GCT User's Guide Micromass UK Limited Atlas Park Simonsway Manchester M22 5PP Tel: +44 161 435 4100 Fax: +44 161 435 4444 Floats Road Wythenshawe M23 9LZ Tel: +44 161 946 2400 Fax: +44 161 946 2 Tudor Road WA1: +44 161 926 7200 Fax: +44 161 926 7http://www.micromass.co.uk In accordance with the recommendations of IEC-1010 the following warning symbols appear on the equipment and accessories The instrument is marked with this symbol where high voltages are present. The instrument is marked with this symbol where hot surfaces are present. The instrument is marked with this symbol where the user should refer to this User's Guide for instructions which may prevent damage to the instrument. Warnings are given throughout this manual where care is required to avoid personal injury. If the instrument is used in a manner not specified by the manufacturer, the protection provided by the equipment may be impaired. All information contained in this manual is believed to be correct at the time of publication. The publishers and their agents shall not be liable for errors contained herein nor for incidental or consequential damages in connection with the furnishing, performance or use of this material. All product specifications, as well as the information contained in this manual, are subject to change without notice. Micromass ® is a registered trade mark of Micromass Limited (Reg. U.S. Pat. & T.M. Off.). Code Number 6666524 Issue 3 © Micromass Ltd.

GCTguide_issue3
Feb 05, 2016
manual GCT mass spectrometer
Welcome message from author
This document is posted to help you gain knowledge. Please leave a comment to let me know what you think about it! Share it to your friends and learn new things together.
Transcript

GCTUser's Guide
Micromass UK Limited
Atlas ParkSimonswayManchester
M22 5PPTel: +44 161 435 4100 Fax: +44 161 435 4444
Floats RoadWythenshawe
M23 9LZTel: +44 161 946 2400 Fax: +44 161 946 2
Tudor Road
WA1: +44 161 926 7200 Fax: +44 161 926 7http://www.micromass.co.uk
In accordance with the recommendations of IEC-1010 the following warning symbolsappear on the equipment and accessories
The instrument is marked with this symbol where high voltages arepresent.
The instrument is marked with this symbol where hot surfaces arepresent.
The instrument is marked with this symbol where the user should refer tothis User's Guide for instructions which may prevent damage to the
instrument.
Warnings are given throughout this manual where care is required to avoid personalinjury.
If the instrument is used in a manner not specified by the manufacturer, the protectionprovided by the equipment may be impaired.
All information contained in this manual is believed to be correct at the time ofpublication. The publishers and their agents shall not be liable for errors contained
herein nor for incidental or consequential damages in connection with the furnishing,performance or use of this material. All product specifications, as well as theinformation contained in this manual, are subject to change without notice.
Micromass ® is a registered trade mark of Micromass Limited(Reg. U.S. Pat. & T.M. Off.).
Code Number 6666524Issue 3© Micromass Ltd.

Table of Contents
GCTUser's Guide
ContentsSafety Information
Generic Warnings 13Lifting and Carrying 13
Assess the Risk of Injury 13If Some Risk Still Exists 13
Ventilation Requirements 13Environmental Requirements 14Disposal 14Power Requirements 14Heated Zones 14Using Methane Gas 15Using Ammonia Gas 15Moving Parts 15Possible Hazard From Pressurised Housing 15
DescriptionIntroduction 17Ionisation Techniques 18
Electron Impact and Chemical Ionisation 18Electron Impact (EI) 18
Components to be Configured for EI Operation 18Inlet Options 18
Chemical Ionisation (CI) 19Components to be Configured for CI Operation 19Inlet 19
Direct chemical Ionisation (DCI) 19Components to be Configured for DCI Operation 19Inlet 19
Field Ionisation (FI) 19Components to be Configured for FI Operation 20Inlet Options 20
Field Desorption 20Components to be Configured for FD Operation 20Inlet Options 20
Inlets 20GC Interface 20Solids Probe 22DCI Probe 22The Reference Reservoir Interface 23
Ion Optics 24External Layout 25
Mechanical Components 26Electronics 27
Table of Contents
GCTUser's Guide

Power Requirements 27External Wiring 27Front Panel Indicators 28
Vacuum Light Status Messages 28Operate / Standby Light Status 30
Rear Panel Connections 30SIP 31Optical Communications Link 31Mains Connection and Power Switch 31ESD Earth 31Event Out 31Contact Closure Inputs 32Analog Channels 32Rear Service Panel 33CI Gas 33Air 33Source 33Analyser 34Water in / Water out 34N2 Vent - Max 14psi 34
The Vacuum System 35Fine Pumping 36Rotary Pumping 36Pressure Measurement 36
Automatic Pumpdown and Vacuum Protection 37MassLynx Data System 38
User ProceduresRoutine Instrument Setup 39Instrument Setup from Shutdown 40
Preparation 40Pumping Down 41MCP Detector Conditioning 43MCP Conditioning Procedure 43Automatic MCP Conditioning 44Instrument Warm-up 45Using the Instrument 45Shutdown Procedures 45
Emergency Shutdown 45Overnight Shutdown 45Complete Shutdown 46Installation and Removal of Inner Source EI and CI Mode 47Installation of the GC Interface 48Installing the GC Column 50
Field Ionisation (FI) Mode 52Overview of Operation 53Choosing an Emitter for FI 53Maximum Flash Off Current 54Emitter Lifetime 54
Table of Contents
GCTUser's Guide
Preparing for Operation in GC-FI Mode 55Positioning of GC Column For FI Operation 58
The Solids ProbeIntroduction 59
Removing the GC Interface 60Installing the Probe and Lock 60
Probe Lock Side Panel 61Sample Loading 61Water and Electrical Connections 63Inserting the Probe 63Withdrawing the Probe 66
The DCI ProbeIntroduction 67Installing the probe lock and the DCI probe 67Loading the Tip with Sample 68Inserting the DCI Probe 68Calibration and Tuning 69DCI Probe Control 69Withdrawing the Probe 72
Obtaining an Ion BeamGeneral Tuning Considerations 73Effects of Saturation on Peak Shape 74
Electron Impact Operation (EI) 76Introduction 76Preparing for Operation in EI+ Mode 76Introduction of Reference Gas 77
Obtaining a Beam in EI+ Mode 77IMPORTANT Initial Checks: 77
Tuning 80Chemical Ionisation Operation (CI) 82
Introduction 82Using Methane Gas 82Using Ammonia Gas 82Preparing for Operation in CI+ Mode 82Introduction of CI Reagent Gas 83CI Gas Valve Layout 83Introduction of Reference Gas 84Obtaining a Beam in CI+ Mode 84
Obtaining a Beam - CI- Operation 86Obtaining a Beam - FI Operation 86
Table of Contents
GCTUser's Guide
General Considerations for Tuning and Optimisation in FI Mode 88Lens Tuning 88Extraction Voltage 89GC Column Position 89Emitter Flash off Current 89Running GC MS Samples in FI Mode 90Running Solids Probe Samples in FI Mode 90
Tuning Parameters andUser Interface
The Vacuum Display 91Source Tuning Menu 92Inlets Menu 93Engineer Tuning Menu 94Other Tune Page Settings 96Calibration 98
TDC Settings 98Real Time Peak Display 100Tune Page Acquisition 101Data Processing 102Operation in Positive Ion Chemical Ionisation Mode 104
Introduction 104Using Methane Gas 104Using Ammonia Gas 104Preparing for Operation in CI+ Mode 104Introduction of CI Reagent Gas 105CI Gas Valve Layout 105Introduction of Reference Gas 105Obtaining a Beam in CI+ Mode 106
Operation in Negative Ion Chemical Ionisation(NCI) Mode 108
Preparing for Operation in NCI Mode 108Introduction of CI Reagent Gas 108Introduction of Reference Gas 108
Tuning Menu FI Mode 109Heater Current 109Extraction Voltage 110Flash Off Current 110Flash Off Enable 110Beam Steering 111MCP Voltage 111
Introduction of Reference Material 111General Considerations for Tuning and Position Optimisation in FI Mode 112
Lens Tuning 112Extraction Voltage 112GC Column Position 112Emitter Flash off Current 113Running GC MS Samples in FI Mode 113Running Solids Probe Samples in FI Mode 114
Table of Contents
GCTUser's Guide

Field Desorption (FD) on the GCT 115The FD Lock 115FD Installation 115Inserting the Probe 116Removing the Probe 118Choosing an Emitter 118Loading the Probe with Sample 118Running a FD Experiment 119
Initial Tuning 119Introducing the Sample 121Running a FD experiment - Manual Method 121
Data AcquisitionFile Sizes 123Starting an Acquisition 123
Starting an Acquisition from the Tune Page 123Parameters 124
Continuum 125Continuum Data 125
Centroid 125TOF Spectrum Center Dialog Parameters 126
TOF Parameters 128Mass Measure 128Real Time Centroid 128
Multiple Samples 130File Name 131File Text 131MS File 131Inlet File 131Bottle 131Injection Volume 132
The Experiment Editor 132Introduction 133The Experiment Editor Toolbar 133Adding a New Function 133Setting up a Full Scan Function 134
Parameter File 134Mass (m/z) 134Time 134Method 135Scan Duration 135
Table of Contents
GCTUser's Guide
Use Probe Ramping Method 135Modifying an Existing Function 135Copying an Existing Function 135Removing a Function 135Changing the Order of Functions 136Setting a Solvent Delay 136Analog Channels 136Calibration 137Saving and Restoring an Experiment 138Starting a Multi-sample Acquisition 138
Process 139An Example of Automated Analysis of Sample List 140
Quantify Samples 140Integrate Samples 140Calibrate Standards 140Quantify Samples 140Print Quantify Reports 141Chromatogram Real-Time Update 141Spectrum Real-Time Update 141Stopping an Acquisition 142Automatic Startup and Shutdown 142The Shutdown Editor 142Enable Startup before batch 143Enable Shutdown after batch 143Shutdown Time after batch or error 143Shutdown on error 143The Auto Control Tasks Page 144Task 144Pre-Delay 144Post-Delay 144Ion Mode 144File Name 144To Add a Task 145To Insert a Task 145To Modify a Task 145To Delete a Task 145To Delete All Tasks 145To Change the Width of a Column 146The Shutdown Editor Toolbar 146Saving/Loading Startup and Shutdown Files 147To Open a Startup or Shutdown file 147To Save a Startup or Shutdown file 147Printing Startup and Shutdown Files 148To Print a Startup or Shutdown File 148Creating Startup and Shutdown Files 148To Create a Startup or Shutdown File 148Running Startup and Shutdown Files 148
Table of Contents
GCTUser's Guide
Calibration and Exact MassIntroduction 149
Nominal Mass Accuracy 150Generation of an Instrument Calibration EI+ Operation 152
Effects of Saturation on Peak Shape 155Calibration and Accurate Mass in FI Mode 159Optimisation of FI Calibration 159
Calibration and Exact Mass in CI+ Mode 160Calibration in CI - Ion Mode of Operation 161DXC Temperature Compensation 161
Lock Mass Correction 162Additional Hints for Performing Exact Mass Measurements 163
Maintenance and Fault FindingIntroduction 165Removal and Replacement of Panels and Cover 166
Right Hand Side Panel 166Left Hand Side Panel 167
Cooling Fans and Air Filters 167The Vacuum System 167
Vacuum Leaks 168Pirani Gauge 168Active Inverted Magnetron Gauge 168Gas Ballasting 168Oil Mist Filter 169Rotary Pump Oil 169Foreline Trap Maintenance 170Reference Reservoir Interface Maintenance 170
Replacing the Fused Silica Leak 170EI/CI Inner Source Maintenance 172EI/CI Outer Source Maintenance 173
Removal of the Outer EI / CI Source 174EI / CI Outer Source Parts List 177Removal of the Collimating Slits on the Outer Source 178Cleaning 178
“Quick Clean” Procedure 178Full Clean Procedure 179
Outer Source 179Inner Source 179
Cleaning Materials 179Cleaning the FI Source 181
‘Quick Clean’ Procedure 181FI Outer Source Parts List 182Full Clean Procedure 184
Fault finding 186No Beam 186
General Checks 186Low Compressed Air Supply 186
Table of Contents
GCTUser's Guide

No Trap, Emission or Filament Current Readback 187No Filament Current, Trap Current Maximum, Emission Current Zero 187High Filament Current, High Emission, Low Trap Current 187Ion Repeller Inactive in EI Mode 187Poor Sensitivity 187High Positive Value of Ion Repeller EI Source 188Poor Sensitivity in CI Mode 188Incorrect Position of the GC Column 188Poor GC Conditions 189Faulty Attenuator 189Faulty Preamplifier or Preamplifier Supply 189Poor Resolution 189Gradual Decrease in Resolution and Mass Accuracy 189Incorrect Engineer Tuning Menu Settings 190Incorrect Isotope Distributions, Difficulty in Setting TDC Dead TimeParameters 190
Fault finding in FI Mode 192No Beam 192No Emitter Current 192Excessive Leakage Current 192Poor Sensitivity for the Reference Material 192Poor GC Sensitivity 192Poor Calibration / Accurate Mass 193Electrical Discharge Resulting in Damaged Emitter 193
DXC Troubleshooting and Hints 193Faultfinding and Tips (DCI Probe) 195Preventive Maintenance Check List 196
Reference InformationPositive Ion EI and Positive Ion CI 197
Appendix 1Review of GC Considerations in MS Detection 201Column Installation and Care 201Conditioning the GC Column 202
Appendix 2Trigger Threshold 204Signal Threshold 205Setting the Signal Threshold 206Setting the MCP Voltage 207Effect of low MCP gain on isotope ratio 207Effect of Low MCP gain on Quantitation 209Effect of low MCP gain on Exact Mass Measurement. 210Effect of low MCP gain on Resolution 210
Table of Contents
GCTUser's Guide

Safety InformationGeneric Warnings
Before installing or operating the GCT, read the following topics concerninghazards and potential hazards. System operators must be familiar with bothgeneral and specific safety practices concerning the GCT.
Persons with a medical condition, for example a back injury, which prevents themfrom handling heavy loads should not attempt to lift the instrument. Micromassaccepts no responsibility for any injuries or damage sustained while lifting theinstrument.
Caution: Under no circumstances should the instrument be lifted by the front mouldedcover, the probe, the GC interface or the source housing.
Before lifting the instrument proceed as follows:
Vent, power down and disconnect the instrument from the power supply.
Disconnect power and tubing connections to the rotary pump from the rear of theinstrument.
Disconnect gas inlet and exhaust lines from the rear of the instrument.
Lifting and Carrying
The weight of the instrument is 100kg. UK Health & Safety guidelines recommendthat suitable lifting equipment is used to lift or move the instrument. Note thatMicromass personnel are not permitted to manually lift the instrument without suchequipment.
Assess the Risk of Injury
Take action to eliminate risk.
If Some Risk Still Exists
Plan the operation in advance and in conjunction with our engineer when he/shearrives on site.
Use trained personnel where necessary.
Adhere to appropriate country and/or company regulations.
Ventilation Requirements
Caution: Hazardous vapours. A suitable exhaust line should always be fitted to therotary pump.
User ProceduresPage 11
GCTUser's Guide

Environmental Requirements
Altitude: up to 2000M
Temperature: 15 - 40°C for the rotary pump. Maximum laboratory temperature for theinstrument is 30°C. Optimum temperature range is 19-22°C.
Maximum relative humidity: 70%.
Mains supply voltage fluctuations not to exceed ± 10% of the specified voltage range.
Mains supply transient overvoltages according to installation category II of IEC 644.
Pollution degree 1 in accordance with IEC 664.
Disposal
Do not incinerate electronic assemblies. Emission of noxious fumes may occur andmetal cased capacitors may explode due to build up of pressure.
Oil from the vacuum pumps should be drained and disposed of appropriately.
Power Requirements
The GCT electronics are designed to operate using supply voltages from 100-240V50-60Hz AC at 6.0A max.
Caution: the RV3 rotary pump MUST be configured to operate from the mainsvoltage range supplied. See instructions supplied with the rotary pump.
Mains voltages are supplied to the MA 3799 electronics unit only.
A correctly rated safety earth must be provided in all cases.
Caution: The two PCs supplied with the instrument must be configured to operatefrom the mains voltage range supplied. Refer to the manufacturer's literature.
Heated Zones
Warning: Risk of burns. Never touch a heated transfer line, GC injector cap with bare(unprotected) hands.
Care should be taken when dealing with any heated area of the GCT. For example, theGC transfer line, the solids probe tip, the reference gas inlet and the GC injector cap.In addition, the inner and outer ionisation sources may remain hot for many minuteseven after removed from the source housing.
Allow heated zones to cool before attempting to handle these items.
User ProceduresPage 12
GCTUser's Guide

Using Methane Gas
Caution: Methane gas is explosive. When the instrument is run in chemical ionisationmode (CI), which involves the use of methane gas it is necessary to vent the effluentfrom the rotary pump in a safe manner. All gas fittings should be checked for leaktightness. Avoid naked flames.
Using Ammonia Gas
Caution: Ammonia gas is a hazardous vapour. When the instrument is run in chemicalionisation mode (CI), which involves the use of ammonia gas, it is necessary to ventthe effluent from the rotary pump in a safe manner. All gas fittings should bethoroughly checked for leak tightness.
Moving Parts
Do not remove the cover from the pneumatic source – analyser isolation valve withthe compressed gas line attached to the rear of the GCT and the lines pressurised.
Possible Hazard From Pressurised Housing
If a dry gas supply is fitted to the soft vent inlet on the rear of the instrument, theregulator must be set to deliver a pressure of gas less than 14 psi, (1000 mbar, 1 atm).Failure to set this valve correctly can lead to the analyser housing becoming positivelypressurised.
User ProceduresPage 13
GCTUser's Guide

User ProceduresPage 14
GCTUser's Guide

DescriptionIntroduction
The Micromass GCTTM is a compact, fully integrated, high performance, orthogonalacceleration time of flight mass spectrometer designed for GC-MS and probe MSapplications. The instrument is shown below connected to a HP 6890 GC andautosampler via the optional GC interface.
The basic instrument comprises the source and analyser housings, evacuated by twohigh compression turbomolecular pumps; the source and analyser are separated by apneumatic isolation valve and a differential pumping aperture. An external rotarypump backs both turbomolecular pumps.
Several source options are available to enable analyses using ionisation techniquesappropriate to a wide range of compounds. Source and probe assemblies may beselected for Electron Impact (EI), Chemical Ionisation (CI), Field Ionisation (FI) andField Desorption(FD).
The assembled system ion source is directly coupled to the GC inlet, enabling smoothtransfer of eluent and minimising the possibility of cold spots. A rolling plinthsupplied with the GC option facilitates exchange of source components.
DescriptionPage 15
GCTUser's Guide

Ions are accelerated from the grounded ion source to 40eV before being acceleratedinto the time of flight (TOF) analyser. This features a two stage orthogonalacceleration region, followed by a single stage reflectron, giving an effective pathlength of 1.2 meter. The subsequent dual microchannel plate assembly may detectpositive or negative ions. Ion arrival times are recorded using a time to digitalconverter (TDC) with a sampling rate of 1 or 3.6GHz.
GCT TM produces high quality, full mass spectra with elevated resolution (~ 7000 FWHM).This elevated resolution reduces the likelihood of mass interferences. Furthermore theprecise linear relationship between ion arrival time and the square root of its massallows good mass measurement accuracy with only a single internal reference mass.The precision of mass measurement can provide elemental composition of unknownsand confirm identification of eluting compounds.
The full mass spectral sensitivity of the GCT is comparable to that of a quadrupolemass spectrometer, operating in single ion recording mode and monitoring 10 - 20masses. However, in comparison to a quadrupole instrument when used to record fullmass spectra, the GCT can be 10 - 100 times more sensitive, depending on the massrange acquired.
Ionisation Techniques
Electron Impact and Chemical Ionisation
The ion source consists of two assemblies. An inner, easily removable source whichcomprises all the normally cleanable or replaceable parts, such as the filament, trapand repeller for an EI/CI source. The outer source comprises the source heater,thermocouple, focusing optics and other generally non-replaceable items, and islocated on the source housing lid. Electrical heater elements in the outer sourcevaporise the sample.
Electron Impact (EI)
Electron impact is the classical ionisation technique in which gas phase samplemolecules are ionised in collisions with high energy electrons.
Components to be Configured for EI Operation
• GCT• EI outer source• EI inner source
Inlet Options
• GC with GC Interface• Solids probe• DCI probe (with MassLynx 4.0)
DescriptionPage 16
GCTUser's Guide

Chemical Ionisation (CI)
When the source is operated in the chemical ionisation mode, a reagent gas isadmitted into the ion source at a relatively high pressure. The gas molecules areionised by the electron beam. Sample ions are generated in reactions with thesegaseous ions. CI is a 'softer' ionisation technique than EI, producing less samplefragmentation and generally a stronger molecular ion.
Components to be Configured for CI Operation
• GCT• EI outer source• CI inner source• CI reagent gas cylinder
Inlet
• GC with GC Interface
Direct chemical Ionisation (DCI)
Components to be Configured for DCI Operation
• GCT• EI outer source• Modified CI inner source
Inlet
• DCI probe
Field Ionisation (FI)
In field ionisation, sample molecules are passed in close proximity to a surface of highcurvature maintained at a high potential field. These molecules are subjected topotential gradients in the order of 107 – 108 volts/ cm. Under the influence of thesefields, quantum tunnelling of a valence electron from the molecule to an anode takesplace to give an ion radical. This process is very 'soft' often producing spectra withvery little or no fragmentation.
The ion source consists of a dedicated outer source and a removable probe holding theFI ‘emitter’. The ‘emitter’ consists of a tungsten wire onto which carbon microneedleshave been grown.
DescriptionPage 17
GCTUser's Guide
Components to be Configured for FI Operation
• GCT• FI outer source
Inlet Options
• FI Emitter
Field Desorption
Field desorption differs from field ionisation in that a liquid sample is depositeddirectly onto the emitter. The emitter is heated and an electric field is also applied,with some ion formation through thermal effects and some as a result of field effectson the evaporated vapour.
Components to be Configured for FD Operation
• GCT• FI outer source
Inlet Options
• FD probe
Inlets
GC Interface
The GC interface provides a heated transfer line between the GC and the ion source.This ensures even heating in this region, so that the sample does not condense beforeit reaches the ion source. The interface, shown below, is designed to be easilyremovable to allow simple and rapid conversion to solids probe operation.
DescriptionPage 18
GCTUser's Guide

The GC interface is capable of being heated to a temperature of 350°C. A springloaded tip allows the interface to be in contact with the outer source block for CIoperation, while allowing thermal expansion of the inner re-entrant tube to beaccommodated.
DescriptionPage 19
GCTUser's Guide
Re-entrant Body
Transfer Line
Heater Connection
Graphitised Vespel Ferrules

Solids Probe
An optional solids probe is available for the introduction of involatile materials. Theprobe lock is fitted in place of the GC interface. The probe has a maximum operatingtemperature of 650°C and is fully controlled from the MassLynx software.
DCI Probe
An optional Direct Chemical Ionisation (DCI) Probe is also available, which isintroduced by means of the probe lock. The DCI probe current is controlled fromMassLynx from 0 - 1.5A and is operated in CI mode. A softer ionisation is achievedthan with the solids probe, as the sample is vaporised in the source very quickly. Thisreduces the incidence of thermal fragmentation from probe contact. Also, the time isreduced for the sample to travel from the solids probe cup into the source.
DescriptionPage 20
GCTUser's Guide
Retaining Screw
Quarter Turn Valve
ProbeRetaining Knob
Pumping LineFrom Probe Lock
PumpingLine Port
ElectricalConnection
Probe LockPump Button
WaterSupply Outlets

The Reference Reservoir Interface
The reference reservoir is an interface module, designed for the introduction ofvolatile reference materials necessary for calibration and mass measurement. Thereservoir assembly, shown above, consists of a heated 100ml chamber, 75µm I.D.,fused silica capillary leak and a heated stainless steel transfer line.
Warning: The septum cap can become very hot during heated operation, and careshould be taken when touching it.
Reference material may be introduced via syringe through a septum into the chamber. Amanual valve allows the chamber to be pumped to adjust the amount of referencematerial entering the source region. The interface is mounted on the source housing lid.
The manually operated septum pump valve should be fully open when the sourcehousing is pumped down. The black knob on the top of the interface is turnedanticlockwise.
When vented, the reference reservoir becomes full of air. This takes a long time topump out because of the presence of the fused silica leak within the referencereservoir. The pump solenoid actuates when the source backing line isolation valveopens and evacuates the reservoir during source pumpdown.
DescriptionPage 21
GCTUser's Guide
InsulatingCover
FusedSilica Leak
Reservoir
ManualPump Valve
Septum
Cap

If the reservoir pumping valve is closed, and the source housing is fully pumpeddown, a high pressure is indicated in the source housing. This is due to air slowlyentering the source housing via the fixed leak in the reference reservoir. The reservoirpump valve should then be opened slowly to minimise the effect of the surge of airinto the backing line.
Ion Optics
The principal components of the ion optical system are shown here in schematic form.Ions generated in the ion source are accelerated and focused into the pusher region ofthe orthogonal TOF via a transfer lens.
A sudden voltage pulse is then applied to the pushout electrode, ejecting a section ofthe beam orthogonally. The ion packet then passes through a two stage accelerationregion and enters the time of flight drift region. The reflectron reflects ions back to thedual microchannel plate detector. Ion arrivals are recorded using a time to digitalconverter (TDC).
As ions travel from the pusher to the detector they are separated in mass according totheir flight times, with ions of the highest mass to charge ratio () arriving later inthe spectrum.
DescriptionPage 22
GCTUser's Guide
DETECTOR
PUSHER
GC Oven
GC InterfaceRemovableIon Source
PneumaticIsolation Valve
Refl ctrone
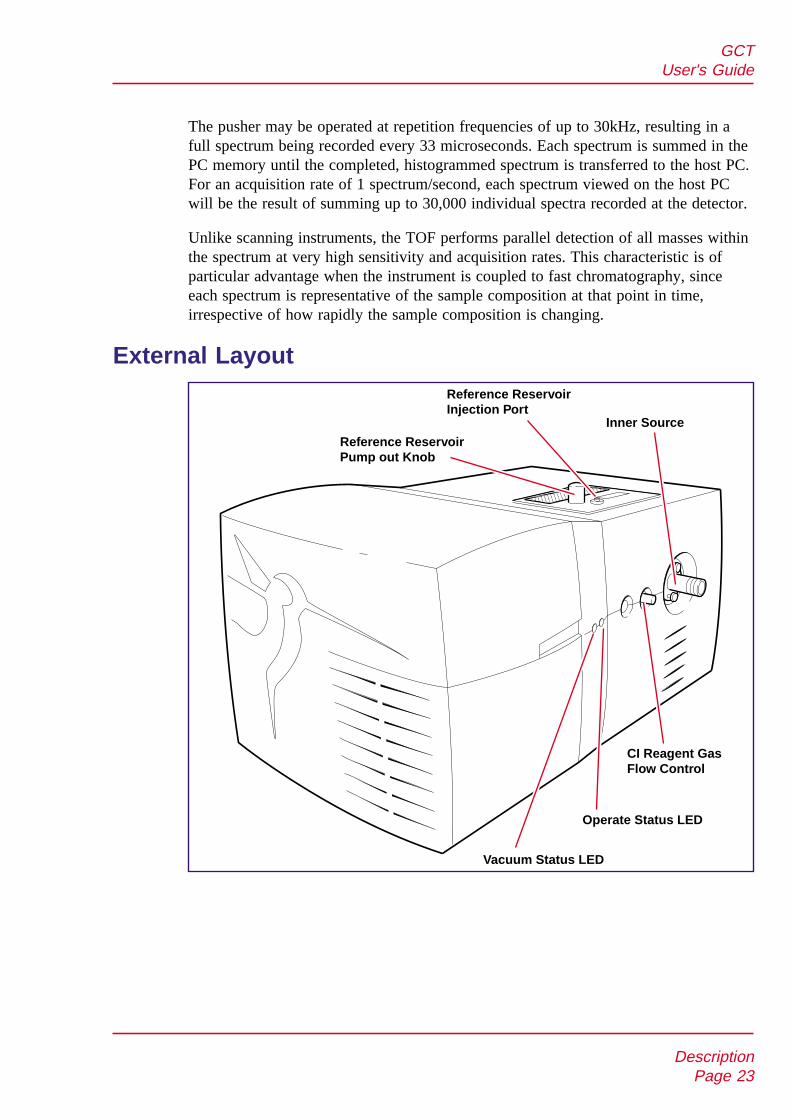
The pusher may be operated at repetition frequencies of up to 30kHz, resulting in afull spectrum being recorded every 33 microseconds. Each spectrum is summed in thePC memory until the completed, histogrammed spectrum is transferred to the host PC.For an acquisition rate of 1 spectrum/second, each spectrum viewed on the host PCwill be the result of summing up to 30,000 individual spectra recorded at the detector.
Unlike scanning instruments, the TOF performs parallel detection of all masses withinthe spectrum at very high sensitivity and acquisition rates. This characteristic is ofparticular advantage when the instrument is coupled to fast chromatography, sinceeach spectrum is representative of the sample composition at that point in time,irrespective of how rapidly the sample composition is changing.
External Layout
DescriptionPage 23
GCTUser's Guide
Reference ReservoirInjection Port
Reference ReservoirPump out Knob
Vacuum Status LED
Inner Source
CI Reagent GasFlow Control
Operate Status LED

Caution: The internal layout shown in the following diagrams is for information only,and does not imply that the labelled components are user-serviceable.
Warning: Removal of covers can expose hazardous voltages.
Mechanical Components
The above view shows the following main internal mechanical components:
• The source housing, containing the ion source.
• The analyser housing, containing the pusher, detector and reflectronassemblies.
• Two active inverted magnetron (Penning) gauges.
DescriptionPage 24
GCTUser's Guide
Analyser Housing
Source Housing
Inner Source
Source Penning Gauge
Source Backing LineIsolation Valve
Analyser Penning Gauge Reference Reservoir
Electronics
Power Requirements
The GCT electronics are designed to operate using supply voltages from 100-240V50-60Hz AC at 6.0A max.
Caution: the RV3 rotary pump MUST be configured to operate from mains voltagerange supplied. Refer to the pump manufacturer's literature.
Mains voltages are supplied to the MA3799 electronics unit only. A correctly ratedsafety earth must be provided in all cases.
Caution: The two PCs supplied with the instrument must be configured to operatefrom the mains voltage range supplied. Refer to the manufacturer's literature.
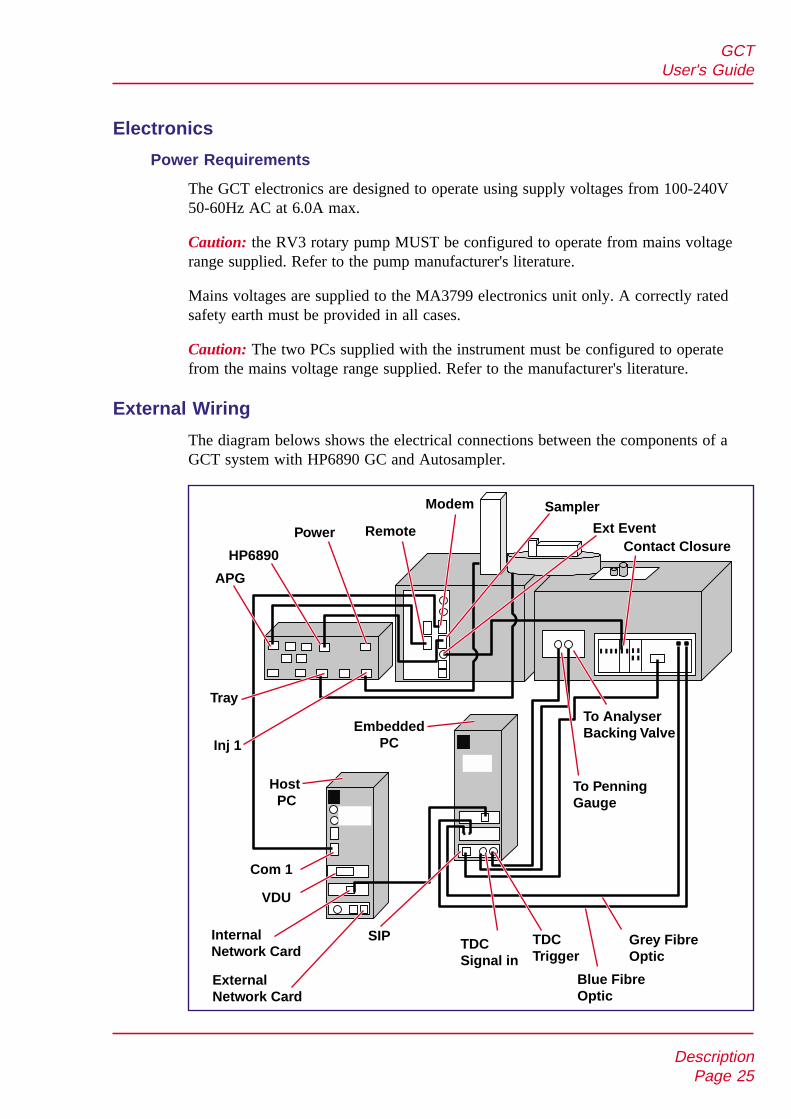
External Wiring
The diagram belows shows the electrical connections between the components of aGCT system with HP6890 GC and Autosampler.
DescriptionPage 25
GCTUser's Guide
Grey FibreOptic
Contact ClosureExt Event
SamplerModem
RemotePower
HP6890
APG
Inj 1
Tray
VDU
Com 1
EmbeddedPC
HostPC
InternalNetwork Card
ExternalNetwork Card
TDCSignal in
TDCTrigger
Blue Fib eOptic
r
SIP
To AnalyserBacking Valve
To PenningG ugea

Front Panel Indicators
Vacuum Light Status Messages
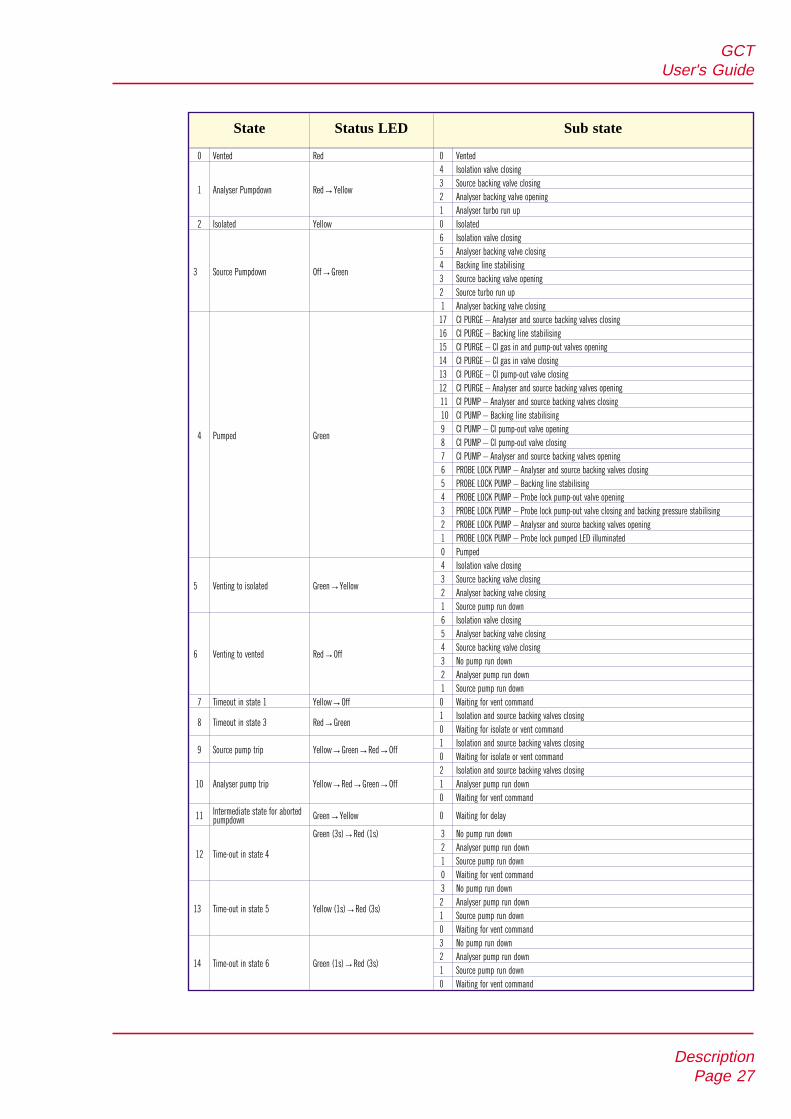
The front panel vacuum LED, and a series of diagnostic messages displayed on thetune page indicate the state of the vacuum system. Some vacuum states haveintermediate substates. The vacuum state is indicated at the bottom of the tune page.The substate may be displayed from the diagnostics menu on the Engineer TuningMenu. The following states have been defined.
The vacuum state is indicated at the bottom of the tune page. The sub state may bedisplayed from the DIAGNOSTICS menu in the Engineer Tuning Menu. The LEDsindicate the vacuum state on the instrument front panel.
LED colour changes are at 1 second periods unless stated otherwise.
DescriptionPage 26
GCTUser's Guide
State Status LED Sub state
0 Vented Red 0 Vented
1 Analyser Pumpdown Red→Yellow
4 Isolation valve closing
3 Source backing valve closing
2 Analyser backing valve opening
1 Analyser turbo run up
2 Isolated Yellow 0 Isolated
3 Source Pumpdown Off→Green
6 Isolation valve closing
5 Analyser backing valve closing
4 Backing line stabilising
3 Source backing valve opening
2 Source turbo run up
1 Analyser backing valve closing
4 Pumped Green
17 CI PURGE – Analyser and source backing valves closing
16 CI PURGE – Backing line stabilising
15 CI PURGE – CI gas in and pump-out valves opening
14 CI PURGE – CI gas in valve closing
13 CI PURGE – CI pump-out valve closing
12 CI PURGE – Analyser and source backing valves opening
11 CI PUMP – Analyser and source backing valves closing
10 CI PUMP – Backing line stabilising
9 CI PUMP – CI pump-out valve opening
8 CI PUMP – CI pump-out valve closing
7 CI PUMP – Analyser and source backing valves opening
6 PROBE LOCK PUMP – Analyser and source backing valves closing
5 PROBE LOCK PUMP – Backing line stabilising
4 PROBE LOCK PUMP – Probe lock pump-out valve opening
3 PROBE LOCK PUMP – Probe lock pump-out valve closing and backing pressure stabilising
2 PROBE LOCK PUMP – Analyser and source backing valves opening
1 PROBE LOCK PUMP – Probe lock pumped LED illuminated
0 Pumped
5 Venting to isolated Green→Yellow
4 Isolation valve closing
3 Source backing valve closing
2 Analyser backing valve closing
1 Source pump run down
6 Venting to vented Red→Off
6 Isolation valve closing
5 Analyser backing valve closing
4 Source backing valve closing
3 No pump run down
2 Analyser pump run down
1 Source pump run down
7 Timeout in state 1 Yellow→Off 0 Waiting for vent command
8 Timeout in state 3 Red→Green1 Isolation and source backing valves closing
0 Waiting for isolate or vent command
9 Source pump trip Yellow→Green→Red→Off1 Isolation and source backing valves closing
0 Waiting for isolate or vent command
10 Analyser pump trip Yellow→Red→Green→Off
2 Isolation and source backing valves closing
1 Analyser pump run down
0 Waiting for vent command
11 Intermediate state for abortedpumpdown Green→Yellow 0 Waiting for delay
12 Time-out in state 4
Green (3s)→Red (1s) 3 No pump run down
2 Analyser pump run down
1 Source pump run down
0 Waiting for vent command
13 Time-out in state 5 Yellow (1s)→Red (3s)
3 No pump run down
2 Analyser pump run down
1 Source pump run down
0 Waiting for vent command
14 Time-out in state 6 Green (1s)→Red (3s)
3 No pump run down
2 Analyser pump run down
1 Source pump run down
0 Waiting for vent command
DescriptionPage 27
GCTUser's Guide

State 7 requires a vent request to exit.
State 8 requires a vent or isolate request to exit.
State 9 requires a vent or isolate request to exit.
State 10 requires a vent request to exit.
State 12 requires a vent request to exit.
State 13 requires a vent request to exit.
State 14 requires a vent request to exit.
Operate / Standby Light Status
State Status Operate LED
Operate Green
Standby Red
Source solvent trip Yellow
Rear Panel Connections
DescriptionPage 28
GCTUser's Guide
SOFT VENT CI GAS AIR
SOURCE ANALYSER WATERIN
WATEROUT
ALARM
ON/OFF Rocker Switch
0 = OFF1 = ON
SIPEARTH
!
01
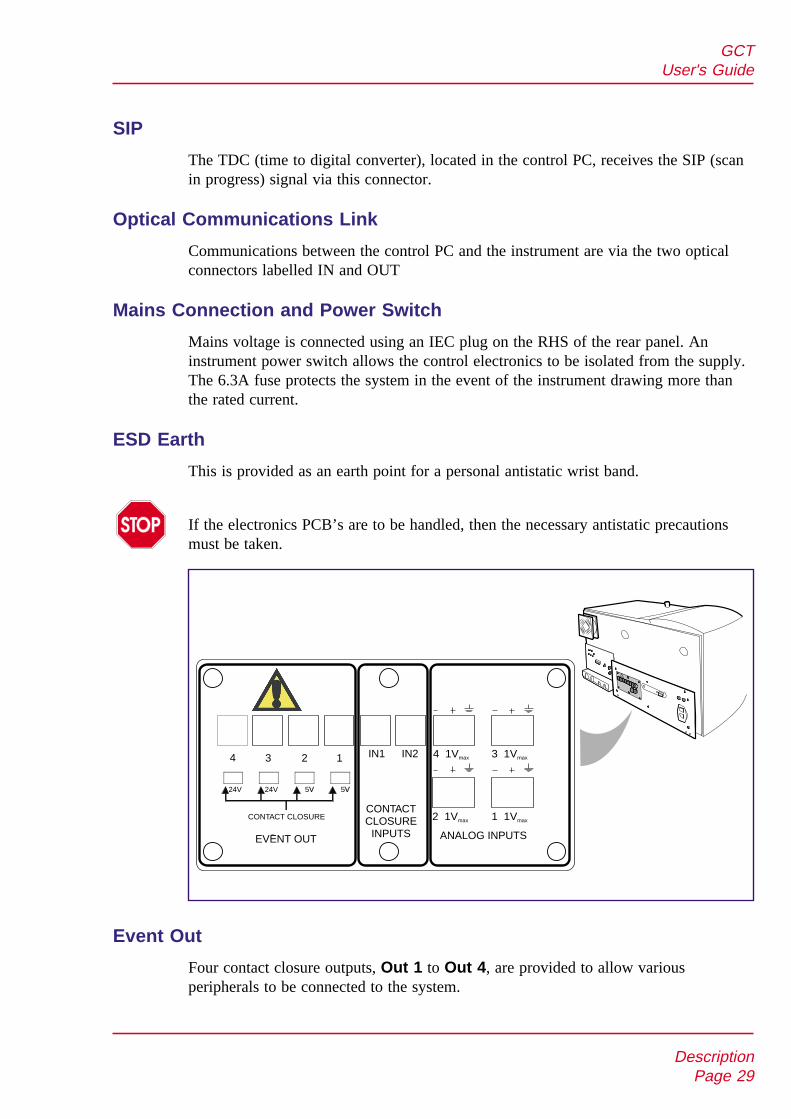
SIP
The TDC (time to digital converter), located in the control PC, receives the SIP (scanin progress) signal via this connector.
Optical Communications Link
Communications between the control PC and the instrument are via the two opticalconnectors labelled IN and OUT
Mains Connection and Power Switch
Mains voltage is connected using an IEC plug on the RHS of the rear panel. Aninstrument power switch allows the control electronics to be isolated from the supply.The 6.3A fuse protects the system in the event of the instrument drawing more thanthe rated current.
ESD Earth
This is provided as an earth point for a personal antistatic wrist band.
If the electronics PCB’s are to be handled, then the necessary antistatic precautionsmust be taken.
Event Out
Four contact closure outputs, Out 1 to Out 4, are provided to allow variousperipherals to be connected to the system.
DescriptionPage 29
GCTUser's Guide
CONTACT CLOSURECONTACTCLOSURE
INPUTS ANALOG INPUTSEVENT OUT
1234
24V 24V 5V 5V
IN1 IN2 4 1Vmax 3 1Vmax
1 1Vmax2 1Vmax

Out 1 and Out 2, voltage output, each have an output of 5 volts. The voltage outputof both Out 3 and Out 4 is 24 volts. Alternatively, by switching the selector switchesthe outputs can be set to Contact Closure.
During a sample run an event output may be configured to actuate betweenacquisitions and is used typically to enable an external device to start at the same timeas the acquisition start.
Contact Closure Inputs
In 1 and In 2 inputs are provided to allow an external device to start sampleacquisition once the device has performed its function (typically sample injection).
Normally the GC is connected to Contact Closure Input IN1 as shown on the previouspage. When the GC has made an injection it sends a signal via this connection toinstruct the GCT to commence an acquisition.
Analog Channels
Four analog channel inputs are available, for acquiring simultaneous data such as aFID detector output. For setup details see the section Analog Channels in the chapterData Acquisition later in this manual. Note that the input differential voltage must notexceed one volt.
DescriptionPage 30
GCTUser's Guide
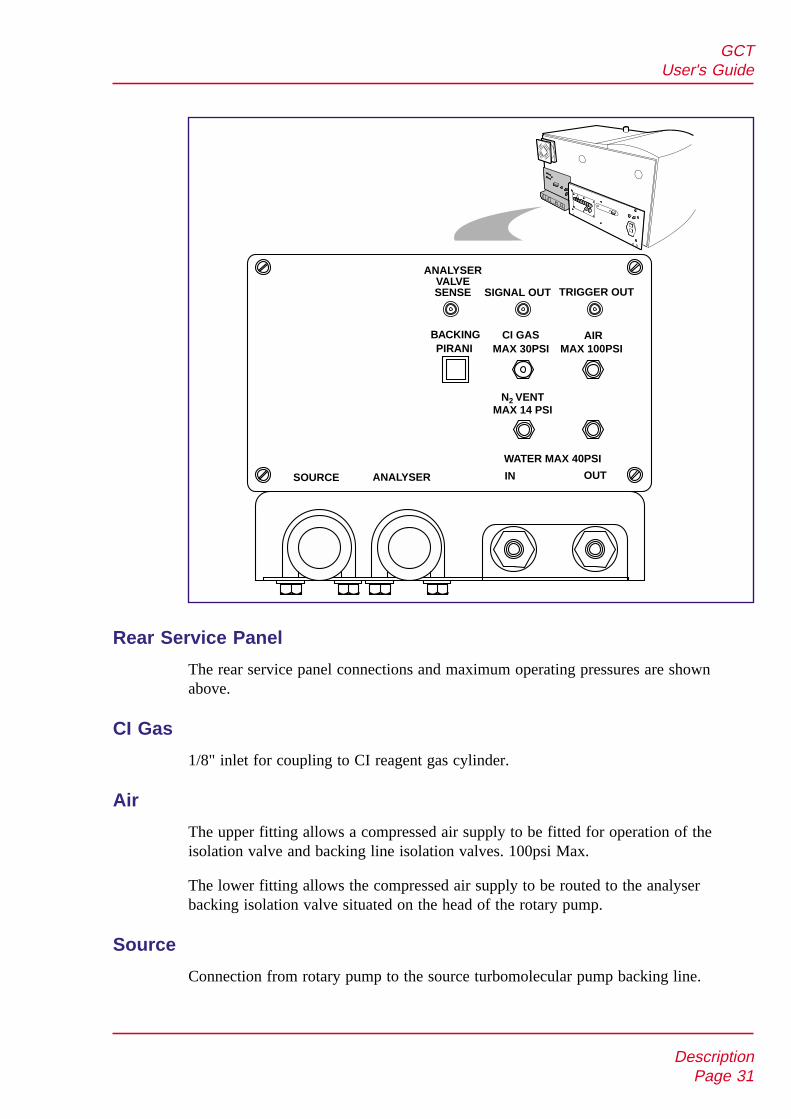
Rear Service Panel
The rear service panel connections and maximum operating pressures are shownabove.
CI Gas
1/8" inlet for coupling to CI reagent gas cylinder.
Air
The upper fitting allows a compressed air supply to be fitted for operation of theisolation valve and backing line isolation valves. 100psi Max.
The lower fitting allows the compressed air supply to be routed to the analyserbacking isolation valve situated on the head of the rotary pump.
Source
Connection from rotary pump to the source turbomolecular pump backing line.
DescriptionPage 31
GCTUser's Guide
TRIGGER OUT
AIRMAX 30PSI
OUT
SIGNAL OUT
CI GASMAX 100PSI
SENSEVALVE
ANALYSER
PIRANIBACKING
INANALYSERSOURCE
WATER MAX 40PSI
N VENTMAX 14 PSI
2

Analyser
Connection from the rotary pump to the analyser turbomolecular pump.
Water in / Water out
The turbomolecular pumps are water cooled, with a water supply pressure 10-40psi.
N2 Vent - Max 14psi
Connection for dry gas for venting the turbo pumps. Using dry gas prevents waterfrom entering the instrument during a vent and reduces the subsequent pumpdowntime.
A typical setting is between 3 - 5 psi and should be set by a regulator.
Warning: a pressure in excess of 14psi may cause damage to the instrument.
DescriptionPage 32
GCTUser's Guide
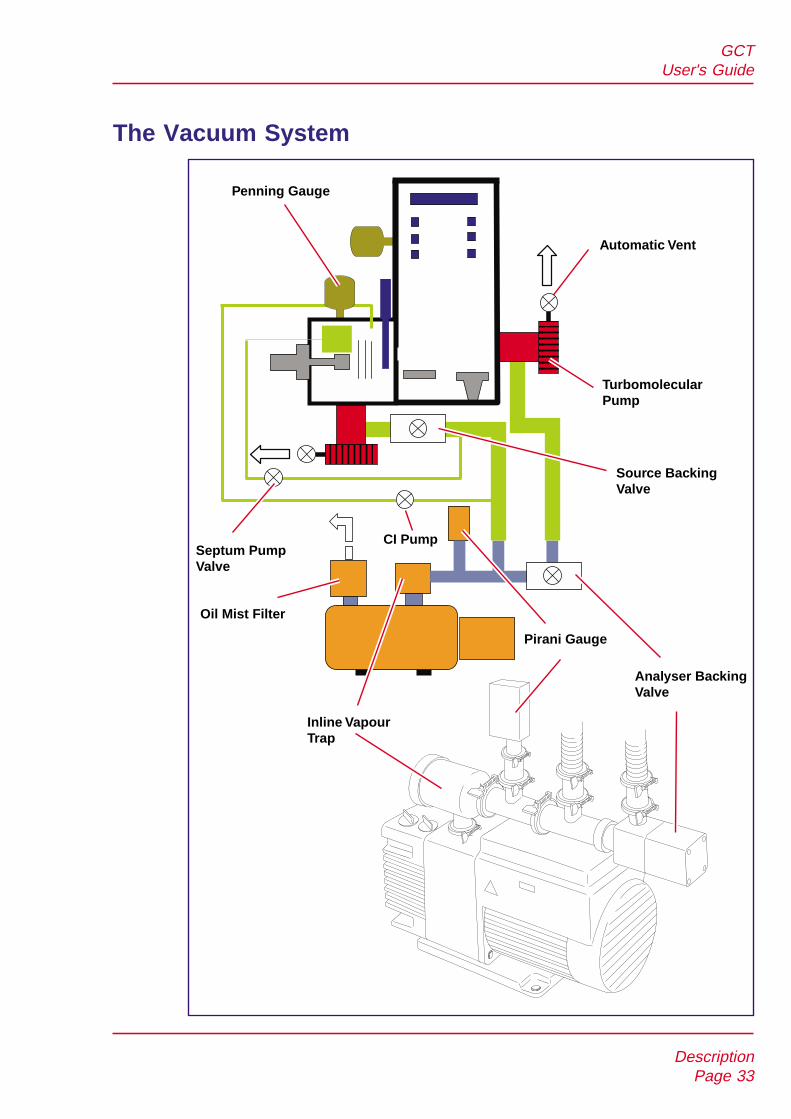
The Vacuum System
DescriptionPage 33
GCTUser's Guide
Penning Gauge
Source BackingValve
Septum PumpValve
Oil Mist Filter
Inline VapourTrap
Analyser BackingValve
Pirani Gauge
Automatic Vent to N2
Automatic Vent
TurbomolecularPump
RV3
CI Pump

Fine Pumping
GCT is equipped with two water cooled high compression turbomolecular pumps,providing independent fine pumping of the source and the analyser housings. Detailsof operation and maintenance of the pumps can be found in the manufacturer’smanuals provided.
Rotary Pumping
Both the source and the analyser turbomolecular pumps are backed by a single RV3rotary pump. This pump is usually situated on the floor adjacent to the GCT. Detailsof operation and maintenance of the pumps can be found in the manufacturer’smanuals provided.
Pressure Measurement
The source pressure is monitored by an active Pirani gauge. If the pressure read bythis gauge exceeds the ‘solvent trip’ level set by the user from the software, thefilament current in both EI and CI modes of operation, and the extraction voltage in FIoperation, is reduced to zero.
Once the pressure has fallen below the trip level normal operation is resumed.
The analyser pressure is also monitored by an active Pirani gauge. This gauge acts asa pressure switch turning the system out of operate if the pressure is too high. Pressurereadings may be displayed on the MassLynx NT tune page.
DescriptionPage 34
GCTUser's Guide
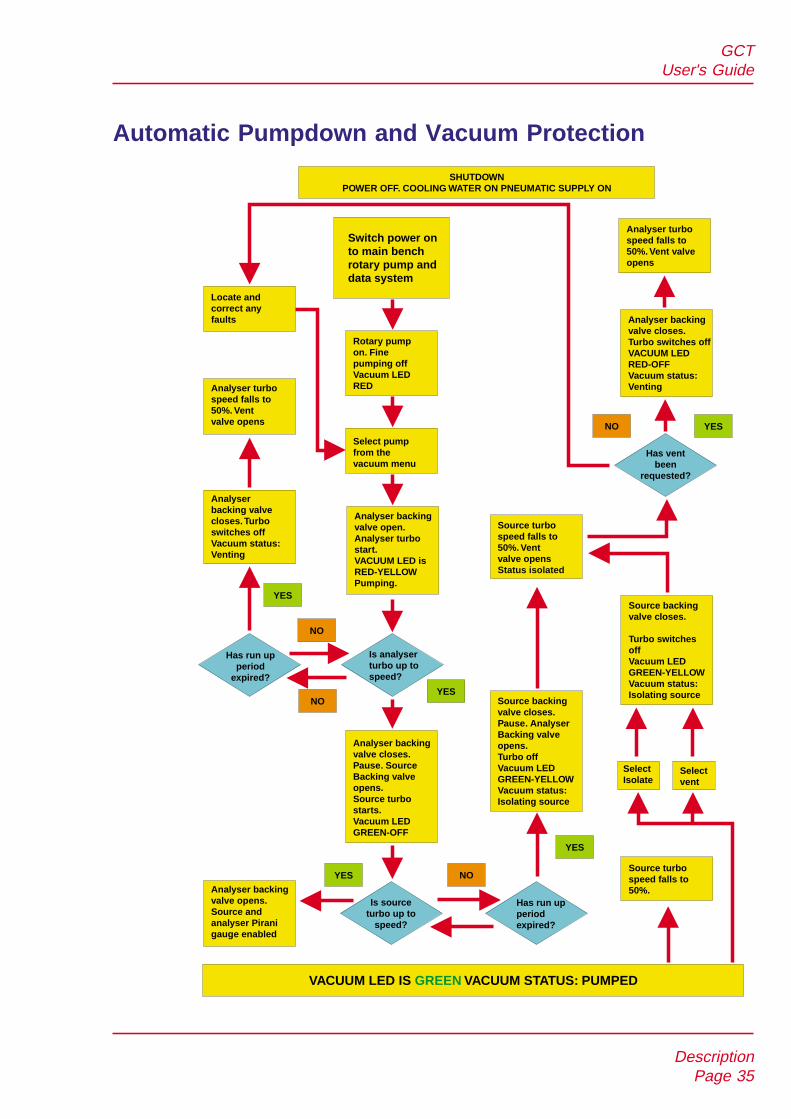
Automatic Pumpdown and Vacuum Protection
DescriptionPage 35
GCTUser's Guide
SHUTDOWNPOWER OFF. COOLING WATER ON PNEUMATIC SUPPLY ON
VACUUM LED IS VACUUM STATUS: PUMPEDGREEN
Locate andcorrect anyfaults
Analyser turbospeed falls to50%. Ventvalve opens
Analyserbacking valvecloses.Turboswitches offVacuum status:Venting
Has run upperiod
expired?
Analyser backingvalve opens.Source andanalyser Piranigauge enabled
Is analyserturbo up tospeed?
Is sourceturbo up to
speed?
Analyser backingvalve closes.Pause. SourceBacking valveopens.Source turbostarts.Vacuum LEDGREEN-OFF
Source
Analyser
backingvalve closes.Pause.Backing valveopens.Turbo offVacuum LEDGREEN-YELLOWVacuum status:Isolating source
Source backingvalve closes.
Turbo switchesoffVacuum LEDGREEN-YELLOWVacuum status:Isolating source
Has run upperiodexpired?
Analyser backingvalve open.Analyser turbostart.VACUUM LED isRED-YELLOWPumping.
Analyser backingvalve closes.Turbo switches offVACUUM LEDRED-OFFVacuum status:Venting
Analyser turbospeed falls to50%. Vent valveopens
Select pumpfrom thevacuum menu
Rotary pumpon. Finepumping offVacuum LEDRED
Switch power onto main benchrotary pump anddata system
Source turbospeed falls to50%. Ventvalve opensStatus isolated
Source turbospeed falls to50%.
SelectIsolate
Selectvent
Has ventbeen
requested?
YES
YES
YES
YES
YES
NO
NO
NO
NO

MassLynx Data SystemA PC with Microsoft Windows Operating System runs the MassLynx software systemto control the GCT, and to acquire and manipulate data from it.
DescriptionPage 36
GCTUser's Guide
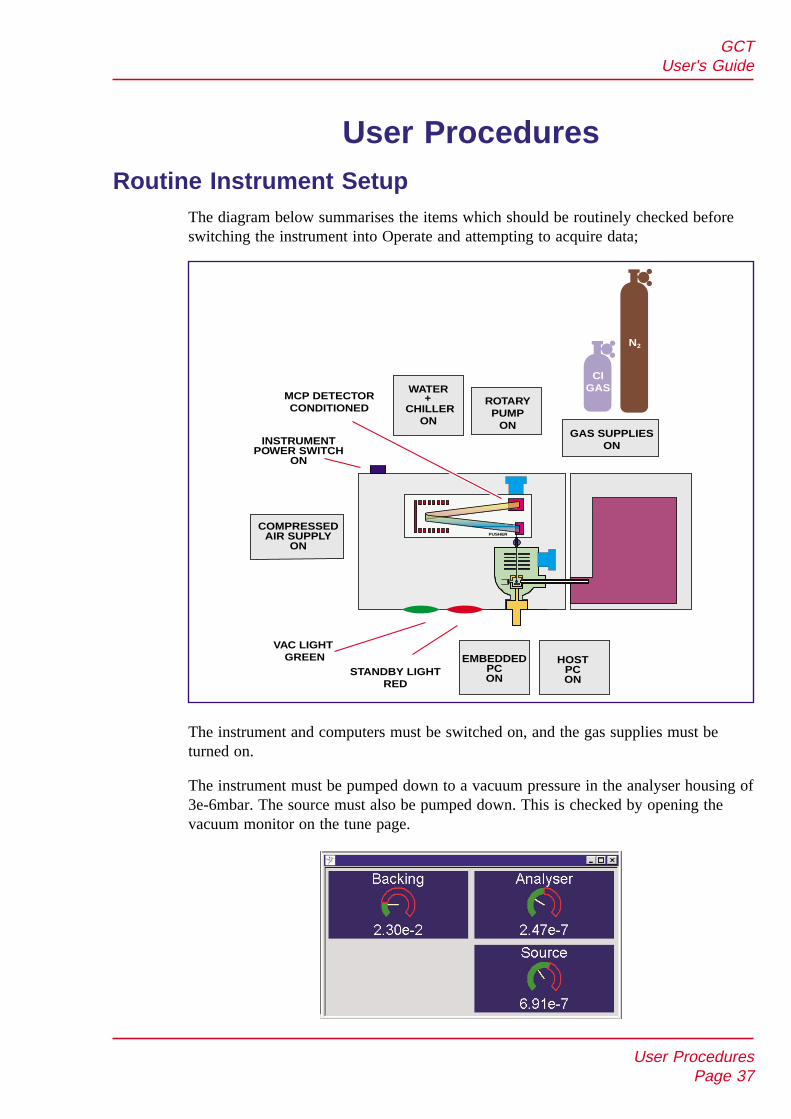
User ProceduresRoutine Instrument Setup
The diagram below summarises the items which should be routinely checked beforeswitching the instrument into Operate and attempting to acquire data;
The instrument and computers must be switched on, and the gas supplies must beturned on.
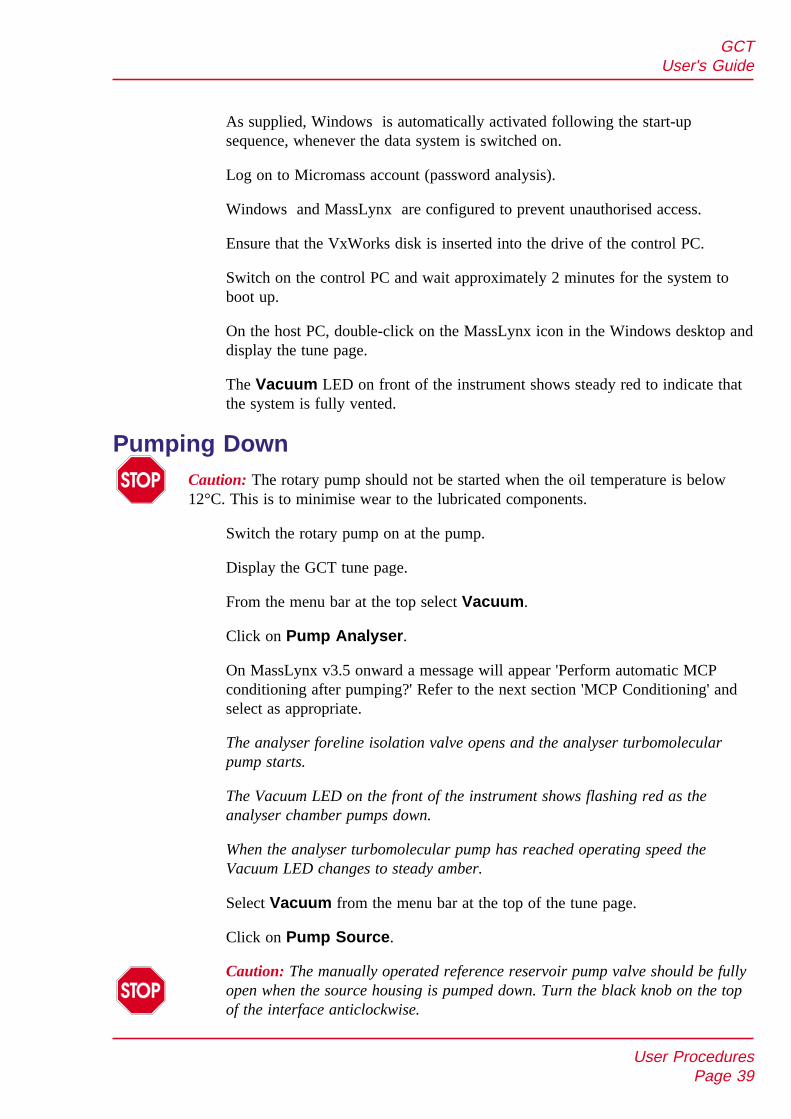
The instrument must be pumped down to a vacuum pressure in the analyser housing of3e-6mbar. The source must also be pumped down. This is checked by opening thevacuum monitor on the tune page.
User ProceduresPage 37
GCTUser's Guide
PUSHER
MCP DETECTORCONDITIONED
STANDBY LIGHTRED
VAC LIGHTGREEN
WATER+
CHILLERON
EMBEDDEDPCON
HOSTPCON
ROTARYPUMP
ONGAS SUPPLIES
ONINSTRUMENTPOWER SWITCH
ON
COMPRESSEDAIR SUPPLY
ON
N2
CIGAS

The microchannel plate detector, referred to as MCPs must be conditioned before turningthe instrument into Operate. If the condition state of the MCPs is in any doubt, they shouldbe conditioned again. Refer to the section MCP Detector Conditioning on page 43.
Once the above have been confirmed, the instrument may be put into Operate.
The instrument conditions must be stabilised for one hour before introducing anysamples.
Instrument Setup from Shutdown
Preparation
Check the level of oil in the rotary pump sight glass.
Connect a supply of clean, dry compressed air to the connector on the servicepanel at the rear of the instrument. Adjust the outlet pressure to 7 bar(80 - 100 psi).
Connect a suitable dry gas, such as dry nitrogen, for example, to the soft ventinlet at the rear of the instrument.
Caution: On some instruments a pressure regulator is connected between the drygas inlet and the analyser turbomolecular pump vent valve. The regulator shouldbe set to a max of 6 psi 500 mbar when the venting gas is attached. If set to ahigher pressure the analyser may become pressurised.
Connect the water supply to the connections at the rear of the instrument.
Check that the rotary pump exhaust is connected to a suitable vent.
Check that the rotary pump vacuum tubing is connected to the rear of theinstrument.
Check that the rotary pump is connected to a suitable mains supply.
Check that the instrument, data system and other peripheral devices (GCequipment, printer etc.) are connected to suitable mains supplies.
Check that the optical communication cables, and the TDC trigger, input andSIP cables are connected from the instrument to the control PC.
Check that the etherlink connection is made between the control PC and the hostPC
Switch on the electronics using the switch situated on the service panel at therear of the instrument.
Switch on the host PC.
User ProceduresPage 38
GCTUser's Guide
As supplied, Windows is automatically activated following the start-upsequence, whenever the data system is switched on.
Log on to Micromass account (password analysis).
Windows and MassLynx are configured to prevent unauthorised access.
Ensure that the VxWorks disk is inserted into the drive of the control PC.
Switch on the control PC and wait approximately 2 minutes for the system toboot up.
On the host PC, double-click on the MassLynx icon in the Windows desktop anddisplay the tune page.
The Vacuum LED on front of the instrument shows steady red to indicate thatthe system is fully vented.
Pumping DownCaution: The rotary pump should not be started when the oil temperature is below12°C. This is to minimise wear to the lubricated components.
Switch the rotary pump on at the pump.
Display the GCT tune page.
From the menu bar at the top select Vacuum.
Click on Pump Analyser.
On MassLynx v3.5 onward a message will appear 'Perform automatic MCPconditioning after pumping?' Refer to the next section 'MCP Conditioning' andselect as appropriate.
The analyser foreline isolation valve opens and the analyser turbomolecularpump starts.
The Vacuum LED on the front of the instrument shows flashing red as theanalyser chamber pumps down.
When the analyser turbomolecular pump has reached operating speed theVacuum LED changes to steady amber.
Select Vacuum from the menu bar at the top of the tune page.
Click on Pump Source.
Caution: The manually operated reference reservoir pump valve should be fullyopen when the source housing is pumped down. Turn the black knob on the topof the interface anticlockwise.
User ProceduresPage 39
GCTUser's Guide

When the reference reservoir is vented it becomes full of air. This takes a long time topump out because of the presence of the fused silica leak within the referencereservoir. The reference pump solenoid is actuated when the source backing lineisolation valve opens and will evacuate the reservoir during source pumpdown.
If the reference reservoir pumping valve is closed, and the source housing is fullypumped down, the pressure indicated in the source housing will be high. This is due toair slowly entering the source housing via the fixed leak in the reference reservoir.The reservoir pump valve should then be opened slowly to minimise the effect of thesurge of air into the backing line.
The analyser foreline isolation valve closes, the source foreline isolation valve opensand the source turbomolecular pump starts.
The Vacuum LED on the front of the instrument shows flashing amber as the analyserchamber pumps down.
When the source turbomolecular pump has reached operating speed the VacuumLED changes to a steady green.
The analyser foreline isolation valve opens.
Selecting Pump Instrument from the Vacuum menu rather thanPump Analyser will pump down the analyser and source housingsequentially, automatically passing through the states described above.
The instrument is ready for MCP detector conditioning once the analyser pressure hasreached a suitable value.
If the rotary pump oil has been changed or replenished, open the gas ballastvalve on the rotary pump. See the pump manufacturer’s literature for details.
Under normal conditions rotary pumps are audibly louder when running undergas ballast.
If the gas ballast valve is open, close it when the rotary pump has run under gasballast for 30 minutes.
MCP Detector ConditioningThe MCP detector must be conditioned before use, by gradually increasing the appliedvoltage over a long time period. This is necessary to allow escape of all absorbedwater from within the coated glass microchannels.
User ProceduresPage 40
GCTUser's Guide

Under normal operation the analyser automatically vents to a dry gas supply installedvia the rear service panel. (eg: dry nitrogen). However, if the dry gas supply was notconnected to the instrument when last vented, or if the instrument has been left ventedfor more than one day, a significant amount of water vapour may have entered theanalyser.
Under these circumstances the instrument will take longer to pump down to a usablevacuum.
MCP conditioning should be repeated after every analyser venting.
It is not necessary to recondition the detector if the instrument has been left out ofOperate while still under vacuum, or if the source housing has been vented whilst theanalyser housing remains under high vacuum.
MCP Conditioning ProcedureEnsure that the analyser pressure is below 3e-6 mbar for at least 1 hour.
Check that the MCP Detector voltage is set to zero on the tune page.
Switch the instrument into the operate mode by selecting Operate on the GCTtune page.
If the instrument is to be left in the operate mode continuously, even when notacquiring data, observe the following;
When no beam is present – reduce the Trap Current to zero in EI mode,Emission Current to Zero in CI mode or Extraction Voltage to zero in FImode. This will minimise source contamination and maximise filament lifetime.This can also be achieved by adjusting the solvent trip level to a pressure lowerthan the source pressure readback.
Close the isolation valve from the software.
Caution: Exposure of the MCP’s to large ion currents over extended periods oftime will reduce the lifetime of the detector.
User ProceduresPage 41
GCTUser's Guide
From the tune page, select Options, MCP Conditioning to access the MCPconditioning program.
Set Start to 100V, Stop to 2700V, Duration to 60 minutes and Step to 1minutes.
Caution: Failure to follow the recommended MCP conditioning procedure canseverely reduce detector lifetime.
Automatic MCP ConditioningOn MassLynx v3.5 onwards an automated pumpdown and MCP conditioning routineis available. Upon pumpdown of the instrument a dialog box will appear stating'Perform Automatic MCP conditioning after pumpdown?
If 'Yes' is selected then pumping down will proceed in the usual manner. Theinstrument will wait until the analyser pressure has been pumped to less than 4e-6mbar, at which point it will turn into Operate and begin conditioning the MCPsaccording to the saved parameters in the MCP Conditioning dialog box.
In order to compensate for the usual 1 hour wait at <3e-6 mbar it is recommended thatAuto MCP conditioning be set for 10 hours (i.e. 600 minutes)
Caution: The instrument will be automatically turned into Operate without userintervention once the pressure has dropped below 4e-6 mbar.
Make sure all panels and covers are in place and no live voltages will bepotentially exposed.
User ProceduresPage 42
GCTUser's Guide

Instrument Warm-upSwitch the instrument into the operate mode by selecting Operate on the GCTtune page.
Allow the instrument temperature to stabilise for at least one hour.
If the instrument is to be left in the operate mode continuously, even when notacquiring data, observe the following;
When no beam is present – reduce the Trap Current to zero in EI mode,Emission Current to Zero in CI mode or Extraction Voltage to zero in FImode. This will minimise source contamination and maximise filament lifetime.This can also be achieved by adjusting the solvent trip level to a pressure lowerthan the source pressure readback.
Close the isolation valve from the software.
Caution: Exposure of the MCP’s to large ion currents over extended periods oftime will reduce the lifetime of the detector.
Using the InstrumentThe GCT is now almost ready to use. To complete the start up procedure and preparefor running samples, follow the instructions described in the section Obtaining an IonBeam in the chapter relevant to the ionisation mode to be used.
Shutdown Procedures
Emergency Shutdown
In the event of having to shut down the instrument in an emergency, proceed asfollows:
Switch off the power at the wall mounted isolation switch(es), if fitted. If not,switch the power off at the rear of the control unit instrument and switch off allperipherals.
A loss of data is likely. The instrument will vent using residual power generatedfrom the spinning turbo pumps to power the vacuum control electronics.
Overnight Shutdown
When the instrument is to be left unattended for a substantial length of time, overnightor at weekends, for example, proceed as follows:
Set the Trap current (EI), emission current (CI) or extraction voltage (FI) requestto Zero.
User ProceduresPage 43
GCTUser's Guide
Close the isolation valve from the CLOSE ISOLATION VALVE button on theEngineer Tuning Menu.
It is not necessary to turn the instrument out of the operate mode. However thisis acceptable as long as instrument warm up time is given consideration whenstarting analysis.
Click on Press for Standby. Switching the instrument out of operate willautomatically close the isolation valve.
Complete Shutdown
Click on Press for Standby.
Select Vacuum from the menu bar at the top of the tune page.
Click on Vent Instrument.
A prompt is displayed to confirm the vent command.
Select OK.
The turbomolecular pumps are switched off. When the turbomolecular pumpshave been run down to half their normal operating speed the vent valves areopened and the instrument is automatically vented. Both front panel LED’sappear red.
Switch off the rotary pump using the switch at the pump.
Exit MassLynx.
Shut down the host PC.
Switch off the control PC.
Switch off all peripherals.
Switch off the power to the instrument using the switch on the rear panel of thecontrol unit.
User ProceduresPage 44
GCTUser's Guide

Installation and Removal of Inner Source EI and CI Mode
Warning: Risk of burns. The source may still be very hot when withdrawn.
From the GCT tune page,
Go to the VACUUM / ISOLATE option
Isolate the source housing
Caution: The diagram below shows the order in which components should beremoved when changing sources. If the GC column is installed it is important toensure that it is withdrawn from the source housing before removal of the innersource. Failure to do this will result in damage to the end of the GC column.
The inner source is retained by two thumb screws above and below the innersource handle. A Viton O ring between the handle and the source housingprovides a vacuum seal.
To remove the inner source undo and remove the two thumb screws and pull theinner source from the source housing.
To replace the source follow the reverse procedure.
Care must be taken to present the inner source centrally to the outer sourcewhen refitting. There should be little resistance to insertion. The column cannow be refitted and the source pumped down.
User ProceduresPage 45
GCTUser's Guide
GC COLUMN + INTERFACE
SOLIDS PROBE
DCI PROBE
OR
OR
1
INNER SOURCE,EI, CI, DCI, FIOR
2
OUTER SOURCEEI
FIOR
3

Installation of the GC Interface
The GC interface incorporates a spring loaded tip at the source end of the columntransfer line. This allows the interface to be in contact with the outer source block tomaintain reagent gas pressure for CI operation, and accommodates thermal expansionof the transfer line.
It is important to ensure that the transfer line is in the correct position relative to theinner source when fitting the interface. If the interface is not fitted and the transfer lineposition not determined proceed as follows:
Isolate the source housing using ISOLATE SOURCE from the VACUUMmenu options in the GCT tune page.
Wait for the Vacuum status light on the front panel to become a constant yellow.
Remove the blanking flange or probe lock from the side of the source housing.
User ProceduresPage 46
GCTUser's Guide
Re-entrant Body
Transfer Line
Heater Connection
Graphitised Vespel Ferrules
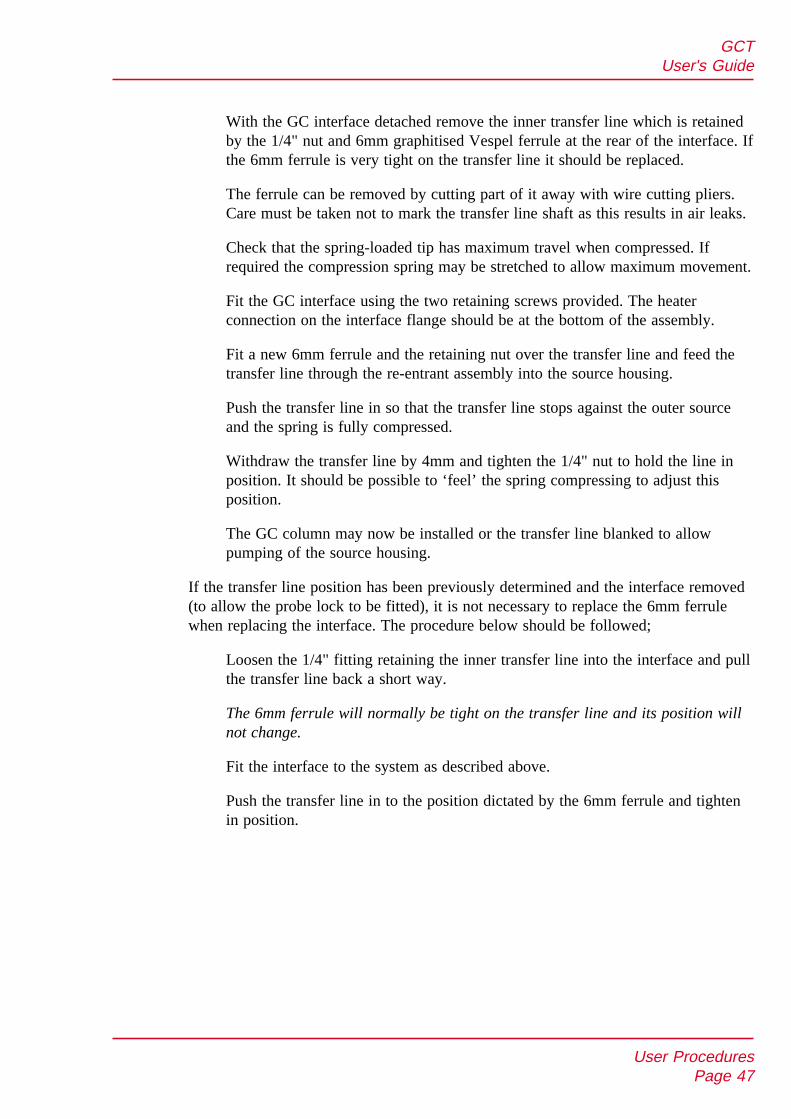
With the GC interface detached remove the inner transfer line which is retainedby the 1/4" nut and 6mm graphitised Vespel ferrule at the rear of the interface. Ifthe 6mm ferrule is very tight on the transfer line it should be replaced.
The ferrule can be removed by cutting part of it away with wire cutting pliers.Care must be taken not to mark the transfer line shaft as this results in air leaks.
Check that the spring-loaded tip has maximum travel when compressed. Ifrequired the compression spring may be stretched to allow maximum movement.
Fit the GC interface using the two retaining screws provided. The heaterconnection on the interface flange should be at the bottom of the assembly.
Fit a new 6mm ferrule and the retaining nut over the transfer line and feed thetransfer line through the re-entrant assembly into the source housing.
Push the transfer line in so that the transfer line stops against the outer sourceand the spring is fully compressed.
Withdraw the transfer line by 4mm and tighten the 1/4" nut to hold the line inposition. It should be possible to ‘feel’ the spring compressing to adjust thisposition.
The GC column may now be installed or the transfer line blanked to allowpumping of the source housing.
If the transfer line position has been previously determined and the interface removed(to allow the probe lock to be fitted), it is not necessary to replace the 6mm ferrulewhen replacing the interface. The procedure below should be followed;
Loosen the 1/4" fitting retaining the inner transfer line into the interface and pullthe transfer line back a short way.
The 6mm ferrule will normally be tight on the transfer line and its position willnot change.
Fit the interface to the system as described above.
Push the transfer line in to the position dictated by the 6mm ferrule and tightenin position.
User ProceduresPage 47
GCTUser's Guide

Installing the GC Column
If a GC column has not been previously installed proceed as follows:
From the GCT tune page,
Go to VACUUM menu options,
Isolate the source housing using ISOLATE SOURCE .
Wait for the Vacuum status light on the front panel to become a constant yellow.
Remove the 1/16" blanking nut from the interface.
Prepare and install the GC column in the GC.
The recommended position of the column into the injector is detailed in the GCmanufacturer's instructions provided.
Undo the two thumb screws retaining the inner source and withdraw the innersource.
Insert the GC column through the interface transfer line to the required distancewith respect to the centre line of the instrument. Mark the position of the columnrelative to the 1/16" retaining nut using typing correction fluid.
Ensure that no typing correction fluid enters the vacuum side of the massspectrometer, as the background will compromise the sample data.
To determine the position of the GC column with respect to the centre line ofthe instrument, look down the inner source probe port with the inner sourcewithdrawn.
The end of the column will be visible as it enters the source housing.
User ProceduresPage 48
GCTUser's Guide
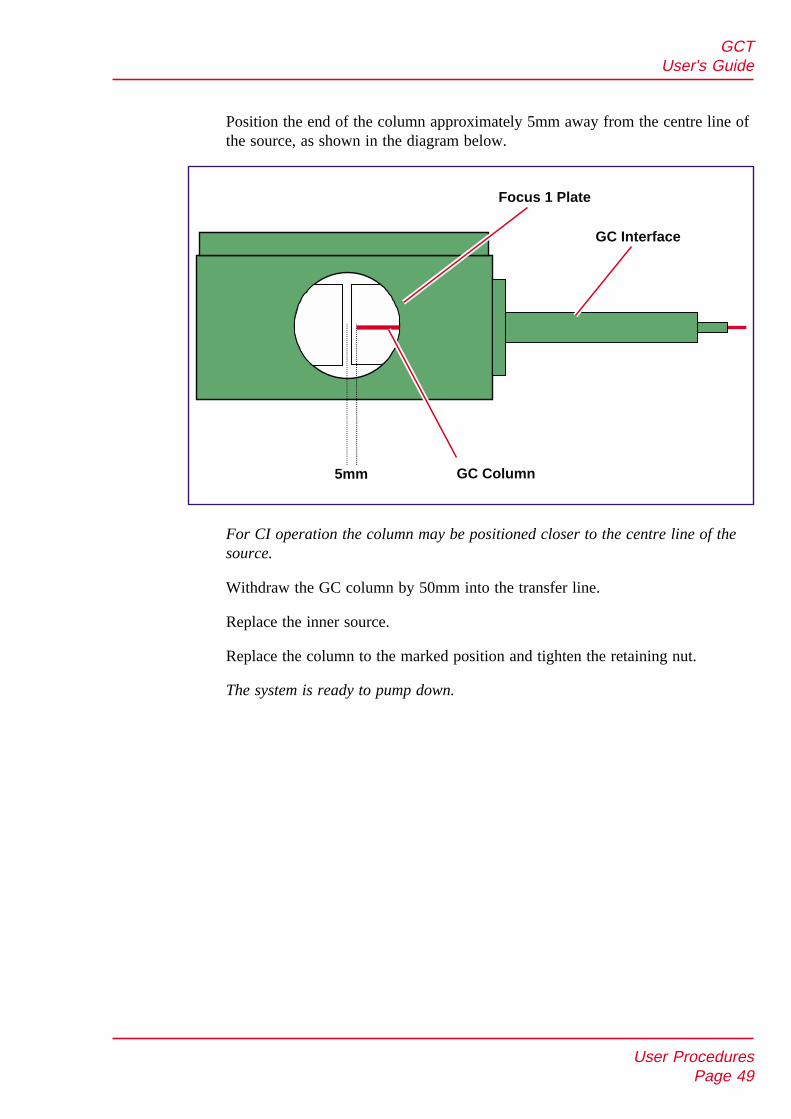
Position the end of the column approximately 5mm away from the centre line ofthe source, as shown in the diagram below.
For CI operation the column may be positioned closer to the centre line of thesource.
Withdraw the GC column by 50mm into the transfer line.
Replace the inner source.
Replace the column to the marked position and tighten the retaining nut.
The system is ready to pump down.
User ProceduresPage 49
GCTUser's Guide
Focus 1 Plate
GC Interface
GC Column5mm

Field Ionisation (FI) ModeField ionisation (FI) is a soft process, often producing spectra with very little or nofragmentation. It is used for detection and exact mass measurement of molecular ionswhich may be weak or even absent in EI.
In field ionisation, sample molecules pass in close proximity to the tips of a mass ofneedle-like carbon dendrites. A counter electrode is held at high potential; thisproduces very high electric fields around the tips of the carbon dendrites.
Under the influence of these fields, quantum tunnelling of a valence electron from themolecule takes place to give an ion radical.
User ProceduresPage 50
GCTUser's Guide
Photograph courtesy of Carbotec GmbH
Support Plates
Lens Block
Focus Plates
Spring Contacts
Electrical Feedthroughs
Overview of OperationIn GC-FI the FI emitter is positioned in close proximity to a pair of hollow extractionrods. The emitter is held at ground potential and 12,000 volts is applied to the rods.These extraction rods can be heated by passing a current through the rods themselves.Heating of the extraction rods is not usually required for GC FI but may be desirableif very involatile samples are introduced via the solids probe. The rods are very highlypolished and must be kept clean and free from burrs to prevent current leakage fromthe rods to the emitter.
The GC column is positioned in close proximity and in line with the emitter wire. Thepositioning of these three elements with respect to each other is critical. The correctposition is described below.
As sample elutes from the GC column some condensation of sample occurs onto thesurface of the emitter. This fills some of the sites on the emitter, reduces field strengthand thus reduces sensitivity. To remove the condensed material and 'regenerate' theemitter a current is passed through the emitter during the interscan delay period of theacquisition between each spectrum. This is referred to as the flash off current. Theemitter is then left to cool during the acquisition period. When the emitter is hotsensitivity is also reduced. There is a finite time associated with heating and coolingthe emitter wire by this method. It is therefore important to set the flash off period(interscan delay time) and emitter current heating period (acquisition time) to thecorrect values for the experiment to be performed.
The maximum emitter current is dictated by the diameter of the wire used to make theemitter. The maximum emitter currents are indicated in the section Choosing anEmitter below.
It should be noted that no deflection of the beam is performed in FI mode. Intense lowmass background ions are not present. Tuning should therefore be optimised for bestsensitivity.
Choosing an Emitter for FIFor the best sensitivity and performance in GC FI for applications involving thecharacterisation of low amounts of chromatographically resolved analytes, thefollowing emitter characteristics are desirable,
• High field strength at minimum extraction voltage.
• Minimum surface area onto which analyte can condense.
• Very fast heating and cooling characteristics. This ensures fast recovery ofsensitivity after flash off.
User ProceduresPage 51
GCTUser's Guide

In general, the smaller the diameter of the emitter wire, and the shorter the carbondendrite micro needles, the higher the field strength at a given extraction voltage. Inaddition smaller diameter emitter wires have very fast cooling and heatingcharacteristics.
The GCT is supplied with a pack of six FI emitters from Carbotec(http://www.carbotec.com). These emitters are made from 5µm diameter tungsten wireand are suitable for FI applications. Emitters are also available from Linden(www.linden.com).
For FI-GC-MS applications involving very complex mixtures which are unresolvedchromatographically eg: analysis of crude oils, different criteria are required.
The emitter must be tolerant to a larger amount of condensed or closelyassociated material.
An emitter with a higher surface area which can act partially as a sample reservoir,without completely suppressing sensitivity is required. FI emitters are not suitable forthese applications.
FD or all-round emitters will give better performance in these applications. Theseemitters have a 10µm diameter wire and have longer and more highly branched carbondendrite micro needles. Absolute sensitivity will be significantly lower than that usingthe 5µm diameter FI emitters.
Maximum Flash Off CurrentThe maximum flash of current for a given emitter depends on the diameter of thetungsten wire attached to the emitter bead.
10µm diameter wire maximum current = 90mA (Carbotec FD, all-round)
5µm diameter wire maximum current = 10mA (Carbotec FI)
Emitter LifetimeSome types of emitters have a finite lifetime, in the order of 3 - 4 months inatmosphere. The ultimate sensitivity of the emitter for FI will decrease the longer theemitter is stored. The likely mechanism for this degrading of performance is oxidationof the tungsten wire used. To extend the lifetime of the emitters they should be storedunder vacuum or under an atmosphere of dry N2.
User ProceduresPage 52
GCTUser's Guide
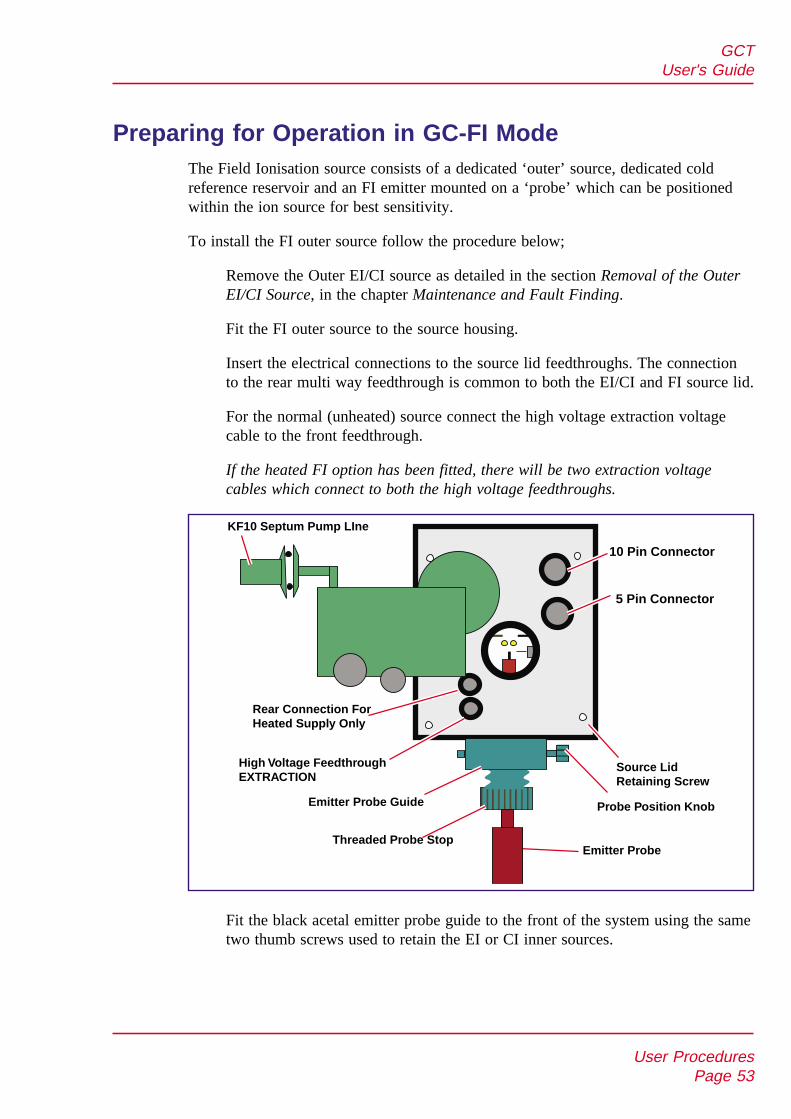
Preparing for Operation in GC-FI ModeThe Field Ionisation source consists of a dedicated ‘outer’ source, dedicated coldreference reservoir and an FI emitter mounted on a ‘probe’ which can be positionedwithin the ion source for best sensitivity.
To install the FI outer source follow the procedure below;
Remove the Outer EI/CI source as detailed in the section Removal of the OuterEI/CI Source, in the chapter Maintenance and Fault Finding.
Fit the FI outer source to the source housing.
Insert the electrical connections to the source lid feedthroughs. The connectionto the rear multi way feedthrough is common to both the EI/CI and FI source lid.
For the normal (unheated) source connect the high voltage extraction voltagecable to the front feedthrough.
If the heated FI option has been fitted, there will be two extraction voltagecables which connect to both the high voltage feedthroughs.
Fit the black acetal emitter probe guide to the front of the system using the sametwo thumb screws used to retain the EI or CI inner sources.
User ProceduresPage 53
GCTUser's Guide
KF10 Septum Pump LIne
10 Pin Connector
5 Pin Connector
Source LidRetaining Screw
Probe Position Knob
Emitter Probe
Emitter Probe Guide
Threaded Probe Stop
High Voltage FeedthroughEXTRACTION
Rear Connection ForHeated Supply Only

Completely remove the inner transfer line of the GC interface and replace withthe dedicated GC-FI inner transfer line. This includes a ceramic tip which helpsto minimise the disturbance of the electrical field close to the emitter. Leave theinner transfer line pulled back from the centre line of the source at this stage.
Carefully remove an FI emitter from its transportation box using a pair oftweezers to grip one of the emitter bead legs. The emitter wire is very fragileand should not be directly touched.
Caution: the emitter bead is made of ceramic and can shatter if put under unduestress. Wear protective goggles when handling the emitters.
Stand the emitter probe upright on a flat surface and carefully install the emitterbead into the end of the emitter probe. The emitter bead can be touched to allowthe emitter to be pushed all the way onto the probe as long as care is taken notto touch the emitter wire directly.
User ProceduresPage 54
GCTUser's Guide
Thumb Screws
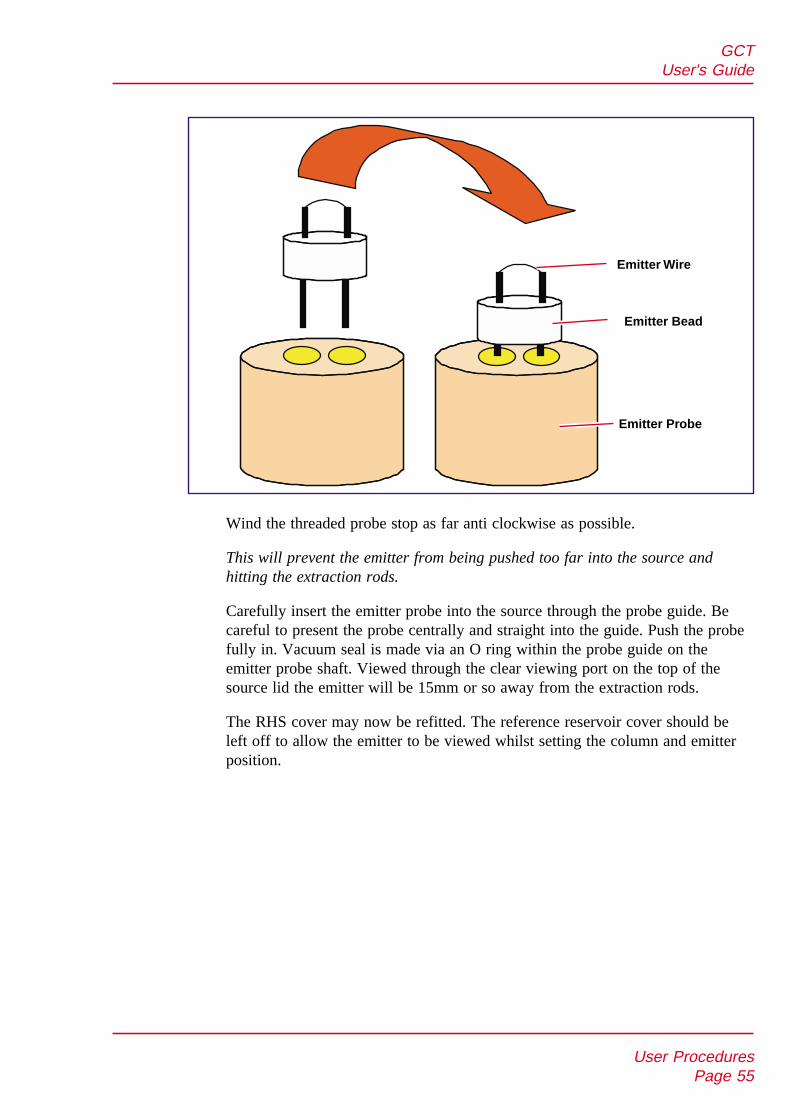
Wind the threaded probe stop as far anti clockwise as possible.
This will prevent the emitter from being pushed too far into the source andhitting the extraction rods.
Carefully insert the emitter probe into the source through the probe guide. Becareful to present the probe centrally and straight into the guide. Push the probefully in. Vacuum seal is made via an O ring within the probe guide on theemitter probe shaft. Viewed through the clear viewing port on the top of thesource lid the emitter will be 15mm or so away from the extraction rods.
The RHS cover may now be refitted. The reference reservoir cover should beleft off to allow the emitter to be viewed whilst setting the column and emitterposition.
User ProceduresPage 55
GCTUser's Guide
Emitter Probe
Emitter Bead
Emitter Wire

Positioning of GC Column For FI OperationInsert the inner GC - FI transfer line and lock in position approximately 5-10mmaway from the edge of the RHS extraction rod whilst viewing through the clearviewing port on the top of the source.
X = about 5 -10mm
Y = about 2 - 4mm
Z = about 12 - 20mm
Insert the GC column through the transfer line and position between 2 and 4 mmaway from the center of the two extraction rods. Tighten in place.
Carefully wind the threaded probe stop clockwise to move the emitter probeinwards. Position the emitter so that it lines up or is fractionally in front of theend of the GC column. NOTE: view the emitter through the viewing port duringthis operation to make sure that the emitter wire does not foul the rods or theend of the GC column.
Adjust the probe position knob until the emitter is roughly central with respect tothe two extraction rods.
User ProceduresPage 56
GCTUser's Guide
X
Y
ZProbe
Emitter GC- FI TransferLine
GC Column
ExtractionRods
ReferenceRe-entrant
5mm
2mm
12mm
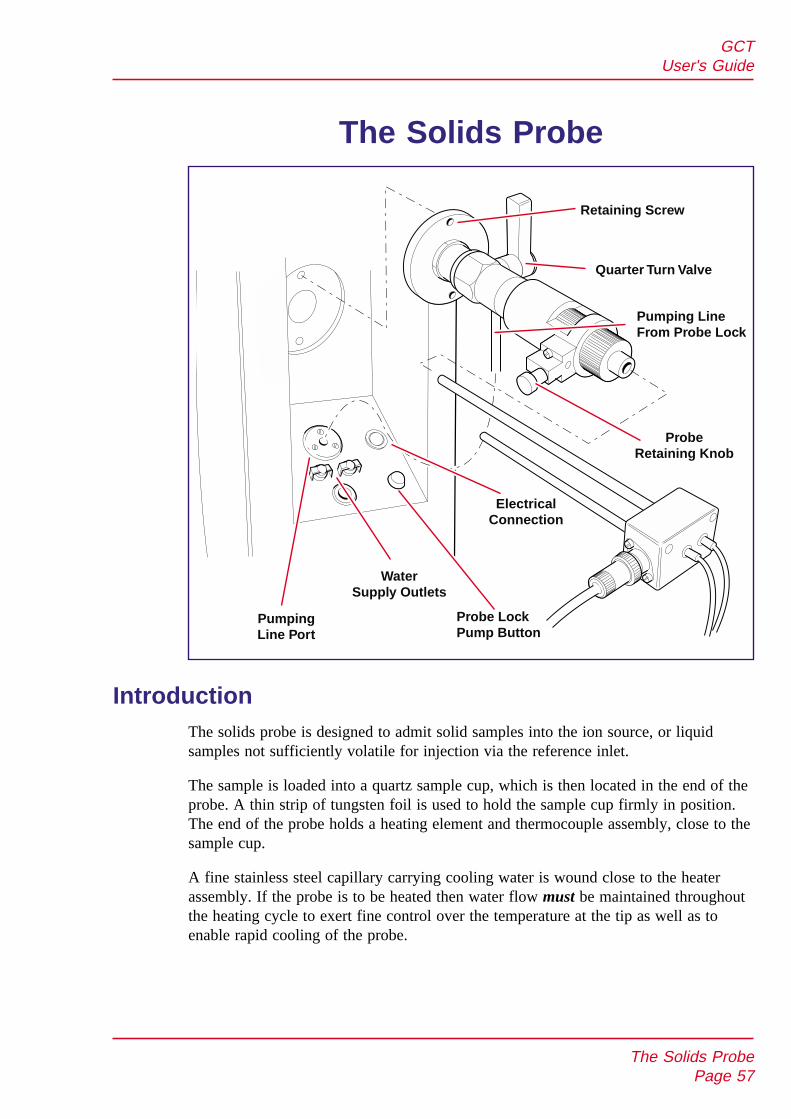
The Solids Probe
IntroductionThe solids probe is designed to admit solid samples into the ion source, or liquidsamples not sufficiently volatile for injection via the reference inlet.
The sample is loaded into a quartz sample cup, which is then located in the end of theprobe. A thin strip of tungsten foil is used to hold the sample cup firmly in position.The end of the probe holds a heating element and thermocouple assembly, close to thesample cup.
A fine stainless steel capillary carrying cooling water is wound close to the heaterassembly. If the probe is to be heated then water flow must be maintained throughoutthe heating cycle to exert fine control over the temperature at the tip as well as toenable rapid cooling of the probe.
The Solids ProbePage 57
GCTUser's Guide
Retaining Screw
Quarter Turn Valve
ProbeRetaining Knob
Pumping LineFrom Probe Lock
PumpingLine Port
ElectricalConnection
Probe LockPump Button
WaterSupply Outlets

The probe may be heated rapidly by the current passed through the heater element.The thermocouple monitors the temperature, and the heating current is controlledelectronically to maintain the required program rate and final temperature. However,it should be noted that interruptions to water flow may result in the probe heater beingdamaged.
Removing the GC Interface
The GC interface is attached to the source housing by two retaining screws on theinterface flange. A vacuum seal to the housing is maintained by a Viton O ring sealwithin the interface flange. To remove the interface and attach the probe insertionlock.
Isolate the source housing using ISOLATE SOURCE from the VACUUMmenu options in the GCT tune page.
Wait for the vacuum status light on the front panel become a constant yellow.
Loosen the 1/16" column retaining nut on the interface within the GC oven andfully withdraw the GC column from the interface.
Release the two GC plinth stops by turning the black knobs on the top righthand side of the GC plinth to allow the GC to be freely pushed away clear of thewhole of the GC interface.
If required for access, the GC may be pushed to the back of the bench clearingthe probe side panel.
Remove the heater connection to the interface.
Remove the two GC interface retaining screws and remove the GC interface.
Installing the Probe and Lock
Attach the probe lock using the two retaining screws provided. The quarter turnvalve should be to the rear of the instrument and in the upright, closed position.
Ensure a Viton O ring is present in the groove in the retaining flange.
Insert the pumping line from the probe lock into the vacuum port on the probeside panel.
A further Viton O ring within this port will make a vacuum seal to the pumpingline adapter allowing the lock to be evacuated prior to probe insertion.
Pump the source housing.
The Solids ProbePage 58
GCTUser's Guide
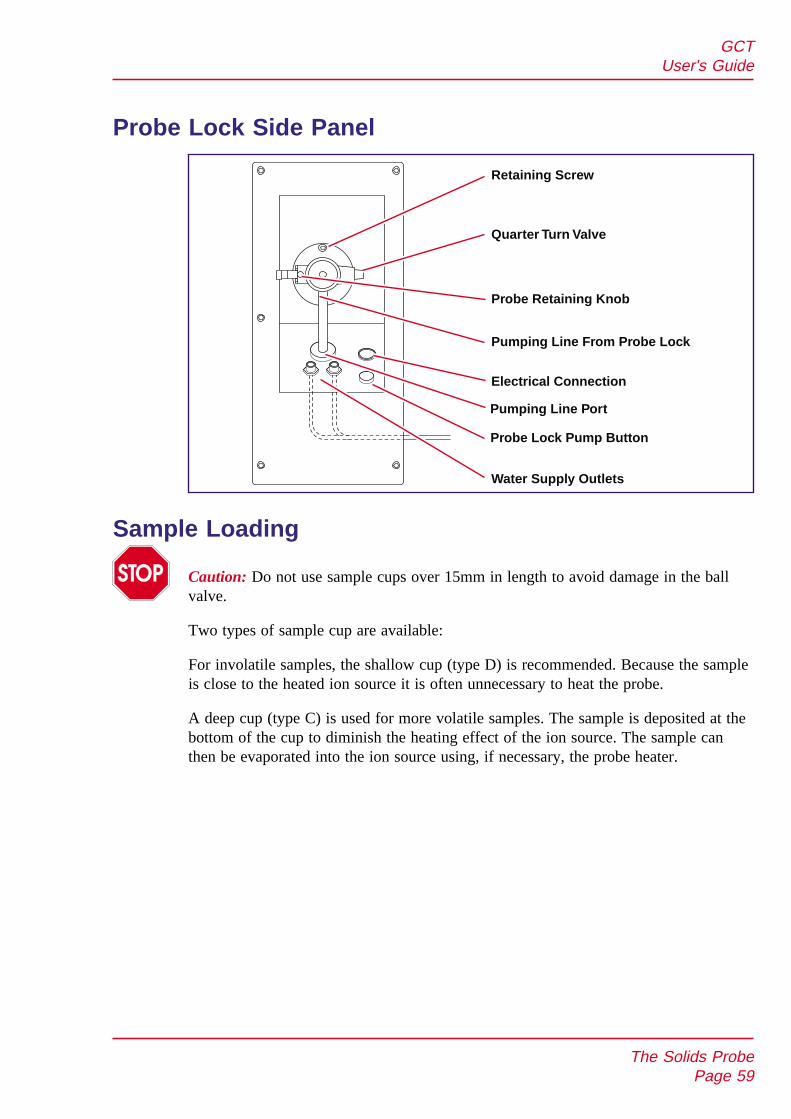
Probe Lock Side Panel
Sample Loading
Caution: Do not use sample cups over 15mm in length to avoid damage in the ballvalve.
Two types of sample cup are available:
For involatile samples, the shallow cup (type D) is recommended. Because the sampleis close to the heated ion source it is often unnecessary to heat the probe.
A deep cup (type C) is used for more volatile samples. The sample is deposited at thebottom of the cup to diminish the heating effect of the ion source. The sample canthen be evaporated into the ion source using, if necessary, the probe heater.
The Solids ProbePage 59
GCTUser's Guide
Retaining Screw
Quarter Turn Valve
Probe Retaining Knob
Pumping Line From Probe Lock
Electrical Connection
Probe Lock Pump Button
Water Supply Outlets
Pumping Line Port
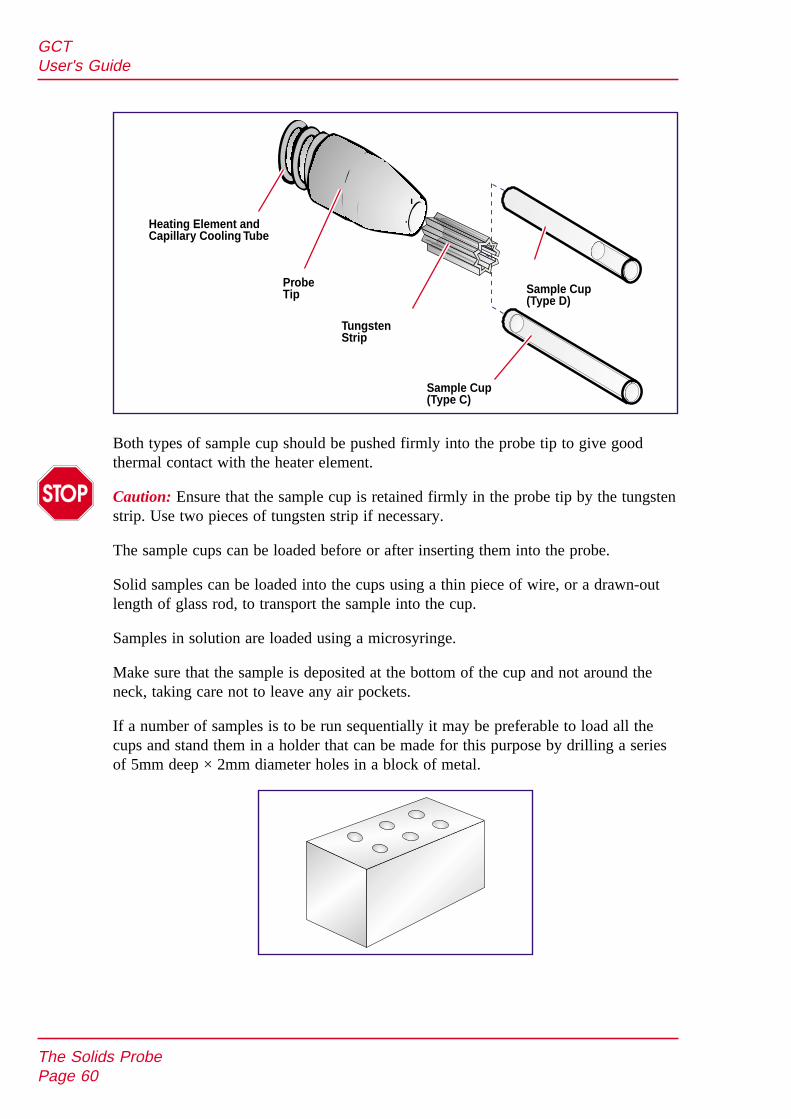
Both types of sample cup should be pushed firmly into the probe tip to give goodthermal contact with the heater element.
Caution: Ensure that the sample cup is retained firmly in the probe tip by the tungstenstrip. Use two pieces of tungsten strip if necessary.
The sample cups can be loaded before or after inserting them into the probe.
Solid samples can be loaded into the cups using a thin piece of wire, or a drawn-outlength of glass rod, to transport the sample into the cup.
Samples in solution are loaded using a microsyringe.
Make sure that the sample is deposited at the bottom of the cup and not around theneck, taking care not to leave any air pockets.
If a number of samples is to be run sequentially it may be preferable to load all thecups and stand them in a holder that can be made for this purpose by drilling a seriesof 5mm deep × 2mm diameter holes in a block of metal.
The Solids ProbePage 60
GCTUser's Guide
Heating Element andCapillary Cooling Tube
ProbeTip
TungstenStrip
Sample Cup(Type D)
Sample Cup(Type C)

Any solvent used in loading can be evaporated by placing the sample tube(s) in awarm place, for example on top of the GC oven. Care should be taken not to heat theholder too quickly so as to avoid blowing the sample out of the cup with solventvapour. Used sample cups should be cleaned in a hot flame and/or washed in solventbefore re-use.
Water and Electrical ConnectionsMaintain connections to water and electrical supplies while the probe is in constantuse. However, it is recommended that the water is disconnected overnight to minimisethe risk of burst pipes through a rise in the water pressure. Disconnect the electricalconnections to avoid heating the probe while the cooling water is disconnected.
To disconnect the water supply push back the collars on the water supply outlets,mounted on the probe side panel, allowing the probe connectors to be withdrawn.
Connection is simply the reverse: push back the collars, insert the connectors andrelease the collars.
Inserting the ProbeCaution: Damage to the instrument may occur if the insertion lock is operated withthe probe incorrectly positioned.
To insert the loaded probe into the ion source:
Check that the quarter turn valve is in the upright position.
Insert the probe into the introduction lock until the probe reaches the first stop.
Check that the water and electrical connections are made.
Check that the pumping line is connected to the port on the probe side panel.
press the Pump Probe switch on the probe side panel.
The vacuum levels can be displayed by selecting Vacuum Monitor. Backingline pressure shows the pressure in the vacuum lock pumping line.
When the inlet pressure falls below the trip level set on the Pirani gauge thegreen light in the centre of the pump probe switch will illuminate:
Slowly open the quarter-turn ball valve.
Pull the black probe retaining knob, located on the side of the probe lock,against its internal spring.
Slowly push the probe fully in.
The Solids ProbePage 61
GCTUser's Guide

It is recommended that the probe shaft be lubricated with molybdenumdisulphide to ensure smooth travel.
A threaded probe stop collar is fitted to the probe lock to allow the probe fully inposition to be set to the desired distance from the ion source. For CI operation, ensurethat the probe hits the outer source by adjusting the collar fully clockwise.
Source temperature is often sufficient to evaporate the sample, particularly if theshallower sample cup is used. If this is not the case, or if a more controlledevaporation is required, the probe temperature may be ramped from software duringacquisition. This menu is accessed from the inlet menu of the GCT instrument controlpage.
There is the option of using base peak or TIC Control offered on this page. This canbe selected in conjunction with 'after mass' which takes the base peak or TIC above aspecific mass to avoid reference peaks/carrier gas etc. When selected, the base peak orTIC is monitored as the ramp is applied. If it achieves the 'hold threshold' the probetemperature is held at its present value until one of the following conditions apply.
a) The base peak/ TIC drops to the 'On Threshold' in which case the ramp resumes.
b) The 'abort threshold' is reached, in which case the probe heating is turned off untilthe base peak/TIC drops below the 'On Threshold'.
This control can help prevent detector saturation.
Multiple ramps can be set on the Ramps page.
It is possible to edit the ramp rate, value and hold parameters by use of the TAB key,the ENTER key and the ARROW keys.
The rate at which the probe is heated can be critical and varies with the type ofsample. Some experimentation may be required to establish the optimum conditionsfor the evaporation of individual samples.
The Solids ProbePage 62
GCTUser's Guide
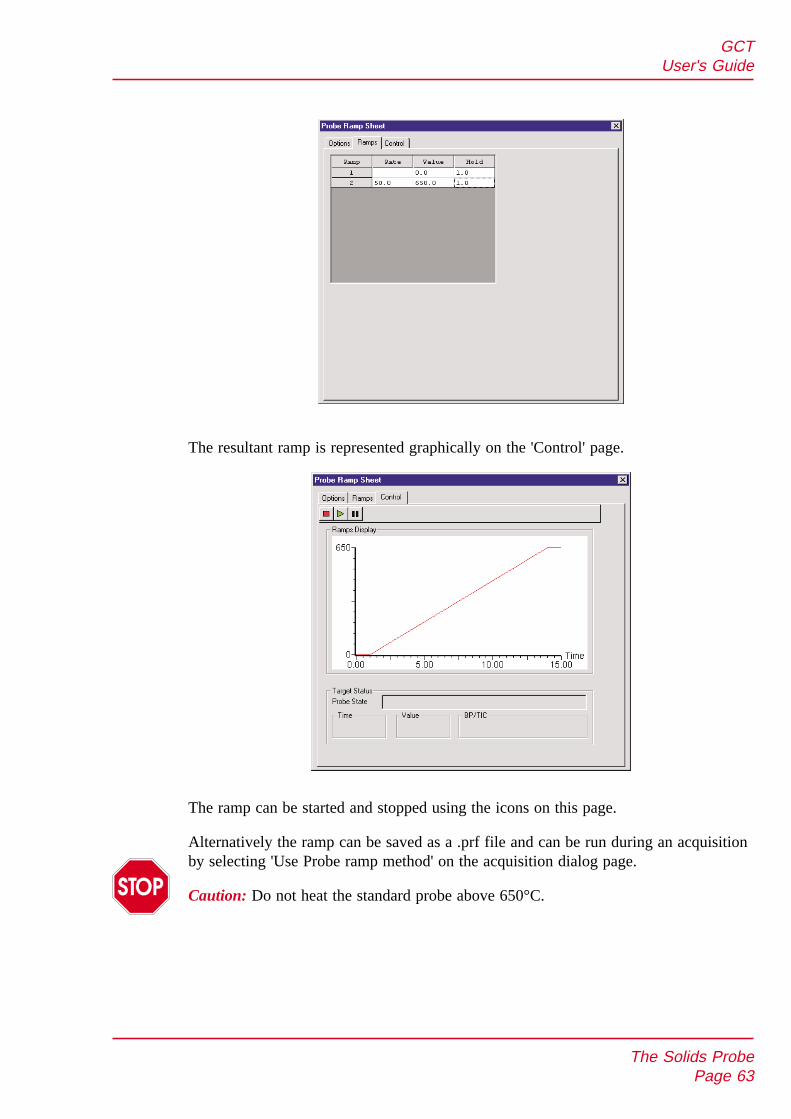
The resultant ramp is represented graphically on the 'Control' page.
The ramp can be started and stopped using the icons on this page.
Alternatively the ramp can be saved as a .prf file and can be run during an acquisitionby selecting 'Use Probe ramp method' on the acquisition dialog page.
Caution: Do not heat the standard probe above 650°C.
The Solids ProbePage 63
GCTUser's Guide
Withdrawing the ProbeTo withdraw the probe after use:
Allow the probe to cool to below 100°C.
This protects the structural integrity of the seals in the lock. The seals mighteasily be damaged if the probe is withdrawn at high temperature.
Withdraw the probe to the first stop.
Close the quarter-turn ball valve.
Pull the black probe retaining knob outwards against the internal spring.
Withdraw the probe from the lock.
Caution: Damage to the instrument may occur if the probe is removed without firstclosing the ball valve.
The Solids ProbePage 64
GCTUser's Guide
The DCI ProbeIntroduction
Direct Chemical Ionisation (DCI) was originally developed as a soft ionisationtechnique for relatively involatile samples for use on EI/CI mass spectrometers. Thesamples are placed on a filament wire which is inserted directly into the ion source sothat the filament tip is in the ion plasma. A current is passed through the wire and thesample is rapidly desorbed. As the sample is rapidly desorbed coupled with the factthat the sample is already directly in the ion plasma it results in a high abundance ofthe molecular ion [M+H]+ due to a short mean free path of the sample in which tofragment.
On the GCT mass spectrometer the DCI probe is inserted into the CI ion source viathe insertion lock in a similar manner to the solids probe. The sample is loaded ontothe end of the probe tip and, once inserted, can be desorbed by ramping the probe tipcurrent using the MassLynx software.
Installing the probe lock and the DCI probeRemoving the GC interface and installing the probe lock is described in the section“Removing the GC interface and Installing the Probe and Lock” earlier in this chapter.
The DCI probe is supplied with a modified inner CI source with a larger (3mm) entryhole to accommodate the probe tip. You must use this special inner source with theDCI probe as the standard source will damage the probe tip. The modified DCI sourcewill not work well with the GC due to the larger hole causing CI gas leaks and shouldonly be used for DCI work.
To prepare to run the DCI probe complete the following steps;
Select ISOLATE SOURCE from the VACUUM drop down menu on the GCTtune page.
Wait for the vacuum indication light on the front of the instrument to become aconstant yellow. You should hear the source venting and see the source vacuumgauge read-back turn off.
If you have not done so already then install the insertion lock on the right handside of the source as described in the section “Removing the GC interface andInstalling the Probe and Lock”.
Remove the inner source and replace it with the modified DCI inner CI sourcesupplied with the DCI probe. This source can be identified by its larger 3mmentry hole on its right hand side to accommodate the DCI probe tip.
Pump down the source by selecting PUMP from the VACUUM drop downmenu on the GCT tune page.
The DCI ProbePage 65
GCTUser's Guide
The DCI probe is introduced to the CI source via the insertion lock. It isrecommended that you lubricate the probe shaft with molybdenum disulphide toensure a smooth travel - do not use SANTOVAC oil lubricant as you will see this ascontaminant at 446 Da (i.e. [M+H]+ at 447 Da). The probe should be tight in the lockbut it should move in and out with a little force. The probe cable should be plugged into the PROBE socket on the side of the instrument below the insertion lock, there isno water cooling on the DCI probe.
Loading the Tip with SampleThe DCI tip consists of a small diamond of rhenium wire on a ceramic mount. It ispushed on to the end of the DCI probe for use.
The wire filament at the end of the tip is fragile so care must be taken whenhandling the tip to prevent damage.
Sample is normally dissolved in methanol or a similar solvent to a concentration of1ng/µl. Then, using a 10 µl syringe, deposit a microlitre onto the end of the DCI tip(i.e. 1ng of sample). Due to surface tension in the liquid the droplet should stay at thepoint of the wire tip. Alternatively if it is not important to know the amount of sampleintroduced then the tip can be carefully dipped into the sample solution. Wait for thesolvent to evaporate, normally this will take a minute or so, and the probe can now beinserted into the source. In order to increase the amount of sample introduced on thetip use a correspondingly stronger solution. It is common to run samples between 1ngand 1 µg.
Inserting the DCI ProbeCaution: Damage to the instrument may occur if the insertion lock is operated withthe probe incorrectly positioned.
The DCI probe is inserted into the source in the same manner as the solids probe asfollows:
Check that the quarter turn valve is in the upright position.
Push the DCI probe into the insertion lock until the probe guide is engaged inthe first stop.
Check that the probe cable is connected to the “PROBE” socket on theinstrument side panel.
Check that the pumping line is connected to the port on the side panel.
Press the “VAC” pump probe button on the probe side panel to pump down theinsertion lock.
The DCI ProbePage 66
GCTUser's Guide
The vacuum levels can be displayed by selecting Vacuum Monitor from the dropdown menu on the GCT tune page. Backing pressure shows the pressure in thevacuum lock pumping line.
When the inlet pressure falls below the trip level the green light in the centre ofthe “VAC” pump probe button will be illuminated.
Slowly open the quarter turn ball valve on the insertion lock.
Release the probe retaining knob and slowly push in the probe.
Make sure that the probe is fully in so that the DCI tip is pushed up against theouter source to make a good seal for the CI gas. If necessary ensure this byrotating the threaded probe stop collar fully clockwise.
Calibration and TuningThe instrument can be calibrated using heptacosa with a very small amount of CI gasif necessary in the same manner as for normal positive ion CI work. Pump out theheptacosa and use tris(trifluoromethyl)triazine as the lock mass ([M+H]+ ion at m/z286.0027 Da). Normally <1µl is needed to get a strong signal. Introduce methane CIgas so that the source pressure is about 1x10⁻⁴ mbar. Tune up the instrument to givemaximum sensitivity on the [M+H]+ 286 Da ion. For good CI this signal should be >than the peak at 285 (M+ ion) You should also see methane giving a signal at 29 Da.
For more details of running the GCT in CI mode and calibration see thesections “Calibration and Exact Mass” and “Operation in Chemical IonisationMode” in this manual.
DCI Probe ControlThe current through the probe tip is controlled from the MassLynx software on theGCT tune page “inlets” section. Tick the box next to “Use DCI mode” and the controlwill change to “DCI Probe” current in Amps.
The DCI ProbePage 67
GCTUser's Guide

The probe current can be controlled from 0 to 1.5A manually or the probe ramps canbe used by clicking the EDIT RAMPS button or from selecting Probe control from theOptions drop down menu.
The Use Ramps box should be ticked in order to ramp the probe.
The DCI probe current can be regulated by the base peak in the spectrum or the TotalIon Count (TIC) if desired by ticking the appropriate box. When this option is selectedthe probe will ramp as defined on the Ramps page until the Hold threshold is reached.At this point the current will remain constant until the signal has dropped to the OnThreshold at which point the ramp will resume. If the Abort Threshold is breachedthen the current will be turned off until the signal has dropped to the On Threshold.
The DCI ProbePage 68
GCTUser's Guide
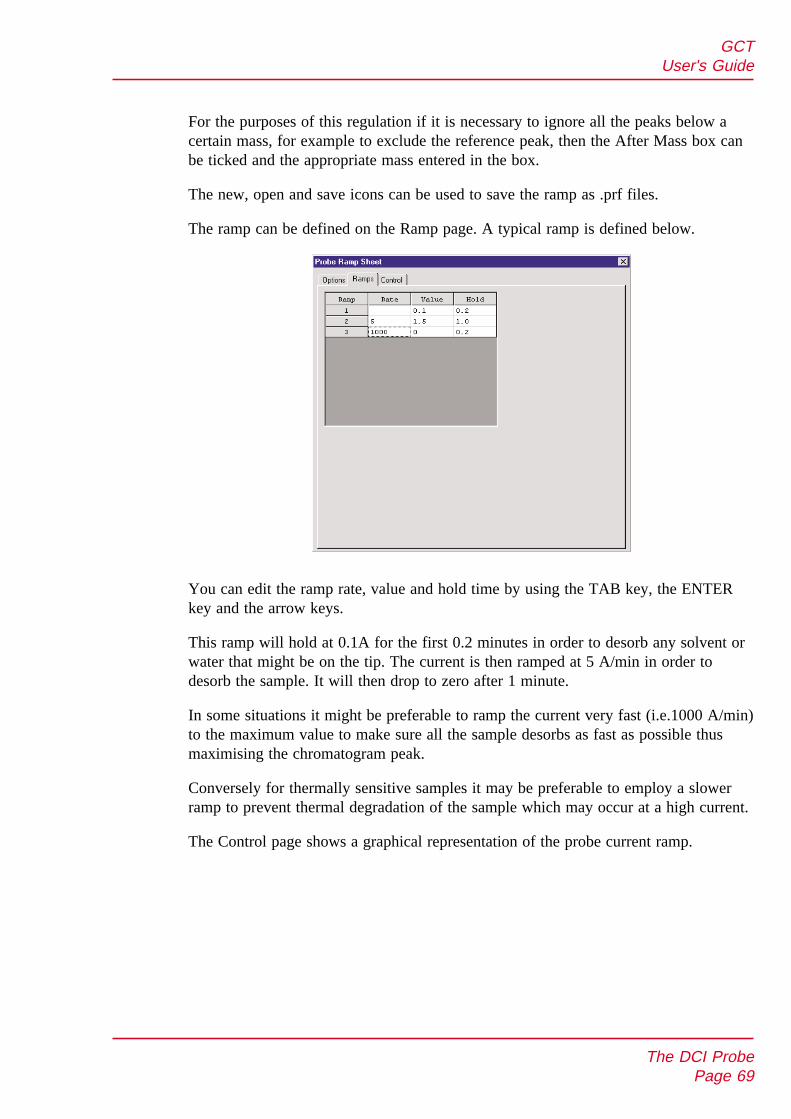
For the purposes of this regulation if it is necessary to ignore all the peaks below acertain mass, for example to exclude the reference peak, then the After Mass box canbe ticked and the appropriate mass entered in the box.
The new, open and save icons can be used to save the ramp as .prf files.
The ramp can be defined on the Ramp page. A typical ramp is defined below.
You can edit the ramp rate, value and hold time by using the TAB key, the ENTERkey and the arrow keys.
This ramp will hold at 0.1A for the first 0.2 minutes in order to desorb any solvent orwater that might be on the tip. The current is then ramped at 5 A/min in order todesorb the sample. It will then drop to zero after 1 minute.
In some situations it might be preferable to ramp the current very fast (i.e.1000 A/min)to the maximum value to make sure all the sample desorbs as fast as possible thusmaximising the chromatogram peak.
Conversely for thermally sensitive samples it may be preferable to employ a slowerramp to prevent thermal degradation of the sample which may occur at a high current.
The Control page shows a graphical representation of the probe current ramp.
The DCI ProbePage 69
GCTUser's Guide
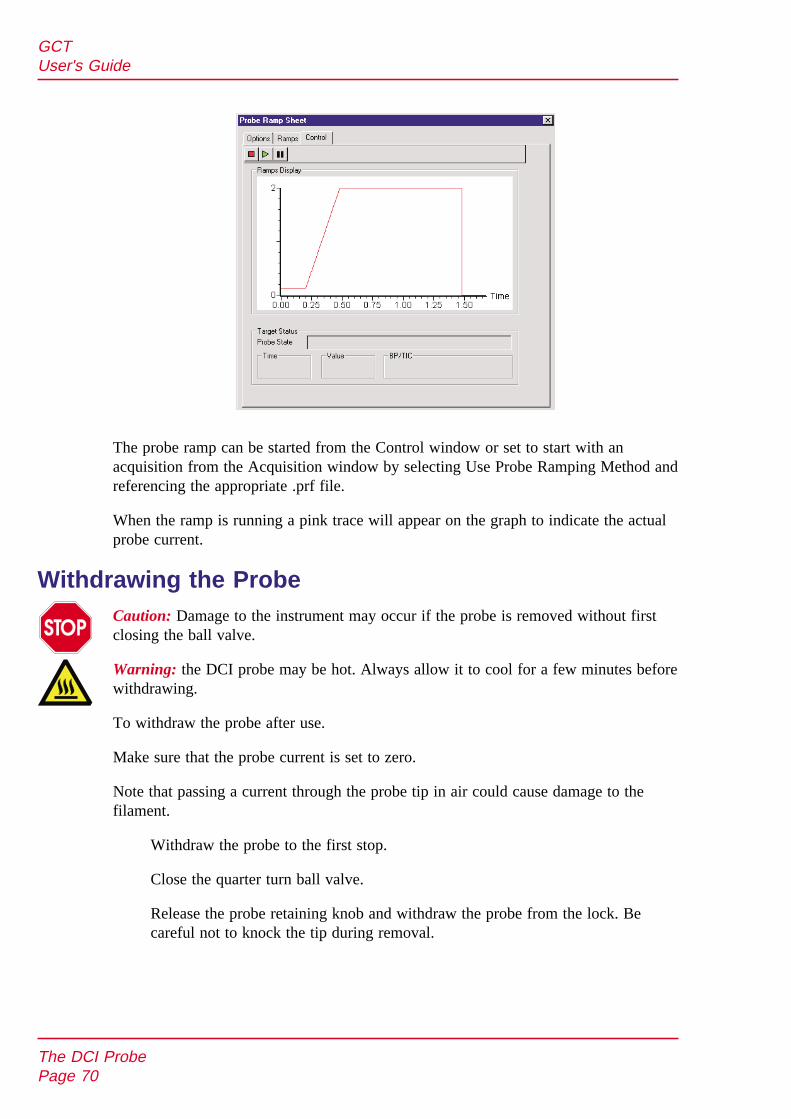
The probe ramp can be started from the Control window or set to start with anacquisition from the Acquisition window by selecting Use Probe Ramping Method andreferencing the appropriate .prf file.
When the ramp is running a pink trace will appear on the graph to indicate the actualprobe current.
Withdrawing the ProbeCaution: Damage to the instrument may occur if the probe is removed without firstclosing the ball valve.
Warning: the DCI probe may be hot. Always allow it to cool for a few minutes beforewithdrawing.
To withdraw the probe after use.
Make sure that the probe current is set to zero.
Note that passing a current through the probe tip in air could cause damage to thefilament.
Withdraw the probe to the first stop.
Close the quarter turn ball valve.
Release the probe retaining knob and withdraw the probe from the lock. Becareful not to knock the tip during removal.
The DCI ProbePage 70
GCTUser's Guide

Obtaining an Ion BeamGeneral Tuning Considerations
In GC- EI and CI+ modes of operation very intense low mass background ions arecontinuously present. In EI+ these are predominantly mass spectral peaks from thehelium, used as the GC carrier gas, and background nitrogen and water peaks fromresidual air. In CI+ mode reagent gas ions dominate the spectrum. If the entire ionsignal from these intense peaks was allowed to reach the MCP detector, the detectorwould rapidly degrade, causing gain loss.
In the GCT the transmission of these ions into the pushout region of the TOF isreduced by restriction slits in the ion source. The primary ion beam exiting the innersource is partially mass dispersed by a magnetic field. Low mass ions are deflectedmore than high mass ions and so do not travel along the centre line of the instrument.
These low mass ions are incident on the restriction slits and so do not enter theanalyser. This introduces an amount of mass discrimination into the spectra, which canbe used to reduce the intensity of the low mass ions. In practice the low mass ions areso large that a proportion of the ion beam still enters the analyser - the intensity ofthese ions must be monitored and minimised during tuning.
Two effects should be considered when tuning in these modes. First, if the ion beam isbadly focussed in the source the beam will appear more homogenous with respect tolow mass and high mass ions. This is equivalent to a poor mass resolution in thesource region. In this case it will be difficult to significantly reduce the intensity of thelow mass ions.
Secondly, the beam steering will allow the primary ion beam to be moved across theface of the restriction slit adjusting the amount of mass discrimination. When tuning inthese modes the ion signal from a reference compound in the middle of the mass rangeshould be monitored (ca300) as well as the ion signal from the most intense lowmass background ion. Two peak displays may be called up to monitor these twoseparate mass regions simultaneously.
At the point of best focusing, small changes in lens voltage should have much less ofan effect on the higher mass ion and a much greater effect on the low mass ion.
Obtaining an Ion BeamPage 71
GCTUser's Guide

The largest constant low mass background ion should be maintained below the levelof saturation of the TDC. This saturation effect is described below.
This chapter describes how to obtain an ion beam and how to tune the GCT in eachion mode.
Effects of Saturation on Peak Shape
The peak shape will characteristically change as saturation of the TDC results inincreasing numbers of ions not to be detected.
At the onset of saturation the peak will shift a little to lower mass followed by afailure to increase in recorded intensity as the ion signal continues to increase. Therewill then be a sudden, sharp high mass cut off and finally the detector will appear to‘ring’, causing a secondary peak to appear on the high mass side of the peak ofinterest.
The diagram below represents the characteristic transition from unsaturated signal tosaturated signal, which would be seen when tuning using the real time peak display incontinuum mode.
Because the recorded intensity of the saturating ions will appear to reach a constantvalue it is important to be able to recognise the onset of saturation by the change inpeak shape and position.
Obtaining an Ion BeamPage 72
GCTUser's Guide
IonSource
IonSource
Boundary of Ion Beam From High Mass Ion
Focused Beam
Non-focused Beam
To Detector
To Detector
Beam ofOnly High Mass Ions
Beam ofHigh/Low Mass Ions
Boundary of Ion Beam From Low Mass Ion

IMPORTANT NOTE: Always monitor the low mass ions during tuning. Neverrun the system for extended periods of time with clearly saturated constant lowmass background peaks.
Set Integration Time to 0.9sec with a 40 µsec pusher interval.
Obtaining an Ion BeamPage 73
GCTUser's Guide
C, D, E - saturated peaks. Notethe shift to lower mass, peaknarrowing and sharp cut-off.Display E shows secondarypeak due to saturation
A, B - peaks withindynamic range.
A
B
C
D
E
In continuum mode during tuning the intensity of the largest low massbackground peak should not exceed 7000 counts in height for a 1GHz TDC or2000 counts in height for a 3.6GHz TDC system.
Introducing mass discrimination in this way results in spectra which are skewed tohigh mass. This observed skew, although significant is not normally enough to impairlibrary searching of spectra against standard EI+ libraries. Once tuned, however, itmay be possible to balance the intensities of the peaks within the spectra using thebeam steering lens as long as the low mass background ions are monitored and theirintensity set within the criteria above.
Once the system has been tuned for best focusing of the primary ion beam, thehigh mass ions maximised and the low mass background minimised, display theentire mass range on the peak display.
Adjust the beam steering to increase the intensity of the low mass ions relativeto the high mass ions.
Continue to monitor the low mass ions to ensure no saturation occurs.
For example, the peak at69 from Tris (trifluoromethyl) Triazine can be set to thesame intensity as the molecular ion at285.
The analyser tuning parameters on the Engineer Tuning Menu should be verysimilar or identical for positive or negative ion operation in EI, CI or FI operation.
Electron Impact Operation (EI)
Introduction
Sample molecules are admitted to the electron impact source via the GC interface, thesolids probe or the reference inlet system. The source is heated to ensure samplevaporisation, and the resulting gas phase molecules are ionised in collisions with highenergy electrons released from the white hot filament. Ions are extracted from thesource and into the analyser by the ion repeller and the focusing lenses.
Preparing for Operation in EI+ Mode
From Ion Mode, set the ionisation mode.
See section entitled General Considerations for Tuning in all Ionisation Modesbefore proceeding.
See section on Tuning Parameters and User Interface for typical values forSource, Inlet, Engineer Tuning Menu and TDC Parameters.
Obtaining an Ion BeamPage 74
GCTUser's Guide
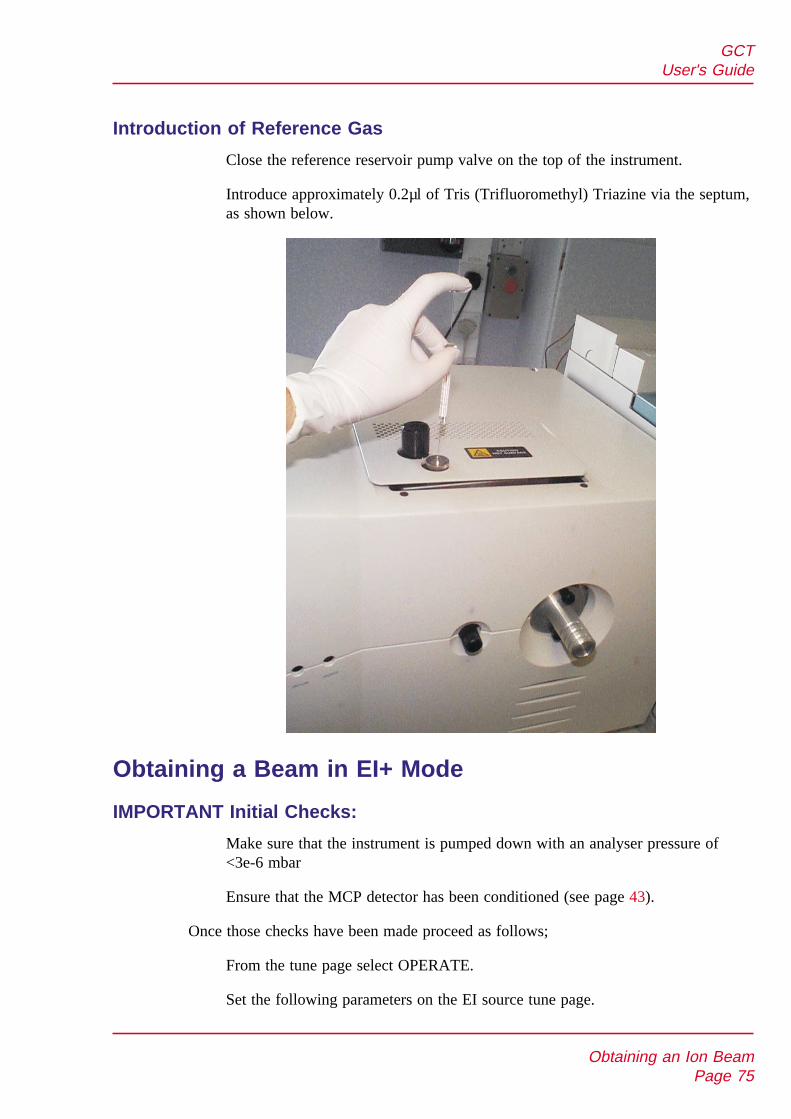
Introduction of Reference Gas
Close the reference reservoir pump valve on the top of the instrument.
Introduce approximately 0.2µl of Tris (Trifluoromethyl) Triazine via the septum,as shown below.
Obtaining a Beam in EI+ Mode
IMPORTANT Initial Checks:
Make sure that the instrument is pumped down with an analyser pressure of<3e-6 mbar
Ensure that the MCP detector has been conditioned (see page 43).
Once those checks have been made proceed as follows;
From the tune page select OPERATE.
Set the following parameters on the EI source tune page.
Obtaining an Ion BeamPage 75
GCTUser's Guide
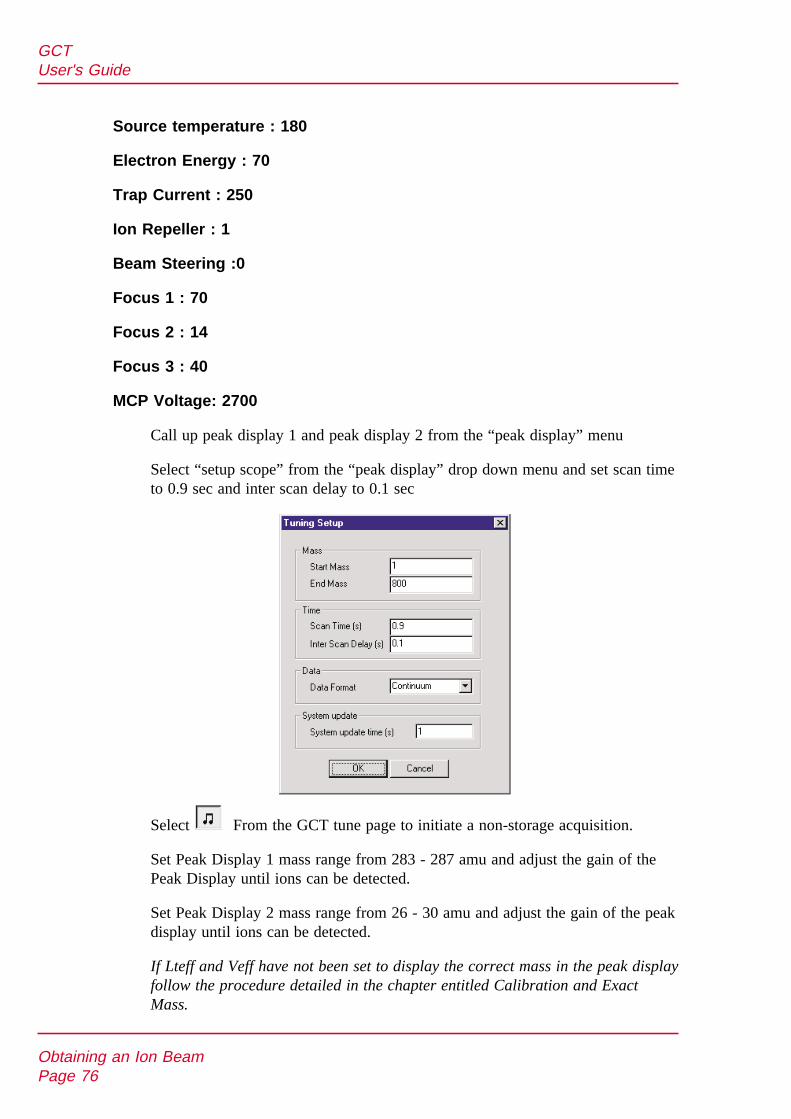
Source temperature : 180
Electron Energy : 70
Trap Current : 250
Ion Repeller : 1
Beam Steering :0
Focus 1 : 70
Focus 2 : 14
Focus 3 : 40
MCP Voltage: 2700
Call up peak display 1 and peak display 2 from the “peak display” menu
Select “setup scope” from the “peak display” drop down menu and set scan timeto 0.9 sec and inter scan delay to 0.1 sec
Select From the GCT tune page to initiate a non-storage acquisition.
Set Peak Display 1 mass range from 283 - 287 amu and adjust the gain of thePeak Display until ions can be detected.
Set Peak Display 2 mass range from 26 - 30 amu and adjust the gain of the peakdisplay until ions can be detected.
If Lteff and Veff have not been set to display the correct mass in the peak displayfollow the procedure detailed in the chapter entitled Calibration and ExactMass.
Obtaining an Ion BeamPage 76
GCTUser's Guide
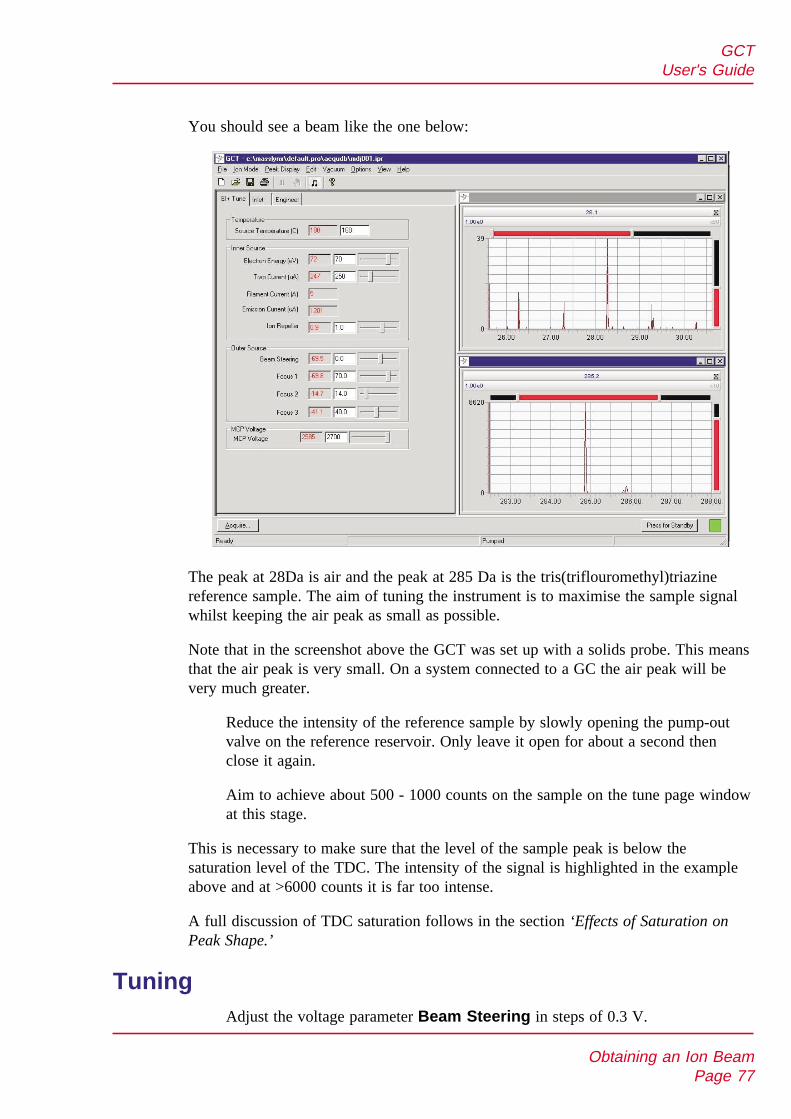
You should see a beam like the one below:
The peak at 28Da is air and the peak at 285 Da is the tris(triflouromethyl)triazinereference sample. The aim of tuning the instrument is to maximise the sample signalwhilst keeping the air peak as small as possible.
Note that in the screenshot above the GCT was set up with a solids probe. This meansthat the air peak is very small. On a system connected to a GC the air peak will bevery much greater.
Reduce the intensity of the reference sample by slowly opening the pump-outvalve on the reference reservoir. Only leave it open for about a second thenclose it again.
Aim to achieve about 500 - 1000 counts on the sample on the tune page windowat this stage.
This is necessary to make sure that the level of the sample peak is below thesaturation level of the TDC. The intensity of the signal is highlighted in the exampleabove and at >6000 counts it is far too intense.
A full discussion of TDC saturation follows in the section ‘Effects of Saturation onPeak Shape.’
TuningAdjust the voltage parameter Beam Steering in steps of 0.3 V.
Obtaining an Ion BeamPage 77
GCTUser's Guide
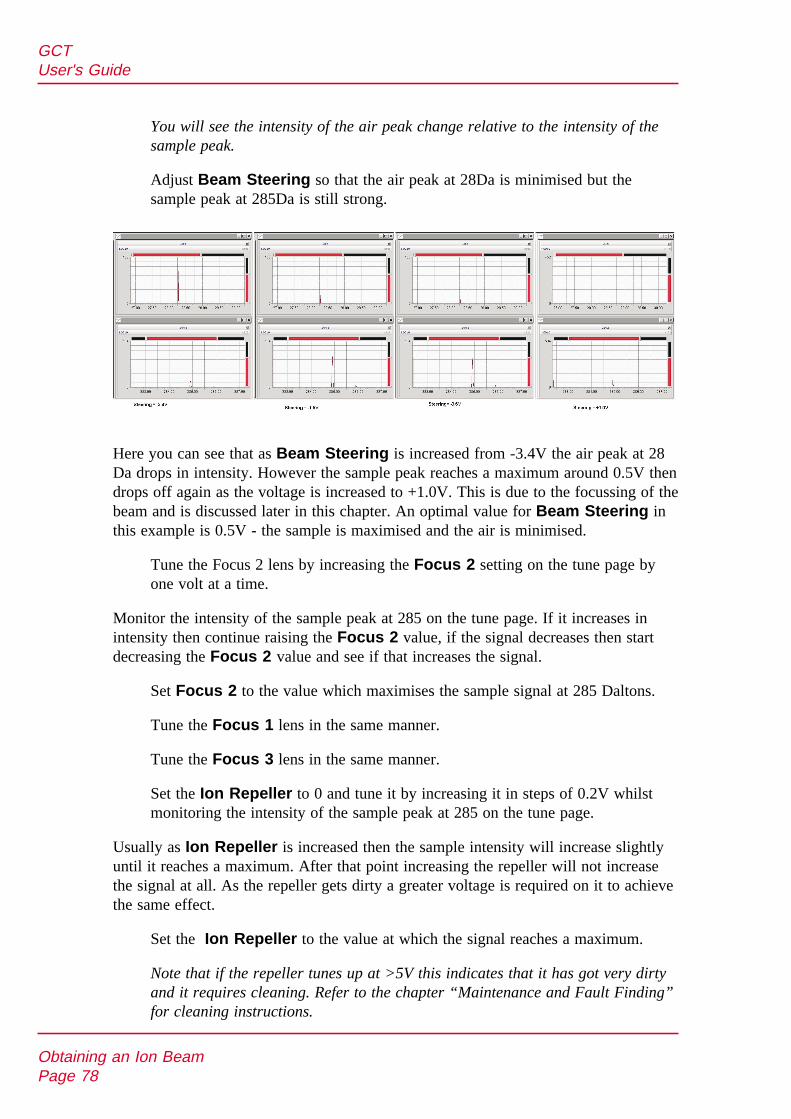
You will see the intensity of the air peak change relative to the intensity of thesample peak.
Adjust Beam Steering so that the air peak at 28Da is minimised but thesample peak at 285Da is still strong.
Here you can see that as Beam Steering is increased from -3.4V the air peak at 28Da drops in intensity. However the sample peak reaches a maximum around 0.5V thendrops off again as the voltage is increased to +1.0V. This is due to the focussing of thebeam and is discussed later in this chapter. An optimal value for Beam Steering inthis example is 0.5V - the sample is maximised and the air is minimised.
Tune the Focus 2 lens by increasing the Focus 2 setting on the tune page byone volt at a time.
Monitor the intensity of the sample peak at 285 on the tune page. If it increases inintensity then continue raising the Focus 2 value, if the signal decreases then startdecreasing the Focus 2 value and see if that increases the signal.
Set Focus 2 to the value which maximises the sample signal at 285 Daltons.
Tune the Focus 1 lens in the same manner.
Tune the Focus 3 lens in the same manner.
Set the Ion Repeller to 0 and tune it by increasing it in steps of 0.2V whilstmonitoring the intensity of the sample peak at 285 on the tune page.
Usually as Ion Repeller is increased then the sample intensity will increase slightlyuntil it reaches a maximum. After that point increasing the repeller will not increasethe signal at all. As the repeller gets dirty a greater voltage is required on it to achievethe same effect.
Set the Ion Repeller to the value at which the signal reaches a maximum.
Note that if the repeller tunes up at >5V this indicates that it has got very dirtyand it requires cleaning. Refer to the chapter “Maintenance and Fault Finding”for cleaning instructions.
Obtaining an Ion BeamPage 78
GCTUser's Guide
Tuning the three Focusing lenses and the Repeller can also affect the BeamSteering value.
Continue tuning by repeating steps 1-5 above at this point as necessary, until thesignal intensity at 285Da has reached a maximum.
Please refer to the section “General Considerations for tuning in all Ion Modes” forfurther information about tuning the source.
At this point you should also perform the following procedures to complete theinstrument setup.
Acquire data with the detector turned off (MCP Voltage = 0) and theinstrument in the operate mode.
Use an Integration Time of about 2 seconds with a low mass of 10amu and ahigh mass of 800amu.
There is always a signal at low mass around 6Da due to electronic pickup fromthe falling edge of the pusher pulse. This is usually at very low mass and doesnot interfere with real data.
Monitor the TIC (Total ion current) At a Signal Threshold value of 20mV asignal equivalent to hundreds of ion counts will be detected as noise.
Increase the Signal Threshold value in 20mV increments during the acquisition.
The above operations tune the instrument in EI mode. Before you can use theinstrument to acquire data with accurate mass the mass scale must be set up andcalibrated. Please refer to the chapter “Calibration and Exact Mass” for details of howto do this.
Obtaining an Ion BeamPage 79
GCTUser's Guide

Chemical Ionisation Operation (CI)
Introduction
Chemical ionisation is a 'soft' ionisation technique in which sample molecules areionised in reactions with ionised gas molecules. Ammonia, isobutane and methane arecommonly used as reagent gases from which the reagent ions are generated. Ionisationof the reagent gas molecules is by electron bombardment within the ion chamber ofthe CI source.
In order to achieve the relatively high pressures required within the ion chamber whilemaintaining an adequate vacuum elsewhere, the chamber must be made partiallygas-tight.
As sufficient electrons are unlikely to reach the electron trap under CI conditions, notrap is present in the inner source. Filament current is regulated using the totalemission current and not the trap current as in EI operation.
Samples can be introduced using the solids probe, the DCI probe, the gaschromatograph, and the reference inlet system.
Using Methane Gas
Caution: Methane gas is explosive. When the instrument is run in chemical ionisationmode (CI), which involves the use of methane gas it is necessary to vent the effluentfrom the rotary pump in a safe manner. All gas fittings should be checked for leaktightness. Avoid naked flames.
Using Ammonia Gas
Caution: Ammonia gas is a hazardous vapour. When the instrument is run in chemicalionisation mode (CI), which involves the use of ammonia gas, it is necessary to ventthe effluent from the rotary pump in a safe manner. All gas fittings should bethoroughly checked for leak tightness.
Preparing for Operation in CI+ Mode
Install the CI inner source. For details of how to change the inner source seeInstallation and Removal of Inner Source in the chapter Routine Proceduresearlier in this manual.
Before proceeding, see the section General Considerations for Tuning in allIonisation Modes.
If necessary, change the ionisation mode using the Ion Mode command.
See the section entitled Tuning Parameters and User Interface for typical valuesfor Inlet, Engineer Tuning Menu and TDC Parameters.
Obtaining an Ion BeamPage 80
GCTUser's Guide

Introduction of CI Reagent Gas
The following description considers methane as the CI reagent gas.
CI Gas Valve Layout
The CI gas solenoid valves are located on the rear inside panel of the GCT.
Before introduction of the CI reagent gas the internal CI reagent gas lines must bepurged of air.
Introduction of reagent gas and purging of the lines is achieved using the CI Gas andCI Purge buttons on the Inlet page shown above.
Attach a cylinder of methane to the CI gas inlet on the rear service panel of theGCT.
Check the main outlet valve on the cylinder to ensure that it is closed.
Select CI Purge from the Inlet page. The following sequence is invoked.
Obtaining an Ion BeamPage 81
GCTUser's Guide
CI Flow ValveFront Panel
Steel Tubing
Union
PEEK Tubing
CI Gas InSolenoid
PumpSolenoid
To RotaryPump
CI Gas 1/8 inch FittingRear Service Panel
CI GasCylinder
PumSole
SOURCE
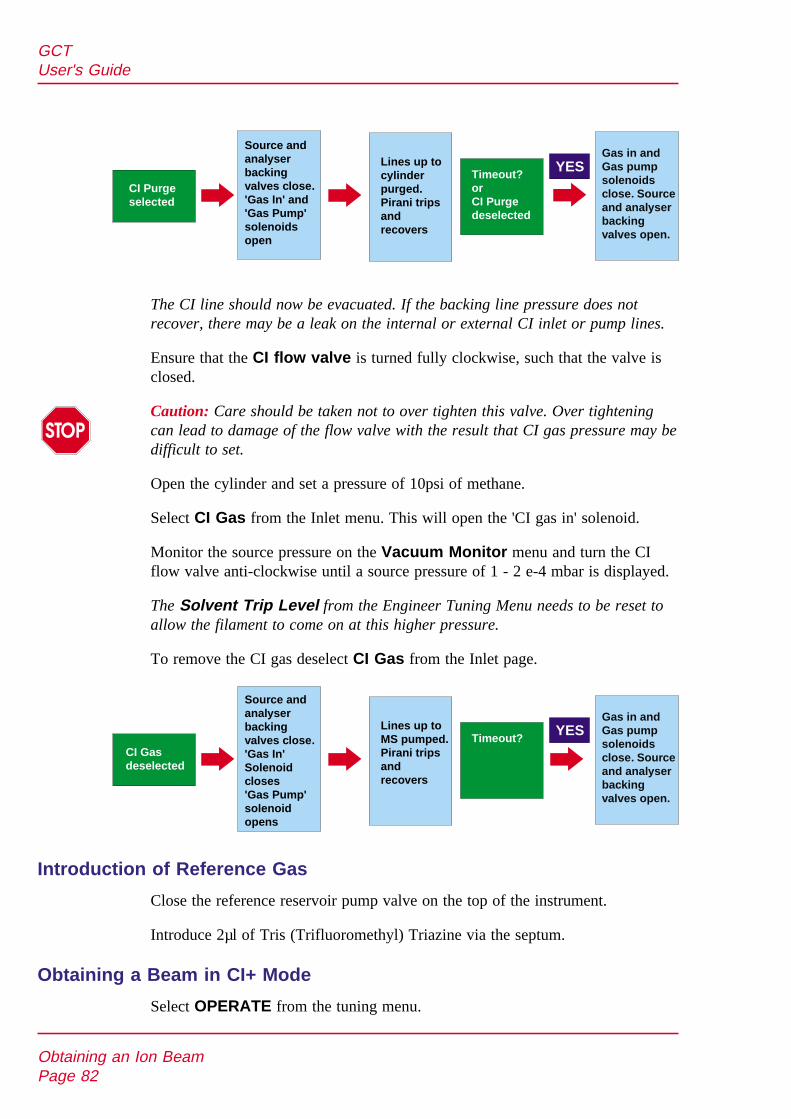
The CI line should now be evacuated. If the backing line pressure does notrecover, there may be a leak on the internal or external CI inlet or pump lines.
Ensure that the CI flow valve is turned fully clockwise, such that the valve isclosed.
Caution: Care should be taken not to over tighten this valve. Over tighteningcan lead to damage of the flow valve with the result that CI gas pressure may bedifficult to set.
Open the cylinder and set a pressure of 10psi of methane.
Select CI Gas from the Inlet menu. This will open the 'CI gas in' solenoid.
Monitor the source pressure on the Vacuum Monitor menu and turn the CIflow valve anti-clockwise until a source pressure of 1 - 2 e-4 mbar is displayed.
The Solvent Trip Level from the Engineer Tuning Menu needs to be reset toallow the filament to come on at this higher pressure.
To remove the CI gas deselect CI Gas from the Inlet page.
Introduction of Reference Gas
Close the reference reservoir pump valve on the top of the instrument.
Introduce 2µl of Tris (Trifluoromethyl) Triazine via the septum.
Obtaining a Beam in CI+ Mode
Select OPERATE from the tuning menu.
Obtaining an Ion BeamPage 82
GCTUser's Guide
CI Gasdeselected
Source andanalyserbackingvalves close.'Gas In'Solenoidcloses'Gas Pump'solenoidopens
Lines up toMS pumped.Pirani tripsandrecovers
Timeout?
Gas in andGas pumpsolenoidsclose. Sourceand analyserbackingvalves open.
YES
CI Purgeselected
Source andanalyserbackingvalves close.'Gas In' and'Gas Pump'solenoidsopen
Lines up tocylinderpurged.Pirani tripsandrecovers
Timeout?orCI Purgedeselected
Gas in andGas pumpsolenoidsclose. Sourceand analyserbackingvalves open.
YES
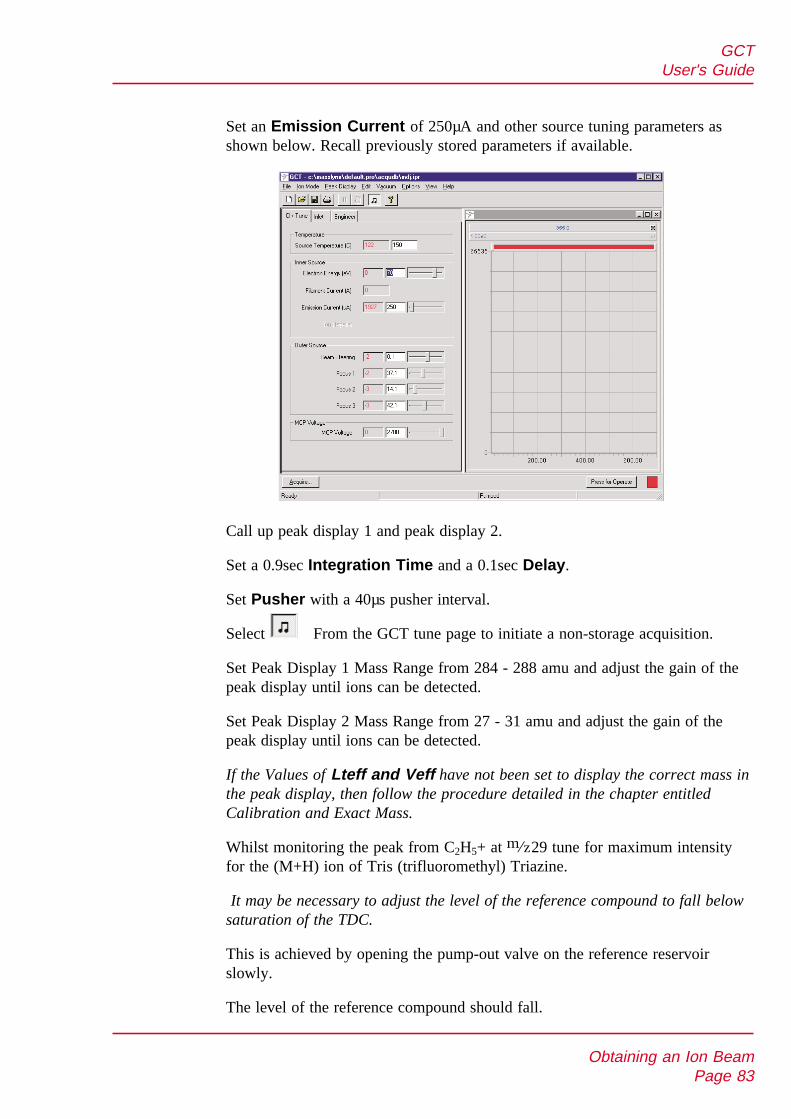
Set an Emission Current of 250µA and other source tuning parameters asshown below. Recall previously stored parameters if available.
Call up peak display 1 and peak display 2.
Set a 0.9sec Integration Time and a 0.1sec Delay.
Set Pusher with a 40µs pusher interval.
Select From the GCT tune page to initiate a non-storage acquisition.
Set Peak Display 1 Mass Range from 284 - 288 amu and adjust the gain of thepeak display until ions can be detected.
Set Peak Display 2 Mass Range from 27 - 31 amu and adjust the gain of thepeak display until ions can be detected.
If the Values of Lteff and Veff have not been set to display the correct mass inthe peak display, then follow the procedure detailed in the chapter entitledCalibration and Exact Mass.
Whilst monitoring the peak from C2H5+ at29 tune for maximum intensityfor the (M+H) ion of Tris (trifluoromethyl) Triazine.
It may be necessary to adjust the level of the reference compound to fall belowsaturation of the TDC.
This is achieved by opening the pump-out valve on the reference reservoirslowly.
The level of the reference compound should fall.
Obtaining an Ion BeamPage 83
GCTUser's Guide
Refer to the section General Considerations for Tuning in all Ionisation Modes.Tune Beam Steering, Focus1, Focus 2 and Focus 3 to obtain the bestintensity of the286 ion.
The CI gas pressure can also be adjusted to obtain best sensitivity.
Obtaining a Beam - CI- OperationCaution: Care should be taken when changing to negative ion mode after using theGCT in positive ion mode for an extended period of time. The following precautionaryprocedure must be followed before setting to OPERATE in CI- mode.
Turn the TOF Voltage to 0 and the MCP Voltage to 0.
Select OPERATE from the tuning menu.
Increase these voltages to operating voltage over a period of 20 seconds. Thisminimises the risk of discharge and possible damage to the MCP.
Set an Emission Current of 250µA and other source tuning parameters asshown in the section Finding a Beam in CI+ Mode.
Recall previously stored parameters if available.
Call up peak display 1. Set a 0.9sec integration time and a 0.1sec delay.
Set a 40µs Pusher Interval.
Select From the GCT tune page to initiate a non-storage acquisition.
Set peak display 1 mass range from 448-454amu and adjust the gain of the peakdisplay until ions from451.97 of heptacosa can be detected.
If the values for Lteff and Veff have not been set to display the correct mass inthe peak display follow the procedure detailed in the chapter entitled Calibrationand Exact Mass.
Tune Beam Steering Focus 1, Focus 2 and Focus 3 to obtain the bestintensity of the 451.97 ion. Note there is little low mass background in thistechnique, and therefore it should not be necessary to consider ions of low massin terms of saturation while tuning.
The CI gas pressure can also be adjusted to obtain best sensitivity.
Obtaining a Beam - FI OperationFrom Ion Mode, set the ionisation mode.
See the section Tuning Parameters FI mode above for typical values of Source pageparameters.
Obtaining an Ion BeamPage 84
GCTUser's Guide

NOTE: The TDC, engineers page, and inlet page parameters should be set to the samevalues as in EI and CI operation.
In the FI+ source tuning menu, set the extraction voltage, heater current,emitter current, and flash off current to zero.
Deselect the flashoff enable toggle.
Switch the system into Operate.
From Peak Display set a Scan Time of 1.2 sec and an Inter Scan Delay of0.2 sec. Continuum mode with a system update time of 1.5 sec.
• Press the symbol to set the system into tune mode.• Increase the extraction voltage in steps of 2000V to a maximum of
12000V.It is important to monitor the readback of extraction voltage leakage current. Ifthe value rises above 10µA constant readback there is excessive leakage of theextraction voltage to ground. The extraction voltage should be turned off and thesource of the leakage isolated. In normal operation the value of leakage current shouldbe 0 - 3µA.
Operating the system with higher leakage current can result in poor massmeasurement, unstable signals and the risk of high voltage ‘flash over’ in theion source.
Depending on the type of emitter in use, see the section Choosing an Emitter, requestan emitter current which is half of the maximum rated current appropriate for the typeof emitter in use.
Check that the readback indicates that current is passing through the emitter. If nocurrent is passing through the emitter, it may be open circuit and will need to bereplaced.
The emitter current is set at the value indicated in the flash off currentdialogue box during the inter scan period or when the system is not in tunemode or performing an acquisition.
The emitter current is set at the value indicated in the emitter current dialoguebox when the system is acquiring data either in tune mode (scan time, nonstorage acquisition, or in acquisition mode.)
When the emitter flash off is not enabled the emitter will stay at the valueindicated in the emitter current dialogue box.
Set the emitter current to its maximum rated value in mA for 2 - 4 seconds.This will desorb any condensed material on the emitter and ensure maximumsensitivity.
Set the emitter current to zero.
Obtaining an Ion BeamPage 85
GCTUser's Guide

Select flashoff enable on.
Set a flash off current (current during interscan) of 80% of the maximumemitter current.
Set the emitter current (current during the acquisition) to Zero mA.
The emitter will now heat up during the interscan period and cool during thescan. This ensures that sample does not condense on the emitter suppressingsensitivity. It may not be possible to see the emitter current readback changeduring the interscan period due to the time required to update the readback bythe software.
With Chloropentafluorobenzene introduced via the reference reservoir set PeakDisplay 1 mass range from 198 - 204 amu. Set the peak display to normalisethe displayed signal.
Carefully adjust the probe position knob on the emitter probe guide until themolecular ion at = 201.9609 is seen.
This adjustment is very sensitive and must be made carefully. If the emitter ismoved to far it may hit the GC column and become damaged.
Using beam centre, Focus 1, 2 and 3 optimise for maximum intensity.
General Considerations for Tuning and Optimisation inFI Mode
Lens Tuning
The focus lenses are interactive with the beam centre, and combinations of focus andsteering settings should be tried. The focus 1 lens often optimises at maximumnegative voltage.
The tuning of the ion source is strongly dependent on the position of the emitter withrespect to the extraction rods. The closer the emitter is to the extraction rods thehigher the field strength at the emitter and the higher the sensitivity.
The position of the emitter with respect to the centre line of the extraction rods is alsovery critical. Small changes in this position can result in large changes in beamsteering voltage being required. In general, the beam steering should be set close tozero and the emitter probe adjuster knob used to optimise the signal. Small adjustmentto beam steering can then be made using the beam steering lens.
Changes in Focus voltage can also result in changes in beam steering voltage. Thefocus lenses should be optimised in conjunction with this steering lens. If the beamsteering lens optimises at > 4V the lens should be returned to zero and the emitterprobe adjuster knob used to reoptimise the beam.
Obtaining an Ion BeamPage 86
GCTUser's Guide
Extraction Voltage
In general the higher the extraction voltage the higher the field strength and thehigher the sensitivity. Adjusting the extraction voltage will cause a change insource focussing and the source lenses will need to be reoptimised. The extractionvoltage should not be run above -12,000V. Higher voltages may result in dischargeswithin the source and ultimately damage to the emitter.
The signal from the reference material used for tuning will optimise in intensitybetween extraction voltages of 10,000 and 12,000V. Lowering the extraction voltagemay result in less fragmentation for particularly fragile analytes, however absolutesensitivity will be reduced.
GC Column Position
For FI- GC-MS the position of the column with respect to the emitter is critical foroptimum sensitivity. The end of the GC column should be as close as possible to theemitter wire. 2mm from the wire is optimum. If the end of the column is too close tothe emitter wire discharge or mechanical failure of the emitter may occur. If the end ofthe column is too far away from the emitter the sensitivity for analytes introduced viathe GC may be reduced.
In addition the end of the GC column should be in line or slightly behind the emitterwire. If the end of the column is in front of the emitter wire sensitivity for analytesintroduced via the GC may be reduced.
Emitter Flash off Current
The magnitude of the flash of current can impact on the sensitivity for differentanalytes. As current is passed through the emitter wire the wire becomes hot. This canreduce sensitivity for thermally labile compounds. In general the emitter is flashed offto 80% of its maximum value, however, lower values may be tried. If the emitter flashoff current is too low sample will condense of the emitter during the chromatographicrun. As sample condenses the field strength between the emitter and the extractionrods is reduced and sensitivity decreases.
For higher boiling point samples some condensation of sample can occur towards theend of the chromatographic run. The emitter can be cleaned by setting the emittercurrent to maximum for 2 - 4 seconds then returning the emitter current to zero.
Sensitivity in FI not only depends on the quality of the emitter and the position of therelative source components but also will vary with acquisition rate and inter scan time.For optimum performance the emitter must be allowed to flash off to the correcttemperature during interscan and to fully cool as quickly as possible during theacquisition time.
For the Carbotec FI emitter with 5µm emitter wire diameter an acquisition time of 1.2sec with an inter scan (flash off) time of 0.2 sec is optimum. As the acquisition time isdecreased or the interscan time is decreased sensitivity will be reduced.
Obtaining an Ion BeamPage 87
GCTUser's Guide
For emitters with larger diameter wire and heavier deposits of carbon dendritemicroneedles a 2.5 sec acquisition time with a 0.4 sec delay is required for maximumsensitivity. Faster acquisition times and delays will decrease ultimate sensitivity.
There may be variation in the field strength, and hence sensitivity, betweenemitters. If sensitivity is poor another emitter should be tried.
Running GC MS Samples in FI Mode
It is important to use a solvent delay at the beginning of the acquisition when runningGC FI. This delay should be set so that the solvent front has completely eluted beforethe end of the solvent delay time. During the solvent delay period the ExtractionVoltage is turned off. This ensures that the Extraction Voltage is not on at a highpressure in the ion source region. Failure to protect the system from the solvent frontmay result in damage to the emitter.
The solvent delay time can be set from the experiment setup window and will beactive only when running an acquisition from the MassLynx Sample list.
The mechanics of acquisition are described in the chapter entitled Data Acquisition.
Running Solids Probe Samples in FI Mode
Involatile samples may be run in FI mode using the solids probe. The adjuster knob onthe probe lock allows the end of the solids probe to be set at a fixed and reproducibledistance away from the emitter.
This distance should be set to approximately 10mm away from the emitter. The closerthe solids probe to the emitter the more the field around the extraction rods will bedistorted resulting in a loss in sensitivity.
It is also important to tune the ion source with the solids probe inserted into theposition to be used.
Operation of the GCT with the solids probe is described in the chapter The SolidsInsertion Probe.
Obtaining an Ion BeamPage 88
GCTUser's Guide

Tuning Parameters andUser Interface
Before the instrument is used to acquire sample data, it should be tuned and calibratedusing suitable reference compounds.
Tuning parameters have been grouped into 3 menus as described below. Full details ofsource tuning procedures for each ion mode are given in the relevant chapter of thismanual.
The Vacuum Display
Display of the pressure reading in the source and analyser housings, and the rotarypump backing line are accessed from the Vacuum Monitor menu. The source andanalyser readouts include the measured pressure and indicate the level of the SourceSolvent Trip and Analyser Trip level on the relevant dials. These trip levels can beset from the Engineer Tuning Menu. The discontinuity in the green line at the borderof the display indicates the level set.
The backing pressure trip displayed is read from the setting on the Pirani gauge at thehead of the rotary pump. This level should be adjusted to be correct duringinstallation.
Vent instrument and Isolate Source commands are also accessed via this menu.
Tuning Parameters and User InterfacePage 89
GCTUser's Guide
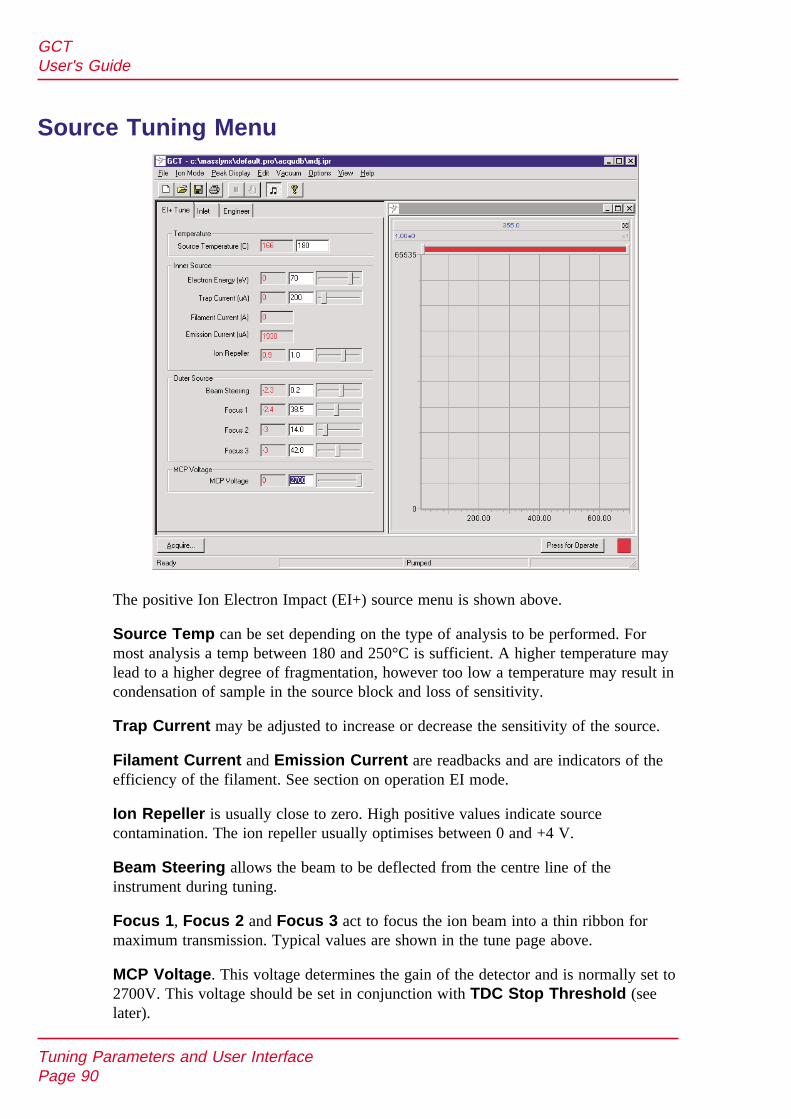
Source Tuning Menu
The positive Ion Electron Impact (EI+) source menu is shown above.
Source Temp can be set depending on the type of analysis to be performed. Formost analysis a temp between 180 and 250°C is sufficient. A higher temperature maylead to a higher degree of fragmentation, however too low a temperature may result incondensation of sample in the source block and loss of sensitivity.
Trap Current may be adjusted to increase or decrease the sensitivity of the source.
Filament Current and Emission Current are readbacks and are indicators of theefficiency of the filament. See section on operation EI mode.
Ion Repeller is usually close to zero. High positive values indicate sourcecontamination. The ion repeller usually optimises between 0 and +4 V.
Beam Steering allows the beam to be deflected from the centre line of theinstrument during tuning.
Focus 1, Focus 2 and Focus 3 act to focus the ion beam into a thin ribbon formaximum transmission. Typical values are shown in the tune page above.
MCP Voltage. This voltage determines the gain of the detector and is normally set to2700V. This voltage should be set in conjunction with TDC Stop Threshold (seelater).
Tuning Parameters and User InterfacePage 90
GCTUser's Guide
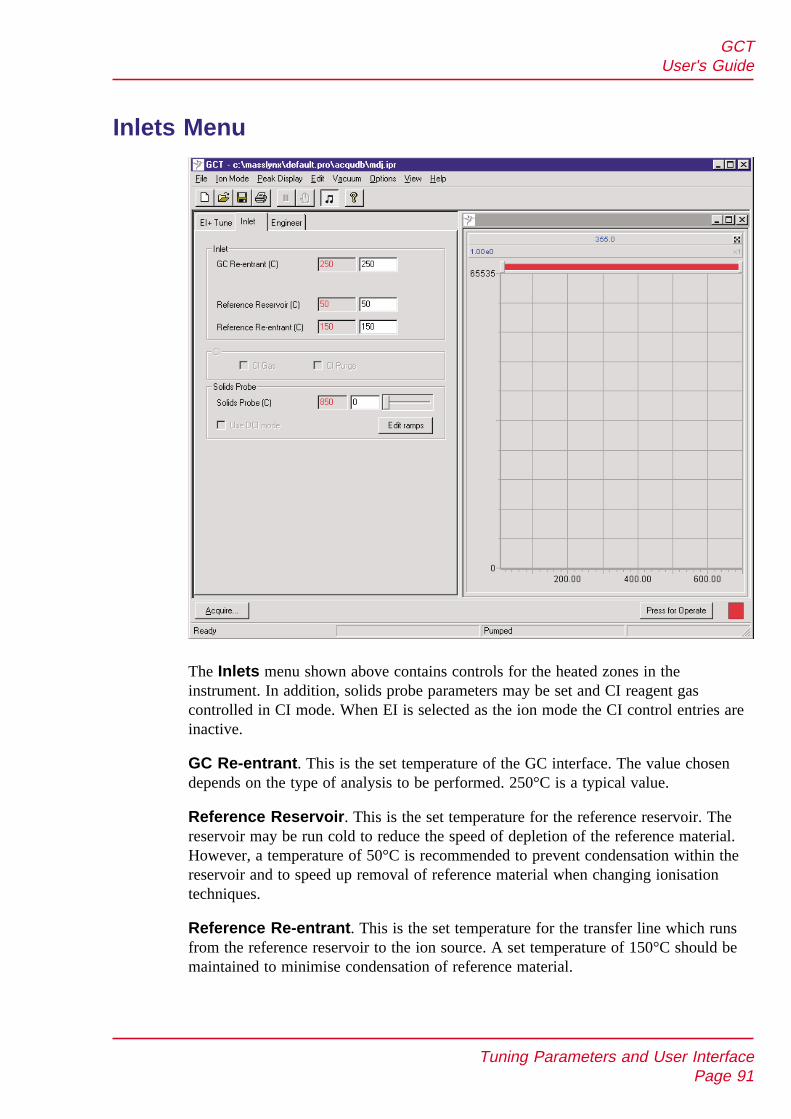
Inlets Menu
The Inlets menu shown above contains controls for the heated zones in theinstrument. In addition, solids probe parameters may be set and CI reagent gascontrolled in CI mode. When EI is selected as the ion mode the CI control entries areinactive.
GC Re-entrant. This is the set temperature of the GC interface. The value chosendepends on the type of analysis to be performed. 250°C is a typical value.
Reference Reservoir. This is the set temperature for the reference reservoir. Thereservoir may be run cold to reduce the speed of depletion of the reference material.However, a temperature of 50°C is recommended to prevent condensation within thereservoir and to speed up removal of reference material when changing ionisationtechniques.
Reference Re-entrant. This is the set temperature for the transfer line which runsfrom the reference reservoir to the ion source. A set temperature of 150°C should bemaintained to minimise condensation of reference material.
Tuning Parameters and User InterfacePage 91
GCTUser's Guide
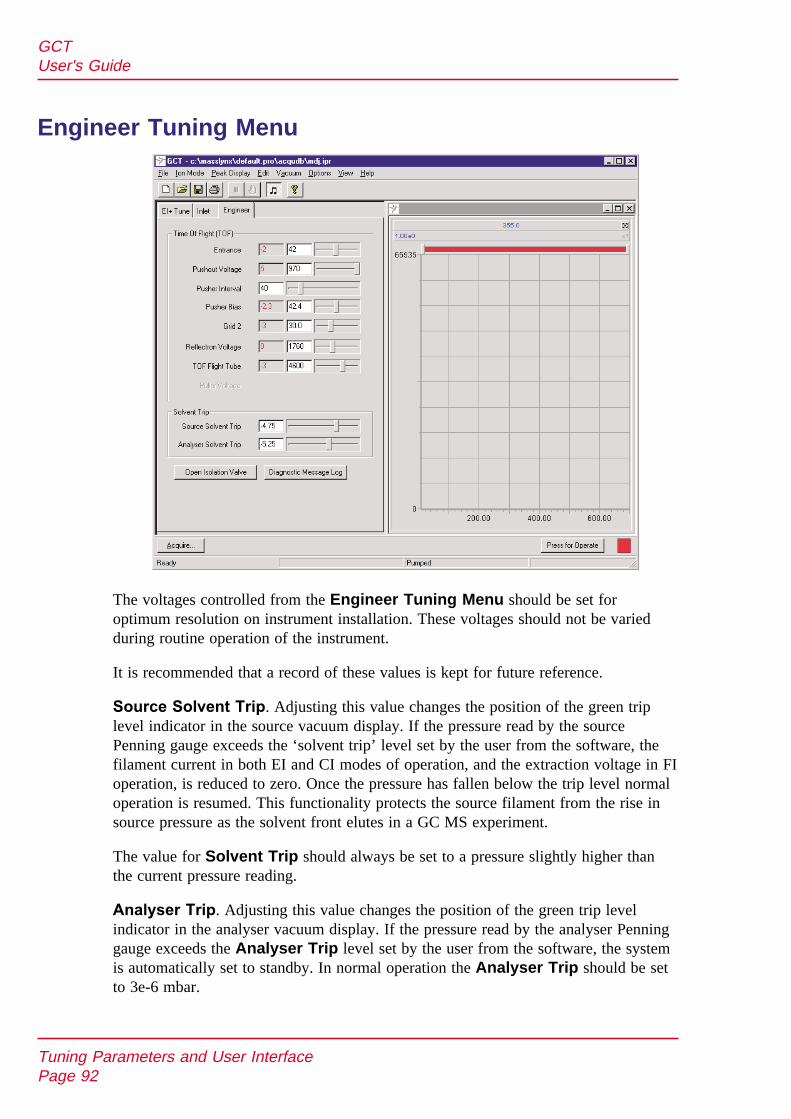
Engineer Tuning Menu
The voltages controlled from the Engineer Tuning Menu should be set foroptimum resolution on instrument installation. These voltages should not be variedduring routine operation of the instrument.
It is recommended that a record of these values is kept for future reference.
Source Solvent Trip. Adjusting this value changes the position of the green triplevel indicator in the source vacuum display. If the pressure read by the sourcePenning gauge exceeds the ‘solvent trip’ level set by the user from the software, thefilament current in both EI and CI modes of operation, and the extraction voltage in FIoperation, is reduced to zero. Once the pressure has fallen below the trip level normaloperation is resumed. This functionality protects the source filament from the rise insource pressure as the solvent front elutes in a GC MS experiment.
The value for Solvent Trip should always be set to a pressure slightly higher thanthe current pressure reading.
Analyser Trip. Adjusting this value changes the position of the green trip levelindicator in the analyser vacuum display. If the pressure read by the analyser Penninggauge exceeds the Analyser Trip level set by the user from the software, the systemis automatically set to standby. In normal operation the Analyser Trip should be setto 3e-6 mbar.
Tuning Parameters and User InterfacePage 92
GCTUser's Guide
Pusher Interval sets the frequency of the pusher pulse is determined by the PusherInterval entered. Pusher Interval may be set between 33 µsec and 250 µsec.
A Pusher Interval of 33 µsec permits ions to be analysed up to780.
The mass range is proportional to the square of the flight time, so a flight time of 66µsec permits ions to be analysed up to 4 x 780 =3120 .
Increasing the flight time reduces the duty cycle (sampling efficiency) of the TOFanalyser resulting in decreased sensitivity. In practice, for most GC-MS work a massrange of 1000 is sufficient. This equates to a Pusher Interval of 40 µsec.
For the best mass accuracy the instrument should be re-calibrated if the pusher intervalis changed.
Unless it is necessary to reach a higher mass range, it is recommended that allanalyses are performed at a Pusher Interval of 40 µsec. This equates to a massrange of approximately 1000amu.
Open Isolation Valve. Allows control of the isolation valve between the source andanalyser housings regardless of whether the instrument is in operate or standby. Thisisolation valve automatically opens in operate and closes in standby modes.
Show diagnostic log. Displays an updated list of the diagnostic messages displayedin the table, as in the section entitled Front Panel Indicators.
Tuning Parameters and User InterfacePage 93
GCTUser's Guide

Other Tune Page Settings
As shown above, Ion Mode from the top of the screen allows the source tuningparameters to be changed to the ion mode required.
The system must be in Standby before the software will accept a change of ion mode.
Deselecting Tuning Parameters hides the tuning parameters for Source, Inletsand Engineer Tuning Menu from the user.
Communication Status. Indicates the detection of the instrument by the operatingsoftware for diagnostic purposes.
Instrument Name allows the instrument name to be recorded.
Readbacks. Allows voltage readbacks to be disabled if required.
Experiment Setup. Allows experimental conditions to be entered and saved under afile name. This experiment can then become part of a sample list and run using anautosampler via MassLynx NT.
Probe Ramp opens the ramp settings for the solids Probe.
Tuning Parameters and User InterfacePage 94
GCTUser's Guide
Selection of View from the top of the screen allows the Engineer Tuning Menu aloneto be hidden from the user.
All these parameters can be saved as an instrument parameter file by selectingFile / Save As from the top of the screen. These instrument parameter file names arethen used within the experiment setup when running acquisitions from the MassLynxNT sample list.
Tuning Parameters and User InterfacePage 95
GCTUser's Guide
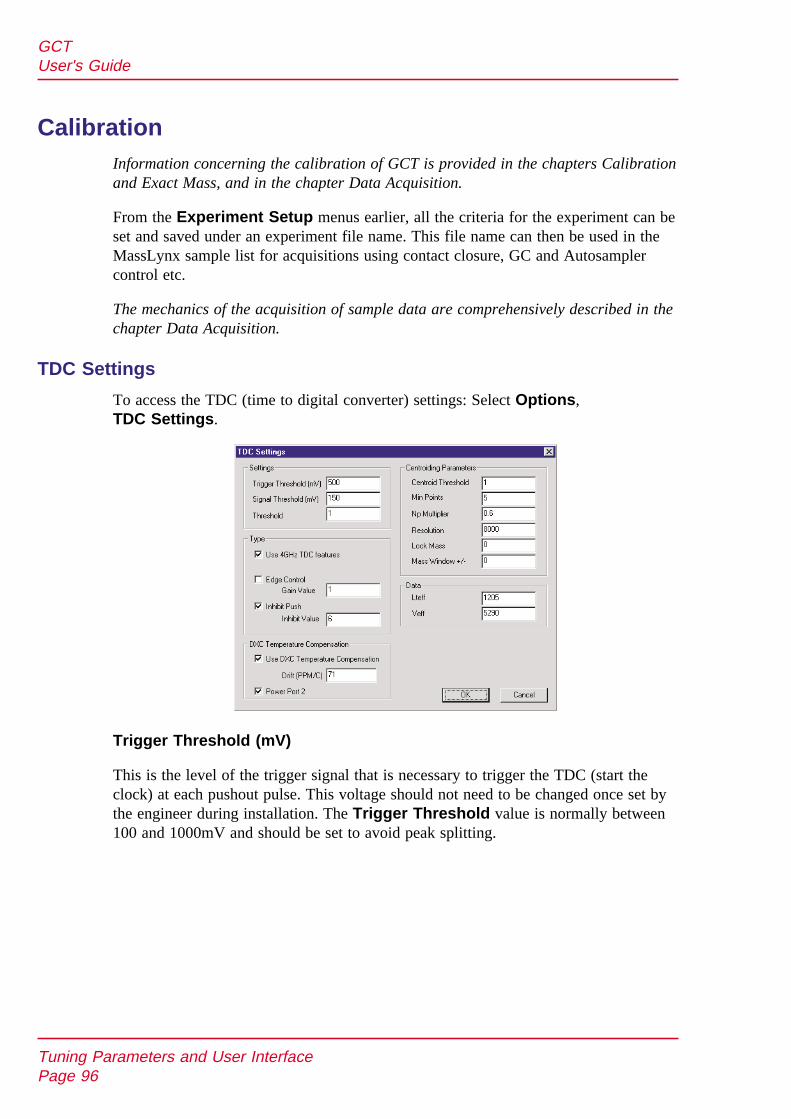
CalibrationInformation concerning the calibration of GCT is provided in the chapters Calibrationand Exact Mass, and in the chapter Data Acquisition.
From the Experiment Setup menus earlier, all the criteria for the experiment can beset and saved under an experiment file name. This file name can then be used in theMassLynx sample list for acquisitions using contact closure, GC and Autosamplercontrol etc.
The mechanics of the acquisition of sample data are comprehensively described in thechapter Data Acquisition.
TDC Settings
To access the TDC (time to digital converter) settings: Select Options,TDC Settings.
Trigger Threshold (mV)
This is the level of the trigger signal that is necessary to trigger the TDC (start theclock) at each pushout pulse. This voltage should not need to be changed once set bythe engineer during installation. The Trigger Threshold value is normally between100 and 1000mV and should be set to avoid peak splitting.
Tuning Parameters and User InterfacePage 96
GCTUser's Guide
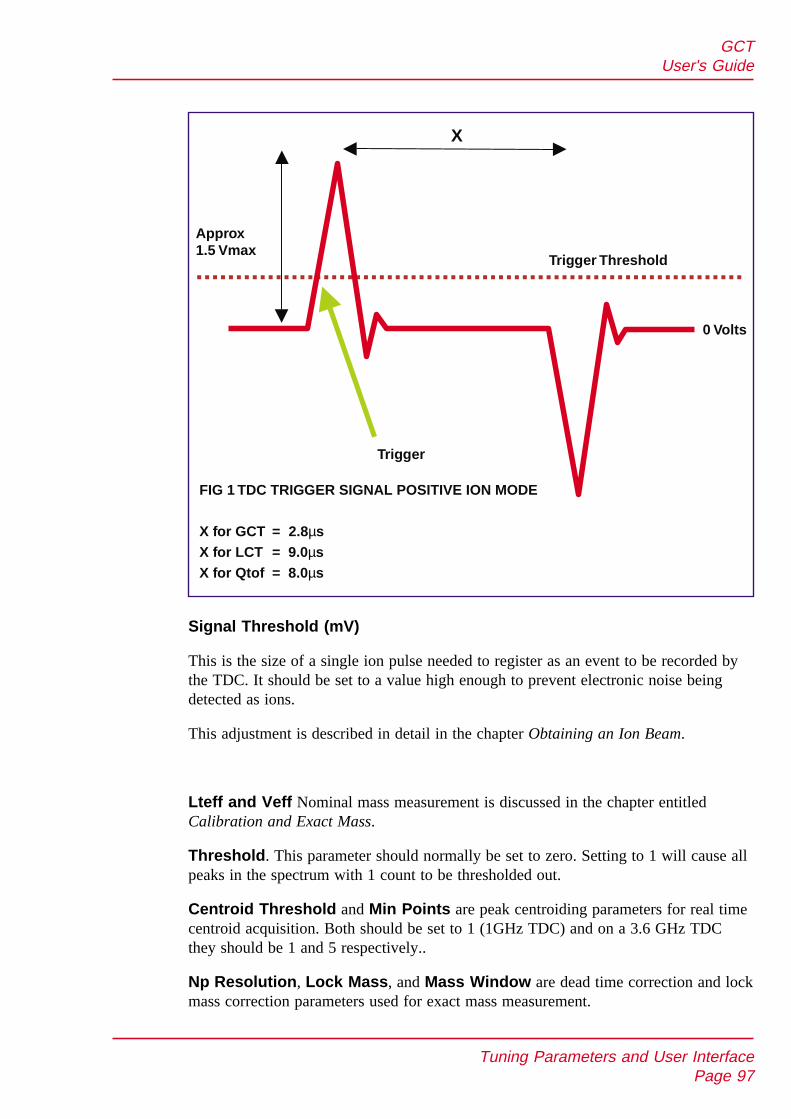
Signal Threshold (mV)
This is the size of a single ion pulse needed to register as an event to be recorded bythe TDC. It should be set to a value high enough to prevent electronic noise beingdetected as ions.
This adjustment is described in detail in the chapter Obtaining an Ion Beam.
Lteff and Veff Nominal mass measurement is discussed in the chapter entitledCalibration and Exact Mass.
Threshold. This parameter should normally be set to zero. Setting to 1 will cause allpeaks in the spectrum with 1 count to be thresholded out.
Centroid Threshold and Min Points are peak centroiding parameters for real timecentroid acquisition. Both should be set to 1 (1GHz TDC) and on a 3.6 GHz TDCthey should be 1 and 5 respectively..
Np Resolution, Lock Mass, and Mass Window are dead time correction and lockmass correction parameters used for exact mass measurement.
Tuning Parameters and User InterfacePage 97
GCTUser's Guide
Approx1.5 Vmax
Trigger Threshold
Trigger
0 Volts
X
FIG 1 TDC TRIGGER SIGNAL POSITIVE ION MODE
X for GCT = 2.8 sX for LCT = 9.0 sX for Qtof = 8.0 s
µ
µ
µ
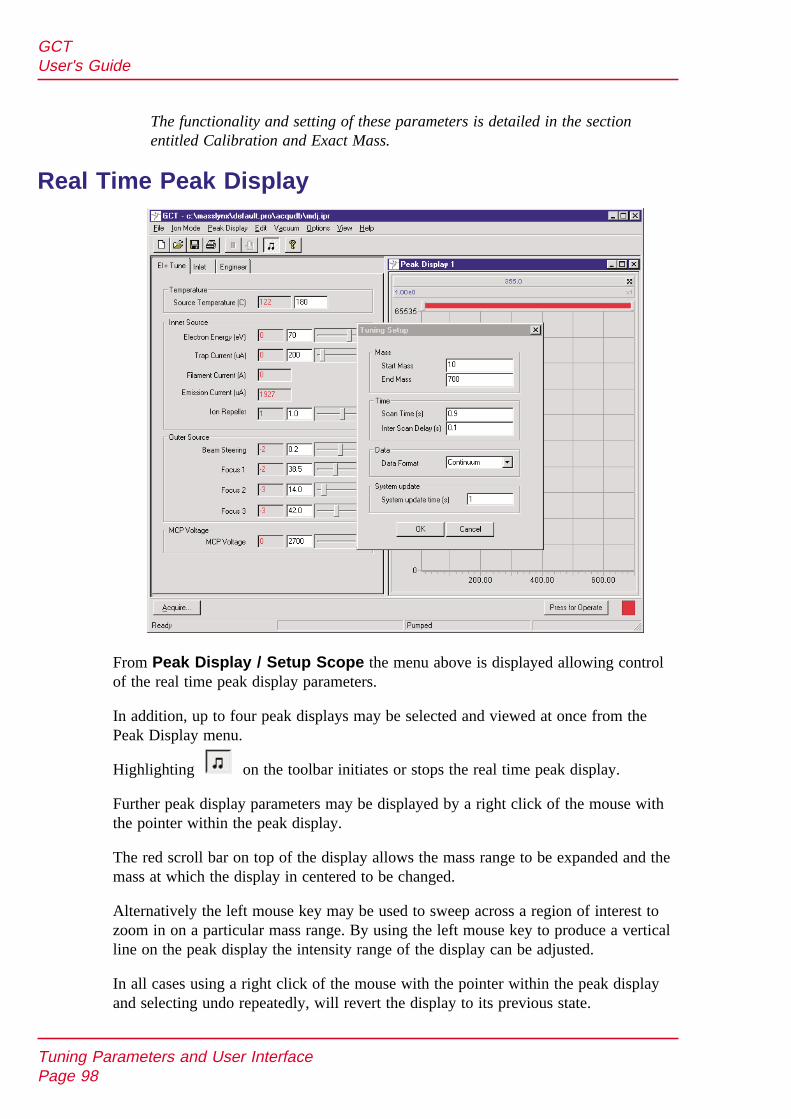
The functionality and setting of these parameters is detailed in the sectionentitled Calibration and Exact Mass.
Real Time Peak Display
From Peak Display / Setup Scope the menu above is displayed allowing controlof the real time peak display parameters.
In addition, up to four peak displays may be selected and viewed at once from thePeak Display menu.
Highlighting on the toolbar initiates or stops the real time peak display.
Further peak display parameters may be displayed by a right click of the mouse withthe pointer within the peak display.
The red scroll bar on top of the display allows the mass range to be expanded and themass at which the display in centered to be changed.
Alternatively the left mouse key may be used to sweep across a region of interest tozoom in on a particular mass range. By using the left mouse key to produce a verticalline on the peak display the intensity range of the display can be adjusted.
In all cases using a right click of the mouse with the pointer within the peak displayand selecting undo repeatedly, will revert the display to its previous state.
Tuning Parameters and User InterfacePage 98
GCTUser's Guide

Tune Page Acquisition
To access this menu select Acquire. This menu allows single acquisitions to bemade from the tune page.
To use a saved calibration file select Calibration from this menu.
When Start is selected from the Tune Page Acquisition menu, an acquisition isinitiated using the current tune page settings, acquisition parameters and calibrationfile entered in the Acquire menu. Data will be stored to disk.
Selecting Continuum on the acquisition page from Data Format and selectingStart will initiate an acquisition storing the raw data from the system.
Selecting Centroid on the acquisition page from Data Format and selecting Startwill initiate an acquisition storing peak-detected centroid data to disk. Any dead timecorrection and lock mass parameters not set to 0 in the TDC Parameters page willbe applied to the data.
To stop an acquisition use the tool bar button shown. This will be red when anacquisition is in progress.
Tuning Parameters and User InterfacePage 99
GCTUser's Guide

Data ProcessingThe processing of sample data is comprehensively described in the MassLynx NTUser’s Guide. Refer to that publication for full details.
The following is a very brief guide to displaying acquired data from MassLynx. Oncean acquisition is underway data may be viewed from MassLynx.
From the MassLynx page select File / Open Data file
Select the data file required and select OK. The TIC and the first spectrum in thechromatogram will be displayed.
Tuning Parameters and User InterfacePage 100
GCTUser's Guide

Operation in Positive Ion Chemical Ionisation Mode
Introduction
Chemical ionisation is a 'soft' ionisation technique in which sample molecules areionised in reactions with ionised gas molecules. Ammonia, isobutane and methane arecommonly used as reagent gases from which the reagent ions are generated. Ionisationof the reagent gas molecules is by electron bombardment within the ion chamber ofthe CI source.
In order to achieve the relatively high pressures required within the ion chamber whilemaintaining an adequate vacuum elsewhere, the chamber must be made partiallygas-tight.
As sufficient electrons are unlikely to reach the electron trap under CI conditions, notrap is present in the inner source. Filament current is regulated using the totalemission current and not the trap current as in EI operation.
Samples can be introduced using the solids probe, the DCI probe, the gaschromatograph, and the reference inlet system.
Using Methane Gas
Caution: Methane gas is explosive. When the instrument is run in chemical ionisationmode (CI), which involves the use of methane gas it is necessary to vent the effluentfrom the rotary pump in a safe manner. All gas fittings should be checked for leaktightness. Avoid naked flames.
Using Ammonia Gas
Caution: Ammonia gas is a hazardous vapour. When the instrument is run in chemicalionisation mode (CI), which involves the use of ammonia gas, it is necessary to ventthe effluent from the rotary pump in a safe manner. All gas fittings should bethoroughly checked for leak tightness.
Preparing for Operation in CI+ Mode
Install the CI inner source. For details of how to change the inner source seeInstallation and Removal of Inner Source in the chapter entitled RoutineProcedures earlier in this manual.
Before proceeding, see the section General Considerations for Tuning in allIonisation Modes.
If necessary, change the ionisation mode using the Ion Mode command.
See the section entitled Tuning Parameters and User Interface for typical valuesfor Inlet, Engineer Tuning Menu and TDC Parameters.
Tuning Parameters and User InterfacePage 101
GCTUser's Guide

Introduction of CI Reagent Gas
The following description considers methane as the CI reagent gas.
CI Gas Valve Layout
The CI gas solenoid valves are located on the rear inside panel of the GCT.
Before introduction of the CI reagent gas the internal CI reagent gas lines must bepurged of air.
Introduction of reagent gas and purging of the lines is achieved using the CI Gas andCI Purge buttons on the Inlet page shown above.
Attach a cylinder of methane to the CI gas inlet on the rear service panel of theGCT.
Check the main outlet valve on the cylinder to ensure that it is closed.
Select CI Purge from the Inlet page. The following sequence is invoked.
The CI line should now be evacuated. If the backing line pressure does notrecover, there may be a leak on the internal or external CI inlet or pump lines.
Ensure that the CI flow valve is turned fully clockwise, such that the valve isclosed.
Caution: Care should be taken not to over tighten this valve. Over tighteningcan lead to damage of the flow valve with the result that CI gas pressure may bedifficult to set.
Open the cylinder and set a pressure of 10psi of methane.
Select CI Gas from the Inlet menu. This will open the 'CI gas in' solenoid.
Monitor the source pressure on the Vacuum Monitor menu and turn the CIflow valve anti-clockwise until a source pressure of 1 - 2 e-4 mbar is displayed.
The Solvent Trip Level from the Engineer Tuning Menu needs to be reset toallow the filament to come on at this higher pressure.
To remove the CI gas deselect CI Gas from the Inlet page.
Introduction of Reference Gas
Close the reference reservoir pump valve on the top of the instrument.
Tuning Parameters and User InterfacePage 102
GCTUser's Guide

Introduce 2µl of Tris (Trifluoromethyl) Triazine via the septum.
Obtaining a Beam in CI+ Mode
Select OPERATE from the tuning menu.
Set an Emission Current of 250µA and other source tuning parameters asshown below. Recall previously stored parameters if available.
Call up peak display 1 and peak display 2.
Set a 0.9sec Integration Time and a 0.1sec Delay.
Set Pusher with a 40µs pusher interval.
Select From the GCT tune page to initiate a non-storage acquisition.
Set Peak Display 1 Mass Range from 284 - 288 amu and adjust the gain of thepeak display until ions can be detected.
Set Peak Display 2 Mass Range from 27 - 31 amu and adjust the gain of thepeak display until ions can be detected.
If the Values of Lteff and Veff have not been set to display the correct mass inthe peak display, then follow the procedure detailed in the chapter entitledCalibration and Exact Mass.
Whilst monitoring the peak from C2H5+ at29 tune for maximum intensityfor the (M+H) ion of Tris (trifluoromethyl) Triazine.
Tuning Parameters and User InterfacePage 103
GCTUser's Guide

It may be necessary to adjust the level of the reference compound to fall belowsaturation of the TDC.
This is achieved by opening the pump-out valve on the reference reservoirslowly.
The level of the reference compound should fall.
Refer to the section General Considerations for Tuning in all Ionisation Modes.Tune Beam Steering, Focus1, Focus 2 and Focus 3 to obtain the bestintensity of the286 ion.
The CI gas pressure can also be adjusted to obtain best sensitivity.
Tuning Parameters and User InterfacePage 104
GCTUser's Guide

Operation in Negative Ion Chemical Ionisation(NCI) Mode
During electron impact ionisation, negatively charged ions are formed as well aspositively charged ions. Normally, the negative ions remain undetected because theion source and focusing potentials allow only the extraction of positive ions.
There are limitations to the analytical usefulness of negative ions formed by electronimpact; for instance, many organic compounds do not form molecular orquasi-molecular anions under conventional EI conditions, but instead provide spectradominated by structurally insignificant low mass ions (e.g. CN-, F-, Cl-).Furthermore, the sensitivity for production of negative ions under EI conditions isseveral orders of magnitude lower than for positive ion production.
In contrast to the conditions of conventional electron impact, low energy electrons arereadily captured by many organic compounds without inducing excessivefragmentation. Consequently, the NCI ion source has been optimised for generating alarge population of electrons with near-thermal energy. Introduction of a reagent gasacts as a moderator for the initially energetic electrons. Anionic reagent gas ions canalso be generated for ion formation by ion-molecule reactions.
Preparing for Operation in NCI Mode
Install the CI inner source. For details of how to change the inner source see thesection Installation and Removal of Inner Source in the chapter entitled RoutineProcedures earlier in this manual.
If necessary, change the ionisation mode using the Ion Mode command.
See the section General Considerations for Tuning in all Ionisation Modesbefore proceeding.
See the section Tuning Parameters and User Interface to obtain typical valuesfor Inlet, Engineer Tuning Menu and TDC Parameters.
Introduction of CI Reagent Gas
See previous section Operation in Positive Ion Chemical Ionisation Mode. Thepressure of CI reagent gas in the source is usually somewhat lower for CInegative mode compared to CI positive mode.
Start with a set pressure read from the source Penning gauge of 5 - 8e-5 mbar.
Introduction of Reference Gas
Close the reference reservoir pump valve on the top of the instrument.
Introduce ca. 0.5µl of Heptacosa (PFTBA) via the septum.
Tuning Parameters and User InterfacePage 105
GCTUser's Guide

Tuning Parameters and User InterfacePage 106
GCTUser's Guide
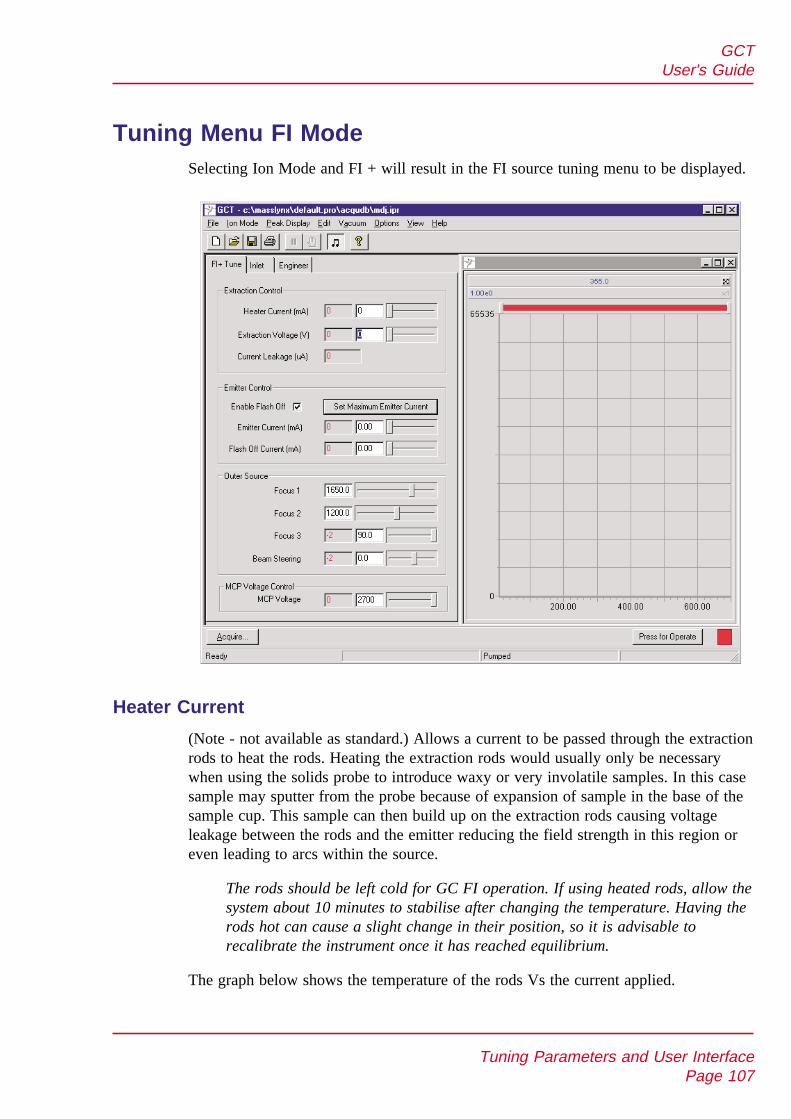
Tuning Menu FI ModeSelecting Ion Mode and FI + will result in the FI source tuning menu to be displayed.
Heater Current
(Note - not available as standard.) Allows a current to be passed through the extractionrods to heat the rods. Heating the extraction rods would usually only be necessarywhen using the solids probe to introduce waxy or very involatile samples. In this casesample may sputter from the probe because of expansion of sample in the base of thesample cup. This sample can then build up on the extraction rods causing voltageleakage between the rods and the emitter reducing the field strength in this region oreven leading to arcs within the source.
The rods should be left cold for GC FI operation. If using heated rods, allow thesystem about 10 minutes to stabilise after changing the temperature. Having therods hot can cause a slight change in their position, so it is advisable torecalibrate the instrument once it has reached equilibrium.
The graph below shows the temperature of the rods Vs the current applied.
Tuning Parameters and User InterfacePage 107
GCTUser's Guide
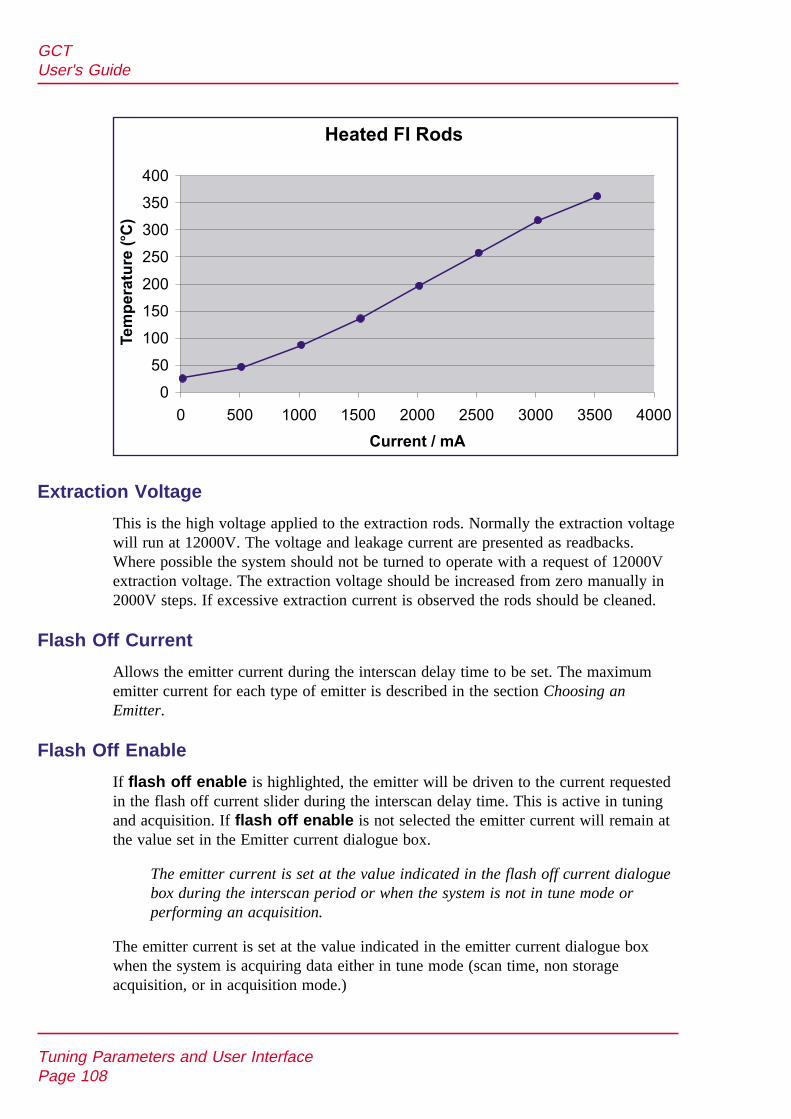
Extraction Voltage
This is the high voltage applied to the extraction rods. Normally the extraction voltagewill run at 12000V. The voltage and leakage current are presented as readbacks.Where possible the system should not be turned to operate with a request of 12000Vextraction voltage. The extraction voltage should be increased from zero manually in2000V steps. If excessive extraction current is observed the rods should be cleaned.
Flash Off Current
Allows the emitter current during the interscan delay time to be set. The maximumemitter current for each type of emitter is described in the section Choosing anEmitter.
Flash Off Enable
If flash off enable is highlighted, the emitter will be driven to the current requestedin the flash off current slider during the interscan delay time. This is active in tuningand acquisition. If flash off enable is not selected the emitter current will remain atthe value set in the Emitter current dialogue box.
The emitter current is set at the value indicated in the flash off current dialoguebox during the interscan period or when the system is not in tune mode orperforming an acquisition.
The emitter current is set at the value indicated in the emitter current dialogue boxwhen the system is acquiring data either in tune mode (scan time, non storageacquisition, or in acquisition mode.)
Tuning Parameters and User InterfacePage 108
GCTUser's Guide
Heated FI Rods
0
50
100
150
200
250
300
350
400
0 500 1000 1500 2000 2500 3000 3500 4000
Current / mA
Te
mp
era
ture
(C
)o

When the emitter flash off is not enabled the emitter will stay at the value indicated inthe emitter current dialogue box.
Beam Steering
Allows the beam to be deflected from center line during tuning. This is interactivewith the physical position of the emitter with respect to the center line of the machine.The beam steering should be set close to zero. The side to side position of the emittershould then be adjusted to obtain a beam. The beam steering can then be used for finetuning of the beam for maximum sensitivity.
Focus 1, Focus 2, and Focus 3 act to focus the ion beam into a thin ribbon formaximum transmission. Typical values are shown in the tune page above. Focus 1 andFocus 2 are 0 - 2500V lenses. Focus 3 is a 0 - 100V lens.
MCP Voltage
Provides control of the detector gain and should be set to the same value as used forEI and CI operation.
Introduction of Reference MaterialThe FI source has a dedicated reference gas reservoir and transfer line attached to thesource-housing lid. This reservoir is of similar construction to the reservoir attached tothe EI/CI source lid (see Reference Reservoir). However the reservoir has a slightlylarger internal volume and is not heated.
The fused silica leak within the reference inlet re-entrant is 100µm ID x 320µm OD.
The stainless steel capillary line within the source housing is arranged so that it pointsat the emitter and is set approximately 20mm away from the emitter. The end of thecapillary line is sheathed in high alumina ceramic Degussit tube. This minimises thedistortion of the electrical field in the extraction rod region from the presence of thestainless steel tubing at ground potential.
To introduce reference material,
• Close the reference reservoir pump valve on the top of the instrument.• Introduce about 3µl of reference material via the septum.
Set a flash off current (current during interscan) of 80% of the maximumemitter current.
Set the emitter current (current during the acquisition) to Zero mA.
The emitter will now heat up during the interscan period and cool during thescan. This ensures that sample does not condense on the emitter suppressingsensitivity. It may not be possible to see the emitter current readback changeduring the interscan period due to the time required to update the readback bythe software.
Tuning Parameters and User InterfacePage 109
GCTUser's Guide

General Considerations for Tuning and PositionOptimisation in FI Mode
Lens Tuning
The focus lenses are interactive with the beam centre, and combinations of focus andsteering settings should be tried. The focus 1 lens often optimises at maximumnegative voltage.
The tuning of the ion source is strongly dependent on the position of the emitter withrespect to the extraction rods. The closer the emitter is to the extraction rods thehigher the field strength at the emitter and the higher the sensitivity.
The position of the emitter with respect to the centre line of the extraction rods is alsovery critical. Small changes in this position can result in large changes in beamsteering voltage being required. In general, the beam steering should be set close tozero and the emitter probe adjuster knob used to optimise the signal. Smalladjustments to Beam Steering can then be made using the beam steering lens.
Changes in Focus voltage can also result in changes in beam steering voltage. Thefocus lenses should be optimised in conjunction with this steering lens. If the beamsteering lens optimises at > 4V the lens should be returned to zero and the emitterprobe adjuster knob used to reoptimise the beam.
Extraction Voltage
In general the higher the extraction voltage the higher the field strength and thehigher the sensitivity. Adjusting the extraction voltage will cause a change insource focussing and the source lenses will need to be reoptimised. The extractionvoltage should not be run above -12,000V. Higher voltages may result in dischargeswithin the source and ultimately damage to the emitter.
The signal from the reference material used for tuning will optimise in intensitybetween extraction voltages of 10,000 and 12,000V. Lowering the extraction voltagemay result in less fragmentation for particularly fragile analytes, however absolutesensitivity will be reduced.
GC Column Position
For FI- GC-MS the position of the column with respect to the emitter is critical foroptimum sensitivity. The end of the GC column should be as close as possible to theemitter wire. 2mm from the wire is optimum. If the end of the column is too close tothe emitter wire discharge or mechanical failure of the emitter may occur. If the end ofthe column is too far away from the emitter the sensitivity for analytes introduced viathe GC may be reduced.
Tuning Parameters and User InterfacePage 110
GCTUser's Guide

In addition the end of the GC column should be in line or slightly behind the emitterwire. If the end of the column is in front of the emitter wire sensitivity for analytesintroduced via the GC may be reduced.
Emitter Flash off Current
The magnitude of the flash of current can impact on the sensitivity for differentanalytes. As current is passed through the emitter wire the wire becomes hot. This canreduce sensitivity for thermally labile compounds. In general the emitter is flashed offto 80% of its maximum value however lower values may be tried. If the emitter flashoff current is too low sample will condense of the emitter during the chromatographicrun. As sample condenses the field strength between the emitter and the extractionrods is reduced and sensitivity decreases.
For higher boiling point samples some condensation of sample can occur towards theend of the chromatographic run. The emitter can be cleaned by setting the emittercurrent to maximum for 2 - 4 seconds then returning the emitter current to zero.
Sensitivity in FI not only depends on the quality of the emitter and the position of therelative source components but also will vary with acquisition rate and inter scan time.For optimum performance the emitter must be allowed to flash off to the correcttemperature during interscan and to fully cool as quickly as possible during theacquisition time.
For the CARBOTEC FI emitter with 5µm emitter wire diameter an acquisition time of1.2 sec with an inter scan (flash off) time of 0.2 sec is optimum. As the acquisitiontime is decreased or the interscan time is decreased sensitivity will be reduced.
For emitters with larger diameter wire and heavier deposits of carbon dendritemicroneedles a 2.5 sec acquisition time with a 0.4 sec delay is required for maximumsensitivity. Faster acquisition times and delays will decrease ultimate sensitivity.
There may be variation in the field strength, and hence sensitivity, betweenemitters. If sensitivity is poor another emitter should be tried.
Running GC MS Samples in FI Mode
It is important to use a solvent delay at the beginning of the acquisition when runningGC FI. This delay should be set so that the solvent front has completely eluted beforethe end of the solvent delay time. During the solvent delay period the ExtractionVoltage is turned off. This ensures that the Extraction Voltage is not on at a highpressure in the ion source region. Failure to protect the system from the solvent frontmay result in damage to the emitter.
The solvent delay time can be set from the experiment setup window and will beactive only when running an acquisition from the MassLynx Sample list.
The mechanics of acquisition are described in the chapter entitled Data Acquisition.
Tuning Parameters and User InterfacePage 111
GCTUser's Guide

Running Solids Probe Samples in FI Mode
Involatile samples may be run in FI mode using the solids probe. The adjuster knob onthe probe lock allows the end of the solids probe to be set at a fixed and reproducibledistance away from the emitter.
This distance should be set to approximately 10mm away from the emitter. The closerthe solids probe to the emitter the more the field around the extraction rods will bedistorted resulting in a loss in sensitivity.
It is also important to tune the ion source with the solids probe inserted into theposition to be used.
Operation of the GCT with the solids probe is described in the chapter The SolidsInsertion Probe.
Tuning Parameters and User InterfacePage 112
GCTUser's Guide
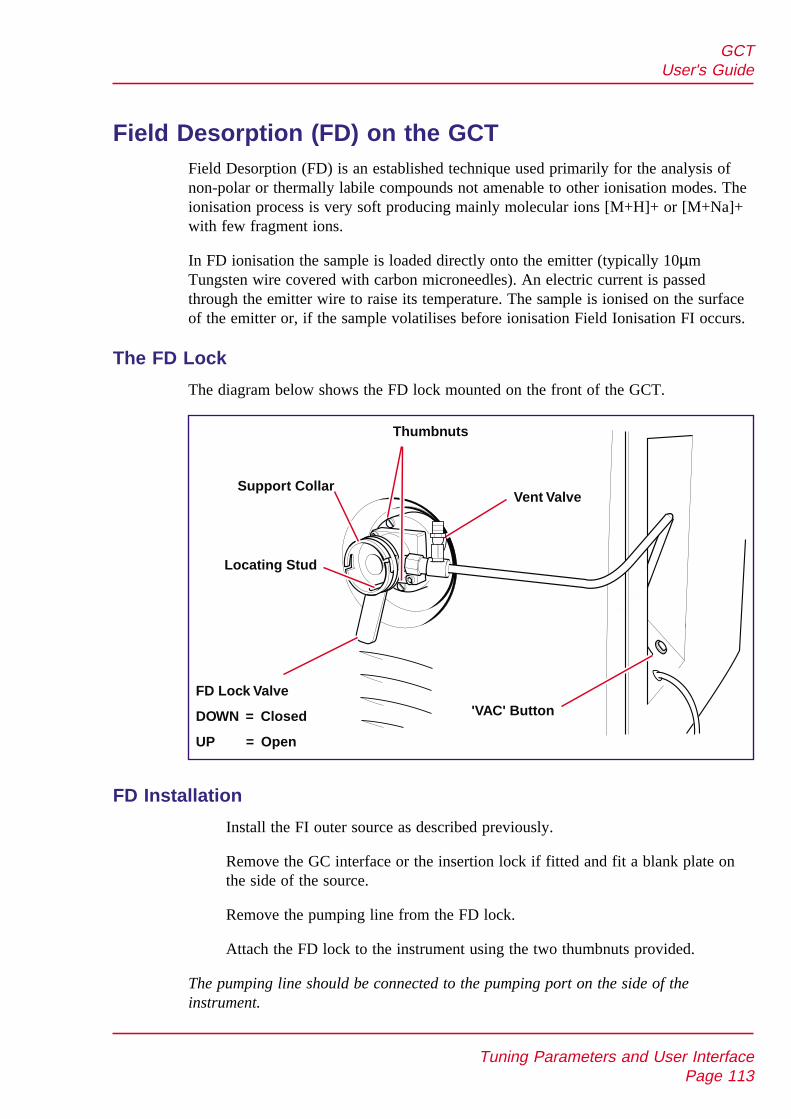
Field Desorption (FD) on the GCTField Desorption (FD) is an established technique used primarily for the analysis ofnon-polar or thermally labile compounds not amenable to other ionisation modes. Theionisation process is very soft producing mainly molecular ions [M+H]+ or [M+Na]+with few fragment ions.
In FD ionisation the sample is loaded directly onto the emitter (typically 10µmTungsten wire covered with carbon microneedles). An electric current is passedthrough the emitter wire to raise its temperature. The sample is ionised on the surfaceof the emitter or, if the sample volatilises before ionisation Field Ionisation FI occurs.
The FD Lock
The diagram below shows the FD lock mounted on the front of the GCT.
FD Installation
Install the FI outer source as described previously.
Remove the GC interface or the insertion lock if fitted and fit a blank plate onthe side of the source.
Remove the pumping line from the FD lock.
Attach the FD lock to the instrument using the two thumbnuts provided.
The pumping line should be connected to the pumping port on the side of theinstrument.
Tuning Parameters and User InterfacePage 113
GCTUser's Guide
Support Collar
Locating Stud
FD Lock Valve
DOWN = Closed
UP = Open
Thumbnuts
Vent Valve
'VAC' Button
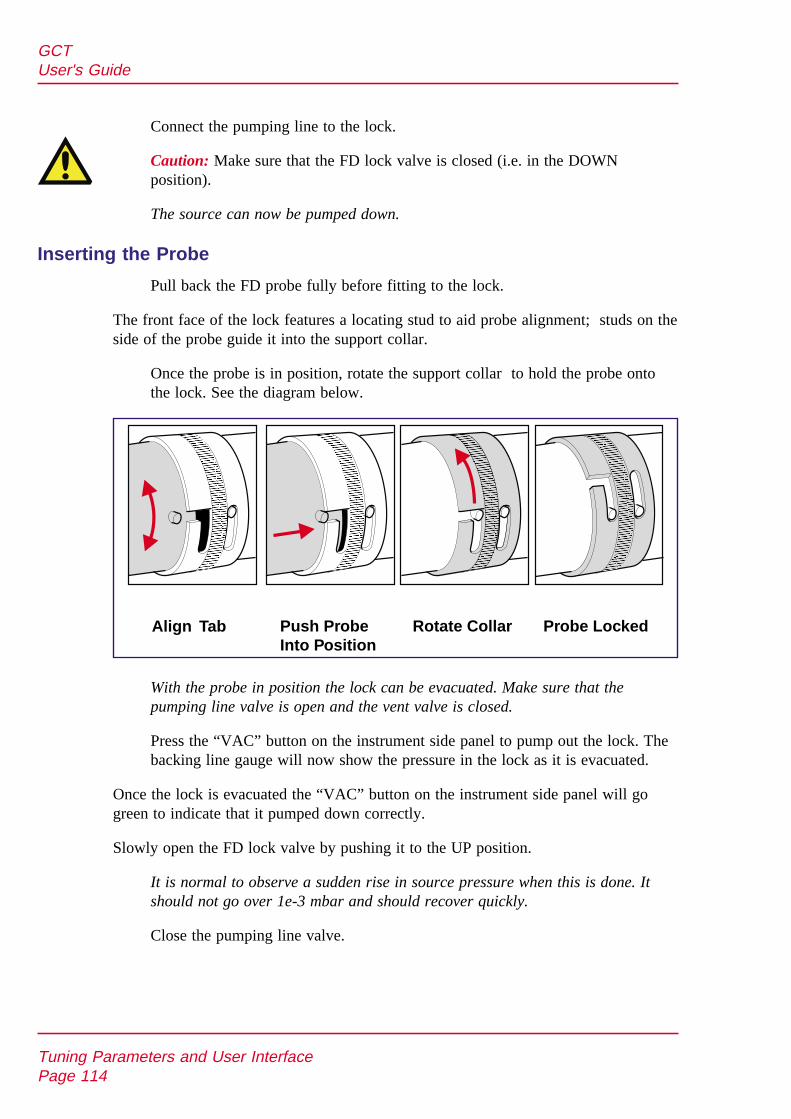
Connect the pumping line to the lock.
Caution: Make sure that the FD lock valve is closed (i.e. in the DOWNposition).
The source can now be pumped down.
Inserting the Probe
Pull back the FD probe fully before fitting to the lock.
The front face of the lock features a locating stud to aid probe alignment; studs on theside of the probe guide it into the support collar.
Once the probe is in position, rotate the support collar to hold the probe ontothe lock. See the diagram below.
With the probe in position the lock can be evacuated. Make sure that thepumping line valve is open and the vent valve is closed.
Press the “VAC” button on the instrument side panel to pump out the lock. Thebacking line gauge will now show the pressure in the lock as it is evacuated.
Once the lock is evacuated the “VAC” button on the instrument side panel will gogreen to indicate that it pumped down correctly.
Slowly open the FD lock valve by pushing it to the UP position.
It is normal to observe a sudden rise in source pressure when this is done. Itshould not go over 1e-3 mbar and should recover quickly.
Close the pumping line valve.
Tuning Parameters and User InterfacePage 114
GCTUser's Guide
Push ProbeInto Position
Rotate Collar Probe LockedAlign Tab

Now push the FD probe into the source.
The diagram above shows the probe pushed half way into the source.
The diagram above shows the probe mounted on the lock. Once the lock valve is openthe probe can be pushed into the source. Pull the stop trigger on the probe handle torelease the stop bar.
Push the probe forward whilst holding the trigger down so that the stop bar clears theprobe stop and collar. Rotate the probe if necessary to align the probe handle stud withthe groove in the screw thread.Rotate the probe to align the probe handle stud with thegroove in the screw thread.
The probe shaft may be lubricated with Molybdenum Disulphide powder or a verysmall amount of SANTOVAC oil, if necessary. (Care should be taken not to applyexcessive amounts of lubricant)
Tuning Parameters and User InterfacePage 115
GCTUser's Guide
Vent Valve
Pumping Line Valve
Support Collar
Side-to-side Adjuster Knob
ThreadedProbe Stop
Probe HandleRotationalAdjustmentKnob
FD Lock Valve
Screw ThreadWith Locating Groove
The source pressure should be allowed to reach approximately <5e-6 mbarbefore operating the source. This may take some minutes if the source is beingpumped down for the first time.
The system may now be turned to OPERATE mode.
The Source solvent trip level should be set to a pressure just above the source pressureindicated. This will protect the emitter in the event of a pressure surge in the sourcehousing.
Removing the Probe
Before removing the probe reduce the Emitter Current to zero mA and ensure thatthe Extraction Voltage request is zero V.
Pull the FD probe back fully through the lock. Make sure that the stop bar clicksinto position on the shaft behind the screw thread.
Close the FD lock valve by pushing it into the DOWN position.
Vent the lock by rotating the vent valve anti-clockwise by about half a turn.
You should hear a short hiss as air is let into the lock.
Rotate the support collar to release the probe and remove the FD probe from thelock.
Be careful not to knock the emitter on the lock as you remove it.
Choosing an Emitter
It is recommended that Carbotec FD emitters using 10µm wire are used for FD. Thesehave a maximum current of 100mA The Carbotec FI emitters using 5µm are notsuitable for FD applications.
Loading the Probe with Sample
It is recommended that a sample concentration in the range of 500ng/µl -20µg/µlshould generally be used for the best results. At higher concentrations there may be atendency for the sample to ‘sputter’ off the emitter and cause discontinuities in thespectrum and sometimes arcing which can destroy the emitter. The sample should bedissolved in a volatile solvent, if possible, to minimise evaporation time.
Remove the probe from the insertion lock and pull fully out.
Place the assembly on its side on a flat surface.
Rotate the probe shaft to present the emitter in a horizontal aspect.
Using a 10µl syringe drip 1µl of sample directly onto the sample wire.
Tuning Parameters and User InterfacePage 116
GCTUser's Guide
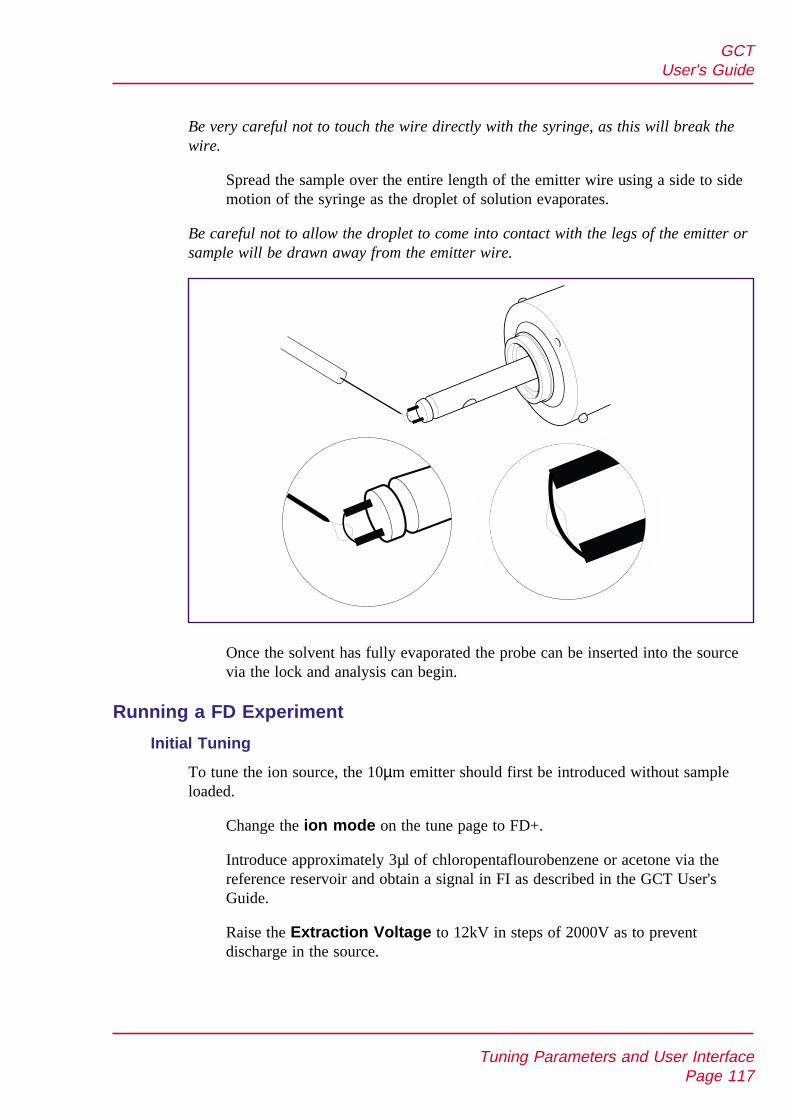
Be very careful not to touch the wire directly with the syringe, as this will break thewire.
Spread the sample over the entire length of the emitter wire using a side to sidemotion of the syringe as the droplet of solution evaporates.
Be careful not to allow the droplet to come into contact with the legs of the emitter orsample will be drawn away from the emitter wire.
Once the solvent has fully evaporated the probe can be inserted into the sourcevia the lock and analysis can begin.
Running a FD Experiment
Initial Tuning
To tune the ion source, the 10µm emitter should first be introduced without sampleloaded.
Change the ion mode on the tune page to FD+.
Introduce approximately 3µl of chloropentaflourobenzene or acetone via thereference reservoir and obtain a signal in FI as described in the GCT User'sGuide.
Raise the Extraction Voltage to 12kV in steps of 2000V as to preventdischarge in the source.
Tuning Parameters and User InterfacePage 117
GCTUser's Guide
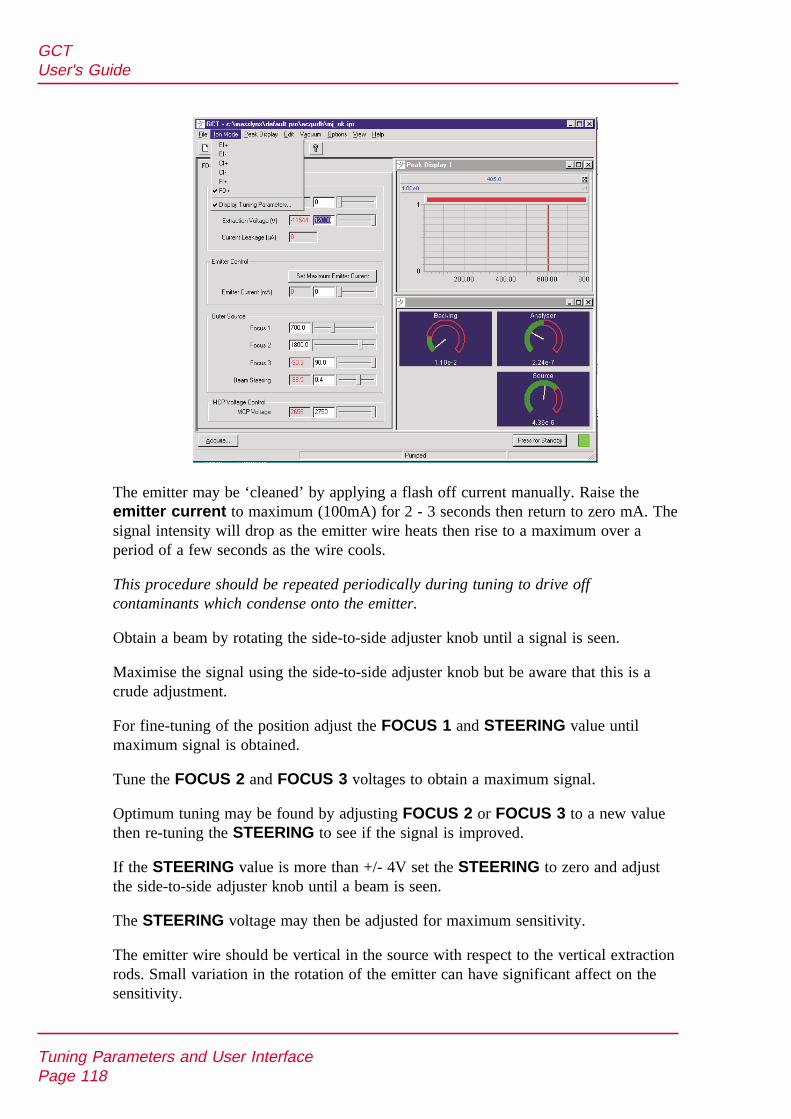
The emitter may be ‘cleaned’ by applying a flash off current manually. Raise theemitter current to maximum (100mA) for 2 - 3 seconds then return to zero mA. Thesignal intensity will drop as the emitter wire heats then rise to a maximum over aperiod of a few seconds as the wire cools.
This procedure should be repeated periodically during tuning to drive offcontaminants which condense onto the emitter.
Obtain a beam by rotating the side-to-side adjuster knob until a signal is seen.
Maximise the signal using the side-to-side adjuster knob but be aware that this is acrude adjustment.
For fine-tuning of the position adjust the FOCUS 1 and STEERING value untilmaximum signal is obtained.
Tune the FOCUS 2 and FOCUS 3 voltages to obtain a maximum signal.
Optimum tuning may be found by adjusting FOCUS 2 or FOCUS 3 to a new valuethen re-tuning the STEERING to see if the signal is improved.
If the STEERING value is more than +/- 4V set the STEERING to zero and adjustthe side-to-side adjuster knob until a beam is seen.
The STEERING voltage may then be adjusted for maximum sensitivity.
The emitter wire should be vertical in the source with respect to the vertical extractionrods. Small variation in the rotation of the emitter can have significant affect on thesensitivity.
Tuning Parameters and User InterfacePage 118
GCTUser's Guide
A rotational adjustment knob is provided on the rear of the probe handle to allowsmall adjustments to emitter rotation to be made. Beam steering and focusing willneed to be re-optimised after adjusting this parameter. This knob should be locked inposition once a suitable setting is determined.
Introducing the Sample
Before removing the probe;
Reduce the Emitter Current to zero mA and ensure that the ExtractionVoltage request is zero V.
Take out the probe and load the emitter with sample. The FD lock and probe isdesigned so that when the probe is reintroduced the emitter will return to as nearto the previous position as possible.
This minimises the amount of re-tuning required before an experiment can beperformed.
Re-introduce the probe. Increase the Extraction Voltage to 12kV in steps of2000V.
Do not flash off the emitter at this stage or raise the Emitter Current abovezero.
Introduce acetone into the reference reservoir until the source pressure climbs toabout 1e-5mbar (about 20µl is typically required)
It may be necessary to adjust the source trip level on the engineers page to allowthis. This should give a good strong signal of acetone at 58Da.
The sensitivity of the source to reference compound introduced via the referencereservoir (FI) is severely reduced, when sample is loaded. This sensitivity loss in FI isdue to coating of the carbon dendrites with sample which reduces the overall fieldstrength near to the emitter surface. .
Adjust the STEERING voltage to maximise the acetone signal at 58 Da. Normally thevoltage should have changed from the previous position by less than 4 Volts.
Running a FD experiment - Manual Method
Once the instrument is tuned up on the acetone start an acquisition over the massrange of interest.
Tuning Parameters and User InterfacePage 119
GCTUser's Guide
Once the acquisition is underway begin to slowly increase the Emitter Current onthe tune page. This will gradually warm up the emitter and desorb the sample. As it isdesorbed the sample will ionise on the emitter. Monitor the spectrum on the tune pageas the acquisition progresses. It is advisable to desorb the sample slowly. At theemitter current where ions start to be observed in the spectrum there may be a largeincrease in signal for a small increase in emitter current. The emitter current should beraised in small increments allowing the signal intensity to stabilise each time thecurrent is increased.
Raising the emitter current too quickly can result in thermal degrading of the analyteon the emitter surface before ionisation, reduced overall ionisation efficiency and insevere cases arcing between the emitter and the extraction rods due to localisedincreases in pressure. Once the signal has dropped to a low value you can then resumeraising the Emitter Current.
Once all the sample has been desorbed from the emitter, flash off the emitter byraising the Emitter Current to 100µA for five seconds then dropping it back to zero.The acetone peak should be clearly visible again and the acquisition may be stopped.
For some analyses it may be preferable to ramp the emitter without any acetone in thesource. With no reference material in the source there will be more sites available forionisation of the sample. In this case use acetone to tune up initially to get a goodposition for the emitter then pump out the reference reservoir before commencing theramp.
Tuning Parameters and User InterfacePage 120
GCTUser's Guide

Data AcquisitionFile Sizes
Time-of-flight mass spectrometers such as the GCT generate very large data files. Filesize depends on the specific type of experiment and on the quality of the samplesused. Samples with a lot of interference (‘dirty’) have very large files, whereas verypure samples will have relatively small files (though still large).
This consideration is important when the system is being used for multiple sampleruns. The large number of samples run, without care, can completely fill the harddrive, losing valuable data.
As with any software application, it is important to constantly monitor the hard diskspace, and to consider the requirements of proposed experiments. If the remaining freespace is allowed to fall below 10%, this will almost certainly affect the performanceof both MassLynx and the Windows operating system.
Starting an AcquisitionThere are two ways of starting an acquisition:
• a single sample acquisition from the tune page.
• a single or multiple sample acquisition from the MassLynx sample list.
Starting an Acquisition from the Tune Page
The easiest way to acquire data is directly from the tune page.
Acquisitions can be started and stopped.
Inlet programs cannot be used.
Analog data cannot be acquired.
Multiple sample sequences cannot be acquired.
To start a single sample acquisition:
Data AcquisitionPage 121
GCTUser's Guide
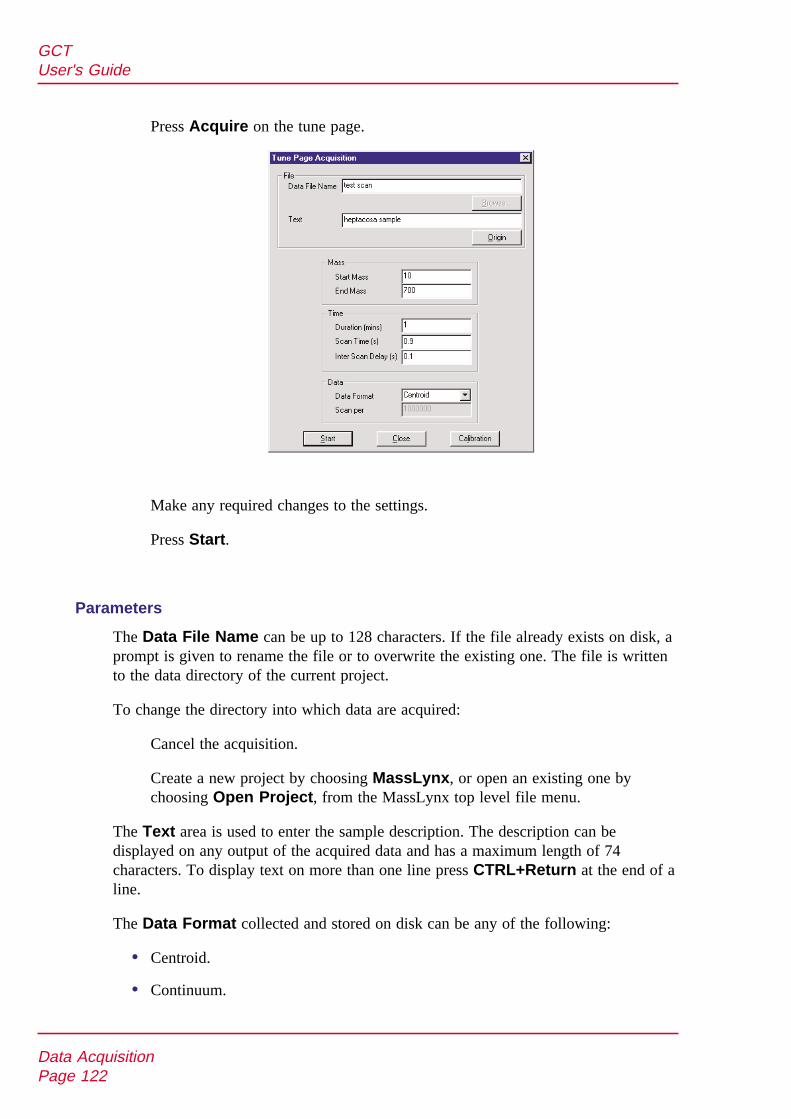
Press Acquire on the tune page.
Make any required changes to the settings.
Press Start.
Parameters
The Data File Name can be up to 128 characters. If the file already exists on disk, aprompt is given to rename the file or to overwrite the existing one. The file is writtento the data directory of the current project.
To change the directory into which data are acquired:
Cancel the acquisition.
Create a new project by choosing MassLynx, or open an existing one bychoosing Open Project, from the MassLynx top level file menu.
The Text area is used to enter the sample description. The description can bedisplayed on any output of the acquired data and has a maximum length of 74characters. To display text on more than one line press CTRL+Return at the end of aline.
The Data Format collected and stored on disk can be any of the following:
• Centroid.
• Continuum.
Data AcquisitionPage 122
GCTUser's Guide
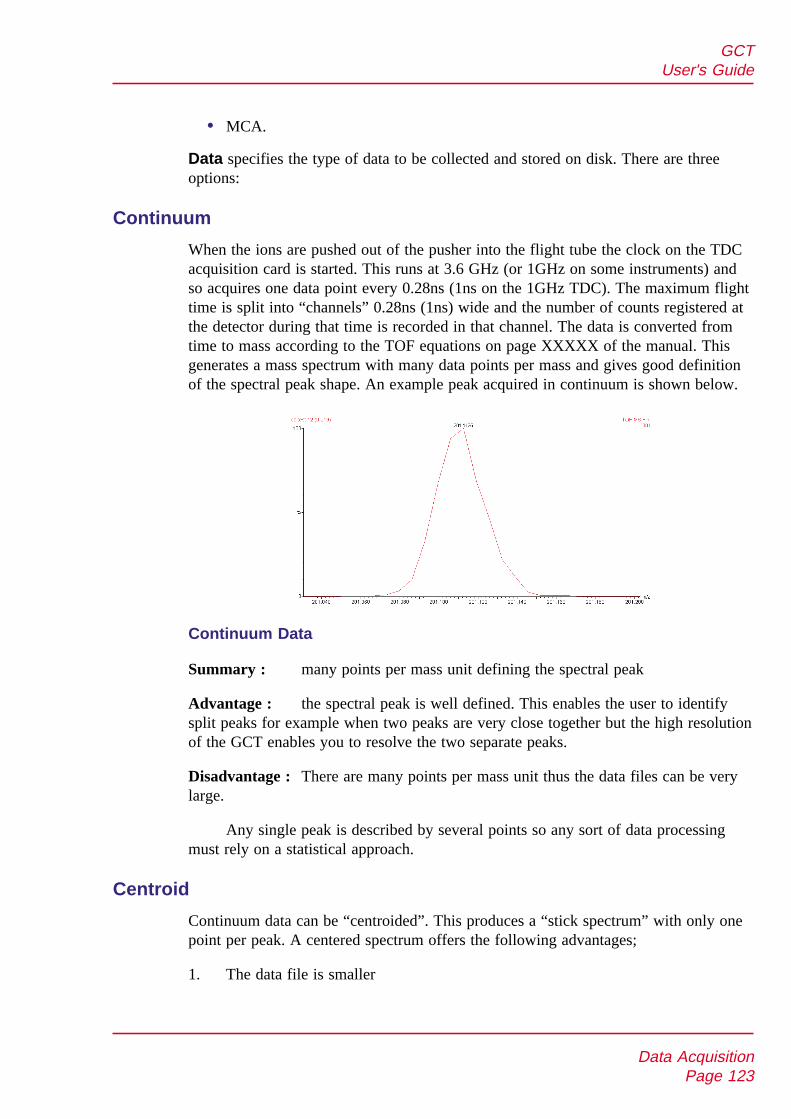
• MCA.
Data specifies the type of data to be collected and stored on disk. There are threeoptions:
Continuum
When the ions are pushed out of the pusher into the flight tube the clock on the TDCacquisition card is started. This runs at 3.6 GHz (or 1GHz on some instruments) andso acquires one data point every 0.28ns (1ns on the 1GHz TDC). The maximum flighttime is split into “channels” 0.28ns (1ns) wide and the number of counts registered atthe detector during that time is recorded in that channel. The data is converted fromtime to mass according to the TOF equations on page XXXXX of the manual. Thisgenerates a mass spectrum with many data points per mass and gives good definitionof the spectral peak shape. An example peak acquired in continuum is shown below.
Continuum Data
Summary : many points per mass unit defining the spectral peak
Advantage : the spectral peak is well defined. This enables the user to identifysplit peaks for example when two peaks are very close together but the high resolutionof the GCT enables you to resolve the two separate peaks.
Disadvantage : There are many points per mass unit thus the data files can be verylarge.
Any single peak is described by several points so any sort of data processingmust rely on a statistical approach.
Centroid
Continuum data can be “centroided”. This produces a “stick spectrum” with only onepoint per peak. A centered spectrum offers the following advantages;
1. The data file is smaller
Data AcquisitionPage 123
GCTUser's Guide
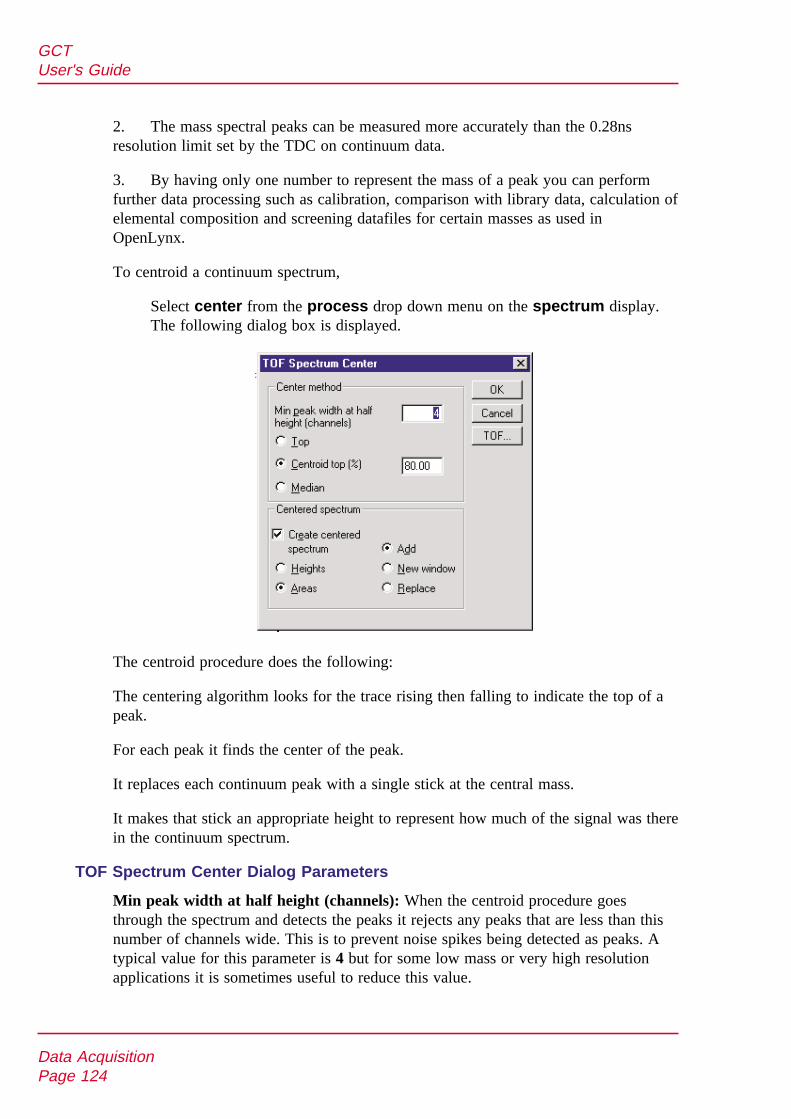
2. The mass spectral peaks can be measured more accurately than the 0.28nsresolution limit set by the TDC on continuum data.
3. By having only one number to represent the mass of a peak you can performfurther data processing such as calibration, comparison with library data, calculation ofelemental composition and screening datafiles for certain masses as used inOpenLynx.
To centroid a continuum spectrum,
Select center from the process drop down menu on the spectrum display.The following dialog box is displayed.
The centroid procedure does the following:
The centering algorithm looks for the trace rising then falling to indicate the top of apeak.
For each peak it finds the center of the peak.
It replaces each continuum peak with a single stick at the central mass.
It makes that stick an appropriate height to represent how much of the signal was therein the continuum spectrum.
TOF Spectrum Center Dialog Parameters
Min peak width at half height (channels): When the centroid procedure goesthrough the spectrum and detects the peaks it rejects any peaks that are less than thisnumber of channels wide. This is to prevent noise spikes being detected as peaks. Atypical value for this parameter is 4 but for some low mass or very high resolutionapplications it is sometimes useful to reduce this value.
Data AcquisitionPage 124
GCTUser's Guide
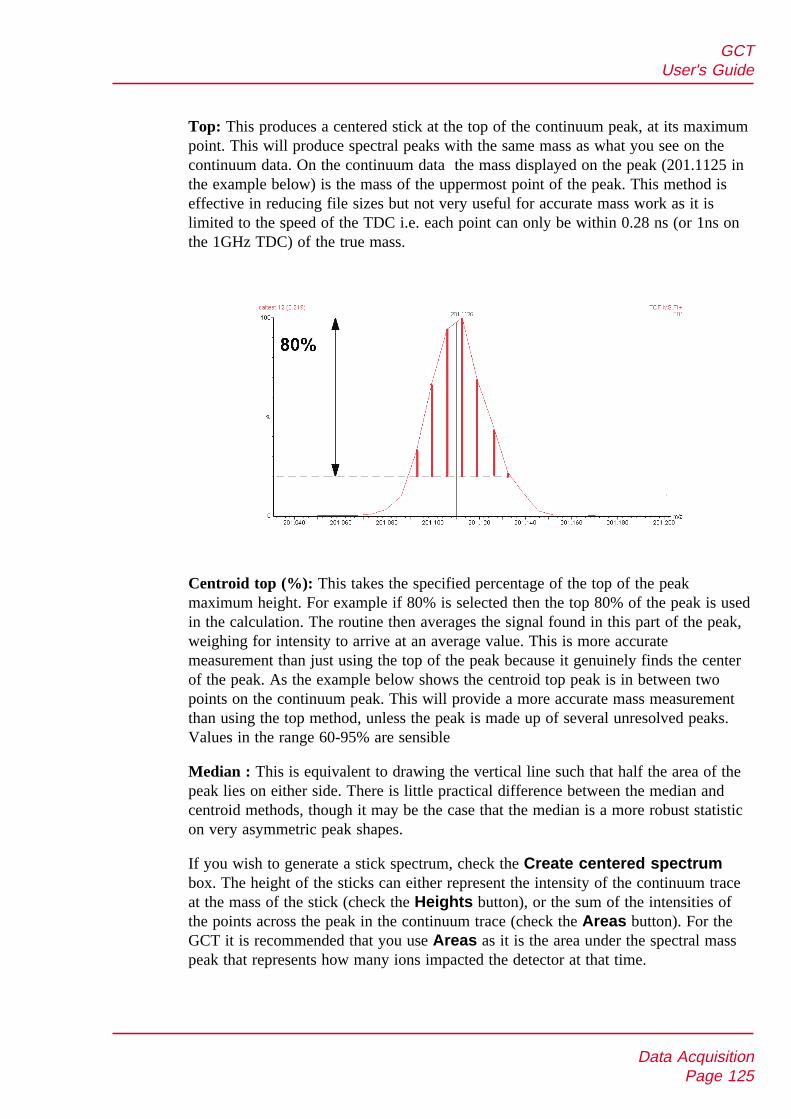
Top: This produces a centered stick at the top of the continuum peak, at its maximumpoint. This will produce spectral peaks with the same mass as what you see on thecontinuum data. On the continuum data the mass displayed on the peak (201.1125 inthe example below) is the mass of the uppermost point of the peak. This method iseffective in reducing file sizes but not very useful for accurate mass work as it islimited to the speed of the TDC i.e. each point can only be within 0.28 ns (or 1ns onthe 1GHz TDC) of the true mass.
Centroid top (%): This takes the specified percentage of the top of the peakmaximum height. For example if 80% is selected then the top 80% of the peak is usedin the calculation. The routine then averages the signal found in this part of the peak,weighing for intensity to arrive at an average value. This is more accuratemeasurement than just using the top of the peak because it genuinely finds the centerof the peak. As the example below shows the centroid top peak is in between twopoints on the continuum peak. This will provide a more accurate mass measurementthan using the top method, unless the peak is made up of several unresolved peaks.Values in the range 60-95% are sensible
Median : This is equivalent to drawing the vertical line such that half the area of thepeak lies on either side. There is little practical difference between the median andcentroid methods, though it may be the case that the median is a more robust statisticon very asymmetric peak shapes.
If you wish to generate a stick spectrum, check the Create centered spectrumbox. The height of the sticks can either represent the intensity of the continuum traceat the mass of the stick (check the Heights button), or the sum of the intensities ofthe points across the peak in the continuum trace (check the Areas button). For theGCT it is recommended that you use Areas as it is the area under the spectral masspeak that represents how many ions impacted the detector at that time.
Data AcquisitionPage 125
GCTUser's Guide

The stick spectrum may be added to the current spectrum window, it may replace thecurrent spectrum, or it may be placed in a new window. Check Add, Replace orNew appropriately.
TOF Parameters
On a Time Of Flight (TOF) mass spectrometer the detector dead-time can cause thepeaks to shift over to low mass and appear smaller than they really are (see pageXXXXX of the manual). To correct for this a dead time correction algorithm isincluded in the centering process. To set the parameters for the dead time correctionpress the “TOF” button on the TOF Spectrum Center diaolog box and enter theappropriate parameters in the boxes (see section XXXXX for more details). Thisdialog box also allows you to set a lock mass to use for accurate mass measurements(see section XXXXX for more details)
Mass Measure
To improve mass accuracy it is recommended that the continuum data be backgroundsubtracted and smoothed prior to centering. Background subtraction tells the centeringalgorithm how much of the spectrum is noise, and therefore reduce the amount ofnoise seen in the resultant stick spectrum. Smoothing will help the centering algorithmmake sensible decisions about whether groups of data points represent peaks, or noisespikes.
(Exception: MaxEnt spectra. MaxEnt spectra need centering to get an accurate massjust like any continuum spectrum. MaxEnt is designed to produce smooth spectra, andevery peak in the MaxEnt result has already been interpreted by MaxEnt assignificant. For this reason, neither smoothing nor subtraction of MaxEnt spectra isnecessary prior to mass measurement.)
In order to do all three of these processes together select mass measure from theprocess drop down menu on the spectrum display.
Real Time Centroid
The above discussion has covered post processing centroiding which is performed oncontinuum data. Data can also be acquired in centroid mode. This may be considered asensible option on the GCT because:
The centroid data files are much smaller than continuum data files. As a typical GCexperiment can be 20-30 minutes long the size of continuum data files can become anissue. If you post process the data you still have the large continuum data file saved onthe hard disk taking up space.
The centroid data comes out mass measured with accurate mass using the lock massthat is continuously bled into the source and therefore present throughout theacquisition.
Data AcquisitionPage 126
GCTUser's Guide

Data has to be centroided anyway to calibrate, mass measure, use the library and theelemental composition calculator and packages such as OpenLynx.
When the data is acquired in centroid mode the computer does what is called “realtime centroid” i.e. the spectra are acquired then centroided as the acquisition takesplace before being saved to hard disk. The principal difference between real timecentroid acquisition and post process centroiding is that in real time centroidacquisition the data is peak detected, smoothed (2x3window) and centered (centroidtop = 80% using peak Areas) by default. Note that these parameters have beenchosen to work in a wide variety of situations but cannot be altered by the user. Alsothe process of peak detection is by using a differential method which is a fastermethod but differs slightly from that used in the post process version.
However the TOF parameters (dead time correction and lock mass), Min peak widthat half height and centroid threshold (used to background subtract) can bealtered by the user on the TDC settings page of the Tune page (see page XXXXX ofthe Users Guide)
In practice real time centroid acquisition and post process centroiding produce verysimilar results (<1 ppm). However it is important to realise that real time centroidacquisition does work in a slightly different way to post process centroiding. In thevery unlikely event that errors are observed in data that has been acquired in centroidmode it may be worth trying the acquisition again in continuum mode then centeringthe data in the spectrum display window.
• Centroid stores data as centroided, intensity and mass assigned peaks. Data arestored for every scan.
• Continuum. The signal received by the interface electronics is stored regularlyto give an analog intensity picture of the data being acquired. Data are notcentroided into peaks, but are stored for every scan.
Due to the fact that continuum has many points across each peak, data files tendto be significantly larger than centroided ones. However, since the centroidroutine is not invoked the absolute scanning speed(spectra/sec) is faster.
It is possible, however, to set a threshold below which the data are not stored.The threshold can be set so that data considered to be ‘noise’ can be discarded,thus improving data acquisition speed and reducing data file sizes.
• Multi Channel Analysis (MCA). MCA data can be thought of as ‘summedcontinuum’, with only one intensity accumulated scan being stored for a givenexperiment. As each scan is acquired, its intensity data is added to theaccumulated summed data of previous scans.
An advantage of MCA is that the data files occupy significantly less space onthe hard disk than the equivalent continuum data would.
Data AcquisitionPage 127
GCTUser's Guide
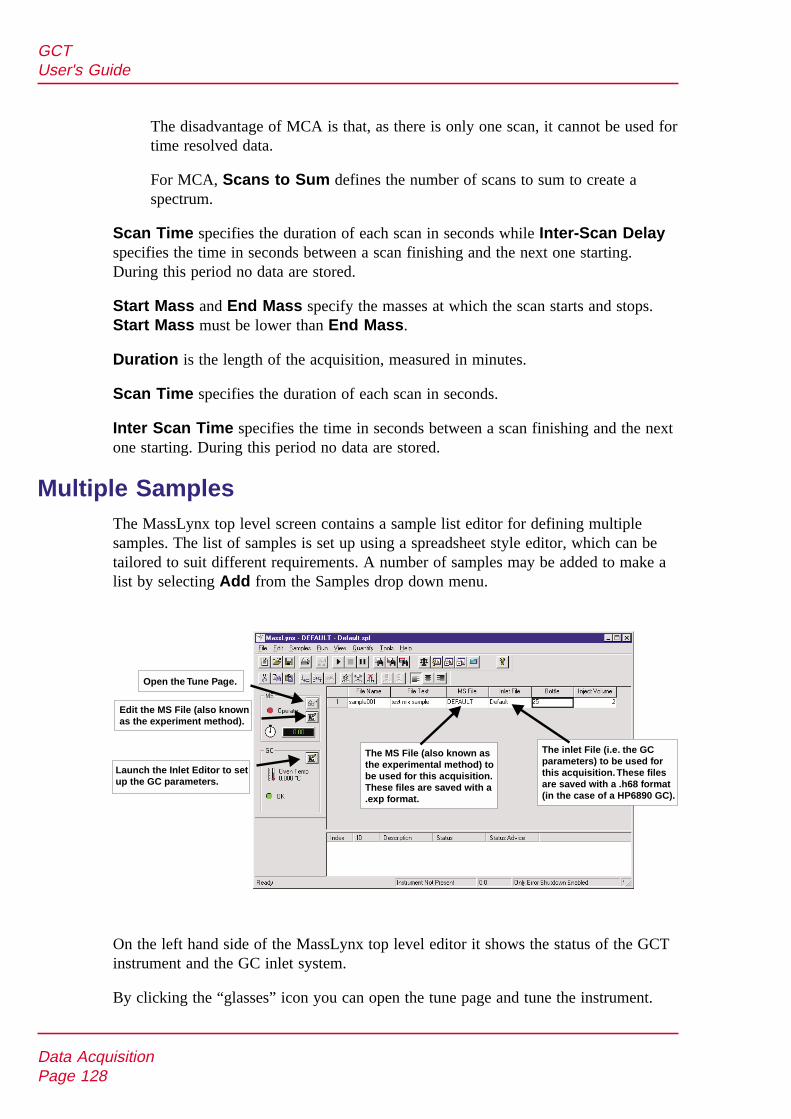
The disadvantage of MCA is that, as there is only one scan, it cannot be used fortime resolved data.
For MCA, Scans to Sum defines the number of scans to sum to create aspectrum.
Scan Time specifies the duration of each scan in seconds while Inter-Scan Delayspecifies the time in seconds between a scan finishing and the next one starting.During this period no data are stored.
Start Mass and End Mass specify the masses at which the scan starts and stops.Start Mass must be lower than End Mass.
Duration is the length of the acquisition, measured in minutes.
Scan Time specifies the duration of each scan in seconds.
Inter Scan Time specifies the time in seconds between a scan finishing and the nextone starting. During this period no data are stored.
Multiple SamplesThe MassLynx top level screen contains a sample list editor for defining multiplesamples. The list of samples is set up using a spreadsheet style editor, which can betailored to suit different requirements. A number of samples may be added to make alist by selecting Add from the Samples drop down menu.
On the left hand side of the MassLynx top level editor it shows the status of the GCTinstrument and the GC inlet system.
By clicking the “glasses” icon you can open the tune page and tune the instrument.
Data AcquisitionPage 128
GCTUser's Guide
The inlet File (i.e. the GCparameters) to be used forthis acquisition.These filesare saved with a .h68 format(in the case of a HP6890 GC).
The MS File (also known asthe experimental method) tobe used for this acquisition.These files are saved with a.exp format.
Launch the Inlet Editor to setup the GC parameters.
Edit the MS File (also knownas the experiment method).
Open the Tune Page.

Clicking on the edit icon below this will edit the MS file (this is also known as the“experiment method” or the “method editor”).
Clicking the “Inlet Editor” icon in the GC status area will launch the Inlet Editorprogram which allows you to set up the parameters used for the GC system.
The sample list is displayed on the right hand side of the window.
This contains the following fields in the spreadsheet display.
File Name
This is the name of the data file that will be saved to hard disk when the data isacquired.
File Text
This is used to enter a sample description to be saved and displayed with the data onthe Chromatogram or Spectrum window.
MS File
This refers to the “experiment method” that will be used to acquire the data. Theexperiment method specifies which tune page parameters to use, the length andduration of the scan, the calibrations etc and is described in detail later on in thischapter.
The parameters are set up and then saved as a “.exp” file which must be referencedhere. Select from the ones currently saved and available by double clicking in this boxand selecting one from the drop down menu that appears.
Inlet File
This specifies which Inlet parameters will be used in the acquisition. The inletparameters are set up on the Inlet Editor page. They are saved as a “.h98" file (in thecase of a HP 6890 GC system) which must be referenced here.
For more details of the Inlet Editor for all the various GC and Auto-samplercombinations supported by MassLynx see the publication Micromass NT Guide toInlet Control (Micromass part number 6666678).
Select from the ones currently saved and available by double clicking in this box andselecting one from the drop down menu that appears.
Bottle
This is only relevant when using an auto-sampler and indicates which the position inthe auto-sampler tray that the sample is located. The auto-sampler will take the samplefrom the position indicated so make sure that it corresponds to the correct sample inthe tray.
Data AcquisitionPage 129
GCTUser's Guide

Injection Volume
This is only relevant when using an auto-sampler and indicates the amount of sampleto be injected into the injector.
It is important to realise that this value is expressed in terms of tenths of a syringevolume e.g. if you have a 5 microlitre syringe then setting a value of 2 will give 2/10of 5 microliters which is 1 microlitre. Also note that in most versions of MassLynx forthe GCT the HP6890 can only accept integer values for this parameter so to avoidmistakes it is best to set the properties of this column to accept only integers.
Right click on the column heading and select “Properties” from the drop downmenu.
The “Field Properties” dialog box will appear.
Set “decimal places” to 0 and press “OK”.
For more details of the MassLynx top level screen see the MassLynx NT Users Guide(Micromass part number 6666536)
The Experiment Editor
Data AcquisitionPage 130
GCTUser's Guide

Introduction
The experiment editor is used to set up the function(s) that the mass spectrometer usesto scan the instrument during an acquisition. A function list can be a mixture ofdifferent scanning techniques that can be arranged to run either sequentially orconcurrently during an acquisition.
A function list is produced in the experiment window, saved on disk as a .exp file andthen referenced by name on the sample list.
A simple experiment is shown above, containing only one function: a centroided modefull scan, between 20 and 1000 amu using EI+ ionisation. Immediately above thefunction bar display is a time scale that shows from when the function is active, andfor how long it runs. In this case the function starts after 5 minutes and then runs for15 minutes, terminating after a total elapsed time of 20 minutes.
To access this dialog:
Press on the MS panel of the MassLynx screen.
The Experiment Editor Toolbar
The toolbar is displayed at the top of the tune window and allows some commonoperations to be performed with a single click.
Create a new experiment. Edit the selected function.
Open an existing experiment. Delete the selected function.
Save the current experiment to disk. Move the selected function up the list offunctions.
Print the current window in portraitformat.
Move the selected function down the listof functions.
Create a new function.
Adding a New Function
To add a new function to the list:
Click the toolbar button MS Scan, or select the required function from theFunction menu.
Make any changes required to the parameters and press OK to add the newfunction.
Data AcquisitionPage 131
GCTUser's Guide

Setting up a Full Scan Function
The full scan function editor, activated by pressing or by selecting TOF MSfrom the Functions menu, is used to set up centroid, continuum and MCA functions.
Parameter File
This references which tune page parameters to use for the acquisition.
The appropriate instrument tuning parameters should be set up on the tune page, andthen the tune page should be saved from its File menu as a .ipr file.
You can then reference the .ipr file in this dialog by typing in the path and name ofthe calibration file or press the Browse button and locate the required calibration fileusing the Open dialogue.
It is important to make sure that you are using the correct .ipr file here. For good massaccuracy you must use an appropriate calibration file as described later in this chapter.The parameters saved in the .ipr file referenced here should be the same as those usedin the creation of the calibration. Furthermore remember that the Lock Mass isspecified on the tune page and therefore is saved in the .ipr file. If you need to adjustit you must do so on the tune page then save the .ipr file and make sure it isreferenced correctly here.
Mass (m/z)
Start Mass and End Mass specify the masses at which the scan starts and stops.Start Mass must be lower than End Mass.
Time
Start and End specify the retention time in minutes during which this functionbecomes active, and data are acquired.
Data AcquisitionPage 132
GCTUser's Guide
Method
Ionization Mode specifies the ionization mode and polarity to be used duringacquisition.
Scan Duration
Enables setting of the Scan Time and the Inter-Scan Delay
Use Probe Ramping Method
For acquiring data using the solids probe or DCI probe from the sample list theappropriate probe ramping file must be inserted here. The probe ramp is defined fromthe tune page as described in the chapters The Solids Insertion Probe and The DCIProbe.
A ramp can be saved as a .prb file and can then be referenced in this dialogue. Whenthe acquisition is started the probe ramp will be started and will follow the rampdefined in the file.
Modifying an Existing Function
To modify an existing function:
Select the function in the experiment window.
Press , or double click on the function.
This displays the editor for the function and allows changes to be made.
The experiment setup display is updated to show any changes.
Entering a new a value in Total Run Time and pressing sets the maximumretention time for the experiment. The ratio of the functions defined ismaintained. For example, if two functions are defined one from 0 to 5 minutesand the other 5 to 10 minutes then a Total Run Time of 10 minutes isdisplayed. If this value is changed to 20 then the first function now runs from 0to 10 minutes and the second from 10 to 20 minutes.
Copying an Existing Function
To copy an existing function:
Select the function in the experiment window.
Select Copy and then Paste from the Edit menu.
Modify the parameters as described above.
Removing a Function
To remove a function:
Data AcquisitionPage 133
GCTUser's Guide
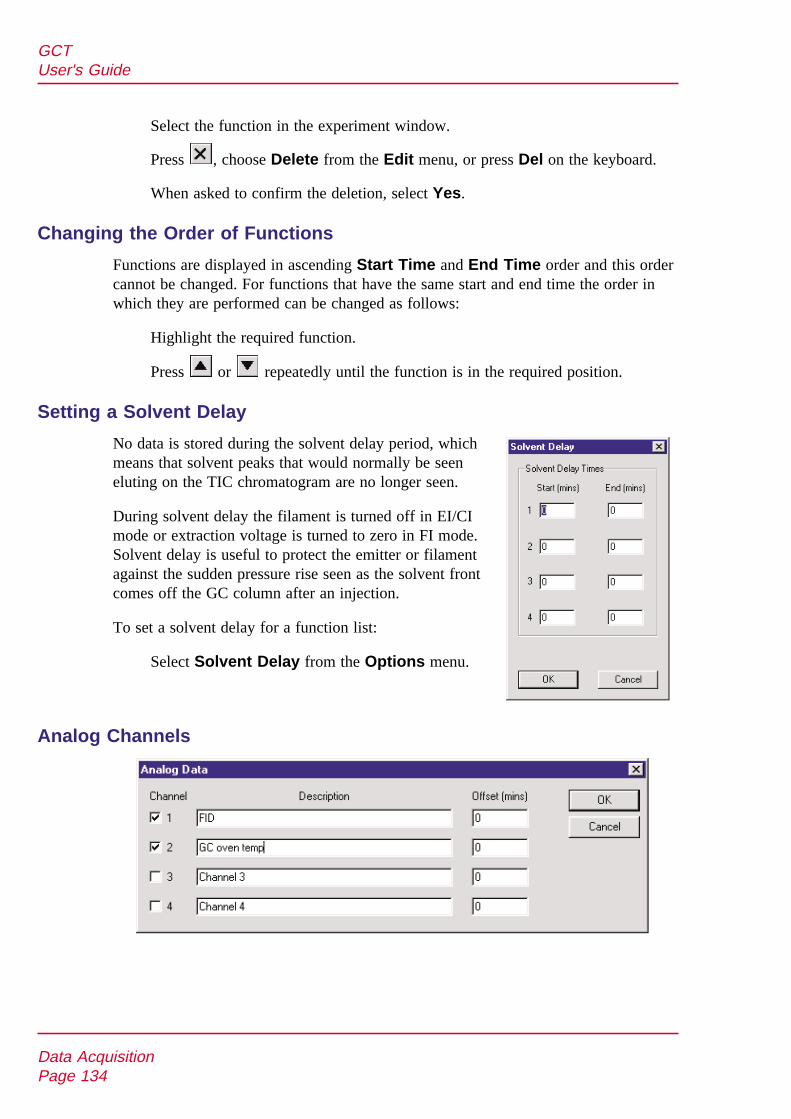
Select the function in the experiment window.
Press , choose Delete from the Edit menu, or press Del on the keyboard.
When asked to confirm the deletion, select Yes.
Changing the Order of Functions
Functions are displayed in ascending Start Time and End Time order and this ordercannot be changed. For functions that have the same start and end time the order inwhich they are performed can be changed as follows:
Highlight the required function.
Press or repeatedly until the function is in the required position.
Setting a Solvent Delay
No data is stored during the solvent delay period, whichmeans that solvent peaks that would normally be seeneluting on the TIC chromatogram are no longer seen.
During solvent delay the filament is turned off in EI/CImode or extraction voltage is turned to zero in FI mode.Solvent delay is useful to protect the emitter or filamentagainst the sudden pressure rise seen as the solvent frontcomes off the GC column after an injection.
To set a solvent delay for a function list:
Select Solvent Delay from the Options menu.
Analog Channels
Data AcquisitionPage 134
GCTUser's Guide
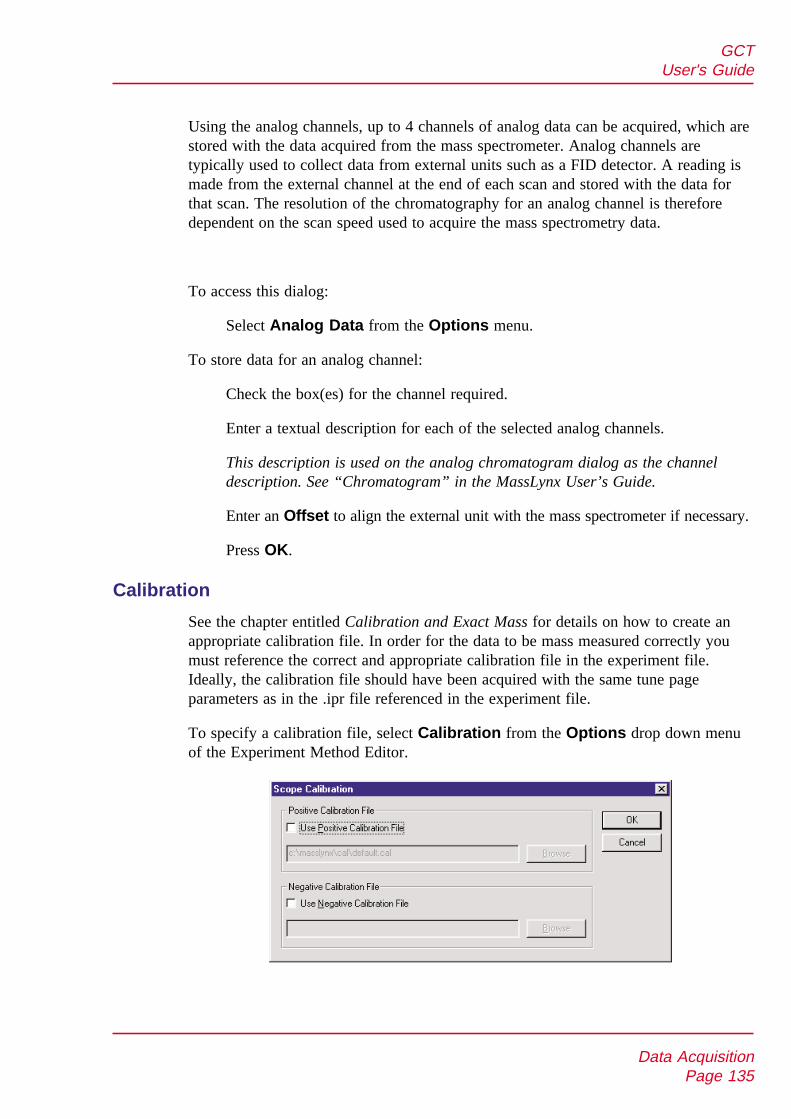
Using the analog channels, up to 4 channels of analog data can be acquired, which arestored with the data acquired from the mass spectrometer. Analog channels aretypically used to collect data from external units such as a FID detector. A reading ismade from the external channel at the end of each scan and stored with the data forthat scan. The resolution of the chromatography for an analog channel is thereforedependent on the scan speed used to acquire the mass spectrometry data.
To access this dialog:
Select Analog Data from the Options menu.
To store data for an analog channel:
Check the box(es) for the channel required.
Enter a textual description for each of the selected analog channels.
This description is used on the analog chromatogram dialog as the channeldescription. See “Chromatogram” in the MassLynx User’s Guide.
Enter an Offset to align the external unit with the mass spectrometer if necessary.
Press OK.
Calibration
See the chapter entitled Calibration and Exact Mass for details on how to create anappropriate calibration file. In order for the data to be mass measured correctly youmust reference the correct and appropriate calibration file in the experiment file.Ideally, the calibration file should have been acquired with the same tune pageparameters as in the .ipr file referenced in the experiment file.
To specify a calibration file, select Calibration from the Options drop down menuof the Experiment Method Editor.
Data AcquisitionPage 135
GCTUser's Guide
To specify the calibration file to be used when acquiring in positive ion mode selectthe Use Positive Calibration File tick box. Either type in the path and name of thecalibration file or press the Browse button and locate the required calibration fileusing the Open dialogue.
To specify the calibration file to be used when acquiring in negative ion mode selectthe Use Negative Calibration File tick box. Either type in the path and name ofthe calibration file or press the Browse button and locate the required calibration fileusing the Open dialogue.
Saving and Restoring an Experiment
To save an experiment:
Choose Save As from the function list File menu.
Enter a new file name, or select an existing file from the list displayed.
Press Save.
If the file already exists on disk, confirmation is requested to overwrite the existinginformation.
Press Yes to overwrite the file, or No to select a different name.
When the editor is closed a prompt is issued to save any changed function lists.
To restore a saved experiment:
Choose Open from the experiment setup window file menu.
Select the name of the experiment to open, either by typing its name or byselecting it from the displayed list.
Press Open.
Starting a Multi-sample Acquisition
To start a multi-sample acquisition:
Set up a sample list.
Choose Start from the top level Run menu, or press .
This displays the start sample list run dialog.
Data AcquisitionPage 136
GCTUser's Guide

Check the Acquire Sample Data, Auto Process Samples andAuto Quantify Samples boxes as required.
Enter values in the Run From Sample and To Sample boxes.
The default is all samples in the list.
Check the Priority and/or Night Time Process boxes as required.
See the “Getting Started” chapter of the MassLynx manual for details.
Press OK.
Repeat the above procedure as required.
Sample lists are added to a queue and run sequentially unless Priority orNight Time Process has been checked.
The sample which is currently being acquired has a next to it in the samplelist.
Process
The process controls allow processes to be run before and after the acquisition. ThePre-Run control is used to specify the name of a process that is run beforeacquisition of the files in the sample list.
The Post-Run control is used to specify the name of a process which is run afteracquisition of the files in the sample list. This could be used, for example, to switchthe instrument out of operate and to switch off various gases.
To run a process after each sample in the sample list has been acquired:
Format the sample list to display the Process column and enter the name of theprocess to be run for each of the samples.
Data AcquisitionPage 137
GCTUser's Guide

For the process to automatically operate on the data file which has just been acquired:
Leave unchecked Use Acquired File as Default on the System tab of theMassLynx Options dialog.
The MassLynx Options dialog is accessed by choosing Options from theMassLynx Tools menu.
An Example of Automated Analysis of Sample List
To display the quantify samples dialog:
Select Process Samples from the Quantify menu. Check the boxes requiredand press OK.
Quantify Samples
This dialog allows automatic processing of data files once they have been acquired.To perform integration, calibration of standards, quantification of samples and printingof quantification reports select the relevant check boxes. See Quantify, MassLynx UserGuide, for more detailed information about using automated sample list analysis.
Integrate Samples
Integrates all the sample data files named in the peak list.
Calibrate Standards
Uses integration results to form quantify calibration curves.
Quantify Samples
Uses integration results and quantify calibration curves to calculate compoundconcentrations.
Data AcquisitionPage 138
GCTUser's Guide
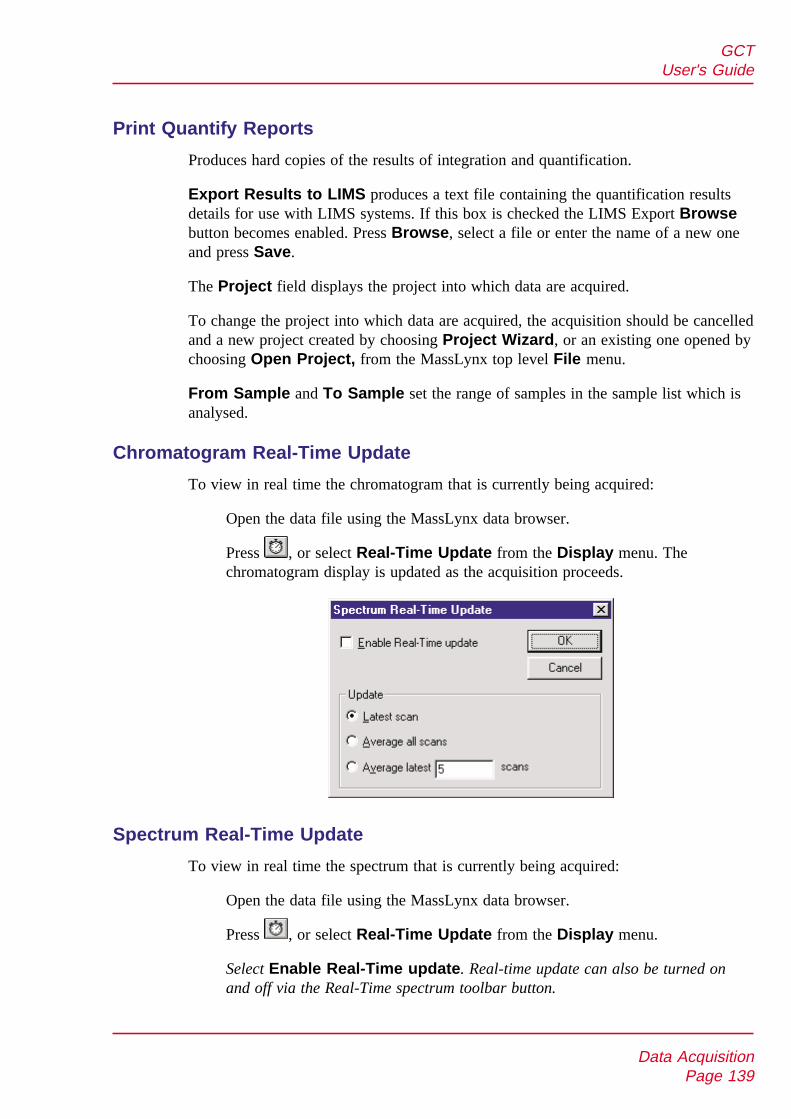
Print Quantify Reports
Produces hard copies of the results of integration and quantification.
Export Results to LIMS produces a text file containing the quantification resultsdetails for use with LIMS systems. If this box is checked the LIMS Export Browsebutton becomes enabled. Press Browse, select a file or enter the name of a new oneand press Save.
The Project field displays the project into which data are acquired.
To change the project into which data are acquired, the acquisition should be cancelledand a new project created by choosing Project Wizard, or an existing one opened bychoosing Open Project, from the MassLynx top level File menu.
From Sample and To Sample set the range of samples in the sample list which isanalysed.
Chromatogram Real-Time Update
To view in real time the chromatogram that is currently being acquired:
Open the data file using the MassLynx data browser.
Press , or select Real-Time Update from the Display menu. Thechromatogram display is updated as the acquisition proceeds.
Spectrum Real-Time Update
To view in real time the spectrum that is currently being acquired:
Open the data file using the MassLynx data browser.
Press , or select Real-Time Update from the Display menu.
Select Enable Real-Time update. Real-time update can also be turned onand off via the Real-Time spectrum toolbar button.
Data AcquisitionPage 139
GCTUser's Guide
When real-time update is on the display is continually updated with spectra from thecurrent acquisition. The actual information displayed is determined by selecting one ofthe following radio buttons.
• Latest scan
Displays the last acquired scan. This is the default option.
• Average all scans
Updates the display with spectra formed by averaging all the spectra that have so farbeen acquired.
• Average latest scans
Updates the display with spectra formed by averaging the last n scans acquired, wheren is specified in the associated edit control.
Stopping an Acquisition
To halt the acquisition:
From the tune page, press the Stop icon .
From the MassLynx screen choose Stop from the Run menu, or press .
Data acquired up to this point is saved.
Automatic Startup and Shutdown
MassLynx comes with automatic Startup and Shutdown files. They are found in theC:\MassLynx\Shutdown directory and are called ShutDownxxx.acl and StartUpxxx.aclwhere xxx refers to the instrument configuration. E.g. ShutDownESI_ACE.acl for aninstrument configured as an ACE system.
When Startup or Shutdown is selected from the MassLynx Run menu it is thesefiles which are run.
The Shutdown Editor
The shutdown editor, shown below, allows the automatic startup and shutdownprocedures to be modified or new procedures to be created. To access the editor,select Edit Shutdown from the MassLynx Run menu.
Data AcquisitionPage 140
GCTUser's Guide
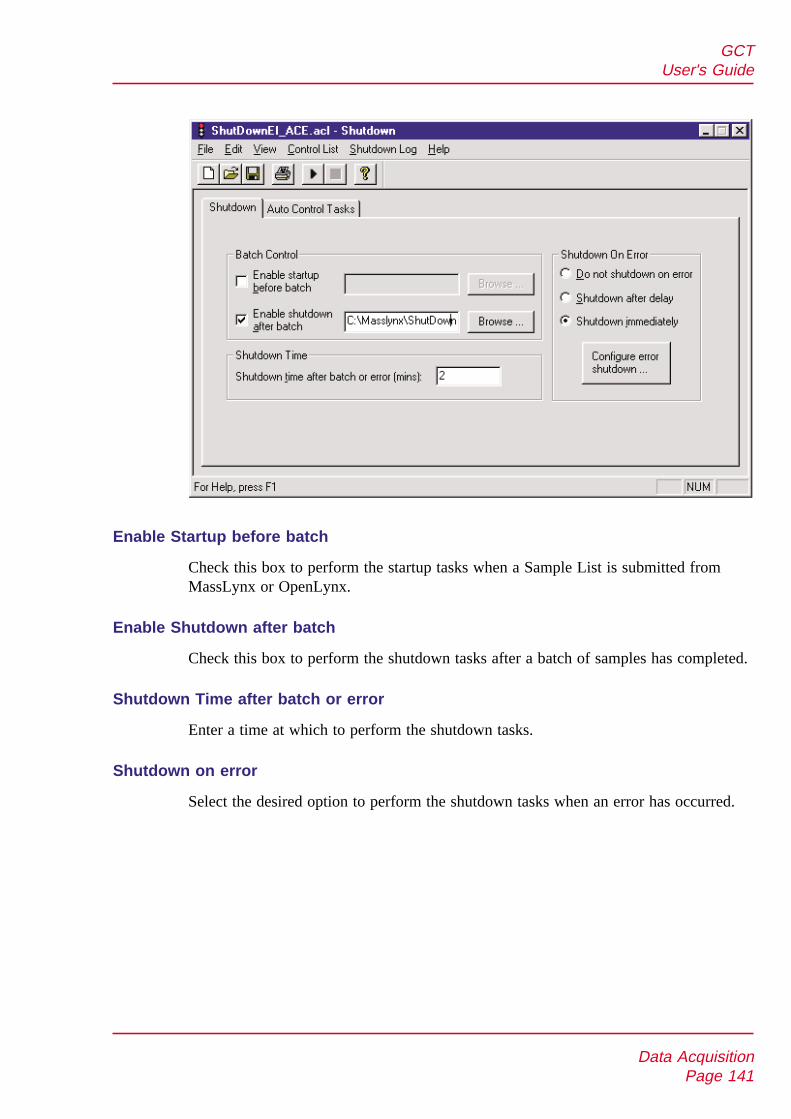
Enable Startup before batch
Check this box to perform the startup tasks when a Sample List is submitted fromMassLynx or OpenLynx.
Enable Shutdown after batch
Check this box to perform the shutdown tasks after a batch of samples has completed.
Shutdown Time after batch or error
Enter a time at which to perform the shutdown tasks.
Shutdown on error
Select the desired option to perform the shutdown tasks when an error has occurred.
Data AcquisitionPage 141
GCTUser's Guide

The Auto Control Tasks Page
Task
This is a dropdown list box with all the available tasks.
Pre-Delay
This is the length of time that will elapse before the current task is performed.
Post-Delay
This is the length of time that will elapse after the current task has been completedand before the next task is started. E.g. a Post delay of 60s, in the Tune File taskabove, means that there will be a delay of 60 seconds before the next task is started, toallow the machine to stabilise with the new tune page settings.
Ion Mode
This is a dropdown list box with all the available ionisation modes.
File Name
This is the name of the Tune file to be used. The file name can be typed in, including
the full path name, or selected from the browser displayed when
the button is pressed.
Data AcquisitionPage 142
GCTUser's Guide
To Add a Task
Select a task from the dropdown Task list box.
Enter the required parameters.
Press the add button.
If this is a new task timetable the task will be added to the end of the list. If a taskhas been inserted into the task timetable then all subsequent tasks will be added afterthe inserted task.
To add a task to the end of the timetable after inserting a task,
Click twice with the left mouse button below the last entry in the timetable andthen add the new task.
To Insert a Task
Click, with the left mouse button, on the entry in the task timetable before whichyou want to insert the new task.
Select a task from the dropdown Task list box.
Enter the required parameters.
Press the add button. The task will be inserted before the selected entry.
To Modify a Task
Click, with the left mouse button, on the entry in the task timetable. The detailsfor the task will be displayed in the fields on the left of the screen.
Change the required parameters.
Press the modify button. The details will change in the task timetable.
To Delete a Task
Click, with the left mouse button, on the entry in the task timetable. The detailsfor the task will be displayed in the fields on the left of the screen.
Press the button. The task selected will be deleted from the task timetable.
To Delete All Tasks
Press the button. All tasks will be deleted from the task timetable.
Data AcquisitionPage 143
GCTUser's Guide
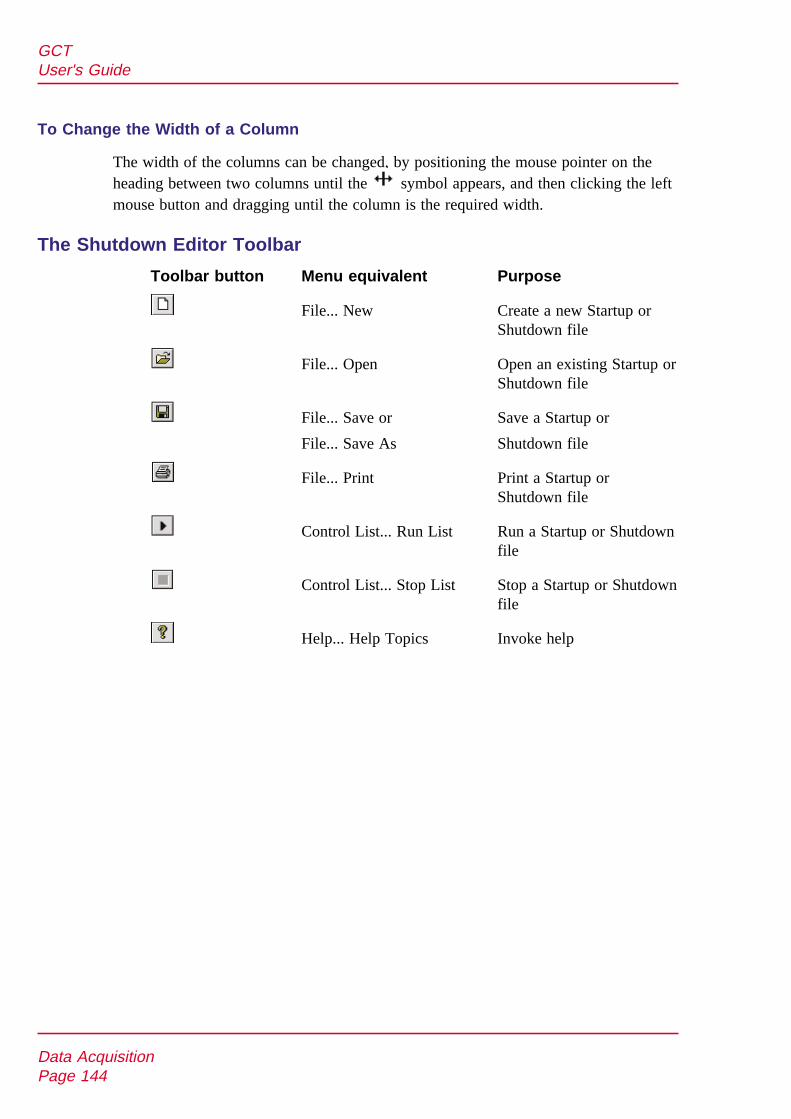
To Change the Width of a Column
The width of the columns can be changed, by positioning the mouse pointer on theheading between two columns until the symbol appears, and then clicking the leftmouse button and dragging until the column is the required width.
The Shutdown Editor Toolbar
Toolbar button Menu equivalent Purpose
File... New Create a new Startup orShutdown file
File... Open Open an existing Startup orShutdown file
File... Save or Save a Startup or
File... Save As Shutdown file
File... Print Print a Startup orShutdown file
Control List... Run List Run a Startup or Shutdownfile
Control List... Stop List Stop a Startup or Shutdownfile
Help... Help Topics Invoke help
Data AcquisitionPage 144
GCTUser's Guide
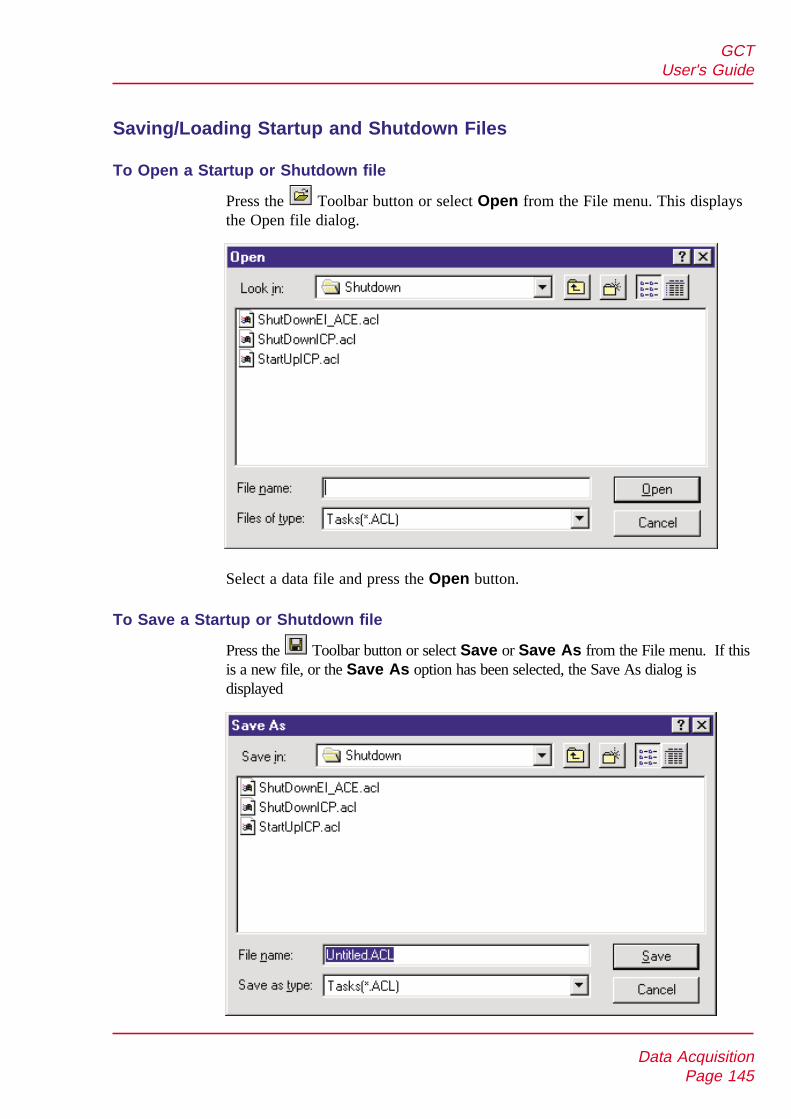
Saving/Loading Startup and Shutdown Files
To Open a Startup or Shutdown file
Press the Toolbar button or select Open from the File menu. This displaysthe Open file dialog.
Select a data file and press the Open button.
To Save a Startup or Shutdown file
Press the Toolbar button or select Save or Save As from the File menu. If thisis a new file, or the Save As option has been selected, the Save As dialog isdisplayed
Data AcquisitionPage 145
GCTUser's Guide
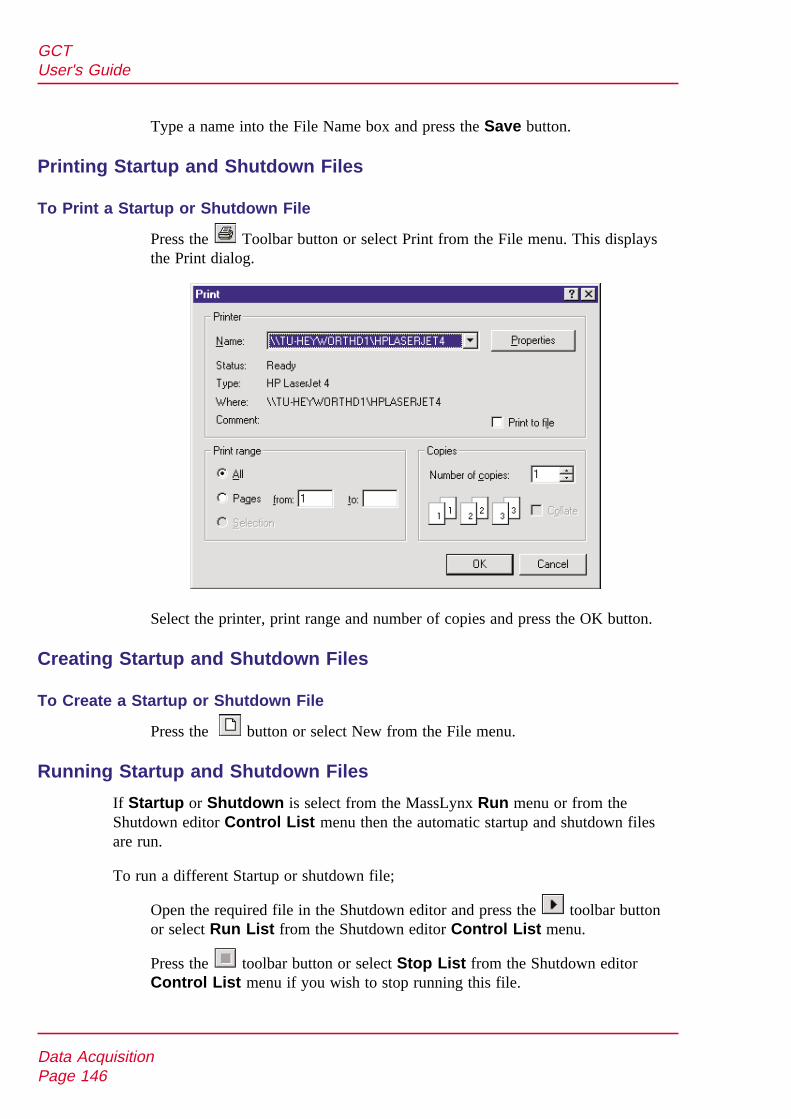
Type a name into the File Name box and press the Save button.
Printing Startup and Shutdown Files
To Print a Startup or Shutdown File
Press the Toolbar button or select Print from the File menu. This displaysthe Print dialog.
Select the printer, print range and number of copies and press the OK button.
Creating Startup and Shutdown Files
To Create a Startup or Shutdown File
Press the button or select New from the File menu.
Running Startup and Shutdown Files
If Startup or Shutdown is select from the MassLynx Run menu or from theShutdown editor Control List menu then the automatic startup and shutdown filesare run.
To run a different Startup or shutdown file;
Open the required file in the Shutdown editor and press the toolbar buttonor select Run List from the Shutdown editor Control List menu.
Press the toolbar button or select Stop List from the Shutdown editorControl List menu if you wish to stop running this file.
Data AcquisitionPage 146
GCTUser's Guide

Calibration and Exact MassIntroduction
The elevated resolution and inherent stability of the calibration law of orthogonal TOFinstruments allow accurate mass measurements to be performed. The basic time offlight to mass relationship is of the form
= Q + Pt
where
the term P represents the resultant gain from the instrument geometry(pathlengths and voltages).
Q is an offset, arising from propagation delays through the electronics(detector rise time and delays of trigger signals through cables).
If a data file is acquired from the instrument with no calibration applied then it isassumed that the offset is zero and the gain P is calculated from the instrumentgeometry.
It is important that the gain is set up to give at least nominal mass accuracy. Nominalmass measurement is achieved on the GCT by adjustment of the Lteff and Vefffactors which appear in the OPTIONS/TDC SETTINGS menu accessed from theGCT Tuning page.
Calibration and Exact MassPage 147
GCTUser's Guide

Nominal Mass Accuracy
It is important that the pathlengths are set up to give at least nominal mass accuracy.Nominal mass measurement is achieved on the GCT by adjustment of the Lteff factor.
Acquire a TOF spectrum of a standard compound is acquired with Lteff set toits default value of 1195.
Calculate a new value of Lteff from the relation:
Lteff = 1195 (m ) m )ind act÷ (
where:
mind = indicated m/z
mact = actual m/z
Enter this new value under TDC Parameters.
After switching the real time tune display off and on, all subsequent massmeasurements will be nominally correct(within ± 0.5).
With no calibration applied the data displayed on the spectrum in MassLynx is just aset of mass intensity pairs Mn,In based upon instrument geometry. Because of theinherent relationship between mass and time shown above it is prudent to generatehigher order calibration coefficients that are applied to the square root of the nominalmasses Mn i.e.
The terms A,B,C,D…. are calculated by fitting a polynomial to acquired mass spectraldata and Mc is the calibrated displayed mass. If a polynomial of order 1 is requestedthe values for A & B are calculated and the higher terms are set to zero. With apolynomial of order 5 (the highest supported in MassLynx) there will be six termsgenerated.
Normally a first order calibration should be generated for the GCT. If a higher orderpolynomial calibration is used it is important to be aware that the calibration may notextrapolate beyond the highest value used for generating the calibration.
Once a calibration has been generated from a reference compound such as Tristrifluoromethyltriazine, it should be used as an “instrument calibration” to be appliedto all subsequently acquired data.
Calibration and Exact MassPage 148
GCTUser's Guide
Mc=A+B Mn + CMn + DMn +.....3/2

Temperature variations in the environment and power supplies may cause theinstrument to drift hundreds of ppm over the course of a day. In order to compensatefor the change in lab temperature the GCT uses Dynamic External Calibration(DXC)to stabilise the mass drift. When performing accurate mass work it is advisable to keepthe instrument in operate at all times so that the power supplies can stabilise.
However, the isolation valve should be closed and the filament current set to zero ifthe system is to be left unattended, to extend the lifetime of the MCP detector andfilament.
Instrument drift can be compensated for by applying a single point lock masscorrection that recalculates term B in the above equation. The lock mass reference isintroduced via the reference reservoir.
The data acquisition system for the instrument is a Time to Digital Converter (TDC).This is an ion counting type of system that generates a mass spectrum by storingarrival times of ions in a histogram memory. After the arrival and detection of an ionby the TDC there is a minimum time interval before a subsequent ion arrival can beregistered. This is called the “Dead Time” of the TDC and is of the order of 5ns.
The consequence of this dead time is that at high ion currents a proportion of the ionsgenerated are not registered leading to a shift to lower mass centroids and lower areason reported peaks.
There is dead time correction software in MassLynx that allows accurate massmeasurements to be achieved at a larger range of ion currents than otherwise wouldhave been possible.
The use of this software correction is in the following section.
Calibration and Exact MassPage 149
GCTUser's Guide

Generation of an Instrument Calibration EI+ OperationIntroduce 0.2µl of tris (trifluoromethyl) triazine via the reference reservoir.
Initially set the Centroiding parameters as shown below in the TDC settingsmenu, with the Lteff and Trigger/Signal threshold set as described in the relevantsection in this manual.
Resolution reflects the base resolution FWHM of the system at 614 ofHeptacosa. This defines the peak width at a given mass in ns and is used to calculatethe probability of peak distortion due to ion arrivals at a given ion current within thedead time of the TDC.
Np is a factor applied to the calculated number of individual pushout events whichoccurred within a single spectral duration. This value can be adjusted to apply thedead time correction to the best possible effect for a given system.
Ensure that no calibration file is selected in the acquisition parameters from themenu below.
Acquire data over the range 10-800 Da, in real time centroid mode with aspectral time of 0.9 second and a delay between spectra of 0.1s.
The data acquired should not be too intense or deadtime distortion will occur. Tocheck that the signal is not too intense select a single spectrum from thechromatogram.
Calibration and Exact MassPage 150
GCTUser's Guide
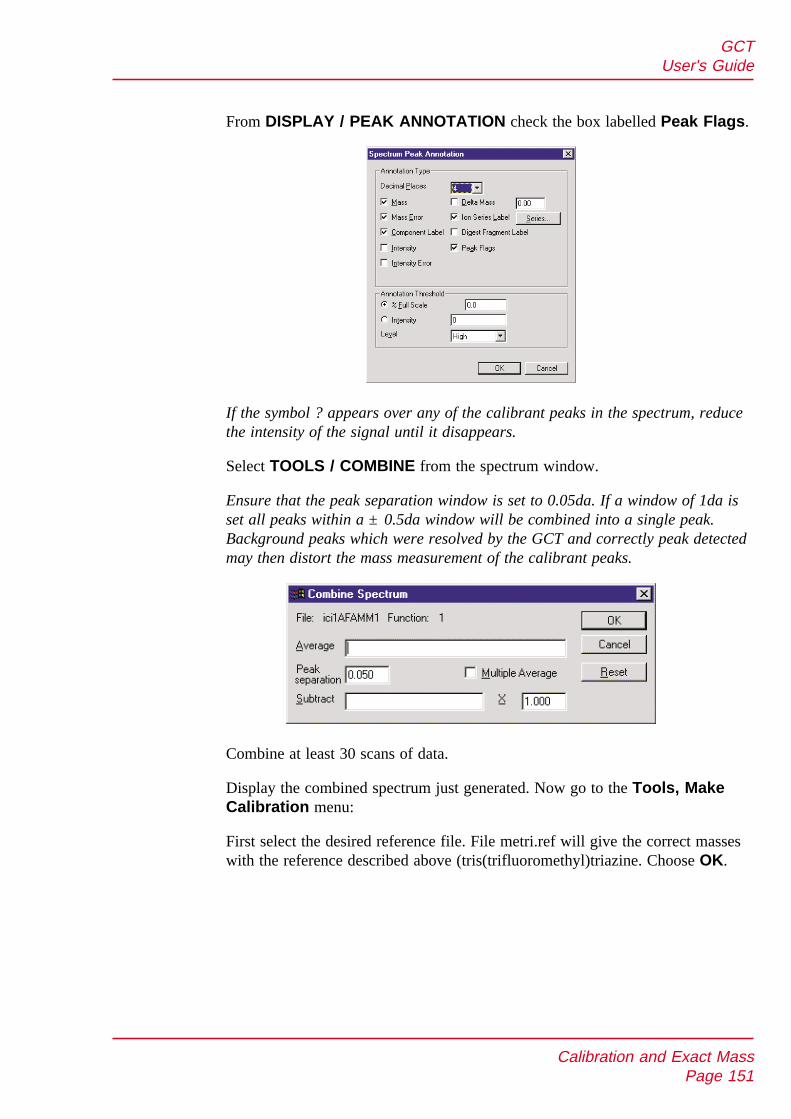
From DISPLAY / PEAK ANNOTATION check the box labelled Peak Flags.
If the symbol ? appears over any of the calibrant peaks in the spectrum, reducethe intensity of the signal until it disappears.
Select TOOLS / COMBINE from the spectrum window.
Ensure that the peak separation window is set to 0.05da. If a window of 1da isset all peaks within a ± 0.5da window will be combined into a single peak.Background peaks which were resolved by the GCT and correctly peak detectedmay then distort the mass measurement of the calibrant peaks.
Combine at least 30 scans of data.
Display the combined spectrum just generated. Now go to the Tools, MakeCalibration menu:
First select the desired reference file. File metri.ref will give the correct masseswith the reference described above (tris(trifluoromethyl)triazine. Choose OK.
Calibration and Exact MassPage 151
GCTUser's Guide

Make sure that the residual errors are all less than about 2mDa. The calibrationparameters can be altered by clicking on Edit to reveal the menu below:
Calibration and Exact MassPage 152
GCTUser's Guide

After these parameters have been set, click on OK to regenerate the calibrationwith the new parameters if required.
Note that peaks may be excluded from the calibration curve by de-selecting themwith a right mouse click in the reference file spectrum followed by a right clickon the data file spectrum at the top of the window.
Effects of Saturation on Peak Shape
The peak shape will characteristically change as saturation of the TDC results inincreasing numbers of ions not to be detected.
At the onset of saturation the peak will shift a little to lower mass followed by afailure to increase in recorded intensity as the ion signal continues to increase. Therewill then be a sudden, sharp high mass cut off and finally the detector will appear to‘ring’, causing a secondary peak to appear on the high mass side of the peak ofinterest.
The diagram below represents the characteristic transition from unsaturated signal tosaturated signal, which would be seen when tuning using the real time peak display incontinuum mode.
Because the recorded intensity of the saturating ions will appear to reach a constantvalue it is important to be able to recognise the onset of saturation by the change inpeak shape and position.
Calibration and Exact MassPage 153
GCTUser's Guide

The effect of deadtime saturation on centroid determination is to shift the measuredmass to a lower value than calculated from the empirical formula. In the residuals boxfrom the calibration, insufficient deadtime correction would be reflected by asystematic shift of the largest ions in the spectrum (those with the highest degree ofdead time saturation) to a position below the line of best fit compared to the smallerions in the spectrum (those with the least degree of dead time saturation). If there istoo much dead time correction applied the converse will be true.
Calibration and Exact MassPage 154
GCTUser's Guide
C, D, E - saturated peaks. Notethe shift to lower mass, peaknarrowing and sharp cut-off.Display E shows secondarypeak due to saturation
A, B - peaks withindynamic range.
A
B
C
D
E
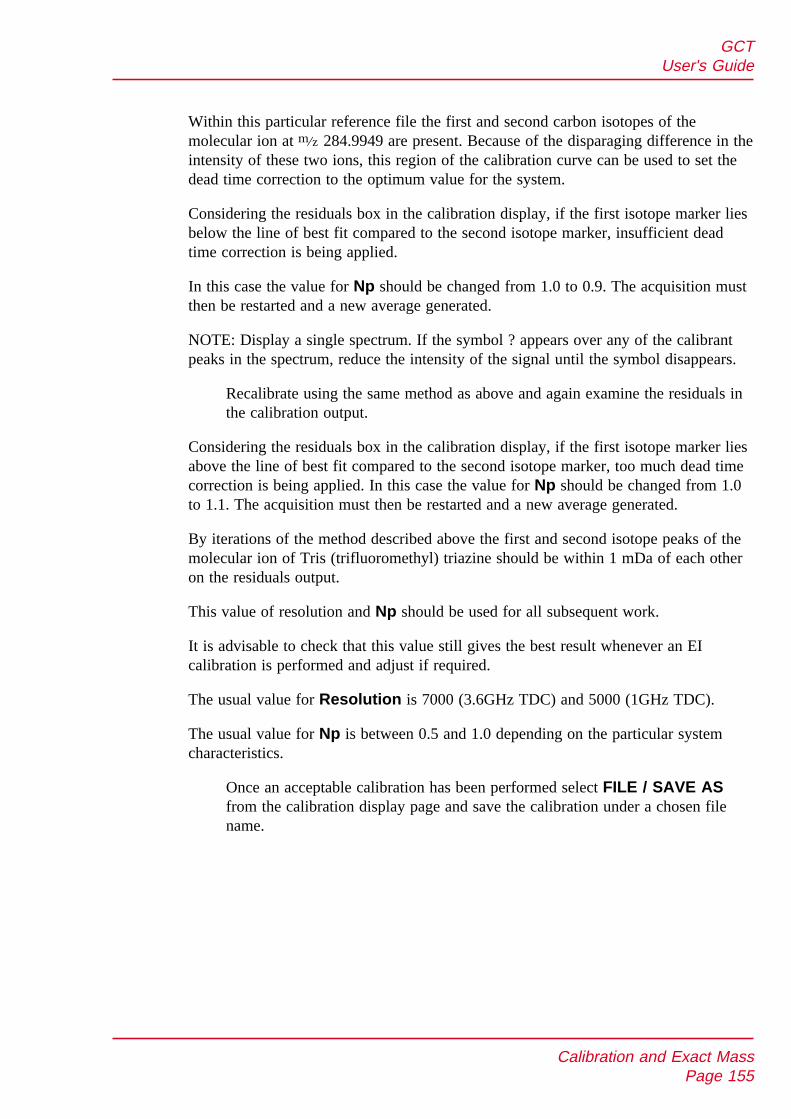
Within this particular reference file the first and second carbon isotopes of themolecular ion at 284.9949 are present. Because of the disparaging difference in theintensity of these two ions, this region of the calibration curve can be used to set thedead time correction to the optimum value for the system.
Considering the residuals box in the calibration display, if the first isotope marker liesbelow the line of best fit compared to the second isotope marker, insufficient deadtime correction is being applied.
In this case the value for Np should be changed from 1.0 to 0.9. The acquisition mustthen be restarted and a new average generated.
NOTE: Display a single spectrum. If the symbol ? appears over any of the calibrantpeaks in the spectrum, reduce the intensity of the signal until the symbol disappears.
Recalibrate using the same method as above and again examine the residuals inthe calibration output.
Considering the residuals box in the calibration display, if the first isotope marker liesabove the line of best fit compared to the second isotope marker, too much dead timecorrection is being applied. In this case the value for Np should be changed from 1.0to 1.1. The acquisition must then be restarted and a new average generated.
By iterations of the method described above the first and second isotope peaks of themolecular ion of Tris (trifluoromethyl) triazine should be within 1 mDa of each otheron the residuals output.
This value of resolution and Np should be used for all subsequent work.
It is advisable to check that this value still gives the best result whenever an EIcalibration is performed and adjust if required.
The usual value for Resolution is 7000 (3.6GHz TDC) and 5000 (1GHz TDC).
The usual value for Np is between 0.5 and 1.0 depending on the particular systemcharacteristics.
Once an acceptable calibration has been performed select FILE / SAVE ASfrom the calibration display page and save the calibration under a chosen filename.
Calibration and Exact MassPage 155
GCTUser's Guide
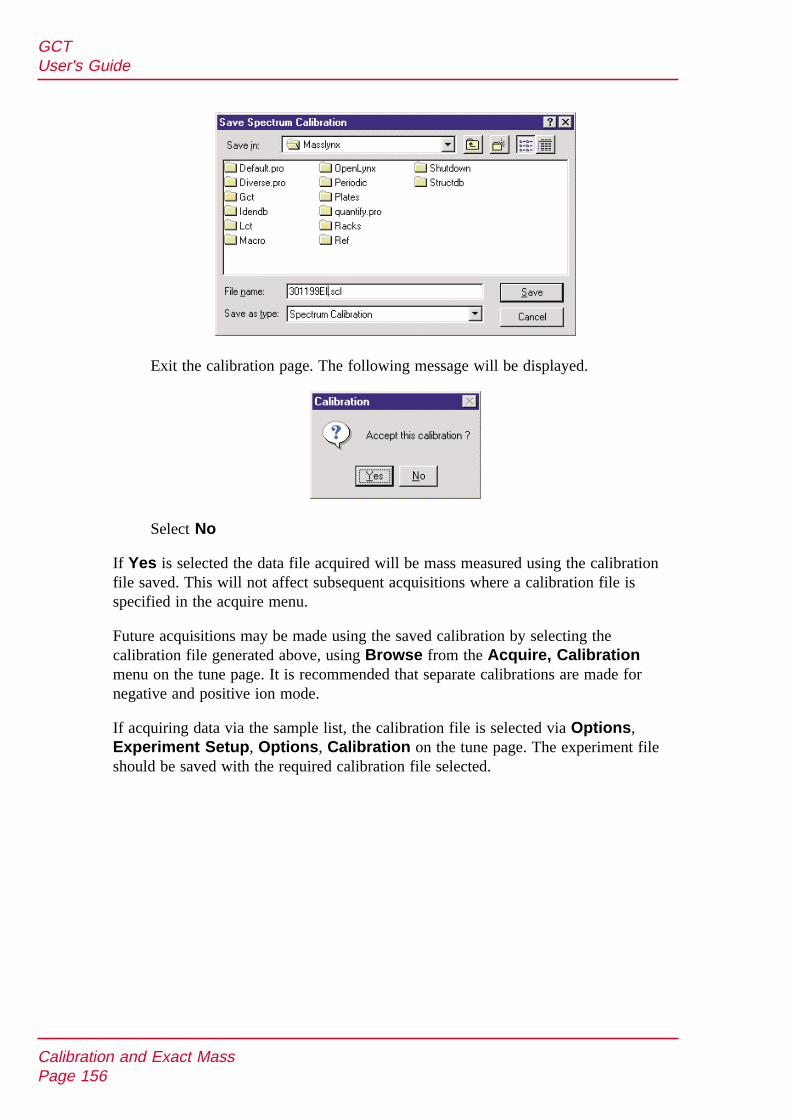
Exit the calibration page. The following message will be displayed.
Select No
If Yes is selected the data file acquired will be mass measured using the calibrationfile saved. This will not affect subsequent acquisitions where a calibration file isspecified in the acquire menu.
Future acquisitions may be made using the saved calibration by selecting thecalibration file generated above, using Browse from the Acquire, Calibrationmenu on the tune page. It is recommended that separate calibrations are made fornegative and positive ion mode.
If acquiring data via the sample list, the calibration file is selected via Options,Experiment Setup, Options, Calibration on the tune page. The experiment fileshould be saved with the required calibration file selected.
Calibration and Exact MassPage 156
GCTUser's Guide

Calibration and Accurate Mass in FI ModeBecause the spectra produced in FI mode are usually very simple, often exhibitingonly molecular ion information, a mixture of volatile compounds must be used toinitially characterise the time to square root of mass relationship. The following listshows the compounds and their relative amount by volume to produce a suitablecalibration mixture.
Compound Name % By Volume Expected Masses
Heptacosa (PFTBA) 20 501.9711,68.9952
Perfluorotrimethylcyclohexane 70 380.9760,68.9952
Hexafluorobenzene 2 185.9998
Pentafluorobenzene 2 167.9998
Acetone 1 58.0419
Chloropentafluorobenzene 2 201.9609
Xylene 2 106.0783
These proportions may be adjusted to produce a more balanced spectra ifrequired. The sample should be kept in a sealed vial, out of direct light and in acool place. The very volatile components (Acetone) may decrease in proportionto the less volatile components over time.
The perflorinated compounds suggested may be purchased from Fluorochem Ltd.(http://www.fluorochem.co.uk).
Approximately 10 - 15µl of this calibration mixture should be introduced and asuitable number of scans averaged to produce a calibration.
Optimisation of FI CalibrationThe spectra produced from the calibration mixture above contains fragment ions fromsome of the compounds in the mixture as well as molecular ions. The fragment ionsform at a slightly different time and hence position with respect to the emitter than dothe molecular ions.
Because of the very high potential gradient between the emitter and the extraction rodsthe fragment ions have a slightly different resultant axial energy entering the pushoutregion than the molecular ions. This results in some ions within the calibrationresiduals appearing below or above the line of best fit.
These differences can be minimised by small adjustments in the Pusher Bias voltagein the Engineers page.
Acquire data from the calibrant mixture and examine the residuals produced. If 502 from heptacosa is below the line of best fit reduce the Pusher Biasby 0.2V. Repeat the calibration experiment using different values of PusherBias until the calibration residuals are within 2 - 3 mDa. A second ordercalibration may be necessary.
Difficulty in producing an acceptable calibration may indicate excessiveextraction rod contamination. The rods should be cleaned.
Calibration and Exact MassPage 157
GCTUser's Guide
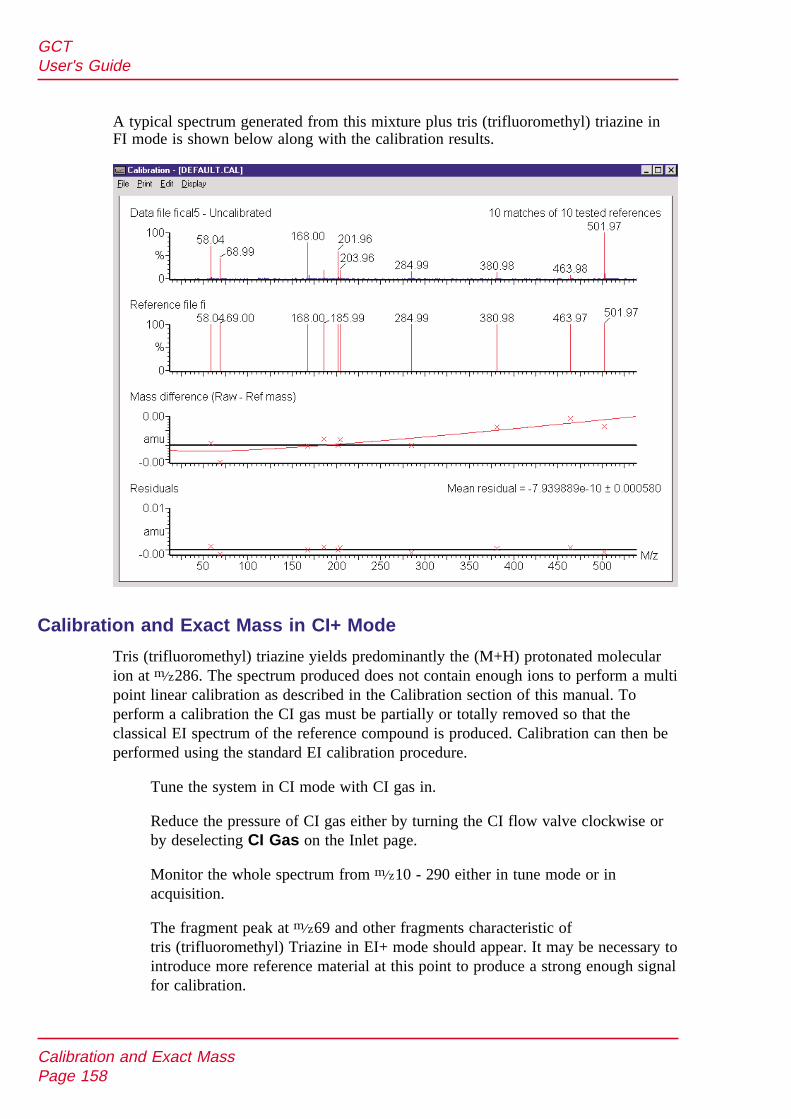
A typical spectrum generated from this mixture plus tris (trifluoromethyl) triazine inFI mode is shown below along with the calibration results.
Calibration and Exact Mass in CI+ Mode
Tris (trifluoromethyl) triazine yields predominantly the (M+H) protonated molecularion at 286. The spectrum produced does not contain enough ions to perform a multipoint linear calibration as described in the Calibration section of this manual. Toperform a calibration the CI gas must be partially or totally removed so that theclassical EI spectrum of the reference compound is produced. Calibration can then beperformed using the standard EI calibration procedure.
Tune the system in CI mode with CI gas in.
Reduce the pressure of CI gas either by turning the CI flow valve clockwise orby deselecting CI Gas on the Inlet page.
Monitor the whole spectrum from 10 - 290 either in tune mode or inacquisition.
The fragment peak at 69 and other fragments characteristic oftris (trifluoromethyl) Triazine in EI+ mode should appear. It may be necessary tointroduce more reference material at this point to produce a strong enough signalfor calibration.
Calibration and Exact MassPage 158
GCTUser's Guide

Follow the calibration procedure as described in the chapter Calibration andExact Mass and use the Metri reference file. Note the C13 isotope of the M+ ionat 286 will be interfered with by the residual (M+H)+ ion at 286. Thisshould be removed from the calibration output before accepting the calibration.
Once a calibration has been accepted reintroduce CI gas and adjust the level ofthe reference.
The (M+H)+ ion at 286.0027 may be used as the internal reference for CI+accurate mass experiments.
See the section Lock Mass Correction in the chapter entitled Calibration andExact Mass later in this manual.
Calibration in CI - Ion Mode of Operation
A multi point calibration can be performed using the Heptaneg calibration file withHeptacosa introduced via the reference reservoir.
Follow the procedure outlined for EI operation in the section dealing withcalibration. Use the value of resolution and Np determined in EI operation fordead time correction.
Heptacosa is not a suitable material to use for as an internal reference for lock masscorrection as it contains too many ions, which could interfere with sample peakscausing mass measurement errors.
To perform a lock mass correction:
Pump away the Heptacosa and introduce 0.2µl of chloropentafluorobenzeneC6F5Cl. This compound yields an intense -ve ion at 201.9609 which can beused for lock mass correction.
See the section Additional hints for performing exact Mass Measurement in thechapter entitled Calibration and Exact Mass for setting the level of the lockmass compound during acquisition.
DXC Temperature Compensation
In order to compensate for the change in lab temperature the GCT uses DynamicExternal Calibration (DXC) which can be activated from the TDC Parameters page.This shifts the mass by a specified amount in ppm/degree. Typical values for theppm/degree drift compensation constant is 40-80 ppm/degree, and will have beenfactory set for your specific instrument. This value should be retained.
In order to derive the value for yourself, the following procedure can be followed.
• Acquire data on a reference compound such as heptacosa without using DXC,lock mass or a calibration file.
Calibration and Exact MassPage 159
GCTUser's Guide
• Display a spectrum of the summed data. On the header display 'Temp correction'from the 'Spectrum QTOF' group. This will show the temperature of theinstrument.
• Repeat the same acquisition later in the day under the same conditions when thelab temperature has changed by up to 3°C.
• Display both spectra. From the difference in mass and the difference intemperature the drift constant may be calculated in ppm/°C.
The temperature compensation is only applied when the acquisition is performed usinga calibration file. The software records the temperature at which it was calibrated, thenapplies the ppm/degree value according to the measured temperature on eachspectrum.
For instruments with Serial Number <CA072 DXC (if fitted) is connected externally.For these instruments, on the TDC Settings page, the box 'Power Port 2' must bechecked to activate Event 2 to power the device.
Using DXC mass accuracy of <10ppm RMS may be generally achieved for < 3°Ctemperature drift.
If more reliable mass accuracy is required or the instrument is subject to a temperaturevariation of >3°C, then a lock mass can be used.
Lock Mass CorrectionTo produce accurately mass measured data to within 5ppm, compensations must bemade for instrument drift resulting from internal factors other than ambienttemperature changes.
This is achieved using a single lock mass peak from an internal reference compoundintroduced via the septum. This single peak is used on a spectrum to spectrum basis toadjust the calibration applied to individual spectra. The result is a complete accuratelymass measured data set.
In EI + operation 284.9949 from Tris (trifluoromethyl)triazine is used as aninternal lock mass.
The lock mass is specified from the OPTIONS / TDC SETTINGS menu in the GCTtune page.
Calibration and Exact MassPage 160
GCTUser's Guide

A Mass Window of 0.3mDa is usually sufficient for the system to locate the lockmass peak desired prior to adjusting the mass measurement.
Additional Hints for Performing Exact MassMeasurements
As all measurements are made with respect to the internal lock mass peak it isimportant to maintain the best possible statistics for the measurement of this peak. Forthis to be achieved, the intensity of the lock mass peak should be adjusted to be justbelow the point where the peak saturation flag is present. At 1sec acquisition at apusher interval of 40µs the centroided lock mass peak should contain between3000 and 8000 ions in total.
Always be aware of possible chemical interference problems - either on thesample or the lock mass peak.
If the limits of the deadtime correction algorithm are exceeded (indicated by thepresence of the saturation flag on the peak top in a single spectrum) it may be possibleto use the C13 or other relevant isotopes.
The standard deviation in the determination of the mass centroid of a triangular-shapedpeak (sppm) due to ion statistics alone is given by equation 1 below:
where DM is the width () of the a triangular peak across the base.
M is the value of the peak.
N is the total number of ions in the peak.
Calibration and Exact MassPage 161
GCTUser's Guide
NM
DMsppm
×××=24
106

The final standard deviation of the mass centroid in an exact mass experiment usingthe GCT is governed by the statistics of the analyte peak measured and the internallock mass peak used for drift correction.
The final standard deviation SD is given by equation 2:
where SD = final standard deviation of the measurement
SppmAnalyte = standard deviation of the centroid measurement for theanalyte.
SppmLock = standard deviation of the centroid measurement for theinternal lock mass.
From these two equations the necessity for a good statistical measurement of the lockmass centroid is evident to produce a good measurement for the centroid of theanalyte.
For example; for 95% (2 standard deviations) of the measurements for an analyte peakat 500, resolution 5000 FWHM (DM = 0.2), to be within 5ppm, the final standarddeviation, SD needs to be 2.5ppm.
Assuming that the lock mass peak at 285 contains 5000 ions and has a resolution of5000 FWHM (DM = 0.114 da), the standard deviation for the lock mass peak alone is
= 1.15 ppm.
From equation 2,
Rearranging this equation to determine N for the analyte peak,
N = 1353 ions per peak.
Calibration and Exact MassPage 162
GCTUser's Guide
) ) )) 22
26
15.15.2
1
24500
102.0
−×
××=N
2
26
15.124500
102.05.2 +
×××=
N) ) ))
N285
0.114sppmLock
×××=24
106
) )) ) 22sppm Lockesppm AnalytSD +=

Maintenance and Fault FindingIntroduction
Cleanliness and care are of the utmost importance whenever internal assemblies areremoved from the instrument.
Always prepare a clear clean area in which to work.
Make sure that any tools or spare parts that may be required are close at hand.
Obtain some small containers in which screws, washers, spacers etc. can bestored.
Use tweezers and pliers whenever possible.
Do not use rubber gloves.
If nylon or cotton gloves are used take care not to leave fibres in sensitive areas.
Avoid touching sensitive parts with fingers.
Before reassembling and replacing dismantled components, inspect O rings and othervacuum seals for damage. If in doubt replace with new parts. Should a fault occursoon after a particular part of the system has been repaired or otherwise disturbed, it isadvisable first of all to ensure that this part has been correctly refitted and / oradjusted and that adjacent components have not been inadvertently disturbed.
Warning: Many of the procedures described in this chapter involve the removal ofpossibly toxic contaminating deposits using flammable or caustic agents. Personnelperforming these operations should be aware of the inherent risks, and take thenecessary precautions.
Maintenance and Fault FindingPage 163
GCTUser's Guide

Removal and Replacement of Panels and Cover
Right Hand Side Panel
Viewing the instrument from the front, remove the reference reservoir top cover,which rests on top of the moulded cover.
Remove the two retaining screws from the bottom of the right hand side panel.Loosen the two captive retaining screws at the back of the panel.
Pull the panel forward and tilt as shown below, so that the cut-out in the top ofthe panel clears the reference reservoir pump-out knob.
Maintenance and Fault FindingPage 164
GCTUser's Guide

Left Hand Side Panel
Viewing the instrument from the left-hand side, remove the two retaining screwsfrom the bottom of the left hand side panel. Pull the panel forward to remove it.
Cooling Fans and Air FiltersAlways ensure that none of the cooling fans are obstructed. It is essential that the fanfilter is checked and cleaned at regular intervals, and replaced if there is any doubtabout its effectiveness.
The Vacuum SystemThe performance of the mass spectrometer will be severely impaired by the lack of agood vacuum in the source or analyser region.
An excessive source pressure results in shortened filament life time and high low massbackground.
As the vacuum deteriorates, the vacuum becomes insufficient to maintain theinstrument in the operate mode.
Before suspecting a leak, the following points should be noted:
If the rotary pump is not maintained, the oil may become so contaminated thatoptimum pumping speed is no longer possible. Initially, gas ballasting may clean theoil. If the oil in the rotary pump has become discoloured, then it should be changedaccording to the pump manufacturer’s maintenance manual.
Maintenance and Fault FindingPage 165
GCTUser's Guide

The turbomolecular pumps switch off if an over temperature is detected. This could bedue to poor backing vacuum, failure of the water supply or a leak in the source oranalyser.
The turbomolecular pumps switch off if full speed is not achieved within a set timefollowing start-up. This could be due to a leak or too high an ambient temperature.
The source and analyser backing isolation valves require a compressed air supply ofbetween 80 - 100psi to operate. If this supply fails the backing valves may close. Thebacking pressure will rise and the turbomolecular pumps may over temperature orslow to below operating speed. This will result in automatic venting of the source andor the analyser housing.
Vacuum Leaks
If a leak is suspected, the following basic points may help to locate it:
Leaks very rarely develop on an instrument that has been fully operational. Suspectcomponents that have recently been disturbed.
Leaks on flanges can usually be cured by further tightening of the flange bolts or byreplacing the seal.
All seals are made using O rings. When refitting flanges pay attention to the conditionof O rings. Any that are cut or marked may cause a leak. The O rings should be cleanand free from foreign matter.
A hair across an O ring is sufficient to prevent the instrument pumping down. In theunlikely event of a leak on a feedthrough, then the unit should be replaced or returnedto Micromass for repair.
Pirani Gauge
The Pirani gauge head does not normally require routine maintenance.
Active Inverted Magnetron Gauge
For information on cleaning the active inverted magnetron (Penning) gauge, refer tothe Edwards literature supplied with the instrument.
Gas Ballasting
Caution: Failure to gas ballast the rotary pump frequently leads to shortened oillifetime which in turn may shorten rotary pump lifetime.
Caution: Under no circumstances should gas ballasting be performed duringinstrument operation.
Maintenance and Fault FindingPage 166
GCTUser's Guide
Open the gas ballast knob on top of the rotary pump for 10 - 30 mins once per week.This draws air through the pump oil to help drive condensed solvents out of the oil.This is to ensure that the oil in the rotary pump is kept as clean as possible. Thefrequency of ballasting may need to be increased if CI has been performed on aregular basis.
It is normal for the rotary pump to make more noise when the gas ballast valve isopen.
Oil Mist Filter
The rotary pump is fitted with an Edwards EMF20 oil mist filter which traps oilvapour from the rotary pump exhaust. The oil mist filter contains two elements whichrequire the following maintenance:
Change the odour element quarterly or whenever the pump emits an oily odour.
Change the mist element every time the rotary pump oil is changed.
To change the elements follow the instructions in the Edwards manual supplied in theauxiliary equipment documentation folder.
Rotary Pump Oil
The oil in the rotary pump should be maintained at the correct level at all times.
Check the oil level at weekly intervals, topping up if necessary.
It is important to monitor the condition of the oil regularly. Replace the oil when it haschanged to a noticeable reddish brown colour, or routinely at 4 month intervals (3000hours operation). At the same time, replace the oil mist filter’s mist element (seeabove).
Change the oil in the rotary pump as follows:
Gas ballast lightly for 30 to 60 minutes.
Vent and shut down the instrument as described in the chapter entitled RoutineProcedures earlier in this manual.
It is easier to drain the oil while the pump is still warm.
Drain the oil through the drain hole situated near the oil level sight glass.
Flush the pump, then replace the drain plug and refill the pump with the correct gradeoil to the correct level.
Gas ballast lightly for 30 to 60 minutes.
For further servicing information refer to the manufacturer’s manual.
Maintenance and Fault FindingPage 167
GCTUser's Guide

Foreline Trap Maintenance
The head of the rotary pump is fitted with a foreline trap which prevents oil vapourfrom entering the backing lines and contaminating the instrument vacuum system.
The activated alumina absorbent in the fore line trap should be replaced every three tosix months. This should be done at the same time as changing the rotary pump oil, inaccordance with the manufacturer's literature supplied.
Reference Reservoir Interface Maintenance
Replacing the Fused Silica Leak
Caution: Risk of burns. The interface may be hot.
Although predominantly volatile compounds are used in conjunction with thereference reservoir, it is possible for the fused silica leak within the interface tobecome partially or fully blocked after extended periods of use.
Partial blockage of the interface usually results in unstable delivery of the referencematerial. This is exhibited by erratic behaviour of the TIC when monitoring thereference material. It may be possible to clear a blockage by introduction of puresolvents into the reference reservoir.
With the reference reservoir pump valve closed introduce 10µl of a suitablesolvent. Acetone, Dichloromethane etc. Wait for 30 seconds then open thereference reservoir pump valve to remove the solvent. If this fails then the fusedsilica within the transfer line should be replaced by following the procedurebelow.
Maintenance and Fault FindingPage 168
GCTUser's Guide
L
LIFT
Insulating Block andRetaining Screw
Septum Nut Heater Connectionon Reverse
KF 10 Pumping LineFitting
Double Ferrule
Septum RetainingScrew
Fused Silica Leak
Special 1/16 Nut
1/16 Steel Capillary
The diagram above shows the reference reservoir partially removed to access the fusedsilica leak.
Isolate the source housing. Vent to atmosphere.
If fitted with an Autosampler tray, move the GC away from the system on itsrolling plinth. The GC column need not be disconnected if there is enoughcolumn length within the GC to allow the GC to be withdrawn.
Remove the right hand side moulded cover.
Disconnect the reference reservoir pump line by removing the KF 10 clamp andO ring.
Disconnect the reservoir heater lead at the rear of the reservoir.
Remove the reference reservoir transfer line insulation retaining screw andremove the insulation block to expose the reservoir to re-entrant coupling.
Unscrew the special 1/16" nut and push it to the bottom of the steel capillaryline to expose the double ferrule.
Loosen the retaining screws on the front and rear reference reservoir mountingpillars.
Lift the whole interface clear of the retaining pillars.
The top 10 - 15 mm of the fused silica will be exposed above the double ferrule.
Remove the double ferrule and withdraw the fused silica from the steel capillary.
It may be possible to reuse the double ferrule if the fused silica can be easilywithdrawn. It is recommended that the ferrule be replaced at this point.
Cut a length of new fused silica approximately 20cm long. This fused silica is320µm OD x 75µm ID. Feed the fused silica into the steel capillary until itmeets resistance. The capillary will not easily pass within the steel capillary atthe point where the steel capillary is bent inside the source housing.
Thread the new double ferrule over the protruding fused silica and make surethat the 1/16" opening end passes over the end of the steel capillary as far as itcan.
Cut the protruding fused silica so that 10 - 15mm of fused silica remains abovethe double ferrule. This will ensure that the fused silica can be withdrawn at alater date.
Replace the reference reservoir ensuring that the double ferrule lines up with thefitting on the reservoir and that the protruding fused silica passes inside thisfitting.
Maintenance and Fault FindingPage 169
GCTUser's Guide
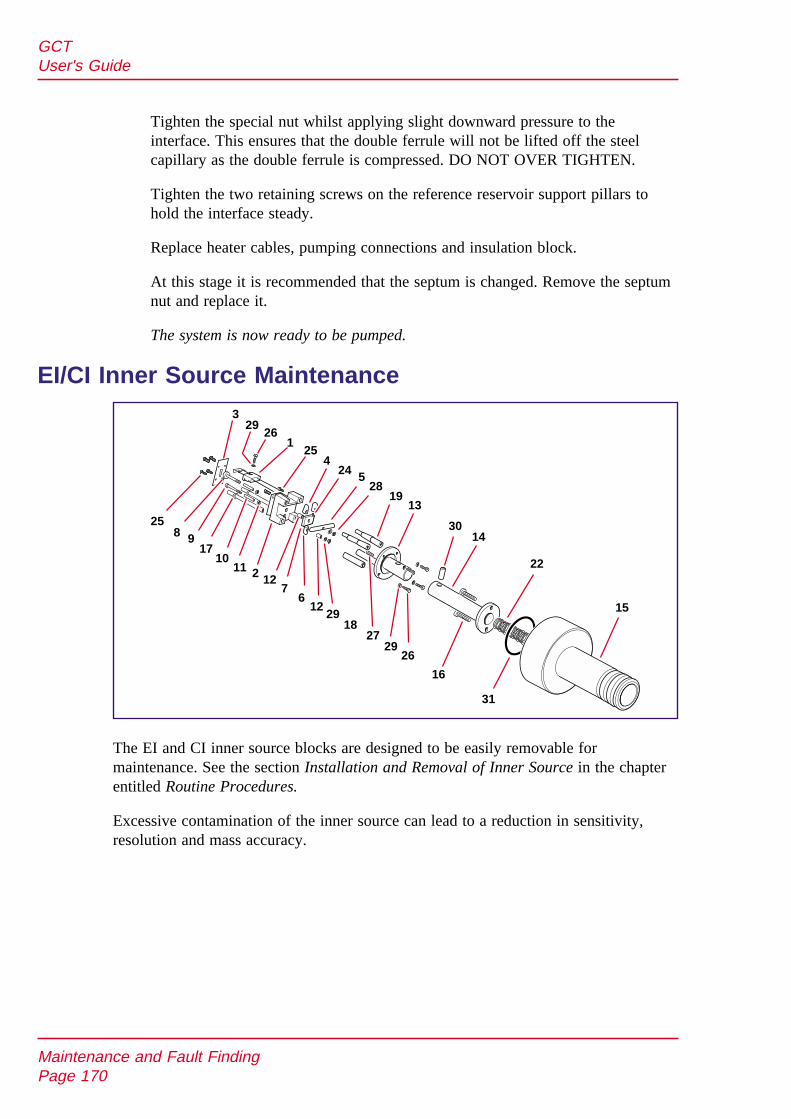
Tighten the special nut whilst applying slight downward pressure to theinterface. This ensures that the double ferrule will not be lifted off the steelcapillary as the double ferrule is compressed. DO NOT OVER TIGHTEN.
Tighten the two retaining screws on the reference reservoir support pillars tohold the interface steady.
Replace heater cables, pumping connections and insulation block.
At this stage it is recommended that the septum is changed. Remove the septumnut and replace it.
The system is now ready to be pumped.
EI/CI Inner Source Maintenance
The EI and CI inner source blocks are designed to be easily removable formaintenance. See the section Installation and Removal of Inner Source in the chapterentitled Routine Procedures.
Excessive contamination of the inner source can lead to a reduction in sensitivity,resolution and mass accuracy.
Maintenance and Fault FindingPage 170
GCTUser's Guide
329
261
254
24 528
13
3014
22
31
16
2629
2718
296
2
98
7
1011
12
12
17
19
25
15
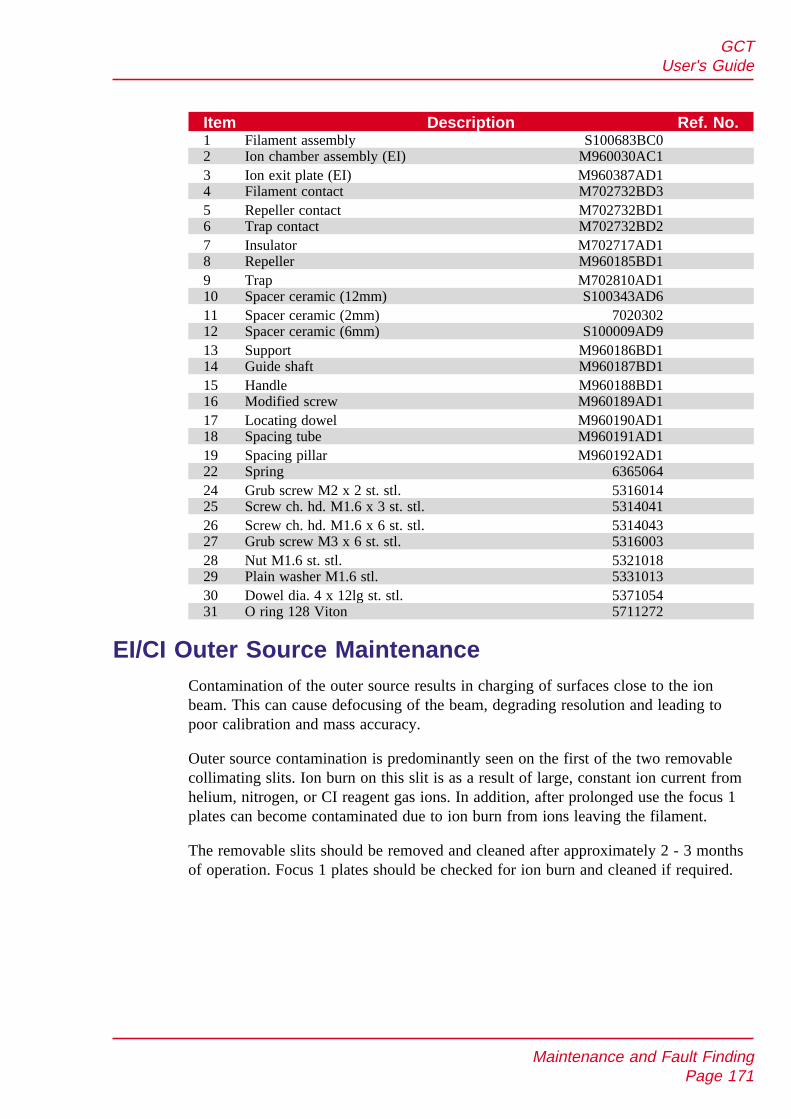
Item Description Ref. No.1 Filament assembly S100683BC02 Ion chamber assembly (EI) M960030AC13 Ion exit plate (EI) M960387AD14 Filament contact M702732BD35 Repeller contact M702732BD16 Trap contact M702732BD27 Insulator M702717AD18 Repeller M960185BD19 Trap M702810AD110 Spacer ceramic (12mm) S100343AD611 Spacer ceramic (2mm) 702030212 Spacer ceramic (6mm) S100009AD913 Support M960186BD114 Guide shaft M960187BD115 Handle M960188BD116 Modified screw M960189AD117 Locating dowel M960190AD118 Spacing tube M960191AD119 Spacing pillar M960192AD122 Spring 636506424 Grub screw M2 x 2 st. stl. 531601425 Screw ch. hd. M1.6 x 3 st. stl. 531404126 Screw ch. hd. M1.6 x 6 st. stl. 531404327 Grub screw M3 x 6 st. stl. 531600328 Nut M1.6 st. stl. 532101829 Plain washer M1.6 stl. 533101330 Dowel dia. 4 x 12lg st. stl. 537105431 O ring 128 Viton 5711272
EI/CI Outer Source MaintenanceContamination of the outer source results in charging of surfaces close to the ionbeam. This can cause defocusing of the beam, degrading resolution and leading topoor calibration and mass accuracy.
Outer source contamination is predominantly seen on the first of the two removablecollimating slits. Ion burn on this slit is as a result of large, constant ion current fromhelium, nitrogen, or CI reagent gas ions. In addition, after prolonged use the focus 1plates can become contaminated due to ion burn from ions leaving the filament.
The removable slits should be removed and cleaned after approximately 2 - 3 monthsof operation. Focus 1 plates should be checked for ion burn and cleaned if required.
Maintenance and Fault FindingPage 171
GCTUser's Guide
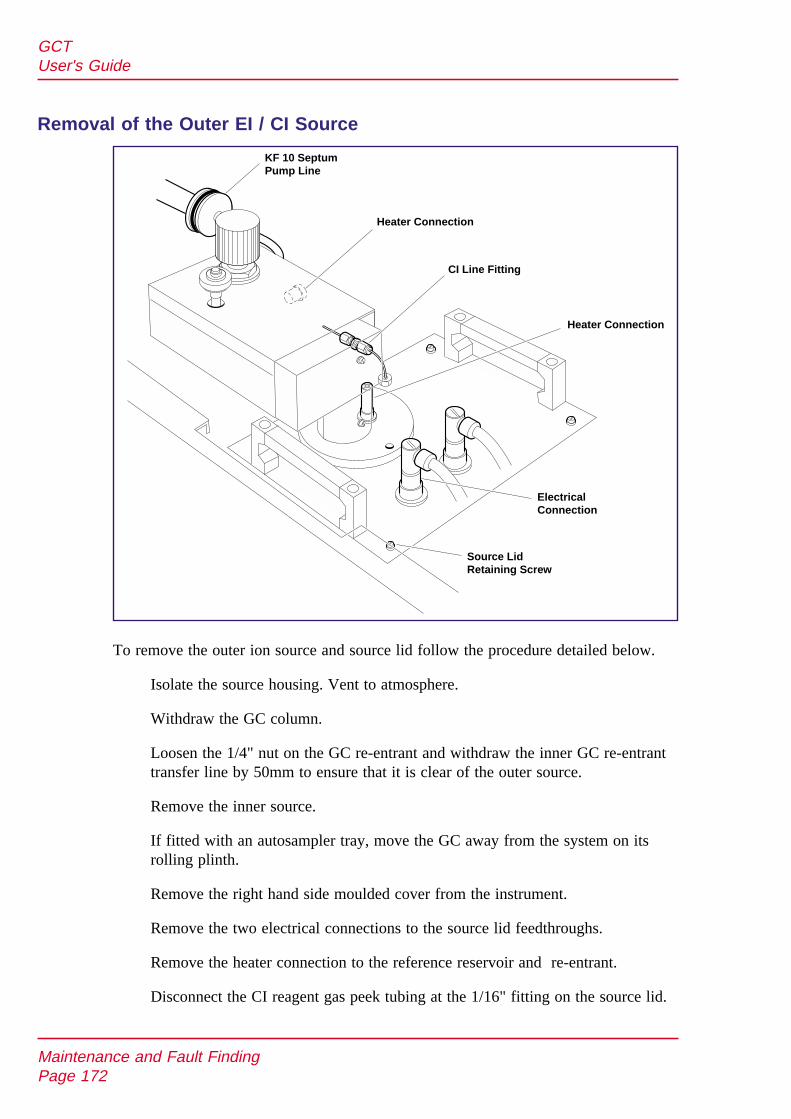
Removal of the Outer EI / CI Source
To remove the outer ion source and source lid follow the procedure detailed below.
Isolate the source housing. Vent to atmosphere.
Withdraw the GC column.
Loosen the 1/4" nut on the GC re-entrant and withdraw the inner GC re-entranttransfer line by 50mm to ensure that it is clear of the outer source.
Remove the inner source.
If fitted with an autosampler tray, move the GC away from the system on itsrolling plinth.
Remove the right hand side moulded cover from the instrument.
Remove the two electrical connections to the source lid feedthroughs.
Remove the heater connection to the reference reservoir and re-entrant.
Disconnect the CI reagent gas peek tubing at the 1/16" fitting on the source lid.
Maintenance and Fault FindingPage 172
GCTUser's Guide
ElectricalConnection
Source LidRetaining Screw
Heater Connection
CI Line Fitting
Heater Connection
KF 10 SeptumPump Line

Disconnect the reference reservoir pump line by removing the KF 10 clamp andO ring.
Remove the four, source lid retaining screws.
Lift off the source lid and outer source.
Maintenance and Fault FindingPage 173
GCTUser's Guide
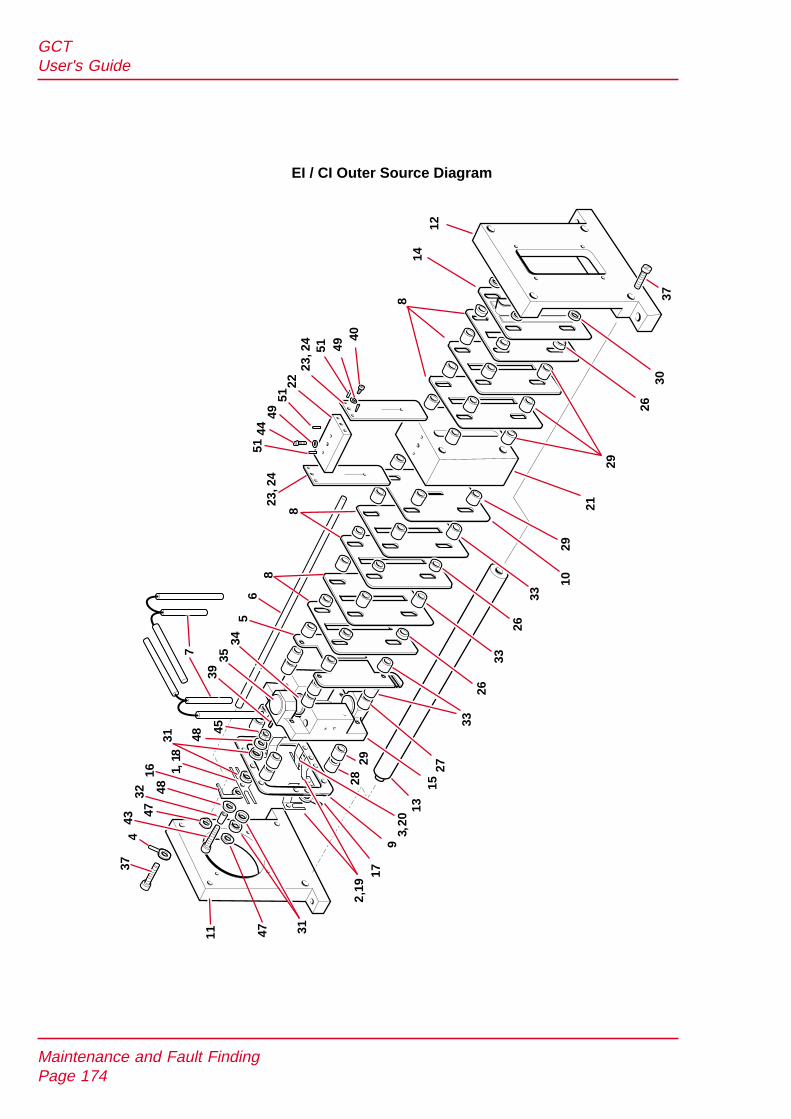
Maintenance and Fault FindingPage 174
GCTUser's Guide
2 ,19
179
3,20
1527
13
3326
26
26
29
21
10
33
33
29
3037
1214
8
8
86
4049
4944
51
51
51
23, 2
4
23, 2
4
22
11
374
47
47
4332 48
16 1,18
31
31
48
4539
7 3534
5
2829
EI / CI Outer Source Diagram

EI / CI Outer Source Parts List
Item Description Ref. No.1 Contact M702972AD12 Contact(3 off) M702739AD2
3 Contact M702739AD14 Terminal Washer M702807AD1
5 Focus. 1 Half Plate (3 gap) M702808BD16 Ceramic Rod (102) M960336AD1
7 Heater Assembly M960023AC18 Focus No.2-3 Plate M960252BD1
9 Contact Support Plate M702716BD110 Aperture Plate M960155BD1
11 Support Plate M960159CD112 Support Plate M960161CD1
13 Pillar M960162AD114 Exit Plate M960165AC1
15 Ion Chamber (Outer) M960167CD116 Contact Washer M960168BD1
17 Terminal Washer M960169AD118 Spring Contact M960170BD1
19 Spring Contact M960171BD120 Spring Contact M960172BD1
21 Lens Block M960286CD122 Slit Plate Support M960287AD1
23 Slit Plate (0.25) M960288AD224 Slit Plate (0.5) M960288AD3
26 Metal Spacer (2) 702010427 Metal Spacer (4.7) 7020170
28 Metal Spacer (7) 702010329 Metal Spacer (5) 7020135
30 Insulating Spacer (1) 702030131 Insulating Spacer (2) 7020302
32 Insulating Spacer (3.5) 702436433 Insulating Spacer (5) S100009AD5
34 Magnet Cap 702491235 Source Magnet 7028106
37 Screw Ch. Hd. M3 x 12 st. stl. 531406939 Grub Screw M3 x 4 st. stl. 5316005
40 Screw Ch. Hd. M2 x 3 st. stl. 531404841 Screw Ch. Hd. M1.6 x 3 st. stl. 5314041
42 Screw Ch. Hd. M1.6 x 5 st. stl. 531404243 Screw Csk. Hd. M1.6 x 8 st. stl. 5311040
44 Screw Ch. Hd. M2 x 8 st. stl. 531404845 Nut M1.6 st. stl. 5314065
47 Washer M3 st. stl. Wavy 533500548 Washer M1.6 st. stl. Plain 5331013
49 Washer M2 st. stl. Plain 533101451 Dowel dia.2 x 6 st. stl. 5371002
Maintenance and Fault FindingPage 175
GCTUser's Guide
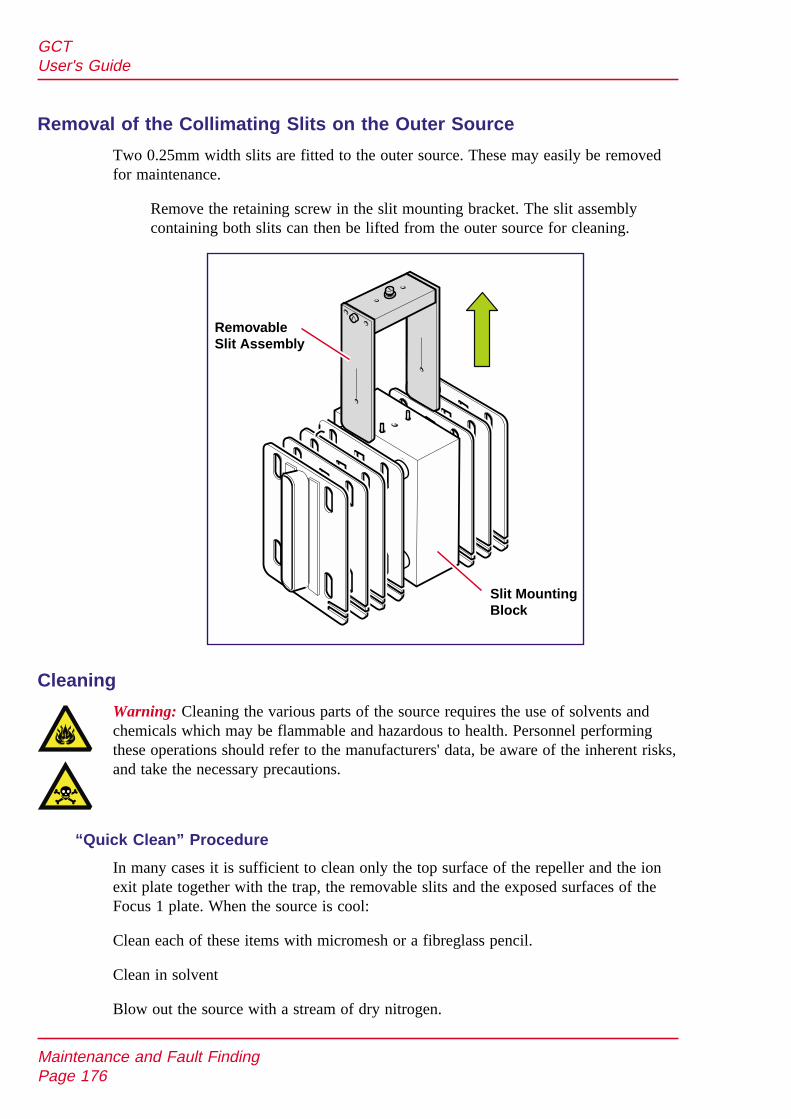
Removal of the Collimating Slits on the Outer Source
Two 0.25mm width slits are fitted to the outer source. These may easily be removedfor maintenance.
Remove the retaining screw in the slit mounting bracket. The slit assemblycontaining both slits can then be lifted from the outer source for cleaning.
Cleaning
Warning: Cleaning the various parts of the source requires the use of solvents andchemicals which may be flammable and hazardous to health. Personnel performingthese operations should refer to the manufacturers' data, be aware of the inherent risks,and take the necessary precautions.
“Quick Clean” Procedure
In many cases it is sufficient to clean only the top surface of the repeller and the ionexit plate together with the trap, the removable slits and the exposed surfaces of theFocus 1 plate. When the source is cool:
Clean each of these items with micromesh or a fibreglass pencil.
Clean in solvent
Blow out the source with a stream of dry nitrogen.
Maintenance and Fault FindingPage 176
GCTUser's Guide
RemovableSlit Assembly
Slit MountingBlock
Full Clean Procedure
Before proceeding to clean the source components refer to the general guidelines inthe section Cleaning Materials below.
Identify the following components for cleaning:
Outer Source
• Focus 1 plates• Collimating slits
Inner Source
• Repeller• Trap• Ion exit plate• Ion volume
Clean each item with a fine abrasive as detailed below.
Clean by washing with a suitable solvent, as detailed below.
Dry in an oven.
Cleaning Materials
It is important when cleaning internal components to maintain the quality of thesurface finish. Deep scratches or pits can cause loss of performance. Where nospecific cleaning procedure is given, fine abrasives should be used to remove dirt frommetal components. Recommended abrasives are:
600 and 1200 grade wet/dry paper.
Lapping paper (produced by 3M).
After cleaning with abrasives it is necessary to wash all metal components in suitablesolvents to remove all traces of grease and oil. The recommended procedure is tosonicate the components in a clean beaker of solvent and subsequently to blot themdry with lint-free tissue. Recommended solvents are:
Isopropyl Alcohol (IPA)
Methanol
Acetone
Following re-assembly, components should be blown with oil-free nitrogen to removedust particles.
Maintenance and Fault FindingPage 177
GCTUser's Guide

Warning: Clean panels with a damp cloth. Use of excessive amounts of water orsolvents near to the electronics units can present a safety hazard.
Furthermore, many of the procedures described in this chapter involve the removal ofpossibly toxic contaminating deposits using flammable or caustic agents. Personnelperforming these operations should be aware of the inherent risks, and should take thenecessary precautions.
Maintenance and Fault FindingPage 178
GCTUser's Guide
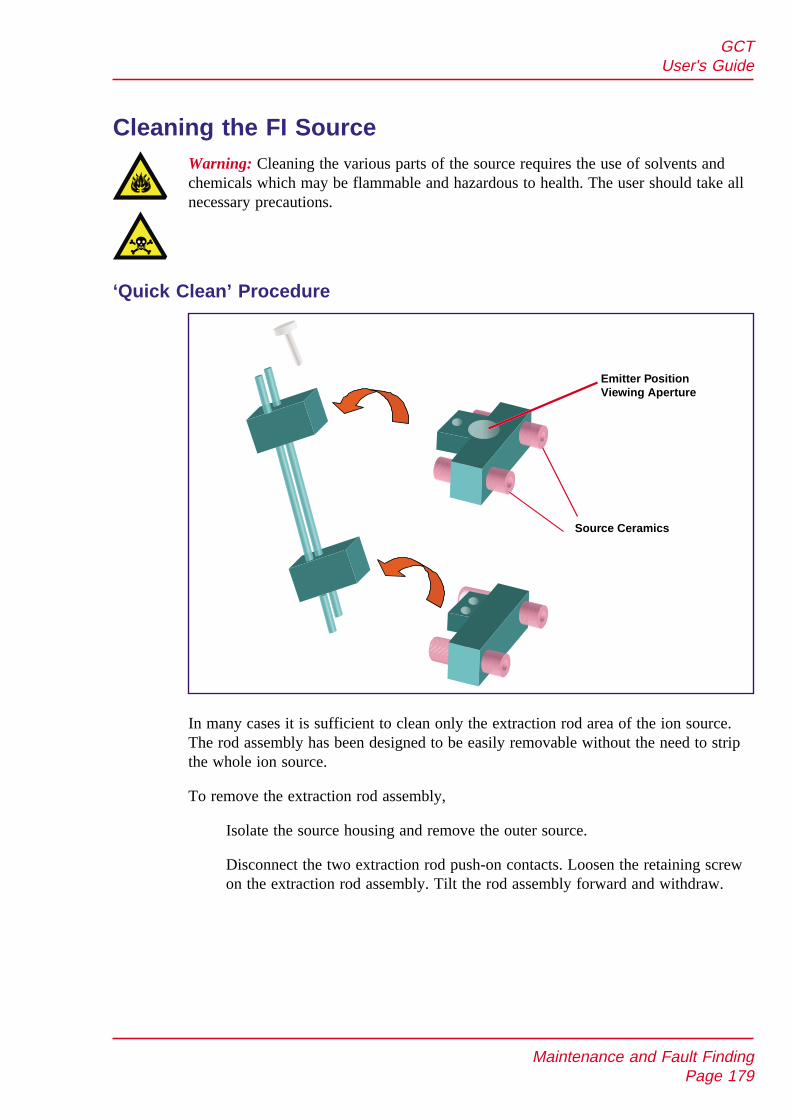
Cleaning the FI SourceWarning: Cleaning the various parts of the source requires the use of solvents andchemicals which may be flammable and hazardous to health. The user should take allnecessary precautions.
‘Quick Clean’ Procedure
In many cases it is sufficient to clean only the extraction rod area of the ion source.The rod assembly has been designed to be easily removable without the need to stripthe whole ion source.
To remove the extraction rod assembly,
Isolate the source housing and remove the outer source.
Disconnect the two extraction rod push-on contacts. Loosen the retaining screwon the extraction rod assembly. Tilt the rod assembly forward and withdraw.
Maintenance and Fault FindingPage 179
GCTUser's Guide
Source Ceramics
Emitter PositionViewing Aperture

FI Outer Source Parts List
Item Description Code No. Off1 Support plate M960161CD1 12 Exit plate M960165AC1 13 Insulating spacer (1mm) M960387AD1 44 Metal spacer (2mm) 7020104 125 Focus 2-plate M960152BD1 46 Metal spacer (5mm) 7020135 127 Lens block M960286CD1 18 Aperture plate M960155BD1 19 Metal spacer (1mm) 7020144 810 Insulating spacer (5mm) S100009AD5 3211 Focus 3 plate no.1 PLATE ( GAP) M702808BD1 412 Insulator shield M960416AD1 213 Half plate M416271AD1 414 Lower saddle M960410AD1 115 Extraction rod M960413AD1 216 Upper saddle M960189AD1 117 Grub screw M2 x 2 st. st. 5316014 118 Insulator M960414AD1 219 Contact pin M960412AD1 120 Lower support plate M960408AD1 121 Upper support plate M960409AD1 1222 Insulating spacer (2mm) 7020302 123 Ch Hd screw M2 x 8 st. st. 5314065 324 M2 washer st. st. 5314040 425 Ch Hd screw M1 .6 x 2 st. st. 5331013 126 M1.6 st. st. washer M960288AD3 127 Slit Plate support M960287AD1 128 Slit Plate (0.5) M960288AD3 129 Spring contact M960259BD1 230 Contact plate M960258AD1 231 Ch Hd M2 x 3 screw st. st. 5314048 232 Dowel dia.2 x 6 st. st. 5371002 633 Support plate M960159CD1 134 Pillar M960162AD1 435 Wavy washer M3 st. st. 5335005 836 Screw ch hd M3 x 12 st. st. 5314069 437 Screw ch hd M3 x 10 st. st. 5314017 438 Insulating rod M960336AD1 4
Maintenance and Fault FindingPage 180
GCTUser's Guide
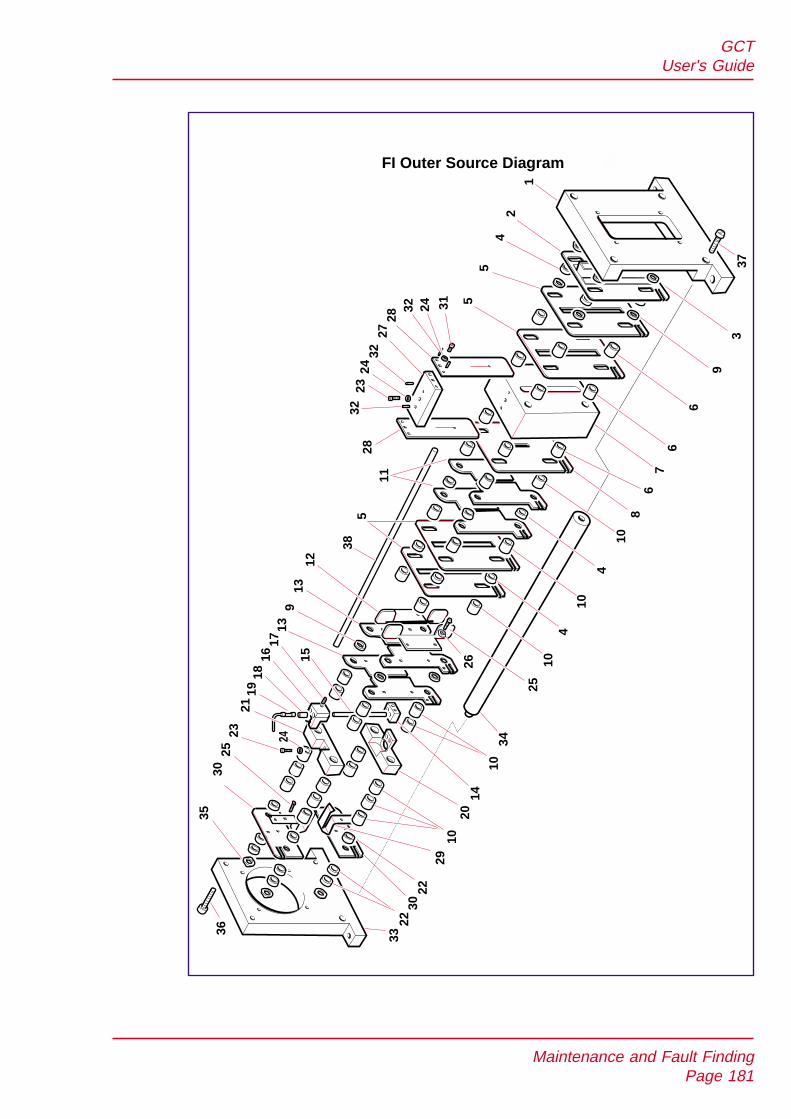
Maintenance and Fault FindingPage 181
GCTUser's Guide
3322
3022
29
2014
10
21
24
1918
1617
15
139
1312
25
26
38
104
10
34
5
11
4
10
67
6
6
9
3
5
45
21
8
28
28
2332
3224
31
27
2432
33
37
3635
3025
23
10
FI Outer Source Diagram
The extraction rods can be cleaned without disassembling. The rods should be cleanedwith fine grade emery paper or fine stainless steel wool. The surface should have ahighly polished appearance with no scratches or sharp points.
Immerse the whole assembly in a suitable solvent and sonicate until all particles areremoved and all condensed sample has been removed.
Full Clean Procedure
After a period of time there may be sample build-up on the source ceramics and thefocus plates. This may cause extraction voltage leakage and /or calibration massaccuracy problems. In this case the source must be removed from the source lidassembly disassembled and the contaminated components individually cleaned.
In the event that an emitter fails due to an electrical discharge in the ion source theemitter wire can experience a very high short-lived current which is enough toeffectively vaporize the wire. The carbon dendrites are then attracted to the emitterrods and to the ceramics of the outer source.
The result is usually a high leakage current when a new emitter is introduced. Theextraction rods and lens elements including ceramics up to the first focusing elementafter the extraction rods must be cleaned. Lens plates need to be cleaned in anultrasonic bath using a suitable solvent to ensure all emitter fragments are removedbefore reassembly.
Caution: To aid reassembly, the diagram below illustrates the feedthroughs asviewed from the outside of the housing. This is a very important consideration,because from inside the housing the layout is a mirror image, and if the wiresare connected incorrectly this will damage the instrument.
Maintenance and Fault FindingPage 182
GCTUser's Guide
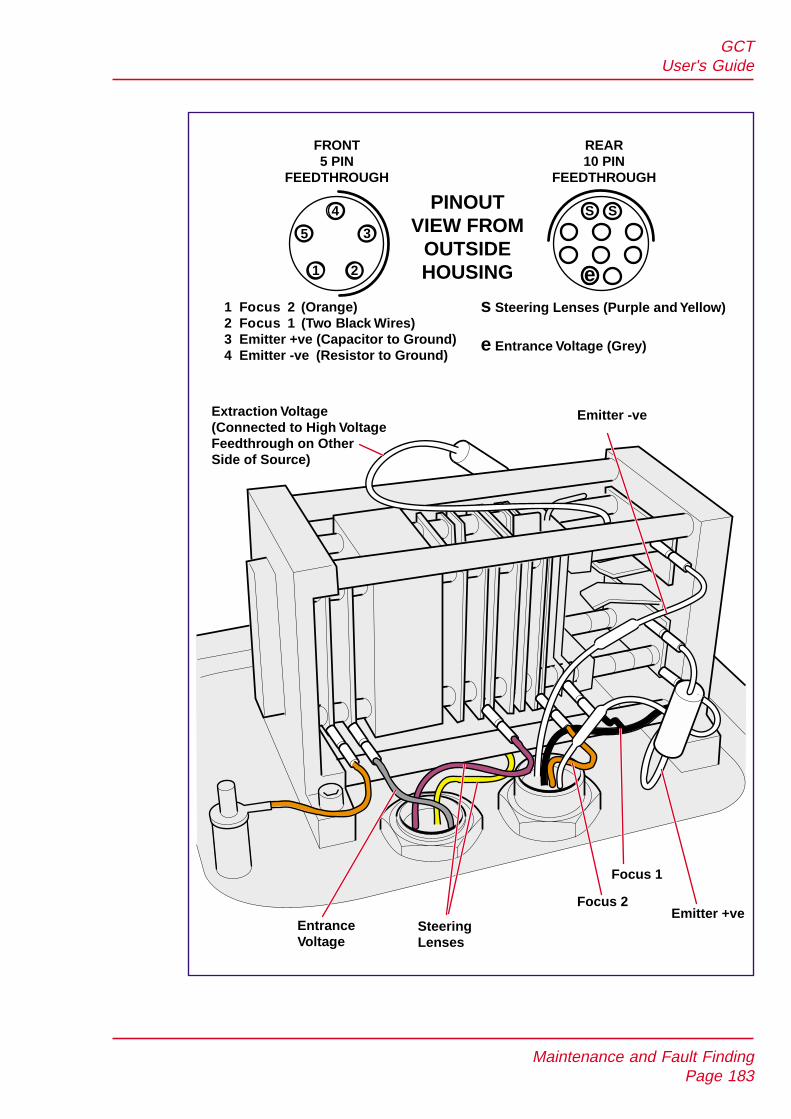
Maintenance and Fault FindingPage 183
GCTUser's Guide
1 Focus 2 (Orange)2 Focus 1 (Two Black Wires)3 Emitter +ve (Capacitor to Ground)4 Emitter -ve (Resistor to Ground)
s
e
Steering Lenses (Purple and Yellow)
Entrance Voltage (Grey)
PINOUTVIEW FROM
OUTSIDEHOUSING
FRONT5 PIN
FEEDTHROUGH
REAR10 PIN
FEEDTHROUGH
EntranceVoltage
Extraction Voltage(Connected to High VoltageFeedthrough on OtherSide of Source)
SteeringLenses
Focus 2
Focus 1
Emitter +ve
Emitter -ve
5
1 2
3
4 S S
e
Fault finding
No Beam
General Checks
Refer to the relevant chapters of this manual and check the following:
The tune page real time display is activated by pressing the appropriate buttonon the tool bar of the tune page.
Normal tuning parameters are set and, where appropriate, readback values areacceptable.
All necessary cables have been correctly attached to the source.
The source has been assembled correctly and is clean.
The source isolation valve is open.
If, after performing the above checks, the beam is still absent:
Set the real time tune display to show the mass range down to0.
Check that there is an interference ‘peak’ at approximately11 due to thepusher pulse being switched off.
If this interference peak is not present, either the pusher is not pulsing or the outputfrom the detector is not reaching the TDC (time to digital converter).
The most likely cause of an absent pusher interference pulse is a faulty attenuator.
The attenuator must only be replaced by trained maintenance personnel. If the pusherinterference peak is not present no data will be acquired.
Low Compressed Air Supply
In the extreme case of total loss of the compressed air supply to the system the systemmay vent. This is a result of the backing line isolation valves closing.
However, if the supply is low the backing line isolation valves will remain open butthere may be insufficient pressure to allow the isolation valve to open. Isolation valveoperation is accompanied by a characteristic audible hiss, and in the absence of thisthe air supply should be investigated.
Action
Check pressure of compressed air supply.
Maintenance and Fault FindingPage 184
GCTUser's Guide

No Trap, Emission or Filament Current Readback
This can be due either to a damaged filament or to poor contact to the filament fromthe spring contacts on the outer source.
Action
Remove inner source.
Check continuity of the filament with a digital voltmeter ca: 0.2ohm.Replace filament if damaged.
If the filament is intact adjust the spring contacts on the outer sourceslightly to improve contact.
No Filament Current, Trap Current Maximum, Emission Current Zero
This is usually due to a particle or general contamination in the region of the trapcausing leakage current between the block and the trap.
Action
Remove inner source and exit plate.
Check cleanliness of trap and trap ceramic. Blow out any particles using drynitrogen.
High Filament Current, High Emission, Low Trap Current
Electron entrance aperture blocked or filament in incorrect position. Trap springcontact not connected.
Action
Clean inner source.
Check trap spring contact on outer source.
Ion Repeller Inactive in EI Mode
Action
Check ion repeller spring contact on outer source.
Poor Sensitivity
Poor emission to trap ratio and poor sensitivity in EI mode.
Maintenance and Fault FindingPage 185
GCTUser's Guide
The EI source filament current is regulated by monitoring the current produced byelectrons accelerated from the surface of the filament on a trap inside the inner source.After an extended period of use the filament current required to produce the requestedtrap current may increase, as the filament becomes less efficient. The filament may‘sag’ so that it does not align correctly with the electron entrance hole in the block.The electron entrance hole may become partially blocked with contaminant. The trapmay become contaminated so that an incorrect reading of trap current is registered.These effects will result in the emission current (amount of electrons produced by thefilament) to trap current (amount of electrons reaching the trap) ratio changing. Withthe EI only source expect an emission to trap ratio (at 70eV) of about 3:1 andcertainly less than 7:1. Poor emission to trap ratio will result in poor sensitivity.
Action
Clean the inner source.
High Positive Value of Ion Repeller EI Source
If the ion repeller is optimising at more than 7V it is likely that the repeller hasbecome contaminated. This will lead to poor sensitivity. NOTE: if the repeller tuneshigh immediately after a column has been installed it is likely that the end of thecolumn is too close to or protrudes past the centre line of the source. This willinterfere with extraction of ions from the source and lead to poor sensitivity.
Action
Check column position, clean inner source.
Poor Sensitivity in CI Mode
As there is no trap in CI mode the emission to trap ratio cannot be used as anindicator of poor source performance. However contamination of the electron entranceaperture, and sagging of the filament can have an adverse effect on sensitivity in thismode.
Action
Clean the inner source.
Incorrect Position of the GC Column
If the GC column is too far in or not far enough in with respect to the centre line ofthe source sensitivity may be reduced. Column position in the injector is also critical.
Action
Check column position.
Maintenance and Fault FindingPage 186
GCTUser's Guide
Poor GC Conditions
Contamination of the GC liner, leaks on the GC, damage to column etc can result inpoor transmission of analyte to the mass spectrometer. Poor chromatographic separationand tailing of chromatographic peaks can suggest problems in this area. Adsorption ofanalyte on column or in the injector may lead to non linear response. Incorrect GCsettings for column parameters, flow rate, purge time and flow, or split ratio will alsoaffect transfer. Incorrect column cutting or position can also affect performance, Refer toGC manufacturer's information and see section on GC-MS in this manual.
Action
Check sensitivity with HCB. This compound is not normally retained on thecolumn. Check column installation and GC parameters.
Faulty Attenuator
This can result in poor peak shape or loss of beam.
Action
Check continuity of attenuator. With a digital voltmeter set to measure ohmscheck for a resistance ≈ 52Ω with respect to the case at both ends of theattenuator. Values > 55Ω indicate a faulty attenuator.
Faulty Preamplifier or Preamplifier Supply
No beam.
Action
Check 12V supply to preamplifier. Replace preamplifier if faulty.
Poor Resolution
Gradual Decrease in Resolution and Mass Accuracy
This usually indicates a problem with contamination of the outer source lens elements,however excessive contamination of the inner source can lead to problems. Generallya contaminated inner source leads to a greater energy spread of ions leaving thesource. This will add to the initial orthogonal energy of the ion beam degradingresolution. The energy spread of ions produced will depend on the energetics of thatparticular ion. This can lead to poor calibration and mass accuracy.
In terms of the outer source most contamination will appear on the first of the tworemovable collimating slits. Ion burn of this slit is due mainly to Helium, Nitrogen, orCI reagent gas signal. In addition after prolonged use the focus 1 plates can becomecontaminated due to ion burn from ions leaving the filament.
Maintenance and Fault FindingPage 187
GCTUser's Guide
Action
Check for contamination inner and outer source and clean inner source,collimating slits in outer source and focus 1 plates if required.
Incorrect Engineer Tuning Menu Settings
The settings of the analyser voltages in the Engineer Tuning Menu will have been setup during installation. These values should be saved and recorded in case lost.
Action
Check settings against values determined during installation.
Incorrect Isotope Distributions, Difficulty in Setting TDC Dead Time Parameters
If the Gain of the system is low or the TDC signal threshold is set too high, aproportion of single ions will not be counted. Under single ion counting conditions(without TDC saturation) this would have no effect on the spectra other than to reducesensitivity. However, under multiple ion arrival conditions, where dead time correctionis used the population of ions detected can be skewed leading to incorrect isotope ratiomeasurements and incorrect application of the dead time model. It is thereforimportant to make sure that at least 85% of all ions are recorded by adjusting the TDCsignal threshold or multiplier gain settings. See section on Tuning and user interface.
The effects detailed above can be caused by:
• The TDC Stop (mV) threshold being set too high.
Refer to the tune page settings section on Tuning and user interface forinformation regarding the setting of this parameter.
• A faulty attenuator.
Attenuators can fail so that they are open circuit (no beam or pusherinterference ‘peak’ present), or they can fail such that they stopattenuating. The latter failure mode gives rise to problems in ion detection.
When the attenuator fails in this way the TDC Stop (mV) threshold can beincreased to a significantly higher value than that used previously withoutreducing the beam intensity.
In normal operation setting the TDC threshold above 200 or 250mV willstart to reduce the beam intensity. If the attenuator has failed the TDCthreshold can be increased to 500mV or higher before the beam intensity isreduced.
Maintenance and Fault FindingPage 188
GCTUser's Guide
• High noise - chemical.
Chemical noise usually originates from contaminated samples, solvents orGC or CI reagent gases or lines. Chemical noise can be distinguished fromelectronic noise simply by stopping source ionisation, by turning the trapcurrent to 0 or shutting the isolation valve.
If no sample or gases are entering the source and all the source voltagesare set to zero then the remaining noise will be electronic in nature.
• High noise - electronic.
Electronic noise can be caused by setting the TDC Stop (mV) thresholdtoo low. Refer to the section Tune Page Settings in the chapter entitledTuning and User Interface for information regarding the setting of thisparameter.
Warning: The microchannel plate detector can be damaged by failure toproperly condition the detector following venting of the system toatmosphere.
If the detector is producing micro discharges, excessive noise will beapparent on the baseline of mass spectra in the absence of any ion beam.Reducing the detector voltage will reduce the number of discharges andreduce the noise.
Caution: It is strongly recommended that assistance is sought fromMicromass if maintenance to the detector system is considered necessary.
Caution: Assistance from Micromass should be sought if, due tosymptoms such as excessive noise, spikes, loss of detector gain orabnormal peak shapes, maintenance to any of the components within theTOF analyser housing is thought to be necessary.
• Poor vacuum.
Before suspecting a pump fault or vacuum leak (see Vacuum System earlierin this chapter) check the inverted magnetron (Penning) gauge. If thisgauge has become dirty it will indicate a poor vacuum, or even fail toregister at all. For information on cleaning the gauge, refer to the Edwardsliterature supplied in the auxiliary equipment folder with the instrument.
Poor source vacuum after a source pumpdown can be caused by failure to openthe reference reservoir pump valve during pumpdown. Trapped air in theinterface will take some time to completely pump away through the fused silicaleak.
Maintenance and Fault FindingPage 189
GCTUser's Guide

Fault finding in FI ModeNo Beam
• Check that the position of the emitter is correct using the emitter probe adjusterknob.
• Check that the extraction voltage readback is present and that the leakage currentis low.
No Emitter Current
The emitter may be damaged.
Vent the source region, withdraw the emitter and check that there is electricalcontinuity through the emitter wire. In most cases it is possible to assess theintegrity of the emitter wire by visual inspection. Replace emitter if required.
Note: it is possible to see a weak ion signal even when the emitter wire isdamaged however no emitter current will be drawn.
Excessive Leakage Current
• Check that the internal source wiring is not touching any grounded elements.
• Withdraw the emitter by 5 -10mm from the extraction rods.
A continued high leakage current indicates that either the internal wiring isclose to a grounded element or that voltage leakage is occurring across theceramics of the ion source.
Inspect the source, and strip and clean the source if required.
If the leakage current decreases to an acceptable level, the voltage leakage isoccurring between the extraction rods and the emitter.
Remove the ion source and clean the extraction rods.
• Check that the shield plates protecting the ceramics on either side of theextraction rods are not touching the extraction rod assembly. Adjust if required.
Poor Sensitivity for the Reference Material
• Check that the emitter is intact.
• Replace emitter and reassess. (There may be marked variation between theperformance of individual emitters).
Poor GC Sensitivity
• Check that the source end of column is cleanly cut.
• Check the position of the emitter relative to the end of the column and adjust ifrequired.
Maintenance and Fault FindingPage 190
GCTUser's Guide

Poor Calibration / Accurate Mass
Clean the extraction rods.
Electrical Discharge Resulting in Damaged Emitter
Most emitter failures result from an impact, incorrect handling or stresses within theemitter bead. If an emitter fails in this way, the emitter wire generally remainsattached to one or both of the legs of the emitter bead. Replacing the emitter is usuallyall that is required.
Failure of emitters due to discharge in the ion source is rare and is usually due toexcessive source contamination.
In the event that an emitter fails due to an electrical discharge in the ion source theemitter wire can experience a very high short-lived current which is enough toeffectively vaporize the wire. The carbon dendrites are then attracted to the emitterrods and to the ceramics of the outer source.
The result is usually a high leakage current when a new emitter is introduced. Theextraction rods and lens elements including ceramics up to the first focusing elementafter the extraction rods must be cleaned. Lens plates need to be cleaned in anultrasonic bath using a suitable solvent to ensure all emitter fragments are removedbefore reassembly.
Continuous loss of emitters in this way indicates a high level of contamination and apossible fault in the protection resistors/capacitors across the emitter within the outersource.
DXC Troubleshooting and HintsEnsure that the temperature compensation cable is fitted correctly, this includes:
• If the cable is the external type plug the 2 pin connector into the EVENT OUT 2with the switch set to 5V.
• If the cable is the external type plug the 3 pin connector into ANALOGCHANNEL 4
• If the cable is the internal type make sure that it is wired correctly to the blockon the interconnection PCB. The wires should be (from left to right) black-SCN,green-0V, blue-temperature signal, red-+5V.
• Ensuring the 'slot' in the flight tube is full of heat sink compound and thethermal sensing transistor is submerged in this heat sink.
• Ensuring the clamp plate is securely fixed and the 2 earth connections are fixedto the housing or block.
Maintenance and Fault FindingPage 191
GCTUser's Guide
• If you still have problems then fill the 'opening' into the slot for the wires witharaldite or some similar substance to fix the wires, reduce air flow to the heatsink and stop the heat sink running out.
• Ensure that the correct version of software is installed.
• Ensure that the instrument's internal and external covers are all fitted.
• Ensure that there are no dead-time effects causing problems with mass accuracy.
• Ensure that there is enough signal to give an accurate mass measurement - over1500 counts should be OK. If not, then sum more scans.
• Ensure that the instrument has been switched on and set to constant operatingconditions for at least 2 hours.
• Make sure that you are using the correct calibration file.
• Check that the calibrated temperature in the _header.txt file of the calibrated datacorresponds to the temperature that the calibration was taken at.
Check that the instrument 'knows' it is using DXC by displaying it on the header in thespectrum. Select SpectrumQTOF from group and"UseTempCorrection" from element -it should say "1" and "TempCoefficient" should give the ppm/degree value.
Maintenance and Fault FindingPage 192
GCTUser's Guide
Faultfinding and Tips (DCI Probe)
Peak shifting can sometimes be seen if the DCI tip is touching the source inside theinstrument due to grounding the current return path. This can be determined bymeasuring the resistance from the tip to ground when the probe is in position whichwould change if the probe is withdrawn by five centimetres or so. It can be preventedby carefully bending the tip back to a straight position and making sure that it is about2.1mm wide.
No DCI current can be caused by a damaged tip. Visually inspect the tip and checkthe continuity across the tip from the socket on the DCI probe.
Large peak at 447Da is probably SANTOVAC. Clean the probe shaft with methanoland acetone and change the o-rings in the insertion lock. Coat the o-rings and lubricatethe probe shaft with molybdenum disulphide instead.
A general hydrocarbon like background hump getting up to 100 counts or so persecond from 100 to 400Da is normal.
Saturation of detector (characterised by the lock mass peak dropping down in intensityor peak flags on the spectrum) - use less sample, use a lower emission current (youcan drop it down to 10µA and still see a signal) or use a slower ramp.
Vacuum gauges fluctuating when the probe is inserted - this is due to a poor seal onthe o-ring in the insertion lock. Tighten up the three screws a little on the brass ringthat holds the o-ring in place.
Maintenance and Fault FindingPage 193
GCTUser's Guide

Preventive Maintenance Check List
Avoid venting the instrument when the rotary pump is gas ballasting. Do not gasballast the rotary pump for more than 2 hours under any circumstances. Under nocircumstances should gas ballasting be performed during instrument operation. For fulldetails of the following procedures, consult the relevant sections of this chapter and/orrefer to the manufacturer’s literature.
Weekly
Gas ballast for at least 30 minutes by rotating the gas ballast knob anticlockwise by 5to 6 turns.
When gas ballast is complete, check the rotary pump oil level and colour.
Oil that has become noticeably red in colour should be replaced.
Check the water chiller level and temperature (if fitted).
Monthly
Check all cooling fans and filters.
Change the odour element in the oil mist filter.
Four-Monthly
Change the mist element in the oil mist filter.
Change the oil in the rotary pump.
Gas ballast lightly for 30 to 60 minutes both before and after changing oil.
Maintenance and Fault FindingPage 194
GCTUser's Guide

Reference InformationPositive Ion EI and Positive Ion CI
Tris (trifluoromethyl) triazine reference masses.
Mass Intensity Empirical formula
C12 C13 N F
49.996800 10 1 1
68.995210 100 1 3
75.998881 25 2 1 2
102.002950 10 3 2 2
121.001358 100 3 2 3
170.998164 5 4 2 6
189.996568 100 4 9
265.996448 100 6 3 8
284.994900 100 6 3 9
285.998400 5 5 1 3 9
Lock mass for CI- Chloropentafluorobenzene201.9609.
Maintenance and Fault FindingPage 195
GCTUser's Guide
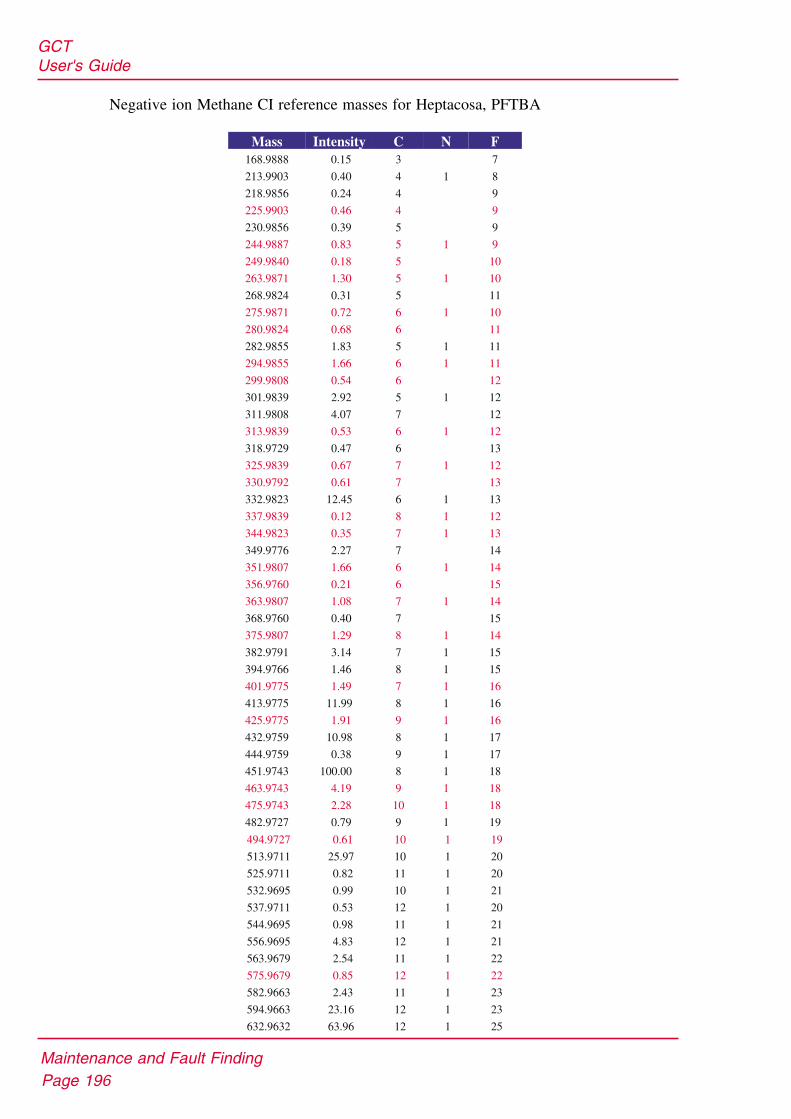
Negative ion Methane CI reference masses for Heptacosa, PFTBA
Mass Intensity C N F168.9888 0.15 3 7
213.9903 0.40 4 1 8
218.9856 0.24 4 9
225.9903 0.46 4 9
230.9856 0.39 5 9
244.9887 0.83 5 1 9
249.9840 0.18 5 10
263.9871 1.30 5 1 10
268.9824 0.31 5 11
275.9871 0.72 6 1 10
280.9824 0.68 6 11
282.9855 1.83 5 1 11
294.9855 1.66 6 1 11
299.9808 0.54 6 12
301.9839 2.92 5 1 12
311.9808 4.07 7 12
313.9839 0.53 6 1 12
318.9729 0.47 6 13
325.9839 0.67 7 1 12
330.9792 0.61 7 13
332.9823 12.45 6 1 13
337.9839 0.12 8 1 12
344.9823 0.35 7 1 13
349.9776 2.27 7 14
351.9807 1.66 6 1 14
356.9760 0.21 6 15
363.9807 1.08 7 1 14
368.9760 0.40 7 15
375.9807 1.29 8 1 14
382.9791 3.14 7 1 15
394.9766 1.46 8 1 15
401.9775 1.49 7 1 16
413.9775 11.99 8 1 16
425.9775 1.91 9 1 16
432.9759 10.98 8 1 17
444.9759 0.38 9 1 17
451.9743 100.00 8 1 18
463.9743 4.19 9 1 18
475.9743 2.28 10 1 18
482.9727 0.79 9 1 19
Maintenance and Fault FindingPage 196
GCTUser's Guide
494.9727 0.61 10 1 19
513.9711 25.97 10 1 20
525.9711 0.82 11 1 20
532.9695 0.99 10 1 21
537.9711 0.53 12 1 20
544.9695 0.98 11 1 21
556.9695 4.83 12 1 21
563.9679 2.54 11 1 22
575.9679 0.85 12 1 22
582.9663 2.43 11 1 23
594.9663 23.16 12 1 23
632.9632 63.96 12 1 25

Appendix 1GC-MS
This section deals with correct installation of the GC column and notes on obtainingthe best GC MS performance from the GCT.
Review of GC Considerations in MS DetectionOptimisation of chromatographic performance is dependent upon a number of factors,most notably column selection. The characteristics of bonded fused silica capillarycolumns have been well established, providing a range of stationary phases designedfor applications with polar and non-polar analytes.
The following guidelines may be useful in selecting an appropriate stationary phase.
Review literature to ensure the application has not been previously reported. Theanalysis of polar analytes is usually achieved with polar phases. The selectivity ofsuch phases is related to the polarity of the analytes. Select the least polar phase thatwill perform the required separation. Non-polar phases generally have a highermaximum operating temperature, lower bleed and longer life than polar phases.
Column Installation and CareThe following section describes guidelines for good practice when installing GCcolumns and performing GC – MS analysis.
Always ensure that the ends of the columns are cut cleanly and at right angles to thelength of the column. A purpose designed column tool should always be used ie:ceramic wafer or quartz cutter.
Minimise the amount of handling with bare hands. This can introduce contaminationinto the mass spectrometer resulting in a high level of background. Use cotton glovesor a tissue to hold the column whilst installing.
Replace the injection liner and septum in the GC injector at regular intervals.Contamination in these components can lead to poor chromatography – tailing peaks-and loss of sensitivity due to adsorption of analyte in the injector.
After installation of a new column ensure that the correct conditioning procedure hasbeen completed.
Always thoroughly check for leaks after installing a column. A small amount ofoxygen entering the GC column can lead to permanent damage to the column. UseIsopropyl alcohol or an electronic leak checker.
Do not use Snoop soap solution as this can cause contamination.
Appendix 1 GC-MSPage 197
GCTUser's Guide

Conditioning the GC ColumnAfter installation of a new GC column and before sample analysis the column shouldbe conditioned at operating temperature.
Install the column into the mass spectrometer and set the desired flow rate.
Start an acquisition to monitor the level of the background entering the source.
Set the GC oven to the maximum operating temperature of the column.
Monitor characteristic column bleed peaks 207, 281.
The intensity of these peaks will rise as the oven temperature increases. The signalshould reach a maximum and remain constant when the GC oven reaches themaximum operating temperature. If the level of column bleed continues to rise, thecolumn may be damaged or there may be an air leak on the GC side. Cool the ovenand isolate the problem.
Appendix 1 GC-MSPage 198
GCTUser's Guide
Appendix 2Ion Counting on TOF Instruments
Using a TDCThe TDC (Time to Digital Converter) is the acquisition device used to record thearrival times of ions on LCT, GCT and Q-Tof mass spectrometers. The TDC isessentially an ion-counting device which will record an ion arrival with a single‘count’ and associate that arrival with a time relative to a start time. The internal clockof the TDC is reset and started by an external Trigger signal. This clock will only startwhen this Trigger signal exceeds a user defined threshold. This is called the TriggerThreshold.
A single ion arrival will only result in an event being recorded if the signal generatedby this arrival passes through a user-defined voltage threshold. This is called theSignal Threshold. When this occurs the TDC records the event and associates it with atime stamp. The TDC will continue to associate times with ion arrival events untilanother trigger signal is detected. At this point the internal clock within the TDCresets to zero and subsequent ion arrivals are associated with a time relative to thisnew start time.
The time between trigger signals corresponds to a single time-of-flight spectrum. Thistime may be as small as 30 micro seconds. Each individual time of flight spectra isadded to the last to produce a total histogrammed mass spectrum.
Within the architecture of the TDC each event recorded is not only associated with atime stamp but is also ‘flagged’ as resulting from the detection of a trigger signal or asresulting from the detection of a single ion pulse. The former is referred to as a startevent the latter a stop event. Because of this terminology the signal threshold can alsobe referred to as the stop threshold and the trigger threshold referred to as the startthreshold.
Appendix 2 Ion Counting on TOF Instruments using a TDCPage 199
GCTUser's Guide

Trigger ThresholdThe electronic pulse which triggers the TDC clock to start counting (Trigger Signal) isderived directly from the orthogonal acceleration (pushout) pulse. The general form ofthe signal is shown in Fig 1
Referring to Fig 1 the initial positive going ion spike corresponds to the leading edgeof the pushout pulse, the negative going spike corresponds to the falling edge of thepushout pulse. In positive ion the Trigger Threshold, in the instrument controlsoftware, is set to detect a positive going slope and a positive voltage.
In negative ion mode the pushout pulse is inverted, therefore the trigger signal is alsoinverted.
The software automatically changes the characteristic of Trigger Threshold when thepolarity of the system is changed, so that the clock will start when a negative signalwith a negative going slope is detected.
Appendix 2 Ion Counting on TOF Instruments using a TDCPage 200
GCTUser's Guide
Approx1.5 Vmax
Trigger Threshold
Trigger
0 Volts
X
FIG 1 TDC TRIGGER SIGNAL POSITIVE ION MODE
X for GCT = 2.8 sX for LCT = 9.0 sX for Qtof = 8.0 s
µ
µ
µ
0 Volts
Fig2 TDC trigger signal negative ion mode

The Trigger Threshold should be adjusted so that the best resolution and peak shape isobserved. If the threshold is too high no trigger signal will be detected and the internalTDC clock will not start. No data will be produced. If the threshold is too low. TheTDC may detect the small electronic ringing close to the zero volts level. This cancause multiple triggering resulting in split peaks or even two discrete spectra separatedby the fixed time interval X in Fig 1.
Generally the best position for the threshold will be directly between these twoextremes. However, the rising edge of this pulse may have areas of instability, whichcan cause split peaks or peak broadening. Several different values of TriggerThreshold can be examined to find the value resulting in the best resolution and peakshape.
Once set this should not need to be changed. It is a system parameter unique to theelectronics characteristic of a particular instrument.
Signal ThresholdThe current produced from an individual ion arrival needs to be greatly amplifiedbefore it can be detected by the electronics of the TDC. This is achieved using aMicrochannel Plate Detector (MCP). The MCP is essentially a fast electron multiplier.In normal operation, for a single ion arrival at the front of the MCP assembly > 10exp 7 electrons are produced at the output of the system. This is the MCP’s gain. Theelectron current exiting the rear of the MCP is converted into a voltage pulse at acollector plate. This negative pulse is then delivered to the TDC input. When thenegative going edge of this negative pulse passes through a user-settable thresholdSignal Threshold an ion event is registered and saved with a time stamp. Fig 3
However, not all ion events, even from the same m/z value ion, result in the samedetector output and there is a significant distribution of output pulse intensity. Thegain of the MCP is therefore only an average of the total distribution of outputintensities. This variation is known as ion height distribution of the MCP.
Fig 4 shows the nature of this distribution.
Appendix 2 Ion Counting on TOF Instruments using a TDCPage 201
GCTUser's Guide
0 Volts
Fig 3 Single ion pulse

Referring to Fig 4 the X-axis represents the intensity of the pulse presented to theTDC input for a single ion event. The Y-axis represents the proportion of events witha particular intensity. It can be seen that the distribution of ion heights is roughlyGaussian. The large population of events at low intensity is due to electronic noise,mostly power supply ripple. The red dotted line indicates the optimum position of theSignal Threshold. All events to the right of the red dotted line will appear as counts inthe final spectrum. This threshold should be set to count 85 - 95 percent of all thesingle ions events.
If the Signal Threshold is set too low there will be a large amount of noise detected. Ifit is set too high counts may be missed.
Setting the Signal ThresholdThe Signal Threshold should be set up to be just above the level of the systemelectronic noise. This is as low a value as possible. The MCP voltage should then beadjusted so that the gain of the system is enough to place at least 85 percent of theions above the threshold. The level of electronic noise is unique for an individualsystem, therefore, once set the level need not be further adjusted.
Appendix 2 Ion Counting on TOF Instruments using a TDCPage 202
GCTUser's Guide
Fig 4. Ion height distribution of dual chevron MCP
Electronic noise
Signal threshold
Ion height (mv)
Single ion events
Events counted
Number of ions /population

Setting the MCP VoltageFor a given Signal Threshold the MCP will need to be driven to a suitable gain atwhich the majority of single ions are detected. In practice this is normally at a gain of1 - 5exp7. At this high gain the ion height distribution is at its narrowest (the MCP isclose to saturation). Low gain can cause the ion height distribution to broaden andmake the differentiation between single ion events and electronic noise difficult to setup. Like any electron multiplier the MCP has a limited lifetime. As electrons arestripped from the detectors coating changes occur resulting in reduced gain. The rateof gain change is related to the intensity of the output signal. The MCP’s should neverbe exposed to large ion currents for extended time periods.
A new MCP detector will initially appear to have high gain for a moderate voltageapplied. This is due to trapped gas in the coating of the MCP increasing secondaryelectron yield. As the MCP out-gasses with use the gain for a given applied voltagewill drop. Once out-gassing is complete (the MCP has been aged) the rate of gain dropwill slow.
Because of these effects the MCP voltage must be checked, and increased if required,at regular intervals to ensure that the majority of ion events are counted. Once theMCP voltage exceeds the maximum allowed from the software the MCP’s should bereplaced.
Effect of low MCP gain on isotope ratioFig 5 shows the position of the Signal threshold relative to the ion height distributionfor single ion counting with low gain.
Appendix 2 Ion Counting on TOF Instruments using a TDCPage 203
GCTUser's Guide
Fig 5 Ion height distribution low gain
Electronic noise
Signal threshold
Ion height (mv)
Single ion events
Events counted
Number of ions /population
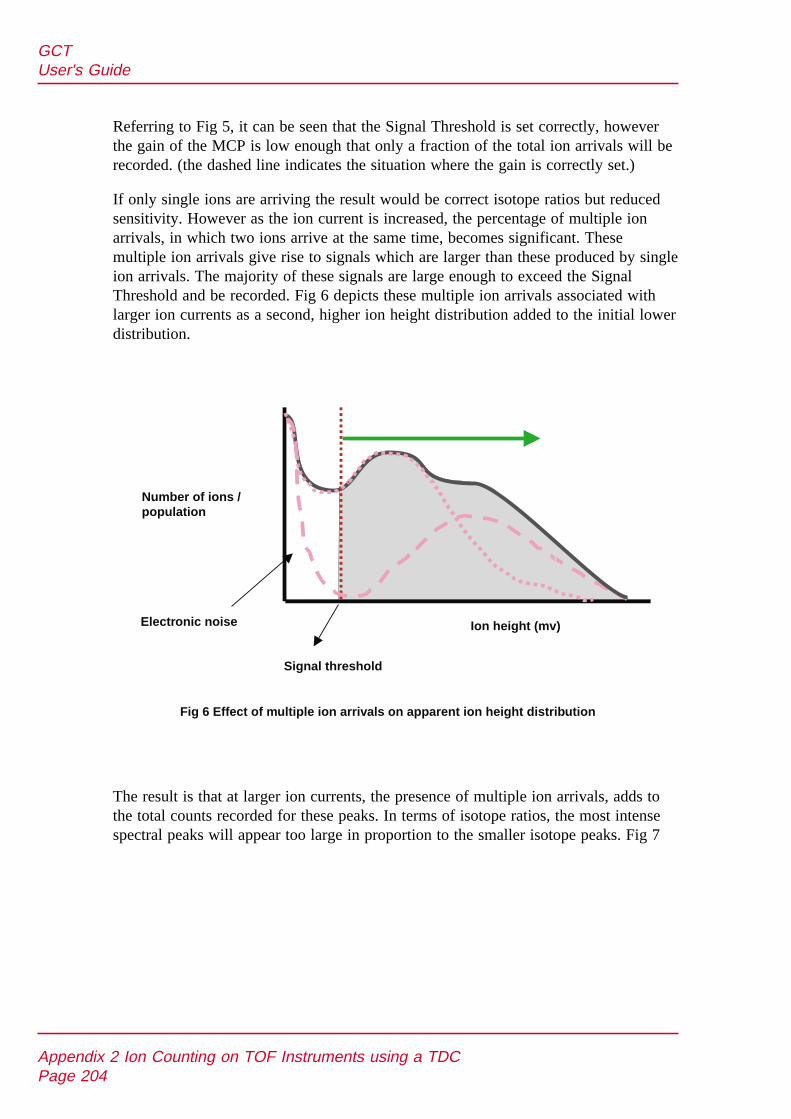
Referring to Fig 5, it can be seen that the Signal Threshold is set correctly, howeverthe gain of the MCP is low enough that only a fraction of the total ion arrivals will berecorded. (the dashed line indicates the situation where the gain is correctly set.)
If only single ions are arriving the result would be correct isotope ratios but reducedsensitivity. However as the ion current is increased, the percentage of multiple ionarrivals, in which two ions arrive at the same time, becomes significant. Thesemultiple ion arrivals give rise to signals which are larger than these produced by singleion arrivals. The majority of these signals are large enough to exceed the SignalThreshold and be recorded. Fig 6 depicts these multiple ion arrivals associated withlarger ion currents as a second, higher ion height distribution added to the initial lowerdistribution.
The result is that at larger ion currents, the presence of multiple ion arrivals, adds tothe total counts recorded for these peaks. In terms of isotope ratios, the most intensespectral peaks will appear too large in proportion to the smaller isotope peaks. Fig 7
Appendix 2 Ion Counting on TOF Instruments using a TDCPage 204
GCTUser's Guide
Fig 6 Effect of multiple ion arrivals on apparent ion height distribution
Electronic noise
Signal threshold
Ion height (mv)
Number of ions /population
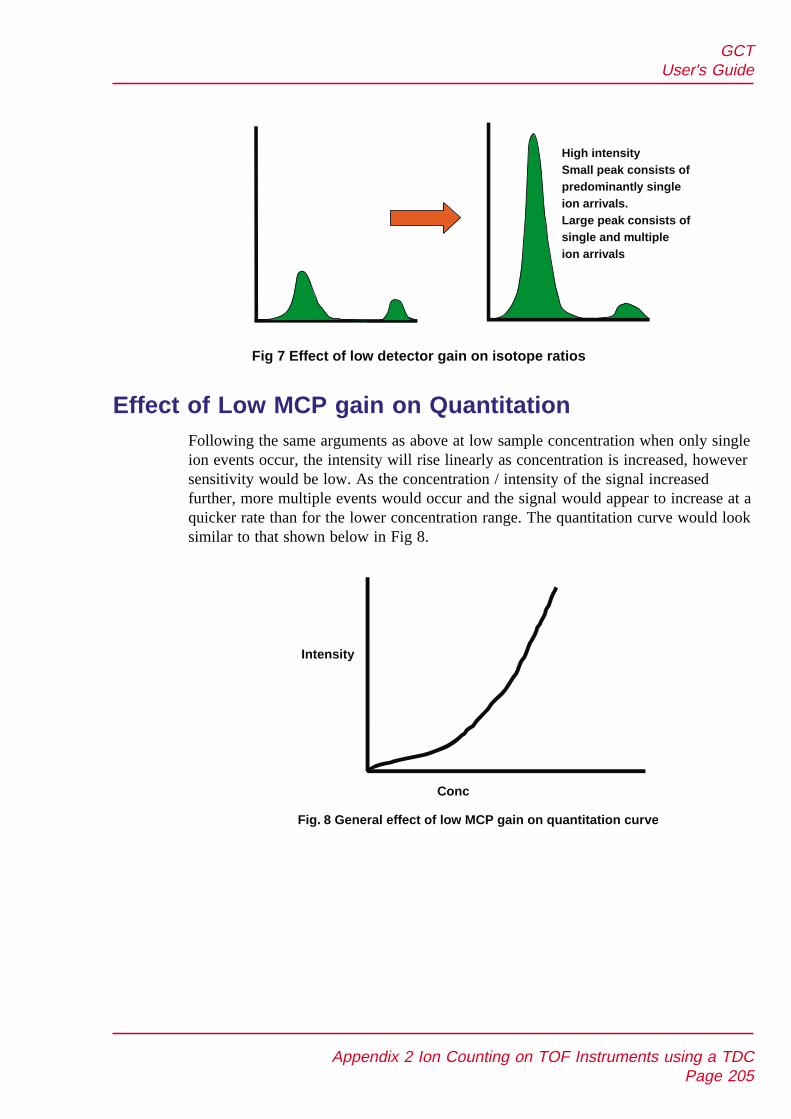
Effect of Low MCP gain on QuantitationFollowing the same arguments as above at low sample concentration when only singleion events occur, the intensity will rise linearly as concentration is increased, howeversensitivity would be low. As the concentration / intensity of the signal increasedfurther, more multiple events would occur and the signal would appear to increase at aquicker rate than for the lower concentration range. The quantitation curve would looksimilar to that shown below in Fig 8.
Appendix 2 Ion Counting on TOF Instruments using a TDCPage 205
GCTUser's Guide
Intensity
Conc
Fig. 8 General effect of low MCP gain on quantitation curve
High intensitySmall peak consists ofpredominantly singleion arrivals.Large peak consists ofsingle and multipleion arrivals
Fig 7 Effect of low detector gain on isotope ratios
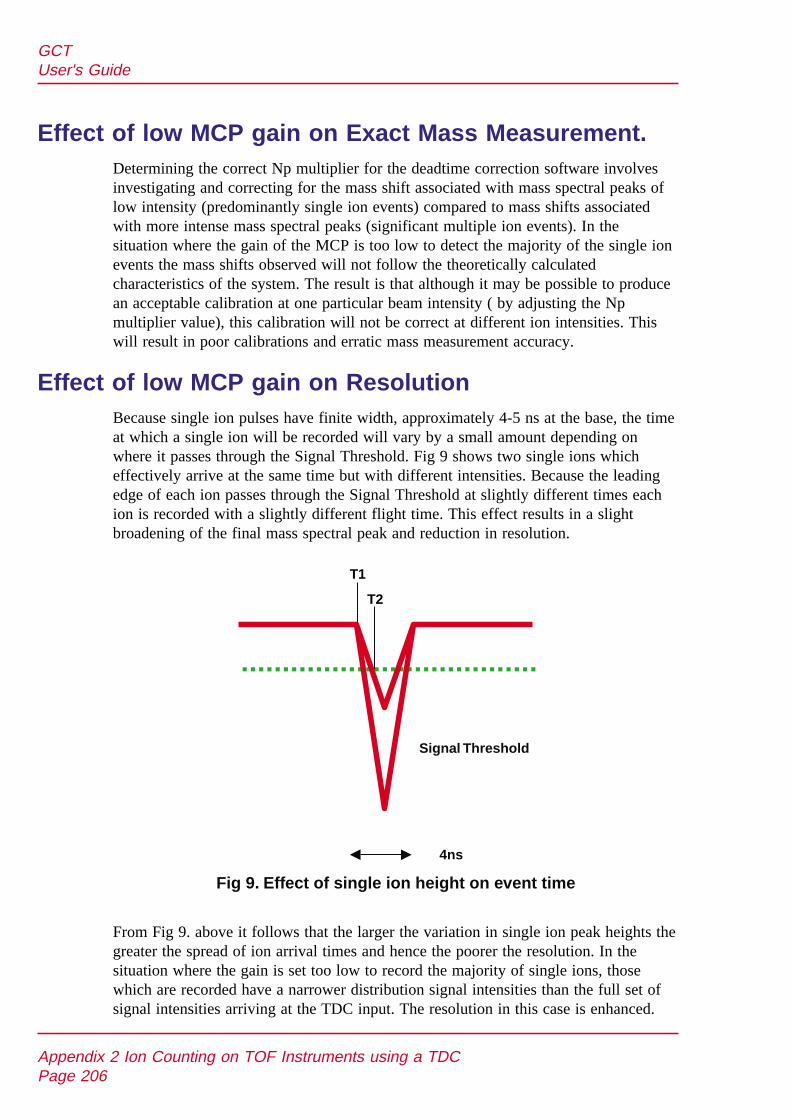
Effect of low MCP gain on Exact Mass Measurement.Determining the correct Np multiplier for the deadtime correction software involvesinvestigating and correcting for the mass shift associated with mass spectral peaks oflow intensity (predominantly single ion events) compared to mass shifts associatedwith more intense mass spectral peaks (significant multiple ion events). In thesituation where the gain of the MCP is too low to detect the majority of the single ionevents the mass shifts observed will not follow the theoretically calculatedcharacteristics of the system. The result is that although it may be possible to producean acceptable calibration at one particular beam intensity ( by adjusting the Npmultiplier value), this calibration will not be correct at different ion intensities. Thiswill result in poor calibrations and erratic mass measurement accuracy.
Effect of low MCP gain on ResolutionBecause single ion pulses have finite width, approximately 4-5 ns at the base, the timeat which a single ion will be recorded will vary by a small amount depending onwhere it passes through the Signal Threshold. Fig 9 shows two single ions whicheffectively arrive at the same time but with different intensities. Because the leadingedge of each ion passes through the Signal Threshold at slightly different times eachion is recorded with a slightly different flight time. This effect results in a slightbroadening of the final mass spectral peak and reduction in resolution.
From Fig 9. above it follows that the larger the variation in single ion peak heights thegreater the spread of ion arrival times and hence the poorer the resolution. In thesituation where the gain is set too low to record the majority of single ions, thosewhich are recorded have a narrower distribution signal intensities than the full set ofsignal intensities arriving at the TDC input. The resolution in this case is enhanced.
Appendix 2 Ion Counting on TOF Instruments using a TDCPage 206
GCTUser's Guide
Signal Threshold
4ns
Fig 9. Effect of single ion height on event time
T1
T2

Index
AAccurate mass 149, 161Acquisition 25, 32, 101, 123Active inverted magnetron gauge 168, 191Air filter 167Ammonia
CI mode 15Analog channels 32, 97, 136Attenuator 186, 189, 190
BBallast
Rotary pump 196
CCalibration 149
CI positive mode 160Dynamic External Calibration (DXC) 151, 161EI mode 155FI mode 159
Capillary 59, 171Centroid 99, 124, 152, 163, 164Centroid data 129Charging 173Cleaning 165, 178Column
Column selection 201Conditioning 202Correct column position 188Installation 201
Communication status 96Cone 135Continuum 87, 101, 124Cooling fan 167
DData acquisition 123Data processing 102DCI probe 67
Faultfinding and tips 195Deadtime correction 156
Exact mass measurements 163Direct chemical ionisation (DCI) 67Direct insertion probe 59
Inserting the probe 62Installing probe lock 60Sample loading 61Temperature control 64
DXC (Dynamic External Calibration) 161DXC Troubleshooting 193
IndexPage 207
GCTUser's Guide
EElectronics 27
Power requirements 14End mass 130ESD earth 31Event out 31Exhaust 13
FFault finding 165Focus 73, 92Fragmentation 92, 108Full scan function 134Function list editor 132Fused silica capillary 201Fused silica leak 42
Reference reservoir 171Replacement 170, 171
GGas ballasting 196GC interface 20
Control 93Installation 48
GC-MS 201
IInner source
Maintenance 172Removal and installation 47
Inter scan time 130
LLights
Front panel indicators 28, 30Lock mass 151
Lock mass correction 162
MMaintenance and fault finding 165MCA 129MCP detector
Conditioning 42, 43Method 135Multi channel analysis (MCA) 129Multiple samples 130
NNitrogen 40, 43, 73, 173, 178, 187Noise 81, 191
IndexPage 208
GCTUser's Guide

OOil
Disposal 14Oil mist filter 196Rotray pump oil 196
Operate/Standby light 30Optical communications link 31Outer source EI/CI
Removal and maintenance 173
PPanels and covers
Removal 166Penning
See: Active inverted magnetron gaugePirani gauge 63, 91, 168Power port 2 162Power requirements 14, 27Preamplifier 189Probe
Direct insertion probe 22Probe lock 48Probe temperature 64Solids insertion probe 59
Process 139Pusher 24Pusher
Pusher interval 95
RReference inlet
See: Septum interfaceReflectron 24Rotary pump 13, 15, 35, 36, 167, 169Run duration 130
User ProceduresPage 211
GCTUser's Guide

SSaturation effects 74Scan time 130Sensitivity 18, 25, 92, 95, 108
Poor sensitivity in CI mode 188Poor sensitivity in EI mode 187
Septum interfaceMaintenance 170
ShutdownShutdown procedures 45
SIP 41Solvent delay 136Source
Inner source maintenance 172Outer source collimating slits 178Outer source maintenance 173Outer source removal 174Quick clean procedure 178
Start 44Start mass 130
TTDC
See: Time to digital converterThreshold
Signal threshold 99Trigger threshold 98
Time to digital converter 18, 31, 98, 151Transfer lens 24Tuning
CI negative ion 86CI positive ion 160FI 109Source tuning menu 92
Turbomolecular pump 36
VVacuum protection 37Vacuum status light 50, 60Vacuum system
Schematic 35
User ProceduresPage 212
GCTUser's Guide