1 Tectonic hazards In this chapter you will learn about... • the global distribution of earthquakes and volcanoes • how the movement of plates leads to earthquakes and volcanic eruptions • the benefits of living in tectonically active areas • the primary and secondary effects of earthquakes and volcanic eruptions • how people respond to tectonic activity • how the effects of and responses to earthquakes vary between areas of contrasting levels of wealth. 1.1 What is the Earth made of? The Earth is made up of several layers (Figure 1.1). The top layer, called the crust, is between 5 km and 90 km in thickness. Underneath this is the mantle, a mass of hotter material which includes magma. This becomes denser towards the centre of the Earth, which is called the core and is so dense it is like solid rock. crust: the outermost layer of the Earth mantle: a layer of rock between the core and crust made of molten rock magma: heat from the Earth’s core is hot enough to melt rock in the mantle; this molten (liquid) rock is called magma core: dense hot rock at the centre of the Earth Key terms Figure 1.1 The structure of the Earth. crust oceanic crust oceanic crust mantle outer core inner core mantle mantle spreading centre collision between two continents ocean trench continent mantle continent continent subduction zone tectonic plate tectonic plate tectonic plate 10 Sample © Cambridge University Press 2016

Welcome message from author
This document is posted to help you gain knowledge. Please leave a comment to let me know what you think about it! Share it to your friends and learn new things together.
Transcript
1 Tectonic hazards
In this chapter you will learn about...
• the global distribution of earthquakes and volcanoes• how the movement of plates leads to earthquakes and volcanic
eruptions• the benefi ts of living in tectonically active areas• the primary and secondary effects of earthquakes and volcanic
eruptions• how people respond to tectonic activity• how the effects of and responses to earthquakes vary between
areas of contrasting levels of wealth.
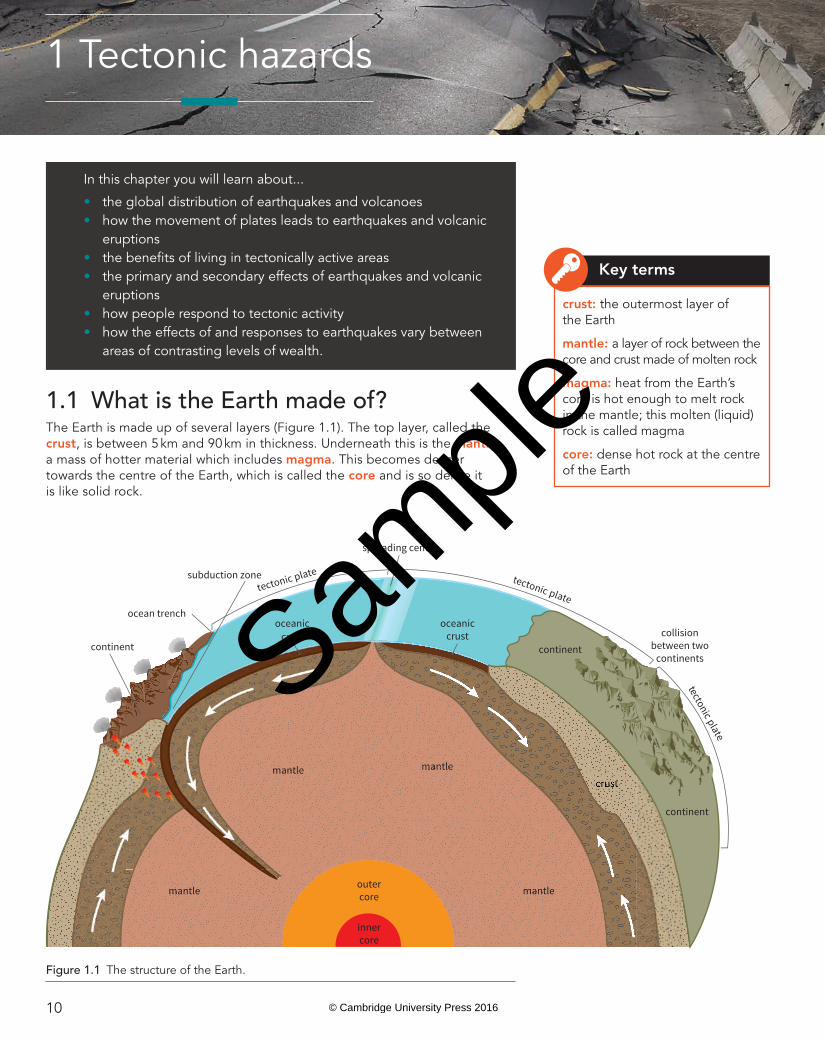
1.1 What is the Earth made of?The Earth is made up of several layers (Figure 1.1). The top layer, called the crust, is between 5 km and 90 km in thickness. Underneath this is the mantle, a mass of hotter material which includes magma. This becomes denser towards the centre of the Earth, which is called the core and is so dense it is like solid rock.
crust: the outermost layer of the Earth
mantle: a layer of rock between the core and crust made of molten rock
magma: heat from the Earth’s core is hot enough to melt rock in the mantle; this molten (liquid) rock is called magma
core: dense hot rock at the centre of the Earth
Key terms
Figure 1.1 The structure of the Earth.
crust
oceaniccrust
oceaniccrust
mantleoutercore
innercore
mantle
mantle
spreading centre
collisionbetween two
continents
ocean trench
continent
mantle
continent
continent
subduction zone tectonic plate
tectonic plate
tectonic plate
10
Sample
© Cambridge University Press 2016
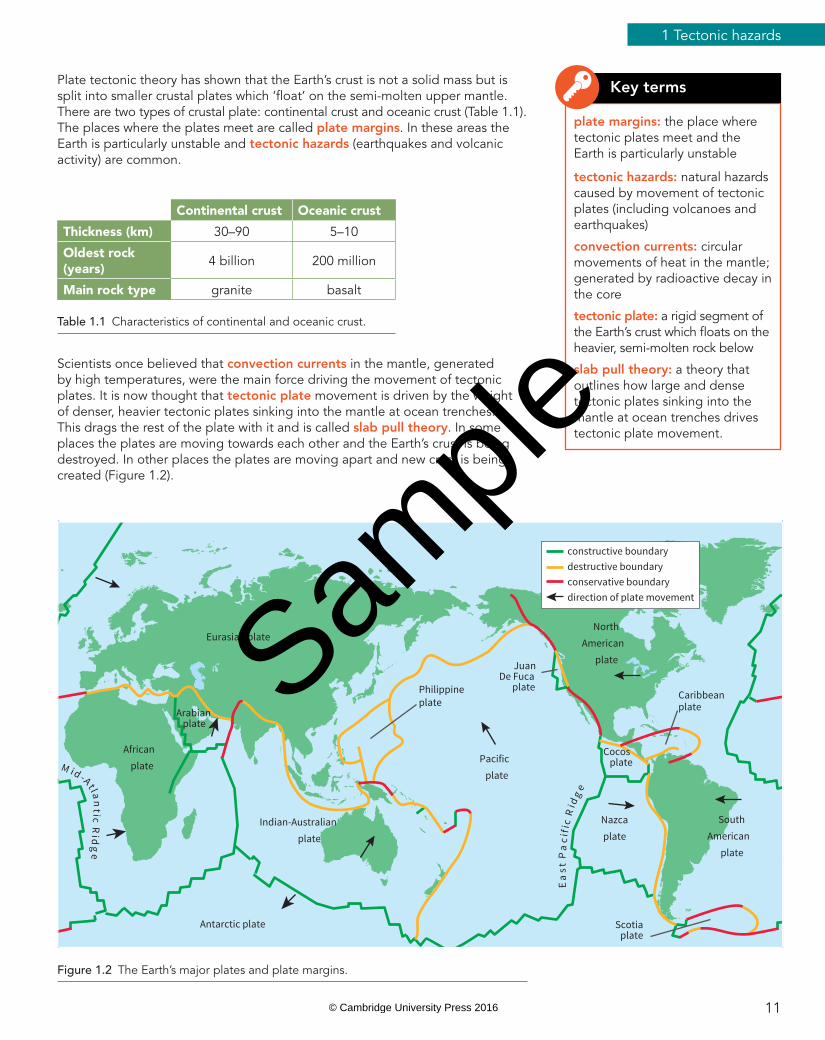
Plate tectonic theory has shown that the Earth’s crust is not a solid mass but is split into smaller crustal plates which ‘fl oat’ on the semi-molten upper mantle. There are two types of crustal plate: continental crust and oceanic crust (Table 1.1). The places where the plates meet are called plate margins. In these areas the Earth is particularly unstable and tectonic hazards (earthquakes and volcanic activity) are common.
Continental crust Oceanic crust
Thickness (km) 30–90 5–10
Oldest rock (years)
4 billion 200 million
Main rock type granite basalt
Table 1.1 Characteristics of continental and oceanic crust.
Scientists once believed that convection currents in the mantle, generated by high temperatures, were the main force driving the movement of tectonic plates. It is now thought that tectonic plate movement is driven by the weight of denser, heavier tectonic plates sinking into the mantle at ocean trenches. This drags the rest of the plate with it and is called slab pull theory. In some places the plates are moving towards each other and the Earth’s crust is being destroyed. In other places the plates are moving apart and new crust is being created (Figure 1.2).
plate margins: the place where tectonic plates meet and the Earth is particularly unstable
tectonic hazards: natural hazards caused by movement of tectonic plates (including volcanoes and earthquakes)
convection currents: circular movements of heat in the mantle; generated by radioactive decay in the core
tectonic plate: a rigid segment of the Earth’s crust which fl oats on the heavier, semi-molten rock below
slab pull theory: a theory that outlines how large and dense tectonic plates sinking into the mantle at ocean trenches drives tectonic plate movement.
Key terms
Figure 1.2 The Earth’s major plates and plate margins.
Eurasian plate
African plate
SouthAmerican
plate
NorthAmerican
plate
Nazcaplate
JuanDe Fuca
plate
Cocos platePacific
plate
Indian-Australianplate
Caribbeanplate
Scotiaplate
Antarctic plate
Philippineplate
Arabianplate
M id -A tl a ntic R
idg
e
Ea
st P
aci
fic
Rid
ge
constructive boundarydestructive boundaryconservative boundarydirection of plate movement
11
1 Tectonic hazards
Sample
© Cambridge University Press 2016
1.2 What are the different types of plate margins and their resulting landforms?Destructive plate marginsDestructive plate margins occur where two plates move towards each other (converge). This happens at subduction and collision zones.
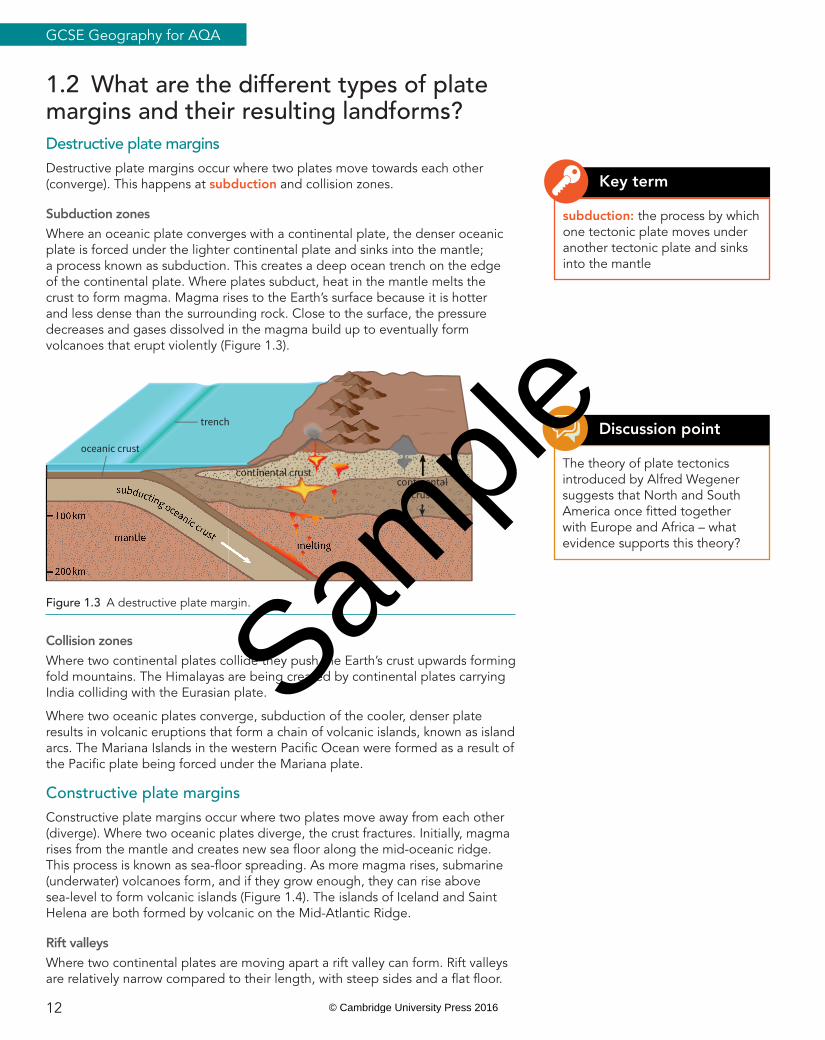
Subduction zonesWhere an oceanic plate converges with a continental plate, the denser oceanic plate is forced under the lighter continental plate and sinks into the mantle; a process known as subduction. This creates a deep ocean trench on the edge of the continental plate. Where plates subduct, heat in the mantle melts the crust to form magma. Magma rises to the Earth’s surface because it is hotter and less dense than the surrounding rock. Close to the surface, the pressure decreases and gases dissolved in the magma build up to eventually form volcanoes that erupt violently (Figure 1.3).
subducting oceanic crust
200km
100km
mantle
oceanic crust
continental crustcontinental
crust
melting
trench
Figure 1.3 A destructive plate margin.
Collision zonesWhere two continental plates collide they push the Earth’s crust upwards forming fold mountains. The Himalayas are being created by continental plates carrying India colliding with the Eurasian plate.
Where two oceanic plates converge, subduction of the cooler, denser plate results in volcanic eruptions that form a chain of volcanic islands, known as island arcs. The Mariana Islands in the western Pacifi c Ocean were formed as a result of the Pacifi c plate being forced under the Mariana plate.
Constructive plate marginsConstructive plate margins occur where two plates move away from each other (diverge). Where two oceanic plates diverge, the crust fractures. Initially, magma rises from the mantle and creates new sea fl oor along the mid-oceanic ridge. This process is known as sea-fl oor spreading. As more magma rises, submarine (underwater) volcanoes form, and if they grow enough, they can rise above sea-level to form volcanic islands (Figure 1.4). The islands of Iceland and Saint Helena are both formed by volcanic on the Mid-Atlantic Ridge.
Rift valleysWhere two continental plates are moving apart a rift valley can form. Rift valleys are relatively narrow compared to their length, with steep sides and a fl at fl oor.
subduction: the process by which one tectonic plate moves under another tectonic plate and sinks into the mantle
Key term
The theory of plate tectonics introduced by Alfred Wegener suggests that North and South America once fi tted together with Europe and Africa – what evidence supports this theory?
Discussion point
12
GCSE Geography for AQA
Sample
© Cambridge University Press 2016
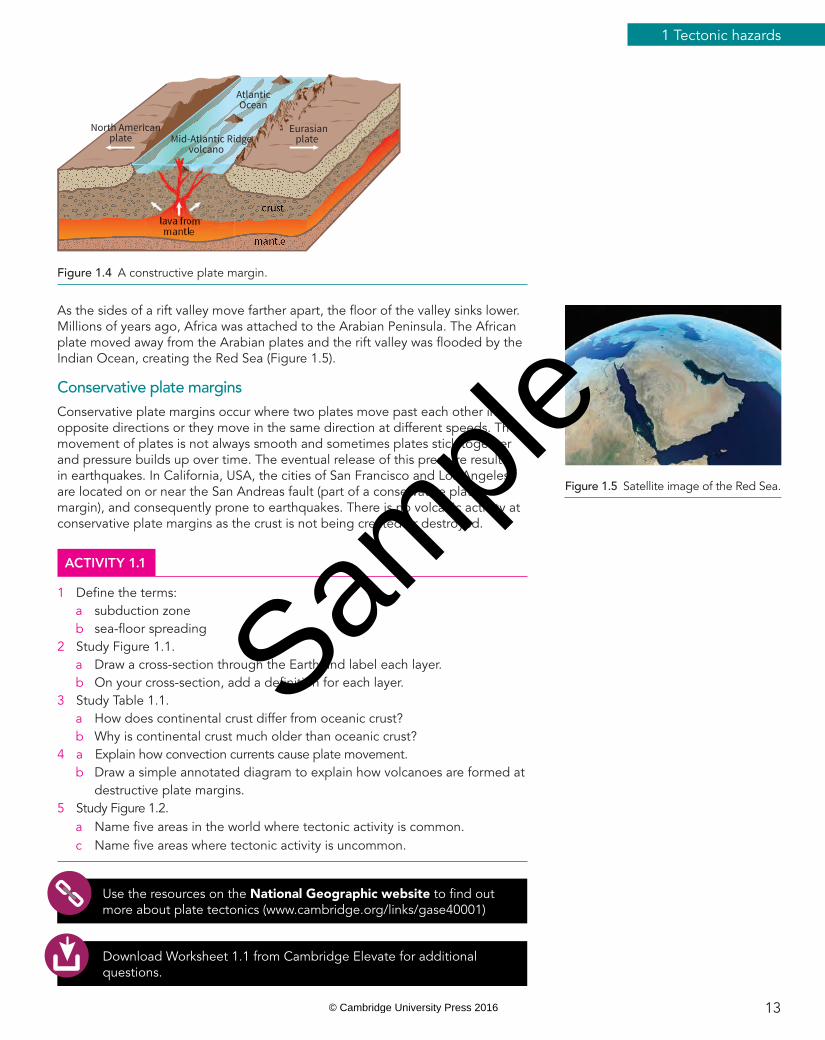
Figure 1.5 Satellite image of the Red Sea.
As the sides of a rift valley move farther apart, the fl oor of the valley sinks lower. Millions of years ago, Africa was attached to the Arabian Peninsula. The African plate moved away from the Arabian plates and the rift valley was fl ooded by the Indian Ocean, creating the Red Sea (Figure 1.5).
Conservative plate marginsConservative plate margins occur where two plates move past each other in opposite directions or they move in the same direction at different speeds. The movement of plates is not always smooth and sometimes plates stick together and pressure builds up over time. The eventual release of this pressure results in earthquakes. In California, USA, the cities of San Francisco and Los Angeles, are located on or near the San Andreas fault (part of a conservative plate margin), and consequently prone to earthquakes. There is no volcanic activity at conservative plate margins as the crust is not being created or destroyed.
Use the resources on the National Geographic website to fi nd out more about plate tectonics (www.cambridge.org/links/gase40001)
ACTIVITY 1.1
1 Defi ne the terms:a subduction zoneb sea-fl oor spreading
2 Study Figure 1.1.a Draw a cross-section through the Earth and label each layer.b On your cross-section, add a defi nition for each layer.
3 Study Table 1.1.a How does continental crust differ from oceanic crust?b Why is continental crust much older than oceanic crust?
4 a Explain how convection currents cause plate movement.b Draw a simple annotated diagram to explain how volcanoes are formed at
destructive plate margins.5 Study Figure 1.2.
a Name fi ve areas in the world where tectonic activity is common.c Name fi ve areas where tectonic activity is uncommon.
Download Worksheet 1.1 from Cambridge Elevate for additional questions.
crust
Eurasianplate
AtlanticOcean
Mid-Atlantic Ridgevolcano
mantle
lava frommantle
North Americanplate
Figure 1.4 A constructive plate margin.
13
1 Tectonic hazards
Sample
© Cambridge University Press 2016
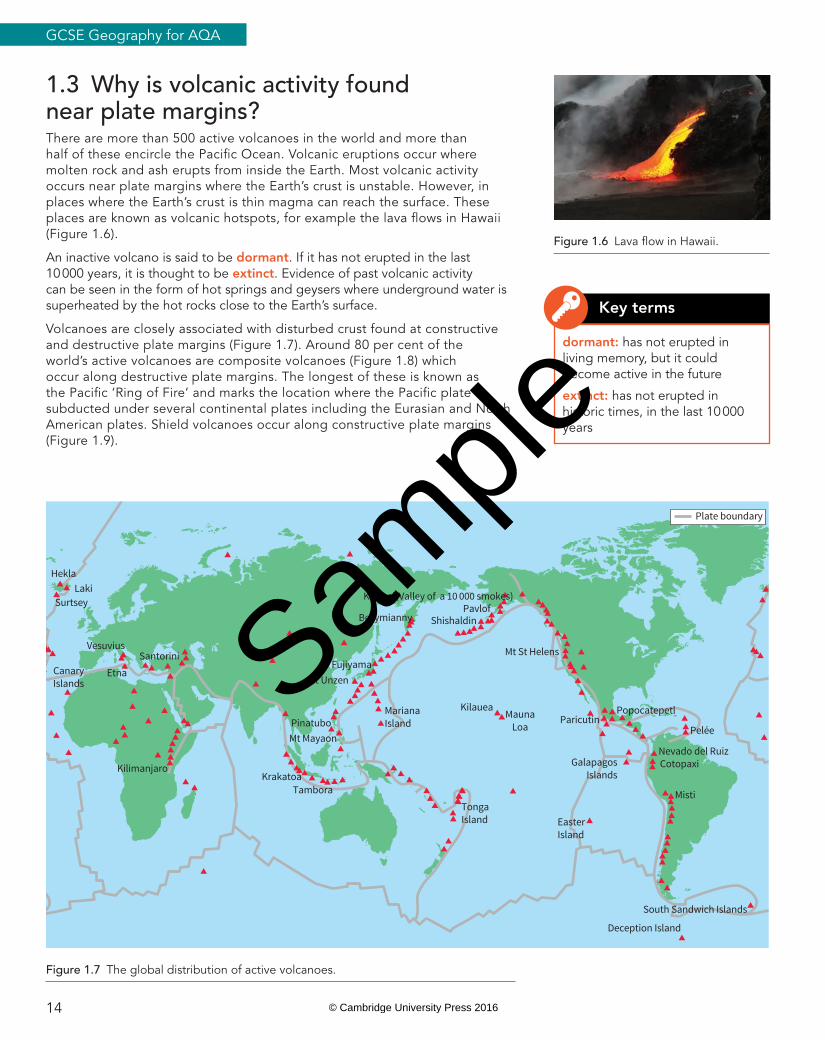
1.3 Why is volcanic activity found near plate margins?There are more than 500 active volcanoes in the world and more than half of these encircle the Pacifi c Ocean. Volcanic eruptions occur where molten rock and ash erupts from inside the Earth. Most volcanic activity occurs near plate margins where the Earth’s crust is unstable. However, in places where the Earth’s crust is thin magma can reach the surface. These places are known as volcanic hotspots, for example the lava fl ows in Hawaii (Figure 1.6).
An inactive volcano is said to be dormant. If it has not erupted in the last 10 000 years, it is thought to be extinct. Evidence of past volcanic activity can be seen in the form of hot springs and geysers where underground water is superheated by the hot rocks close to the Earth’s surface.
Volcanoes are closely associated with disturbed crust found at constructive and destructive plate margins (Figure 1.7). Around 80 per cent of the world’s active volcanoes are composite volcanoes (Figure 1.8) which occur along destructive plate margins. The longest of these is known as the Pacifi c ‘Ring of Fire’ and marks the location where the Pacifi c plate is subducted under several continental plates including the Eurasian and North American plates. Shield volcanoes occur along constructive plate margins (Figure 1.9).
Figure 1.6 Lava fl ow in Hawaii.
Figure 1.7 The global distribution of active volcanoes.
Katmai (Valley of a 10 000 smokes)
Mt St Helens
PopocatepetlParicutin
Nevado del Ruiz
Misti
South Sandwich Islands
Kilimanjaro
Etna Santorini
Bezymianny
FujiyamaMt Unzen
Mt Mayaon
KrakatoaTambora
Mariana Island
TongaIsland
Pinatubo
LakiSurtsey
Hekla
Vesuvius
Deception Island
Cotopaxi
Pelée
PavlofShishaldin
Kilauea
Easter Island
GalapagosIslands
CanaryIslands
MaunaLoa
Plate boundary
dormant: has not erupted in living memory, but it could become active in the future
extinct: has not erupted in historic times, in the last 10 000 years
Key terms
14
GCSE Geography for AQA
Sample
© Cambridge University Press 2016
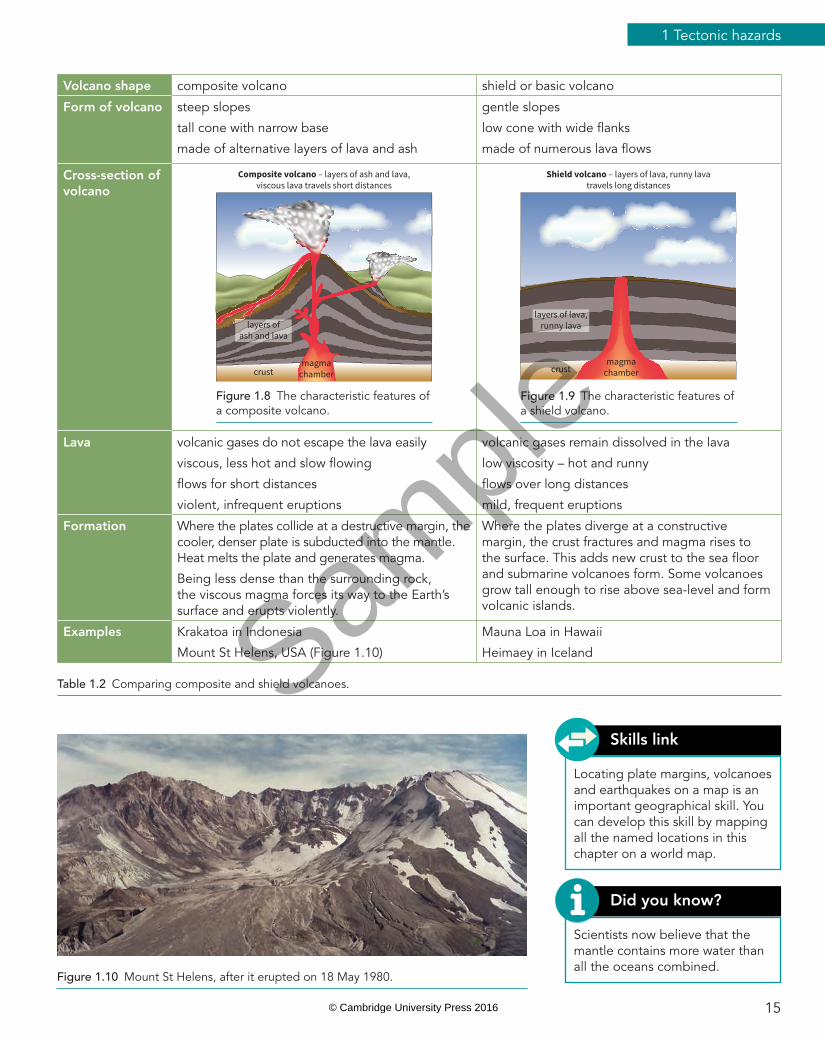
Volcano shape composite volcano shield or basic volcano
Form of volcano steep slopes
tall cone with narrow base
made of alternative layers of lava and ash
gentle slopes
low cone with wide fl anks
made of numerous lava fl ows
Cross-section of volcano
magmachambercrust
Composite volcano – layers of ash and lava,viscous lava travels short distances
layers ofash and lava
Figure 1.8 The characteristic features of a composite volcano.
magmachambercrust
Shield volcano – layers of lava, runny lavatravels long distances
layers of lava,runny lava
Figure 1.9 The characteristic features of a shield volcano.
Lava volcanic gases do not escape the lava easily
viscous, less hot and slow fl owing
fl ows for short distances
violent, infrequent eruptions
volcanic gases remain dissolved in the lava
low viscosity – hot and runny
fl ows over long distances
mild, frequent eruptions
Formation Where the plates collide at a destructive margin, the cooler, denser plate is subducted into the mantle. Heat melts the plate and generates magma.
Being less dense than the surrounding rock, the viscous magma forces its way to the Earth’s surface and erupts violently.
Where the plates diverge at a constructive margin, the crust fractures and magma rises to the surface. This adds new crust to the sea fl oor and submarine volcanoes form. Some volcanoes grow tall enough to rise above sea-level and form volcanic islands.
Examples Krakatoa in Indonesia
Mount St Helens, USA (Figure 1.10)
Mauna Loa in Hawaii
Heimaey in Iceland
Table 1.2 Comparing composite and shield volcanoes.
Locating plate margins, volcanoes and earthquakes on a map is an important geographical skill. You can develop this skill by mapping all the named locations in this chapter on a world map.
Skills link
Scientists now believe that the mantle contains more water than all the oceans combined.
Did you know?
Figure 1.10 Mount St Helens, after it erupted on 18 May 1980.
15
1 Tectonic hazards
Sample
© Cambridge University Press 2016
1.4 Volcanic hazardsVolcanic eruptions are hazardous. Volcanic bombs, pyroclastic fl ows, ash and gas clouds can all kill people when volcanoes erupt suddenly. As the time between eruptions can be long, many people can live safely near volcanoes, never experiencing any of the hazards shown in Table 1.3.
Volcanic eruptions have primary and secondary hazards. Primary hazards are directly caused by the volcano while secondary hazards are caused indirectly, as a result of the primary hazards.
Primary hazards Secondary hazards
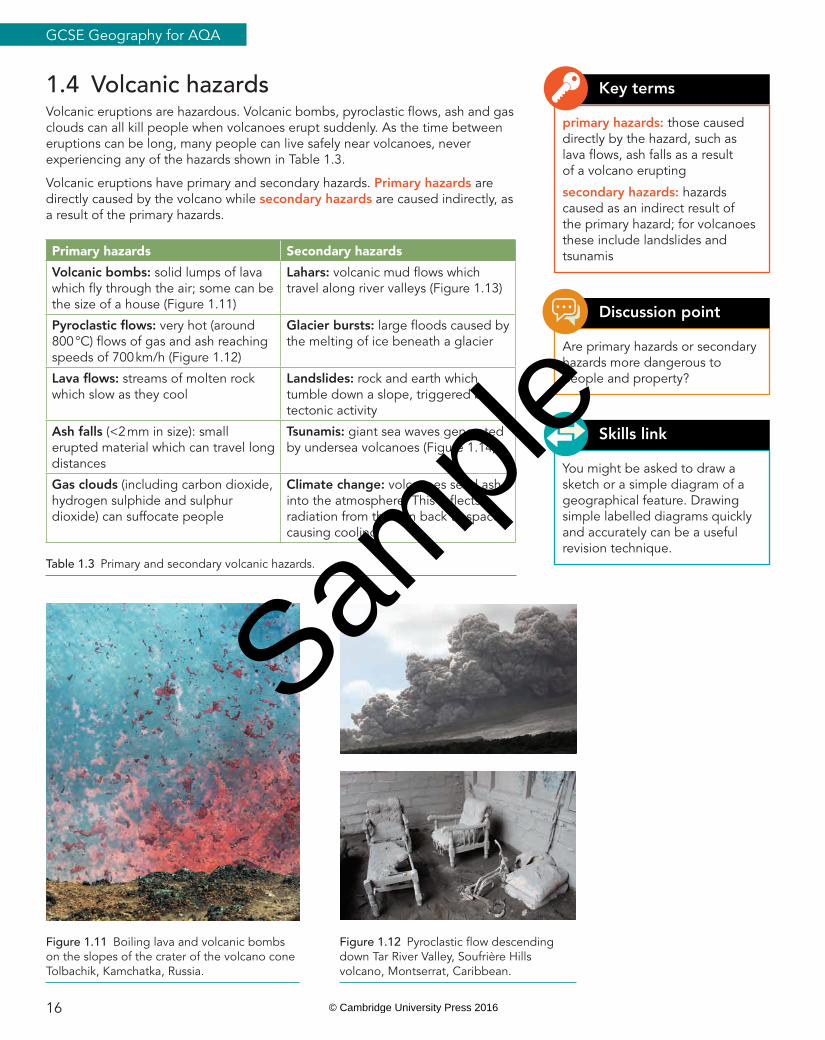
Volcanic bombs: solid lumps of lava which fl y through the air; some can be the size of a house (Figure 1.11)
Lahars: volcanic mud fl ows which travel along river valleys (Figure 1.13)
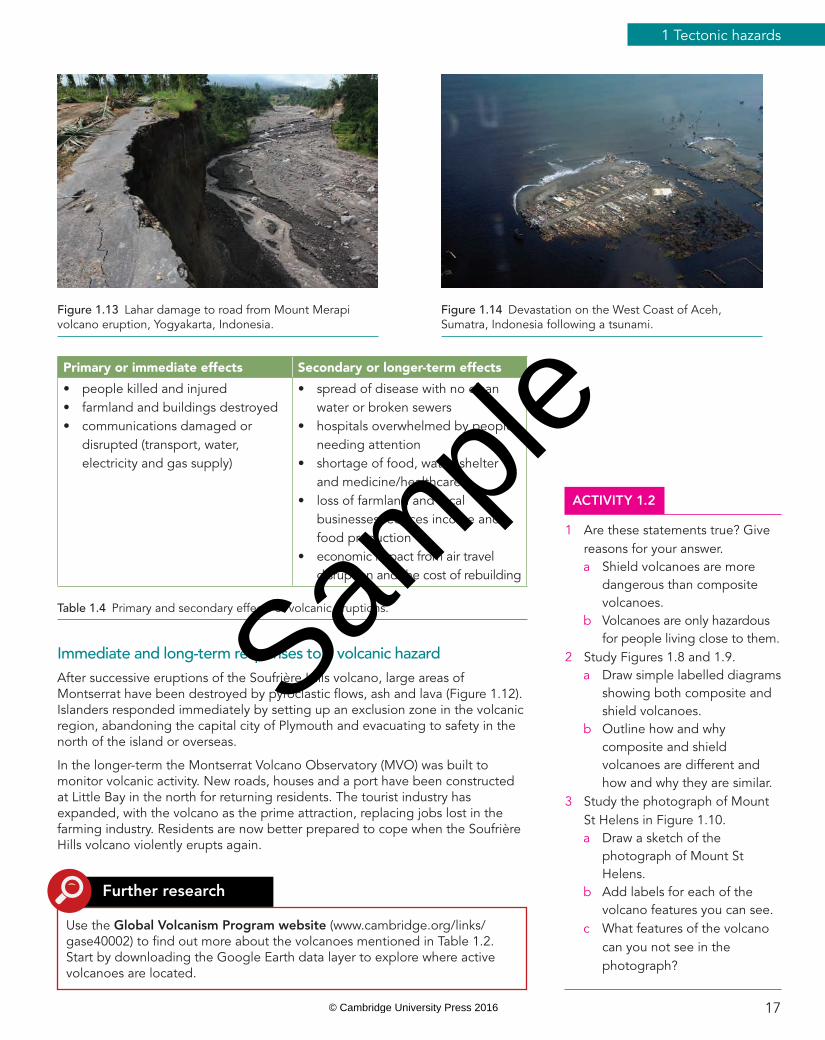
Pyroclastic fl ows: very hot (around 800 °C) fl ows of gas and ash reaching speeds of 700 km/h (Figure 1.12)
Glacier bursts: large fl oods caused by the melting of ice beneath a glacier
Lava fl ows: streams of molten rock which slow as they cool
Landslides: rock and earth which tumble down a slope, triggered by tectonic activity
Ash falls (<2 mm in size): small erupted material which can travel long distances
Tsunamis: giant sea waves generated by undersea volcanoes (Figure 1.14)
Gas clouds (including carbon dioxide, hydrogen sulphide and sulphur dioxide) can suffocate people
Climate change: volcanoes send ash into the atmosphere. This refl ects radiation from the Sun back to space, causing cooling
Table 1.3 Primary and secondary volcanic hazards.
You might be asked to draw a sketch or a simple diagram of a geographical feature. Drawing simple labelled diagrams quickly and accurately can be a useful revision technique.
Skills link
Are primary hazards or secondary hazards more dangerous to people and property?
Discussion point
primary hazards: those caused directly by the hazard, such as lava fl ows, ash falls as a result of a volcano erupting
secondary hazards: hazards caused as an indirect result of the primary hazard; for volcanoes these include landslides and tsunamis
Key terms
Figure 1.11 Boiling lava and volcanic bombs on the slopes of the crater of the volcano cone Tolbachik, Kamchatka, Russia.
Figure 1.12 Pyroclastic fl ow descending down Tar River Valley, Soufrière Hills volcano, Montserrat, Caribbean.
16
GCSE Geography for AQA
Sample
© Cambridge University Press 2016
ACTIVITY 1.2
1 Are these statements true? Give reasons for your answer.a Shield volcanoes are more
dangerous than composite volcanoes.
b Volcanoes are only hazardous for people living close to them.
2 Study Figures 1.8 and 1.9.a Draw simple labelled diagrams
showing both composite and shield volcanoes.
b Outline how and why composite and shield volcanoes are different and how and why they are similar.
3 Study the photograph of Mount St Helens in Figure 1.10.a Draw a sketch of the
photograph of Mount St Helens.
b Add labels for each of the volcano features you can see.
c What features of the volcano can you not see in the photograph?
Primary or immediate effects Secondary or longer-term effects
• people killed and injured• farmland and buildings destroyed• communications damaged or
disrupted (transport, water, electricity and gas supply)
• spread of disease with no clean water or broken sewers
• hospitals overwhelmed by people needing attention
• shortage of food, water, shelter and medicine/healthcare
• loss of farmland and local businesses reduces income and food production
• economic impact from air travel disruption and the cost of rebuilding
Table 1.4 Primary and secondary effects of volcanic eruptions.
Use the Global Volcanism Program website (www.cambridge.org/links/gase40002) to fi nd out more about the volcanoes mentioned in Table 1.2. Start by downloading the Google Earth data layer to explore where active volcanoes are located.
Further research
Figure 1.13 Lahar damage to road from Mount Merapi volcano eruption, Yogyakarta, Indonesia.
Figure 1.14 Devastation on the West Coast of Aceh, Sumatra, Indonesia following a tsunami.
Immediate and long-term responses to a volcanic hazardAfter successive eruptions of the Soufrière Hills volcano, large areas of Montserrat have been destroyed by pyroclastic fl ows, ash and lava (Figure 1.12). Islanders responded immediately by setting up an exclusion zone in the volcanic region, abandoning the capital city of Plymouth and evacuating to safety in the north of the island or overseas.
In the longer-term the Montserrat Volcano Observatory (MVO) was built to monitor volcanic activity. New roads, houses and a port have been constructed at Little Bay in the north for returning residents. The tourist industry has expanded, with the volcano as the prime attraction, replacing jobs lost in the farming industry. Residents are now better prepared to cope when the Soufrière Hills volcano violently erupts again.
17
1 Tectonic hazards
Sample
© Cambridge University Press 2016
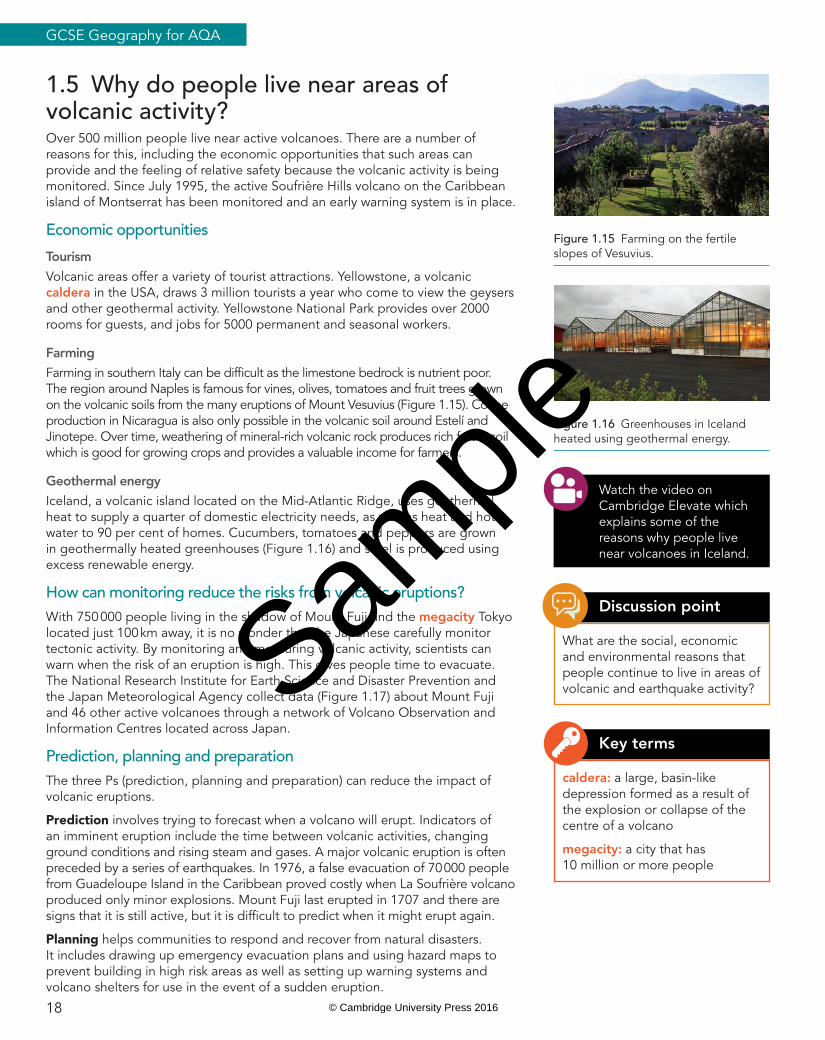
1.5 Why do people live near areas of volcanic activity?Over 500 million people live near active volcanoes. There are a number of reasons for this, including the economic opportunities that such areas can provide and the feeling of relative safety because the volcanic activity is being monitored. Since July 1995, the active Soufrière Hills volcano on the Caribbean island of Montserrat has been monitored and an early warning system is in place.
Economic opportunities
TourismVolcanic areas offer a variety of tourist attractions. Yellowstone, a volcanic caldera in the USA, draws 3 million tourists a year who come to view the geysers and other geothermal activity. Yellowstone National Park provides over 2000 rooms for guests, and jobs for 5000 permanent and seasonal workers.
FarmingFarming in southern Italy can be diffi cult as the limestone bedrock is nutrient poor. The region around Naples is famous for vines, olives, tomatoes and fruit trees grown on the volcanic soils from the many eruptions of Mount Vesuvius (Figure 1.15). Coffee production in Nicaragua is also only possible in the volcanic soil around Estelí and Jinotepe. Over time, weathering of mineral-rich volcanic rock produces rich fertile soil which is good for growing crops and provides a valuable income for farmers.
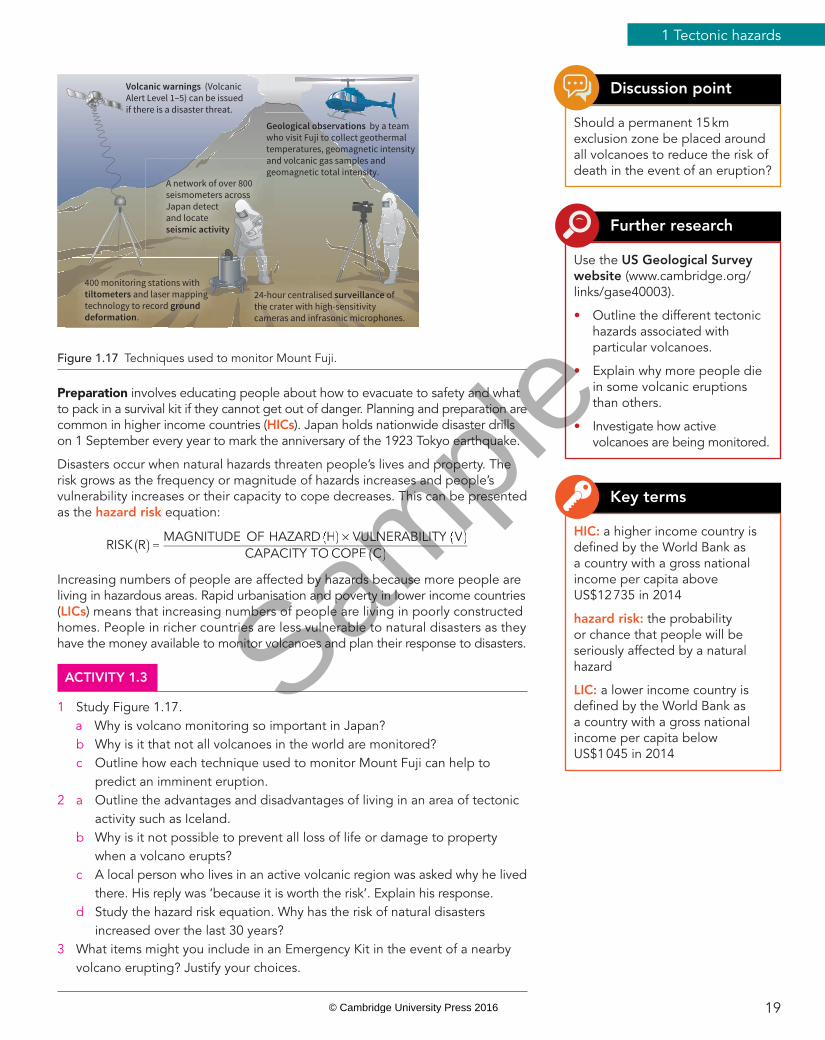
Geothermal energyIceland, a volcanic island located on the Mid-Atlantic Ridge, uses geothermal heat to supply a quarter of domestic electricity needs, as well as heat and hot water to 90 per cent of homes. Cucumbers, tomatoes and peppers are grown in geothermally heated greenhouses (Figure 1.16) and steel is produced using excess renewable energy.
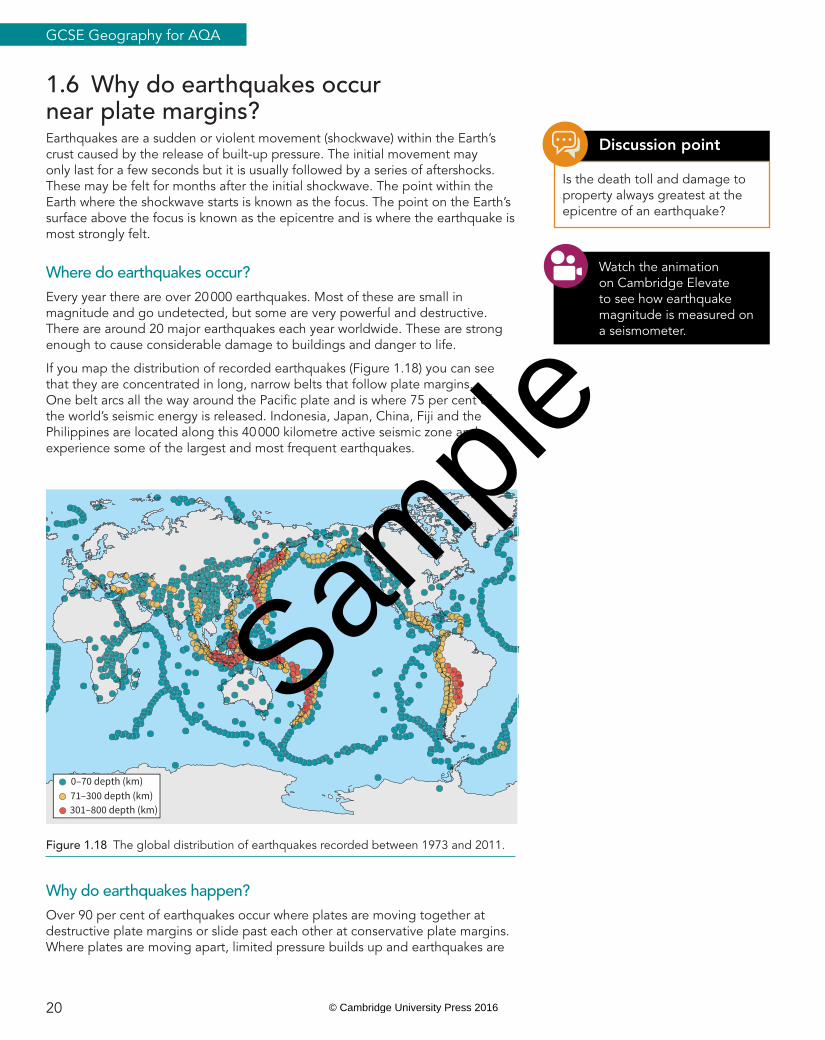
How can monitoring reduce the risks from volcanic eruptions?With 750 000 people living in the shadow of Mount Fuji and the megacity Tokyo located just 100 km away, it is no wonder that the Japanese carefully monitor tectonic activity. By monitoring and measuring volcanic activity, scientists can warn when the risk of an eruption is high. This gives people time to evacuate. The National Research Institute for Earth Science and Disaster Prevention and the Japan Meteorological Agency collect data (Figure 1.17) about Mount Fuji and 46 other active volcanoes through a network of Volcano Observation and Information Centres located across Japan.
Prediction, planning and preparationThe three Ps (prediction, planning and preparation) can reduce the impact of volcanic eruptions.
Prediction involves trying to forecast when a volcano will erupt. Indicators of an imminent eruption include the time between volcanic activities, changing ground conditions and rising steam and gases. A major volcanic eruption is often preceded by a series of earthquakes. In 1976, a false evacuation of 70 000 people from Guadeloupe Island in the Caribbean proved costly when La Soufrière volcano produced only minor explosions. Mount Fuji last erupted in 1707 and there are signs that it is still active, but it is diffi cult to predict when it might erupt again.
Planning helps communities to respond and recover from natural disasters. It includes drawing up emergency evacuation plans and using hazard maps to prevent building in high risk areas as well as setting up warning systems and volcano shelters for use in the event of a sudden eruption.
Figure 1.15 Farming on the fertile slopes of Vesuvius.
Watch the video on Cambridge Elevate which explains some of the reasons why people live near volcanoes in Iceland.
What are the social, economic and environmental reasons that people continue to live in areas of volcanic and earthquake activity?
Discussion point
Figure 1.16 Greenhouses in Iceland heated using geothermal energy.
caldera: a large, basin-like depression formed as a result of the explosion or collapse of the centre of a volcano
megacity: a city that has 10 million or more people
Key terms
18
GCSE Geography for AQA
Sample
© Cambridge University Press 2016
Preparation involves educating people about how to evacuate to safety and what to pack in a survival kit if they cannot get out of danger. Planning and preparation are common in higher income countries (HICs). Japan holds nationwide disaster drills on 1 September every year to mark the anniversary of the 1923 Tokyo earthquake.
Disasters occur when natural hazards threaten people’s lives and property. The risk grows as the frequency or magnitude of hazards increases and people’s vulnerability increases or their capacity to cope decreases. This can be presented as the hazard risk equation:
RISKHAZARDD VULNERABILITY
CAPACITY TOMAGNITUDE OF( )R ( )H ( )V= ×
CO OPE C( )Increasing numbers of people are affected by hazards because more people are living in hazardous areas. Rapid urbanisation and poverty in lower income countries (LICs) means that increasing numbers of people are living in poorly constructed homes. People in richer countries are less vulnerable to natural disasters as they have the money available to monitor volcanoes and plan their response to disasters.
Should a permanent 15 km exclusion zone be placed around all volcanoes to reduce the risk of death in the event of an eruption?
Discussion point
Use the US Geological Survey website (www.cambridge.org/links/gase40003).
• Outline the different tectonic hazards associated with particular volcanoes.
• Explain why more people die in some volcanic eruptions than others.
• Investigate how active volcanoes are being monitored.
Further research
HIC: a higher income country is defi ned by the World Bank as a country with a gross national income per capita above US$12 735 in 2014
hazard risk: the probability or chance that people will be seriously affected by a natural hazard
LIC: a lower income country is defi ned by the World Bank as a country with a gross national income per capita below US$1 045 in 2014
Key terms
Figure 1.17 Techniques used to monitor Mount Fuji.
ACTIVITY 1.3
1 Study Figure 1.17.a Why is volcano monitoring so important in Japan?
b Why is it that not all volcanoes in the world are monitored? c Outline how each technique used to monitor Mount Fuji can help to
predict an imminent eruption.2 a Outline the advantages and disadvantages of living in an area of tectonic
activity such as Iceland. b Why is it not possible to prevent all loss of life or damage to property
when a volcano erupts? c A local person who lives in an active volcanic region was asked why he lived
there. His reply was ‘because it is worth the risk’. Explain his response. d Study the hazard risk equation. Why has the risk of natural disasters
increased over the last 30 years?3 What items might you include in an Emergency Kit in the event of a nearby
volcano erupting? Justify your choices.
Geological observations by a teamwho visit Fuji to collect geothermaltemperatures, geomagnetic intensityand volcanic gas samples andgeomagnetic total intensity.
Volcanic warnings (VolcanicAlert Level 1–5) can be issuedif there is a disaster threat.
ange
A network of over 800seismometers acrossJapan detectand locateseismic activity
24-hour centralised surveillance ofthe crater with high-sensitivitycameras and infrasonic microphones.
400 monitoring stations withtiltometers and laser mappingtechnology to record grounddeformation.
19
1 Tectonic hazards
Sample
© Cambridge University Press 2016
1.6 Why do earthquakes occur near plate margins?Earthquakes are a sudden or violent movement (shockwave) within the Earth’s crust caused by the release of built-up pressure. The initial movement may only last for a few seconds but it is usually followed by a series of aftershocks. These may be felt for months after the initial shockwave. The point within the Earth where the shockwave starts is known as the focus. The point on the Earth’s surface above the focus is known as the epicentre and is where the earthquake is most strongly felt.
Where do earthquakes occur?Every year there are over 20 000 earthquakes. Most of these are small in magnitude and go undetected, but some are very powerful and destructive. There are around 20 major earthquakes each year worldwide. These are strong enough to cause considerable damage to buildings and danger to life.
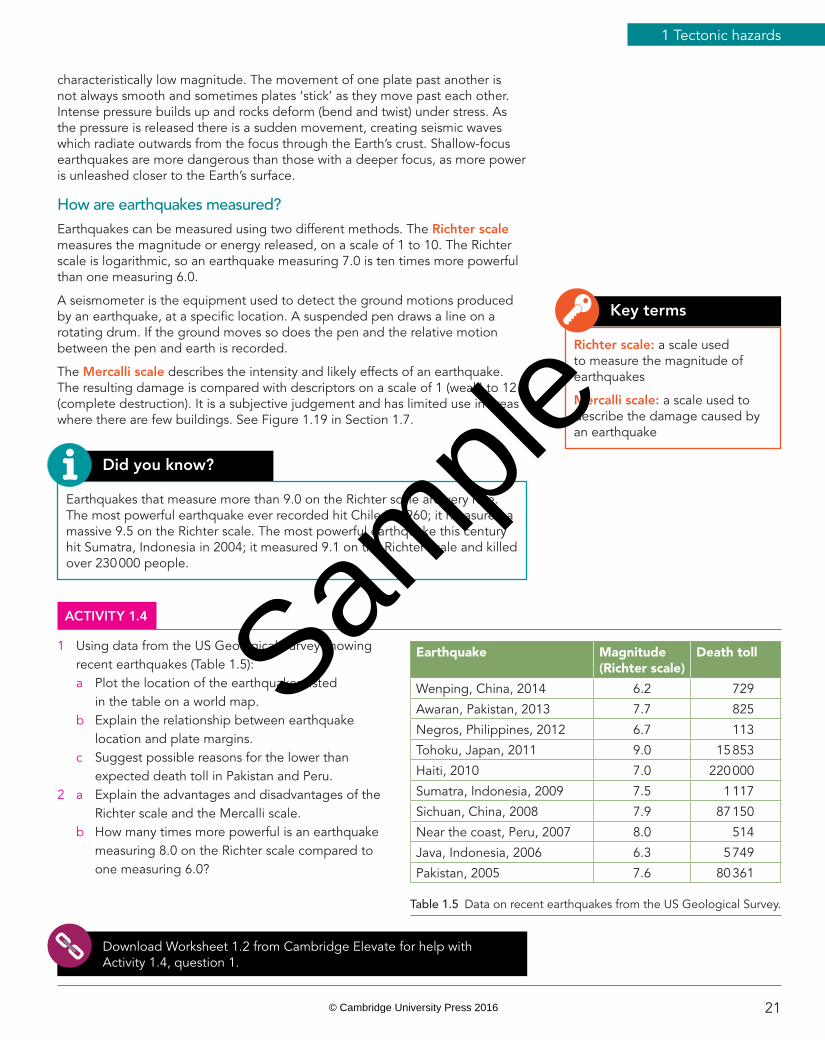
If you map the distribution of recorded earthquakes (Figure 1.18) you can see that they are concentrated in long, narrow belts that follow plate margins. One belt arcs all the way around the Pacifi c plate and is where 75 per cent of the world’s seismic energy is released. Indonesia, Japan, China, Fiji and the Philippines are located along this 40 000 kilometre active seismic zone and experience some of the largest and most frequent earthquakes.
Is the death toll and damage to property always greatest at the epicentre of an earthquake?
Discussion point
Watch the animation on Cambridge Elevate to see how earthquake magnitude is measured on a seismometer.
Figure 1.18 The global distribution of earthquakes recorded between 1973 and 2011.
0–70 depth (km)71–300 depth (km)301–800 depth (km)
Why do earthquakes happen?Over 90 per cent of earthquakes occur where plates are moving together at destructive plate margins or slide past each other at conservative plate margins. Where plates are moving apart, limited pressure builds up and earthquakes are
20
GCSE Geography for AQA
Sample
© Cambridge University Press 2016
characteristically low magnitude. The movement of one plate past another is not always smooth and sometimes plates ‘stick’ as they move past each other. Intense pressure builds up and rocks deform (bend and twist) under stress. As the pressure is released there is a sudden movement, creating seismic waves which radiate outwards from the focus through the Earth’s crust. Shallow-focus earthquakes are more dangerous than those with a deeper focus, as more power is unleashed closer to the Earth’s surface.
How are earthquakes measured?Earthquakes can be measured using two different methods. The Richter scale measures the magnitude or energy released, on a scale of 1 to 10. The Richter scale is logarithmic, so an earthquake measuring 7.0 is ten times more powerful than one measuring 6.0.
A seismometer is the equipment used to detect the ground motions produced by an earthquake, at a specifi c location. A suspended pen draws a line on a rotating drum. If the ground moves so does the pen and the relative motion between the pen and earth is recorded.
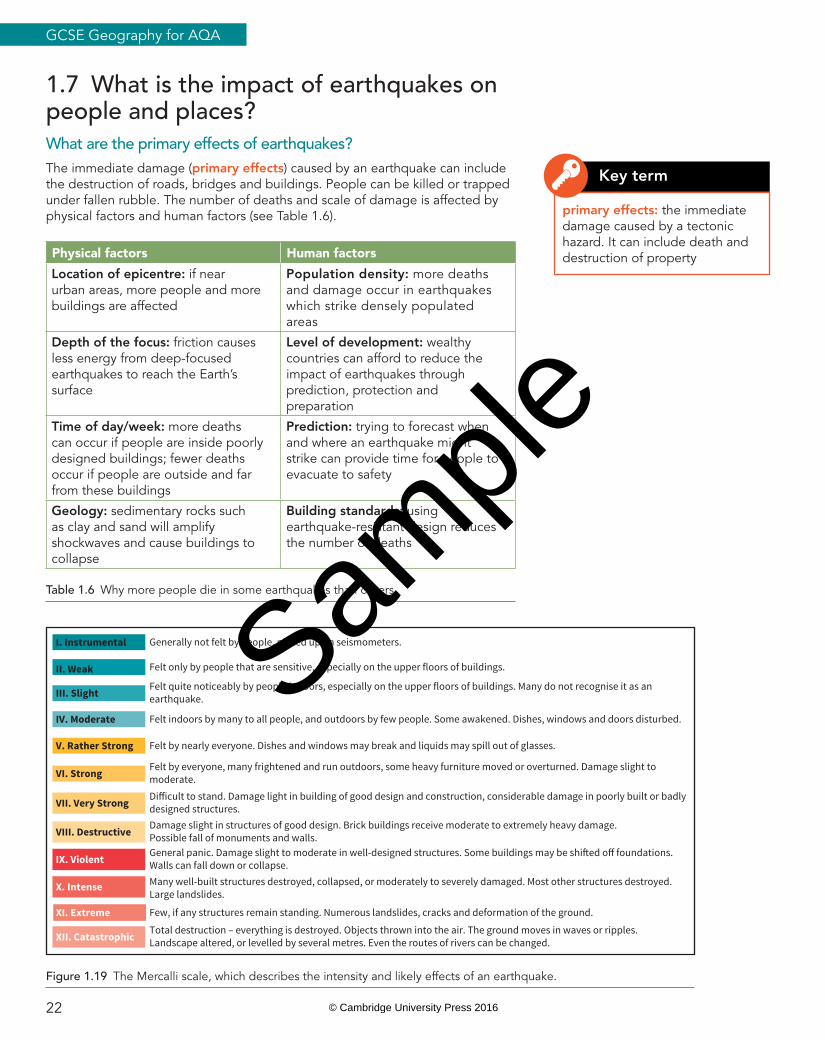
The Mercalli scale describes the intensity and likely effects of an earthquake. The resulting damage is compared with descriptors on a scale of 1 (weak) to 12 (complete destruction). It is a subjective judgement and has limited use in areas where there are few buildings. See Figure 1.19 in Section 1.7.
Download Worksheet 1.2 from Cambridge Elevate for help with Activity 1.4, question 1.
Earthquakes that measure more than 9.0 on the Richter scale are very rare. The most powerful earthquake ever recorded hit Chile in 1960; it measured a massive 9.5 on the Richter scale. The most powerful earthquake this century hit Sumatra, Indonesia in 2004; it measured 9.1 on the Richter scale and killed over 230 000 people.
Did you know?
Richter scale: a scale used to measure the magnitude of earthquakes
Mercalli scale: a scale used to describe the damage caused by an earthquake
Key terms
ACTIVITY 1.4
1 Using data from the US Geological Survey showing recent earthquakes (Table 1.5):
a Plot the location of the earthquakes listed in the table on a world map.
b Explain the relationship between earthquake location and plate margins.
c Suggest possible reasons for the lower than expected death toll in Pakistan and Peru.
2 a Explain the advantages and disadvantages of the Richter scale and the Mercalli scale.
b How many times more powerful is an earthquake measuring 8.0 on the Richter scale compared to one measuring 6.0?
Earthquake Magnitude(Richter scale)
Death toll
Wenping, China, 2014 6.2 729
Awaran, Pakistan, 2013 7.7 825
Negros, Philippines, 2012 6.7 113
Tohoku, Japan, 2011 9.0 15 853
Haiti, 2010 7.0 220 000
Sumatra, Indonesia, 2009 7.5 1 117
Sichuan, China, 2008 7.9 87 150
Near the coast, Peru, 2007 8.0 514
Java, Indonesia, 2006 6.3 5 749
Pakistan, 2005 7.6 80 361
Table 1.5 Data on recent earthquakes from the US Geological Survey.
21
1 Tectonic hazards
Sample
© Cambridge University Press 2016
1.7 What is the impact of earthquakes on people and places?What are the primary effects of earthquakes?The immediate damage (primary effects) caused by an earthquake can include the destruction of roads, bridges and buildings. People can be killed or trapped under fallen rubble. The number of deaths and scale of damage is affected by physical factors and human factors (see Table 1.6).
Physical factors Human factors
Location of epicentre: if near urban areas, more people and more buildings are affected
Population density: more deaths and damage occur in earthquakes which strike densely populated areas
Depth of the focus: friction causes less energy from deep-focused earthquakes to reach the Earth’s surface
Level of development: wealthy countries can afford to reduce the impact of earthquakes through prediction, protection and preparation
Time of day/week: more deaths can occur if people are inside poorly designed buildings; fewer deaths occur if people are outside and far from these buildings
Prediction: trying to forecast when and where an earthquake might strike can provide time for people to evacuate to safety
Geology: sedimentary rocks such as clay and sand will amplify shockwaves and cause buildings to collapse
Building standards: using earthquake-resistant design reduces the number of deaths
Table 1.6 Why more people die in some earthquakes than others.
primary effects: the immediate damage caused by a tectonic hazard. It can include death and destruction of property
Key term
Figure 1.19 The Mercalli scale, which describes the intensity and likely effects of an earthquake.
I. Instrumental Generally not felt by people, picked up on seismometers.
Felt only by people that are sensitive, especially on the upper floors of buildings.II. Weak
III. Slight
IV. Moderate
V. Rather Strong
VI. Strong
VII. Very Strong
VIII. Destructive
IX. Violent
X. Intense
XI. Extreme
XII. Catastrophic
Felt quite noticeably by people indoors, especially on the upper floors of buildings. Many do not recognise it as anearthquake.
Felt indoors by many to all people, and outdoors by few people. Some awakened. Dishes, windows and doors disturbed.
Felt by nearly everyone. Dishes and windows may break and liquids may spill out of glasses.
Felt by everyone, many frightened and run outdoors, some heavy furniture moved or overturned. Damage slight tomoderate.Difficult to stand. Damage light in building of good design and construction, considerable damage in poorly built or badlydesigned structures.Damage slight in structures of good design. Brick buildings receive moderate to extremely heavy damage.Possible fall of monuments and walls.General panic. Damage slight to moderate in well-designed structures. Some buildings may be shifted off foundations.Walls can fall down or collapse.Many well-built structures destroyed, collapsed, or moderately to severely damaged. Most other structures destroyed.Large landslides.
Few, if any structures remain standing. Numerous landslides, cracks and deformation of the ground.
Total destruction – everything is destroyed. Objects thrown into the air. The ground moves in waves or ripples.Landscape altered, or levelled by several metres. Even the routes of rivers can be changed.
22
GCSE Geography for AQA
Sample
© Cambridge University Press 2016
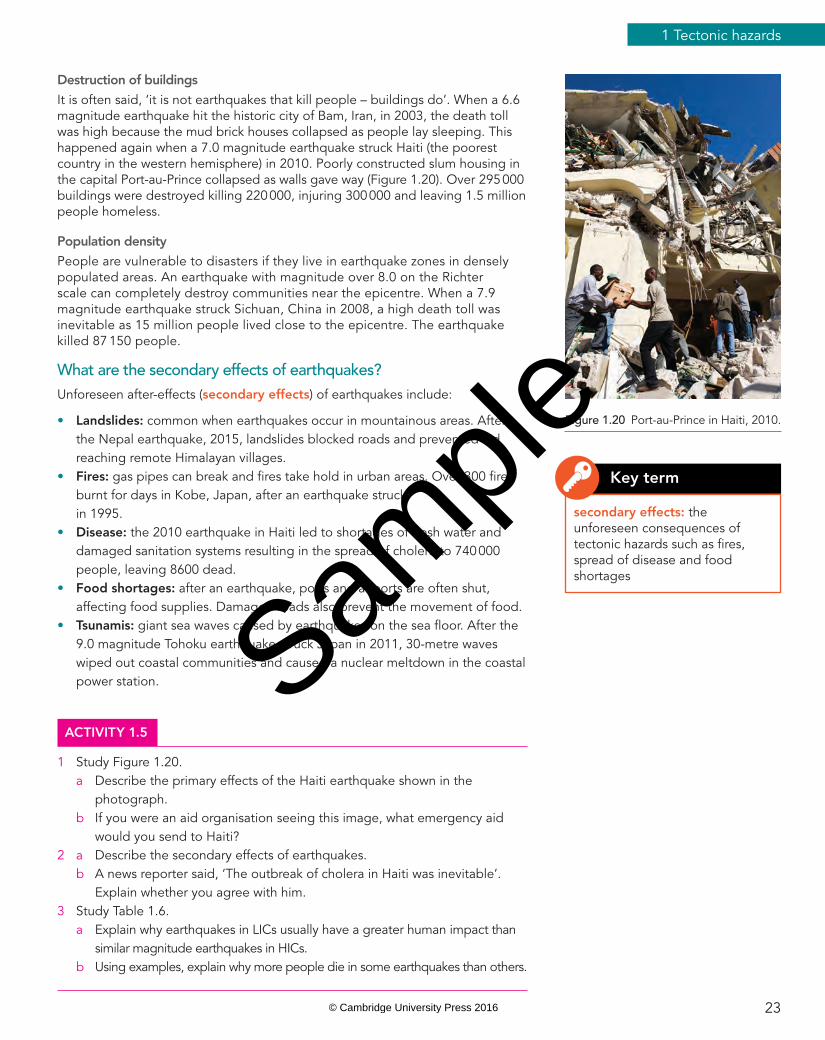
Destruction of buildingsIt is often said, ‘it is not earthquakes that kill people – buildings do’. When a 6.6 magnitude earthquake hit the historic city of Bam, Iran, in 2003, the death toll was high because the mud brick houses collapsed as people lay sleeping. This happened again when a 7.0 magnitude earthquake struck Haiti (the poorest country in the western hemisphere) in 2010. Poorly constructed slum housing in the capital Port-au-Prince collapsed as walls gave way (Figure 1.20). Over 295 000 buildings were destroyed killing 220 000, injuring 300 000 and leaving 1.5 million people homeless.
Population densityPeople are vulnerable to disasters if they live in earthquake zones in densely populated areas. An earthquake with magnitude over 8.0 on the Richter scale can completely destroy communities near the epicentre. When a 7.9 magnitude earthquake struck Sichuan, China in 2008, a high death toll was inevitable as 15 million people lived close to the epicentre. The earthquake killed 87 150 people.
What are the secondary effects of earthquakes?Unforeseen after-effects (secondary effects) of earthquakes include:
• Landslides: common when earthquakes occur in mountainous areas. After the Nepal earthquake, 2015, landslides blocked roads and prevented aid reaching remote Himalayan villages.
• Fires: gas pipes can break and fi res take hold in urban areas. Over 300 fi res burnt for days in Kobe, Japan, after an earthquake struck in 1995.
• Disease: the 2010 earthquake in Haiti led to shortages of fresh water and damaged sanitation systems resulting in the spread of cholera to 740 000 people, leaving 8600 dead.
• Food shortages: after an earthquake, ports and airports are often shut, affecting food supplies. Damaged roads also prevent the movement of food.
• Tsunamis: giant sea waves caused by earthquakes on the sea fl oor. After the 9.0 magnitude Tohoku earthquake struck Japan in 2011, 30-metre waves wiped out coastal communities and caused a nuclear meltdown in the coastal power station.
Figure 1.20 Port-au-Prince in Haiti, 2010.
secondary effects: the unforeseen consequences of tectonic hazards such as fi res, spread of disease and food shortages
Key term
ACTIVITY 1.5
1 Study Figure 1.20. a Describe the primary effects of the Haiti earthquake shown in the
photograph. b If you were an aid organisation seeing this image, what emergency aid
would you send to Haiti?2 a Describe the secondary effects of earthquakes. b A news reporter said, ‘The outbreak of cholera in Haiti was inevitable’.
Explain whether you agree with him.3 Study Table 1.6. a Explain why earthquakes in LICs usually have a greater human impact than
similar magnitude earthquakes in HICs. b Using examples, explain why more people die in some earthquakes than others.
23
1 Tectonic hazards
Sample
© Cambridge University Press 2016
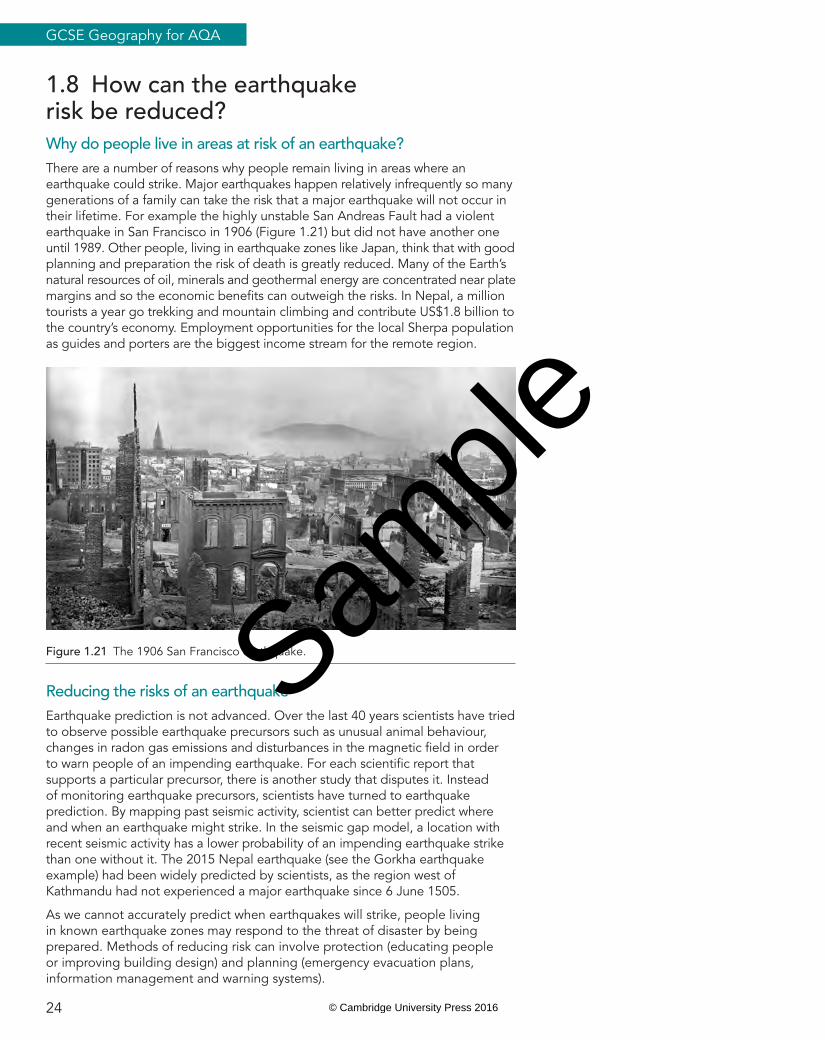
1.8 How can the earthquake risk be reduced?Why do people live in areas at risk of an earthquake?There are a number of reasons why people remain living in areas where an earthquake could strike. Major earthquakes happen relatively infrequently so many generations of a family can take the risk that a major earthquake will not occur in their lifetime. For example the highly unstable San Andreas Fault had a violent earthquake in San Francisco in 1906 (Figure 1.21) but did not have another one until 1989. Other people, living in earthquake zones like Japan, think that with good planning and preparation the risk of death is greatly reduced. Many of the Earth’s natural resources of oil, minerals and geothermal energy are concentrated near plate margins and so the economic benefi ts can outweigh the risks. In Nepal, a million tourists a year go trekking and mountain climbing and contribute US$1.8 billion to the country’s economy. Employment opportunities for the local Sherpa population as guides and porters are the biggest income stream for the remote region.
Figure 1.21 The 1906 San Francisco earthquake.
Reducing the risks of an earthquakeEarthquake prediction is not advanced. Over the last 40 years scientists have tried to observe possible earthquake precursors such as unusual animal behaviour, changes in radon gas emissions and disturbances in the magnetic fi eld in order to warn people of an impending earthquake. For each scientifi c report that supports a particular precursor, there is another study that disputes it. Instead of monitoring earthquake precursors, scientists have turned to earthquake prediction. By mapping past seismic activity, scientist can better predict where and when an earthquake might strike. In the seismic gap model, a location with recent seismic activity has a lower probability of an impending earthquake strike than one without it. The 2015 Nepal earthquake (see the Gorkha earthquake example) had been widely predicted by scientists, as the region west of Kathmandu had not experienced a major earthquake since 6 June 1505.
As we cannot accurately predict when earthquakes will strike, people living in known earthquake zones may respond to the threat of disaster by being prepared. Methods of reducing risk can involve protection (educating people or improving building design) and planning (emergency evacuation plans, information management and warning systems).
24
GCSE Geography for AQA
Sample
© Cambridge University Press 2016
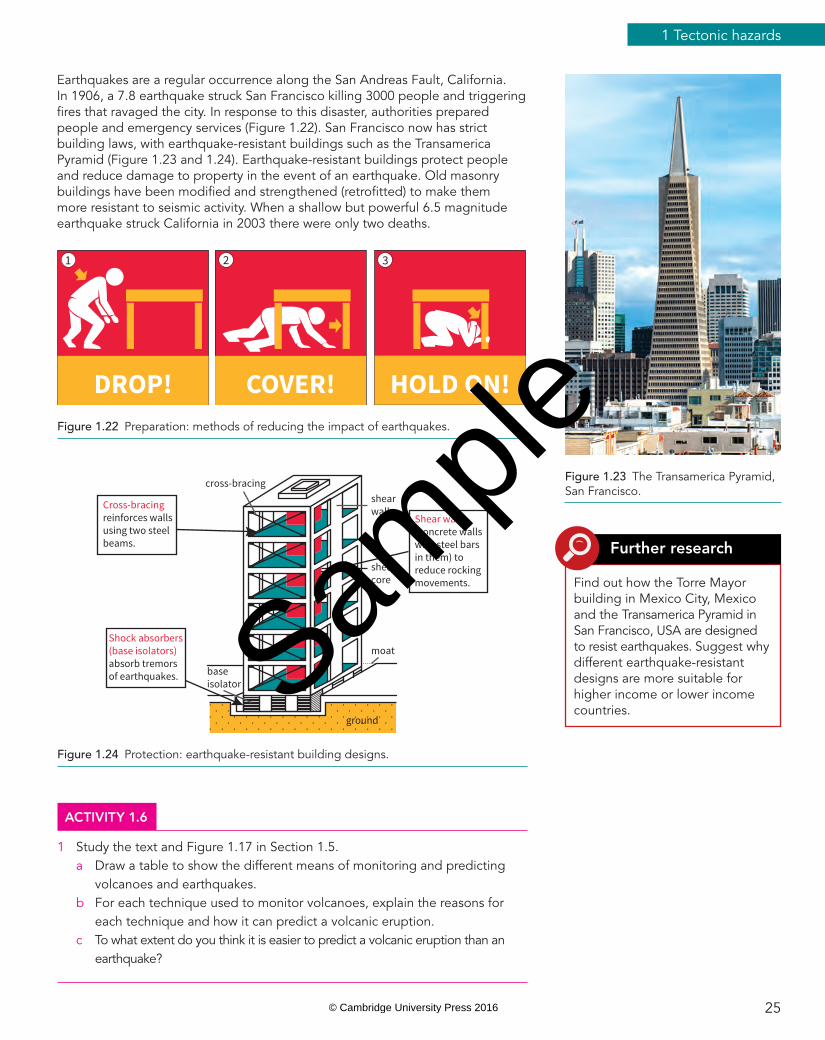
Earthquakes are a regular occurrence along the San Andreas Fault, California. In 1906, a 7.8 earthquake struck San Francisco killing 3000 people and triggering fi res that ravaged the city. In response to this disaster, authorities prepared people and emergency services (Figure 1.22). San Francisco now has strict building laws, with earthquake-resistant buildings such as the Transamerica Pyramid (Figure 1.23 and 1.24). Earthquake-resistant buildings protect people and reduce damage to property in the event of an earthquake. Old masonry buildings have been modifi ed and strengthened (retrofi tted) to make them more resistant to seismic activity. When a shallow but powerful 6.5 magnitude earthquake struck California in 2003 there were only two deaths.
Figure 1.23 The Transamerica Pyramid, San Francisco.
Find out how the Torre Mayor building in Mexico City, Mexico and the Transamerica Pyramid in San Francisco, USA are designed to resist earthquakes. Suggest why different earthquake-resistant designs are more suitable for higher income or lower income countries.
Further research
Figure 1.22 Preparation: methods of reducing the impact of earthquakes.
DROP! COVER! HOLD ON!
1 2 3
ACTIVITY 1.6
1 Study the text and Figure 1.17 in Section 1.5. a Draw a table to show the different means of monitoring and predicting
volcanoes and earthquakes. b For each technique used to monitor volcanoes, explain the reasons for
each technique and how it can predict a volcanic eruption. c To what extent do you think it is easier to predict a volcanic eruption than an
earthquake?
Figure 1.24 Protection: earthquake-resistant building designs.
cross-bracingshearwall
shearcore
moat
ground
baseisolator
Cross-bracingreinforces wallsusing two steelbeams.
Shear walls(concrete wallswith steel barsin them) toreduce rockingmovements.
Shock absorbers(base isolators)absorb tremorsof earthquakes.
25
1 Tectonic hazards
Sample
© Cambridge University Press 2016
Example
The Tohoku earthquake, Japan, 2011What caused the earthquake?
• The tectonic plates in the area around Japan are complex. The Pacifi c plate, moving westwards at a rate of 83 mm a year, is being forced under the minor tectonic plate on which the north of Japan sits (the Okhotsk plate) at a subduction zone known as the Japan Trench.
• The earthquake was shallow-focused at a depth of approximately 30 km.• Faulting occurred along 300 km of the Japan Trench and uplifted the fault by
over 30 m. It was the most powerful earthquake ever recorded in Japan and lasted over 3 minutes.
The impact of the earthquake was increased by the following factors:
• Japan’s coastal area is fl at, low-lying and the soft soil amplifi es shockwaves.
• There are deep coastal bays that amplify tsunami waves.
What were the primary effects?The March 2011 earthquake was preceded by a series of large foreshocks over the previous two days. The Japan Meteorological Agency sent out an earthquake warning on national television and radio, giving precious time for people to evacuate.
The Tohoku earthquake
• The earthquake shifted the Earth on its axis by 10 cm.
• The coastal areas of Sendai, located 130 km from the epicentre, were all but destroyed.
• Skyscrapers in Tokyo (370 km from the epicentre) swayed, but damage was limited due to earthquake-resistant design.
• Most casualties and damage occurred in Iwate, Miyagi and Fukushima where 127 000 buildings were completely destroyed and a million were damaged across north-east Japan.
• Oil refi neries in Ichihara and Sendai were ablaze.
• One school in Ishinomaki, Miyagi lost 84 of 121 students and teachers.
• Around 4.4 million households in north-east Japan were left without electricity and 1.5 million without running water.
• 1100 sections of train track were damaged. Only four trains were derailed because all high-speed trains had been automatically stopped by an early warning system.
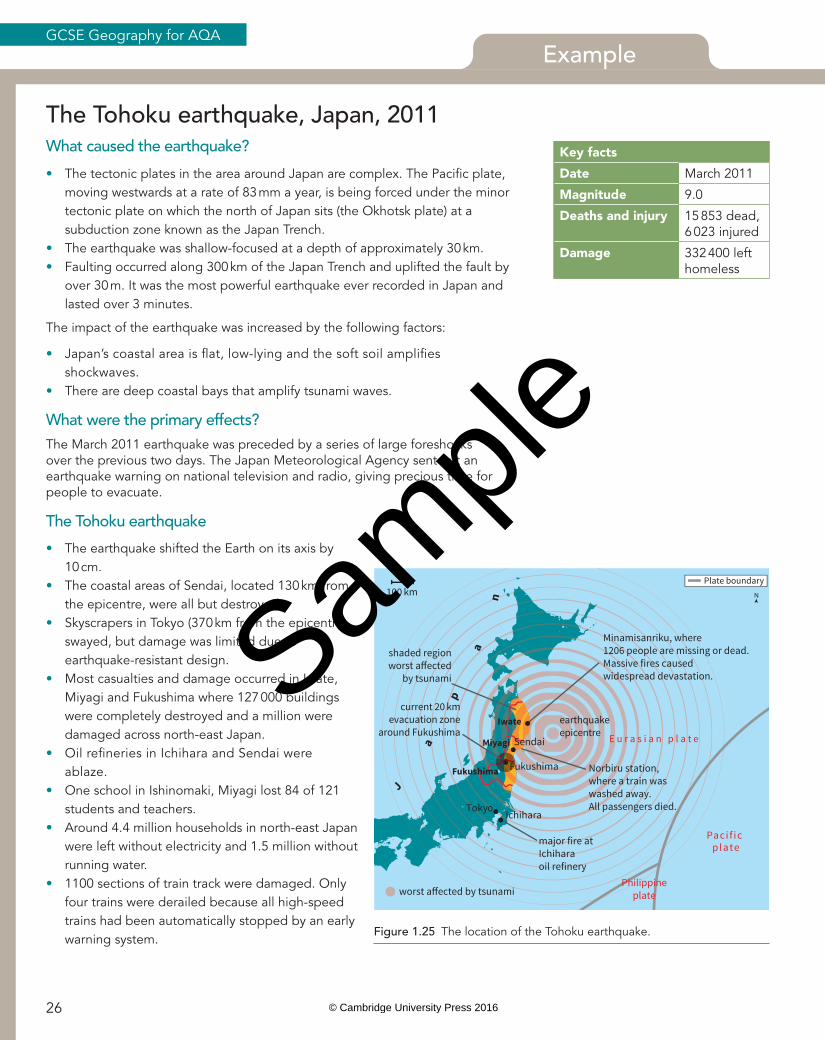
Figure 1.25 The location of the Tohoku earthquake.
Sendai
Fukushima Fukushima
Iwate
Miyagi
TokyoIchihara
J
a
p
an
E u r a s i a n p l a t e
Paci f ic plate
Philippineplate
earthquakeepicentre
Norbiru station,where a train was washed away.All passengers died.
Minamisanriku, where 1206 people are missing or dead.Massive fires caused widespread devastation.
shaded regionworst affected
by tsunami
100 km
major fire atIchihara oil refinery
current 20 kmevacuation zone
around Fukushima
Plate boundaryN
worst affected by tsunami
Key facts
Date March 2011
Magnitude 9.0
Deaths and injury 15 853 dead, 6 023 injured
Damage 332 400 left homeless
26
GCSE Geography for AQA
Sample
© Cambridge University Press 2016
What were the secondary effects?At least 1800 houses were destroyed in Fukushima when the Fujinuma dam failed. The earthquake triggered a tsunami that took 10 minutes to reach the coast with waves up to 38 m high (Figure 1.26). The waves travelled 10 km inland. In total, 56 bridges and 26 railways were washed away along the east coast of Honshu from Chiba to Aomori. The earthquake knocked out the power supply to the Fukushima Daiichi Nuclear Power Plant. The tsunami then fl ooded back-up generators and triggered nuclear meltdown in three reactors. Further afi eld, the tsunami caused several massive slabs of ice to calve (break away) from the Sulzberger Ice Shelf, Antarctica and damage to property in California, Hawaii and Ecuador. Nissan’s UK Sunderland plant shut down due to a parts shortage from its Japanese factories. The damage caused was in excess of $300 billion, making this the costliest natural disaster in world history.
Immediate responsesPeople got outside or ran for the hills when they heard earthquake and tsunami warnings. The government was overwhelmed by the scale of the disaster and quickly asked for international help. Over 116 countries and 28 international organisations responded. The military were forced to bury the dead in mass graves to prevent the spread of disease. AT&T (an American telecommunications corporation) maintained wireless and telephone networks to help people communicate free of charge. Japan declared a state of emergency following problems at six nuclear reactors. Around 140 000 residents were evacuated from a 20 km radius around the Fukushima plant (Figure 1.27).
Long-term responsesAll 55 nuclear reactors across Japan were taken offl ine for safety reasons. This resulted in power blackouts across Japan. Toyota and Sony stopped production and other companies decided to permanently relocate abroad, even though all of Japan’s ports reopened to limited ship traffi c by the end of March. The railway network was fully functional by September. Japan’s food exports were limited due to radiation fears. A year later, homes needed to be constructed for the 330 000 victims who were still homeless.
In the longer-term, reconstruction of the coastal areas will need to take place. This will include the re-building of road, rail and port infrastructure, as well as houses and community facilities. Questions over the future location of nuclear power plants and the height of new tsunami defences will need to be answered.
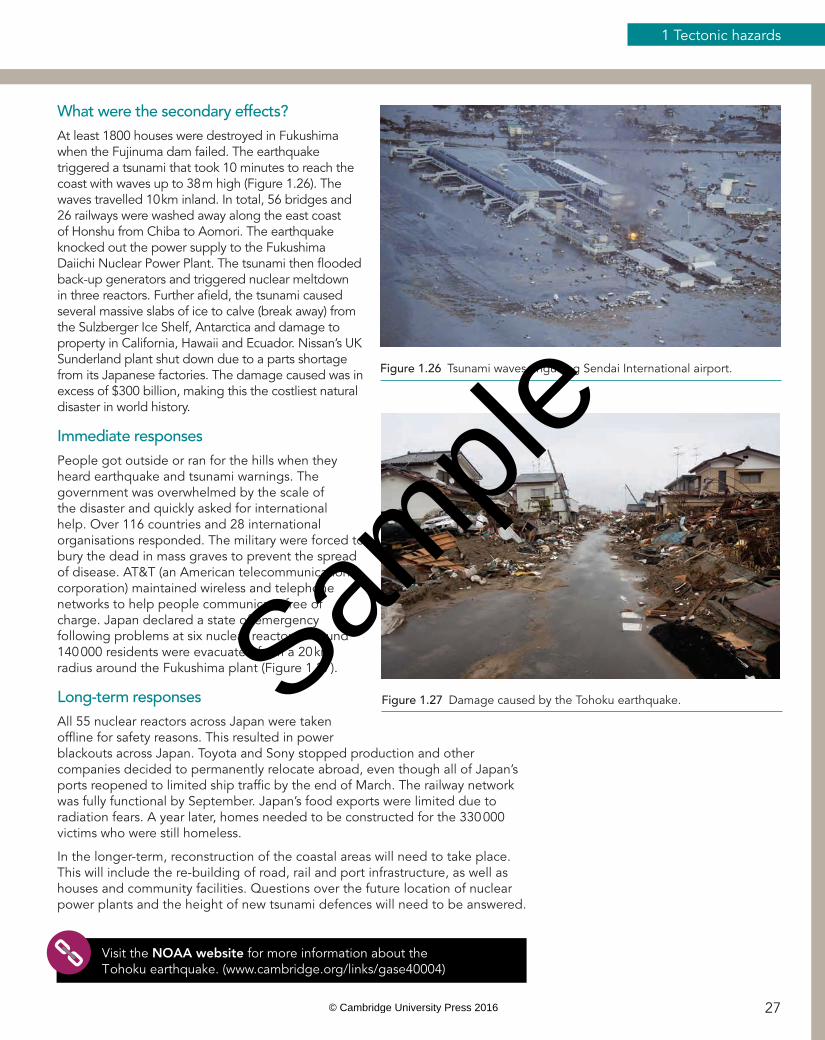
Figure 1.26 Tsunami waves engulfi ng Sendai International airport.
Figure 1.27 Damage caused by the Tohoku earthquake.
Visit the NOAA website for more information about the Tohoku earthquake. (www.cambridge.org/links/gase40004)
27
1 Tectonic hazards
Sample
© Cambridge University Press 2016
Example
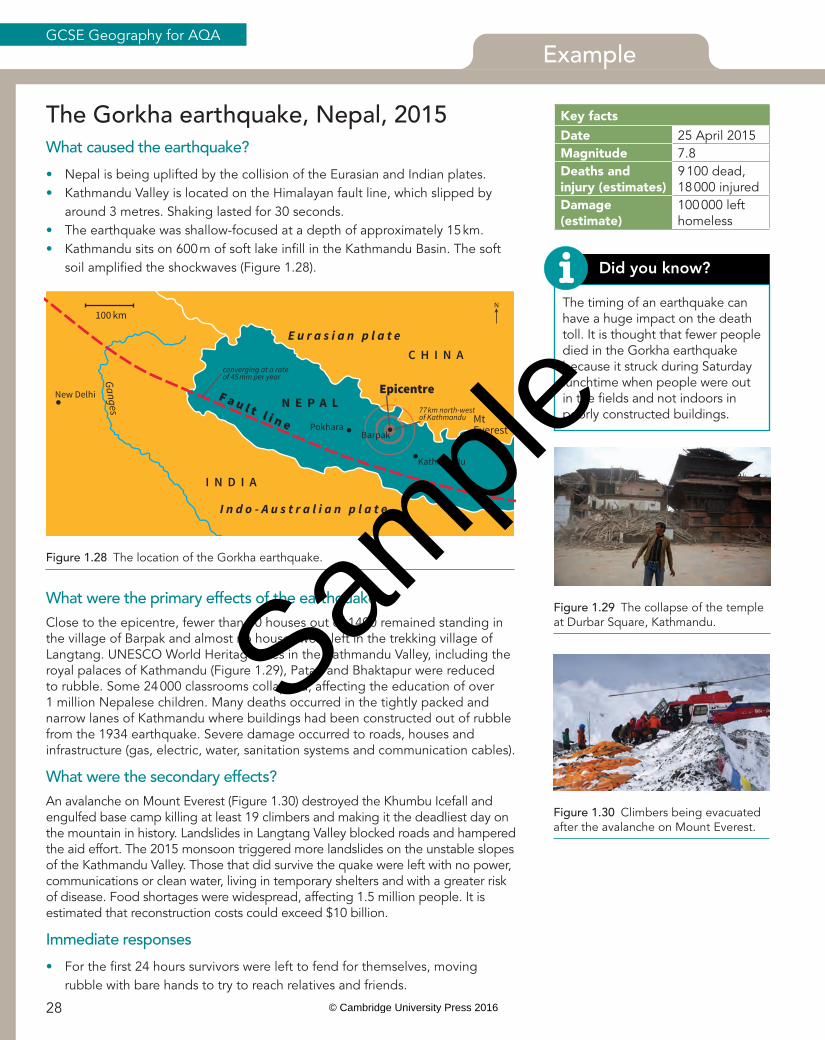
The Gorkha earthquake, Nepal, 2015What caused the earthquake?
• Nepal is being uplifted by the collision of the Eurasian and Indian plates.• Kathmandu Valley is located on the Himalayan fault line, which slipped by
around 3 metres. Shaking lasted for 30 seconds.• The earthquake was shallow-focused at a depth of approximately 15 km.• Kathmandu sits on 600 m of soft lake infi ll in the Kathmandu Basin. The soft
soil amplifi ed the shockwaves (Figure 1.28).
The timing of an earthquake can have a huge impact on the death toll. It is thought that fewer people died in the Gorkha earthquake because it struck during Saturday lunchtime when people were out in the fi elds and not indoors in poorly constructed buildings.
Did you know?
Figure 1.30 Climbers being evacuated after the avalanche on Mount Everest.
Figure 1.28 The location of the Gorkha earthquake.
Kathmandu
MtEverestPokhara
Barpak
77 km north-west of Kathmandu
converging at a rate of 45 mm per year
New Delhi
Ganges
I N D I A
C H I N A
N E P A LEpicentre
E u r a s i a n p l a t e
I n d o - A u s t r a l i a n p l a t e
F a u l t l i n e
N
100 km
Figure 1.29 The collapse of the temple at Durbar Square, Kathmandu.
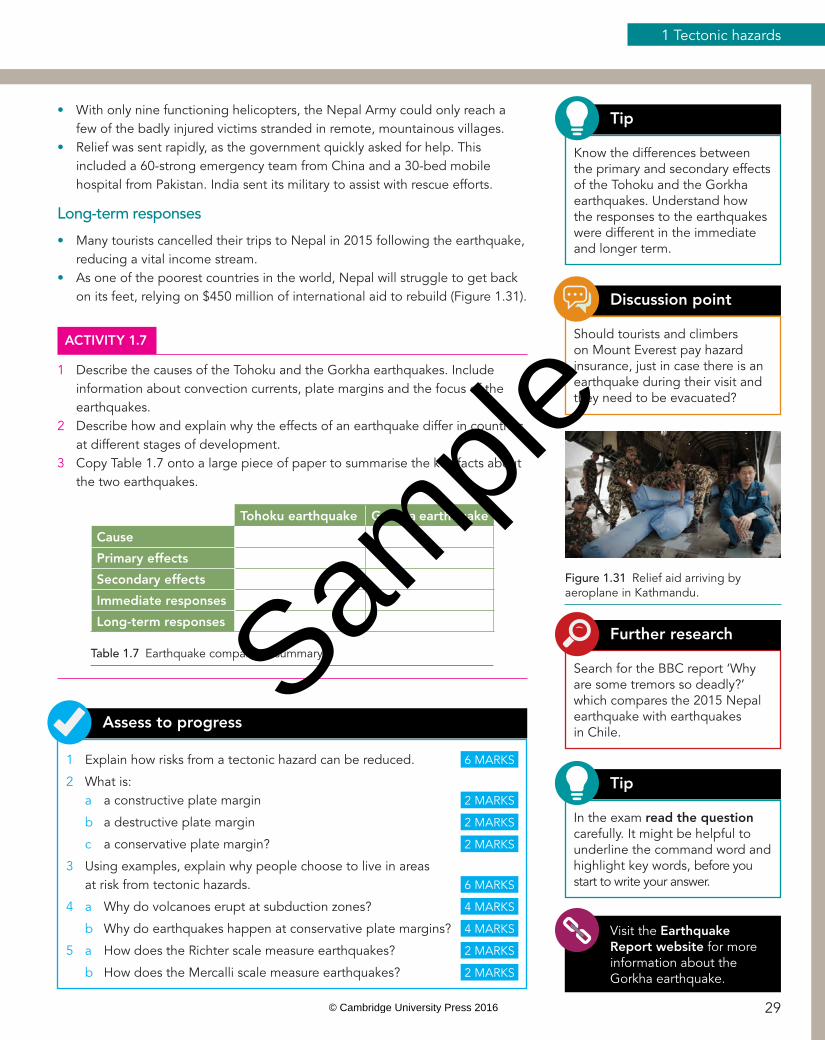
What were the primary effects of the earthquake?Close to the epicentre, fewer than 50 houses out of 1400 remained standing in the village of Barpak and almost no houses were left in the trekking village of Langtang. UNESCO World Heritage sites in the Kathmandu Valley, including the royal palaces of Kathmandu (Figure 1.29), Patan and Bhaktapur were reduced to rubble. Some 24 000 classrooms collapsed, affecting the education of over 1 million Nepalese children. Many deaths occurred in the tightly packed and narrow lanes of Kathmandu where buildings had been constructed out of rubble from the 1934 earthquake. Severe damage occurred to roads, houses and infrastructure (gas, electric, water, sanitation systems and communication cables).
What were the secondary effects?An avalanche on Mount Everest (Figure 1.30) destroyed the Khumbu Icefall and engulfed base camp killing at least 19 climbers and making it the deadliest day on the mountain in history. Landslides in Langtang Valley blocked roads and hampered the aid effort. The 2015 monsoon triggered more landslides on the unstable slopes of the Kathmandu Valley. Those that did survive the quake were left with no power, communications or clean water, living in temporary shelters and with a greater risk of disease. Food shortages were widespread, affecting 1.5 million people. It is estimated that reconstruction costs could exceed $10 billion.
Immediate responses
• For the fi rst 24 hours survivors were left to fend for themselves, moving rubble with bare hands to try to reach relatives and friends.
Key factsDate 25 April 2015Magnitude 7.8Deaths and injury (estimates)
9 100 dead, 18 000 injured
Damage (estimate)
100 000 left homeless
28
GCSE Geography for AQA
Sample
© Cambridge University Press 2016
• With only nine functioning helicopters, the Nepal Army could only reach a few of the badly injured victims stranded in remote, mountainous villages.
• Relief was sent rapidly, as the government quickly asked for help. This included a 60-strong emergency team from China and a 30-bed mobile hospital from Pakistan. India sent its military to assist with rescue efforts.
Long-term responses
• Many tourists cancelled their trips to Nepal in 2015 following the earthquake, reducing a vital income stream.
• As one of the poorest countries in the world, Nepal will struggle to get back on its feet, relying on $450 million of international aid to rebuild (Figure 1.31).
ACTIVITY 1.7
1 Describe the causes of the Tohoku and the Gorkha earthquakes. Include information about convection currents, plate margins and the focus of the earthquakes.
2 Describe how and explain why the effects of an earthquake differ in countries at different stages of development.
3 Copy Table 1.7 onto a large piece of paper to summarise the key facts about the two earthquakes.
Tohoku earthquake Gorkha earthquake
Cause
Primary effects
Secondary effects
Immediate responses
Long-term responses
Table 1.7 Earthquake comparison summary.
Should tourists and climbers on Mount Everest pay hazard insurance, just in case there is an earthquake during their visit and they need to be evacuated?
Discussion point
Figure 1.31 Relief aid arriving by aeroplane in Kathmandu.
Search for the BBC report ‘Why are some tremors so deadly?’ which compares the 2015 Nepal earthquake with earthquakes in Chile.
Further research
Visit the Earthquake Report website for more information about the Gorkha earthquake.
In the exam read the question carefully. It might be helpful to underline the command word and highlight key words, before you start to write your answer.
Tip
1 Explain how risks from a tectonic hazard can be reduced. 6 MARKS
2 What is: a a constructive plate margin 2 MARKS
b a destructive plate margin 2 MARKS
c a conservative plate margin? 2 MARKS
3 Using examples, explain why people choose to live in areas at risk from tectonic hazards. 6 MARKS
4 a Why do volcanoes erupt at subduction zones? 4 MARKS
b Why do earthquakes happen at conservative plate margins? 4 MARKS
5 a How does the Richter scale measure earthquakes? 2 MARKS
b How does the Mercalli scale measure earthquakes? 2 MARKS
Assess to progress
Know the differences between the primary and secondary effects of the Tohoku and the Gorkha earthquakes. Understand how the responses to the earthquakes were different in the immediate and longer term.
Tip
29
1 Tectonic hazards
Sample
© Cambridge University Press 2016
Issue evaluation
1.9 Predicting seismic activity in ChinaIn this issue evaluation you will consider the effectiveness and relative advantages and disadvantages of different methods of earthquake monitoring, prediction and mitigation.
MONGOLIA
KAZAKHSTAN
I N D I A
MYANMAR
THAILAND LAOS
VIETNAM
PHILIPPINES
SOUTHKOREA
NORTHKOREA
NEPAL
BHUTAN
BANGLADESH
R U S S I A
P A C I F I CO C E A N
Ye l l ow S e a
S o u t h C h i n a
S e a
B a y o f
B e n g a l
Tropic of Cancer
0
0
500 km100 300
500 miles100 200 300 400
XinjiangM 8.0 (10 Aug. 1931)
Haiyuan, NingxiaM 7.8 (16 Dec. 1920)
Haicheng M 7 (4 Feb. 1975)
HebeiM 7 (7 Mar. 1966)M 6.9 (22 Mar. 1966)
SichuanM 5.9 (22 July 2013)
GuangdongM 5.9 (25 July 1969)
Nan’aoM 7.3 (13 Feb. 1918)
SichuanM 7.6 (25 Aug. 1933)M 7.3 (25 May 1948)
ShensiM 8.0 (23 Jan. 1556)
30.314 ̊ N 102.934˚EM 6.9 (20 Apr. 2013)
27.245 ̊ N 103.427˚EM 6.1 (3 Aug. 2014)
YunnanM 7.1 (16 Mar. 1925)M 7.5 (4 Jan. 1970)M 6.0 (21 July 2003)M 5.7 (9 July 2009)
M 6.1 (3 Aug. 2014)23.386 ̊ N 100.487˚E
near Luhuo, SichuanM 7.3 (24 Mar. 1923)
Southern QinghaiM 6.9 (13 Apr. 2010)
GansuM 7.6 (25 Dec. 1932)
TangshanM 7.5 (27 July 1976)
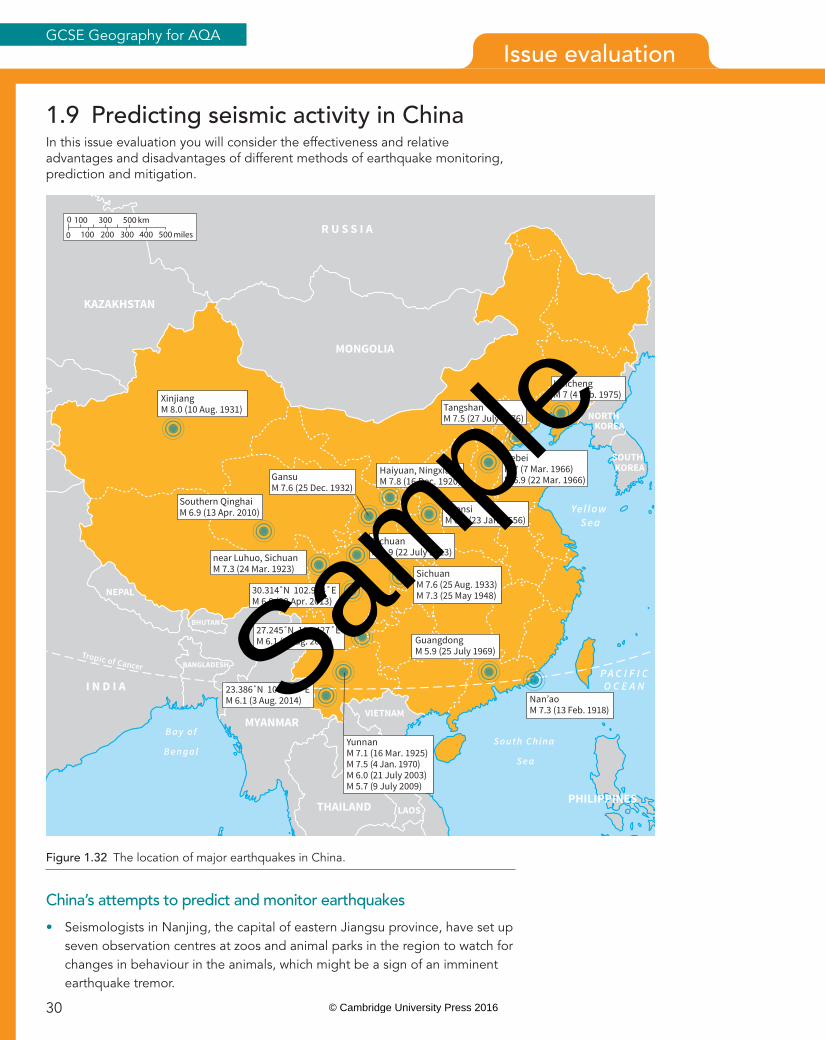
Figure 1.32 The location of major earthquakes in China.
China’s attempts to predict and monitor earthquakes
• Seismologists in Nanjing, the capital of eastern Jiangsu province, have set up seven observation centres at zoos and animal parks in the region to watch for changes in behaviour in the animals, which might be a sign of an imminent earthquake tremor.
30
GCSE Geography for AQA
Sample
© Cambridge University Press 2016
• The 1975 Haicheng earthquake was successfully predicted and was based on reports of changes in groundwater and soil elevations.
• China’s Seismological Society suggested, after the 2008 Sichuan earthquake, that the same fault line was likely to rupture again. They used seismograph data to make this prediction.
Predicting seismic activity is notoriously diffi cult, if not impossible. All of the methods described above are highly experimental, and, in the case of seismograph data, are only available after the earthquake event. However, China is developing a network of Seismo-Electromagnetic Satellites (CSES) as part of its earthquake monitoring network. Strong seismic activity can cause anomalies in the Earth’s atmosphere and magnetic fi eld which has the potential to be detected by satellites. Indeed, two days before Japan’s March 2011 earthquake, Chinese researchers detected abnormal electromagnetic signals in the area using ground-based systems. When a disturbance is recorded it is important to compare data at a number of locations to ensure that it is not caused by another factor. This is the reason that China’s satellite network is more ambitious than existing systems, developed by countries such as France, because it uses several satellites. This means that locations are monitored more frequently meaning that data is likely to be more reliable. China is working with other countries including Italy, Russia and Ukraine to develop the system as these countries already have similar, although less ambitious, systems.
Is a satellite network the best option?However, the technique is still experimental and poses a risk of false alarms and therefore predictions are not being made public in case they are wrong. Critics have also suggested that the $1 billion predicted spend on the system would have been better spent on building earthquake-proof buildings in China’s seismic zones.
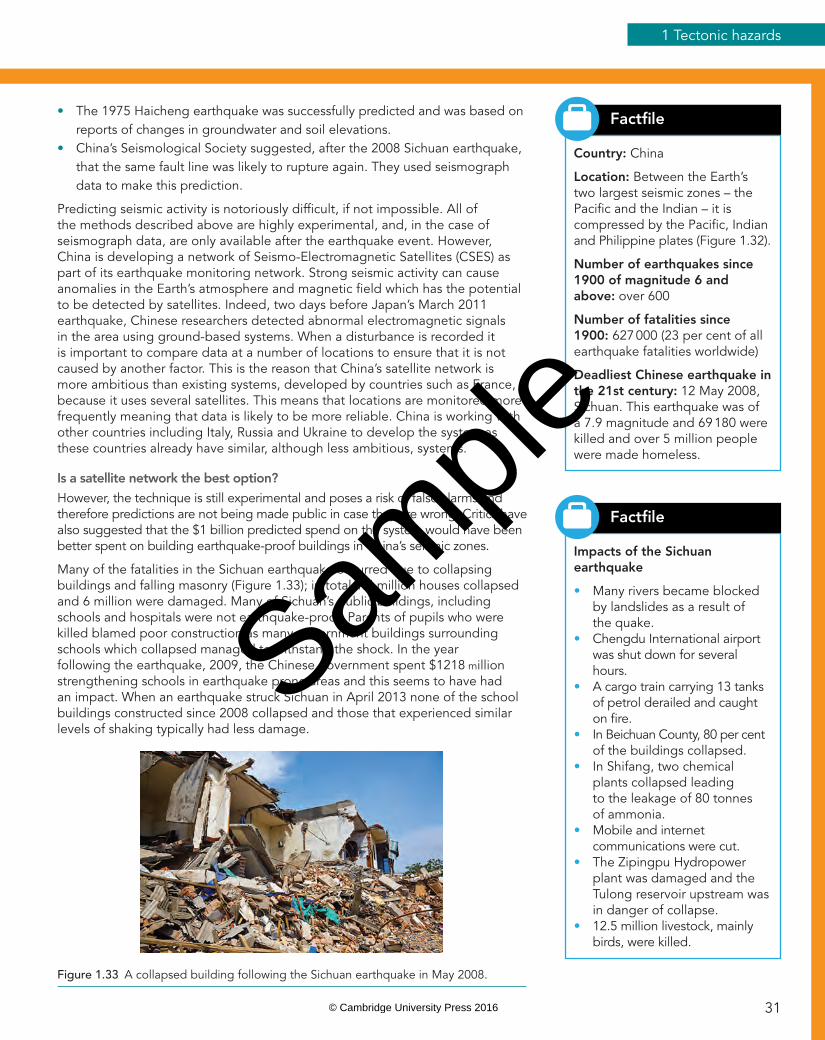
Many of the fatalities in the Sichuan earthquake occurred due to collapsing buildings and falling masonry (Figure 1.33); in total 1.5 million houses collapsed and 6 million were damaged. Many of Sichuan’s public buildings, including schools and hospitals were not earthquake-proof. Parents of pupils who were killed blamed poor construction as many government buildings surrounding schools which collapsed managed to withstand the shock. In the year following the earthquake, 2009, the Chinese government spent $1218 million strengthening schools in earthquake prone areas and this seems to have had an impact. When an earthquake struck Sichuan in April 2013 none of the school buildings constructed since 2008 collapsed and those that experienced similar levels of shaking typically had less damage.
Country: China
Location: Between the Earth’s two largest seismic zones – the Pacifi c and the Indian – it is compressed by the Pacifi c, Indian and Philippine plates (Figure 1.32).
Number of earthquakes since 1900 of magnitude 6 and above: over 600
Number of fatalities since 1900: 627 000 (23 per cent of all earthquake fatalities worldwide)
Deadliest Chinese earthquake in the 21st century: 12 May 2008, Sichuan. This earthquake was of a 7.9 magnitude and 69 180 were killed and over 5 million people were made homeless.
Factfi le
Impacts of the Sichuan earthquake
• Many rivers became blocked by landslides as a result of the quake.
• Chengdu International airport was shut down for several hours.
• A cargo train carrying 13 tanks of petrol derailed and caught on fi re.
• In Beichuan County, 80 per cent of the buildings collapsed.
• In Shifang, two chemical plants collapsed leading to the leakage of 80 tonnes of ammonia.
• Mobile and internet communications were cut.
• The Zipingpu Hydropower plant was damaged and the Tulong reservoir upstream was in danger of collapse.
• 12.5 million livestock, mainly birds, were killed.
Factfi le
Figure 1.33 A collapsed building following the Sichuan earthquake in May 2008.
31
1 Tectonic hazards
Sample
© Cambridge University Press 2016
Issue evaluation
Are new earthquake-proof buildings effective?‘If the buildings were older and built prior to the 1976 Tangshan earthquake the chances are that they weren’t built adequately for earthquake forces. It is only following this earthquake event that China put in place a design code to try to make buildings as earthquake-proof as possible.’
Reginald DesRoches, professor of civil and environmental engineering at Georgia Tech.
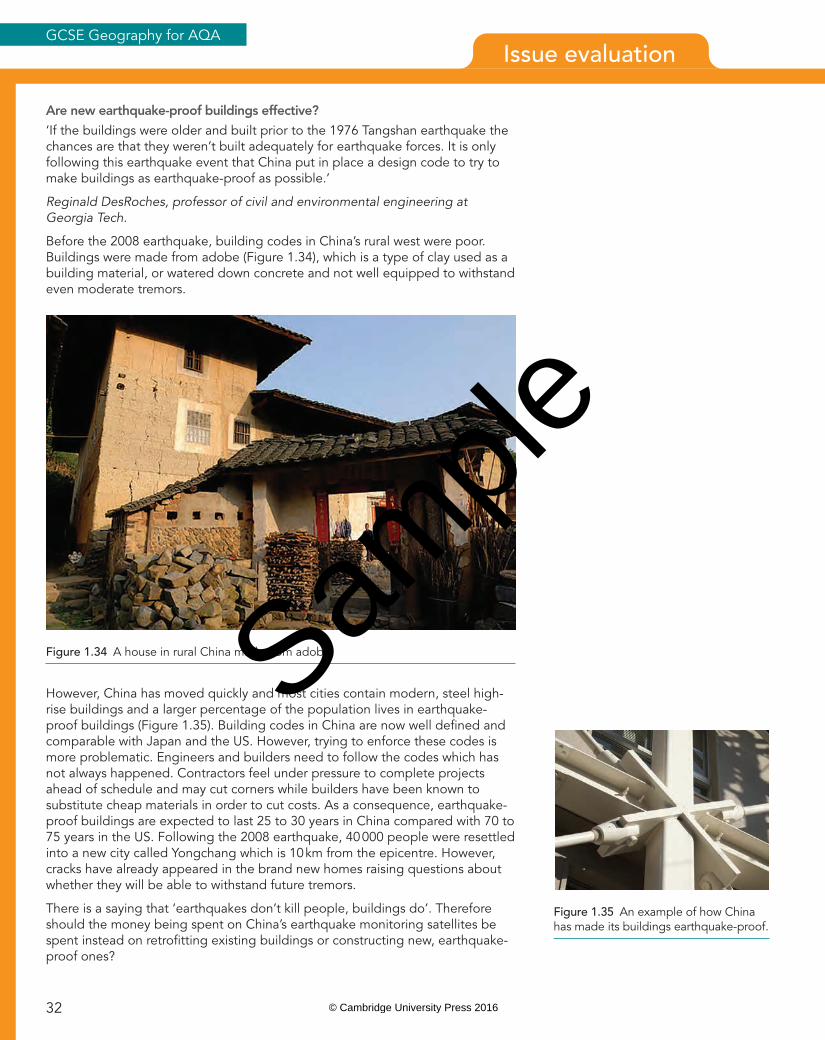
Before the 2008 earthquake, building codes in China’s rural west were poor. Buildings were made from adobe (Figure 1.34), which is a type of clay used as a building material, or watered down concrete and not well equipped to withstand even moderate tremors.
However, China has moved quickly and most cities contain modern, steel high-rise buildings and a larger percentage of the population lives in earthquake-proof buildings (Figure 1.35). Building codes in China are now well defi ned and comparable with Japan and the US. However, trying to enforce these codes is more problematic. Engineers and builders need to follow the codes which has not always happened. Contractors feel under pressure to complete projects ahead of schedule and may cut corners while builders have been known to substitute cheap materials in order to cut costs. As a consequence, earthquake-proof buildings are expected to last 25 to 30 years in China compared with 70 to 75 years in the US. Following the 2008 earthquake, 40 000 people were resettled into a new city called Yongchang which is 10 km from the epicentre. However, cracks have already appeared in the brand new homes raising questions about whether they will be able to withstand future tremors.
There is a saying that ‘earthquakes don’t kill people, buildings do’. Therefore should the money being spent on China’s earthquake monitoring satellites be spent instead on retrofi tting existing buildings or constructing new, earthquake-proof ones?
Figure 1.34 A house in rural China made from adobe.
Figure 1.35 An example of how China has made its buildings earthquake-proof.
32
GCSE Geography for AQA
Sample
© Cambridge University Press 2016
For more information see the BBC website (www.cambridge.org/links/gase40005)
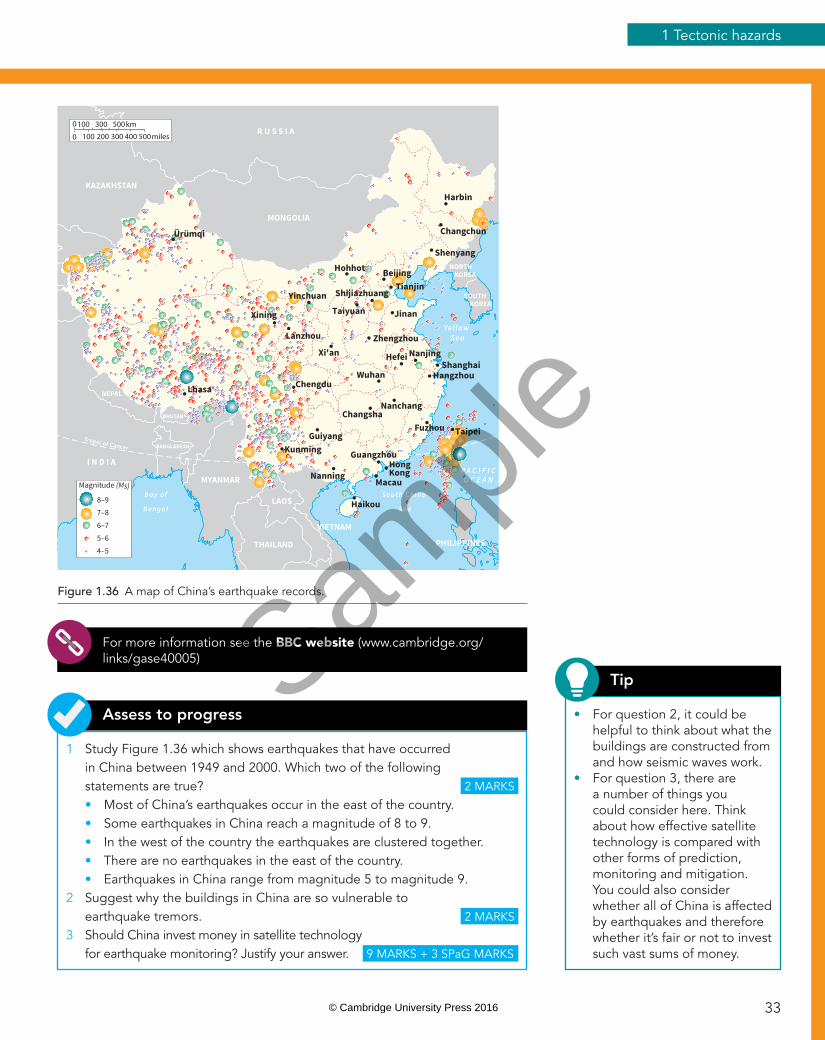
1 Study Figure 1.36 which shows earthquakes that have occurred in China between 1949 and 2000. Which two of the following statements are true? 2 MARKS
• Most of China’s earthquakes occur in the east of the country.• Some earthquakes in China reach a magnitude of 8 to 9.• In the west of the country the earthquakes are clustered together.• There are no earthquakes in the east of the country.• Earthquakes in China range from magnitude 5 to magnitude 9.
2 Suggest why the buildings in China are so vulnerable to earthquake tremors. 2 MARKS
3 Should China invest money in satellite technology for earthquake monitoring? Justify your answer. 9 MARKS + 3 SPaG MARKS
Assess to progress • For question 2, it could be helpful to think about what the buildings are constructed from and how seismic waves work.
• For question 3, there are a number of things you could consider here. Think about how effective satellite technology is compared with other forms of prediction, monitoring and mitigation. You could also consider whether all of China is affected by earthquakes and therefore whether it’s fair or not to invest such vast sums of money.
Tip
Figure 1.36 A map of China’s earthquake records.
Harbin
Changchun
ShenyangHohhot
Jinan
Tianjin
Taiyuan
Beijing
Shijiazhuang
Ürümqi
Lhasa
Xining
Lanzhou
Xi'anZhengzhou
Hefei
Wuhan
ChangshaNanchang
Chengdu
KunmingGuiyang
Nanning
Guangzhou
HangzhouShanghai
Nanjing
Macau
Haikou
Hong Kong
TaipeiFuzhou
Yinchuan
MONGOLIA
KAZAKHSTAN
I N D I A
MYANMAR
THAILAND
LAOS
VIETNAM
PHILIPPINES
SOUTHKOREA
NORTHKOREA
NEPAL
BHUTAN
BANGLADESH
R U S S I A
8–9
7–8
6–7
5–6
4–5
Magnitude (Ms)
0
0
500km100 300
500miles100 200 300 400
P A C I F I CO C E A N
Ye l l ow S e a
S o u t h C h i n a
S e a
B a y o f
B e n g a l
Tropic of Cancer
33
1 Tectonic hazards
Sample
© Cambridge University Press 2016
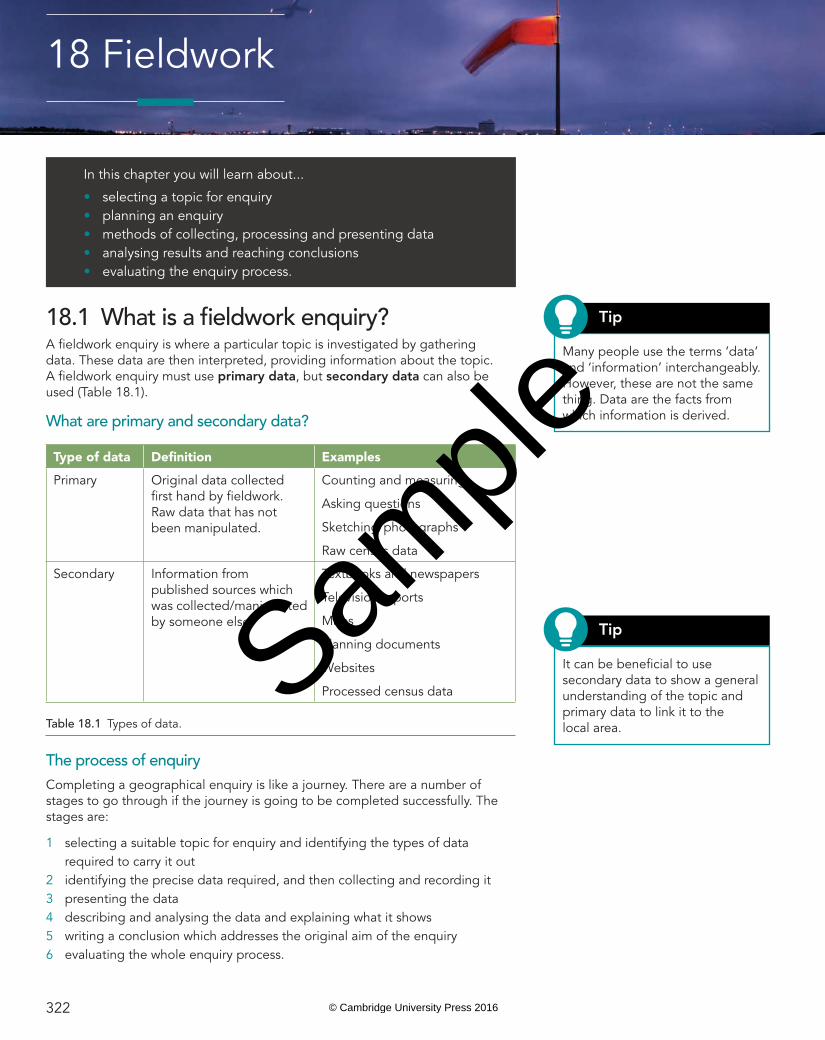
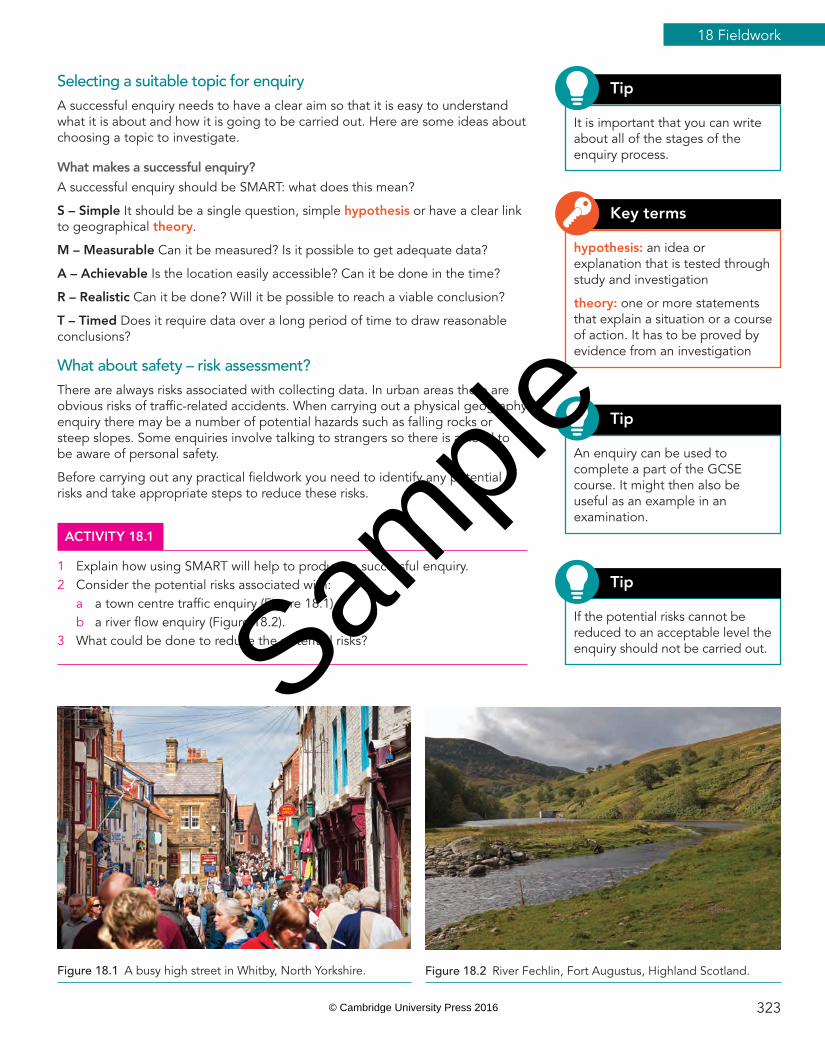
18.1 What is a fi eldwork enquiry?A fi eldwork enquiry is where a particular topic is investigated by gathering data. These data are then interpreted, providing information about the topic. A fi eldwork enquiry must use primary data, but secondary data can also be used (Table 18.1).
What are primary and secondary data?
Type of data Defi nition Examples
Primary Original data collected fi rst hand by fi eldwork. Raw data that has not been manipulated.
Counting and measuring
Asking questions
Sketching/photographs
Raw census data
Secondary Information from published sources which was collected/manipulated by someone else.
Textbooks and newspapers
Television reports
Maps
Planning documents
Websites
Processed census data
Table 18.1 Types of data.
The process of enquiryCompleting a geographical enquiry is like a journey. There are a number of stages to go through if the journey is going to be completed successfully. The stages are:
1 selecting a suitable topic for enquiry and identifying the types of data required to carry it out
2 identifying the precise data required, and then collecting and recording it3 presenting the data4 describing and analysing the data and explaining what it shows5 writing a conclusion which addresses the original aim of the enquiry6 evaluating the whole enquiry process.
In this chapter you will learn about...
• selecting a topic for enquiry• planning an enquiry• methods of collecting, processing and presenting data• analysing results and reaching conclusions• evaluating the enquiry process.
Many people use the terms ‘data’ and ‘information’ interchangeably. However, these are not the same thing. Data are the facts from which information is derived.
Tip
It can be benefi cial to use secondary data to show a general understanding of the topic and primary data to link it to the local area.
Tip
18 Fieldwork
322
Sample
© Cambridge University Press 2016
Selecting a suitable topic for enquiryA successful enquiry needs to have a clear aim so that it is easy to understand what it is about and how it is going to be carried out. Here are some ideas about choosing a topic to investigate.
What makes a successful enquiry?A successful enquiry should be SMART: what does this mean?
S – Simple It should be a single question, simple hypothesis or have a clear link to geographical theory.
M – Measurable Can it be measured? Is it possible to get adequate data?
A – Achievable Is the location easily accessible? Can it be done in the time?
R – Realistic Can it be done? Will it be possible to reach a viable conclusion?
T – Timed Does it require data over a long period of time to draw reasonable conclusions?
What about safety – risk assessment?There are always risks associated with collecting data. In urban areas there are obvious risks of traffi c-related accidents. When carrying out a physical geography enquiry there may be a number of potential hazards such as falling rocks or steep slopes. Some enquiries involve talking to strangers so there is a need to be aware of personal safety.
Before carrying out any practical fi eldwork you need to identify any potential risks and take appropriate steps to reduce these risks.
ACTIVITY 18.1
1 Explain how using SMART will help to produce a successful enquiry.2 Consider the potential risks associated with: a a town centre traffi c enquiry (Figure 18.1) b a river fl ow enquiry (Figure 18.2).3 What could be done to reduce the potential risks?
It is important that you can write about all of the stages of the enquiry process.
Tip
An enquiry can be used to complete a part of the GCSE course. It might then also be useful as an example in an examination.
Tip
If the potential risks cannot be reduced to an acceptable level the enquiry should not be carried out.
Tip
hypothesis: an idea or explanation that is tested through study and investigation
theory: one or more statements that explain a situation or a course of action. It has to be proved by evidence from an investigation
Key terms
Figure 18.1 A busy high street in Whitby, North Yorkshire. Figure 18.2 River Fechlin, Fort Augustus, Highland Scotland.
323
18 Fieldwork
Sample
© Cambridge University Press 2016
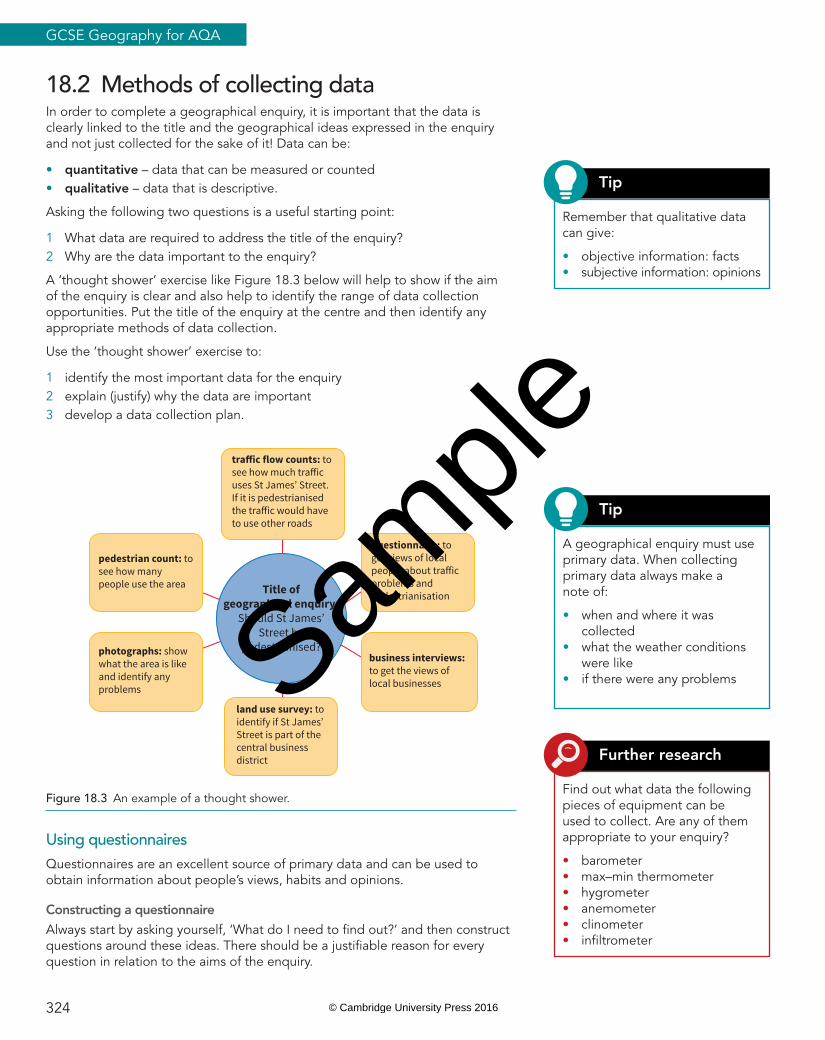
18.2 Methods of collecting dataIn order to complete a geographical enquiry, it is important that the data is clearly linked to the title and the geographical ideas expressed in the enquiry and not just collected for the sake of it! Data can be:
• quantitative – data that can be measured or counted• qualitative – data that is descriptive.
Asking the following two questions is a useful starting point:
1 What data are required to address the title of the enquiry?2 Why are the data important to the enquiry?
A ‘thought shower’ exercise like Figure 18.3 below will help to show if the aim of the enquiry is clear and also help to identify the range of data collection opportunities. Put the title of the enquiry at the centre and then identify any appropriate methods of data collection.
Use the ‘thought shower’ exercise to:
1 identify the most important data for the enquiry2 explain (justify) why the data are important3 develop a data collection plan.
Title ofgeographical enquiry:
Should St James’Street be
pedestrianised?
traffic flow counts: tosee how much trafficuses St James’ Street.If it is pedestrianisedthe traffic would haveto use other roads
questionnaire: toget views of localpeople about trafficproblems andpedestrianisation
business interviews:to get the views oflocal businesses
land use survey: toidentify if St James’Street is part of thecentral businessdistrict
photographs: showwhat the area is likeand identify anyproblems
pedestrian count: tosee how manypeople use the area
Figure 18.3 An example of a thought shower.
Using questionnairesQuestionnaires are an excellent source of primary data and can be used to obtain information about people’s views, habits and opinions.
Constructing a questionnaireAlways start by asking yourself, ‘What do I need to fi nd out?’ and then construct questions around these ideas. There should be a justifi able reason for every question in relation to the aims of the enquiry.
A geographical enquiry must use primary data. When collecting primary data always make a note of:
• when and where it was collected
• what the weather conditions were like
• if there were any problems
Tip
Find out what data the following pieces of equipment can be used to collect. Are any of them appropriate to your enquiry?
• barometer• max–min thermometer• hygrometer• anemometer• clinometer• infi ltrometer
Further research
Remember that qualitative data can give:
• objective information: facts• subjective information: opinions
Tip
324
GCSE Geography for AQA
Sample
© Cambridge University Press 2016
There are basically two types of question:
• closed questions – these are questions that allow only a limited set of responses, e.g. short answer, yes/no or tick box questions. Closed questions are a good way of getting a lot of data quickly.
• open questions – these are questions that allow unlimited responses (they can be like mini interviews). Open questions can provide more detail and individual opinions, but they are harder to process and collate.
Piloting a questionnaireIt is a good idea to ‘test’ a questionnaire. This can be done by trying it out on a small number of people to make sure that the questions work.
ACTIVITY 18.2
1 a Why should you avoid questions like ‘How old are you?’ or ‘How much do you earn?’?
b How else might you get this type of data?2 a Why is ‘What do you think of the coastal protection methods?’ not a very
useful question? b How might you get more accurate data about people’s opinions of coastal
protection methods?
SamplingSampling is about selecting the people or places where data is going to be collected. For example, it would not be possible to give everyone a questionnaire or complete hundreds of river measurements, so a sampling method needs to be used.
There are three main types of sampling:
1 random sampling: where every person or place has an equal chance of being selected
2 stratifi ed sampling: where people or places are chosen according to the topic; for example, a question about the condition of cycle tracks might be given to a higher proportion of cycle users
3 systematic sampling: where a regular sample is taken, for example, every tenth house or person, every 50 metres along a river.
Remember to learn about the different types of sampling and why a particular sampling method was used.
Tip
Interviews can be a good source of data. Be prepared – have a list of questions ready for an interview.
Tip
325
18 Fieldwork
Sample
© Cambridge University Press 2016
18.3 Methods of presenting dataThere are a wide range of data presentation methods. It is important to select the most appropriate presentation method for each individual set of data.
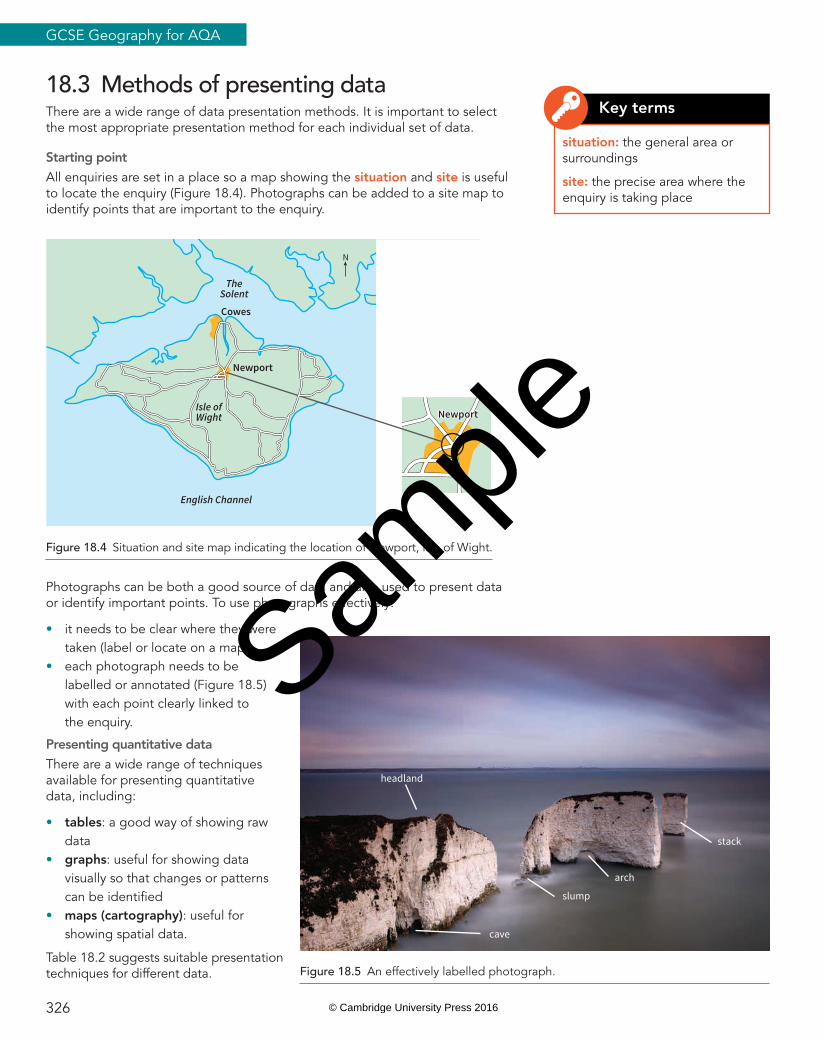
Starting pointAll enquiries are set in a place so a map showing the situation and site is useful to locate the enquiry (Figure 18.4). Photographs can be added to a site map to identify points that are important to the enquiry.
TheSolent
English Channel
Isle ofWight
Newport
Cowes
Newport
N
Figure 18.4 Situation and site map indicating the location of Newport, Isle of Wight.
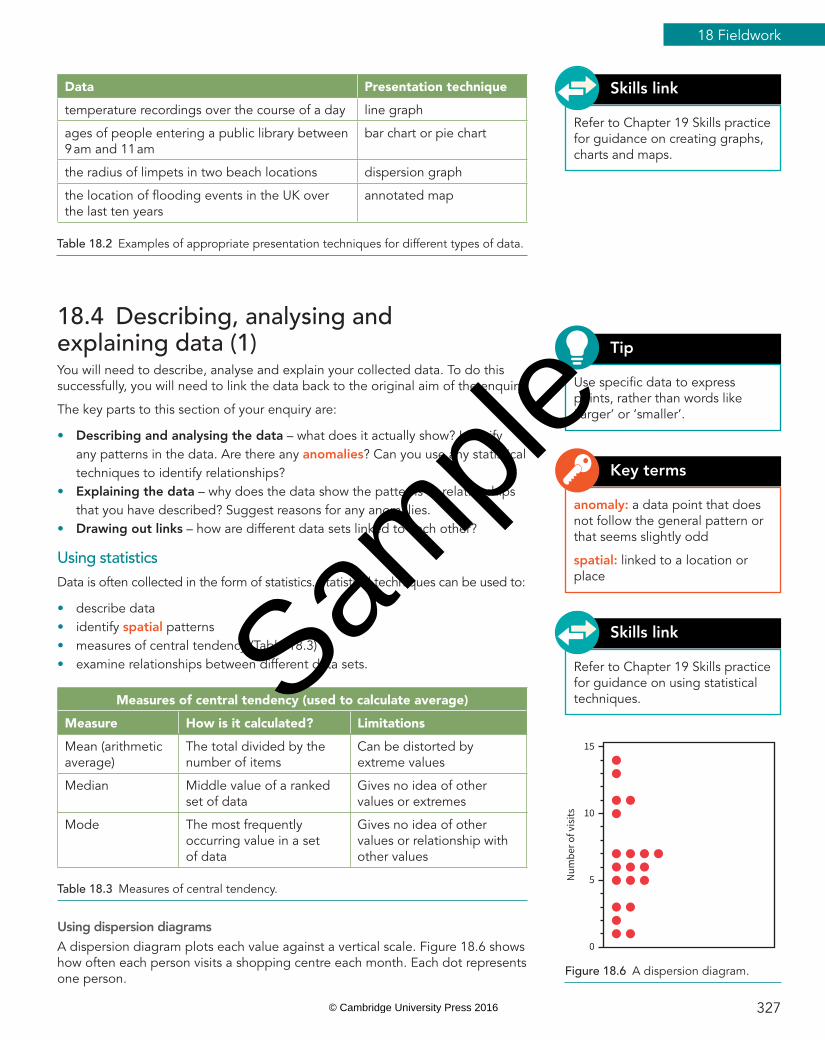
Photographs can be both a good source of data and also used to present data or identify important points. To use photographs effectively:
• it needs to be clear where they were taken (label or locate on a map)
• each photograph needs to be labelled or annotated (Figure 18.5) with each point clearly linked to the enquiry.
Presenting quantitative dataThere are a wide range of techniques available for presenting quantitative data, including:
• tables: a good way of showing raw data
• graphs: useful for showing data visually so that changes or patterns can be identifi ed
• maps (cartography): useful for showing spatial data.
Table 18.2 suggests suitable presentation techniques for different data.
situation: the general area or surroundings
site: the precise area where the enquiry is taking place
Key terms
headland
cave
slump
arch
stack
Figure 18.5 An effectively labelled photograph.
326
GCSE Geography for AQA
Sample
© Cambridge University Press 2016
Refer to Chapter 19 Skills practice for guidance on creating graphs, charts and maps.
Skills linkData Presentation technique
temperature recordings over the course of a day line graph
ages of people entering a public library between 9 am and 11 am
bar chart or pie chart
the radius of limpets in two beach locations dispersion graph
the location of fl ooding events in the UK over the last ten years
annotated map
Table 18.2 Examples of appropriate presentation techniques for different types of data.
18.4 Describing, analysing and explaining data (1)You will need to describe, analyse and explain your collected data. To do this successfully, you will need to link the data back to the original aim of the enquiry.
The key parts to this section of your enquiry are:
• Describing and analysing the data – what does it actually show? Identify any patterns in the data. Are there any anomalies? Can you use any statistical techniques to identify relationships?
• Explaining the data – why does the data show the patterns or relationships that you have described? Suggest reasons for any anomalies.
• Drawing out links – how are different data sets linked to each other?
Using statisticsData is often collected in the form of statistics. Statistical techniques can be used to:
• describe data• identify spatial patterns• measures of central tendency (Table 18.3)• examine relationships between different data sets.
Measures of central tendency (used to calculate average)
Measure How is it calculated? Limitations
Mean (arithmetic average)
The total divided by the number of items
Can be distorted by extreme values
Median Middle value of a ranked set of data
Gives no idea of other values or extremes
Mode The most frequently occurring value in a set of data
Gives no idea of other values or relationship with other values
Table 18.3 Measures of central tendency.
Using dispersion diagramsA dispersion diagram plots each value against a vertical scale. Figure 18.6 shows how often each person visits a shopping centre each month. Each dot represents one person.
Use specifi c data to express points, rather than words like ‘larger’ or ‘smaller’.
Tip
anomaly: a data point that does not follow the general pattern or that seems slightly odd
spatial: linked to a location or place
Key terms
Figure 18.6 A dispersion diagram.
0
5Num
ber o
f vis
its 10
15
Refer to Chapter 19 Skills practice for guidance on using statistical techniques.
Skills link
327
18 Fieldwork
Sample
© Cambridge University Press 2016
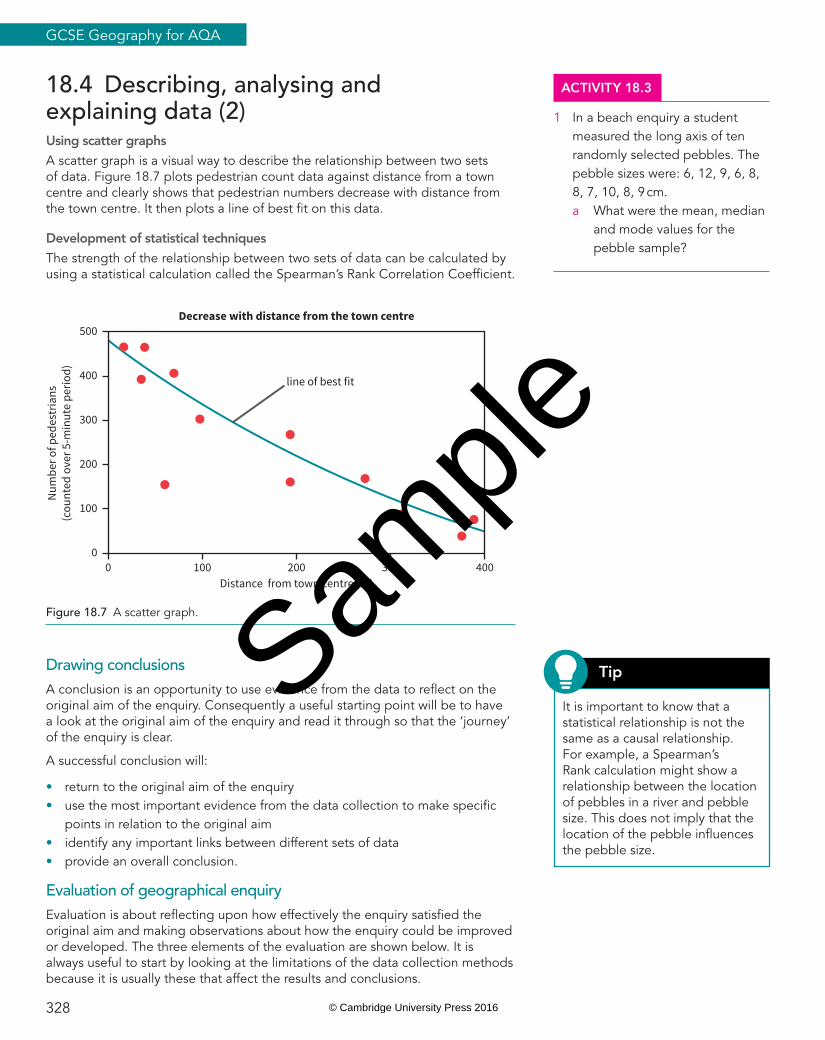
Drawing conclusionsA conclusion is an opportunity to use evidence from the data to refl ect on the original aim of the enquiry. Consequently a useful starting point will be to have a look at the original aim of the enquiry and read it through so that the ‘journey’ of the enquiry is clear.
A successful conclusion will:
• return to the original aim of the enquiry• use the most important evidence from the data collection to make specifi c
points in relation to the original aim• identify any important links between different sets of data• provide an overall conclusion.
Evaluation of geographical enquiryEvaluation is about refl ecting upon how effectively the enquiry satisfi ed the original aim and making observations about how the enquiry could be improved or developed. The three elements of the evaluation are shown below. It is always useful to start by looking at the limitations of the data collection methods because it is usually these that affect the results and conclusions.
18.4 Describing, analysing and explaining data (2)Using scatter graphsA scatter graph is a visual way to describe the relationship between two sets of data. Figure 18.7 plots pedestrian count data against distance from a town centre and clearly shows that pedestrian numbers decrease with distance from the town centre. It then plots a line of best fi t on this data.
Development of statistical techniquesThe strength of the relationship between two sets of data can be calculated by using a statistical calculation called the Spearman’s Rank Correlation Coeffi cient.
It is important to know that a statistical relationship is not the same as a causal relationship. For example, a Spearman’s Rank calculation might show a relationship between the location of pebbles in a river and pebble size. This does not imply that the location of the pebble infl uences the pebble size.
Tip
Figure 18.7 A scatter graph.
0
100
0
200
300
400
500
100
Num
ber o
f ped
estr
ians
(cou
nted
ove
r 5-m
inut
e pe
riod)
200Distance from town centre (m)
line of best fit
300 400
Decrease with distance from the town centre
ACTIVITY 18.3
1 In a beach enquiry a student measured the long axis of ten randomly selected pebbles. The pebble sizes were: 6, 12, 9, 6, 8, 8, 7, 10, 8, 9 cm.
a What were the mean, median and mode values for the pebble sample?
328
GCSE Geography for AQA
Sample
© Cambridge University Press 2016
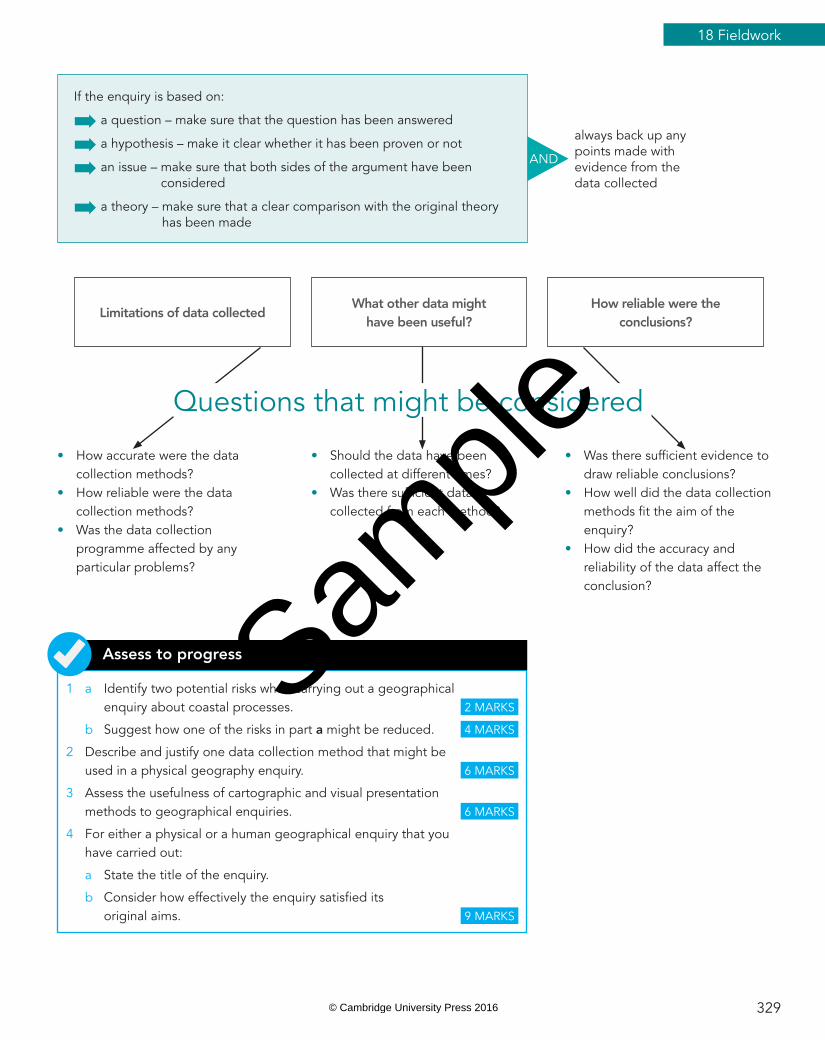
If the enquiry is based on:
➡ a question – make sure that the question has been answered
➡ a hypothesis – make it clear whether it has been proven or not
➡ an issue – make sure that both sides of the argument have been considered
➡ a theory – make sure that a clear comparison with the original theory has been made
always back up any points made with evidence from the data collected
AND
Limitations of data collectedWhat other data might
have been useful?How reliable were the
conclusions?
• How accurate were the data collection methods?
• How reliable were the data collection methods?
• Was the data collection programme affected by any particular problems?
• Should the data have been collected at different times?
• Was there suffi cient data collected from each method?
• Was there suffi cient evidence to draw reliable conclusions?
• How well did the data collection methods fi t the aim of the enquiry?
• How did the accuracy and reliability of the data affect the conclusion?
Questions that might be considered
1 a Identify two potential risks when carrying out a geographical enquiry about coastal processes. 2 MARKS
b Suggest how one of the risks in part a might be reduced. 4 MARKS
2 Describe and justify one data collection method that might be used in a physical geography enquiry. 6 MARKS
3 Assess the usefulness of cartographic and visual presentation methods to geographical enquiries. 6 MARKS
4 For either a physical or a human geographical enquiry that you have carried out:
a State the title of the enquiry.
b Consider how effectively the enquiry satisfi ed its original aims. 9 MARKS
Assess to progress
329
18 Fieldwork
Sample
© Cambridge University Press 2016
Related Documents