THE NOTES AND DISCLOSURES FOLLOWING THIS REPORT ARE AN INTEGRAL PART OF THIS REPORT AND MUST BE READ IN CONNECTION WITH YOUR REVIEW OF THIS REPORT. THIS REPORT HAS BEEN PREPARED BY THE GCM CUSTOMIZED FUND INVESTMENT GROUP, L.P. (REFERRED TO HEREIN AS “GCM GROSVENOR PRIVATE MARKETS”) AND GRV SECURITIES LLC. © 2017 GCM CUSTOMIZED FUND INVESTMENT GROUP, L.P. ALL RIGHTS RESERVED GCM Grosvenor Pacific, L.P. Private Equity and Infrastructure September 30, 2016 Quarterly Report

Welcome message from author
This document is posted to help you gain knowledge. Please leave a comment to let me know what you think about it! Share it to your friends and learn new things together.
Transcript
THE NOTES AND DISCLOSURES FOLLOWING THIS REPORT ARE AN INTEGRAL PART OF THIS REPORT AND MUST BE READ IN CONNECTION WITH YOUR REVIEW
OF THIS REPORT. THIS REPORT HAS BEEN PREPARED BY THE GCM CUSTOMIZED FUND INVESTMENT GROUP, L.P. (REFERRED TO HEREIN AS “GCM GROSVENOR
PRIVATE MARKETS”) AND GRV SECURITIES LLC. © 2017 GCM CUSTOMIZED FUND INVESTMENT GROUP, L.P. ALL RIGHTS RESERVED
GCM Grosvenor Pacific, L.P. Private Equity and Infrastructure September 30, 2016 Quarterly Report
GCM Grosvenor Pacific, L.P. September 30, 2016 Quarterly Report
Table of Contents Page
GCM Grosvenor Pacific, L.P.
Update Letter ................................................................................................................................................ 1
Summary Tables ............................................................................................................................................ 5
Underlying Fund Investment Reports ......................................................................................................... 14
Co-Investment Reports ............................................................................................................................... 41
Notes & Disclosures ............................................................................................................................................................... 54
Appendix – 3Q 2016 Market Overview .................................................................................................................................. 55

GCM Grosvenor Pacific, L.P. September 30, 2016 Quarterly Report
1
Update Letter
Dear Partner:
We are pleased to provide you with the third quarter 2016 report for GCM Grosvenor Pacific, L.P. (the “Fund” or the “Partnership”).
Fund Overview
Since the formation of the Fund in September 2009, GCM Grosvenor Private Markets has pursued a disciplined, but opportunistic approach of implementing the stated strategy of identifying top quartile managers, and constructing a portfolio of investments in leveraged buyout funds and special situation investments such as mezzanine, distressed debt and secondary investments. The Fund also opportunistically invests in co-investments and potentially other non-traditional investments that may offer enhanced net returns, as well as accelerate capital deployment to meet SDCERS’ private equity allocation targets. GCM Grosvenor Private Markets has also actively targeted strategies that lessened the “J-curve” effect of private equity investing. In 2011, GCM Grosvenor Private Markets also began to implement the strategy of investing in infrastructure fund investments (primary and secondary) and infrastructure co-investments. GCM Grosvenor Private Markets pursues a global total return strategy while also seeking current cash and “J-curve” mitigation, with an emphasis on North American infrastructure and other U.S. dollar-based investments.
A summary of the Fund as of September 30, 2016 is as follows:
Since inception, the Partnership has committed $756.3 million to 54 total underlying funds and 32 total co-investments.
The Partnership had contributed a total of $502.8 million to investments, representing 66.5% of commitments to investments.
Cumulative distributions from investments totaled $217.6 million, representing approximately 43.3% of capital contributed to investments.
The Partnership’s investments continued to progress well during the third quarter of 2016. Top drivers of performance include1:
Private Equity Funds
Avista Capital Partners II, L.P. was held at 2.11x cost, with 12 of its 15 investments marked at or above cost, generating a net IRR of 19.4%.1
Castlelake Aviation II, L.P. (fka Airline Credit Opportunities II, L.P.) was held at 1.56x cost, with 30 of its 53 investments market at or above cost, generating a net IRR of 13.5%.1
Cerberus Institutional Partners V, L.P. was held at 1.51x cost, with 85 of its 129 investments marked at or above cost, generating a net IRR of 16.7%.1
Cerberus Institutional Partners, L.P. (Series Four) was held at 1.20x cost, with 13 of its 42 investments marked at or above cost, generating a net IRR of 21.0%1.
Clearlake Capital Partners III, L.P. was held at 1.90x cost, with 18 of its 23 investments marked at or above cost, generating a net IRR of 33.2%.1
Crestview Capital Partners, L.P. was held at 1.27x cost, with 5 of its 10 investments marked at or above cost, generating a net IRR of 27.3%.1
Crestview Partners II (TE), L.P. was held at 1.28x cost, with two of its six investments marked at or above cost, generating a net IRR of 28.7%.1
GCM Grosvenor Pacific, L.P. September 30, 2016 Quarterly Report
2
Darby Asia Mezzanine Fund II, L.P. generated an infinite net IRR.2
Darby Converging Europe Mezzanine Fund, L.P. was held at 275.16x cost, generating an infinite net IRR. 1,2
Excellere Capital Fund II, L.P. was held at 2.15x cost, with six of its eight investments marked at or above cost, generating a net IRR of 35.4%.1
GCM Grosvenor Secondary Opportunities, L.P. was held at 1.43x cost, generating a net IRR of 35.5%.1
KRG Capital Fund III, L.P. was held at 1.85x cost, generating an infinite net IRR.1,2
KRG Capital Fund IV, LP was held at 1.53x cost, with 7 of its 14 investments marked at or above cost, generating a net IRR of 37.9%.1
Revelstoke Capital Partners Fund I, L.P. was held at 1.31x cost, with its seven investments marked at or above cost, generating a net IRR of 24.3%.1
Siris Partners II, L.P. was held at 1.39x cost, with five of seven its investments marked at or above cost, generating a net IRR of 24.5%.1
TPG Opportunities Partners II (A), L.P. was held at 1.64x cost, with 44 of its 53 investments marked at or above cost, generating a net IRR of 17.5%.1
TSG6, L.P. was held at 2.10x cost, with 12 of its 13 investments marked at or above cost, generating a net IRR of 40.0%.1
The Veritas Capital Fund IV, L.P. was held at 1.92x cost, with 8 of its 9 investments marked at or above cost, generating a net IRR of 17.3%.1
VIP I A L.P. was held at 1.17x cost, with 8 of its 12 investments marked at or above cost, generating a net IRR of 18.2%.1
Private Equity Co-Investments
The Private Equity Co-Investment Portfolio was held at 1.44x cost, with 27 of the 29 co-investments marked at or above cost, generating a net IRR of 27.2%.1
Infrastructure Funds
Alinda Infrastructure Fund I, L.P. (secondary) was held at 1.96x cost, generating a net IRR of 15.8%.1
Alinda Infrastructure Fund II, L.P. (secondary) was held at 1.70x cost, generating a net IRR of 16.8%.1
EIV Capital Fund II, L.P. was held at 1.51x cost, generating a net IRR of 22.8%.1
HighStar Capital II, L.P. (secondary) was held at 1.65x cost, generating a net IRR of 17.8%.1
IDFC Private Equity (Mauritius) Fund II (secondary) was held at 3.89x cost, generating a net IRR of 319.1%.1
Infracapital Partners LP (secondary) was held at 1.39x cost, generating a net IRR of 18.2%.1
KoFC Macquarie Korea Growth Champ 2010-1 Private Equity Fund (secondary), was held at 1.43x cost, generating a net IRR of 21.7%.1
Macquarie European Infrastructure Fund I, L.P. (secondary) was held at 1.75x cost, generating a net IRR of 14.4%.1
Macquarie European Infrastructure Fund 4, L.P. (secondary) was held at 1.30x cost, generating a net IRR of 21.0%.1
Macquarie Infrastructure Partners I, L.P. (secondary) was held at 1.96x cost, generating a net IRR of 29.9%.1
Macquarie Infrastructure Partners I, L.P. (Project Key) (secondary) was held at 1.51x cost, generating a net IRR of 53.3%.1
Rockland Power Partners II, LP was held at 1.39x cost, generating a net IRR of 24.2%.1
Infrastructure Co-Investments
The Infrastructure Co-Investment Portfolio was held at 1.14x cost, with all three co-investments marked at or above cost, generating a net IRR of 6.0%.1
1 Returns do not take into account application of management fees, allocable expenses and carried interest, if applicable, at the GCM Grosvenor Private
Markets level. Returns would be lower if net-of-fee performance was presented. Past performance is not necessarily indicative of future results. 2 Little or no capital has been funded in respect of this investment, which together with the current market value and distributions, produces an infinite
IRR.
GCM Grosvenor Pacific, L.P. September 30, 2016 Quarterly Report
3
Limited Partner Summary
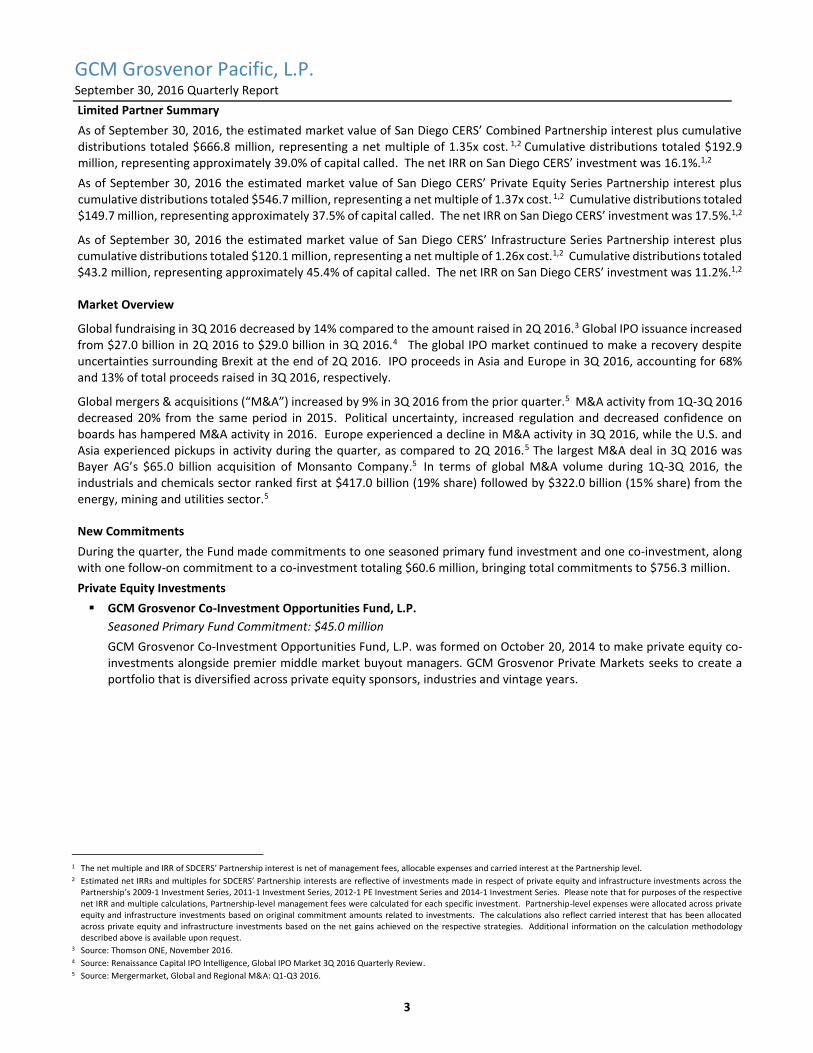
As of September 30, 2016, the estimated market value of San Diego CERS’ Combined Partnership interest plus cumulative distributions totaled $666.8 million, representing a net multiple of 1.35x cost. 1,2 Cumulative distributions totaled $192.9 million, representing approximately 39.0% of capital called. The net IRR on San Diego CERS’ investment was 16.1%.1,2
As of September 30, 2016 the estimated market value of San Diego CERS’ Private Equity Series Partnership interest plus cumulative distributions totaled $546.7 million, representing a net multiple of 1.37x cost. 1,2 Cumulative distributions totaled $149.7 million, representing approximately 37.5% of capital called. The net IRR on San Diego CERS’ investment was 17.5%.1,2
As of September 30, 2016 the estimated market value of San Diego CERS’ Infrastructure Series Partnership interest plus cumulative distributions totaled $120.1 million, representing a net multiple of 1.26x cost.1,2 Cumulative distributions totaled $43.2 million, representing approximately 45.4% of capital called. The net IRR on San Diego CERS’ investment was 11.2%.1,2
Market Overview
Global fundraising in 3Q 2016 decreased by 14% compared to the amount raised in 2Q 2016.3 Global IPO issuance increased from $27.0 billion in 2Q 2016 to $29.0 billion in 3Q 2016.4 The global IPO market continued to make a recovery despite uncertainties surrounding Brexit at the end of 2Q 2016. IPO proceeds in Asia and Europe in 3Q 2016, accounting for 68% and 13% of total proceeds raised in 3Q 2016, respectively.
Global mergers & acquisitions (“M&A”) increased by 9% in 3Q 2016 from the prior quarter.5 M&A activity from 1Q-3Q 2016 decreased 20% from the same period in 2015. Political uncertainty, increased regulation and decreased confidence on boards has hampered M&A activity in 2016. Europe experienced a decline in M&A activity in 3Q 2016, while the U.S. and Asia experienced pickups in activity during the quarter, as compared to 2Q 2016.5 The largest M&A deal in 3Q 2016 was Bayer AG’s $65.0 billion acquisition of Monsanto Company.5 In terms of global M&A volume during 1Q-3Q 2016, the industrials and chemicals sector ranked first at $417.0 billion (19% share) followed by $322.0 billion (15% share) from the energy, mining and utilities sector.5
New Commitments
During the quarter, the Fund made commitments to one seasoned primary fund investment and one co-investment, along with one follow-on commitment to a co-investment totaling $60.6 million, bringing total commitments to $756.3 million.
Private Equity Investments
GCM Grosvenor Co-Investment Opportunities Fund, L.P.
Seasoned Primary Fund Commitment: $45.0 million
GCM Grosvenor Co-Investment Opportunities Fund, L.P. was formed on October 20, 2014 to make private equity co-investments alongside premier middle market buyout managers. GCM Grosvenor Private Markets seeks to create a portfolio that is diversified across private equity sponsors, industries and vintage years.
1 The net multiple and IRR of SDCERS’ Partnership interest is net of management fees, allocable expenses and carried interest at the Partnership level. 2 Estimated net IRRs and multiples for SDCERS’ Partnership interests are reflective of investments made in respect of private equity and infrastructure investments across the
Partnership’s 2009-1 Investment Series, 2011-1 Investment Series, 2012-1 PE Investment Series and 2014-1 Investment Series. Please note that for purposes of the respective net IRR and multiple calculations, Partnership-level management fees were calculated for each specific investment. Partnership-level expenses were allocated across private equity and infrastructure investments based on original commitment amounts related to investments. The calculations also reflect carried interest that has been allocated across private equity and infrastructure investments based on the net gains achieved on the respective strategies. Additional information on the calculation methodology described above is available upon request.
3 Source: Thomson ONE, November 2016. 4 Source: Renaissance Capital IPO Intelligence, Global IPO Market 3Q 2016 Quarterly Review. 5 Source: Mergermarket, Global and Regional M&A: Q1-Q3 2016.
GCM Grosvenor Pacific, L.P. September 30, 2016 Quarterly Report
4
Project Denali
Co-Investment Follow-On Investment: $5.6 million
Project Denali (the “Company”) provides integrated technology solutions in the information technology (IT) industry worldwide. The Company designs, develops, manufactures, markets, sells, and supports mobility and desktop products, including notebooks, workstations, tablets, smartphones, and desktop PCs, as well as servers and networking products and storage products to enterprises, public, small and medium businesses, and consumers. Project Denali offers high performance rack, blade, and tower servers for enterprise customers, value tower servers for small organizations, networks, and remote offices, and storage area networks, network-attached storage, direct-attached storage and backup systems.
Project Therapy
Co-Investment Commitment: $10.0 million
Project Therapy (or “Company”) is a leading provider of comprehensive outpatient rehabilitation services for the treatment of acute and chronic orthopedic injuries. The Company combines best practices from the disciplines of physical therapy, exercise physiology and athletic training. Project Therapy’s full suite of comprehensive services include: physical therapy; work conditioning; hand therapy; aquatic therapy; functional capacity assessments; sports medicine; women’s health; employer services; and fitness programs. The Company operates nearly 200 clinics throughout Illinois, Wisconsin, Indiana, Ohio, Delaware, Maryland and Pennsylvania.
Partnership Highlights
The following summarizes the combined activity during the quarter:
The Partnership made three capital calls to San Diego CERS totaling $39.3 million.
The Partnership made one non-recallable distribution to San Diego CERS totaling $25.2 million.
* * * * *
As always, we welcome the opportunity to speak with you. Please feel free to contact Bernard Yancovich at (646) 362-3737 or [email protected] should you wish to discuss your investment.
Sincerely,
GCM Grosvenor Private Markets
GCM Grosvenor Pacific, L.P. September 30, 2016 Quarterly Report
5
Summary Tables
Partnership Summary1
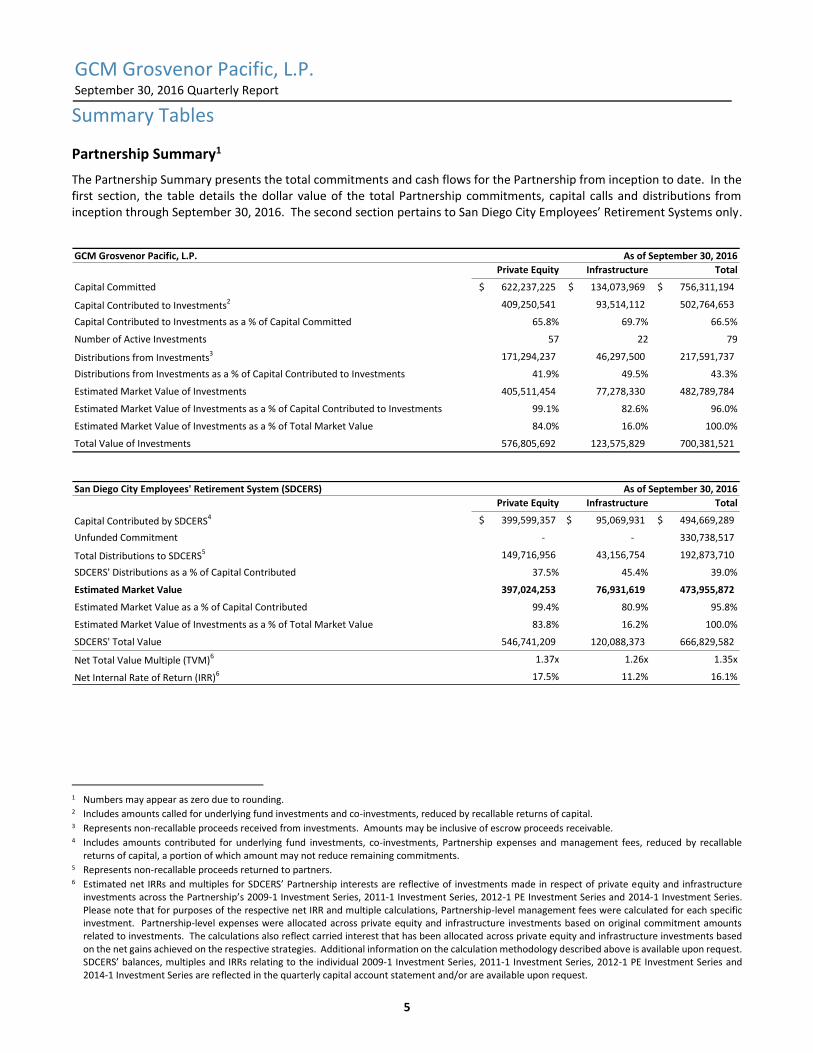
The Partnership Summary presents the total commitments and cash flows for the Partnership from inception to date. In the first section, the table details the dollar value of the total Partnership commitments, capital calls and distributions from inception through September 30, 2016. The second section pertains to San Diego City Employees’ Retirement Systems only.
1 Numbers may appear as zero due to rounding. 2 Includes amounts called for underlying fund investments and co-investments, reduced by recallable returns of capital. 3 Represents non-recallable proceeds received from investments. Amounts may be inclusive of escrow proceeds receivable. 4 Includes amounts contributed for underlying fund investments, co-investments, Partnership expenses and management fees, reduced by recallable
returns of capital, a portion of which amount may not reduce remaining commitments. 5 Represents non-recallable proceeds returned to partners. 6 Estimated net IRRs and multiples for SDCERS’ Partnership interests are reflective of investments made in respect of private equity and infrastructure
investments across the Partnership’s 2009-1 Investment Series, 2011-1 Investment Series, 2012-1 PE Investment Series and 2014-1 Investment Series. Please note that for purposes of the respective net IRR and multiple calculations, Partnership-level management fees were calculated for each specific investment. Partnership-level expenses were allocated across private equity and infrastructure investments based on original commitment amounts related to investments. The calculations also reflect carried interest that has been allocated across private equity and infrastructure investments based on the net gains achieved on the respective strategies. Additional information on the calculation methodology described above is available upon request. SDCERS’ balances, multiples and IRRs relating to the individual 2009-1 Investment Series, 2011-1 Investment Series, 2012-1 PE Investment Series and 2014-1 Investment Series are reflected in the quarterly capital account statement and/or are available upon request.
GCM Grosvenor Pacific, L.P. As of September 30, 2016
Private Equity Infrastructure Total
Capital Committed 622,237,225$ 134,073,969$ 756,311,194$
Capital Contributed to Investments2 409,250,541 93,514,112 502,764,653
Capital Contributed to Investments as a % of Capital Committed 65.8% 69.7% 66.5%
Number of Active Investments 57 22 79
Distributions from Investments3 171,294,237 46,297,500 217,591,737
Distributions from Investments as a % of Capital Contributed to Investments 41.9% 49.5% 43.3%
Estimated Market Value of Investments 405,511,454 77,278,330 482,789,784
Estimated Market Value of Investments as a % of Capital Contributed to Investments 99.1% 82.6% 96.0%
Estimated Market Value of Investments as a % of Total Market Value 84.0% 16.0% 100.0%
Total Value of Investments 576,805,692 123,575,829 700,381,521
San Diego City Employees' Retirement System (SDCERS) As of September 30, 2016
Private Equity Infrastructure Total
Capital Contributed by SDCERS4 399,599,357$ 95,069,931$ 494,669,289$
Unfunded Commitment - - 330,738,517
Total Distributions to SDCERS5 149,716,956 43,156,754 192,873,710
SDCERS' Distributions as a % of Capital Contributed 37.5% 45.4% 39.0%
Estimated Market Value 397,024,253 76,931,619 473,955,872
Estimated Market Value as a % of Capital Contributed 99.4% 80.9% 95.8%
Estimated Market Value of Investments as a % of Total Market Value 83.8% 16.2% 100.0%
SDCERS' Total Value 546,741,209 120,088,373 666,829,582
Net Total Value Multiple (TVM)6 1.37x 1.26x 1.35x
Net Internal Rate of Return (IRR)6 17.5% 11.2% 16.1%
GCM Grosvenor Pacific, L.P. September 30, 2016 Quarterly Report
6
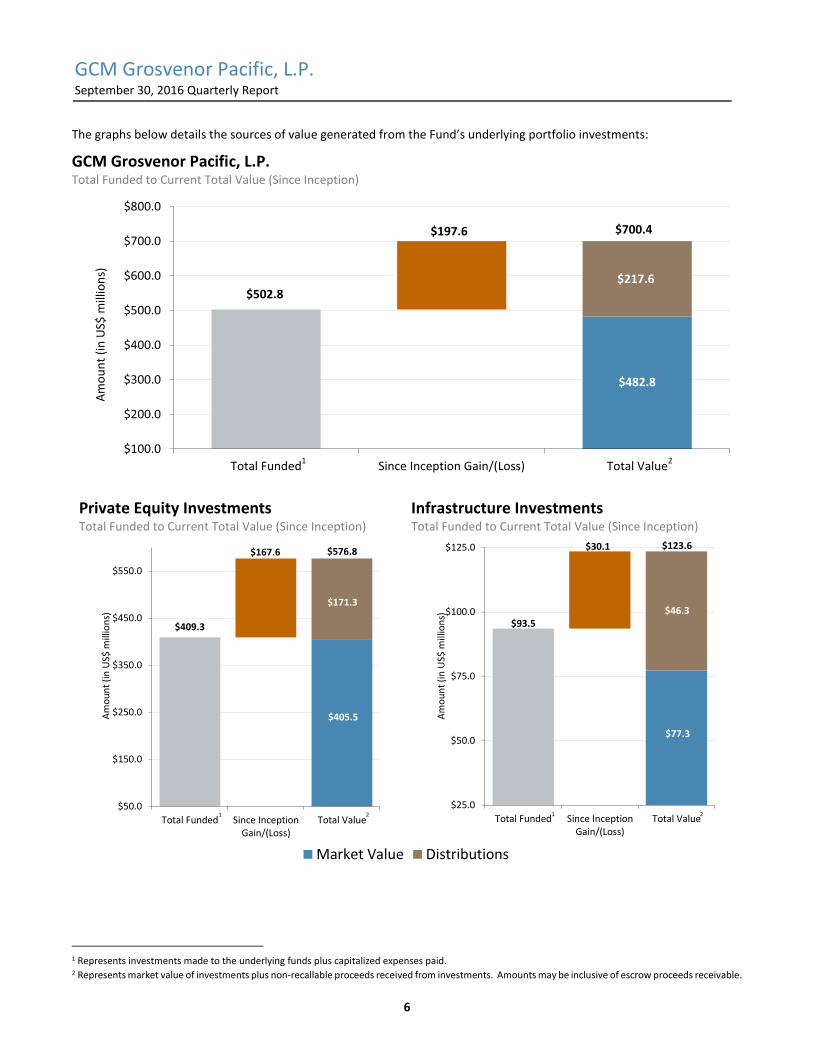
The graphs below details the sources of value generated from the Fund’s underlying portfolio investments:
GCM Grosvenor Pacific, L.P. Total Funded to Current Total Value (Since Inception) 12
Private Equity Investments Total Funded to Current Total Value (Since Inception)
Infrastructure Investments Total Funded to Current Total Value (Since Inception)
1 Represents investments made to the underlying funds plus capitalized expenses paid. 2 Represents market value of investments plus non-recallable proceeds received from investments. Amounts may be inclusive of escrow proceeds receivable.
$502.8
$482.8
$197.6
$217.6
$100.0
$200.0
$300.0
$400.0
$500.0
$600.0
$700.0
$800.0
Total Funded Since Inception Gain/(Loss) Total Value
Am
ou
nt
(in
US$
mill
ion
s)
$700.4
1 2
$409.3
$405.5
$167.6
$171.3
$50.0
$150.0
$250.0
$350.0
$450.0
$550.0
Total Funded Since InceptionGain/(Loss)
Total Value
Am
ou
nt
(in
US$
mill
ion
s)
$576.8
1 2
$93.5
$77.3
$30.1
$46.3
$25.0
$50.0
$75.0
$100.0
$125.0
Total Funded Since InceptionGain/(Loss)
Total Value
Am
ou
nt
(in
US$
mill
ion
s)
$123.6
1 2$0.0$5.0$10.0$15.0$20.0$25.0$30.0$35.0
Total FundedSince Inception Gain/(Loss)Total Value
Market Value Distributions
GCM Grosvenor Pacific, L.P. September 30, 2016 Quarterly Report
7
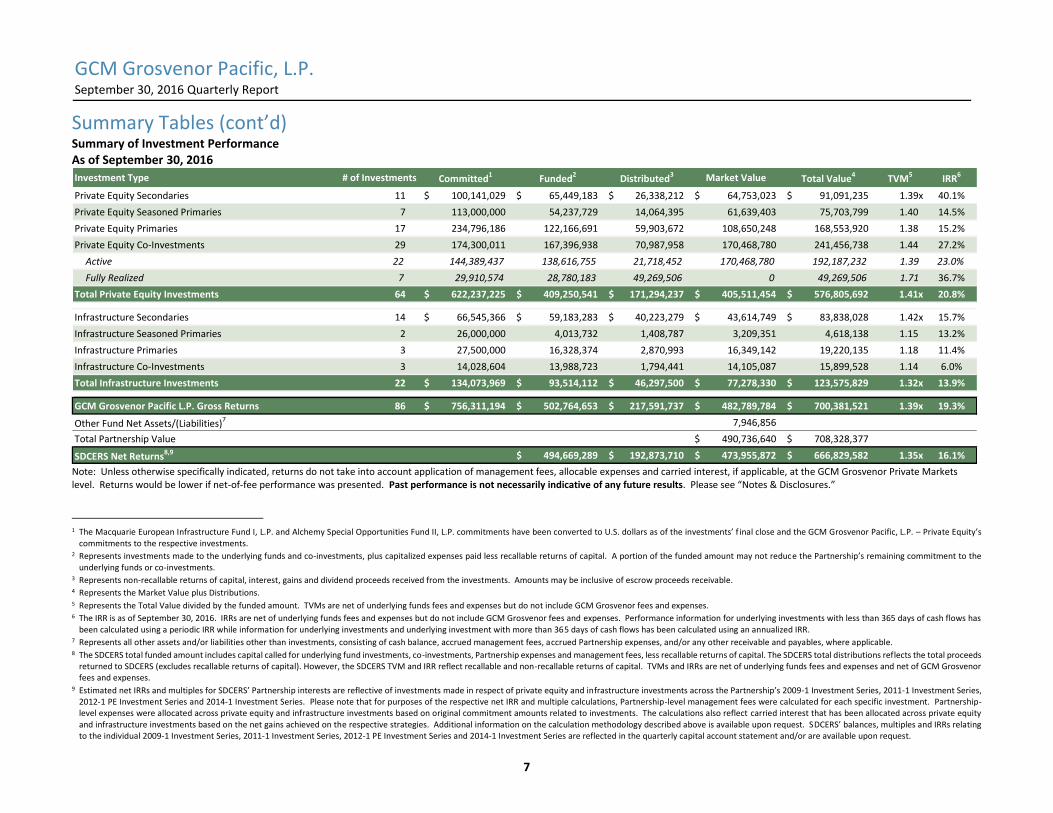
Summary Tables (cont’d) Summary of Investment Performance As of September 30, 2016
Note: Unless otherwise specifically indicated, returns do not take into account application of management fees, allocable expenses and carried interest, if applicable, at the GCM Grosvenor Private Markets level. Returns would be lower if net-of-fee performance was presented. Past performance is not necessarily indicative of any future results. Please see “Notes & Disclosures.”
1 The Macquarie European Infrastructure Fund I, L.P. and Alchemy Special Opportunities Fund II, L.P. commitments have been converted to U.S. dollars as of the investments’ f inal close and the GCM Grosvenor Pacific, L.P. – Private Equity’s
commitments to the respective investments. 2 Represents investments made to the underlying funds and co-investments, plus capitalized expenses paid less recallable returns of capital. A portion of the funded amount may not reduce the Partnership’s remaining commitment to the
underlying funds or co-investments. 3 Represents non-recallable returns of capital, interest, gains and dividend proceeds received from the investments. Amounts may be inclusive of escrow proceeds receivable. 4 Represents the Market Value plus Distributions. 5 Represents the Total Value divided by the funded amount. TVMs are net of underlying funds fees and expenses but do not include GCM Grosvenor fees and expenses. 6 The IRR is as of September 30, 2016. IRRs are net of underlying funds fees and expenses but do not include GCM Grosvenor fees and expenses. Performance information for underlying investments with less than 365 days of cash flows has
been calculated using a periodic IRR while information for underlying investments and underlying investment with more than 365 days of cash flows has been calculated using an annualized IRR. 7 Represents all other assets and/or liabilities other than investments, consisting of cash balance, accrued management fees, accrued Partnership expenses, and/or any other receivable and payables, where applicable. 8 The SDCERS total funded amount includes capital called for underlying fund investments, co-investments, Partnership expenses and management fees, less recallable returns of capital. The SDCERS total distributions reflects the total proceeds
returned to SDCERS (excludes recallable returns of capital). However, the SDCERS TVM and IRR reflect recallable and non-recallable returns of capital. TVMs and IRRs are net of underlying funds fees and expenses and net of GCM Grosvenor fees and expenses.
9 Estimated net IRRs and multiples for SDCERS’ Partnership interests are reflective of investments made in respect of private equity and infrastructure investments across the Partnership’s 2009-1 Investment Series, 2011-1 Investment Series, 2012-1 PE Investment Series and 2014-1 Investment Series. Please note that for purposes of the respective net IRR and multiple calculations, Partnership-level management fees were calculated for each specific investment. Partnership-level expenses were allocated across private equity and infrastructure investments based on original commitment amounts related to investments. The calculations also reflect carried interest that has been allocated across private equity and infrastructure investments based on the net gains achieved on the respective strategies. Additional information on the calculation methodology described above is available upon request. SDCERS’ balances, multiples and IRRs relating to the individual 2009-1 Investment Series, 2011-1 Investment Series, 2012-1 PE Investment Series and 2014-1 Investment Series are reflected in the quarterly capital account statement and/or are available upon request.
Investment Type # of Investments Committed1 Funded2 Distributed3 Market Value Total Value4 TVM5 IRR6
Private Equity Secondaries 11 100,141,029$ 65,449,183$ 26,338,212$ 64,753,023$ 91,091,235$ 1.39x 40.1%
Private Equity Seasoned Primaries 7 113,000,000 54,237,729 14,064,395 61,639,403 75,703,799 1.40 14.5%
Private Equity Primaries 17 234,796,186 122,166,691 59,903,672 108,650,248 168,553,920 1.38 15.2%
Private Equity Co-Investments 29 174,300,011 167,396,938 70,987,958 170,468,780 241,456,738 1.44 27.2%
Active 22 144,389,437 138,616,755 21,718,452 170,468,780 192,187,232 1.39 23.0%
Fully Realized 7 29,910,574 28,780,183 49,269,506 0 49,269,506 1.71 36.7%
Total Private Equity Investments 64 622,237,225$ 409,250,541$ 171,294,237$ 405,511,454$ 576,805,692$ 1.41x 20.8%
Infrastructure Secondaries 14 66,545,366$ 59,183,283$ 40,223,279$ 43,614,749$ 83,838,028$ 1.42x 15.7%
Infrastructure Seasoned Primaries 2 26,000,000 4,013,732 1,408,787 3,209,351 4,618,138 1.15 13.2%
Infrastructure Primaries 3 27,500,000 16,328,374 2,870,993 16,349,142 19,220,135 1.18 11.4%
Infrastructure Co-Investments 3 14,028,604 13,988,723 1,794,441 14,105,087 15,899,528 1.14 6.0%
Total Infrastructure Investments 22 134,073,969$ 93,514,112$ 46,297,500$ 77,278,330$ 123,575,829$ 1.32x 13.9%
GCM Grosvenor Pacific L.P. Gross Returns 86 756,311,194$ 502,764,653$ 217,591,737$ 482,789,784$ 700,381,521$ 1.39x 19.3%
Other Fund Net Assets/(Liabilities)7 7,946,856
Total Partnership Value 490,736,640$ 708,328,377$
SDCERS Net Returns8,9 494,669,289$ 192,873,710$ 473,955,872$ 666,829,582$ 1.35x 16.1%
GCM Grosvenor Pacific, L.P. September 30, 2016 Quarterly Report
8
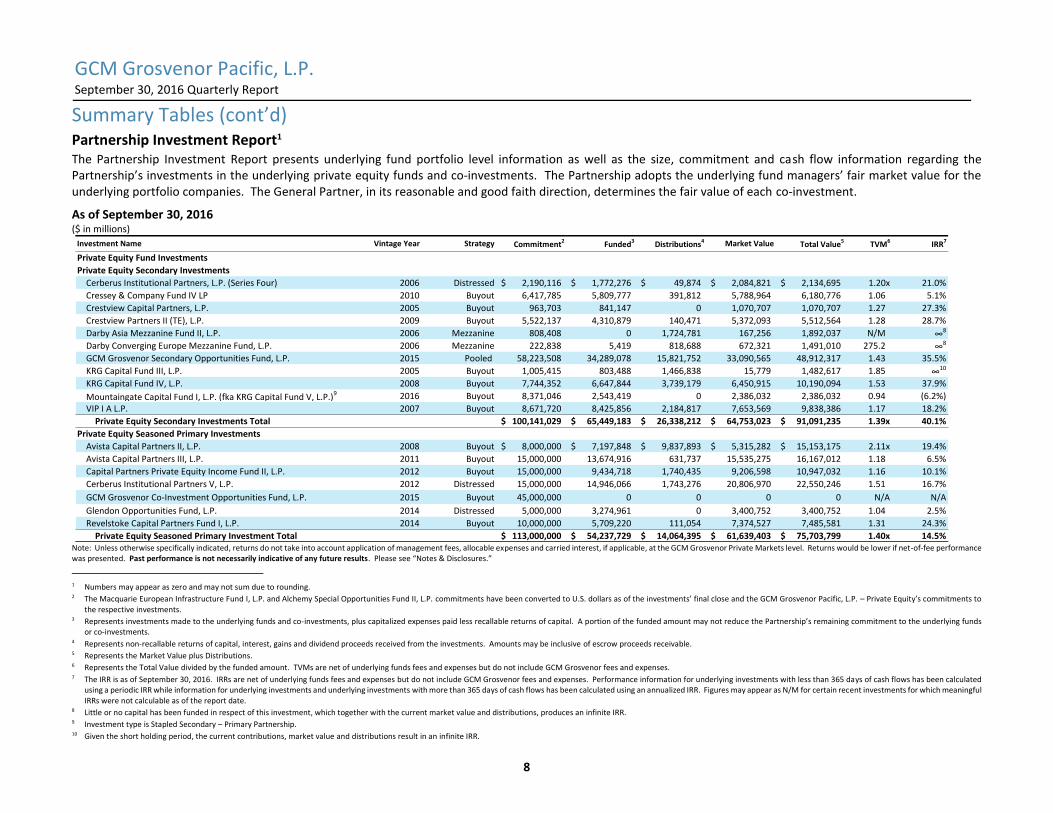
Summary Tables (cont’d) Partnership Investment Report1 The Partnership Investment Report presents underlying fund portfolio level information as well as the size, commitment and cash flow information regarding the Partnership’s investments in the underlying private equity funds and co-investments. The Partnership adopts the underlying fund managers’ fair market value for the underlying portfolio companies. The General Partner, in its reasonable and good faith direction, determines the fair value of each co-investment.
As of September 30, 2016
($ in millions)
Note: Unless otherwise specifically indicated, returns do not take into account application of management fees, allocable expenses and carried interest, if applicable, at the GCM Grosvenor Private Markets level. Returns would be lower if net-of-fee performance was presented. Past performance is not necessarily indicative of any future results. Please see “Notes & Disclosures.”
1 Numbers may appear as zero and may not sum due to rounding. 2 The Macquarie European Infrastructure Fund I, L.P. and Alchemy Special Opportunities Fund II, L.P. commitments have been converted to U.S. dollars as of the investments’ final close and the GCM Grosvenor Pacific, L.P. – Private Equity’s commitments to
the respective investments. 3 Represents investments made to the underlying funds and co-investments, plus capitalized expenses paid less recallable returns of capital. A portion of the funded amount may not reduce the Partnership’s remaining commitment to the underlying funds
or co-investments. 4 Represents non-recallable returns of capital, interest, gains and dividend proceeds received from the investments. Amounts may be inclusive of escrow proceeds receivable. 5 Represents the Market Value plus Distributions. 6 Represents the Total Value divided by the funded amount. TVMs are net of underlying funds fees and expenses but do not include GCM Grosvenor fees and expenses. 7 The IRR is as of September 30, 2016. IRRs are net of underlying funds fees and expenses but do not include GCM Grosvenor fees and expenses. Performance information for underlying investments with less than 365 days of cash flows has been calculated
using a periodic IRR while information for underlying investments and underlying investments with more than 365 days of cash flows has been calculated using an annualized IRR. Figures may appear as N/M for certain recent investments for which meaningful IRRs were not calculable as of the report date.
8 Little or no capital has been funded in respect of this investment, which together with the current market value and distributions, produces an infinite IRR. 9 Investment type is Stapled Secondary – Primary Partnership. 10 Given the short holding period, the current contributions, market value and distributions result in an infinite IRR.
Investment Name Vintage Year Strategy Commitment2 Funded3 Distributions4 Market Value Total Value5 TVM6 IRR7
Private Equity Fund Investments
Private Equity Secondary Investments
Cerberus Institutional Partners, L.P. (Series Four) 2006 Distressed 2,190,116$ 1,772,276$ 49,874$ 2,084,821$ 2,134,695$ 1.20x 21.0%
Cressey & Company Fund IV LP 2010 Buyout 6,417,785 5,809,777 391,812 5,788,964 6,180,776 1.06 5.1%
Crestview Capital Partners, L.P. 2005 Buyout 963,703 841,147 0 1,070,707 1,070,707 1.27 27.3%
Crestview Partners II (TE), L.P. 2009 Buyout 5,522,137 4,310,879 140,471 5,372,093 5,512,564 1.28 28.7%
Darby Asia Mezzanine Fund II, L.P. 2006 Mezzanine 808,408 0 1,724,781 167,256 1,892,037 N/M ∞8
Darby Converging Europe Mezzanine Fund, L.P. 2006 Mezzanine 222,838 5,419 818,688 672,321 1,491,010 275.2 ∞8
GCM Grosvenor Secondary Opportunities Fund, L.P. 2015 Pooled 58,223,508 34,289,078 15,821,752 33,090,565 48,912,317 1.43 35.5%
KRG Capital Fund III, L.P. 2005 Buyout 1,005,415 803,488 1,466,838 15,779 1,482,617 1.85 ∞10
KRG Capital Fund IV, L.P. 2008 Buyout 7,744,352 6,647,844 3,739,179 6,450,915 10,190,094 1.53 37.9%
Mountaingate Capital Fund I, L.P. (fka KRG Capital Fund V, L.P.)9 2016 Buyout 8,371,046 2,543,419 0 2,386,032 2,386,032 0.94 (6.2%)
VIP I A L.P. 2007 Buyout 8,671,720 8,425,856 2,184,817 7,653,569 9,838,386 1.17 18.2%
Private Equity Secondary Investments Total 100,141,029$ 65,449,183$ 26,338,212$ 64,753,023$ 91,091,235$ 1.39x 40.1%
Private Equity Seasoned Primary Investments
Avista Capital Partners II, L.P. 2008 Buyout 8,000,000$ 7,197,848$ 9,837,893$ 5,315,282$ 15,153,175$ 2.11x 19.4%
Avista Capital Partners III, L.P. 2011 Buyout 15,000,000 13,674,916 631,737 15,535,275 16,167,012 1.18 6.5%
Capital Partners Private Equity Income Fund II, L.P. 2012 Buyout 15,000,000 9,434,718 1,740,435 9,206,598 10,947,032 1.16 10.1%
Cerberus Institutional Partners V, L.P. 2012 Distressed 15,000,000 14,946,066 1,743,276 20,806,970 22,550,246 1.51 16.7%
GCM Grosvenor Co-Investment Opportunities Fund, L.P. 2015 Buyout 45,000,000 0 0 0 0 N/A N/A
Glendon Opportunities Fund, L.P. 2014 Distressed 5,000,000 3,274,961 0 3,400,752 3,400,752 1.04 2.5%
Revelstoke Capital Partners Fund I, L.P. 2014 Buyout 10,000,000 5,709,220 111,054 7,374,527 7,485,581 1.31 24.3%
Private Equity Seasoned Primary Investment Total 113,000,000$ 54,237,729$ 14,064,395$ 61,639,403$ 75,703,799$ 1.40x 14.5%
GCM Grosvenor Pacific, L.P. September 30, 2016 Quarterly Report
9
Summary Tables (cont’d) Partnership Investment Report1
As of September 30, 2016
($ in millions)
Note: Unless otherwise specifically indicated, returns do not take into account application of management fees, allocable expenses and carried interest, if applicable, at the GCM Grosvenor Private Markets level. Returns would be lower if net-of-fee performance was presented. Past performance is not necessarily indicative of any future results. Please see “Notes & Disclosures.”
1 Numbers may appear as zero and may not sum due to rounding. 2 The Macquarie European Infrastructure Fund I, L.P. and Alchemy Special Opportunities Fund II, L.P. commitments have been converted to U.S. dollars as of the investments’ final close and the GCM Grosvenor
Pacific, L.P. – Private Equity’s commitments to the respective investments. 3 Represents investments made to the underlying funds and co-investments, plus capitalized expenses paid less recallable returns of capital. A portion of the funded amount may not reduce the Partnership’s
remaining commitment to the underlying funds or co-investments. 4 Represents non-recallable returns of capital, interest, gains and dividend proceeds received from the investments. Amounts may be inclusive of escrow proceeds receivable. 5 Represents the Market Value plus Distributions. 6 Represents the Total Value divided by the funded amount. TVMs are net of underlying funds fees and expenses but do not include GCM Grosvenor fees and expenses. 7 The IRR is as of September 30, 2016. IRRs are net of underlying funds fees and expenses but do not include GCM Grosvenor fees and expenses. Performance information for underlying investments with less
than 365 days of cash flows has been calculated using a periodic IRR while information for underlying investments and underlying investments with more than 365 days of cash flows has been calculated using an annualized IRR. Figures may appear as N/M for certain recent investments for which meaningful IRRs were not calculable as of the report date.
8 Amounts reflect the aggregate investment held in both Maranon Mezzanine Fund II, L.P. and Maranon Mezzanine GP II, L.P.
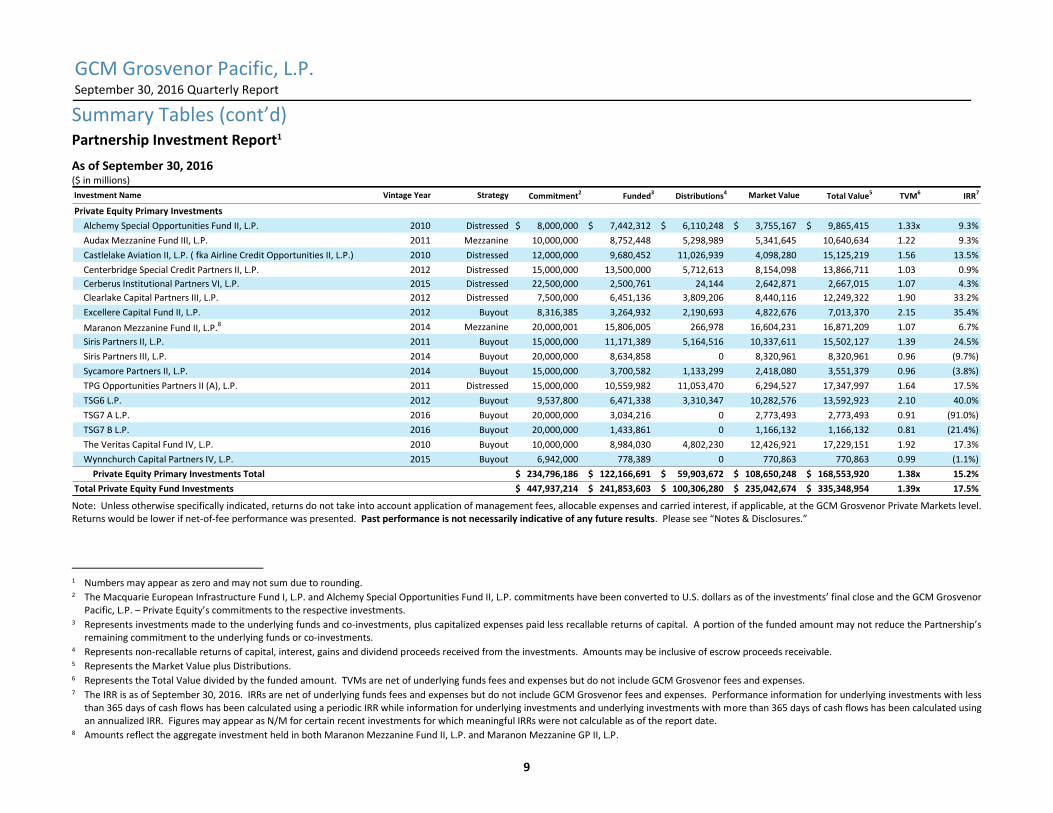
Investment Name Vintage Year Strategy Commitment2 Funded3 Distributions4 Market Value Total Value5 TVM6 IRR7
Private Equity Primary Investments
Alchemy Special Opportunities Fund II, L.P. 2010 Distressed 8,000,000$ 7,442,312$ 6,110,248$ 3,755,167$ 9,865,415$ 1.33x 9.3%
Audax Mezzanine Fund III, L.P. 2011 Mezzanine 10,000,000 8,752,448 5,298,989 5,341,645 10,640,634 1.22 9.3%
Castlelake Aviation II, L.P. ( fka Airline Credit Opportunities II, L.P.) 2010 Distressed 12,000,000 9,680,452 11,026,939 4,098,280 15,125,219 1.56 13.5%
Centerbridge Special Credit Partners II, L.P. 2012 Distressed 15,000,000 13,500,000 5,712,613 8,154,098 13,866,711 1.03 0.9%
Cerberus Institutional Partners VI, L.P. 2015 Distressed 22,500,000 2,500,761 24,144 2,642,871 2,667,015 1.07 4.3%
Clearlake Capital Partners III, L.P. 2012 Distressed 7,500,000 6,451,136 3,809,206 8,440,116 12,249,322 1.90 33.2%
Excellere Capital Fund II, L.P. 2012 Buyout 8,316,385 3,264,932 2,190,693 4,822,676 7,013,370 2.15 35.4%
Maranon Mezzanine Fund II, L.P.8 2014 Mezzanine 20,000,001 15,806,005 266,978 16,604,231 16,871,209 1.07 6.7%
Siris Partners II, L.P. 2011 Buyout 15,000,000 11,171,389 5,164,516 10,337,611 15,502,127 1.39 24.5%
Siris Partners III, L.P. 2014 Buyout 20,000,000 8,634,858 0 8,320,961 8,320,961 0.96 (9.7%)
Sycamore Partners II, L.P. 2014 Buyout 15,000,000 3,700,582 1,133,299 2,418,080 3,551,379 0.96 (3.8%)
TPG Opportunities Partners II (A), L.P. 2011 Distressed 15,000,000 10,559,982 11,053,470 6,294,527 17,347,997 1.64 17.5%
TSG6 L.P. 2012 Buyout 9,537,800 6,471,338 3,310,347 10,282,576 13,592,923 2.10 40.0%
TSG7 A L.P. 2016 Buyout 20,000,000 3,034,216 0 2,773,493 2,773,493 0.91 (91.0%)
TSG7 B L.P. 2016 Buyout 20,000,000 1,433,861 0 1,166,132 1,166,132 0.81 (21.4%)
The Veritas Capital Fund IV, L.P. 2010 Buyout 10,000,000 8,984,030 4,802,230 12,426,921 17,229,151 1.92 17.3%
Wynnchurch Capital Partners IV, L.P. 2015 Buyout 6,942,000 778,389 0 770,863 770,863 0.99 (1.1%)
Private Equity Primary Investments Total 234,796,186$ 122,166,691$ 59,903,672$ 108,650,248$ 168,553,920$ 1.38x 15.2%
Total Private Equity Fund Investments 447,937,214$ 241,853,603$ 100,306,280$ 235,042,674$ 335,348,954$ 1.39x 17.5%
GCM Grosvenor Pacific, L.P. September 30, 2016 Quarterly Report
10
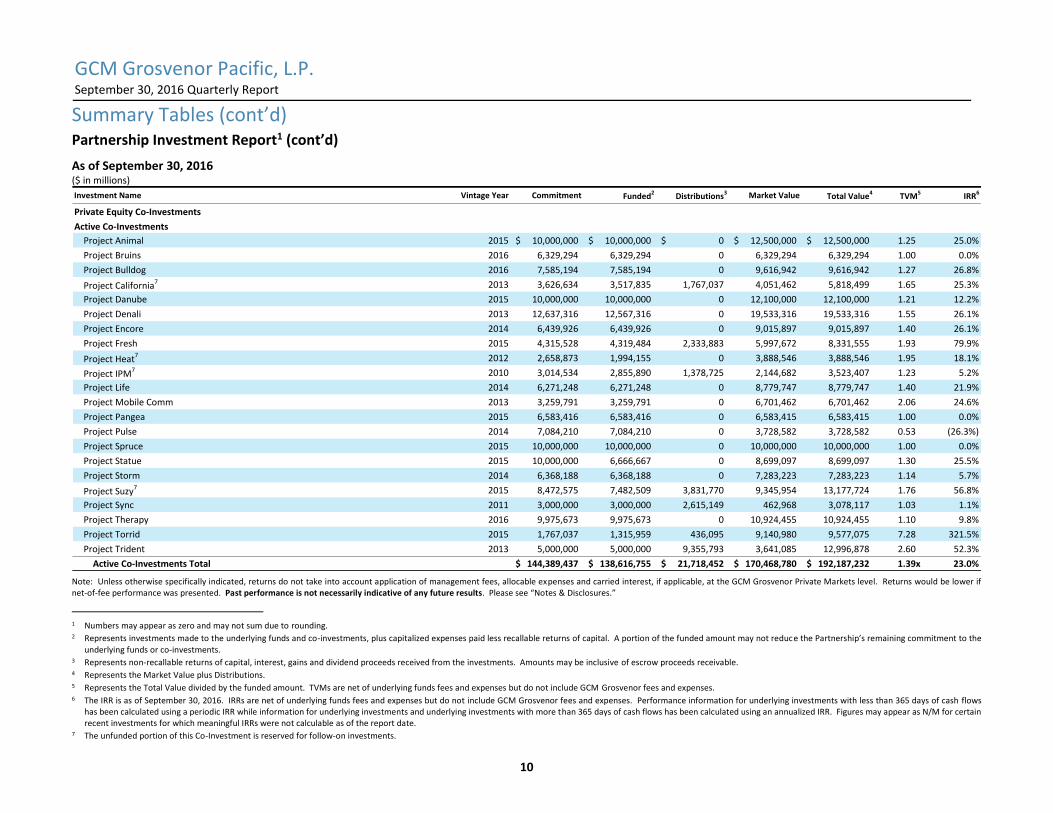
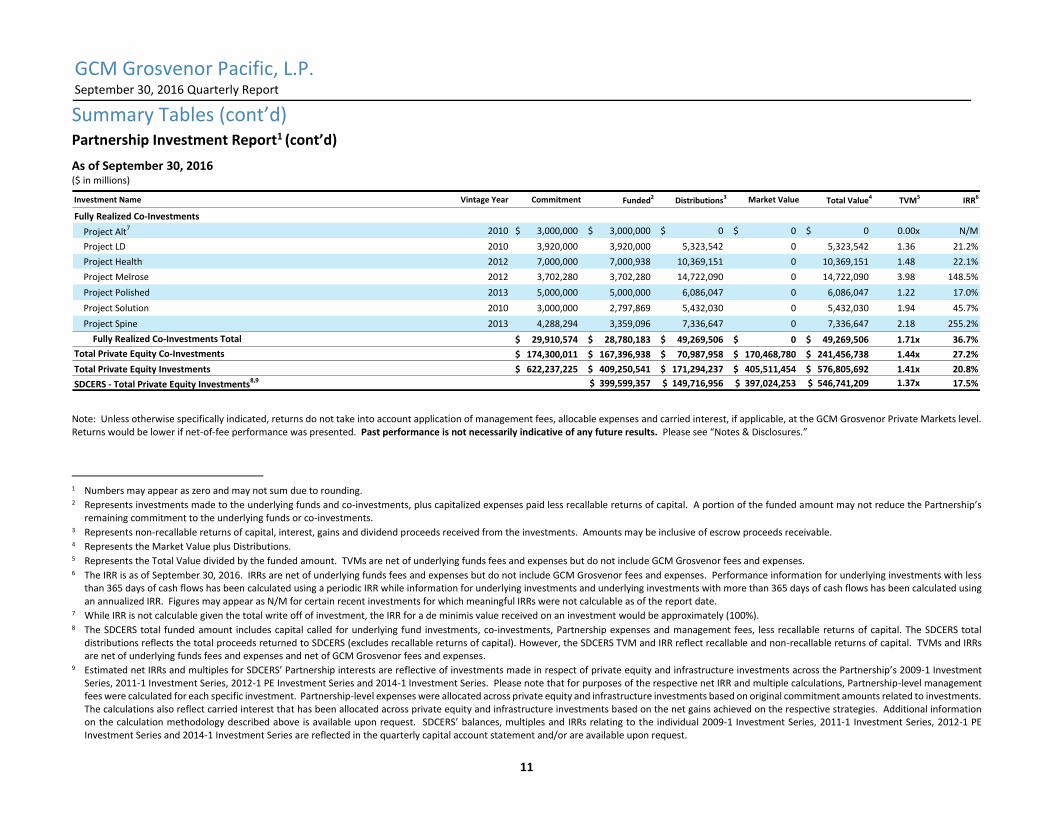
Summary Tables (cont’d) Partnership Investment Report1 (cont’d)
As of September 30, 2016
($ in millions)
Note: Unless otherwise specifically indicated, returns do not take into account application of management fees, allocable expenses and carried interest, if applicable, at the GCM Grosvenor Private Markets level. Returns would be lower if net-of-fee performance was presented. Past performance is not necessarily indicative of any future results. Please see “Notes & Disclosures.”
1 Numbers may appear as zero and may not sum due to rounding. 2 Represents investments made to the underlying funds and co-investments, plus capitalized expenses paid less recallable returns of capital. A portion of the funded amount may not reduce the Partnership’s remaining commitment to the
underlying funds or co-investments. 3 Represents non-recallable returns of capital, interest, gains and dividend proceeds received from the investments. Amounts may be inclusive of escrow proceeds receivable. 4 Represents the Market Value plus Distributions. 5 Represents the Total Value divided by the funded amount. TVMs are net of underlying funds fees and expenses but do not include GCM Grosvenor fees and expenses. 6 The IRR is as of September 30, 2016. IRRs are net of underlying funds fees and expenses but do not include GCM Grosvenor fees and expenses. Performance information for underlying investments with less than 365 days of cash flows
has been calculated using a periodic IRR while information for underlying investments and underlying investments with more than 365 days of cash flows has been calculated using an annualized IRR. Figures may appear as N/M for certain recent investments for which meaningful IRRs were not calculable as of the report date.
7 The unfunded portion of this Co-Investment is reserved for follow-on investments.
Investment Name Vintage Year Commitment Funded2 Distributions3 Market Value Total Value4 TVM5 IRR6
Private Equity Co-Investments
Active Co-Investments
Project Animal 2015 10,000,000$ 10,000,000$ 0$ 12,500,000$ 12,500,000$ 1.25 25.0%
Project Bruins 2016 6,329,294 6,329,294 0 6,329,294 6,329,294 1.00 0.0%
Project Bulldog 2016 7,585,194 7,585,194 0 9,616,942 9,616,942 1.27 26.8%
Project California7 2013 3,626,634 3,517,835 1,767,037 4,051,462 5,818,499 1.65 25.3%
Project Danube 2015 10,000,000 10,000,000 0 12,100,000 12,100,000 1.21 12.2%
Project Denali 2013 12,637,316 12,567,316 0 19,533,316 19,533,316 1.55 26.1%
Project Encore 2014 6,439,926 6,439,926 0 9,015,897 9,015,897 1.40 26.1%
Project Fresh 2015 4,315,528 4,319,484 2,333,883 5,997,672 8,331,555 1.93 79.9%
Project Heat7 2012 2,658,873 1,994,155 0 3,888,546 3,888,546 1.95 18.1%
Project IPM7 2010 3,014,534 2,855,890 1,378,725 2,144,682 3,523,407 1.23 5.2%
Project Life 2014 6,271,248 6,271,248 0 8,779,747 8,779,747 1.40 21.9%
Project Mobile Comm 2013 3,259,791 3,259,791 0 6,701,462 6,701,462 2.06 24.6%
Project Pangea 2015 6,583,416 6,583,416 0 6,583,415 6,583,415 1.00 0.0%
Project Pulse 2014 7,084,210 7,084,210 0 3,728,582 3,728,582 0.53 (26.3%)
Project Spruce 2015 10,000,000 10,000,000 0 10,000,000 10,000,000 1.00 0.0%
Project Statue 2015 10,000,000 6,666,667 0 8,699,097 8,699,097 1.30 25.5%
Project Storm 2014 6,368,188 6,368,188 0 7,283,223 7,283,223 1.14 5.7%
Project Suzy7 2015 8,472,575 7,482,509 3,831,770 9,345,954 13,177,724 1.76 56.8%
Project Sync 2011 3,000,000 3,000,000 2,615,149 462,968 3,078,117 1.03 1.1%
Project Therapy 2016 9,975,673 9,975,673 0 10,924,455 10,924,455 1.10 9.8%
Project Torrid 2015 1,767,037 1,315,959 436,095 9,140,980 9,577,075 7.28 321.5%
Project Trident 2013 5,000,000 5,000,000 9,355,793 3,641,085 12,996,878 2.60 52.3%
Active Co-Investments Total 144,389,437$ 138,616,755$ 21,718,452$ 170,468,780$ 192,187,232$ 1.39x 23.0%
GCM Grosvenor Pacific, L.P. September 30, 2016 Quarterly Report
11
Summary Tables (cont’d) Partnership Investment Report1 (cont’d)
As of September 30, 2016
($ in millions)
Note: Unless otherwise specifically indicated, returns do not take into account application of management fees, allocable expenses and carried interest, if applicable, at the GCM Grosvenor Private Markets level. Returns would be lower if net-of-fee performance was presented. Past performance is not necessarily indicative of any future results. Please see “Notes & Disclosures.”
1 Numbers may appear as zero and may not sum due to rounding. 2 Represents investments made to the underlying funds and co-investments, plus capitalized expenses paid less recallable returns of capital. A portion of the funded amount may not reduce the Partnership’s
remaining commitment to the underlying funds or co-investments. 3 Represents non-recallable returns of capital, interest, gains and dividend proceeds received from the investments. Amounts may be inclusive of escrow proceeds receivable. 4 Represents the Market Value plus Distributions. 5 Represents the Total Value divided by the funded amount. TVMs are net of underlying funds fees and expenses but do not include GCM Grosvenor fees and expenses. 6 The IRR is as of September 30, 2016. IRRs are net of underlying funds fees and expenses but do not include GCM Grosvenor fees and expenses. Performance information for underlying investments with less
than 365 days of cash flows has been calculated using a periodic IRR while information for underlying investments and underlying investments with more than 365 days of cash flows has been calculated using an annualized IRR. Figures may appear as N/M for certain recent investments for which meaningful IRRs were not calculable as of the report date.
7 While IRR is not calculable given the total write off of investment, the IRR for a de minimis value received on an investment would be approximately (100%). 8 The SDCERS total funded amount includes capital called for underlying fund investments, co-investments, Partnership expenses and management fees, less recallable returns of capital. The SDCERS total
distributions reflects the total proceeds returned to SDCERS (excludes recallable returns of capital). However, the SDCERS TVM and IRR reflect recallable and non-recallable returns of capital. TVMs and IRRs are net of underlying funds fees and expenses and net of GCM Grosvenor fees and expenses.
9 Estimated net IRRs and multiples for SDCERS’ Partnership interests are reflective of investments made in respect of private equity and infrastructure investments across the Partnership’s 2009-1 Investment Series, 2011-1 Investment Series, 2012-1 PE Investment Series and 2014-1 Investment Series. Please note that for purposes of the respective net IRR and multiple calculations, Partnership-level management fees were calculated for each specific investment. Partnership-level expenses were allocated across private equity and infrastructure investments based on original commitment amounts related to investments. The calculations also reflect carried interest that has been allocated across private equity and infrastructure investments based on the net gains achieved on the respective strategies. Additional information on the calculation methodology described above is available upon request. SDCERS’ balances, multiples and IRRs relating to the individual 2009-1 Investment Series, 2011-1 Investment Series, 2012-1 PE Investment Series and 2014-1 Investment Series are reflected in the quarterly capital account statement and/or are available upon request.
Investment Name Vintage Year Commitment Funded2 Distributions3 Market Value Total Value4 TVM5 IRR6
Fully Realized Co-Investments
Project Alt7 2010 3,000,000$ 3,000,000$ 0$ 0$ 0$ 0.00x N/M
Project LD 2010 3,920,000 3,920,000 5,323,542 0 5,323,542 1.36 21.2%
Project Health 2012 7,000,000 7,000,938 10,369,151 0 10,369,151 1.48 22.1%
Project Melrose 2012 3,702,280 3,702,280 14,722,090 0 14,722,090 3.98 148.5%
Project Polished 2013 5,000,000 5,000,000 6,086,047 0 6,086,047 1.22 17.0%
Project Solution 2010 3,000,000 2,797,869 5,432,030 0 5,432,030 1.94 45.7%
Project Spine 2013 4,288,294 3,359,096 7,336,647 0 7,336,647 2.18 255.2%
Fully Realized Co-Investments Total 29,910,574$ 28,780,183$ 49,269,506$ 0$ 49,269,506$ 1.71x 36.7%
Total Private Equity Co-Investments 174,300,011$ 167,396,938$ 70,987,958$ 170,468,780$ 241,456,738$ 1.44x 27.2%
Total Private Equity Investments 622,237,225$ 409,250,541$ 171,294,237$ 405,511,454$ 576,805,692$ 1.41x 20.8%
SDCERS - Total Private Equity Investments8,9 399,599,357$ 149,716,956$ 397,024,253$ 546,741,209$ 1.37x 17.5%
GCM Grosvenor Pacific, L.P. September 30, 2016 Quarterly Report
12
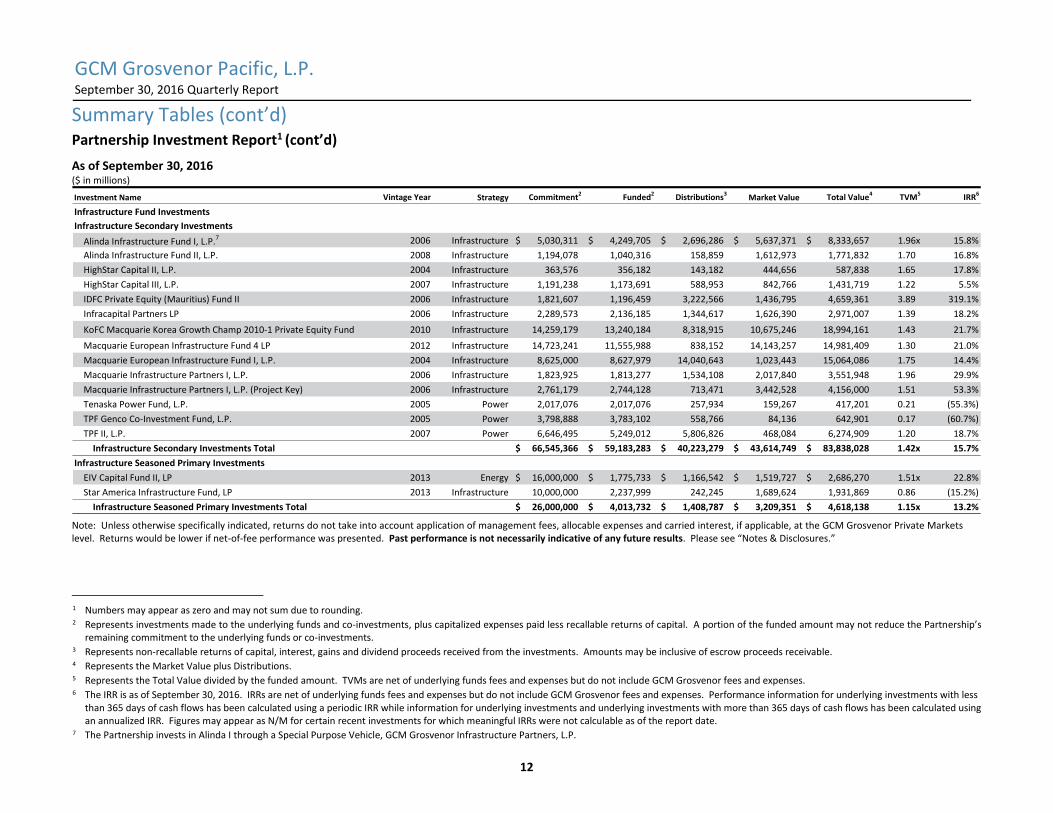
Summary Tables (cont’d) Partnership Investment Report1 (cont’d)
As of September 30, 2016 ($ in millions)
Note: Unless otherwise specifically indicated, returns do not take into account application of management fees, allocable expenses and carried interest, if applicable, at the GCM Grosvenor Private Markets level. Returns would be lower if net-of-fee performance was presented. Past performance is not necessarily indicative of any future results. Please see “Notes & Disclosures.”
1 Numbers may appear as zero and may not sum due to rounding. 2 Represents investments made to the underlying funds and co-investments, plus capitalized expenses paid less recallable returns of capital. A portion of the funded amount may not reduce the Partnership’s
remaining commitment to the underlying funds or co-investments. 3 Represents non-recallable returns of capital, interest, gains and dividend proceeds received from the investments. Amounts may be inclusive of escrow proceeds receivable. 4 Represents the Market Value plus Distributions. 5 Represents the Total Value divided by the funded amount. TVMs are net of underlying funds fees and expenses but do not include GCM Grosvenor fees and expenses. 6 The IRR is as of September 30, 2016. IRRs are net of underlying funds fees and expenses but do not include GCM Grosvenor fees and expenses. Performance information for underlying investments with less
than 365 days of cash flows has been calculated using a periodic IRR while information for underlying investments and underlying investments with more than 365 days of cash flows has been calculated using an annualized IRR. Figures may appear as N/M for certain recent investments for which meaningful IRRs were not calculable as of the report date.
7 The Partnership invests in Alinda I through a Special Purpose Vehicle, GCM Grosvenor Infrastructure Partners, L.P.
Investment Name Vintage Year Strategy Commitment2 Funded2 Distributions3Market Value Total Value4 TVM5 IRR6
Infrastructure Fund Investments
Infrastructure Secondary Investments
Alinda Infrastructure Fund I, L.P.7 2006 Infrastructure 5,030,311$ 4,249,705$ 2,696,286$ 5,637,371$ 8,333,657$ 1.96x 15.8%
Alinda Infrastructure Fund II, L.P. 2008 Infrastructure 1,194,078 1,040,316 158,859 1,612,973 1,771,832 1.70 16.8%
HighStar Capital II, L.P. 2004 Infrastructure 363,576 356,182 143,182 444,656 587,838 1.65 17.8%
HighStar Capital III, L.P. 2007 Infrastructure 1,191,238 1,173,691 588,953 842,766 1,431,719 1.22 5.5%
IDFC Private Equity (Mauritius) Fund II 2006 Infrastructure 1,821,607 1,196,459 3,222,566 1,436,795 4,659,361 3.89 319.1%
Infracapital Partners LP 2006 Infrastructure 2,289,573 2,136,185 1,344,617 1,626,390 2,971,007 1.39 18.2%
KoFC Macquarie Korea Growth Champ 2010-1 Private Equity Fund 2010 Infrastructure 14,259,179 13,240,184 8,318,915 10,675,246 18,994,161 1.43 21.7%
Macquarie European Infrastructure Fund 4 LP 2012 Infrastructure 14,723,241 11,555,988 838,152 14,143,257 14,981,409 1.30 21.0%
Macquarie European Infrastructure Fund I, L.P. 2004 Infrastructure 8,625,000 8,627,979 14,040,643 1,023,443 15,064,086 1.75 14.4%
Macquarie Infrastructure Partners I, L.P. 2006 Infrastructure 1,823,925 1,813,277 1,534,108 2,017,840 3,551,948 1.96 29.9%
Macquarie Infrastructure Partners I, L.P. (Project Key) 2006 Infrastructure 2,761,179 2,744,128 713,471 3,442,528 4,156,000 1.51 53.3%
Tenaska Power Fund, L.P. 2005 Power 2,017,076 2,017,076 257,934 159,267 417,201 0.21 (55.3%)
TPF Genco Co-Investment Fund, L.P. 2005 Power 3,798,888 3,783,102 558,766 84,136 642,901 0.17 (60.7%)
TPF II, L.P. 2007 Power 6,646,495 5,249,012 5,806,826 468,084 6,274,909 1.20 18.7%
Infrastructure Secondary Investments Total 66,545,366$ 59,183,283$ 40,223,279$ 43,614,749$ 83,838,028$ 1.42x 15.7%
Infrastructure Seasoned Primary Investments
EIV Capital Fund II, LP 2013 Energy 16,000,000$ 1,775,733$ 1,166,542$ 1,519,727$ 2,686,270$ 1.51x 22.8%
Star America Infrastructure Fund, LP 2013 Infrastructure 10,000,000 2,237,999 242,245 1,689,624 1,931,869 0.86 (15.2%)
Infrastructure Seasoned Primary Investments Total 26,000,000$ 4,013,732$ 1,408,787$ 3,209,351$ 4,618,138$ 1.15x 13.2%
GCM Grosvenor Pacific, L.P. September 30, 2016 Quarterly Report
13
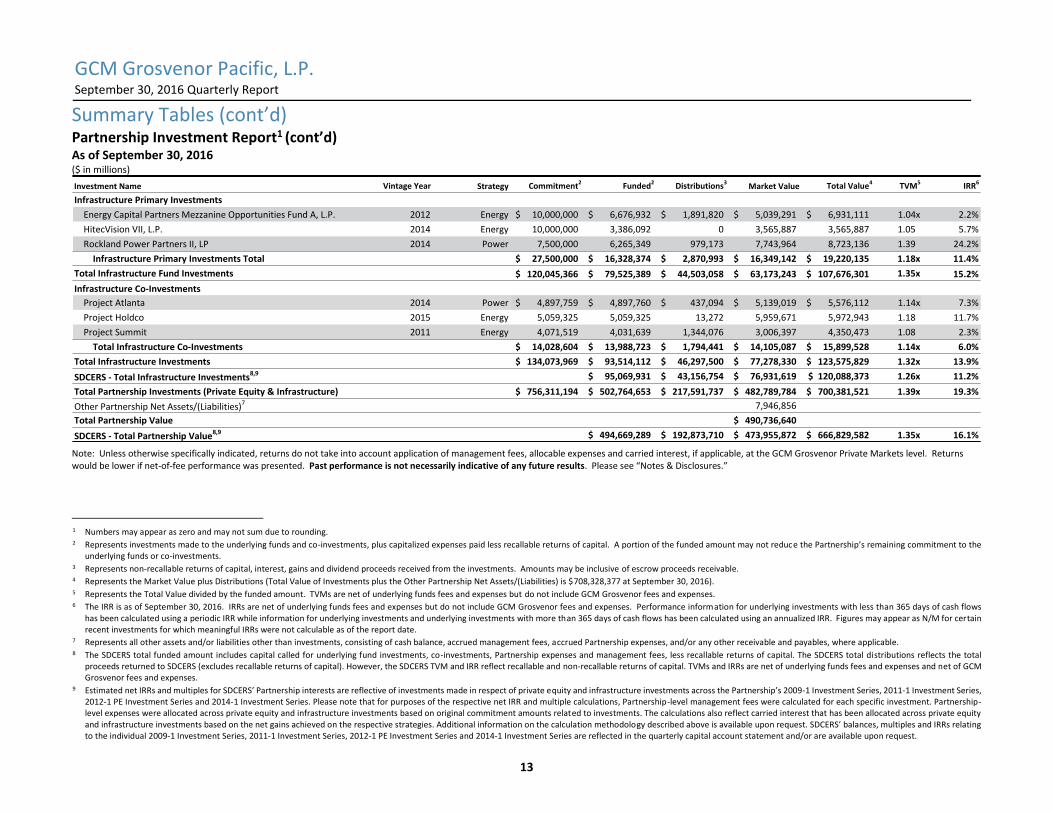
Summary Tables (cont’d) Partnership Investment Report1 (cont’d) As of September 30, 2016 ($ in millions)
Note: Unless otherwise specifically indicated, returns do not take into account application of management fees, allocable expenses and carried interest, if applicable, at the GCM Grosvenor Private Markets level. Returns would be lower if net-of-fee performance was presented. Past performance is not necessarily indicative of any future results. Please see “Notes & Disclosures.”
1 Numbers may appear as zero and may not sum due to rounding. 2 Represents investments made to the underlying funds and co-investments, plus capitalized expenses paid less recallable returns of capital. A portion of the funded amount may not reduce the Partnership’s remaining commitment to the
underlying funds or co-investments. 3 Represents non-recallable returns of capital, interest, gains and dividend proceeds received from the investments. Amounts may be inclusive of escrow proceeds receivable. 4 Represents the Market Value plus Distributions (Total Value of Investments plus the Other Partnership Net Assets/(Liabilities) is $708,328,377 at September 30, 2016). 5 Represents the Total Value divided by the funded amount. TVMs are net of underlying funds fees and expenses but do not include GCM Grosvenor fees and expenses. 6 The IRR is as of September 30, 2016. IRRs are net of underlying funds fees and expenses but do not include GCM Grosvenor fees and expenses. Performance information for underlying investments with less than 365 days of cash flows
has been calculated using a periodic IRR while information for underlying investments and underlying investments with more than 365 days of cash flows has been calculated using an annualized IRR. Figures may appear as N/M for certain recent investments for which meaningful IRRs were not calculable as of the report date.
7 Represents all other assets and/or liabilities other than investments, consisting of cash balance, accrued management fees, accrued Partnership expenses, and/or any other receivable and payables, where applicable. 8 The SDCERS total funded amount includes capital called for underlying fund investments, co-investments, Partnership expenses and management fees, less recallable returns of capital. The SDCERS total distributions reflects the total
proceeds returned to SDCERS (excludes recallable returns of capital). However, the SDCERS TVM and IRR reflect recallable and non-recallable returns of capital. TVMs and IRRs are net of underlying funds fees and expenses and net of GCM Grosvenor fees and expenses.
9 Estimated net IRRs and multiples for SDCERS’ Partnership interests are reflective of investments made in respect of private equity and infrastructure investments across the Partnership’s 2009-1 Investment Series, 2011-1 Investment Series, 2012-1 PE Investment Series and 2014-1 Investment Series. Please note that for purposes of the respective net IRR and multiple calculations, Partnership-level management fees were calculated for each specific investment. Partnership-level expenses were allocated across private equity and infrastructure investments based on original commitment amounts related to investments. The calculations also reflect carried interest that has been allocated across private equity and infrastructure investments based on the net gains achieved on the respective strategies. Additional information on the calculation methodology described above is available upon request. SDCERS’ balances, multiples and IRRs relating to the individual 2009-1 Investment Series, 2011-1 Investment Series, 2012-1 PE Investment Series and 2014-1 Investment Series are reflected in the quarterly capital account statement and/or are available upon request.
Investment Name Vintage Year Strategy Commitment2 Funded2 Distributions3Market Value Total Value4 TVM5 IRR6
Infrastructure Primary Investments
Energy Capital Partners Mezzanine Opportunities Fund A, L.P. 2012 Energy 10,000,000$ 6,676,932$ 1,891,820$ 5,039,291$ 6,931,111$ 1.04x 2.2%
HitecVision VII, L.P. 2014 Energy 10,000,000 3,386,092 0 3,565,887 3,565,887 1.05 5.7%
Rockland Power Partners II, LP 2014 Power 7,500,000 6,265,349 979,173 7,743,964 8,723,136 1.39 24.2%
Infrastructure Primary Investments Total 27,500,000$ 16,328,374$ 2,870,993$ 16,349,142$ 19,220,135$ 1.18x 11.4%
Total Infrastructure Fund Investments 120,045,366$ 79,525,389$ 44,503,058$ 63,173,243$ 107,676,301$ 1.35x 15.2%
Infrastructure Co-Investments
Project Atlanta 2014 Power 4,897,759$ 4,897,760$ 437,094$ 5,139,019$ 5,576,112$ 1.14x 7.3%
Project Holdco 2015 Energy 5,059,325 5,059,325 13,272 5,959,671 5,972,943 1.18 11.7%
Project Summit 2011 Energy 4,071,519 4,031,639 1,344,076 3,006,397 4,350,473 1.08 2.3%
Total Infrastructure Co-Investments 14,028,604$ 13,988,723$ 1,794,441$ 14,105,087$ 15,899,528$ 1.14x 6.0%
Total Infrastructure Investments 134,073,969$ 93,514,112$ 46,297,500$ 77,278,330$ 123,575,829$ 1.32x 13.9%
SDCERS - Total Infrastructure Investments8,9 95,069,931$ 43,156,754$ 76,931,619$ 120,088,373$ 1.26x 11.2%
Total Partnership Investments (Private Equity & Infrastructure) 756,311,194$ 502,764,653$ 217,591,737$ 482,789,784$ 700,381,521$ 1.39x 19.3%
Other Partnership Net Assets/(Liabilities)7 7,946,856
Total Partnership Value 490,736,640$
SDCERS - Total Partnership Value8,9 494,669,289$ 192,873,710$ 473,955,872$ 666,829,582$ 1.35x 16.1%
GCM Grosvenor Pacific, L.P. September 30, 2016 Quarterly Report
14
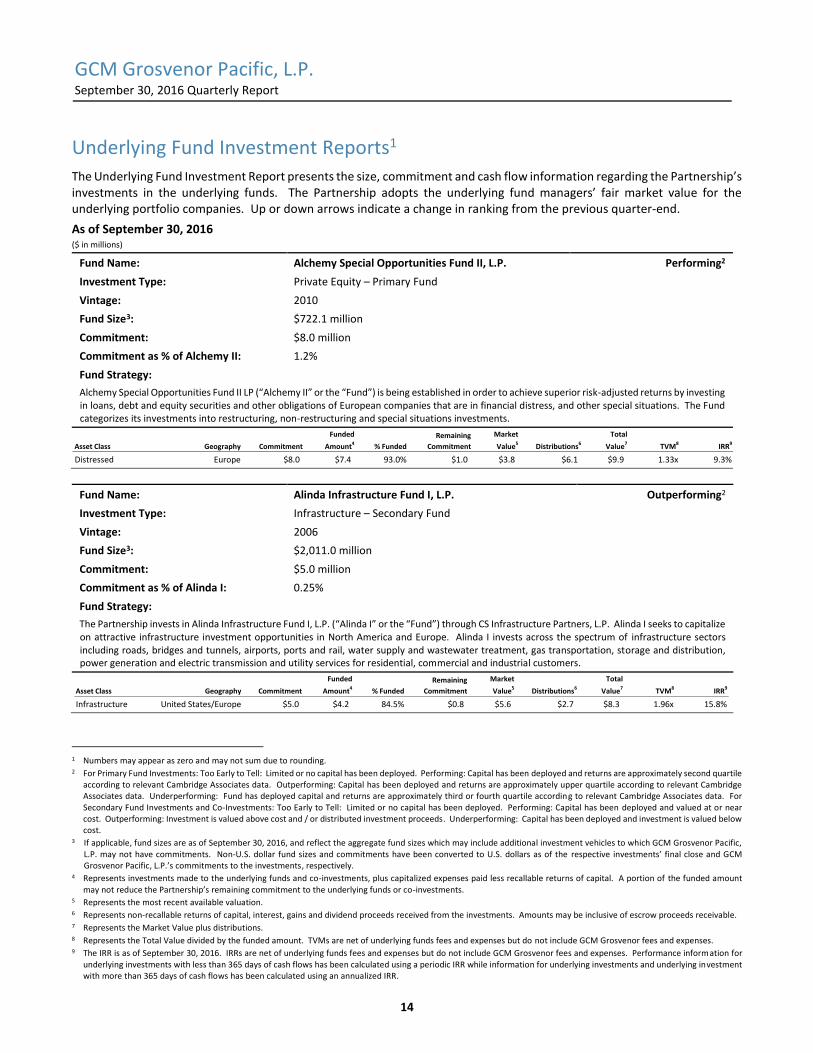
Underlying Fund Investment Reports1 The Underlying Fund Investment Report presents the size, commitment and cash flow information regarding the Partnership’s investments in the underlying funds. The Partnership adopts the underlying fund managers’ fair market value for the underlying portfolio companies. Up or down arrows indicate a change in ranking from the previous quarter-end.
As of September 30, 2016 ($ in millions)
Fund Name: Alchemy Special Opportunities Fund II, L.P. Performing2
Investment Type: Private Equity – Primary Fund
Vintage: 2010
Fund Size3: $722.1 million
Commitment: $8.0 million
Commitment as % of Alchemy II: 1.2%
Fund Strategy:
Alchemy Special Opportunities Fund II LP (“Alchemy II” or the “Fund”) is being established in order to achieve superior risk-adjusted returns by investing in loans, debt and equity securities and other obligations of European companies that are in financial distress, and other special situations. The Fund categorizes its investments into restructuring, non-restructuring and special situations investments.
Fund Name: Alinda Infrastructure Fund I, L.P. Outperforming2
Investment Type: Infrastructure – Secondary Fund
Vintage: 2006
Fund Size3: $2,011.0 million
Commitment: $5.0 million
Commitment as % of Alinda I: 0.25%
Fund Strategy:
The Partnership invests in Alinda Infrastructure Fund I, L.P. (“Alinda I” or the “Fund”) through CS Infrastructure Partners, L.P. Alinda I seeks to capitalize on attractive infrastructure investment opportunities in North America and Europe. Alinda I invests across the spectrum of infrastructure sectors including roads, bridges and tunnels, airports, ports and rail, water supply and wastewater treatment, gas transportation, storage and distribution, power generation and electric transmission and utility services for residential, commercial and industrial customers.
1 Numbers may appear as zero and may not sum due to rounding. 2 For Primary Fund Investments: Too Early to Tell: Limited or no capital has been deployed. Performing: Capital has been deployed and returns are approximately second quartile
according to relevant Cambridge Associates data. Outperforming: Capital has been deployed and returns are approximately upper quartile according to relevant Cambridge Associates data. Underperforming: Fund has deployed capital and returns are approximately third or fourth quartile according to relevant Cambridge Associates data. For Secondary Fund Investments and Co-Investments: Too Early to Tell: Limited or no capital has been deployed. Performing: Capital has been deployed and valued at or near cost. Outperforming: Investment is valued above cost and / or distributed investment proceeds. Underperforming: Capital has been deployed and investment is valued below cost.
3 If applicable, fund sizes are as of September 30, 2016, and reflect the aggregate fund sizes which may include additional investment vehicles to which GCM Grosvenor Pacific, L.P. may not have commitments. Non-U.S. dollar fund sizes and commitments have been converted to U.S. dollars as of the respective investments’ final close and GCM Grosvenor Pacific, L.P.’s commitments to the investments, respectively.
4 Represents investments made to the underlying funds and co-investments, plus capitalized expenses paid less recallable returns of capital. A portion of the funded amount may not reduce the Partnership’s remaining commitment to the underlying funds or co-investments.
5 Represents the most recent available valuation. 6 Represents non-recallable returns of capital, interest, gains and dividend proceeds received from the investments. Amounts may be inclusive of escrow proceeds receivable. 7 Represents the Market Value plus distributions. 8 Represents the Total Value divided by the funded amount. TVMs are net of underlying funds fees and expenses but do not include GCM Grosvenor fees and expenses. 9 The IRR is as of September 30, 2016. IRRs are net of underlying funds fees and expenses but do not include GCM Grosvenor fees and expenses. Performance information for
underlying investments with less than 365 days of cash flows has been calculated using a periodic IRR while information for underlying investments and underlying investment with more than 365 days of cash flows has been calculated using an annualized IRR.
Asset Class Geography Commitment
Funded
Amount4 % Funded
Remaining
Commitment
Market
Value5 Distributions6
Total
Value7 TVM8 IRR9
Distressed Europe $8.0 $7.4 93.0% $1.0 $3.8 $6.1 $9.9 1.33x 9.3%
Asset Class Geography Commitment
Funded
Amount4 % Funded
Remaining
Commitment
Market
Value5 Distributions6
Total
Value7 TVM8 IRR9
Infrastructure United States/Europe $5.0 $4.2 84.5% $0.8 $5.6 $2.7 $8.3 1.96x 15.8%
GCM Grosvenor Pacific, L.P. September 30, 2016 Quarterly Report
15
Underlying Fund Investment Reports (cont’d)1 As of September 30, 2016 ($ in millions)
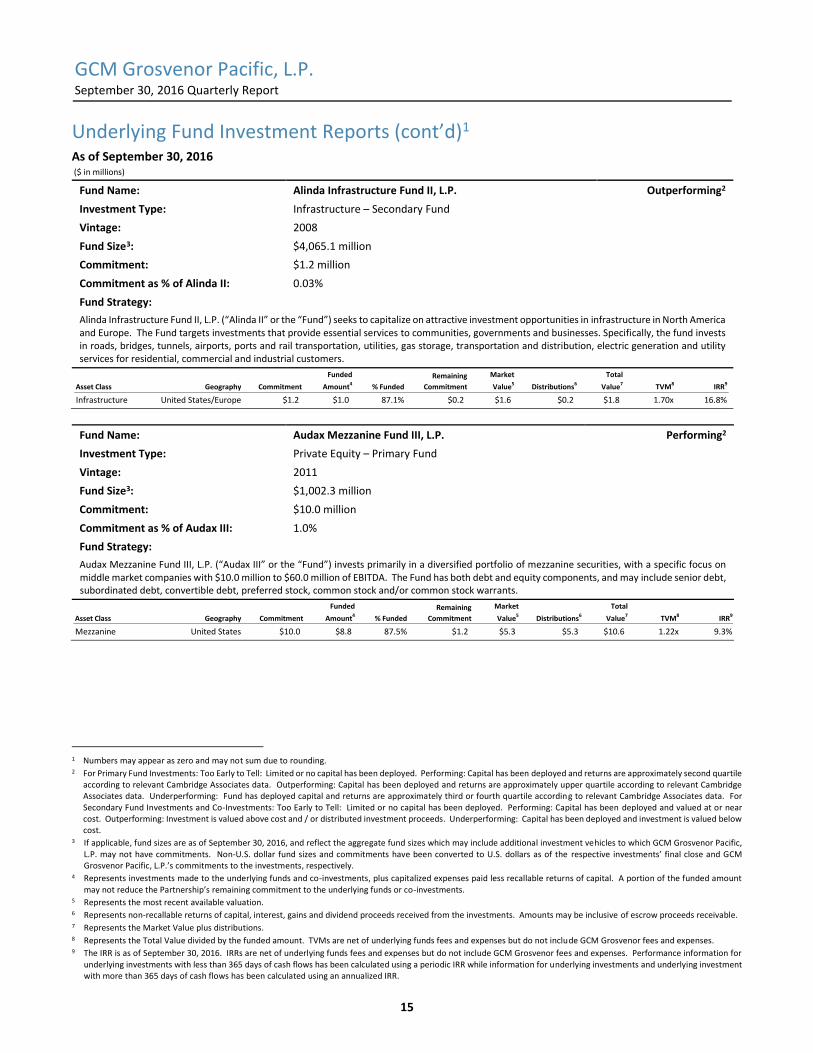
Fund Name: Alinda Infrastructure Fund II, L.P. Outperforming2
Investment Type: Infrastructure – Secondary Fund
Vintage: 2008
Fund Size3: $4,065.1 million
Commitment: $1.2 million
Commitment as % of Alinda II: 0.03%
Fund Strategy:
Alinda Infrastructure Fund II, L.P. (“Alinda II” or the “Fund”) seeks to capitalize on attractive investment opportunities in infrastructure in North America and Europe. The Fund targets investments that provide essential services to communities, governments and businesses. Specifically, the fund invests in roads, bridges, tunnels, airports, ports and rail transportation, utilities, gas storage, transportation and distribution, electric generation and utility services for residential, commercial and industrial customers.
Fund Name: Audax Mezzanine Fund III, L.P. Performing2
Investment Type: Private Equity – Primary Fund
Vintage: 2011
Fund Size3: $1,002.3 million
Commitment: $10.0 million
Commitment as % of Audax III: 1.0%
Fund Strategy:
Audax Mezzanine Fund III, L.P. (“Audax III” or the “Fund”) invests primarily in a diversified portfolio of mezzanine securities, with a specific focus on middle market companies with $10.0 million to $60.0 million of EBITDA. The Fund has both debt and equity components, and may include senior debt, subordinated debt, convertible debt, preferred stock, common stock and/or common stock warrants.
1 Numbers may appear as zero and may not sum due to rounding. 2 For Primary Fund Investments: Too Early to Tell: Limited or no capital has been deployed. Performing: Capital has been deployed and returns are approximately second quartile
according to relevant Cambridge Associates data. Outperforming: Capital has been deployed and returns are approximately upper quartile according to relevant Cambridge Associates data. Underperforming: Fund has deployed capital and returns are approximately third or fourth quartile according to relevant Cambridge Associates data. For Secondary Fund Investments and Co-Investments: Too Early to Tell: Limited or no capital has been deployed. Performing: Capital has been deployed and valued at or near cost. Outperforming: Investment is valued above cost and / or distributed investment proceeds. Underperforming: Capital has been deployed and investment is valued below cost.
3 If applicable, fund sizes are as of September 30, 2016, and reflect the aggregate fund sizes which may include additional investment vehicles to which GCM Grosvenor Pacific, L.P. may not have commitments. Non-U.S. dollar fund sizes and commitments have been converted to U.S. dollars as of the respective investments’ final close and GCM Grosvenor Pacific, L.P.’s commitments to the investments, respectively.
4 Represents investments made to the underlying funds and co-investments, plus capitalized expenses paid less recallable returns of capital. A portion of the funded amount may not reduce the Partnership’s remaining commitment to the underlying funds or co-investments.
5 Represents the most recent available valuation. 6 Represents non-recallable returns of capital, interest, gains and dividend proceeds received from the investments. Amounts may be inclusive of escrow proceeds receivable. 7 Represents the Market Value plus distributions. 8 Represents the Total Value divided by the funded amount. TVMs are net of underlying funds fees and expenses but do not include GCM Grosvenor fees and expenses. 9 The IRR is as of September 30, 2016. IRRs are net of underlying funds fees and expenses but do not include GCM Grosvenor fees and expenses. Performance information for
underlying investments with less than 365 days of cash flows has been calculated using a periodic IRR while information for underlying investments and underlying investment with more than 365 days of cash flows has been calculated using an annualized IRR.
Asset Class Geography Commitment
Funded
Amount4 % Funded
Remaining
Commitment
Market
Value5 Distributions6
Total
Value7 TVM8 IRR9
Infrastructure United States/Europe $1.2 $1.0 87.1% $0.2 $1.6 $0.2 $1.8 1.70x 16.8%
Asset Class Geography Commitment
Funded
Amount4 % Funded
Remaining
Commitment
Market
Value5 Distributions6
Total
Value7 TVM8 IRR9
Mezzanine United States $10.0 $8.8 87.5% $1.2 $5.3 $5.3 $10.6 1.22x 9.3%
GCM Grosvenor Pacific, L.P. September 30, 2016 Quarterly Report
16
Underlying Fund Investment Reports (cont’d)1 As of September 30, 2016 ($ in millions)
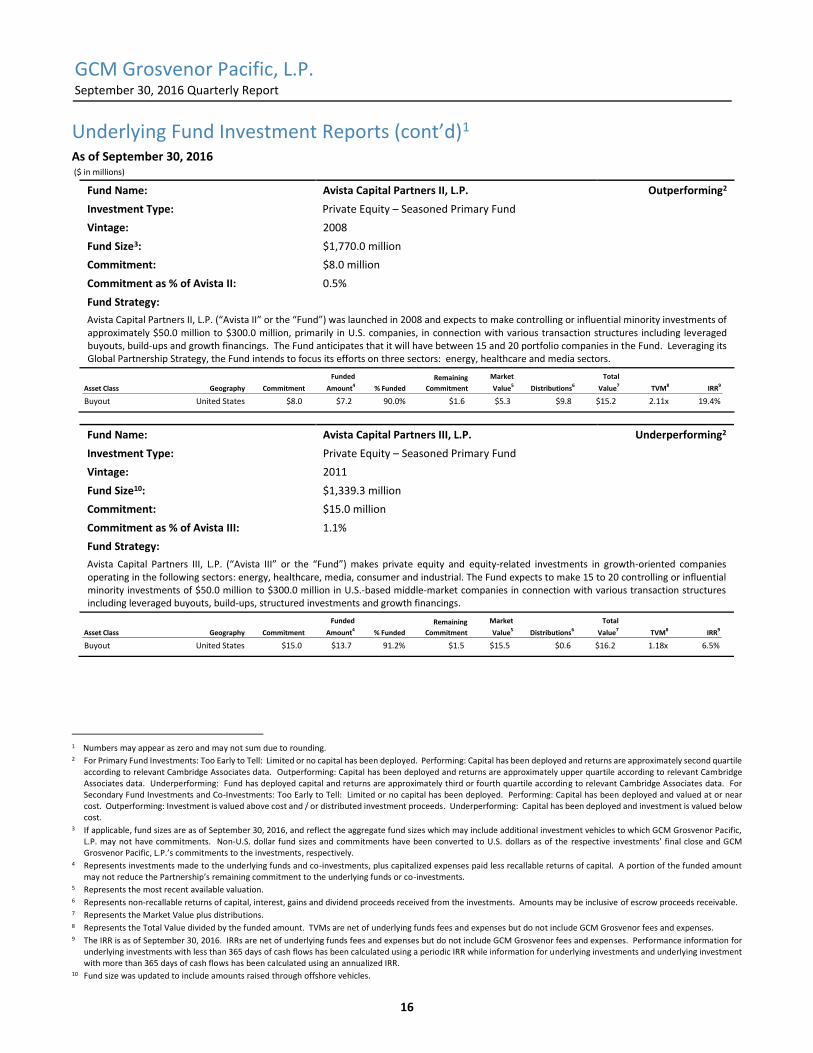
Fund Name: Avista Capital Partners II, L.P. Outperforming2
Investment Type: Private Equity – Seasoned Primary Fund
Vintage: 2008
Fund Size3: $1,770.0 million
Commitment: $8.0 million
Commitment as % of Avista II: 0.5%
Fund Strategy:
Avista Capital Partners II, L.P. (“Avista II” or the “Fund”) was launched in 2008 and expects to make controlling or influential minority investments of approximately $50.0 million to $300.0 million, primarily in U.S. companies, in connection with various transaction structures including leveraged buyouts, build-ups and growth financings. The Fund anticipates that it will have between 15 and 20 portfolio companies in the Fund. Leveraging its Global Partnership Strategy, the Fund intends to focus its efforts on three sectors: energy, healthcare and media sectors.
Fund Name: Avista Capital Partners III, L.P. Underperforming2
Investment Type: Private Equity – Seasoned Primary Fund
Vintage: 2011
Fund Size10: $1,339.3 million
Commitment: $15.0 million
Commitment as % of Avista III: 1.1%
Fund Strategy:
Avista Capital Partners III, L.P. (“Avista III” or the “Fund”) makes private equity and equity-related investments in growth-oriented companies operating in the following sectors: energy, healthcare, media, consumer and industrial. The Fund expects to make 15 to 20 controlling or influential minority investments of $50.0 million to $300.0 million in U.S.-based middle-market companies in connection with various transaction structures including leveraged buyouts, build-ups, structured investments and growth financings.
1 Numbers may appear as zero and may not sum due to rounding. 2 For Primary Fund Investments: Too Early to Tell: Limited or no capital has been deployed. Performing: Capital has been deployed and returns are approximately second quartile
according to relevant Cambridge Associates data. Outperforming: Capital has been deployed and returns are approximately upper quartile according to relevant Cambridge Associates data. Underperforming: Fund has deployed capital and returns are approximately third or fourth quartile according to relevant Cambridge Associates data. For Secondary Fund Investments and Co-Investments: Too Early to Tell: Limited or no capital has been deployed. Performing: Capital has been deployed and valued at or near cost. Outperforming: Investment is valued above cost and / or distributed investment proceeds. Underperforming: Capital has been deployed and investment is valued below cost.
3 If applicable, fund sizes are as of September 30, 2016, and reflect the aggregate fund sizes which may include additional investment vehicles to which GCM Grosvenor Pacific, L.P. may not have commitments. Non-U.S. dollar fund sizes and commitments have been converted to U.S. dollars as of the respective investments’ final close and GCM Grosvenor Pacific, L.P.’s commitments to the investments, respectively.
4 Represents investments made to the underlying funds and co-investments, plus capitalized expenses paid less recallable returns of capital. A portion of the funded amount may not reduce the Partnership’s remaining commitment to the underlying funds or co-investments.
5 Represents the most recent available valuation. 6 Represents non-recallable returns of capital, interest, gains and dividend proceeds received from the investments. Amounts may be inclusive of escrow proceeds receivable. 7 Represents the Market Value plus distributions. 8 Represents the Total Value divided by the funded amount. TVMs are net of underlying funds fees and expenses but do not include GCM Grosvenor fees and expenses. 9 The IRR is as of September 30, 2016. IRRs are net of underlying funds fees and expenses but do not include GCM Grosvenor fees and expenses. Performance information for
underlying investments with less than 365 days of cash flows has been calculated using a periodic IRR while information for underlying investments and underlying investment with more than 365 days of cash flows has been calculated using an annualized IRR.
10 Fund size was updated to include amounts raised through offshore vehicles.
Asset Class Geography Commitment
Funded
Amount4 % Funded
Remaining
Commitment
Market
Value5 Distributions6
Total
Value7 TVM8 IRR9
Buyout United States $8.0 $7.2 90.0% $1.6 $5.3 $9.8 $15.2 2.11x 19.4%
Asset Class Geography Commitment
Funded
Amount4 % Funded
Remaining
Commitment
Market
Value5 Distributions6
Total
Value7 TVM8 IRR9
Buyout United States $15.0 $13.7 91.2% $1.5 $15.5 $0.6 $16.2 1.18x 6.5%
GCM Grosvenor Pacific, L.P. September 30, 2016 Quarterly Report
17
Underlying Fund Investment Reports (cont’d)1 As of September 30, 2016 ($ in millions)
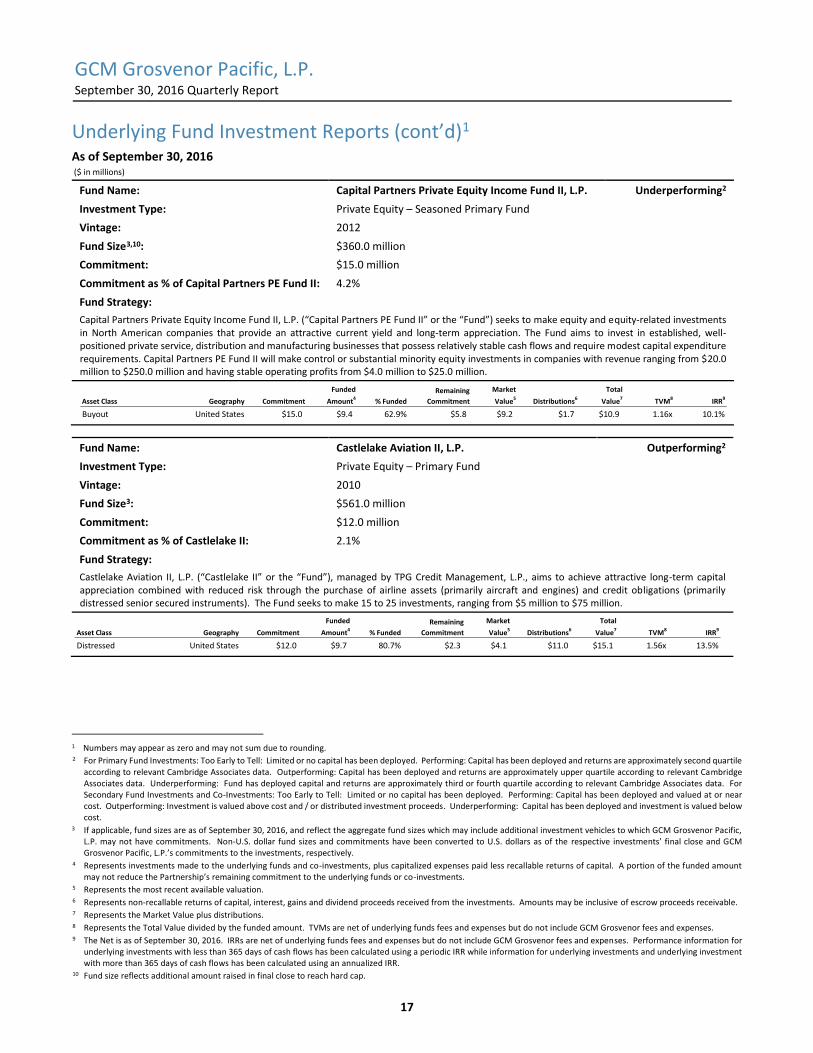
Fund Name: Capital Partners Private Equity Income Fund II, L.P. Underperforming2
Investment Type: Private Equity – Seasoned Primary Fund
Vintage: 2012
Fund Size3,10: $360.0 million
Commitment: $15.0 million
Commitment as % of Capital Partners PE Fund II: 4.2%
Fund Strategy:
Capital Partners Private Equity Income Fund II, L.P. (“Capital Partners PE Fund II” or the “Fund”) seeks to make equity and equity-related investments in North American companies that provide an attractive current yield and long-term appreciation. The Fund aims to invest in established, well-positioned private service, distribution and manufacturing businesses that possess relatively stable cash flows and require modest capital expenditure requirements. Capital Partners PE Fund II will make control or substantial minority equity investments in companies with revenue ranging from $20.0 million to $250.0 million and having stable operating profits from $4.0 million to $25.0 million.
Fund Name: Castlelake Aviation II, L.P. Outperforming2
Investment Type: Private Equity – Primary Fund
Vintage: 2010
Fund Size3: $561.0 million
Commitment: $12.0 million
Commitment as % of Castlelake II: 2.1%
Fund Strategy:
Castlelake Aviation II, L.P. (“Castlelake II” or the “Fund”), managed by TPG Credit Management, L.P., aims to achieve attractive long-term capital appreciation combined with reduced risk through the purchase of airline assets (primarily aircraft and engines) and credit obligations (primarily distressed senior secured instruments). The Fund seeks to make 15 to 25 investments, ranging from $5 million to $75 million.
1 Numbers may appear as zero and may not sum due to rounding. 2 For Primary Fund Investments: Too Early to Tell: Limited or no capital has been deployed. Performing: Capital has been deployed and returns are approximately second quartile
according to relevant Cambridge Associates data. Outperforming: Capital has been deployed and returns are approximately upper quartile according to relevant Cambridge Associates data. Underperforming: Fund has deployed capital and returns are approximately third or fourth quartile according to relevant Cambridge Associates data. For Secondary Fund Investments and Co-Investments: Too Early to Tell: Limited or no capital has been deployed. Performing: Capital has been deployed and valued at or near cost. Outperforming: Investment is valued above cost and / or distributed investment proceeds. Underperforming: Capital has been deployed and investment is valued below cost.
3 If applicable, fund sizes are as of September 30, 2016, and reflect the aggregate fund sizes which may include additional investment vehicles to which GCM Grosvenor Pacific, L.P. may not have commitments. Non-U.S. dollar fund sizes and commitments have been converted to U.S. dollars as of the respective investments’ final close and GCM Grosvenor Pacific, L.P.’s commitments to the investments, respectively.
4 Represents investments made to the underlying funds and co-investments, plus capitalized expenses paid less recallable returns of capital. A portion of the funded amount may not reduce the Partnership’s remaining commitment to the underlying funds or co-investments.
5 Represents the most recent available valuation. 6 Represents non-recallable returns of capital, interest, gains and dividend proceeds received from the investments. Amounts may be inclusive of escrow proceeds receivable. 7 Represents the Market Value plus distributions. 8 Represents the Total Value divided by the funded amount. TVMs are net of underlying funds fees and expenses but do not include GCM Grosvenor fees and expenses. 9 The Net is as of September 30, 2016. IRRs are net of underlying funds fees and expenses but do not include GCM Grosvenor fees and expenses. Performance information for
underlying investments with less than 365 days of cash flows has been calculated using a periodic IRR while information for underlying investments and underlying investment with more than 365 days of cash flows has been calculated using an annualized IRR.
10 Fund size reflects additional amount raised in final close to reach hard cap.
Asset Class Geography Commitment
Funded
Amount4 % Funded
Remaining
Commitment
Market
Value5 Distributions6
Total
Value7 TVM8 IRR9
Buyout United States $15.0 $9.4 62.9% $5.8 $9.2 $1.7 $10.9 1.16x 10.1%
Asset Class Geography Commitment
Funded
Amount4 % Funded
Remaining
Commitment
Market
Value5 Distributions6
Total
Value7 TVM8 IRR9
Distressed United States $12.0 $9.7 80.7% $2.3 $4.1 $11.0 $15.1 1.56x 13.5%
GCM Grosvenor Pacific, L.P. September 30, 2016 Quarterly Report
18
Underlying Fund Investment Reports (cont’d)1 As of September 30, 2016 ($ in millions)
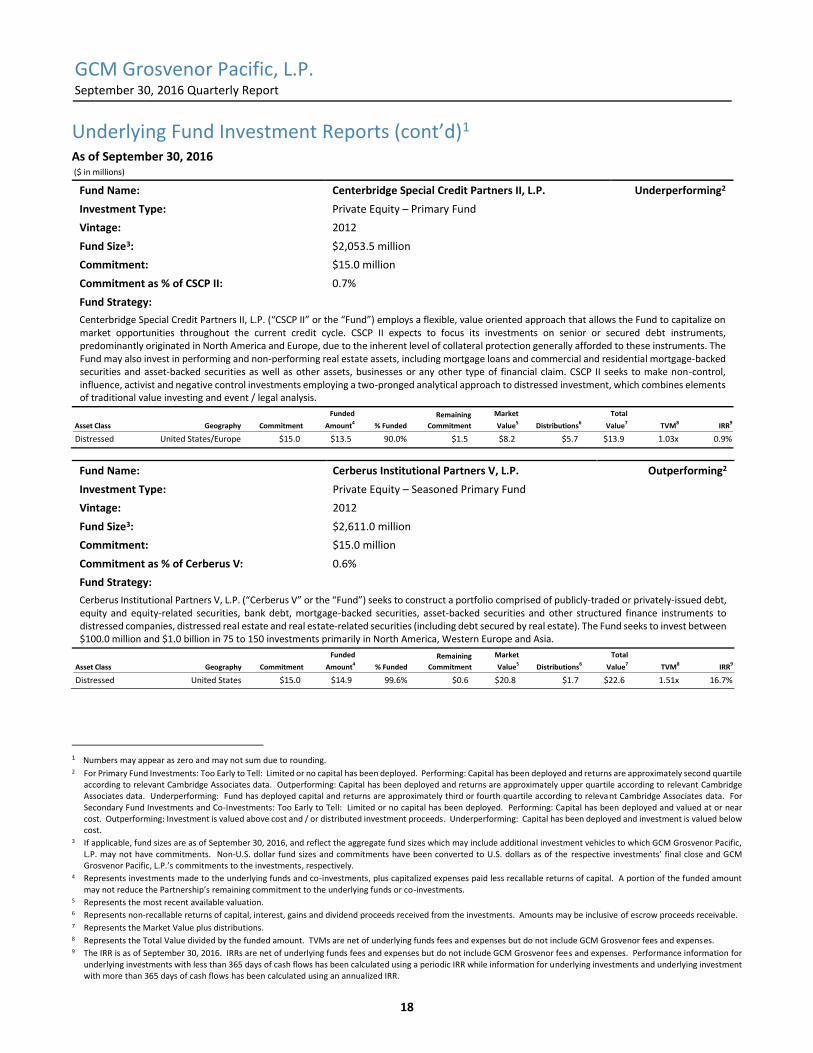
Fund Name: Centerbridge Special Credit Partners II, L.P. Underperforming2
Investment Type: Private Equity – Primary Fund
Vintage: 2012
Fund Size3: $2,053.5 million
Commitment: $15.0 million
Commitment as % of CSCP II: 0.7%
Fund Strategy:
Centerbridge Special Credit Partners II, L.P. (“CSCP II” or the “Fund”) employs a flexible, value oriented approach that allows the Fund to capitalize on market opportunities throughout the current credit cycle. CSCP II expects to focus its investments on senior or secured debt instruments, predominantly originated in North America and Europe, due to the inherent level of collateral protection generally afforded to these instruments. The Fund may also invest in performing and non-performing real estate assets, including mortgage loans and commercial and residential mortgage-backed securities and asset-backed securities as well as other assets, businesses or any other type of financial claim. CSCP II seeks to make non-control, influence, activist and negative control investments employing a two-pronged analytical approach to distressed investment, which combines elements of traditional value investing and event / legal analysis.
Fund Name: Cerberus Institutional Partners V, L.P. Outperforming2
Investment Type: Private Equity – Seasoned Primary Fund
Vintage: 2012
Fund Size3: $2,611.0 million
Commitment: $15.0 million
Commitment as % of Cerberus V: 0.6%
Fund Strategy:
Cerberus Institutional Partners V, L.P. (“Cerberus V” or the “Fund”) seeks to construct a portfolio comprised of publicly-traded or privately-issued debt, equity and equity-related securities, bank debt, mortgage-backed securities, asset-backed securities and other structured finance instruments to distressed companies, distressed real estate and real estate-related securities (including debt secured by real estate). The Fund seeks to invest between $100.0 million and $1.0 billion in 75 to 150 investments primarily in North America, Western Europe and Asia.
1 Numbers may appear as zero and may not sum due to rounding. 2 For Primary Fund Investments: Too Early to Tell: Limited or no capital has been deployed. Performing: Capital has been deployed and returns are approximately second quartile
according to relevant Cambridge Associates data. Outperforming: Capital has been deployed and returns are approximately upper quartile according to relevant Cambridge Associates data. Underperforming: Fund has deployed capital and returns are approximately third or fourth quartile according to relevant Cambridge Associates data. For Secondary Fund Investments and Co-Investments: Too Early to Tell: Limited or no capital has been deployed. Performing: Capital has been deployed and valued at or near cost. Outperforming: Investment is valued above cost and / or distributed investment proceeds. Underperforming: Capital has been deployed and investment is valued below cost.
3 If applicable, fund sizes are as of September 30, 2016, and reflect the aggregate fund sizes which may include additional investment vehicles to which GCM Grosvenor Pacific, L.P. may not have commitments. Non-U.S. dollar fund sizes and commitments have been converted to U.S. dollars as of the respective investments’ final close and GCM Grosvenor Pacific, L.P.’s commitments to the investments, respectively.
4 Represents investments made to the underlying funds and co-investments, plus capitalized expenses paid less recallable returns of capital. A portion of the funded amount may not reduce the Partnership’s remaining commitment to the underlying funds or co-investments.
5 Represents the most recent available valuation. 6 Represents non-recallable returns of capital, interest, gains and dividend proceeds received from the investments. Amounts may be inclusive of escrow proceeds receivable. 7 Represents the Market Value plus distributions. 8 Represents the Total Value divided by the funded amount. TVMs are net of underlying funds fees and expenses but do not include GCM Grosvenor fees and expenses. 9 The IRR is as of September 30, 2016. IRRs are net of underlying funds fees and expenses but do not include GCM Grosvenor fees and expenses. Performance information for
underlying investments with less than 365 days of cash flows has been calculated using a periodic IRR while information for underlying investments and underlying investment with more than 365 days of cash flows has been calculated using an annualized IRR.
Asset Class Geography Commitment
Funded
Amount4 % Funded
Remaining
Commitment
Market
Value5 Distributions6
Total
Value7 TVM8 IRR9
Distressed United States/Europe $15.0 $13.5 90.0% $1.5 $8.2 $5.7 $13.9 1.03x 0.9%
Asset Class Geography Commitment
Funded
Amount4 % Funded
Remaining
Commitment
Market
Value5 Distributions6
Total
Value7 TVM8 IRR9
Distressed United States $15.0 $14.9 99.6% $0.6 $20.8 $1.7 $22.6 1.51x 16.7%
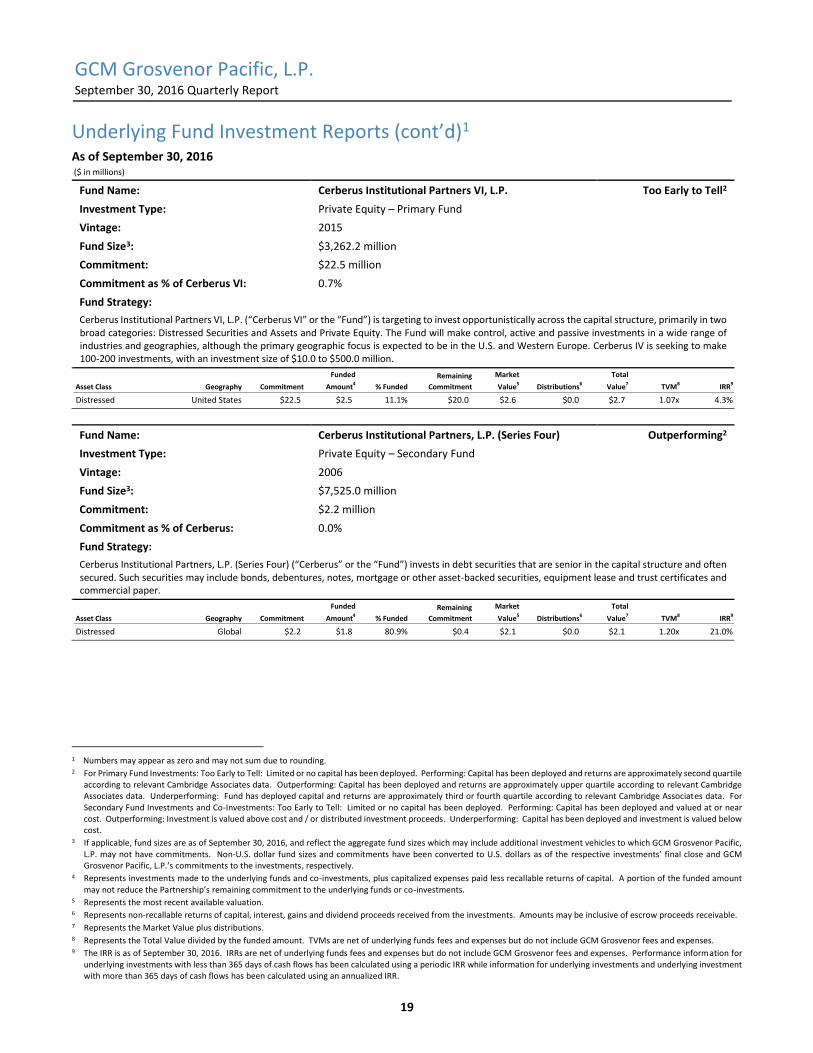
GCM Grosvenor Pacific, L.P. September 30, 2016 Quarterly Report
19
Underlying Fund Investment Reports (cont’d)1 As of September 30, 2016 ($ in millions)
Fund Name: Cerberus Institutional Partners VI, L.P. Too Early to Tell2
Investment Type: Private Equity – Primary Fund
Vintage: 2015
Fund Size3: $3,262.2 million
Commitment: $22.5 million
Commitment as % of Cerberus VI: 0.7%
Fund Strategy:
Cerberus Institutional Partners VI, L.P. (“Cerberus VI” or the “Fund”) is targeting to invest opportunistically across the capital structure, primarily in two broad categories: Distressed Securities and Assets and Private Equity. The Fund will make control, active and passive investments in a wide range of industries and geographies, although the primary geographic focus is expected to be in the U.S. and Western Europe. Cerberus IV is seeking to make 100-200 investments, with an investment size of $10.0 to $500.0 million.
Fund Name: Cerberus Institutional Partners, L.P. (Series Four) Outperforming2
Investment Type: Private Equity – Secondary Fund
Vintage: 2006
Fund Size3: $7,525.0 million
Commitment: $2.2 million
Commitment as % of Cerberus: 0.0%
Fund Strategy:
Cerberus Institutional Partners, L.P. (Series Four) (“Cerberus” or the “Fund”) invests in debt securities that are senior in the capital structure and often secured. Such securities may include bonds, debentures, notes, mortgage or other asset-backed securities, equipment lease and trust certificates and commercial paper.
1 Numbers may appear as zero and may not sum due to rounding. 2 For Primary Fund Investments: Too Early to Tell: Limited or no capital has been deployed. Performing: Capital has been deployed and returns are approximately second quartile
according to relevant Cambridge Associates data. Outperforming: Capital has been deployed and returns are approximately upper quartile according to relevant Cambridge Associates data. Underperforming: Fund has deployed capital and returns are approximately third or fourth quartile according to relevant Cambridge Associates data. For Secondary Fund Investments and Co-Investments: Too Early to Tell: Limited or no capital has been deployed. Performing: Capital has been deployed and valued at or near cost. Outperforming: Investment is valued above cost and / or distributed investment proceeds. Underperforming: Capital has been deployed and investment is valued below cost.
3 If applicable, fund sizes are as of September 30, 2016, and reflect the aggregate fund sizes which may include additional investment vehicles to which GCM Grosvenor Pacific, L.P. may not have commitments. Non-U.S. dollar fund sizes and commitments have been converted to U.S. dollars as of the respective investments’ final close and GCM Grosvenor Pacific, L.P.’s commitments to the investments, respectively.
4 Represents investments made to the underlying funds and co-investments, plus capitalized expenses paid less recallable returns of capital. A portion of the funded amount may not reduce the Partnership’s remaining commitment to the underlying funds or co-investments.
5 Represents the most recent available valuation. 6 Represents non-recallable returns of capital, interest, gains and dividend proceeds received from the investments. Amounts may be inclusive of escrow proceeds receivable. 7 Represents the Market Value plus distributions. 8 Represents the Total Value divided by the funded amount. TVMs are net of underlying funds fees and expenses but do not include GCM Grosvenor fees and expenses. 9 The IRR is as of September 30, 2016. IRRs are net of underlying funds fees and expenses but do not include GCM Grosvenor fees and expenses. Performance information for
underlying investments with less than 365 days of cash flows has been calculated using a periodic IRR while information for underlying investments and underlying investment with more than 365 days of cash flows has been calculated using an annualized IRR.
Asset Class Geography Commitment
Funded
Amount4 % Funded
Remaining
Commitment
Market
Value5 Distributions6
Total
Value7 TVM8 IRR9
Distressed United States $22.5 $2.5 11.1% $20.0 $2.6 $0.0 $2.7 1.07x 4.3%
Asset Class Geography Commitment
Funded
Amount4 % Funded
Remaining
Commitment
Market
Value5 Distributions6
Total
Value7 TVM8 IRR9
Distressed Global $2.2 $1.8 80.9% $0.4 $2.1 $0.0 $2.1 1.20x 21.0%
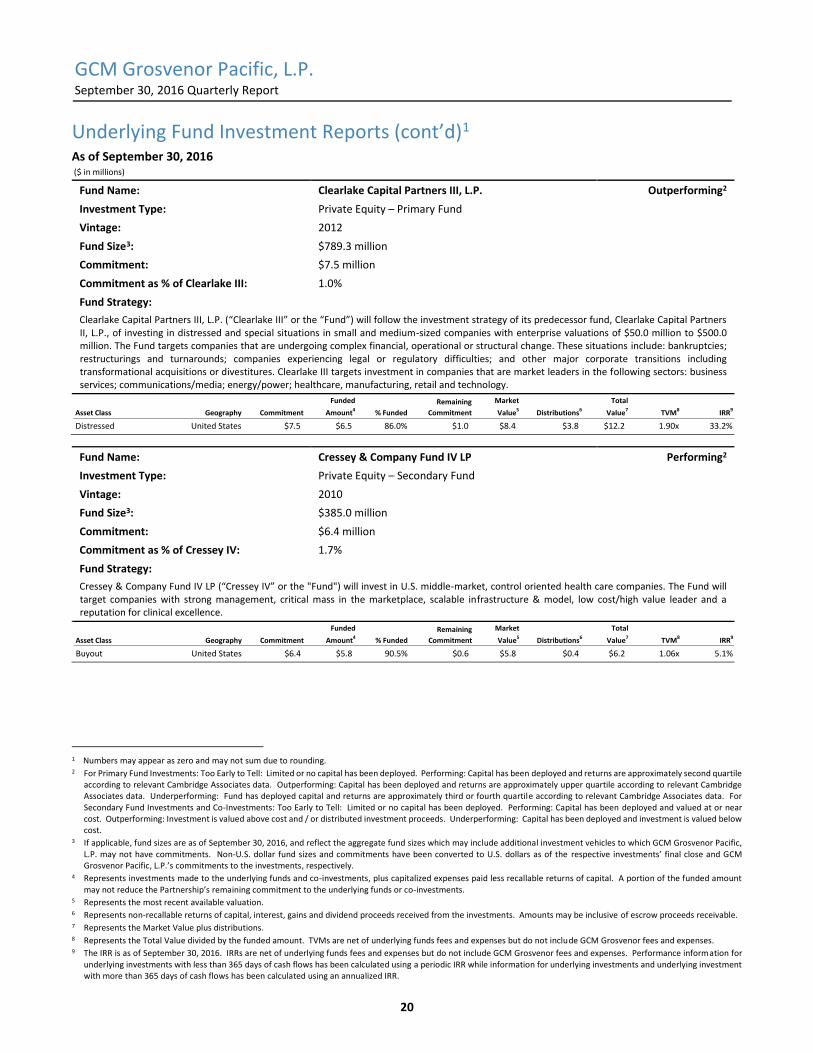
GCM Grosvenor Pacific, L.P. September 30, 2016 Quarterly Report
20
Underlying Fund Investment Reports (cont’d)1 As of September 30, 2016 ($ in millions)
Fund Name: Clearlake Capital Partners III, L.P. Outperforming2
Investment Type: Private Equity – Primary Fund
Vintage: 2012
Fund Size3: $789.3 million
Commitment: $7.5 million
Commitment as % of Clearlake III: 1.0%
Fund Strategy:
Clearlake Capital Partners III, L.P. (“Clearlake III” or the “Fund”) will follow the investment strategy of its predecessor fund, Clearlake Capital Partners II, L.P., of investing in distressed and special situations in small and medium-sized companies with enterprise valuations of $50.0 million to $500.0 million. The Fund targets companies that are undergoing complex financial, operational or structural change. These situations include: bankruptcies; restructurings and turnarounds; companies experiencing legal or regulatory difficulties; and other major corporate transitions including transformational acquisitions or divestitures. Clearlake III targets investment in companies that are market leaders in the following sectors: business services; communications/media; energy/power; healthcare, manufacturing, retail and technology.
Fund Name: Cressey & Company Fund IV LP Performing2
Investment Type: Private Equity – Secondary Fund
Vintage: 2010
Fund Size3: $385.0 million
Commitment: $6.4 million
Commitment as % of Cressey IV: 1.7%
Fund Strategy:
Cressey & Company Fund IV LP (“Cressey IV” or the "Fund") will invest in U.S. middle-market, control oriented health care companies. The Fund will target companies with strong management, critical mass in the marketplace, scalable infrastructure & model, low cost/high value leader and a reputation for clinical excellence.
1 Numbers may appear as zero and may not sum due to rounding. 2 For Primary Fund Investments: Too Early to Tell: Limited or no capital has been deployed. Performing: Capital has been deployed and returns are approximately second quartile
according to relevant Cambridge Associates data. Outperforming: Capital has been deployed and returns are approximately upper quartile according to relevant Cambridge Associates data. Underperforming: Fund has deployed capital and returns are approximately third or fourth quartile according to relevant Cambridge Associates data. For Secondary Fund Investments and Co-Investments: Too Early to Tell: Limited or no capital has been deployed. Performing: Capital has been deployed and valued at or near cost. Outperforming: Investment is valued above cost and / or distributed investment proceeds. Underperforming: Capital has been deployed and investment is valued below cost.
3 If applicable, fund sizes are as of September 30, 2016, and reflect the aggregate fund sizes which may include additional investment vehicles to which GCM Grosvenor Pacific, L.P. may not have commitments. Non-U.S. dollar fund sizes and commitments have been converted to U.S. dollars as of the respective investments’ final close and GCM Grosvenor Pacific, L.P.’s commitments to the investments, respectively.
4 Represents investments made to the underlying funds and co-investments, plus capitalized expenses paid less recallable returns of capital. A portion of the funded amount may not reduce the Partnership’s remaining commitment to the underlying funds or co-investments.
5 Represents the most recent available valuation. 6 Represents non-recallable returns of capital, interest, gains and dividend proceeds received from the investments. Amounts may be inclusive of escrow proceeds receivable. 7 Represents the Market Value plus distributions. 8 Represents the Total Value divided by the funded amount. TVMs are net of underlying funds fees and expenses but do not include GCM Grosvenor fees and expenses. 9 The IRR is as of September 30, 2016. IRRs are net of underlying funds fees and expenses but do not include GCM Grosvenor fees and expenses. Performance information for
underlying investments with less than 365 days of cash flows has been calculated using a periodic IRR while information for underlying investments and underlying investment with more than 365 days of cash flows has been calculated using an annualized IRR.
Asset Class Geography Commitment
Funded
Amount4 % Funded
Remaining
Commitment
Market
Value5 Distributions6
Total
Value7 TVM8 IRR9
Distressed United States $7.5 $6.5 86.0% $1.0 $8.4 $3.8 $12.2 1.90x 33.2%
Asset Class Geography Commitment
Funded
Amount4 % Funded
Remaining
Commitment
Market
Value5 Distributions6
Total
Value7 TVM8 IRR9
Buyout United States $6.4 $5.8 90.5% $0.6 $5.8 $0.4 $6.2 1.06x 5.1%
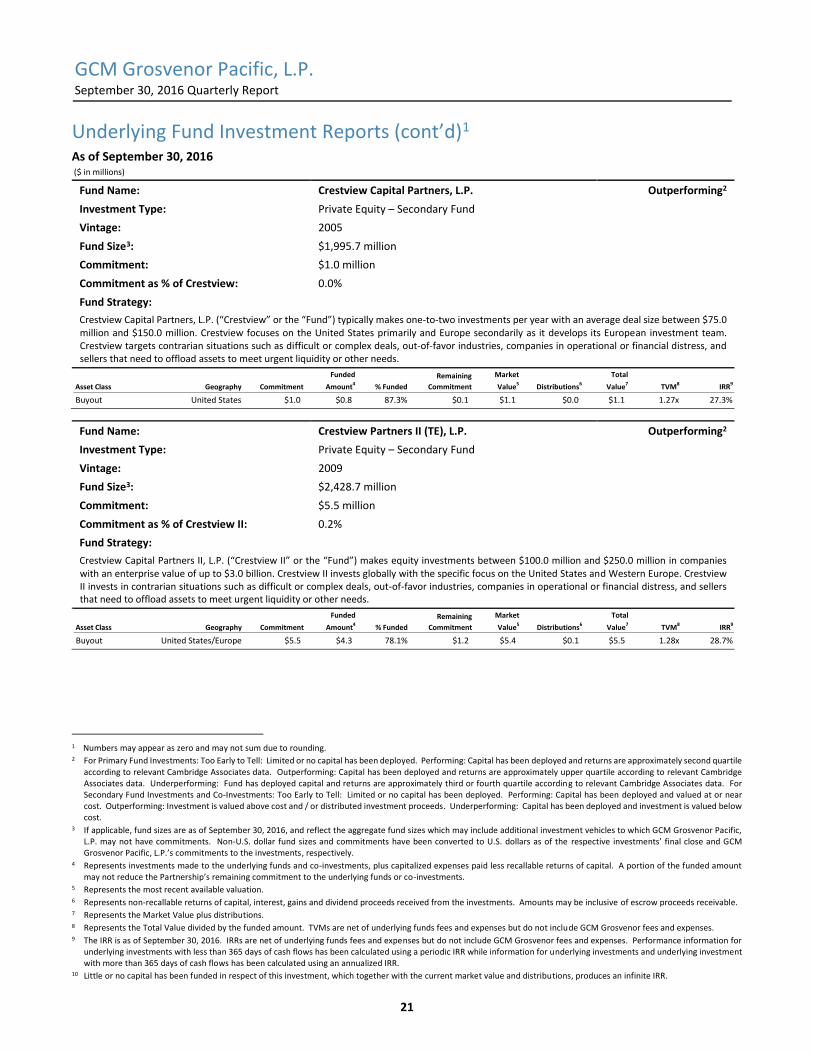
GCM Grosvenor Pacific, L.P. September 30, 2016 Quarterly Report
21
Underlying Fund Investment Reports (cont’d)1 As of September 30, 2016 ($ in millions)
Fund Name: Crestview Capital Partners, L.P. Outperforming2
Investment Type: Private Equity – Secondary Fund
Vintage: 2005
Fund Size3: $1,995.7 million
Commitment: $1.0 million
Commitment as % of Crestview: 0.0%
Fund Strategy:
Crestview Capital Partners, L.P. (“Crestview” or the “Fund”) typically makes one-to-two investments per year with an average deal size between $75.0 million and $150.0 million. Crestview focuses on the United States primarily and Europe secondarily as it develops its European investment team. Crestview targets contrarian situations such as difficult or complex deals, out-of-favor industries, companies in operational or financial distress, and sellers that need to offload assets to meet urgent liquidity or other needs.
Fund Name: Crestview Partners II (TE), L.P. Outperforming2
Investment Type: Private Equity – Secondary Fund
Vintage: 2009
Fund Size3: $2,428.7 million
Commitment: $5.5 million
Commitment as % of Crestview II: 0.2%
Fund Strategy:
Crestview Capital Partners II, L.P. (“Crestview II” or the “Fund”) makes equity investments between $100.0 million and $250.0 million in companies with an enterprise value of up to $3.0 billion. Crestview II invests globally with the specific focus on the United States and Western Europe. Crestview II invests in contrarian situations such as difficult or complex deals, out-of-favor industries, companies in operational or financial distress, and sellers that need to offload assets to meet urgent liquidity or other needs.
1 Numbers may appear as zero and may not sum due to rounding. 2 For Primary Fund Investments: Too Early to Tell: Limited or no capital has been deployed. Performing: Capital has been deployed and returns are approximately second quartile
according to relevant Cambridge Associates data. Outperforming: Capital has been deployed and returns are approximately upper quartile according to relevant Cambridge Associates data. Underperforming: Fund has deployed capital and returns are approximately third or fourth quartile according to relevant Cambridge Associates data. For Secondary Fund Investments and Co-Investments: Too Early to Tell: Limited or no capital has been deployed. Performing: Capital has been deployed and valued at or near cost. Outperforming: Investment is valued above cost and / or distributed investment proceeds. Underperforming: Capital has been deployed and investment is valued below cost.
3 If applicable, fund sizes are as of September 30, 2016, and reflect the aggregate fund sizes which may include additional investment vehicles to which GCM Grosvenor Pacific, L.P. may not have commitments. Non-U.S. dollar fund sizes and commitments have been converted to U.S. dollars as of the respective investments’ final close and GCM Grosvenor Pacific, L.P.’s commitments to the investments, respectively.
4 Represents investments made to the underlying funds and co-investments, plus capitalized expenses paid less recallable returns of capital. A portion of the funded amount may not reduce the Partnership’s remaining commitment to the underlying funds or co-investments.
5 Represents the most recent available valuation. 6 Represents non-recallable returns of capital, interest, gains and dividend proceeds received from the investments. Amounts may be inclusive of escrow proceeds receivable. 7 Represents the Market Value plus distributions. 8 Represents the Total Value divided by the funded amount. TVMs are net of underlying funds fees and expenses but do not include GCM Grosvenor fees and expenses. 9 The IRR is as of September 30, 2016. IRRs are net of underlying funds fees and expenses but do not include GCM Grosvenor fees and expenses. Performance information for
underlying investments with less than 365 days of cash flows has been calculated using a periodic IRR while information for underlying investments and underlying investment with more than 365 days of cash flows has been calculated using an annualized IRR.
10 Little or no capital has been funded in respect of this investment, which together with the current market value and distributions, produces an infinite IRR.
Asset Class Geography Commitment
Funded
Amount4 % Funded
Remaining
Commitment
Market
Value5 Distributions6
Total
Value7 TVM8 IRR9
Buyout United States $1.0 $0.8 87.3% $0.1 $1.1 $0.0 $1.1 1.27x 27.3%
Asset Class Geography Commitment
Funded
Amount4 % Funded
Remaining
Commitment
Market
Value5 Distributions6
Total
Value7 TVM8 IRR9
Buyout United States/Europe $5.5 $4.3 78.1% $1.2 $5.4 $0.1 $5.5 1.28x 28.7%
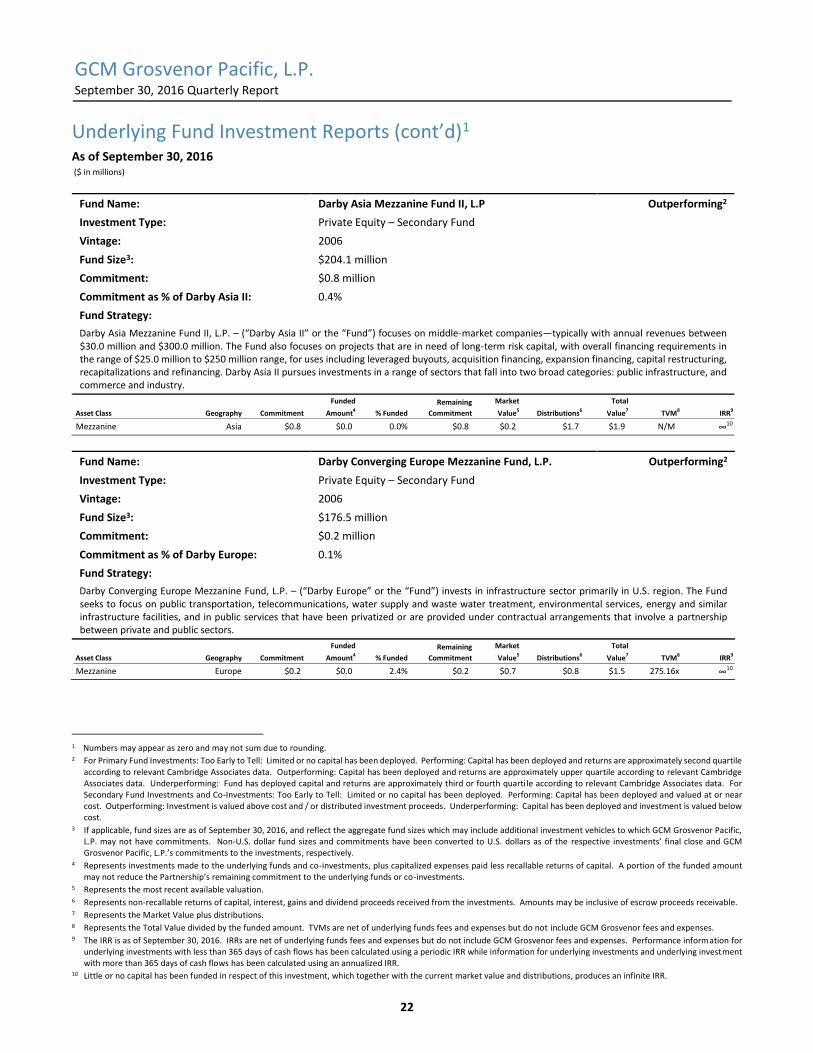
GCM Grosvenor Pacific, L.P. September 30, 2016 Quarterly Report
22
Underlying Fund Investment Reports (cont’d)1 As of September 30, 2016 ($ in millions)
Fund Name: Darby Asia Mezzanine Fund II, L.P Outperforming2
Investment Type: Private Equity – Secondary Fund
Vintage: 2006
Fund Size3: $204.1 million
Commitment: $0.8 million
Commitment as % of Darby Asia II: 0.4%
Fund Strategy:
Darby Asia Mezzanine Fund II, L.P. – (“Darby Asia II” or the “Fund”) focuses on middle-market companies—typically with annual revenues between $30.0 million and $300.0 million. The Fund also focuses on projects that are in need of long-term risk capital, with overall financing requirements in the range of $25.0 million to $250 million range, for uses including leveraged buyouts, acquisition financing, expansion financing, capital restructuring, recapitalizations and refinancing. Darby Asia II pursues investments in a range of sectors that fall into two broad categories: public infrastructure, and commerce and industry.
Fund Name: Darby Converging Europe Mezzanine Fund, L.P. Outperforming2
Investment Type: Private Equity – Secondary Fund
Vintage: 2006
Fund Size3: $176.5 million
Commitment: $0.2 million
Commitment as % of Darby Europe: 0.1%
Fund Strategy:
Darby Converging Europe Mezzanine Fund, L.P. – (“Darby Europe” or the “Fund”) invests in infrastructure sector primarily in U.S. region. The Fund seeks to focus on public transportation, telecommunications, water supply and waste water treatment, environmental services, energy and similar infrastructure facilities, and in public services that have been privatized or are provided under contractual arrangements that involve a partnership between private and public sectors.
1 Numbers may appear as zero and may not sum due to rounding. 2 For Primary Fund Investments: Too Early to Tell: Limited or no capital has been deployed. Performing: Capital has been deployed and returns are approximately second quartile
according to relevant Cambridge Associates data. Outperforming: Capital has been deployed and returns are approximately upper quartile according to relevant Cambridge Associates data. Underperforming: Fund has deployed capital and returns are approximately third or fourth quarti le according to relevant Cambridge Associates data. For Secondary Fund Investments and Co-Investments: Too Early to Tell: Limited or no capital has been deployed. Performing: Capital has been deployed and valued at or near cost. Outperforming: Investment is valued above cost and / or distributed investment proceeds. Underperforming: Capital has been deployed and investment is valued below cost.
3 If applicable, fund sizes are as of September 30, 2016, and reflect the aggregate fund sizes which may include additional investment vehicles to which GCM Grosvenor Pacific, L.P. may not have commitments. Non-U.S. dollar fund sizes and commitments have been converted to U.S. dollars as of the respective investments’ final close and GCM Grosvenor Pacific, L.P.’s commitments to the investments, respectively.
4 Represents investments made to the underlying funds and co-investments, plus capitalized expenses paid less recallable returns of capital. A portion of the funded amount may not reduce the Partnership’s remaining commitment to the underlying funds or co-investments.
5 Represents the most recent available valuation. 6 Represents non-recallable returns of capital, interest, gains and dividend proceeds received from the investments. Amounts may be inclusive of escrow proceeds receivable. 7 Represents the Market Value plus distributions. 8 Represents the Total Value divided by the funded amount. TVMs are net of underlying funds fees and expenses but do not include GCM Grosvenor fees and expenses. 9 The IRR is as of September 30, 2016. IRRs are net of underlying funds fees and expenses but do not include GCM Grosvenor fees and expenses. Performance information for
underlying investments with less than 365 days of cash flows has been calculated using a periodic IRR while information for underlying investments and underlying investment with more than 365 days of cash flows has been calculated using an annualized IRR.
10 Little or no capital has been funded in respect of this investment, which together with the current market value and distributions, produces an infinite IRR.
Asset Class Geography Commitment
Funded
Amount4 % Funded
Remaining
Commitment
Market
Value5 Distributions6
Total
Value7 TVM8 IRR9
Mezzanine Asia $0.8 $0.0 0.0% $0.8 $0.2 $1.7 $1.9 N/M ∞10
Asset Class Geography Commitment
Funded
Amount4 % Funded
Remaining
Commitment
Market
Value5 Distributions6
Total
Value7 TVM8 IRR9
Mezzanine Europe $0.2 $0.0 2.4% $0.2 $0.7 $0.8 $1.5 275.16x ∞10
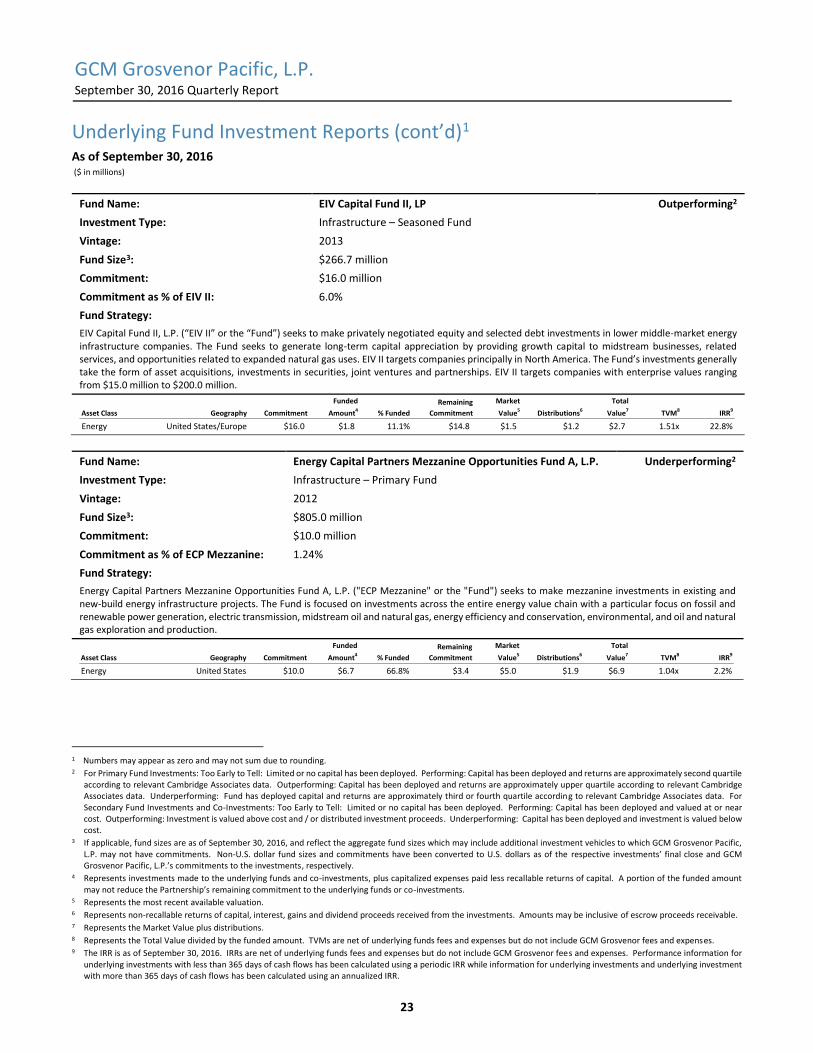
GCM Grosvenor Pacific, L.P. September 30, 2016 Quarterly Report
23
Underlying Fund Investment Reports (cont’d)1 As of September 30, 2016 ($ in millions)
Fund Name: EIV Capital Fund II, LP Outperforming2
Investment Type: Infrastructure – Seasoned Fund
Vintage: 2013
Fund Size3: $266.7 million
Commitment: $16.0 million
Commitment as % of EIV II: 6.0%
Fund Strategy:
EIV Capital Fund II, L.P. (“EIV II” or the “Fund”) seeks to make privately negotiated equity and selected debt investments in lower middle-market energy infrastructure companies. The Fund seeks to generate long-term capital appreciation by providing growth capital to midstream businesses, related services, and opportunities related to expanded natural gas uses. EIV II targets companies principally in North America. The Fund’s investments generally take the form of asset acquisitions, investments in securities, joint ventures and partnerships. EIV II targets companies with enterprise values ranging from $15.0 million to $200.0 million.
Fund Name: Energy Capital Partners Mezzanine Opportunities Fund A, L.P. Underperforming2
Investment Type: Infrastructure – Primary Fund
Vintage: 2012
Fund Size3: $805.0 million
Commitment: $10.0 million
Commitment as % of ECP Mezzanine: 1.24%
Fund Strategy:
Energy Capital Partners Mezzanine Opportunities Fund A, L.P. ("ECP Mezzanine" or the "Fund") seeks to make mezzanine investments in existing and new-build energy infrastructure projects. The Fund is focused on investments across the entire energy value chain with a particular focus on fossil and renewable power generation, electric transmission, midstream oil and natural gas, energy efficiency and conservation, environmental, and oil and natural gas exploration and production.
1 Numbers may appear as zero and may not sum due to rounding. 2 For Primary Fund Investments: Too Early to Tell: Limited or no capital has been deployed. Performing: Capital has been deployed and returns are approximately second quartile
according to relevant Cambridge Associates data. Outperforming: Capital has been deployed and returns are approximately upper quartile according to relevant Cambridge Associates data. Underperforming: Fund has deployed capital and returns are approximately third or fourth quartile according to relevant Cambridge Associates data. For Secondary Fund Investments and Co-Investments: Too Early to Tell: Limited or no capital has been deployed. Performing: Capital has been deployed and valued at or near cost. Outperforming: Investment is valued above cost and / or distributed investment proceeds. Underperforming: Capital has been deployed and investment is valued below cost.
3 If applicable, fund sizes are as of September 30, 2016, and reflect the aggregate fund sizes which may include additional investment vehicles to which GCM Grosvenor Pacific, L.P. may not have commitments. Non-U.S. dollar fund sizes and commitments have been converted to U.S. dollars as of the respective investments’ final close and GCM Grosvenor Pacific, L.P.’s commitments to the investments, respectively.
4 Represents investments made to the underlying funds and co-investments, plus capitalized expenses paid less recallable returns of capital. A portion of the funded amount may not reduce the Partnership’s remaining commitment to the underlying funds or co-investments.
5 Represents the most recent available valuation. 6 Represents non-recallable returns of capital, interest, gains and dividend proceeds received from the investments. Amounts may be inclusive of escrow proceeds receivable. 7 Represents the Market Value plus distributions. 8 Represents the Total Value divided by the funded amount. TVMs are net of underlying funds fees and expenses but do not include GCM Grosvenor fees and expenses. 9 The IRR is as of September 30, 2016. IRRs are net of underlying funds fees and expenses but do not include GCM Grosvenor fees and expenses. Performance information for
underlying investments with less than 365 days of cash flows has been calculated using a periodic IRR while information for underlying investments and underlying investment with more than 365 days of cash flows has been calculated using an annualized IRR.
Asset Class Geography Commitment
Funded
Amount4 % Funded
Remaining
Commitment
Market
Value5 Distributions6
Total
Value7 TVM8 IRR9
Energy United States/Europe $16.0 $1.8 11.1% $14.8 $1.5 $1.2 $2.7 1.51x 22.8%
Asset Class Geography Commitment
Funded
Amount4 % Funded
Remaining
Commitment
Market
Value5 Distributions6
Total
Value7 TVM8 IRR9
Energy United States $10.0 $6.7 66.8% $3.4 $5.0 $1.9 $6.9 1.04x 2.2%
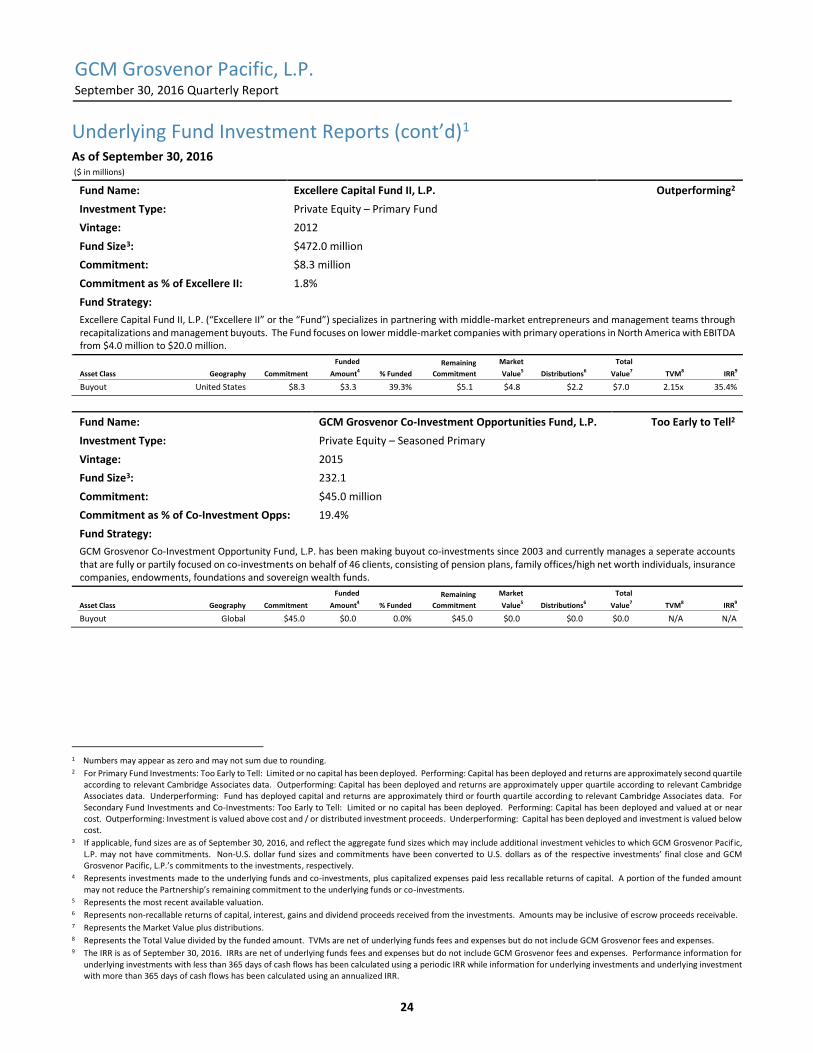
GCM Grosvenor Pacific, L.P. September 30, 2016 Quarterly Report
24
Underlying Fund Investment Reports (cont’d)1 As of September 30, 2016 ($ in millions)
Fund Name: Excellere Capital Fund II, L.P. Outperforming2
Investment Type: Private Equity – Primary Fund
Vintage: 2012
Fund Size3: $472.0 million
Commitment: $8.3 million
Commitment as % of Excellere II: 1.8%
Fund Strategy:
Excellere Capital Fund II, L.P. (“Excellere II” or the “Fund”) specializes in partnering with middle-market entrepreneurs and management teams through recapitalizations and management buyouts. The Fund focuses on lower middle-market companies with primary operations in North America with EBITDA from $4.0 million to $20.0 million.
Fund Name: GCM Grosvenor Co-Investment Opportunities Fund, L.P. Too Early to Tell2
Investment Type: Private Equity – Seasoned Primary
Vintage: 2015
Fund Size3: 232.1
Commitment: $45.0 million
Commitment as % of Co-Investment Opps: 19.4%
Fund Strategy:
GCM Grosvenor Co-Investment Opportunity Fund, L.P. has been making buyout co-investments since 2003 and currently manages a seperate accounts that are fully or partily focused on co-investments on behalf of 46 clients, consisting of pension plans, family offices/high net worth individuals, insurance companies, endowments, foundations and sovereign wealth funds.
1 Numbers may appear as zero and may not sum due to rounding. 2 For Primary Fund Investments: Too Early to Tell: Limited or no capital has been deployed. Performing: Capital has been deployed and returns are approximately second quartile
according to relevant Cambridge Associates data. Outperforming: Capital has been deployed and returns are approximately upper quartile according to relevant Cambridge Associates data. Underperforming: Fund has deployed capital and returns are approximately third or fourth quartile according to relevant Cambridge Associates data. For Secondary Fund Investments and Co-Investments: Too Early to Tell: Limited or no capital has been deployed. Performing: Capital has been deployed and valued at or near cost. Outperforming: Investment is valued above cost and / or distributed investment proceeds. Underperforming: Capital has been deployed and investment is valued below cost.
3 If applicable, fund sizes are as of September 30, 2016, and reflect the aggregate fund sizes which may include additional investment vehicles to which GCM Grosvenor Pacif ic, L.P. may not have commitments. Non-U.S. dollar fund sizes and commitments have been converted to U.S. dollars as of the respective investments’ final close and GCM Grosvenor Pacific, L.P.’s commitments to the investments, respectively.
4 Represents investments made to the underlying funds and co-investments, plus capitalized expenses paid less recallable returns of capital. A portion of the funded amount may not reduce the Partnership’s remaining commitment to the underlying funds or co-investments.
5 Represents the most recent available valuation. 6 Represents non-recallable returns of capital, interest, gains and dividend proceeds received from the investments. Amounts may be inclusive of escrow proceeds receivable. 7 Represents the Market Value plus distributions. 8 Represents the Total Value divided by the funded amount. TVMs are net of underlying funds fees and expenses but do not include GCM Grosvenor fees and expenses. 9 The IRR is as of September 30, 2016. IRRs are net of underlying funds fees and expenses but do not include GCM Grosvenor fees and expenses. Performance information for
underlying investments with less than 365 days of cash flows has been calculated using a periodic IRR while information for underlying investments and underlying investment with more than 365 days of cash flows has been calculated using an annualized IRR.
Asset Class Geography Commitment
Funded
Amount4 % Funded
Remaining
Commitment
Market
Value5 Distributions6
Total
Value7 TVM8 IRR9
Buyout United States $8.3 $3.3 39.3% $5.1 $4.8 $2.2 $7.0 2.15x 35.4%
Asset Class Geography Commitment
Funded
Amount4 % Funded
Remaining
Commitment
Market
Value5 Distributions6
Total
Value7 TVM8 IRR9
Buyout Global $45.0 $0.0 0.0% $45.0 $0.0 $0.0 $0.0 N/A N/A
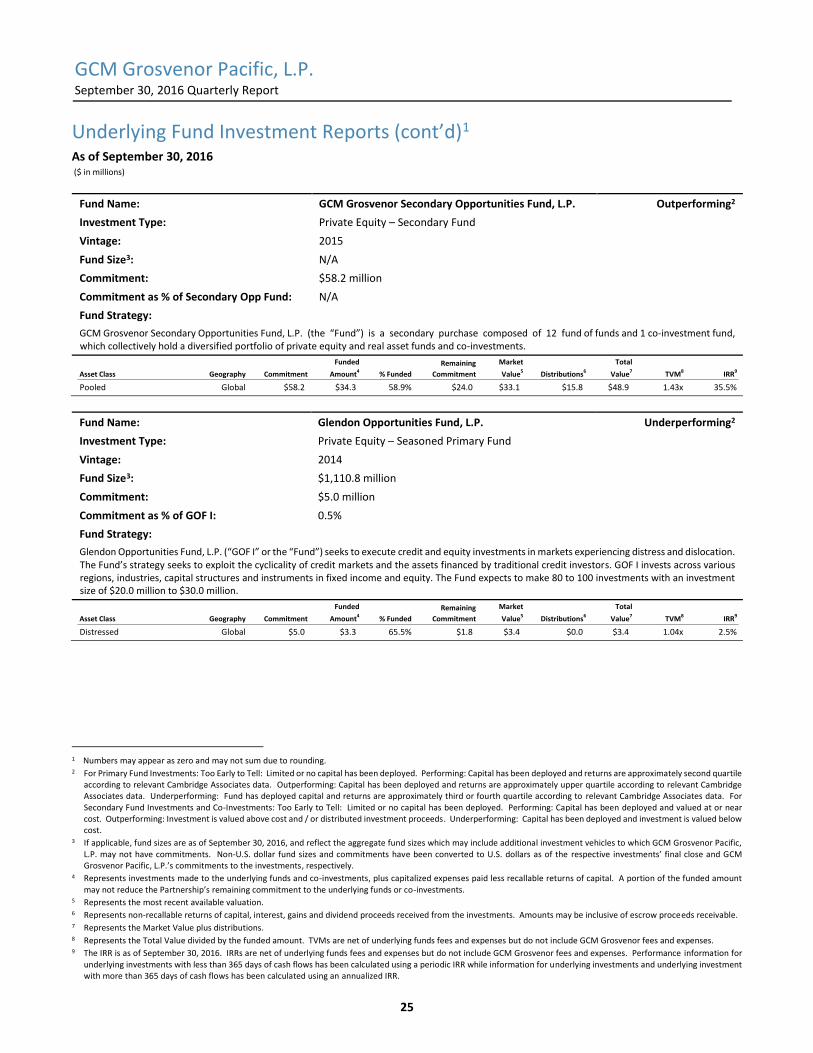
GCM Grosvenor Pacific, L.P. September 30, 2016 Quarterly Report
25
Underlying Fund Investment Reports (cont’d)1 As of September 30, 2016 ($ in millions)
Fund Name: GCM Grosvenor Secondary Opportunities Fund, L.P. Outperforming2
Investment Type: Private Equity – Secondary Fund
Vintage: 2015
Fund Size3: N/A
Commitment: $58.2 million
Commitment as % of Secondary Opp Fund: N/A
Fund Strategy:
GCM Grosvenor Secondary Opportunities Fund, L.P. (the “Fund”) is a secondary purchase composed of 12 fund of funds and 1 co-investment fund, which collectively hold a diversified portfolio of private equity and real asset funds and co-investments.
Fund Name: Glendon Opportunities Fund, L.P. Underperforming2
Investment Type: Private Equity – Seasoned Primary Fund
Vintage: 2014
Fund Size3: $1,110.8 million
Commitment: $5.0 million
Commitment as % of GOF I: 0.5%
Fund Strategy:
Glendon Opportunities Fund, L.P. (“GOF I” or the “Fund”) seeks to execute credit and equity investments in markets experiencing distress and dislocation. The Fund’s strategy seeks to exploit the cyclicality of credit markets and the assets financed by traditional credit investors. GOF I invests across various regions, industries, capital structures and instruments in fixed income and equity. The Fund expects to make 80 to 100 investments with an investment size of $20.0 million to $30.0 million.
1 Numbers may appear as zero and may not sum due to rounding. 2 For Primary Fund Investments: Too Early to Tell: Limited or no capital has been deployed. Performing: Capital has been deployed and returns are approximately second quartile
according to relevant Cambridge Associates data. Outperforming: Capital has been deployed and returns are approximately upper quartile according to relevant Cambridge Associates data. Underperforming: Fund has deployed capital and returns are approximately third or fourth quartile according to relevant Cambridge Associates data. For Secondary Fund Investments and Co-Investments: Too Early to Tell: Limited or no capital has been deployed. Performing: Capital has been deployed and valued at or near cost. Outperforming: Investment is valued above cost and / or distributed investment proceeds. Underperforming: Capital has been deployed and investment is valued below cost.
3 If applicable, fund sizes are as of September 30, 2016, and reflect the aggregate fund sizes which may include additional investment vehicles to which GCM Grosvenor Pacific, L.P. may not have commitments. Non-U.S. dollar fund sizes and commitments have been converted to U.S. dollars as of the respective investments’ final close and GCM Grosvenor Pacific, L.P.’s commitments to the investments, respectively.
4 Represents investments made to the underlying funds and co-investments, plus capitalized expenses paid less recallable returns of capital. A portion of the funded amount may not reduce the Partnership’s remaining commitment to the underlying funds or co-investments.
5 Represents the most recent available valuation. 6 Represents non-recallable returns of capital, interest, gains and dividend proceeds received from the investments. Amounts may be inclusive of escrow proceeds receivable. 7 Represents the Market Value plus distributions. 8 Represents the Total Value divided by the funded amount. TVMs are net of underlying funds fees and expenses but do not include GCM Grosvenor fees and expenses. 9 The IRR is as of September 30, 2016. IRRs are net of underlying funds fees and expenses but do not include GCM Grosvenor fees and expenses. Performance information for
underlying investments with less than 365 days of cash flows has been calculated using a periodic IRR while information for underlying investments and underlying investment with more than 365 days of cash flows has been calculated using an annualized IRR.
Asset Class Geography Commitment
Funded
Amount4 % Funded
Remaining
Commitment
Market
Value5 Distributions6
Total
Value7 TVM8 IRR9
Pooled Global $58.2 $34.3 58.9% $24.0 $33.1 $15.8 $48.9 1.43x 35.5%
Asset Class Geography Commitment
Funded
Amount4 % Funded
Remaining
Commitment
Market
Value5 Distributions6
Total
Value7 TVM8 IRR9
Distressed Global $5.0 $3.3 65.5% $1.8 $3.4 $0.0 $3.4 1.04x 2.5%
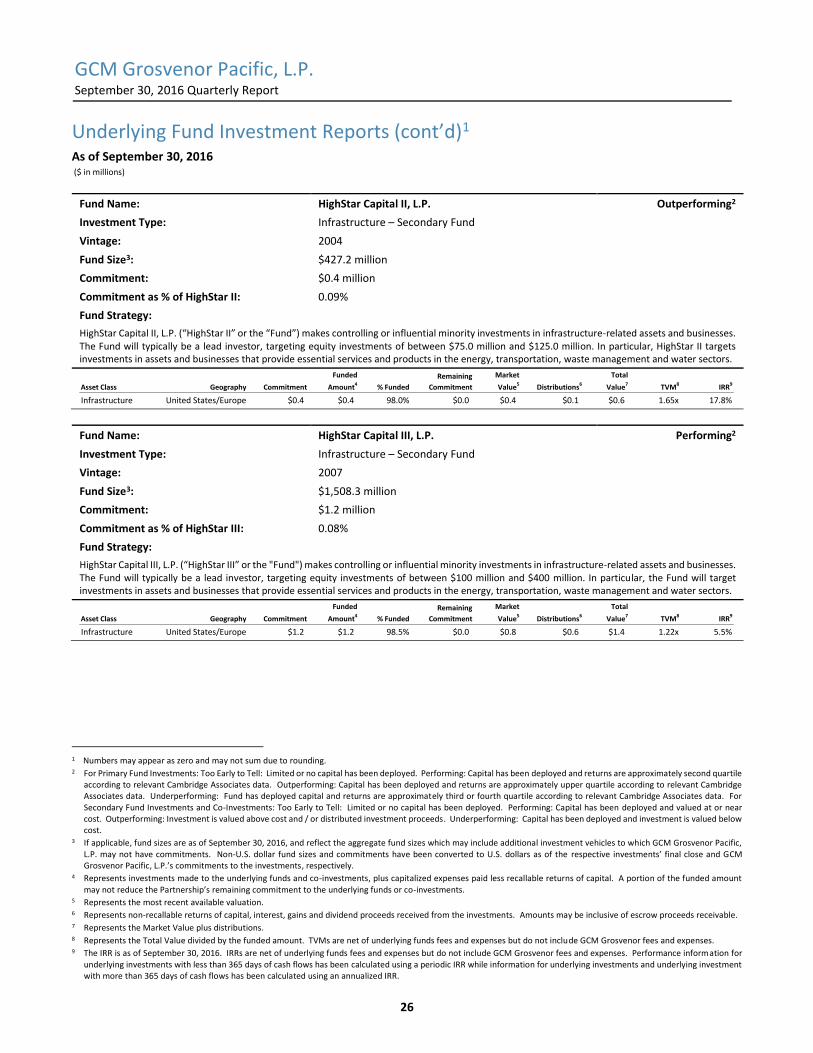
GCM Grosvenor Pacific, L.P. September 30, 2016 Quarterly Report
26
Underlying Fund Investment Reports (cont’d)1 As of September 30, 2016 ($ in millions)
Fund Name: HighStar Capital II, L.P. Outperforming2
Investment Type: Infrastructure – Secondary Fund
Vintage: 2004
Fund Size3: $427.2 million
Commitment: $0.4 million
Commitment as % of HighStar II: 0.09%
Fund Strategy:
HighStar Capital II, L.P. (“HighStar II” or the “Fund”) makes controlling or influential minority investments in infrastructure-related assets and businesses. The Fund will typically be a lead investor, targeting equity investments of between $75.0 million and $125.0 million. In particular, HighStar II targets investments in assets and businesses that provide essential services and products in the energy, transportation, waste management and water sectors.
Fund Name: HighStar Capital III, L.P. Performing2
Investment Type: Infrastructure – Secondary Fund
Vintage: 2007
Fund Size3: $1,508.3 million
Commitment: $1.2 million
Commitment as % of HighStar III: 0.08%
Fund Strategy:
HighStar Capital III, L.P. (“HighStar III” or the "Fund") makes controlling or influential minority investments in infrastructure-related assets and businesses. The Fund will typically be a lead investor, targeting equity investments of between $100 million and $400 million. In particular, the Fund will target investments in assets and businesses that provide essential services and products in the energy, transportation, waste management and water sectors.
1 Numbers may appear as zero and may not sum due to rounding. 2 For Primary Fund Investments: Too Early to Tell: Limited or no capital has been deployed. Performing: Capital has been deployed and returns are approximately second quartile
according to relevant Cambridge Associates data. Outperforming: Capital has been deployed and returns are approximately upper quartile according to relevant Cambridge Associates data. Underperforming: Fund has deployed capital and returns are approximately third or fourth quartile according to relevant Cambridge Associates data. For Secondary Fund Investments and Co-Investments: Too Early to Tell: Limited or no capital has been deployed. Performing: Capital has been deployed and valued at or near cost. Outperforming: Investment is valued above cost and / or distributed investment proceeds. Underperforming: Capital has been deployed and investment is valued below cost.
3 If applicable, fund sizes are as of September 30, 2016, and reflect the aggregate fund sizes which may include additional investment vehicles to which GCM Grosvenor Pacific, L.P. may not have commitments. Non-U.S. dollar fund sizes and commitments have been converted to U.S. dollars as of the respective investments’ final close and GCM Grosvenor Pacific, L.P.’s commitments to the investments, respectively.
4 Represents investments made to the underlying funds and co-investments, plus capitalized expenses paid less recallable returns of capital. A portion of the funded amount may not reduce the Partnership’s remaining commitment to the underlying funds or co-investments.
5 Represents the most recent available valuation. 6 Represents non-recallable returns of capital, interest, gains and dividend proceeds received from the investments. Amounts may be inclusive of escrow proceeds receivable. 7 Represents the Market Value plus distributions. 8 Represents the Total Value divided by the funded amount. TVMs are net of underlying funds fees and expenses but do not include GCM Grosvenor fees and expenses. 9 The IRR is as of September 30, 2016. IRRs are net of underlying funds fees and expenses but do not include GCM Grosvenor fees and expenses. Performance information for
underlying investments with less than 365 days of cash flows has been calculated using a periodic IRR while information for underlying investments and underlying investment with more than 365 days of cash flows has been calculated using an annualized IRR.
Asset Class Geography Commitment
Funded
Amount4 % Funded
Remaining
Commitment
Market
Value5 Distributions6
Total
Value7 TVM8 IRR9
Infrastructure United States/Europe $0.4 $0.4 98.0% $0.0 $0.4 $0.1 $0.6 1.65x 17.8%
Asset Class Geography Commitment
Funded
Amount4 % Funded
Remaining
Commitment
Market
Value5 Distributions6
Total
Value7 TVM8 IRR9
Infrastructure United States/Europe $1.2 $1.2 98.5% $0.0 $0.8 $0.6 $1.4 1.22x 5.5%
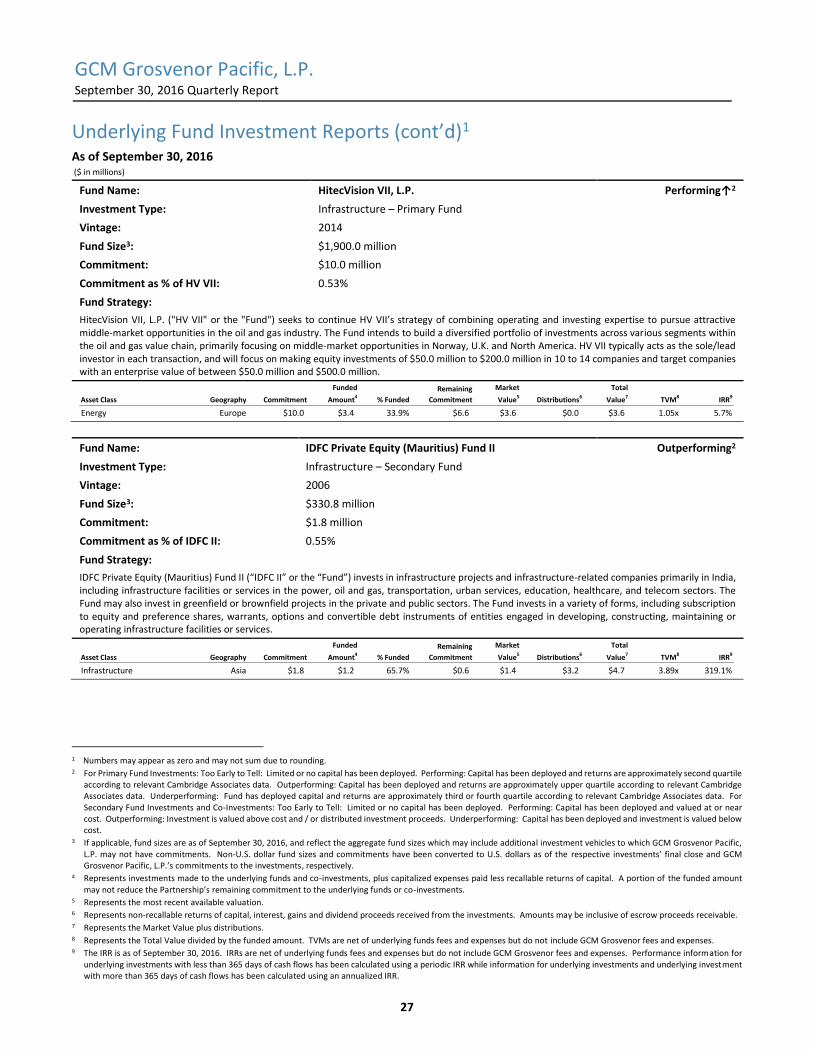
GCM Grosvenor Pacific, L.P. September 30, 2016 Quarterly Report
27
Underlying Fund Investment Reports (cont’d)1 As of September 30, 2016 ($ in millions)
Fund Name: HitecVision VII, L.P. Performing↑2
Investment Type: Infrastructure – Primary Fund
Vintage: 2014
Fund Size3: $1,900.0 million
Commitment: $10.0 million
Commitment as % of HV VII: 0.53%
Fund Strategy:
HitecVision VII, L.P. ("HV VII" or the "Fund") seeks to continue HV VII’s strategy of combining operating and investing expertise to pursue attractive middle-market opportunities in the oil and gas industry. The Fund intends to build a diversified portfolio of investments across various segments within the oil and gas value chain, primarily focusing on middle-market opportunities in Norway, U.K. and North America. HV VII typically acts as the sole/lead investor in each transaction, and will focus on making equity investments of $50.0 million to $200.0 million in 10 to 14 companies and target companies with an enterprise value of between $50.0 million and $500.0 million.
Fund Name: IDFC Private Equity (Mauritius) Fund II Outperforming2
Investment Type: Infrastructure – Secondary Fund
Vintage: 2006
Fund Size3: $330.8 million
Commitment: $1.8 million
Commitment as % of IDFC II: 0.55%
Fund Strategy:
IDFC Private Equity (Mauritius) Fund II (“IDFC II” or the “Fund”) invests in infrastructure projects and infrastructure-related companies primarily in India, including infrastructure facilities or services in the power, oil and gas, transportation, urban services, education, healthcare, and telecom sectors. The Fund may also invest in greenfield or brownfield projects in the private and public sectors. The Fund invests in a variety of forms, including subscription to equity and preference shares, warrants, options and convertible debt instruments of entities engaged in developing, constructing, maintaining or operating infrastructure facilities or services.
1 Numbers may appear as zero and may not sum due to rounding. 2 For Primary Fund Investments: Too Early to Tell: Limited or no capital has been deployed. Performing: Capital has been deployed and returns are approximately second quartile
according to relevant Cambridge Associates data. Outperforming: Capital has been deployed and returns are approximately upper quartile according to relevant Cambridge Associates data. Underperforming: Fund has deployed capital and returns are approximately third or fourth quartile according to relevant Cambridge Associates data. For Secondary Fund Investments and Co-Investments: Too Early to Tell: Limited or no capital has been deployed. Performing: Capital has been deployed and valued at or near cost. Outperforming: Investment is valued above cost and / or distributed investment proceeds. Underperforming: Capital has been deployed and investment is valued below cost.
3 If applicable, fund sizes are as of September 30, 2016, and reflect the aggregate fund sizes which may include additional investment vehicles to which GCM Grosvenor Pacific, L.P. may not have commitments. Non-U.S. dollar fund sizes and commitments have been converted to U.S. dollars as of the respective investments’ final close and GCM Grosvenor Pacific, L.P.’s commitments to the investments, respectively.
4 Represents investments made to the underlying funds and co-investments, plus capitalized expenses paid less recallable returns of capital. A portion of the funded amount may not reduce the Partnership’s remaining commitment to the underlying funds or co-investments.
5 Represents the most recent available valuation. 6 Represents non-recallable returns of capital, interest, gains and dividend proceeds received from the investments. Amounts may be inclusive of escrow proceeds receivable. 7 Represents the Market Value plus distributions. 8 Represents the Total Value divided by the funded amount. TVMs are net of underlying funds fees and expenses but do not include GCM Grosvenor fees and expenses. 9 The IRR is as of September 30, 2016. IRRs are net of underlying funds fees and expenses but do not include GCM Grosvenor fees and expenses. Performance information for
underlying investments with less than 365 days of cash flows has been calculated using a periodic IRR while information for underlying investments and underlying investment with more than 365 days of cash flows has been calculated using an annualized IRR.
Asset Class Geography Commitment
Funded
Amount4 % Funded
Remaining
Commitment
Market
Value5 Distributions6
Total
Value7 TVM8 IRR9
Energy Europe $10.0 $3.4 33.9% $6.6 $3.6 $0.0 $3.6 1.05x 5.7%
Asset Class Geography Commitment
Funded
Amount4 % Funded
Remaining
Commitment
Market
Value5 Distributions6
Total
Value7 TVM8 IRR9
Infrastructure Asia $1.8 $1.2 65.7% $0.6 $1.4 $3.2 $4.7 3.89x 319.1%

GCM Grosvenor Pacific, L.P. September 30, 2016 Quarterly Report
28
Underlying Fund Investment Reports (cont’d)1 As of September 30, 2016 ($ in millions)
Fund Name: Infracapital Partners LP Outperforming2
Investment Type: Infrastructure – Secondary Fund
Vintage: 2006
Fund Size3: $1,208.7 million
Commitment: $2.3 million
Commitment as % of Infracapital: 0.19%
Fund Strategy:
Infracapital Partners LP (“Infracapital” or the “Fund”) makes direct investments in infrastructure assets, investing in long-term, sustainable and low volatility cash flows with moderate capital appreciation. The Fund targets investments in businesses or assets operating in core infrastructure sectors, including regulated gas and electricity transmission and distribution, water utilities, transportation, communication infrastructure sectors.
Fund Name: KoFC Macquarie Korea Growth Champ 2010-1 Private Equity Fund Outperforming2
Investment Type: Infrastructure – Secondary Fund
Vintage: 2010
Fund Size3: $477.5 million
Commitment: $14.3 million
Commitment as % of KMFG: 2.85%
Fund Strategy:
KoFC Macquarie Korea Growth Champ 2010-1 Private Equity Fund ("KMGF" or the "Fund") is targeting to promote the potential growth of portfolio companies and continuously developing related industries. The Fund is seeking to make equity investments in a diversified portfolio of infrastructure and renewable assets located primarily in South Korea. KMGF seeks investments for which it can exercise control or significant influence over key strategic, commercial and financial decisions.
1 Numbers may appear as zero and may not sum due to rounding. 2 For Primary Fund Investments: Too Early to Tell: Limited or no capital has been deployed. Performing: Capital has been deployed and returns are approximately second quartile
according to relevant Cambridge Associates data. Outperforming: Capital has been deployed and returns are approximately upper quartile according to relevant Cambridge Associates data. Underperforming: Fund has deployed capital and returns are approximately third or fourth quartile according to relevant Cambridge Associates data. For Secondary Fund Investments and Co-Investments: Too Early to Tell: Limited or no capital has been deployed. Performing: Capital has been deployed and valued at or near cost. Outperforming: Investment is valued above cost and / or distributed investment proceeds. Underperforming: Capital has been deployed and investment is valued below cost.
3 If applicable, fund sizes are as of September 30, 2016, and reflect the aggregate fund sizes which may include additional investment vehicles to which GCM Grosvenor Pacific, L.P. may not have commitments. Non-U.S. dollar fund sizes and commitments have been converted to U.S. dollars as of the respective investments’ final close and GCM Grosvenor Pacific, L.P.’s commitments to the investments, respectively.
4 Represents investments made to the underlying funds and co-investments, plus capitalized expenses paid less recallable returns of capital. A portion of the funded amount may not reduce the Partnership’s remaining commitment to the underlying funds or co-investments.
5 Represents the most recent available valuation. 6 Represents non-recallable returns of capital, interest, gains and dividend proceeds received from the investments. Amounts may be inclusive of escrow proceeds receivable. 7 Represents the Market Value plus distributions. 8 Represents the Total Value divided by the funded amount. TVMs are net of underlying funds fees and expenses but do not include GCM Grosvenor fees and expenses. 9 The IRR is as of September 30, 2016. IRRs are net of underlying funds fees and expenses but do not include GCM Grosvenor fees and expenses. Performance information for
underlying investments with less than 365 days of cash flows has been calculated using a periodic IRR while information for underlying investments and underlying investment with more than 365 days of cash flows has been calculated using an annualized IRR.
Asset Class Geography Commitment
Funded
Amount4 % Funded
Remaining
Commitment
Market
Value5 Distributions6
Total
Value7 TVM8 IRR9
Infrastructure Europe $2.3 $2.1 93.3% $0.1 $1.6 $1.3 $3.0 1.39x 18.2%
Asset Class Geography Commitment
Funded
Amount4 % Funded
Remaining
Commitment
Market
Value5 Distributions6
Total
Value7 TVM8 IRR9
Infrastructure Asia $14.3 $13.2 92.9% $0.1 $10.7 $8.3 $19.0 1.43x 21.7%
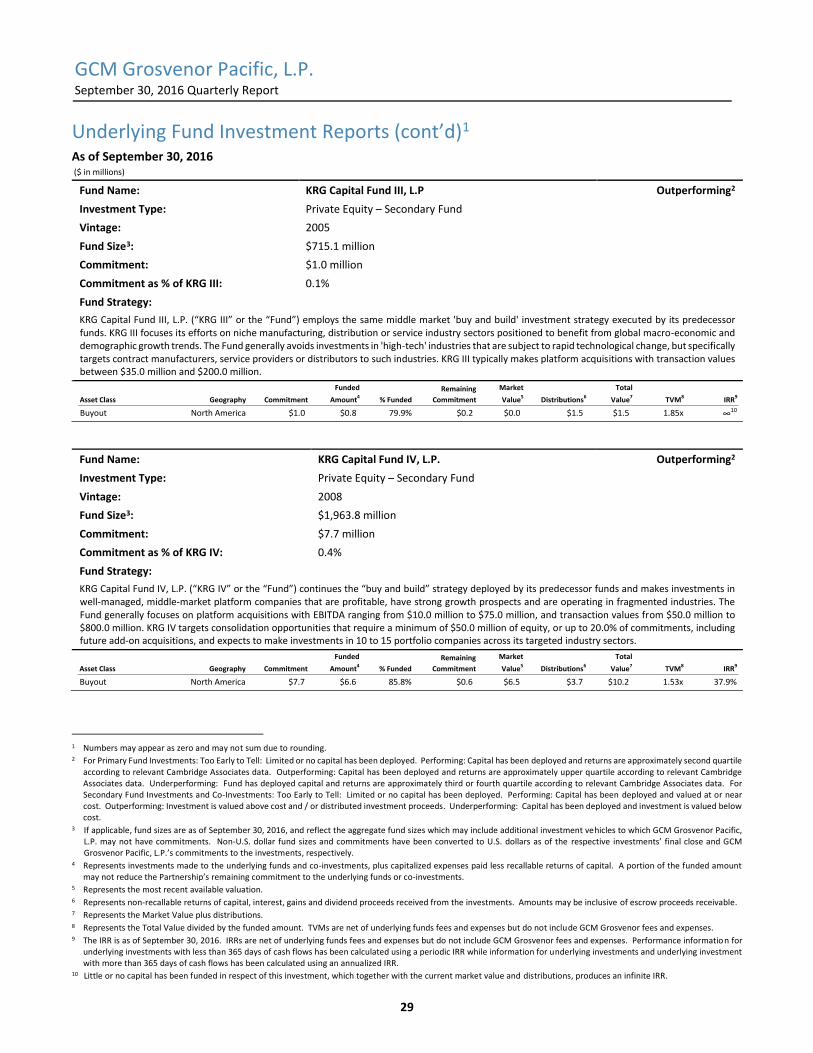
GCM Grosvenor Pacific, L.P. September 30, 2016 Quarterly Report
29
Underlying Fund Investment Reports (cont’d)1 As of September 30, 2016 ($ in millions)
Fund Name: KRG Capital Fund III, L.P Outperforming2
Investment Type: Private Equity – Secondary Fund
Vintage: 2005
Fund Size3: $715.1 million
Commitment: $1.0 million
Commitment as % of KRG III: 0.1%
Fund Strategy:
KRG Capital Fund III, L.P. (“KRG III” or the “Fund”) employs the same middle market 'buy and build' investment strategy executed by its predecessor funds. KRG III focuses its efforts on niche manufacturing, distribution or service industry sectors positioned to benefit from global macro-economic and demographic growth trends. The Fund generally avoids investments in 'high-tech' industries that are subject to rapid technological change, but specifically targets contract manufacturers, service providers or distributors to such industries. KRG III typically makes platform acquisitions with transaction values between $35.0 million and $200.0 million.
Fund Name: KRG Capital Fund IV, L.P. Outperforming2
Investment Type: Private Equity – Secondary Fund
Vintage: 2008
Fund Size3: $1,963.8 million
Commitment: $7.7 million
Commitment as % of KRG IV: 0.4%
Fund Strategy:
KRG Capital Fund IV, L.P. (“KRG IV” or the “Fund”) continues the “buy and build” strategy deployed by its predecessor funds and makes investments in well-managed, middle-market platform companies that are profitable, have strong growth prospects and are operating in fragmented industries. The Fund generally focuses on platform acquisitions with EBITDA ranging from $10.0 million to $75.0 million, and transaction values from $50.0 million to $800.0 million. KRG IV targets consolidation opportunities that require a minimum of $50.0 million of equity, or up to 20.0% of commitments, including future add-on acquisitions, and expects to make investments in 10 to 15 portfolio companies across its targeted industry sectors.
1 Numbers may appear as zero and may not sum due to rounding. 2 For Primary Fund Investments: Too Early to Tell: Limited or no capital has been deployed. Performing: Capital has been deployed and returns are approximately second quartile
according to relevant Cambridge Associates data. Outperforming: Capital has been deployed and returns are approximately upper quartile according to relevant Cambridge Associates data. Underperforming: Fund has deployed capital and returns are approximately third or fourth quartile according to relevant Cambridge Associates data. For Secondary Fund Investments and Co-Investments: Too Early to Tell: Limited or no capital has been deployed. Performing: Capital has been deployed and valued at or near cost. Outperforming: Investment is valued above cost and / or distributed investment proceeds. Underperforming: Capital has been deployed and investment is valued below cost.
3 If applicable, fund sizes are as of September 30, 2016, and reflect the aggregate fund sizes which may include additional investment vehicles to which GCM Grosvenor Pacific, L.P. may not have commitments. Non-U.S. dollar fund sizes and commitments have been converted to U.S. dollars as of the respective investments’ final close and GCM Grosvenor Pacific, L.P.’s commitments to the investments, respectively.
4 Represents investments made to the underlying funds and co-investments, plus capitalized expenses paid less recallable returns of capital. A portion of the funded amount may not reduce the Partnership’s remaining commitment to the underlying funds or co-investments.
5 Represents the most recent available valuation. 6 Represents non-recallable returns of capital, interest, gains and dividend proceeds received from the investments. Amounts may be inclusive of escrow proceeds receivable. 7 Represents the Market Value plus distributions. 8 Represents the Total Value divided by the funded amount. TVMs are net of underlying funds fees and expenses but do not include GCM Grosvenor fees and expenses. 9 The IRR is as of September 30, 2016. IRRs are net of underlying funds fees and expenses but do not include GCM Grosvenor fees and expenses. Performance information for
underlying investments with less than 365 days of cash flows has been calculated using a periodic IRR while information for underlying investments and underlying investment with more than 365 days of cash flows has been calculated using an annualized IRR.
10 Little or no capital has been funded in respect of this investment, which together with the current market value and distributions, produces an infinite IRR.
Asset Class Geography Commitment
Funded
Amount4 % Funded
Remaining
Commitment
Market
Value5 Distributions6
Total
Value7 TVM8 IRR9
Buyout North America $1.0 $0.8 79.9% $0.2 $0.0 $1.5 $1.5 1.85x ∞10
Asset Class Geography Commitment
Funded
Amount4 % Funded
Remaining
Commitment
Market
Value5 Distributions6
Total
Value7 TVM8 IRR9
Buyout North America $7.7 $6.6 85.8% $0.6 $6.5 $3.7 $10.2 1.53x 37.9%

GCM Grosvenor Pacific, L.P. September 30, 2016 Quarterly Report
30
Underlying Fund Investment Reports (cont’d)1 As of September 30, 2016 ($ in millions)
Fund Name: Macquarie European Infrastructure Fund I, L.P. Outperforming2
Investment Type: Infrastructure – Secondary Fund
Vintage: 2004
Fund Size3: $1,710.9 million
Commitment: $8.6 million
Commitment as % of MEIF I: 0.51%
Fund Strategy:
Macquarie European Infrastructure Fund I, L.P. (“MEIF I” or the “Fund”) was established to invest in infrastructure and related businesses in European OECD countries. MEIF I seeks to deliver sustainable cash yield and moderate capital growth from a diversified portfolio of quality infrastructure investments.
Fund Name: Macquarie European Infrastructure Fund 4 LP Outperforming2
Investment Type: Infrastructure – Secondary Fund
Vintage: 2011
Fund Size3: $2,995.9 million
Commitment: $14.7 million
Commitment as % of MEIF 4: 0.50%
Fund Strategy:
Macquarie European Infrastructure Fund 4 LP ("MEIF 4" or the "Fund") makes lead control investments in European infrastructure companies. MEIF 4 primarily invests in European Union countries, Norway, Switzerland and Iceland. The Fund targets infrastructure companies operating in the basic utilities, communication and transportation sectors.
1 Numbers may appear as zero and may not sum due to rounding. 2 For Primary Fund Investments: Too Early to Tell: Limited or no capital has been deployed. Performing: Capital has been deployed and returns are approximately second quartile
according to relevant Cambridge Associates data. Outperforming: Capital has been deployed and returns are approximately upper quartile according to relevant Cambridge Associates data. Underperforming: Fund has deployed capital and returns are approximately third or fourth quartile according to relevant Cambridge Associates data. For Secondary Fund Investments and Co-Investments: Too Early to Tell: Limited or no capital has been deployed. Performing: Capital has been deployed and valued at or near cost. Outperforming: Investment is valued above cost and / or distributed investment proceeds. Underperforming: Capital has been deployed and investment is valued below cost.
3 If applicable, fund sizes are as of September 30, 2016, and reflect the aggregate fund sizes which may include additional investment vehicles to which GCM Grosvenor Pacific, L.P. may not have commitments. Non-U.S. dollar fund sizes and commitments have been converted to U.S. dollars as of the respective investments’ final close and GCM Grosvenor Pacific, L.P.’s commitments to the investments, respectively.
4 Represents investments made to the underlying funds and co-investments, plus capitalized expenses paid less recallable returns of capital. A portion of the funded amount may not reduce the Partnership’s remaining commitment to the underlying funds or co-investments.
5 Represents the most recent available valuation. 6 Represents non-recallable returns of capital, interest, gains and dividend proceeds received from the investments. Amounts may be inclusive of escrow proceeds receivable. 7 Represents the Market Value plus distributions. 8 Represents the Total Value divided by the funded amount. TVMs are net of underlying funds fees and expenses but do not include GCM Grosvenor fees and expenses. 9 The IRR is as of September 30, 2016. IRRs are net of underlying funds fees and expenses but do not include GCM Grosvenor fees and expenses. Performance information for
underlying investments with less than 365 days of cash flows has been calculated using a periodic IRR while information for underlying investments and underlying investment with more than 365 days of cash flows has been calculated using an annualized IRR.
Asset Class Geography Commitment
Funded
Amount4 % Funded
Remaining
Commitment
Market
Value5 Distributions6
Total
Value7 TVM8 IRR9
Infrastructure Europe $8.6 $8.6 100.0% $0.0 $1.0 $14.0 $15.1 1.75x 14.4%
Asset Class Geography Commitment
Funded
Amount4 % Funded
Remaining
Commitment
Market
Value5 Distributions6
Total
Value7 TVM8 IRR9
Infrastructure Europe $14.7 $11.6 78.5% $0.9 $14.1 $0.8 $15.0 1.30x 21.0%

GCM Grosvenor Pacific, L.P. September 30, 2016 Quarterly Report
31
Underlying Fund Investment Reports (cont’d)1 As of September 30, 2016 ($ in millions)
Fund Name: Macquarie Infrastructure Partners I, L.P. Outperforming2
Investment Type: Infrastructure – Secondary Fund
Vintage: 2006
Fund Size3: $4,000.0 million
Commitment: $1.8 million
Commitment as % of MIP I: 0.05%
Fund Strategy:
Macquarie Infrastructure Partners I (“MIP I” or the “Fund”) makes lead control investments in North American infrastructure companies. MIP I primarily invests in the U.S. The Fund targets infrastructure assets operating in the basic utilities, communication and transportation sectors.
Fund Name: Macquarie Infrastructure Partners I, L.P. (Project Key) Outperforming2
Investment Type: Infrastructure – Secondary Fund
Vintage: 2006
Fund Size3: $4,000.0 million
Commitment: $2.8 million
Commitment as % of MIP I (Project Key): 0.07%
Fund Strategy:
Macquarie Infrastructure Partners I (“MIP I” or the “Fund”) makes lead control investments in North American infrastructure companies. MIP I primarily invests in the U.S. The Fund targets infrastructure companies operating in basic utilities, communication and transportation sectors.
1 Numbers may appear as zero and may not sum due to rounding. 2 For Primary Fund Investments: Too Early to Tell: Limited or no capital has been deployed. Performing: Capital has been deployed and returns are approximately second quartile
according to relevant Cambridge Associates data. Outperforming: Capital has been deployed and returns are approximately upper quartile according to relevant Cambridge Associates data. Underperforming: Fund has deployed capital and returns are approximately third or fourth quartile according to relevant Cambridge Associates data. For Secondary Fund Investments and Co-Investments: Too Early to Tell: Limited or no capital has been deployed. Performing: Capital has been deployed and valued at or near cost. Outperforming: Investment is valued above cost and / or distributed investment proceeds. Underperforming: Capital has been deployed and investment is valued below cost.
3 If applicable, fund sizes are as of September 30, 2016, and reflect the aggregate fund sizes which may include additional investment vehicles to which GCM Grosvenor Pacific, L.P. may not have commitments. Non-U.S. dollar fund sizes and commitments have been converted to U.S. dollars as of the respective investments’ final close and GCM Grosvenor Pacific, L.P.’s commitments to the investments, respectively.
4 Represents investments made to the underlying funds and co-investments, plus capitalized expenses paid less recallable returns of capital. A portion of the funded amount may not reduce the Partnership’s remaining commitment to the underlying funds or co-investments.
5 Represents the most recent available valuation. 6 Represents non-recallable returns of capital, interest, gains and dividend proceeds received from the investments. Amounts may be inclusive of escrow proceeds receivable. 7 Represents the Market Value plus distributions. 8 Represents the Total Value divided by the funded amount. TVMs are net of underlying funds fees and expenses but do not include GCM Grosvenor fees and expenses. 9 The IRR is as of September 30, 2016. IRRs are net of underlying funds fees and expenses but do not include GCM Grosvenor fees and expenses. Performance information for
underlying investments with less than 365 days of cash flows has been calculated using a periodic IRR while information for underlying investments and underlying investment with more than 365 days of cash flows has been calculated using an annualized IRR.
Asset Class Geography Commitment
Funded
Amount4 % Funded
Remaining
Commitment
Market
Value5 Distributions6
Total
Value7 TVM8 IRR9
Infrastructure Europe $1.8 $1.8 99.4% $0.0 $2.0 $1.5 $3.6 1.96x 29.9%
Asset Class Geography Commitment
Funded
Amount4 % Funded
Remaining
Commitment
Market
Value5 Distributions6
Total
Value7 TVM8 IRR9
Infrastructure Europe $2.8 $2.7 99.4% $0.0 $3.4 $0.7 $4.2 1.51x 53.3%
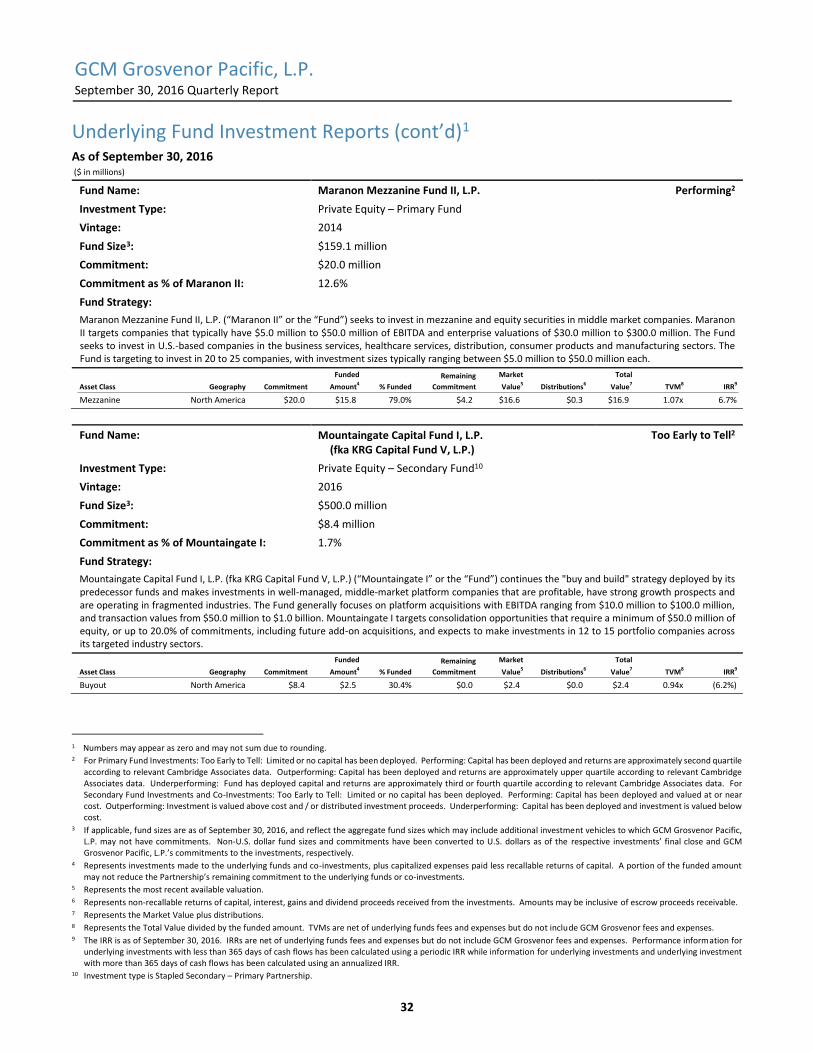
GCM Grosvenor Pacific, L.P. September 30, 2016 Quarterly Report
32
Underlying Fund Investment Reports (cont’d)1 As of September 30, 2016 ($ in millions)
Fund Name: Maranon Mezzanine Fund II, L.P. Performing2
Investment Type: Private Equity – Primary Fund
Vintage: 2014
Fund Size3: $159.1 million
Commitment: $20.0 million
Commitment as % of Maranon II: 12.6%
Fund Strategy:
Maranon Mezzanine Fund II, L.P. (“Maranon II” or the “Fund”) seeks to invest in mezzanine and equity securities in middle market companies. Maranon II targets companies that typically have $5.0 million to $50.0 million of EBITDA and enterprise valuations of $30.0 million to $300.0 million. The Fund seeks to invest in U.S.-based companies in the business services, healthcare services, distribution, consumer products and manufacturing sectors. The Fund is targeting to invest in 20 to 25 companies, with investment sizes typically ranging between $5.0 million to $50.0 million each.
Fund Name: Mountaingate Capital Fund I, L.P. (fka KRG Capital Fund V, L.P.)
Too Early to Tell2
Investment Type: Private Equity – Secondary Fund10
Vintage: 2016
Fund Size3: $500.0 million
Commitment: $8.4 million
Commitment as % of Mountaingate I: 1.7%
Fund Strategy:
Mountaingate Capital Fund I, L.P. (fka KRG Capital Fund V, L.P.) (“Mountaingate I” or the “Fund”) continues the "buy and build" strategy deployed by its predecessor funds and makes investments in well-managed, middle-market platform companies that are profitable, have strong growth prospects and are operating in fragmented industries. The Fund generally focuses on platform acquisitions with EBITDA ranging from $10.0 million to $100.0 million, and transaction values from $50.0 million to $1.0 billion. Mountaingate I targets consolidation opportunities that require a minimum of $50.0 million of equity, or up to 20.0% of commitments, including future add-on acquisitions, and expects to make investments in 12 to 15 portfolio companies across its targeted industry sectors.
1 Numbers may appear as zero and may not sum due to rounding. 2 For Primary Fund Investments: Too Early to Tell: Limited or no capital has been deployed. Performing: Capital has been deployed and returns are approximately second quartile
according to relevant Cambridge Associates data. Outperforming: Capital has been deployed and returns are approximately upper quartile according to relevant Cambridge Associates data. Underperforming: Fund has deployed capital and returns are approximately third or fourth quartile according to relevant Cambridge Associates data. For Secondary Fund Investments and Co-Investments: Too Early to Tell: Limited or no capital has been deployed. Performing: Capital has been deployed and valued at or near cost. Outperforming: Investment is valued above cost and / or distributed investment proceeds. Underperforming: Capital has been deployed and investment is valued below cost.
3 If applicable, fund sizes are as of September 30, 2016, and reflect the aggregate fund sizes which may include additional investment vehicles to which GCM Grosvenor Pacific, L.P. may not have commitments. Non-U.S. dollar fund sizes and commitments have been converted to U.S. dollars as of the respective investments’ final close and GCM Grosvenor Pacific, L.P.’s commitments to the investments, respectively.
4 Represents investments made to the underlying funds and co-investments, plus capitalized expenses paid less recallable returns of capital. A portion of the funded amount may not reduce the Partnership’s remaining commitment to the underlying funds or co-investments.
5 Represents the most recent available valuation. 6 Represents non-recallable returns of capital, interest, gains and dividend proceeds received from the investments. Amounts may be inclusive of escrow proceeds receivable. 7 Represents the Market Value plus distributions. 8 Represents the Total Value divided by the funded amount. TVMs are net of underlying funds fees and expenses but do not include GCM Grosvenor fees and expenses. 9 The IRR is as of September 30, 2016. IRRs are net of underlying funds fees and expenses but do not include GCM Grosvenor fees and expenses. Performance information for
underlying investments with less than 365 days of cash flows has been calculated using a periodic IRR while information for underlying investments and underlying investment with more than 365 days of cash flows has been calculated using an annualized IRR.
10 Investment type is Stapled Secondary – Primary Partnership.
Asset Class Geography Commitment
Funded
Amount4 % Funded
Remaining
Commitment
Market
Value5 Distributions6
Total
Value7 TVM8 IRR9
Mezzanine North America $20.0 $15.8 79.0% $4.2 $16.6 $0.3 $16.9 1.07x 6.7%
Asset Class Geography Commitment
Funded
Amount4 % Funded
Remaining
Commitment
Market
Value5 Distributions6
Total
Value7 TVM8 IRR9
Buyout North America $8.4 $2.5 30.4% $0.0 $2.4 $0.0 $2.4 0.94x (6.2%)
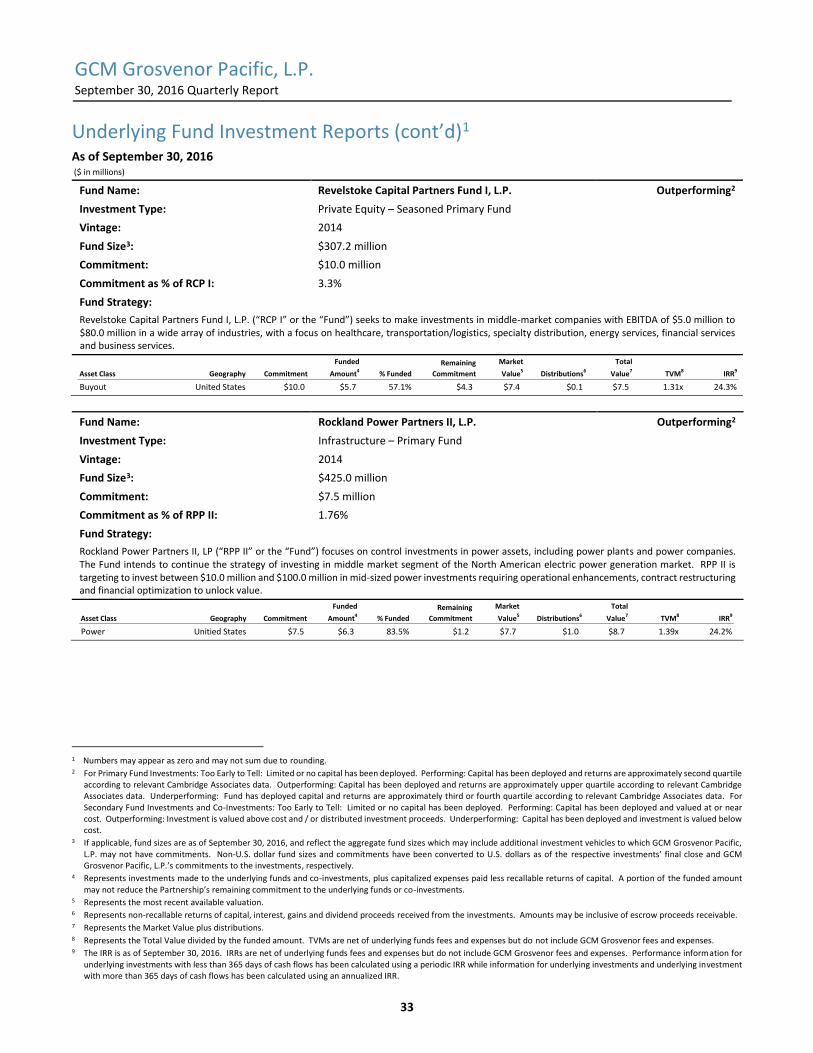
GCM Grosvenor Pacific, L.P. September 30, 2016 Quarterly Report
33
Underlying Fund Investment Reports (cont’d)1 As of September 30, 2016 ($ in millions)
Fund Name: Revelstoke Capital Partners Fund I, L.P. Outperforming2
Investment Type: Private Equity – Seasoned Primary Fund
Vintage: 2014
Fund Size3: $307.2 million
Commitment: $10.0 million
Commitment as % of RCP I: 3.3%
Fund Strategy:
Revelstoke Capital Partners Fund I, L.P. (“RCP I” or the “Fund”) seeks to make investments in middle-market companies with EBITDA of $5.0 million to $80.0 million in a wide array of industries, with a focus on healthcare, transportation/logistics, specialty distribution, energy services, financial services and business services.
Fund Name: Rockland Power Partners II, L.P. Outperforming2
Investment Type: Infrastructure – Primary Fund
Vintage: 2014
Fund Size3: $425.0 million
Commitment: $7.5 million
Commitment as % of RPP II: 1.76%
Fund Strategy:
Rockland Power Partners II, LP (“RPP II” or the “Fund”) focuses on control investments in power assets, including power plants and power companies. The Fund intends to continue the strategy of investing in middle market segment of the North American electric power generation market. RPP II is targeting to invest between $10.0 million and $100.0 million in mid-sized power investments requiring operational enhancements, contract restructuring and financial optimization to unlock value.
1 Numbers may appear as zero and may not sum due to rounding. 2 For Primary Fund Investments: Too Early to Tell: Limited or no capital has been deployed. Performing: Capital has been deployed and returns are approximately second quartile
according to relevant Cambridge Associates data. Outperforming: Capital has been deployed and returns are approximately upper quartile according to relevant Cambridge Associates data. Underperforming: Fund has deployed capital and returns are approximately third or fourth quartile according to relevant Cambridge Associates data. For Secondary Fund Investments and Co-Investments: Too Early to Tell: Limited or no capital has been deployed. Performing: Capital has been deployed and valued at or near cost. Outperforming: Investment is valued above cost and / or distributed investment proceeds. Underperforming: Capital has been deployed and investment is valued below cost.
3 If applicable, fund sizes are as of September 30, 2016, and reflect the aggregate fund sizes which may include additional investment vehicles to which GCM Grosvenor Pacific, L.P. may not have commitments. Non-U.S. dollar fund sizes and commitments have been converted to U.S. dollars as of the respective investments’ final close and GCM Grosvenor Pacific, L.P.’s commitments to the investments, respectively.
4 Represents investments made to the underlying funds and co-investments, plus capitalized expenses paid less recallable returns of capital. A portion of the funded amount may not reduce the Partnership’s remaining commitment to the underlying funds or co-investments.
5 Represents the most recent available valuation. 6 Represents non-recallable returns of capital, interest, gains and dividend proceeds received from the investments. Amounts may be inclusive of escrow proceeds receivable. 7 Represents the Market Value plus distributions. 8 Represents the Total Value divided by the funded amount. TVMs are net of underlying funds fees and expenses but do not include GCM Grosvenor fees and expenses. 9 The IRR is as of September 30, 2016. IRRs are net of underlying funds fees and expenses but do not include GCM Grosvenor fees and expenses. Performance information for
underlying investments with less than 365 days of cash flows has been calculated using a periodic IRR while information for underlying investments and underlying investment with more than 365 days of cash flows has been calculated using an annualized IRR.
Asset Class Geography Commitment
Funded
Amount4 % Funded
Remaining
Commitment
Market
Value5 Distributions6
Total
Value7 TVM8 IRR9
Buyout United States $10.0 $5.7 57.1% $4.3 $7.4 $0.1 $7.5 1.31x 24.3%
Asset Class Geography Commitment
Funded
Amount4 % Funded
Remaining
Commitment
Market
Value5 Distributions6
Total
Value7 TVM8 IRR9
Power Unitied States $7.5 $6.3 83.5% $1.2 $7.7 $1.0 $8.7 1.39x 24.2%
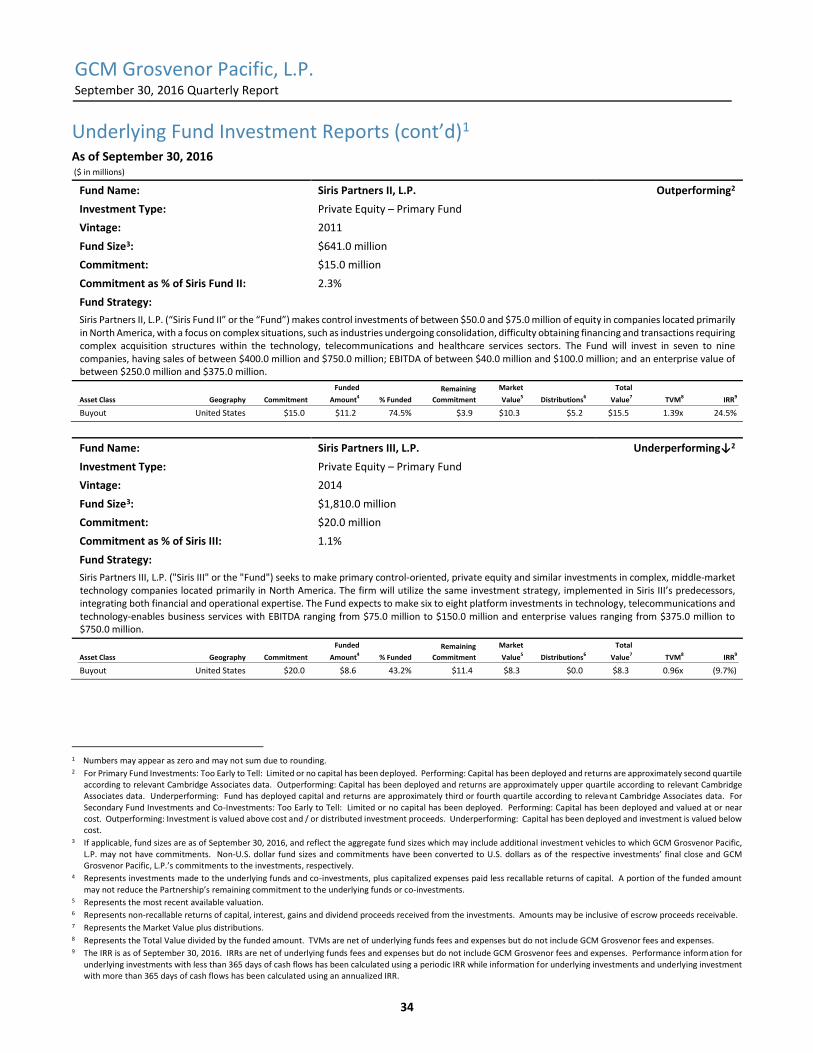
GCM Grosvenor Pacific, L.P. September 30, 2016 Quarterly Report
34
Underlying Fund Investment Reports (cont’d)1 As of September 30, 2016 ($ in millions)
Fund Name: Siris Partners II, L.P. Outperforming2
Investment Type: Private Equity – Primary Fund
Vintage: 2011
Fund Size3: $641.0 million
Commitment: $15.0 million
Commitment as % of Siris Fund II: 2.3%
Fund Strategy:
Siris Partners II, L.P. (“Siris Fund II” or the “Fund”) makes control investments of between $50.0 and $75.0 million of equity in companies located primarily in North America, with a focus on complex situations, such as industries undergoing consolidation, difficulty obtaining financing and transactions requiring complex acquisition structures within the technology, telecommunications and healthcare services sectors. The Fund will invest in seven to nine companies, having sales of between $400.0 million and $750.0 million; EBITDA of between $40.0 million and $100.0 million; and an enterprise value of between $250.0 million and $375.0 million.
Fund Name: Siris Partners III, L.P. Underperforming↓2
Investment Type: Private Equity – Primary Fund
Vintage: 2014
Fund Size3: $1,810.0 million
Commitment: $20.0 million
Commitment as % of Siris III: 1.1%
Fund Strategy:
Siris Partners III, L.P. ("Siris III" or the "Fund") seeks to make primary control-oriented, private equity and similar investments in complex, middle-market technology companies located primarily in North America. The firm will utilize the same investment strategy, implemented in Siris III’s predecessors, integrating both financial and operational expertise. The Fund expects to make six to eight platform investments in technology, telecommunications and technology-enables business services with EBITDA ranging from $75.0 million to $150.0 million and enterprise values ranging from $375.0 million to $750.0 million.
1 Numbers may appear as zero and may not sum due to rounding. 2 For Primary Fund Investments: Too Early to Tell: Limited or no capital has been deployed. Performing: Capital has been deployed and returns are approximately second quartile
according to relevant Cambridge Associates data. Outperforming: Capital has been deployed and returns are approximately upper quartile according to relevant Cambridge Associates data. Underperforming: Fund has deployed capital and returns are approximately third or fourth quartile according to relevant Cambridge Associates data. For Secondary Fund Investments and Co-Investments: Too Early to Tell: Limited or no capital has been deployed. Performing: Capital has been deployed and valued at or near cost. Outperforming: Investment is valued above cost and / or distributed investment proceeds. Underperforming: Capital has been deployed and investment is valued below cost.
3 If applicable, fund sizes are as of September 30, 2016, and reflect the aggregate fund sizes which may include additional investment vehicles to which GCM Grosvenor Pacific, L.P. may not have commitments. Non-U.S. dollar fund sizes and commitments have been converted to U.S. dollars as of the respective investments’ final close and GCM Grosvenor Pacific, L.P.’s commitments to the investments, respectively.
4 Represents investments made to the underlying funds and co-investments, plus capitalized expenses paid less recallable returns of capital. A portion of the funded amount may not reduce the Partnership’s remaining commitment to the underlying funds or co-investments.
5 Represents the most recent available valuation. 6 Represents non-recallable returns of capital, interest, gains and dividend proceeds received from the investments. Amounts may be inclusive of escrow proceeds receivable. 7 Represents the Market Value plus distributions. 8 Represents the Total Value divided by the funded amount. TVMs are net of underlying funds fees and expenses but do not include GCM Grosvenor fees and expenses. 9 The IRR is as of September 30, 2016. IRRs are net of underlying funds fees and expenses but do not include GCM Grosvenor fees and expenses. Performance information for
underlying investments with less than 365 days of cash flows has been calculated using a periodic IRR while information for underlying investments and underlying investment with more than 365 days of cash flows has been calculated using an annualized IRR.
Asset Class Geography Commitment
Funded
Amount4 % Funded
Remaining
Commitment
Market
Value5 Distributions6
Total
Value7 TVM8 IRR9
Buyout United States $15.0 $11.2 74.5% $3.9 $10.3 $5.2 $15.5 1.39x 24.5%
Asset Class Geography Commitment
Funded
Amount4 % Funded
Remaining
Commitment
Market
Value5 Distributions6
Total
Value7 TVM8 IRR9
Buyout United States $20.0 $8.6 43.2% $11.4 $8.3 $0.0 $8.3 0.96x (9.7%)
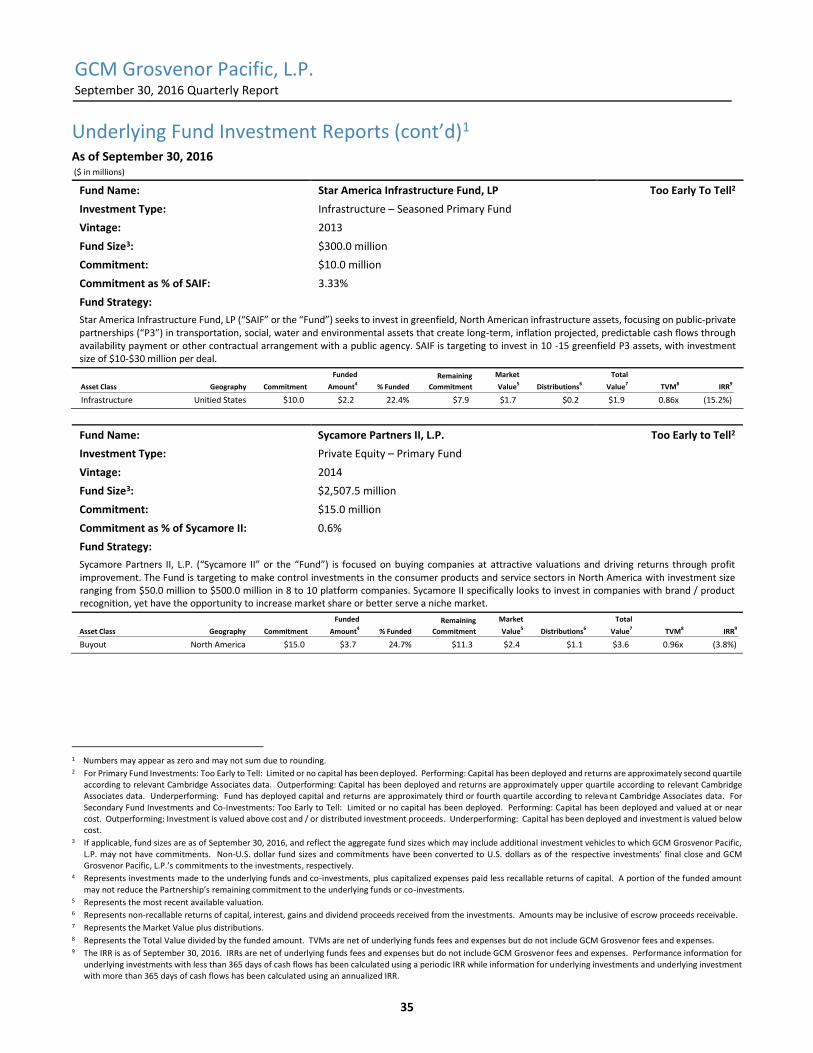
GCM Grosvenor Pacific, L.P. September 30, 2016 Quarterly Report
35
Underlying Fund Investment Reports (cont’d)1 As of September 30, 2016 ($ in millions)
Fund Name: Star America Infrastructure Fund, LP Too Early To Tell2
Investment Type: Infrastructure – Seasoned Primary Fund
Vintage: 2013
Fund Size3: $300.0 million
Commitment: $10.0 million
Commitment as % of SAIF: 3.33%
Fund Strategy:
Star America Infrastructure Fund, LP (“SAIF” or the “Fund”) seeks to invest in greenfield, North American infrastructure assets, focusing on public-private partnerships (“P3”) in transportation, social, water and environmental assets that create long-term, inflation projected, predictable cash flows through availability payment or other contractual arrangement with a public agency. SAIF is targeting to invest in 10 -15 greenfield P3 assets, with investment size of $10-$30 million per deal.
Fund Name: Sycamore Partners II, L.P. Too Early to Tell2
Investment Type: Private Equity – Primary Fund
Vintage: 2014
Fund Size3: $2,507.5 million
Commitment: $15.0 million
Commitment as % of Sycamore II: 0.6%
Fund Strategy:
Sycamore Partners II, L.P. (“Sycamore II” or the “Fund”) is focused on buying companies at attractive valuations and driving returns through profit improvement. The Fund is targeting to make control investments in the consumer products and service sectors in North America with investment size ranging from $50.0 million to $500.0 million in 8 to 10 platform companies. Sycamore II specifically looks to invest in companies with brand / product recognition, yet have the opportunity to increase market share or better serve a niche market.
1 Numbers may appear as zero and may not sum due to rounding. 2 For Primary Fund Investments: Too Early to Tell: Limited or no capital has been deployed. Performing: Capital has been deployed and returns are approximately second quartile
according to relevant Cambridge Associates data. Outperforming: Capital has been deployed and returns are approximately upper quartile according to relevant Cambridge Associates data. Underperforming: Fund has deployed capital and returns are approximately third or fourth quartile according to relevant Cambridge Associates data. For Secondary Fund Investments and Co-Investments: Too Early to Tell: Limited or no capital has been deployed. Performing: Capital has been deployed and valued at or near cost. Outperforming: Investment is valued above cost and / or distributed investment proceeds. Underperforming: Capital has been deployed and investment is valued below cost.
3 If applicable, fund sizes are as of September 30, 2016, and reflect the aggregate fund sizes which may include additional investment vehicles to which GCM Grosvenor Pacific, L.P. may not have commitments. Non-U.S. dollar fund sizes and commitments have been converted to U.S. dollars as of the respective investments’ final close and GCM Grosvenor Pacific, L.P.’s commitments to the investments, respectively.
4 Represents investments made to the underlying funds and co-investments, plus capitalized expenses paid less recallable returns of capital. A portion of the funded amount may not reduce the Partnership’s remaining commitment to the underlying funds or co-investments.
5 Represents the most recent available valuation. 6 Represents non-recallable returns of capital, interest, gains and dividend proceeds received from the investments. Amounts may be inclusive of escrow proceeds receivable. 7 Represents the Market Value plus distributions. 8 Represents the Total Value divided by the funded amount. TVMs are net of underlying funds fees and expenses but do not include GCM Grosvenor fees and expenses. 9 The IRR is as of September 30, 2016. IRRs are net of underlying funds fees and expenses but do not include GCM Grosvenor fees and expenses. Performance information for
underlying investments with less than 365 days of cash flows has been calculated using a periodic IRR while information for underlying investments and underlying investment with more than 365 days of cash flows has been calculated using an annualized IRR.
Asset Class Geography Commitment
Funded
Amount4 % Funded
Remaining
Commitment
Market
Value5 Distributions6
Total
Value7 TVM8 IRR9
Infrastructure Unitied States $10.0 $2.2 22.4% $7.9 $1.7 $0.2 $1.9 0.86x (15.2%)
Asset Class Geography Commitment
Funded
Amount4 % Funded
Remaining
Commitment
Market
Value5 Distributions6
Total
Value7 TVM8 IRR9
Buyout North America $15.0 $3.7 24.7% $11.3 $2.4 $1.1 $3.6 0.96x (3.8%)
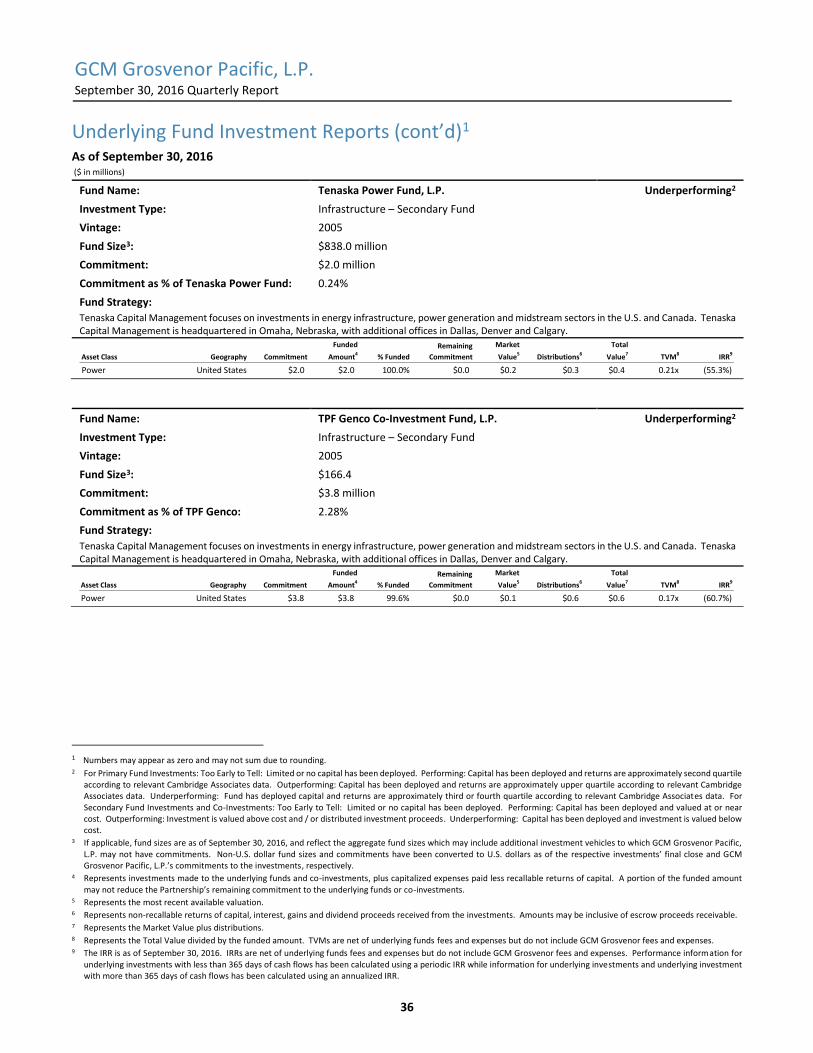
GCM Grosvenor Pacific, L.P. September 30, 2016 Quarterly Report
36
Underlying Fund Investment Reports (cont’d)1 As of September 30, 2016 ($ in millions)
Fund Name: Tenaska Power Fund, L.P. Underperforming2
Investment Type: Infrastructure – Secondary Fund
Vintage: 2005
Fund Size3: $838.0 million
Commitment: $2.0 million
Commitment as % of Tenaska Power Fund: 0.24%
Fund Strategy:
Tenaska Capital Management focuses on investments in energy infrastructure, power generation and midstream sectors in the U.S. and Canada. Tenaska Capital Management is headquartered in Omaha, Nebraska, with additional offices in Dallas, Denver and Calgary.
Fund Name: TPF Genco Co-Investment Fund, L.P. Underperforming2
Investment Type: Infrastructure – Secondary Fund
Vintage: 2005
Fund Size3: $166.4
Commitment: $3.8 million
Commitment as % of TPF Genco: 2.28%
Fund Strategy:
Tenaska Capital Management focuses on investments in energy infrastructure, power generation and midstream sectors in the U.S. and Canada. Tenaska Capital Management is headquartered in Omaha, Nebraska, with additional offices in Dallas, Denver and Calgary.
1 Numbers may appear as zero and may not sum due to rounding. 2 For Primary Fund Investments: Too Early to Tell: Limited or no capital has been deployed. Performing: Capital has been deployed and returns are approximately second quartile
according to relevant Cambridge Associates data. Outperforming: Capital has been deployed and returns are approximately upper quartile according to relevant Cambridge Associates data. Underperforming: Fund has deployed capital and returns are approximately third or fourth quartile according to relevant Cambridge Associates data. For Secondary Fund Investments and Co-Investments: Too Early to Tell: Limited or no capital has been deployed. Performing: Capital has been deployed and valued at or near cost. Outperforming: Investment is valued above cost and / or distributed investment proceeds. Underperforming: Capital has been deployed and investment is valued below cost.
3 If applicable, fund sizes are as of September 30, 2016, and reflect the aggregate fund sizes which may include additional investment vehicles to which GCM Grosvenor Pacific, L.P. may not have commitments. Non-U.S. dollar fund sizes and commitments have been converted to U.S. dollars as of the respective investments’ final close and GCM Grosvenor Pacific, L.P.’s commitments to the investments, respectively.
4 Represents investments made to the underlying funds and co-investments, plus capitalized expenses paid less recallable returns of capital. A portion of the funded amount may not reduce the Partnership’s remaining commitment to the underlying funds or co-investments.
5 Represents the most recent available valuation. 6 Represents non-recallable returns of capital, interest, gains and dividend proceeds received from the investments. Amounts may be inclusive of escrow proceeds receivable. 7 Represents the Market Value plus distributions. 8 Represents the Total Value divided by the funded amount. TVMs are net of underlying funds fees and expenses but do not include GCM Grosvenor fees and expenses. 9 The IRR is as of September 30, 2016. IRRs are net of underlying funds fees and expenses but do not include GCM Grosvenor fees and expenses. Performance information for
underlying investments with less than 365 days of cash flows has been calculated using a periodic IRR while information for underlying investments and underlying investment with more than 365 days of cash flows has been calculated using an annualized IRR.
Asset Class Geography Commitment
Funded
Amount4 % Funded
Remaining
Commitment
Market
Value5 Distributions6
Total
Value7 TVM8 IRR9
Power United States $2.0 $2.0 100.0% $0.0 $0.2 $0.3 $0.4 0.21x (55.3%)
Asset Class Geography Commitment
Funded
Amount4 % Funded
Remaining
Commitment
Market
Value5 Distributions6
Total
Value7 TVM8 IRR9
Power United States $3.8 $3.8 99.6% $0.0 $0.1 $0.6 $0.6 0.17x (60.7%)

GCM Grosvenor Pacific, L.P. September 30, 2016 Quarterly Report
37
Underlying Fund Investment Reports (cont’d)1 As of September 30, 2016 ($ in millions)
Fund Name: TPF II, L.P. Performing2
Investment Type: Infrastructure – Secondary Fund
Vintage: 2007
Fund Size3: $1,687.0 million
Commitment: $6.6 million
Commitment as % of TPF II: 0.39%
Fund Strategy:
Tenaska Capital Management focuses on investments in energy infrastructure, power generation and midstream sectors in the U.S. and Canada. Tenaska Capital Management is headquartered in Omaha, Nebraska, with additional offices in Dallas, Denver and Calgary.
Fund Name: TPG Opportunities Partners II (A), L.P. Outperforming2
Investment Type: Private Equity – Primary Fund
Vintage: 2011
Fund Size3: $2,137.3 million
Commitment: $15.0 million
Commitment as % of TOP II: 0.7%
Fund Strategy:
TPG Opportunities Partners II (A), L.P. (“TOP II” or the “Fund”) seeks to make special situations and distressed debt investments in companies having an industry orientation in Illiquid credit such as U.S. Residential & Commercial NPL’s, U.S. and European middle-market deals and Healthcare. The Fund primarily seeks to make portfolio investments across three major categories: Asset Special Situations (40.0% - 50.0%); Distressed-for-Control investments (25.0% - 35.0%); and Corporate Dislocations investments (15.0% - 25.0%). TOP II intends to make Corporate Special Situations investments in Europe with approximately 40.0% - 60.0% of investments to be non-U.S. The Fund typically seeks to invest between $25.0 million and $200.0 million per company.
1 Numbers may appear as zero and may not sum due to rounding. 2 For Primary Fund Investments: Too Early to Tell: Limited or no capital has been deployed. Performing: Capital has been deployed and returns are approximately second quartile
according to relevant Cambridge Associates data. Outperforming: Capital has been deployed and returns are approximately upper quartile according to relevant Cambridge Associates data. Underperforming: Fund has deployed capital and returns are approximately third or fourth quartile according to relevant Cambridge Associates data. For Secondary Fund Investments and Co-Investments: Too Early to Tell: Limited or no capital has been deployed. Performing: Capital has been deployed and valued at or near cost. Outperforming: Investment is valued above cost and / or distributed investment proceeds. Underperforming: Capital has been deployed and investment is valued below cost.
3 If applicable, fund sizes are as of September 30, 2016, and reflect the aggregate fund sizes which may include additional investment vehicles to which GCM Grosvenor Pacific, L.P. may not have commitments. Non-U.S. dollar fund sizes and commitments have been converted to U.S. dollars as of the respective investments’ final close and GCM Grosvenor Pacific, L.P.’s commitments to the investments, respectively.
4 Represents investments made to the underlying funds and co-investments, plus capitalized expenses paid less recallable returns of capital. A portion of the funded amount may not reduce the Partnership’s remaining commitment to the underlying funds or co-investments.
5 Represents the most recent available valuation. 6 Represents non-recallable returns of capital, interest, gains and dividend proceeds received from the investments. Amounts may be inclusive of escrow proceeds receivable. 7 Represents the Market Value plus distributions. 8 Represents the Total Value divided by the funded amount. TVMs are net of underlying funds fees and expenses but do not include GCM Grosvenor fees and expenses. 9 The IRR is as of September 30, 2016. IRRs are net of underlying funds fees and expenses but do not include GCM Grosvenor fees and expenses. Performance information for
underlying investments with less than 365 days of cash flows has been calculated using a periodic IRR while information for underlying investments and underlying investment with more than 365 days of cash flows has been calculated using an annualized IRR.
Asset Class Geography Commitment
Funded
Amount4 % Funded
Remaining
Commitment
Market
Value5 Distributions6
Total
Value7 TVM8 IRR9
Power United States $6.6 $5.2 79.0% $1.4 $0.5 $5.8 $6.3 1.20x 18.7%
Asset Class Geography Commitment
Funded
Amount4 % Funded
Remaining
Commitment
Market
Value5 Distributions6
Total
Value7 TVM8 IRR9
Distressed United States $15.0 $10.6 70.4% $4.4 $6.3 $11.1 $17.3 1.64x 17.5%
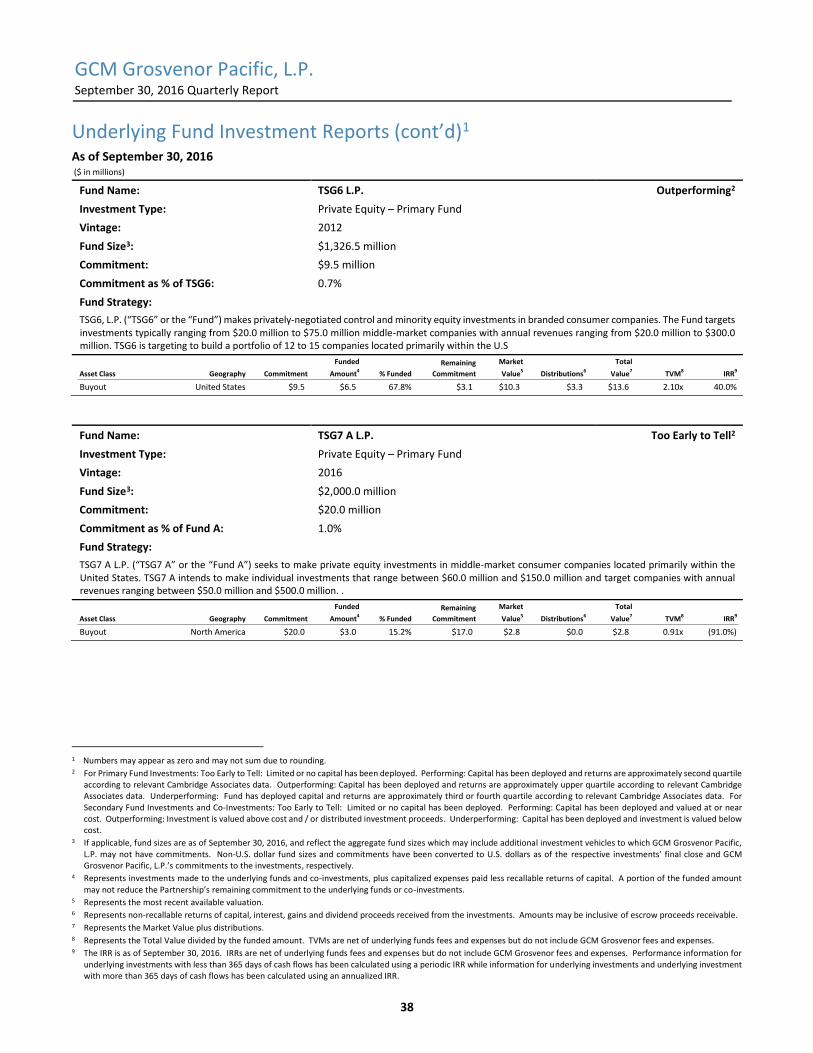
GCM Grosvenor Pacific, L.P. September 30, 2016 Quarterly Report
38
Underlying Fund Investment Reports (cont’d)1 As of September 30, 2016 ($ in millions)
Fund Name: TSG6 L.P. Outperforming2
Investment Type: Private Equity – Primary Fund
Vintage: 2012
Fund Size3: $1,326.5 million
Commitment: $9.5 million
Commitment as % of TSG6: 0.7%
Fund Strategy:
TSG6, L.P. (“TSG6” or the “Fund”) makes privately-negotiated control and minority equity investments in branded consumer companies. The Fund targets investments typically ranging from $20.0 million to $75.0 million middle-market companies with annual revenues ranging from $20.0 million to $300.0 million. TSG6 is targeting to build a portfolio of 12 to 15 companies located primarily within the U.S
Fund Name: TSG7 A L.P. Too Early to Tell2
Investment Type: Private Equity – Primary Fund
Vintage: 2016
Fund Size3: $2,000.0 million
Commitment: $20.0 million
Commitment as % of Fund A: 1.0%
Fund Strategy:
TSG7 A L.P. (“TSG7 A” or the “Fund A”) seeks to make private equity investments in middle-market consumer companies located primarily within the United States. TSG7 A intends to make individual investments that range between $60.0 million and $150.0 million and target companies with annual revenues ranging between $50.0 million and $500.0 million. .
1 Numbers may appear as zero and may not sum due to rounding. 2 For Primary Fund Investments: Too Early to Tell: Limited or no capital has been deployed. Performing: Capital has been deployed and returns are approximately second quartile
according to relevant Cambridge Associates data. Outperforming: Capital has been deployed and returns are approximately upper quartile according to relevant Cambridge Associates data. Underperforming: Fund has deployed capital and returns are approximately third or fourth quartile according to relevant Cambridge Associates data. For Secondary Fund Investments and Co-Investments: Too Early to Tell: Limited or no capital has been deployed. Performing: Capital has been deployed and valued at or near cost. Outperforming: Investment is valued above cost and / or distributed investment proceeds. Underperforming: Capital has been deployed and investment is valued below cost.
3 If applicable, fund sizes are as of September 30, 2016, and reflect the aggregate fund sizes which may include additional investment vehicles to which GCM Grosvenor Pacific, L.P. may not have commitments. Non-U.S. dollar fund sizes and commitments have been converted to U.S. dollars as of the respective investments’ final close and GCM Grosvenor Pacific, L.P.’s commitments to the investments, respectively.
4 Represents investments made to the underlying funds and co-investments, plus capitalized expenses paid less recallable returns of capital. A portion of the funded amount may not reduce the Partnership’s remaining commitment to the underlying funds or co-investments.
5 Represents the most recent available valuation. 6 Represents non-recallable returns of capital, interest, gains and dividend proceeds received from the investments. Amounts may be inclusive of escrow proceeds receivable. 7 Represents the Market Value plus distributions. 8 Represents the Total Value divided by the funded amount. TVMs are net of underlying funds fees and expenses but do not include GCM Grosvenor fees and expenses. 9 The IRR is as of September 30, 2016. IRRs are net of underlying funds fees and expenses but do not include GCM Grosvenor fees and expenses. Performance information for
underlying investments with less than 365 days of cash flows has been calculated using a periodic IRR while information for underlying investments and underlying investment with more than 365 days of cash flows has been calculated using an annualized IRR.
Asset Class Geography Commitment
Funded
Amount4 % Funded
Remaining
Commitment
Market
Value5 Distributions6
Total
Value7 TVM8 IRR9
Buyout United States $9.5 $6.5 67.8% $3.1 $10.3 $3.3 $13.6 2.10x 40.0%
Asset Class Geography Commitment
Funded
Amount4 % Funded
Remaining
Commitment
Market
Value5 Distributions6
Total
Value7 TVM8 IRR9
Buyout North America $20.0 $3.0 15.2% $17.0 $2.8 $0.0 $2.8 0.91x (91.0%)
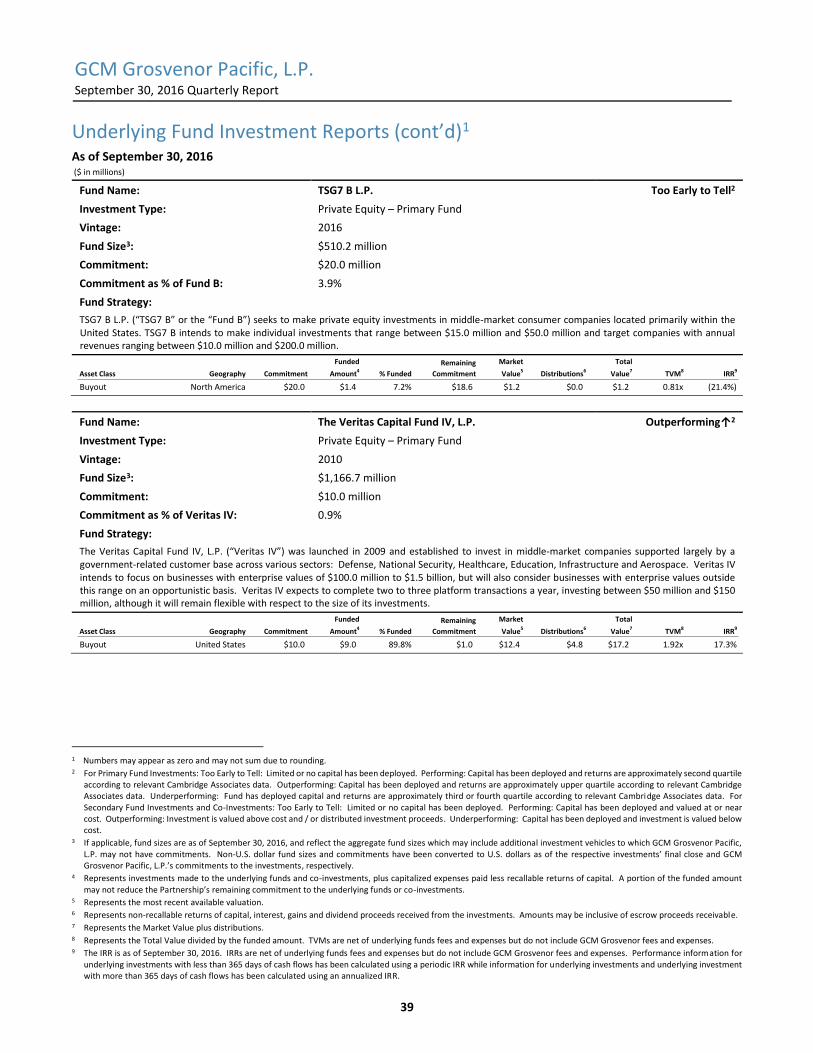
GCM Grosvenor Pacific, L.P. September 30, 2016 Quarterly Report
39
Underlying Fund Investment Reports (cont’d)1 As of September 30, 2016 ($ in millions)
Fund Name: TSG7 B L.P. Too Early to Tell2
Investment Type: Private Equity – Primary Fund
Vintage: 2016
Fund Size3: $510.2 million
Commitment: $20.0 million
Commitment as % of Fund B: 3.9%
Fund Strategy:
TSG7 B L.P. (“TSG7 B” or the “Fund B”) seeks to make private equity investments in middle-market consumer companies located primarily within the United States. TSG7 B intends to make individual investments that range between $15.0 million and $50.0 million and target companies with annual revenues ranging between $10.0 million and $200.0 million.
Fund Name: The Veritas Capital Fund IV, L.P. Outperforming↑2
Investment Type: Private Equity – Primary Fund
Vintage: 2010
Fund Size3: $1,166.7 million
Commitment: $10.0 million
Commitment as % of Veritas IV: 0.9%
Fund Strategy:
The Veritas Capital Fund IV, L.P. (“Veritas IV”) was launched in 2009 and established to invest in middle-market companies supported largely by a government-related customer base across various sectors: Defense, National Security, Healthcare, Education, Infrastructure and Aerospace. Veritas IV intends to focus on businesses with enterprise values of $100.0 million to $1.5 billion, but will also consider businesses with enterprise values outside this range on an opportunistic basis. Veritas IV expects to complete two to three platform transactions a year, investing between $50 million and $150 million, although it will remain flexible with respect to the size of its investments.
1 Numbers may appear as zero and may not sum due to rounding. 2 For Primary Fund Investments: Too Early to Tell: Limited or no capital has been deployed. Performing: Capital has been deployed and returns are approximately second quartile
according to relevant Cambridge Associates data. Outperforming: Capital has been deployed and returns are approximately upper quartile according to relevant Cambridge Associates data. Underperforming: Fund has deployed capital and returns are approximately third or fourth quartile according to relevant Cambridge Associates data. For Secondary Fund Investments and Co-Investments: Too Early to Tell: Limited or no capital has been deployed. Performing: Capital has been deployed and valued at or near cost. Outperforming: Investment is valued above cost and / or distributed investment proceeds. Underperforming: Capital has been deployed and investment is valued below cost.
3 If applicable, fund sizes are as of September 30, 2016, and reflect the aggregate fund sizes which may include additional investment vehicles to which GCM Grosvenor Pacific, L.P. may not have commitments. Non-U.S. dollar fund sizes and commitments have been converted to U.S. dollars as of the respective investments’ final close and GCM Grosvenor Pacific, L.P.’s commitments to the investments, respectively.
4 Represents investments made to the underlying funds and co-investments, plus capitalized expenses paid less recallable returns of capital. A portion of the funded amount may not reduce the Partnership’s remaining commitment to the underlying funds or co-investments.
5 Represents the most recent available valuation. 6 Represents non-recallable returns of capital, interest, gains and dividend proceeds received from the investments. Amounts may be inclusive of escrow proceeds receivable. 7 Represents the Market Value plus distributions. 8 Represents the Total Value divided by the funded amount. TVMs are net of underlying funds fees and expenses but do not include GCM Grosvenor fees and expenses. 9 The IRR is as of September 30, 2016. IRRs are net of underlying funds fees and expenses but do not include GCM Grosvenor fees and expenses. Performance information for
underlying investments with less than 365 days of cash flows has been calculated using a periodic IRR while information for underlying investments and underlying investment with more than 365 days of cash flows has been calculated using an annualized IRR.
Asset Class Geography Commitment
Funded
Amount4 % Funded
Remaining
Commitment
Market
Value5 Distributions6
Total
Value7 TVM8 IRR9
Buyout North America $20.0 $1.4 7.2% $18.6 $1.2 $0.0 $1.2 0.81x (21.4%)
Asset Class Geography Commitment
Funded
Amount4 % Funded
Remaining
Commitment
Market
Value5 Distributions6
Total
Value7 TVM8 IRR9
Buyout United States $10.0 $9.0 89.8% $1.0 $12.4 $4.8 $17.2 1.92x 17.3%
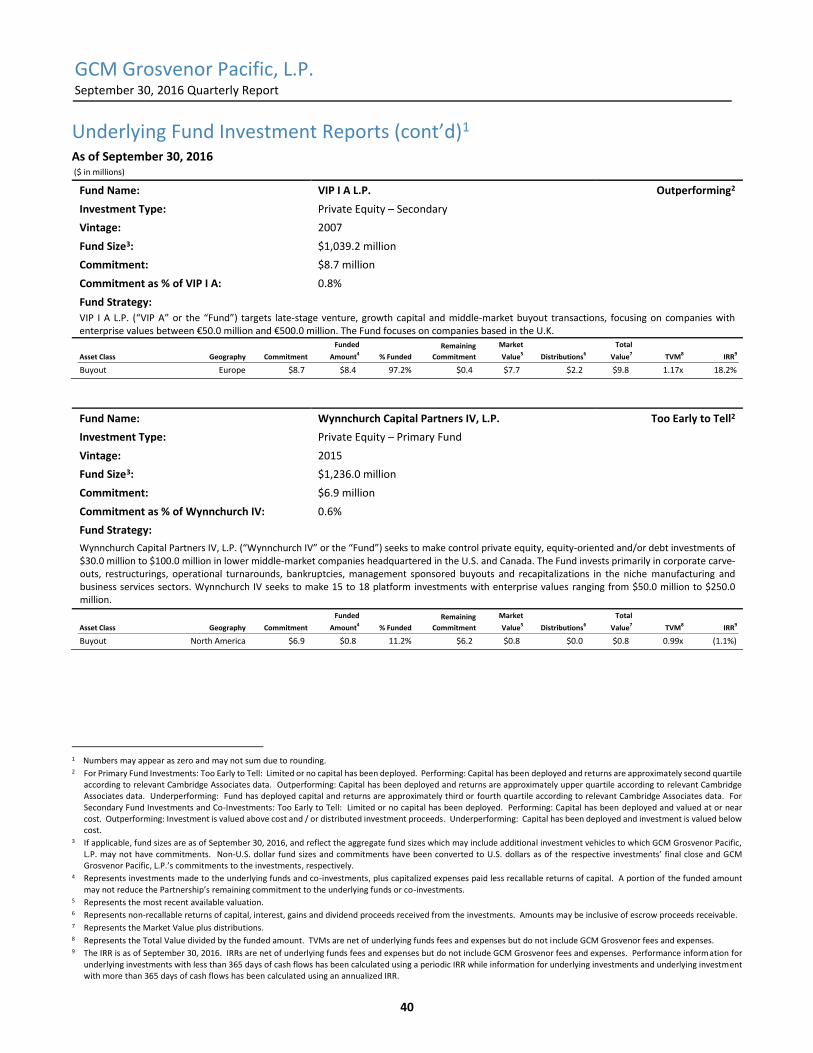
GCM Grosvenor Pacific, L.P. September 30, 2016 Quarterly Report
40
Underlying Fund Investment Reports (cont’d)1 As of September 30, 2016 ($ in millions)
Fund Name: VIP I A L.P. Outperforming2
Investment Type: Private Equity – Secondary
Vintage: 2007
Fund Size3: $1,039.2 million
Commitment: $8.7 million
Commitment as % of VIP I A: 0.8%
Fund Strategy:
VIP I A L.P. (“VIP A” or the “Fund”) targets late-stage venture, growth capital and middle-market buyout transactions, focusing on companies with enterprise values between €50.0 million and €500.0 million. The Fund focuses on companies based in the U.K.
Fund Name: Wynnchurch Capital Partners IV, L.P. Too Early to Tell2
Investment Type: Private Equity – Primary Fund
Vintage: 2015
Fund Size3: $1,236.0 million
Commitment: $6.9 million
Commitment as % of Wynnchurch IV: 0.6%
Fund Strategy:
Wynnchurch Capital Partners IV, L.P. (“Wynnchurch IV” or the “Fund”) seeks to make control private equity, equity-oriented and/or debt investments of $30.0 million to $100.0 million in lower middle-market companies headquartered in the U.S. and Canada. The Fund invests primarily in corporate carve-outs, restructurings, operational turnarounds, bankruptcies, management sponsored buyouts and recapitalizations in the niche manufacturing and business services sectors. Wynnchurch IV seeks to make 15 to 18 platform investments with enterprise values ranging from $50.0 million to $250.0 million.
1 Numbers may appear as zero and may not sum due to rounding. 2 For Primary Fund Investments: Too Early to Tell: Limited or no capital has been deployed. Performing: Capital has been deployed and returns are approximately second quartile
according to relevant Cambridge Associates data. Outperforming: Capital has been deployed and returns are approximately upper quartile according to relevant Cambridge Associates data. Underperforming: Fund has deployed capital and returns are approximately third or fourth quartile according to relevant Cambridge Associates data. For Secondary Fund Investments and Co-Investments: Too Early to Tell: Limited or no capital has been deployed. Performing: Capital has been deployed and valued at or near cost. Outperforming: Investment is valued above cost and / or distributed investment proceeds. Underperforming: Capital has been deployed and investment is valued below cost.
3 If applicable, fund sizes are as of September 30, 2016, and reflect the aggregate fund sizes which may include additional investment vehicles to which GCM Grosvenor Pacific, L.P. may not have commitments. Non-U.S. dollar fund sizes and commitments have been converted to U.S. dollars as of the respective investments’ final close and GCM Grosvenor Pacific, L.P.’s commitments to the investments, respectively.
4 Represents investments made to the underlying funds and co-investments, plus capitalized expenses paid less recallable returns of capital. A portion of the funded amount may not reduce the Partnership’s remaining commitment to the underlying funds or co-investments.
5 Represents the most recent available valuation. 6 Represents non-recallable returns of capital, interest, gains and dividend proceeds received from the investments. Amounts may be inclusive of escrow proceeds receivable. 7 Represents the Market Value plus distributions. 8 Represents the Total Value divided by the funded amount. TVMs are net of underlying funds fees and expenses but do not include GCM Grosvenor fees and expenses. 9 The IRR is as of September 30, 2016. IRRs are net of underlying funds fees and expenses but do not include GCM Grosvenor fees and expenses. Performance information for
underlying investments with less than 365 days of cash flows has been calculated using a periodic IRR while information for underlying investments and underlying investment with more than 365 days of cash flows has been calculated using an annualized IRR.
Asset Class Geography Commitment
Funded
Amount4 % Funded
Remaining
Commitment
Market
Value5 Distributions6
Total
Value7 TVM8 IRR9
Buyout Europe $8.7 $8.4 97.2% $0.4 $7.7 $2.2 $9.8 1.17x 18.2%
Asset Class Geography Commitment
Funded
Amount4 % Funded
Remaining
Commitment
Market
Value5 Distributions6
Total
Value7 TVM8 IRR9
Buyout North America $6.9 $0.8 11.2% $6.2 $0.8 $0.0 $0.8 0.99x (1.1%)

GCM Grosvenor Pacific, L.P. September 30, 2016 Quarterly Report
41
Co-Investment Reports1 As of September 30, 2016 ($ in millions)
Investment Name: Project Animal Performing2
Investment Type: Private Equity – Co-Investment
Vintage: 2015
Fund Size3: N/A
Commitment: $10.0 million
Commitment as % of Project Animal: N/A
Business Description:
Project Animal ("Project Animal" or the "Company") is a leading distributor of pet products to independent pet stores, veterinary clinics and other pet product specialty retailers throughout the United States and the Caribbean. Project Animal has a comprehensive product offering with market leadership in dry dog and cat food, driven by deep relationships with leading vendors. The Company’s national distribution platform enables the Company to profitably serve the full spectrum of pet retailers from large emerging chains to small “mom & pop” pet stores.
Fund Name: Project Atlanta Performing2
Investment Type: Infrastructure – Co-Investment
Vintage: 2014
Fund Size3: N/A
Commitment: $4.9 million
Commitment as % of Project Atlanta: N/A
Fund Strategy:
Project Atlanta (the “Portfolio”) is one of the largest operating renewable power generation portfolios in the world. The Portfolio consists of 55 individual assets located in 14 countries, with investments in the U.S., Mexico, Australia, Italy and Portugal accounting for approximately 75.0% of the value of the platform. These assets are relatively new, with average life of approximately five years and average remaining life of approximately 20 years.
1 Numbers may appear as zero and may not sum due to rounding. 2 For Primary Fund Investments: Too Early to Tell: Limited or no capital has been deployed. Performing: Capital has been deployed and returns are approximately second quartile
according to relevant Cambridge Associates data. Outperforming: Capital has been deployed and returns are approximately upper quartile according to relevant Cambridge Associates data. Underperforming: Fund has deployed capital and returns are approximately third or fourth quartile according to relevant Cambridge Associates data. For Secondary Fund Investments and Co-Investments: Too Early to Tell: Limited or no capital has been deployed. Performing: Capital has been deployed and valued at or near cost. Outperforming: Investment is valued above cost and / or distributed investment proceeds. Underperforming: Capital has been deployed and investment is valued below cost.
3 If applicable, fund sizes are as of September 30, 2016, and reflect the aggregate fund sizes which may include additional investment vehicles to which GCM Grosvenor Pacific, L.P. may not have commitments. Non-U.S. dollar fund sizes and commitments have been converted to U.S. dollars as of the respective investments’ final close and GCM Grosvenor Pacific, L.P.’s commitments to the investments, respectively.
4 Represents investments made to the underlying funds and co-investments, plus capitalized expenses paid less recallable returns of capital. A portion of the funded amount may not reduce the Partnership’s remaining commitment to the underlying funds or co-investments.
5 Represents the most recent available valuation. 6 Represents non-recallable returns of capital, interest, gains and dividend proceeds received from the investments. Amounts may be inclusive of escrow proceeds receivable. 7 Represents the Market Value plus distributions. 8 Represents the Total Value divided by the funded amount. TVMs are net of underlying funds fees and expenses but do not include GCM Grosvenor fees and expenses. 9 The IRR is as of September 30, 2016. IRRs are net of underlying funds fees and expenses but do not include GCM Grosvenor fees and expenses. Performance information for
underlying investments with less than 365 days of cash flows has been calculated using a periodic IRR while information for underlying investments and underlying investment with more than 365 days of cash flows has been calculated using an annualized IRR.
Asset Class Geography Commitment
Funded
Amount4
% Funded
Remaining
Commitment
Market
Value5
Distributions6
Total
Value7
TVM8
IRR9
Co-Investment United States $10.0 $10.0 100.0% $0.0 $12.5 $0.0 $12.5 1.25x 25.0%
Asset Class Geography Commitment
Funded
Amount4 % Funded
Remaining
Commitment
Market
Value5 Distributions6
Total
Value7 TVM8 IRR9
Power United States $4.9 $4.9 100.0% $0.0 $5.1 $0.4 $5.6 1.14x 7.3%
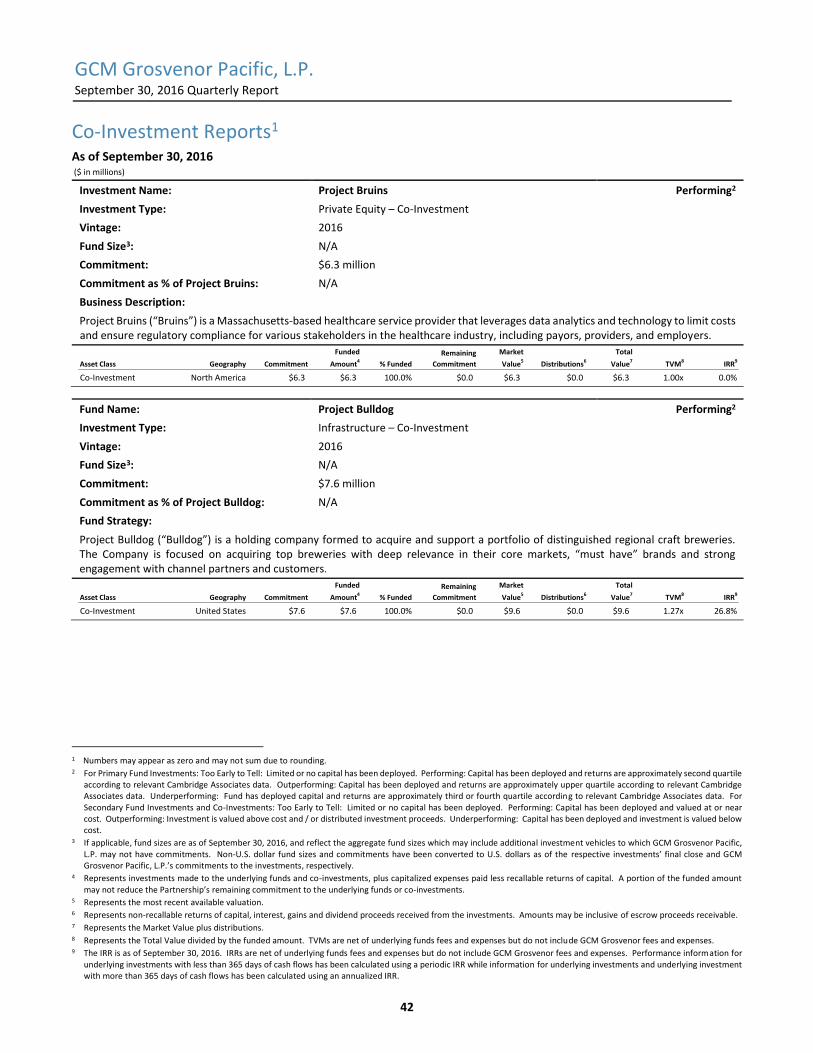
GCM Grosvenor Pacific, L.P. September 30, 2016 Quarterly Report
42
Co-Investment Reports1 As of September 30, 2016 ($ in millions)
Investment Name: Project Bruins Performing2
Investment Type: Private Equity – Co-Investment
Vintage: 2016
Fund Size3: N/A
Commitment: $6.3 million
Commitment as % of Project Bruins: N/A
Business Description:
Project Bruins (“Bruins”) is a Massachusetts-based healthcare service provider that leverages data analytics and technology to limit costs and ensure regulatory compliance for various stakeholders in the healthcare industry, including payors, providers, and employers.
Fund Name: Project Bulldog Performing2
Investment Type: Infrastructure – Co-Investment
Vintage: 2016
Fund Size3: N/A
Commitment: $7.6 million
Commitment as % of Project Bulldog: N/A
Fund Strategy:
Project Bulldog (“Bulldog”) is a holding company formed to acquire and support a portfolio of distinguished regional craft breweries. The Company is focused on acquiring top breweries with deep relevance in their core markets, “must have” brands and strong engagement with channel partners and customers.
1 Numbers may appear as zero and may not sum due to rounding. 2 For Primary Fund Investments: Too Early to Tell: Limited or no capital has been deployed. Performing: Capital has been deployed and returns are approximately second quartile
according to relevant Cambridge Associates data. Outperforming: Capital has been deployed and returns are approximately upper quartile according to relevant Cambridge Associates data. Underperforming: Fund has deployed capital and returns are approximately third or fourth quartile according to relevant Cambridge Associates data. For Secondary Fund Investments and Co-Investments: Too Early to Tell: Limited or no capital has been deployed. Performing: Capital has been deployed and valued at or near cost. Outperforming: Investment is valued above cost and / or distributed investment proceeds. Underperforming: Capital has been deployed and investment is valued below cost.
3 If applicable, fund sizes are as of September 30, 2016, and reflect the aggregate fund sizes which may include additional investment vehicles to which GCM Grosvenor Pacific, L.P. may not have commitments. Non-U.S. dollar fund sizes and commitments have been converted to U.S. dollars as of the respective investments’ final close and GCM Grosvenor Pacific, L.P.’s commitments to the investments, respectively.
4 Represents investments made to the underlying funds and co-investments, plus capitalized expenses paid less recallable returns of capital. A portion of the funded amount may not reduce the Partnership’s remaining commitment to the underlying funds or co-investments.
5 Represents the most recent available valuation. 6 Represents non-recallable returns of capital, interest, gains and dividend proceeds received from the investments. Amounts may be inclusive of escrow proceeds receivable. 7 Represents the Market Value plus distributions. 8 Represents the Total Value divided by the funded amount. TVMs are net of underlying funds fees and expenses but do not include GCM Grosvenor fees and expenses. 9 The IRR is as of September 30, 2016. IRRs are net of underlying funds fees and expenses but do not include GCM Grosvenor fees and expenses. Performance information for
underlying investments with less than 365 days of cash flows has been calculated using a periodic IRR while information for underlying investments and underlying investment with more than 365 days of cash flows has been calculated using an annualized IRR.
Asset Class Geography Commitment
Funded
Amount4
% Funded
Remaining
Commitment
Market
Value5
Distributions6
Total
Value7
TVM8
IRR9
Co-Investment North America $6.3 $6.3 100.0% $0.0 $6.3 $0.0 $6.3 1.00x 0.0%
Asset Class Geography Commitment
Funded
Amount4
% Funded
Remaining
Commitment
Market
Value5
Distributions6
Total
Value7
TVM8
IRR9
Co-Investment United States $7.6 $7.6 100.0% $0.0 $9.6 $0.0 $9.6 1.27x 26.8%

GCM Grosvenor Pacific, L.P. September 30, 2016 Quarterly Report
43
Co-Investment Reports (cont’d)1 As of September 30, 2016 ($ in millions)
Investment Name: Project California Outperforming2
Investment Type: Private Equity – Co-Investment
Vintage: 2013
Fund Size3: N/A
Commitment: $3.6 million
Commitment as % of Project California: N/A
Business Description:
Project California (the "Company") is a mall and web-based specialty retailer. The Company’s products include music and pop culture-licensed and music and pop culture-influenced apparel and accessories, music and gift items for young men and women, lingerie and beauty products.
Investment Name: Project Danube Performing2
Investment Type: Private Equity – Co-Investment
Vintage: 2015
Fund Size3: N/A
Commitment: $10.0 million
Commitment as % of Project Danube: N/A
Business Description:
Project Danube (“Danube” or the “Company”) is a provider of global commerce-as-a-service (“CaaS”) solutions. The Company provides commerce, payments and marketing solutions to business-to-business (“B2B”) and business-to-consumer (“B2C”) digital product and cloud service companies as well as branded manufacturers through its multi-tenant technology, platform and service offerings. Danube’s customers range from small and mid-sized companies to multi-national enterprises, including, software, consumer electronics, computer games, publishing, travel, music, video games, electronic toys, housewares, medical equipment, power tools and direct-selling.
1 Numbers may appear as zero and may not sum due to rounding. 2 For Primary Fund Investments: Too Early to Tell: Limited or no capital has been deployed. Performing: Capital has been deployed and returns are approximately second quartile
according to relevant Cambridge Associates data. Outperforming: Capital has been deployed and returns are approximately upper quartile according to relevant Cambridge Associates data. Underperforming: Fund has deployed capital and returns are approximately third or fourth quartile according to relevant Cambridge Associates data. For Secondary Fund Investments and Co-Investments: Too Early to Tell: Limited or no capital has been deployed. Performing: Capital has been deployed and valued at or near cost. Outperforming: Investment is valued above cost and / or distributed investment proceeds. Underperforming: Capital has been deployed and investment is valued below cost.
3 If applicable, fund sizes are as of September 30, 2016, and reflect the aggregate fund sizes which may include additional investment vehicles to which GCM Grosvenor Pacific, L.P. may not have commitments. Non-U.S. dollar fund sizes and commitments have been converted to U.S. dollars as of the respective investments’ final close and GCM Grosvenor Pacific, L.P.’s commitments to the investments, respectively.
4 Represents investments made to the underlying funds and co-investments, plus capitalized expenses paid less recallable returns of capital. A portion of the funded amount may not reduce the Partnership’s remaining commitment to the underlying funds or co-investments.
5 Represents the most recent available valuation. 6 Represents non-recallable returns of capital, interest, gains and dividend proceeds received from the investments. Amounts may be inclusive of escrow proceeds receivable. 7 Represents the Market Value plus distributions. 8 Represents the Total Value divided by the funded amount. TVMs are net of underlying funds fees and expenses but do not include GCM Grosvenor fees and expenses. 9 The IRR is as of September 30, 2016. IRRs are net of underlying funds fees and expenses but do not include GCM Grosvenor fees and expenses. Performance information for
underlying investments with less than 365 days of cash flows has been calculated using a periodic IRR while information for underlying investments and underlying investment with more than 365 days of cash flows has been calculated using an annualized IRR.
Asset Class Geography Commitment
Funded
Amount4
% Funded
Remaining
Commitment
Market
Value5
Distributions6
Total
Value7
TVM8
IRR9
Co-Investment United States $3.6 $3.5 97.0% $0.1 $4.1 $1.8 $5.8 1.65x 25.3%
Asset Class Geography Commitment
Funded
Amount4
% Funded
Remaining
Commitment
Market
Value5
Distributions6
Total
Value7
TVM8
IRR9
Co-Investment North America $10.0 $10.0 100.0% $0.0 $12.1 $0.0 $12.1 1.21x 12.2%
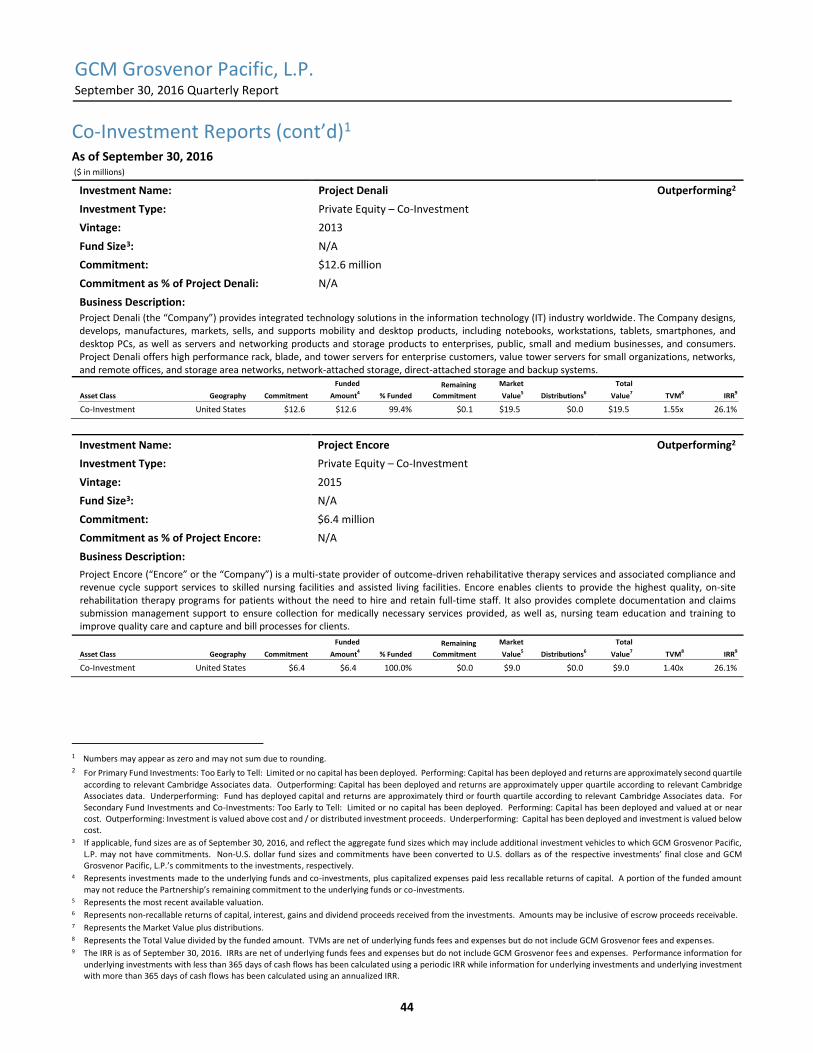
GCM Grosvenor Pacific, L.P. September 30, 2016 Quarterly Report
44
Co-Investment Reports (cont’d)1 As of September 30, 2016 ($ in millions)
Investment Name: Project Denali Outperforming2
Investment Type: Private Equity – Co-Investment
Vintage: 2013
Fund Size3: N/A
Commitment: $12.6 million
Commitment as % of Project Denali: N/A
Business Description:
Project Denali (the “Company”) provides integrated technology solutions in the information technology (IT) industry worldwide. The Company designs, develops, manufactures, markets, sells, and supports mobility and desktop products, including notebooks, workstations, tablets, smartphones, and desktop PCs, as well as servers and networking products and storage products to enterprises, public, small and medium businesses, and consumers. Project Denali offers high performance rack, blade, and tower servers for enterprise customers, value tower servers for small organizations, networks, and remote offices, and storage area networks, network-attached storage, direct-attached storage and backup systems.
Investment Name: Project Encore Outperforming2
Investment Type: Private Equity – Co-Investment
Vintage: 2015
Fund Size3: N/A
Commitment: $6.4 million
Commitment as % of Project Encore: N/A
Business Description:
Project Encore (“Encore” or the “Company”) is a multi-state provider of outcome-driven rehabilitative therapy services and associated compliance and revenue cycle support services to skilled nursing facilities and assisted living facilities. Encore enables clients to provide the highest quality, on-site rehabilitation therapy programs for patients without the need to hire and retain full-time staff. It also provides complete documentation and claims submission management support to ensure collection for medically necessary services provided, as well as, nursing team education and training to improve quality care and capture and bill processes for clients.
1 Numbers may appear as zero and may not sum due to rounding. 2 For Primary Fund Investments: Too Early to Tell: Limited or no capital has been deployed. Performing: Capital has been deployed and returns are approximately second quartile
according to relevant Cambridge Associates data. Outperforming: Capital has been deployed and returns are approximately upper quartile according to relevant Cambridge Associates data. Underperforming: Fund has deployed capital and returns are approximately third or fourth quartile according to relevant Cambridge Associates data. For Secondary Fund Investments and Co-Investments: Too Early to Tell: Limited or no capital has been deployed. Performing: Capital has been deployed and valued at or near cost. Outperforming: Investment is valued above cost and / or distributed investment proceeds. Underperforming: Capital has been deployed and investment is valued below cost.
3 If applicable, fund sizes are as of September 30, 2016, and reflect the aggregate fund sizes which may include additional investment vehicles to which GCM Grosvenor Pacific, L.P. may not have commitments. Non-U.S. dollar fund sizes and commitments have been converted to U.S. dollars as of the respective investments’ final close and GCM Grosvenor Pacific, L.P.’s commitments to the investments, respectively.
4 Represents investments made to the underlying funds and co-investments, plus capitalized expenses paid less recallable returns of capital. A portion of the funded amount may not reduce the Partnership’s remaining commitment to the underlying funds or co-investments.
5 Represents the most recent available valuation. 6 Represents non-recallable returns of capital, interest, gains and dividend proceeds received from the investments. Amounts may be inclusive of escrow proceeds receivable. 7 Represents the Market Value plus distributions. 8 Represents the Total Value divided by the funded amount. TVMs are net of underlying funds fees and expenses but do not include GCM Grosvenor fees and expenses. 9 The IRR is as of September 30, 2016. IRRs are net of underlying funds fees and expenses but do not include GCM Grosvenor fees and expenses. Performance information for
underlying investments with less than 365 days of cash flows has been calculated using a periodic IRR while information for underlying investments and underlying investment with more than 365 days of cash flows has been calculated using an annualized IRR.
Asset Class Geography Commitment
Funded
Amount4
% Funded
Remaining
Commitment
Market
Value5
Distributions6
Total
Value7
TVM8
IRR9
Co-Investment United States $12.6 $12.6 99.4% $0.1 $19.5 $0.0 $19.5 1.55x 26.1%
Asset Class Geography Commitment
Funded
Amount4
% Funded
Remaining
Commitment
Market
Value5
Distributions6
Total
Value7
TVM8
IRR9
Co-Investment United States $6.4 $6.4 100.0% $0.0 $9.0 $0.0 $9.0 1.40x 26.1%
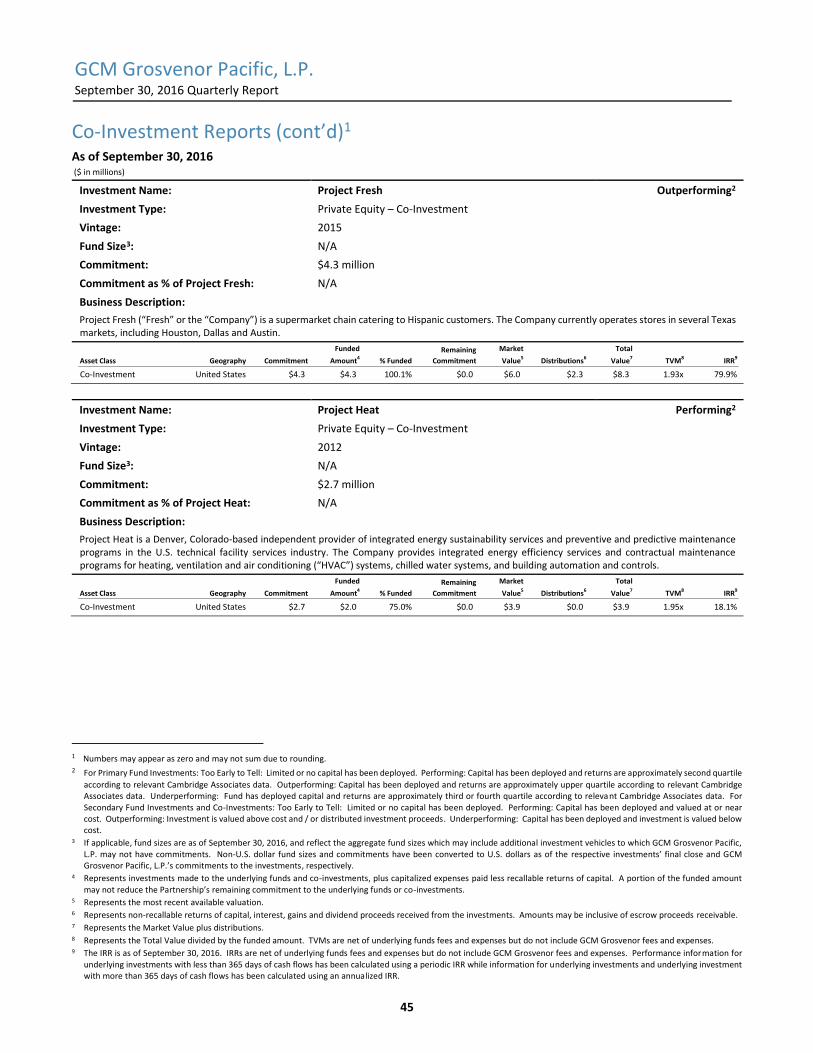
GCM Grosvenor Pacific, L.P. September 30, 2016 Quarterly Report
45
Co-Investment Reports (cont’d)1 As of September 30, 2016 ($ in millions)
Investment Name: Project Fresh Outperforming2
Investment Type: Private Equity – Co-Investment
Vintage: 2015
Fund Size3: N/A
Commitment: $4.3 million
Commitment as % of Project Fresh: N/A
Business Description:
Project Fresh (“Fresh” or the “Company”) is a supermarket chain catering to Hispanic customers. The Company currently operates stores in several Texas markets, including Houston, Dallas and Austin.
Investment Name: Project Heat Performing2
Investment Type: Private Equity – Co-Investment
Vintage: 2012
Fund Size3: N/A
Commitment: $2.7 million
Commitment as % of Project Heat: N/A
Business Description:
Project Heat is a Denver, Colorado-based independent provider of integrated energy sustainability services and preventive and predictive maintenance programs in the U.S. technical facility services industry. The Company provides integrated energy efficiency services and contractual maintenance programs for heating, ventilation and air conditioning (“HVAC”) systems, chilled water systems, and building automation and controls.
1 Numbers may appear as zero and may not sum due to rounding. 2 For Primary Fund Investments: Too Early to Tell: Limited or no capital has been deployed. Performing: Capital has been deployed and returns are approximately second quartile
according to relevant Cambridge Associates data. Outperforming: Capital has been deployed and returns are approximately upper quartile according to relevant Cambridge Associates data. Underperforming: Fund has deployed capital and returns are approximately third or fourth quartile according to relevant Cambridge Associates data. For Secondary Fund Investments and Co-Investments: Too Early to Tell: Limited or no capital has been deployed. Performing: Capital has been deployed and valued at or near cost. Outperforming: Investment is valued above cost and / or distributed investment proceeds. Underperforming: Capital has been deployed and investment is valued below cost.
3 If applicable, fund sizes are as of September 30, 2016, and reflect the aggregate fund sizes which may include additional investment vehicles to which GCM Grosvenor Pacific, L.P. may not have commitments. Non-U.S. dollar fund sizes and commitments have been converted to U.S. dollars as of the respective investments’ final close and GCM Grosvenor Pacific, L.P.’s commitments to the investments, respectively.
4 Represents investments made to the underlying funds and co-investments, plus capitalized expenses paid less recallable returns of capital. A portion of the funded amount may not reduce the Partnership’s remaining commitment to the underlying funds or co-investments.
5 Represents the most recent available valuation. 6 Represents non-recallable returns of capital, interest, gains and dividend proceeds received from the investments. Amounts may be inclusive of escrow proceeds receivable. 7 Represents the Market Value plus distributions. 8 Represents the Total Value divided by the funded amount. TVMs are net of underlying funds fees and expenses but do not include GCM Grosvenor fees and expenses. 9 The IRR is as of September 30, 2016. IRRs are net of underlying funds fees and expenses but do not include GCM Grosvenor fees and expenses. Performance information for
underlying investments with less than 365 days of cash flows has been calculated using a periodic IRR while information for underlying investments and underlying investment with more than 365 days of cash flows has been calculated using an annualized IRR.
Asset Class Geography Commitment
Funded
Amount4
% Funded
Remaining
Commitment
Market
Value5
Distributions6
Total
Value7
TVM8
IRR9
Co-Investment United States $4.3 $4.3 100.1% $0.0 $6.0 $2.3 $8.3 1.93x 79.9%
Asset Class Geography Commitment
Funded
Amount4
% Funded
Remaining
Commitment
Market
Value5
Distributions6
Total
Value7
TVM8
IRR9
Co-Investment United States $2.7 $2.0 75.0% $0.0 $3.9 $0.0 $3.9 1.95x 18.1%
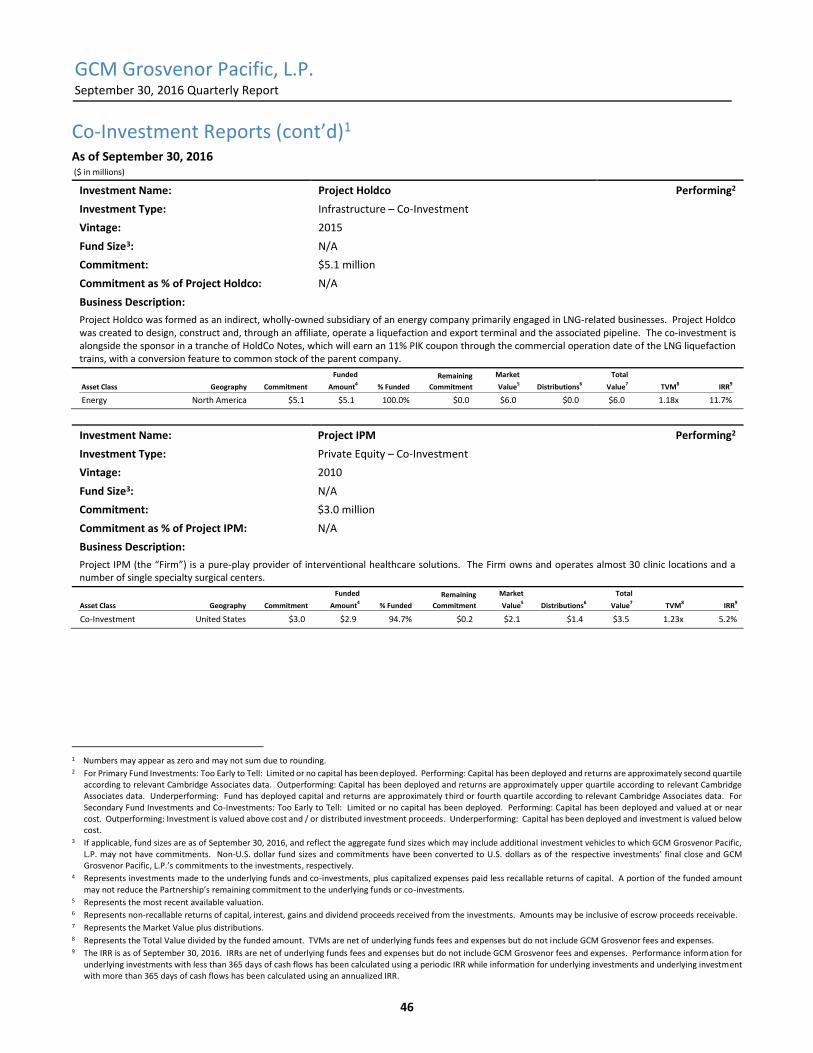
GCM Grosvenor Pacific, L.P. September 30, 2016 Quarterly Report
46
Co-Investment Reports (cont’d)1 As of September 30, 2016 ($ in millions)
Investment Name: Project Holdco Performing2
Investment Type: Infrastructure – Co-Investment
Vintage: 2015
Fund Size3: N/A
Commitment: $5.1 million
Commitment as % of Project Holdco: N/A
Business Description:
Project Holdco was formed as an indirect, wholly-owned subsidiary of an energy company primarily engaged in LNG-related businesses. Project Holdco was created to design, construct and, through an affiliate, operate a liquefaction and export terminal and the associated pipeline. The co-investment is alongside the sponsor in a tranche of HoldCo Notes, which will earn an 11% PIK coupon through the commercial operation date of the LNG liquefaction trains, with a conversion feature to common stock of the parent company.
Investment Name: Project IPM Performing2
Investment Type: Private Equity – Co-Investment
Vintage: 2010
Fund Size3: N/A
Commitment: $3.0 million
Commitment as % of Project IPM: N/A
Business Description:
Project IPM (the “Firm”) is a pure-play provider of interventional healthcare solutions. The Firm owns and operates almost 30 clinic locations and a number of single specialty surgical centers.
1 Numbers may appear as zero and may not sum due to rounding. 2 For Primary Fund Investments: Too Early to Tell: Limited or no capital has been deployed. Performing: Capital has been deployed and returns are approximately second quartile
according to relevant Cambridge Associates data. Outperforming: Capital has been deployed and returns are approximately upper quartile according to relevant Cambridge Associates data. Underperforming: Fund has deployed capital and returns are approximately third or fourth quartile according to relevant Cambridge Associates data. For Secondary Fund Investments and Co-Investments: Too Early to Tell: Limited or no capital has been deployed. Performing: Capital has been deployed and valued at or near cost. Outperforming: Investment is valued above cost and / or distributed investment proceeds. Underperforming: Capital has been deployed and investment is valued below cost.
3 If applicable, fund sizes are as of September 30, 2016, and reflect the aggregate fund sizes which may include additional investment vehicles to which GCM Grosvenor Pacific, L.P. may not have commitments. Non-U.S. dollar fund sizes and commitments have been converted to U.S. dollars as of the respective investments’ final close and GCM Grosvenor Pacific, L.P.’s commitments to the investments, respectively.
4 Represents investments made to the underlying funds and co-investments, plus capitalized expenses paid less recallable returns of capital. A portion of the funded amount may not reduce the Partnership’s remaining commitment to the underlying funds or co-investments.
5 Represents the most recent available valuation. 6 Represents non-recallable returns of capital, interest, gains and dividend proceeds received from the investments. Amounts may be inclusive of escrow proceeds receivable. 7 Represents the Market Value plus distributions. 8 Represents the Total Value divided by the funded amount. TVMs are net of underlying funds fees and expenses but do not include GCM Grosvenor fees and expenses. 9 The IRR is as of September 30, 2016. IRRs are net of underlying funds fees and expenses but do not include GCM Grosvenor fees and expenses. Performance information for
underlying investments with less than 365 days of cash flows has been calculated using a periodic IRR while information for underlying investments and underlying investment with more than 365 days of cash flows has been calculated using an annualized IRR.
Asset Class Geography Commitment
Funded
Amount4 % Funded
Remaining
Commitment
Market
Value5 Distributions6
Total
Value7 TVM8 IRR9
Energy North America $5.1 $5.1 100.0% $0.0 $6.0 $0.0 $6.0 1.18x 11.7%
Asset Class Geography Commitment
Funded
Amount4
% Funded
Remaining
Commitment
Market
Value5
Distributions6
Total
Value7
TVM8
IRR9
Co-Investment United States $3.0 $2.9 94.7% $0.2 $2.1 $1.4 $3.5 1.23x 5.2%
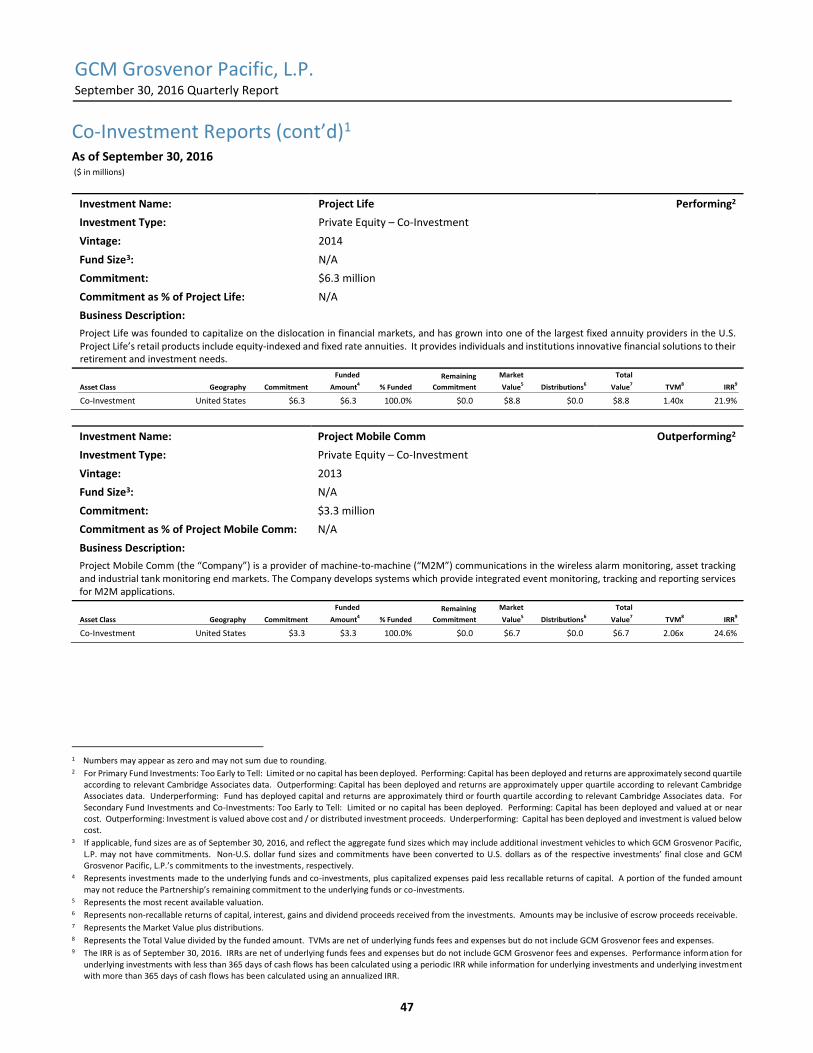
GCM Grosvenor Pacific, L.P. September 30, 2016 Quarterly Report
47
Co-Investment Reports (cont’d)1 As of September 30, 2016 ($ in millions)
Investment Name: Project Life Performing2
Investment Type: Private Equity – Co-Investment
Vintage: 2014
Fund Size3: N/A
Commitment: $6.3 million
Commitment as % of Project Life: N/A
Business Description:
Project Life was founded to capitalize on the dislocation in financial markets, and has grown into one of the largest fixed annuity providers in the U.S. Project Life’s retail products include equity-indexed and fixed rate annuities. It provides individuals and institutions innovative financial solutions to their retirement and investment needs.
Investment Name: Project Mobile Comm Outperforming2
Investment Type: Private Equity – Co-Investment
Vintage: 2013
Fund Size3: N/A
Commitment: $3.3 million
Commitment as % of Project Mobile Comm: N/A
Business Description:
Project Mobile Comm (the “Company”) is a provider of machine-to-machine (“M2M”) communications in the wireless alarm monitoring, asset tracking and industrial tank monitoring end markets. The Company develops systems which provide integrated event monitoring, tracking and reporting services for M2M applications.
1 Numbers may appear as zero and may not sum due to rounding. 2 For Primary Fund Investments: Too Early to Tell: Limited or no capital has been deployed. Performing: Capital has been deployed and returns are approximately second quartile
according to relevant Cambridge Associates data. Outperforming: Capital has been deployed and returns are approximately upper quartile according to relevant Cambridge Associates data. Underperforming: Fund has deployed capital and returns are approximately third or fourth quartile according to relevant Cambridge Associates data. For Secondary Fund Investments and Co-Investments: Too Early to Tell: Limited or no capital has been deployed. Performing: Capital has been deployed and valued at or near cost. Outperforming: Investment is valued above cost and / or distributed investment proceeds. Underperforming: Capital has been deployed and investment is valued below cost.
3 If applicable, fund sizes are as of September 30, 2016, and reflect the aggregate fund sizes which may include additional investment vehicles to which GCM Grosvenor Pacific, L.P. may not have commitments. Non-U.S. dollar fund sizes and commitments have been converted to U.S. dollars as of the respective investments’ final close and GCM Grosvenor Pacific, L.P.’s commitments to the investments, respectively.
4 Represents investments made to the underlying funds and co-investments, plus capitalized expenses paid less recallable returns of capital. A portion of the funded amount may not reduce the Partnership’s remaining commitment to the underlying funds or co-investments.
5 Represents the most recent available valuation. 6 Represents non-recallable returns of capital, interest, gains and dividend proceeds received from the investments. Amounts may be inclusive of escrow proceeds receivable. 7 Represents the Market Value plus distributions. 8 Represents the Total Value divided by the funded amount. TVMs are net of underlying funds fees and expenses but do not include GCM Grosvenor fees and expenses. 9 The IRR is as of September 30, 2016. IRRs are net of underlying funds fees and expenses but do not include GCM Grosvenor fees and expenses. Performance information for
underlying investments with less than 365 days of cash flows has been calculated using a periodic IRR while information for underlying investments and underlying investment with more than 365 days of cash flows has been calculated using an annualized IRR.
Asset Class Geography Commitment
Funded
Amount4
% Funded
Remaining
Commitment
Market
Value5
Distributions6
Total
Value7
TVM8
IRR9
Co-Investment United States $6.3 $6.3 100.0% $0.0 $8.8 $0.0 $8.8 1.40x 21.9%
Asset Class Geography Commitment
Funded
Amount4
% Funded
Remaining
Commitment
Market
Value5
Distributions6
Total
Value7
TVM8
IRR9
Co-Investment United States $3.3 $3.3 100.0% $0.0 $6.7 $0.0 $6.7 2.06x 24.6%
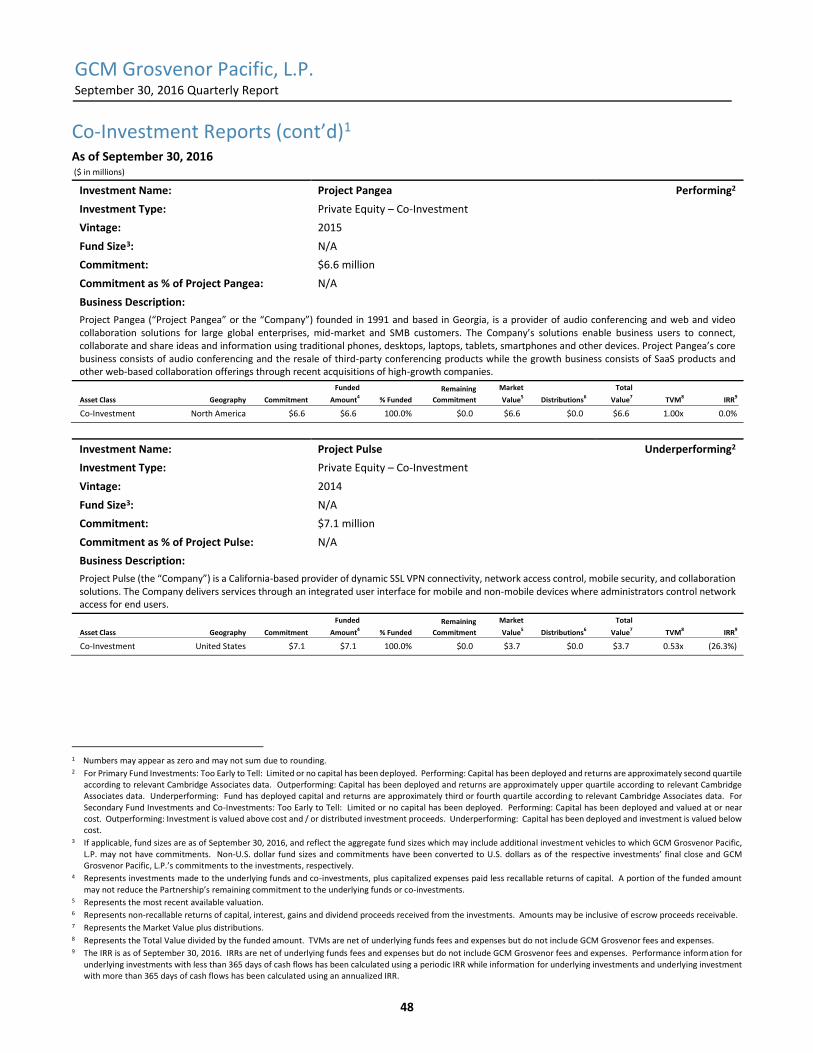
GCM Grosvenor Pacific, L.P. September 30, 2016 Quarterly Report
48
Co-Investment Reports (cont’d)1 As of September 30, 2016 ($ in millions)
Investment Name: Project Pangea Performing2
Investment Type: Private Equity – Co-Investment
Vintage: 2015
Fund Size3: N/A
Commitment: $6.6 million
Commitment as % of Project Pangea: N/A
Business Description:
Project Pangea (“Project Pangea” or the “Company”) founded in 1991 and based in Georgia, is a provider of audio conferencing and web and video collaboration solutions for large global enterprises, mid-market and SMB customers. The Company’s solutions enable business users to connect, collaborate and share ideas and information using traditional phones, desktops, laptops, tablets, smartphones and other devices. Project Pangea’s core business consists of audio conferencing and the resale of third-party conferencing products while the growth business consists of SaaS products and other web-based collaboration offerings through recent acquisitions of high-growth companies.
Investment Name: Project Pulse Underperforming2
Investment Type: Private Equity – Co-Investment
Vintage: 2014
Fund Size3: N/A
Commitment: $7.1 million
Commitment as % of Project Pulse: N/A
Business Description:
Project Pulse (the “Company”) is a California-based provider of dynamic SSL VPN connectivity, network access control, mobile security, and collaboration solutions. The Company delivers services through an integrated user interface for mobile and non-mobile devices where administrators control network access for end users.
1 Numbers may appear as zero and may not sum due to rounding. 2 For Primary Fund Investments: Too Early to Tell: Limited or no capital has been deployed. Performing: Capital has been deployed and returns are approximately second quartile
according to relevant Cambridge Associates data. Outperforming: Capital has been deployed and returns are approximately upper quartile according to relevant Cambridge Associates data. Underperforming: Fund has deployed capital and returns are approximately third or fourth quartile according to relevant Cambridge Associates data. For Secondary Fund Investments and Co-Investments: Too Early to Tell: Limited or no capital has been deployed. Performing: Capital has been deployed and valued at or near cost. Outperforming: Investment is valued above cost and / or distributed investment proceeds. Underperforming: Capital has been deployed and investment is valued below cost.
3 If applicable, fund sizes are as of September 30, 2016, and reflect the aggregate fund sizes which may include additional investment vehicles to which GCM Grosvenor Pacific, L.P. may not have commitments. Non-U.S. dollar fund sizes and commitments have been converted to U.S. dollars as of the respective investments’ final close and GCM Grosvenor Pacific, L.P.’s commitments to the investments, respectively.
4 Represents investments made to the underlying funds and co-investments, plus capitalized expenses paid less recallable returns of capital. A portion of the funded amount may not reduce the Partnership’s remaining commitment to the underlying funds or co-investments.
5 Represents the most recent available valuation. 6 Represents non-recallable returns of capital, interest, gains and dividend proceeds received from the investments. Amounts may be inclusive of escrow proceeds receivable. 7 Represents the Market Value plus distributions. 8 Represents the Total Value divided by the funded amount. TVMs are net of underlying funds fees and expenses but do not include GCM Grosvenor fees and expenses. 9 The IRR is as of September 30, 2016. IRRs are net of underlying funds fees and expenses but do not include GCM Grosvenor fees and expenses. Performance information for
underlying investments with less than 365 days of cash flows has been calculated using a periodic IRR while information for underlying investments and underlying investment with more than 365 days of cash flows has been calculated using an annualized IRR.
Asset Class Geography Commitment
Funded
Amount4
% Funded
Remaining
Commitment
Market
Value5
Distributions6
Total
Value7
TVM8
IRR9
Co-Investment North America $6.6 $6.6 100.0% $0.0 $6.6 $0.0 $6.6 1.00x 0.0%
Asset Class Geography Commitment
Funded
Amount4
% Funded
Remaining
Commitment
Market
Value5
Distributions6
Total
Value7
TVM8
IRR9
Co-Investment United States $7.1 $7.1 100.0% $0.0 $3.7 $0.0 $3.7 0.53x (26.3%)
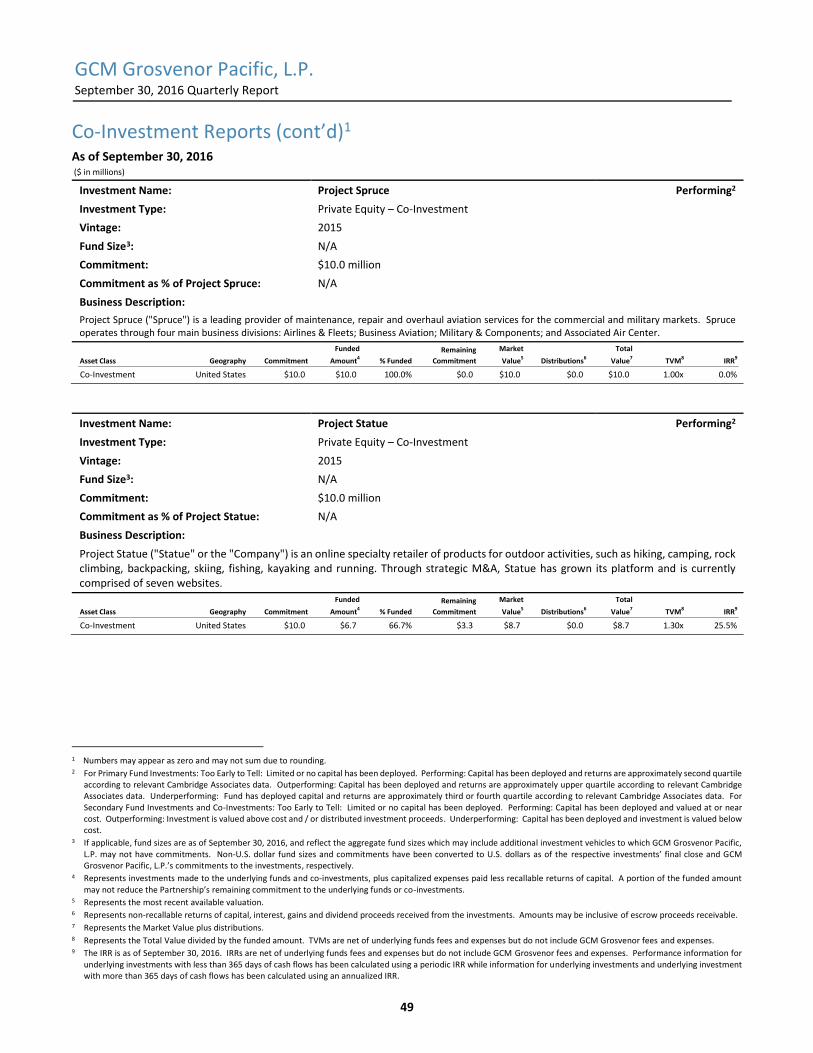
GCM Grosvenor Pacific, L.P. September 30, 2016 Quarterly Report
49
Co-Investment Reports (cont’d)1 As of September 30, 2016 ($ in millions)
Investment Name: Project Spruce Performing2
Investment Type: Private Equity – Co-Investment
Vintage: 2015
Fund Size3: N/A
Commitment: $10.0 million
Commitment as % of Project Spruce: N/A
Business Description:
Project Spruce ("Spruce") is a leading provider of maintenance, repair and overhaul aviation services for the commercial and military markets. Spruce operates through four main business divisions: Airlines & Fleets; Business Aviation; Military & Components; and Associated Air Center.
Investment Name: Project Statue Performing2
Investment Type: Private Equity – Co-Investment
Vintage: 2015
Fund Size3: N/A
Commitment: $10.0 million
Commitment as % of Project Statue: N/A
Business Description:
Project Statue ("Statue" or the "Company") is an online specialty retailer of products for outdoor activities, such as hiking, camping, rock climbing, backpacking, skiing, fishing, kayaking and running. Through strategic M&A, Statue has grown its platform and is currently comprised of seven websites.
1 Numbers may appear as zero and may not sum due to rounding. 2 For Primary Fund Investments: Too Early to Tell: Limited or no capital has been deployed. Performing: Capital has been deployed and returns are approximately second quartile
according to relevant Cambridge Associates data. Outperforming: Capital has been deployed and returns are approximately upper quartile according to relevant Cambridge Associates data. Underperforming: Fund has deployed capital and returns are approximately third or fourth quartile according to relevant Cambridge Associates data. For Secondary Fund Investments and Co-Investments: Too Early to Tell: Limited or no capital has been deployed. Performing: Capital has been deployed and valued at or near cost. Outperforming: Investment is valued above cost and / or distributed investment proceeds. Underperforming: Capital has been deployed and investment is valued below cost.
3 If applicable, fund sizes are as of September 30, 2016, and reflect the aggregate fund sizes which may include additional investment vehicles to which GCM Grosvenor Pacific, L.P. may not have commitments. Non-U.S. dollar fund sizes and commitments have been converted to U.S. dollars as of the respective investments’ final close and GCM Grosvenor Pacific, L.P.’s commitments to the investments, respectively.
4 Represents investments made to the underlying funds and co-investments, plus capitalized expenses paid less recallable returns of capital. A portion of the funded amount may not reduce the Partnership’s remaining commitment to the underlying funds or co-investments.
5 Represents the most recent available valuation. 6 Represents non-recallable returns of capital, interest, gains and dividend proceeds received from the investments. Amounts may be inclusive of escrow proceeds receivable. 7 Represents the Market Value plus distributions. 8 Represents the Total Value divided by the funded amount. TVMs are net of underlying funds fees and expenses but do not include GCM Grosvenor fees and expenses. 9 The IRR is as of September 30, 2016. IRRs are net of underlying funds fees and expenses but do not include GCM Grosvenor fees and expenses. Performance information for
underlying investments with less than 365 days of cash flows has been calculated using a periodic IRR while information for underlying investments and underlying investment with more than 365 days of cash flows has been calculated using an annualized IRR.
Asset Class Geography Commitment
Funded
Amount4
% Funded
Remaining
Commitment
Market
Value5
Distributions6
Total
Value7
TVM8
IRR9
Co-Investment United States $10.0 $10.0 100.0% $0.0 $10.0 $0.0 $10.0 1.00x 0.0%
Asset Class Geography Commitment
Funded
Amount4
% Funded
Remaining
Commitment
Market
Value5
Distributions6
Total
Value7
TVM8
IRR9
Co-Investment United States $10.0 $6.7 66.7% $3.3 $8.7 $0.0 $8.7 1.30x 25.5%
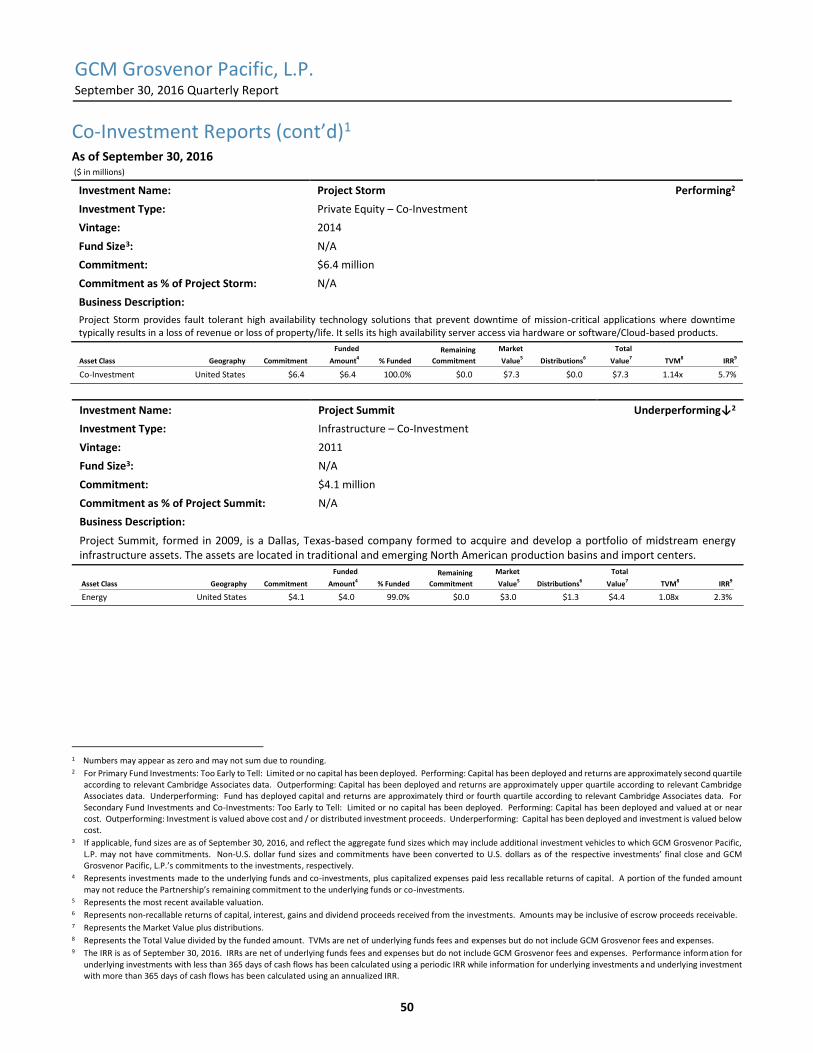
GCM Grosvenor Pacific, L.P. September 30, 2016 Quarterly Report
50
Co-Investment Reports (cont’d)1 As of September 30, 2016 ($ in millions)
Investment Name: Project Storm Performing2
Investment Type: Private Equity – Co-Investment
Vintage: 2014
Fund Size3: N/A
Commitment: $6.4 million
Commitment as % of Project Storm: N/A
Business Description:
Project Storm provides fault tolerant high availability technology solutions that prevent downtime of mission-critical applications where downtime typically results in a loss of revenue or loss of property/life. It sells its high availability server access via hardware or software/Cloud-based products.
Investment Name: Project Summit Underperforming↓2
Investment Type: Infrastructure – Co-Investment
Vintage: 2011
Fund Size3: N/A
Commitment: $4.1 million
Commitment as % of Project Summit: N/A
Business Description:
Project Summit, formed in 2009, is a Dallas, Texas-based company formed to acquire and develop a portfolio of midstream energy infrastructure assets. The assets are located in traditional and emerging North American production basins and import centers.
1 Numbers may appear as zero and may not sum due to rounding. 2 For Primary Fund Investments: Too Early to Tell: Limited or no capital has been deployed. Performing: Capital has been deployed and returns are approximately second quartile
according to relevant Cambridge Associates data. Outperforming: Capital has been deployed and returns are approximately upper quartile according to relevant Cambridge Associates data. Underperforming: Fund has deployed capital and returns are approximately third or fourth quartile according to relevant Cambridge Associates data. For Secondary Fund Investments and Co-Investments: Too Early to Tell: Limited or no capital has been deployed. Performing: Capital has been deployed and valued at or near cost. Outperforming: Investment is valued above cost and / or distributed investment proceeds. Underperforming: Capital has been deployed and investment is valued below cost.
3 If applicable, fund sizes are as of September 30, 2016, and reflect the aggregate fund sizes which may include additional investment vehicles to which GCM Grosvenor Pacific, L.P. may not have commitments. Non-U.S. dollar fund sizes and commitments have been converted to U.S. dollars as of the respective investments’ final close and GCM Grosvenor Pacific, L.P.’s commitments to the investments, respectively.
4 Represents investments made to the underlying funds and co-investments, plus capitalized expenses paid less recallable returns of capital. A portion of the funded amount may not reduce the Partnership’s remaining commitment to the underlying funds or co-investments.
5 Represents the most recent available valuation. 6 Represents non-recallable returns of capital, interest, gains and dividend proceeds received from the investments. Amounts may be inclusive of escrow proceeds receivable. 7 Represents the Market Value plus distributions. 8 Represents the Total Value divided by the funded amount. TVMs are net of underlying funds fees and expenses but do not include GCM Grosvenor fees and expenses. 9 The IRR is as of September 30, 2016. IRRs are net of underlying funds fees and expenses but do not include GCM Grosvenor fees and expenses. Performance information for
underlying investments with less than 365 days of cash flows has been calculated using a periodic IRR while information for underlying investments and underlying investment with more than 365 days of cash flows has been calculated using an annualized IRR.
Asset Class Geography Commitment
Funded
Amount4
% Funded
Remaining
Commitment
Market
Value5
Distributions6
Total
Value7
TVM8
IRR9
Co-Investment United States $6.4 $6.4 100.0% $0.0 $7.3 $0.0 $7.3 1.14x 5.7%
Asset Class Geography Commitment
Funded
Amount4 % Funded
Remaining
Commitment
Market
Value5 Distributions6
Total
Value7 TVM8 IRR9
Energy United States $4.1 $4.0 99.0% $0.0 $3.0 $1.3 $4.4 1.08x 2.3%
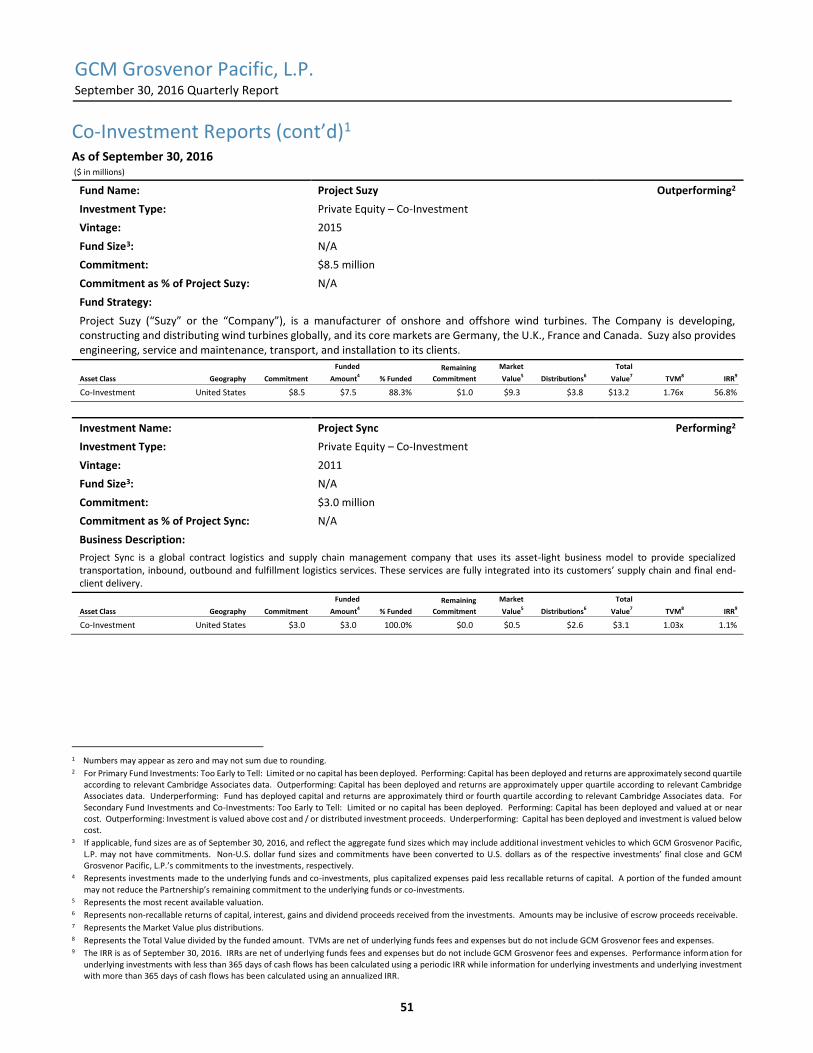
GCM Grosvenor Pacific, L.P. September 30, 2016 Quarterly Report
51
Co-Investment Reports (cont’d)1 As of September 30, 2016 ($ in millions)
Fund Name: Project Suzy Outperforming2
Investment Type: Private Equity – Co-Investment
Vintage: 2015
Fund Size3: N/A
Commitment: $8.5 million
Commitment as % of Project Suzy: N/A
Fund Strategy:
Project Suzy (“Suzy” or the “Company”), is a manufacturer of onshore and offshore wind turbines. The Company is developing, constructing and distributing wind turbines globally, and its core markets are Germany, the U.K., France and Canada. Suzy also provides engineering, service and maintenance, transport, and installation to its clients.
Investment Name: Project Sync Performing2
Investment Type: Private Equity – Co-Investment
Vintage: 2011
Fund Size3: N/A
Commitment: $3.0 million
Commitment as % of Project Sync: N/A
Business Description:
Project Sync is a global contract logistics and supply chain management company that uses its asset-light business model to provide specialized transportation, inbound, outbound and fulfillment logistics services. These services are fully integrated into its customers’ supply chain and final end-client delivery.
1 Numbers may appear as zero and may not sum due to rounding. 2 For Primary Fund Investments: Too Early to Tell: Limited or no capital has been deployed. Performing: Capital has been deployed and returns are approximately second quartile
according to relevant Cambridge Associates data. Outperforming: Capital has been deployed and returns are approximately upper quartile according to relevant Cambridge Associates data. Underperforming: Fund has deployed capital and returns are approximately third or fourth quartile according to relevant Cambridge Associates data. For Secondary Fund Investments and Co-Investments: Too Early to Tell: Limited or no capital has been deployed. Performing: Capital has been deployed and valued at or near cost. Outperforming: Investment is valued above cost and / or distributed investment proceeds. Underperforming: Capital has been deployed and investment is valued below cost.
3 If applicable, fund sizes are as of September 30, 2016, and reflect the aggregate fund sizes which may include additional investment vehicles to which GCM Grosvenor Pacific, L.P. may not have commitments. Non-U.S. dollar fund sizes and commitments have been converted to U.S. dollars as of the respective investments’ final close and GCM Grosvenor Pacific, L.P.’s commitments to the investments, respectively.
4 Represents investments made to the underlying funds and co-investments, plus capitalized expenses paid less recallable returns of capital. A portion of the funded amount may not reduce the Partnership’s remaining commitment to the underlying funds or co-investments.
5 Represents the most recent available valuation. 6 Represents non-recallable returns of capital, interest, gains and dividend proceeds received from the investments. Amounts may be inclusive of escrow proceeds receivable. 7 Represents the Market Value plus distributions. 8 Represents the Total Value divided by the funded amount. TVMs are net of underlying funds fees and expenses but do not include GCM Grosvenor fees and expenses. 9 The IRR is as of September 30, 2016. IRRs are net of underlying funds fees and expenses but do not include GCM Grosvenor fees and expenses. Performance information for
underlying investments with less than 365 days of cash flows has been calculated using a periodic IRR while information for underlying investments and underlying investment with more than 365 days of cash flows has been calculated using an annualized IRR.
Asset Class Geography Commitment
Funded
Amount4
% Funded
Remaining
Commitment
Market
Value5
Distributions6
Total
Value7
TVM8
IRR9
Co-Investment United States $8.5 $7.5 88.3% $1.0 $9.3 $3.8 $13.2 1.76x 56.8%
Asset Class Geography Commitment
Funded
Amount4
% Funded
Remaining
Commitment
Market
Value5
Distributions6
Total
Value7
TVM8
IRR9
Co-Investment United States $3.0 $3.0 100.0% $0.0 $0.5 $2.6 $3.1 1.03x 1.1%
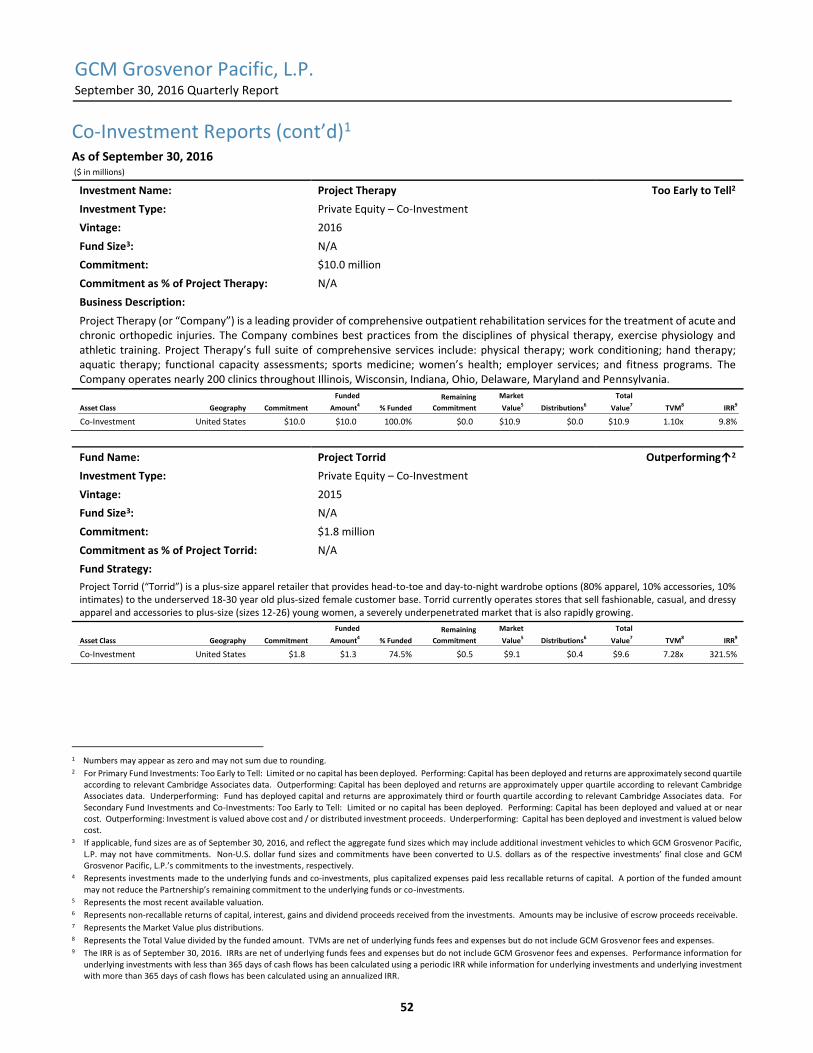
GCM Grosvenor Pacific, L.P. September 30, 2016 Quarterly Report
52
Co-Investment Reports (cont’d)1 As of September 30, 2016 ($ in millions)
Investment Name: Project Therapy Too Early to Tell2
Investment Type: Private Equity – Co-Investment
Vintage: 2016
Fund Size3: N/A
Commitment: $10.0 million
Commitment as % of Project Therapy: N/A
Business Description:
Project Therapy (or “Company”) is a leading provider of comprehensive outpatient rehabilitation services for the treatment of acute and chronic orthopedic injuries. The Company combines best practices from the disciplines of physical therapy, exercise physiology and athletic training. Project Therapy’s full suite of comprehensive services include: physical therapy; work conditioning; hand therapy; aquatic therapy; functional capacity assessments; sports medicine; women’s health; employer services; and fitness programs. The Company operates nearly 200 clinics throughout Illinois, Wisconsin, Indiana, Ohio, Delaware, Maryland and Pennsylvania.
Fund Name: Project Torrid Outperforming↑2
Investment Type: Private Equity – Co-Investment
Vintage: 2015
Fund Size3: N/A
Commitment: $1.8 million
Commitment as % of Project Torrid: N/A
Fund Strategy:
Project Torrid (“Torrid”) is a plus-size apparel retailer that provides head-to-toe and day-to-night wardrobe options (80% apparel, 10% accessories, 10% intimates) to the underserved 18-30 year old plus-sized female customer base. Torrid currently operates stores that sell fashionable, casual, and dressy apparel and accessories to plus-size (sizes 12-26) young women, a severely underpenetrated market that is also rapidly growing.
1 Numbers may appear as zero and may not sum due to rounding. 2 For Primary Fund Investments: Too Early to Tell: Limited or no capital has been deployed. Performing: Capital has been deployed and returns are approximately second quartile
according to relevant Cambridge Associates data. Outperforming: Capital has been deployed and returns are approximately upper quartile according to relevant Cambridge Associates data. Underperforming: Fund has deployed capital and returns are approximately third or fourth quartile according to relevant Cambridge Associates data. For Secondary Fund Investments and Co-Investments: Too Early to Tell: Limited or no capital has been deployed. Performing: Capital has been deployed and valued at or near cost. Outperforming: Investment is valued above cost and / or distributed investment proceeds. Underperforming: Capital has been deployed and investment is valued below cost.
3 If applicable, fund sizes are as of September 30, 2016, and reflect the aggregate fund sizes which may include additional investment vehicles to which GCM Grosvenor Pacific, L.P. may not have commitments. Non-U.S. dollar fund sizes and commitments have been converted to U.S. dollars as of the respective investments’ final close and GCM Grosvenor Pacific, L.P.’s commitments to the investments, respectively.
4 Represents investments made to the underlying funds and co-investments, plus capitalized expenses paid less recallable returns of capital. A portion of the funded amount may not reduce the Partnership’s remaining commitment to the underlying funds or co-investments.
5 Represents the most recent available valuation. 6 Represents non-recallable returns of capital, interest, gains and dividend proceeds received from the investments. Amounts may be inclusive of escrow proceeds receivable. 7 Represents the Market Value plus distributions. 8 Represents the Total Value divided by the funded amount. TVMs are net of underlying funds fees and expenses but do not include GCM Grosvenor fees and expenses. 9 The IRR is as of September 30, 2016. IRRs are net of underlying funds fees and expenses but do not include GCM Grosvenor fees and expenses. Performance information for
underlying investments with less than 365 days of cash flows has been calculated using a periodic IRR while information for underlying investments and underlying investment with more than 365 days of cash flows has been calculated using an annualized IRR.
Asset Class Geography Commitment
Funded
Amount4
% Funded
Remaining
Commitment
Market
Value5
Distributions6
Total
Value7
TVM8
IRR9
Co-Investment United States $10.0 $10.0 100.0% $0.0 $10.9 $0.0 $10.9 1.10x 9.8%
Asset Class Geography Commitment
Funded
Amount4
% Funded
Remaining
Commitment
Market
Value5
Distributions6
Total
Value7
TVM8
IRR9
Co-Investment United States $1.8 $1.3 74.5% $0.5 $9.1 $0.4 $9.6 7.28x 321.5%
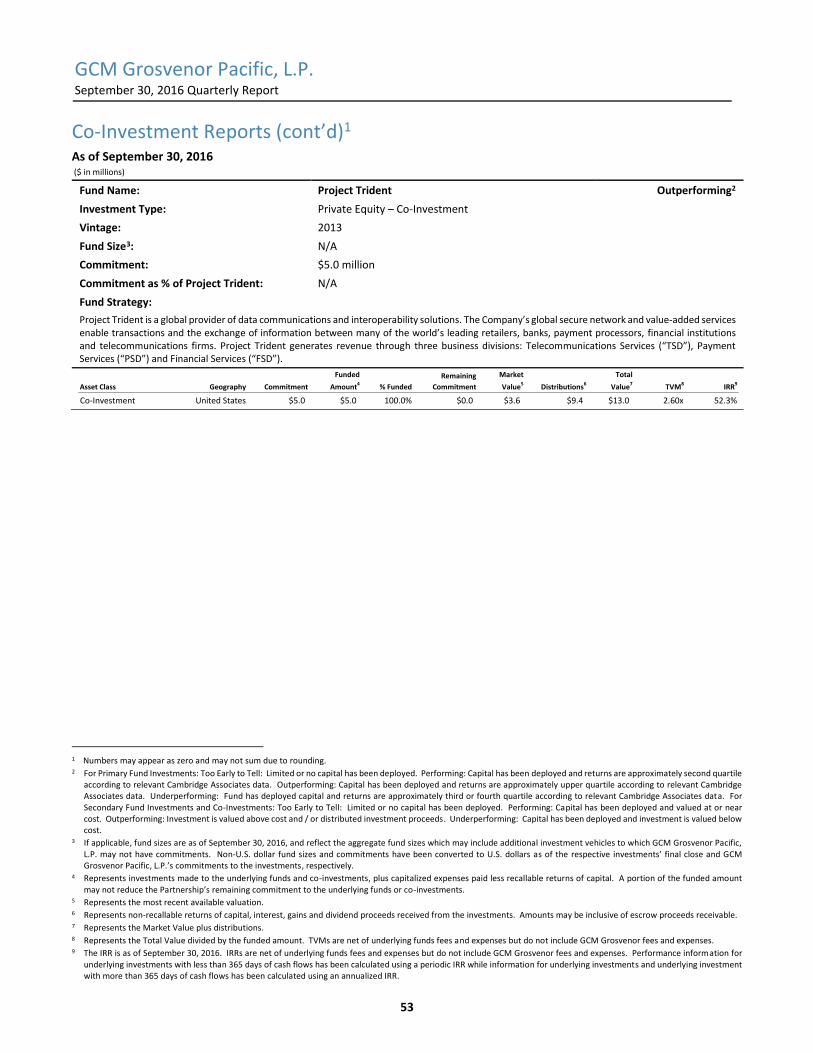
GCM Grosvenor Pacific, L.P. September 30, 2016 Quarterly Report
53
Co-Investment Reports (cont’d)1 As of September 30, 2016 ($ in millions)
Fund Name: Project Trident Outperforming2
Investment Type: Private Equity – Co-Investment
Vintage: 2013
Fund Size3: N/A
Commitment: $5.0 million
Commitment as % of Project Trident: N/A
Fund Strategy:
Project Trident is a global provider of data communications and interoperability solutions. The Company’s global secure network and value-added services enable transactions and the exchange of information between many of the world’s leading retailers, banks, payment processors, financial institutions and telecommunications firms. Project Trident generates revenue through three business divisions: Telecommunications Services (“TSD”), Payment Services (“PSD”) and Financial Services (“FSD”).
1 Numbers may appear as zero and may not sum due to rounding. 2 For Primary Fund Investments: Too Early to Tell: Limited or no capital has been deployed. Performing: Capital has been deployed and returns are approximately second quartile
according to relevant Cambridge Associates data. Outperforming: Capital has been deployed and returns are approximately upper quartile according to relevant Cambridge Associates data. Underperforming: Fund has deployed capital and returns are approximately third or fourth quartile according to relevant Cambridge Associates data. For Secondary Fund Investments and Co-Investments: Too Early to Tell: Limited or no capital has been deployed. Performing: Capital has been deployed and valued at or near cost. Outperforming: Investment is valued above cost and / or distributed investment proceeds. Underperforming: Capital has been deployed and investment is valued below cost.
3 If applicable, fund sizes are as of September 30, 2016, and reflect the aggregate fund sizes which may include additional investment vehicles to which GCM Grosvenor Pacific, L.P. may not have commitments. Non-U.S. dollar fund sizes and commitments have been converted to U.S. dollars as of the respective investments’ final close and GCM Grosvenor Pacific, L.P.’s commitments to the investments, respectively.
4 Represents investments made to the underlying funds and co-investments, plus capitalized expenses paid less recallable returns of capital. A portion of the funded amount may not reduce the Partnership’s remaining commitment to the underlying funds or co-investments.
5 Represents the most recent available valuation. 6 Represents non-recallable returns of capital, interest, gains and dividend proceeds received from the investments. Amounts may be inclusive of escrow proceeds receivable. 7 Represents the Market Value plus distributions. 8 Represents the Total Value divided by the funded amount. TVMs are net of underlying funds fees and expenses but do not include GCM Grosvenor fees and expenses. 9 The IRR is as of September 30, 2016. IRRs are net of underlying funds fees and expenses but do not include GCM Grosvenor fees and expenses. Performance information for
underlying investments with less than 365 days of cash flows has been calculated using a periodic IRR while information for underlying investments and underlying investment with more than 365 days of cash flows has been calculated using an annualized IRR.
Asset Class Geography Commitment
Funded
Amount4
% Funded
Remaining
Commitment
Market
Value5
Distributions6
Total
Value7
TVM8
IRR9
Co-Investment United States $5.0 $5.0 100.0% $0.0 $3.6 $9.4 $13.0 2.60x 52.3%
GCM Grosvenor Pacific, L.P. September 30, 2016 Quarterly Report
54
Notes & Disclosures This report is being provided by Grosvenor Capital Management, L.P. (“GCM Grosvenor Public Markets”) and/or GCM Customized Fund Investment Group, L.P. (“GCM Grosvenor Private Markets,” and together with GCM Grosvenor Public Markets and their affiliates, “GCM Grosvenor”). GCM Grosvenor Public Markets and its predecessors have been managing hedge fund investment portfolios on behalf of clients since 1971. GCM Grosvenor Private Markets, whose predecessors have been managing private equity, real estate, and infrastructure investment portfolios since 1999, 2002, and 2003, respectively, is the successor entity to the Customized Fund Investment Group that was previously a business unit within the asset management division of Credit Suisse Group AG (“Credit Suisse”). On January 2, 2014, GCM Grosvenor Private Markets acquired certain clients and assets, and hired certain employees previously associated with the Customized Fund Investment Group from affiliates of Credit Suisse. Data and other information related to GCM Grosvenor Private Markets for periods prior to January 2, 2014 relate to predecessors of GCM Grosvenor Private Markets. While GCM Grosvenor Public Markets and GCM Grosvenor Private Markets share certain operational infrastructure, each has its own investment team and investment process. GCM Grosvenor has implemented information barriers between the investment teams of GCM Grosvenor Public Markets and GCM Grosvenor Private Markets that prevent the sharing of certain investment information between the two business units. Additionally, neither GCM Grosvenor Public Markets nor GCM Grosvenor Private Markets is under any obligation to share with the other business unit (or the clients of the other business unit) any investment opportunities it identifies.
The information contained in this report (“GCM Information”) relates to GCM Grosvenor Private Markets, to one or more investment vehicles/accounts managed or advised GCM Grosvenor Private Markets (“GCM Private Markets Funds”) and/or to one or more investment vehicles/accounts (“Underlying Funds”) managed or advised by third-party investment management firms (“Investment Managers”). GCM Information is general in nature and does not take into account any investor’s particular circumstances. GCM Information is neither an offer to sell, nor a solicitation of an offer to buy, an interest in any GCM Private Markets Fund. Any offer to sell or solicitation of an offer to buy an interest in a GCM Private Markets Fund must be accompanied by such GCM Private Markets Fund’s current confidential offering or risk disclosure document (“Fund Document”). Except as specifically agreed, neither GCM Grosvenor nor any of its affiliates act as agent/broker for prospective investors. An investor must rely on its own examination in identifying and assessing the merits and risks of investing in a GCM Private Markets Fund or Underlying Fund (together, “Investment Products”). Each GCM Private Markets Fund invests in Underlying Funds and/or in securities or other assets that may be sponsored or identified by Investment Managers.
PAST PERFORMANCE IS NOT NECESSARILY INDICATIVE OF FUTURE RESULTS, AND THE PERFORMANCE OF EACH INVESTMENT PRODUCT COULD BE VOLATILE. AN INVESTMENT IN AN INVESTMENT PRODUCT IS SPECULATIVE AND INVOLVES SUBSTANTIAL RISK (INCLUDING THE POSSIBLE LOSS OF THE ENTIRE INVESTMENT). NO ASSURANCE CAN BE GIVEN THAT ANY INVESTMENT PRODUCT WILL ACHIEVE ITS OBJECTIVES OR AVOID SIGNIFICANT LOSSES.
By your acceptance of GCM Information, you understand, acknowledge, and agree that GCM Information is confidential and proprietary, and you may not copy, transmit or distribute GCM Information, or any data or other information contained therein, or authorize such actions by others, without GCM Grosvenor’s express prior written consent, except that you may share GCM Information with your professional advisors. If you are a professional financial adviser, you may share GCM Information with those of your clients that you reasonably determine to be eligible to invest in the relevant Investment Product (GCM Grosvenor assumes no responsibility with respect to GCM Information shared that is presented in a format different from this report). Any violation of the above may constitute a breach of contract and applicable copyright laws. In addition you (i) acknowledge that you may receive material nonpublic information relating to particular securities or other financial instruments and/or the issuers thereof; (ii) acknowledge that you are aware that applicable securities laws prohibit any person who has received material, nonpublic information regarding particular securities and/or an the issuer thereof from (a) purchasing or selling such securities or other securities of such issuer or (b) communicating such information to any other person under circumstances in which it is reasonably foreseeable that such person is likely to purchase or sell such securities or other securities of such issuer; and (iii) agree to comply in all material respects with such securities laws. You also agree that GCM Information may have specific restrictions attached to it (e.g. standstill, non-circumvent or non-solicitation restrictions) and agrees to abide by any such restrictions of which it is informed. GCM Grosvenor and its affiliates have not independently verified third-party information included in GCM Information and makes no representation or warranty as to its accuracy or completeness. The information and opinions expressed are as of the date set forth therein.
GCM Information may not include the most recent month of performance data of Investment Products; such performance, if omitted, is available upon request. Interpretation of the performance statistics (including statistical methods), if used, is subject to certain inherent limitations. Assets under management include all subscriptions to, and are reduced by all redemptions from, a GCM Private Markets Fund effected in conjunction with the close of business as of the date indicated. GCM Grosvenor Private Markets classifies Underlying Funds as pursuing particular “strategies” or “sub-strategies” (collectively, “strategies”) using its reasonable discretion; GCM Grosvenor Private Markets may classify an Underlying Fund in a certain strategy even though it may not invest all of its assets in such strategy. If returns of a particular strategy or Underlying Fund are presented, such returns are presented net of any fees and expenses charged by the relevant Underlying Fund(s), but do not reflect the fees and expenses charged by the relevant GCM Private Markets Fund to its investors/participants.
GCM Grosvenor employs certain conventions and methodologies in providing GCM Information that may differ from those used by other investment managers. GCM Information does not make any recommendations regarding specific securities, investment strategies, industries or sectors. Risk management, diversification and due diligence processes seek to mitigate, but cannot eliminate risk, nor do they imply low risk. To the extent GCM Information contains “forward-looking” statements, such statements represent GCM Grosvenor Private Market’s good-faith expectations concerning future actions, events or conditions, and can never be viewed as indications of whether particular actions, events or conditions will occur. Additional information is available upon request. ©2017 GCM Customized Fund Investment Group, L.P. All rights reserved. GRV Securities LLC (“GSLLC”), an affiliate of GCM Grosvenor and a member of the U.S. Financial Industry Regulatory Authority, Inc., acts as a placement agent on behalf of certain GCM Private Markets Funds. GSLLC does not offer any investment products other than interests in certain funds managed by GCM Grosvenor or its affiliates. Neither GCM Grosvenor nor any of its affiliates acts as agent/broker for any Underlying Fund.
THE NOTES AND DISCLOSURES FOLLOWING THIS REPORT ARE AN INTEGRAL PART OF THIS REPORT AND MUST BE READ IN CONNECTION WITH YOUR REVIEW
OF THIS REPORT. THIS REPORT HAS BEEN PREPARED BY THE GCM CUSTOMIZED FUND INVESTMENT GROUP, L.P. (REFERRED TO HEREIN AS “GCM GROSVENOR
PRIVATE MARKETS”) AND GRV SECURITIES LLC. © 2017 GCM CUSTOMIZED FUND INVESTMENT GROUP, L.P. ALL RIGHTS RESERVED
Appendix 3Q 2016 Market Overview
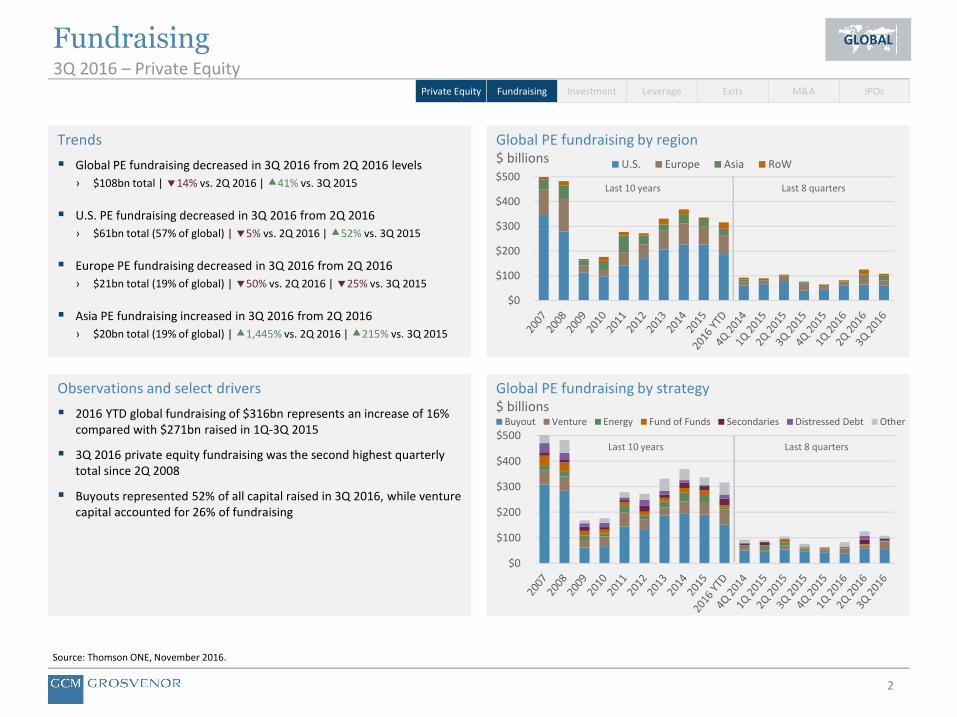
2
Fundraising3Q 2016 – Private Equity
Source: Thomson ONE, November 2016.
Private Equity
GLOBAL
Private Equity Fundraising Investment Leverage Exits M&A IPOs
Global PE fundraising by region$ billions
Global PE fundraising by strategy$ billions
Trends
Global PE fundraising decreased in 3Q 2016 from 2Q 2016 levels
› $108bn total | 14% vs. 2Q 2016 | 41% vs. 3Q 2015
U.S. PE fundraising decreased in 3Q 2016 from 2Q 2016
› $61bn total (57% of global) | 5% vs. 2Q 2016 | 52% vs. 3Q 2015
Europe PE fundraising decreased in 3Q 2016 from 2Q 2016
› $21bn total (19% of global) | 50% vs. 2Q 2016 | 25% vs. 3Q 2015
Asia PE fundraising increased in 3Q 2016 from 2Q 2016
› $20bn total (19% of global) | 1,445% vs. 2Q 2016 | 215% vs. 3Q 2015
Observations and select drivers
2016 YTD global fundraising of $316bn represents an increase of 16% compared with $271bn raised in 1Q-3Q 2015
3Q 2016 private equity fundraising was the second highest quarterly total since 2Q 2008
Buyouts represented 52% of all capital raised in 3Q 2016, while venture capital accounted for 26% of fundraising
Last 8 quartersLast 10 years
Last 8 quartersLast 10 years
$0
$100
$200
$300
$400
$500U.S. Europe Asia RoW
$0
$100
$200
$300
$400
$500Buyout Venture Energy Fund of Funds Secondaries Distressed Debt Other

3
Investment3Q 2016 – Private Equity
1 Source: Thomson ONE, November 2016.
2 Source: Mergermarket, Global and Regional M&A: Q1-Q3 2016.
GLOBAL
Private Equity Fundraising Investment Leverage Exits M&A IPOs
Global equity invested by region1
$ billions
$0
$50
$100
$150
$200
$250U.S. Europe Asia RoW
1Q-3Q 2016 Top global M&A Deals2
Trends
Global PE investment decreased in 3Q 2016 from 2Q 2016 levels
› $46bn total | 19% vs. 2Q 2016 | 29% vs. 3Q 2015
U.S. PE investment decreased in 3Q 2016 from 2Q 2016 levels
› $20bn total (43% of global) | 9% vs. 2Q 2016 | 37% vs. 3Q 2015
Europe PE investment decreased in 3Q 2016 from 2Q 2016 levels
› $5bn total (11% of global) | 40% vs. 2Q 2016 | 5% vs. 3Q 2015
Asia PE investment decreased in 3Q 2016 from 2Q 2016
› $15bn total (32% of global) | 41% vs. 2Q 2016 | 37% vs. 3Q 2015
Observations and select drivers
YTD 2016 global investment of $178bn represents an increase of 6% compared with $168bn invested in 1Q-3Q 2015
U.S., Europe and Asia investment all decreased in 3Q 2016
Global private equity investment was $221bn for the trailing 12-month period ending 3Q 2016, representing an 8% decrease compared to the 12 months ending 2Q 2016
Buyouts represent 13% of all capital invested in 2016 while venture capital has accounted for 22% of YTD investment
Target Acquirer Deal value
Monsanto Company Bayer AG $65.3bn
Syngenta AG China National Chemical Corporation $45.9bn
Spectra Energy Corp Enbridge Inc $40.7bn
Baxalta Inc Shire Plc $35.2bn
ARM Holdings Plc SoftBank Group Corp $30.2bn
Last 8 quartersLast 10 years
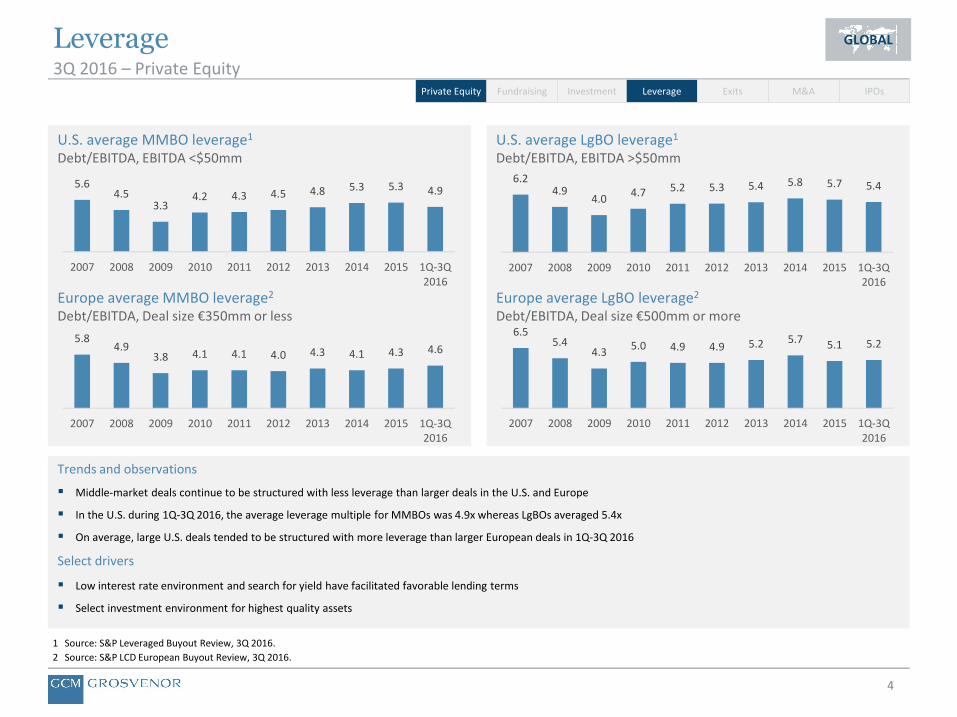
4
Leverage3Q 2016 – Private Equity
1 Source: S&P Leveraged Buyout Review, 3Q 2016.
2 Source: S&P LCD European Buyout Review, 3Q 2016.
GLOBAL
Private Equity Fundraising Investment Leverage Exits M&A IPOs
U.S. average LgBO leverage1
Debt/EBITDA, EBITDA >$50mm
Europe average LgBO leverage2
Debt/EBITDA, Deal size €500mm or more6.5
5.44.3
5.0 4.9 4.9 5.2 5.7 5.1 5.2
2007 2008 2009 2010 2011 2012 2013 2014 2015 1Q-3Q2016
U.S. average MMBO leverage1
Debt/EBITDA, EBITDA <$50mm
Europe average MMBO leverage2
Debt/EBITDA, Deal size €350mm or less
5.84.9
3.8 4.1 4.1 4.0 4.3 4.1 4.3 4.6
2007 2008 2009 2010 2011 2012 2013 2014 2015 1Q-3Q2016
5.64.5
3.34.2 4.3 4.5 4.8 5.3 5.3 4.9
2007 2008 2009 2010 2011 2012 2013 2014 2015 1Q-3Q2016
6.24.9
4.04.7 5.2 5.3 5.4 5.8 5.7 5.4
2007 2008 2009 2010 2011 2012 2013 2014 2015 1Q-3Q2016
Trends and observations
Middle-market deals continue to be structured with less leverage than larger deals in the U.S. and Europe
In the U.S. during 1Q-3Q 2016, the average leverage multiple for MMBOs was 4.9x whereas LgBOs averaged 5.4x
On average, large U.S. deals tended to be structured with more leverage than larger European deals in 1Q-3Q 2016
Select drivers
Low interest rate environment and search for yield have facilitated favorable lending terms
Select investment environment for highest quality assets
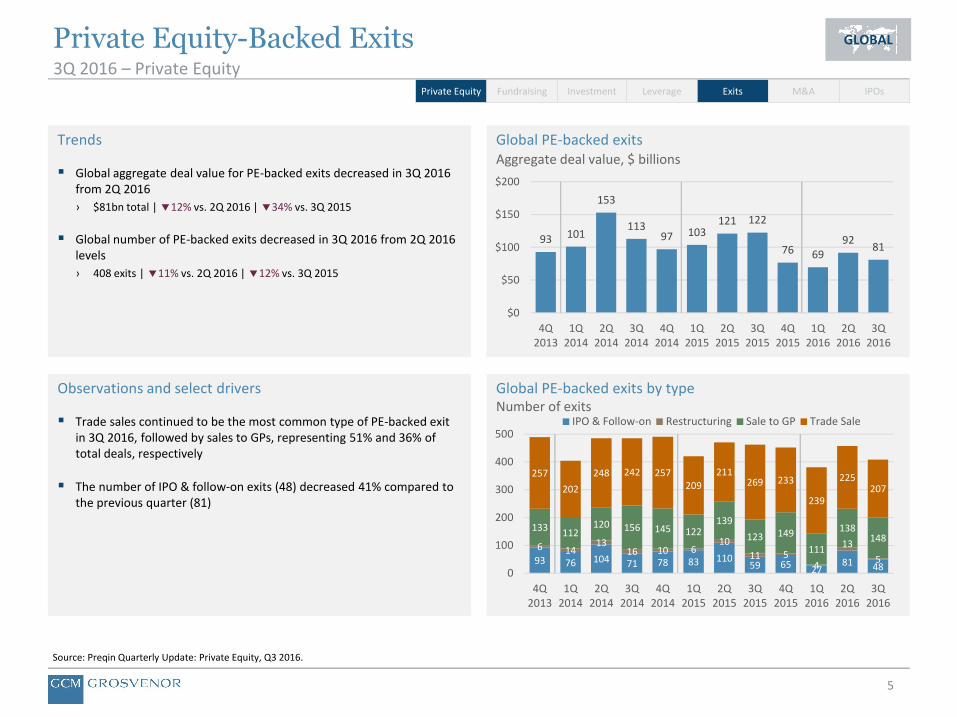
5
Private Equity-Backed Exits3Q 2016 – Private Equity
Source: Preqin Quarterly Update: Private Equity, Q3 2016.
GLOBAL
Private Equity Fundraising Investment Leverage Exits M&A IPOs
Global PE-backed exits by typeNumber of exits
4881276559
1108378711047693 5
13
4511
1061016
13146
148138
111
149123
139122145156120
112133
207225
239
233269211
209257242248
202
257
0
100
200
300
400
500
3Q2016
2Q2016
1Q2016
4Q2015
3Q2015
2Q2015
1Q2015
4Q2014
3Q2014
2Q2014
1Q2014
4Q2013
IPO & Follow-on Restructuring Sale to GP Trade Sale
Global PE-backed exitsAggregate deal value, $ billions
8192
6976
12212110397
113
153
10193
3Q2016
2Q2016
1Q2016
4Q2015
3Q2015
2Q2015
1Q2015
4Q2014
3Q2014
2Q2014
1Q2014
4Q2013
$0
$50
$100
$150
$200
Trends
Global aggregate deal value for PE-backed exits decreased in 3Q 2016 from 2Q 2016
› $81bn total | 12% vs. 2Q 2016 | 34% vs. 3Q 2015
Global number of PE-backed exits decreased in 3Q 2016 from 2Q 2016 levels
› 408 exits | 11% vs. 2Q 2016 | 12% vs. 3Q 2015
Observations and select drivers
Trade sales continued to be the most common type of PE-backed exit in 3Q 2016, followed by sales to GPs, representing 51% and 36% of total deals, respectively
The number of IPO & follow-on exits (48) decreased 41% compared to the previous quarter (81)
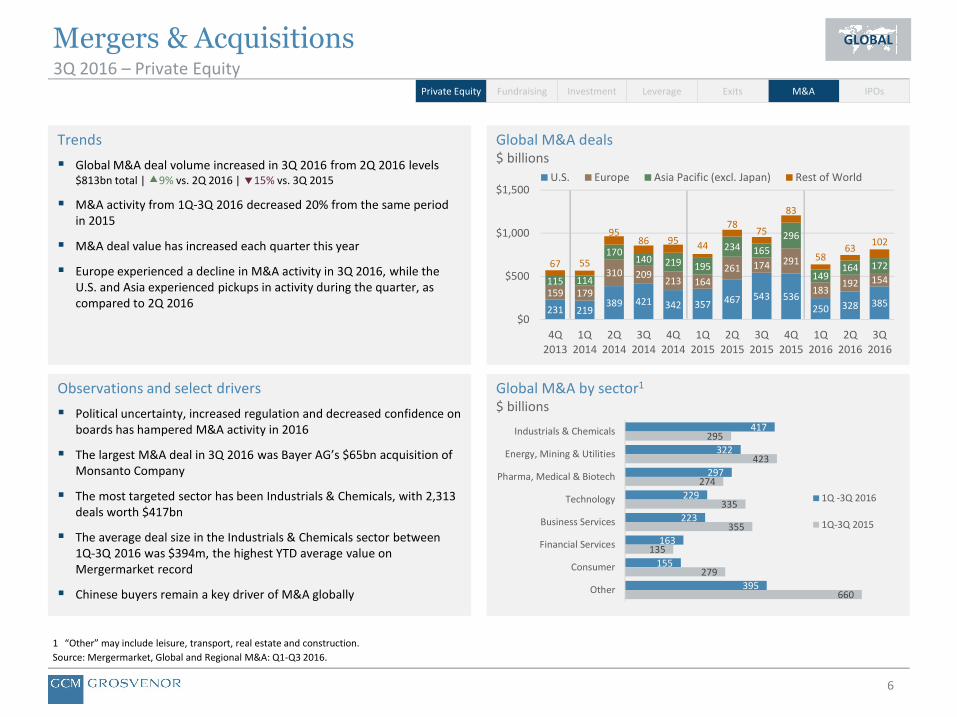
6
Mergers & Acquisitions3Q 2016 – Private Equity
1 “Other” may include leisure, transport, real estate and construction.
Source: Mergermarket, Global and Regional M&A: Q1-Q3 2016.
GLOBAL
Private Equity Fundraising Investment Leverage Exits M&A IPOs
Global M&A by sector1
$ billions
417
322
297
229
223
163
155
395
295
423
274
335
355
135
279
660
Industrials & Chemicals
Energy, Mining & Utilities
Pharma, Medical & Biotech
Technology
Business Services
Financial Services
Consumer
Other
1Q -3Q 2016
1Q-3Q 2015
Global M&A deals$ billions
385328250536543467357342421389
219231
154192183
291174261
164213209310
179159
172164149
296
165234
195219140170
114115
10263
58
83
7578
44958695
5567
$0
$500
$1,000
$1,500
3Q2016
2Q2016
1Q2016
4Q2015
3Q2015
2Q2015
1Q2015
4Q2014
3Q2014
2Q2014
1Q2014
4Q2013
U.S. Europe Asia Pacific (excl. Japan) Rest of World
Trends
Global M&A deal volume increased in 3Q 2016 from 2Q 2016 levels $813bn total | 9% vs. 2Q 2016 | 15% vs. 3Q 2015
M&A activity from 1Q-3Q 2016 decreased 20% from the same period in 2015
M&A deal value has increased each quarter this year
Europe experienced a decline in M&A activity in 3Q 2016, while the U.S. and Asia experienced pickups in activity during the quarter, as compared to 2Q 2016
Observations and select drivers
Political uncertainty, increased regulation and decreased confidence on boards has hampered M&A activity in 2016
The largest M&A deal in 3Q 2016 was Bayer AG’s $65bn acquisition of Monsanto Company
The most targeted sector has been Industrials & Chemicals, with 2,313 deals worth $417bn
The average deal size in the Industrials & Chemicals sector between 1Q-3Q 2016 was $394m, the highest YTD average value on Mergermarket record
Chinese buyers remain a key driver of M&A globally

7
Initial Public Offerings3Q 2016 – Private Equity
Data excludes IPOs with proceeds of less than $100 million, closed-end funds and SPACS.
Source: Renaissance Capital IPO Intelligence, Global IPO Market 3Q 2016 Quarterly Review.
GLOBAL
Private Equity Fundraising Investment Leverage Exits M&A IPOs
Global IPO volumeProceeds (LHS), $ billions, Number of IPOs (RHS)
$29 $27 $10
$56
$14
$51 $36
$58
6177
29
72
42
123
75
122
0
50
100
150
$0
$25
$50
$75
3Q2016
2Q2016
1Q2016
4Q2015
3Q2015
2Q2015
1Q2015
4Q2014
Largest 3Q 2016 IPOs
Trends
Global IPO proceeds increased in 3Q 2016 from 2Q 2016 levels
› $29bn total | 9% vs. 2Q 2016 | 115% vs. 3Q 2015
The number of IPOs globally decreased in 3Q 2016 from 2Q 2016 levels
› 61 IPOs | 21% vs. 2Q 2016 | 45% vs. 3Q 2015
Observations and select drivers
The global IPO market continued to make a recovery despite uncertainties surrounding Brexit at the end of 2Q 2016
The financial sector dominated the IPO market in 3Q 2016, accounting for 63% of proceeds raised
IPO proceeds in Asia and Europe accounted for 68% and 13% of total proceeds raised, respectively
Investor sentiment improved despite uncertainties related to monetary policy, the U.S. presidential election and China’s slowing economy
Name Industry Deal value
Postal Savings Bank of China Financial $7,426mm
Nets Holding Financial $2,372mm
China Merchants Securities Financial $1,380mm
LINE Technology $1,149mm
Everbright Securities Financial $1,111mm
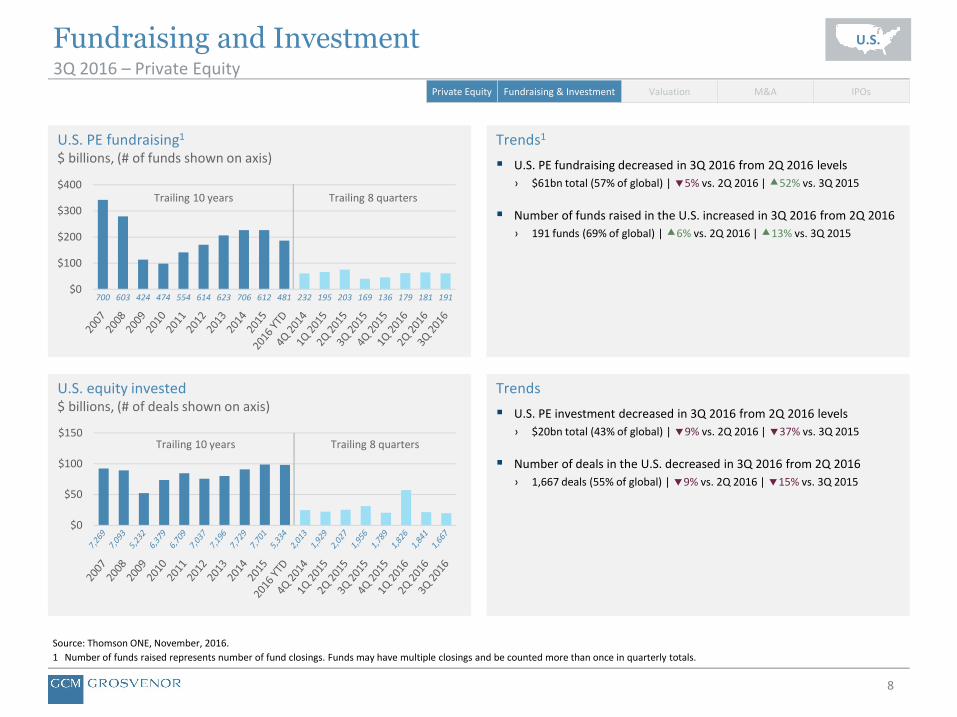
8
Fundraising and Investment3Q 2016 – Private Equity
Source: Thomson ONE, November, 2016.
1 Number of funds raised represents number of fund closings. Funds may have multiple closings and be counted more than once in quarterly totals.
U.S.
Private Equity Fundraising & Investment Valuation M&A IPOs
U.S. equity invested$ billions, (# of deals shown on axis)
$0
$50
$100
$150
U.S. PE fundraising1
$ billions, (# of funds shown on axis)
$0
$100
$200
$300
$400
700 603 424 474 554 614 623 706 612 481 232 195 203 169 136 179 181 191
Trends1
U.S. PE fundraising decreased in 3Q 2016 from 2Q 2016 levels
› $61bn total (57% of global) | 5% vs. 2Q 2016 | 52% vs. 3Q 2015
Number of funds raised in the U.S. increased in 3Q 2016 from 2Q 2016
› 191 funds (69% of global) | 6% vs. 2Q 2016 | 13% vs. 3Q 2015
Trends
U.S. PE investment decreased in 3Q 2016 from 2Q 2016 levels
› $20bn total (43% of global) | 9% vs. 2Q 2016 | 37% vs. 3Q 2015
Number of deals in the U.S. decreased in 3Q 2016 from 2Q 2016
› 1,667 deals (55% of global) | 9% vs. 2Q 2016 | 15% vs. 3Q 2015
Trailing 10 years Trailing 8 quarters
Trailing 10 years Trailing 8 quarters
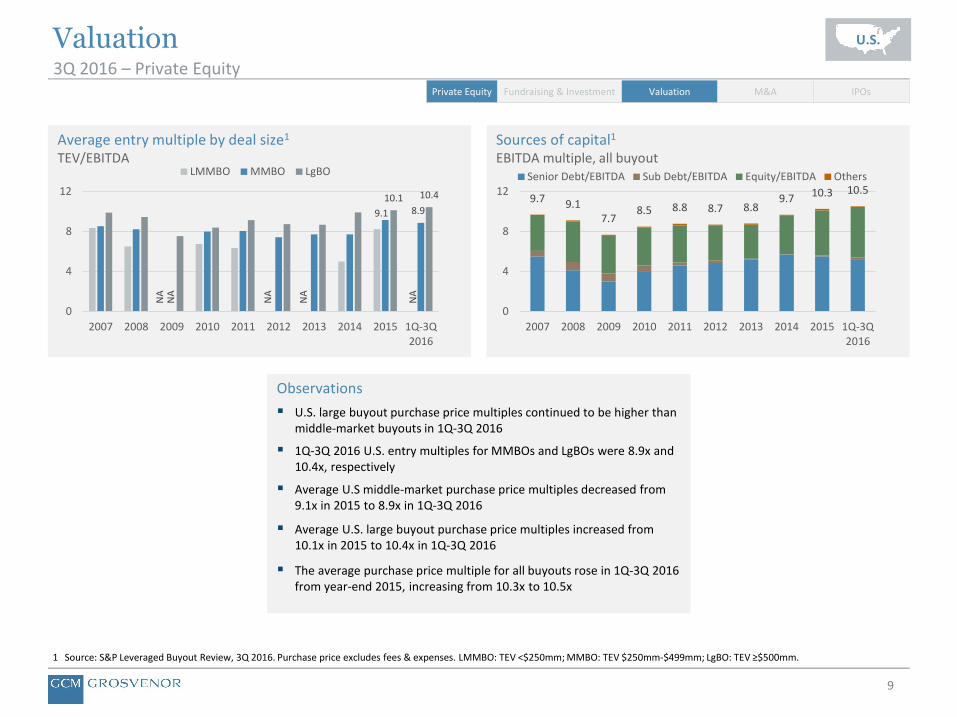
9
Valuation3Q 2016 – Private Equity
1 Source: S&P Leveraged Buyout Review, 3Q 2016. Purchase price excludes fees & expenses. LMMBO: TEV <$250mm; MMBO: TEV $250mm-$499mm; LgBO: TEV ≥$500mm.
U.S.
Private Equity Fundraising & Investment Valuation M&A IPOs
Average entry multiple by deal size1
TEV/EBITDAN
A
NA
NA
NA
NA
9.1 8.910.1 10.4
0
4
8
12
2007 2008 2009 2010 2011 2012 2013 2014 2015 1Q-3Q2016
LMMBO MMBO LgBO
Sources of capital1
EBITDA multiple, all buyout
9.7 9.17.7
8.5 8.8 8.7 8.89.7 10.3 10.5
0
4
8
12
2007 2008 2009 2010 2011 2012 2013 2014 2015 1Q-3Q2016
Senior Debt/EBITDA Sub Debt/EBITDA Equity/EBITDA Others
Observations
U.S. large buyout purchase price multiples continued to be higher than middle-market buyouts in 1Q-3Q 2016
1Q-3Q 2016 U.S. entry multiples for MMBOs and LgBOs were 8.9x and 10.4x, respectively
Average U.S middle-market purchase price multiples decreased from 9.1x in 2015 to 8.9x in 1Q-3Q 2016
Average U.S. large buyout purchase price multiples increased from 10.1x in 2015 to 10.4x in 1Q-3Q 2016
The average purchase price multiple for all buyouts rose in 1Q-3Q 2016 from year-end 2015, increasing from 10.3x to 10.5x
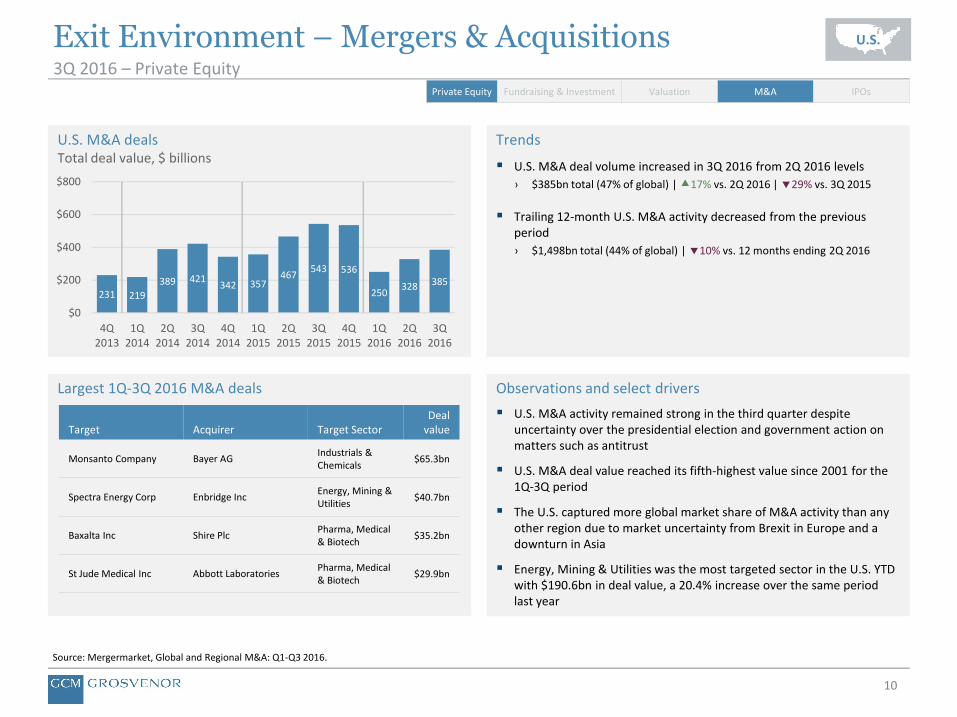
10
Exit Environment – Mergers & Acquisitions3Q 2016 – Private Equity
Source: Mergermarket, Global and Regional M&A: Q1-Q3 2016.
U.S.
Private Equity Fundraising & Investment Valuation M&A IPOs
U.S. M&A dealsTotal deal value, $ billions
385328250
536543467
357342421389
219231
$0
$200
$400
$600
$800
3Q2016
2Q2016
1Q2016
4Q2015
3Q2015
2Q2015
1Q2015
4Q2014
3Q2014
2Q2014
1Q2014
4Q2013
Largest 1Q-3Q 2016 M&A deals
Target Acquirer Target SectorDeal
value
Monsanto Company Bayer AGIndustrials & Chemicals
$65.3bn
Spectra Energy Corp Enbridge IncEnergy, Mining & Utilities
$40.7bn
Baxalta Inc Shire PlcPharma, Medical & Biotech
$35.2bn
St Jude Medical Inc Abbott LaboratoriesPharma, Medical & Biotech
$29.9bn
Trends
U.S. M&A deal volume increased in 3Q 2016 from 2Q 2016 levels
› $385bn total (47% of global) | 17% vs. 2Q 2016 | 29% vs. 3Q 2015
Trailing 12-month U.S. M&A activity decreased from the previous period
› $1,498bn total (44% of global) | 10% vs. 12 months ending 2Q 2016
Observations and select drivers
U.S. M&A activity remained strong in the third quarter despite uncertainty over the presidential election and government action on matters such as antitrust
U.S. M&A deal value reached its fifth-highest value since 2001 for the 1Q-3Q period
The U.S. captured more global market share of M&A activity than any other region due to market uncertainty from Brexit in Europe and a downturn in Asia
Energy, Mining & Utilities was the most targeted sector in the U.S. YTD with $190.6bn in deal value, a 20.4% increase over the same period last year
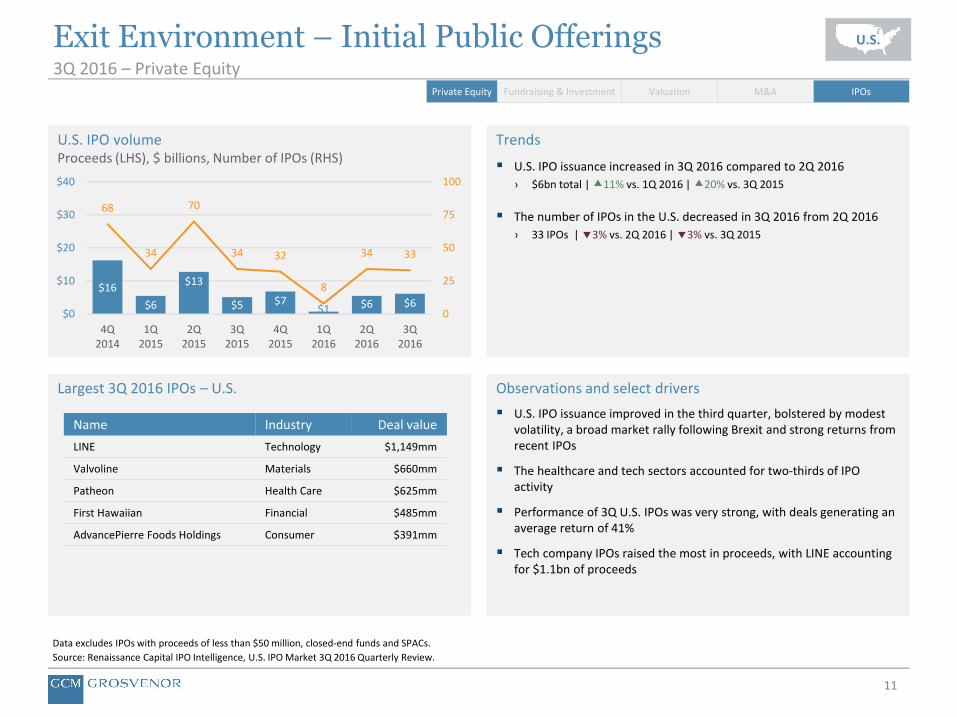
11
Exit Environment – Initial Public Offerings3Q 2016 – Private Equity
Data excludes IPOs with proceeds of less than $50 million, closed-end funds and SPACs.
Source: Renaissance Capital IPO Intelligence, U.S. IPO Market 3Q 2016 Quarterly Review.
U.S.
Private Equity Fundraising & Investment Valuation M&A IPOs
U.S. IPO volumeProceeds (LHS), $ billions, Number of IPOs (RHS)
$6 $6 $1 $7 $5
$13
$6
$16
3334
8
3234
70
34
68
0
25
50
75
100
$0
$10
$20
$30
$40
3Q2016
2Q2016
1Q2016
4Q2015
3Q2015
2Q2015
1Q2015
4Q2014
Trends
U.S. IPO issuance increased in 3Q 2016 compared to 2Q 2016
› $6bn total | 11% vs. 1Q 2016 | 20% vs. 3Q 2015
The number of IPOs in the U.S. decreased in 3Q 2016 from 2Q 2016
› 33 IPOs | 3% vs. 2Q 2016 | 3% vs. 3Q 2015
Largest 3Q 2016 IPOs – U.S. Observations and select drivers
U.S. IPO issuance improved in the third quarter, bolstered by modest volatility, a broad market rally following Brexit and strong returns from recent IPOs
The healthcare and tech sectors accounted for two-thirds of IPO activity
Performance of 3Q U.S. IPOs was very strong, with deals generating an average return of 41%
Tech company IPOs raised the most in proceeds, with LINE accounting for $1.1bn of proceeds
Name Industry Deal value
LINE Technology $1,149mm
Valvoline Materials $660mm
Patheon Health Care $625mm
First Hawaiian Financial $485mm
AdvancePierre Foods Holdings Consumer $391mm
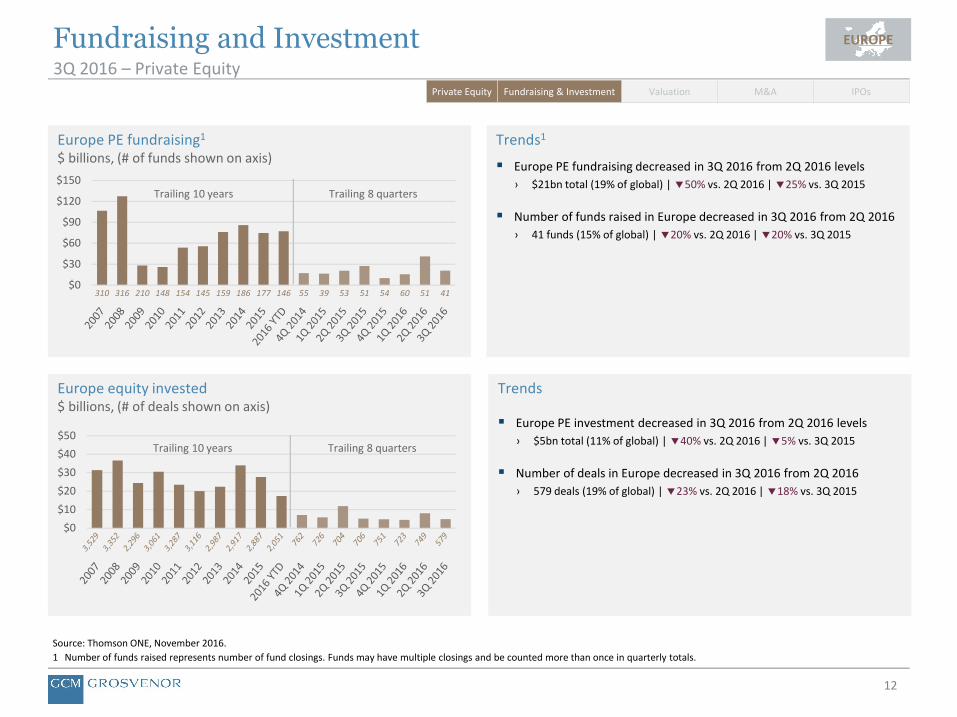
12
Fundraising and Investment3Q 2016 – Private Equity
Source: Thomson ONE, November 2016.
1 Number of funds raised represents number of fund closings. Funds may have multiple closings and be counted more than once in quarterly totals.
EUROPE
Private Equity Fundraising & Investment Valuation M&A IPOs
Europe equity invested$ billions, (# of deals shown on axis)
$0
$10
$20
$30
$40
$50
Europe PE fundraising1
$ billions, (# of funds shown on axis)
$0
$30
$60
$90
$120
$150
310 316 210 148 154 145 159 186 177 146 55 39 53 51 54 60 51 41
Trends1
Europe PE fundraising decreased in 3Q 2016 from 2Q 2016 levels
› $21bn total (19% of global) | 50% vs. 2Q 2016 | 25% vs. 3Q 2015
Number of funds raised in Europe decreased in 3Q 2016 from 2Q 2016
› 41 funds (15% of global) | 20% vs. 2Q 2016 | 20% vs. 3Q 2015
Trends
Europe PE investment decreased in 3Q 2016 from 2Q 2016 levels
› $5bn total (11% of global) | 40% vs. 2Q 2016 | 5% vs. 3Q 2015
Number of deals in Europe decreased in 3Q 2016 from 2Q 2016
› 579 deals (19% of global) | 23% vs. 2Q 2016 | 18% vs. 3Q 2015
Trailing 10 years Trailing 8 quarters
Trailing 10 years Trailing 8 quarters

13
Valuation3Q 2016 – Private Equity
1 Source: S&P European Leveraged Buyout Review, 3Q 2016. Purchase price excludes fees & expenses. LMMBO: TEV <€250mm; MMBO: TEV €250mm-€499mm; LgBO: TEV ≥ €500mm.
EUROPE
Private Equity Fundraising & Investment Valuation M&A IPOs
Average entry multiple by deal size1
TEV/EBITDAN
A
NA
NA
8.4 8.39.8 10.2
0
4
8
12
2007 2008 2009 2010 2011 2012 2013 2014 2015 1Q-3Q2016
LMMBO MMBO LgBO
Sources of capitalEBITDA multiple, all buyout
9.7 9.78.9 9.2 8.8 9.3
8.79.7 9.2
9.9
0
4
8
12
2007 2008 2009 2010 2011 2012 2013 2014 2015 1Q-3Q2016
Debt/EBITDA Equity/EBITDA Other/EBITDA
Observations
Average European large buyout purchase price multiples increased from 9.8x in 2015 to 10.2x in 1Q-3Q 2016
Average European middle-market buyout purchase price multiples declined from 8.4x in 2015 to 8.3x in 1Q-3Q 2016
The average purchase price multiple for all buyouts rose in 1Q-3Q 2016 from year-end 2015, increasing from 9.2x to 9.9x
The trend of increasing dispersion between purchase price multiples at varying deal sizes since the end of 2013 continued in 1Q-3Q 2016
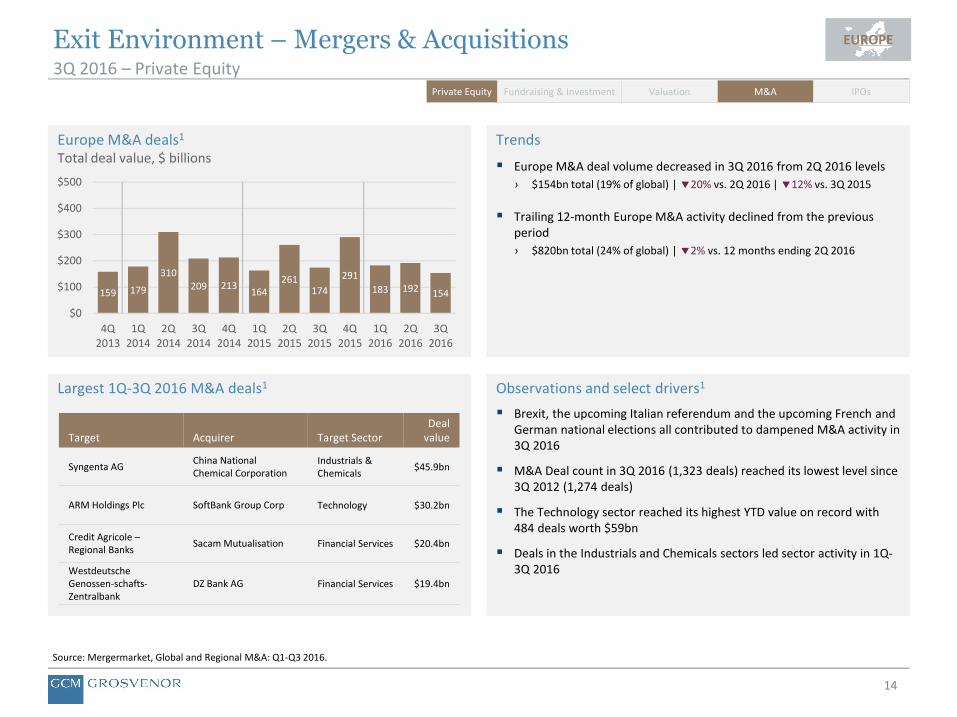
14
Exit Environment – Mergers & Acquisitions3Q 2016 – Private Equity
Source: Mergermarket, Global and Regional M&A: Q1-Q3 2016.
EUROPE
Private Equity Fundraising & Investment Valuation M&A IPOs
Europe M&A deals1
Total deal value, $ billions
154192183
291
174261
164213209
310
179159
$0
$100
$200
$300
$400
$500
3Q2016
2Q2016
1Q2016
4Q2015
3Q2015
2Q2015
1Q2015
4Q2014
3Q2014
2Q2014
1Q2014
4Q2013
Trends
Europe M&A deal volume decreased in 3Q 2016 from 2Q 2016 levels
› $154bn total (19% of global) | 20% vs. 2Q 2016 | 12% vs. 3Q 2015
Trailing 12-month Europe M&A activity declined from the previous period
› $820bn total (24% of global) | 2% vs. 12 months ending 2Q 2016
Observations and select drivers1
Brexit, the upcoming Italian referendum and the upcoming French and German national elections all contributed to dampened M&A activity in 3Q 2016
M&A Deal count in 3Q 2016 (1,323 deals) reached its lowest level since 3Q 2012 (1,274 deals)
The Technology sector reached its highest YTD value on record with 484 deals worth $59bn
Deals in the Industrials and Chemicals sectors led sector activity in 1Q-3Q 2016
Largest 1Q-3Q 2016 M&A deals1
Target Acquirer Target SectorDeal
value
Syngenta AGChina National Chemical Corporation
Industrials & Chemicals
$45.9bn
ARM Holdings Plc SoftBank Group Corp Technology $30.2bn
Credit Agricole –Regional Banks
Sacam Mutualisation Financial Services $20.4bn
WestdeutscheGenossen-schafts-Zentralbank
DZ Bank AG Financial Services $19.4bn
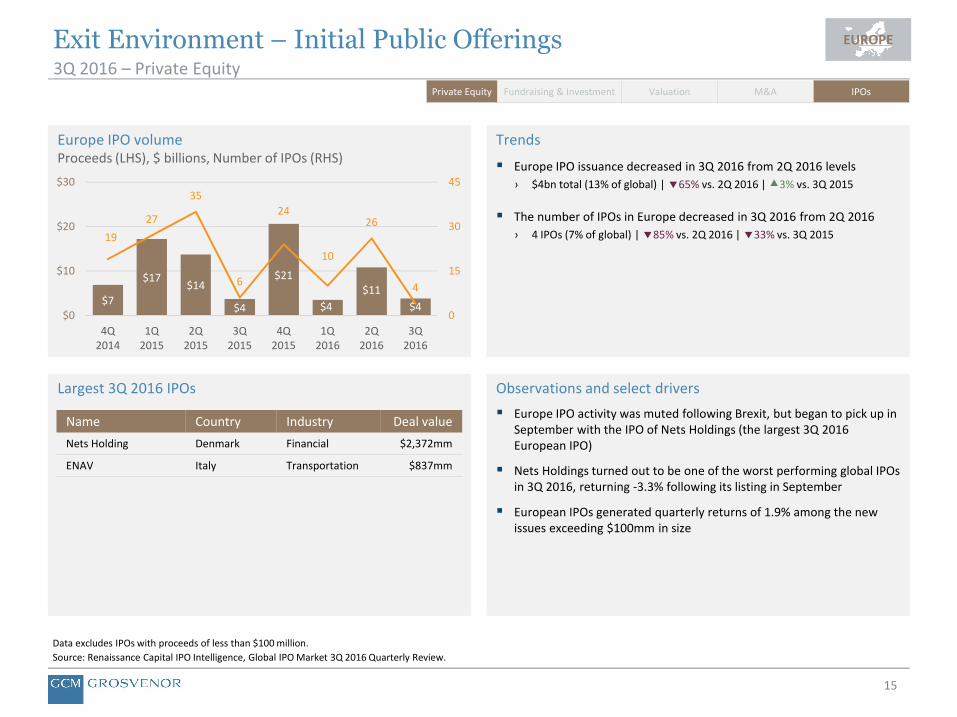
15
Exit Environment – Initial Public Offerings3Q 2016 – Private Equity
EUROPE
Data excludes IPOs with proceeds of less than $100 million.
Source: Renaissance Capital IPO Intelligence, Global IPO Market 3Q 2016 Quarterly Review.
Private Equity Fundraising & Investment Valuation M&A IPOs
Europe IPO volumeProceeds (LHS), $ billions, Number of IPOs (RHS)
$4
$11
$4
$21
$4
$14 $17
$7 4
26
10
24
6
35
27
19
0
15
30
45
$0
$10
$20
$30
3Q2016
2Q2016
1Q2016
4Q2015
3Q2015
2Q2015
1Q2015
4Q2014
Trends
Europe IPO issuance decreased in 3Q 2016 from 2Q 2016 levels
› $4bn total (13% of global) | 65% vs. 2Q 2016 | 3% vs. 3Q 2015
The number of IPOs in Europe decreased in 3Q 2016 from 2Q 2016
› 4 IPOs (7% of global) | 85% vs. 2Q 2016 | 33% vs. 3Q 2015
Largest 3Q 2016 IPOs Observations and select drivers
Europe IPO activity was muted following Brexit, but began to pick up in September with the IPO of Nets Holdings (the largest 3Q 2016 European IPO)
Nets Holdings turned out to be one of the worst performing global IPOs in 3Q 2016, returning -3.3% following its listing in September
European IPOs generated quarterly returns of 1.9% among the new issues exceeding $100mm in size
Name Country Industry Deal value
Nets Holding Denmark Financial $2,372mm
ENAV Italy Transportation $837mm
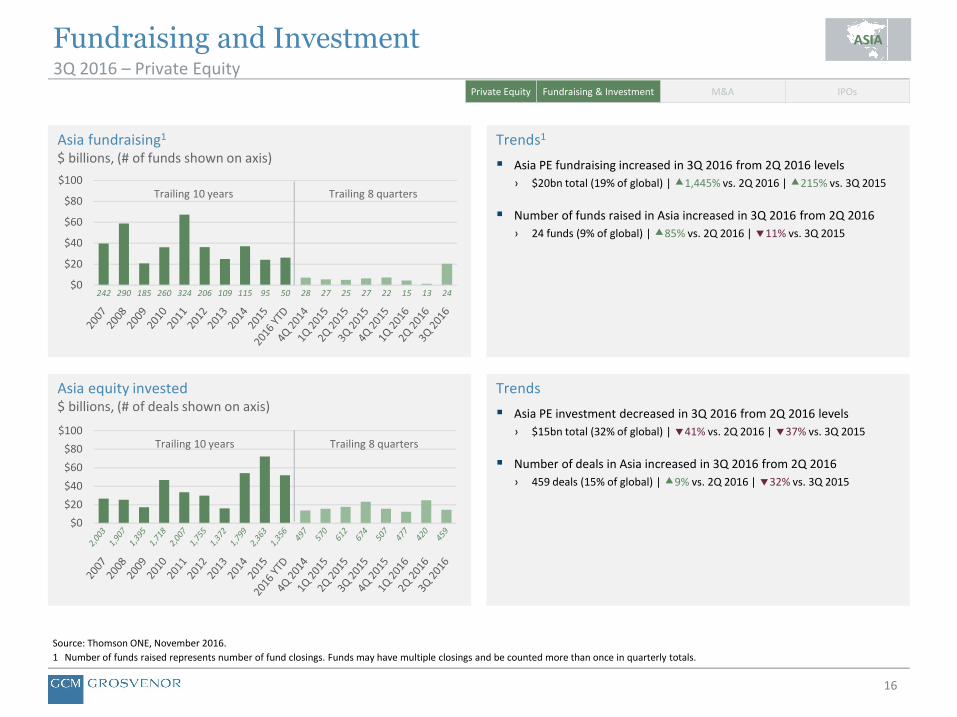
16
Fundraising and Investment3Q 2016 – Private Equity
Source: Thomson ONE, November 2016.
1 Number of funds raised represents number of fund closings. Funds may have multiple closings and be counted more than once in quarterly totals.
ASIA
Private Equity Fundraising & Investment M&A IPOs
Asia equity invested$ billions, (# of deals shown on axis)
$0
$20
$40
$60
$80
$100
Asia fundraising1
$ billions, (# of funds shown on axis)
$0
$20
$40
$60
$80
$100
242 290 185 260 324 206 109 115 95 50 28 27 25 27 22 15 13 24
Trends1
Asia PE fundraising increased in 3Q 2016 from 2Q 2016 levels
› $20bn total (19% of global) | 1,445% vs. 2Q 2016 | 215% vs. 3Q 2015
Number of funds raised in Asia increased in 3Q 2016 from 2Q 2016
› 24 funds (9% of global) | 85% vs. 2Q 2016 | 11% vs. 3Q 2015
Trends
Asia PE investment decreased in 3Q 2016 from 2Q 2016 levels
› $15bn total (32% of global) | 41% vs. 2Q 2016 | 37% vs. 3Q 2015
Number of deals in Asia increased in 3Q 2016 from 2Q 2016
› 459 deals (15% of global) | 9% vs. 2Q 2016 | 32% vs. 3Q 2015
Trailing 10 years Trailing 8 quarters
Trailing 10 years Trailing 8 quarters

17
Exit Environment – Mergers and Acquisitions3Q 2016 – Private Equity
ASIA
Private Equity Fundraising & Investment M&A IPOs
Source: Mergermarket, Global and Regional M&A: Q1-Q3 2016.
Asia Pacific (excl. Japan) M&A dealsTotal deal value, $ billions
172164149
296
165234
195219140170
114115
$0
$100
$200
$300
$400
3Q2016
2Q2016
1Q2016
4Q2015
3Q2015
2Q2015
1Q2015
4Q2014
3Q2014
2Q2014
1Q2014
4Q2013
Largest 1Q-3Q 2016 M&A deals – Asia Pacific (excl. Japan)
Target AcquirerTarget Sector
Deal value
China Petroleum Capital Co Ltd
Jinan Diesel Engine Co LtdIndustrials & Chemicals
$11.3bn
Asciano LimitedConsortium for Asciano led by CPPIB GIP
Transport $9.4bn
Wuhan Iron and Steel Company Limited
Baoshan Iron & Steel Co LtdIndustrials& Chemicals
$8.7bn
Aditya Birla Nuvo Limited Grasim Industries Limited Telecom $8.0bn
Trends
Asia Pacific (excl. Japan) M&A volume increased in 3Q 2016 from 2Q
› $172bn total (21% of global) | 5% vs. 2Q 2016 | 4% vs. 3Q 2015
Trailing 12-month Asia Pacific (excl. Japan) M&A activity increased modestly from the previous period
› $781bn total (23% of global) | 1% vs. 12 months ending 2Q 2016
Observations and select drivers
Asia Pacific (excl. Japan) M&A deal value in 1Q-3Q 2016 (2,557 deals worth $485bn) has declined 18% compared to 1Q-3Q 2015 (2,717 deals worth $594bn)
Despite the decline, 1Q-3Q 2016 is still the second highest YTD period on record
Chinese outbound M&A activity (201 deals worth $141.2bn) accounted for 85% of Asia’s outbound deal value and 46% of deal count
The Technology sector led M&A activity in 1Q-3Q 2016
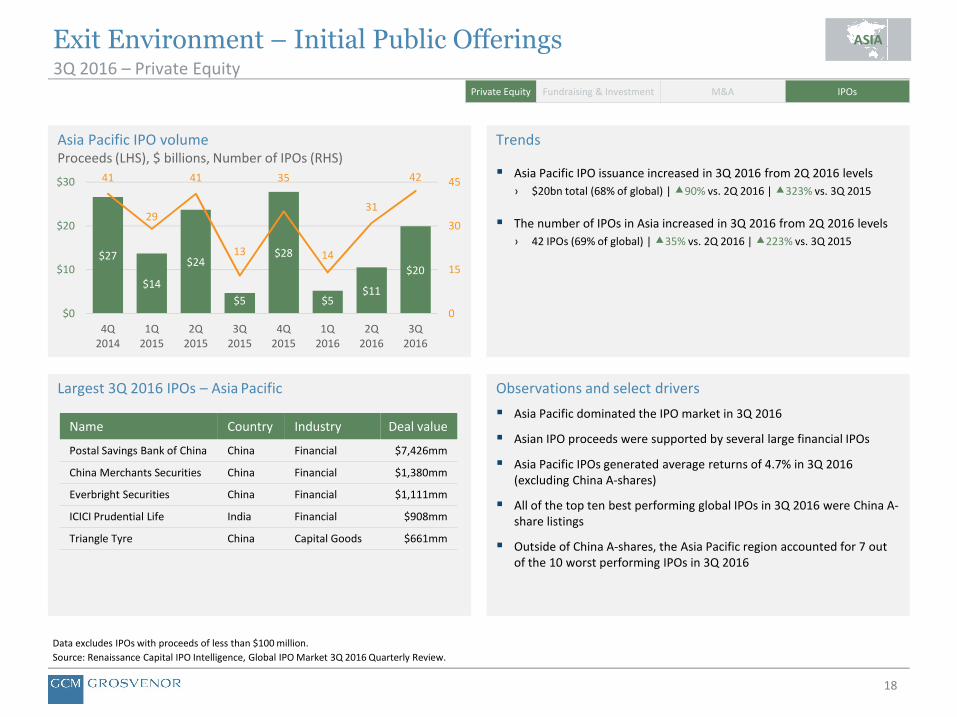
18
Exit Environment – Initial Public Offerings3Q 2016 – Private Equity
Data excludes IPOs with proceeds of less than $100 million.
Source: Renaissance Capital IPO Intelligence, Global IPO Market 3Q 2016 Quarterly Review.
ASIA
Private Equity Fundraising & Investment M&A IPOs
Asia Pacific IPO volumeProceeds (LHS), $ billions, Number of IPOs (RHS)
$20
$11 $5
$28
$5
$24
$14
$27
42
31
14
35
13
41
29
41
0
15
30
45
$0
$10
$20
$30
3Q2016
2Q2016
1Q2016
4Q2015
3Q2015
2Q2015
1Q2015
4Q2014
Trends
Asia Pacific IPO issuance increased in 3Q 2016 from 2Q 2016 levels
› $20bn total (68% of global) | 90% vs. 2Q 2016 | 323% vs. 3Q 2015
The number of IPOs in Asia increased in 3Q 2016 from 2Q 2016 levels
› 42 IPOs (69% of global) | 35% vs. 2Q 2016 | 223% vs. 3Q 2015
Largest 3Q 2016 IPOs – Asia Pacific Observations and select drivers
Asia Pacific dominated the IPO market in 3Q 2016
Asian IPO proceeds were supported by several large financial IPOs
Asia Pacific IPOs generated average returns of 4.7% in 3Q 2016 (excluding China A-shares)
All of the top ten best performing global IPOs in 3Q 2016 were China A-share listings
Outside of China A-shares, the Asia Pacific region accounted for 7 out of the 10 worst performing IPOs in 3Q 2016
Name Country Industry Deal value
Postal Savings Bank of China China Financial $7,426mm
China Merchants Securities China Financial $1,380mm
Everbright Securities China Financial $1,111mm
ICICI Prudential Life India Financial $908mm
Triangle Tyre China Capital Goods $661mm
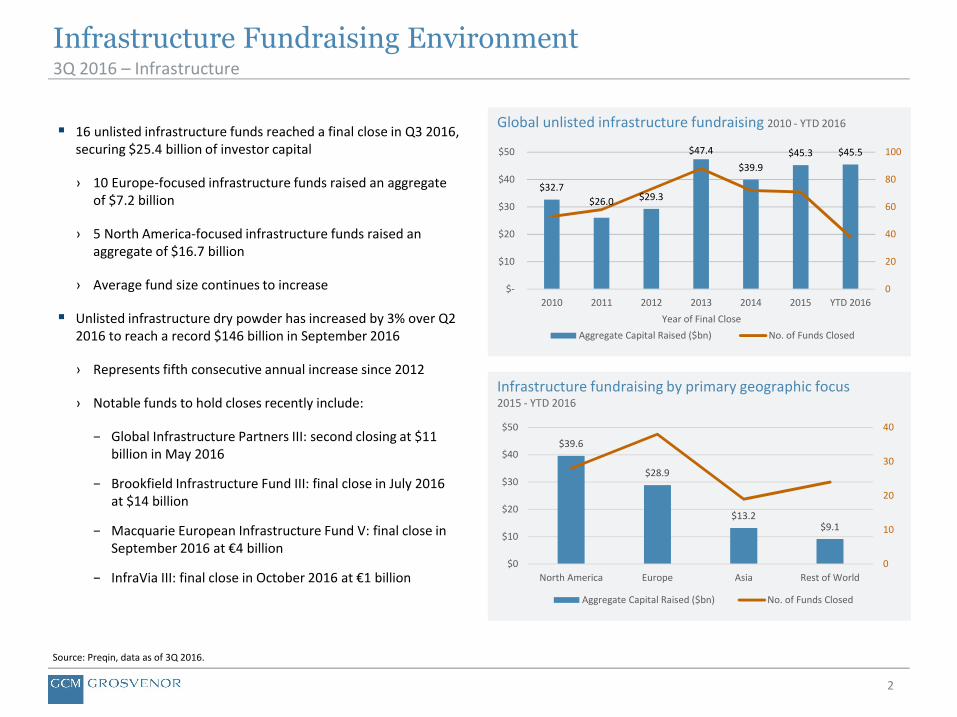
2
Infrastructure Fundraising Environment
16 unlisted infrastructure funds reached a final close in Q3 2016, securing $25.4 billion of investor capital
› 10 Europe-focused infrastructure funds raised an aggregate of $7.2 billion
› 5 North America-focused infrastructure funds raised an aggregate of $16.7 billion
› Average fund size continues to increase
Unlisted infrastructure dry powder has increased by 3% over Q2 2016 to reach a record $146 billion in September 2016
› Represents fifth consecutive annual increase since 2012
› Notable funds to hold closes recently include:
− Global Infrastructure Partners III: second closing at $11 billion in May 2016
− Brookfield Infrastructure Fund III: final close in July 2016 at $14 billion
− Macquarie European Infrastructure Fund V: final close in September 2016 at €4 billion
− InfraVia III: final close in October 2016 at €1 billion
3Q 2016 – Infrastructure
Source: Preqin, data as of 3Q 2016.
Global unlisted infrastructure fundraising 2010 - YTD 2016
Infrastructure fundraising by primary geographic focus2015 - YTD 2016
$32.7
$26.0 $29.3
$47.4
$39.9
$45.3 $45.5
0
20
40
60
80
100
$-
$10
$20
$30
$40
$50
2010 2011 2012 2013 2014 2015 YTD 2016
Year of Final Close
Aggregate Capital Raised ($bn) No. of Funds Closed
$39.6
$28.9
$13.2$9.1
0
10
20
30
40
$0
$10
$20
$30
$40
$50
North America Europe Asia Rest of World
Aggregate Capital Raised ($bn) No. of Funds Closed
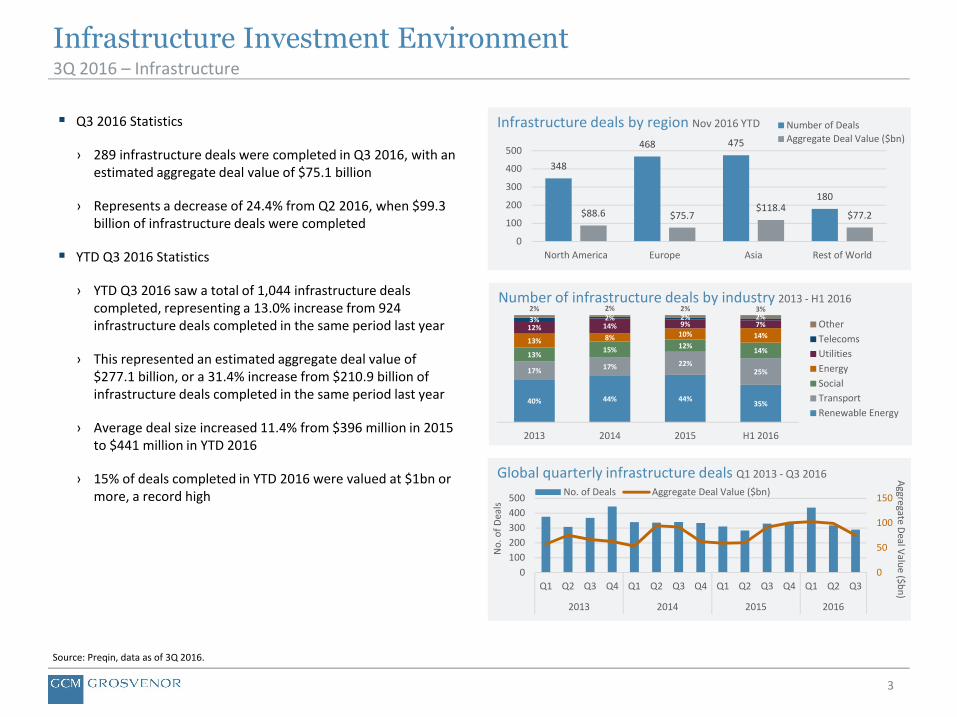
3
Infrastructure Investment Environment
Q3 2016 Statistics
› 289 infrastructure deals were completed in Q3 2016, with an estimated aggregate deal value of $75.1 billion
› Represents a decrease of 24.4% from Q2 2016, when $99.3 billion of infrastructure deals were completed
YTD Q3 2016 Statistics
› YTD Q3 2016 saw a total of 1,044 infrastructure deals completed, representing a 13.0% increase from 924 infrastructure deals completed in the same period last year
› This represented an estimated aggregate deal value of $277.1 billion, or a 31.4% increase from $210.9 billion of infrastructure deals completed in the same period last year
› Average deal size increased 11.4% from $396 million in 2015 to $441 million in YTD 2016
› 15% of deals completed in YTD 2016 were valued at $1bn or more, a record high
3Q 2016 – Infrastructure
Source: Preqin, data as of 3Q 2016.
Infrastructure deals by region Nov 2016 YTD
Global quarterly infrastructure deals Q1 2013 - Q3 2016
Number of infrastructure deals by industry 2013 - H1 2016
348
468 475
180
$88.6 $75.7$118.4
$77.2
0
100
200
300
400
500
North America Europe Asia Rest of World
Number of Deals
Aggregate Deal Value ($bn)
40% 44% 44%35%
17% 17% 22%25%
13%15% 12%
14%13% 8% 10% 14%12% 14% 9% 7%3% 2% 2% 2%2% 2% 2% 3%
2013 2014 2015 H1 2016
Other
Telecoms
Utilities
Energy
Social
Transport
Renewable Energy
0
50
100
150
0
100
200
300
400
500
Q1 Q2 Q3 Q4 Q1 Q2 Q3 Q4 Q1 Q2 Q3 Q4 Q1 Q2 Q3
2013 2014 2015 2016
Aggregate D
eal Valu
e ($b
n)
No
. of
Dea
lsNo. of Deals Aggregate Deal Value ($bn)
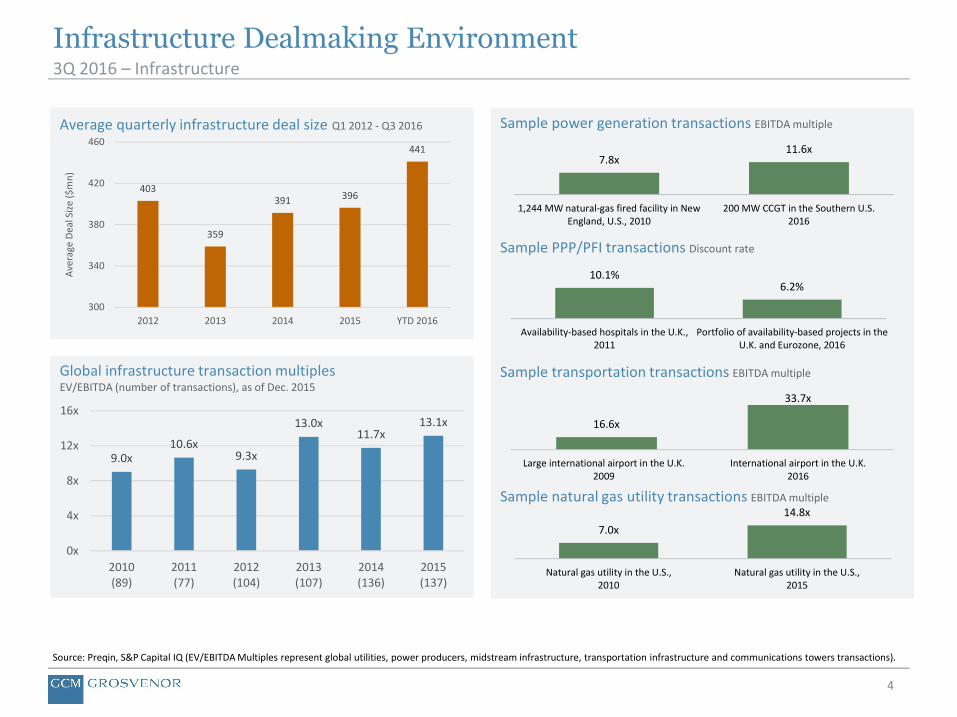
Sample power generation transactions EBITDA multiple
Sample PPP/PFI transactions Discount rate
Sample transportation transactions EBITDA multiple
Sample natural gas utility transactions EBITDA multiple
4
Infrastructure Dealmaking Environment
Source: Preqin, S&P Capital IQ (EV/EBITDA Multiples represent global utilities, power producers, midstream infrastructure, transportation infrastructure and communications towers transactions).
3Q 2016 – Infrastructure
Average quarterly infrastructure deal size Q1 2012 - Q3 2016
Global infrastructure transaction multiplesEV/EBITDA (number of transactions), as of Dec. 2015
9.0x10.6x
9.3x
13.0x11.7x
13.1x
0x
4x
8x
12x
16x
2010(89)
2011(77)
2012(104)
2013(107)
2014(136)
2015(137)
7.8x11.6x
1,244 MW natural-gas fired facility in NewEngland, U.S., 2010
200 MW CCGT in the Southern U.S.2016
10.1%6.2%
Availability-based hospitals in the U.K.,2011
Portfolio of availability-based projects in theU.K. and Eurozone, 2016
7.0x
14.8x
Natural gas utility in the U.S.,2010
Natural gas utility in the U.S.,2015
16.6x
33.7x
Large international airport in the U.K.2009
International airport in the U.K.2016
403
359
391 396
441
300
340
380
420
460
2012 2013 2014 2015 YTD 2016
Ave
rage
Dea
l Siz
e ($
mn
)
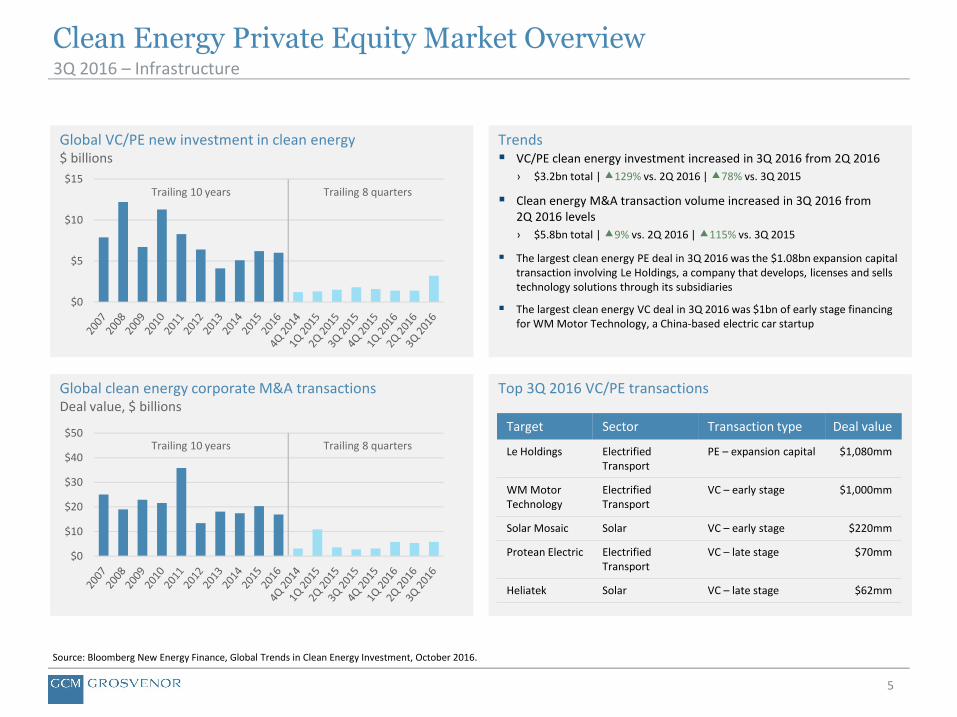
5
Clean Energy Private Equity Market Overview3Q 2016 – Infrastructure
Source: Bloomberg New Energy Finance, Global Trends in Clean Energy Investment, October 2016.
Global clean energy corporate M&A transactionsDeal value, $ billions
$0
$10
$20
$30
$40
$50
Global VC/PE new investment in clean energy$ billions
$0
$5
$10
$15
Trends VC/PE clean energy investment increased in 3Q 2016 from 2Q 2016
› $3.2bn total | 129% vs. 2Q 2016 | 78% vs. 3Q 2015
Clean energy M&A transaction volume increased in 3Q 2016 from 2Q 2016 levels
› $5.8bn total | 9% vs. 2Q 2016 | 115% vs. 3Q 2015
The largest clean energy PE deal in 3Q 2016 was the $1.08bn expansion capital transaction involving Le Holdings, a company that develops, licenses and sells technology solutions through its subsidiaries
The largest clean energy VC deal in 3Q 2016 was $1bn of early stage financing for WM Motor Technology, a China-based electric car startup
Top 3Q 2016 VC/PE transactions
Target Sector Transaction type Deal value
Le Holdings Electrified Transport
PE – expansion capital $1,080mm
WM Motor Technology
ElectrifiedTransport
VC – early stage $1,000mm
Solar Mosaic Solar VC – early stage $220mm
Protean Electric ElectrifiedTransport
VC – late stage $70mm
Heliatek Solar VC – late stage $62mm
Trailing 10 years Trailing 8 quarters
Trailing 10 years Trailing 8 quarters
Related Documents