© WJEC CBAC Ltd. GCE AS MARKING SCHEME SUMMER 2016 ECONOMICS B520U20-1 – NEW AS COMPONENT 2

Welcome message from author
This document is posted to help you gain knowledge. Please leave a comment to let me know what you think about it! Share it to your friends and learn new things together.
Transcript

© WJEC CBAC Ltd.
GCE AS MARKING SCHEME
SUMMER 2016 ECONOMICS B520U20-1 – NEW AS COMPONENT 2
© WJEC CBAC Ltd.
INTRODUCTION This marking scheme was used by WJEC for the 2016 examination. It was finalised after detailed discussion at examiners' conferences by all the examiners involved in the assessment. The conference was held shortly after the paper was taken so that reference could be made to the full range of candidates' responses, with photocopied scripts forming the basis of discussion. The aim of the conference was to ensure that the marking scheme was interpreted and applied in the same way by all examiners. It is hoped that this information will be of assistance to centres but it is recognised at the same time that, without the benefit of participation in the examiners' conference, teachers may have different views on certain matters of detail or interpretation. WJEC regrets that it cannot enter into any discussion or correspondence about this marking scheme. GENERAL MARKING GUIDANCE Positive Marking It should be remembered that learners are writing under examination conditions and credit should be given for what the learner writes, rather than adopting the approach of penalising him/her for any omissions. It should be possible for a very good response to achieve full marks and a very poor one to achieve zero marks. Marks should not be deducted for a less than perfect answer if it satisfies the criteria of the mark scheme, nor should marks be added as a consolation where they are not merited. For each question there is a list of indicative content which suggest the range of economic concepts, theory, issues and arguments which might be included in learners’ answers. This is not intended to be exhaustive and learners do not have to include all the indicative content to reach the highest level of the mark scheme.
The level based mark schemes sub-divide the total mark to allocate to individual assessment objectives. These are shown in bands in the mark scheme. For each assessment objective a descriptor will indicate the different skills and qualities at the appropriate level. Learner’s responses to questions are assessed against the relevant individual assessment objectives and they may achieve different bands within a single question. A mark will be awarded for each assessment objective targeted in the question and then totalled to give an overall mark for the question.
1 © WJEC CBAC Ltd.
EDUQAS NEW AS ECONOMICS - COMPONENT 2
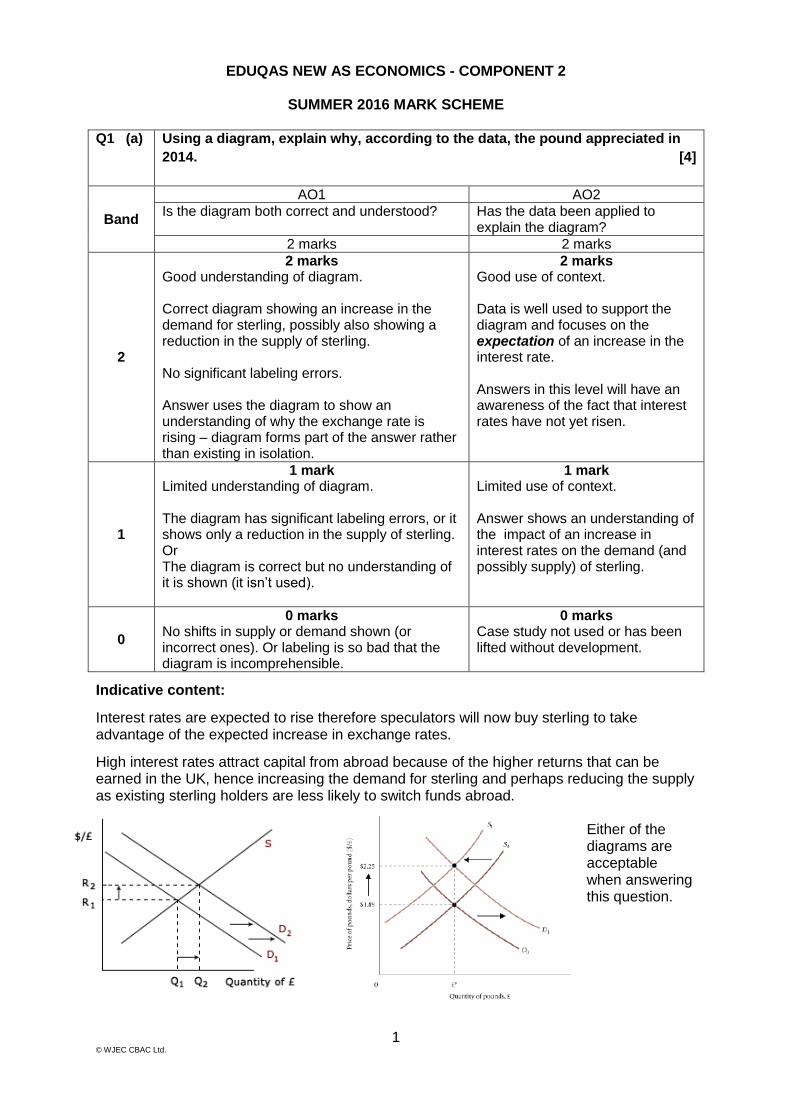
SUMMER 2016 MARK SCHEME Q1 (a) Using a diagram, explain why, according to the data, the pound appreciated in
2014. [4]
Band
AO1 AO2
Is the diagram both correct and understood? Has the data been applied to explain the diagram?
2 marks 2 marks
2
2 marks Good understanding of diagram. Correct diagram showing an increase in the demand for sterling, possibly also showing a reduction in the supply of sterling. No significant labeling errors. Answer uses the diagram to show an understanding of why the exchange rate is rising – diagram forms part of the answer rather than existing in isolation.
2 marks Good use of context. Data is well used to support the diagram and focuses on the expectation of an increase in the interest rate. Answers in this level will have an awareness of the fact that interest rates have not yet risen.
1
1 mark Limited understanding of diagram. The diagram has significant labeling errors, or it shows only a reduction in the supply of sterling. Or The diagram is correct but no understanding of it is shown (it isn’t used).
1 mark Limited use of context. Answer shows an understanding of the impact of an increase in interest rates on the demand (and possibly supply) of sterling.
0
0 marks No shifts in supply or demand shown (or incorrect ones). Or labeling is so bad that the diagram is incomprehensible.
0 marks Case study not used or has been lifted without development.
Indicative content:
Interest rates are expected to rise therefore speculators will now buy sterling to take advantage of the expected increase in exchange rates.
High interest rates attract capital from abroad because of the higher returns that can be earned in the UK, hence increasing the demand for sterling and perhaps reducing the supply as existing sterling holders are less likely to switch funds abroad.
Either of the diagrams are acceptable when answering this question.
2 © WJEC CBAC Ltd.
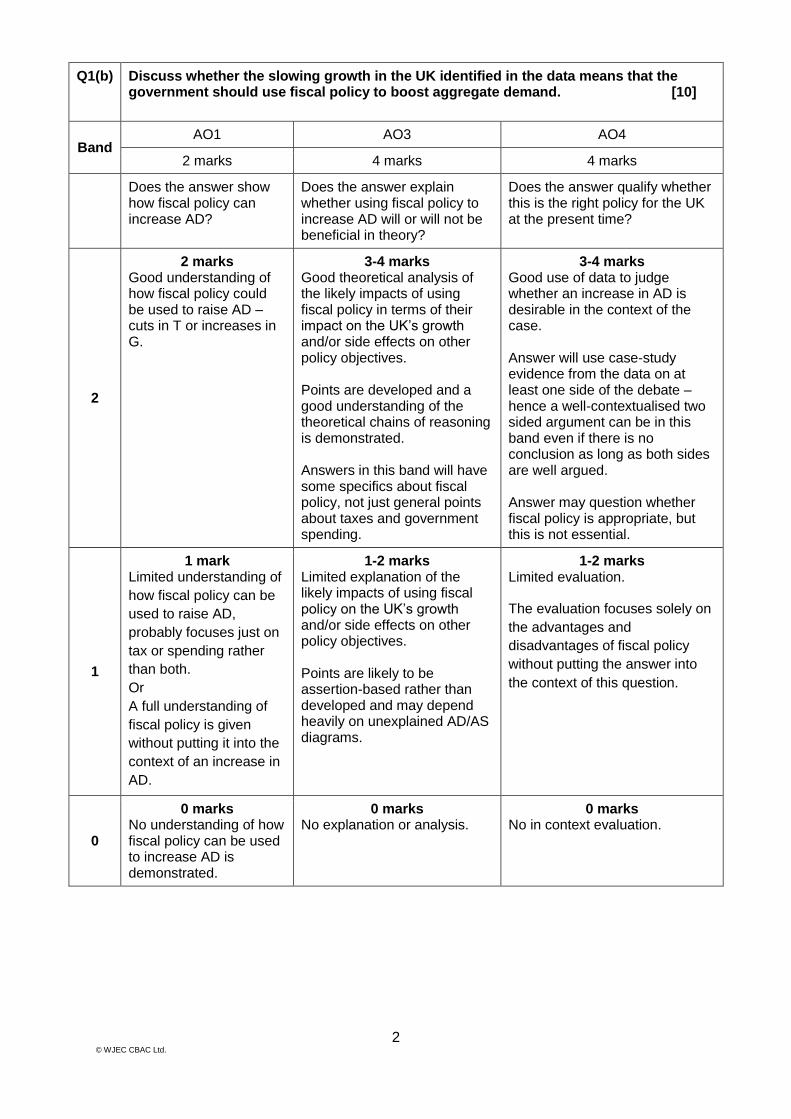
Q1(b) Discuss whether the slowing growth in the UK identified in the data means that the government should use fiscal policy to boost aggregate demand. [10]
Band AO1 AO3 AO4
2 marks 4 marks 4 marks
Does the answer show how fiscal policy can increase AD?
Does the answer explain whether using fiscal policy to increase AD will or will not be beneficial in theory?
Does the answer qualify whether this is the right policy for the UK at the present time?
2
2 marks Good understanding of how fiscal policy could be used to raise AD – cuts in T or increases in G.
3-4 marks Good theoretical analysis of the likely impacts of using fiscal policy in terms of their impact on the UK’s growth and/or side effects on other policy objectives. Points are developed and a good understanding of the theoretical chains of reasoning is demonstrated. Answers in this band will have some specifics about fiscal policy, not just general points about taxes and government spending.
3-4 marks Good use of data to judge whether an increase in AD is desirable in the context of the case. Answer will use case-study evidence from the data on at least one side of the debate – hence a well-contextualised two sided argument can be in this band even if there is no conclusion as long as both sides are well argued. Answer may question whether fiscal policy is appropriate, but this is not essential.
1
1 mark Limited understanding of
how fiscal policy can be
used to raise AD,
probably focuses just on
tax or spending rather
than both.
Or
A full understanding of
fiscal policy is given
without putting it into the
context of an increase in
AD.
1-2 marks Limited explanation of the likely impacts of using fiscal policy on the UK’s growth and/or side effects on other policy objectives. Points are likely to be assertion-based rather than developed and may depend heavily on unexplained AD/AS diagrams.
1-2 marks Limited evaluation.
The evaluation focuses solely on
the advantages and
disadvantages of fiscal policy
without putting the answer into
the context of this question.
0
0 marks No understanding of how fiscal policy can be used to increase AD is demonstrated.
0 marks No explanation or analysis.
0 marks No in context evaluation.
3 © WJEC CBAC Ltd.
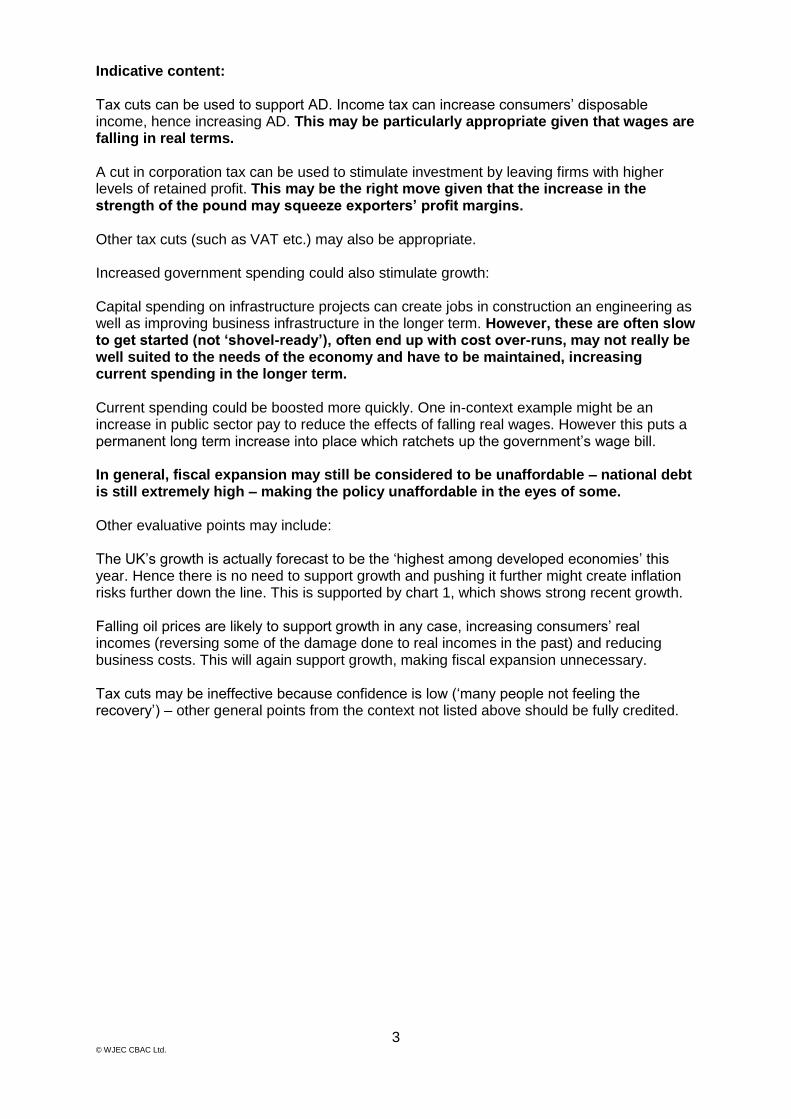
Indicative content: Tax cuts can be used to support AD. Income tax can increase consumers’ disposable income, hence increasing AD. This may be particularly appropriate given that wages are falling in real terms. A cut in corporation tax can be used to stimulate investment by leaving firms with higher levels of retained profit. This may be the right move given that the increase in the strength of the pound may squeeze exporters’ profit margins. Other tax cuts (such as VAT etc.) may also be appropriate. Increased government spending could also stimulate growth: Capital spending on infrastructure projects can create jobs in construction an engineering as well as improving business infrastructure in the longer term. However, these are often slow to get started (not ‘shovel-ready’), often end up with cost over-runs, may not really be well suited to the needs of the economy and have to be maintained, increasing current spending in the longer term. Current spending could be boosted more quickly. One in-context example might be an increase in public sector pay to reduce the effects of falling real wages. However this puts a permanent long term increase into place which ratchets up the government’s wage bill. In general, fiscal expansion may still be considered to be unaffordable – national debt is still extremely high – making the policy unaffordable in the eyes of some. Other evaluative points may include: The UK’s growth is actually forecast to be the ‘highest among developed economies’ this year. Hence there is no need to support growth and pushing it further might create inflation risks further down the line. This is supported by chart 1, which shows strong recent growth. Falling oil prices are likely to support growth in any case, increasing consumers’ real incomes (reversing some of the damage done to real incomes in the past) and reducing business costs. This will again support growth, making fiscal expansion unnecessary. Tax cuts may be ineffective because confidence is low (‘many people not feeling the recovery’) – other general points from the context not listed above should be fully credited.

4 © WJEC CBAC Ltd.
Q1 (c) (i) Using a supply and demand diagram explain why the price of oil fell sharply
in the second half of 2014. [4]
Band
AO1 AO2 Is the diagram correct and is an understanding of why price falls present?
Has the data been applied to explain the diagram?
2 marks 2 marks
2
2 marks Good understanding of diagram. Correct diagram showing a fall in demand for oil combined with an increase in supply.
Accept supply rising faster than an increase in demand. No major labeling errors are present and the diagram forms part of the answer.
2 marks Good use of context. Data is well used to support the diagram identifying both the global economic slowdown and shale gas in the US.
Each factor is linked to the relevant shift.
1
1 mark Limited use of diagram. Either the diagram has significant labeling errors, or it shows only one of the two shifts or the diagram does not form part of the answer.
1 mark Limited use of context. Data identifies only one of the two key factors or identifies both but fails to link the factors to supply and demand.
0
0 marks No shifts in supply or demand shown (or incorrect ones). Or labeling is so bad that the diagram is incomprehensible.
0 marks Case not used.
Indicative content:
The diagram above is also acceptable.
Demand for oil has decreased because the world economy is slowing thus the demand curve has shifted to the left from D1 to D2.
Supply has increased of the discovery of shale oil and gas in the US shifting the supply curve from S1 to S2.
Overall there is an increase in the quantity of oil as a result of these changes in market conditions.
5 © WJEC CBAC Ltd.
Q1 (c) ii)
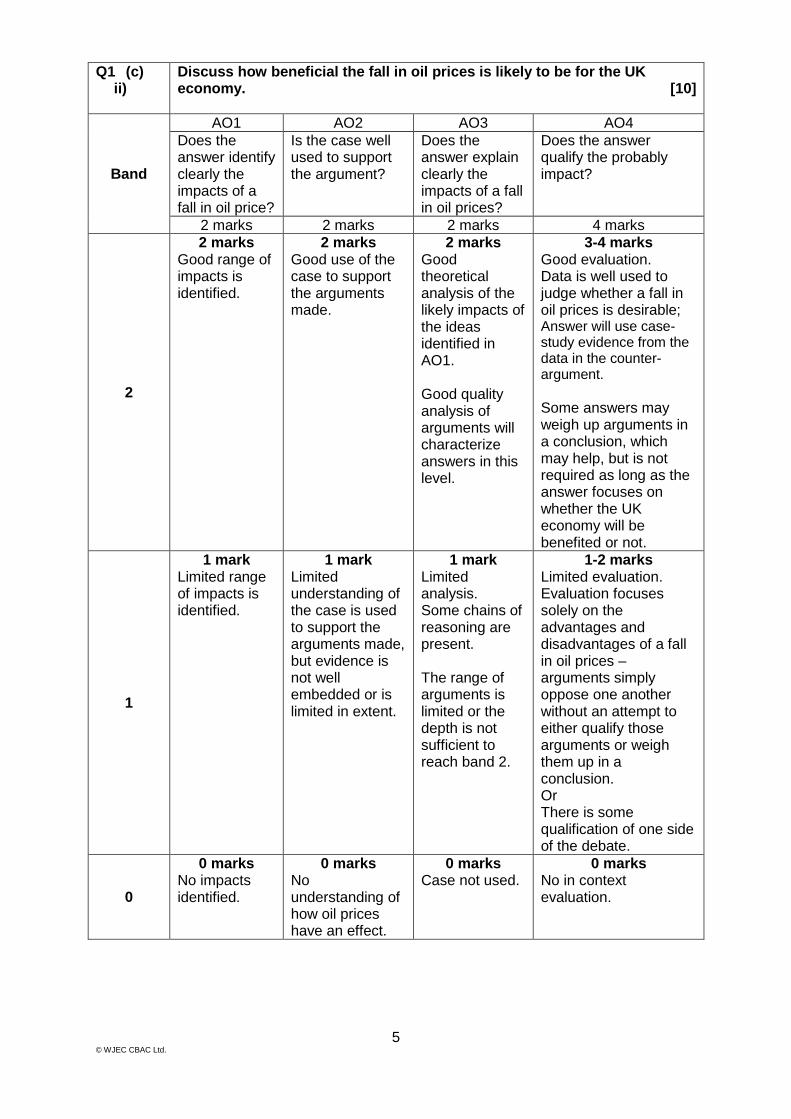
Discuss how beneficial the fall in oil prices is likely to be for the UK economy. [10]
Band
AO1 AO2 AO3 AO4
Does the answer identify clearly the impacts of a fall in oil price?
Is the case well used to support the argument?
Does the answer explain clearly the impacts of a fall in oil prices?
Does the answer qualify the probably impact?
2 marks 2 marks 2 marks 4 marks
2
2 marks Good range of impacts is identified.
2 marks Good use of the case to support the arguments made.
2 marks Good theoretical analysis of the likely impacts of the ideas identified in AO1. Good quality analysis of arguments will characterize answers in this level.
3-4 marks Good evaluation. Data is well used to judge whether a fall in oil prices is desirable; Answer will use case-study evidence from the data in the counter-argument. Some answers may weigh up arguments in a conclusion, which may help, but is not required as long as the answer focuses on whether the UK economy will be benefited or not.
1
1 mark Limited range of impacts is identified.
1 mark Limited understanding of the case is used to support the arguments made, but evidence is not well embedded or is limited in extent.
1 mark Limited analysis. Some chains of reasoning are present. The range of arguments is limited or the depth is not sufficient to reach band 2.
1-2 marks Limited evaluation. Evaluation focuses solely on the advantages and disadvantages of a fall in oil prices – arguments simply oppose one another without an attempt to either qualify those arguments or weigh them up in a conclusion. Or There is some qualification of one side of the debate.
0
0 marks No impacts identified.
0 marks No understanding of how oil prices have an effect.
0 marks Case not used.
0 marks No in context evaluation.
6 © WJEC CBAC Ltd.
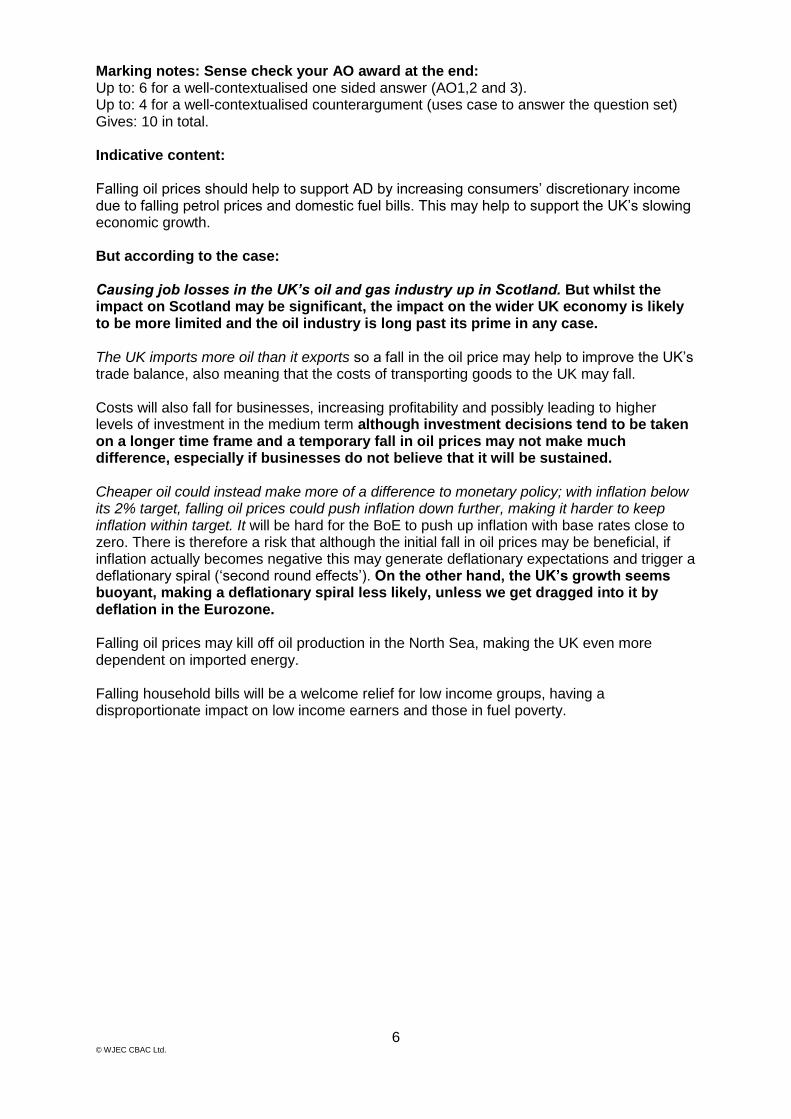
Marking notes: Sense check your AO award at the end: Up to: 6 for a well-contextualised one sided answer (AO1,2 and 3). Up to: 4 for a well-contextualised counterargument (uses case to answer the question set) Gives: 10 in total. Indicative content: Falling oil prices should help to support AD by increasing consumers’ discretionary income due to falling petrol prices and domestic fuel bills. This may help to support the UK’s slowing economic growth. But according to the case: Causing job losses in the UK’s oil and gas industry up in Scotland. But whilst the impact on Scotland may be significant, the impact on the wider UK economy is likely to be more limited and the oil industry is long past its prime in any case. The UK imports more oil than it exports so a fall in the oil price may help to improve the UK’s trade balance, also meaning that the costs of transporting goods to the UK may fall. Costs will also fall for businesses, increasing profitability and possibly leading to higher levels of investment in the medium term although investment decisions tend to be taken on a longer time frame and a temporary fall in oil prices may not make much difference, especially if businesses do not believe that it will be sustained. Cheaper oil could instead make more of a difference to monetary policy; with inflation below its 2% target, falling oil prices could push inflation down further, making it harder to keep inflation within target. It will be hard for the BoE to push up inflation with base rates close to zero. There is therefore a risk that although the initial fall in oil prices may be beneficial, if inflation actually becomes negative this may generate deflationary expectations and trigger a deflationary spiral (‘second round effects’). On the other hand, the UK’s growth seems buoyant, making a deflationary spiral less likely, unless we get dragged into it by deflation in the Eurozone. Falling oil prices may kill off oil production in the North Sea, making the UK even more dependent on imported energy. Falling household bills will be a welcome relief for low income groups, having a disproportionate impact on low income earners and those in fuel poverty.
7 © WJEC CBAC Ltd.
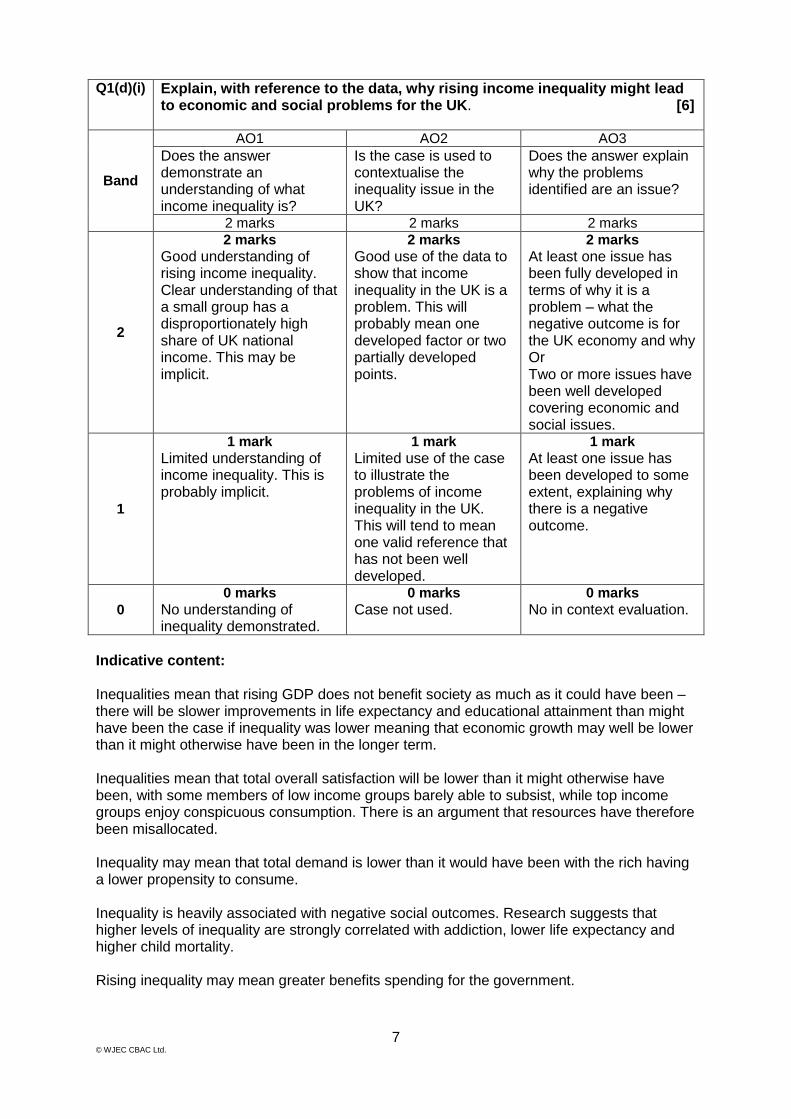
Q1(d)(i) Explain, with reference to the data, why rising income inequality might lead
to economic and social problems for the UK. [6]
Band
AO1 AO2 AO3
Does the answer demonstrate an understanding of what income inequality is?
Is the case is used to contextualise the inequality issue in the UK?
Does the answer explain why the problems identified are an issue?
2 marks 2 marks 2 marks
2
2 marks
Good understanding of rising income inequality. Clear understanding of that a small group has a disproportionately high share of UK national income. This may be implicit.
2 marks
Good use of the data to show that income inequality in the UK is a problem. This will probably mean one developed factor or two partially developed points.
2 marks
At least one issue has been fully developed in terms of why it is a problem – what the negative outcome is for the UK economy and why Or Two or more issues have been well developed covering economic and social issues.
1
1 mark
Limited understanding of income inequality. This is probably implicit.
1 mark
Limited use of the case to illustrate the problems of income inequality in the UK. This will tend to mean one valid reference that has not been well developed.
1 mark
At least one issue has been developed to some extent, explaining why there is a negative outcome.
0
0 marks No understanding of inequality demonstrated.
0 marks
Case not used. 0 marks
No in context evaluation.
Indicative content: Inequalities mean that rising GDP does not benefit society as much as it could have been – there will be slower improvements in life expectancy and educational attainment than might have been the case if inequality was lower meaning that economic growth may well be lower than it might otherwise have been in the longer term. Inequalities mean that total overall satisfaction will be lower than it might otherwise have been, with some members of low income groups barely able to subsist, while top income groups enjoy conspicuous consumption. There is an argument that resources have therefore been misallocated. Inequality may mean that total demand is lower than it would have been with the rich having a lower propensity to consume. Inequality is heavily associated with negative social outcomes. Research suggests that higher levels of inequality are strongly correlated with addiction, lower life expectancy and higher child mortality. Rising inequality may mean greater benefits spending for the government.
8 © WJEC CBAC Ltd.
Inequality is linked to rising crime rates and corruption as elites attempt to maintain their position with society. Data use: References are likely to include: “Most people are still not feeling the recovery". The UK is now the only leading economy where inequality is greater than at the turn of the century. As the rich have got richer, low and middle-income households have been squeezed by falling real incomes caused by years of rising household bills and lack of wage increases.

9 © WJEC CBAC Ltd.
Q1 (d) (ii) Evaluate the extent to which a more progressive tax system will reduce income inequality in the UK. [6]
Band
AO1 AO3 AO4 Does the answer show an understanding of what a more progressive tax system means?
Does the answer explain how these policies will reduce income inequality?
Does the answer consider the probable effectiveness of the increase in the progressivity of the system in reducing income inequality?
2 marks 2 marks 2 marks
2
2 marks Good understanding of an increase in the progressive nature of the system is shown through the candidate’s response - a definition is not necessary, but a clear understanding of how the system could be made more progressive will be present, probably beyond just increasing the top rate of tax (unless this is very well developed) and looking at cutting basic rate of tax, changing tax allowances etc.
2 marks Good explanation of how the ideas identified in AO1 might reduce income inequalities in the UK – answers in this band will probably explain ways that the poor will be richer and the rich will be poorer, although one very well developed argument (such as an increase in the top rate of tax, where the answer argues that the revenue generated can then be pumped into health and education) would be in this band.
2 marks Good evaluation. There is clear understanding of reasons that the policies identified might be only partially successful or fail altogether. A well-developed qualification of one main policy could be in this band, but it is more likely that a shorter discussion of a couple of policies will be present. If there is only evaluation of one of the ideas, the evaluation will need to be well analysed to reach this band.
1
1 mark Limited understanding of what making the tax system more progressive might mean, probably centred on the increase in the top rate of tax mentioned in the data (but if this is well explained in the context of progressivity, this could be a band 2 response).
1 mark Limited explanation of how the policies identified will reduce income inequality, perhaps a limited analysis of one aspect of the increase in the progressivity of the tax system.
1 mark Limited evaluation is present, but lacking in either breadth or depth. Most probably one main evaluative point has been made, but has not been well-developed.
0
0 marks No clear understanding of what a progressive tax system might mean is demonstrated.
0 marks Superficial assertion of points without meaningful development – really not building on AO1.
0 marks Evaluation looks at side effects rather than effectiveness, including throw-away comments ‘it depends on the size of the cut’ etc. or fails to evaluate at all.
10 © WJEC CBAC Ltd.
Indicative content: Could increase the top rate of tax (as labour has promised). This will reduce the after tax income of the very richest members of society, hence helping to reduce income inequality. The proceeds could be used to improve the health and education systems giving better life chances to all. However, top earners may be able to avoid the tax fairly straightforwardly and in any case, only a relatively few people are in the highest tax bracket, making its impact relatively small. Laffer curve could be used. Could increase tax credits, allowing those with the least income and wealth to earn more. However there is a risk that increasing the safety net creates a disincentive to work therefore creating a larger underclass that is increasingly left behind by those in work – the short term effects might be larger than the long term effects. Could increase the personal allowance/cut the basic rate of tax. These will benefit all those in work and on low incomes, hence helping to narrow the gap with the highest earners, however, they will have no effect on those who are already earning less than the personal allowance, on benefits and so on (although it might create more incentives to work). Cuts in VAT/indirect taxes generally might make the tax system more progressive and would increase the purchasing power of low income groups to a great extent than higher income groups, hence reducing income inequality, but the cut would need to be quite sharp to make a major difference, many essential items are already zero rated and cuts in excise duties might have longer term health consequences that might negate their short term effects. Many of these policies will do little to tackle wealth inequality, which many argue is at the root of the problem by perpetuating and consolidating inequality across generations. Allow other changes to the tax system that make sense
11 © WJEC CBAC Ltd.
Q2 (a)
Explain what is meant by ‘all figures at 2010 prices’. (Figure 3)
Total 2
AO2 Candidate explains accurately how figures for years subsequent to 2010 have been adjusted to the price levels prevailing in that year. 2 marks Showing some understanding of the fact that figures have been adjusted for inflation/ are in real terms is a limited explanation. 1 mark
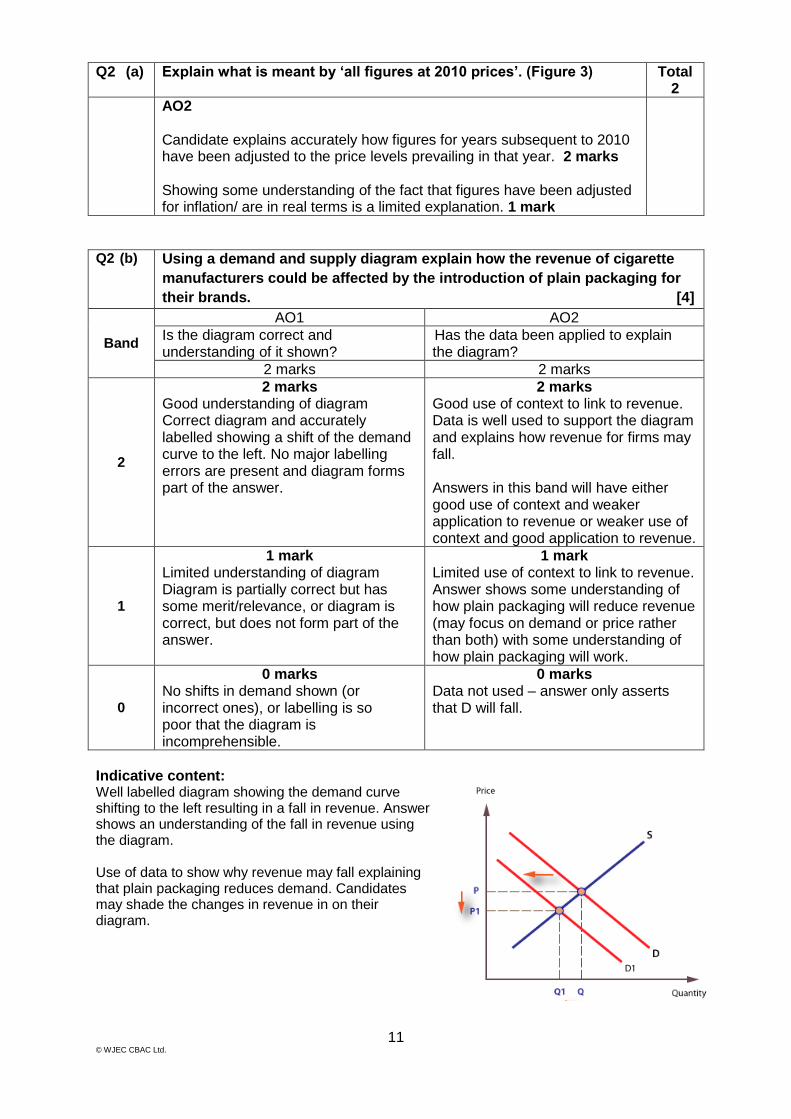
Q2 (b) Using a demand and supply diagram explain how the revenue of cigarette
manufacturers could be affected by the introduction of plain packaging for
their brands. [4]
Band
AO1 AO2
Is the diagram correct and understanding of it shown?
Has the data been applied to explain the diagram?
2 marks 2 marks
2
2 marks Good understanding of diagram Correct diagram and accurately labelled showing a shift of the demand curve to the left. No major labelling errors are present and diagram forms part of the answer.
2 marks Good use of context to link to revenue. Data is well used to support the diagram and explains how revenue for firms may fall. Answers in this band will have either good use of context and weaker application to revenue or weaker use of context and good application to revenue.
1
1 mark Limited understanding of diagram Diagram is partially correct but has some merit/relevance, or diagram is correct, but does not form part of the answer.
1 mark Limited use of context to link to revenue. Answer shows some understanding of how plain packaging will reduce revenue (may focus on demand or price rather than both) with some understanding of how plain packaging will work.
0
0 marks No shifts in demand shown (or incorrect ones), or labelling is so poor that the diagram is incomprehensible.
0 marks Data not used – answer only asserts that D will fall.
Indicative content: Well labelled diagram showing the demand curve shifting to the left resulting in a fall in revenue. Answer shows an understanding of the fall in revenue using the diagram. Use of data to show why revenue may fall explaining that plain packaging reduces demand. Candidates may shade the changes in revenue in on their diagram.
12 © WJEC CBAC Ltd.
Q2 (c) How does the growing of both tobacco and the smoking of cigarettes produce external costs? [8]
Band
AO1 AO2
Is good knowledge of external costs shown?
Is the data well used in the context of external costs?
4 marks 4 marks
2
3-4 marks Good understanding of both external costs of consumption and production showing a clear understanding of why the costs are ‘external’ – third party effects are clear – and there is clear understanding of what the difference between production and consumption externalities.
3-4 marks Good use of the data to show how smoking produces external costs from consumption and growing tobacco produces external costs from production. Well-developed examples of both consumption and production externalities focusing on issues other than just government spending on healthcare.
1
1-2 marks Limited understanding of external costs of consumption and production or good knowledge of one type of external cost.
1-2 marks Limited use of the data to illustrate the issues of external costs from consumption and production. Either only consumption or production externalities are covered in detail or bother are covered superficially.
0 0 marks
No knowledge of external costs is shown.
0 marks Data not used.
Indicative content: AO1: Answer shows an understanding of external costs in general. External costs are a cost imposed on third parties as a result of the consumption or production of a product. High band answers will show a clear understanding of the way in which the costs are external; i.e. they are clear that the external costs affect third parties/wider society. AO2: Use of the data to show how smoking and growing tobacco produce external costs. Answer shows why these are external costs: External costs of consumption (smoking). Examples include: passive smoking, litter, fires, overuse of health facilities which impose costs on non-smokers. External costs of production (growing tobacco) – pesticides and fertilisers degrading soils and water and affecting health of farmers– imposing costs on wider society.
13 © WJEC CBAC Ltd.
Q2 (d) With the aid of the data discuss the view that the price elasticity of supply of tobacco is inelastic. [6]
Band
AO1 AO2 AO4
Does the answer show clear knowledge of price elasticity of supply?
Does the answer explain using the context the inelasticity of supply of tobacco?
Does the answer qualify whether price elasticity of supply is always inelastic?
2 marks 2 marks 2 marks
2
2 marks Answer shows a good understanding of price elasticity of supply – sensitivity of supply to a change in price.
2 marks Good use of the data explaining two features of the context, possibly conjoined or one well developed.
2 marks Good evaluation. At least one evaluation point made well developed.
1
1 mark Limited understanding. Answer demonstrates a partial knowledge of price elasticity of supply, failing to show an understanding of proportionality.
1 mark Limited use of the data to explain price elasticity of supply.
1 mark Limited evaluation. One evaluation point made but not developed.
0
0 marks Answer shows no knowledge price elasticity of supply.
0 marks No use of the data.
0 marks No attempt at evaluation.
Indicative content: AO1: Correct definition of price elasticity of supply or the equation or clear understanding that it measures the proportional responsiveness of supply to a change in price. AO2: Short run price elasticity of supply is inelastic: Growing season (4 months to grow), Perishability (can’t easily be stored) SR PES +0.34 (less than 1.0). AO4: Long run price elasticity of supply is more elastic: All factors of production variable etc. New areas of land can be used to grow tobacco/new countries can enter the market. Might be possible to store processed tobacco. Tobacco is grown all over the world, therefore might just be able to import.
14 © WJEC CBAC Ltd.
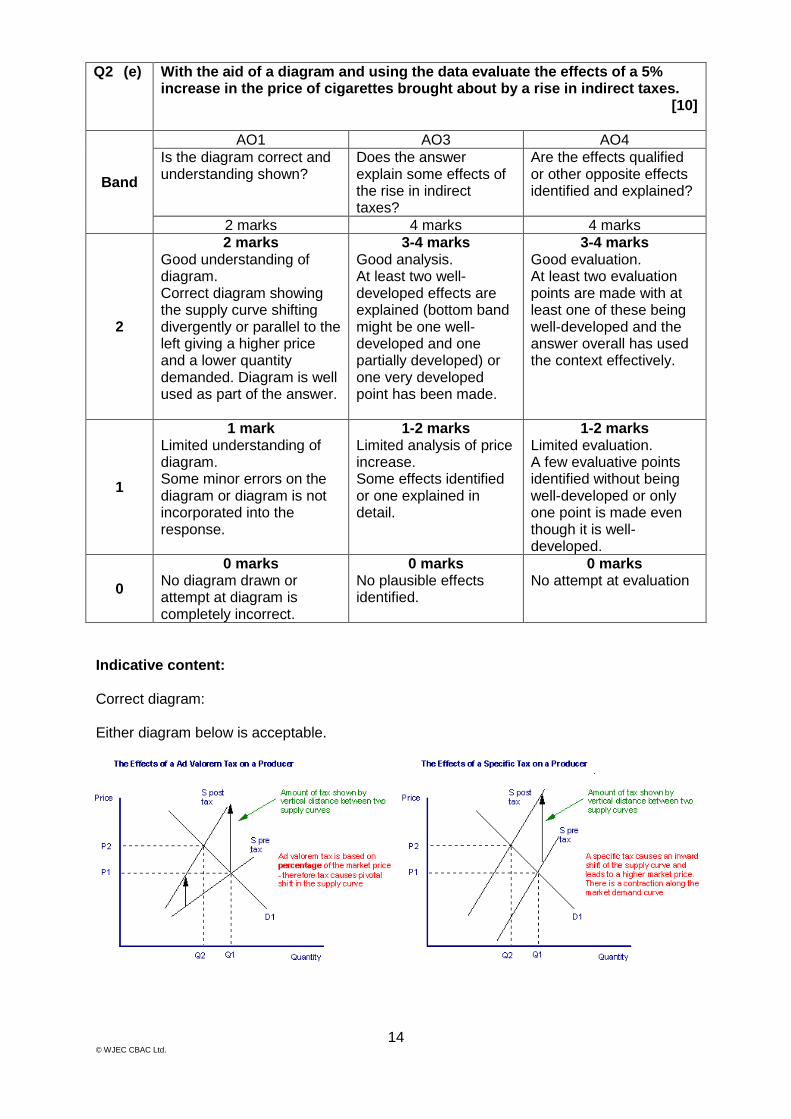
Q2 (e) With the aid of a diagram and using the data evaluate the effects of a 5% increase in the price of cigarettes brought about by a rise in indirect taxes. [10]
Band
AO1 AO3 AO4
Is the diagram correct and understanding shown?
Does the answer explain some effects of the rise in indirect taxes?
Are the effects qualified or other opposite effects identified and explained?
2 marks 4 marks 4 marks
2
2 marks Good understanding of diagram. Correct diagram showing the supply curve shifting divergently or parallel to the left giving a higher price and a lower quantity demanded. Diagram is well used as part of the answer.
3-4 marks Good analysis. At least two well-developed effects are explained (bottom band might be one well-developed and one partially developed) or one very developed point has been made.
3-4 marks Good evaluation. At least two evaluation points are made with at least one of these being well-developed and the answer overall has used the context effectively.
1
1 mark Limited understanding of diagram. Some minor errors on the diagram or diagram is not incorporated into the response.
1-2 marks Limited analysis of price increase. Some effects identified or one explained in detail.
1-2 marks Limited evaluation. A few evaluative points identified without being well-developed or only one point is made even though it is well-developed.
0
0 marks No diagram drawn or attempt at diagram is completely incorrect.
0 marks No plausible effects identified.
0 marks No attempt at evaluation
Indicative content: Correct diagram: Either diagram below is acceptable.
15 © WJEC CBAC Ltd.
Marker notes: Diagram is worth 2 by itself if incorporated (2), then allow up to 4 for one side (positive/negative effects) (AO3) and 4 for the other (negative/positive effects) (AO4). To get band 2 AO4, the answer must use the context effectively on one side or the other. Possible effects: Increased price deters/reduces consumption (data figure 2) but demand may be price inelastic. Improved health less demand on the NHS (figure 3). Improved fiscal position tax revenue etc (data figure 3) but pensioner benefits increase due to increased life expectancy. Less passive smoking damage/litter/fires. Improved productivity fewer days lost dues to sickness and cigarette breaks. Internalises the externality but difficult to measure the value of external costs. Increased price of cigarettes can impact negatively on inflation. Damage to employment and output in the UK (data). Increased smuggling/illicit purchase/avoidance (data).
16 © WJEC CBAC Ltd.
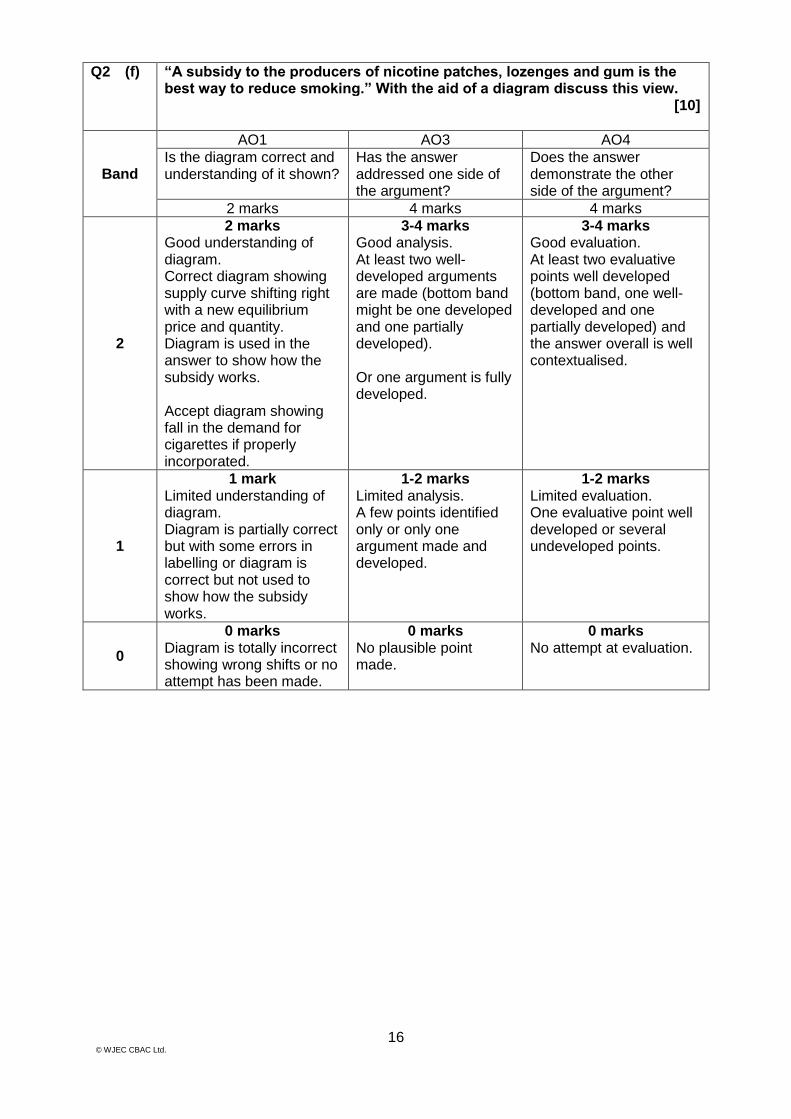
Q2 (f) “A subsidy to the producers of nicotine patches, lozenges and gum is the best way to reduce smoking.” With the aid of a diagram discuss this view. [10]
Band
AO1 AO3 AO4
Is the diagram correct and understanding of it shown?
Has the answer addressed one side of the argument?
Does the answer demonstrate the other side of the argument?
2 marks 4 marks 4 marks
2
2 marks Good understanding of diagram. Correct diagram showing supply curve shifting right with a new equilibrium price and quantity. Diagram is used in the answer to show how the subsidy works. Accept diagram showing fall in the demand for cigarettes if properly incorporated.
3-4 marks Good analysis. At least two well-developed arguments are made (bottom band might be one developed and one partially developed). Or one argument is fully developed.
3-4 marks Good evaluation. At least two evaluative points well developed (bottom band, one well-developed and one partially developed) and the answer overall is well contextualised.
1
1 mark Limited understanding of diagram. Diagram is partially correct but with some errors in labelling or diagram is correct but not used to show how the subsidy works.
1-2 marks Limited analysis. A few points identified only or only one argument made and developed.
1-2 marks Limited evaluation. One evaluative point well developed or several undeveloped points.
0
0 marks Diagram is totally incorrect showing wrong shifts or no attempt has been made.
0 marks No plausible point made.
0 marks No attempt at evaluation.
17 © WJEC CBAC Ltd.
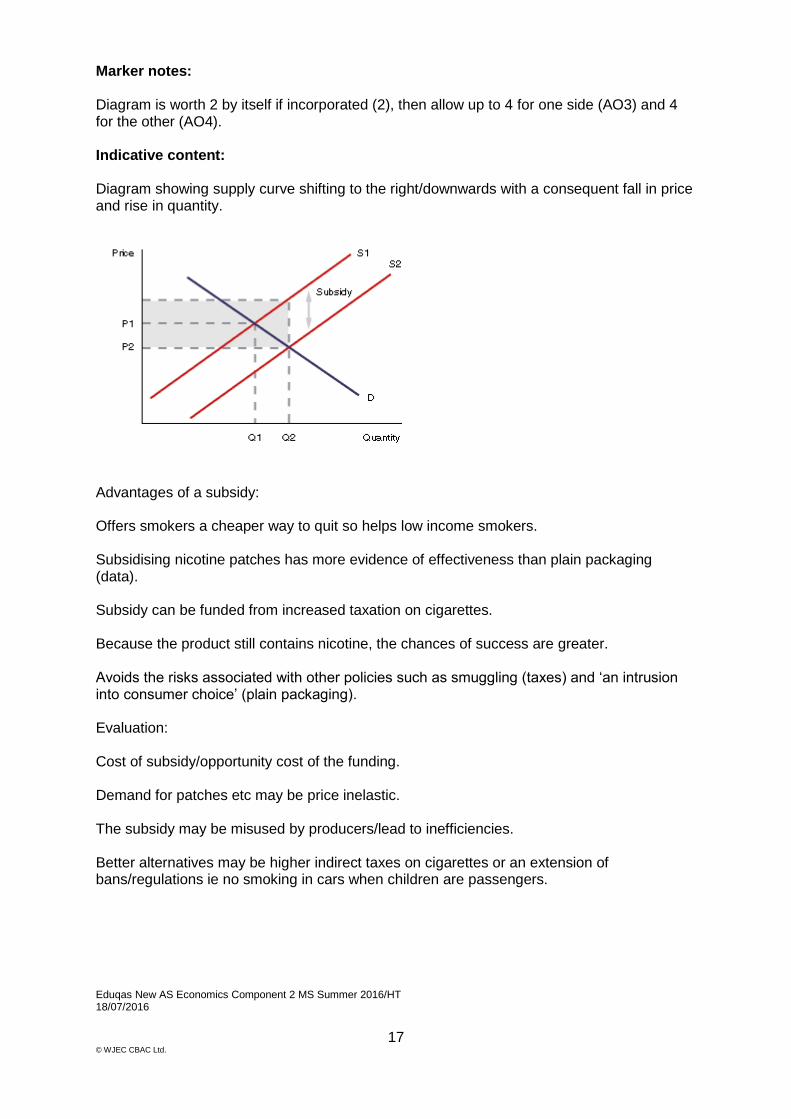
Marker notes: Diagram is worth 2 by itself if incorporated (2), then allow up to 4 for one side (AO3) and 4 for the other (AO4). Indicative content: Diagram showing supply curve shifting to the right/downwards with a consequent fall in price and rise in quantity.
Advantages of a subsidy: Offers smokers a cheaper way to quit so helps low income smokers. Subsidising nicotine patches has more evidence of effectiveness than plain packaging (data). Subsidy can be funded from increased taxation on cigarettes. Because the product still contains nicotine, the chances of success are greater. Avoids the risks associated with other policies such as smuggling (taxes) and ‘an intrusion into consumer choice’ (plain packaging). Evaluation: Cost of subsidy/opportunity cost of the funding. Demand for patches etc may be price inelastic. The subsidy may be misused by producers/lead to inefficiencies. Better alternatives may be higher indirect taxes on cigarettes or an extension of bans/regulations ie no smoking in cars when children are passengers. Eduqas New AS Economics Component 2 MS Summer 2016/HT 18/07/2016
Related Documents