March 2014 Activity Snapshot One-Year Change in One-Year Change in Closed Sales Median Sales Price 2 3 4 5 6 7 8 9 10 11 12 Click on desired metric to jump to that page. Current as of April 10, 2014. All data from the Greater Baton Rouge Association of REALTORS® MLS. Information deemed reliable but not guaranteed. Powered by 10K Research and Marketing. Pending Sales Closed Sales Days on Market Until Sale Median Sales Price Average Sales Price Percent of List Price Received During this year's spring refresh, seller activity is the first item on the watch list. Low inventory has been a national headline grabber, and many are eager to see if this is the year that brings a bevy of new properties to market for ready-to- buyers. Investor activity and cash purchases should be monitored, as well, along with any increases in new construction. And although interest rates are up from their all-time lows, borrowing costs are still remarkably affordable. It's cheaper to own than to rent in most of the country. New Listings in Greater Baton Rouge decreased 8.8 percent to 1,106. Pending Sales were up 10.3 percent to 968. Inventory levels shrank 9.8 percent to 3,795 units. Prices remained determined. The Median Sales Price increased 5.9 percent to $178,005. Days on Market was up 1.1 percent to 94 days. Absorption rates improved as Months Supply of Inventory was down 17.5 percent to 5.2 months. Consumers are in better shape for the current financial landscape, just in time for the primary home-buying season. Along with an uptick in consumer confidence, GDP growth was revised up to 2.6 percent by the Commerce Department. Consumer spending has risen and claims for unemployment benefits have decreased. Economic health fuels housing market growth. Employed, confident people with rising incomes tend to purchase real property. Homes for Sale A research tool provided by the Greater Baton Rouge Association of REALTORS®. Residential real estate activity comprised of single-family properties, townhomes and condominiums combined. Percent changes are calculated using rounded figures. Activity Overview New Listings Housing Affordability Index Inventory of Homes for Sale Months Supply of Inventory Monthly Indicators - 14.6% + 5.9% - 9.8% One-Year Change in

Welcome message from author
This document is posted to help you gain knowledge. Please leave a comment to let me know what you think about it! Share it to your friends and learn new things together.
Transcript
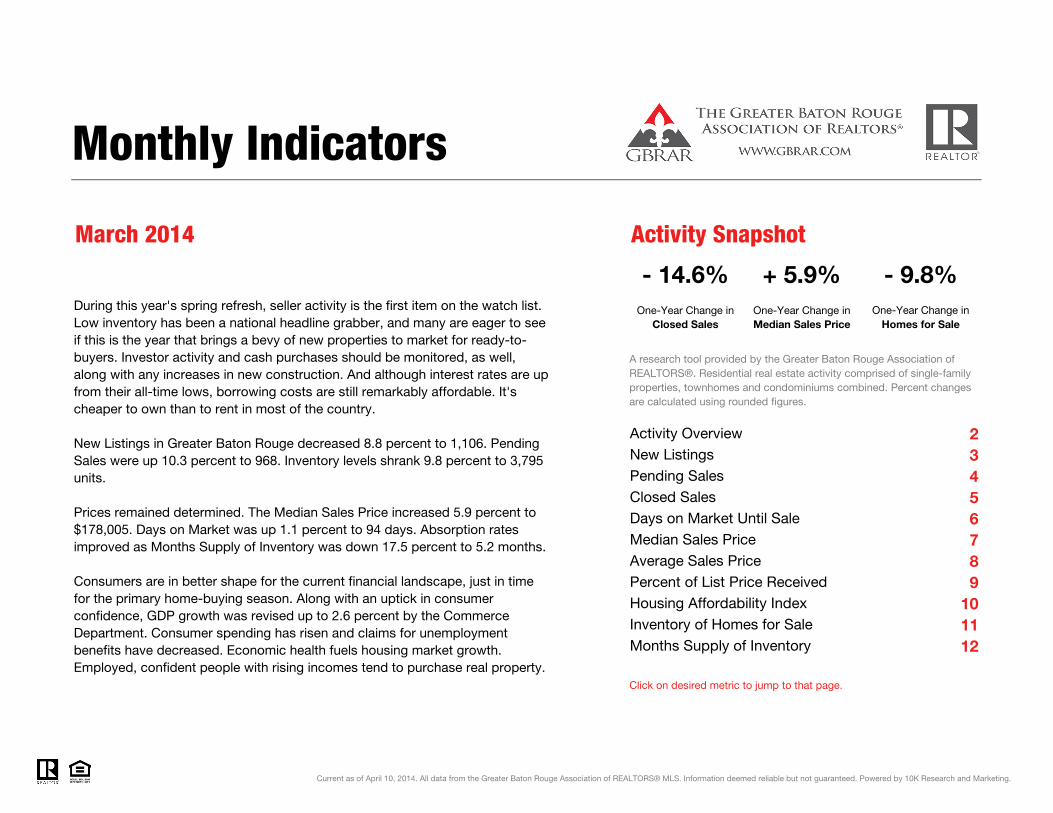
March 2014 Activity Snapshot
One-Year Change in One-Year Change inClosed Sales Median Sales Price
23456789
101112
Click on desired metric to jump to that page.
Current as of April 10, 2014. All data from the Greater Baton Rouge Association of REALTORS® MLS. Information deemed reliable but not guaranteed. Powered by 10K Research and Marketing.
Pending SalesClosed SalesDays on Market Until SaleMedian Sales PriceAverage Sales PricePercent of List Price Received
During this year's spring refresh, seller activity is the first item on the watch list. Low inventory has been a national headline grabber, and many are eager to see if this is the year that brings a bevy of new properties to market for ready-to-buyers. Investor activity and cash purchases should be monitored, as well, along with any increases in new construction. And although interest rates are up from their all-time lows, borrowing costs are still remarkably affordable. It's cheaper to own than to rent in most of the country.
New Listings in Greater Baton Rouge decreased 8.8 percent to 1,106. Pending Sales were up 10.3 percent to 968. Inventory levels shrank 9.8 percent to 3,795 units.
Prices remained determined. The Median Sales Price increased 5.9 percent to $178,005. Days on Market was up 1.1 percent to 94 days. Absorption rates improved as Months Supply of Inventory was down 17.5 percent to 5.2 months.
Consumers are in better shape for the current financial landscape, just in time for the primary home-buying season. Along with an uptick in consumer confidence, GDP growth was revised up to 2.6 percent by the Commerce Department. Consumer spending has risen and claims for unemployment benefits have decreased. Economic health fuels housing market growth. Employed, confident people with rising incomes tend to purchase real property.
Homes for Sale
A research tool provided by the Greater Baton Rouge Association of REALTORS®. Residential real estate activity comprised of single-family properties, townhomes and condominiums combined. Percent changes are calculated using rounded figures.
Activity OverviewNew Listings
Housing Affordability IndexInventory of Homes for SaleMonths Supply of Inventory
Monthly Indicators
- 14.6% + 5.9% - 9.8%One-Year Change in
Activity Overview
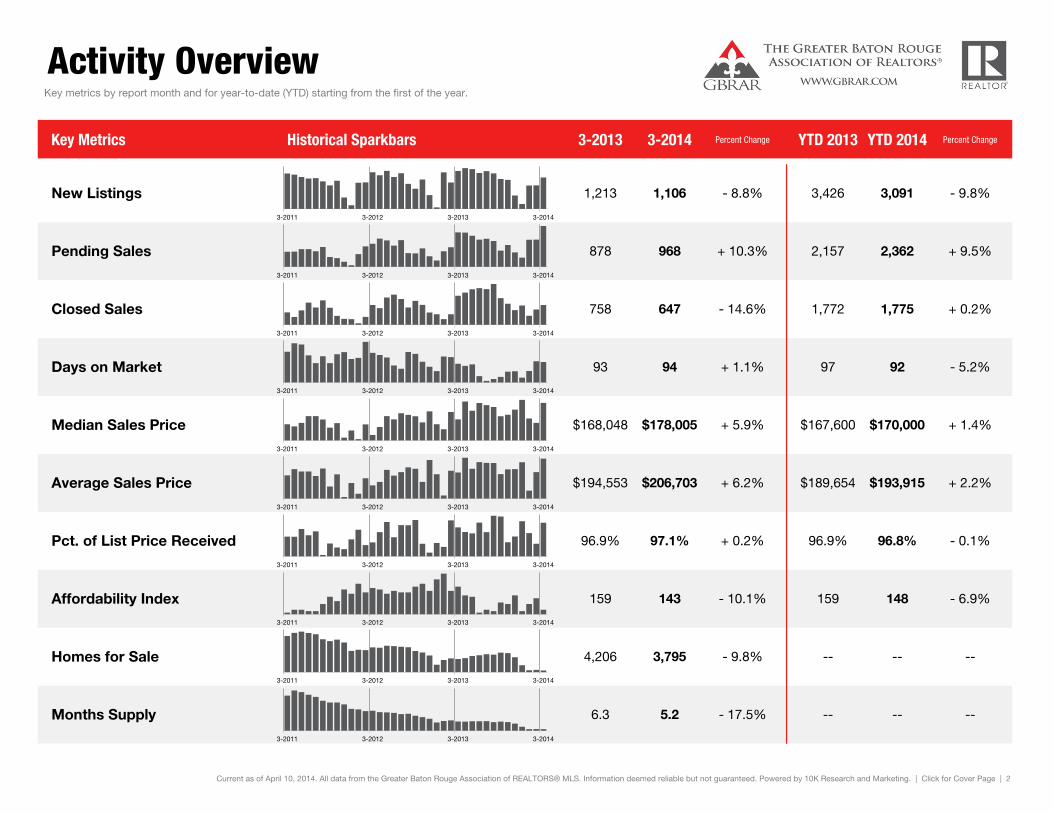
Key Metrics Historical Sparkbars 3-2013 3-2014 Percent Change YTD 2013 YTD 2014 Percent Change
Current as of April 10, 2014. All data from the Greater Baton Rouge Association of REALTORS® MLS. Information deemed reliable but not guaranteed. Powered by 10K Research and Marketing. | Click for Cover Page | 2
- 0.1%
Affordability Index 159 143 - 10.1% 159 148 - 6.9%
Pct. of List Price Received 96.9% 97.1% + 0.2% 96.9% 96.8%
--
-- --
Homes for Sale 4,206 3,795 - 9.8% -- --
Months Supply 6.3 5.2 - 17.5% --
+ 1.4%
Average Sales Price $194,553 $206,703 + 6.2% $189,654 $193,915 + 2.2%
Median Sales Price $168,048 $178,005 + 5.9% $167,600 $170,000
+ 0.2%
Days on Market 93 94 + 1.1% 97 92 - 5.2%
Closed Sales 758 647 - 14.6% 1,772 1,775
Key metrics by report month and for year-to-date (YTD) starting from the first of the year.
New Listings 1,213 1,106 - 8.8% 3,091 - 9.8%
Pending Sales 878 968 + 10.3% 2,157 2,362 + 9.5%
3,426
3-2011 3-2012 3-2013 3-2014
3-2011 3-2012 3-2013 3-2014
3-2011 3-2012 3-2013 3-2014
3-2011 3-2012 3-2013 3-2014
3-2011 3-2012 3-2013 3-2014
3-2011 3-2012 3-2013 3-2014
3-2011 3-2012 3-2013 3-2014
3-2011 3-2012 3-2013 3-2014
3-2011 3-2012 3-2013 3-2014
3-2011 3-2012 3-2013 3-2014
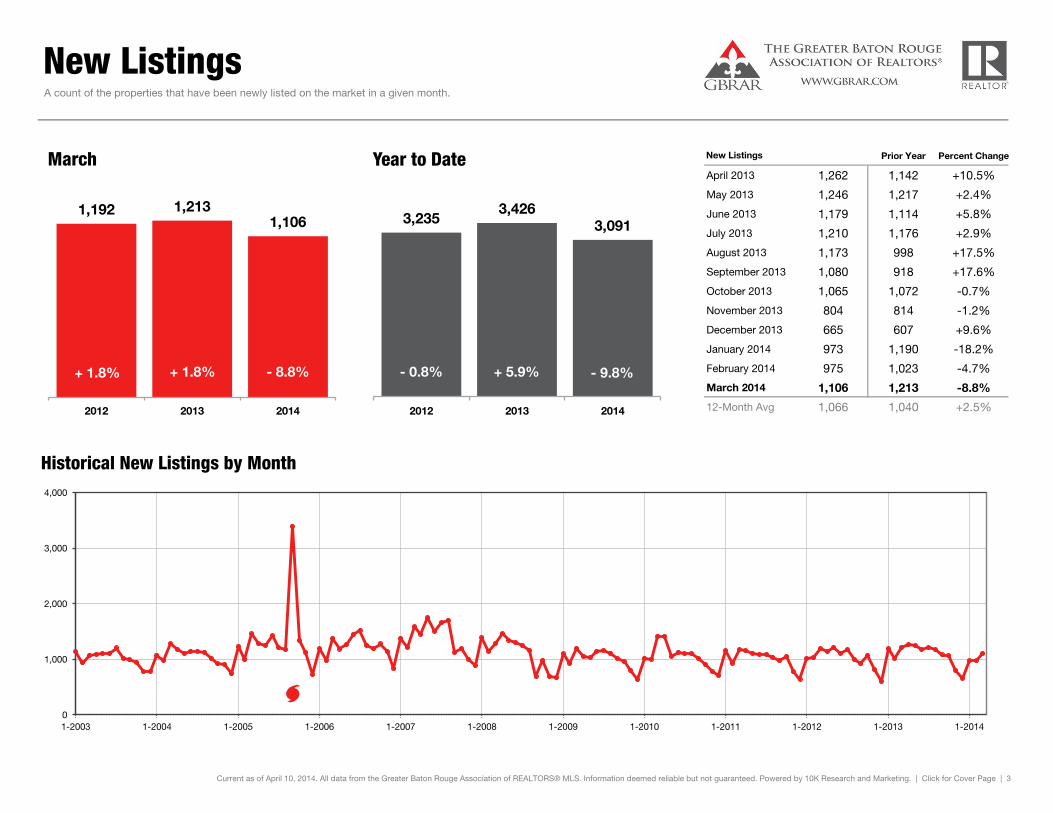
New Listings
Prior Year Percent Change
April 2013 1,262 1,142 +10.5%
May 2013 1,246 1,217 +2.4%
June 2013 1,179 1,114 +5.8%
July 2013 1,210 1,176 +2.9%
August 2013 1,173 998 +17.5%
September 2013 1,080 918 +17.6%
October 2013 1,065 1,072 -0.7%
November 2013 804 814 -1.2%
December 2013 665 607 +9.6%
January 2014 973 1,190 -18.2%
February 2014 975 1,023 -4.7%
March 2014 1,106 1,213 -8.8%
12-Month Avg 1,066 1,040 +2.5%
Historical New Listings by Month
Current as of April 10, 2014. All data from the Greater Baton Rouge Association of REALTORS® MLS. Information deemed reliable but not guaranteed. Powered by 10K Research and Marketing. | Click for Cover Page | 3
A count of the properties that have been newly listed on the market in a given month.
New Listings
1,192 1,213 1,106
2012 2013 2014
March
0
1,000
2,000
3,000
4,000
1-2003 1-2004 1-2005 1-2006 1-2007 1-2008 1-2009 1-2010 1-2011 1-2012 1-2013 1-2014
3,235 3,426
3,091
2012 2013 2014
Year to Date
- 9.8% + 1.8% - 8.8% + 5.9% + 1.8% - 0.8%
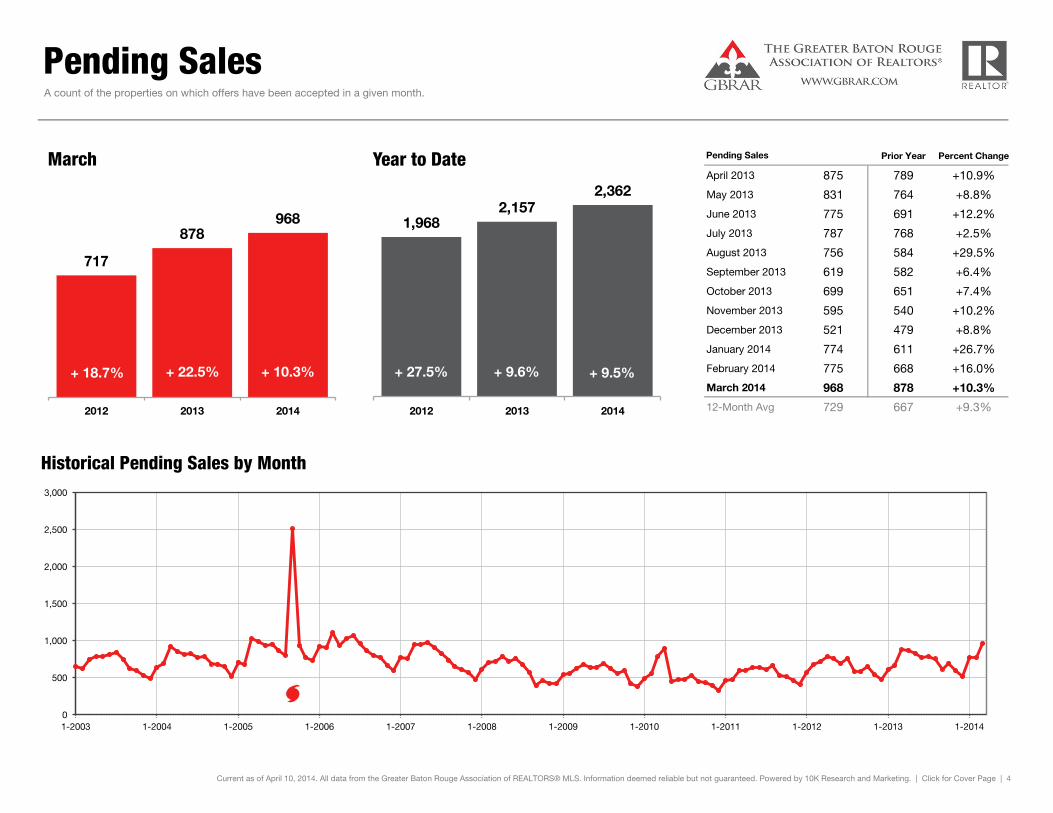
Pending Sales
Prior Year Percent Change
April 2013 875 789 +10.9%
May 2013 831 764 +8.8%
June 2013 775 691 +12.2%
July 2013 787 768 +2.5%
August 2013 756 584 +29.5%
September 2013 619 582 +6.4%
October 2013 699 651 +7.4%
November 2013 595 540 +10.2%
December 2013 521 479 +8.8%
January 2014 774 611 +26.7%
February 2014 775 668 +16.0%
March 2014 968 878 +10.3%
12-Month Avg 729 667 +9.3%
Historical Pending Sales by Month
Current as of April 10, 2014. All data from the Greater Baton Rouge Association of REALTORS® MLS. Information deemed reliable but not guaranteed. Powered by 10K Research and Marketing. | Click for Cover Page | 4
A count of the properties on which offers have been accepted in a given month.
Pending Sales
717
878 968
2012 2013 2014
March
0
500
1,000
1,500
2,000
2,500
3,000
1-2003 1-2004 1-2005 1-2006 1-2007 1-2008 1-2009 1-2010 1-2011 1-2012 1-2013 1-2014
1,968 2,157
2,362
2012 2013 2014
Year to Date
+ 9.5% + 22.5% + 10.3% + 9.6% + 18.7% + 27.5%
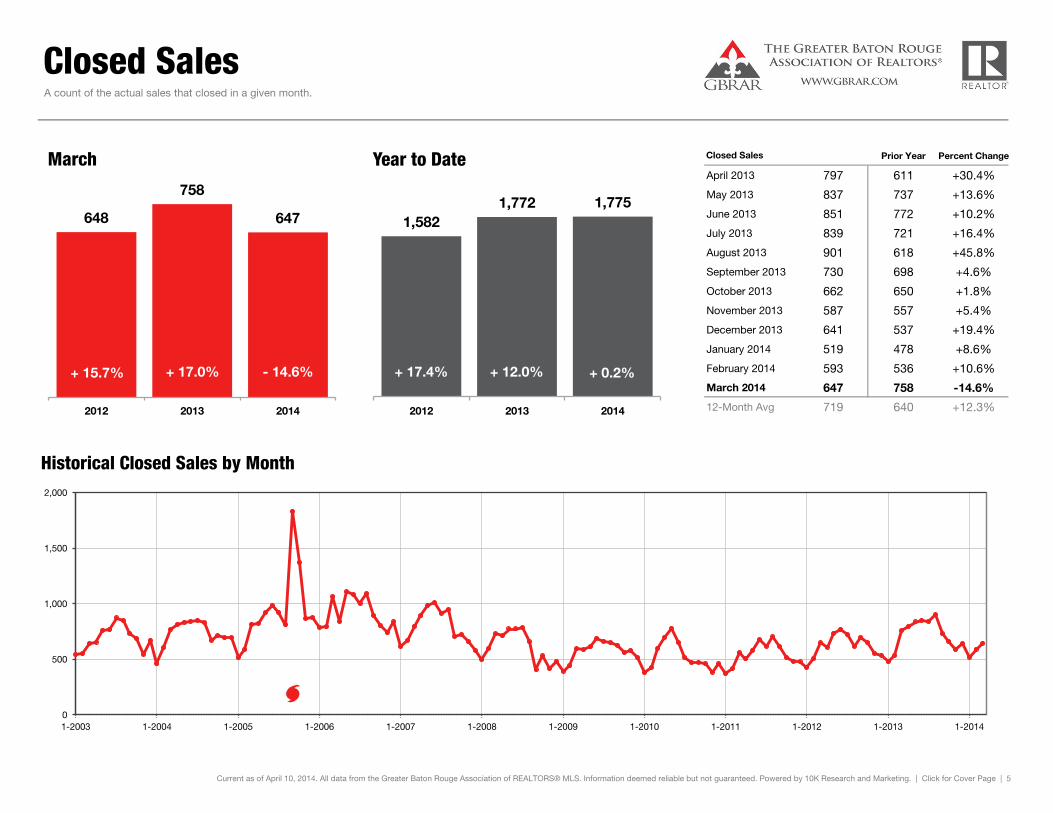
Closed Sales
Prior Year Percent Change
April 2013 797 611 +30.4%
May 2013 837 737 +13.6%
June 2013 851 772 +10.2%
July 2013 839 721 +16.4%
August 2013 901 618 +45.8%
September 2013 730 698 +4.6%
October 2013 662 650 +1.8%
November 2013 587 557 +5.4%
December 2013 641 537 +19.4%
January 2014 519 478 +8.6%
February 2014 593 536 +10.6%
March 2014 647 758 -14.6%
12-Month Avg 719 640 +12.3%
Historical Closed Sales by Month
Current as of April 10, 2014. All data from the Greater Baton Rouge Association of REALTORS® MLS. Information deemed reliable but not guaranteed. Powered by 10K Research and Marketing. | Click for Cover Page | 5
A count of the actual sales that closed in a given month.
Closed Sales
648
758
647
2012 2013 2014
March
0
500
1,000
1,500
2,000
1-2003 1-2004 1-2005 1-2006 1-2007 1-2008 1-2009 1-2010 1-2011 1-2012 1-2013 1-2014
1,582 1,772 1,775
2012 2013 2014
Year to Date
+ 0.2% + 17.0% - 14.6% + 12.0% + 15.7% + 17.4%
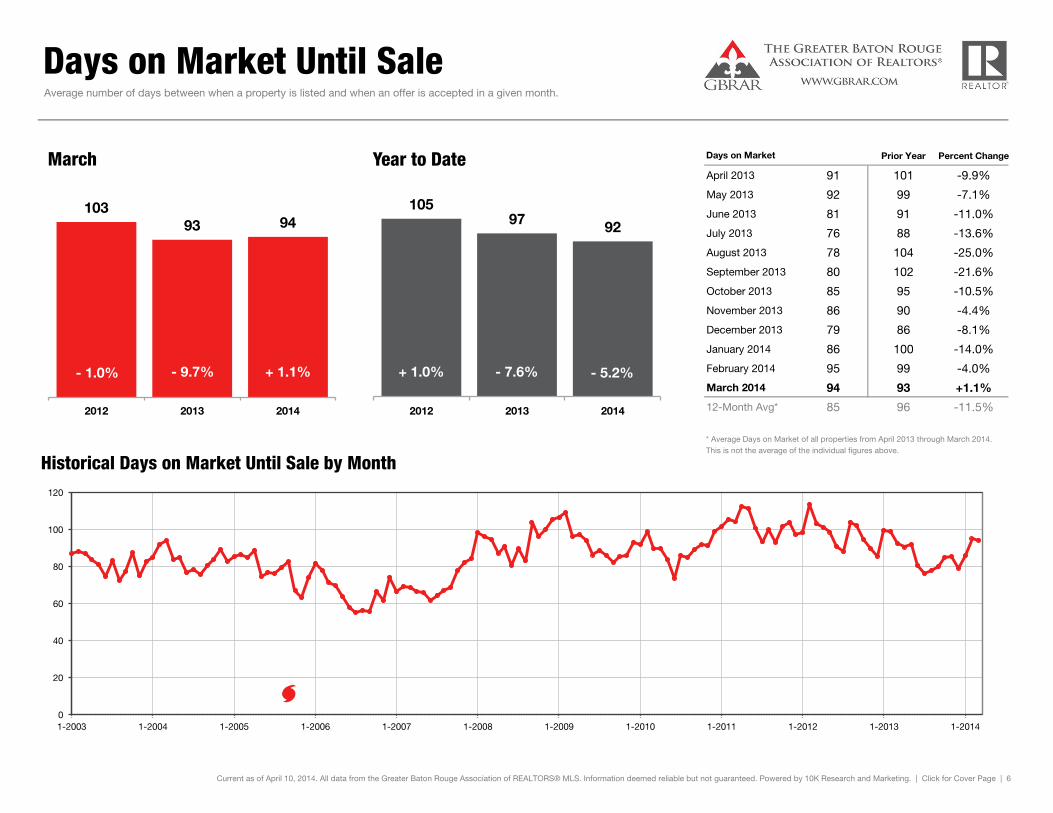
Days on Market Until Sale
Prior Year Percent Change
April 2013 91 101 -9.9%
May 2013 92 99 -7.1%
June 2013 81 91 -11.0%
July 2013 76 88 -13.6%
August 2013 78 104 -25.0%
September 2013 80 102 -21.6%
October 2013 85 95 -10.5%
November 2013 86 90 -4.4%
December 2013 79 86 -8.1%
January 2014 86 100 -14.0%
February 2014 95 99 -4.0%
March 2014 94 93 +1.1%
12-Month Avg* 85 96 -11.5%
Historical Days on Market Until Sale by Month
Current as of April 10, 2014. All data from the Greater Baton Rouge Association of REALTORS® MLS. Information deemed reliable but not guaranteed. Powered by 10K Research and Marketing. | Click for Cover Page | 6
Average number of days between when a property is listed and when an offer is accepted in a given month.
Days on Market
* Average Days on Market of all properties from April 2013 through March 2014. This is not the average of the individual figures above.
103 93 94
2012 2013 2014
March
0
20
40
60
80
100
120
1-2003 1-2004 1-2005 1-2006 1-2007 1-2008 1-2009 1-2010 1-2011 1-2012 1-2013 1-2014
105 97 92
2012 2013 2014
Year to Date
- 5.2% - 9.7% + 1.1% - 7.6% - 1.0% + 1.0%

Median Sales Price
Prior Year Percent Change
April 2013 $178,950 $163,385 +9.5%
May 2013 $173,250 $170,000 +1.9%
June 2013 $177,900 $168,000 +5.9%
July 2013 $176,650 $171,707 +2.9%
August 2013 $175,525 $170,700 +2.8%
September 2013 $169,900 $169,900 0.0%
October 2013 $170,858 $166,150 +2.8%
November 2013 $174,000 $172,900 +0.6%
December 2013 $179,900 $165,000 +9.0%
January 2014 $168,500 $162,000 +4.0%
February 2014 $165,900 $172,450 -3.8%
March 2014 $178,005 $168,048 +5.9%
12-Month Med* $174,900 $169,000 +3.5%
Historical Median Sales Price by Month
Current as of April 10, 2014. All data from the Greater Baton Rouge Association of REALTORS® MLS. Information deemed reliable but not guaranteed. Powered by 10K Research and Marketing. | Click for Cover Page | 7
Point at which half of the sales sold for more and half sold for less, not accounting for seller concessions, in a given month.
Median Sales Price
* Median Sales Price of all properties from April 2013 through March 2014. This is not the average of the individual figures above.
$158,500 $168,048
$178,005
2012 2013 2014
March
$0
$50,000
$100,000
$150,000
$200,000
1-2003 1-2004 1-2005 1-2006 1-2007 1-2008 1-2009 1-2010 1-2011 1-2012 1-2013 1-2014
$159,900 $167,600 $170,000
2012 2013 2014
Year to Date
+ 1.4% + 6.0% + 5.9% + 4.8% - 3.9% - 3.0%
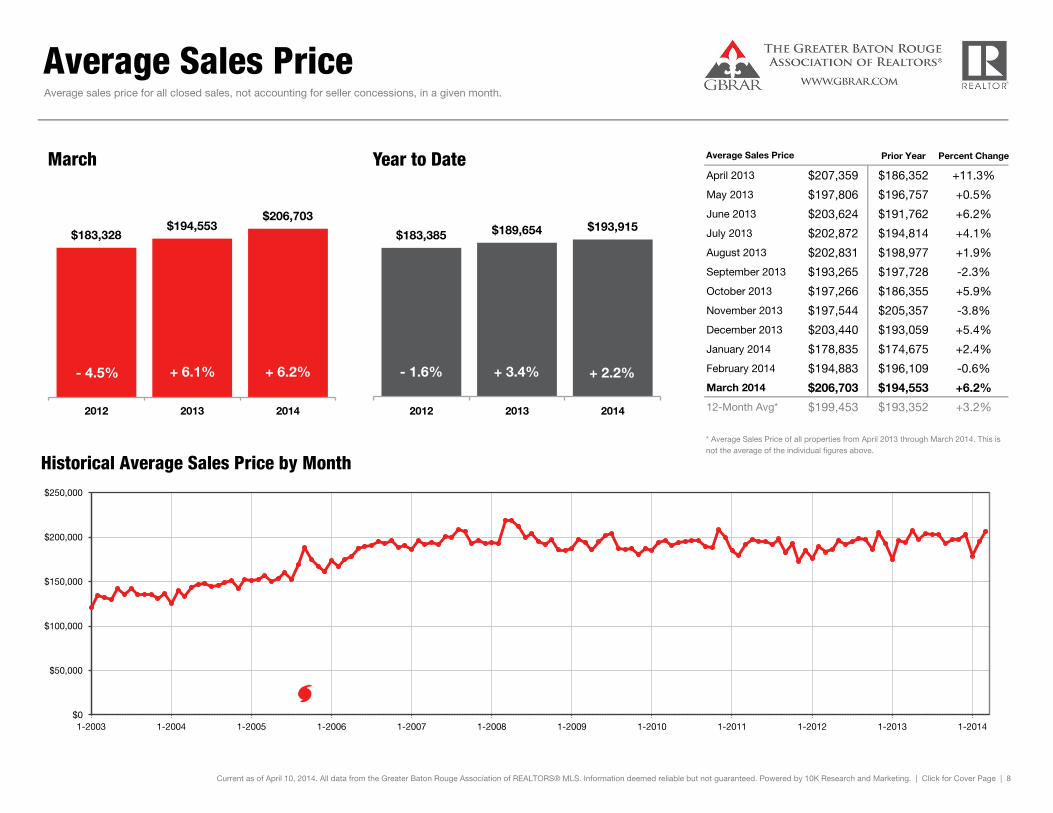
Average Sales Price
Prior Year Percent Change
April 2013 $207,359 $186,352 +11.3%
May 2013 $197,806 $196,757 +0.5%
June 2013 $203,624 $191,762 +6.2%
July 2013 $202,872 $194,814 +4.1%
August 2013 $202,831 $198,977 +1.9%
September 2013 $193,265 $197,728 -2.3%
October 2013 $197,266 $186,355 +5.9%
November 2013 $197,544 $205,357 -3.8%
December 2013 $203,440 $193,059 +5.4%
January 2014 $178,835 $174,675 +2.4%
February 2014 $194,883 $196,109 -0.6%
March 2014 $206,703 $194,553 +6.2%
12-Month Avg* $199,453 $193,352 +3.2%
Historical Average Sales Price by Month
Current as of April 10, 2014. All data from the Greater Baton Rouge Association of REALTORS® MLS. Information deemed reliable but not guaranteed. Powered by 10K Research and Marketing. | Click for Cover Page | 8
Average sales price for all closed sales, not accounting for seller concessions, in a given month.
Average Sales Price
* Average Sales Price of all properties from April 2013 through March 2014. This is not the average of the individual figures above.
$183,328 $194,553
$206,703
2012 2013 2014
March
$0
$50,000
$100,000
$150,000
$200,000
$250,000
1-2003 1-2004 1-2005 1-2006 1-2007 1-2008 1-2009 1-2010 1-2011 1-2012 1-2013 1-2014
$183,385 $189,654 $193,915
2012 2013 2014
Year to Date
+ 2.2% + 6.1% + 6.2% + 3.4% - 4.5% - 1.6%
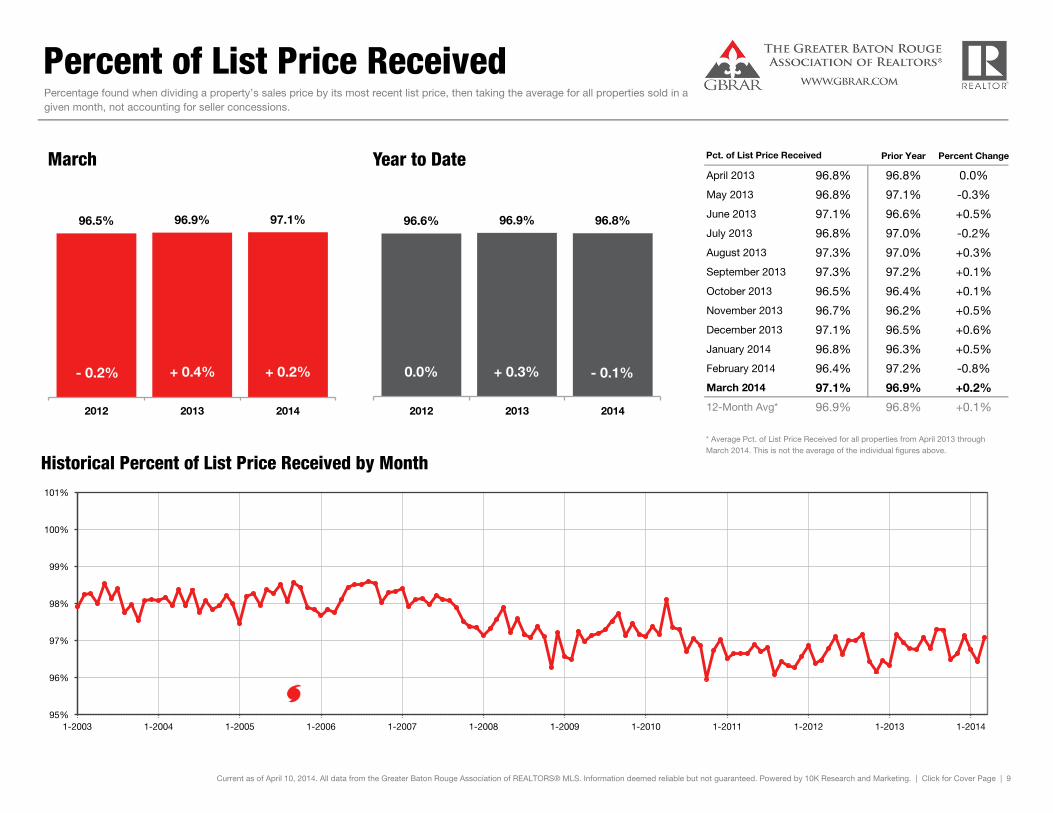
Percent of List Price Received
Prior Year Percent Change
April 2013 96.8% 96.8% 0.0%
May 2013 96.8% 97.1% -0.3%
June 2013 97.1% 96.6% +0.5%
July 2013 96.8% 97.0% -0.2%
August 2013 97.3% 97.0% +0.3%
September 2013 97.3% 97.2% +0.1%
October 2013 96.5% 96.4% +0.1%
November 2013 96.7% 96.2% +0.5%
December 2013 97.1% 96.5% +0.6%
January 2014 96.8% 96.3% +0.5%
February 2014 96.4% 97.2% -0.8%
March 2014 97.1% 96.9% +0.2%
12-Month Avg* 96.9% 96.8% +0.1%
Historical Percent of List Price Received by Month
Current as of April 10, 2014. All data from the Greater Baton Rouge Association of REALTORS® MLS. Information deemed reliable but not guaranteed. Powered by 10K Research and Marketing. | Click for Cover Page | 9
Percentage found when dividing a property’s sales price by its most recent list price, then taking the average for all properties sold in a given month, not accounting for seller concessions.
Pct. of List Price Received
* Average Pct. of List Price Received for all properties from April 2013 through March 2014. This is not the average of the individual figures above.
96.5% 96.9% 97.1%
2012 2013 2014
March
95%
96%
97%
98%
99%
100%
101%
1-2003 1-2004 1-2005 1-2006 1-2007 1-2008 1-2009 1-2010 1-2011 1-2012 1-2013 1-2014
96.6% 96.9% 96.8%
2012 2013 2014
Year to Date
- 0.1% + 0.4% + 0.2% + 0.3% - 0.2% 0.0%
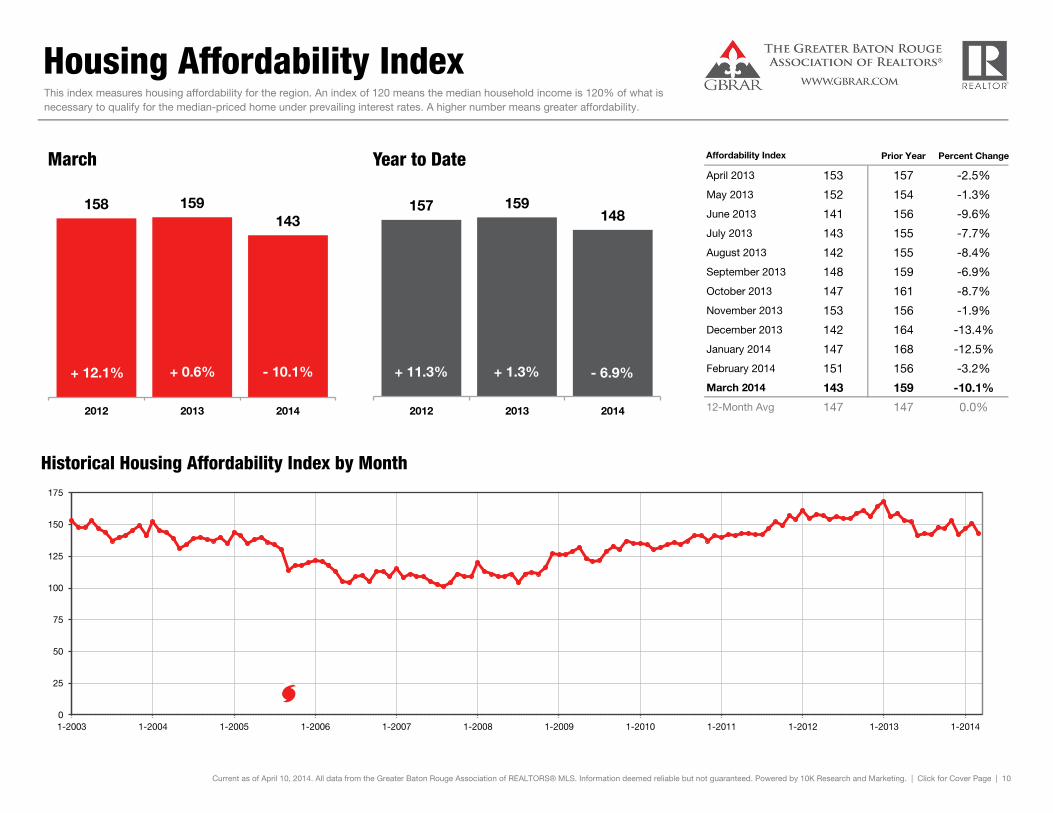
Housing Affordability Index
Prior Year Percent Change
April 2013 153 157 -2.5%
May 2013 152 154 -1.3%
June 2013 141 156 -9.6%
July 2013 143 155 -7.7%
August 2013 142 155 -8.4%
September 2013 148 159 -6.9%
October 2013 147 161 -8.7%
November 2013 153 156 -1.9%
December 2013 142 164 -13.4%
January 2014 147 168 -12.5%
February 2014 151 156 -3.2%
March 2014 143 159 -10.1%
12-Month Avg 147 147 0.0%
Historical Housing Affordability Index by Month
Current as of April 10, 2014. All data from the Greater Baton Rouge Association of REALTORS® MLS. Information deemed reliable but not guaranteed. Powered by 10K Research and Marketing. | Click for Cover Page | 10
This index measures housing affordability for the region. An index of 120 means the median household income is 120% of what is necessary to qualify for the median-priced home under prevailing interest rates. A higher number means greater affordability.
Affordability Index
158 159 143
2012 2013 2014
March
0
25
50
75
100
125
150
175
1-2003 1-2004 1-2005 1-2006 1-2007 1-2008 1-2009 1-2010 1-2011 1-2012 1-2013 1-2014
157 159 148
2012 2013 2014
Year to Date
- 6.9% + 0.6% - 10.1% + 1.3% + 12.1% + 11.3%
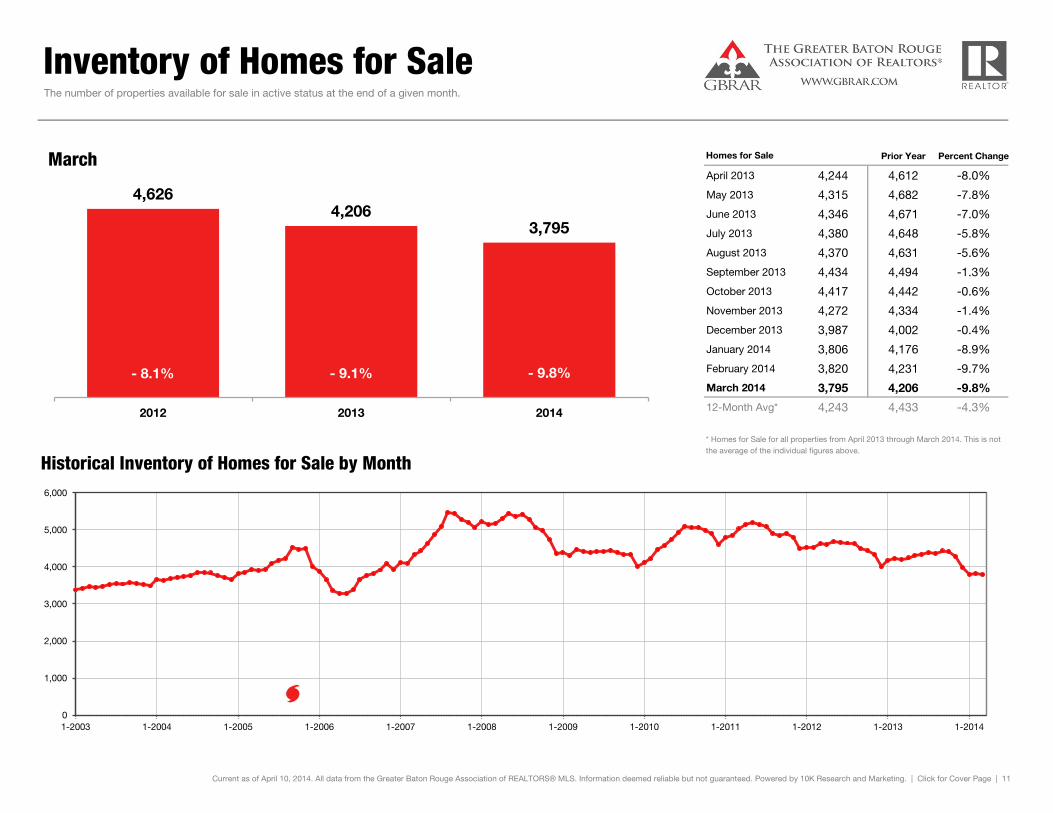
Inventory of Homes for Sale
Prior Year Percent Change
April 2013 4,244 4,612 -8.0%
May 2013 4,315 4,682 -7.8%
June 2013 4,346 4,671 -7.0%
July 2013 4,380 4,648 -5.8%
August 2013 4,370 4,631 -5.6%
September 2013 4,434 4,494 -1.3%
October 2013 4,417 4,442 -0.6%
November 2013 4,272 4,334 -1.4%
December 2013 3,987 4,002 -0.4%
January 2014 3,806 4,176 -8.9%
February 2014 3,820 4,231 -9.7%
March 2014 3,795 4,206 -9.8%
12-Month Avg* 4,243 4,433 -4.3%
Historical Inventory of Homes for Sale by Month
Current as of April 10, 2014. All data from the Greater Baton Rouge Association of REALTORS® MLS. Information deemed reliable but not guaranteed. Powered by 10K Research and Marketing. | Click for Cover Page | 11
The number of properties available for sale in active status at the end of a given month.
Homes for Sale
* Homes for Sale for all properties from April 2013 through March 2014. This is not the average of the individual figures above.
4,626 4,206
3,795
2012 2013 2014
March
0
1,000
2,000
3,000
4,000
5,000
6,000
1-2003 1-2004 1-2005 1-2006 1-2007 1-2008 1-2009 1-2010 1-2011 1-2012 1-2013 1-2014
- 9.1% - 9.8% - 8.1%
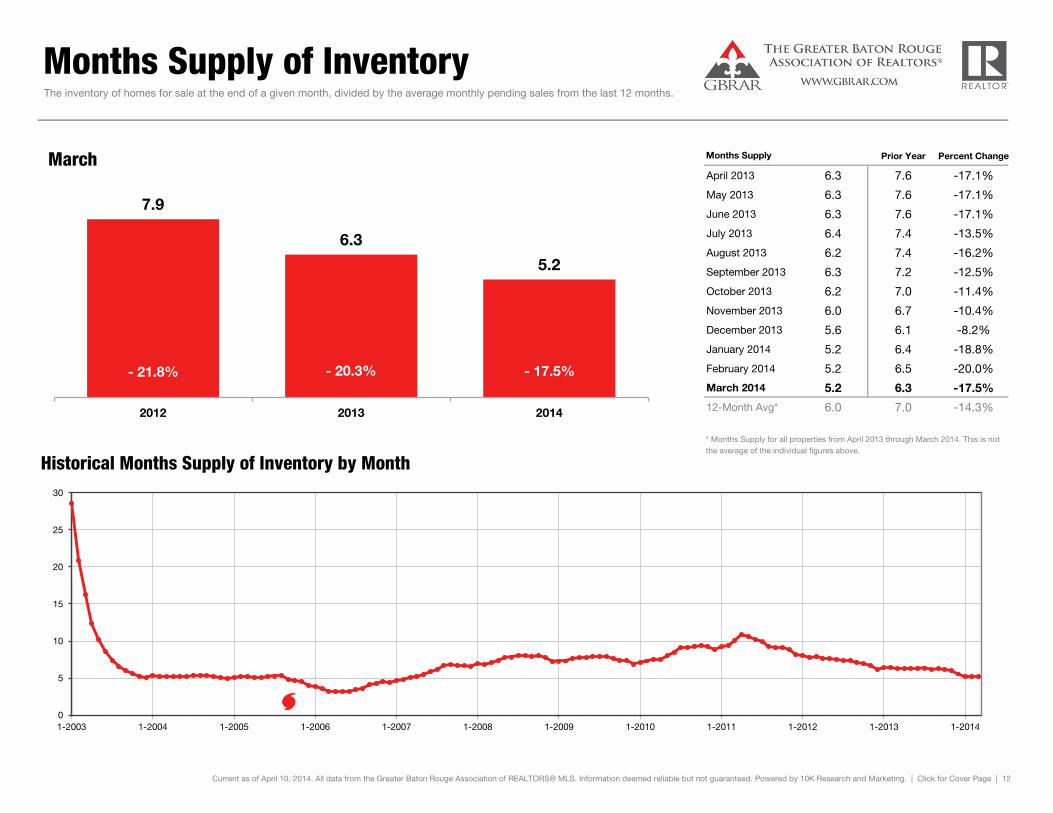
Months Supply of Inventory
Prior Year Percent Change
April 2013 6.3 7.6 -17.1%
May 2013 6.3 7.6 -17.1%
June 2013 6.3 7.6 -17.1%
July 2013 6.4 7.4 -13.5%
August 2013 6.2 7.4 -16.2%
September 2013 6.3 7.2 -12.5%
October 2013 6.2 7.0 -11.4%
November 2013 6.0 6.7 -10.4%
December 2013 5.6 6.1 -8.2%
January 2014 5.2 6.4 -18.8%
February 2014 5.2 6.5 -20.0%
March 2014 5.2 6.3 -17.5%
12-Month Avg* 6.0 7.0 -14.3%
Historical Months Supply of Inventory by Month
Current as of April 10, 2014. All data from the Greater Baton Rouge Association of REALTORS® MLS. Information deemed reliable but not guaranteed. Powered by 10K Research and Marketing. | Click for Cover Page | 12
The inventory of homes for sale at the end of a given month, divided by the average monthly pending sales from the last 12 months.
Months Supply
* Months Supply for all properties from April 2013 through March 2014. This is not the average of the individual figures above.
7.9
6.3
5.2
2012 2013 2014
March
0
5
10
15
20
25
30
1-2003 1-2004 1-2005 1-2006 1-2007 1-2008 1-2009 1-2010 1-2011 1-2012 1-2013 1-2014
- 20.3% - 17.5% - 21.8%
Related Documents