545 Vote 14 - Gauteng Treasury • 2008/09 - Budget Statement 2 VOTE 14 GAUTENG TREASURY To be appropriated by Vote R185 549 000 Responsible MEC MEC for Finance and Economic Affairs Administering department Gauteng Treasury Accounting officer Head of Department 1. OVERVIEW Vision Gauteng Treasury aspires to be pioneers in financial management and fiscal discipline within the public sector in South Africa. Mission To provide custodianship and distribution of Public Funds as well as Financial Management Services, through: • Strengthening financial management to achieve operational efficiency and promoting accountability in government; • Attracting and retaining an appropriate technical skills base at Gauteng Treasury; • Providing technical assistance including analysing, monitoring, evaluating and advising customers to enable good financial planning and management; • Developing and implementing efficient internal systems and processes; • Investing in and empowering Gauteng Treasury employees. Strategic Goals • To integrate policies within Treasury to ensure synergy and effective co-ordination; • To manage and oversee the implementation of Pubic Private Partnership projects in Gauteng to support the GPG economic growth, job creation and poverty alleviation strategies; • Provide provincial, social and economic research and analysis that inform fiscal policy development and the annual budget process contributing to the Provincial Growth and Development Strategy; • Allocate resources in line with provincial government priorities and the five plans to contribute to economic, efficient and effective service delivery; • Maintain fiscal discipline through policies and the monitoring and evaluation of financial performance; • To maximise current revenue sources and optimise potential new revenue streams; • Develop and implement a provincial comprehensive revenue strategy; • Provide provincial socio-economic research and analysis in order to inform resource allocation and utilisation. • To conduct sector level policy analysis in order to maximise efficiency gains and value for money; • To monitor and evaluate performance outcomes of spending agencies. The key functions for the Gauteng Treasury (GT) are: • Implementing accounting practices that will promote the effective capturing of revenue, expenditure, assets and liabilities; • Ensuring the effective management of risks to which the Gauteng Provincial Government (GPG) is exposed to by virtue of its assets, programs and operations; • Optimising liquidity requirements and maximising returns within acceptable levels of risk for GPG and securing sound cash management; • Ensuring the efficient and effective management of assets for GPG; • Providing guidance and leading the implementation of financial management reforms for both provincial and local governments; • Providing provincial social and economic research and analysis that inform fiscal policy development and the

Welcome message from author
This document is posted to help you gain knowledge. Please leave a comment to let me know what you think about it! Share it to your friends and learn new things together.
Transcript

545
Vote 14 - Gauteng Treasury • 2008/09 - Budget Statement 2
VOTE 14
GAUTENG TREASURYTo be appropriated by Vote R185 549 000Responsible MEC MEC for Finance and Economic AffairsAdministering department Gauteng TreasuryAccounting officer Head of Department
1. OVERVIEW
VisionGauteng Treasury aspires to be pioneers in financial management and fiscal discipline within the public sector in South Africa.
MissionTo provide custodianship and distribution of Public Funds as well as Financial Management Services, through:• Strengthening financial management to achieve operational efficiency and promoting accountability in
government;• AttractingandretaininganappropriatetechnicalskillsbaseatGautengTreasury;• Providingtechnicalassistanceincludinganalysing,monitoring,evaluatingandadvisingcustomerstoenable
good financial planning and management;• Developingandimplementingefficientinternalsystemsandprocesses;• InvestinginandempoweringGautengTreasuryemployees.
Strategic Goals• TointegratepolicieswithinTreasurytoensuresynergyandeffectiveco-ordination;• TomanageandoverseetheimplementationofPubicPrivatePartnershipprojectsinGautengtosupporttheGPGeconomicgrowth,jobcreationandpovertyalleviationstrategies;
• Provideprovincial,socialandeconomicresearchandanalysisthatinformfiscalpolicydevelopmentandtheannualbudgetprocesscontributingtotheProvincialGrowthandDevelopmentStrategy;
• Allocateresourcesinlinewithprovincialgovernmentprioritiesandthefiveplanstocontributetoeconomic,efficientandeffectiveservicedelivery;
• Maintainfiscaldisciplinethroughpoliciesandthemonitoringandevaluationoffinancialperformance;• Tomaximisecurrentrevenuesourcesandoptimisepotentialnewrevenuestreams;• Developandimplementaprovincialcomprehensiverevenuestrategy;• Provide provincial socio-economic research and analysis in order to inform resource allocation and
utilisation.• Toconductsectorlevelpolicyanalysisinordertomaximiseefficiencygainsandvalueformoney;• Tomonitorandevaluateperformanceoutcomesofspendingagencies.
The key functions for the Gauteng Treasury (GT) are:• Implementingaccountingpracticesthatwillpromotetheeffectivecapturingofrevenue,expenditure,assetsandliabilities;
• EnsuringtheeffectivemanagementofriskstowhichtheGautengProvincialGovernment(GPG)isexposedtobyvirtueofitsassets,programsandoperations;
• OptimisingliquidityrequirementsandmaximisingreturnswithinacceptablelevelsofriskforGPGandsecuringsoundcashmanagement;
• EnsuringtheefficientandeffectivemanagementofassetsforGPG;• Providingguidanceandleadingtheimplementationoffinancialmanagementreformsforbothprovincialandlocalgovernments;
• Providingprovincialsocialandeconomicresearchandanalysisthatinformfiscalpolicydevelopmentandthe

546
Budget Statement 2 - 2008/09 • Vote 14 - Gautneg Treasury
annualbudgetprocess,contributingtotheprovincialgrowthanddevelopmentstrategy;• Allocatingresourcesinlinewithprovincialgovernmentprioritiesand5yearplanstocontributetoeconomic,efficientandeffectiveservicedelivery(crediblebudgets);
• Maintainingfiscaldisciplinethroughpoliciesandmonitoringandevaluatingfinancialperformance;• Providingstrategicleadershipandtechnicalandstrategicsupportinfinancialmanagementandbudgeting;• PromotingknowledgeoftheTreasuryRegulations(16)pertainingtoPublicPrivatePartnerships(PPPs)throughalevelofexcellenceintechnicalsupporttoprovincialgovernmentinstitutions;
• ManagingandoverseeingtheimplementationofPPPsinGautengtosupportGautengProvincialGovernment’seconomicgrowth,jobcreationandpovertyalleviationstrategies.
Legislative mandateThefollowingActsgoverntheadministrationofgovernmentdepartmentsandforspecificlegislationpertainingtotheadministrationofTreasury,detailisprovided:• MunicipalFinanceManagementAct(MFMA),2004;• PreferentialProcurementPolicyFrameworkAct,2000providesaframeworkfor theimplementationof the
preferential procurement policy.• PromotionofAccesstoInformationAct,2000;• MunicipalitySystemsAct,2000outlines thesupportandmonitoring responsibilities in termsofMunicipalIntegratedDevelopmentPlanning(MIDP)processes.
• Public FinanceManagement Act (PFMA), 1999 regulates financial management to ensure that revenue,expenditure,assetsandliabilitiesaremanagedefficientlyandeffectivelyandprovidesfortheresponsibilitiesofpersonsentrustedwithfinancialmanagementandmattersconnectedtherewith.
• EmploymentEquityAct,1998;• BasicConditionsofEmploymentAct,1997;• Intergovernmental Fiscal Relations Act, 1997 defines the role of the Minister of Finance and EconomicDevelopmentandthatoftheTreasuryasrepresentativesoftheprovincialgovernment,inpromotingcooperationbetweenotherspheresofgovernmentonfiscal,budgetaryandfinancialmatters.Italsoprovidesinsightintotheprescribedprocesses for thedetermination of the equitable shareand theallocation of revenue rosenationallyandmattersinconnectiontherewith.
• BorrowingPowersofProvincialGovernmentAct,1996providesnormsandconditions towhichGautengTreasurymustadhereinnegotiatingloansfortheprovincialgovernment.
• TheConstitutionoftheRepublicofSouthAfrica,1996(Chapter13);• DevelopmentFacilitationAct,1995outlinesthesupportandmonitoringresponsibilitiesintermsofMunicipalIntegratedDevelopmentPlanning(MIDP)processes.
• LabourRelationsAct,1995;• PublicServiceAct,1994;and• DivisionofRevenueAct,whichprovidesfor theequitabledivisionofrevenue,rosenationally, inclusiveofconditionalgrants,amongstthethreespheresofgovernmentandmattersincidentalthereto.
Key policy areas and developmentsAnoverviewofthekeypolicyareasanddevelopmentsovertheperiodbeingreportedincludethefollowing:• ParticipationintheGCRAcademythroughscarceandcriticalskillstraininginternallyandexternally.• Developabudgetprocessmanual,budgetdatabaseandMTEFmodelaswellastherolloutoftheActivityBasedcostingmodel.
• Implementation of the departmental communication strategy through informative publications such as thedepartmentalAnnualReport,quarterlynewsletters,informationbrochures,pressreleasesetc.
• IssueofquarterlyeconomicbulletinsandproduceaProvincialandSocioEconomicReviewandOutlook,SocialAccountingMatrixanalysisandimpactreportandaMacro-Economicmodel.
• IntroductionoftheGautengMunicipalsupportprogrammetoassistmunicipalitiesinfinancialmanagement.• Publicationofallmunicipalfinancialandnon-financialinformationthroughtheGautengMunicipaldatabase/
portal.• TheimplementationoftheconversionofGRAPtoGAMAPinlinewithnewaccountingstandardsthatwere
promulgated. • Implementationof theassetmanagement reforms in theprovincebasedon theNationalTreasury reformstowardsaccrualaccounting.

547
Vote 14 - Gauteng Treasury • 2008/09 - Budget Statement 2
2. REVIEW OF THE 2007/08 FINANCIAL YEAR
Administration
Human ResourcesThe reviewedorganisational structure for thedepartmentover theMTEFhasbeenapproved. The reviewedstructuresawtheincreaseofpostsfrom161to195posts.Priortotheapprovalofthestructure,thevacancyratewasreducedfrom60percentto40percent,withthevacancyrateofthenewstructureon50percent.Thedepartmenthasa53percentfemalerepresentationoverall,33percentfemalerepresentationonSMSleveland1percentrepresentationofpeoplewithdisabilities.
Duringthisyear,thedepartmenthaslaunchedits’internshipprogrammeandhasappointed15interns,whichrepresents15percentofthetotalestablishment.Toensurethattheregulatoryframeworkiscompliedwith,andappropriatesystemsandprocessesareinplace,HRMdelegationsand11policieshavebeenapproved.
Thedepartmenthasconcludedaskillsauditofallemployeesonlevels1–12,andthecompetenciesofmembersoftheSeniorManagementServiceshavebeenassessed.This,togetherwiththepersonaldevelopmentplanscontainedinperformanceagreements,hasformedthebasisoftheapprovedWorkplaceSkillsPlan(WSP)whichinformstraininganddevelopmentinitiativesofthedepartment.Thedepartmenthasalsoawardedbursariesto22employeeswhichcoverqualificationsfromGrade12tomaster’sdegreelevels.
Intheinterestofincreasingthepoolofpossibleemployees,thedepartmenthasawardedbursariesto10full-timestudentsinthefieldsofeconomics,econometricsandaccounting.Thesestudentswillbeexpectedtoworkinaninternshipcapacityinthedepartmentduringandafterthecompletionoftheirstudiestosupporttheireducationalknowledgewiththeapplicableskills.
Thedepartmenthasconcludedacultureaudit.TheresultsofthisauditwillinformtheHRstrategy/planofthedepartmentwhichwilladdressissuessuchasrecruitingandretainingscarceandcriticalskills,employeewell-being,HIVandAids,traininganddevelopmentetc.
Sustainable Resource Management
Budget ManagementThebudgetingplanningprocessfor2008MTEFcommencedearlyinthe2007/08financialyear.Theprovincialbudget planning stage, which covers the budget makgotla that were held in June and November 2007,highlightedtheconsolidationofGPGgainstowardseffectivedeliveryon2004mandate,threemajorareasofprioritiesandidentifiedflagshipprogrammesthatmustreceivepriorityfundinginthe2008MTEFperiod.Thenextkeystageoftheprocess(thatis,organisingstage)sawforthefirsttimethecustomisationofdepartments’budgetinputtemplates.Thebudgetinputtemplateswerepreloadedwithdepartments’specificavailabledatainordertoallowdepartmentstofocusoncapturingthenewbudgetdataandhenceimprovetheturnaroundtime.NewdevelopmentsinthebudgetimplementationstageoftheprocessrelatetotheissuanceofregularTreasuryCircularsthatprovideguidanceforeachkeypointsoftheprocesswithanultimateaimofimprovingthequalityofTreasurysubmissionsaswellascompliancewithprovincialbudgetprocesstimelines.Themonitoringandevaluationstagehighlightedproactivemeasures taken to improvespendingofprovincialbudget,namely thetablingoftheprovincialamendmentstothe2006/07adjustmentbudget.
Budgetaryreformsrelatingtotheperiodunderreviewincludetheintroductionofnewmodelforperformancereportingandtheupgradeofthestandardchartofaccounts(SCOA)thatiscurrentlyinprogress.The2007/08financialyear,theunitconductedaresearchontheprojectsrelatingtoplannedelectronicsystems.Inpreparationfor theMTEF fundingmodel, the unit commenced planning for the development of the consolidated budgetdatabaseandMTEFmodellinkedtoexistingeconomicresearchinitiatives.Thisincludesatrainingprogrammeon financial modelling that was aimed at providing basic skills in modelling. With respect to knowledgemanagement,theunitdraftedabudgetprocessmanualthatisscheduledtobefinalizedearlyinthe2008/09financialyearandprovidesubsequenttrainingtoalldepartments.TheevaluationreportforthepilotphaseoftheActivity-BasedCostingthatwasimplementedintheDepartmentofSport,Arts,CultureandRecreationwillbefinalisedby31March2008.
Public FinancePublicFinancewasestablishedinthepreviousfinancialyeartomonitortheimplementationofthebudgetand

548
Budget Statement 2 - 2008/09 • Vote 14 - Gautneg Treasury
to strengthen reporting systems in theprovince. The unit hasplaceda lot of emphasis on themonitoringofexpenditureandthatspendingduringthecourseoftheyearbecloselyscrutinisedbydepartments.Significantpositivestrideshavebeenmade infinancial resourcemanagement,PublicFinancewillhowever;continue tosupportdepartmentsinachievingtheirmandatesbyprovingfinancialmanagementexpertise,adviceandsupportaswellasencouragingthemtodoproperplanning.Properplanningwillleadtobetterbudgetingwhichjointly,isintendingtoenhanceservicedelivery.
Thisunitisnowalmostfullycapacitatedwithdiverseskillsincludinginfrastructurespecialists.Thishasenabledtheunittoprovidestrategicsupporttodepartmentsinimplementingthebudgetandimproveservicedelivery.PublicFinancewassuccessfulinintroducingsetofmeasurestoimprovebudgetpreparation,implementation,monitoringandreportingprocessesatadepartmentallevel.Suchmeasuresincludeamongothersaphase-inapproachtotheutilizationofanalytical techniques, introducing the requirements forprogrammeplanningon thebasisofbusiness case for eachproposal, implementationandmonitoringplansand supportdepartments to improvethequalityofnon-financialandfinancialreportsforinfrastructurespending,inYearMonitoringandconditionalgrants.PublicFinancesuccessfullyimplementedtheInfrastructureDeliveryProgrammewhichseekstoensurethatdepartmentsalignthebudgetandinfrastructuredeliverycycle.
Fiscal PolicyTheFiscalPolicyandEconomicAnalysisunitconsolidatedonsomeof theachievements for the2006/07intermsofimprovingthestructureandapproachoftheMediumTermBudgetPolicyStatement(MTBPS).Afeasibilitystudyonprovincialtaxationwascompleted;adecisionwhethertoproceedornottoproceedwillbetakeninthefinancialyear2008/09.Bettercooperationwiththemainownrevenuegeneratingdepartmentshasresultedinmoreeffectiveandefficientcollectionofrevenueandtobuildonthisachievementanownrevenueforummeetsonaquarterlybasistodiscussallownrevenuerelatedissues.
ThefirstannualProvincialEconomicReviewandOutlook (PERO)was tabled in2007.TheprovincialSocialAccountingmatrixwascompletedtogetherwiththeanalysisreport.Twoquarterlybulletinswerecompletedandcirculatedwhilethethirdonewillbecirculatedbeforetheendofthefinancialyear.TheSocioEconomicReview(SER)willalsobetabledbeforetheendofthefinancialyear.TheservicelevelagreementwiththeUniversityofPretoriahasbeenfinalizedwithregardtothedevelopmentoftheprovincialComputableGeneralEquilibriumModel(CGE).
Pubic Private PartnershipsIn viewof adecision takenby the Provincial ExecutiveCouncil theGauteng Public-Private Partnership (PPP)unithasbeenestablishedundertheauspicesoftheGautengTreasury.Theunitacceptedtheroleasregulatortooversee,manageexecuteandsupportPPP’sataprovinciallevelinlinewithTreasuryRegulation16tothePFMA.
ThestructurefortheGautengPPPUnithasbeendesignedtopromoteefficientdeliveryinthetechnical,financialandlegalactivitiespertainingtoaspecificproject.PositionsintheLegal,FinancialandAdministrativedeskshavebeenfilledandarecurrentlyfullyfunctionalinprovidingPPPadvicetotheGautengProvinces.ConsiderableprogresshasbeenmadeontheLegalDesk,tobecomeaunitthatprovideslegalexpertisetotheentireGautengTreasury,aswellaslegalprojectsupporttoalldepartments.ThelegaldatabasehasbeenupdatedandaforumtoensureacommonplatformforlegaladviceintheProvinceisintheprocesstomaterialise.
InviewofthedauntingchallengesthePPPunitfaceasanewestablishedunit,theskilledadvisorshavebeenappointedtoassistinprovidingthemuchneededsupportandassistancethroughouttheprovince.Theyhavefulfilledtheirobligationsintermsoftheestablishmentofafirmregulatoryframework,providingongoingregulatoryadviceandassistance in theestablishmentofacapablePPPunit,and toenforcePPPregulations topromotesustainablePPP’sthroughalevelofexcellenceandtechnicalsupporttoprovincialgovernmentinstitutions.Thenecessaryskillshavebeentransferredwithintheunitandrelevantappointmentsunderthefinancialandlegaldeskhavebeenfinalisedtosupportthestrategicplan.
ThefeasibilitystudyreportfortheChrisHaniBaragwanathhasbeencompletedandwaspresentedforNationalTreasury review and approval. The unit in collaborationwithGauteng Department of Health andNationalTreasuryare in theprocessof resolvingaffordabilitychallenges regarding theChrisHaniBaragwanath.TheGautrainRapidLinkproject iscurrentlyunderconstructionwhilst the listingofGautrainAgencyisunderway.Otherinitiativesatinceptionstageincludebuildingschoolsandrelatedwaterandsanitationinschools.ArolloutofMunicipal PPPGuidelinesbyNational TreasuryandDPLG teams in collaborationwithGauteng Treasury

549
Vote 14 - Gauteng Treasury • 2008/09 - Budget Statement 2
promisestoenhanceservicedeliveryforthebettermentoftheGPGcitizenswithpotentialspin-offsforpovertyalleviation.
Furthermore,thePPPunithadidentifiedanincreaseinPPPdealflowintheHealthandEducationalsectorthatyieldvalueforallstakeholdersintheProvince.SignificantprogresshasbeenmadeintheHealthSectorprovidingadviceindraftingoffeasibilitystudiesandprocurementdocumentationtoenhanceprojectsuccess.InsupportofPPP Initiativesaswellas thechallengingprospect to increasedealflow,aCommunicationPlanhasbeendesignedtoestablishaplatformtosellthePPPconcept,involveallrelevantstakeholdersandproposeongoingsolutionsforinfrastructureandservicedeliveryinGautengthroughaPPPmodel.
Provincial Financial Management and Governance (PFMG)
Financial AccountingGautengTreasuryworkedtowardsobtaininganunqualifiedauditopinionontheconsolidatedannualfinancialstatementsforGPGfor2007/08.HoweveritshouldbenotedthattheauditopinionwillonlybeknownoncetheAuditorGeneralhasfinalisedtheaudits.Furthermore,itshouldbenotedthattheachievementofthisobjectiveisdependentupontheindividualdepartmentsgettingunqualifiedauditsreports.Treasuryhastoexertalltheeffortinassistingdepartmentswithfinancialmanagementcapacity inorder torealize thatobjective.Treasuryhasincreaseditscapacityinordertoprovideeffectiveassistancetodepartments.
With effect from the second quarter of 2007/08 financial year, Gauteng Treasury implemented monthlymanagement reports on financial accounting and asset management. These reports are submitted to theLegislatureonaquarterlybasis.Theywereintroducedasmechanismtoassist inobtainingunqualifiedauditreports. Another initiativewas the reintroductionof theChiefFinancialOfficers (CFO) forum thatmetonaquarterlybasistoshareinformationonissuesofpolicydevelopmentandeffectiveimplementationofBudgeting,SupplyChainManagement,FinancialAccounting,CashManagement,RiskManagement,AssetManagementandotherfinancialmanagementrelatedmatters.
Asset ManagementFor the 2007/08 financial year, asset management focused on ensuring that all departments implementedtheirassetmanagementstrategies.AssetManagementisanareathat leadstomostmattersofemphasisandqualificationsinGPGdepartments.Thefocusofassetmanagementthereforewastoensurethatqueriesrelatingtoassetmanagementwereminimizedfor2007/08,byassistingdepartmentswithensuringthattheirassetsareproperlyclassified,evaluatedaccuratelyandallare recorded in theirasset registers.Reportingrequirementsonassetmanagementwerealsointroducedin2007/08toLegislatureonaquarterlybasisasanendeavourtoobtainunqualifiedreports.TreasuryinitiatedtheprocessofassistingdepartmentstofairvaluealltheirassetstomeetthetargetdateofMarch2008.
RiskManagementEnterprise Risk Management (ERM) approach recognizes that risk management needs to encompass allorganizations’riskssuchasoperational,financial,compliance,regulatoryandstrategicrisks.Inessence,riskmanagementmust be imbeddedwithin theoverall context of anybusiness strategy. In2007/08,GautengTreasurycontinuedonitsimplementationofERMindepartments.OfcriticalimportancewasthedevelopmentandimplementationofaGPGRiskManagementPolicyanddefiningtheriskmanagementstandards.Thisresultedineachdepartmenthavingariskregisterthatwaspreparedaccordingtotheriskmanagementframework.ThesuccessfactorsthatdrovetheimplementationwereobtainedfromtopmanagementcommitmentfromHODForumaswellintegratingriskmanagementintostrategicplanningprocessfor2007/08.EffectiveimplementationofriskmanagementwasalsoaninterventionaimedatreducingqueriesraisedbytheAuditorGeneralrelatingtointernalcontrolsandrisks.
Assets and LiabilitiesTreasuryonceagainfocusedonstrengtheningthecashflowforecastingindepartmentsaswellastheachievementof5percentvariancebetween funds requested to fundexpenditureandactualexpenditure.Therehasbeentremendous improvement in this regard.Trainingoncashmanagementhasbeenprovided todepartments tocapacitatetheminthisregard.Treasurycontinuedtooptimizeinterestoninvestments,anactivitythatcontributessubstantialfundsintotheProvincialOwnRevenue.TheimplementationoftheTreasuryandCashmanagementsystemhasnotstartedduetothemoratoriumthathasbeenplacedonimplementationofsystemsbyNationalTreasury.HoweverasubmissionhasbeenmadetoNationalTreasurytorequestforapprovalfortheimplementationofthesystem.
550
Budget Statement 2 - 2008/09 • Vote 14 - Gautneg Treasury
Provincial Financial Management Reforms (PFMR)
Municipal Budgets & Financial Reporting and Compliance (MBFRC)During the2007/08financialyear theprovince intensified its support toGautengMunicipalities inadditionto the current support framework established through the Gauteng Municipal Support Plan. In an effort tounderstandthecurrentlocalgovernmentmilieutheunitinconjunctionwiththemunicipalcounterpartsandotherkeystakeholdersdevelopedthroughtheGautengMunicipalFinanceSummitengagementskeyresolutionsthatwouldseetheunitenhancingmunicipalcapacityoverthenext2years.Theseresolutionshavebeentabledtoat thePremierCoordinatingForumforendorsement.TheMunicipalSupportPlan ismanagedjointlywith theDepartmentofLocalGovernment.Thisprojectisongoingandtodatewehaveconsistentimprovementinthefinancial performance and management of our municipalities.
In the advent of theMunicipal FinanceManagementAct implementation frameworkdrawing to a close theProvincialTreasurythroughvariousinterventionswillcontinuetocontributeandenhancethecurrentinstitutionalcapacityofMunicipalCFOOffices.ThisTreasuryintendsdoingthisthroughvariouspilotprojectscovering:• GautengMunicipalInternSupportGrant,• MunicipalInterventionsFrameworkandAssessmentTool;and• GenericBudgetPoliciesFrameworkandOperationalManuals.
DuringthecurrentmunicipalfinancialyeartheProvincialTreasuryprovideddirectfinancialsupporttoNokengTsaTaemaneinanefforttoaidthemunicipalitywithitsinstitutionalchallenges.ThroughthissupportNokenghasalreadyappointedaChiefFinancialOfficerandthedepartmentlooksforwardtothemunicipalityestablishingaBudgetandTreasuryOfficeinlinewiththerequirementsoftheMFMA.
TheUnitimplementedadoptedandwhereactivesupportedtheestablishmentofMunicipalDistrictCFOForums.InconjunctionwithoursisterDepartmentofLocalGovernmentwecontinuetoassessInfrastructureDevelopmentProgramme(IDP),MunicipalBudgetsandServiceDeliveryBudgetImplementationPlans(SDBIP’s).
Municipal Financial GovernanceTheunitprovidedGAMAP/GRAPinstitutionalsupport toalldelegatedmunicipalitiestoassist themtoconvertto thesetaccountingstandards.Theunithascommencedwithariskmanagement initiative toassess theriskaversenessofalldelegatedmunicipalities.Theoutcomesofthisinitiativewillinformthetypeofinterventionwhichtheunitwilladoptfornextfinancialyear.
Public Finance Management Reforms (PFMR)TheunithascontinuedwithitsinstitutionalandfinancialsupporttoGautengdepartmentsandmorespecificallytheCFOoffices.InlinewiththerequirementsofthePFMA-thecurrentstructuralsupportfocusisaimedat:• FinancialAccounting• ManagementAccounting• SupplyChainManagement• AssetManagement.
ThisyearsawtheestablishmentandintroductionoftheProvincialAuditCommitteewhichinthemainwillfocusonconsolidatedstatements,RevenueFundandTransversalmatters.IntermsofSupplyChainManagement(SCM)theunitprovidedextensivetrainingonprocurementcommitteesandtheirfunctioning.Throughthecurrentcomplianceframeworktheunitcontinuouslyassessedprovincialdepartmentsandmunicipalitieslevelsofcompliancewiththesaidregulatoryframework.
3. OUTLOOK FOR THE 2008/09 FINANCIAL YEAR
Administration
Human resourcesTheHumanResourceManagementunitwill focusontheimplementationofacomprehensivehumanresourcestrategy/plan.Theplanwillfocusoninterventionstorecruitandretainscarceandcriticalskills,maintainingandincreasingthewell-beingofemployees,traininganddevelopmentofemployeesthroughi.e.accreditedtrainingprogrammesandbursaryschemes,internshipsandthedevelopmentofabroadcompetencyframeworkforallpostsinthedepartment.
551
Vote 14 - Gauteng Treasury • 2008/09 - Budget Statement 2
Sustainable Resource Management
Budget ManagementTheBudgetManagementunitwillcontinuetofocusatexploringmoreefficientmethodsofprocessmanagement,improvingbackbonebudgetinformationandsupportsystemsandexploringpossiblefundingmodels.
Theunit intends to increase thehuman resourcecapacitybyappointingmore sectoranalystsandelectronicsystems-biased skills to ensure further improvements in the budget information quality. BudgetManagementis planning to enhance theavailability of integrated information systems toachieveour strategic objectives,developmentandcompletionofelectronicsystemssuchaselectronicfilingsystem,budgetconsolidationdatabaseandadatawarehousingsystemandnewMTEFfundingmodelfortheprovince.Alltheseactivitiesareinlinewiththemandateoftheunit.Thedatabaseprojectwillbedevelopedinphases;thefirstphaseincludesdatagathering,alignmentofdatawiththestandardchartofaccounts.
TheevaluationreportforthepilotphaseoftheActivity-BasedCostingthatwasimplementedintheDepartmentofSport,Arts,CultureandRecreationwillinformthedecisiontorollouttheprojecttootherdepartments.Itisplannedthattherolloutwillinitiallycoverthreedepartmentsin2008/09.
Public FinanceTheunitwillcontinuetoengageinprocesstoimprovereportingtoensurethatdepartmentscomplywithrequirementsofthePFMAandDORA.Emphasishasbeenonspendingcapability,butthefocusoughttochangetolookatvalueformoney.Thechallengehasalwaysbeenonavailabilityandcredibilityofinformationonperformance.PublicFinancewilltrytogetthebuyinofdepartmentsinconductingefficiency,valueformoneyandeconomicevaluationstudies.TheunitwillcontinuetogiveactivesupportfortheimplementationoftheInfrastructureDeliveryImprovementProgrammetoallinfrastructuredepartmentsintheprovince.Allvacantpostswillbefilledduring2008/09financialyeartoattractthenecessaryskills.
Thefollowingaretheplannedqualityimprovementmeasures:• Improvedrelationshipwithexternalandinternalstakeholderstoimproveservicedelivery.• Creating partnerships with both internal and external stakeholders to improve service delivery throughleveragingtechnicalexpertiseandcapacityaswellasenhancingresearchcapabilities.
• Developmentandimplementationofeconomicandquantitativetoolsinordertoachieveoptimalresourceallocation.
• Supportdepartmentstoimprovethequalityofnon-financialandfinancialreports.• Providestrategicsupporttodepartmentsregardingthepreparationof2010FIFAWorldCup
Fiscal Policy and Economic AnalysisTheunit intendsbuildingon itspastachievementsbyworkingcloselywithallGPGdepartments tohighlighttheimportanceofeffectiveandefficientdebtormanagement.Aprovincialrevenuestrategyiscurrentlybeingdevelopedtosimplifyrevenuemanagementforthemainownrevenuedepartments.Inaddition,theMTBPSistoexaminethepolicyframeworkandchallengesconfrontingGPGinitsquesttomeetbothprovincialandnationalservicedeliverypriorities.Theunitwillalsodeveloparevenueforecastingmodeltoassistdepartmentswiththeirrevenueprojections.
Ason-goingprojects,thePEROandSERwillbepublishedonanannualbasiswiththeobjectivetoprovideawellresearchedreviewandoutlookoftheprovincialeconomysoastoinformotherpolicydecisions.Theunitwillcollaboratewithotherdepartmentstoensurethatitsresearchisinformativeandremainrelevant.Theunitwillpublishquarterlybulletinsontopicalissues.ItintendstousethedevelopedSAMtoassesstheeconomicimpactofdifferentprojects in theprovinceandalsotofinalizethedevelopmentof theCGEmodel togetherwith theUniversityofPretoria.
Public Private PartnershipsTheoriginoftheproposaltointegratetheGautengPPPUnitunderSustainableResourceManagement(SRM)stemmedfromtheProvincialTreasury’smandatetocreateaco-herentapproachininfrastructureandimprovedservice delivery efficiency in all spheres of government. Such amandatedwill face current challenges thatgovernmentisfacinginaddressingseriousbacklogs,underperformanceandtheabsenceofspecialisedskillsandauthoritytomanageandregulatePPP’s,therebyprotectingthepublicinterest.

552
Budget Statement 2 - 2008/09 • Vote 14 - Gautneg Treasury
Duringthepreparationoftheintegrationplan,cognisancehasbeentakenofallspecificrequirementsforasuccessfulintegration,supportedbyasoundbusinessplan.TheunitwillalsoadvancewiththeimplementationofthisIntegrationPlan.Itswillbeengagedinthenecessaryprocessesrequiredtoensurethatitsstructureandthewayitsfunctionallowsasuccessfuldeliveryof itssetgoals.Thisprocessmay takeaperiodof time to implement,however thepotentialforfuturesuccesseswillbedemonstratedintheintegratedcommunicationplanaswellassupportingtimeframeforplanned successes.
Thestrategicobjectivesidentifiedforthisintegrationplanaimstostrengthenexistingachievementsandaddressthegapsidentified.Insupportoftheintegrationplantheunitwillsecureprivatefinancialsupporttoenhanceprovincialrevenuethroughprivateinvestmentininfrastructureandservicedelivery.ItswillevolveasadynamicandsustainablecentreofexcellenceforPPP’s,providingtechnicalassistancetopublicinstitutionsthroughprojectfeasibility,procurementandmanagement.ItwillensuresuccessfulidentificationofPPPprojectopportunitiesthatwillyieldvalueforallstakeholdersandpromoteanenablingenvironmentthroughPPP’sintheMunicipalfield.
Insupportoftheaboveobjective,theunitwillensurethatsucharesupportedbysufficientresources,newappointmentsandsufficienttrainingtodevelopskillsinthePPPfield.Furthermore,thePPPunitwillcommunicatethegovernment’sPPPstrategyclearlyandconsistentlytoalldepartments,localauthorities,potentialinvestorsandotherstakeholders.Itswillassistinstitutionstoprepareandimplementcost-effectiveandaffordablePPPprojects.SuchassistancewouldbeavailablethroughoutthePPPprojectcyclefromprojectidentificationthroughtofinancialclosure.
Provincial Financial Management and Governance (PFMG)
Financial AccountingIn linewith strengtheningcapacity indepartments, Treasurywill continue towork towardsassistingallGPGdepartmentsand their entities toobtainanunqualifiedaudit report andhenceanunqualified report for theconsolidatedannualfinancialstatements.Someoftheinterventionstoensurethatthisobjectiveisachieved,TreasurywilluseofmonthlyreportingsupportedbytheCFOforumstoensurethatalldepartmentsshareexperiencesandknowledgeinfinancialmanagement.Furthermore,Treasurywillembarkonassistingdepartmentsinclearingtheirauditqueriesandensuringthattheydonotrecurandanumberoftoolshavealreadybeendevelopedinthisregard.Treasurywillalsofocusonensuringthattheinternalauditrecommendationsareimplemented.
Asset ManagementIn2008/09,Treasurywillensurethatalldepartmentshavealltheirassetsvaluedinlinewiththeimplementationoftheassetmanagementreforms.ValuationofallassetswillbetheculminationoftheimplementationofassetmanagementplansthathavealreadybeensignedbytheChiefFinancialOfficers.AfocuswillalsobeplacedontrainingofassetmanagersindepartmentstoensurethatGPGassetsareproperlymanagedandmaintained.
RiskManagementAs Treasury continues to implement enterprisewide riskmanagement, the focuswill be on capacitating thedepartments toensurethatrisksareproperlymanagedindepartmentswhiledischargingtheir functions.Forenterpriseriskstobeproperlymanaged,departmentswillhavetodeterminetheirriskappetite.Riskappetiteistheamountofexposureorpotentialadverseimpactfromaneventthatadepartmentiswillingtoacceptorretain.ThiswillenabletheAccountingOfficerstocommunicatetheriskappetitetoall levelsof thedepartmentsandthereforebeincorporatedinthedaytodayoperations.TreasurywillthereforeworkwiththeChiefRiskOfficersindepartmentstodeterminetheriskappetite.
Assets and LiabilitiesTreasurywillcontinuetoassistdepartmentsinensuringthattheymeetthetargetof5%ofactualexpenditure,cashflowprojectionsagainstthefundrequestedtofundexpenditure.Theassistancewillbeprovidedbymeansoftrainingofdepartmentsonaquarterlybasisaswellasprovidingthemwithauserfriendlysystemtoassistwithcashmanagement.Inordertooptimizeownrevenuethedepartmentwillcontinuetoinvestsurplusfundsinaprudentmannerwhilemaintainingtheappropriatelevelofrisk.
Public Finance Management Reforms (PFMR)
Municipal Budgets and Compliance Theunitplansin2008/09willfocusonenhancingcurrentintergovernmentalprocessesrelating to financial transfers andplanningbetweenprovincialgovernmentanddistrictandlocalmunicipalitiesbyensuringtimeousavailabilityoftheProvincialGazetteinthemunicipalities.Itswillensurethatdelegatedmunicipalitiessuccessfullyprepareand

553
Vote 14 - Gauteng Treasury • 2008/09 - Budget Statement 2
timeously submit theirmonthly In-Year-Monitoring reports,WithdrawalStatements,MFMAComplianceReturns forconsiderationbyMunicipalCouncils,ProvincialandNationalTreasuryandotherGovernmentInstitutions.
InlinewiththeintergovernmentalrelationshipwithLocalGovernmenttheunitwillcontinueitscollectivesupporttomunicipalitiesundertheGautengMunicipalSupportPlanandimplementsupportinitiativesaimedatcapacitatingallmunicipalitiesinGautengProvince.AmunicipalfinancialcapacitybuildinginitiativeaswellastheMunicipalInternSupportProgrammewillbelaunched.TheunitwillgolivewiththeportalfortheGautengMunicipaldatabasewhereallthemunicipalfinancialandnon–financialinformationwillbehoused.ItswillincollaborationwiththeDepartmentofLocalGovernmentdrivetheimplementationoftheGautengFinancialSummitResolutionsandAgendatowardsultimatelyimprovingservicedeliveryatalocalgovernmentlevel.
TheunitwillcontinuetomonitorcompliancewiththeMFMAinallthedelegatedmunicipalities.Theunit’sinternalcapacityhasevolvedextensivelyandwiththeadventofthe2008/09financialyearitwillseetheinstitutionalisationandoperationalisationoftheDirectorate:MunicipalComplianceandIntergovernmentalRelations.
Municipal Financial Governance (MFG)TheMFGunitwillcontinuetheirsupporttomunicipalitiesby:• AssistingwithformulationofRiskManagementStrategiesandmonitoringimplementation;• EvaluatingAFSofmunicipalitiesforreasonablenessandfairpresentation;• AssessingandMonitoringthefunctioningandeffectivenessofInternalAuditandAuditCommittees;• AssistingwithestablishmentofAuditcommitteesandInternalAuditunits• AssistingmunicipalitieswithGRAP/GAMAPConversionandimplementationandAFSpreparation;• AssistingwithestablishingcredibleAssetManagementControlsandSystems;and• VettingtheestablishmentandfunctioningofMunicipalFinancialSystems
Public Finance Management Act (PFMA)Theunitcontinuestocarryoutitsmainfunctionofleadingtheimplementationoffinancialmanagementreformsinboththeprovincialdepartmentsandpublicentities.ThepolicysettingandmonitoringfunctionintermsofSupplyChainManagementwillcontinuetogainmomentumandgoingforwardtheunitwillprovideongoinginstitutionalsupport and training to municipalities andprovincialdepartments.
4. RECEIPTS AND FINANCING
TheprimarysourceoffundingforGautengTreasuryistheequitableshare;howeverconditionalgrantsallocationsaremadewitheffectfromthe2008MTEF.ThelaunchingofGautengTreasuryasafullyfledgeddepartmentsawitexpenditureincreasing127.6percentin2006/07asmorepersonnelcapacitywasemployedtosupporttheGToversightfunctions.
4.1 Summary of receipts
TABLE 1: SUMMARY OF RECEIPTS: GAUTENG TREASURY
Outcome Main appropriation
Adjusted appropriation
Revised estimate
Medium-term estimates
R thousand 2004/05 2005/06 2006/07 2007/08 2008/09 2009/10 2010/11
Equitable share 26,870 18,510 42,145 100,292 100,292 100,292 181,349 207,628 213,184
Conditional grants 4,000 4,000 4,000 4,200 4,410 4,733
Total receipts 26,870 18,510 42,145 104,292 104,292 104,292 185,549 212,038 217,917
TheprimarysourceoffundingforGautengTreasuryistheequitableshare,howeverconditionalgrantsallocationsaremadewitheffectfromthe2008MTEF.ThelaunchingofGautengTreasuryasafullyfledgeddepartmentsawits expenditure increasingby127.6percent in2006/07asmorepersonnel capacitywas employed to supporttheGToversight functions. Thedepartment’sbudget further increasedby149.8percent in2007/08due to theimplementationofthenewstructure.This,togetherwithtotalallocationofR220millionfortheGautengFundovertheMTEFperiod,resultedinthedepartment’sbudgetgrowingatanannualaverageof23.6percent.Theequitableshareallocationgrewbyanaverageof16.2percentbetween2004/05and2006/07,andbyanaverageof5.5percentovertheMTEF.Conditionalgrantsallocationsareonlyfactoredoverthe2008MTEFandreflectagrowthof5.1 percent.

554
Budget Statement 2 - 2008/09 • Vote 14 - Gautneg Treasury
4.2 Departmental receipts collection
TABLE 2: DEPARTMENTAL RECEIPTS: GAUTENG TREASURY
Outcome Main appropriation
Adjusted appropriation
Revised estimate
Medium-term estimates
R thousand 2004/05 2005/06 2006/07 2007/08 2008/09 2009/10 2010/11Tax receipts
Casino taxes
Horse racing taxes
Liquor licences
Motor vehicle licences Sales of goods and services other than capital assets 10 10 Transfers received Fines, penalties and forfeits Interest, dividends and rent on land 176,063 223,189 227,689 152,184 220,000 259,977 236,500 254,240 273,308Sales of capital assets Financial transactions in assets and liabilities 10 Total departmental receipts 176,063 223,189 227,699 152,184 220,000 259,997 236,500 254,240 273,308
Interestrevenuegrowsat9percentbetweenthe2004/05and2006/07financialyears.Thispositivegrowthcontinuesoverthe2008MTEFalbeitatareducedaveragegrowthof5percent.Thisreductioninthegrowthrateisinfluencedby:• Thedepletionofpartoftheprovincialreservesduetospendingrequirementsbydepartments;and• The implementation of further phases of the intergovernmental cash coordination project that will placeinvestmentpowerswiththeCorporationofPublicDepositswhichmayvarytheamountofinterestearnedovertheMTEF.
5. PAYMENT SUMMARY
5.1 Key assumptionsThepreparationof the2008/09MTEFbudgetwasguidedby theGautengandNationalTreasury’sbudgetguideline.Thedepartmentfurtherreceiveditsguidancefromitsfiveyearstrategicplanand2008/09annualperformanceplan.Bulkofthedepartment’sbudgetisallocatedtocompensationofemployeesandfollowedbygoodsandservices.Toarriveatthepersonnelbudget,apersonnelmodelwasusedtocoststhedepartment’snewpersonnelestablishmentstructure.Historicinformationwasusedtobudgetfortherecurrentitemssuchasstationery,printing,telephonecosts,travelandsubsistencecosts,whiletherecruitmentaswellastheITplanswereconsultedtocostthegoodsandservicesandacapitalbudget.Theonceoffprogrammesandinitiativewerecostedfromzero.
555
Vote 14 - Gauteng Treasury • 2008/09 - Budget Statement 2
5.2. Programme summary
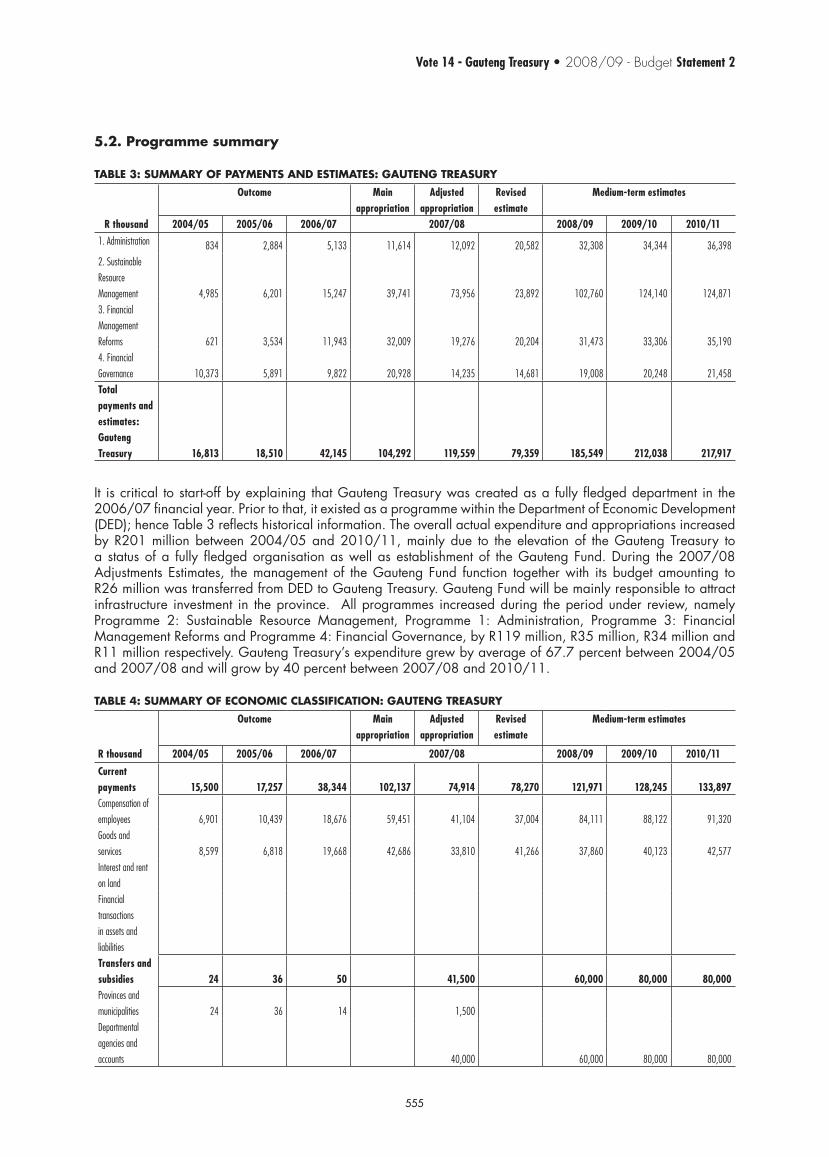
TABLE 3: SUMMARY OF PAYMENTS AND ESTIMATES: GAUTENG TREASURY
Outcome Main appropriation
Adjusted appropriation
Revised estimate
Medium-term estimates
R thousand 2004/05 2005/06 2006/07 2007/08 2008/09 2009/10 2010/111. Administration 834 2,884 5,133 11,614 12,092 20,582 32,308 34,344 36,3982. Sustainable Resource Management 4,985 6,201 15,247 39,741 73,956 23,892 102,760 124,140 124,8713. Financial Management Reforms 621 3,534 11,943 32,009 19,276 20,204 31,473 33,306 35,1904. Financial Governance 10,373 5,891 9,822 20,928 14,235 14,681 19,008 20,248 21,458Total payments and estimates: Gauteng Treasury 16,813 18,510 42,145 104,292 119,559 79,359 185,549 212,038 217,917
It iscritical tostart-offbyexplainingthatGautengTreasurywascreatedasafullyfledgeddepartment in the2006/07financialyear.Priortothat,itexistedasaprogrammewithintheDepartmentofEconomicDevelopment(DED);henceTable3reflectshistoricalinformation.TheoverallactualexpenditureandappropriationsincreasedbyR201millionbetween2004/05and2010/11,mainlydue to theelevationof theGauteng Treasury toa statusofa fullyfledgedorganisationaswellasestablishmentof theGautengFund.During the2007/08AdjustmentsEstimates, themanagementof theGautengFund function togetherwith itsbudgetamounting toR26millionwastransferredfromDEDtoGautengTreasury.GautengFundwillbemainlyresponsibletoattractinfrastructure investment in theprovince. Allprogrammes increasedduring theperiodunder review,namelyProgramme 2: Sustainable Resource Management, Programme 1: Administration, Programme 3: FinancialManagementReformsandProgramme4:FinancialGovernance,byR119million,R35million,R34millionandR11millionrespectively.GautengTreasury’sexpendituregrewbyaverageof67.7percentbetween2004/05and2007/08andwillgrowby40percentbetween2007/08and2010/11.
TABLE 4: SUMMARY OF ECONOMIC CLASSIFICATION: GAUTENG TREASURY
Outcome Main appropriation
Adjusted appropriation
Revised estimate
Medium-term estimates
R thousand 2004/05 2005/06 2006/07 2007/08 2008/09 2009/10 2010/11
Current payments 15,500 17,257 38,344 102,137 74,914 78,270 121,971 128,245 133,897Compensation of employees 6,901 10,439 18,676 59,451 41,104 37,004 84,111 88,122 91,320Goods and services 8,599 6,818 19,668 42,686 33,810 41,266 37,860 40,123 42,577Interest and rent on land Financial transactions in assets and liabilitiesTransfers and subsidies 24 36 50 41,500 60,000 80,000 80,000Provinces and municipalities 24 36 14 1,500Departmental agencies and accounts 40,000 60,000 80,000 80,000
556
Budget Statement 2 - 2008/09 • Vote 14 - Gautneg Treasury
Outcome Main appropriation
Adjusted appropriation
Revised estimate
Medium-term estimates
R thousand 2004/05 2005/06 2006/07 2007/08 2008/09 2009/10 2010/11
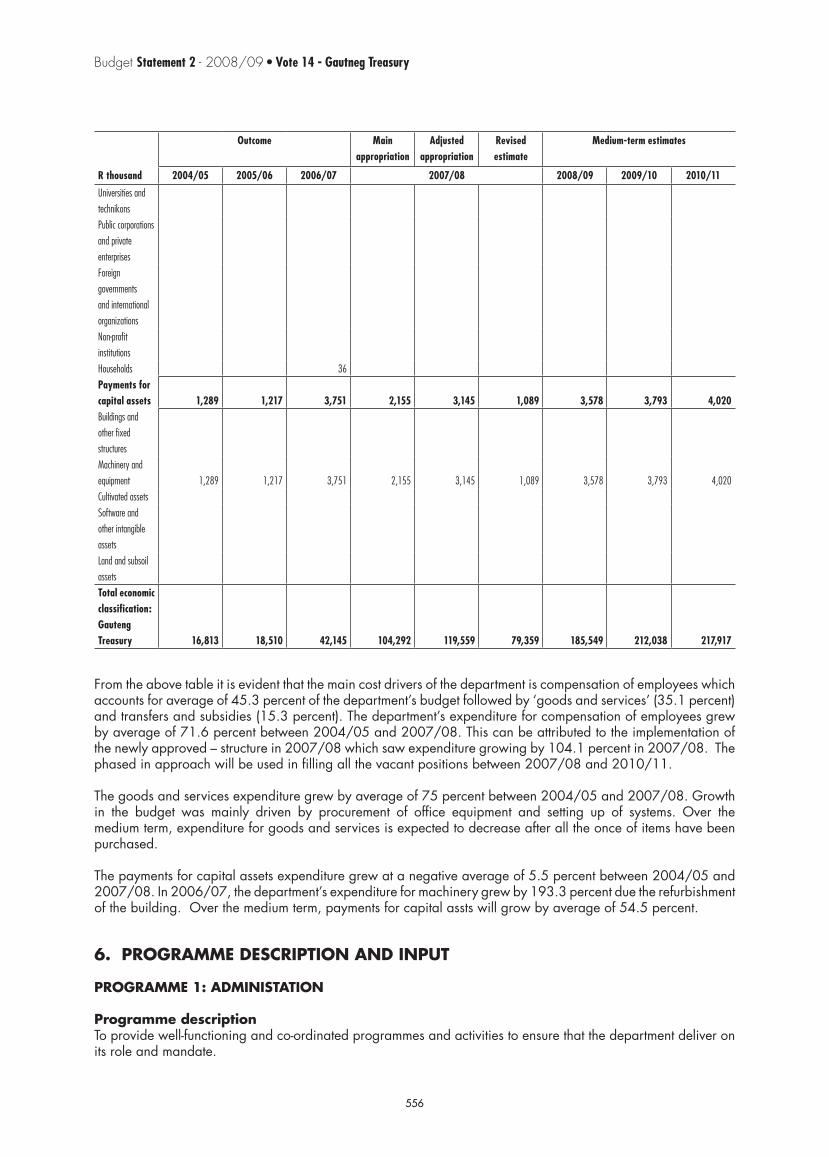
Universities and technikonsPublic corporations and private enterprisesForeign governments and international organizationsNon-profit institutionsHouseholds 36Payments for capital assets 1,289 1,217 3,751 2,155 3,145 1,089 3,578 3,793 4,020Buildings and other fixed structuresMachinery and equipment 1,289 1,217 3,751 2,155 3,145 1,089 3,578 3,793 4,020Cultivated assetsSoftware and other intangible assetsLand and subsoil assetsTotal economic classification: Gauteng Treasury 16,813 18,510 42,145 104,292 119,559 79,359 185,549 212,038 217,917
Fromtheabovetableitisevidentthatthemaincostdriversofthedepartmentiscompensationofemployeeswhichaccountsforaverageof45.3percentofthedepartment’sbudgetfollowedby‘goodsandservices’(35.1percent)andtransfersandsubsidies(15.3percent).Thedepartment’sexpenditureforcompensationofemployeesgrewbyaverageof71.6percentbetween2004/05and2007/08.Thiscanbeattributedtotheimplementationofthenewlyapproved–structurein2007/08whichsawexpendituregrowingby104.1percentin2007/08.Thephasedinapproachwillbeusedinfillingallthevacantpositionsbetween2007/08and2010/11.
Thegoodsandservicesexpendituregrewbyaverageof75percentbetween2004/05and2007/08.Growthin the budget was mainly driven by procurement of office equipment and setting up of systems. Over themediumterm,expenditureforgoodsandservicesisexpectedtodecreaseafteralltheonceofitemshavebeenpurchased.
Thepaymentsforcapitalassetsexpendituregrewatanegativeaverageof5.5percentbetween2004/05and2007/08.In2006/07,thedepartment’sexpenditureformachinerygrewby193.3percentduetherefurbishmentofthebuilding.Overthemediumterm,paymentsforcapitalasstswillgrowbyaverageof54.5percent.
6. PROGRAMME DESCRIPTION AND INPUT
PROGRAMME 1: ADMINISTATION
Programme descriptionToprovidewell-functioningandco-ordinatedprogrammesandactivitiestoensurethatthedepartmentdeliveronits role and mandate.

557
Vote 14 - Gauteng Treasury • 2008/09 - Budget Statement 2
Programme objectives• IntegratepolicieswithinTreasurytoensuresynergiesandeffectiveco-ordination;• Drivethedepartmentalstrategy;• Providerequiredsupporttoenhancedelivery;• Providehumanresourcemanagementservices,complianttolegislation• Provideinternalandexternalcommunicationsservices;• Provideinformationtechnologyservices;• Provideallotherauxiliaryservices;and• ManageandoverseetheimplementationofPubicandPrivatePartnershipsinGautengtosupporttheGPGeconomicgrowth,jobcreationandpovertyalleviationstrategies.
TABLE 5: SUMMARY OF PAYMENTS AND ESTIMATES: ADMINISTRATION
R thousand
Outcome Main appropriation
Adjusted appropriation
Revised estimate
Medium-term estimates
2004/05 2005/06 2006/07 2007/08 2008/09 2009/10 2010/111. Management Services 834 2,884 2,534 3,864 3,864 6,395 2,544 2,697 2,8582. Corporate Services 2,599 3,341 4,326 3,544 19,135 20,380 21,5973. Office of the CFO 4,409 3,902 10,643 10,629 11,267 11,943Total payments and estimates: Administration 834 2,884 5,133 11,614 12,092 20,582 32,308 34,344 36,398
Table5describesthetrendsintheactualexpenditureandappropriationsforProgramme1:Administrationanditcanbeseenthatbetween2006/07and2010/11,thebudgetincreasedbyR36millionduetothecreationofunitssuchascommunications,humanresourcesandChiefFinancialOfficer’soffice.Sub-programme2:CorporateServiceshasseenanincreaseofR19millionbetween2006/07and2010/11period.ManagementServiceshasincreasedslightlybyR2millionbetween2004/05and2010/11financialyears.Overthemediumtermtheoverallexpenditureofthisprogrammewillgrowby20.9percent.
TABLE 6: SUMMARY OF ECONOMIC CLASSIFICATION: ADMINISTRATION
R thousand
Outcome Main appropriation
Adjusted appropriation
Revised estimate
Medium-term estimates
2004/05 2005/06 2006/07 2007/08 2008/09 2009/10 2010/11
Current payments 811 2,863 5,069 11,172 11,065 20,322 28,730 30,551 32,378Compensation of employees 763 2,546 2,448 6,177 6,177 8,319 15,749 16,795 17,780Goods and services 48 317 2,621 4,995 4,888 12,003 12,981 13,756 14,598Interest and rent on land Financial transactions in assets and liabilities Transfers and subsidies 23 2Provinces and municipalities 23 2 Departmental agencies and accounts
Universities and technikons

558
Budget Statement 2 - 2008/09 • Vote 14 - Gautneg Treasury
R thousand
Outcome Main appropriation
Adjusted appropriation
Revised estimate
Medium-term estimates
2004/05 2005/06 2006/07 2007/08 2008/09 2009/10 2010/11
Public corporations and private enterprises
Foreign governments and international organizations
Non-profit institutions Households Payments for capital assets 21 62 442 1,027 260 3,578 3,793 4,020Buildings and other fixed structures Machinery and equipment 21 62 442 1,027 260 3,578 3,793 4,020Cultivated assets Software and other intangible assets Land and subsoil assets Total economic classification: Administration 834 2,884 5,133 11,614 12,092 20,582 32,308 34,344 36,398
Examiningtable6thatshowsthetrendsinactualexpenditureandfinalappropriationbyeconomicclassification,itisclearthatonaverage,themaincostdriversunderthisprogrammeare‘CompensationofEmployees’(59.2percent)andgoodsandservices (35.2percent) in theperiodunderreview.Payments forcapitalassetsonlyaccountsfor5.2percentoftheprogrammetotalbudget.Thekeyroleofthisprogrammeistoprovidesupportfunctiontotheentiredepartment.Itisworthnotingthatbetween2004/05and2007/08bothcompensationofemployeesandgoodsandservicesgrewby192.6percentand121.7percentrespectively.
PROGRAMME 2: SUSTAINABLE RESOURCE MANAGEMENT
Programme descriptionTheprogrammeaimstooptimiseresourcesallocation,utilisationandrevenueinordertomaximisethenetsocialbenefittoGautengcitizens.
Programme objectivesFiscal Policy and Economic Analysis• Tomaximisecurrentrevenuesourcesandoptimisepotentialnewrevenuestreams;• Developandimplementaprovincialcomprehensiverevenuestrategy;• Provide advisory services to relevant stakeholders on fiscal policy matters and the medium term fiscal
framework;• Provide provincial socio-economic research and analysis in order to inform resource allocation and
utilisation
Budget Management• Toallocateresourcesinanoptimalandtransparentmannerthisisalignedtonationalandprovincialprioritiesandaddressequity,needandspatialdevelopment;
• Toimplementbudgetreformswhichenhancebudgetingprocessesintheprovinceandenshrinesthestochasticnature of budgeting.

559
Vote 14 - Gauteng Treasury • 2008/09 - Budget Statement 2
Public Finance• Toprovidestrategicsupporttodepartmentsandagenciestoeffectivelyutilisepublicresources;• Toconductsectorlevelpolicyanalysisinordertomaximiseefficiencygainsandvalueformoney;• Tomonitorandevaluateperformanceoutcomesofspendingagencies.
TABLE 7: SUMMARY OF PAYMENTS AND ESTIMATES: SUSTAINABLE RESOURCE MANAGEMENT
R thousand
Outcome Main appropriation
Adjusted appropriation
Revised estimate
Medium-term estimates
2004/05 2005/06 2006/07 2007/08 2008/09 2009/10 2010/11
1. Programme Support 486 1,228 1,307 1,307 2,023 1,649 1,748 1,853
2. Budget Management 4,065 1,085 5,026 9,368 9,368 8,935 10,360 11,121 11,868
3. Fiscal Policy 434 736 3,095 6,309 6,309 4,110 9,847 10,438 11,064
4. Public Finance 4,380 4,202 12,941 8,441 8,824 17,625 17,357 16,402
5. Public Private Partnership 1,696 9,816 8,531 3,279 3,476 3,684
6. Gauteng Fund 40,000 60,000 80,000 80,000
Total payments and estimates: Sustainable Resource Management 4,985 6,201 15,247 39,741 73,956 23,892 102,760 124,140 124,871
Table7illustratesthetrendsinactualexpenditureandappropriationforProgramme2:SustainableResourcesManagementbetween theperiod2004/05and2010/11. Thisprogrammehas seenan increaseof R120millionduringtheperiodunderreview,drivenlargelybyincreaseintheallocationtoSub-Programme6:GautengFund,followedbySub-Programme4:PublicFinance(R12million),Sub-Programme3:FiscalPolicy(R11million)andlastlySub-Programme2:BudgetManagement(R8million).
Growthinappropriationsforthisprogrammehighlightthatbetween2004/05and2007/08cameinat68.6percentandwillescalateto73.5percentinthemediumtermperiod.
TABLE 8: SUMMMARY OF ECONOMIC CLASSIFICATION: SUSTAINABLE RESOURCE MANAGEMENT
R thousand
Outcome Main appropriation
Adjusted appropriation
Revised estimate
Medium-term estimates
2004/05 2005/06 2006/07 2007/08 2008/09 2009/10 2010/11
Current payments 4,985 6,074 14,605 39,023 32,833 23,606 42,760 44,140 44,871
Compensation of employees 2,679 2,912 7,146 27,320 19,673 13,895 32,519 33,287 33,352
Goods and services 2,306 3,162 7,459 11,703 13,160 9,711 10,241 10,853 11,519
Interest and rent on land
Financial transactions in assets and liabilities
Transfers and subsidies 4 40,000 60,000 80,000 80,000

560
Budget Statement 2 - 2008/09 • Vote 14 - Gautneg Treasury
R thousand
Outcome Main appropriation
Adjusted appropriation
Revised estimate
Medium-term estimates
2004/05 2005/06 2006/07 2007/08 2008/09 2009/10 2010/11
Provinces and municipalities 4
Departmental agencies and accounts 40,000 60,000 80,000 80,000
Universities and technikons
Public corporations and private enterprises
Foreign governments and international organizations
Non-profit institutions
Households
Payments for capital assets 127 638 718 1,123 286
Buildings and other fixed structures
Machinery and equipment 127 638 718 1,123 286
Cultivated assets
Software and other intangible assets
Land and subsoil assets
Total economic classification: Sustainable Resource Management 4,985 6,201 15,247 39,741 73,956 23,892 102,760 124,140 124,871
Lookingattrendsinactualexpenditureandappropriationsbyeconomicclassification,thelargestcostdriversarecompensationofemployees,goodsandservices,andtransfersandsubsidiesrespectivelyaveraging41.6percent, 30.7 percent and 26.7 percent of the programmes budget during the period under review. Theprogramme’sexpenditureoncompensationofemployeesgrewby145percentwhile ingoodsandservicesgrewby136percentin2006/07.ThiscanbeattributabletoPublicFinanceunitemployingmoresectorandinfrastructure specialist.

561
Vote 14 - Gauteng Treasury • 2008/09 - Budget Statement 2
KEY OUTPUTS AND SERVICE DELIVERY MEASURES
Sustainable Resource Management
Budget ManagementStrategic Objectives Measurable objective Performance
Measure /Indicator 2007/08Estimate
Performance Targets2008/09 2009/10 2010/11
Compile credible and transparent budget for GPG according to the planned budget cycle
Consolidated MTEF indicative allocation letterTimeliness Within 2 weeks of Budget
LekgotlaWithin 2 weeks of Budget Lekgotla
Within 2 weeks of Budget Lekgotla
Within 2 weeks of Budget Lekgotla
Treasury budget guideline circular development and distributedTimeliness Within 2 weeks of Budget
LekgotlaWithin 2 weeks of Budget Lekgotla
Within 2 weeks of Budget Lekgotla
Within 2 weeks of Budget Lekgotla
Training on budget guideline during the Budget Forum workshop
Training on budget guideline circular
Within 2 weeks of issuing budget guideline circular
Within 2 weeks of issuing budget guideline circular
Within 2 weeks of issuing budget guideline circular
Within 2 weeks of issuing budget guideline circular
Provincial cabinet memo on budget lekgotla distributedTimeliness Within 2 weeks of Budget
LekgotlaWithin 2 weeks of Budget Lekgotla
Within 2 weeks of Budget Lekgotla
Within 2 weeks of Budget Lekgotla
Bilateral engagements between NT and the province on provincial budget implementation
Hosting of National Treasury visits
2 visits per year (July and November)
2 visits per year (July and November)
2 visits per year (July and November)
2 visits per year (July and November)
Participation in provincial benchmark exercise
2 Benchmark session reports (1 for pre-benchmark and 1 for final benchmark)
2 Benchmark session reports (1 for pre-benchmark and 1 for final benchmark)
2 Benchmark session reports (1 for pre-benchmark and 1 for final benchmark)
2 Benchmark session reports (1 for pre-benchmark and 1 for final benchmark)
Bilateral engagements between provincial budget committee and departments on departmental budget implementation
Hosting of Premier Budget Committee
Premier Budget Committee recommendations report
Premier Budget Committee recommendations report
Premier Budget Committee recommendations report
Premier Budget Committee recommendations report
Table annual and adjustment budgets
Submission of annual and adjustment budgets that meet the requirements of NT and Provincial Priorities
100% compliance 100% compliance 100% compliance 100% compliance
MTEF financing model System development and implementation
Research completion System development and testing
System implementation System review
Implementation of budgetary reforms
Budget related research and supporting reforms from stakeholders
Research on budgetary reforms and implementation in the province
Training on researched reforms and reforms from stakeholders
Training on researched reforms and reforms from stakeholders
Training on researched reforms and reforms from stakeholders
Ensure availability of high integrity budget information for decision making within the GPG budget process
Monthly and Quarterly Financial and Non-Financial Reporting
IYM Data Consolidated Checked and Reported
Monthly and Quarterly Monthly and Quarterly Monthly and Quarterly Monthly and Quarterly
Development of data electronic systems
Provincial budget database and data warehouse
Terms of reference for system development and first phase development
Second and third phases development
Review and improvement Review and improvement

562
Budget Statement 2 - 2008/09 • Vote 14 - Gautneg Treasury
Public FinanceStrategic Objectives Measurable objective Performance
Measure /Indicator 2007/08Estimate
Performance Targets2008/09 2009/10 2010/11
Oversight, guidance and input into provincial budgetary planning, development, implementation and analysis
Improved quality of departmental inputs to budget statement and timeous submissions
Budget review sessions with all departments
Review all 14 departments annually in May
Review all 14 departments annually in May
Review all 14 departments annually in May
Review all 14 departments annually in May
Provincial Treasury Budget Guide for 2008/09 work shopped to all departments
100% compliance by departments to budget prescripts
14 departments 14 departments 14 departments 14 departments
MTEF and Adjustment budget sectoral analysis
Interventions to support strategic planning framework with departments
Improved alignment of strategic plans, annual performance plans and resource allocations
Annually in June Annually in June Annually in June Annually in June
Review of sectoral MTSF Assessment reports completed
14 reports completed annually in August
14 reports completed annually in August
14 reports completed annually in August
14 reports completed annually in August
Adjustment Budget, MTEF, Infrastructure plan and budget analysis sectoral report
Assessment reports completed
14 reports completed annually in September
14 reports completed annually in September
14 reports completed annually in September
14 reports completed annually in September
Inputs to benchmark exercise
Sectoral analysis on spending pressure and service delivery
14 reports completed annually in January
14 reports completed annually in January
14 reports completed annually in January
14 reports completed annually in January
Budget Implementation quarterly assessment reports
Sectoral expenditure report
Sectoral expenditure reports completed for all sectors
Quarterly Quarterly Quarterly Quarterly
Sectoral performance report
Performance reports completed
Quarterly Quarterly Quarterly Quarterly
Monitor implementation of all conditional grants
Conditional grants implementation according to DORA provisions
Compliance with the provisions of conditional grant framework
Quarterly Quarterly Quarterly Quarterly
Conditional grants performance Report
Evaluation Report on Infrastructure implementation completed
Quarterly Quarterly Quarterly Quarterly
Conducting efficiency, value for money and economic evaluation studies
Intervention that support budget proposal and business plan development.
Training sessions for budget task teams held
Annually in June Annually in June Annually in June Annually in June
Presentations to legislature on financial and economic performance
Presentation to legislator is made
Quarterly Quarterly Quarterly Quarterly
Monitor and Facilitate implementation of infrastructure delivery Improvement programme - IDIP)/IDIP Model
Training Departments on the IDIP (improved service delivery Model)
Roll out the model in all infrastructure departments
June 2007
Provide IRM training to Infrastructure implementing departments
Improved compliance by departments
June 2007
Monitor and evaluate spending on infrastructure
Monthly and quarterly spending and delivery reports completed
Quarterly Quarterly Quarterly Quarterly
Material and significant improvement in delivery of infrastructure plans
Assessment report on infrastructure plans
Annually in July Annually in July Annually in July Annually in July

563
Vote 14 - Gauteng Treasury • 2008/09 - Budget Statement 2
Strategic Objectives Measurable objective Performance Measure /Indicator
2007/08Estimate
Performance Targets2008/09 2009/10 2010/11
Infrastructure Site visit reports
Site visit report submitted Monthly and Quarterly Monthly and Quarterly Monthly and Quarterly Monthly and Quarterly
Development of Infrastructure database and Maintenance
Infrastructure database developed and updated
Monthly Monthly Monthly Monthly
Fiscal Policy and Economic AnalysisStrategic Objectives Measurable objective Performance
Measure /Indicator 2007/08Estimate
Performance Targets2008/09 2009/10 2010/11
Conduct feasibility study on provincial taxation
Feasibility study planned and implemented
Annual Outline of research programme
N/A no research was undertaken
Conduct research with the assistance of external experts
Report on the initial results of the research
Continue with annual updates.
Advise fiscal policy and determine the medium term fiscal framework
Quarterly reports produced (monitoring and evaluation)
Timely Published progress review report
4 Reports produced for legislature and departments
4 Reports produced for legislature and departments
4 Reports produced for legislature and departments
4 Reports produced for legislature and departments
Annual budget review publication
Timely Published budget review
Annually in March Annually in March Annually in March Annually in March
HoD/Budget Lekgotla presentation
Timely scheduled lekgotla presentation events
2 presentations per year 2 presentations per year 2 presentations per year 2 presentations per year
Develop borrowing framework
Policy document Draft frame work developed
Borrowing frame work adopted
Ad hoc updates of the framework
Ad hoc updates of the framework
MTBPS compiled Timely Published report First draft produced prior to 2nd lekgotla
Final report before Nov. First draft produced prior to 2nd lekgotla
Final report before Nov. First draft produced prior to 2nd lekgotla
Final report before Nov.
Optimise own revenue (GPG)
Revenue forecasting model utilised
Percentage variance of revenue forecasted
98% accuracy 98% accuracy 98% accuracy
Produce regular provincial economic review and outlook reports
Analyse the potential and constraint for growth and development in the province
Timely Published Gauteng Growth and Development Report (GGDR)
GGDR report published Quarterly
GGDR report published Quarterly
GGDR report published Quarterly
Econometric modelling (trend and forecast analysis) reports
Timely published trend analysis report
Bi-annual Report Published Bi-annual Report Published Bi-annual Report Published
Monthly and quarterly economic report
Timely published reports Monthly and quarterly report published
Monthly and quarterly report published
Monthly and quarterly report published
Provincial Economic Review and Outlook and Socio-economic report
Timely published reports Annual report published Annual report published Annual report published Annual report published
Social Accounting Matrix analysis report and impact analysis
Timely published reports Annual report published Annual report published Annual report published Annual report published
Macro Economic Model Timely published reports Annual report published Annual report published Annual report published Annual report published

564
Budget Statement 2 - 2008/09 • Vote 14 - Gautneg Treasury
Public Private PartnershipsStrategic Objectives Measurable objective Performance
Measure /Indicator 2007/08Estimate
Performance Targets2008/09 2009/10 2010/11
To manage and oversee the implementation of Public and Private Partnerships in Gauteng
Promote and enabling environment for PPPs
Percentage satisfaction with regard to quality output, timeliness and cost
100% 100% 100% 100%
Increase with PPP unit policy and regulations
Percentage satisfaction of compliance clearly identifying areas of non-compliance
100% 100% 100% 100%
Facilitate and enhance provincial revenue through private investment in infrastructure and service delivery
Number of increased private finance initiatives
5 6 6 7
Promote a platform for a revitalised and concerted action programme to promote a greater role for private sector investment
Percentage increase in opportunities that can provide financial support
100% 100% 100% 100%
BEEs adapting to a suitable range of skills in PPPs
Percentage increase of BEEs to demonstrate a suitable range of skills
70% 80% 90% 100%
Facilitate certainty in the regulatory framework
Percentage increase of stakeholder training and awareness programmes
100% 100% 100% 100%
Drive PPP deal flow by identifying project opportunities that yield value for all stakeholders
Increase in the number of registered PPP projects
5 6 7 8
Satisfactory regulated PPP projects providing a stable and planned platform for new PPP initiatives
Increase in the number of newly regulated PPP projects within GPG
2 4 4 5
PROGRAMME 3: FINANCIAL MANAGEMENT REFORM (FMR)
Programme descriptionProvision of guidanceand leadership towards the implementation of financialmanagement reformsbroughtaboutbytheimplementationofboththePFMAtoprovincialdepartmentsandtheMFMAtomunicipalities.
Programme objectives• IntermsofProvincialGovernment:• Takingtheleadroleindevelopingfinancialmanagementskillsandcapacityintheprovince;• Ensuring that Internal Audit and Audit Committees are used effectively as risk management tools indepartments;
• ContinuetoresearchbetterfinancialmanagementpracticesandpolicieswithagoalofimplementingthembothinGPGandinmunicipalities;
• EnsuringcompliancetothePFMAbydepartmentsandtheirpublicentities;• Ensure implementation and compliance to a Supply Chain Management Policy for departments and
municipalities.
IntermsofLocalGovernment:• EnsuringtheimplementationoftheMFMAinallmunicipalitiesinGauteng;• EnsuringcompliancewiththeMFMAbymunicipalitiesandmunicipalentities;• Monitoringthepreparationofmunicipalbudgets;
565
Vote 14 - Gauteng Treasury • 2008/09 - Budget Statement 2
• Monitoringthemonthlyoutcomesofthosebudgets;• AssistingmunicipalitieswiththeimplementationofGRAPstandardsandthegeneralpreparationofFinancialStatements;
• AssistingmunicipalitieswithestablishingInternalAuditunitsandAuditCommittees;• AssistingmunicipalitiesofformulatingrealisticRiskManagementStrategiesandmonitoringtheimplementationofthosestrategies;
• AssistingmunicipalitieswithestablishingcredibleAssetManagementcontrolsandsystems;and• Ensuringtimeousfinancialmanagementinterventionsatmunicipalitiesasandwhenrequired.
TABLE 9: SUMMARY OF PAYMENTS AND ESTIMATES: FINANCIAL MANAGEMENT REFORMS (FMR)
Outcome Main appropriation
Adjusted appropriation
Revised estimate
Medium-term estimates
R thousand 2004/05 2005/06 2006/07 2007/08 2008/09 2009/10 2010/11
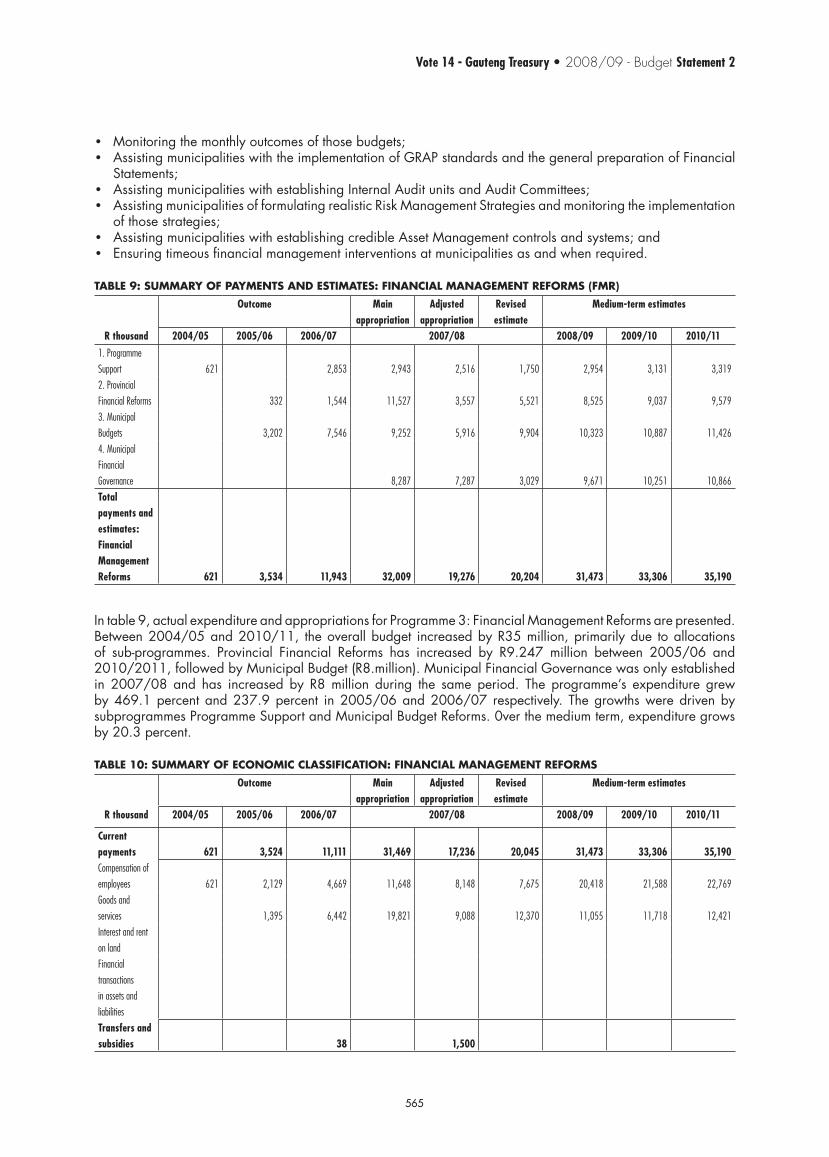
1. Programme Support 621 2,853 2,943 2,516 1,750 2,954 3,131 3,3192. Provincial Financial Reforms 332 1,544 11,527 3,557 5,521 8,525 9,037 9,5793. Municipal Budgets 3,202 7,546 9,252 5,916 9,904 10,323 10,887 11,4264. Municipal Financial Governance 8,287 7,287 3,029 9,671 10,251 10,866Total payments and estimates: Financial Management Reforms 621 3,534 11,943 32,009 19,276 20,204 31,473 33,306 35,190
Intable9,actualexpenditureandappropriationsforProgramme3:FinancialManagementReformsarepresented.Between2004/05and2010/11, theoverallbudget increasedbyR35million,primarilydue toallocationsof sub-programmes. Provincial Financial Reforms has increased by R9.247 million between 2005/06 and2010/2011,followedbyMunicipalBudget(R8.million).MunicipalFinancialGovernancewasonlyestablishedin 2007/08and has increased by R8million during the same period. The programme’s expenditure grewby469.1percentand237.9percent in2005/06and2006/07 respectively. ThegrowthsweredrivenbysubprogrammesProgrammeSupportandMunicipalBudgetReforms.0verthemediumterm,expendituregrowsby20.3percent.
TABLE 10: SUMMARY OF ECONOMIC CLASSIFICATION: FINANCIAL MANAGEMENT REFORMS
Outcome Main appropriation
Adjusted appropriation
Revised estimate
Medium-term estimates
R thousand 2004/05 2005/06 2006/07 2007/08 2008/09 2009/10 2010/11
Current payments 621 3,524 11,111 31,469 17,236 20,045 31,473 33,306 35,190Compensation of employees 621 2,129 4,669 11,648 8,148 7,675 20,418 21,588 22,769Goods and services 1,395 6,442 19,821 9,088 12,370 11,055 11,718 12,421Interest and rent on land Financial transactions in assets and liabilities Transfers and subsidies 38 1,500
566
Budget Statement 2 - 2008/09 • Vote 14 - Gautneg Treasury
Outcome Main appropriation
Adjusted appropriation
Revised estimate
Medium-term estimates
R thousand 2004/05 2005/06 2006/07 2007/08 2008/09 2009/10 2010/11
Provinces and municipalities 2 1,500 Departmental agencies and accounts Universities and technikons
Public corporations and private enterprises
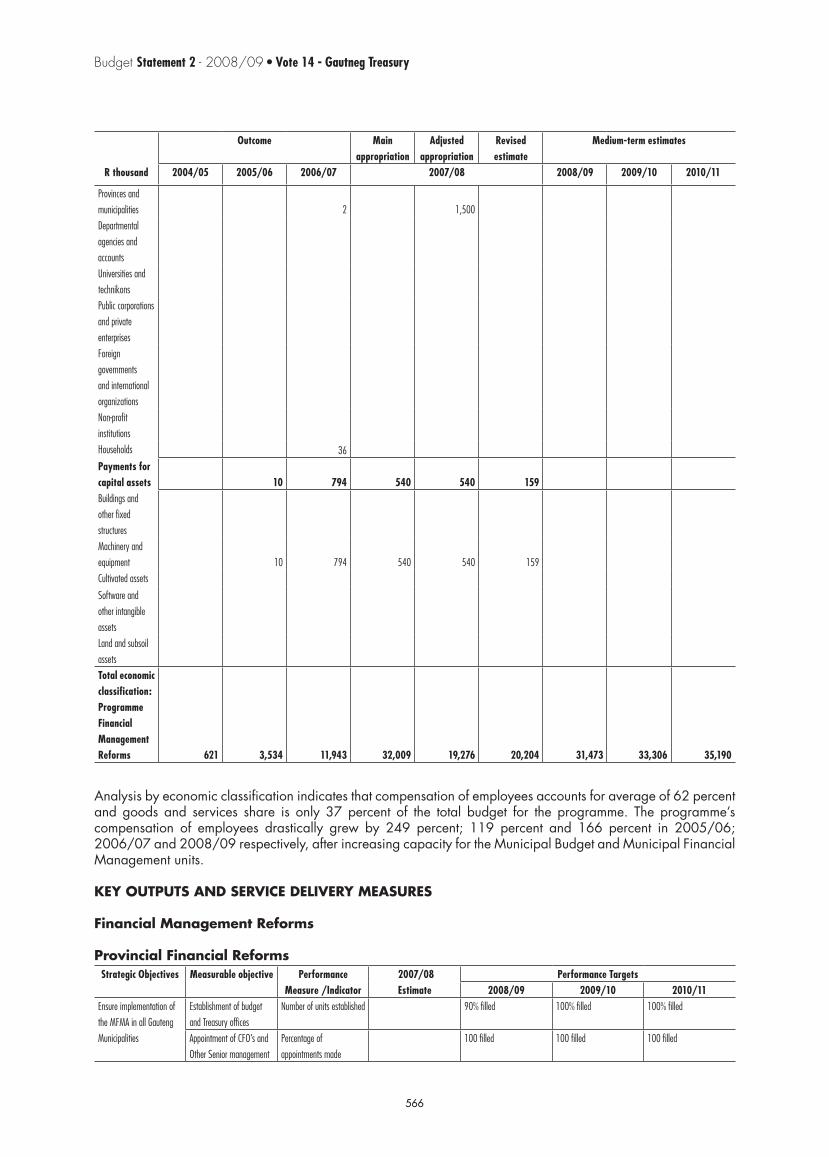
Foreign governments and international organizations Non-profit institutions Households 36 Payments for capital assets 10 794 540 540 159Buildings and other fixed structures Machinery and equipment 10 794 540 540 159 Cultivated assets Software and other intangible assets Land and subsoil assets Total economic classification: Programme Financial Management Reforms 621 3,534 11,943 32,009 19,276 20,204 31,473 33,306 35,190
Analysisbyeconomicclassificationindicatesthatcompensationofemployeesaccountsforaverageof62percentandgoodsand services share is only37percent of the total budget for the programme. Theprogramme’scompensation of employees drastically grew by 249 percent; 119 percent and 166 percent in 2005/06;2006/07and2008/09respectively,afterincreasingcapacityfortheMunicipalBudgetandMunicipalFinancialManagement units.
KEY OUTPUTS AND SERVICE DELIVERY MEASURES
Financial Management Reforms
Provincial Financial Reforms Strategic Objectives Measurable objective Performance
Measure /Indicator 2007/08Estimate
Performance Targets2008/09 2009/10 2010/11
Ensure implementation of the MFMA in all Gauteng Municipalities
Establishment of budget and Treasury offices
Number of units established 90% filled 100% filled 100% filled
Appointment of CFO’s and Other Senior management
Percentage of appointments made
100 filled 100 filled 100 filled
567
Vote 14 - Gauteng Treasury • 2008/09 - Budget Statement 2
Strategic Objectives Measurable objective Performance Measure /Indicator
2007/08Estimate
Performance Targets2008/09 2009/10 2010/11
Set up process for three MTEF budgets
Percentage of municipalities with completed processes
100 % complete 100 % complete 100 % complete
Monitor the preparation of annual budget and their monthly outcomes for municipalities
Municipal IDP’S and service delivery budget implementation plans reviewed
Evaluation report on the quality of IDP’s and service delivery plans
1 Report annually per Municipality.
1 Report annually per Municipality.
1 Report annually per Municipality.
Monitor and assess annual financial statements for municipalities
Submission of annual financial statements
Evaluation report on annual financial statements submitted
1 Report annually per Municipality.
1 Report annually per Municipality.
1 Report annually per Municipality.
Ensure timeous financial management interventions at municipalities as and when required
Provide Technical assistance and training to municipalities
Number of people trained and Frequency of requests for assistance
Report on No. of trainees and Ad hoc progress reports
Report on No. of trainees and Ad hoc progress reports
Report on No. of trainees and Ad hoc progress reports
Take the lead role in developing financial management skills and capacity in the province
Provide Technical assistance and training to municipalities
Number of people trained and Frequency of requests for assistance
Report on No. of trainees and Ad hoc progress reports
Report on No. of trainees and Ad hoc progress reports
Report on No. of trainees and Ad hoc progress reports
Ensure that internal audit committees are used effectively as risk management tools in departments
Monitor the implementation of recommendations made by internal audit (GAS) by CFO’s and HOD’s.
Implementation progress reports
Quarterly reports Quarterly reports Quarterly reports
Report on non complying departments
Compliance report Quarterly reports Quarterly reports Quarterly reports
Ensuring that financial management normative measures are adhered to in terms of the PFMA in both department and provincial public entities
Report on the compliance by departments and provincial public entities
Compliance report Annual com-pliance report Annual com-pliance report Annual com-pliance report
Ensure implementation and compliance to supply chain management Policy for departments
Departmental expenditure analysis and vendor procurement spend analysis (GSSC as an implementation agency)
Compliance with the requirements on the BBBEE act and the policy
Annual spend a analysis by from GSSC
100% com-pliance and spend analysis report
100% com-pliance and spend analysis report
100% com-pliance and spend analysis report
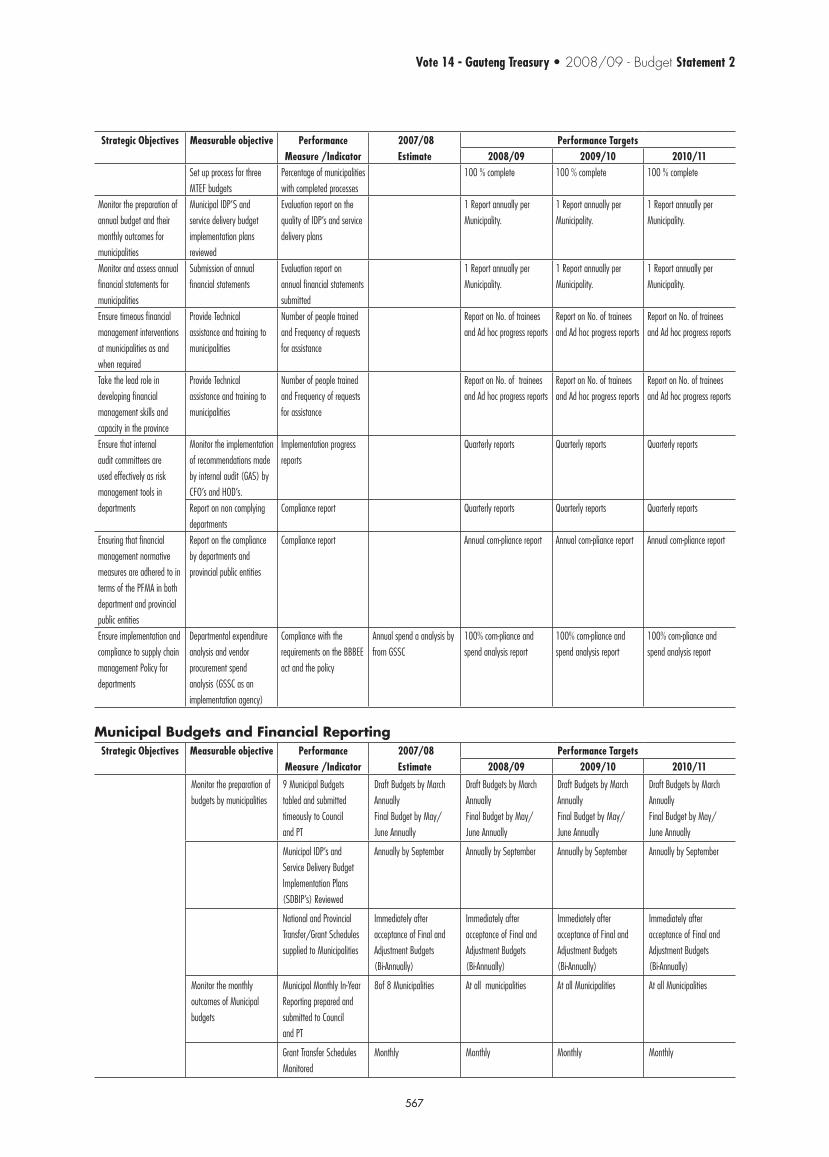
Municipal Budgets and Financial Reporting Strategic Objectives Measurable objective Performance
Measure /Indicator 2007/08Estimate
Performance Targets2008/09 2009/10 2010/11
Monitor the preparation of budgets by municipalities
9 Municipal Budgets tabled and submitted timeously to Council and PT
Draft Budgets by March AnnuallyFinal Budget by May/June Annually
Draft Budgets by March AnnuallyFinal Budget by May/June Annually
Draft Budgets by March AnnuallyFinal Budget by May/June Annually
Draft Budgets by March AnnuallyFinal Budget by May/June Annually
Municipal IDP’s and Service Delivery Budget Implementation Plans (SDBIP’s) Reviewed
Annually by September Annually by September Annually by September Annually by September
National and Provincial Transfer/Grant Schedules supplied to Municipalities
Immediately after acceptance of Final and Adjustment Budgets (Bi-Annually)
Immediately after acceptance of Final and Adjustment Budgets (Bi-Annually)
Immediately after acceptance of Final and Adjustment Budgets (Bi-Annually)
Immediately after acceptance of Final and Adjustment Budgets (Bi-Annually)
Monitor the monthly outcomes of Municipal budgets
Municipal Monthly In-Year Reporting prepared and submitted to Council and PT
8of 8 Municipalities At all municipalities At all Municipalities At all Municipalities
Grant Transfer Schedules Monitored
Monthly Monthly Monthly Monthly
568
Budget Statement 2 - 2008/09 • Vote 14 - Gautneg Treasury
Strategic Objectives Measurable objective Performance Measure /Indicator
2007/08Estimate
Performance Targets2008/09 2009/10 2010/11
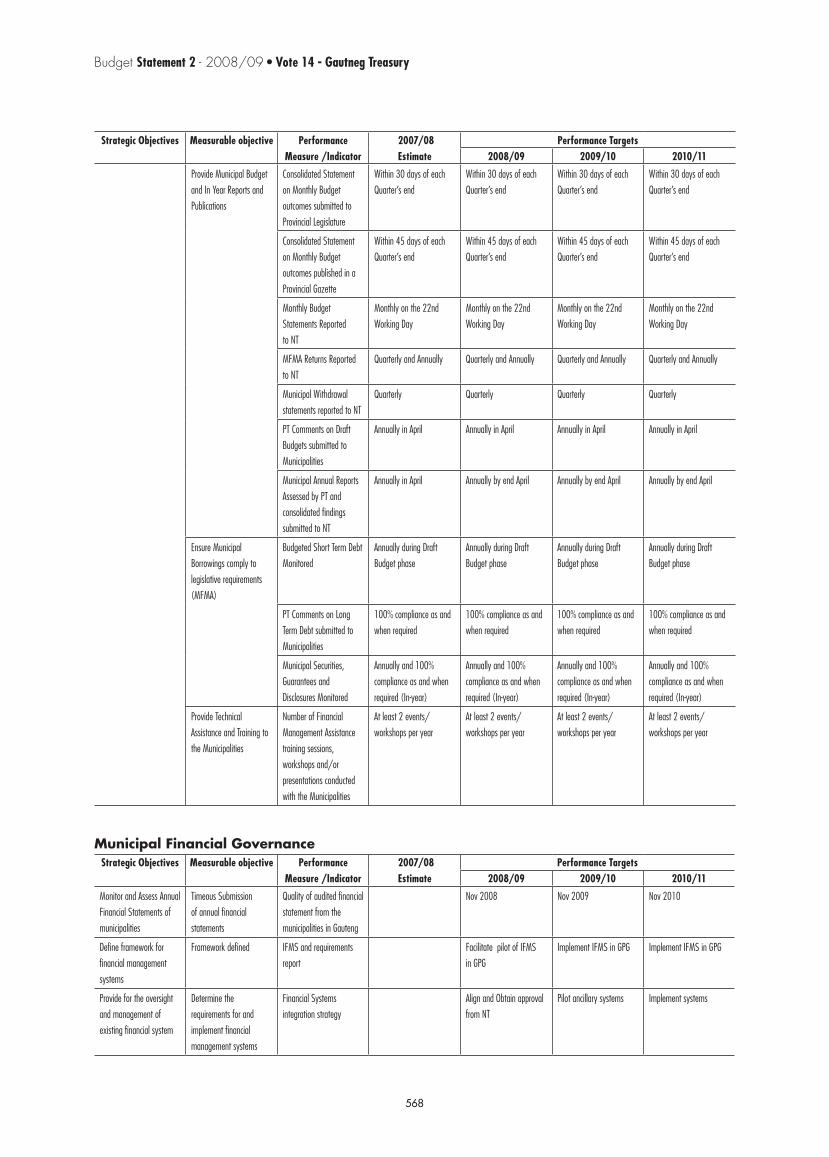
Provide Municipal Budget and In Year Reports and Publications
Consolidated Statement on Monthly Budget outcomes submitted to Provincial Legislature
Within 30 days of each Quarter’s end
Within 30 days of each Quarter’s end
Within 30 days of each Quarter’s end
Within 30 days of each Quarter’s end
Consolidated Statement on Monthly Budget outcomes published in a Provincial Gazette
Within 45 days of each Quarter’s end
Within 45 days of each Quarter’s end
Within 45 days of each Quarter’s end
Within 45 days of each Quarter’s end
Monthly Budget Statements Reported to NT
Monthly on the 22nd Working Day
Monthly on the 22nd Working Day
Monthly on the 22nd Working Day
Monthly on the 22nd Working Day
MFMA Returns Reported to NT
Quarterly and Annually Quarterly and Annually Quarterly and Annually Quarterly and Annually
Municipal Withdrawal statements reported to NT
Quarterly Quarterly Quarterly Quarterly
PT Comments on Draft Budgets submitted to Municipalities
Annually in April Annually in April Annually in April Annually in April
Municipal Annual Reports Assessed by PT and consolidated findings submitted to NT
Annually in April Annually by end April Annually by end April Annually by end April
Ensure Municipal Borrowings comply to legislative requirements (MFMA)
Budgeted Short Term Debt Monitored
Annually during Draft Budget phase
Annually during Draft Budget phase
Annually during Draft Budget phase
Annually during Draft Budget phase
PT Comments on Long Term Debt submitted to Municipalities
100% compliance as and when required
100% compliance as and when required
100% compliance as and when required
100% compliance as and when required
Municipal Securities, Guarantees and Disclosures Monitored
Annually and 100% compliance as and when required (In-year)
Annually and 100% compliance as and when required (In-year)
Annually and 100% compliance as and when required (In-year)
Annually and 100% compliance as and when required (In-year)
Provide Technical Assistance and Training to the Municipalities
Number of Financial Management Assistance training sessions, workshops and/or presentations conducted with the Municipalities
At least 2 events/ workshops per year
At least 2 events/ workshops per year
At least 2 events/ workshops per year
At least 2 events/ workshops per year
Municipal Financial GovernanceStrategic Objectives Measurable objective Performance
Measure /Indicator 2007/08Estimate
Performance Targets2008/09 2009/10 2010/11
Monitor and Assess Annual Financial Statements of municipalities
Timeous Submission of annual financial statements
Quality of audited financial statement from the municipalities in Gauteng
Nov 2008 Nov 2009 Nov 2010
Define framework for financial management systems
Framework defined IFMS and requirements report
Facilitate pilot of IFMS in GPG
Implement IFMS in GPG Implement IFMS in GPG
Provide for the oversight and management of existing financial system
Determine the requirements for and implement financial management systems
Financial Systems integration strategy
Align and Obtain approval from NT
Pilot ancillary systems Implement systems
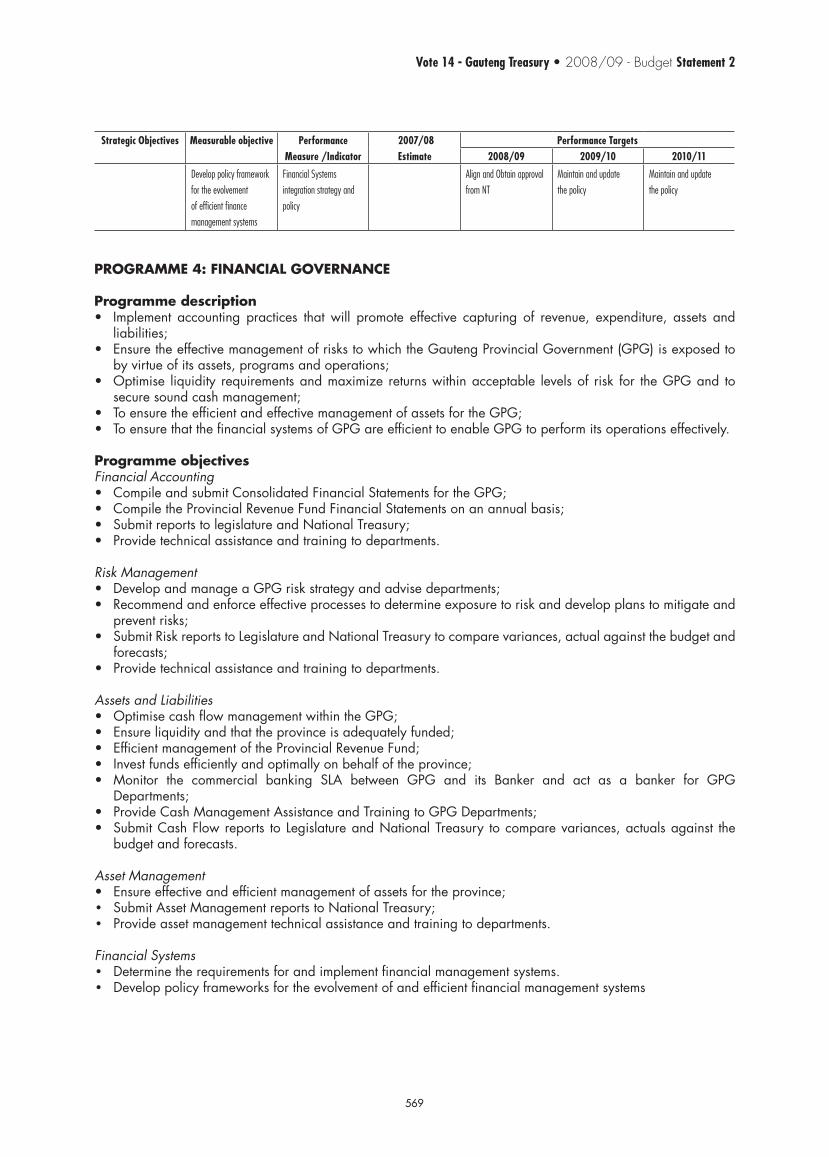
569
Vote 14 - Gauteng Treasury • 2008/09 - Budget Statement 2
Strategic Objectives Measurable objective Performance Measure /Indicator
2007/08Estimate
Performance Targets2008/09 2009/10 2010/11
Develop policy framework for the evolvement of efficient finance management systems
Financial Systems integration strategy and policy
Align and Obtain approval from NT
Maintain and update the policy
Maintain and update the policy
PROGRAMME 4: FINANCIAL GOVERNANCE
Programme description• Implement accounting practices thatwill promote effective capturing of revenue, expenditure, assets andliabilities;
• EnsuretheeffectivemanagementofriskstowhichtheGautengProvincialGovernment(GPG)isexposedtobyvirtueofitsassets,programsandoperations;
• Optimise liquidity requirementsandmaximize returnswithinacceptable levelsof risk for theGPGand tosecuresoundcashmanagement;
• ToensuretheefficientandeffectivemanagementofassetsfortheGPG;• ToensurethatthefinancialsystemsofGPGareefficienttoenableGPGtoperformitsoperationseffectively.
Programme objectivesFinancial Accounting• CompileandsubmitConsolidatedFinancialStatementsfortheGPG;• CompiletheProvincialRevenueFundFinancialStatementsonanannualbasis;• SubmitreportstolegislatureandNationalTreasury;• Providetechnicalassistanceandtrainingtodepartments.
RiskManagement• DevelopandmanageaGPGriskstrategyandadvisedepartments;• Recommendandenforceeffectiveprocessestodetermineexposuretoriskanddevelopplanstomitigateandpreventrisks;
• SubmitRiskreportstoLegislatureandNationalTreasurytocomparevariances,actualagainstthebudgetandforecasts;
• Providetechnicalassistanceandtrainingtodepartments.
Assets and Liabilities• OptimisecashflowmanagementwithintheGPG;• Ensureliquidityandthattheprovinceisadequatelyfunded;• EfficientmanagementoftheProvincialRevenueFund;• Investfundsefficientlyandoptimallyonbehalfoftheprovince;• Monitor the commercial banking SLA between GPG and its Banker and act as a banker for GPGDepartments;
• ProvideCashManagementAssistanceandTrainingtoGPGDepartments;• SubmitCashFlowreports toLegislatureandNationalTreasury tocomparevariances,actualsagainst the
budget and forecasts.
Asset Management• Ensureeffectiveandefficientmanagementofassetsfortheprovince;• SubmitAssetManagementreportstoNationalTreasury;• Provideassetmanagementtechnicalassistanceandtrainingtodepartments.
Financial Systems• Determinetherequirementsforandimplementfinancialmanagementsystems.• Developpolicyframeworksfortheevolvementofandefficientfinancialmanagementsystems

570
Budget Statement 2 - 2008/09 • Vote 14 - Gautneg Treasury
TABLE 11: SUMMARY OF PAYMENTS AND ESTIMATES: FINANCIAL GOVERNANCE
Outcome Main appropriation
Adjusted appropriation
Revised estimate
Medium-term estimates
R thousand 2004/05 2005/06 2006/07 2007/08 2008/09 2009/10 2010/11
1. Programme Support 7,534 5,083 3,119 3,119 2,597 1,865 1,977 2,0962. Assets Liabilities 945 1086 2,390 5,268 5,268 3,652 5,555 6,028 6,4693. Accounting Services 1,894 4805 2,349 7,845 1,152 5,138 7,131 7,519 7,8854. Risk Management 4,696 4,696 3,294 4,457 4,724 5,0085. Provincial internal Audit Total payments and estimates: Financial Governance 10,373 5,891 9,822 20,928 14,235 14,681 19,008 20,248 21,458
Actual expenditure and estimated budget for programme 4: Financial Governance between 2004/05 and2010/11arereproducedintable11anditcanbeseenthatinthisperiodunderreview,thattheallocationstotheprogrammerosebyR11million.Themostsignificantriseisinsub-programme3:AccountingServiceswhichincreasedbyR6million,followedbyAssetandLiabilitieswithanincreaseofR6million.Thisprogrammegrewby12.3percentbetween2004/05and2007/08andwillcontinuetogrowby13.5percentinthemediumterm.ItisimportanttonotethatRiskManagementwasestablishedin2007/08financialyear.
TABLE 12: SUMMARY OF ECONOMIC CLASSIFICATION: FINANCIAL GOVERNANCE
Outcome Main appropriation
Adjusted appropriation
Revised estimate
Medium-term estimates
R thousand 2004/05 2005/06 2006/07 2007/08 2008/09 2009/10 2010/11Current payments 9,083 4,796 7,559 20,473 13,780 14,297 19,008 20,248 21,458Compensation of employees 2,838 2,852 4,413 14,306 7,106 7,115 15,425 16,452 17,419Goods and services 6,245 1,944 3,146 6,167 6,674 7,182 3,583 3,796 4,039Interest and rent on land Financial transactions in assets and liabilities Transfers and subsidies 1 36 6Provinces and municipalities 1 36 6 Departmental agencies and accounts
Universities and technikons
Public corporations and private enterprises

571
Vote 14 - Gauteng Treasury • 2008/09 - Budget Statement 2
Outcome Main appropriation
Adjusted appropriation
Revised estimate
Medium-term estimates
R thousand 2004/05 2005/06 2006/07 2007/08 2008/09 2009/10 2010/11Foreign governments and international organizations
Non-profit institutions Households Payments for capital assets 1,289 1,059 2,257 455 455 384Buildings and other fixed structures Machinery and equipment 1,289 1,059 2,257 455 455 384 Cultivated assets Software and other intangible assets Land and subsoil assets Total economic classification: Financial Governance 10,373 5,891 9,822 20,928 14,235 14,681 19,008 20,248 21,458
Table12 represents actual expenditureandappropriationby economic classification. Theaverage shareofcompensationofemployeesstandsat58.9percentof theprogrammeexpenditure,withgoodsandservicestakingup32.9percentduringtheperiodunderscrutiny.
KEY OUTPUTS AND SERVICE DELIVERY MEASURES
Financial Governance
Accounting Services
Strategic Objectives Measurable objective Performance Measure /Indicator
2007/08Estimate
Performance Targets2008/09 2009/10 2010/11
Compile and submit consolidated financial statements for the GPG
Table consolidated financial statements at the legislature with 6 months of the year end
Timeous submission of consolidated statements
Oct 2006 Oct 2007 Oct 2008 Oct 2009
Submit consolidated financial statements to Auditors within 3 month of year end
Timeous submission of consolidated statements
June 2006 June 2007 June 2008 June 2009
Compile the provincial revenue fund financial statement on an annual basis
Unqualified audit opinion on the statements
Unqualified annual provincial revenue fund statements
100% un-qualified 100% un-qualified 100% un-qualified 100% un-qualified
Ensure effective and efficient management of assets for the province
Asset management strategy implemented
All assets are accurately valued
Approved asset acquisition and maintenance and disposal plan in place
100% Co-mpliance 100% Co-mpliance 100% Co-mpliance
Strengthen capacity and organisation of the state
Analysis of audit findings by the AG on department’s books
Queries cleared and not recurring in next financial year
All queries cleared within one week
All queries cleared within one week
All queries cleared within one week
All queries cleared within one week

572
Budget Statement 2 - 2008/09 • Vote 14 - Gautneg Treasury
Risk ManagementStrategic Objectives Measurable objective Performance
Measure /Indicator 2007/08Estimate
Performance Targets2008/09 2009/10 2010/11
Develop and manage a GPG risk strategy and advise departments
Develop and manage a GPG risk strategy and advise departments
GPG Risk Management Policy defined and implemented
Policy implemented by year end
Review all existing Risk Management Policies and Strategies in use in GPG departments and draft a Plan for the implementation and rollout of a provincial Risk Management Policy
Review completed, Draft Plan completed.
Recommend and enforce effective processes to determine exposure to risk and develop plans to mitigate and prevent risks
Facilitate the compilation of an Annual Risk Assessment Report for each GPG department, incl. recommendations and plans
13 Annual Reports within 2 months of Financial Year End
13 Annual Reports within 2 months of Financial Year End
13 Annual Reports within 2 months of Financial Year End
13 Annual Reports within 2 months of Financial Year End
Submit Risk reports to Legislature and National Treasury to compare variance Actual against Budget and Forecasts
Quarterly Risk Management Reports Produced
Quarterly Reports submitted Quarterly Reports submitted
Quarterly Reports submitted
Quarterly Reports submitted
Provide Technical Assistance and Training to the GPG departments
Number of training sessions, workshops and/or presentations conducted with departments
At least 1 per quarter At least 1 per quarter At least 1 per quarter At least 1 per quarter
Assets and LiabilitiesStrategic Objectives Measurable objective Performance
Measure /Indicator 2007/08Estimate
Performance Targets2008/09 2009/10 2010/11
Ensure effective and efficient management of assets for the province
Establishing Asset Management teams at all GPG departments
Number of team established
Progress report compiled Progress report compiled
Ad hoc Progress reports compiled
Ad hoc Progress report compiled
Submit Asset Management reports to National Treasury
Consolidated GPG assets report
Reports for NT Compiled Reports for NT Compiled
Reports for NT Compiled
Reports for NT Compiled
Provide Asses Management technical assistance and training to the GPG departments
Number of people trained and frequency of assistance rendered
Progress report compiled Progress report compiled
Ad hoc Progress reports compiled
Ad hoc Progress report compiled
Optimize cash flow management within GPG
Variance between funds requested, cash flow projection and actual expenditure not to exceed 5%
Consolidated Cash management reports
Max. 5%13 Depart.Complying
Max. 5%14 Depart.Complying
Max. 5%14 Depart.Complying
Max. 5%14 Depart.Complying
Ensure liquidity and that the province is adequately funded
Daily cash balance are maintained as planned not to exceed R200m
Consolidated Cash management reports
Max. R200m Max. R150m Max. R100m Max. R50m
Invest funds efficiently and optimally on behalf of the province
Maintain a properly diversified portfolio of investment ( not more than 30% of the portfolio to be held by any one bank
Investment Report Max. 30% per Fin. Institution Max. 30% per Fin. Institution
Max. 30% per Fin. Institution
Max. 30% per Fin. Institution
Interest revenue to meet al least budgeted amounts
Interest Received Meet Budget Meet Budget Meet Budget Meet Budget
Effective and efficient management of revenue fund and related bank accounts
Recommendations of internal audit implemented
100% implemented 100% implemented 100% implemented 100% implemented
Maintenance of accountants diary All tasks completed 100% completed 100% completed 100% completed 100% completed
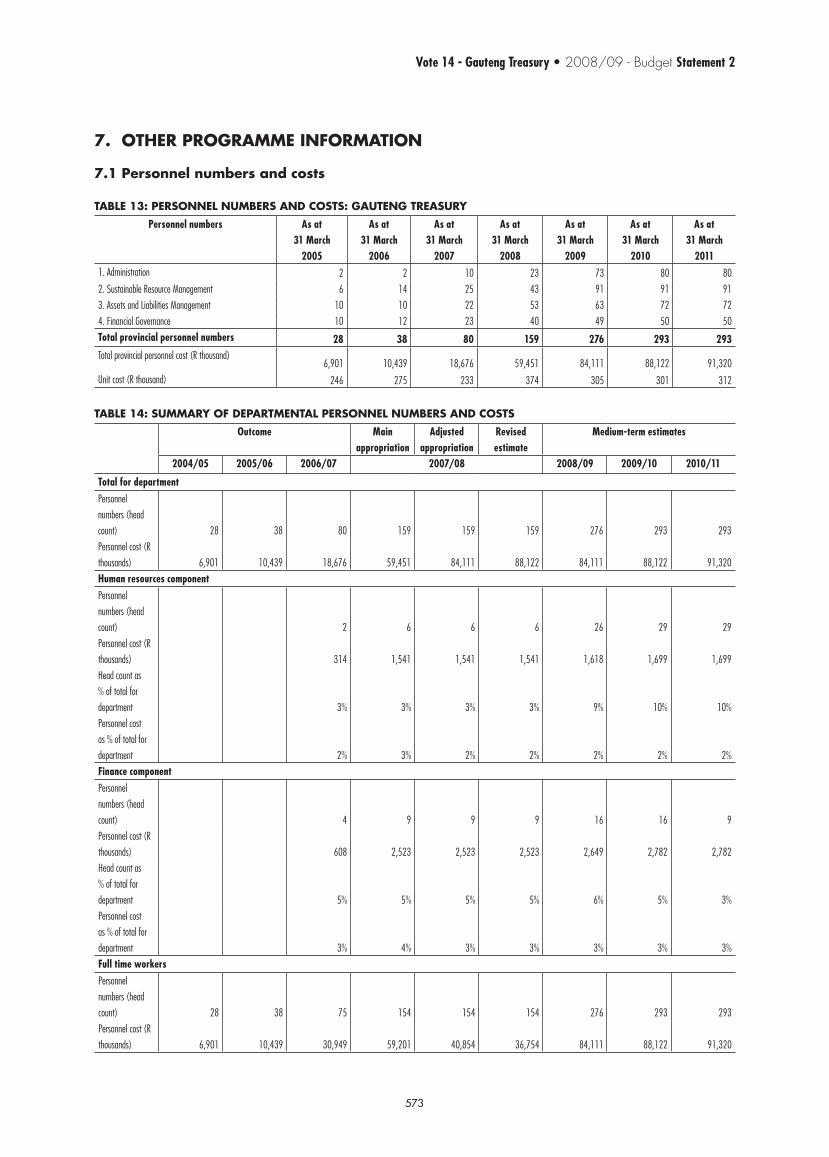
573
Vote 14 - Gauteng Treasury • 2008/09 - Budget Statement 2
7. OTHER PROGRAMME INFORMATION
7.1 Personnel numbers and costs
TABLE 13: PERSONNEL NUMBERS AND COSTS: GAUTENG TREASURY
Personnel numbers As at 31 March
2005
As at 31 March
2006
As at 31 March
2007
As at 31 March
2008
As at 31 March
2009
As at 31 March
2010
As at 31 March
20111. Administration 2 2 10 23 73 80 802. Sustainable Resource Management 6 14 25 43 91 91 913. Assets and Liabilities Management 10 10 22 53 63 72 724. Financial Governance 10 12 23 40 49 50 50Total provincial personnel numbers 28 38 80 159 276 293 293Total provincial personnel cost (R thousand)
6,901 10,439 18,676 59,451 84,111 88,122 91,320Unit cost (R thousand) 246 275 233 374 305 301 312
TABLE 14: SUMMARY OF DEPARTMENTAL PERSONNEL NUMBERS AND COSTS
Outcome Main appropriation
Adjusted appropriation
Revised estimate
Medium-term estimates
2004/05 2005/06 2006/07 2007/08 2008/09 2009/10 2010/11
Total for department Personnel numbers (head count) 28 38 80 159 159 159 276 293 293Personnel cost (R thousands) 6,901 10,439 18,676 59,451 84,111 88,122 84,111 88,122 91,320Human resources componentPersonnel numbers (head count) 2 6 6 6 26 29 29Personnel cost (R thousands) 314 1,541 1,541 1,541 1,618 1,699 1,699Head count as % of total for department 3% 3% 3% 3% 9% 10% 10%Personnel cost as % of total for department 2% 3% 2% 2% 2% 2% 2%Finance componentPersonnel numbers (head count) 4 9 9 9 16 16 9Personnel cost (R thousands) 608 2,523 2,523 2,523 2,649 2,782 2,782Head count as % of total for department 5% 5% 5% 5% 6% 5% 3%Personnel cost as % of total for department 3% 4% 3% 3% 3% 3% 3%Full time workers Personnel numbers (head count) 28 38 75 154 154 154 276 293 293Personnel cost (R thousands) 6,901 10,439 30,949 59,201 40,854 36,754 84,111 88,122 91,320

574
Budget Statement 2 - 2008/09 • Vote 14 - Gautneg Treasury
Outcome Main appropriation
Adjusted appropriation
Revised estimate
Medium-term estimates
2004/05 2005/06 2006/07 2007/08 2008/09 2009/10 2010/11
Head count as % of total for department 100% 100% 94% 97% 97% 97% 100% 100% 100%Personnel cost as % of total for department 100% 100% 166% 100% 99% 99% 100% 100% 100%Part-time workersPersonnel numbers (head count) Personnel cost (R thousands) Head count as % of total for departmentPersonnel cost as % of total for departmentContract workersPersonnel numbers (head count) 5 5 5Personnel cost (R thousands) 250 250 250Head count as % of total for department 3% 3% 3%Personnel cost as % of total for department
7.2 Training
TABLE 15: PAYMENTS ON TRAINING: GAUTENG TREASURY
Outcome Main appropriation
Adjusted appropriation
Revised estimate
Medium-term estimates
R thousand 2004/05 2005/06 2006/07 2007/08 2008/09 2009/10 2010/11
1. Administration 64 78 185 185 185 230 241 241Subsistence and travel 64 78 185 185 185 230 241 241Payments on tuition 2. Sustainable Resource Management 200 89 93 308 308 308 326 433 433Subsistence and travel 200 89 93 308 308 308 326 433 433Payments on tuition 3. Financial Management Reforms 287 301 188 188 188 198 208 208Subsistence and travel 287 301 188 188 188 198 208 208

575
Vote 14 - Gauteng Treasury • 2008/09 - Budget Statement 2
Outcome Main appropriation
Adjusted appropriation
Revised estimate
Medium-term estimates
R thousand 2004/05 2005/06 2006/07 2007/08 2008/09 2009/10 2010/11
Payments on tuition 4. Financial Governance 23 81 102 135 135 135 141 148 148Subsistence and travel 23 81 102 135 135 135 141 148 148Payments on tuition Total payments on training: Gauteng Treasury 223 521 574 816 816 816 895 1,030 1,030
TABLE 16: INFORMATION ON TRAINING: GAUTENG TREASURY
Outcome Main appropriation
Adjusted appropriation
Revised estimate
Medium-term estimates
R thousand 2004/05 2005/06 2006/07 2007/08 2008/09 2009/10 2010/11
Number of staff 28 38 80 184 184 184 276 293 293Number of personnel trained 49 109 109 109 154 164 179of which Male 25 49 49 49 69 73 80Female 24 60 60 60 85 91 99Number of training opportunities 24 34 34 34 38 43 48of which Tertiary
Workshops 5 5 5 6 7 8Seminars 5 5 5 6 7 8Other 24 24 24 24 26 29 32Number of bursaries offered 23 28 28 28 31 34 37Number of interns appointed 5 15 18 18 22 25 29Number of learnerships appointed 5 6Number of days spent on training 103 103 103 114 144 159

576
Budget Statement 2 - 2008/09 • Vote 14 - Gautneg Treasury
8. CROSS CUTTING ISSUES
Outcome Output Gender Issue Programme Sub-Programme
Indicator/Output
Performance Targets2008/09 2009/10 2010/11
Ensure fully integrated financial and procurement management system
Economic empowerment –improved facilitation of business engagement, effective procurement of quality goods and services
Most of the goods and service providers for the department are male dominated. Encourage and support the participation of women as service providers to the department through processes put in place in accordance with the Preferred Procurement Policy Framework Act
Internal Finance. Supply Chain Management.
Percentage of goods and services procured from entities managed and controlled by women.
1,500 2,000 2,500
Appropriately skilled, empowered and competent members of staff in Gauteng Treasury.
Workplace Skills Plan.Training and development interventions.
Equitable distribution of training and development opportunities to all employees in the Department (including females).
Corporate Services HRM and Aux. Serv. Plan in place (focusing on gender). Training reports according to gender.
R1,323 R1,455 R1,600
Internal and External bursaries.
Targeting all employees (focus on female employees).
Corporate Services HRM and Aux. Serv. Distribution of bursaries granted (female employees = 55% of staff complement)
810 891 980
Internship programme.
Programme that specifically targets women and disabled.
Corporate Services HRM and Aux. Serv. 55% women employed as interns.
567 623 686
Recruitment strategy. Implementation of a recruitment strategy.
Corporate Services. HRM and Aux. Serv. Recruitment of female employees in line with set EE targets.
1,000 1,100 1,210
Employment Equity. Achieving representivity targets as set by EE plan
Corporate Services. HRM and Aux. Serv. Attainment of targets as per EE plan.
16 18 19
Retention strategy. Implementation of retention strategy (including female employees).
Corporate Services. HRM and Aux. Serv. Retention of employees (special reference to female employees)
2 3 3

577
Vote 14 - Gauteng Treasury • 2008/09 - Budget Statement 2
Outcome Output Gender Issue Programme Sub-Programme
Indicator/Output
Performance Targets2008/09 2009/10 2010/11
Gender sensitive and supportive working environment.
Wellness programme.
Awareness programme on gender- and related issues.Implementation and management of:• Sexual Harassment Policy.• HIV/AIDS Policy.• Violence against women programme.• Commemorative days (e.g. women’s day).
Corporate Services. HRM and Aux. Serv. Policies and programmes in place.
170 187 205
Wellness Programme.
Researching the possibility of establishing child care programme.
Corporate Services. HRM and Aux. Serv Research and findings/ implementation of child care programme.
40 50 60
9. RECONCILIATION OF STRUCTURAL CHANGES
TABLE 17: RECONCILIATION OF STRUCTURAL CHANGES: GAUTENG TREASURY
Programmes for 2007/08 Programmes for 2008/09 2008/09Equivalent Programme Sub programme Programme Sub programme
Administration 1 Management Services Administration 1 Management Services Corporate Services Corporate Services Office Of the CFO Office Of the CFO Public Private Partnership Sustainable Resource Management 2 Programme Support Sustainable Resource Management 2 Programme Support
Budget Management Budget Management Fiscal Policy and Economic Analysis Fiscal Policy and Economic Analysis
Public Finance Public FinancePublic Private PartnershipGauteng fund

578
Budget Statement 2 - 2008/09 • Vote 14 - Gautneg Treasury

579
Vote 14 - Gauteng Treasury • 2008/09 - Budget Statement 2
Annexure to Budget Statement 2

580
Budget Statement 2 - 2008/09 • Vote 14 - Gautneg Treasury
TABLE 18: SPECIFICATION OF RECEIPTS: GAUTENG TREASURY
Outcome Main appropriation
Adjusted appropriation
Revised estimate
Medium-term estimates
R thousand 2004/05 2005/06 2006/07 2007/08 2008/09 2009/10 2010/11Tax receipts
Casino taxes
Horse racing taxes
Liquor licences
Motor vehicle licences Sales of goods and services other than capital assets 10 10Sale of goods and services produced by department (excluding capital assets) 10 10Sales by market establishments Administrative fees Other sales 10 10 Of which Health patient fees Other (Specify) Sales of scrap, waste, arms and other used current goods (excluding capital assets) Transfers received from:Other governmental units Universities and technikons Foreign governments International organizations Public corporations and private enterprises Households and non-profit institutions Fines, penalties and forfeits Interest, dividends and rent on land 176,063 223,189 227,689 152,184 220,000 259,977 236,500 254,240 273,308Interest 176,063 223,189 227,689 152,184 220,000 259,977 236,500 254,240 273,308
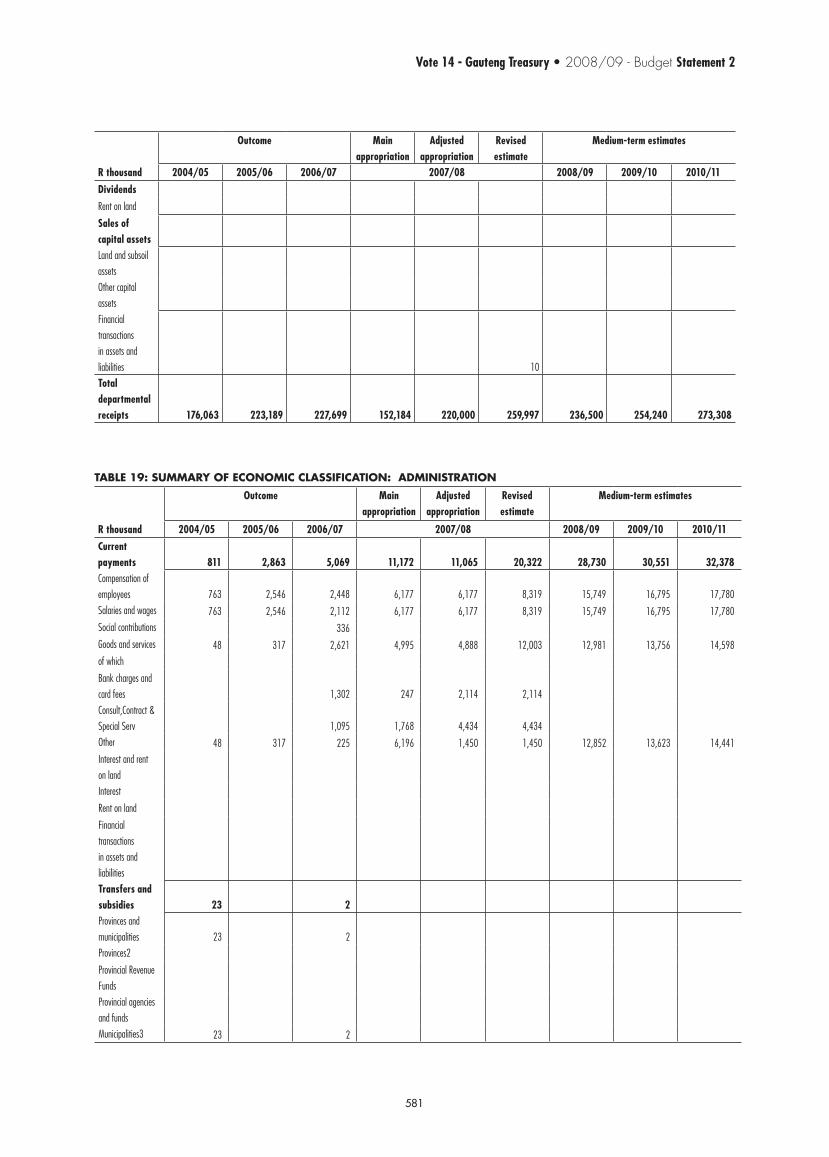
581
Vote 14 - Gauteng Treasury • 2008/09 - Budget Statement 2
Outcome Main appropriation
Adjusted appropriation
Revised estimate
Medium-term estimates
R thousand 2004/05 2005/06 2006/07 2007/08 2008/09 2009/10 2010/11Dividends
Rent on land Sales of capital assetsLand and subsoil assets Other capital assets Financial transactions in assets and liabilities 10 Total departmental receipts 176,063 223,189 227,699 152,184 220,000 259,997 236,500 254,240 273,308
TABLE 19: SUMMARY OF ECONOMIC CLASSIFICATION: ADMINISTRATION
Outcome Main appropriation
Adjusted appropriation
Revised estimate
Medium-term estimates
R thousand 2004/05 2005/06 2006/07 2007/08 2008/09 2009/10 2010/11Current payments 811 2,863 5,069 11,172 11,065 20,322 28,730 30,551 32,378Compensation of employees 763 2,546 2,448 6,177 6,177 8,319 15,749 16,795 17,780Salaries and wages 763 2,546 2,112 6,177 6,177 8,319 15,749 16,795 17,780Social contributions 336 Goods and services 48 317 2,621 4,995 4,888 12,003 12,981 13,756 14,598of which Bank charges and card fees 1,302 247 2,114 2,114 Consult,Contract & Special Serv 1,095 1,768 4,434 4,434 Other 48 317 225 6,196 1,450 1,450 12,852 13,623 14,441Interest and rent on land Interest Rent on land Financial transactions in assets and liabilities Transfers and subsidies 23 2Provinces and municipalities 23 2Provinces2
Provincial Revenue Funds Provincial agencies and funds Municipalities3 23 2

582
Budget Statement 2 - 2008/09 • Vote 14 - Gautneg Treasury
Outcome Main appropriation
Adjusted appropriation
Revised estimate
Medium-term estimates
R thousand 2004/05 2005/06 2006/07 2007/08 2008/09 2009/10 2010/11
Municipalities 23 2 of which: Regional service council levies Municipal agencies and funds Departmental agencies and accountsSocial security funds Universities and technikons Public corporations and private enterprises5Public corporations
Private enterprises
Foreign governments and international organizationsNon-profit institutionsHouseholds
Social benefits Other transfers to households Payments for capital assets 21 62 442 1,027 260 3,578 3,793 4,020Buildings and other fixed structuresBuildings Other fixed structures Machinery and equipment 21 62 442 1,027 260 3,578 3,793 4,020Transport equipment Other machinery and equipment 21 62 442 1,027 260 3,578 3,793 4,020Cultivated assets Software and other intangible assets Land and subsoil assets Total economic classification: Administration 834 2,884 5,133 11,614 12,092 20,582 32,308 34,344 36,398

583
Vote 14 - Gauteng Treasury • 2008/09 - Budget Statement 2
TABLE 20: SUMMARY OF ECONOMIC CLASSIFICATION: SUSTAINABLE RESOURCE MANAGEMENT
Outcome Main appropriation
Adjusted appropriation
Revised estimate
Medium-term estimates
R thousand 2004/05 2005/06 2006/07 2007/08 2008/09 2009/10 2010/11Current payments 4,985 6,074 14,605 39,023 32,833 23,606 42,760 44,140 44,871Compensation of employees 2,679 2,912 7,146 27,320 19,673 13,895 32,519 33,287 33,352Salaries and wages 2,679 2,912 6,478 27,320 19,673 13,895 32,519 33,287 33,352Social contributions 668 Goods and services 2,306 3,162 7,459 11,703 13,160 9,711 10,241 10,853 11,519of which Consult,Contract & Special Serv 2,897 2,978 2,899 2,899 Inventory 1,439 1,577 1,498 1,498 Other 2,306 3,162 3,123 7,534 5,653 5,653 10,112 10,719 11,362Interest and rent on land Interest Rent on land Financial transactions in assets and liabilities Transfers and subsidies 40,000 60,000 80,000 80,000Provinces and municipalities Provinces2
Provincial Revenue FundsProvincial agencies and fundsMunicipalities3
Municipalities
Municipal agencies and funds Departmental agencies and accounts 40,000 60,000 80,000 80,000Social security funds 40,000 60,000 80,000 80,000Provide list of entities receiving transfers4 Universities and technikons Public corporations and private enterprises5Public corporations
Private enterprises

584
Budget Statement 2 - 2008/09 • Vote 14 - Gautneg Treasury
Outcome Main appropriation
Adjusted appropriation
Revised estimate
Medium-term estimates
R thousand 2004/05 2005/06 2006/07 2007/08 2008/09 2009/10 2010/11
Foreign governments and international organizationsNon-profit institutionsHouseholds
Social benefits Other transfers to households Payments for capital assets 127 638 718 1,123 286Buildings and other fixed structuresBuildings Other fixed structures Machinery and equipment 127 638 718 1,123 286Transport equipment Other machinery and equipment 127 638 718 1,123 286 Cultivated assets Software and other intangible assets Land and subsoil assets Total economic classification: Sustainable Resource Management 4,985 6,201 15,247 39,741 73,956 23,892 102,760 124,140 124,871
TABLE 21: SUMMARY OF ECONOMIC CLASSIFICATION: FINANCIAL MANAGEMENT REFORMS
Outcome Main appropriation
Adjusted appropriation
Revised estimate
Medium-term estimates
R thousand 2004/05 2005/06 2006/07 2007/08 2008/09 2009/10 2010/11Current payments 621 3,524 11,111 31,469 17,236 20,045 31,473 33,306 35,190Compensation of employees 621 2,129 4,669 11,648 8,148 7,675 20,418 21,588 22,769Salaries and wages 621 2,129 4,195 11,648 8,148 7,675 20,418 21,588 22,769Social contributions 474 Goods and services 1,395 6,442 19,821 9,088 12,370 11,055 11,718 12,421of which Consultants,Contract & Special Serv 3,876 14,848 7,643 7,643 Travel and Subsistence 1,206 1,445 1,445 1,445 Other 1,395 1,360 3,528 11,055 11,718 12,421

585
Vote 14 - Gauteng Treasury • 2008/09 - Budget Statement 2
Outcome Main appropriation
Adjusted appropriation
Revised estimate
Medium-term estimates
R thousand 2004/05 2005/06 2006/07 2007/08 2008/09 2009/10 2010/11
Interest and rent on land Interest Rent on land Transfers and subsidies 38 1,500Provinces and municipalities 2 1,500Provinces2
Provincial Revenue Funds Provincial agencies and funds Municipalities3 2 1,500Municipalities 2 1,500 of which: Regional service council levies Municipal agencies and funds Departmental agencies and accountsSocial security fundsProvide list of entities receiving transfers4Universities and technikonsPublic corporations and private enterprises5Public corporations
Private enterprises
Foreign governments and international organizations Non-profit institutions Households 36Social benefits 36 Other transfers to households Payments for capital assets 10 794 540 540 159Buildings and other fixed structures 540 540 159Buildings Other fixed structures 540 540 159Machinery and equipment 10 794Transport equipment
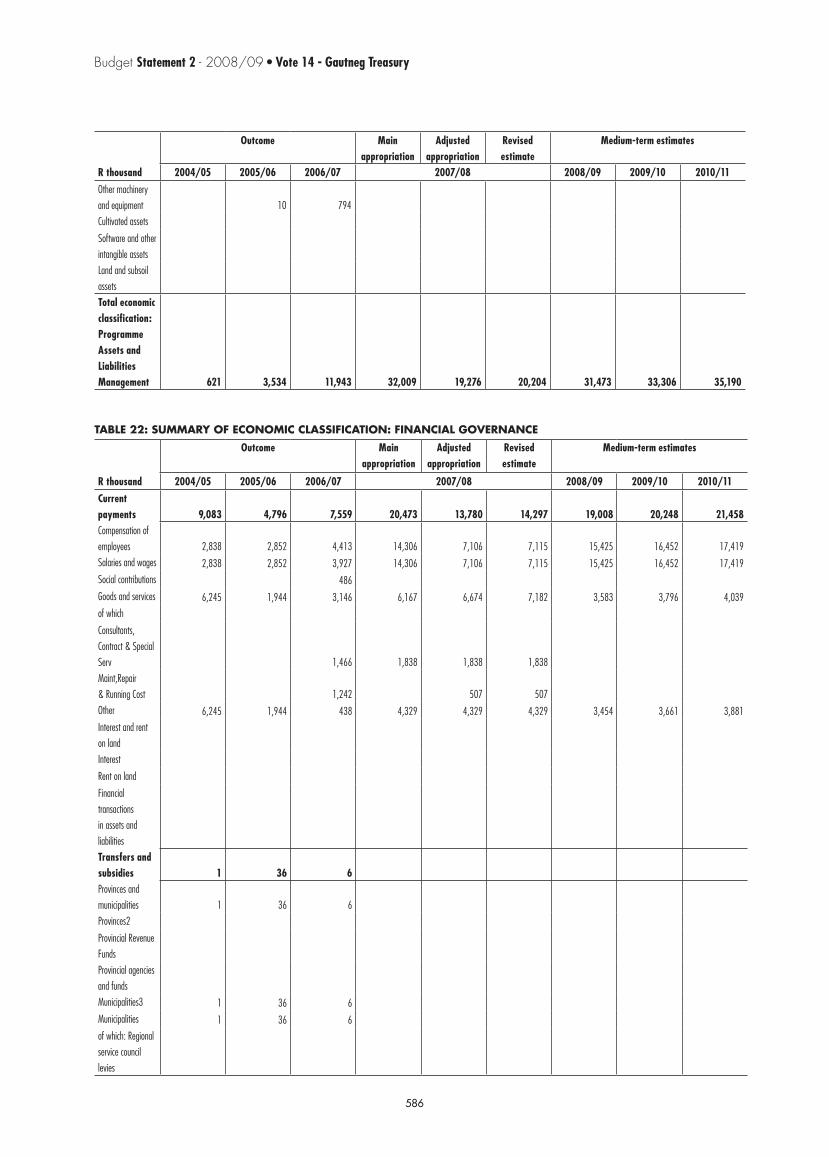
586
Budget Statement 2 - 2008/09 • Vote 14 - Gautneg Treasury
Outcome Main appropriation
Adjusted appropriation
Revised estimate
Medium-term estimates
R thousand 2004/05 2005/06 2006/07 2007/08 2008/09 2009/10 2010/11
Other machinery and equipment 10 794 Cultivated assets Software and other intangible assets Land and subsoil assets Total economic classification: Programme Assets and Liabilities Management 621 3,534 11,943 32,009 19,276 20,204 31,473 33,306 35,190
TABLE 22: SUMMARY OF ECONOMIC CLASSIFICATION: FINANCIAL GOVERNANCE
Outcome Main appropriation
Adjusted appropriation
Revised estimate
Medium-term estimates
R thousand 2004/05 2005/06 2006/07 2007/08 2008/09 2009/10 2010/11Current payments 9,083 4,796 7,559 20,473 13,780 14,297 19,008 20,248 21,458Compensation of employees 2,838 2,852 4,413 14,306 7,106 7,115 15,425 16,452 17,419Salaries and wages 2,838 2,852 3,927 14,306 7,106 7,115 15,425 16,452 17,419Social contributions 486 Goods and services 6,245 1,944 3,146 6,167 6,674 7,182 3,583 3,796 4,039of which Consultants,Contract & Special Serv 1,466 1,838 1,838 1,838 Maint,Repair & Running Cost 1,242 507 507 Other 6,245 1,944 438 4,329 4,329 4,329 3,454 3,661 3,881Interest and rent on land Interest Rent on land Financial transactions in assets and liabilities Transfers and subsidies 1 36 6Provinces and municipalities 1 36 6Provinces2
Provincial Revenue Funds Provincial agencies and funds Municipalities3 1 36 6Municipalities 1 36 6 of which: Regional service council levies
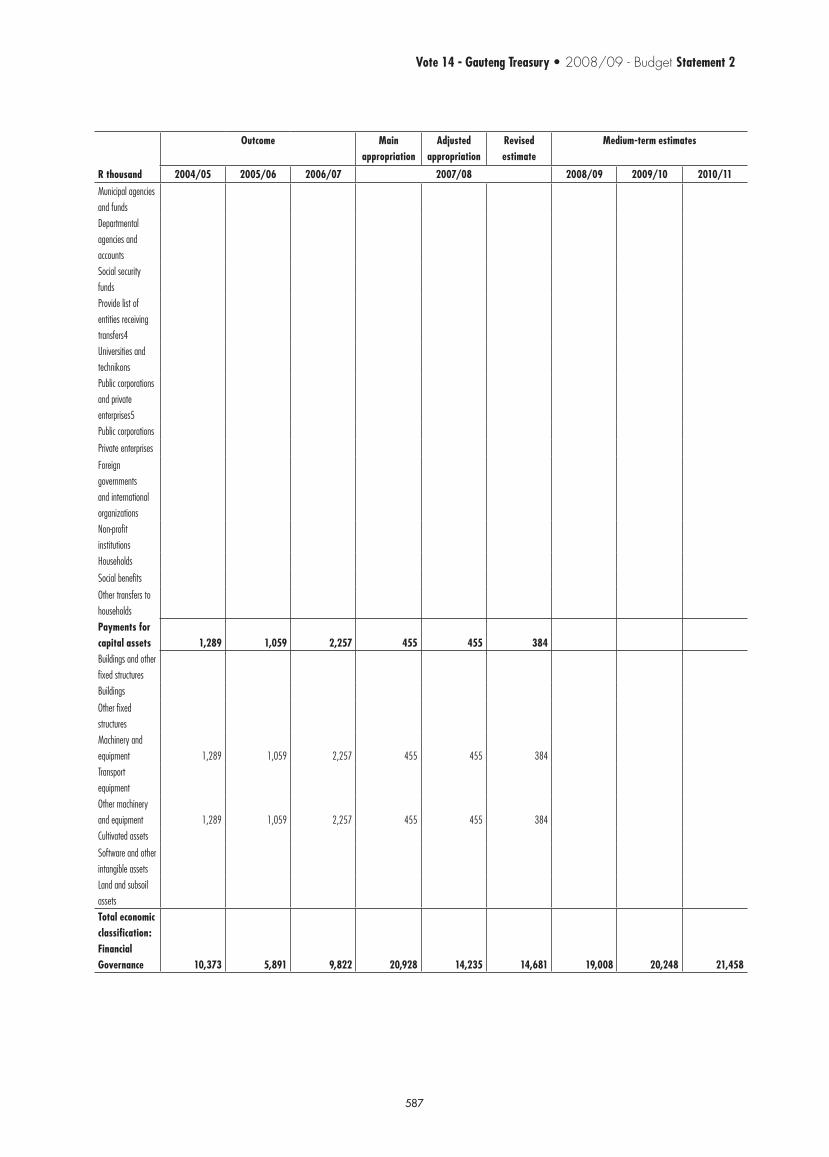
587
Vote 14 - Gauteng Treasury • 2008/09 - Budget Statement 2
Outcome Main appropriation
Adjusted appropriation
Revised estimate
Medium-term estimates
R thousand 2004/05 2005/06 2006/07 2007/08 2008/09 2009/10 2010/11
Municipal agencies and funds
Departmental agencies and accountsSocial security fundsProvide list of entities receiving transfers4Universities and technikonsPublic corporations and private enterprises5Public corporations
Private enterprises
Foreign governments and international organizations Non-profit institutions Households
Social benefits Other transfers to households Payments for capital assets 1,289 1,059 2,257 455 455 384Buildings and other fixed structuresBuildings Other fixed structures Machinery and equipment 1,289 1,059 2,257 455 455 384Transport equipment Other machinery and equipment 1,289 1,059 2,257 455 455 384 Cultivated assets Software and other intangible assets Land and subsoil assets Total economic classification: Financial Governance 10,373 5,891 9,822 20,928 14,235 14,681 19,008 20,248 21,458

588
Budget Statement 2 - 2008/09 • Vote 14 - Gautneg Treasury
Related Documents


![Draft dated 6-20-2008 DEPARTMENT OF THE TREASURY …1 Draft dated 6-20-2008 DEPARTMENT OF THE TREASURY Office of the Comptroller of the Currency 12 CFR Part 3 [Docket No. 08-xxxx]](https://static.cupdf.com/doc/110x72/5e7dba25ea0ddb760f05ca91/draft-dated-6-20-2008-department-of-the-treasury-1-draft-dated-6-20-2008-department.jpg)