Journal of Sol-Gel Science and Technology 14, 291–308 (1999) c 1999 Kluwer Academic Publishers. Manufactured in The Netherlands. Gasochromic Behavior of Sol-Gel Derived Pd Doped Peroxopolytungstic Acid (W-PTA) Nano-Composite Films B. OREL, U. OPARA KRA ˇ SOVEC AND N. GRO ˇ SELJ National Institute of Chemistry, Hajdrihova 19, SI-1001 Ljubljana, Slovenia M. KOSEC AND G. DRA ˇ ZI ˇ C J. Stefan Institute, SI-1000 Ljubljana, Slovenia R. REISFELD Department of Inorganic Chemistry, Hebrew University of Jerusalem, Jerusalem, Israel Received February 18, 1998; Accepted July 22, 1998 Abstract. The behavior of sol-gel prepared thin films exhibiting a gasochromic effect; i.e., a reversibly change in colour from transparent when in air to blue when in H 2 , has been studied. The films were prepared from a Pd (PdCl 2 ) doped peroxopolytungstic acid sol using a dip-coating technique. Transmission electron microscopy together with selected area electron diffractrometry revealed that the films consist of monoclinic and hexagonal nanocrystalline grains (∼2–5 nm) embedded in an amorphous phase. This amorphous hydrated phase was established using Infrared (IR) and Raman spectroscopy. Characteristic vibrations observed in the in-situ IR spectra of the coloured and bleached states revealed the presence and the importance of terminal W O and W OH 2 groups in the colouring of the films. Colouring/bleaching changes of Pd doped W-PTA films observed using in-situ UV-Vis spectroscopy are described in terms of Pd concentration, and the number of reducing/oxidising cycles. The rate of colouring/bleaching is greater for films containing a higher concentration of Pd but the change in the optical density does not increase, i.e., shows saturation. Keywords: gasochromism, sol-gel prepared W-PTA, Pd doped W-PTA, polaron modes, in-situ infrared and in-situ UV-Vis spectra, Raman spectra Introduction WO 3 is a typical intercalation compound with chromo- genic properties [1] extensively studied because of its application in electrochromic devices [2]. The inter- calation properties of WO 3 are well documented and understood [3] and derive from its regular array of nanodimensional pores, into which various ionic species, with the appropriate dimension and function- ality, e.g., H + , Li + , Na + , and K + , can reversibly pene- trate. Long range diffusion within the open pores of the WO 3 network is possible without the need for excessively high activation energies ( E a = 0.35 eV) and chemical diffusion constants, which for protons are in the order of 10 -7 to 10 -11 cm 2 /s [4]. The network is relatively condensed consisting of edge- and corner- sharing WO 6 octahedra that causes the WO 3 to have sufficiently electronic conductivity (10 -6 –10 -1 S/cm) [1]. The optical modulation of WO 3 films is directly re- lated to the double insertion/extraction of electrons and ions according to the following reaction: x M + + x e - + WO 3 ↔ M x WO 3

Welcome message from author
This document is posted to help you gain knowledge. Please leave a comment to let me know what you think about it! Share it to your friends and learn new things together.
Transcript

Journal of Sol-Gel Science and Technology 14, 291–308 (1999)c© 1999 Kluwer Academic Publishers. Manufactured in The Netherlands.
Gasochromic Behavior of Sol-Gel Derived Pd Doped PeroxopolytungsticAcid (W-PTA) Nano-Composite Films
B. OREL, U. OPARA KRASOVEC AND N. GROSELJNational Institute of Chemistry, Hajdrihova 19, SI-1001 Ljubljana, Slovenia
M. KOSEC AND G. DRAZICJ. Stefan Institute, SI-1000 Ljubljana, Slovenia
R. REISFELDDepartment of Inorganic Chemistry, Hebrew University of Jerusalem, Jerusalem, Israel
Received February 18, 1998; Accepted July 22, 1998
Abstract. The behavior of sol-gel prepared thin films exhibiting a gasochromic effect; i.e., a reversibly change incolour from transparent when in air to blue when in H2, has been studied. The films were prepared from a Pd (PdCl2)doped peroxopolytungstic acid sol using a dip-coating technique. Transmission electron microscopy together withselected area electron diffractrometry revealed that the films consist of monoclinic and hexagonal nanocrystallinegrains (∼2–5 nm) embedded in an amorphous phase. This amorphous hydrated phase was established using Infrared(IR) and Raman spectroscopy. Characteristic vibrations observed in the in-situ IR spectra of the coloured andbleached states revealed the presence and the importance of terminal WO and W OH2 groups in the colouring ofthe films. Colouring/bleaching changes of Pd doped W-PTA films observed using in-situ UV-Vis spectroscopy aredescribed in terms of Pd concentration, and the number of reducing/oxidising cycles. The rate of colouring/bleachingis greater for films containing a higher concentration of Pd but the change in the optical density does not increase,i.e., shows saturation.
Keywords: gasochromism, sol-gel prepared W-PTA, Pd doped W-PTA, polaron modes, in-situ infrared andin-situ UV-Vis spectra, Raman spectra
Introduction
WO3 is a typical intercalation compound with chromo-genic properties [1] extensively studied because of itsapplication in electrochromic devices [2]. The inter-calation properties of WO3 are well documented andunderstood [3] and derive from its regular array ofnanodimensional pores, into which various ionicspecies, with the appropriate dimension and function-ality, e.g., H+, Li+, Na+, and K+, can reversibly pene-trate. Long range diffusion within the open pores ofthe WO3 network is possible without the need for
excessively high activation energies (Ea= 0.35 eV)and chemical diffusion constants, which for protons arein the order of 10−7 to 10−11 cm2/s [4]. The networkis relatively condensed consisting of edge- and corner-sharing WO6 octahedra that causes the WO3 to havesufficiently electronic conductivity (10−6–10−1 S/cm)[1].
The optical modulation of WO3 films is directly re-lated to the double insertion/extraction of electrons andions according to the following reaction:
xM+ + xe− +WO3↔MxWO3

292 Orel et al.
where M+ =H+, Li+, etc. This process increases thenumber of W5+ sites and hence the films becomecoloured. According to Schirmer [5] the observedcolouration is a consequence of polaron transitions be-tween two non-equivalent sites: W5+ and W6+, i.e.,
hº +W5+(A)+W6+(B)↔W5+(B)+W6+(A)
The inserted electrons are localized on W5+ sites andpolarize the neighboring lattice sites to form small po-larons. Incident photons then become absorbed by the“hopping” of polarons from one lattice site to an ad-jacent site; since this absorption is in near IR spectralrange the characteristic blue colour of the film develops.The optical absorption is connected with the polarontransfer and to the change in the phonon modes, whichfor WO3 appear in the spectral range<900 cm−1.
The formation of a blue tungsten bronze MxWO3 oc-curs whenever WO3 is exposed to reducing conditions,for example, atomic hydrogen [6, 7] (viz. Zn/HCl,SnCl2, etc.) or when WO3, in contact with Pt or Pd, isexposed to H2 gas [8]. Benson et al. [9] proposed thatH2 is initially dissociatively chemi-sorbed on Pt andthen migrates across the metal-oxide interface to formbronze. The colouration is enhanced by the presenceof water [10], indicating the importance of the protonconductivity [11] to compensate the redox processes inWO3 films.
Pd : WO3 films show a gasochromic effect by turn-ing a blue colour in the presence of H2 [12]. This wasinitially exploited for hydrogen detection [13, 14] butmore recently for switchable (“smart”) window appli-cations [15, 16]. The gasochromic switching deviceis claimed to be simple and inexpensive because onlya single WO3 sputtered layer [15] covered with a fewnanometer thick layer of Pt metal is sufficient to obtain agasochromic effect. The bleached state is then achievedby flushing the device with air. The long term cyclingstability of a gasochromic device is difficult to attainunless there is strict control over the following the H2
gas humidity, the presence of gases which can poisonthe catalyst (e.g., CO, NO2) and the concentration ofH2 [16].
In this paper the gasochromic properties of Pddoped peroxopolytungstic acid (W-PTA) films pre-pared by sol-gel processing are presented. Sol-gelprocessing offers many advantages over traditionalvacuum deposition techniques; one advantage is highhomogeneity of the films, since the starting materialsare mixed on the molecular level [17]; low processing
temperatures can be used, which is important for mak-ing organic/inorganic hybrids [18–20], or when filmswith a high degree of hydration are desired as in thecase of gasochromic WO3 [9].
Among the four commonly used sol-gel routes formaking WO3 films [21] the peroxo route developed inthe late 80s by Kudo was chosen [22, 23]. The filmsare easily made by dipping an appropriate support ineither aqueous or alcohol based W-PTA sols [24]; thestability of the sols is high because of the chelatingproperties of the peroxo species (O2)
−2, which hinderthe precipitation of colloidal species [21].
W-PTA is important for electrochromic applica-tions and films with an excellent electrochromicresponse have been prepared by heat-treatment at150◦C [25–27]. At higher temperatures crystallineWO3 films were obtained [21, 25, 28]. Also W-PTAfilms heat-treated at 80–130◦C or cured under UV-radiation have a relatively high refractive index (∼2.0)making them promising photoresistant materials[29, 30].
The structure of W-PTA was determined by Nanbaet al. [27] using XRD and radial distribution func-tion analysis (RDF). RDF analysis revealed that W-PTA consists of a polyanion W12O38(O2)
16−6 in which
a 6-membered ring of corner-shared polyhedra such asWO5(O2) or WO6 is sandwiched between two W3O10
units consisting of edge-shared WO6.IR and Raman spectroscopy confirmed the presence
of peroxo W O O W and———–—
W O O—
groups and theirdisappearance during heat-treatment at 100◦C. Heat-treatment leads to the formation of WO3·2H2O [21,28] with a layered structure: layers of corner shar-ing WO6·2H2O octahedra held together by hydrogenbonding. More recently Hibino et al. [11], studyingthe protonic conductivity of heat-treated W-PTA byIR and Raman spectroscopy, propose that polymerization at 100◦C forms tungsten oxide clusters, similarin structure to the hexagonal form of tungsten oxide[31].
The presence of 5 nm clusters with an unknownstructure in W-PTA films with and without oxalic acidwere observed by Denesuk et al. [26] using transmis-sion electron microscopy (TEM). Although the clusterswere well resolved, it was not possible to elucidate theircrystalline structure using electron diffraction, sinceonly a single diffuse halo was detected.
In the first part of the paper the structural features ofW-PTA and Pd : W-PTA films based on data obtainedfrom TEM microscopy combined with Selected Area

Gasochromic Behavior 293
Electron Diffraction (SAED) are reported. Infraredand Raman data are included to confirm the struc-tural properties of films by identifying the vibrationalmodes which characterize the nanocrystalline structureof the deposited films. In-situ IR transmission spectraof Pd : W-PTA films are shown and the role that the po-laron modes together with phonons have in the coloura-tion of the films, when exposed to H2, is discussed. Thefinal part the report uses data obtained from in-situUV-Vis spectroscopy to show how colouring/bleachingchanges depend on the Pd concentration and the con-centration of H2 in an H2/Ar gas mixture and how theseparameters influence the colouring bleaching kineticsof the films.
Experimental
Preparation of Sols and Films
W-PTA sols were prepared according to the method ofKudo et al. [22, 23]. 18 ml of H2O2 (30%) were re-acted with small pieces of metallic powder (5 g, Fluka,99%). The mixture was stirred for 12 hours at roomtemperature until all the tungsten had dissolved. A Ptnet was then added to the mixture to remove any un-reacted H2O2. After the addition of EtOH (20 g), thesolution was heated at 80◦C for 4 hours until the colourof the sol turned from milky to a clear orange colour. Pdwas added in the form of PdCl2 (Merck) in a concentra-tion necessary to produce Pd/W molar ratios of 1 : 125,1 : 76, 1 : 53 and 1 : 40. The sols with a deep brown-colour were stored at−25◦C to prevent gellation priorto dipping. This gellation process can be reversed byadding small amount of H2O2 until the dark brown solis reformed.
All Pd : WO3 films were deposited using the dip-coating process from either freshly prepared sols orfrom sols that have retained their original deep browncolour. The yield of deposition is dependent on theviscosity, and on the amount of EtOH added and isapproximately 600 nm/dipping. Multiple layers werenot prepared because of the tendency of the xerogel filmto partially dissolve after being successively dippedinto the colloidal solution.
Instrumental and Measuring Techniques
For IR analysis the films were deposited on Siwafers. Infrared spectra were obtained using a FT-IR
Perkin Elmer 2000 system spectrometer (spectralrange 7000–400 cm−1). The instrument was fitted witha home-made air-tight compartment, which allows thedetection of in-situ spectra of films in the transmissionmode in the coloured and bleached states. In the case ofUV-Vis films deposited on bare glass slides were used.UV-Vis spectra (300–1200 nm) were obtained using aHewlett-Packard diode-array spectrometer.
Films were repeatedly cycled in in-situ UV-Vis cellby flushing with H2 and/or H2/Ar (4%) gas mixture.After each reduction the films were bleached by expos-ing the films to humid air. The humidity of the flushinggases was kept constant by passing the gases througha water trap. For in-situ IR measurements films werefirst reduced/oxidized in the UV-Vis cell and afterwardstransferred to the in-situ IR cell.
For transmission electron microscopy thin filmswere deposited on a Cu grid using the dip coating tech-nique. Samples were examined using a Jeol 2000 FXtransmission electron microscope (TEM) operated at200 kV. The chemical composition of the films wasdetermined using a Link AN-10000 EDXS system(Energy Dispersive X-ray Spectroscopy) with an UltraThin Window Si(Li) detector, connected to the TEM.
Results and Discussion
TEM Measurements
Figure 1 shows a central dark field (CDF) in the TEMmicrograph of the W-TPA film which together withthe SAED pattern indicate the diffraction spots usedfor CDF imaging. Up to 2 nm large clusters of WO3
could be easily resolved. However, broad diffuse ringsat lowerd values in the SAED pattern indicates thatthe clusters are embedded in an amorphous matrix.The rings in the SAED pattern at 0.38 nm correspondto the 002 and 020 planes of the monoclinic WO3
phase (JCPDS-ICDD-43-1035 [32]). Electron diffrac-tion studies, however, do not eliminate the presence ofthe hexagonal WO3 phase (Table 1).
CDF TEM micrographs and the SAED pattern ofa Pd-W-PTA film are given in Fig. 2. Both the mi-crograph and the enhanced intensities of the rings inthe SAED pattern reveal that the clusters are larger(up to 5 nm) than the clusters in films without addedPd. The values of all the rings in SAED (Table 1) andthehkl planes show that certain rings would be betterindexed as hexagonal WO3. This suggests that Pd : W-PTA films do not consist of a single crystalline phase

294 Orel et al.
Figure 1. TEM micrograph (central dark field) and SAED patterns of the W-PTA film. The white solid circles in the diffraction patternsindicate the position and size of the objective aperture during CDF imaging. The numbers in the SAED patterns represent thehkl values of theplanes (m: monoclinic WO3, h: hexagonal WO3).
but are rather a mixture of monoclinic and hexagonalphases coexisting in the amorphous matrix.
Crystallization of W-PTA films was induced by ex-posing the films to strong electron irradiation by dis-placing the condenser aperture and using the largestspot size of the microscope. The WO3 crystals with agrain size of 30–50 nm and mainly with a monoclinicstructure appeared within 3–5 s (Fig. 3 and Table 1).The results confirmed that Pd : W-PTA and W-PTAfilms do consist of clusters embedded in the amorphousmatrix agreeing with the results obtained by Denesuket al. [26]. In addition, the results clearly show that thenano-crystalline WO3 clusters in W-PTA films have amonoclinic modification [32].
The presence of Pd promotes the crystallization ofW-PTA, forming additional hexagonal grains but noseparate diffraction patterns, which may indicate thepresence of Pd grains, were noted. These observa-tions do not confirm the possible existence of crystal-line WO3·2H2O [20] but are in accordance with Hibinoet al. [11], suggesting that the W-PTA network con-sists of clusters with a hexagonal arrangement of WO6
octahedra. It should be noted that these conclusions
refer solely to the crystalline phase of the films andin order to elucidate the structure of the amorphousWO3·2H2O phase in W-PTA and Pd : W-PTA filmsfurther studies using IR and Raman spectroscopy wereneeded.
IR and Raman Spectra of Films
The structural features of W-PTA films imply the exis-tence specific vibrational modes which are characteris-tic of its structure. The vibrational band assignment ofW-PTA is based on IR and Raman spectra of WO3 andWO3·H2O [31] films including; WO3 films preparedby the ion-exchange method [33], e-beam vacuum eva-porated WO3 films [27] and published IR and Ramanspectra of W-PTA films and powders [11, 22, 23, 25].The IR and Raman spectra of the W-PTA films con-sists of two well defined groups of vibrations: stretch-ing modes of terminal (ºW O at 980 cm−1), cornersharing (ºW O W at 680 cm−1) and edge-sharing(ºW O W at 750–700 cm−1) W O modes and bend-ing modes below 450 cm−1.

Gasochromic Behavior 295
Table 1. Measuredd-values (in nm) of rings (spots) in SAED patterns with esti-mated error levels,hkl of corresponding planes for monoclinic (m) and hexagonal (h)WO3 and difference (delta) between measured and theoreticald values.
d (nm) Error (nm) hkl WO3 (m) Delta (nm) hkl WO3 (h) Delta (nm)
W-PTAa
0.377 0.008 002 020 0.007, 0.00 110 0.012
0.306 0.006 112 0.002 200 0.01
0.188 0.004 040 014 0.00 002 0.002
0.158 0.003 420 402 0.00, 0.001 221 202 0.002
Pd : W-PTA (1 : 40)b
0.371 0.007 002 020 0.007, 0.00 110 0.012
0.306 0.006 112 0.002 200 0.01
0.245 0.005 221 0.002 201 0.00
0.188 0.004 040 014
W-PTA, in-situ crystallizationc
0.383 0.008 002 0.001 001 0.008
0.371 0.007 020 0.005 110 0.006
0.331 0.007 120 0.004 101 0.002
0.261 0.005 022 0.001 111 0.006
0.206 0.004 320 0.002 211 0.002
aSee Fig. 1.bSee Fig. 2.cSee Fig. 3.
Figure 2. TEM micrograph and SAED patterns of the Pd : W-PTA (1 : 53) film. Numbers in SAED patterns represent thehkl values of theplanes (m: monoclinic WO3, h: hexagonal WO3).

296 Orel et al.
Figure 3. TEM micrograph and SAED patterns of the in-situ crystallized W-PTA film (see text).
Specific to the W-PTA structure is the presence ofW O O W and
———–—W O O
—modes which appear at
800–830 cm−1 and 560 cm−1 [11, 22, 23, 25, 34].Modes incorporating the vibrations of hydrogen bond-ed H2O appear between 3500 and 3000 cm−1 (stretch-ing modes). The bending mode is found at 1640 cm−1
and modes of H2O attached to the WO W skeletonare expected between 600 and 400 cm−1 [31]. The hy-droxyl group linked through the H-bonds to the WO6
skeleton were assigned to 3220 and 1410 cm−1 modes[31].
Raman spectra revealed similar band frequencies,albeit the band intensities differ with respect to theirIR counterparts. The bands at 800–850 cm−1 and 560–580 cm−1 are quite intense and originate from theO O modes of W-PTA [34]. Bending WO W modesalso appear as separate bands in the spectral range<400 cm−1. For detail vibrational band assignment seeTable 2.
IR spectra of our W-PTA films deposited onto Si-wafers measured immediately after being dipped inW-PTA sols (Fig. 4) show besides the modes assignedto the alcohol solvent bonds, modes at 850 cm−1,820 cm−1 (ºW O W O), 730 cm−1 (ºW O W
edge sharing), 984 cm−1 (terminal ºW O) and
569 cm−1 (º———–—
W O O—
). Bending modes were not de-tected since they appear outside the measuring rangeof the IR spectrometer.
A transformation was observed in IR spectra of theW-PTA and Pd : W-PTA films (Fig. 5(a) and (b)) af-ter being dried (1 and 100 hours). This is reflected inthe relative intensity decrease of the 850–820 cm−1,570 cm−1 and 725 cm−1 bands with respect to the641 cm−1 band and suggests that the peroxo groupsdecompose and the structure of edge-sharing WO6
groups, which prevail in sols and fresh xerogels, trans-forms to a more condensed structure with corner-sharing WO6 units [27, 33]. However, the presenceof the terminal W O mode at 970 cm−1 in spectra ofdried films indicates the existence of the WO3·xH2Ophase. This is also indicated by the presence of H-bonded water bands at 3480, 3220, and 3000 cm−1
suggesting the presence of variously H-bonded watermolecules. The hydroxyl modes at 3220 and 1420 cm−1
confirm the presence of the hydroxyl groups. A com-parison of the IR spectra of Pd : W-PTA with the spectraW-PTA films (Figs. 4 and 5(a), (b)) shows that the de-composition of the peroxo groups and the simultaneous
Solo
fW
-PTA
and
Pd:W
-PTA
As
depo
site
dW
-PTA
As-
depo
site
dPd
:W-P
TA(1
:125
)Fi
lmof
Pd:W
-PTA
(1:1
25)
Film
Pow
der
Film
Film
Pow
der
Seco
ndco
lour
edSe
cond
blea
ched
Sixt
hco
lour
edSi
xth
blea
ched
Solu
tion
afte
r1
haf
ter
100
haf
ter
1h
afte
r10
0h
afte
r10
0h
stat
est
ate
stat
est
ate
Ram
anIR
Ram
anIR
IRR
aman
IRIR
IRIR
Ban
das
sign
men
t
—∼3
400
—∼3
400
3450
—34
64∼3
420
3465
3402
ºO
HO
——
——
3220
——
3215
3233
3231
ºO
H(h
ydro
xyl)
——
——
——
——
3050
3063
ºO
HO
——
—16
3016
30—
1620
1620
1620
1620
±H
2O
——
——
1420
—14
2014
2014
2014
20º
WO
H(h
ydro
xyl)
956
970
958
975
975
958
956
973
946
972
ºW
Ote
rmin
al
817
824
810
817
813
——
——
—º
WO
OW
——
——
——
850
—85
1—
ºW
OW
——
——
—80
379
780
079
879
3
720
725
720
704
720
710
——
——
ºW
OW
edge
shar
ing
——
—64
264
8—
637
637
636
636
ºW
OW
corn
ersh
arin
g
566
562
560
562
——
——
——
——
———
ºW
OO
——
——
578
—56
2—
558
—º
WH
2O
320
—31
8—
—32
9—
——
—W
OW
defo
rmat
ion
221
—22
6—
—22
6—
——
—W
OW
defo
rmat
ion
Tabl
e2.
IRan
dR
aman
vibr
atio
nalb
and
freq
uenc
ies
(in
cm−1
)an
dba
ndas
sign
men
tof
W-P
TAan
dPd
:W-P
TA.

298 Orel et al.
Figure 4. FTIR spectra of a W-PTA film deposited on a Si-wafer obtained durring drying.
transformation of the WO W skeleton is faster in thepresence of Pd. This is not surprising because Pd hasthe same effect as the Pt net used to remove unreactedH2O2. This agrees with the reducing effect of the Pdcatalyst on the W-PTA matrix [35].
Raman spectra of fresh W-PTA and Pd : W-PTAsols (Fig. 6) and dried powders (Fig. 7) provide clearevidence of the presence of the peroxo groups inthe freshly prepared sols and powders. The bands at
810 cm−1 (ºW O O W) and 560 cm−1 (º———–—
W O O—
)disappeared from the Raman spectra of W-PTA andPd : W-PTA dried films (Fig. 7). This confirms thatthe IR active band at 570 cm−1 can be assigned to
the H2O WO6 mode and not to theº———–—
W O O—
modeas suggested from the IR spectra alone. Similar to IRanalysis, Raman spectra reveal that the decompositionof the peroxo groups and the transformation of theW O W skeleton is much faster for Pd : W-PTA thanW-PTA films. Raman spectra also prove the presenceof terminal W O groups (960 cm−1), which confirmsthe existence of the hydrated WO3 phase in doped andundoped films.
It should be noted that although the general appear-ance of the Raman and IR spectra is similar to that ofthe monoclinic WO3, the observed spectra could not be
directly correlated to the spectra of either the monocli-nic or hexagonal WO3 [31]. This is not a surprisingsince the crystalline grains are of nanodimensionswhich influences the mode frequencies and intensities.
In-Situ IR Transmission Spectra of H2 Coloured Film
The most prominent feature in the IR spectra of Pd : W-PTA films when exposed to H2 gas (Fig. 8) is thestrong absorption extending from the near infrared tothe spectral range where skeletal modes of the film ap-pear. This absorption shows a modulation of intensitywith the Pd content and in the time that the film is incontact with H2. Thus we assigned this broad absorp-tion peaking in near-IR spectral range to the polaronmode, agreeing with the characteristic mode detected inthe transmission spectra of electrochemically colouredWO3 [33] and Nb2O5 films [28].
The gasochromic colouration also alters the WOmodes confirming that the polaron transition disturbsthe phonon modes (Fig. 9). The most pronounced ef-fect is a drastic increase in the intensity of the terminalW O band at 955 cm−1, which becomes red shiftedfrom 964 cm−1. The difference spectra (Fig. 9), ob-tained by subtracting the IR spectrum of Pd : W-PTA

Gasochromic Behavior 299
Figure 5. FTIR spectra of W-PTA and Pd : W-PTA (1 : 53, 1 : 125) films taken after 1 hour (a) and after 100 hours (b).
in the coloured state from the bleached state, revealedthat the terminal (ºW O mode (954 cm−1) and theºW H2O band at 558 cm−1 gain in intensity in spec-tra of the coloured films. This suggest that the increaseof the W O bonds is accompanied by the formation
of W OH2 groups. Accordingly, other modes did notshow any significant alteration agreeing with the re-versibility of the gasochromism observed for our films.This also agrees with in-situ Raman spectral measure-ments made by Delichere et al. [37], who found that

300 Orel et al.
Figure 6. FT-Raman spectra of W-PTA and Pd : W-PTA (1 : 53, 1 : 125) sols.
Figure 7. FT-Raman spectra of W-PTA and Pd : W-PTA (1 : 53, 1 : 125) powders (after 100 hours of ageing).

Gasochromic Behavior 301
Figure 8. FTIR spectra of the coloured and bleached states of a Pd : W-PTA (1 : 125) film (6000–400 cm−1).
Figure 9. FTIR spectra of coloured (f lushing with H2) and bleached state of Pd : W-PTA (1 : 125) film in the spectral range from 1300 to400 cm−1 and the difference spectra obtained by substracting the IR spectra of coloured state and bleached state (insertion).

302 Orel et al.
Figure 10. UV-Vis spectra of an as-deposited Pd : W-PTA (1 : 125) film, coloured state obtained by 9th flushing with H2 and correspondingbleached state.
anodically deposited WO3 films, when charged cathod-ically, exhibit the W O band at 950 cm−1. However,the in-situ IR gasochromic spectra also show that thefrequency of the WO band is shifted from 964 to955 cm−1 with colouration. While the increase in in-tensity could be explained by the formation of an ad-ditional W O groups replacing the already existingW O W bonds, the red frequency shift of the termi-nal ºW O mode indicates that the protons interactwith the W O bond, reducing its frequency. Accord-ing to this small red frequency shift the WO modeinteractions are small, which suggests that the pro-tons in the matrix have a high mobility [11].
Colouring/Bleaching Properties of Films
As-deposited Pd : W-PTA films with Pd : W a molarconcentrations ratio 1 : 125 were exposed to H2 gas andthe in-situ UV-Vis spectra recorded (Fig. 10). The spec-tra revealed that the transmittance of the as-depositedfilm is ∼5% higher than the transmittance of the samefilm which was bleached with air after first being re-duced with H2 gas. This indicates that the Pd, intro-duced in as-deposited Pd : W-PTA films in the form ofPdCl2, is transformed into the Pd0 state.
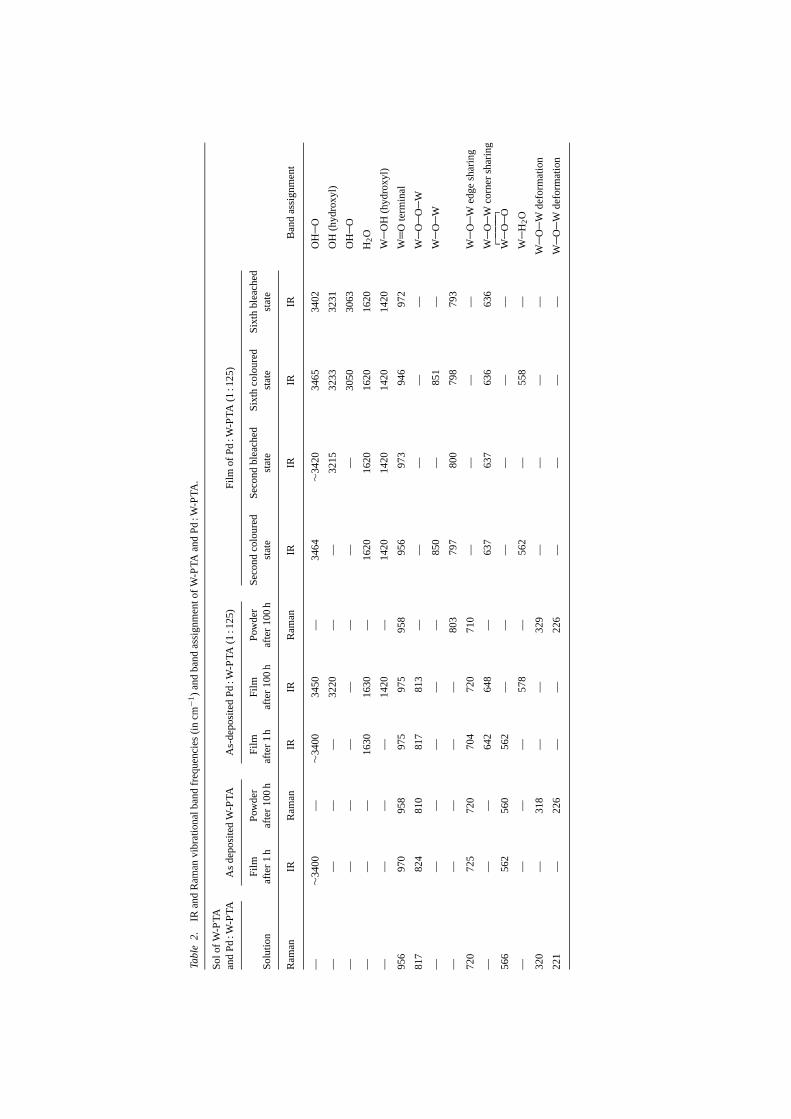
The in-situ UV-Vis spectra of Pd : W-PTA films withmolar ratios 1 : 125, 1 : 76 and 1 : 40 were detectedafter the films were periodically flushed with H2 andair (up to 17 cycles). The colouring bleaching changesand kinetics depend on the number of successive ex-posures of the films to H2, concentration of catalystand H2/Ar concentration. Figure 11 shows the influ-ence of the Pd catalyst concentration on the colour-ing/bleaching changes of the films. It suggests that theincreasing Pd concentration causes a decrease in thetransmittance modulation of the films. This indicatesthat at higher Pd concentrations the number of W6+
sites, able to transform in W5+, is diminished. Thisagrees with a similar effect observed for ion-storageand electrochromic films, which also show saturationof the inserted/extracted charges with increased filmthickness [38, 39]. Small shifts observed in spectra offilms having different Pd/W molar ratios originate fromthe interference patterns which are different for variousfilms having not exactly the same thickness (Fig. 11).
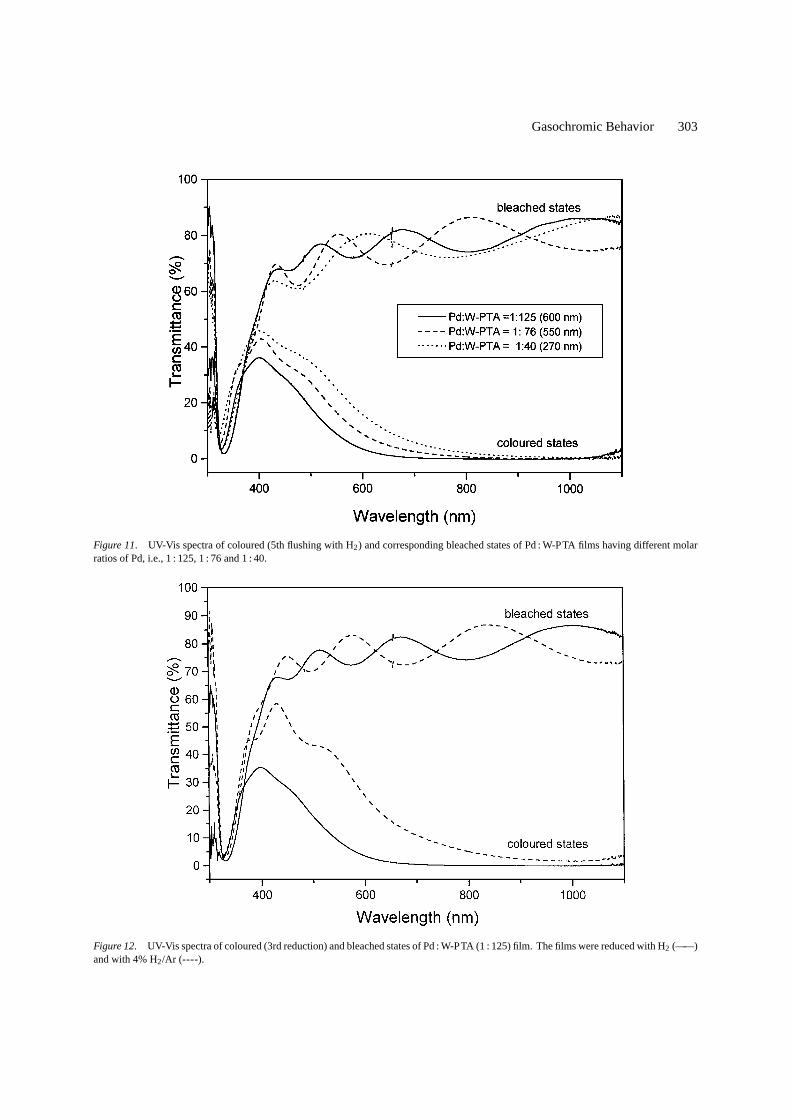
Smaller colouring/bleaching changes were notedwhen Pd : W-PTA 1 : 125 films are coloured in an H2/Ar(4%) mixture (Figs. 12 and 13). For example, the fullcolouration is not attained after the 3rd successive re-duction with H2/Ar (4%) mixture (Fig. 12) but the
Gasochromic Behavior 303
Figure 11. UV-Vis spectra of coloured (5th flushing with H2) and corresponding bleached states of Pd : W-PTA films having different molarratios of Pd, i.e., 1 : 125, 1 : 76 and 1 : 40.
Figure 12. UV-Vis spectra of coloured (3rd reduction) and bleached states of Pd : W-PTA (1 : 125) film. The films were reduced with H2 (——)and with 4% H2/Ar (----).

304 Orel et al.
Figure 13. UV-Vis spectra of coloured (9th reduction) and the corresponding bleached states of a Pd : W-PTA (1 : 125) film. The films werereduced with H2 (——) and with 4% H2/Ar (----).
transmittance of the film in the coloured state drops toa minimal value after the 9th H2/Ar reduction (Fig. 13).
The colouring/bleaching kinetic becomes fasterwhen the concentration of the catalyst is increased andis considerably slower when H2/Ar gas is used (Fig. 14)instead of pure H2 gas. For example, Pd : W-PTA filmwith a Pd : W ratio of 1 : 125 attains a full colourationin pure H2 in 170 s (7th reduction is shown) but thetime required to attain complete colouring reduces to20 s for the film with Pd : W molar ratio 1 : 40. WhenH2/Ar mixtures is used, the time needed to reach afull colouration for the films with Pd : W molar ratio1 : 125 is 1500 s (not shown) and diminishes to 120 swhen Pd : W molar ratio is increased to 1 : 40 (Fig. 14).Bleaching speeds (Fig. 15) also depend on the con-centration of the Pd catalyst and are greater at highercatalyst concentrations.
The time needed to attain reversible and persistentcolouring/bleaching changes depends on the numberof reduction/oxidation cycles performed on films.Figures 16 and 17 show the time (t1/2) needed todecrease (during colouring) or increase (during blea-ching) the transmittance of the film to the half of theinitial value (at = 633 nm) as a function of the numberof successive reduction/oxidation cycles performed onfilms. According to expectations, films having higher
concentration of Pd need smaller number of cyclesbefore they reach the stabilized gasochromic response(Fig. 14). Similarly, also the bleaching kinetics of filmsdepend on the catalyst concentration and is higher forthe films having higher amount of Pd (Fig. 15).
Concluding Remarks
Our results show that the sol-gel derived Pd : W-PTAfilms, at present, are still unable to compete with gaso-chromic films prepared by successive deposition ofsputtered WO3 and Pd metal layers and diminishes theirpotential application in practical gasochromic devices.The following observations should be outlined:
• The colouring/bleaching kinetics of the films, al-though adequate in H2, is particularly slow when amixture 4% H2/Ar is used for colouration. Our mostrecent observations reveal that when W-PTA filmsare exposed to ambient air they become gasochromi-cally passive due to the poisoning effects of traceamounts of CO and other polluting gases [40]. Filmsmust also be bleached with humid air otherwise theyloose hydrated water and in turn their gasochromiceffect.

Gasochromic Behavior 305
Figure 14. Colouring kinetics of gasochromic Pd : W-PTA film having molar ratio 1 : 125 (squares), 1:76 (triangles) and 1 : 40 (circles). Filmswere reduced with H2 (7th reduction: solid symbols) and H2/Ar (4%) (17th reduction: open symbols).
Figure 15. Bleaching kinetics of gasochromic Pd : W-PTA films having different molar ratio of Pd, i.e., 1 : 125 (squares), 1 : 76 (triangles),1 : 40 (circles). Films were oxidased with air.

306 Orel et al.
Figure 16. Time of colouring in which transmittance drops to 1/2 of the initial value vs. number of gasochromic cycles.
Figure 17. Time of bleaching in which transmittance drops to 1/2 of the initial value vs. number of gasochromic cycles.

Gasochromic Behavior 307
• In-situ UV-Vis spectroscopy confirmed that colou-red films are characterized by polaron absor-ption. However, the changes in optical density(1OD633 nm=OD633 nm(coloured)−OD633 nm(bleached))is only 0.2–0.3 contrasting with the higher1OD(1OD633 nm= 0.8–1) observed for electrochemi-cally coloured WO3 films of the same thickness(d≈ 300 nm) [41].• The structure of the gasochromically cycled Pd : W-
PTA and W-PTA films exhibit all the characteristicsof a nanocomposite material, i.e., the presence ofsmall grains with well defined crystalline structurecoexisting with an amorphous WO3·xH2O phase.Accordingly, we propose that the gasochromic effectis related to the combined effect of the surfaceproperties of the crystal grains and the hydra-ted amorphous phase. The mixed monoclinic andhexagonal WO3 crystalline grains assure the elec-tron transfer between the W6+ and W5+ sites viathe polaron mechanism, while the amorphous hy-drated phase provides the necessary proton conduc-tivity.• Changes in the vibrational bands observed in the in-
situ IR spectra of Pd : W-PTA films suggest that thereis a weak interaction between the released protonsand the W O network, since only a small red fre-quency shift (965–950 cm−1) of the W O mode onthe surface of grains was detected in the spectra of thecoloured films. Colouration was found to increasethe number of W O terminal and W OH2 groups,which indicates that the released electrons becomeredistributed in bonds around the W ion, increasingthe bond order of terminal WO groups, while thenumber of W OH2 groups are increased to retaincharge neutrality.
Further work is planned to improve the stability ofPd : W-PTA films against dry gases and the poisoningeffect of CO. Also other multicomponent oxides filmsand Pd : W-PTA oxide multilayer stacks will be madein the future in an attempt overcome the deficiencies ofdeposited films.
Acknowledgments
Authors wish to thank to Ministry of Science andTechnology of Slovenia for financial support (projectJ1-8903). We would also like to thank Dr. A. Georg(Fraunhofer Institute for Solar Systems, Freiburg,Germany) for his helpfull discussion.
References
1. C.G. Granqvist,Handbook of Inorganic Electrochromic Mate-rials (Elsevier, Amsterdam, 1995).
2. P.M.S. Monk, R.J. Mortimer, and D.R. Rosseinsky,Electro-chromism: Fundamentals and Applications(VCH, Weinheim,1995).
3. C.G. Granqvist, Appl. Phys.A57, 3–12 (1993).4. C.G. Granqvist,Handbook of Inorganic Electrochromic Mate-
rials (Elsevier, Amsterdam, 1995), p. 83.5. O.F. Schirmer, J. Phys. (Paris), Coloque6, 479 (1980).6. D. Brennan and P.C. Fletcher, Nature183, 249 (1959).7. O. Glemser, U. Hauschild, and G. Lutz, Z. Anorg. Allgem.
Chem.269, 93 (195).8. M. Boredort, M.A. Vannice, and J.E. Benson, Z. Physik. Chem.
Neue Folge64, 171 (1969).9. J.E. Benson, H.W. Kohn, and M. Bondart, J. Catalysis5, 307
(1966).10. B.S. Hobbs and A.C.C. Tseng, J. Electrochem. Soc.119, 580
(1972).11. M. Hibino, H. Nakajima, T. Kudo, and N. Mizuno, Solid State
Ionics100, 211–216 (1997).12. C.G. Granqvist,Handbook of Inorganic Electrochromic Mate-
rials (Elsevier, Amsterdam, 1995), p. 153.13. J. Hamagami, Y. Oh, Y. Watanabe, and M. Takata, Sensors and
ActuatorsB13-14, 281 (1993).14. K. Ito and T. Ohgami, Appl. Phys. Lett.60, 938 (1992).15. A. Georg, W. Graf, D. Scweiger, V. Wittwer, and H.R. Wilson,
Solar Energy62, 215 (1998).16. M. Zayat, R. Reisfeld, H. Minti, B. Orel, and F.Svegl, J. Sol-Gel
Sci. Technol.11, 161 (1998).17. C.J. Brinker and G.W. Scherer,Sol-Gel Science(AP, San Diego,
1990).18. J. Wen and G. Wilkes, Chem. Mater.8, 1667 (1996).19. W.H. Meyer, Adv. Mater10(6), 439 (1998).20. P. Judeinstein and C. Sanchez, J. Mater. Chem.6, 511 (1996).21. J. Livage and G. Guzman, Solid State Ionics84, 2054–2211
(1996).22. T. Kudo, H. Okamoto, K. Matsumoto, and Y. Sasaki, Inorg.
Chim. Acta111, L27–L28 (1986).23. T. Kudo, Nature312, 537 (1984).24. M. Macek, B. Orel, and U. Opara Kraˇsovec, J. Electrochem.
Soc.144, 3002 (1997).25. K. Yamanaka, H. Oakamoto, M. Kudo, and T. Kudo, Jap.
J. Appl. Phys.25, 1420 (1986).26. M. Denesuk, J.P. Cronin, S.R. Kennedy, K.J. Law, G.F. Nielson,
and D.R. Uhlman, SPIE2255, 52 (1994).27. T. Nanba, S. Takano, I. Yasui, and T. Kudo, J. Solid State Chem.
90, 47 (1991).28. Y. Li, Y. Aikawa, A. Kishimoto, and T. Kudo, Electrochim. Acta
39, 807 (1994).29. K. Itale, T. Okamoto, S. Wahita, H. Niikura, and H. Murabyashi,
Appl. Organometal. Chem.5, 295 (1991).30. H. Okamoto, I. Iwaynagis, K. Mochiji, H. Umezaki, and
T. Kudo, Appl. Phys. Lett49, 298 (1986).31. M.F. Daniel, B. Desbat, J.S. Lassegues, B. Gerand, and
M. Figlarz, J. Solid State Chem.67, 235 (1987).32. JCPDS-ICDD 43-1035.33. T. Nanba, Y. Nishiyama, and I. Yasui, J. Mater. Res.6, 1324
(1991).

308 Orel et al.
34. V. Vacque, B. Sombret, J.P. Huvenue, D. Legrand, and S. Suc,Spectrochim. ActaA53, 55–66 (1997).
35. P.J. Kulesza, B. Grzybowska, M.A. Malik, and M.T. Galkowski,J. Electrochem. Soc.144, 1911 (1997).
36. B. Orel, M. Macek, J. Grdadolnik, and A. Meden, J. Solid StateElectrochem.4, 221 (1998).
37. P. Delichere, P. Falaras, M. Frommet, and A. Hugot-Le Goff,Thin Solid Films161, 35–46 (1988).
38. M.A. Aegerter,Structure and Bonding, Vol. 85 (Springer-VerlagBerlin, Heidelberg, 1996), pp. 149–194.
39. A. Agrawal, J.P. Cronin, and R. Zhang, Sol. Energ. Mat. Sol.Cells31, 9–21 (1993).
40. N. Groselj, U. Opara Kraˇsovec, and B. Orel, unpublishedresults.
41. O. Bohnke, G. Bohnke, G. Robert, and B. Carquille, Solid StateIonics6, 121–128 (1982).
Related Documents


