Proceedings of the 2 nd Middle East Turbomachiery Symposium March 17-20, 2013, Doha, Qatar GAS TURBINE PERFORMANCE DETERIORATION AND COMPRESSOR WASHING Cyrus Meher-Homji Bechtel Fellow Bechtel Corporation Houston, TX, USA Andrew F. Bromley Vice President, Operations Turbotect (USA), Inc. Tomball, TX, USA Jean-Pierre Stalder Chief Engineer, R&D Manager Turbotect Ltd. Baden, Switzerland Cyrus Meher-Homji is an Engineering Fellow and Technology Manager at Bechtel Corporation assigned to the LNG Technology Center of Excellence as a turbomachinery advisor to ongoing LNG projects on the aeromechanical design, selection, and testing of large compressors and gas turbines. His 33 years of industrial experience cover gas turbine and compressor application, design, and troubleshooting. Cyrus is a Fellow of ASME, and is active in several committees of ASME's International Gas Turbine Institute. He has a Master's Degree in Engineering from Texas A&M University and an MBA from the University of Houston. Cyrus is a member of the Texas A&M University Turbomachinery Symposium Adviso ry ommittee. f Chemistry and the Institute of Metallurgy & Materials (UK), and a Fellow of ASME. n crude oil, HFO or other contaminated fuels. Mr. Stalder is a mechanical ngineer and a Fellow of ASME. lting in a C Andrew Bromley is Vice President of Operations for Turbotect (USA) Inc. where he is responsible for the company’s U.S. activities in the areas of gas turbine compressor cleaning and fuel treatment technology. Andrew has over 30 years of experience with gas turbines and has specialized in the areas of high temperature corrosion, fuel chemistry, fuel treatment, hot gas path and compressor fouling, compressor washing, and other chemical applications associated with gas turbine performance. Mr. Bromley holds a diploma in Chemistry and a Master of Science degree in Corrosion Science & Engineering from City of London Polytechnic, UK. He is a member of the Royal Society o Jean-Pierre Stalder is Chief Engineer and R&D Manager with Turbotect Limited in Baden, Switzerland. His responsibilities include the conceptual development of compressor cleaning systems and chemicals to alleviate gas turbine power degradation and efficiency loss due to compressor fouling. His career in turbomachinery has spanned over 30 years and is underlined by a number of experimental studies to improve the understanding of axial compressor fouling phenomena and its control. Other areas of expertise are the development and application of lubricity improvement additives for gas turbines operated on low viscosity liquid fuels, the combustion of alternative fuels, and high temperature corrosion inhibition for engines operated o e ABSTRACT The privatization of utilities, intense competition in the petrochemical and gas distribution industries, coupled with increasing fuel costs, have created a strong incentive for gas turbine operators to minimize and control performance deterioration. The most significant deterioration problem faced by gas turbine operators is compressor fouling which is the focus of this paper. The effect of compressor fouling is a drop in airflow, pressure ratio and compressor efficiency, resu Copyright © 2013 by Turbomachinery Laboratory, Texas A&M University 1

Welcome message from author
This document is posted to help you gain knowledge. Please leave a comment to let me know what you think about it! Share it to your friends and learn new things together.
Transcript

Proceedings of the 2nd Middle East Turbomachiery Symposium March 17-20, 2013, Doha, Qatar
GAS TURBINE PERFORMANCE DETERIORATION AND COMPRESSOR WASHING
Cyrus Meher-Homji
Bechtel Fellow Bechtel Corporation Houston, TX, USA
Andrew F. Bromley Vice President, Operations
Turbotect (USA), Inc. Tomball, TX, USA
Jean-Pierre Stalder Chief Engineer, R&D Manager
Turbotect Ltd. Baden, Switzerland
Cyrus Meher-Homji is an Engineering Fellow and Technology Manager at Bechtel Corporation assigned to the LNG Technology Center of Excellence as a turbomachinery advisor to ongoing LNG projects on the aeromechanical design, selection, and testing of large compressors and gas turbines. His 33 years of
industrial experience cover gas turbine and compressor application, design, and troubleshooting. Cyrus is a Fellow of ASME, and is active in several committees of ASME's International Gas Turbine Institute. He has a Master's Degree in Engineering from Texas A&M University and an MBA from the University of Houston. Cyrus is a member of the Texas A&M University Turbomachinery Symposium Advisory
ommittee.
f Chemistry and the Institute of Metallurgy & Materials (UK), and a Fellow of ASME.
n crude oil, HFO or other contaminated fuels. Mr. Stalder is a mechanical ngineer and a Fellow of ASME.
lting in a
C
Andrew Bromley is Vice President of Operations for Turbotect (USA) Inc. where he is responsible for the company’s U.S. activities in the areas of gas turbine compressor cleaning and fuel treatment technology. Andrew has over 30 years of experience with gas turbines and
has specialized in the areas of high temperature corrosion, fuel chemistry, fuel treatment, hot gas path and compressor fouling, compressor washing, and other chemical applications associated with gas turbine performance. Mr. Bromley holds a diploma in Chemistry and a Master of Science degree in Corrosion Science & Engineering from City of London Polytechnic, UK. He is a member of the Royal Society
o
Jean-Pierre Stalder is Chief Engineer and R&D Manager with Turbotect Limited in Baden, Switzerland. His responsibilities include the conceptual
development of compressor cleaning systems and chemicals to alleviate gas turbine power degradation and efficiency loss due to compressor fouling. His career in turbomachinery has spanned over 30 years and is underlined by a number of experimental studies to improve the understanding of axial
compressor fouling phenomena and its control. Other areas of expertise are the development and application of lubricity improvement additives for gas turbines operated on low viscosity liquid fuels, the combustion of alternative fuels, and high temperature corrosion inhibition for engines operated o
e
ABSTRACT
The privatization of utilities, intense competition in the petrochemical and gas distribution industries, coupled with increasing fuel costs, have created a strong incentive for gas turbine operators to minimize and control performance deterioration. The most significant deterioration problem faced by gas turbine operators is compressor fouling which is the focus of this paper. The effect of compressor fouling is a drop in airflow, pressure ratio and compressor efficiency, resu
Copyright© 2013 by Turbomachinery Laboratory, Texas A&M University
1
rematching of the gas turbine and compressor and a drop in power output and thermal efficiency. This paper provides a comprehensive practical treatment of the causes, effects and control of fouling. Gas turbine inlet filtration, fouling mechanisms and compressor washing are also covered in detail. The major emphasis will be on the causes, effects detection and control of compressor fouling The complexities and challenges of on-line washing of large output new
as turbines will also be covered. The treatment also pplies to axial air compressors used in the
ng industry.
2) have provided a treatment of non-recoverable
l fficiency. In extreme cases, fouling can also result in
uring operation. Output losses between 2
experienced.
key ndings are incorporated here. It is useful to recognize
different gas turbine
gas turbine designs to the impact of fouling; i.e. the effect
ith a wide span of characteristics. he range of salient parameters used for the analysis is
shown in Figure 1.
NE AIRFLOW INGESTION AND
icates e ingested amount of foulant assuming an ambient
r. Consequently, maintaining high ompressor efficiency is important for the plant’s venue stream.
gahydrocarbon processi INTRODUCTION The use of gas turbines in power generation and other industrial applications has grown significantly in the past two decades. Compressor fouling and its control is, by far, the most important topic in the area of gas turbine performance deterioration and consequently is dealt with in detail. An overview of fouling deterioration may be found in Meher-Homji (1990) and an overall treatment of gas turbine performance deterioration including other sources is presented in Meher-Homji et al (2001). A detailed treatment of gas turbine degradation is made by Kurz and Brun (2000, 2012), and by Kurz et al (2008). Flashberg and Haub(199deterioration. An overview of fouling deterioration may be found in Meher-Homji and Bromley (2004). The fouling of axial flow compressors is a serious operating problem and its control is of supreme importance to gas turbine operators especially in the deregulated and highly competitive power market. It is also significant in the mechanical drive market where a loss in gas turbine output directly affects plant throughput. Foulants in the ppm range can cause deposits on blading, resulting in severe performance deterioration. The effect of compressor fouling is a drop in airflow and compressor isentropic efficiency, which results in a “rematching” of the gas turbine and compressor causing a drop in power output and thermaesurge problems, as it tends to move the compressor surge line to the right; i.e. towards the operating line. Estimates have placed fouling as being responsible for 70 to 85 percent of all gas turbine performance losses accumulated dpercent (under favorable conditions) and 15 to 20 percent (under adverse conditions) have been
A treatment of fouling susceptibility and sensitivity was made by Meher-Homji et al (2009) and fithat there are two distinct issues to be considered:
• The susceptibility of designs to fouling; i.e. the axial compressor’s propensity to foul.
• The sensitivity of different
of fouling on their performance.
In the past, these two issues have often been wrongly analyzed or confused. Fouling susceptibility and the effect of fouling are quite different. Results of simulations on 92 different engines of varying size and configuration have been evaluated, covering heavy-duty “frame” type models, aeroderivatives and hybrids – and including both older technology units as well as advanced models wT
GAS TURBIFOULING Gas turbines ingest extremely large quantities of air, with larger gas turbines having airflow rates as high as 680 kg/sec (1,500 lbs/sec). A scatter plot of the airflow rate versus power for 92 gas turbines is presented in Figure 1. A very important parameter in evaluating gas turbines is “specific work” - defined as the power per unit of airflow rate (kW/kg/sec). The linkage between airflow rate and compressor fouling is indicated in Table 1. The data was derived by GTPRO1 simulations running at an ambient temperature of 15°C (59°F) and with typical inlet and outlet losses. This table indthloading of 10 ppm for a variety of gas turbines. Axial compressor work [Wc] and total turbine work [Wt] is also shown in Table 1, and it can be seen that the compressor section consumes a large portion of the total turbine work. To quantify this important fact, the last column of Table 1 provides the Wc/Wt ratio and it can be seen that approximately 50 to 60 percent of the total work produced in the turbine is consumed by its axial compressocre
1 By Thermoflow Inc.
Copyright© 2013 by Turbomachinery Laboratory, Texas A&M University
2

0
200
400
600
800
1000
1200
1400
1600
100 150 200 250 300 350 400 450 500
Specific Work, kW/kg/sec
TIT,
Deg
C
0
5
10
15
20
25
30
35
40
Pres
sure
Rat
io
TIT
PR Ratio
0
100
200
300
400
500
600
700
800
0 100,000 200,000 300,000 400,000
Power, kW
Mas
s Fl
ow, k
g/se
c
10
15
20
25
30
35
40
45
Ther
mal
Eff,
%Mass Flow
Thermal Eff
Figure 1. Range of Salient Parameters for 92 Gas Turbines. Parameters evaluated - Power, Mass Flow, TIT, PR, Thermal Efficiency and Specific Work. Table 1. Example of Airflow Ingestion of Different Gas Turbines and Ratio of Compressor Work to Total Turbine Work. To help visualize the huge airflow, the volume of air consumed per year is presented in terms of miles above a traditional football field 110 x 49 m (360 x 160 ft). As an example, the Frame 9351FA gas turbine, (ISO airflow of 648 kg/sec), would ingest, in a year of operation, a column of air over a football field 3120 kM (1,950 miles) high. At a 10 ppm foulant loading
rate, 204,414 kg (450,649 lb) of foulant would be ingested. Solids or condensing particles in the air and in the combustion gases can precipitate on the rotating and stationary blades causing changes in aerodynamic profile, reducing the compressor mass flow rate and affecting the flow coefficient and efficiency; thus reducing the unit's overall performance. Further, contaminated air can cause a host of problems that include erosion, fouling, corrosion and, in some cases, plugging of hot section cooling passages. There is also a close correlation between mechanical reliability and fouling deterioration, and an example is the damaging effects of fouling on blading integrity as discussed in the following sections. This is another important reason to keep the compressor clean. Some typical photos of fouled compressors are shown in Figures 2, 3 and 4.
Figure 2. Examples of Fouled Compressor Blades:
0.530.47490,325229,707450,6491,9501,429255,400Frame 9351FA
0.520.48340,671164,387306,2151,325971172,757Frame 7241FA
0.460.54354,064190,196363,6101,5731,153160,748GT 13E2
0.450.55192,481105,264206,56189465585,206Frame 7121EA
0.500.50147,12774,237141,91261445070,116Frame 6101FA
0.430.57136,14977,627135,28958542956,295GT 8C2
0.390.61136,47884,280107,22246434050,990Trent 50
0.460.5494,22950,706101,23143832141,487Frame 6581B
0.400.6069,25841,22262,75727219926,678RB-211
0.410.5966,31138,96084,83236726926,056Frame 5371 PA
0.390.6128,98117,93829,0131269210,436Mars 100
0.440.5611,0936,26313,18257424,481Centaur 50
0.410.5913,5368,10412,29953395,106Typhoon
Net Work RatioNWR
Wc/Wt
TotalturbineworkWt
(kW)
Compr.workWc
(kW)
Foulantingestedper year
at 10 ppmambient
(lb)
Airingestedper year
(Miles above a football
field)
ISOairflow(lb/sec)
ISOoutput(kW)
Gas Turbine
0.530.47490,325229,707450,6491,9501,429255,400Frame 9351FA
0.520.48340,671164,387306,2151,325971172,757Frame 7241FA
0.460.54354,064190,196363,6101,5731,153160,748GT 13E2
0.450.55192,481105,264206,56189465585,206Frame 7121EA
0.500.50147,12774,237141,91261445070,116Frame 6101FA
0.430.57136,14977,627135,28958542956,295GT 8C2
0.390.61136,47884,280107,22246434050,990Trent 50
0.460.5494,22950,706101,23143832141,487Frame 6581B
0.400.6069,25841,22262,75727219926,678RB-211
0.410.5966,31138,96084,83236726926,056Frame 5371 PA
0.390.6128,98117,93829,0131269210,436Mars 100
0.440.5611,0936,26313,18257424,481Centaur 50
0.410.5913,5368,10412,29953395,106Typhoon
Net Work RatioNWR
Wc/Wt
TotalturbineworkWt
(kW)
Compr.workWc
(kW)
Foulantingestedper year
at 10 ppmambient
(lb)
Airingestedper year
(Miles above a football
field)
ISOairflow(lb/sec)
ISOoutput(kW)
Gas Turbine (a) Heavily-fouled air inlet bell-mouth and blading on a
35 MW gas turbine (b) Typical oily deposits on blades (c) Compressor blades fouled with a mixture of salts and oil.
Figure 3. Oily Deposits on Axial Compressor Blades from No. 1 Bearing Oil Leakage on a Large Heavy Duty Gas Turbine.
Copyright© 2013 by Turbomachinery Laboratory, Texas A&M University
3

Figure 4. Salt Deposits on Compressor Blades (Courtesy, Turbotect Ltd.)
ECONOMIC IMPACT OF FOULING
The cost of performance deterioration varies from site to site, depending on the rate of fouling and the effectiveness of compressor washing programs that are applied. Actual costs can be significant, and are often under-estimated by operating companies.
Basically, fouling cost calculations must address the value of the resulting shortfall in energy output and the cost of fuel that is consumed over the operating period. The manner by which the output shortfall is measured may need to be adjusted according to the specific application. For example, in power generation it is the lost revenue from electricity sales, whereas in mechanical-drive gas transmission applications the calculation will involve the quantity of gas moved through the pipeline and the sales price of the gas. Cost models for combined cycle plants must also address the impact of gas turbine output deterioration on the performance of the steam cycle, and these calculations can become more complex as a result of single- and multi-shaft configurations etc.
Gas turbine operating mode also affects the cost calculation. For example, when operating at or near to base load, power output degradation can usually not be controlled by the consumption of additional fuel – due to turbine firing temperature control limitations. In this case, and for a power generation application, the cost of compressor fouling is driven by the loss of revenue from electricity sales, and is partially offset by the cost of fuel saved due to the reduced power output.
However, under part load operating conditions (and within certain limits), power output degradation due to compressor fouling can be controlled by consuming additional fuel. In this case, and assuming the power output is fully recovered, there will be no loss of revenue from electricity sales and the cost of degradation becomes the cost of the additional fuel.
Figure 5 shows the results of a realistic fouling cost model applied to three large, heavy-duty gas turbines in a power generation application. It assumes 8000 hours operation at base load, representative prices for fuel purchase and power sales, and typical “modest” fouling conditions resulting in a 5 percent reduction in power output at the end of the period. Note that the area above the degradation curve computes the annual power output shortfall (in MWh), which in this example calculates to a loss of 3.83 percent. After allowing for fuel cost savings due to reduced power output, the estimated net cost degradation for these three engines ranges from about 1.3 to 4.6 million US dollars per year. Figure 5. Annual Cost of Compressor Fouling, Estimated for three Heavy-Duty Gas Turbines (Bromley, 2012).
Power losses attributable to compressor fouling can be restored through regular compressor cleaning and judicious plant maintenance programs. Overall plant profitability can be significantly improved for a relatively small cost. The amount of improvement at a given site depends on the type of cleaning program adopted and the thoroughness of its implementation. All elements of the program are important, including the design of compressor cleaning systems such as wash skids and injection nozzles, the choice and use of
Copyright© 2013 by Turbomachinery Laboratory, Texas A&M University
4

detergents, the frequency of cleaning, and the actual washing procedure used.
AERODYNAMIC CONSIDERATIONS
An axial compressor is a machine where the aerodynamic performance of each stage depends on that of the earlier stages. Thus, when fouling occurs in the inlet guide vanes and the first few stages, there may be a dramatic drop in compressor performance. This can often occur when oil and industrial smog or pollen are present and form adherent deposits. The forward compressor stages are usually fouled the worst. If the rear stages foul, this seems to have a smaller impact on performance; but due to higher temperatures, deposits can become baked and difficult to remove. This baking effect is more severe on the high pressure ratio compressors of aeroderivative machines ranging from 18:1 to 35:1 pressure ratio, as opposed to the typical 10:1 or 14:1 pressure ratios found on the heavy duty industrial gas turbines. Figure 6 shows the changes in compressor efficiency and heat rate occurring in a large gas turbine over time.
0.80
0.81
0.82
0.83
0.84
0.85
0.86
0.87
0.88
0 2 4 6 8 10 12 14 16 18 20 22 24 26 28 30 32 34 36 38
Days
100
101
102
103
104
105
106
107
108Compressor adiabatic efficiencyPercent of clean heat rate
Figure 6. Change in Compressor Efficiency and Heat Rate for a Heavy Duty Gas Turbine. A typical characteristic curve for an axial flow compressor stage is shown in Figure 7. Under design operating conditions, most stages would operate at design flow coefficient and at a high isentropic efficiency. When the flow coefficient is to the right of the characteristic curve, the stage is lightly loaded and the extreme right point is known as the choke point. To the left of the characteristic curve is a region where aerodynamic stall occurs (surge region).
Figure 7. Compressor Stage Loading Characteristics. As fouling drops the mass flow (flow coefficient) in the first stage, this affects the performance of the latter stages as follows: The operating point on the first-stage characteristic moves towards the left, thus increasing the pressure ratio. This causes a higher density at the inlet to the second stage. Thus there will be a further reduction in second-stage flow coefficient. This effect progresses through successive stages until aerodynamic stall occurs in a later stage and triggers a surge. Basic velocity triangles indicating how a drop in mass flow causes excessive incidence angles and subsequent aerodynamic stall are shown in Figure 8 (Dundas, 1982).
Figure 8. Velocity Triangles under Fouled Conditions showing how Change in Mass Flow Causes a Change in Incidence (Dundas, 1982). SIMULATION RESULTS OF COMPRESSOR DETERIORATION Simple Cycle Simulation It is instructive to investigate the sensitivity of compressor fouling deterioration on simple cycle gas turbine performance. To this end, simulation runs using GTPRO software have been made for a 40 MW-Class heavy duty gas turbine in simple cycle configuration. Runs were made with natural gas fuel with an LHV of
Copyright© 2013 by Turbomachinery Laboratory, Texas A&M University
5

50046 kJ/kg (21,518 Btu/lb) and with typical inlet and outlet pressure drops 100 & 125 mm WG (4 and 5 inch WG) respectively. The machine has an ISO pressure ratio of 11.8:1 and a mass flow rate of 138 kg/sec (304lbs/sec) and a firing temperature of 1104°C (2020°F). The simulation was run at an ambient temperature of 15°C (59°F), and imposing deterioration steps in the following sequence:
• Step 1: New and Clean, Mass flow drop = 0%,
Comp. efficiency drop = 0% • Step 2: Mass flow drop = 1%,
Comp. efficiency drop = 0.833 % • Step 3: Mass flow drop = 2%,
Comp. efficiency drop = 1.67 % • Step 4: Mass flow drop = 3%,
Comp. efficiency drop = 2.5 % • Step 5: Mass flow drop = 4 %,
Comp. efficiency drop = 3.33 % • Step 6: Mass flow drop = 5 %,
Comp. efficiency drop = 4.167% • Step 7: Mass flow drop = 6 %,
Comp. efficiency drop = 5% Output and heat rate variation with the deterioration steps is shown in Figure 9. The output at the end of the 7th deterioration step has dropped 5.5 MW while the heat rate has increased by 850 Btu/kW hr. The change in mass flow rate, compressor discharge pressure and compressor discharge temperature corresponding to the simulated deterioration steps is shown in Figure 10.
30,000
31,000
32,000
33,000
34,000
35,000
36,000
37,000
38,000
39,000
1 2 3 4 5 6 7
Degradation Steps ( 1 = New and Clean)
Out
put,
kW
10,200
10,400
10,600
10,800
11,000
11,200
11,400
11,600
11,800
Hea
t Rat
e, B
TU/k
Whr
Output
Heat Rate
Figure 9. Output and Heat Rate Change with Compressor Degradation Steps Imposed on a 40 MW Gas Turbine.
100
150
200
250
300
350
1 2 3 4 5 6 7
Degradation Steps (1 = New and Clean)
Mas
s Fl
ow( L
bs/s
ec) &
CD
P (P
sia)
650
655
660
665
670
675
680
685
690
695
700
Com
pres
sor D
isch
Tem
p, F
CDT
Mass Flow
CDP
Figure 10. Change in Mass Flow Rate, Compressor Discharge Temperature and Pressure with Compressor Degradation Steps Imposed on a 40 MW Gas Turbine. The drop in efficiency causes the discharge temperature to increase by approximately 10.6°C (19°F) and the compressor discharge pressure to drop by about 0.7 bar (10 psia). The variation in axial compressor work, turbine section work, and the output after losses is shown in Figure 11. Whereas the axial compressor work is seen to drop slightly due to the reduction in mass flow (middle line of the figure), there is a steep drop in the turbine work (upper line in the figure) resulting in a drop in overall gas turbine output of 5.5 MW. The steep drop in turbine section work is due to the reduced mass flow and the smaller expansion ratio available as a result of the loss in compressor discharge pressure.
20,000
30,000
40,000
50,000
60,000
70,000
80,000
90,000
100,000
1 2 3 4 5 6 7
Degradation Steps (1 = New and Clean)
Com
pres
sor P
ower
, Tur
bine
Pow
er, O
utpu
t, kW
Total Turbine Work
Compressor Work
Output Work
Figure. 11. Change in Compressor Work, Turbine Work and Overall Output with Compressor Degradation Steps Imposed on a 40 MW Gas Turbine. Even with good air filtration, salt can collect in the compressor section, and will continue to accumulate (together with other foulants) until an equilibrium condition is reached. At this point, large particles will
Copyright© 2013 by Turbomachinery Laboratory, Texas A&M University
6
start to break away and will be ingested into the combustion section in relatively high concentrations. This ingestion has to be prevented by the removal of salt from the compressor prior to saturation. The rate at which saturation occurs is highly dependent on filter performance. The effect of hot section fouling is that the nozzle throat area is reduced. As this controls the compressor-turbine match, it causes a movement away from the design match point and results in a corresponding loss of performance. Deposits will also form on the rotating blades causing a further loss in performance. Also, as the turbine section of a gas turbine fouls, there will be a drop in the turbine flow coefficient and the compression ratio of the compressor will increase as the turbine “swallowing” capacity is reduced. Note that in some OEM control systems, the compression ratio and exhaust gas temperature are used to determine the turbine inlet temperature; Zaba (1980). This algorithm is based on an assumption of constant turbine efficiency, and if this efficiency decreases due to turbine fouling, then the control system will indicate a higher turbine inlet temperature than is really present. Therefore the output of the turbine is further reduced.
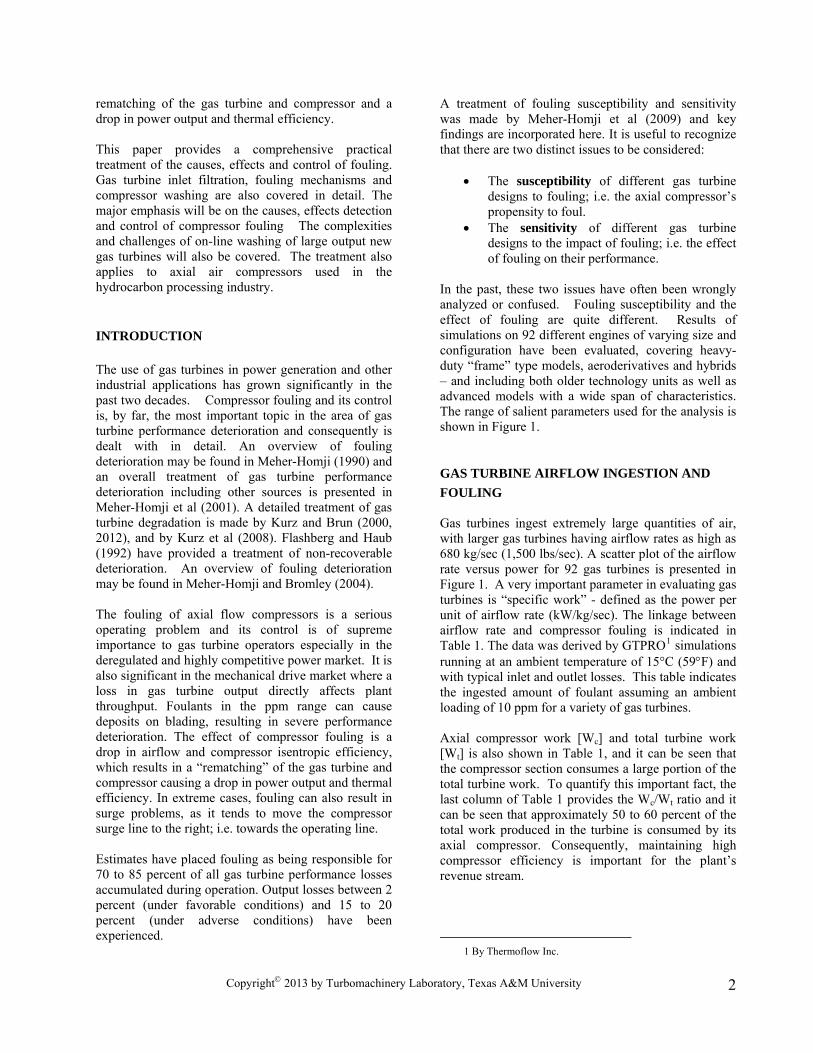
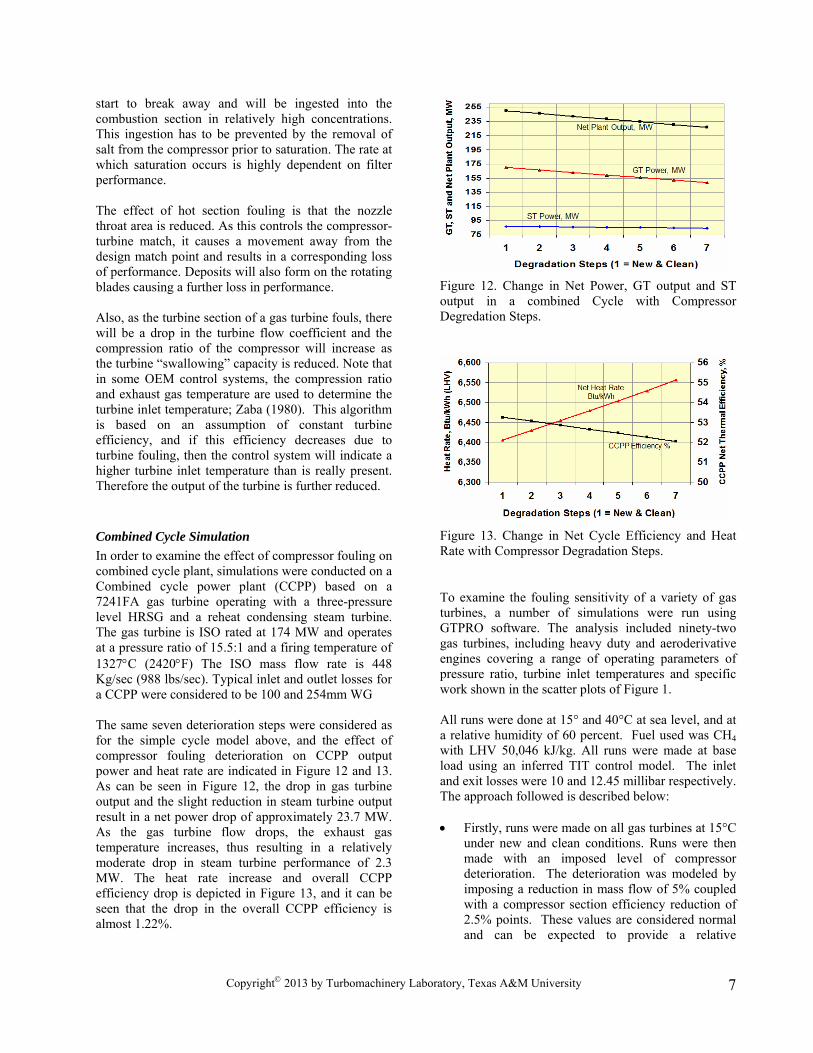
Combined Cycle Simulation In order to examine the effect of compressor fouling on combined cycle plant, simulations were conducted on a Combined cycle power plant (CCPP) based on a 7241FA gas turbine operating with a three-pressure level HRSG and a reheat condensing steam turbine. The gas turbine is ISO rated at 174 MW and operates at a pressure ratio of 15.5:1 and a firing temperature of 1327°C (2420°F) The ISO mass flow rate is 448 Kg/sec (988 lbs/sec). Typical inlet and outlet losses for a CCPP were considered to be 100 and 254mm WG The same seven deterioration steps were considered as for the simple cycle model above, and the effect of compressor fouling deterioration on CCPP output power and heat rate are indicated in Figure 12 and 13. As can be seen in Figure 12, the drop in gas turbine output and the slight reduction in steam turbine output result in a net power drop of approximately 23.7 MW. As the gas turbine flow drops, the exhaust gas temperature increases, thus resulting in a relatively moderate drop in steam turbine performance of 2.3 MW. The heat rate increase and overall CCPP efficiency drop is depicted in Figure 13, and it can be seen that the drop in the overall CCPP efficiency is almost 1.22%.
Figure 12. Change in Net Power, GT output and ST output in a combined Cycle with Compressor Degredation Steps.
Figure 13. Change in Net Cycle Efficiency and Heat Rate with Compressor Degradation Steps.
To examine the fouling sensitivity of a variety of gas turbines, a number of simulations were run using GTPRO software. The analysis included ninety-two gas turbines, including heavy duty and aeroderivative engines covering a range of operating parameters of pressure ratio, turbine inlet temperatures and specific work shown in the scatter plots of Figure 1. All runs were done at 15° and 40°C at sea level, and at a relative humidity of 60 percent. Fuel used was CH4 with LHV 50,046 kJ/kg. All runs were made at base load using an inferred TIT control model. The inlet and exit losses were 10 and 12.45 millibar respectively. The approach followed is described below: • Firstly, runs were made on all gas turbines at 15°C
under new and clean conditions. Runs were then made with an imposed level of compressor deterioration. The deterioration was modeled by imposing a reduction in mass flow of 5% coupled with a compressor section efficiency reduction of 2.5% points. These values are considered normal and can be expected to provide a relative
Copyright© 2013 by Turbomachinery Laboratory, Texas A&M University
7
comparison of the ninety-two gas turbines considered.
• Runs as defined in point (1) above were then made at an ambient temperature of 40°C to examine the impact of ambient temperature.
• All gas turbine salient operating parameters were logged into a spreadsheet for analysis.
• Using the spreadsheet, computations were then made of deterioration levels in terms of power and heat rate, and other parameters such as the temperature differential per stage and fouling factors
Key Gas Turbine Design Parameters
Key design operating parameters used to examine what correlations existed between the loss of power due to fouling included pressure ratio, specific work, and GT net work ratio (NWR). Of these, it appears that the best correlation obtained was with the GT net work ratio. (Meher-Homji, et al 2009). The NWR is defined as the useful output of the gas turbine divided by the total turbine work.
tWkWn iOutput
)Ratio (Net Work NWR =
Another way of expressing this ratio is:
t
c
t
ctWW
WWWNWR −=
−= 1
NWR requires knowledge of the turbine section total work and the work consumed in the compressor, and these are factors that are not easily available to most users.
Power, Heat Rate and Fuel Consumption Changes
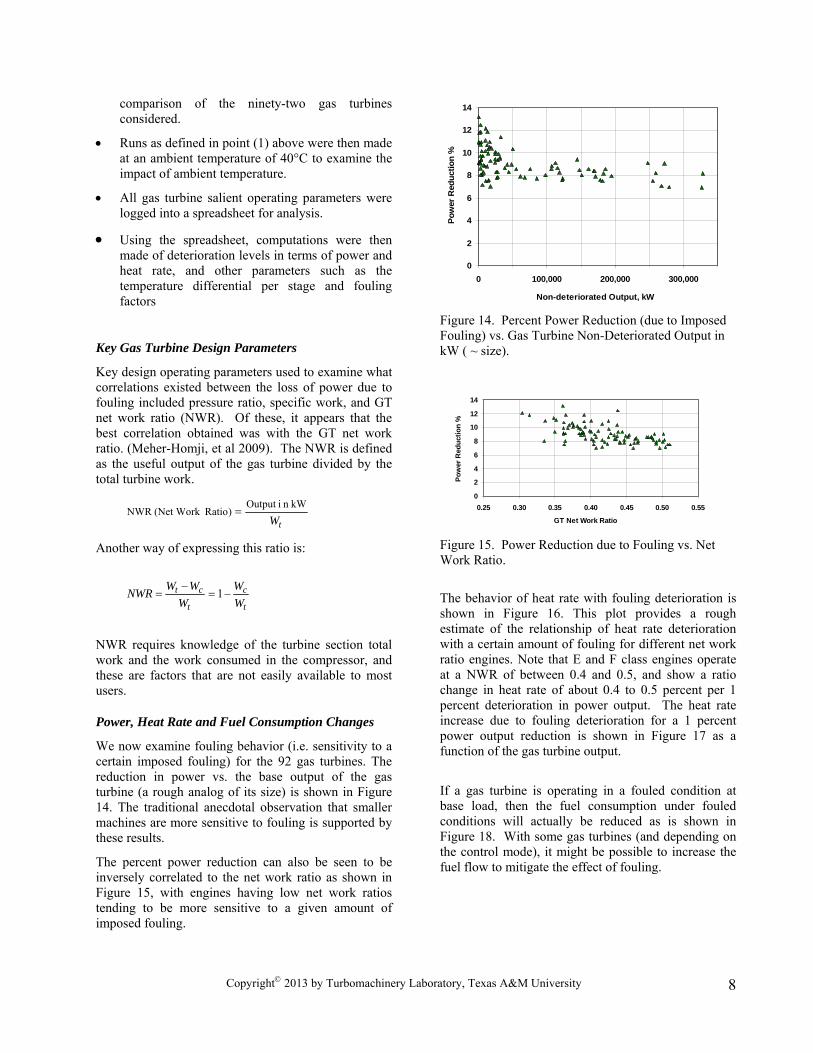
We now examine fouling behavior (i.e. sensitivity to a certain imposed fouling) for the 92 gas turbines. The reduction in power vs. the base output of the gas turbine (a rough analog of its size) is shown in Figure 14. The traditional anecdotal observation that smaller machines are more sensitive to fouling is supported by these results.
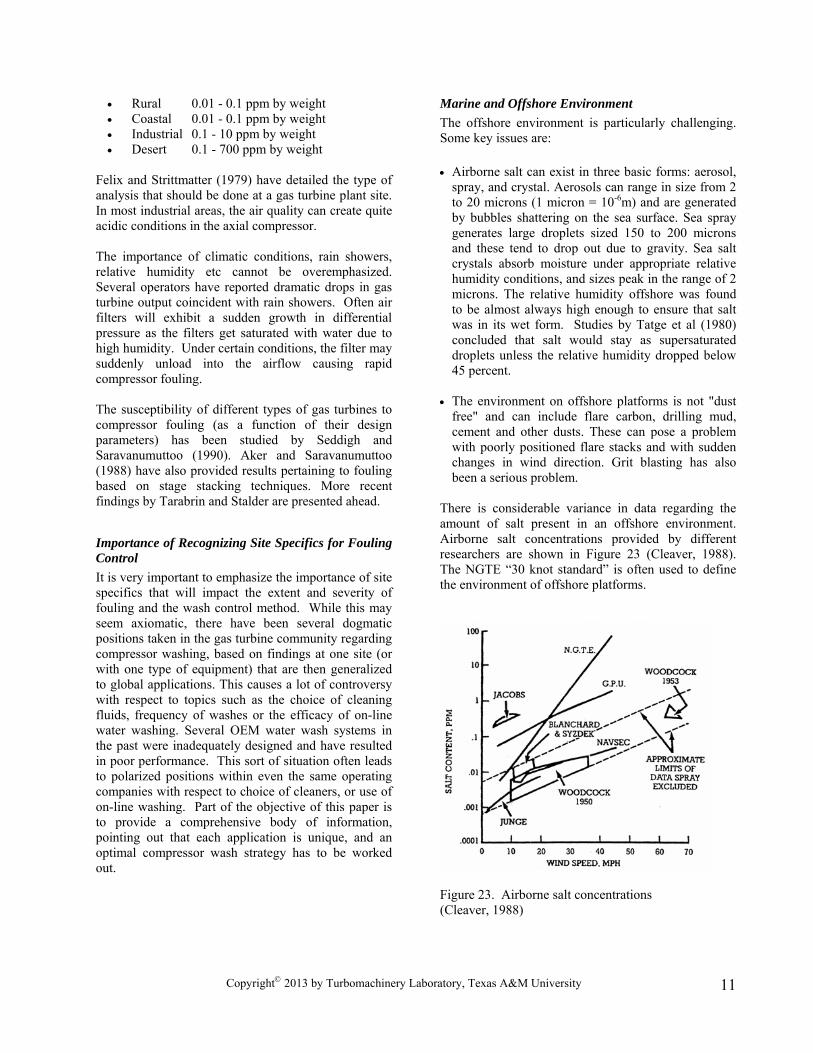
The percent power reduction can also be seen to be inversely correlated to the net work ratio as shown in Figure 15, with engines having low net work ratios tending to be more sensitive to a given amount of imposed fouling.
0
2
4
6
8
10
12
14
0 100,000 200,000 300,000
Non-deteriorated Output, kW
Pow
er R
educ
tion
%
Figure 14. Percent Power Reduction (due to Imposed Fouling) vs. Gas Turbine Non-Deteriorated Output in kW ( ~ size).
0
2
4
6
8
10
12
14
0.25 0.30 0.35 0.40 0.45 0.50 0.55
GT Net Work Ratio
Pow
er R
educ
tion
%
Figure 15. Power Reduction due to Fouling vs. Net Work Ratio.
The behavior of heat rate with fouling deterioration is shown in Figure 16. This plot provides a rough estimate of the relationship of heat rate deterioration with a certain amount of fouling for different net work ratio engines. Note that E and F class engines operate at a NWR of between 0.4 and 0.5, and show a ratio change in heat rate of about 0.4 to 0.5 percent per 1 percent deterioration in power output. The heat rate increase due to fouling deterioration for a 1 percent power output reduction is shown in Figure 17 as a function of the gas turbine output.
If a gas turbine is operating in a fouled condition at base load, then the fuel consumption under fouled conditions will actually be reduced as is shown in Figure 18. With some gas turbines (and depending on the control mode), it might be possible to increase the fuel flow to mitigate the effect of fouling.
Copyright© 2013 by Turbomachinery Laboratory, Texas A&M University
8

0.2
0.3
0.4
0.5
0.6
0.7
0.8
0.25 0.30 0.35 0.40 0.45 0.50 0.55
GT Net Work Ratio
% H
R in
c pe
r 1%
pow
er o
utpu
t los
s
Figure 16: Percent Heat Rate Increase per 1% Power Output Reduction (due to fouling) vs. Net Work Ratio.
0.2
0.3
0.4
0.5
0.6
0.7
0.8
0 100,000 200,000 300,000
Non-deteriorated output, kW
% H
R in
c pe
r 1%
pow
er o
utpu
t los
s
Figure 17. Percent Heat Rate Increase per 1% Power Output Drop with 5% Reduction in Air Mass Flow (due to fouling) vs. Gas Turbine Non-Deteriorated Output in kW (~size).
0.2
0.3
0.4
0.5
0.6
0.7
0.8
0 100,000 200,000 300,000
Non-deteriorated output, kW
% fu
el fl
ow re
duct
ion
per 1
%po
wer
out
put l
oss
Figure 18. Percent Reduction in Fuel Flow Rate per 1% Output Reduction with Fouled Operation (5% Drop in Mass Flow).
Ambient Temperature Effects
The general sensitivity of power drop with ambient temperature2 is depicted in Figure 19, in which the power drop per oC (within the range 15° to 40°C) is plotted against the design gas turbine net work ratio. This curve is without any imposed fouling degradation. As expected, as the compressor work increases as a fraction of the turbine total work, the net work ratio decreases. Thus, low net work ratio machines tend to exhibit higher sensitivity to ambient temperature swings. This is typical of aeroderivative engines, where the compressor work tends to be a higher percentage of the total turbine work.
0.0
0.2
0.4
0.6
0.8
1.0
1.2
1.4
0.25 0.30 0.35 0.40 0.45 0.50 0.55
GT Net Work Ratio %
Pow
er D
rop
/ Deg
C
Figure 19. Power Drop per °C for 92 Gas Turbines, as a Function of GT Net Work Ratio.
The power reduction with fouling deterioration vs. gas turbine net work ratio for two ambient temperatures of 15 and 40°C is shown in Figure 20. It can be seen that the effect of fouling is a function of the net work ratio and that it is also more severe at high temperatures. A similar plot showing the heat rate change is provided in Figure 21.
0
2
4
6
8
10
12
14
16
18
0.25 0.30 0.35 0.40 0.45 0.50 0.55
GT Net Work Ratio
Pow
er R
educ
tion
%
15 C40 C
Figure 20. Power Reduction with Compressor Deterioration for 92 Gas Turbines, as a Function of GT Net Work Ratio for Two Different Ambient Temperatures (15 and 40°C).
2 Commonly known as the power lapse rate.
Copyright© 2013 by Turbomachinery Laboratory, Texas A&M University
9

0
2
4
6
8
10
12
0.25 0.30 0.35 0.40 0.45 0.50 0.55
GT Net Work Ratio
% H
R in
crea
se
15 C40 C
Figure 21. Heat Rate Increase with Compressor Deterioration for 92 Gas Turbines, as a Function of GT Net Work Ratio for Two Different Ambient Temperatures (15 and 40°C).
Key Parameter Changes with Compressor Fouling A simulation was conducted on a large advanced gas turbine to demonstrate key parameter changes resulting from progressive compressor fouling. The imposed degradation steps and the resulting percentage change of key parameters are summarized in Figure 22. The simulation model assumes base load operation on natural gas at 15°C ambient temperature, and degradation step 0 represents “new and clean” conditions. Figure 22. Key Parameter Changes with Simulated Compressor Degradation Steps (Bromley, 2012).
It is important to note that the absolute fuel flow rate actually decreases with increasing levels of fouling, while the heat rate increases. In other words, less fuel is consumed due to the declining power output, but it is
consumed less efficiently. As discussed in an earlier section on the economic impact of compressor fouling, the relationship between power output, heat rate and fuel consumption should not be overlooked when calculating the net cost of degradation.
UNDERLYING CAUSES OF FOULING Experience has shown that axial compressors will foul in most operating environments; be they industrial, rural or marine. There are a wide range of industrial pollutants and a range of environmental conditions (fog, rain, humidity) that play a part in the fouling process. Compressor fouling is typically caused by:
• Airborne Salt • Industrial Pollution – hydrocarbons, fly ash,
smog, exhaust emissions from traffic etc. This causes a grimy coating on the early compressor stages and can get "baked on" in the latter stages because of the high compressor discharge temperatures (This is especially true of high pressure ratio compressors).
• Ingestion of Gas Turbine Exhaust or Lube Oil Tank Vapors.
• Mineral Deposits such as limestone, coal dust and cement dust.
• Airborne Materials - soil, dust, sand, chemical fertilizers, insecticides, and plant matter.
• Insects – This can be a serious problem in tropical environments
• Internal Gas Turbine Oil Leaks – Leakage from the front bearing of the axial compressor is a common cause. Oil leaks combined with dirt ingestion cause heavy fouling problems.
• Impure Water from Evaporative Coolers (carryover)
• Spray Paint that is ingested. • Vapor plumes from adjacent cooling towers.
Often the inlet struts and IGVs become severely fouled. Hand cleaning the IGVs and first stage will restore a considerable amount of performance. Ambient air can be contaminated by solids, liquids and gases. Air loadings can be defined in mg/m3, grains/1000 ft3 or ppm (mass of contaminant per unit mass of air). In general, particles up to 10 microns cause fouling, but not erosion. Particles above 10 to 20 microns cause blading erosion. Some typical air loadings are as follows:
Copyright© 2013 by Turbomachinery Laboratory, Texas A&M University
10
• Rural 0.01 - 0.1 ppm by weight • Coastal 0.01 - 0.1 ppm by weight • Industrial 0.1 - 10 ppm by weight • Desert 0.1 - 700 ppm by weight
Felix and Strittmatter (1979) have detailed the type of analysis that should be done at a gas turbine plant site. In most industrial areas, the air quality can create quite acidic conditions in the axial compressor. The importance of climatic conditions, rain showers, relative humidity etc cannot be overemphasized. Several operators have reported dramatic drops in gas turbine output coincident with rain showers. Often air filters will exhibit a sudden growth in differential pressure as the filters get saturated with water due to high humidity. Under certain conditions, the filter may suddenly unload into the airflow causing rapid compressor fouling. The susceptibility of different types of gas turbines to compressor fouling (as a function of their design parameters) has been studied by Seddigh and Saravanumuttoo (1990). Aker and Saravanumuttoo (1988) have also provided results pertaining to fouling based on stage stacking techniques. More recent findings by Tarabrin and Stalder are presented ahead. Importance of Recognizing Site Specifics for Fouling Control It is very important to emphasize the importance of site specifics that will impact the extent and severity of fouling and the wash control method. While this may seem axiomatic, there have been several dogmatic positions taken in the gas turbine community regarding compressor washing, based on findings at one site (or with one type of equipment) that are then generalized to global applications. This causes a lot of controversy with respect to topics such as the choice of cleaning fluids, frequency of washes or the efficacy of on-line water washing. Several OEM water wash systems in the past were inadequately designed and have resulted in poor performance. This sort of situation often leads to polarized positions within even the same operating companies with respect to choice of cleaners, or use of on-line washing. Part of the objective of this paper is to provide a comprehensive body of information, pointing out that each application is unique, and an optimal compressor wash strategy has to be worked out.
Marine and Offshore Environment The offshore environment is particularly challenging. Some key issues are: • Airborne salt can exist in three basic forms: aerosol,
spray, and crystal. Aerosols can range in size from 2 to 20 microns (1 micron = 10-6m) and are generated by bubbles shattering on the sea surface. Sea spray generates large droplets sized 150 to 200 microns and these tend to drop out due to gravity. Sea salt crystals absorb moisture under appropriate relative humidity conditions, and sizes peak in the range of 2 microns. The relative humidity offshore was found to be almost always high enough to ensure that salt was in its wet form. Studies by Tatge et al (1980) concluded that salt would stay as supersaturated droplets unless the relative humidity dropped below 45 percent.
• The environment on offshore platforms is not "dust
free" and can include flare carbon, drilling mud, cement and other dusts. These can pose a problem with poorly positioned flare stacks and with sudden changes in wind direction. Grit blasting has also been a serious problem.
There is considerable variance in data regarding the amount of salt present in an offshore environment. Airborne salt concentrations provided by different researchers are shown in Figure 23 (Cleaver, 1988). The NGTE “30 knot standard” is often used to define the environment of offshore platforms.
Figure 23. Airborne salt concentrations (Cleaver, 1988)
Copyright© 2013 by Turbomachinery Laboratory, Texas A&M University
11
FOULING DETERIORATION RATE IN AXIAL FLOW COMPRESSORS The types of foulant entering the compressor vary widely from site to site, and influences selection of wash detergent as discussed in a later section of this paper. Deposits of oil and grease are commonly found in industrial locations as a result of local emissions from refineries and petrochemical plants. These types of deposits act as “glue” and entrap other materials entering the compressor. Coastal locations usually involve the ingestion of sea salt, desert regions attract dry sand and dust particles, and a variety of fertilizer chemicals may be ingested in agricultural areas. Compressor foulants are often classified as being “oil soluble”, “water soluble” or “water wettable”, but experience has shown that they typically are a combination of these types. For example, although sea salt is essentially water soluble, its retention within the compressor may be significantly influenced by trace quantities of oil and grease. In this case, the use of water alone for washing may not be sufficient, and a chemical detergent would be required for effective compressor cleaning. The susceptibility of gas turbine axial flow compressor to fouling is controlled by the following major factors (Stalder 1998).
• Location of the plant and the environment • Atmospheric parameters • Gas turbine design parameters • Plant design and layout • Plant maintenance practices
A discussion of Fouling susceptibility and sensitivity may be found in Meher-Homji et al, 2009. In practice while design parameters may impact fouling susceptibility, the degree and efficiency of air filtration is of critical importance.
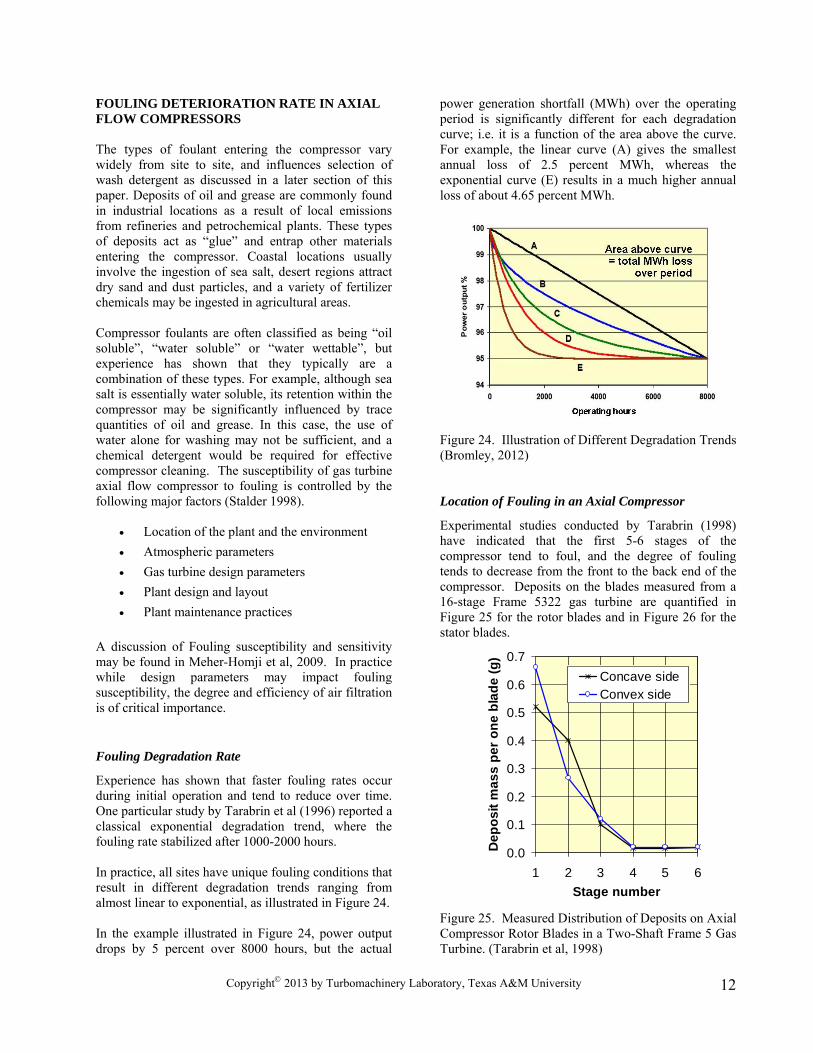
Fouling Degradation Rate Experience has shown that faster fouling rates occur during initial operation and tend to reduce over time. One particular study by Tarabrin et al (1996) reported a classical exponential degradation trend, where the fouling rate stabilized after 1000-2000 hours. In practice, all sites have unique fouling conditions that result in different degradation trends ranging from almost linear to exponential, as illustrated in Figure 24. In the example illustrated in Figure 24, power output drops by 5 percent over 8000 hours, but the actual
power generation shortfall (MWh) over the operating period is significantly different for each degradation curve; i.e. it is a function of the area above the curve. For example, the linear curve (A) gives the smallest annual loss of 2.5 percent MWh, whereas the exponential curve (E) results in a much higher annual loss of about 4.65 percent MWh. Figure 24. Illustration of Different Degradation Trends (Bromley, 2012) Location of Fouling in an Axial Compressor
Experimental studies conducted by Tarabrin (1998) have indicated that the first 5-6 stages of the compressor tend to foul, and the degree of fouling tends to decrease from the front to the back end of the compressor. Deposits on the blades measured from a 16-stage Frame 5322 gas turbine are quantified in Figure 25 for the rotor blades and in Figure 26 for the stator blades.
0.0
0.1
0.2
0.3
0.4
0.5
0.6
0.7
1 2 3 4 5 6Stage number
Dep
osit
mas
s pe
r one
bla
de (g
)
Concave sideConvex side
Figure 25. Measured Distribution of Deposits on Axial Compressor Rotor Blades in a Two-Shaft Frame 5 Gas Turbine. (Tarabrin et al, 1998)
Copyright© 2013 by Turbomachinery Laboratory, Texas A&M University
12

These figures provide the weight distribution on the convex and concave sides of the rotor and stator blades up to stage 6. An insignificant amount of deposits were noted on the seventh stage onwards.
Figure 26. Measured Distribution of Deposits on Axial Compressor Stator Blades in a Two-Shaft Frame 5 Gas Turbine. (Tarabrin et al, 1998).
Relationship between Airflow Loss Due to Fouling, Pressure Ratio and Gas Turbine Thermal Efficiency For single shaft machines, the percent change in mass flow rate due to compressor fouling and pressure ratio are approximately equal. The relationship between compressor efficiency and mass flow rate change follows the following rules according to Zaba (1980).
• Percent change in mass flow is approximately equal to the percent change in compressor efficiency if all the stages are equally fouled.
• Percent change in mass flow is greater than percent change in compressor efficiency if the early stages are fouled (this situation is most commonly found in practice). Typically, the change in mass flow rate in percent equals 1.25 times the change in compressor efficiency in percent. For example if mass flow changes 2 percent, the compressor efficiency changes by approximately 0.8 percent.
Engine Configuration and Number of Shafts
Analytical studies by Tarabrin et al (1998) examined the susceptibility of fouling based on the engine configuration. Three configurations were examined:
• Single Shaft Gas Turbines • Two Shaft Gas Turbine i.e., a gas generator and a
free power turbine • Three shaft configuration with a two shaft
compressor (LP and HP) driven by their respective HP and LP turbines and a free power turbine
0.0
0.2
0.4
0.6
0.8
1.0
1.2
1.4
IGV 1 2 3 4 5 6Stage number
Dep
osit
mas
s pe
r one
bla
de (g
)
Concave sideConvex side
For the comparative study the same thermodynamic cycle parameters of pressure ratio, airflow and ISF were used. The study examined the effect of a 1 percent drop in compressor efficiency with results being presented in Table 2 and graphically in Figure 27. The table and figure indicate changes in power (δNe), gas thermal efficiency (δηe), airflow rate (δG), pressure ratio (δΠ), and compressor speed (δN, δNLPC δNHPC).
Table 2. Coefficients of Influence of Gas Turbines with a 1 Percent Drop in Compressor Efficiency (Tarabrin et al, 1998).
Figure 27. Influence of Axial Compressor Fouling on Efficiency and Power for Different Shaft Configurations (Tarabrin, et al 1988).
For the case of constant turbine inlet temperature T3 it can be seen that the single shaft gas turbine exhibits an output drop of 2.82 percent compared to a drop in
Copyright© 2013 by Turbomachinery Laboratory, Texas A&M University
13

power for the three-shaft gas turbine of 4.32 percent. The physical explanation of this behavior is that the power match point is of a gas generator compressor, and a gas generator turbine is achieved by a greater change in air mass flow in comparison with the single shaft gas turbine. The two-shaft turbine lies between the three-shaft and single-shaft turbine in terms of power drop (power drop of 3.5 percent).
In the case of a two-shaft turbine with variable power turbine nozzles (as may be found on mechanical drive split shaft gas turbines) the compressor speed can be kept close to constant by varying the power turbine area; thus resulting in a power drop of 2.82 percent.
Simulation Runs with Compressor Degradation on Six Gas Turbines
GTPRO simulation runs assuming an ambient temperature of 15°C by imposing compressor degradation were conducted on the following available gas turbines ranging in power from 38-174 MW.
• Advanced technology high output gas turbine, single shaft configuration (designated A)
• Moderate firing temperature gas turbines, single shaft configuration (designated as B and C, with B being a scaled up version of C)
• Moderate firing temperature gas turbine, single shaft approximately half the power of C (designated D)
• Aeroderivative gas turbine with 2 compressor spools and a power turbine (designated E)
• Aeroderivative gas turbine with three compressor spools (designated F)
As before, the degradation steps imposed on these gas turbines were:
• Step 1: New and Clean, Mass flow drop = 0%, Comp. efficiency drop = 0%
• Step 2: Mass flow drop = 1%, Comp. efficiency drop = 0.833 %
• Step 3: Mass flow drop = 2%, Comp. efficiency drop = 1.67 %
• Step 4: Mass flow drop = 3%, Comp. efficiency drop = 2.5 %
• Step 5: Mass flow drop = 4 %, Comp. efficiency drop = 3.33 %
• Step 6: Mass flow drop = 5 %, Comp. efficiency drop = 4.167%
• Step 7: Mass flow drop = 6 %, Comp. efficiency drop = 5%
The following assumptions were made for all simulations:
• Fuel CH4, LHV = 50047 kJ/kg supplied at 25°C
• Gas turbines run at 100 percent rating, inferred TIT control mode, control curve limited.
• Site ambient conditions 1.013 bar, 15°C and 60% Relative Humidity.
• Inlet and outlet Losses 10 and 12.45 millibar respectively.
In order to compare the gas turbine and their response to fouling, the simulation results were normalized where “1” represents the output and efficiency at Step 1 (i.e., new and clean condition with no deterioration imposed). The results in terms of normalized power and normalized efficiency are shown in Figures 28 and 29 and seem to corroborate Tarabrin’s findings that the multi-spool machines tend to be more sensitive to fouling. It is important to note that this analysis addresses the impact on performance when simulated fouling is imposed uniformly on all six gas turbines (i.e. the sensitivity). It does not address the susceptibility to fouling of these engines.
Research conducted by Arnulfi and Massardo (1993) states that the distribution of pressure rise in the compressor is also an important determinant in fouling deterioration behavior.
0.80
0.82
0.84
0.86
0.88
0.90
0.92
0.94
0.96
0.98
1.00
1.02
1 2 3 4 5 6 7
Degradation Steps (1 = New & Clean)
BCD
A
E
F
Nor
mal
ized
Pow
er D
egra
datio
n
0.80
0.82
0.84
0.86
0.88
0.90
0.92
0.94
0.96
0.98
1.00
1.02
1 2 3 4 5 6 7
Degradation Steps (1 = New & Clean)
BCD
A
E
F
Nor
mal
ized
Pow
er D
egra
datio
n
Figure 28. Normalized Power Output Changes with Fouling Degradation Steps for Different Gas Turbine Models.
Copyright© 2013 by Turbomachinery Laboratory, Texas A&M University
14
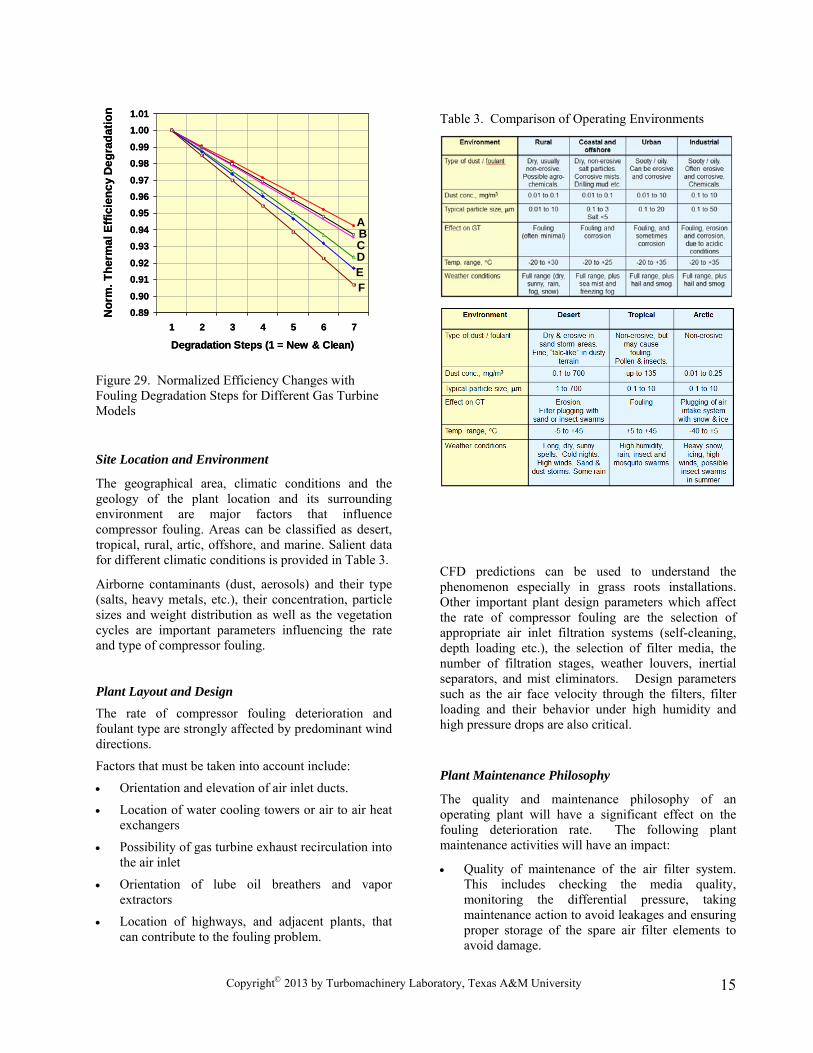
Figure 29. Normalized Efficiency Changes with Fouling Degradation Steps for Different Gas Turbine Models
Site Location and Environment
The geographical area, climatic conditions and the geology of the plant location and its surrounding environment are major factors that influence compressor fouling. Areas can be classified as desert, tropical, rural, artic, offshore, and marine. Salient data for different climatic conditions is provided in Table 3.
Airborne contaminants (dust, aerosols) and their type (salts, heavy metals, etc.), their concentration, particle sizes and weight distribution as well as the vegetation cycles are important parameters influencing the rate and type of compressor fouling.
Plant Layout and Design The rate of compressor fouling deterioration and foulant type are strongly affected by predominant wind directions.
Factors that must be taken into account include:
• Orientation and elevation of air inlet ducts.
• Location of water cooling towers or air to air heat exchangers
• Possibility of gas turbine exhaust recirculation into the air inlet
• Orientation of lube oil breathers and vapor extractors
• Location of highways, and adjacent plants, that can contribute to the fouling problem.
Table 3. Comparison of Operating Environments
0.890.90
0.910.92
0.930.94
0.950.960.97
0.980.99
1.001.01
1 2 3 4 5 6 7
Degradation Steps (1 = New & Clean)
ABCDEF
Nor
m. T
herm
al E
ffici
ency
Deg
rada
tion
0.890.90
0.910.92
0.930.94
0.950.960.97
0.980.99
1.001.01
1 2 3 4 5 6 7
Degradation Steps (1 = New & Clean)
ABCDEF
Nor
m. T
herm
al E
ffici
ency
Deg
rada
tion
CFD predictions can be used to understand the phenomenon especially in grass roots installations. Other important plant design parameters which affect the rate of compressor fouling are the selection of appropriate air inlet filtration systems (self-cleaning, depth loading etc.), the selection of filter media, the number of filtration stages, weather louvers, inertial separators, and mist eliminators. Design parameters such as the air face velocity through the filters, filter loading and their behavior under high humidity and high pressure drops are also critical.
Plant Maintenance Philosophy
The quality and maintenance philosophy of an operating plant will have a significant effect on the fouling deterioration rate. The following plant maintenance activities will have an impact:
• Quality of maintenance of the air filter system. This includes checking the media quality, monitoring the differential pressure, taking maintenance action to avoid leakages and ensuring proper storage of the spare air filter elements to avoid damage.
Copyright© 2013 by Turbomachinery Laboratory, Texas A&M University
15

• If an evaporative cooling system is present the degree of maintenance becomes even more important. Evaporative media must be checked for signs of deterioration or separation from the steel framework or loss of integrity of the mist eliminator. Unequal wetting of the media can create droplet carryover. With fogging systems, constant checks on the quality of the demineralized water must be made.
• Method of detection of fouling deterioration. This could include some form of performance monitoring or tracking of key aerothermal parameters.
• Schedule and frequency of compressor washing
• Maintenance of the gas turbine bearings and seals to prevent oil leakages into the inlet plenum.
In general a plant that is conscious of the fouling problem and the losses associated with it will adopt a maintenance schedule to manage and mitigate the problem. Unfortunately, in several mechanical drive applications the power margins that are designed into the system (excess gas turbine power over compressor absorbed power) may promote a negligent attitude towards fouling control.
Climatic Parameters Ambient temperature, relative humidity and climatic conditions such as fog and smog will strongly impact compressor fouling. The change in differential pressure in an inlet system over a day is shown in Figure 30, with the effect of fog (increase in differential pressure) being evident during the early hours of the day.
Figure 30. Filter Differential Pressure Changes with Time due to Fog in Early Morning.
In some cases, turbines have been known to trip due to excessive backpressure caused due to morning fogs. In other cases, excessive sandstorms have also been known to create high differential pressure conditions.
Correlation between Rate of Power Degradation and Atmospheric Condition
Based on various field tests and observations (Stalder, 1998), a correlation between rate of power degradation and atmospheric conditions prevailing at site has been established. Stalder’s studies included extensive testing covering eighteen months and utilizing several types of wash cycles including on-line and crank washing. The salient results are presented below. Out of 40 measured continuous operating periods (without shut-downs and start-ups), a total of 14 operating periods each between 70 to 72 hours can be directly compared in Figure 31. This graph shows the power output measurements were made at the beginning of each period after on-line washing (100 percent reference point) and at the end of each period, prior to on-line washing of the next period. One can see that there is a large spread in the power losses over such a short period, and the highest loss in performance was 3.1 percent. Interestingly, the output at the end of one period shows a gain of 0.5 percent power output. This surprising result was obtained on the same unit, with the same air inlet filtration system, the same washing nozzle system, the same washing procedure and the same detergent.
Figure 31. Power Losses over 70 Continuous Operating Hours. It is generally assumed that power losses will depend on the amount of humidity in a specific environment. With the data collected during the comparative test periods above, the total quantity of water and vapor mass flow ingested by the compressor was determined. Stalder calculated the compressor air mass flows by means of a heat balance. The average ingested total humidity (water and vapor) amounted to 7.7 tonnes/hour; i.e., a total of 548 tonnes during 70
Copyright© 2013 by Turbomachinery Laboratory, Texas A&M University
16
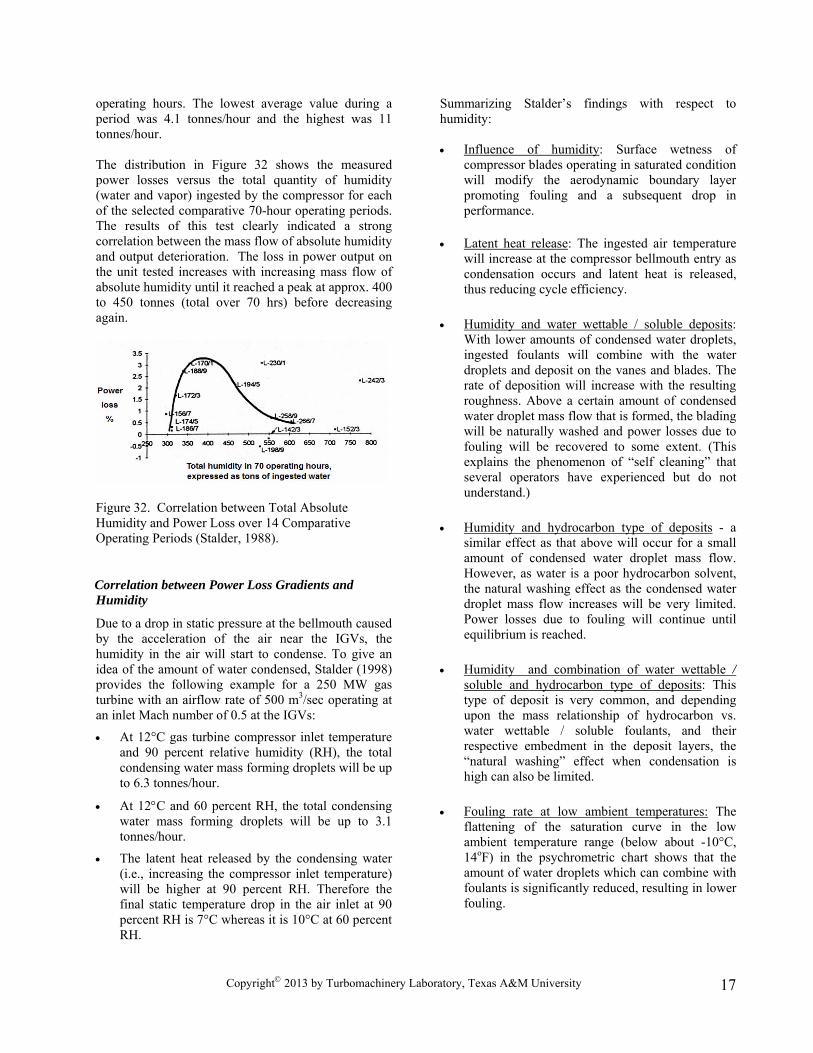
operating hours. The lowest average value during a period was 4.1 tonnes/hour and the highest was 11 tonnes/hour. The distribution in Figure 32 shows the measured power losses versus the total quantity of humidity (water and vapor) ingested by the compressor for each of the selected comparative 70-hour operating periods. The results of this test clearly indicated a strong correlation between the mass flow of absolute humidity and output deterioration. The loss in power output on the unit tested increases with increasing mass flow of absolute humidity until it reached a peak at approx. 400 to 450 tonnes (total over 70 hrs) before decreasing again.
Figure 32. Correlation between Total Absolute Humidity and Power Loss over 14 Comparative Operating Periods (Stalder, 1988).
Correlation between Power Loss Gradients and Humidity
Due to a drop in static pressure at the bellmouth caused by the acceleration of the air near the IGVs, the humidity in the air will start to condense. To give an idea of the amount of water condensed, Stalder (1998) provides the following example for a 250 MW gas turbine with an airflow rate of 500 m3/sec operating at an inlet Mach number of 0.5 at the IGVs:
• At 12°C gas turbine compressor inlet temperature and 90 percent relative humidity (RH), the total condensing water mass forming droplets will be up to 6.3 tonnes/hour.
• At 12°C and 60 percent RH, the total condensing water mass forming droplets will be up to 3.1 tonnes/hour.
• The latent heat released by the condensing water (i.e., increasing the compressor inlet temperature) will be higher at 90 percent RH. Therefore the final static temperature drop in the air inlet at 90 percent RH is 7°C whereas it is 10°C at 60 percent RH.
Summarizing Stalder’s findings with respect to humidity: • Influence of humidity: Surface wetness of
compressor blades operating in saturated condition will modify the aerodynamic boundary layer promoting fouling and a subsequent drop in performance.
• Latent heat release: The ingested air temperature
will increase at the compressor bellmouth entry as condensation occurs and latent heat is released, thus reducing cycle efficiency.
• Humidity and water wettable / soluble deposits:
With lower amounts of condensed water droplets, ingested foulants will combine with the water droplets and deposit on the vanes and blades. The rate of deposition will increase with the resulting roughness. Above a certain amount of condensed water droplet mass flow that is formed, the blading will be naturally washed and power losses due to fouling will be recovered to some extent. (This explains the phenomenon of “self cleaning” that several operators have experienced but do not understand.)
• Humidity and hydrocarbon type of deposits - a
similar effect as that above will occur for a small amount of condensed water droplet mass flow. However, as water is a poor hydrocarbon solvent, the natural washing effect as the condensed water droplet mass flow increases will be very limited. Power losses due to fouling will continue until equilibrium is reached.
• Humidity and combination of water wettable /
soluble and hydrocarbon type of deposits: This type of deposit is very common, and depending upon the mass relationship of hydrocarbon vs. water wettable / soluble foulants, and their respective embedment in the deposit layers, the “natural washing” effect when condensation is high can also be limited.
• Fouling rate at low ambient temperatures: The
flattening of the saturation curve in the low ambient temperature range (below about -10°C, 14oF) in the psychrometric chart shows that the amount of water droplets which can combine with foulants is significantly reduced, resulting in lower fouling.
Copyright© 2013 by Turbomachinery Laboratory, Texas A&M University
17
• Duration and sequence of operation in a saturated condition: The changes in rate of power losses noticed over a given operating period will be strongly influenced by the duration and sequences of operation under saturated high humidity conditions (vs. a dryer condition).
Humidity Effects on the Fouling Of Axial Compressors As air passes through the intake and filtration system, it proceeds at a very low velocity with filter face velocities being typically around 3 m/sec. As it approaches the compressor face, the air accelerates to a high velocity (0.5 - 0.8 Mach number). This results in a static temperature reduction of about 10 to 15°C. The saturation air temperature also drops. If the relative humidity is high enough, it is possible that the static air temperature falls below the saturation air temperature. This causes condensation of water vapor, which is a common occurrence in most gas turbines when ambient relative humidity is high. The process is depicted in Figure 33 (Zaba, 1984). In this figure, Tas is the static air temperature, Ts is the saturation air temperature and γ the relative humidity. Three values of relative humidity are shown (40, 60 and 80 percent). As can be seen in this figure, when the relative humidity is 60 percent, the air temperature Tas is lower than the saturation temperature (in the shaded region of the figure), resulting in condensation of the water vapor.
Figure 33. Intake Temperature Depression and Condensation (Zaba, 1984). Filters tend to unload salt (leeching effect) under high ambient humidity conditions and this is a factor that is often neglected. It is this factor that causes the sudden fouling of compressors during periods of ambient fog.
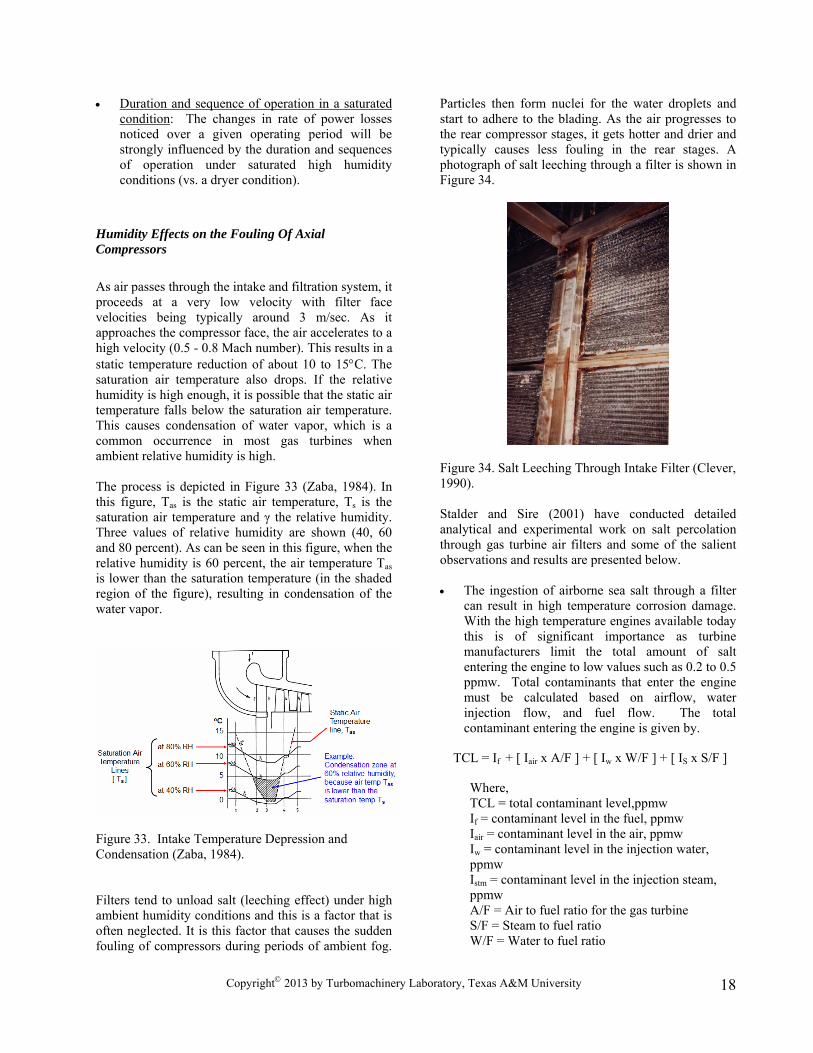
Particles then form nuclei for the water droplets and start to adhere to the blading. As the air progresses to the rear compressor stages, it gets hotter and drier and typically causes less fouling in the rear stages. A photograph of salt leeching through a filter is shown in Figure 34.
Figure 34. Salt Leeching Through Intake Filter (Clever, 1990). Stalder and Sire (2001) have conducted detailed analytical and experimental work on salt percolation through gas turbine air filters and some of the salient observations and results are presented below. • The ingestion of airborne sea salt through a filter
can result in high temperature corrosion damage. With the high temperature engines available today this is of significant importance as turbine manufacturers limit the total amount of salt entering the engine to low values such as 0.2 to 0.5 ppmw. Total contaminants that enter the engine must be calculated based on airflow, water injection flow, and fuel flow. The total contaminant entering the engine is given by.
TCL = If + [ Iair x A/F ] + [ Iw x W/F ] + [ IS x S/F ]
Where, TCL = total contaminant level,ppmw If = contaminant level in the fuel, ppmw Iair = contaminant level in the air, ppmw Iw = contaminant level in the injection water, ppmw Istm = contaminant level in the injection steam, ppmw A/F = Air to fuel ratio for the gas turbine S/F = Steam to fuel ratio W/F = Water to fuel ratio
Copyright© 2013 by Turbomachinery Laboratory, Texas A&M University
18
• With regards to limits of airborne contaminants,
the following example is provided: Natural gas contaminated with salt at a sodium concentration of 0.1 ppm and airborne salt contamination of 5 ppb, will result in an equivalent fuel Na content of 0.35 ppm – assuming an air to fuel ratio of 50. Specific OEM requirements should be considered, as this is dependant on blade metallurgy, coating technology and cooling approach. The performance of filters in limiting ingress of salt is therefore extremely important.
• Studies performed on used filters indicate that percolation of salt laden water can occur in both surface and depth loading type of filters. The mechanism is supported by the presence of dissolved acid gases (SOx and NOx) found in industrial environments.
• The large area of the air filter media may also act as a reaction site for various chemical processes and reactions. The real challenge is to determine the efficiency of the media under real life operational conditions where aggressive gases may exist in the environment.
• Optimal selection of filter media is of supreme importance and the system must be tailored to climatic conditions.
• Good filtration must be coupled with a carefully planned on-line and off-line washing regime to minimize salt deposits on compressor airfoils.
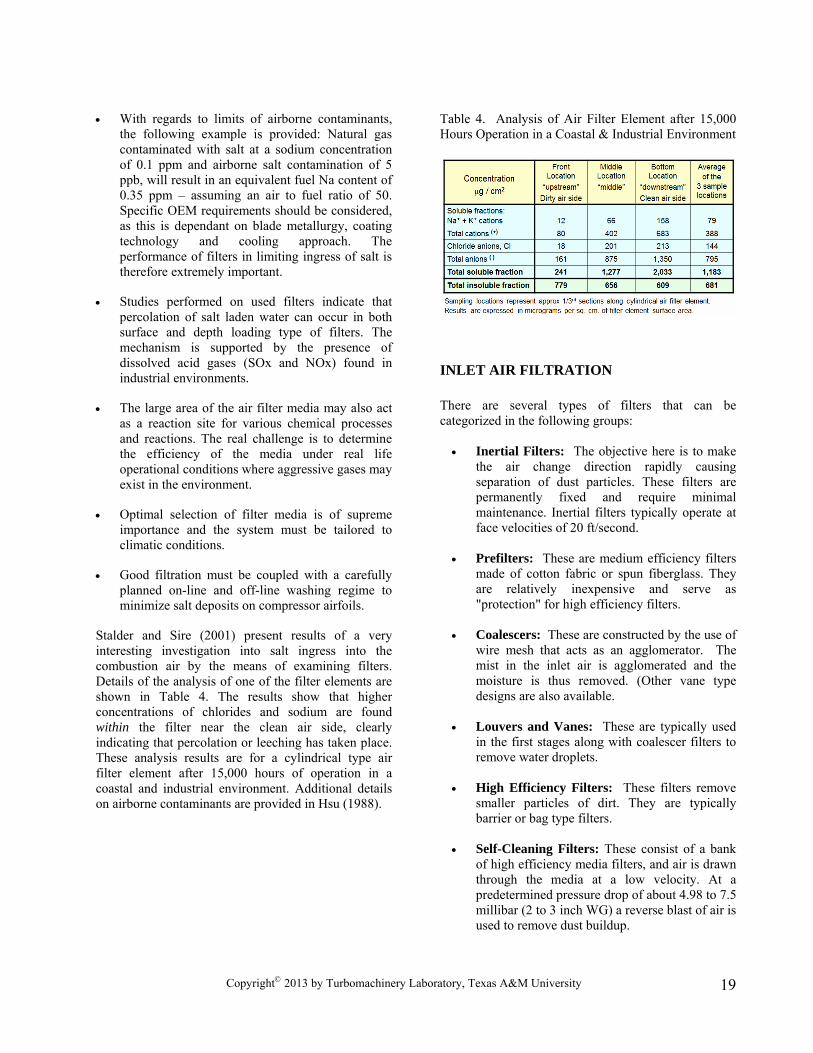
Stalder and Sire (2001) present results of a very interesting investigation into salt ingress into the combustion air by the means of examining filters. Details of the analysis of one of the filter elements are shown in Table 4. The results show that higher concentrations of chlorides and sodium are found within the filter near the clean air side, clearly indicating that percolation or leeching has taken place. These analysis results are for a cylindrical type air filter element after 15,000 hours of operation in a coastal and industrial environment. Additional details on airborne contaminants are provided in Hsu (1988).
Table 4. Analysis of Air Filter Element after 15,000 Hours Operation in a Coastal & Industrial Environment
INLET AIR FILTRATION There are several types of filters that can be categorized in the following groups:
• Inertial Filters: The objective here is to make the air change direction rapidly causing separation of dust particles. These filters are permanently fixed and require minimal maintenance. Inertial filters typically operate at face velocities of 20 ft/second.
• Prefilters: These are medium efficiency filters
made of cotton fabric or spun fiberglass. They are relatively inexpensive and serve as "protection" for high efficiency filters.
• Coalescers: These are constructed by the use of
wire mesh that acts as an agglomerator. The mist in the inlet air is agglomerated and the moisture is thus removed. (Other vane type designs are also available.
• Louvers and Vanes: These are typically used
in the first stages along with coalescer filters to remove water droplets.
• High Efficiency Filters: These filters remove
smaller particles of dirt. They are typically barrier or bag type filters.
• Self-Cleaning Filters: These consist of a bank
of high efficiency media filters, and air is drawn through the media at a low velocity. At a predetermined pressure drop of about 4.98 to 7.5 millibar (2 to 3 inch WG) a reverse blast of air is used to remove dust buildup.
Copyright© 2013 by Turbomachinery Laboratory, Texas A&M University
19

Goulding et. al (1990) have provided a detailed treatment of the technical considerations in the selection of gas turbine filters. Details of offshore platform filtration systems are provided in Kimm and Langlands (1985) and Schweiger (1983). Zaba and Lombardi (1984) have detailed experiences with different types of filters.
Practical Aspects Relating to Air Filter System Integrity Air tightness is a must for any gas turbine inlet system as even the most efficient filtration system will be useless if unfiltered airflow leaks in and enters the compressor. Some common causes of leakage are:
• Bypass door leakage • Poor gaskets and seals at flanges • Modifications made on the inlet ducting. Over
the years, personnel may add structures or devices to the inlet system that may cause problems.
Some important considerations in intake filter design are:
• Aerodynamic design should be such as to keep
intake velocities uniform across the entire filter area.
• The filter housing should be of a bolted and
welded design fabricated of steel no less than 4.76 mm (3/16") thick and reinforced by steel members. The filter house should withstand 30 millibar (12 inch WG) pressure. All seams and joints should be airtight. All nuts and bolts used inside the clean air plenum should be welded after assembly to prevent air leaks and foreign object damage to the turbine.
• Design should facilitate change-out of all filters
from the upstream side. Filter change should be possible without turbine shutdown. Filter elements should be designed for quick change-out, avoidance of blind assembly and loose retaining nuts, un-gasketed washers etc.
• The filter design should ensure that the inlet air
is drawn at least 3 meters (10 feet) above grade level. In some locations a greater height may be required.
• A stainless steel trash screen with 25.4 mm (1
inch) square mesh should be provided in the
transition section between the clean air plenum and the compressor intake.
• Avoid the use of gravity weighted by-pass
doors. Bypass doors are designed to permit emergency airflow to the engine when intake pressure drop rises above a critical value. Bypass doors are typically gravity operated or power operated. The gravity type has earned a reputation for unreliability. Poor sealing, hinge corrosion and improper operation have made the bypass door a weak link in inlet filter design.
• All filter seal points should be reviewed during
the design phase. Poor intake sealing has allowed leaks through bypass doors, access doors and flanges on the intake filter. In several situations, flange distortion has allowed air ingress. Users should specify types of seals required and call for a filter house integrity test under specified depression to ensure air tightness.
• System design in the case of pulsed cleaning
systems should be such as to minimize flow distortions and pressure pulsations due to pulse cleaning. More than 5 percent of the total filter elements should not be cleaned simultaneously.
• Filter system pressure drop is an important
parameter affecting gas turbine performance. It is important to consider both new filter pressure drop and the pressure drop increase over time.
Filter House Design and Corrosion Experience has shown that stainless steel (316L) construction is by far the most sensible approach especially in offshore and coastal areas. The life cycle costs when one considers the constant painting that has to be done to carbon steel filter systems, is several times the small incremental first cost increase for the use of SS 316L construction. It is indeed unfortunate that the desire to minimize first cost often results in filter systems that cause great harm to the project in term of gas turbine deterioration, and even subsequent damage that can be caused by severe rusting and other distress over the project life cycle. A highly corroded floor of an inlet filter is shown in Figure 35.
Copyright© 2013 by Turbomachinery Laboratory, Texas A&M University
20

Figure 35. Corroded Floor of Inlet Duct (Clever, 1988). Corrosion of inlet systems is widespread especially when they are made of carbon steel. Corrosion of the filter house downstream of the filters totally defeats the purpose of having air filtration. Painted carbon steel structures need constant painting and often, poor application of paint and other problems involving dissimilar materials start the corrosion process only weeks after the painting is completed. Proper painting requires the use of shot blasting to fully clean the parent surface prior to the painting process. Modern technology has allowed the use of high performance SS 316L systems that include relatively light elements, and which are very effective against driving rain and high humidity. These filter systems use special high velocity vane separators that have proven very effective for offshore applications. The choice of material is also very important as SS 304 or 321 steels do not have sufficient corrosion protection. The presence of Chromium (up to 18.5 percent) in SS 316L helps to build a passive protective film of oxide and prevents corrosion. Along with the 10-14 percent Nickel content, 316L can be easily welded. In offshore and hostile environments, it is best to have all the system components (including vane separators and door hinges) made of 316L stainless steel. Proper attention must also be paid to drain systems to enable water to be removed from the system. An excellent treatment of air filtration is made by Cleaver (1990). Details regarding the testing of gas turbine air filters are provided in Gidley et al (1993).
Filter System Pressure Drop The effect of high pressure drop in the inlet filter system is a reduction in the inlet density and mass flow of the gas turbine and a reduction in the turbine section expansion ratio. The effect of inlet system pressure drop is provided for a Frame 5 gas turbine in Table 5. Salient cycle conditions for the engine are provided for inlet pressure drops of 0 through 12.54 millibar (0 to 5 inches W.G). As the inlet system differential pressure increases, the pressure to the turbine section drops and results in a lower expansion ratio and an increase in the EGT. A power drop of 0.4 percent per inch of WG differential pressure and a heat rate increase of 0.19 percent per inch of WG differential pressure emphasizes the importance of this parameter. Table 5. Impact of Inlet Filter Differential Pressure on a Frame 5 Gas Turbine
EFFECTS OF FOULING ON GAS TURBINE OPERATION AND MAINTENANCE Aerothermodynamic Effects of Compressor Fouling The observable effect of compressor fouling is a drop in thermal efficiency (increase in heat rate) and a drop in output. The axial flow compressor is a sensitive component that requires smooth aerodynamic surfaces. Fouling causes an alteration in the shape and profile of the blading (increased surface blade roughness), and this reduces air flow rate, pressure ratio (of the overall compressor) and compressor efficiency. Modeling details may be found in Lakshminarasimha et al (1994) and Tabakoff (1988).
Copyright© 2013 by Turbomachinery Laboratory, Texas A&M University
21
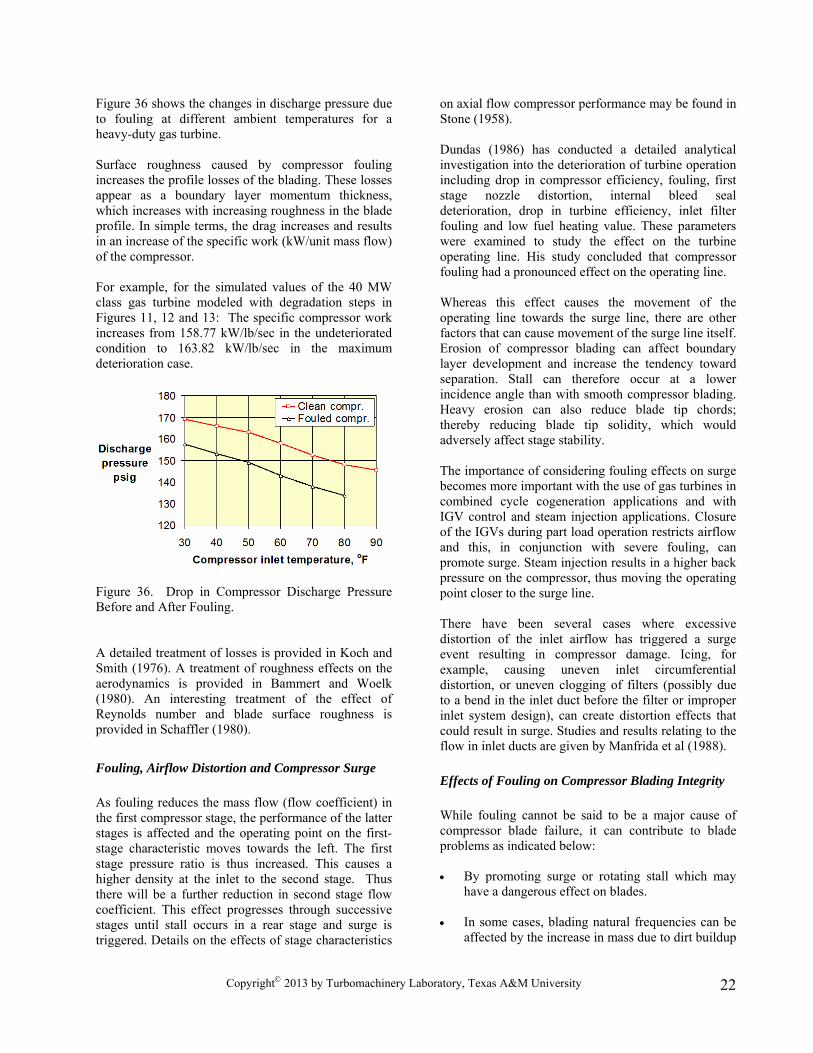
Figure 36 shows the changes in discharge pressure due to fouling at different ambient temperatures for a heavy-duty gas turbine. Surface roughness caused by compressor fouling increases the profile losses of the blading. These losses appear as a boundary layer momentum thickness, which increases with increasing roughness in the blade profile. In simple terms, the drag increases and results in an increase of the specific work (kW/unit mass flow) of the compressor. For example, for the simulated values of the 40 MW class gas turbine modeled with degradation steps in Figures 11, 12 and 13: The specific compressor work increases from 158.77 kW/lb/sec in the undeteriorated condition to 163.82 kW/lb/sec in the maximum deterioration case.
Figure 36. Drop in Compressor Discharge Pressure Before and After Fouling. A detailed treatment of losses is provided in Koch and Smith (1976). A treatment of roughness effects on the aerodynamics is provided in Bammert and Woelk (1980). An interesting treatment of the effect of Reynolds number and blade surface roughness is provided in Schaffler (1980).
Fouling, Airflow Distortion and Compressor Surge As fouling reduces the mass flow (flow coefficient) in the first compressor stage, the performance of the latter stages is affected and the operating point on the first-stage characteristic moves towards the left. The first stage pressure ratio is thus increased. This causes a higher density at the inlet to the second stage. Thus there will be a further reduction in second stage flow coefficient. This effect progresses through successive stages until stall occurs in a rear stage and surge is triggered. Details on the effects of stage characteristics
on axial flow compressor performance may be found in Stone (1958).
Dundas (1986) has conducted a detailed analytical investigation into the deterioration of turbine operation including drop in compressor efficiency, fouling, first stage nozzle distortion, internal bleed seal deterioration, drop in turbine efficiency, inlet filter fouling and low fuel heating value. These parameters were examined to study the effect on the turbine operating line. His study concluded that compressor fouling had a pronounced effect on the operating line. Whereas this effect causes the movement of the operating line towards the surge line, there are other factors that can cause movement of the surge line itself. Erosion of compressor blading can affect boundary layer development and increase the tendency toward separation. Stall can therefore occur at a lower incidence angle than with smooth compressor blading. Heavy erosion can also reduce blade tip chords; thereby reducing blade tip solidity, which would adversely affect stage stability. The importance of considering fouling effects on surge becomes more important with the use of gas turbines in combined cycle cogeneration applications and with IGV control and steam injection applications. Closure of the IGVs during part load operation restricts airflow and this, in conjunction with severe fouling, can promote surge. Steam injection results in a higher back pressure on the compressor, thus moving the operating point closer to the surge line. There have been several cases where excessive distortion of the inlet airflow has triggered a surge event resulting in compressor damage. Icing, for example, causing uneven inlet circumferential distortion, or uneven clogging of filters (possibly due to a bend in the inlet duct before the filter or improper inlet system design), can create distortion effects that could result in surge. Studies and results relating to the flow in inlet ducts are given by Manfrida et al (1988). Effects of Fouling on Compressor Blading Integrity While fouling cannot be said to be a major cause of compressor blade failure, it can contribute to blade problems as indicated below: • By promoting surge or rotating stall which may
have a dangerous effect on blades. • In some cases, blading natural frequencies can be
affected by the increase in mass due to dirt buildup
Copyright© 2013 by Turbomachinery Laboratory, Texas A&M University
22
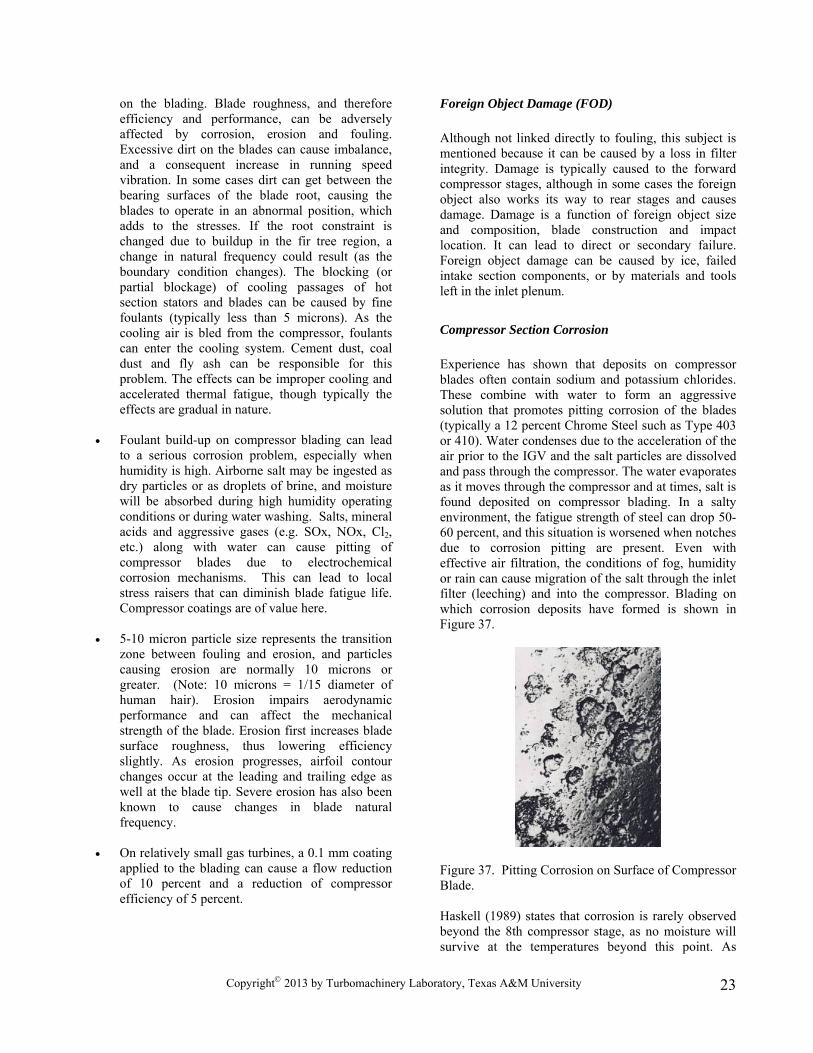
on the blading. Blade roughness, and therefore efficiency and performance, can be adversely affected by corrosion, erosion and fouling. Excessive dirt on the blades can cause imbalance, and a consequent increase in running speed vibration. In some cases dirt can get between the bearing surfaces of the blade root, causing the blades to operate in an abnormal position, which adds to the stresses. If the root constraint is changed due to buildup in the fir tree region, a change in natural frequency could result (as the boundary condition changes). The blocking (or partial blockage) of cooling passages of hot section stators and blades can be caused by fine foulants (typically less than 5 microns). As the cooling air is bled from the compressor, foulants can enter the cooling system. Cement dust, coal dust and fly ash can be responsible for this problem. The effects can be improper cooling and accelerated thermal fatigue, though typically the effects are gradual in nature.
• Foulant build-up on compressor blading can lead
to a serious corrosion problem, especially when humidity is high. Airborne salt may be ingested as dry particles or as droplets of brine, and moisture will be absorbed during high humidity operating conditions or during water washing. Salts, mineral acids and aggressive gases (e.g. SOx, NOx, Cl2, etc.) along with water can cause pitting of compressor blades due to electrochemical corrosion mechanisms. This can lead to local stress raisers that can diminish blade fatigue life. Compressor coatings are of value here.
• 5-10 micron particle size represents the transition
zone between fouling and erosion, and particles causing erosion are normally 10 microns or greater. (Note: 10 microns = 1/15 diameter of human hair). Erosion impairs aerodynamic performance and can affect the mechanical strength of the blade. Erosion first increases blade surface roughness, thus lowering efficiency slightly. As erosion progresses, airfoil contour changes occur at the leading and trailing edge as well at the blade tip. Severe erosion has also been known to cause changes in blade natural frequency.
• On relatively small gas turbines, a 0.1 mm coating
applied to the blading can cause a flow reduction of 10 percent and a reduction of compressor efficiency of 5 percent.
Foreign Object Damage (FOD) Although not linked directly to fouling, this subject is mentioned because it can be caused by a loss in filter integrity. Damage is typically caused to the forward compressor stages, although in some cases the foreign object also works its way to rear stages and causes damage. Damage is a function of foreign object size and composition, blade construction and impact location. It can lead to direct or secondary failure. Foreign object damage can be caused by ice, failed intake section components, or by materials and tools left in the inlet plenum.
Compressor Section Corrosion Experience has shown that deposits on compressor blades often contain sodium and potassium chlorides. These combine with water to form an aggressive solution that promotes pitting corrosion of the blades (typically a 12 percent Chrome Steel such as Type 403 or 410). Water condenses due to the acceleration of the air prior to the IGV and the salt particles are dissolved and pass through the compressor. The water evaporates as it moves through the compressor and at times, salt is found deposited on compressor blading. In a salty environment, the fatigue strength of steel can drop 50-60 percent, and this situation is worsened when notches due to corrosion pitting are present. Even with effective air filtration, the conditions of fog, humidity or rain can cause migration of the salt through the inlet filter (leeching) and into the compressor. Blading on which corrosion deposits have formed is shown in Figure 37.
Figure 37. Pitting Corrosion on Surface of Compressor Blade. Haskell (1989) states that corrosion is rarely observed beyond the 8th compressor stage, as no moisture will survive at the temperatures beyond this point. As
Copyright© 2013 by Turbomachinery Laboratory, Texas A&M University
23

shown in Table 6, sulfur dioxide [SO2] and hydrochloric acid [HCl] can create very acidic conditions on the compressor blading, even in the parts per billion concentration range. This situation is acute in heavy industrial areas or close to chemical manufacturing plants. Furthermore, even moderate relative humidity conditions of about 50 percent will result in water formation at the compressor inlet due to the intake temperature depression. A detailed treatment of gas turbine blade failures including underlying causes and troubleshooting is provided in Meher-Homji and Gabriles (1998). Table 6. Effect of Ambient Gases on Acidity at the Compressor Inlet (based on Haskell, 1989).
DETECTION OF FOULING Gas turbine manufacturers and operators usually develop guidelines to define when fouling deterioration calls for corrective action. This is based on a combination of load and exhaust gas temperatures (EGT). Users also monitor compressor discharge pressure and compressor efficiency. Graphs can be plotted to show expected (clean) versus measured parameters. However, it is the opinion of some operators that the only way to detect a fouled compressor is by visual inspection. Unfortunately, though, with most turbine designs this means shutting down the unit, removing the inlet plenum hatch and visually inspecting the compressor inlet, bellmouth inlet guide vane (IGVs) and visible early stage blading. The following factors can be used as indicators of fouling:
• Drop in power output for given ambient temperature and corrected speed.
• Drop in compressor mass flow rate on fixed geometry engines.
• Drop in compressor efficiency and pressure ratio (or discharge pressure).
The most sensitive parameter of the above factors is the mass flow rate. The real problem is to detect fouling in time to prevent a significant power drop, and before a fuel penalty cost has been incurred. Several philosophies are in use. Some operators believe in regular periodic washing of the machine, whereas others base the washing requirement on a certain set of performance parameters. The philosophy utilized is a function of normally expected fouling levels, its severity, washing effectiveness and plant operation criteria. Measurement of air-intake depression is a practical and economical method for fixed geometry machines. The technique involves measuring intake depression as an analog of airflow rate. In this approach, the gas turbine inlet bellmouth is utilized as a flow meter. This approach has been successfully used by Scott (1979, 1986). By means of suitable software, data available in the gas turbine control system can often be used to monitor compressor deterioration. The set of graphs taken on a Frame 7EA gas turbine engine (Dusatko, 1995) show the correlations very clearly. In Figure 38, the general relationship between compressor discharge pressure (CDP) vs. compressor inlet temperature (CIT) can be seen. This data was taken over several hundred hours of operating data at full load conditions. The rule of thumb derived from this figure is that a 0.138 bar (2 psig) loss of compressor discharge pressure is equivalent to one gross MW of power for these particular Frame 7EA gas turbine engines. The effect of a crank wash on the CDP vs. CIT plot is shown in this figure.
Figure 38. Scatter Plot Showing Effect of Crank Wash on Compressor Discharge Pressure vs Compressor Inlet Temperature
Copyright© 2013 by Turbomachinery Laboratory, Texas A&M University
24
A common approach to trend gas turbine output is to use a power capacity factor defined as Power Capacity Factor = MWActual/MW Expected The MW expected is the corrected “new and clean” performance test output, which is typically 3-5 percent higher than the “guarantee” output. Corrections should be made for
• Inlet temperature • Inlet pressure • Specific humidity • NOx water injection rates • Inlet and outlet Pressure drops • Speed corrections (this is not a major issue for
power generation applications with single shaft gas turbines unless significant off frequency operation is experienced. This happens in some countries due to grid “under-frequency” problems).
A baseline development process and the use of scatter plots for deterioration analysis of advanced F class turbines is provided in Meher-Homji et al (1993).
Mapping of Compressor Performance to Monitor Deterioration It is very valuable to monitor compressor performance by creating a compressor map and comparing the performance behavior to the predicted characteristics. Corrected speed and flow are the best correlating parameters as they allow variations in ambient temperature and pressure drop through an inlet filter to be incorporated on the map. The corrected speed represents the wheel tangential mach number whereas the corrected flow represents the through-flow mac number. Practical details of monitoring of compressoperformance from a standpoint of detecting problems are provided in Dundas (1982, 1992).
hr Several different methods of gas turbine compressor
cleaning have been applied over the years, but “wet cleaning” has been found to be by far the most effective and economic technique. However, today's sophisticated large industrial engines and blade coatings require appropriately designed cleaning systems to ensure operational safety, reliability and optimum efficiency. Two different wet cleaning techniques are generally applied, known as off-line (crank wash) and on-line cleaning. Under extreme fouling conditions, hand washing of the IGVs may have to be conducted if time permits. During overhauls, hand cleaning of the full axial compressor is most effective.
Once a judicious schedule for on-line and off-line washing has been established, it is important to monitor the performance of the gas turbine and track for unexpected events and monitor the efficacy of washing. It is important that all parameters be monitored and appropriate corrections made using corrected speeds, temperatures and flows that can then be trended. For aeroderivative engines the control approach must be taken into account (i.e. speed or temperature control). For aeroderivatives with multip e
compressor spools, the interrelationship between the corrected LP and HP compressor spool speeds can provide a valuable indicator of compressor deterioration. Special performance monitoring considerations when operating at peak loads are provided in Syverud et al (2003).
l
CONTROL OF FOULING BY COMPRESSOR WASHING Fouling is best controlled by a combination of two methods. The first line of defense is to employ a high quality air filtration system. However, as fouling will inevitably occur, compressor washing should be used to control its impact. Compressor washing is an area in which strong and divergent opinions exist. Washing efficacy is so site specific that approaches which work for one site may not be appropriate for another. Controversy is often caused by polarized opinions relating to wash procedures, wash media, and techniques. Some of the highlights are presented below in an attempt to present the overall picture and the practical field experiences of Stalder (1998). Operators must determine the best approach for their gas turbines by trial and error in terms of wash technique, use of on-line washing, which cleaners should be used, and the frequency of washing. This is a complex technical-economical scenario, and also depends on the service that the gas turbines are in. For example, by not having the ability to shut down for crank washes, IPP operators and merchant power plants may need to be more aggressive in controlling fouling. A useful set of papers relating to compressor washing have been provided in Stalder (1998), Stalder and van Oosten (1994) and Bagshaw (1974).
Copyright© 2013 by Turbomachinery Laboratory, Texas A&M University
25

Off-line washing is almost always carried out with the aid of a detergent, and extremely effective power recovery can usually be achieved. However, it is important that the manufacturer's recommendations are followed with respect to water quality, detergent/water ratio and other operating procedures. Typically, wheel space temperatures must be below 93°C (200°F) to avoid thermal shock, and the off-line water wash is done with the machine on crank. The downtime for a crank wash depends mainly on the time it takes for cooling the engine. Larger heavy-duty engines can take 8 to 10 hours to cool whereas on light aeroderivative engines only 1.5 to 3 hours may be needed because of the low metal mass. Off-line cleaning is most effective when carried out in several steps that involve the application of a soap and water solution, followed by several rinse cycles using water alone. Each rinse cycle involves the acceleration of the machine to approximately 50 percent of the starting speed, after which the machine is allowed to coast to a stop. A soaking period between each wash and rinse cycle is also very important, and allows the soapy cleaning fluid to penetrate into the fouling deposits, thus dissolving salts and emulsifying oil and grease components. A useful method of determining the effectiveness of the off-line wash, and perhaps the need for additional wash or rinse cycles, is to collect samples of the effluent water from all available drain ports. The samples can be checked visually for color and clarity (which should improve as dirt is removed), or by a simple conductivity meter to monitor the removal of salts. On-line washing is now very popular as a means to control fouling by avoiding the problem from developing. The primary objective of on-line washing is to extend the operating period between off-line washes by minimizing the build-up of deposits in the compressor, and thereby reducing the on-going incremental power losses. On-line washing is performed with the unit in full operation, and techniques and wash systems have now evolved to a point where this can be done effectively and safely. Outages or shutdown periods are not required. Depending on the nature of the fouling material, on-line washing is sometimes performed with water alone. In most cases, however, the use of an approved cleaner (detergent) will improve the effectiveness of the washing operation. This is particularly true if the fouling material contains any quantity of oil or grease. Demineralized water quality is almost always specified by the OEMs for on-line washing, to avoid the possibility of introducing harmful trace metal contaminants (such as Na+K) into the combustion turbine.
Optimal compressor cleaning can normally be achieved by adopting a combined program of regular and routine on-line washing (for example every few days or weekly), plus periodic off-line washing during planned outages. Two main types of cleaning agents (detergents) are available for compressor washing and are normally classified as “water-based” or “solvent-based” products. Most of the new-generation products contain surfactants, wetting agents and emulsifiers, and involve either an aqueous or petroleum-based solvent system. Both type products are normally supplied as concentrates, and are diluted on-site with water (typically 1 part cleaner with 4 parts water) to produce the cleaning fluid. Solvent-based cleaners have traditionally been recognized as being more effective in removing oil and grease deposits, but certain new-generation water-based cleaners are formulated to be equally effective. Most water-based products also have the advantage of being biodegradable, which is an increasingly important requirement within this industry. A comparative summary between on-line and off-line cleaning is provided in Table 7. Table 7. Comparison between Off-Line and On-Line Washing.
OFF-LINE (CRANK) WASHING
The basic objectives of off-line cleaning are to clean a dirty compressor and to restore power and efficiency to virtually “new & clean” values. When performed correctly, and provided the operating period between off-line washing is not too long (site specific), this type of cleaning will typically restore virtually 100 percent of the lost power and efficiency attributed to compressor fouling. However, irrespective of the
Copyright© 2013 by Turbomachinery Laboratory, Texas A&M University
26

compressor performance degradation actually encountered, experience has indicated that users of both base load and peaking gas turbines should incorporate a minimum of three or four off-line compressor cleanings per year in order to remove the salt laden deposits on the downstream stages.
Off-line wet cleaning (also known as crank washing) is a typical "soak and rinse" procedure for which the gas turbine must be shut down and cooled. The compressor is rotated at crank-speed while a cleaning fluid is injected via nozzles or jet lances. Hand-held jet lances were widely used in the past and are still fairly popular with some operators. However, permanently mounted off-line nozzle systems installed in the air intake plenum are now preferred, and are generally offered as standard by most of the major turbine manufacturers. Nozzle design, system operating pressure and total mass flow parameters vary widely, however, between the different manufacturers.
The injected cleaning fluid is normally a mixture of
chemical detergent and water. Both solvent-based detergents and water-based products are used, depending mainly on the type of fouling material found in the compressor and local plant experience.
After a soaking period the compressor is rinsed with a quantity of fresh water. The amount of rinse water required and the number of rinse cycles varies from site to site, according to the gas turbine model and the amount of dirt removed during the off-line wash. Note that demineralized water is usually not specified for off-line cleaning and fresh water quality is normally acceptable. Effluent water drained from the compressor has to be disposed of according to local regulations. Typical water quality requirements for an off-line wash are: • Total solids (dissolved & undissolved) ≤100 ppm • Total alkali metals (Na, K) ≤ 25 ppm • Other metals which may promote hot corrosion
(V, Pb) ≤ 1 ppm • pH 6.5-7.5 This water would be used for cleaner dilution and also for rinsing. Off-line crank washing systems should be designed to achieve the highest washing efficiency with the smallest injection mass flow. This is important for the following reasons: . • Gas Turbine users are interested in minimizing the
quantity of effluent water to be disposed of.
• Some users claim that off-line water effluent is
transported up to the exhaust during the wash procedure, and may wet and soak into the expansion joint fabric - resulting in damage of the expansion joint by lowering its insulation properties.
• A lower off-line injection mass flow will also
reduce the potential risk of trace metal contamination in exhaust systems, where selective catalytic reactors (SCR) for NOx reduction or CO catalysts are installed.
• A smaller off-line injection mass flow will
significantly reduce the required size, volume and cost of washing skids, as well as the overall water and cleaner consumption.
Important Considerations During Off Line Washing Wetting of IGVs: Effective wetting of the IGV’s suction area can be achieved by using full cone jet spray nozzles. The number of nozzles will be defined by the area to be wetted, which is usually the area between two intake struts. The necessary off-line injection mass flow characteristic will therefore be determined by the area to be wetted and impacted by the jet spray, and the distance between nozzles and the IGVs. The injection pressure is generally between 5.5 to 6 bar (80 to 87 psi). As spray jet trajectory is subject to gravity, the nozzle should be designed to provide an adjustment of up to five degrees to compensate for the gravity effect. Crank washing (soaking) and rinsing can be considered as a mechanical “erosion” of the deposit layer, and soaking time will allow the cleaner to penetrate and soften the deposit layers. Systems with high atomization pressure will have no impact pressure on the IGVs, because the spray pressure will have decayed approx. 20 cm from the nozzle outlet, and the atomized droplets will need to be carried by the relatively low air flow rate produced at crank speed. Most high-pressure systems do not show the same effectiveness in removing salts and insoluble compounds on downstream stages. Typical location of wash nozzles for both on-line and off-line systems is shown in Figure 39.
Copyright© 2013 by Turbomachinery Laboratory, Texas A&M University
27
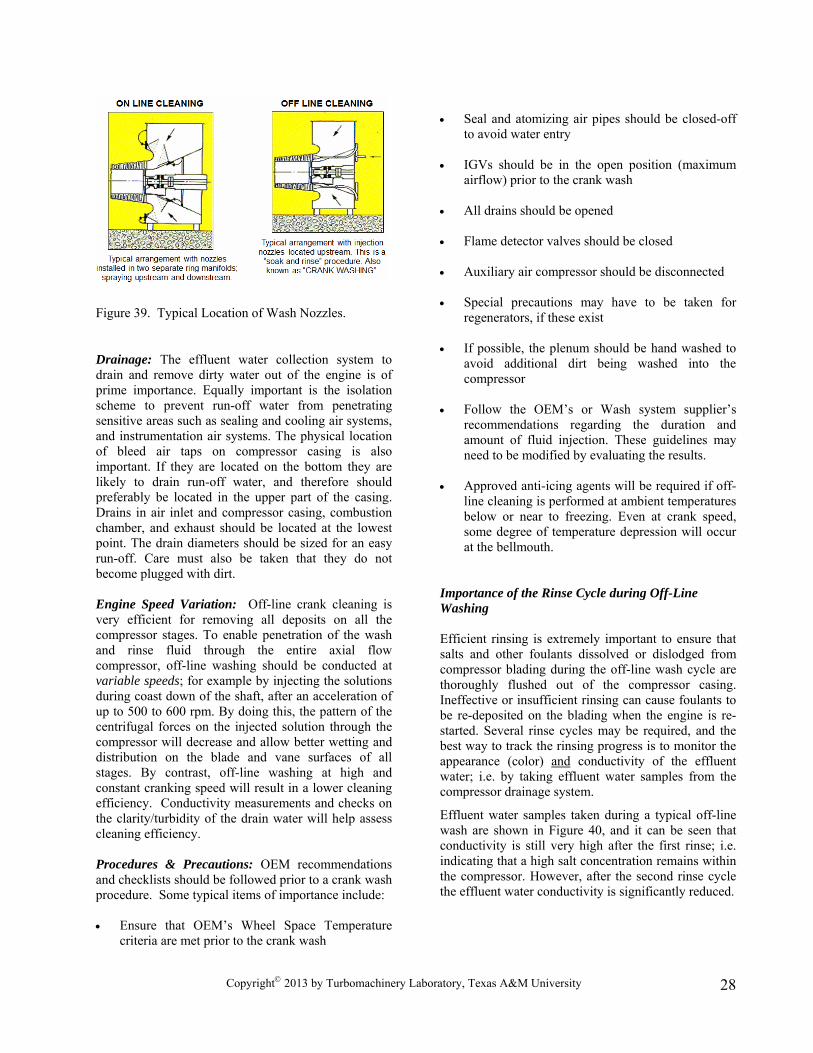
Figure 39. Typical Location of Wash Nozzles.
Drainage: The effluent water collection system to drain and remove dirty water out of the engine is of prime importance. Equally important is the isolation scheme to prevent run-off water from penetrating sensitive areas such as sealing and cooling air systems, and instrumentation air systems. The physical location of bleed air taps on compressor casing is also important. If they are located on the bottom they are likely to drain run-off water, and therefore should preferably be located in the upper part of the casing. Drains in air inlet and compressor casing, combustion chamber, and exhaust should be located at the lowest point. The drain diameters should be sized for an easy run-off. Care must also be taken that they do not become plugged with dirt. Engine Speed Variation: Off-line crank cleaning is very efficient for removing all deposits on all the compressor stages. To enable penetration of the wash and rinse fluid through the entire axial flow compressor, off-line washing should be conducted at variable speeds; for example by injecting the solutions during coast down of the shaft, after an acceleration of up to 500 to 600 rpm. By doing this, the pattern of the centrifugal forces on the injected solution through the compressor will decrease and allow better wetting and distribution on the blade and vane surfaces of all stages. By contrast, off-line washing at high and constant cranking speed will result in a lower cleaning efficiency. Conductivity measurements and checks on the clarity/turbidity of the drain water will help assess cleaning efficiency. Procedures & Precautions: OEM recommendations and checklists should be followed prior to a crank wash procedure. Some typical items of importance include: • Ensure that OEM’s Wheel Space Temperature
criteria are met prior to the crank wash
• Seal and atomizing air pipes should be closed-off
to avoid water entry • IGVs should be in the open position (maximum
airflow) prior to the crank wash • All drains should be opened • Flame detector valves should be closed • Auxiliary air compressor should be disconnected • Special precautions may have to be taken for
regenerators, if these exist • If possible, the plenum should be hand washed to
avoid additional dirt being washed into the compressor
• Follow the OEM’s or Wash system supplier’s
recommendations regarding the duration and amount of fluid injection. These guidelines may need to be modified by evaluating the results.
• Approved anti-icing agents will be required if off-
line cleaning is performed at ambient temperatures below or near to freezing. Even at crank speed, some degree of temperature depression will occur at the bellmouth.
Importance of the Rinse Cycle during Off-Line Washing Efficient rinsing is extremely important to ensure that salts and other foulants dissolved or dislodged from compressor blading during the off-line wash cycle are thoroughly flushed out of the compressor casing. Ineffective or insufficient rinsing can cause foulants to be re-deposited on the blading when the engine is re-started. Several rinse cycles may be required, and the best way to track the rinsing progress is to monitor the appearance (color) and conductivity of the effluent water; i.e. by taking effluent water samples from the compressor drainage system.
Effluent water samples taken during a typical off-line wash are shown in Figure 40, and it can be seen that conductivity is still very high after the first rinse; i.e. indicating that a high salt concentration remains within the compressor. However, after the second rinse cycle the effluent water conductivity is significantly reduced.
Copyright© 2013 by Turbomachinery Laboratory, Texas A&M University
28
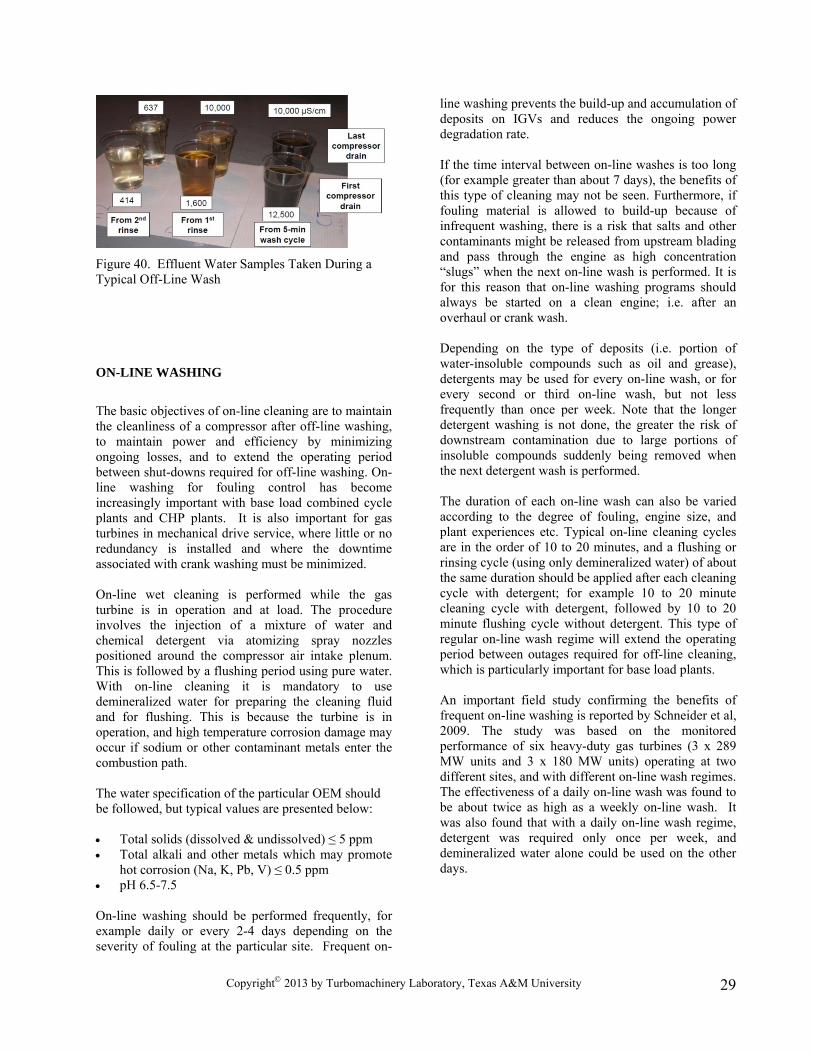
Figure 40. Effluent Water Samples Taken During a Typical Off-Line Wash
ON-LINE WASHING
The basic objectives of on-line cleaning are to maintain the cleanliness of a compressor after off-line washing, to maintain power and efficiency by minimizing ongoing losses, and to extend the operating period between shut-downs required for off-line washing. On-line washing for fouling control has become increasingly important with base load combined cycle plants and CHP plants. It is also important for gas turbines in mechanical drive service, where little or no redundancy is installed and where the downtime associated with crank washing must be minimized.
On-line wet cleaning is performed while the gas
turbine is in operation and at load. The procedure involves the injection of a mixture of water and chemical detergent via atomizing spray nozzles positioned around the compressor air intake plenum. This is followed by a flushing period using pure water. With on-line cleaning it is mandatory to use demineralized water for preparing the cleaning fluid and for flushing. This is because the turbine is in operation, and high temperature corrosion damage may occur if sodium or other contaminant metals enter the combustion path.
The water specification of the particular OEM should be followed, but typical values are presented below: • Total solids (dissolved & undissolved) ≤ 5 ppm • Total alkali and other metals which may promote
hot corrosion (Na, K, Pb, V) ≤ 0.5 ppm • pH 6.5-7.5 On-line washing should be performed frequently, for example daily or every 2-4 days depending on the severity of fouling at the particular site. Frequent on-
line washing prevents the build-up and accumulation of deposits on IGVs and reduces the ongoing power degradation rate. If the time interval between on-line washes is too long (for example greater than about 7 days), the benefits of this type of cleaning may not be seen. Furthermore, if fouling material is allowed to build-up because of infrequent washing, there is a risk that salts and other contaminants might be released from upstream blading and pass through the engine as high concentration “slugs” when the next on-line wash is performed. It is for this reason that on-line washing programs should always be started on a clean engine; i.e. after an overhaul or crank wash. Depending on the type of deposits (i.e. portion of water-insoluble compounds such as oil and grease), detergents may be used for every on-line wash, or for every second or third on-line wash, but not less frequently than once per week. Note that the longer detergent washing is not done, the greater the risk of downstream contamination due to large portions of insoluble compounds suddenly being removed when the next detergent wash is performed. The duration of each on-line wash can also be varied according to the degree of fouling, engine size, and plant experiences etc. Typical on-line cleaning cycles are in the order of 10 to 20 minutes, and a flushing or rinsing cycle (using only demineralized water) of about the same duration should be applied after each cleaning cycle with detergent; for example 10 to 20 minute cleaning cycle with detergent, followed by 10 to 20 minute flushing cycle without detergent. This type of regular on-line wash regime will extend the operating period between outages required for off-line cleaning, which is particularly important for base load plants. An important field study confirming the benefits of frequent on-line washing is reported by Schneider et al, 2009. The study was based on the monitored performance of six heavy-duty gas turbines (3 x 289 MW units and 3 x 180 MW units) operating at two different sites, and with different on-line wash regimes. The effectiveness of a daily on-line wash was found to be about twice as high as a weekly on-line wash. It was also found that with a daily on-line wash regime, detergent was required only once per week, and demineralized water alone could be used on the other days.
Copyright© 2013 by Turbomachinery Laboratory, Texas A&M University
29
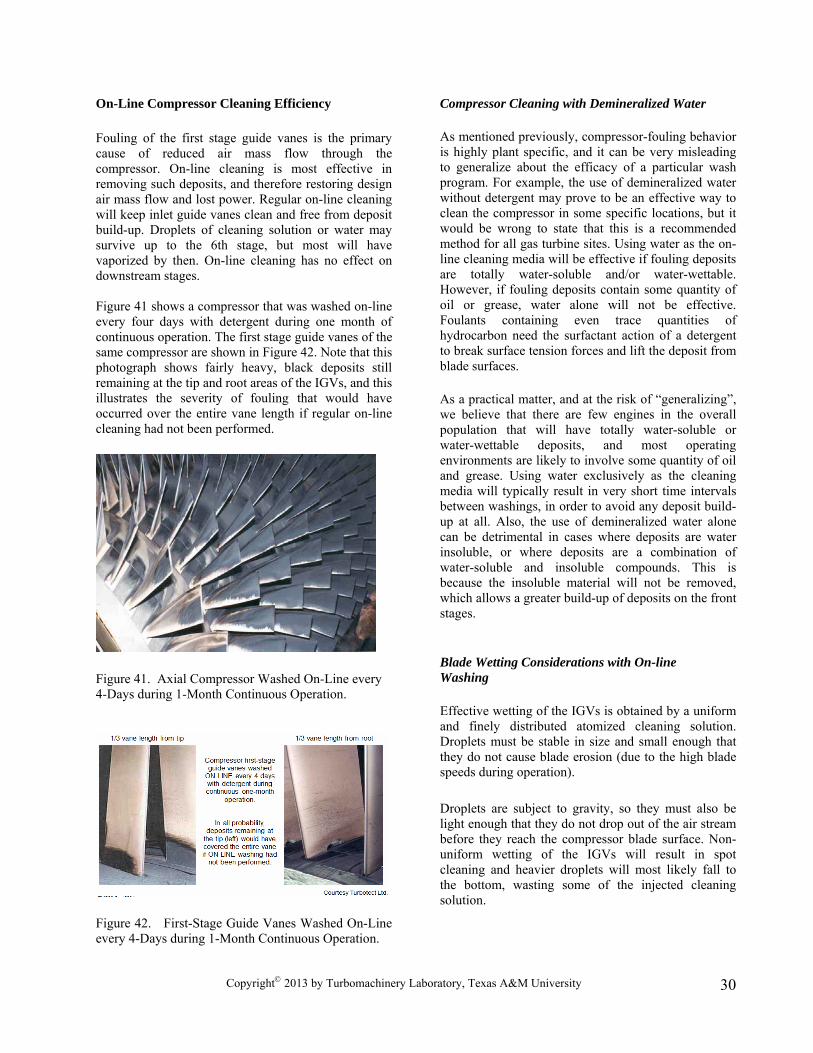
On-Line Compressor Cleaning Efficiency Fouling of the first stage guide vanes is the primary cause of reduced air mass flow through the compressor. On-line cleaning is most effective in removing such deposits, and therefore restoring design air mass flow and lost power. Regular on-line cleaning will keep inlet guide vanes clean and free from deposit build-up. Droplets of cleaning solution or water may survive up to the 6th stage, but most will have vaporized by then. On-line cleaning has no effect on downstream stages. Figure 41 shows a compressor that was washed on-line every four days with detergent during one month of continuous operation. The first stage guide vanes of the same compressor are shown in Figure 42. Note that this photograph shows fairly heavy, black deposits still remaining at the tip and root areas of the IGVs, and this illustrates the severity of fouling that would have occurred over the entire vane length if regular on-line cleaning had not been performed.
Figure 41. Axial Compressor Washed On-Line every 4-Days during 1-Month Continuous Operation.
Figure 42. First-Stage Guide Vanes Washed On-Line every 4-Days during 1-Month Continuous Operation.
Compressor Cleaning with Demineralized Water As mentioned previously, compressor-fouling behavior is highly plant specific, and it can be very misleading to generalize about the efficacy of a particular wash program. For example, the use of demineralized water without detergent may prove to be an effective way to clean the compressor in some specific locations, but it would be wrong to state that this is a recommended method for all gas turbine sites. Using water as the on-line cleaning media will be effective if fouling deposits are totally water-soluble and/or water-wettable. However, if fouling deposits contain some quantity of oil or grease, water alone will not be effective. Foulants containing even trace quantities of hydrocarbon need the surfactant action of a detergent to break surface tension forces and lift the deposit from blade surfaces. As a practical matter, and at the risk of “generalizing”, we believe that there are few engines in the overall population that will have totally water-soluble or water-wettable deposits, and most operating environments are likely to involve some quantity of oil and grease. Using water exclusively as the cleaning media will typically result in very short time intervals between washings, in order to avoid any deposit build-up at all. Also, the use of demineralized water alone can be detrimental in cases where deposits are water insoluble, or where deposits are a combination of water-soluble and insoluble compounds. This is because the insoluble material will not be removed, which allows a greater build-up of deposits on the front stages. Blade Wetting Considerations with On-line Washing Effective wetting of the IGVs is obtained by a uniform and finely distributed atomized cleaning solution. Droplets must be stable in size and small enough that they do not cause blade erosion (due to the high blade speeds during operation). Droplets are subject to gravity, so they must also be light enough that they do not drop out of the air stream before they reach the compressor blade surface. Non-uniform wetting of the IGVs will result in spot cleaning and heavier droplets will most likely fall to the bottom, wasting some of the injected cleaning solution.
Copyright© 2013 by Turbomachinery Laboratory, Texas A&M University
30
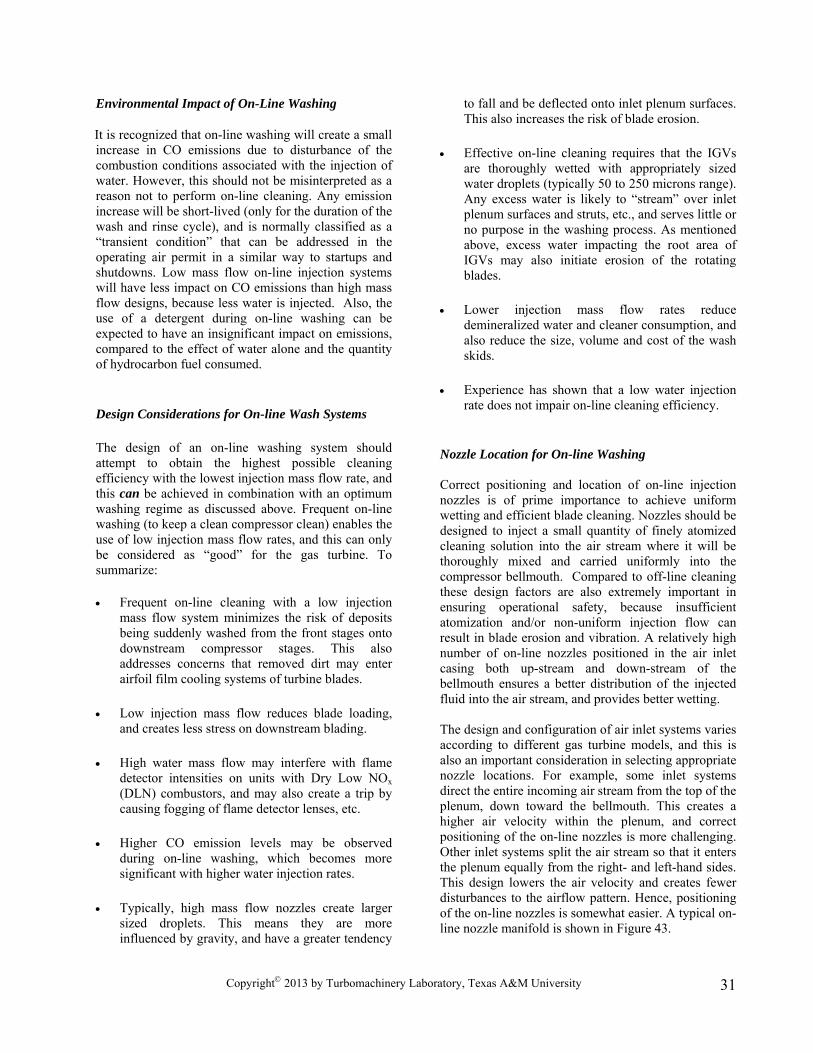
Environmental Impact of On-Line Washing
It is recognized that on-line washing will create a small increase in CO emissions due to disturbance of the combustion conditions associated with the injection of water. However, this should not be misinterpreted as a reason not to perform on-line cleaning. Any emission increase will be short-lived (only for the duration of the wash and rinse cycle), and is normally classified as a “transient condition” that can be addressed in the operating air permit in a similar way to startups and shutdowns. Low mass flow on-line injection systems will have less impact on CO emissions than high mass flow designs, because less water is injected. Also, the use of a detergent during on-line washing can be expected to have an insignificant impact on emissions, compared to the effect of water alone and the quantity of hydrocarbon fuel consumed. Design Considerations for On-line Wash Systems The design of an on-line washing system should attempt to obtain the highest possible cleaning efficiency with the lowest injection mass flow rate, and this can be achieved in combination with an optimum washing regime as discussed above. Frequent on-line washing (to keep a clean compressor clean) enables the use of low injection mass flow rates, and this can only be considered as “good” for the gas turbine. To summarize: • Frequent on-line cleaning with a low injection
mass flow system minimizes the risk of deposits being suddenly washed from the front stages onto downstream compressor stages. This also addresses concerns that removed dirt may enter airfoil film cooling systems of turbine blades.
• Low injection mass flow reduces blade loading,
and creates less stress on downstream blading. • High water mass flow may interfere with flame
detector intensities on units with Dry Low NOx (DLN) combustors, and may also create a trip by causing fogging of flame detector lenses, etc.
• Higher CO emission levels may be observed
during on-line washing, which becomes more significant with higher water injection rates.
• Typically, high mass flow nozzles create larger
sized droplets. This means they are more influenced by gravity, and have a greater tendency
to fall and be deflected onto inlet plenum surfaces. This also increases the risk of blade erosion.
• Effective on-line cleaning requires that the IGVs
are thoroughly wetted with appropriately sized water droplets (typically 50 to 250 microns range). Any excess water is likely to “stream” over inlet plenum surfaces and struts, etc., and serves little or no purpose in the washing process. As mentioned above, excess water impacting the root area of IGVs may also initiate erosion of the rotating blades.
• Lower injection mass flow rates reduce
demineralized water and cleaner consumption, and also reduce the size, volume and cost of the wash skids.
• Experience has shown that a low water injection
rate does not impair on-line cleaning efficiency. Nozzle Location for On-line Washing Correct positioning and location of on-line injection nozzles is of prime importance to achieve uniform wetting and efficient blade cleaning. Nozzles should be designed to inject a small quantity of finely atomized cleaning solution into the air stream where it will be thoroughly mixed and carried uniformly into the compressor bellmouth. Compared to off-line cleaning these design factors are also extremely important in ensuring operational safety, because insufficient atomization and/or non-uniform injection flow can result in blade erosion and vibration. A relatively high number of on-line nozzles positioned in the air inlet casing both up-stream and down-stream of the bellmouth ensures a better distribution of the injected fluid into the air stream, and provides better wetting. The design and configuration of air inlet systems varies according to different gas turbine models, and this is also an important consideration in selecting appropriate nozzle locations. For example, some inlet systems direct the entire incoming air stream from the top of the plenum, down toward the bellmouth. This creates a higher air velocity within the plenum, and correct positioning of the on-line nozzles is more challenging. Other inlet systems split the air stream so that it enters the plenum equally from the right- and left-hand sides. This design lowers the air velocity and creates fewer disturbances to the airflow pattern. Hence, positioning of the on-line nozzles is somewhat easier. A typical on-line nozzle manifold is shown in Figure 43.
Copyright© 2013 by Turbomachinery Laboratory, Texas A&M University
31

Figure 43. Photograph of On-Line Nozzle Manifold (courtesy of Turbotect Ltd.)
Nozzle Designs for On-Line Washing The on-line injection nozzle is the most critical component in the washing system, and its design determines the overall effectiveness of the cleaning process. Important issues such as nozzle location, injected mass flow, wash frequency and the use of detergent etc. can be rendered immaterial if the installed nozzles do not perform. A nozzle is essentially an atomizing device, and they are designed to create droplets in a certain size range and with a specific spray profile. However, in order to achieve the design droplet size and spray pattern, the nozzle must be operated at its design flow rate and operating pressure. Changing the design parameters of a particular nozzle will affect its spray characteristics. For example, droplet size will usually increase by reducing operating pressure below the design point. Many different types and designs of on-line injection nozzle are used within this industry; some are available directly from the gas turbine OEMs and others are manufactured and marketed by independent suppliers. Design differences between the various types of nozzles are quite significant, and this results in a wide range of mass flow rates, operating pressures, spray patterns, droplet size ranges and, not surprisingly, performance characteristics. However, accepting that different design philosophies do exist (and probably will continue to exist), there is fairly common agreement within the industry that on-line droplet size should be within the range 50 to 250 microns. If droplets are too small they are easily deflected by the air stream, and may not survive to perform wetting of the IGVs. If droplets are too large they are more influenced by gravity, and tend to fall toward the lower
surfaces of the inlet plenum. Large sized droplets are also more likely to cause erosion problems. General design factors for on-line wash nozzle systems are as follows: • Nozzles must provide excellent atomization
characteristics, and create a stable distribution of droplets within the recommended size range 50 to 250 microns.
• Nozzles should be positioned to enable uniform wetting of the IGVs. (Note that high mass flow designs can create too much spray that collects and “streams” on plenum surfaces).
• A sufficient number of nozzles must be installed to provide the required total mass flow for the particular gas turbine model.
• Flush-mounted, low profile nozzle designs create less disturbance to the air flow.
• All components must be corrosion resistant (stainless steel) and designed for maximum safety.
• The system should be easy to install on new units and on retrofits.
• The system should be operated at its design flow rate and pressure.
Figure 44 shows one particular design of on-line nozzle that is adjustable, and can be rotated in two dimensions to optimize the spray direction. This nozzle is a low pressure, low mass flow design, and produces a 90 degree cone-shaped spray pattern. The nozzle’s low profile ensures minimal penetration into the air stream to avoid airflow disturbance and vibration. It also prevents misuse of the nozzles as climbing supports during compressor intake inspections.
Figure 44. Adjustable On-Line Injection Nozzle, for Flush-Mounting in the Air Inlet Plenum (courtesy of Turbotect Ltd.). .
Copyright© 2013 by Turbomachinery Laboratory, Texas A&M University
32
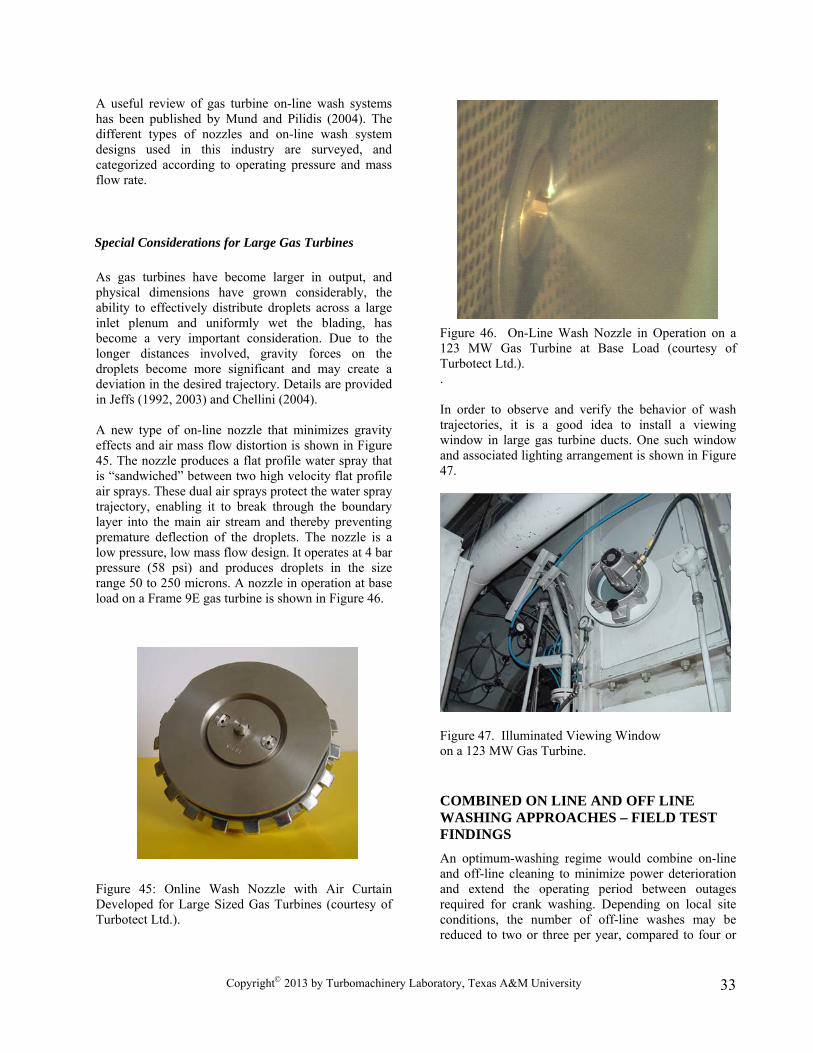
A useful review of gas turbine on-line wash systems has been published by Mund and Pilidis (2004). The different types of nozzles and on-line wash system designs used in this industry are surveyed, and categorized according to operating pressure and mass flow rate.
Special Considerations for Large Gas Turbines As gas turbines have become larger in output, and physical dimensions have grown considerably, the ability to effectively distribute droplets across a large inlet plenum and uniformly wet the blading, has become a very important consideration. Due to the longer distances involved, gravity forces on the droplets become more significant and may create a deviation in the desired trajectory. Details are provided in Jeffs (1992, 2003) and Chellini (2004). A new type of on-line nozzle that minimizes gravity effects and air mass flow distortion is shown in Figure 45. The nozzle produces a flat profile water spray that is “sandwiched” between two high velocity flat profile air sprays. These dual air sprays protect the water spray trajectory, enabling it to break through the boundary layer into the main air stream and thereby preventing premature deflection of the droplets. The nozzle is a low pressure, low mass flow design. It operates at 4 bar pressure (58 psi) and produces droplets in the size range 50 to 250 microns. A nozzle in operation at base load on a Frame 9E gas turbine is shown in Figure 46. Figure 45: Online Wash Nozzle with Air Curtain Developed for Large Sized Gas Turbines (courtesy of Turbotect Ltd.).
Figure 46. On-Line Wash Nozzle in Operation on a 123 MW Gas Turbine at Base Load (courtesy of Turbotect Ltd.). . In order to observe and verify the behavior of wash trajectories, it is a good idea to install a viewing window in large gas turbine ducts. One such window and associated lighting arrangement is shown in Figure 47.
Figure 47. Illuminated Viewing Window on a 123 MW Gas Turbine. COMBINED ON LINE AND OFF LINE WASHING APPROACHES – FIELD TEST FINDINGS An optimum-washing regime would combine on-line and off-line cleaning to minimize power deterioration and extend the operating period between outages required for crank washing. Depending on local site conditions, the number of off-line washes may be reduced to two or three per year, compared to four or
Copyright© 2013 by Turbomachinery Laboratory, Texas A&M University
33
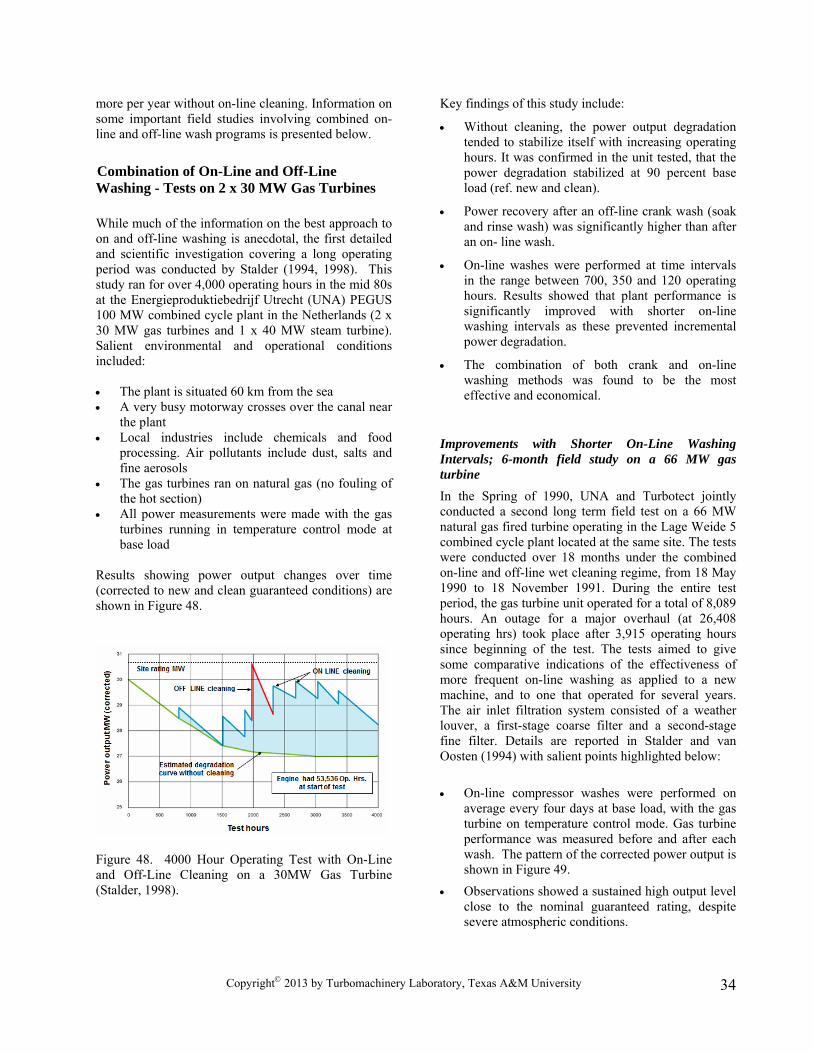
more per year without on-line cleaning. Information on some important field studies involving combined on-line and off-line wash programs is presented below.
Combination of On-Line and Off-Line Washing - Tests on 2 x 30 MW Gas Turbines While much of the information on the best approach to on and off-line washing is anecdotal, the first detailed and scientific investigation covering a long operating period was conducted by Stalder (1994, 1998). This study ran for over 4,000 operating hours in the mid 80s at the Energieproduktiebedrijf Utrecht (UNA) PEGUS 100 MW combined cycle plant in the Netherlands (2 x 30 MW gas turbines and 1 x 40 MW steam turbine). Salient environmental and operational conditions included: • The plant is situated 60 km from the sea • A very busy motorway crosses over the canal near
the plant • Local industries include chemicals and food
processing. Air pollutants include dust, salts and fine aerosols
• The gas turbines ran on natural gas (no fouling of the hot section)
• All power measurements were made with the gas turbines running in temperature control mode at base load
Results showing power output changes over time (corrected to new and clean guaranteed conditions) are shown in Figure 48.
Figure 48. 4000 Hour Operating Test with On-Line and Off-Line Cleaning on a 30MW Gas Turbine (Stalder, 1998).
Key findings of this study include:
• Without cleaning, the power output degradation tended to stabilize itself with increasing operating hours. It was confirmed in the unit tested, that the power degradation stabilized at 90 percent base load (ref. new and clean).
• Power recovery after an off-line crank wash (soak and rinse wash) was significantly higher than after an on- line wash.
• On-line washes were performed at time intervals in the range between 700, 350 and 120 operating hours. Results showed that plant performance is significantly improved with shorter on-line washing intervals as these prevented incremental power degradation.
• The combination of both crank and on-line washing methods was found to be the most effective and economical.
Improvements with Shorter On-Line Washing Intervals; 6-month field study on a 66 MW gas turbine In the Spring of 1990, UNA and Turbotect jointly conducted a second long term field test on a 66 MW natural gas fired turbine operating in the Lage Weide 5 combined cycle plant located at the same site. The tests were conducted over 18 months under the combined on-line and off-line wet cleaning regime, from 18 May 1990 to 18 November 1991. During the entire test period, the gas turbine unit operated for a total of 8,089 hours. An outage for a major overhaul (at 26,408 operating hrs) took place after 3,915 operating hours since beginning of the test. The tests aimed to give some comparative indications of the effectiveness of more frequent on-line washing as applied to a new machine, and to one that operated for several years. The air inlet filtration system consisted of a weather louver, a first-stage coarse filter and a second-stage fine filter. Details are reported in Stalder and van Oosten (1994) with salient points highlighted below: • On-line compressor washes were performed on
average every four days at base load, with the gas turbine on temperature control mode. Gas turbine performance was measured before and after each wash. The pattern of the corrected power output is shown in Figure 49.
• Observations showed a sustained high output level close to the nominal guaranteed rating, despite severe atmospheric conditions.
Copyright© 2013 by Turbomachinery Laboratory, Texas A&M University
34
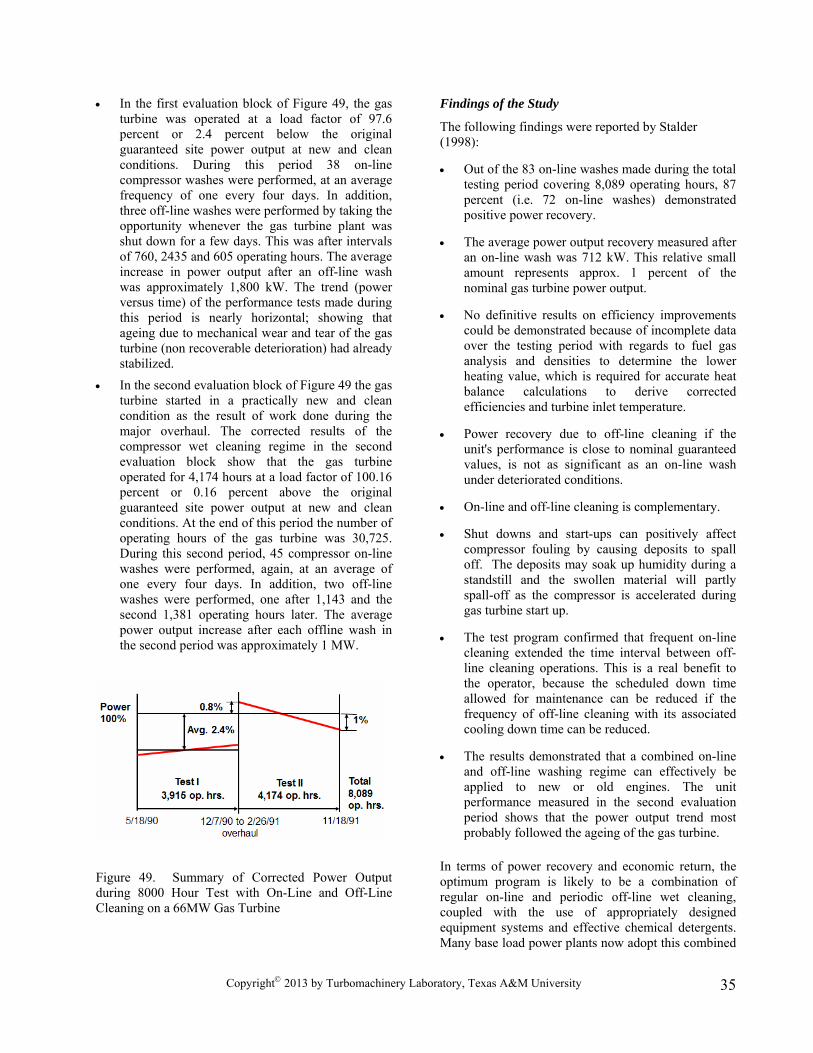
• In the first evaluation block of Figure 49, the gas turbine was operated at a load factor of 97.6 percent or 2.4 percent below the original guaranteed site power output at new and clean conditions. During this period 38 on-line compressor washes were performed, at an average frequency of one every four days. In addition, three off-line washes were performed by taking the opportunity whenever the gas turbine plant was shut down for a few days. This was after intervals of 760, 2435 and 605 operating hours. The average increase in power output after an off-line wash was approximately 1,800 kW. The trend (power versus time) of the performance tests made during this period is nearly horizontal; showing that ageing due to mechanical wear and tear of the gas turbine (non recoverable deterioration) had already stabilized.
• In the second evaluation block of Figure 49 the gas turbine started in a practically new and clean condition as the result of work done during the major overhaul. The corrected results of the compressor wet cleaning regime in the second evaluation block show that the gas turbine operated for 4,174 hours at a load factor of 100.16 percent or 0.16 percent above the original guaranteed site power output at new and clean conditions. At the end of this period the number of operating hours of the gas turbine was 30,725. During this second period, 45 compressor on-line washes were performed, again, at an average of one every four days. In addition, two off-line washes were performed, one after 1,143 and the second 1,381 operating hours later. The average power output increase after each offline wash in the second period was approximately 1 MW.
Figure 49. Summary of Corrected Power Output during 8000 Hour Test with On-Line and Off-Line Cleaning on a 66MW Gas Turbine
Findings of the Study
The following findings were reported by Stalder (1998):
• Out of the 83 on-line washes made during the total testing period covering 8,089 operating hours, 87 percent (i.e. 72 on-line washes) demonstrated positive power recovery.
• The average power output recovery measured after an on-line wash was 712 kW. This relative small amount represents approx. 1 percent of the nominal gas turbine power output.
• No definitive results on efficiency improvements could be demonstrated because of incomplete data over the testing period with regards to fuel gas analysis and densities to determine the lower heating value, which is required for accurate heat balance calculations to derive corrected efficiencies and turbine inlet temperature.
• Power recovery due to off-line cleaning if the unit's performance is close to nominal guaranteed values, is not as significant as an on-line wash under deteriorated conditions.
• On-line and off-line cleaning is complementary.
• Shut downs and start-ups can positively affect compressor fouling by causing deposits to spall off. The deposits may soak up humidity during a standstill and the swollen material will partly spall-off as the compressor is accelerated during gas turbine start up.
• The test program confirmed that frequent on-line cleaning extended the time interval between off-line cleaning operations. This is a real benefit to the operator, because the scheduled down time allowed for maintenance can be reduced if the frequency of off-line cleaning with its associated cooling down time can be reduced.
• The results demonstrated that a combined on-line and off-line washing regime can effectively be applied to new or old engines. The unit performance measured in the second evaluation period shows that the power output trend most probably followed the ageing of the gas turbine.
In terms of power recovery and economic return, the optimum program is likely to be a combination of regular on-line and periodic off-line wet cleaning, coupled with the use of appropriately designed equipment systems and effective chemical detergents. Many base load power plants now adopt this combined
Copyright© 2013 by Turbomachinery Laboratory, Texas A&M University
35

cleaning regime and experience proves that the concept is highly successful in terms of cleaning efficiency and restored power. To summarize, an optimum cleaning program is site-specific, and will be influenced by the severity of compressor fouling, the magnitude of associated power losses, and the operating schedule of the particular plant. Program parameters and options to be considered and evaluated include the following: • Cleaning technique: i.e. on-line, off-line or
combined on-line / off-line wet cleaning. For most plants the combination technique appears to be optimal.
• Frequency of each on-line and off-line cleaning
cycle • Duration of each cleaning cycle and total mass
flow of injected cleaning fluid • Duration of the rinsing or flushing cycle and the
amount of rinse water used • Selection of the most appropriate water-based or
solvent-based chemical detergent
The possibility of ice formation during cold weather washing operations should not be overlooked, and the use of an approved anti-icing agent can be considered.
COMPRESSOR WASH SKIDS Wash skids come in a wide variety of designs, engineering concepts and sizes. Some utilize pumps and others use compressed air. Skids can be designed for only off-line washing, or for combined off-line and on-line duty. It is important that the design of the wash skid be integrated with the nozzle systems installed on the gas turbine, so that wash fluid and rinse water are delivered at the correct pressure, temperature and flow rate. It is also important that the user make a design review of the skid from an operability and reliability standpoint. Some important considerations are as follows: • Skids should be designed to provide sufficient
storage capacity of cleaning fluid (i.e. water-detergent mixture) and rinse water to enable at least one complete off-line or on-line washing operation on one gas turbine, without the need to re-fill the storage tanks. In most cases the volumes
required for off-line cleaning will exceed those for on-line cleaning, so the crank wash volumes will normally determine tank sizing.
• Skids can be designed to serve a single gas turbine
or multiple units on the same site. If multiple gas turbines are involved, outlet manifolds for connection to off-line and on-line piping to each gas turbine should be included. If possible, skids should also be located so that piping runs to each gas turbine are approximately equal.
• Skids can be designed with a variety of control
options: For example “local manual” control for off-line washing, and fully automatic control (local and/or remote) for on-line washing. Note that for automatic on-line washing, a control system can be provided so that the wash sequence is initiated via a signal from the plant control room.
• The complexity of the wash skid control system
can be a fairly major cost factor, and users should determine up front whether options for fully automatic operation are really required.
• Certain gas turbine models need an external
compressed air source for opening and closing shut-off valves and drain valves, as required for off-line washing. In this case, wash skids can also be specified to include an air compressor system.
• Transfer of wash fluid and water to the nozzle
systems can be facilitated by an electrically driven pump, or by compressed air. In the case of compressed air systems, the equipment must be designed/sized to enable complete wash and rinse cycles to be performed without interruption and without pressure fluctuations. It is also extremely important that compressed air used for washing systems is absolutely oil-free. It is not uncommon to find situations where oil is being introduced into the compressor via an air-driven wash system.
• Some OEMs recommend that off-line washing be
performed with hot water, and in this case the skid must be designed with a heating system; which could be steam or electrical. This requirement greatly increases the physical size and cost of the wash skid. The purpose of heating the off-line wash fluid is to reduce gas turbine cool-down time, but it is debatable as to whether cleaning efficiency is actually improved.
Copyright© 2013 by Turbomachinery Laboratory, Texas A&M University
36
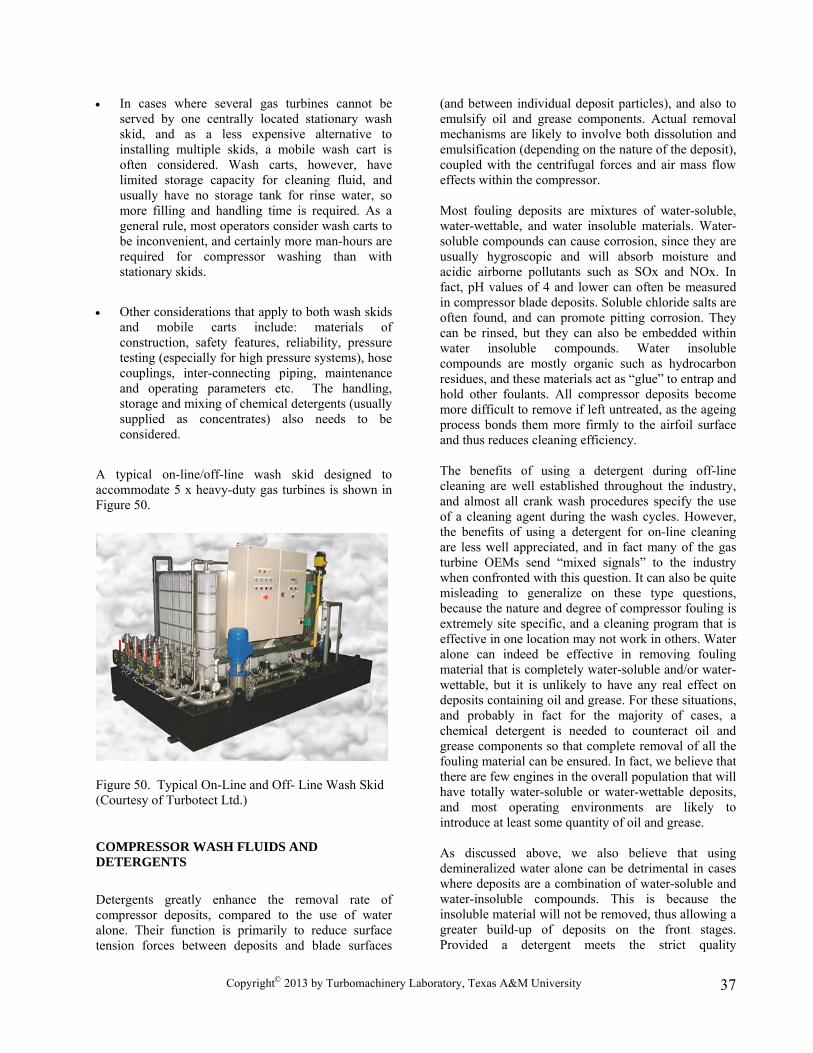
• In cases where several gas turbines cannot be served by one centrally located stationary wash skid, and as a less expensive alternative to installing multiple skids, a mobile wash cart is often considered. Wash carts, however, have limited storage capacity for cleaning fluid, and usually have no storage tank for rinse water, so more filling and handling time is required. As a general rule, most operators consider wash carts to be inconvenient, and certainly more man-hours are required for compressor washing than with stationary skids.
• Other considerations that apply to both wash skids
and mobile carts include: materials of construction, safety features, reliability, pressure testing (especially for high pressure systems), hose couplings, inter-connecting piping, maintenance and operating parameters etc. The handling, storage and mixing of chemical detergents (usually supplied as concentrates) also needs to be considered.
A typical on-line/off-line wash skid designed to accommodate 5 x heavy-duty gas turbines is shown in Figure 50.
Figure 50. Typical On-Line and Off- Line Wash Skid (Courtesy of Turbotect Ltd.)
COMPRESSOR WASH FLUIDS AND DETERGENTS Detergents greatly enhance the removal rate of compressor deposits, compared to the use of water alone. Their function is primarily to reduce surface tension forces between deposits and blade surfaces
(and between individual deposit particles), and also to emulsify oil and grease components. Actual removal mechanisms are likely to involve both dissolution and emulsification (depending on the nature of the deposit), coupled with the centrifugal forces and air mass flow effects within the compressor. Most fouling deposits are mixtures of water-soluble, water-wettable, and water insoluble materials. Water-soluble compounds can cause corrosion, since they are usually hygroscopic and will absorb moisture and acidic airborne pollutants such as SOx and NOx. In fact, pH values of 4 and lower can often be measured in compressor blade deposits. Soluble chloride salts are often found, and can promote pitting corrosion. They can be rinsed, but they can also be embedded within water insoluble compounds. Water insoluble compounds are mostly organic such as hydrocarbon residues, and these materials act as “glue” to entrap and hold other foulants. All compressor deposits become more difficult to remove if left untreated, as the ageing process bonds them more firmly to the airfoil surface and thus reduces cleaning efficiency. The benefits of using a detergent during off-line cleaning are well established throughout the industry, and almost all crank wash procedures specify the use of a cleaning agent during the wash cycles. However, the benefits of using a detergent for on-line cleaning are less well appreciated, and in fact many of the gas turbine OEMs send “mixed signals” to the industry when confronted with this question. It can also be quite misleading to generalize on these type questions, because the nature and degree of compressor fouling is extremely site specific, and a cleaning program that is effective in one location may not work in others. Water alone can indeed be effective in removing fouling material that is completely water-soluble and/or water-wettable, but it is unlikely to have any real effect on deposits containing oil and grease. For these situations, and probably in fact for the majority of cases, a chemical detergent is needed to counteract oil and grease components so that complete removal of all the fouling material can be ensured. In fact, we believe that there are few engines in the overall population that will have totally water-soluble or water-wettable deposits, and most operating environments are likely to introduce at least some quantity of oil and grease. As discussed above, we also believe that using demineralized water alone can be detrimental in cases where deposits are a combination of water-soluble and water-insoluble compounds. This is because the insoluble material will not be removed, thus allowing a greater build-up of deposits on the front stages. Provided a detergent meets the strict quality
Copyright© 2013 by Turbomachinery Laboratory, Texas A&M University
37

specifications established by the OEM for on-line compressor cleaning, we believe there is no technical reason to limit or restrict its use. There are many different brands of compressor cleaners available on the market, but generally they are classified as being either “water-based” or “solvent-based” products. Traditionally, solvent-based cleaners have been recognized as being more powerful in terms of oil and grease removal, but their popularity within the industry has now declined because of environmental and safety considerations. During an off-line crank wash, for example, the discharged effluent water will usually require treatment before disposal and may be classified as hazardous waste. Also, due to the presence of hydrocarbon solvents, this type of cleaner may be subject to transportation restrictions and/or higher freight rates. Water-based cleaners are now more widely applied within this industry, and are generally preferred because of their safe handling properties and high level of biodegradability. Many water-based products can be highly effective in removing a wide variety of foulants, and provide acceptable cleaning performance in most situations. New-generation water-based formulations are also available that can match the cleaning efficiency of solvent-based products. Compressor cleaners must comply with various industry standards (for example MIL-specs and environmental regulations), as well as quality and use specifications established by the various gas turbine manufacturers. General requirements include: • Low trace metal impurity content (extremely
important for on-line applications). • Thermal decomposition properties that ensure
gums or sticky residues do not form during the cleaning operation. (Again, this is particularly relevant for on-line cleaning applications)
• Approximately neutral pH value. • High cleaning performance, which can be
evaluated via several established testing procedures.
• Long-term storage stability. • Compatibility with alloys, coatings, paints and
elastomers within the gas turbine engine. Many detergents are sold as concentrates, and should be used at an appropriate dilution ratio as recommended by the manufacturer. A typical dilution ratio is one part detergent to four parts water.
On-line and Off-Line Compressor Cleaners Cleaners available on the market today are generally non-ionic, and designed to fulfill gas turbine engine manufacturer’s specification for both on-line and off-line cleaning. This also simplifies stock keeping and on-site handling. The main constituent of a cleaner is its surfactant (surface active agent), the purpose of which is to reduce surface tension of the cleaning fluid to enable it to wet, penetrate and disperse the deposits. The surfactant also reduces surface tension of oil and grease films, which otherwise have strong adherence to blade surfaces and to other fouling materials. Such rapid penetration and dispersion of the deposits cannot be achieved with water alone. Surfactants are therefore needed for water insoluble deposits (both liquid and particulate types), to enable their removal from compressor blade surfaces and to prevent re-deposition.
Foaming of Compressor Cleaners Foam is an indication of the degree of activity of the compressor cleaner, and therefore of the effectiveness of the surfactants used in the cleaner formulation. Foam helps to achieve a better distribution and penetration of the cleaning solution into the deposits during off-line washing, and it extends contact time by holding moisture. Water films alone will tend to drain off the blades more rapidly, thus reducing contact time during the off-line soaking period. In addition, the foam also acts as a dirt carrier, to help transport the removed foulants from the compressor. Foam should be quickly displaced during rinsing, but if it dissipates (“collapses”) too rapidly it can release and redeposit dirt within the compressor. So-called “low-foaming” cleaners can reduce the time required for rinsing after an off-line wash, but insufficient foam or foam which collapses too rapidly can also impair the cleaning process. Corrosion Inhibitors The concept of including a corrosion inhibitor in compressor cleaner formulations originated primarily in the aero industry, and may be important for jet engines that are frequently not re-operated (i.e. dried) immediately after compressor crank washing. This philosophy spread to the industrial gas turbine market, and as a result, many compressor cleaners used for stationary gas turbines are also required to include a corrosion inhibitor in order to comply with certain industry specifications.
Copyright© 2013 by Turbomachinery Laboratory, Texas A&M University
38

Conductivity or pH measurements on off-line effluent water have shown that corrosive salts are often left behind to some extent after the cleaning cycle with detergent, and in this regard the corrosion inhibitor can provide some degree of protection. However, rinsing with water alone will also be beneficial in removing residual salt solution, and it is important that sufficient rinse cycles are performed. We also recommend that a “blow out” and “dry out” run is conducted after completing the rinse cycles, even if the cleaning agent contains a corrosion inhibitor. Corrosion inhibitors have a high affinity to surfaces and will tend to form a film on compressor blading. However, there is a potential risk during on-line cleaning that this film may decompose in the mid-stage temperature range of 200°C (about 390oF). We therefore recommend that a demineralized water rinse of the same duration as the cleaning cycle is performed to eliminate any salts left behind. As discussed in previous chapters, this does not pose a risk to the gas turbine provided on-line washing is not applied to heavily fouled units.
Use of Hot Water for Crank Washing Some OEMs recommend the use of hot water for off-line washing, and primarily this is to reduce the cool-down time before crank washing can commence, so that thermal shock is prevented. However, this means that compressor wash skids need to be equipped with a heating system, insulated tanks and insulated piping etc., and this significantly increases acquisition costs. Equipment maintenance costs and operating costs are also increased, and off-line washing must be scheduled in advance to enable heat-up time.
In addition to reducing cool-down time, it is conceivable that hot water may improve cleaning efficiency by helping to soften deposits and increase solubility. It is arguable, however, as to whether or not this improvement is significant, and probably more frequent washing (combined on-line & off-line regime) and the use of a good detergent will more than compensate for these possible benefits.
Engdar et. al. (2004) recently addressed this subject, and conducted CFD studies on hot water injection for off-line compressor washing. The authors concluded that, regardless of its inlet temperature, injected wash fluid is cooled down to ambient air temperature well before the spray reaches the inlet guide vanes. This study indicates that heating the wash fluid may serve little benefit.
COLD WEATHER COMPRESSOR WASHING
The ability to perform compressor washing during cold weather periods has become increasingly important for many gas turbine operators and OEMs. Occasions when it may be required are as follows: • Off-line cleaning prior to an important
performance test, regardless of ambient conditions. • Scheduled outage for off-line cleaning may occur
during winter months and cannot be postponed. • Plant decisions to continue an on-line cleaning
program during winter months. • Plant decisions to perform on-line cleaning in
order to delay an outage for off-line cleaning. In the case of on-line cleaning it is important to remember that ice formation can occur in the compressor at ambient temperatures significantly above the freeze point. This is due to a static temperature depression in the bellmouth area, resulting mainly from air acceleration effects. The amount of temperature depression is related to specific design parameters of the compressor and can be as high as 10°C (18°F). Thus, depending on the particular model of gas turbine, conditions at the IGVs can be 10°C (18°F) lower than actual outside air temperature. The influence of static temperature depression is less significant with off-line washing due to relatively low crank speeds, but a few degrees of safety margin should still be allowed. Various chemicals have been used as anti-icing agents - such as alcohols, ketones and glycols. However, not all are suitable for gas turbine applications and a summary of issues and selection criteria are provided in Table 8. Antifreeze agents based on propylene glycol offer significant safety and handling advantages (non-hazardous, high flash point, biodegradable etc), and can be used for both on-line and off-line cleaning applications. In essence they are used as a substitute for water during the cleaning and rinsing cycles. Using this type of anti-icing agent, on-line cleaning can be performed in ambient temperature conditions down to about -10°C (14°F) and off-line cleaning can be conducted at ambient temperatures down to approximately -22°C (-8°F). Actual product freeze points can vary, however, depending on the specific formulation, so manufacturers’ product information should always be consulted. Cold weather washing procedures and minimum allowed ambient temperatures also vary according to the different gas turbine manufacturers and for different gas turbine models, so OEM recommendations should always be observed.
Copyright© 2013 by Turbomachinery Laboratory, Texas A&M University
39

CONCLUSIONS
This paper provides a comprehensive overview of compressor fouling and washing for gas turbine engines and presents, in a single document, the state of the art regarding the causes, effects and control of axial compressor fouling. The paper has covered numerous practical aspects of direct applicability to users. With increasing fuel costs and a highly competitive market, the understanding, measurement and control of fouling deterioration is an imperative. Fouling rates can vary from plant to plant and are highly environment and machine specific. Furthermore, fouling behavior is influenced by inlet air filter selection and maintenance. Site weather patterns also have a dramatic impact on fouling. A judicious combination of off-line and on-line cleaning usually provides the best results in helping operators fight this common and insidious operating problem. Close monitoring of compressor performance can help optimize compressor-washing regimes and improve plant profitability.
NOMENCLATURE
A/F = Air to fuel ratio for the gas turbine CCPP = Combined Cycle Power Plant CDP = Compressor Discharge Pressure CDT = Compressor Discharge Temperature CHP = Combined Heat and Power Cp = specific heat (J/kgK) GT = Gas Turbine HRSG = Heat Recovery Steam Generator IGV = Inlet Guide Vane ISO = International Standards Organization
If = contaminant level in the fuel, ppmw Iair = contaminant level in the air, ppmw Iw = contaminant level in the injection water, ppmw Istm = contaminant level in the injection steam, ppmw LHV = Lower Heating Value NWR = Net work ratio = output/ Wt OEM = Original Equipment Manufacturer PPM = Parts Per Million PR = Pressure Ratio RH = Relative Humidity S/F = Steam to Fuel Ratio Tas = Static Air Temperature Ts = Saturation Air Temperature TCL = Total Contaminant Level, ppmw TIT = Turbine Inlet Temperature Wc, Wt = Compressor and Turbine Work, kW W/F= Water to fuel ratio ΔT stage = Average Total Temperature Rise/stage, °C ηc = Compressor Efficiency m = mass flow rate (kg/sec) V = Axial Compressor Volumetric Flow Rate REFERENCES Aker, G. F., Saravanamutto, H. I. H., 1988, "Predicting Gas Turbine Performance Degradation Due To Compressor Fouling Using Computer Simulation Techniques,", ASME Gas Turbine and Aeroengine Congress, Amsterdam, June 5-9, 1988, ASME Paper 88-GT- 206. Arnulfi, G.L. and Massardo, A.F., 1993, “The Effect of Axial Flow Compressor Deterioration on Gas Turbines in Combined Cycle Power Plants,” ASME IGTI Volume 8, Cogen Turbo Proceedings, pp 607-614. Bagshaw, K. W., 1974, "Maintaining Cleanliness in Axial Flow Compressors", 1st Gas Turbine Operations and Maintenance Symposium, National Research Council - Canada, October, 1974. Bammert, K. and Woelk, G. U., 1980, "The Influence of Blading Surface Roughness on the Aerodynamic Behavior and Characteristic Of An Axial Compressor," Trans. ASME, Journal of Engineering for Power, Vol.102, April 1980, pp. 283-287. Bromley, A. F., 2012, “Gas Turbine Power Degradation and Compressor Washing, Tutorial Part 2”, ASME International Gas Turbine and Aeroengine Congress, Copenhagen, Denmark, June 11-15, 2012, ASME Tutorial No. GT2012-70231.
Copyright© 2013 by Turbomachinery Laboratory, Texas A&M University
40

Chellini, R., 2004, “Wash Nozzles Designed for Larger Turbines”, Diesel & Gas Turbine Worldwide, May 2004. Cleaver, R.E., 1988, “Retrofitting of Gas Turbine Air Filtration Systems using Improved Technology,” Seminar on Turbomachinery, Paper A-1, BHRA Fluid Engineering Center, Milton Keynes, UK, October 27-28, 1988. Cleaver, R.E., 1990, “Gas Turbine Air Filtration in Tropical Environments,” Turbomachinery Maintenance Congress, October 1990. Dundas, R.E., 1982, “The Use of Performance Monitoring to Prevent Compressor and Turbine Failures”, ASME International Gas Turbine and Aeroengine Congress, Paper No: 82-GT-66. Dundas, R.E., 1986, “A Study of the Effect of Deterioration on Compressor Surge Margin in Constant Speed, Single Shaft Gas Turbines,” 1986 ASME Gas Turbine Congress, ASME Paper No: 86-GT-177. Dundas, R.E., Sullivan, D.A., Abegg, F., 1992, “Performance Monitoring of Gas Turbines for Failure Prevention”, ASME International Gas Turbine and Aeroengine Congress, Cologne, Germany, June 1-4, 1992., ASME Paper No: 92-GT-267. Dusatko, R.A., 1995, “Monitoring Gas Turbine Performance,” Power Engineering, October 1995. Engdar, U., Genrup, M., Orbay, R. C., and Klingmann, J., 2004, “Investigation of the Two-Phase Flow Field of the GTX100 Compressor Inlet during Off-Line Washing”, ASME Turboexpo 2004, Vienna, Austria, June 14-17, 2004, ASME Paper No: GT2004-53141. Felix, P.C., and Strittmatter, W., 1979, “Analysis of Air Pollution on the Erection Site of a Brown Boveri Gas Turbine,” Brown Boveri Review, Vol 66, February 1979, pp 97-103. Flashburg, L.S., and Haub, G.L., 1992, “Measurement of Combustion Turbine Non Recoverable Deterioration,” ASME International Gas Turbine and Aeroengine Congress, Cologne, Germany, June 1-4, 1992. ASME Paper Number 92-GT-264 Gidley, D., Fritz, F. M., and Yu, H., 1993, “The Selection Process and Comparative Air Filter Performance Testing for Combustion Turbine Inlet Air Filters,” ASME International Gas Turbine and Aeroengine Congress, Cincinnati, Ohio, ASME Paper No. 93-GT-219.
Goulding, C.H., Rasmussen, M.G., Fritz, F.M., 1990, “Technical and Other Considerations for the Selection of Inlet Air Filtration Systems for High-Efficiency Industrial Gas Turbines,” International Gas Turbine and Aeroengine Congress, Brussels, Belgium, June 11-14, 1990. ASME Paper No: 90-GT-176. Haskell, R.W., 1989, “Gas Turbine Compressor Operating Environment and Material Evaluation,” ASME International Gas Turbine and Aeroengine Congress, Toronto, Canada, June 4-8, 1989, ASME Paper No: 89-GT-42. Hsu, L. L., 1988, "Total Corrosion Control For Industrial Gas Turbines: Airborne Contaminants and Their Impact On Air/Fuel/Water Management,"ASME International Gas Turbine & Aeroengine Congress, Amsterdam, June 6-9, 1988. ASME Paper No. 88-GT-65 Jeffs, E., 1992, “Compressor Washing for Large Gas Turbines,” Turbomachinery International Magazine, Sept/Oct 1992. Jeffs, E., 2003, “Turbotect’s Innovative On-Line Wash Nozzle for Large Gas Turbines,” Turbomachinery International Magazine, May/June 2003. Kimm, M. H. P., and Langlands, D., 1985, "Gas Turbine Intake Filter Systems Related to Offshore Platform Installations,", ASME International Gas Turbine and Aeroengine Conference, March 18-21, 1985, Houston, Texas. ASME Paper No. 85-GT-109. Koch, C. C., and Smith J. H., 1976, “Loss Sources and Magnitudes in Axial Compressors,” Transaction of ASME Journal of Engineering for Power, A 98 July, pp 411-424. Kurz, R., Brun, K., and Wollie, M., 2008 “Degradation Effects On Industrial Gas Turbines”, Proceedings of ASME Turbo Expo 2008: Power for Land, Sea and Air, June 9-13, 2008, Berlin, Germany; ASME Paper No. GT2008-50020. Kurz, R., and Brun, K., 2000, “Degradation in Gas Turbine Systems,” ASME International Gas Turbine and Aeroengine Congress, Munich, Germany, May 8-11, 2000, ASME Paper No: 2000-GT-345. Kurz,.R., Brun, K., 2012, Fouling Mechanisms in Axial Compressors, TransASME Journal of Engineering for Gas Turbines and Power, Vol.134, GTP-11-1153.
Copyright© 2013 by Turbomachinery Laboratory, Texas A&M University
41
Lakshminarasimha, A. N., Boyce, M. P., Meher-Homji, C. B., 1994, “Modeling and Analysis of Gas Turbine Performance Deterioration”, Transactions of the ASME Journal of Engineering for Gas Turbines and Power, Vol. 116, January 1994, pp 46-52. Manfrida, G., et al, 1988, "Experimental Study of Flow In Gas Turbine Inlet Duct Models," Quaderni Pignone 44, June 1988, pp. 19-26. Meher-Homji, C.B., and Bromley A.F., 2004, “Gas Turbine Axial Compressor Fouling and Washing,” Proceedings of the 33rd Turbomachinery Symposium, September 2004, Houston, Texas. Meher-Homji, C.B., Chaker, M., Bromley, A.F., 2009, “The Fouling of Axial Flow Compressors- Causes, Effects, Susceptibility and Sensitivity,” Proceedings of the ASME International Gas Turbine Congress, Turboexpo 2009, Orlando Florida, June 8-12, 2009, ASME Paper No: GT2009-59239. Meher-Homji, C. B., 1990, “Gas Turbine Axial Compressor Fouling - A Unified Treatment of its Effects, Detection and Control,” ASME Cogen Turbo IV, New Orleans, LA, August 27-29, 1990, Also in International Journal of Turbo and Jet Engines, Vol 9, No.4, 1992, pp 99-111. Meher-Homji, C.B., and Gabriles, G., 1998, “Gas Turbine Blade Failures - Causes, Avoidance, and Troubleshooting,” Proceedings of the 27th Turbomachinery Symposium, Houston Texas, September 1998. Meher-Homji, C. B., Chaker, M., and Motiwalla, H., 2001, “Gas Turbine Performance Deterioration,” Proceedings of the 30th Turbomachinery Symposium, Houston, Texas, September17-20, 2001. Meher-Homji, C. B., Lakshminarasimha, A.N., Mani, G, Boehler, P.D., Dohner, C.V., Ondryas, I, Lukas, H., Cincotta, G.A., 1993, “Durability Surveillance of Advanced Gas Turbines- Performance and Mechanical Baseline Development for the GE Frame 7F”, International Gas Turbine and Aeroengine Congress, Cincinnati, Ohio, May 24-27, 1993, ASME Paper No: 93-GT-276. Mund, F. C., and Pilidis, P., 2004, “A Review of Gas Turbine Washing Systems,”ASME Turboexpo 2004, Vienna, Austria, June 14-17, 2004, ASME Paper No: GT2004-53224.
Schaffler, A., 1980, “Experimental and Analytical Investigation of the Effect of Reynolds Number and Blade Surface Roughness on Multistage Axial Flow Compressors,” ASME Journal of Engineering for Power, Vol 102, Jan 1980 pp. 5-11. Schneider, E., Demircioglu, S., Franco, S. and Therkorn, D., 2009, “Analysis of Compressor On-Line Washing to Optimize Gas Turbine Power Plant Performance,” Proceedings of the ASME International Gas Turbine Congress, Turboexpo 2009, Orlando Florida, June 8-12, 2009, ASME Paper No: GT2009-59356. Schweiger, T., 1983, “North Sea Operating Experience- Air Intake Design”, Proceedings of the Fifth on Gas Turbines Operations and Maintenance, National Research Council of Canada, Calgary, September 1983. Scott, J. H., 1979, "Axial Compressor Monitoring by Measuring Intake Air Depression," Proceedings of the Third Symposium on Gas Turbine Operations and Maintenance, National Research Council of Canada Symposium, September, 1979. Scott, J. H., 1986, "Reduced Turbomachinery Operating Costs with Regular Performance Testing," ASME International Gas Turbine and Aeroengine Congress, June 1986, ASME Paper No. 86-GT-173. Seddigh, F., and Saravanamuttoo, H. I. H., 1990, “ A Proposed Method or Assessing the Susceptibility of Axial Compressors to Fouling,”, ASME International Gas Turbine and Aeroengine Congress, June 11-14, 1990, ASME Paper No: 90-GT-348.
Stalder, J. P., 1998, “Gas Turbine Compressor Washing State of the Art - Field Experiences,” ASME International Gas Turbine and Aeroengine Congress, Stockholm Sweden, June 2-5, 1998, ASME Paper No: 1998-GT-420. Stalder, J. P., and Sire, J., 2001, “Salt Percolation Through Gas Turbine Air Filtration Systems and its Contribution to Total Contaminant Level,” Proceedings of the Joint Power Generation Conference, June 4-7, 2001, New Orleans, LA., Paper JPGC2001/PWR-19148. Stalder, J. P., and van Oosten, P., 1994, “Compressor Washing Maintains Plant Performance and Reduces Cost of Energy Production,” ASME International Gas Turbine and Aeroengine Congress, The Hague, Netherlands, June 13-16, 1994, ASME Paper No: 1994-GT-436.
Copyright© 2013 by Turbomachinery Laboratory, Texas A&M University
42
Copyright© 2013 by Turbomachinery Laboratory, Texas A&M University
43
Stone, A., 1958, "Effects of Stage Characteristics and Matching on Axial-Flow-Compressor Performance", Trans ASME Journal of Engineering for Gas Turbines and Power, August 1958, pp. 1273-1293. Syverud, S, Bakken, L.E., Langnes, K., Bjornas, F., 2003, “ Gas Turbine Operation Offshore- On Line Compresor Wash at Peak Load, Proceedings of ASME Turbo Expo, New Orleans, June 4-6, 2003, ASME Paper No. GT-2003-38071. Tabakoff, W., 1988, "Causes For Turbomachinery Performance Deterioration," ASME Gas Turbine and Aeroengine Congress, Amsterdam, June 6-9, 1988. ASME Paper No. 88-GT-294. Tarabrin, A. P., Bodrov, A. I., Schurovsky, V. A., Stalder, J. P, 1998, “Influence of Axial Compressor Fouling on Gas Turbine Unit Performance Based on Different Schemes and with Different Initial Parameters”, ASME International Gas Turbine and Aeroengine Congress, Stockholm Sweden, June 2-5, 1998, ASME paper No. 98-GT-416.
Tarabrin, A. P., Bodrov, A. I., Schurovsky, V. A., Stalder, J.P, 1996, “An Analysis of Axial Compressor Fouling and a Cleaning Method of their Blading”, ASME International Gas Turbine and Aeroengine Congress, Birmingham, UK, June 10-13, 1996, ASME paper no. 96-GT-363.
Tatge, R. B., Gordon, C. R., Conkey, R. S., 1980, "Gas Turbine Inlet Filtration In Marine Environments," ASME Paper No. 80-GT-174. Zaba, T. and Lombardi, P., 1984, "Experience In The Operation of Air Filters In Gas Turbine Installations", ASME International Gas Turbine and Aeroengine Congress, June 1984 ASME Paper No. 84-GT-39, 1984. Zaba, T., 1980, “Losses in Gas Turbines Due to Deposits on the Blading,” Brown Boveri Review, 12-80, pp 715-722. BIBLIOGRAPHY Bakken, L. E. and Skorping, R., 1996, “Optimum Operation and Maintenance of Gas Turbines Offshore,” International Gas Turbine and Aeroengine Congress, Birmingham, UK, June 10-13, 1996, ASME Paper No: 96-GT-273.
Becker, B. and Bohn, D., 1984, "Operating Experience with Compressors of Large Heavy Duty Gas Turbines," International Gas Turbine and Aeroengine Congress, June 1984 ASME Paper No. 84-GT-133. Benvenuti, E., Bettocchi, R., Cantore, G., Negri di Montenegro, G., Spina, P.R., 1993, “Gas Turbine Cycle Modeling Oriented to Component Performance Evaluation from Limited Design or Test Data,” Proceedings of the ASME IGTI Cogen Turbo Power, IGTI-Vol 8., pp 327-337. Bowen, T. L., Guimond, D. P., Muench, R. K., 1987, "Experimental Investigation of Gas Turbine Recuperator Fouling," ASME Journal of Engineering for Gas Turbines and Power, July 1987, Vol. 109, pp. 249-256. Cohen H., Rogers, G. F. C. and Saravanamuttoo, H. I. H, 1987, “Gas Turbine Theory,” Longman , 1987. Denton, J.D., 1993, “Loss Mechanisms in Turbomachines”, International Gas Turbine and Aeroengine Congress, Cincinnati, Ohio, May 24-27, 1993, ASME paper no: 93-GT-435. Diakunchak, I.S., 1991, “Performance Deterioration in Industrial Gas Turbines,” ASME International Gas Turbine and Aeroengine Conference, Orlando Florida, June 3-6, 1991, ASME Paper No: 91-GT-228. Faddegon, C. J., 1999, “Effective Compressor Cleaning as a Result of Scientific Testing and Field Experience,” Powergen Europe, Brussels, June 1999. Hoeft, R. F., “Heavy-Duty Gas Turbine Operating and Maintenance Considerations”, General Electric publication GER-3620B, 1993. Lakshminarsimha, A. N. and Saravanamuttoo, H. I. H., 1986, “Prediction of Fouled Compressor Performance Using Stage Stacking Techniques,” 4th ASME Fluid Mechanics Conference on Turbomachinery Performance Deterioration, May 12-14, 1986. Mathioudakis, K., Stamatis, A., Bonataki, E., 1999, “Diagnosing the Sources of Overall Performance Deterioration in CCHT Plants,” International Gas Turbine and Aeroengine Congress, Indianapolis, Indiana June 7-10, 1993. ASME Paper No: 99-GT-364. Upton, A. W. J., 1974, “Axial Flow Compressor and Turbine Blade Fouling, Some Causes, Effects and Cleaning Methods," 1st Symposium on Gas Turbine Operation and Maintenance, National Research Council, Canada, October 1974.
Related Documents