3085 Korean J. Chem. Eng., 33(11), 3085-3101 (2016) DOI: 10.1007/s11814-016-0198-z pISSN: 0256-1115 eISSN: 1975-7220 INVITED REVIEW PAPER † To whom correspondence should be addressed. E-mail: [email protected], [email protected] Copyright by The Korean Institute of Chemical Engineers. Gas permeation and separation in asymmetric hollow fiber membrane permeators: Mathematical modeling, sensitivity analysis and optimization Seyed Saeid Hosseini * ,† , Javad Aminian Dehkordi * , and Prodip Kumar Kundu ** *Department of Chemical Engineering, Tarbiat Modares University, Tehran 14115-114, Iran **OLI Systems, Inc, 240 Cedar Knolls Road, Suite 301 Cedar Knolls, NJ 07927-1621, U.S.A. (Received 21 April 2016 • accepted 2 July 2016) Abstract-Mathematical modeling is useful for analysis of process design and performance and is widely used for membrane separation and other important technologies in the energy sector. This study presents the results of our investigations on the mathematical modeling and optimization of hollow fiber membrane permeators specifically used for air separation as well as natural gas purification. The governing equations and mathematical models are developed based on the consideration of ideal and non-ideal conditions often involved in the separation of gas mixtures using membrane permeators. The influence and consequences of adoption of two distinct numerical methods for solving governing equations are investigated in details. The results obtained by using the models as well as the effect of numeri- cal method type are examined and compared to the experimental data. The findings highlight the important role of the solution method on the validity and accuracy of the models. Moreover, the effect of variations in the operating condi- tions and physical geometries of the membrane are investigated through comprehensive sensitivity analysis. Accord- ingly, a set of optimal input parameters is determined using an appropriate statistical method. The findings provide useful information for the design and development of high performance membrane permeators and processes particu- larly in the case of binary gas mixtures for energy applications. Keywords: Gas Separation, Hollow Fiber, Membrane Permeator, Mathematical Modeling, Sensitivity Analysis, Optimi- zation, Numerical Method INTRODUCTION Polymeric membranes are known as an effective means for sep- aration of various gas or liquid mixtures [1-4]. Low operation and energy costs, small footprint, reduced environmental side-effects and high reliability have turned membrane separation processes to a viable choice among the established rivals. Many efforts have been made over the past years on design, fabrication, configuration, modeling, simulation and performance prediction and analysis in order to enable reliable membrane pro- cess developments [5-10]. Modeling of gas separation membranes was first reported by Weller and Steiner in 1950 [11]. Since then, numerous mathematical models have been introduced, especially for high flux asymmetric membranes with different flow configu- ration including co-current, counter-current and cross-current. Among the various membrane types and geometries, asymmetric hollow fiber membranes offer the advantages of high packing and area/volume density, reduced resistance to the transport of species as well as desirable mechanical strength and stability, particularly for gas separation applications [12]. In the prior studies, research- ers considered pressure changes along the shell- and lumen-sides, real gas behavior and concentration polarization as influential param- eters in order to develop more realistic mathematical models. Ac- cordingly, a number of analytical and numerical techniques were examined to solve the derived formulae [13]. Despite the availabil- ity and widespread use of GEAR’s method [14-16], Runge-Kutta [17-22] and orthogonal collocations [23-26], much attention has been paid to the use of finite difference methods for solving the equations. This may be attributed to the ease of formulation and simplicity, since depending on the prevailing conditions, other meth- ods may offer either less accurate results with high computational time or limited stability and interval convergence [27-31]. Lim et al. [22] developed a model for analysis of pressure drop within the lumen-side of hollow fiber membranes based on continuity and momentum balance and used the Runge-Kutta method to solve the set of equations. In another study, Kaldis et al. [26] developed a modified model based on Pan’s initial formulation [13] for pre- diction of membrane separation performance in asymmetric hol- low fiber membrane modules and solved the final equations using orthogonal collocation. They took into account the temperature changes following the Arrhenius-type equation and employed Todus’s method to calculate the variations of gas viscosity. However, the pressure changes in the shell- and lumen-sides as well as the resis- tance within the porous layer were neglected in their proposed model. It was determined that the model slightly overestimated the permeate concentration compared to the model proposed by Giglia et al. [17]. They also declared that orthogonal collocation offered more accurate solutions with less computational time [32]. Recently, authors developed mathematical models and investi- gated the effects of various parameters on the performance of asym-

Welcome message from author
This document is posted to help you gain knowledge. Please leave a comment to let me know what you think about it! Share it to your friends and learn new things together.
Transcript

3085
Korean J. Chem. Eng., 33(11), 3085-3101 (2016)DOI: 10.1007/s11814-016-0198-z
pISSN: 0256-1115eISSN: 1975-7220
INVITED REVIEW PAPER
†To whom correspondence should be addressed.E-mail: [email protected], [email protected] by The Korean Institute of Chemical Engineers.
Gas permeation and separation in asymmetric hollow fiber membrane permeators: Mathematical modeling, sensitivity analysis and optimization
Seyed Saeid Hosseini*,†, Javad Aminian Dehkordi*, and Prodip Kumar Kundu**
*Department of Chemical Engineering, Tarbiat Modares University, Tehran 14115-114, Iran**OLI Systems, Inc, 240 Cedar Knolls Road, Suite 301 Cedar Knolls, NJ 07927-1621, U.S.A.
(Received 21 April 2016 • accepted 2 July 2016)
Abstract−Mathematical modeling is useful for analysis of process design and performance and is widely used formembrane separation and other important technologies in the energy sector. This study presents the results of ourinvestigations on the mathematical modeling and optimization of hollow fiber membrane permeators specifically usedfor air separation as well as natural gas purification. The governing equations and mathematical models are developedbased on the consideration of ideal and non-ideal conditions often involved in the separation of gas mixtures usingmembrane permeators. The influence and consequences of adoption of two distinct numerical methods for solvinggoverning equations are investigated in details. The results obtained by using the models as well as the effect of numeri-cal method type are examined and compared to the experimental data. The findings highlight the important role of thesolution method on the validity and accuracy of the models. Moreover, the effect of variations in the operating condi-tions and physical geometries of the membrane are investigated through comprehensive sensitivity analysis. Accord-ingly, a set of optimal input parameters is determined using an appropriate statistical method. The findings provideuseful information for the design and development of high performance membrane permeators and processes particu-larly in the case of binary gas mixtures for energy applications.
Keywords: Gas Separation, Hollow Fiber, Membrane Permeator, Mathematical Modeling, Sensitivity Analysis, Optimi-zation, Numerical Method
INTRODUCTION
Polymeric membranes are known as an effective means for sep-aration of various gas or liquid mixtures [1-4]. Low operation andenergy costs, small footprint, reduced environmental side-effectsand high reliability have turned membrane separation processes toa viable choice among the established rivals.
Many efforts have been made over the past years on design,fabrication, configuration, modeling, simulation and performanceprediction and analysis in order to enable reliable membrane pro-cess developments [5-10]. Modeling of gas separation membraneswas first reported by Weller and Steiner in 1950 [11]. Since then,numerous mathematical models have been introduced, especiallyfor high flux asymmetric membranes with different flow configu-ration including co-current, counter-current and cross-current.Among the various membrane types and geometries, asymmetrichollow fiber membranes offer the advantages of high packing andarea/volume density, reduced resistance to the transport of speciesas well as desirable mechanical strength and stability, particularlyfor gas separation applications [12]. In the prior studies, research-ers considered pressure changes along the shell- and lumen-sides,real gas behavior and concentration polarization as influential param-eters in order to develop more realistic mathematical models. Ac-
cordingly, a number of analytical and numerical techniques wereexamined to solve the derived formulae [13]. Despite the availabil-ity and widespread use of GEAR’s method [14-16], Runge-Kutta[17-22] and orthogonal collocations [23-26], much attention hasbeen paid to the use of finite difference methods for solving theequations. This may be attributed to the ease of formulation andsimplicity, since depending on the prevailing conditions, other meth-ods may offer either less accurate results with high computationaltime or limited stability and interval convergence [27-31]. Lim etal. [22] developed a model for analysis of pressure drop within thelumen-side of hollow fiber membranes based on continuity andmomentum balance and used the Runge-Kutta method to solvethe set of equations. In another study, Kaldis et al. [26] developeda modified model based on Pan’s initial formulation [13] for pre-diction of membrane separation performance in asymmetric hol-low fiber membrane modules and solved the final equations usingorthogonal collocation. They took into account the temperaturechanges following the Arrhenius-type equation and employed Todus’smethod to calculate the variations of gas viscosity. However, thepressure changes in the shell- and lumen-sides as well as the resis-tance within the porous layer were neglected in their proposedmodel. It was determined that the model slightly overestimatedthe permeate concentration compared to the model proposed byGiglia et al. [17]. They also declared that orthogonal collocationoffered more accurate solutions with less computational time [32].
Recently, authors developed mathematical models and investi-gated the effects of various parameters on the performance of asym-
3086 S. S. Hosseini et al.
November, 2016
metric hollow fiber membrane permeators for separation of binarygas mixtures [33,34]. Governing equations were developed andsolved as a set of initial value problem equations using 4th-orderRunge-Kutta method. It was shown that the developed modelbased on non-ideal conditions offered better predictions about themodule performance, and the deviation from ideality was consid-erably high. Despite the comprehensiveness of the developed mod-els, one of the major shortcomings of employment of Runge-Kuttafor solving the governing equations was the limited internal con-vergence especially in extending the model for analysis of the per-formance over a wide range of operating conditions.
Accordingly, the main objective of the present study was to em-ploy the finite element method (FEM) for solving the governingequations to improve the accuracy and convergence and to over-come the limitations of the Runge-Kutta method. Based on a detailedliterature review, and to the best of our knowledge, this is the firstinvestigation that highlights the effect of adoption of numericalcomputation methods on mathematical modeling in the case hol-low fiber membrane permeators for gas separation. In addition,the impacts of performing sensitivity analysis for identification ofthe pivotal parameters involved in the process design and perfor-mance were investigated in the case of O2/N2 and CO2/CH4 sepa-ration applications. The findings and proposed methodologies pro-vide useful information about optimization of operating conditionsand physical geometry parameters for design and development ofhigh performance membrane permeators and processes.
THEORY AND MODEL DEVELOPMENT
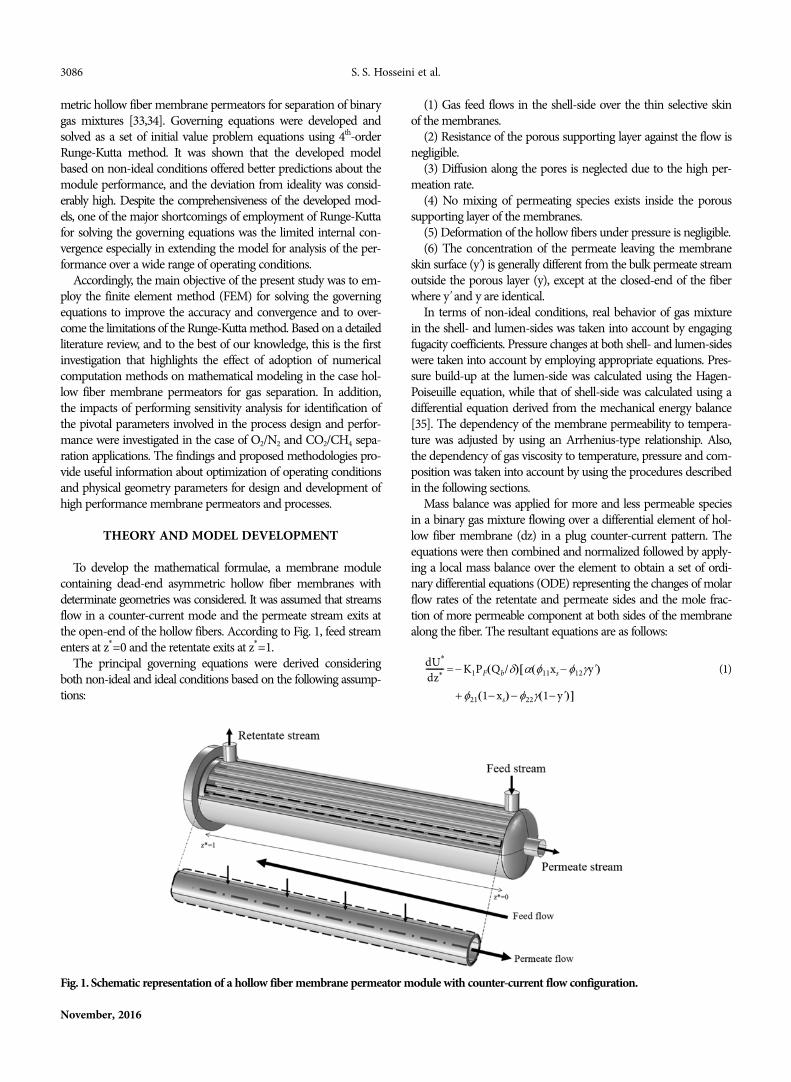
To develop the mathematical formulae, a membrane modulecontaining dead-end asymmetric hollow fiber membranes withdeterminate geometries was considered. It was assumed that streamsflow in a counter-current mode and the permeate stream exits atthe open-end of the hollow fibers. According to Fig. 1, feed streamenters at z*=0 and the retentate exits at z*=1.
The principal governing equations were derived consideringboth non-ideal and ideal conditions based on the following assump-tions:
(1) Gas feed flows in the shell-side over the thin selective skinof the membranes.
(2) Resistance of the porous supporting layer against the flow isnegligible.
(3) Diffusion along the pores is neglected due to the high per-meation rate.
(4) No mixing of permeating species exists inside the poroussupporting layer of the membranes.
(5) Deformation of the hollow fibers under pressure is negligible.(6) The concentration of the permeate leaving the membrane
skin surface (y') is generally different from the bulk permeate streamoutside the porous layer (y), except at the closed-end of the fiberwhere y' and y are identical.
In terms of non-ideal conditions, real behavior of gas mixturein the shell- and lumen-sides was taken into account by engagingfugacity coefficients. Pressure changes at both shell- and lumen-sideswere taken into account by employing appropriate equations. Pres-sure build-up at the lumen-side was calculated using the Hagen-Poiseuille equation, while that of shell-side was calculated using adifferential equation derived from the mechanical energy balance[35]. The dependency of the membrane permeability to tempera-ture was adjusted by using an Arrhenius-type relationship. Also,the dependency of gas viscosity to temperature, pressure and com-position was taken into account by using the procedures describedin the following sections.
Mass balance was applied for more and less permeable speciesin a binary gas mixture flowing over a differential element of hol-low fiber membrane (dz) in a plug counter-current pattern. Theequations were then combined and normalized followed by apply-ing a local mass balance over the element to obtain a set of ordi-nary differential equations (ODE) representing the changes of molarflow rates of the retentate and permeate sides and the mole frac-tion of more permeable component at both sides of the membranealong the fiber. The resultant equations are as follows:
(1)dU*
dz*--------- = − K1PF Qb/δ( ) α φ11xs − φ12γy'( )[
+ φ21 1− xs( ) − φ22γ 1− y'( )]
Fig. 1. Schematic representation of a hollow fiber membrane permeator module with counter-current flow configuration.

Gas permeation and separation in asymmetric hollow fiber membrane permeators 3087
Korean J. Chem. Eng.(Vol. 33, No. 11)
(2)
(3)
(4)
where U*, V* and z* are dimensionless parameters defined as:
and K1 is defined as:
In these equations, PF, Qb, δ, α, ∅, γ, do, L, N and Ui are feed pres-sure, permeability of less permeable component, effective skinthickness of membrane, membrane selectivity, fugacity coefficient,ratio of permeate-side pressure to feed-side pressure, fiber outerdiameter, active fiber length, number of fibers in the module andfeed flow rate, respectively.
The pressure changes along the fiber at feed and permeate sideswere formulated as follows, respectively:
(5)
(6)
where K2 is defined as:
and ZF, R, TF, G, Mwm, μP and TP are compressibility factor of gasmixture in the feed side, ideal gas constant, feed temperature, massflux of feed side stream, molecular weight of gas mixture in thefeed side, viscosity of gas mixture in the permeate side and perme-ate side temperature, respectively.
Also f, gc and Rh are friction factor, Newton’s law conversionfactor and hydraulic diameter, respectively defined as:
where ds0 is the module shell diameter.Applying a local mass balance equation together with mass bal-
ance equations for more and less permeable components after somesimplifications yields Eq. (7):
(7)
1. Model Development Based on Non-ideal ConditionsMany of the early conventional models for studying the proper-
ties and performance of asymmetric hollow fiber membranes gen-erally ignored some or all of the non-ideal effects involved. Thiswas either for the sake of simplification of the procedure and cal-culations or based on the assumptions prevailing in those specificcases [17,32,35-37]. Recent studies, however, have demonstratedthat neglecting non-idealities in modeling can potentially causeserious errors in the evaluation or prediction of the process perfor-mance [15,38].
According to the experience gained in our research group onmodeling of gas separation using hollow fiber membrane perme-ators [39,40], the major non-idealities and the procedure takeninto considerations for model development are as follows:
(1) The SRK equation of state was used to calculate the fugac-ity coefficients to account for the real behavior of the gas mixtures[41].
(2) A surface mole fraction parameter was introduced for morepermeable component using the equation proposed by Wang et al.[16] in order to consider the effect of accumulation of less perme-able component adjacent to the membrane skin surface, whichreduces the permeation driving force (also known as concentra-tion polarization):
(8)
where k, T0 and P0 are mass transfer coefficient in the feed side,standard temperature and standard pressure, respectively.
(3) Joule-Thomson equation was used to account for the effectof variation in the temperature of the components due to perme-ation. Also, the changes in the temperature of the feed stream alongshell-side were calculated via the equation derived from the enthalpybalance and thermodynamic [42].
(9)
where Cp and μJT are the molar heat capacity at constant pres-sure for a pure component and Joule-Thomson coefficient, respec-tively.
(4) The dependency of permeation to temperature owing to thetemperature changes at the feed side was considered by using anArrhenius-type equation [38,40]:
(10)
(5) Temperature, pressure and concentration dependency of gasmixture viscosity were taken into account using the methods pro-posed by Chung et al., Jossi et al. and Wilke [43].
dV*
dz*--------- =
dU*
dz*---------
dxdz*------- =
− K1PF Qb/δ( ) α 1− x( ) φ11xs − φ12γy'( )[
− x φ21 1− xs( ) − φ22γ 1− y'( )( )]
U*
---------------------------------------------------------------------------------------
dydz*------- =
− K1PF Qb/δ( ) α 1− y( ) φ11xs − φ12γy'( )[
− y φ21 1− xs( ) − φ22γ 1− y'( )( )]
V*
---------------------------------------------------------------------------------------
z* = zL---, U*
= UUi-----, V*
= VUi-----
K1= πdoLN
Ui----------------
dPF
dz*-------- = −
2ZFLRTFfG2
PFgcRhMwm------------------------------
dγdz*------- =
K2μPTPV*
γPF2
------------------------
K2 = − 128RLUi
πdi4N
---------------------
f = 0.008 4Rh( )−1/3 and Rh = π ds0/2( )2
− Nπ do/2( )2
πds0 + Nπdo---------------------------------------------------
y' =
ϕ12 + γ αϕ12 − ϕ22( ) + xs αϕ11− ϕ21( )
− ϕ12 + γ αϕ12 − ϕ22( ) + xs αϕ11− ϕ21( )[ ]2 − 4αγϕ11 αϕ12 − ϕ22( )xs
2 αϕ12 − ϕ22( )γ-----------------------------------------------------------------------------------------------------------------------------------------------------
xs =
αϕ12γy' 1− x( ) − ϕ22γx 1− y'( ) + x ϕ21+ kT0
P0TFQb
δ------
⎝ ⎠⎛ ⎞
-----------------------
kT0
P0TFQb
δ------
⎝ ⎠⎛ ⎞
----------------------- + αϕ11 1− x( ) + ϕ21x-------------------------------------------------------------------------------------------------------------------
μJT, m =
xiCpiμJTii=1
2∑
xiCpii=1
2∑
-------------------------
Q = QRef − ER---
1TF----- −
1TRef--------
⎝ ⎠⎛ ⎞exp
3088 S. S. Hosseini et al.
November, 2016
2. Model Development Based on Ideal ConditionsModel development was also carried out based on ideal condi-
tions to enable having quick results without involving numerousnon-ideal parameters and associated complexities. For this purpose,three more assumptions were taken into account for developmentof governing equations in addition to the former six assumptionsconsidered for non-ideal conditions:
(1) Ideal behavior of gas mixtures (ϕ=1).(2) The pressure changes on both sides of fiber are negligible
(γ=constant and μFeed=μPermeate).(3) The process is isothermal (α=constant).By applying the above assumptions to Eqs. (1)-(4) and (7), the
following equations were obtained for the ideal conditions. Theseequations represent the changes of molar flow rates of more per-meable component in feed and permeate sides (Eqs. (11) and (12)),the changes in mole fraction of more permeable component in thefeed and permeate sides (Eq. (13) and (14)) as well as local perme-ate side mole fraction of the more permeable component in thesupport layer (Eq. (15)), respectively as follows:
(11)
(12)
(13)
(14)
(15)
The overall and partial mass balances for the more permeable com-ponent are derived as follows, respectively:
(16)
(17)
3. Numerical Solution by Finite Element MethodFinite element is a widespread and useful numerical method,
especially for solving ordinary and partial differential equations.We adopted the Galerkin method to approximate the solution ofODEs with a piecewise linear function as a sum of basis functions[44]. By transforming a set of ODEs into a system of algebraic equa-tions, the finite element method and a weak formulation of the ap-proximation was used according to the prescribed procedure [45].
Considering a system of non-linear first order ODEs over inter-val (0 L), the following equation can be defined:
P'=f(P, z) (18)
expanding an approximation solution using basis functions yieldsto P and P' as follows:
(19)
(20)
where φj(z) is the hat function defined as:
Accordingly, the residual equation is:
(21)
It is desirable to minimize the residual equation, (i.e., R(z)=0).Thus, Eq. (21) is obtained by applying the weak Galerkin formula-tion of approximate solution as weight factors:
(22)
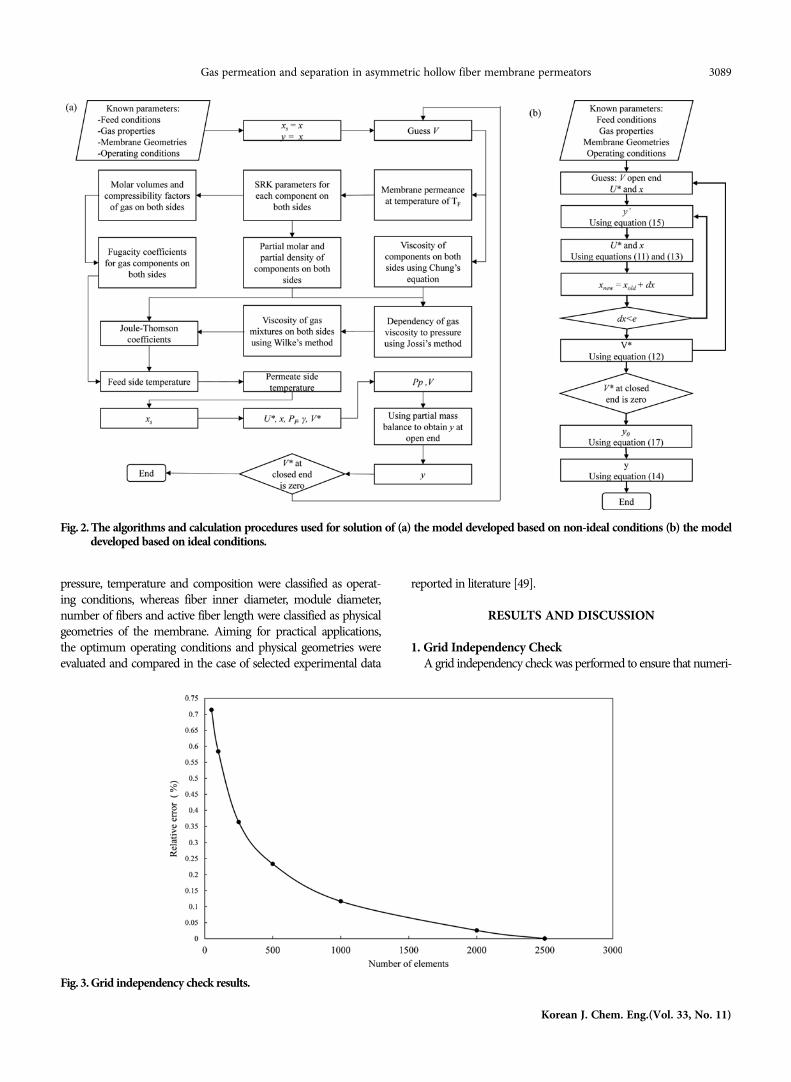
Finally, the Gauss quadrature formulae were used as the solutionmethod. The boundary conditions rely on the flow pattern. Theset of boundary conditions used in this study is provided in Table1. In addition, Fig. 2 demonstrates the algorithms and calculationprocedures followed for solution of models based on non-idealand ideal conditions.4. Sensitivity Analysis and Optimization
Sensitivity analysis provides useful information about the rela-tionship between the involved variables. In addition, statisticalmethods reflect the interactions among the parameters and therole and contribution of each [46]. A conventional method of ana-lyzing the sensitivity of a model is changing an independent vari-able while maintaining others unchanged. A strategic method foranalyzing the relationships of the parameters in a process is toapply response surface methodology (RSM) [47]. We used centralcomposite design (CCD) method to gain a response surface modeland performed sensitivity analysis and optimization [48]. The sta-tistical models were obtained using the Design-Expert 7.0 soft-ware. Input parameters were divided into two main categories. Feed
dU*
dz*--------- = −
πdoLN Qb/δ( )PF
Ui-------------------------------------- α x − γy'( ) + 1− x( ) − y 1− y'( )[ ]
dV*
dz*--------- =
dU*
dz*---------
dxdz*------- = −
πdoLN Qb/δ( )PF
Ui--------------------------------------
α 1− x( ) xs − γy'( ) − x 1− x( ) − γ 1− y'( )( )[ ]
U*
--------------------------------------------------------------------------------------------
dydz*------- = −
πdoLN Qb/δ( )PF
Ui--------------------------------------
α 1− y( ) xs − γy'( ) − y 1− x( ) − γ 1− y'( )( )[ ]
U*
--------------------------------------------------------------------------------------------
y' = 1+ α −1( ) γ + x( ) − 1+ α −1( ) γ + x( )[ ]2
− 4αγ α −1( )x2 α −1( )γ
--------------------------------------------------------------------------------------------------------------------------
Uz*
=0 = U
z*
=1+ V
xz*
=0U
z*
=0 = x
z*
=1U
z*
=1+ yV
P = pjφj z( )j=1
N∑
P' = pjφ'j z( )j=1
N∑
φj z( ) =
0 z zj−1≤
z − zj−1
zj − zj−1---------------- zj−1 z zj≤ ≤
zj+1− zzj+1− zj--------------- zj z zj+1≤ ≤
0 z zj+1≥⎩⎪⎪⎪⎪⎨⎪⎪⎪⎪⎧
R z( ) = P' − f P', z( ) = pjφ'j z( ) − f P, z( )j=1
N∑
φi z( )R z( )dz = 0∫
Table 1. The set of boundary conditions employed for solving ODEsModel type Position Condition
The model based onnon-ideal conditions
z*=0 Ui=1z*=0 x=xF
z*=0 y=y0
z*=0 γ =γ0
z*=0 PF=PF0
z*=1 V*=0
The model based onideal conditions
z*=0 Ui=1z*=0 x=xF
z*=0 y=y0
z*=1 V*=0
Gas permeation and separation in asymmetric hollow fiber membrane permeators 3089
Korean J. Chem. Eng.(Vol. 33, No. 11)
pressure, temperature and composition were classified as operat-ing conditions, whereas fiber inner diameter, module diameter,number of fibers and active fiber length were classified as physicalgeometries of the membrane. Aiming for practical applications,the optimum operating conditions and physical geometries wereevaluated and compared in the case of selected experimental data
reported in literature [49].
RESULTS AND DISCUSSION
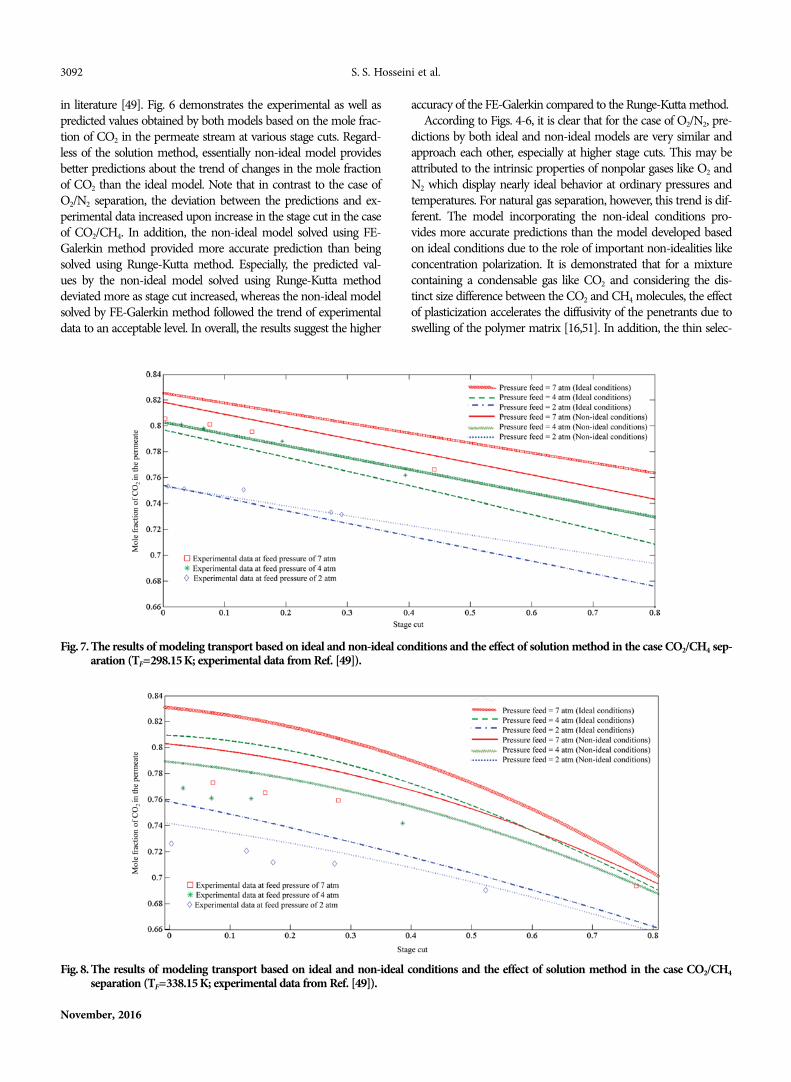
1. Grid Independency CheckA grid independency check was performed to ensure that numeri-
Fig. 2. The algorithms and calculation procedures used for solution of (a) the model developed based on non-ideal conditions (b) the modeldeveloped based on ideal conditions.
Fig. 3. Grid independency check results.

3090 S. S. Hosseini et al.
November, 2016
cal results were grid-independent. The results are shown in Fig. 3in the case of a binary CO2/CH4 gas mixture having a composi-tion of 60% CO2 flowing in the shell-side of a stainless steel cylin-drical module with 15cm length and 1cm internal diameter housing100 hollow fibers with internal and external diameters of 389μmand 735μm, respectively. The pressure difference between the feedand permeate sides was 6 atm and the feed temperature was 298 K.The trend in Fig. 3 reveals that the relative error was reducedexponentially by increasing in the number of grid elements. It wasnoted that the relative error reduced to less than 0.02% for thenumber of elements exceeding 2000. Therefore, the number of gridelements was set to 2000 for all the computations in this study.2. Model Validation
Three exemplary case studies on O2/N2 and CO2/CH4 separationswere investigated to examine how the numerical results obtainedby the developed mathematical models compared to the experimen-tal data. Table 2 represents the set of experimental data related to
the case studies that were employed for the model validation. Inthe case of O2/N2 separation, hollow fiber composite membraneswere from Alberta Research Council (ARC) [50] and InnovativeMembrane Systems of Norwood, MA [17]. Also, for CH4/CO2 sep-aration, hollow fiber composite membranes consisting of coating(aliphatic copolymer) and support (polysulfone) layers from SNIAwere examined [49].
Fig. 4 shows the results obtained from the models developed basedon ideal and non-ideal conditions and solved using FE-Galerkinand Runge-Kutta methods in the case of O2/N2 separation. In thisfigure, the mole fraction of O2 in the permeate is plotted versusstage cut and compared to the experimental data reported by Fenget al. [50]. Results show that the predictions made by both idealand non-ideal models solved using either FE-Galerkin or Runge-Kutta methods are generally in a good agreement with the experi-mental data. Focusing on the use of the Runge-Kutta method, themodel developed based on ideal conditions provides a better match
Table 2. The specifications of the modules and set of experimental data used for model validations and analysisInput parameter Unit O2/N2 separation CO2/CH4 separation
Mole fraction in feed - 0.205 O2 0.2078 O2 0.6 CO2
0.795 N2 0.7922 N2 0.4 CH4
Feed pressure atm 7.8 6.82 2, 4, 7Permeate outlet pressure atm 1 1.01 1
Feed temperature K 296.15 298.15 298.15338.15
Activation energy kJ·mol−1 19.3 O2 19.3 O2 17.765 CO2
27.6 N2 27.6 N2 15.468 CH4
Inner fiber diameter µm 80 145 389Outer fiber diameter µm 160 373 735Module diameter mm 9.5 4.8 10Number of fiber - 368 80 100Active fiber length cm 25 75 15Ref. [50] [17] [49]
Fig. 4. The results of modeling transport based on ideal and non-ideal conditions and the effect of solution method in the case O2/N2 separa-tion (PF=7.8 atm; TF=296.15 K; experimental data from Ref. [50]).

Gas permeation and separation in asymmetric hollow fiber membrane permeators 3091
Korean J. Chem. Eng.(Vol. 33, No. 11)
with the experimental data than the model incorporating non-ideal conditions. At the first glance, this may potentially be attributedto the intrinsically close-to-ideal properties of O2 and N2 moleculesas well as the relatively low operational pressure, both promoting thesystem to behave with negligible deviations from ideal conditions.However, further insights considering solution using FE-Galerkinmethod reveal that the model incorporating non-ideal conditionsprovides better predictions than the model developed based onideal conditions. Thus, the predictions by the non-ideal modelsolved using the FE-Galerkin method are in the best match withthe experimental data. These findings suggest the lower accuracyof 4th order Runge-Kutta compared to the FE-Galerkin method,highlighting the prominent role of adoption of an appropriatesolution method. Interestingly, the predictions by both models be-come similar and regardless of the solution method at stage cuts
beyond 0.7. This may be attributed to the lesser deviations of theO2/N2 gas mixture from ideal conditions at higher stage cuts.
Investigations were further extended by applying the approachin the case of another set of data reported by Giglia et al. for O2/N2
separation [17]. Fig. 5 presents the mole fraction of O2 in the feedat different stage cuts for the models developed based on ideal andnon-ideal conditions solved using the FE-Galerkin method. Theresults reveal that the predictions made by both models are in anadmissible agreement with the experimental data. However, pre-dictions by non-ideal model are in higher accuracy over the fullrange of stage cuts. Similar to the previous case, the accuracy of thepredictions obtained by both ideal and non-ideal models approacheseach other at higher stage cuts.
The validity of the models was also examined in case of CO2/CH4 separation by comparing to the experimental data reported
Fig. 5. The results of modeling transport based on ideal and non-ideal conditions solved using FE-Galerkin method in the case O2/N2 sepa-ration (PF=6.82 atm; TF=298.15 K; experimental data from Ref. [17]).
Fig. 6. The results of modeling transport based on ideal and non-ideal conditions and the effect of solution method in the case CO2/CH4 sep-aration (PF=7 atm; TF=298.15 K; experimental data from Ref. [49]).
3092 S. S. Hosseini et al.
November, 2016
in literature [49]. Fig. 6 demonstrates the experimental as well aspredicted values obtained by both models based on the mole frac-tion of CO2 in the permeate stream at various stage cuts. Regard-less of the solution method, essentially non-ideal model providesbetter predictions about the trend of changes in the mole fractionof CO2 than the ideal model. Note that in contrast to the case ofO2/N2 separation, the deviation between the predictions and ex-perimental data increased upon increase in the stage cut in the caseof CO2/CH4. In addition, the non-ideal model solved using FE-Galerkin method provided more accurate prediction than beingsolved using Runge-Kutta method. Especially, the predicted val-ues by the non-ideal model solved using Runge-Kutta methoddeviated more as stage cut increased, whereas the non-ideal modelsolved by FE-Galerkin method followed the trend of experimentaldata to an acceptable level. In overall, the results suggest the higher
Fig. 7. The results of modeling transport based on ideal and non-ideal conditions and the effect of solution method in the case CO2/CH4 sep-aration (TF=298.15 K; experimental data from Ref. [49]).
Fig. 8. The results of modeling transport based on ideal and non-ideal conditions and the effect of solution method in the case CO2/CH4separation (TF=338.15 K; experimental data from Ref. [49]).
accuracy of the FE-Galerkin compared to the Runge-Kutta method.According to Figs. 4-6, it is clear that for the case of O2/N2, pre-
dictions by both ideal and non-ideal models are very similar andapproach each other, especially at higher stage cuts. This may beattributed to the intrinsic properties of nonpolar gases like O2 andN2 which display nearly ideal behavior at ordinary pressures andtemperatures. For natural gas separation, however, this trend is dif-ferent. The model incorporating the non-ideal conditions pro-vides more accurate predictions than the model developed basedon ideal conditions due to the role of important non-idealities likeconcentration polarization. It is demonstrated that for a mixturecontaining a condensable gas like CO2 and considering the dis-tinct size difference between the CO2 and CH4 molecules, the effectof plasticization accelerates the diffusivity of the penetrants due toswelling of the polymer matrix [16,51]. In addition, the thin selec-
Gas permeation and separation in asymmetric hollow fiber membrane permeators 3093
Korean J. Chem. Eng.(Vol. 33, No. 11)
tive layer of the asymmetric hollow fiber promotes the plasticiza-tion to occur at low pressures [52]. Also, according to the solution-diffusion mechanism, the competition of CO2 and CH4 in the mix-ture for the limited sites within the membrane (known as compet-itive sorption) results in decreased CH4 solubility. However, theincrease in CH4 diffusivity is much greater than the decrease insolubility, so that in overall, the permeability of CH4 increases [53].Consequently, it is expected that the deviation of model predic-tions from the experimental data in the case of CO2/CH4 mixturewill be more than that of O2/N2 mixture.
Further investigations were carried out to examine the effect ofpressure and temperature on the predictions by the developedmodels. Based on the findings, FE-Galerkin method was selectedas the solution method. Figs. 7 and 8 show the effect of variationin the feed pressure on the mole fraction of CO2 in the permeatestream at different stage cuts for two temperatures. Data in Fig. 7and 8 are for the pressures of 2, 4 and 7 atm at 298.15 K and 338.15K, respectively. According to Fig. 7, the model developed based onnon-ideal conditions provides predictions with higher accuracycompared to the ideal model. This can be because the effect ofnon-idealities is more in the case of CO2/CH4 separation. Almostsimilar results can be observed in Fig. 8, which is related to the338.15 K, corroborating the higher accuracy of the non-ideal modelthan the ideal one in predicting the performance. However, theaccuracy of the predictions by the non-ideal model declined in thecase of 338.15 K. On the other hand, essentially, the models areexpected to offer more accurate results at lower pressures, sincedeviation between the experimental data and model predictionsincreases at higher pressures.
Generally, the above findings confirm the complexity of non-idealities involved in modeling the performance of permeators andthe prominent role of inclusion of appropriate parameters to ac-count for the elevated pressure and temperatures. Also, the con-centration of the more permeable components at the permeateoutlet reduced upon increase in stage cuts, illustrating the trade-offbetween the selectivity and stage cut. The effect was more pro-nounced as deviations from ideality increased.3. Sensitivity Analysis
Sensitivity analysis was performed using the model comprisingnon-idealities aimed at investigating the main parameters and
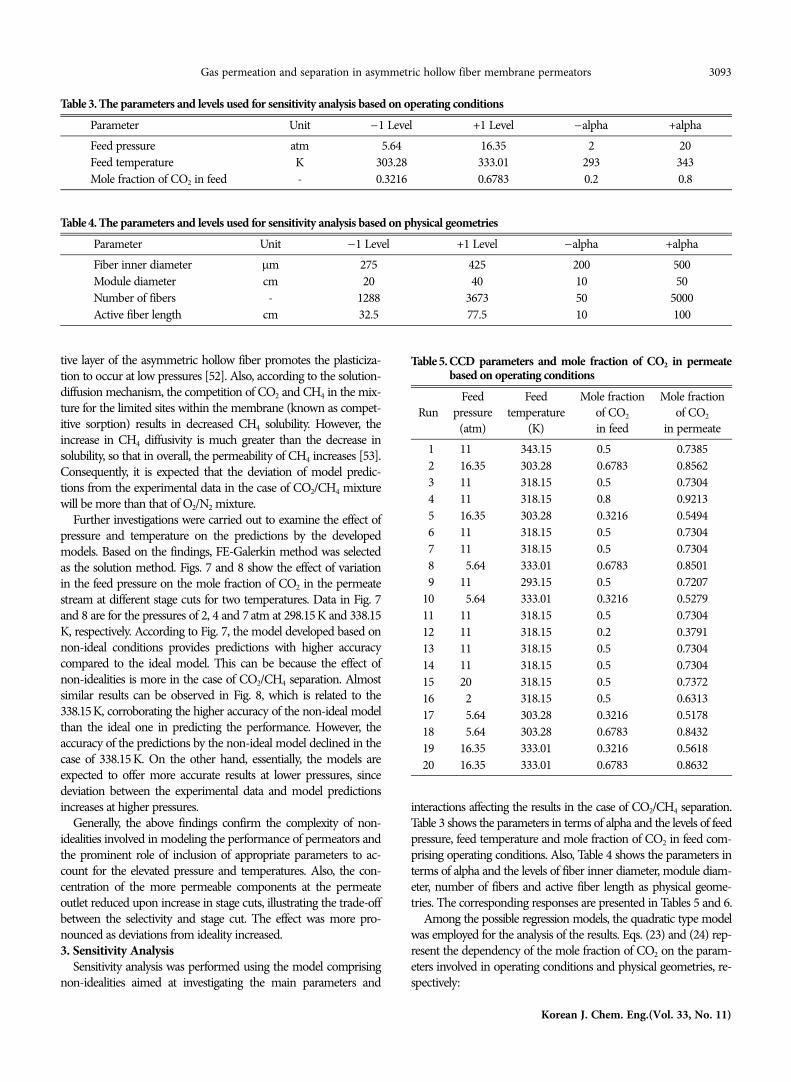
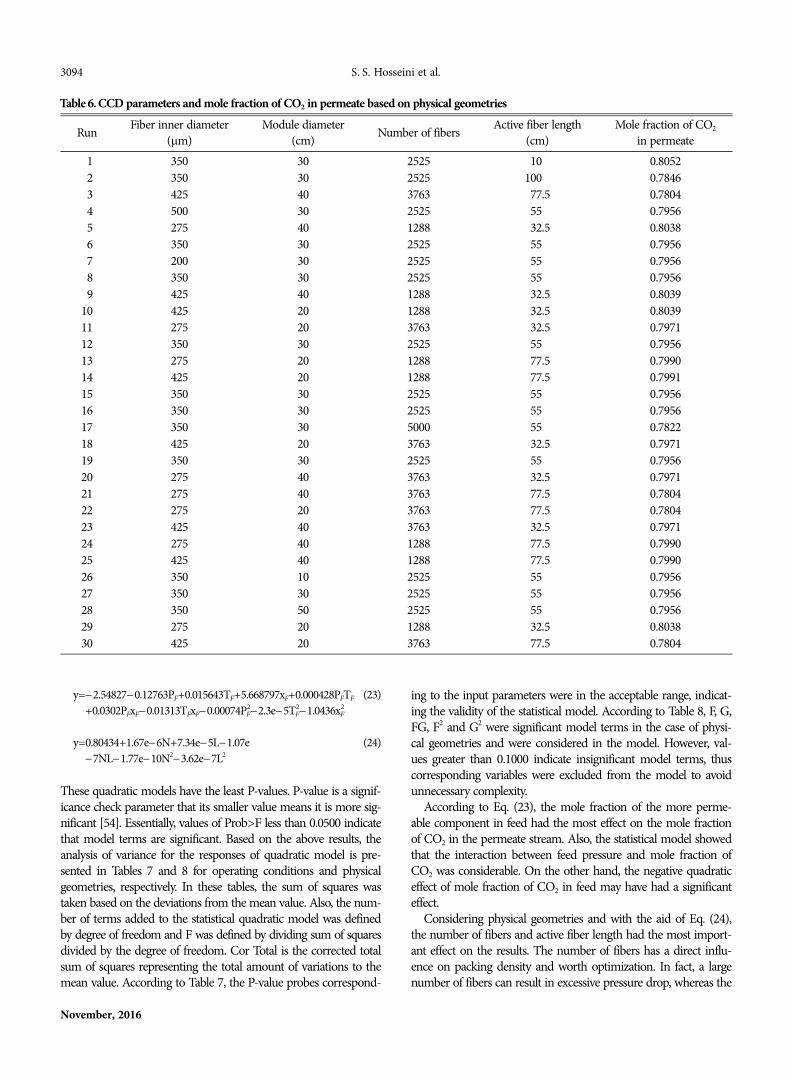
interactions affecting the results in the case of CO2/CH4 separation.Table 3 shows the parameters in terms of alpha and the levels of feedpressure, feed temperature and mole fraction of CO2 in feed com-prising operating conditions. Also, Table 4 shows the parameters interms of alpha and the levels of fiber inner diameter, module diam-eter, number of fibers and active fiber length as physical geome-tries. The corresponding responses are presented in Tables 5 and 6.
Among the possible regression models, the quadratic type modelwas employed for the analysis of the results. Eqs. (23) and (24) rep-resent the dependency of the mole fraction of CO2 on the param-eters involved in operating conditions and physical geometries, re-spectively:
Table 3. The parameters and levels used for sensitivity analysis based on operating conditionsParameter Unit −1 Level +1 Level −alpha +alphaFeed pressure atm 5.64 16.35 2 20Feed temperature K 303.28 333.01 293 343Mole fraction of CO2 in feed - 0.3216 0.6783 0.2 0.8
Table 4. The parameters and levels used for sensitivity analysis based on physical geometriesParameter Unit −1 Level +1 Level −alpha +alphaFiber inner diameter µm 275 425 200 500Module diameter cm 20 40 10 50Number of fibers - 1288 3673 50 5000Active fiber length cm 32.5 77.5 10 100
Table 5. CCD parameters and mole fraction of CO2 in permeatebased on operating conditions
RunFeed
pressure(atm)
Feedtemperature
(K)
Mole fractionof CO2
in feed
Mole fractionof CO2
in permeate01 11.00 343.15 0.5000 0.738502 16.35 303.28 0.6783 0.856203 11.00 318.15 0.5000 0.730404 11.00 318.15 0.8000 0.921305 16.35 303.28 0.3216 0.549406 11.00 318.15 0.5000 0.730407 11.00 318.15 0.5000 0.730408 05.64 333.01 0.6783 0.850109 11.00 293.15 0.5000 0.720710 05.64 333.01 0.3216 0.527911 11.00 318.15 0.5000 0.730412 11.00 318.15 0.2000 0.379113 11.00 318.15 0.5000 0.730414 11.00 318.15 0.5000 0.730415 20.00 318.15 0.5000 0.737216 2.0 318.15 0.5000 0.631317 05.64 303.28 0.3216 0.517818 05.64 303.28 0.6783 0.843219 16.35 333.01 0.3216 0.561820 16.35 333.01 0.6783 0.8632
3094 S. S. Hosseini et al.
November, 2016
y=−2.54827−0.12763PF+0.015643TF+5.668797xF+0.000428PFTF (23)y=+0.0302PFxF−0.01313TFxF−0.00074PF
2−2.3e−5TF2−1.0436xF
2
y=0.80434+1.67e−6N+7.34e−5L−1.07e (24)y=−7NL−1.77e−10N2−3.62e−7L2
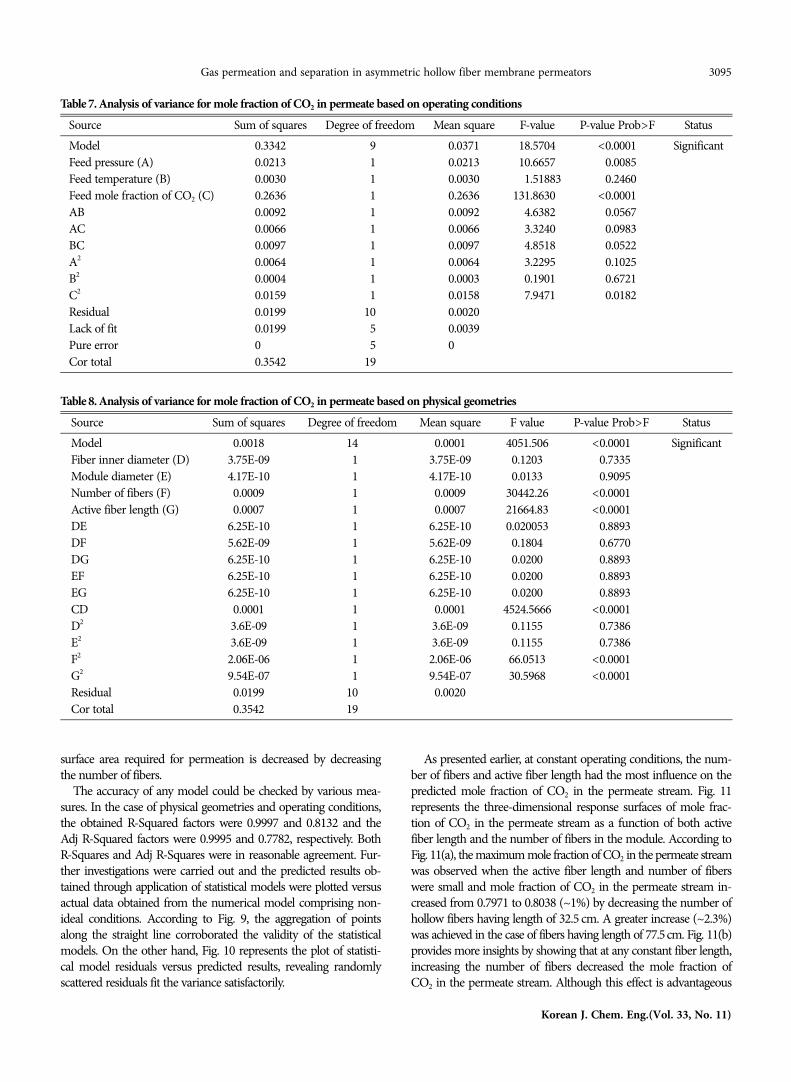
These quadratic models have the least P-values. P-value is a signif-icance check parameter that its smaller value means it is more sig-nificant [54]. Essentially, values of Prob>F less than 0.0500 indicatethat model terms are significant. Based on the above results, theanalysis of variance for the responses of quadratic model is pre-sented in Tables 7 and 8 for operating conditions and physicalgeometries, respectively. In these tables, the sum of squares wastaken based on the deviations from the mean value. Also, the num-ber of terms added to the statistical quadratic model was definedby degree of freedom and F was defined by dividing sum of squaresdivided by the degree of freedom. Cor Total is the corrected totalsum of squares representing the total amount of variations to themean value. According to Table 7, the P-value probes correspond-
ing to the input parameters were in the acceptable range, indicat-ing the validity of the statistical model. According to Table 8, F, G,FG, F2 and G2 were significant model terms in the case of physi-cal geometries and were considered in the model. However, val-ues greater than 0.1000 indicate insignificant model terms, thuscorresponding variables were excluded from the model to avoidunnecessary complexity.
According to Eq. (23), the mole fraction of the more perme-able component in feed had the most effect on the mole fractionof CO2 in the permeate stream. Also, the statistical model showedthat the interaction between feed pressure and mole fraction ofCO2 was considerable. On the other hand, the negative quadraticeffect of mole fraction of CO2 in feed may have had a significanteffect.
Considering physical geometries and with the aid of Eq. (24),the number of fibers and active fiber length had the most import-ant effect on the results. The number of fibers has a direct influ-ence on packing density and worth optimization. In fact, a largenumber of fibers can result in excessive pressure drop, whereas the
Table 6. CCD parameters and mole fraction of CO2 in permeate based on physical geometries
Run Fiber inner diameter(µm)
Module diameter(cm) Number of fibers Active fiber length
(cm)Mole fraction of CO2
in permeate01 350 30 2525 10. 0.805202 350 30 2525 100.0 0.784603 425 40 3763 077.5 0.780404 500 30 2525 55. 0.795605 275 40 1288 032.5 0.803806 350 30 2525 55. 0.795607 200 30 2525 55. 0.795608 350 30 2525 55. 0.795609 425 40 1288 032.5 0.803910 425 20 1288 032.5 0.803911 275 20 3763 032.5 0.797112 350 30 2525 55. 0.795613 275 20 1288 077.5 0.799014 425 20 1288 077.5 0.799115 350 30 2525 55. 0.795616 350 30 2525 55. 0.795617 350 30 5000 55. 0.782218 425 20 3763 032.5 0.797119 350 30 2525 55. 0.795620 275 40 3763 032.5 0.797121 275 40 3763 077.5 0.780422 275 20 3763 077.5 0.780423 425 40 3763 032.5 0.797124 275 40 1288 077.5 0.799025 425 40 1288 077.5 0.799026 350 10 2525 55. 0.795627 350 30 2525 55. 0.795628 350 50 2525 55. 0.795629 275 20 1288 032.5 0.803830 425 20 3763 077.5 0.7804
Gas permeation and separation in asymmetric hollow fiber membrane permeators 3095
Korean J. Chem. Eng.(Vol. 33, No. 11)
surface area required for permeation is decreased by decreasingthe number of fibers.
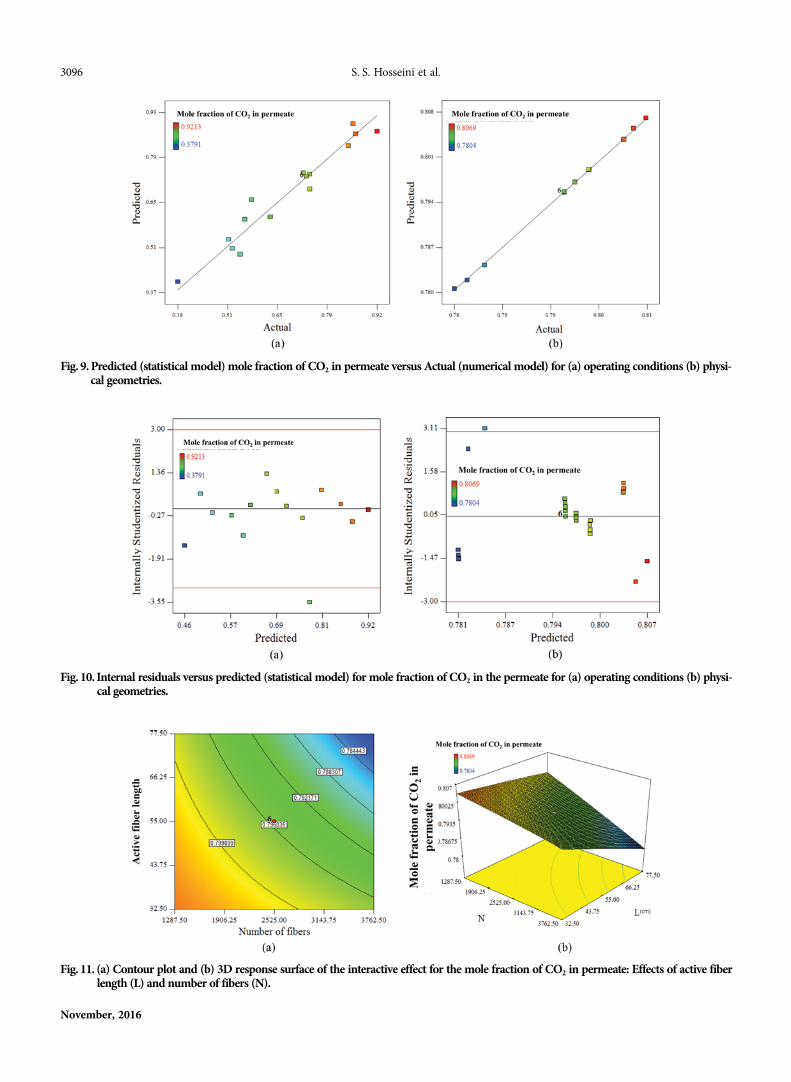
The accuracy of any model could be checked by various mea-sures. In the case of physical geometries and operating conditions,the obtained R-Squared factors were 0.9997 and 0.8132 and theAdj R-Squared factors were 0.9995 and 0.7782, respectively. BothR-Squares and Adj R-Squares were in reasonable agreement. Fur-ther investigations were carried out and the predicted results ob-tained through application of statistical models were plotted versusactual data obtained from the numerical model comprising non-ideal conditions. According to Fig. 9, the aggregation of pointsalong the straight line corroborated the validity of the statisticalmodels. On the other hand, Fig. 10 represents the plot of statisti-cal model residuals versus predicted results, revealing randomlyscattered residuals fit the variance satisfactorily.
As presented earlier, at constant operating conditions, the num-ber of fibers and active fiber length had the most influence on thepredicted mole fraction of CO2 in the permeate stream. Fig. 11represents the three-dimensional response surfaces of mole frac-tion of CO2 in the permeate stream as a function of both activefiber length and the number of fibers in the module. According toFig. 11(a), the maximum mole fraction of CO2 in the permeate streamwas observed when the active fiber length and number of fiberswere small and mole fraction of CO2 in the permeate stream in-creased from 0.7971 to 0.8038 (~1%) by decreasing the number ofhollow fibers having length of 32.5 cm. A greater increase (~2.3%)was achieved in the case of fibers having length of 77.5cm. Fig. 11(b)provides more insights by showing that at any constant fiber length,increasing the number of fibers decreased the mole fraction ofCO2 in the permeate stream. Although this effect is advantageous
Table 7. Analysis of variance for mole fraction of CO2 in permeate based on operating conditionsSource Sum of squares Degree of freedom Mean square F-value P-value Prob>F StatusModel 0.3342 09 0.0371 18.5704 <0.0001 SignificantFeed pressure (A) 0.0213 01 0.0213 10.6657 <0.0085Feed temperature (B) 0.0030 01 0.0030 001.51883 <0.2460Feed mole fraction of CO2 (C) 0.2636 01 0.2636 131.86300 <0.0001AB 0.0092 01 0.0092 04.6382 <0.0567AC 0.0066 01 0.0066 03.3240 <0.0983BC 0.0097 01 0.0097 04.8518 <0.0522A2 0.0064 01 0.0064 03.2295 <0.1025B2 0.0004 01 0.0003 00.1901 <0.6721C2 0.0159 01 0.0158 07.9471 <0.0182Residual 0.0199 10 0.0020Lack of fit 0.0199 05 0.0039Pure error 0.0000 05 0.0000Cor total 0.3542 19
Table 8. Analysis of variance for mole fraction of CO2 in permeate based on physical geometriesSource Sum of squares Degree of freedom Mean square F value P-value Prob>F StatusModel 0.0018 14 0.0001 4051.506 <0.0001 SignificantFiber inner diameter (D) 3.75E-09 01 3.75E-09 0.1203 <0.7335Module diameter (E) 4.17E-10 01 4.17E-10 0.0133 <0.9095Number of fibers (F) 0.0009 01 0.0009 30442.26 <0.0001Active fiber length (G) 0.0007 01 0.0007 21664.83 <0.0001DE 6.25E-10 01 6.25E-10 0.020053 <0.8893DF 5.62E-09 01 5.62E-09 0.1804 <0.6770DG 6.25E-10 01 6.25E-10 0.0200 <0.8893EF 6.25E-10 01 6.25E-10 0.0200 <0.8893EG 6.25E-10 01 6.25E-10 0.0200 <0.8893CD 0.0001 01 0.0001 4524.5666 <0.0001D2 3.6E-09 01 3.6E-09 0.1155 <0.7386E2 3.6E-09 01 3.6E-09 0.1155 <0.7386F2 2.06E-06 01 2.06E-06 66.0513 <0.0001G2 9.54E-07 01 9.54E-07 30.5968 <0.0001Residual 0.0199 10 0.0020Cor total 0.3542 19
3096 S. S. Hosseini et al.
November, 2016
Fig. 9. Predicted (statistical model) mole fraction of CO2 in permeate versus Actual (numerical model) for (a) operating conditions (b) physi-cal geometries.
Fig. 11. (a) Contour plot and (b) 3D response surface of the interactive effect for the mole fraction of CO2 in permeate: Effects of active fiberlength (L) and number of fibers (N).
Fig. 10. Internal residuals versus predicted (statistical model) for mole fraction of CO2 in the permeate for (a) operating conditions (b) physi-cal geometries.
Gas permeation and separation in asymmetric hollow fiber membrane permeators 3097
Korean J. Chem. Eng.(Vol. 33, No. 11)
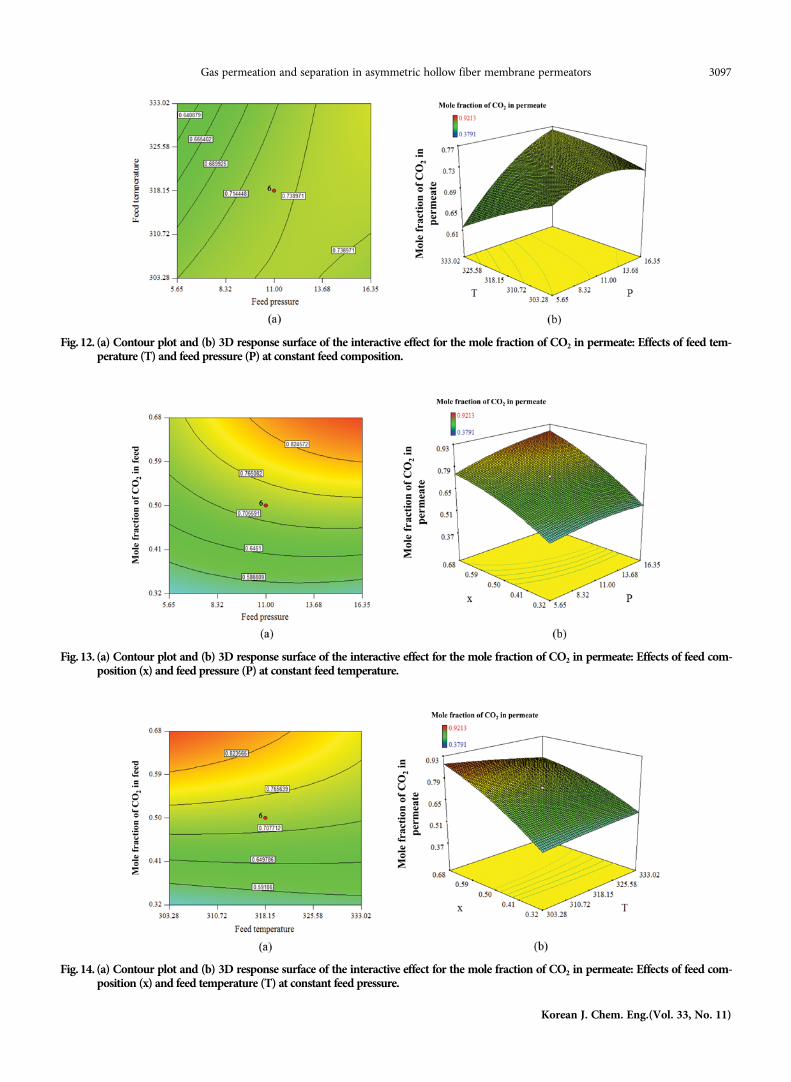
Fig. 12. (a) Contour plot and (b) 3D response surface of the interactive effect for the mole fraction of CO2 in permeate: Effects of feed tem-perature (T) and feed pressure (P) at constant feed composition.
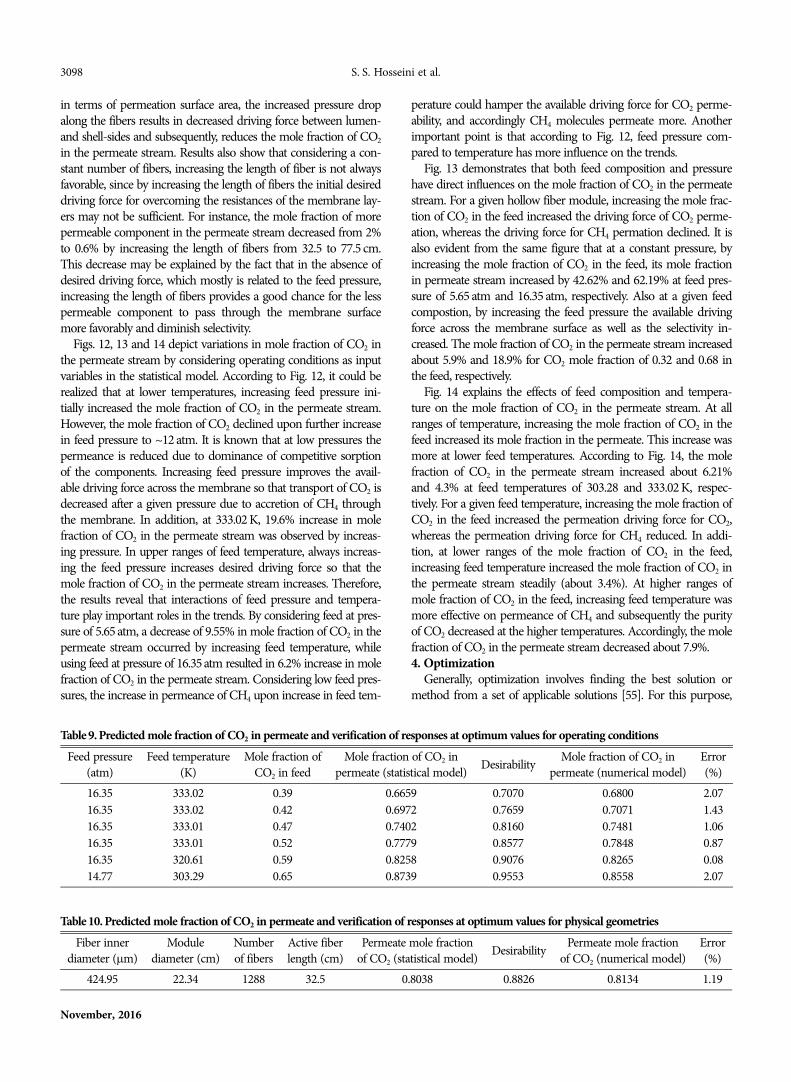
Fig. 13. (a) Contour plot and (b) 3D response surface of the interactive effect for the mole fraction of CO2 in permeate: Effects of feed com-position (x) and feed pressure (P) at constant feed temperature.
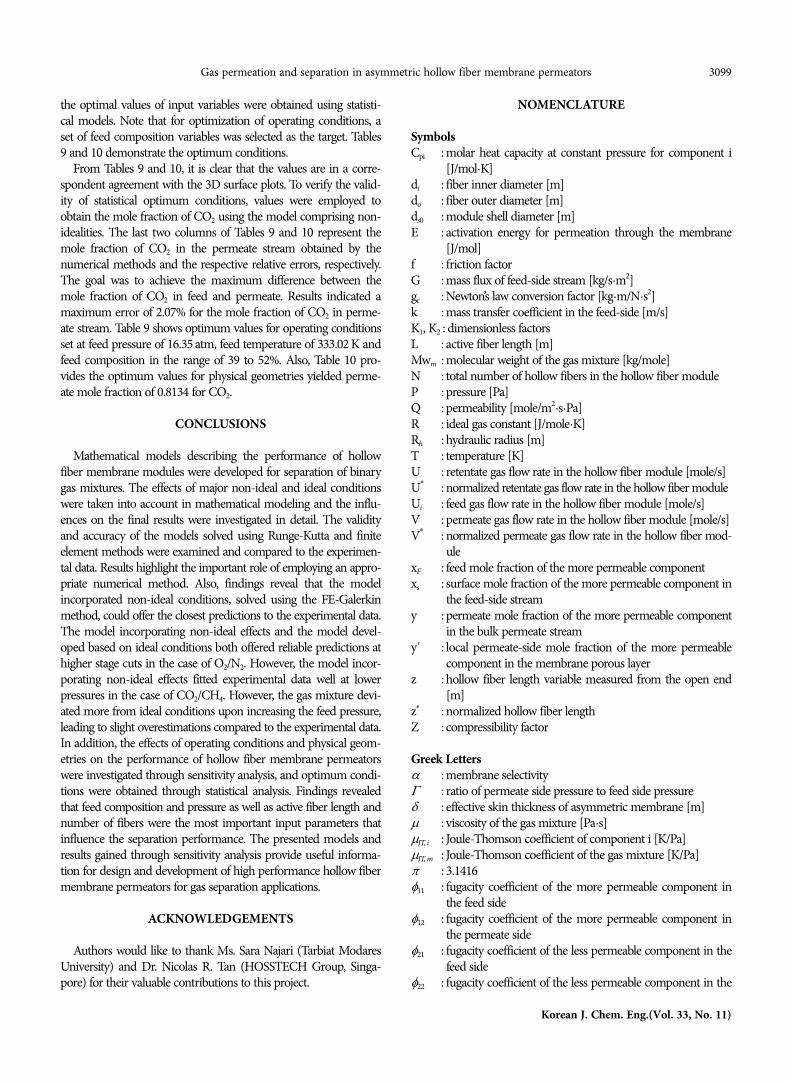
Fig. 14. (a) Contour plot and (b) 3D response surface of the interactive effect for the mole fraction of CO2 in permeate: Effects of feed com-position (x) and feed temperature (T) at constant feed pressure.
3098 S. S. Hosseini et al.
November, 2016
in terms of permeation surface area, the increased pressure dropalong the fibers results in decreased driving force between lumen-and shell-sides and subsequently, reduces the mole fraction of CO2
in the permeate stream. Results also show that considering a con-stant number of fibers, increasing the length of fiber is not alwaysfavorable, since by increasing the length of fibers the initial desireddriving force for overcoming the resistances of the membrane lay-ers may not be sufficient. For instance, the mole fraction of morepermeable component in the permeate stream decreased from 2%to 0.6% by increasing the length of fibers from 32.5 to 77.5 cm.This decrease may be explained by the fact that in the absence ofdesired driving force, which mostly is related to the feed pressure,increasing the length of fibers provides a good chance for the lesspermeable component to pass through the membrane surfacemore favorably and diminish selectivity.
Figs. 12, 13 and 14 depict variations in mole fraction of CO2 inthe permeate stream by considering operating conditions as inputvariables in the statistical model. According to Fig. 12, it could berealized that at lower temperatures, increasing feed pressure ini-tially increased the mole fraction of CO2 in the permeate stream.However, the mole fraction of CO2 declined upon further increasein feed pressure to ~12 atm. It is known that at low pressures thepermeance is reduced due to dominance of competitive sorptionof the components. Increasing feed pressure improves the avail-able driving force across the membrane so that transport of CO2 isdecreased after a given pressure due to accretion of CH4 throughthe membrane. In addition, at 333.02 K, 19.6% increase in molefraction of CO2 in the permeate stream was observed by increas-ing pressure. In upper ranges of feed temperature, always increas-ing the feed pressure increases desired driving force so that themole fraction of CO2 in the permeate stream increases. Therefore,the results reveal that interactions of feed pressure and tempera-ture play important roles in the trends. By considering feed at pres-sure of 5.65 atm, a decrease of 9.55% in mole fraction of CO2 in thepermeate stream occurred by increasing feed temperature, whileusing feed at pressure of 16.35 atm resulted in 6.2% increase in molefraction of CO2 in the permeate stream. Considering low feed pres-sures, the increase in permeance of CH4 upon increase in feed tem-
Table 9. Predicted mole fraction of CO2 in permeate and verification of responses at optimum values for operating conditionsFeed pressure
(atm)Feed temperature
(K)Mole fraction of
CO2 in feedMole fraction of CO2 in
permeate (statistical model) Desirability Mole fraction of CO2 inpermeate (numerical model)
Error(%)
16.35 333.02 0.39 0.6659 0.7070 0.6800 2.0716.35 333.02 0.42 0.6972 0.7659 0.7071 1.4316.35 333.01 0.47 0.7402 0.8160 0.7481 1.0616.35 333.01 0.52 0.7779 0.8577 0.7848 0.8716.35 320.61 0.59 0.8258 0.9076 0.8265 0.0814.77 303.29 0.65 0.8739 0.9553 0.8558 2.07
Table 10. Predicted mole fraction of CO2 in permeate and verification of responses at optimum values for physical geometriesFiber inner
diameter (µm)Module
diameter (cm)Numberof fibers
Active fiberlength (cm)
Permeate mole fractionof CO2 (statistical model) Desirability Permeate mole fraction
of CO2 (numerical model)Error(%)
424.95 22.34 1288 32.5 0.8038 0.8826 0.8134 1.19
perature could hamper the available driving force for CO2 perme-ability, and accordingly CH4 molecules permeate more. Anotherimportant point is that according to Fig. 12, feed pressure com-pared to temperature has more influence on the trends.
Fig. 13 demonstrates that both feed composition and pressurehave direct influences on the mole fraction of CO2 in the permeatestream. For a given hollow fiber module, increasing the mole frac-tion of CO2 in the feed increased the driving force of CO2 perme-ation, whereas the driving force for CH4 permation declined. It isalso evident from the same figure that at a constant pressure, byincreasing the mole fraction of CO2 in the feed, its mole fractionin permeate stream increased by 42.62% and 62.19% at feed pres-sure of 5.65 atm and 16.35 atm, respectively. Also at a given feedcompostion, by increasing the feed pressure the available drivingforce across the membrane surface as well as the selectivity in-creased. The mole fraction of CO2 in the permeate stream increasedabout 5.9% and 18.9% for CO2 mole fraction of 0.32 and 0.68 inthe feed, respectively.
Fig. 14 explains the effects of feed composition and tempera-ture on the mole fraction of CO2 in the permeate stream. At allranges of temperature, increasing the mole fraction of CO2 in thefeed increased its mole fraction in the permeate. This increase wasmore at lower feed temperatures. According to Fig. 14, the molefraction of CO2 in the permeate stream increased about 6.21%and 4.3% at feed temperatures of 303.28 and 333.02 K, respec-tively. For a given feed temperature, increasing the mole fraction ofCO2 in the feed increased the permeation driving force for CO2,whereas the permeation driving force for CH4 reduced. In addi-tion, at lower ranges of the mole fraction of CO2 in the feed,increasing feed temperature increased the mole fraction of CO2 inthe permeate stream steadily (about 3.4%). At higher ranges ofmole fraction of CO2 in the feed, increasing feed temperature wasmore effective on permeance of CH4 and subsequently the purityof CO2 decreased at the higher temperatures. Accordingly, the molefraction of CO2 in the permeate stream decreased about 7.9%.4. Optimization
Generally, optimization involves finding the best solution ormethod from a set of applicable solutions [55]. For this purpose,
Gas permeation and separation in asymmetric hollow fiber membrane permeators 3099
Korean J. Chem. Eng.(Vol. 33, No. 11)
the optimal values of input variables were obtained using statisti-cal models. Note that for optimization of operating conditions, aset of feed composition variables was selected as the target. Tables9 and 10 demonstrate the optimum conditions.
From Tables 9 and 10, it is clear that the values are in a corre-spondent agreement with the 3D surface plots. To verify the valid-ity of statistical optimum conditions, values were employed toobtain the mole fraction of CO2 using the model comprising non-idealities. The last two columns of Tables 9 and 10 represent themole fraction of CO2 in the permeate stream obtained by thenumerical methods and the respective relative errors, respectively.The goal was to achieve the maximum difference between themole fraction of CO2 in feed and permeate. Results indicated amaximum error of 2.07% for the mole fraction of CO2 in perme-ate stream. Table 9 shows optimum values for operating conditionsset at feed pressure of 16.35 atm, feed temperature of 333.02 K andfeed composition in the range of 39 to 52%. Also, Table 10 pro-vides the optimum values for physical geometries yielded perme-ate mole fraction of 0.8134 for CO2.
CONCLUSIONS
Mathematical models describing the performance of hollowfiber membrane modules were developed for separation of binarygas mixtures. The effects of major non-ideal and ideal conditionswere taken into account in mathematical modeling and the influ-ences on the final results were investigated in detail. The validityand accuracy of the models solved using Runge-Kutta and finiteelement methods were examined and compared to the experimen-tal data. Results highlight the important role of employing an appro-priate numerical method. Also, findings reveal that the modelincorporated non-ideal conditions, solved using the FE-Galerkinmethod, could offer the closest predictions to the experimental data.The model incorporating non-ideal effects and the model devel-oped based on ideal conditions both offered reliable predictions athigher stage cuts in the case of O2/N2. However, the model incor-porating non-ideal effects fitted experimental data well at lowerpressures in the case of CO2/CH4. However, the gas mixture devi-ated more from ideal conditions upon increasing the feed pressure,leading to slight overestimations compared to the experimental data.In addition, the effects of operating conditions and physical geom-etries on the performance of hollow fiber membrane permeatorswere investigated through sensitivity analysis, and optimum condi-tions were obtained through statistical analysis. Findings revealedthat feed composition and pressure as well as active fiber length andnumber of fibers were the most important input parameters thatinfluence the separation performance. The presented models andresults gained through sensitivity analysis provide useful informa-tion for design and development of high performance hollow fibermembrane permeators for gas separation applications.
ACKNOWLEDGEMENTS
Authors would like to thank Ms. Sara Najari (Tarbiat ModaresUniversity) and Dr. Nicolas R. Tan (HOSSTECH Group, Singa-pore) for their valuable contributions to this project.
NOMENCLATURE
SymbolsCpi : molar heat capacity at constant pressure for component i
[J/mol·K]di : fiber inner diameter [m]do : fiber outer diameter [m]ds0 : module shell diameter [m]E : activation energy for permeation through the membrane
[J/mol]f : friction factorG : mass flux of feed-side stream [kg/s·m2]gc : Newton’s law conversion factor [kg·m/N·s2]k : mass transfer coefficient in the feed-side [m/s]K1, K2 : dimensionless factorsL : active fiber length [m]Mwm : molecular weight of the gas mixture [kg/mole]N : total number of hollow fibers in the hollow fiber moduleP : pressure [Pa]Q : permeability [mole/m2·s·Pa]R : ideal gas constant [J/mole·K]Rh : hydraulic radius [m]T : temperature [K]U : retentate gas flow rate in the hollow fiber module [mole/s]U* : normalized retentate gas flow rate in the hollow fiber moduleUi : feed gas flow rate in the hollow fiber module [mole/s]V : permeate gas flow rate in the hollow fiber module [mole/s]V* : normalized permeate gas flow rate in the hollow fiber mod-
ulexF : feed mole fraction of the more permeable componentxs : surface mole fraction of the more permeable component in
the feed-side streamy : permeate mole fraction of the more permeable component
in the bulk permeate streamy' : local permeate-side mole fraction of the more permeable
component in the membrane porous layerz : hollow fiber length variable measured from the open end
[m]z* : normalized hollow fiber lengthZ : compressibility factor
Greek Lettersα : membrane selectivityΓ : ratio of permeate side pressure to feed side pressureδ : effective skin thickness of asymmetric membrane [m]μ : viscosity of the gas mixture [Pa·s]μJT, i : Joule-Thomson coefficient of component i [K/Pa]μJT, m : Joule-Thomson coefficient of the gas mixture [K/Pa]π : 3.1416φ11 : fugacity coefficient of the more permeable component in
the feed sideφ12 : fugacity coefficient of the more permeable component in
the permeate sideφ21 : fugacity coefficient of the less permeable component in the
feed sideφ22 : fugacity coefficient of the less permeable component in the
3100 S. S. Hosseini et al.
November, 2016
permeate side
Subscripts0 : standard conditiona : more permeable componentb : less permeable componentF : feed sidei : open end of the fiber (feed inlet) or component ij : component jm : gas mixtureo : closed end of the fiber (retentate outlet)P : permeate sideref : reference
REFERENCES
1. S. S. Hosseini and T. S. Chung, J. Membr. Sci., 328, 174 (2009).2. M. A. Alaei Shahmirzadi, S. S. Hosseini, G. Ruan and N. R. Tan,
RSC Adv., 5, 49080 (2015).3. S. S. Hosseini, Y. Li, T.-S. Chung and Y. Liu, J. Membr. Sci., 302,
207 (2007).4. H. Kwon, M. Lu and J. Lee, Korean J. Chem. Eng., 31, 949 (2014).5. S. S. Hosseini, M. R. Omidkhah, A. Zarringhalam Moghaddam, V.
Pirouzfar, W. B. Krantz and N. R. Tan, Sep. Purif. Technol., 122, 278(2014).
6. S. Najari, S. S. Hosseini, M. Omidkhah and N. R. Tan, RSC Adv., 5,47199 (2015).
7. S. S. Hosseini and T. S. Chung, Polymer blends and carbonized poly-mer blends, in, Google Patents (2014).
8. J. K. Park and J. I. Seo, Korean J. Chem. Eng., 19, 940 (2002).9. S.S. Hosseini, M.M. Teoh and T.S. Chung, Polymer, 49, 1594 (2008).
10. T. Teerachaiyapat and P. Ramakul, Korean J. Chem. Eng., 33, 8(2016).
11. S. Weller and W. A. Steiner, J. Appl. Phys., 21, 279 (1950).12. S. S. Hosseini, N. Peng and T. S. Chung, J. Membr. Sci., 349, 156
(2010).13. Q. T. Nguyen, R. Gref, R. Clément and H. Lenda, Colloid Polym.
Sci., 271, 1134 (1993).14. K. A. Fattah, S. M. Hamam, G. Al-Enezi, H. M. Ettoueny and R.
Hughes, J. Membr. Sci., 65, 247 (1992).15. P. K. Kundu, A. Chakma and X. Feng, Can. J. Chem. Eng., 90, 1253
(2012).16. R. Wang, S. L. Liu, T. T. Lin and T. S. Chung, Chem. Eng. Sci., 57, 967
(2002).17. S. Giglia, B. Bikson, J. E. Perrin and A. A. Donatelli, Ind. Eng. Chem.
Res., 30, 1239 (1991).18. B. J. Gornshteyn, Can. J. Chem. Eng., 81, 139 (2003).19. A. F. Ismail and S. Haron, Development of a simulation model for a
hollow fiber membrane N2-H2 separation system, Jurnal Teknologi,45 (2000).
20. T. Katoh, M. Tokumura, H. Yoshikawa and Y. Kawase, Sep. Purif.Technol., 76, 362 (2011).
21. A. S. Kovvali, S. Vemury and W. Admassu, Ind. Eng. Chem. Res.,33, 896 (1994).
22. S. P. Lim, X. Tan and K. Li, Chem. Eng. Sci., 55, 2641 (2000).23. J. Marriott and E. Sorensen, Chem. Eng. Sci., 58, 4975 (2003).
24. J. I. Marriott, E. Sorensen and I. D. L. Bogle, Comput. Chem. Eng.,25, 693 (2001).
25. S. Zhao, Z. Li, Y. Liu and L. e. Wang, Desalination, 233, 310 (2008).26. S. P. Kaldis, G. C. Kapantaidakis, T. I. Papadopoulos and G. P.
Sakellaropoulos, J. Membr. Sci., 142, 43 (1998).27. D. T. Coker, T. Allen, B. D. Freeman and G. K. Fleming, AIChE J.,
45, 1451 (1999).28. R. Khalilpour, A. Abbas, Z. Lai and I. Pinnau, Chem. Eng. Res.
Design, 91, 332 (2013).29. P. K. Kundu, A. Chakma and X. Feng, Can. J. Chem. Eng., 91, 1092
(2012).30. A. Makaruk and M. Harasek, J. Membr. Sci., 344, 258 (2009).31. A. A. Shamsabadi, A. Kargari, F. Farshadpour and S. Laki, J. Membr.
Sep. Technol., 1, 19 (2012).32. C. Y. Pan, AIChE J., 32, 2020 (1986).33. S. S. Hosseini, S. M. Roodashti, P. K. Kundu and N. R. Tan, Can. J.
Chem. Eng., 93, 1275 (2015).34. S.S. Hosseini, S. Najari, P. K. Kundu, N. R. Tan and S. M. Roo-
dashti, RSC Adv., 5, 86359 (2015).35. A. F. Ismail, H. Saidi and A. Abdul Rahman, Numerical solution
of a mathematical model for hollow-fiber membrane gas separa-tion system, in: Seminar Penyelidikan Fakulti Kej. Kimia & Kej.Sumber Asli, Jawatankuasa PenyelIdikan & Perundingan, FakultiKej. Kimia & Kej. Sumber Asli, UTM, 1 (1993).
36. C. Y. Pan, AIChE J., 29, 545 (1983).37. V. Singh, R. R. Rhinehart, R. S. Narayan and R. W. Tock, Ind. Eng.
Chem. Res., 34, 4472 (1995).38. M. Scholz, T. Harlacher, T. Melin and M. Wessling, Ind. Eng. Chem.
Res., 52, 1079 (2012).39. J. A. Dehkordi, S. S. Hosseini, P. K. Kundu and N. R. Tan, Chemi-
cal Product and Process Modeling, 11, 11 (2016).40. S. S. Hosseini, J. A. Dehkordi and P. K. Kundu, Chemical Product
and Process Modeling, 11, 7 (2016).41. J. M. Prausnitz, R. N. Lichtenthaler and E.G. de Azevedo, Molecular
thermodynamics of fluid-phase equilibria, Pearson Education (1998).42. H. Gorissen, Chemical Engineering and Processing: Process Intensifi-
cation, 22, 63 (1987).43. B. E. Poling, J. M. Prausnitz and J. P. O’Connell, The Properties of
Gases and Liquids, 5th Ed., McGraw-Hill Professional (2001).44. B. Cockburn, G. E. Karniadakis and C.-W. Shu, The development
of discontinuous Galerkin methods, Springer (2000).45. A. Al-Omari, H.-B. Schuttler, J. Arnold and T. Taha, Solving Non-
linear Systems of First Order Ordinary Differential EquationsUsing a Galerkin Finite Element Method, Access, IEEE, 1, 408(2013).
46. S. Rastegar, S. Mousavi, M. Rezaei and S. Shojaosadati, J. Ind. Eng.Chem., 20, 3096 (2014).
47. A. Hassani, R. Darvishi Cheshmeh Soltani, M. Kıranşan, S. Karaca,C. Karaca and A. Khataee, Korean J. Chem. Eng., 33, 178 (2016).
48. R. H. Myers, D. C. Montgomery and C. M. Anderson-Cook,Response surface methodology: process and product optimizationusing designed experiments, John Wiley & Sons (2009).
49. L. Tranchino, R. Santarossa, F. Carta, C. Fabiani and L. Bimbi, Sep.Sci. Technol., 24, 1207 (1989).
50. X. Feng, J. Ivory and V. S. V. Rajan, AIChE J., 45, 2142 (1999).51. E. Sanders, W. J. Koros, H. Hopfenberg and V. Stannett, J. Membr.

Gas permeation and separation in asymmetric hollow fiber membrane permeators 3101
Korean J. Chem. Eng.(Vol. 33, No. 11)
Sci., 18, 53 (1984).52. R. Chern, W. Koros, B. Yui, H. Hopfenberg and V. Stannett, J.
Polym. Sci.: Polym. Phys. Ed., 22, 1061 (1984).53. M. Donohue, B. Minhas and S. Lee, J. Membr. Sci., 42, 197 (1989).
54. V. Pirouzfar, S. S. Hosseini, M. R. Omidkhah and A. Z. Mogh-addam, Polym. Eng. Sci., 54, 147 (2014).
55. G. Dantzig, The nature of mathematical programming, Mathemati-cal Programming Glossary (2010).
Related Documents