2012-05-16 Workbook for Gas Man ® a simulation and teaching tool by James H. Philip, ME(E), MD Harvard Medical School

Welcome message from author
This document is posted to help you gain knowledge. Please leave a comment to let me know what you think about it! Share it to your friends and learn new things together.
Transcript

2012-05-16
Workbook for Gas Man ®
a simulation and teaching tool
by James H. Philip, ME(E), MD Harvard Medical School


i | P a g e
Preface
There are many uses for computer technology within the practice of anesthesia. Usually, computers are used to automate practices which are already well-established. Using the computer to help teach difficult concepts is another matter, however, that goes far beyond the automation of procedure. Computer-aided learning is difficult to develop, but very rewarding in its effectiveness. This program, Gas Man®, exploits this medium and helps learners understand anesthesia uptake and distribution.
The fundamental principles underlying anesthetic pharmacokinetics are simple. The two important rules are conservation of mass and physiologic maintenance of lung volume. Unfortunately, the dynamic implications of these principles are not easy to comprehend. Indeed, it is the need for explanation and demonstration of the dynamic changes in anesthetic tension equilibration which led me to design and implement this educational tool.
The Gas Man program is a powerful marriage of computer simulation and image production with the written word. In place of the instructor in a simulation laboratory, we have the instructor's voice (in print) and a laboratory, both inside a personal computer. By using the set of exercises in this Manual, and by learning how to use Gas Man as a tool for further exploration, users can study the simplicities and subtleties of the dynamic properties of anesthesia uptake and distribution regardless of where they are or what other resources are available to them.
I first began investigating the use of computers to help teach the concepts of anesthesia uptake and distribution in 1980, when I received a grant from the Apple Educational Foundation to explore the use of Apple II computers. In 1982 the first version of Gas Man for the Apple II was shown at the American Society of Anesthesiologists meeting and then the New York Society of Anesthesiologists Post Graduate Assembly (NYSA-PGA) where it won a Special Award. The program and a set of exercises similar to this Manual was published and distributed by Addison-Wesley in 1984. After many colleagues clamored for an updated version of the program suitable for microcomputers, we demonstrated in 1989 a version of Gas Man® for the Macintosh. In 1994 we released Gas Man® for Windows®, and Version 2.1, with many new features, was released in conjunction with this manual in October 1995. As computer operating systems evolved, so did Gas Man, each time adopting the latest Graphical User Interface (GUI) features.
Gas Man's new features significantly broaden the base of users and uses. The ability to compare and contrast anesthetic techniques and agent choices should attract a solid following by hospital administrators, pharmacists, and anyone concerned with the cost of health care.
The ability of the Gas Man Overlay to normalize tensions to agent MAC and then explore the effects of blood/gas solubility provides drug and equipment manufacturers with insights not previously available. Vaporizers for new agents sevoflurane and desflurane have maximum dial settings that account for both MAC and solubility, allowing the same relative alveolar overpressure found with halothane and desflurane vaporizers. Gas Man insights played a role in designing new vaporizers. Meanwhile, clinicians can use the same displays to compare and contrast administrations with different drugs and different techniques. Gas Man's wide ideal-body weight range - from 50 g to 1500 Kg - animals of interest to veterinarians can now be simulated with ease.

ii | P a g e
Gas Man has been reviewed favorably in numerous publications1, 2, 3, 4, 5, 10. Several studies have demonstrated the effectiveness of Gas Man as an educational tool in centers other than where it was written6, 7 and when compared to lecture presentation8. Ongoing study of its efficacy as a simulation program has endorsed its accuracy9. More recently, others have demonstrated that Gas Man accurately predicts expired anesthetic concentrations during induction and upon emergence after anesthetics of short and long duration11 . One recent study used Gas Man to explore context-sensitive decrement times across a wide spectrum of anesthetics, anesthetization periods, and decrement criteria12. I am committed to the wide-ranging audience of Gas Man users to continue to refine and enhance the program and its applications.
►ACKNOWLEDGEMENTS
I gratefully acknowledge the help and support of family members, friends, students, assistants, and teachers. I thank my family (Beverly, Noah, and Ben) for allowing me the time required to prepare both the computer program and this textbook. I thank my son, Ben, for the design of the Gas Man icon. I thank the staff and especially the residents of Brigham and Women's Hospital who afforded me the opportunity to develop and test both the program and text. Daniel Raemer, PhD provided insight and assistance in the initial system model. David Leith, MD provided information on scaling over wide weight ranges. Pauline Wong, DVM and other veterinary anesthesiologists encouraged me to actually add the wide range of weight capability. Iggy Calalang tested various components of the simulation for consistency. Khaled Khodr tested the implementation of some of Gas Man's new features including the second gas effect and weight scaling. Xin Bao Ji, PhD and Jeff Mandel, MD each tested various portions of the mathematics using analytic and simulation techniques. Ed Trautman completed the transition from Apple II to Macintosh. And, since 1990, Hal Franklin has designed and implemented the graphical user interface and optimized the underlying math to make Gas Man easy to use and easy to learn from. In doing so, he added numerous new features and ideas that only an insightful mathematician-engineer-physiologist could envision and implement. Conversion of Gas Man on different platforms via Qt to single program for multiple operating systems was done by ICS with Mark Hatch leading the group. The Gas Man Book in several versions was edited by Ron Waife, Jamie Bell, and Hal Franklin. Anne Kamara, my trusted administrative assistant, supported me in all my tasks related to this endeavor.
And I thank the enthusiastic Gas Man users and teachers who continue to encourage me to develop and release new versions, allowing a wider audience of users to draw benefit from this work.

iii | P a g e
►Med Man Simulations Inc, a nonprofit corporation
Med Man Simulations, Inc. (MMSI) is a nonprofit corporation, organized and existing under the laws of the Commonwealth of Massachusetts. It was created to foster the development and use of simulation in health care. The original corporation was formed in 1995 with the same mission. At that time, MMSI was a for-profit corporation with the intent that it run in a self-sustaining manner and support the educational goals. Gas Man® is the first and currently the only product produced and distributed by MMSI. It has been widely acclaimed and positively reviewed in numerous journals. It is used by individuals and institutions around the world. In 2007 the corporate structure was converted to nonprofit. MMSI is now a tax-exempt Public Educational and Research Charity under Internal Revenue Code 501(c)(3).
James H. Philip, M.E. (E.), M.D. Chestnut Hill, Massachusetts October 2010

iv | P a g e
►REVIEWS OF AND WRITING ABOUT AND USING GAS MAN®
1. Torda TA: Gas Man. Audio-Visual Review. Anaes Intens Care 13: 111, 1984.
2. Schneider AJ: GAS MAN. Educational Resources Review. News Soc Ed Anes 2: 2, 1985.
3. Brandom BW: GAS MAN. Book Reviews. Anes Analg 65:106,1986.
4. Shanks CA: Gas Man. Books. JAMA 255: 268, 1986.
5. Dean JM: GasMan. Software Review. MD Computing 3: 53, 1986.
6. Paskin S, Raemer, DB, Garfield JM, Philip JH: Is computer simulation of anesthetic uptake and distribution an effective teaching tool for anesthesia residents? J Clin Mon 1: 87, 1985.
7. Garfield JM, Paskin, S, Philip JH: An evaluation of the effectiveness of a computer simulation of anesthetic uptake and distribution as a teaching tool. Med Educ 23: 457, 1989.
8. Philip JH, Lema MJ, Raemer DB, Crocker D: Is computer simulation as effective as lecture for teaching residents anesthetic uptake and distribution? Anesthesiology 63: A503,1985.
9. Philip JH: Gas Man simulation of overpressure is verified by correct alveolar plateaus. Anesthesiology 73: A1025, 1990.
10. Gage, JS: Mathematics and judgment: A review of the computer simulation Gas Man. MD Computing 9:54,1992.
11. Bouillon T, Shafer S. Editorial – Hot air or full steam ahead? An empirical pharmacokinetic model of potent inhaled agents. Brit J. Anaes. 84:429-431 2000.
12. Eger EI, Shafer SL. Tutorial: Context-Sensitive Decrement Times for Inhaled Anesthetics. Anesth Analg 2005 101: 688-696.

v | P a g e
Table of Contents PREFACE ....................................................................................................................................................................... I TABLE OF CONTENTS ...................................................................................................................................................... V
CHAPTER 1 OVERVIEW OF GAS MAN® AND ITS USES ............................................................................................. 1
INTRODUCTION .............................................................................................................................................................. 1 THE GAS MAN APPROACH ............................................................................................................................................... 3 USES FOR GAS MAN ....................................................................................................................................................... 4 OTHER USERS OF GAS MAN............................................................................................................................................. 6 SUMMARY .................................................................................................................................................................... 7
CHAPTER 2 GETTING STARTED WITH GAS MAN® ................................................................................................... 8
INTRODUCTION .............................................................................................................................................................. 8 YOUR SOFTWARE LICENSE ............................................................................................................................................... 8
The Single User License ........................................................................................................................................ 8 The Site License .................................................................................................................................................... 8 Copying & Distributing the Manual & Software ................................................................................................... 9
INSTALLING GAS MAN ON WINDOWS™ OR MACINTOSH COMPUTERS ..................................................................................... 9 Hardware Requirements ...................................................................................................................................... 9 Installing the Software under a Single User or Site License.................................................................................. 9
THE GAS MAN CONTROL, PICTURE, AND GRAPH ............................................................................................................... 10 Setting Parameters............................................................................................................................................. 13
THE GAS MAN MENUS & TOOLBAR ................................................................................................................................ 14 MAIN MENU .............................................................................................................................................................. 14 THE TOOLBAR ............................................................................................................................................................. 18 WORKING WITH MULTIPLE VIEWS .................................................................................................................................. 19 RUNNING A GAS MAN SIMULATION ................................................................................................................................ 20
Exercise 2-1: Running a Simple Simulation ......................................................................................................... 20 Exercise 2-2: Replaying and Revising a Simulation ............................................................................................ 22
USING BOOKMARKS ..................................................................................................................................................... 22 SUMMARY .................................................................................................................................................................. 23
CHAPTER 3 A ONE COMPARTMENT MODEL ......................................................................................................... 24
Exercise 3-1: Wash-in of a Single Compartment ................................................................................................ 25 Exercise 3-2: τ = V/F ........................................................................................................................................... 31 Exercise 3-3: The Shape of the Exponential Curve .............................................................................................. 33
SUMMARY .................................................................................................................................................................. 34
CHAPTER 4 TWO SEQUENTIAL COMPARTMENTS ................................................................................................. 35
Exercise 4-1: The Step Response of a Perfectly Mixed Circuit ............................................................................ 36 Exercise 4-2: The Alveolar Step Response .......................................................................................................... 37 Exercise 4-3: Wash-in of Two Compartments .................................................................................................... 39 Exercise 4-4: Using Overpressure ....................................................................................................................... 41
SUMMARY .................................................................................................................................................................. 42

vi | P a g e
CHAPTER 5 THE ALVEOLAR TENSION CURVE ........................................................................................................ 43
Exercise 5-1: The Open Circuit Alveolar Tension Curve ...................................................................................... 44 Exercise 5-2: The Initial Rise in the Alveolar Tension Curve ................................................................................ 45 Exercise 5-3: Lower Ventilation Slows Initial Rise in Alveolar Tension ............................................................... 47 Exercise 5-4: Uptake Produces a Knee and Plateau in Alveolar Tension ............................................................ 48 Exercise 5-5: Increasing Alveolar Ventilation Raises the Knee and Plateau ....................................................... 49 Exercise 5-6: Increasing Cardiac Output Lowers the Knee and Plateau ............................................................. 52 Exercise 5-7a: Ratio of VA to Effective CO Determines Plateau Height .............................................................. 53 Exercise 5-7b: Plateau Increases with VA ........................................................................................................... 55 Exercise 5-7c: Plateau Increases inversely with CO ............................................................................................ 56 Exercise 5-8: Anesthetic in Venous Blood causes Gently-Rising Tail .................................................................. 58
SUMMARY .................................................................................................................................................................. 61
CHAPTER 6 PLATEAU HEIGHT & BLOOD GAS SOLUBILITY ..................................................................................... 62
Exercise 6-1: Alveolar Tension Curves Have the Same General Shape ............................................................... 63 Exercise 6-2: High λB/G Drugs Have Low Plateau and A/I or E/I .......................................................................... 67 Exercise 6-3: Determining the Initial Overpressure Value .................................................................................. 68 Exercise 6-4: Choosing the Solubility-adjusted Overpressure ............................................................................. 70
SUMMARY .................................................................................................................................................................. 72
CHAPTER 7 OVERPRESSURE & OPTIMUM ANESTHESIA ........................................................................................ 73
Exercise 7-1: Maintaining 1 MAC Using Overpressure ....................................................................................... 74 Exercise 7-2: Optimum Anesthesia Uses Overpressure ...................................................................................... 77 Exercise 7-3: Optimum Clinical Anesthesia Using Overpressure ........................................................................ 81
SUMMARY .................................................................................................................................................................. 85
CHAPTER 8 THE HIGH INSPIRED CONCENTRATION EFFECT ................................................................................... 86
Exercise 8-1: The Concentration Effect ............................................................................................................... 87 Exercise 8-2: Concentration Effect Varies with Inspired Concentration ............................................................. 88 Exercise 8-3: At 100%, CO Has No Effect on ALV ................................................................................................ 89 Exercise 8-4: Concentration Effect depends on Uptake Effect ........................................................................... 92
SUMMARY .................................................................................................................................................................. 94
CHAPTER 9 LOW FRESH GAS FLOW ANESTHESIA .................................................................................................. 95
Exercise 9-1: Reducing Fresh Gas Flow ............................................................................................................... 96 Exercise 9-2: Circuit Flush Is Faster..................................................................................................................... 98 Exercise 9-3: In a Perfect World… ..................................................................................................................... 101
SUMMARY ................................................................................................................................................................ 102
CHAPTER 10 CLOSED-CIRCUIT ANESTHESIA ........................................................................................................ 103
Exercise 10-1: Simulating Liquid Injection ........................................................................................................ 104 Exercise 10-2: Liquid Injection Can Produce Optimum Anesthesia .................................................................. 106 Exercise 10-3: Classic Closed-circuit Approach ................................................................................................. 109
SUMMARY ................................................................................................................................................................ 112
CHAPTER 11 THE SECOND GAS EFFECT ............................................................................................................... 113
Exercise 11-1: at Low Concentration, the Second Gas Effect is Slight .............................................................. 114 Exercise 11-2: at High Concentration, the Second Gas Effect is Dramatic ....................................................... 116 Exercise 11-3: Concentration Effect Using 70% Nitrous Oxide ......................................................................... 119
SUMMARY ................................................................................................................................................................ 120

vii | P a g e
CHAPTER 12 PATIENT WAKE UP ......................................................................................................................... 121
Exercise 12-1: Wake Up Is the Inverse of Induction.......................................................................................... 121 Exercise 12-2: Lower Solubility Means Lowers Alveolar Wake-up Tension ...................................................... 123
SUMMARY ................................................................................................................................................................ 126
CHAPTER 13 PATIENT SIZE ................................................................................................................................. 127
Exercise 13-1: Kinetics is Faster in Smaller Patients ......................................................................................... 128 Exercise 13-2: Kinetics is Faster in Smaller Animals ......................................................................................... 130
SUMMARY ................................................................................................................................................................ 131
CHAPTER 14 ANALYZING COST ........................................................................................................................... 132
Exercise 14-1: Determining Cost to Achieve 1 MAC ......................................................................................... 133 Exercise 14-2: Cost to Achieve 1 MAC is Lower with Lower FGF ...................................................................... 135 Exercise 14-3: Low Flow Techniques with New Agents .................................................................................... 138
SUMMARY ................................................................................................................................................................ 141
CHAPTER 15 HIGH FLOW DURING INDUCTION ................................................................................................... 142
Exercise 15-1: Simulate Anesthesia Induction with FGF 6 LPM ........................................................................ 142 Exercise 15-2: Simulate Anesthesia Induction with FGF 2 LPM ........................................................................ 144 Exercise 15-3: Induction at 6 L/min is much more rapid than at 2 L/min ........................................................ 145
SUMMARY ................................................................................................................................................................ 146
CHAPTER 16 BOLUS CONTROLLED ANESTHETIC DEPTH ...................................................................................... 147
THEORY ................................................................................................................................................................... 147 SUMMARY ................................................................................................................................................................ 150
CHAPTER 17 VITAL CAPACITY (DEEP BREATH) INDUCTION ................................................................................. 151
Exercise 17-1: Circuit Prime .............................................................................................................................. 152 Exercise 17-2: VCI Brings Expired to 2 MAC Immediately, VRG to 1.5 MAC Easily ........................................... 153 Exercise 17-3: Turning Vaporizer Off Delivers Negative Bolus ......................................................................... 154 Exercise 17-4: Achieving 2 MAC in the brain after Vital Capacity Induction .................................................... 156
SUMMARY ................................................................................................................................................................ 158
CHAPTER 18 VIMA ............................................................................................................................................. 159
Exercise 18-1: Maintenance of 1 MAC anesthesia until the end of surgery ..................................................... 160 Summary .......................................................................................................................................................... 161
CHAPTER 19 DON'T TURN FGF AND DEL DOWN AS SOON AS END-TIDAL ANESTHETIC CONCENTRATION REACHES THE DESIRED BRAIN ANESTHETIC LEVEL ............................................................................................................. 162
Exercise 19-1: Turning FGF and DEL Down Too Early ....................................................................................... 162 Exercise 19-2: Maintaining FGF and DEL after ALV Reaches 1 MAC ................................................................ 164
SUMMARY ................................................................................................................................................................ 165

viii | P a g e
APPENDIX A ....................................................................................................................................................... 166
EVOLUTION OF THE UNDERSTANDING, MODELING & SIMULATION OF ANESTHESIA UPTAKE & DISTRIBUTION .............................. 166
APPENDIX B ....................................................................................................................................................... 167
THE GAS MAN APPROACH ....................................................................................................................................... 167 Model Parameters ............................................................................................................................................ 168
FURTHER CONSIDERATIONS ON THE USE OF GAS MAN® .................................................................................................... 169 ORGAN VOLUMES ...................................................................................................................................................... 169 ORGAN BLOOD FLOWS ............................................................................................................................................... 169 BREATHING CIRCUIT ................................................................................................................................................... 169 SHUNTS AND DEAD SPACE ........................................................................................................................................... 170 INTER-TISSUE DIFFUSION ............................................................................................................................................. 170 SUMMARY ................................................................................................................................................................ 170
APPENDIX C ....................................................................................................................................................... 171
GAS MAN SYSTEM DEFAULTS ....................................................................................................................................... 171
APPENDIX D ....................................................................................................................................................... 173
GAS MAN VERSIONS & FUNCTIONS ............................................................................................................................... 173
APPENDIX E ....................................................................................................................................................... 176
Custom and Customized Anesthetics ............................................................................................................... 176 Program, View, Simulation, Anesthetic, Color and Patient Defaults ................................................................ 178 Bookmarks........................................................................................................................................................ 183 Saving, Opening, and Sharing Simulations ....................................................................................................... 183 Replaying Simulations ...................................................................................................................................... 186 Tabs, Windows and Panels (The Model, View, Controller Pattern) .................................................................. 187 Multiple Agent Simulations .............................................................................................................................. 189 Circuit flush....................................................................................................................................................... 192 Scrolling ............................................................................................................................................................ 192 Scaling .............................................................................................................................................................. 193 Using the Overlay Feature ................................................................................................................................ 193 Vaporization, injection and uptake .................................................................................................................. 194 The Ideal Circuit ................................................................................................................................................ 194 Printing and Previewing ................................................................................................................................... 195 Exporting to PDF, HTML and XML .................................................................................................................... 195 Capture and Copy ............................................................................................................................................. 196
BIBLIOGRAPHY ................................................................................................................................................... 197

1 | P a g e
Chapter 1 Overview of Gas Man® and its Uses Introduction Welcome to Gas Man® 4.1, the innovative computer-based teaching and simulation program. You are about to explore the concepts of inhalation anesthesia pharmacokinetics in a way that has proven to:
• increase the clarity and retention of the material, • speed your learning time, and • enhance your appreciation and enjoyment of the subject.
Gas Man is a computer simulation tool that teaches about anesthesia. Specifically, Gas Man focuses on anesthesia uptake and distribution, and the time course of anesthetic tension change. The program was designed to be used in close conjunction with this Manual, a text which guides the learner through a set of exercises that demonstrate the important concepts and features of the administration of inhalation anesthetics.
The computer simulation depicts anesthetic tension (partial pressure) in the anesthesia machine, breathing circuit, and patient. The key component of the program is an interactive schematic Picture which shows dynamically what the clinician controls and how the patient's lungs and tissues equilibrate with inspired anesthetic. The Gas Man Graph shows the evolving time course of gas tensions in the locations and tissues of interest. The Gas Man Overlay allows the user to analyze open simulations graphically, by displaying compartment tension ratios, and by comparing one simulation to another. Gas Man also enables you to study the cost of different anesthetic agents and explore anesthesia administration techniques.

2 | P a g e
Concepts Covered in the Gas Man Tutorial, by Chapter
Table 1-1. Concepts taught by Gas Man and the exercises in the manual.
1 Overview of Gas Man and its uses 2 Getting Started with Gas Man – How to use the program 3 The One Compartment Model & its Step Response or Wash-In 4 Two Sequential Compartments 5 The Alveolar Tension Curve
A The Initial Rise: Alveolar Wash-In Determinants: • Inspired Tension • Alveolar (lung) ventilation • Alveolar volume (FRC)
B The Knee: Equilibration with Blood Determinants: • Alveolar ventilation • Cardiac output • Blood/gas solubility
C The Tail: Augmentation by Venous Return Determinants: • Tissue blood flows • Tissue volumes • Tissue blood solubilities • Return of mixed venous blood
6 Plateau Height is Determined by Blood/Gas Solubility 7 Overpressure & Optimal Anesthesia Course for Clinical Anesthesia 8 The Concentration Effect 9 Low Flow Anesthesia 10 Closed-circuit Anesthesia with Liquid Injection 11 The Second Gas Effect 12 Patient Wake-up 13 Patient Size 14 Analyzing Cost of Agents & Techniques 15 High Flow Techniques 16 Bolus Techniques 17 Vital Capacity Induction 18 Volatile Induction and Maintenance

3 | P a g e
Each tutorial chapter introduces an important concept and follows it with exercises to demonstrate and reinforce the concept through simulations using Gas Man. These exercises can serve as a standalone curriculum on anesthesia uptake and distribution. An outline of these chapters is presented in Table 1-1.
The Gas Man Approach
In Gas Man, the path of the anesthetic is depicted as beginning with the clinician's hand adjusting the vaporizer setting, and culminates with the anesthetic effect achieved in the patient's brain. Along this path from vaporizer to brain, physical and physiologic interactions affect anesthetic levels achieved and the rapidity of change.
The Gas Man program is designed to be used hand-in-hand with the exercises in this manual. When the exercises are completed in order, the learner will have constructed the breathing circuit and the patient components in step-by-step fashion to form a coherent, understandable model. The tutorial introduces simple systems first, and then combines them while maintaining their piece-by-piece simplicity. In the end, the learner will fully comprehend a system of sufficient complexity to explain clinical events. Within this clinical system, various administration tech-niques can be demonstrated and their implications explored.
The objective of this approach is to provide a high level of knowledge, understanding and insight that can then be applied in everyday clinical practice to provide both better patient care and greater understanding, satisfaction, and enjoyment for the medical professional.
The overall approach follows that presented by Kety19 in the original explanation of inhalation anesthesia pharmacokinetics, published in 1950. The equilibration of anesthetic partial pressure from compartment to compartment is the seminal concept that underlies the entire approach. Throughout, the tutorial presents data obtained by Edmund I. Eger II11 to validate the Kety model, quantify its parameters, and discover and elucidate its subtleties. It also incorporates additional concepts and clinical techniques offered by others.
This manual is organized as follows:
Chapter 1 The many uses of Gas Man
Chapter 2 How to install and use the program on Windows® and Macintosh® computers
Chapters 3-18 Tutorial on inhalation anesthesia kinetics
Appendices History, advanced features of Gas Man and other details

4 | P a g e
Uses for Gas Man
Gas Man can be used in several ways:
• to learn inhalation anesthesia kinetics by following the tutorial exercises; • to teach principles of anesthesia and kinetics in the classroom; • to experiment with various anesthetic administration possibilities; • to plan your administration in accordance with different clinical or cost objectives; • to better interpret information presented on anesthetic agent monitors; • to design better delivery and monitoring equipment; • to design clinical research experiments.
Note: It is important to stress that although one can plan a clinical strategy with Gas Man, the program and textbook are not a substitute for the clinician's judgment in planning and carrying out the actual course of anesthesia administration in the operating room. No claim is made that Gas Man can or should be used to determine the actual medical treatment of any patient.
►TO TEACH
Gas Man can be used by the teacher/ educator in several ways. The program and the exercises can be incorporated into an educational curriculum either as a primary educational tool to teach inhalation anesthetic pharmacokinetics or as an educational adjunct - reinforcing, expanding, and deepening the students' understanding of the subject. For instance, a lecturer on inhalation anesthesia pharmacokinetics can easily produce the artwork for a sequence of slides that explain the points covered in the lecture by printing out the Gas Man Picture and Graph of a particular simulation. Gas Man can also be projected in the classroom quite effectively with a computer projector, to provide real-time (actually, accelerated time) simulations that can be viewed interactively by the class. The simulations used for teaching can be carefully designed, implemented, and saved prior to the lecture and then simply played back in front of the audience. Or, the entire lecture can be created in front of the audience using the program to generate each simulation as needed. Gas Man is flexible enough to support any approach the teacher might take to the subject. In addition to use in formal didactic-interactive presentation, questions can be answered by using Gas Man to simulate the question and demonstrate the answer. Homework can be assigned and reviewed to reinforce that which is learned in the classroom. Gas Man output files (*.gas) can be emailed to the instructor for credit and critique.
►TO EXPLORE CLINICAL PRACTICE
Gas Man can be used several other ways, without following the exercises. The program can be used to experiment with anesthetic administrations. The student, the resident or the experienced clinician can simulate various anesthetic administration possibilities. A clinician can analyze a recent anesthetic administration to understand why observed clinical events occurred or why the desired course was not achieved. Gas Man can then be used to seek alternative techniques that result in better outcomes.

5 | P a g e
►TO PLAN
A clinician can use Gas Man to plan an anesthetic administration to optimize for specific objectives. One possible objective is speed of induction. Here, the goal is to minimize the time to perfect anesthesia depth – 1 MAC in the brain. Another objective might be gentleness of induction, where anesthetic depth is increased at slow but constant rate up to a desired endpoint. In some circumstances, one might want to maintain a constant depth of anesthesia. In this situation, where the relationship between fresh gas flow, vaporizer setting, and duration of anesthetization is often more complex than it seems, Gas Man can help the clinician understand the interrelationships and gain assurance in a course of action. The opportunities are endless.
►TO REDUCE COSTS
Gas Man calculates and displays the cost of anesthesia administration, facilitating the comparison of agents and techniques. The user can practice and analyze low flow and closed circuit anesthesia to master techniques that minimize drug waste. Another clinical goal might be to achieve rapid, controlled, alteration of anesthetic depth at various times during the course of anesthesia while minimizing the cost to do so.
►TO INTERPRET MONITORS
Anesthetic agent monitors are common in clinical anesthesia practice. First-time users and even experienced users of agent monitors are often perplexed or disturbed by the difference between what is set on the vaporizer and the observed inspired and expired (end-tidal) measurements displayed and recorded. Occasionally either the vaporizer or the monitor may not be functioning properly. But, usually, both are correct. In such situations, the observed differences can be explained by the physics and physiology of the machine, drug, and patient. Gas Man, by simulating that physics and physiology, can be used to produce a good approximation of what is observed on the monitor, thus helping the clinician, technician, or engineer formulate a more accurate explanation for what was observed. In this manner, a Clinical Engineer can use Gas Man to explain how the vaporizer and monitors can be correct, even though the clinician might not yet understand the interactions that led to his or her confusion over the data.

6 | P a g e
Other Users of Gas Man
Gas Man can be used by many professions:
• medical personnel (e.g., students, residents, SRNAs, CRNAs, practicing physicians) in any of the ways described above;
• hospital Clinical Engineers, Biomedical Equipment Technicians and pharmacists; • hospital and managed care administrators; • manufacturers and marketers of agent monitors; • manufacturers and marketers of anesthesia delivery systems; • manufacturers and marketers of inhalation anesthetic drugs; and • educators in other fields interested in creating simulation software for training and
communication.
Clinical Engineers and Biomedical Equipment Technicians in hospitals can use Gas Man to better understand the technical and clinical complexities inherent in their equipment, and the interactions of drug, delivery system, and patient.
Pharmacists can better understand drug delivery system-patient interactions and the impact of drug choice and anesthetic duration on pharmacy costs and on the value provided to the institution.
Hospital and Managed Care Administrators can also learn to appreciate the trade-offs clinicians make between drug choice, quantity and cost of drug used, clinical care provided for the patient, and value of the anesthetic outcome – that is, time to return to normal function.
Manufacturers of agent monitors – particularly their marketing, sales and user education staffs – can better appreciate the questions that will be asked and the confusion that will initially be engendered when their products are introduced in the operating room. By preparing answers to these questions in advance, the introduction and continued use of the monitor will be facilitated.
Manufacturers of gas delivery systems (anesthesia gas machines) can use Gas Man to understand and explain why the concentration the patient inspires from the breathing circuit is not what the clinician set on the vaporizer, even when the vaporizer is performing perfectly. Understanding the clinical goals and administrative objectives taught by Gas Man should assist in designing new anesthesia machines.
Manufacturers of the anesthetic agents can better understand and explain the pharmacokinetics of the drugs they market, sell, or manufacture. Drug manufacturers can enhance patient care by helping clinicians learn to use the drugs effectively, unencumbered by limitations inherent in machine and patient that were previously difficult to overcome. Also, vaporizer specifications can be better determined by carefully considering breathing circuit kinetics and solubility of the drug in blood and other tissues. In addition, the implications of drug attributes such as solubility in blood and various tissues can be understood through Gas Man's computer modeling and simulation.
Veterinarians can use Gas Man to compare drugs and delivery systems applied to animals of various sizes. Gas Man allows adjustments of patient size from 50 g to 1500 kg – from mice to

7 | P a g e
very large animals. Similarly, pediatric human anesthesiologists can explore the difference between kinetics of large and small patients.
Educators in other fields might also be interested in Gas Man, since it demonstrates how the simulation of a complex process, combined with straightforward user interaction with the model, can effectively improve the user's understanding of the care environment and enhance performance on the job.
Summary
The Gas Man program is a unique tool for teaching and simulating anesthesia uptake and distribution. It can be used with the exercises in this manual for a clear, detailed presentation of concepts, accompanied by direct, interactive simulations to demonstrate these concepts and reinforce learning. It can also be used as a general tool for the practicing anesthesiologist, nurse anesthetist, technician or product developer to simulate the interactions of physiological, pharmacological and physical components.

8 | P a g e
Chapter 2 Getting Started with Gas Man® Introduction
In this chapter, you will find:
• your software license agreement • how to install Gas Man® on Windows™ and Macintosh™ computers • an introduction to the Gas Man Picture and Graph • an explanation of Gas Man's menu bar and toolbar on Windows and Macintosh
computers • your first exercise in Gas Man, showing you how to run a simple simulation
When you finish this chapter, you will be ready to run Gas Man simulations on your own.
Note: This chapter assumes that you are already familiar with the Windows or Macintosh computer on which you plan to run Gas Man. If you are not comfortable with how your computer works, please complete an introductory tutorial on your computer's operating system before starting to use Gas Man.
Your Software License
Gas Man® is licensed to you in one of two ways: either under a Site License owned by your Anesthesia Department or University or under a Single User License. The Site License and Single User License are fully described in the License Agreement that accompanies the software and is printed in the back of the complete Gas Man® Workbook and Laboratory Guide.
The Single User License
The Single User License is intended for a single user on one computer such as a desktop or portable. Under the Single User License, you may not install the Gas Man software on more than one computer. If you wish to put Gas Man on a different machine of yours other than the one where you first installed it, you must remove it from the original machine. In addition, under the Single User License, you may not make copies of the software or this manual to distribute to others.
The Site License
The Site License is designed for single department of a university, hospital, or manufacturer of drugs, monitors, or gas machines. The exact organization is defined in the Site License Agreement.

9 | P a g e
The Site License authorizes users to copy the Gas Man software and the PDF version of the tutorial (this document) and to install them on computers within their organization. Salespersons representing drug or device manufacturers are required to own individual licenses, and are not authorized to make and distribute copies of the software or the Manual.
In earlier years, the Site License included a specified number of copies of the Workbook and Laboratory Guide. Now that the workbook is an electronic document this no longer applies.
Copying & Distributing the Manual & Software
The full Workbook and Laboratory Guide and this excerpt are protected under applicable Copyright law. They may not be copied for redistribution under either the Single User License or the Site License. Under both the Single User License and the Site License, a user may download the latest revision of any Gas Man release from the Gas Man web site (http://gasmanweb.com). The key that was issued with the original program will continue to work for all revisions having the same major release number.
Installing Gas Man on Windows™ or Macintosh Computers
Hardware Requirements
• All 2010 versions of Macintosh and Windows Operating Systems
Installing the Software under a Single User or Site License
1. Install like any other program installed under your version of the Windows or Macintosh Operating System.
2. Once installed, start Gas Man, and choose ‘Help / Register product…’ from the main menu. Press the ‘Open File’ button and navigate to and select your Gas Man GasKey. This file converts the Demo version of Gas Man that you downloaded into the fully functional version. Depending on the License, this may be a permanent GasKey or a time-limited GasKey which will expire at the agree-upon date.
►IF YOU HAVE AN INSTALLATION PROBLEM
Contact Med Man Simulations via the web site www.gasmanweb.com .

10 | P a g e
The Gas Man Control, Picture, and Graph
The Gas Man program uses interactive graphics to depict anesthetic tension in various locations from vaporizer to patient. Gas Man windows use three tabs – Control Panel tab, Picture tab, and Graph tab, usually referred to as Control Panel, Picture, and Graph. A single simulation has exactly one Control Panel and any number of Pictures and Graphs.
The Control Panel is used to configure and control the simulation.
Figure 2-0 shows the Gas Man Control Panel described in the text
Fields in the Control Panel
Weight Patient weight. In general, this is ideal body weight
Circuit Breathing circuit type – Open, Semi-closed, Closed, Ideal. The Ideal Circuit is described in Chapter 9
Speed Simulation speed compared with actual time. The range is 1x – 120x, plus, AFAP, As Fast As Possible)
Special These are the same as offered under the Menu bar offering Special. They are described later in this chapter
Agents Used to select one or more anesthetic agents used in an experiment and the corresponding colors used to represent them.

11 | P a g e
The Begin button on the panel changes its function (and label) depending on the state of the simulation. As you can see, it shows the Begin command at the start of a simulation to signify that it will start the simulation running when pressed. While a simulation is running, it shows the Pause command to signify that it will suspend the simulation. For a paused simulation, the button displays the Continue command, to indicate that pressing the button resumes the simulation. Finally, at the end of a simulation the button is disabled and is labeled ‘End.’ Note that this button functions exactly as the Run command on the File menu does; in fact, just as holding the SHIFT key modifies the Run command on the File menu, holding the SHIFT key while pressing Begin or Continue will cause Gas Man to override the speed selection and run the simulation with maximum speed (AFAP).
The Gas Man Picture shows a schematic compartmental diagram of the anesthesia delivery system and patient. Each compartment is filled during the simulation to a height representing partial pressure or tension in that compartment. The bottom half of the Picture depicts the rates of flow between compartments.
Figure 2-1 shows the Gas Man Picture after a simulation has been run, annotated with descriptions of its components.

12 | P a g e
The Gas Man Graph shows the time course of anesthetic tension in the tissues of interest. When a Semi-closed, Closed or Ideal circuit has been selected, the top two panes show the trends of the values of delivered anesthetic tension (DEL) and fresh gas flow (FGF). The fresh gas flow is the total gas flow from the anesthesia machine common outlet into the breathing circuit. The delivered tension is the anesthetic partial pressure (% of one atmosphere) of the fresh gas. The bottom pane shows anesthetic tension in inspired gas (I), alveolar or expired gas (A), vessel-rich tissue group (R), muscle (M) and fat (F). Values are expressed in percent of one standard atmosphere of the anesthetic chosen.
Figure 2-2 shows the Gas Man Graph after a simulation has been run, annotated with descriptions of its components.
When an Open circuit is selected, the top two panes display alveolar ventilation (VA) and cardiac output (CO); in this situation, delivered tension equals inspired tension.
The height of the vertical scale of compartment tension (the lower half of the Graph) is automatically determined by the height of the DEL scale at the upper left of the Picture. You can adjust your view of the compartment tension graph, by changing the upper limit of the DEL scale on the Picture. This is useful in certain simulations to better see the anesthetic time course.

13 | P a g e
Setting Parameters
The tension and flow parameters used by the Gas Man program can be adjusted or controlled prior to and during a simulation in four ways:
• click on the up/down buttons next to the control bars, • grab (click and drag) the control bar itself and move it up or down (the fastest but least
precise method), • type a new numeric value in the appropriate box, or • with the FGF, DEL, VA, CO… command on the Anesthesia menu.
The percent atmospheres of tension or L/min of flow can be expressed in hundredths (to two decimal places) for precise control.
Table 2-1. The basic Gas Man parameters and the available choices used to define each simulation. Gas Man's advanced features employ additional parameters described in Appendix E.
Gas Man Basic Parameter Choices
Agent Choose from the agents available, typically desflurane, enflurane, halothane, isoflurane, nitrogen, nitrous oxide, and sevoflurane.
Color Choose the color to represent each agent in the Overlay Panel.
Circuit Choose from Open, Semi-Closed, Closed or Ideal.
DEL (%) Adjust the anesthetic tension (% of one atmosphere) delivered from the vaporizer.
FGF Adjust the fresh gas flow (L/min).
VA Adjust the alveolar ventilation (L/min).
CO Adjust the cardiac output (L/min).
Weight Adjust from 0.05 to 1500 kg.
Speed Choose the simulated speed (compared to real time) at which you wish the simulation to run. You can choose from 1x, 2x, 5x, 10x, 20x, 60x, 120x and AFAP (as fast as possible). The actual speed of these settings will vary depending on the speed of your computer.
View Choose the duration of time shown on the Gas Man Graph. The choices range from 5 minutes to 10 hours.

14 | P a g e
The Gas Man Menus & Toolbar
This section describes each of the commands available to you under the menu bar of the Gas Man application.
Figure 2-3 shows menu bar and toolbar. Its appearance varies slightly from version to version and platform to platform. The functionality is similar on all versions and platforms.
Main Menu
FILE menu
At the left of the menu bar is the File menu. Here you find the usual commands for opening, closing, creating and saving files, re-opening recently accessed files, and exiting Gas Man. There are also output commands to Print, Send, and Export experiments in various formats (see Appendix E for a full explanation of the output commands). Other commands include:
Run/Stop Run starts or continues the simulation in the active window. If you choose this command while holding down the SHIFT key, the speed control will be ignored and the simulation will progress at the fastest rate possible (AFAP). Stop halts the simulation in the active window.
Run/Stop All
Same as Run/Stop, but acts on all open simulations. If you choose Run All while holding down the SHIFT key, the speed controls will be ignored and the simulations will progress at the fastest rate possible (AFAP). Stop All halts all open simulations.
Simulation Description
Associates a caption or brief description with the simulation in the active window. The caption appears in printed output, and it is saved with the simulation when a simulation is saved to disk.
EDIT menu
Second from the left on the menu bar is the Edit menu. Under this menu are two kinds of commands – those for resetting or replaying the simulation, and those for using the simulation data in other applications.
Rewind Allows you to rewind in preparation for replaying the simulation you have just paused or completed, keeping all the settings as they were throughout the simulation, including any changes or manual adjustments you made.

15 | P a g e
Fast Fwd Takes you immediately forward to the next Bookmark or the end of the simulation, keeping all the settings as they were throughout the simulation, including any changes or manual adjustments you made.
Zero Timer Erases the simulation you have just paused or just completed, without saving it, but retains the settings you had when you chose this command.
Clear All Erases the simulation you have just paused or just completed, without saving it, and restores the settings to the current defaults.
Select All Creates a snapshot of the active tab’s content that can be copied to the Windows Clipboard. From the Clipboard, the screen image can be pasted into many other Windows applications, such as word processing or presentation software files.
Copy Selection
Copies your display selection to the Clipboard (after Select All).
Copy Data Copies the current data from the active simulation to the Clipboard, allowing you to paste it into a spreadsheet or word processing application for analysis and presentation.
ANESTHESIA menu
The next menu to the right is the Anesthesia menu. Here you will find commands to use the liquid injection feature, to enter your costs for anesthetic agents, and to make simulation parameter adjustments more quickly than by typing them into their individual screen boxes.
Liquid Inject
Introduces a unit dose of liquid anesthetic into the breathing circuit. You can also do this by clicking on the syringe icon in the Gas Man Picture.
Unit Dose…
Allows you to set the volume in ml of the liquid injection.
Set Cost… Allows you to type in the bottle volume and bottle cost of the anesthetic agent you have selected, in the local currency.
FGF, DEL, VA, CO….
Allows you to set each or all of these parameters in one dialog box. These can also be set directly on the Picture
Agent & Circuit…
Allows you to set each or all of these parameters in one dialog box. These can also be set directly on the Control Panel.
Default Colors
Resets the colors in the active simulation to the local default anesthetic color codes.

16 | P a g e
VIEW menu
The View menu allows you to create and manipulate multiple views of a single simulation, or create a single view to analyze data in one or more simulations. As described in the previous section, the Gas Man program displays both a Picture (showing the compartments of the anesthesia circuit) and a Graph (showing the time course of the value of each variable during the simulation). These two views, and indeed multiple versions of these views, can be open simultaneously on your screen.
New Graph and New Picture
Display cascading menus that allow you to add views (Graph and Picture tabs) to a simulation. The cascading menus allow you to select an anesthetic agent to show in the additional view. At time zero in the simulation, you can introduce a secondary agent (thus creating a multi-agent simulation) by creating a view for an agent that is not already present. After time zero, you can only create additional views for agents already present.
Overlay… Invokes the Overlay dialog box, which is used in some of the exercises in the tutorial chapters of this Manual and fully explained in Appendix E. The Overlay feature of Gas Man allows you to graph a curve showing the relationship between any two of the program's variables (such as alveolar concentration versus circuit concentration). In addition, you can study that same quotient across multiple simulations, and have the resulting curves all shown on one graph. Overlay can also be invoked from the toolbar
Toolbar A toggle that alternately hides and shows the toolbar. Hiding the toolbar makes more screen space available for views.
SPECIAL menu
The Special menu allows you to control some of the advanced features of Gas Man. With these commands, you can change the way some aspects of the simulations run, and how information is displayed on the screen. Each of these commands toggle: when you select one, it is marked by a checkmark in the drop-down menu; de-select it by clicking on the command again, and the checkmark disappears.
Disable Uptake
Removes the effect of anesthesia uptake on alveolar ventilation.
Disable Return
Removes the effect on alveolar tension caused by anesthetic agent in the venous blood.
Enable Vapor
Causes the simulation to use effective fresh gas flow, which is the sum of the FGF you set and the flow of agent added by the vaporizer (see Appendix E).

17 | P a g e
Change Patient…
Allows you to set or change a number of parameters for the current patient, including Weight (in either kilograms or pounds), compartment volumes and flow percentages, and cardio-pulmonary parameters (VA and CO). Some of these can be set directly on the Picture, and all of them have defaults which can be changed under the Tool menu (see Appendix E).
Note that Gas Man will scale the compartment volumes (linearly) and VA and CO (allometrically) automatically when you adjust patient weight, but you can also change those values independently, by adjusting weight first. Weight will be displayed in kilograms whether you enter it in kilograms or pounds.
Set Bookmark…
Allows you to set times when you wish the simulation to pause. This is explained further later in this chapter.
Enable Scrolling
Ensures that the simulation will keep running even if the visible portion of the Gas Man Graph is filled (otherwise, the simulation will pause automatically when it reaches the latest time visible in the Gas Man Graph). For instance, you would use this command if you wanted a simulation to run for 2 hours, but would like to see its progress scroll by on a 15-minute visible segment of the Gas Man Graph. If you wish your simulation to run only for a specific length of time, set that time as the "View" time on the Graph, and do not enable this command. If scrolling is enabled, a checkmark will appear next to this menu item.
Hide Numerics…
Eliminates from the display the numbers under the compartments for ALV, ART, VRG, MUS, FAT and VEN. If numerics are hidden, a checkmark will appear next to this menu item.
Show Cost…
Changes the values in the ‘Uptake’ and ‘Delivered’ displays in the Gas Man Picture from volume in liters to cost in local currency. To return to liters, click on this command again. You can also control this function using the toolbar.
TOOLS menu
The Tools menu contains the single command Options… that invokes a tabbed dialog box that allows the user to customize the default settings (the settings Gas Man chooses for new simulations, or when it first starts up). There are defaults for program behavior, appearance, patient parameters, simulation settings, and more.
WINDOW menu
The Window menu contains aids to organization for the windows shown by Gas Man. It permits the user to arrange and focus on multiple windows and simulations. (See the section on Working with Multiple Views later in this chapter.)

18 | P a g e
HELP menu
The Help menu is found on the far right side of the program's menu bar. Under this menu, you can find out more about using Gas Man, register your copy of Gas Man, and find out which version of Gas Man you are using.
The Toolbar
The Gas Man toolbar contains an iconographic set of commonly used commands. You may find it helpful to use these icons in addition to the drop-down menus and keyboard shortcuts.
Figure 2-4 shows the icons on the Gas Man toolbar.
Starting from the left…
• The first icon (New) will create a new simulation. One click on this icon will open a new window and a new file (not a new window of the current simulation, if one is already running.)
• A click on the second icon (Open) will bring up a dialog asking you to select a simulation that has been previously saved.
• The third icon (Save) will enable you to save the simulation running in the active window.
• Pressing the printer icon will bring up the Print dialog. • Copy Data will copy the current simulation data values to the Clipboard. • If you have selected a tab image for copying to the Clipboard (by choosing Select on the
Edit menu), then pressing the scissors icon (Cut) will do the copying. • Show Cost changes the Gas Man Picture to display the cost in local currency of
anesthetic delivered and taken up, rather than the volume in liters. Gas Man determines cost by the bottle size and bottle costs listed in the Set Cost command of the Anesthesia menu.
• Pressing the Overlay icon will open the Overlay display, described briefly above and in more detail in this manual's exercises and in Appendix E.
• Set Bookmark allows pause times to be set. This command is also available from the Special menu. Bookmarks are described later in this chapter.
The remaining buttons Rewind, Run/Stop, Fast Forward, and Run All/Stop All correspond to the same commands found under the File menu and the Edit menu. (As with the Run and Run All commands on the File menu, holding the SHIFT key while pressing the Run or Run All buttons will run simulations at maximum speed). These commands are further described later in this chapter.
19 | P a g e
Working With Multiple Views
The Multiple Document Interface (MDI), is an operating system feature that enables you to open more than one window to view a single file or document, or to open more than one file at a time.
In Gas Man, a single file or document corresponds to a single simulation. So, MDI allows Gas Man to have multiple views of multiple simulations open simultaneously. Although this may be confusing at first, it offers the Gas Man user some advantages in being able to display a wide range of information as densely as possible on the screen.
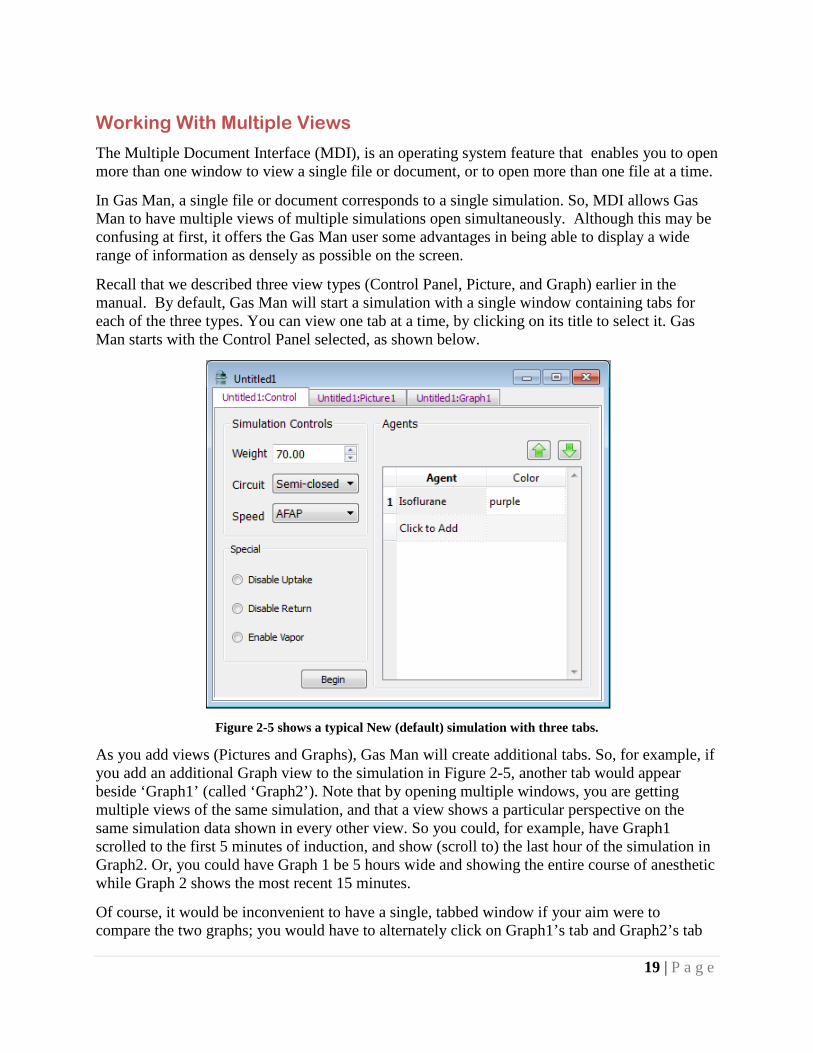
Recall that we described three view types (Control Panel, Picture, and Graph) earlier in the manual. By default, Gas Man will start a simulation with a single window containing tabs for each of the three types. You can view one tab at a time, by clicking on its title to select it. Gas Man starts with the Control Panel selected, as shown below.
Figure 2-5 shows a typical New (default) simulation with three tabs.
As you add views (Pictures and Graphs), Gas Man will create additional tabs. So, for example, if you add an additional Graph view to the simulation in Figure 2-5, another tab would appear beside ‘Graph1’ (called ‘Graph2’). Note that by opening multiple windows, you are getting multiple views of the same simulation, and that a view shows a particular perspective on the same simulation data shown in every other view. So you could, for example, have Graph1 scrolled to the first 5 minutes of induction, and show (scroll to) the last hour of the simulation in Graph2. Or, you could have Graph 1 be 5 hours wide and showing the entire course of anesthetic while Graph 2 shows the most recent 15 minutes.
Of course, it would be inconvenient to have a single, tabbed window if your aim were to compare the two graphs; you would have to alternately click on Graph1’s tab and Graph2’s tab

20 | P a g e
and you would not be able to view them simultaneously. To solve this problem, Gas Man allows you to create a separate window to hold Graph2 by dragging the tab for Graph2 to a different area on the desktop (away from its neighboring tabs). In general, you can drag any tab away to view it in its own window, and you can drag any tab between any two windows for the same simulation. (You cannot combine tabs from two simulations in one window.)
Remember, the view is just a representation. Closing a view (there is an ‘x’ in the upper right of each Picture and Graph tab to do just that) does not, for example, remove the anesthetic shown in the view from the experiment or simulation. If you do close a tab and you later want to recover it, just create a new Picture or Graph via the View menu.
The Control Panel, uniquely, is a ‘singleton.’ While you can create multiple Pictures and Graphs, there is exactly one Control Panel per open simulation, and closing the Control Panel is the same as closing the simulation.
If you get confused – running multiple simulations with multiple windows with multiple tabs of multiple anesthetics can get confusing in a hurry! – there is a helpful command in the Windows menu called Group Windows. This command will collect all the views for each open simulation into a single window.
As you might expect, Gas Man windows can be resized by dragging their edges and corners in or out. If you make a window too small to display its entire contents, scroll bars appear along the right and bottom edges. By moving the scroll button (the ‘thumb’), or clicking on the up, down, left, and right arrows, you can determine which portion of the Picture or Graph appears in the space you have for it on the screen. Therefore, especially if you have a small screen, you can use this feature to see and juxtapose different components of the simulation display without having to alternate between them.
Only one Gas Man window will appear to be active (in full-color and high-contrast) at any given time. Understanding which window is active is fairly intuitive – it is usually the last window to receive input or a mouse click, or it is the window most recently created. Gas Man uses the single active window to supply context, especially when there are multiple windows – that is, Gas Man interprets most commands (and shortcut keys) in the context of the active window. For example, the Close command will close the simulation viewed in the active window; the Print command prints the simulations shown in the active window, and so forth.
Running a Gas Man Simulation
Exercise 2-1: Running a Simple Simulation
In this section, you will actually run your first Gas Man simulation. Open the application and follow the steps outlined below:
1. Close the ‘Untitled1’ simulation window that Gas Man supplies when it is first opened by choosing Close on the File menu or use the keyboard shortcut Ctrl + W (holding down the control key and “W” at the same time).

21 | P a g e
2. Choose New from the File menu, press the New icon on the toolbar (on the far left), or use the keyboard shortcut Ctrl + N. A fresh Gas Man simulation window called ‘Untitled2’ will appear.
3. Drag the tab labeled ‘Untitled2:Graph1’ to an empty area on the desktop. Enlarge the desktop so both windows are fully visible, if necessary.
4. In the original window, click on the tab labeled ‘Untitled2:Control.’ In the section ‘Simulation Controls,’ set the Speed drop-down to 60X if it is not set that way already.
5. In the original window again, click on the tab labeled ‘Untitled2:Picture1.’ Your Gas Man desktop should now look something like figure 2-6
Figure 2-6 shows the Gas Man Picture and Graph before a simulation begins.
6. Click the green Run icon on the toolbar (shown under the Window menu in figure 2-6) to begin simulating administering an isoflurane anesthetic with a semi-closed breathing circuit.
7. Grab the control bar for the vaporizer (DEL) in the upper left of the picture and drag it to the top of the scale, if it is not there already.
As the simulation evolves, anesthetic tension rises in the breathing circuit (CKT). The other compartments follow in succession, equilibrating with inspired tension: the lung alveoli (ALV) and arterial blood (ART); the vessel-rich group (VRG) containing the brain, heart, and other well-perfused organs; muscle (MUS), and finally fat (FAT). Venous blood anesthetic tension (VEN) lies somewhere between the vessel rich group and muscle since it contains an anesthetic

22 | P a g e
tension equal to the average of those leaving the various body compartments, each weighted by relative blood flow to (and from) the compartment.
8. The simulation will stop at the time set in the View field in the Graph. To save this simulation, choose Save from the File menu, type Ctrl + S, or press the Save icon in the toolbar. To print, see Appendix E.
Exercise 2-2: Replaying and Revising a Simulation
Gas Man allows you several options for replaying and revising your simulations, including opening and replaying simulations from a previous session. Try the following steps to become familiar with these features:
1. Return to the simulation you ran on the previous page. Choose Rewind from the Edit menu or toolbar. Now click the Run icon in the toolbar again. The simulation will replay itself exactly as it ran before. This is particularly useful if you make manual adjustments during a simulation, and want to watch the Picture or Graph again, perhaps at a different speed. Try running a new simulation, and make some manual adjustments during its course. Choose Rewind, and then Run, and watch the changes occur again.
2. If you want to run a simulation with a different set of parameters, you can either choose New again, which will create a new simulation with a new name, or you can choose Zero Timer (Ctrl + Z) from the Edit menu. You can adjust the parameters either before or after selecting this command; when you press Begin on the Control Panel or Run (the right arrow) on the toolbar, the simulation will run using the new parameters.
3. To run a simulation using the default settings for all parameters, choose Clear All from the Edit menu and then Begin again.
4. Save this simulation by choosing Save from the Edit menu or click the Save icon in the toolbar. You will see the standard File Manager dialog box with the ".GAS" filename extension. Re-open the simulation by choosing Open (Ctrl + O) from the File menu. You will see the Gas Man Control Panel at its time-zero state. If you run this simulation, it will play out exactly as you ran it before you saved it.
Using Bookmarks
A useful feature of Gas Man is the ability to set bookmarks, which cause a simulation to pause when the elapsed time equals the bookmark time. You can add, delete or change multiple bookmarks for each simulation. The bookmarks are saved with the experiment, making this a useful feature for lectures and presentations. It is also useful for setting precise timings when comparing simulations.
The command Set Bookmark is found under the Special menu.
23 | P a g e
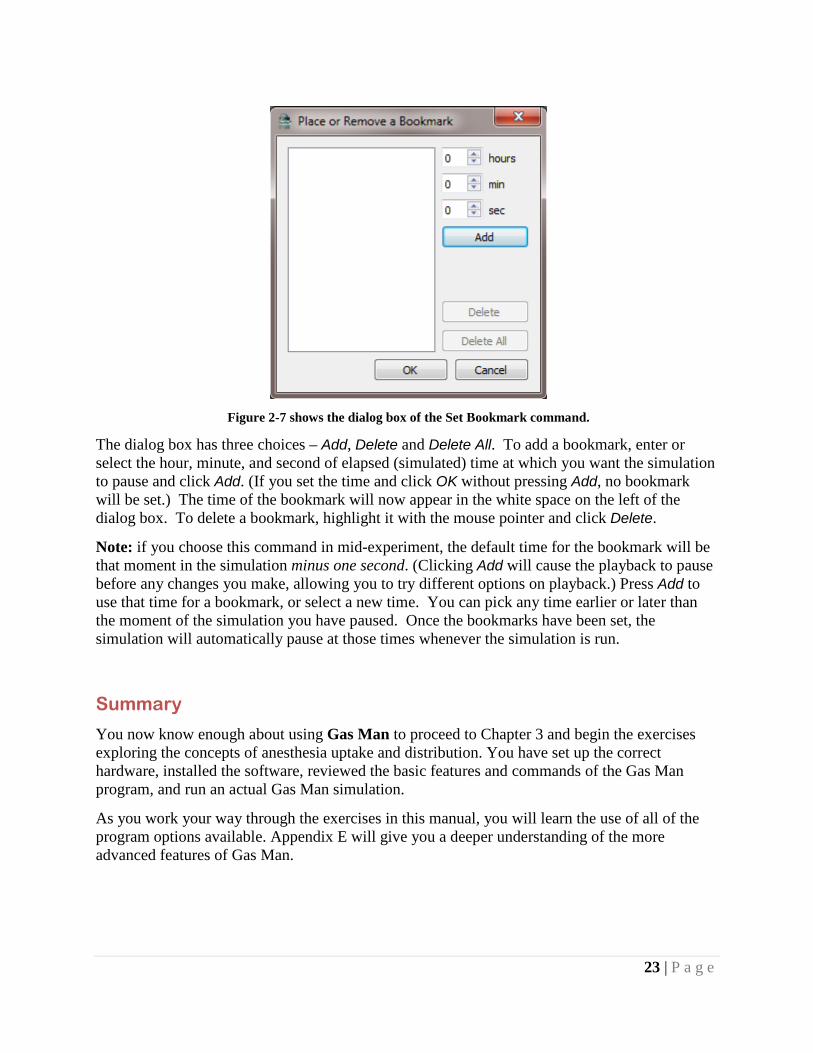
Figure 2-7 shows the dialog box of the Set Bookmark command.
The dialog box has three choices – Add, Delete and Delete All. To add a bookmark, enter or select the hour, minute, and second of elapsed (simulated) time at which you want the simulation to pause and click Add. (If you set the time and click OK without pressing Add, no bookmark will be set.) The time of the bookmark will now appear in the white space on the left of the dialog box. To delete a bookmark, highlight it with the mouse pointer and click Delete.
Note: if you choose this command in mid-experiment, the default time for the bookmark will be that moment in the simulation minus one second. (Clicking Add will cause the playback to pause before any changes you make, allowing you to try different options on playback.) Press Add to use that time for a bookmark, or select a new time. You can pick any time earlier or later than the moment of the simulation you have paused. Once the bookmarks have been set, the simulation will automatically pause at those times whenever the simulation is run.
Summary
You now know enough about using Gas Man to proceed to Chapter 3 and begin the exercises exploring the concepts of anesthesia uptake and distribution. You have set up the correct hardware, installed the software, reviewed the basic features and commands of the Gas Man program, and run an actual Gas Man simulation.
As you work your way through the exercises in this manual, you will learn the use of all of the program options available. Appendix E will give you a deeper understanding of the more advanced features of Gas Man.

24 | P a g e
Chapter 3 A One Compartment Model Theory
Compartments are real or theoretical containers which initially contain no anesthetic. A compartment has an actual volume, which could be measured with a ruler. If the compartment contains body tissues rather than air, the capacity or effective volume of the compartment will be different from the actual volume. The ratio of effective volume to actual volume is the tissue/gas solubility or tissue/gas partition coefficient
λT/G = tissue/gas solubility
with the tissue specified by name. For example:
λH/G = heart/gas solubility
λB/G = blood/gas solubility.
Thus, capacity or effective volume equals volume times solubility:
C = V x λT/G (Eq. 3-1)
For a gas-filled compartment (breathing circuit or alveolar space):
λT/G = 1 ml gas/1 ml volume = 1 (Eq. 3-2)
For non-gas filled compartments, depending on the organ, one milliliter of tissue or blood may be able to absorb more or less than 1 milliliter of anesthetic gas or vapor. For nitrous oxide the blood/gas solubility is equal to 0.47; for desflurane it is 0.42. Thus, less than 1 ml (0.47 or 0.42 ml) of these gases will be contained in 1 ml of blood. For halothane, the blood/gas solubility is 2.47; that is, 2.47 ml of vapor will be contained in 1 ml of blood. For isoflurane, the value is 1.30; 1.3 ml of vapor will be contained in 1 ml of blood. Tissue/gas solubilities are tabulated in the Appendix.
The terms anesthetic tension and anesthetic partial pressure will be used interchangeably in this book. Partial pressure is the pressure of the anesthetic if it were present by itself. When compartments are in equilibrium, their anesthetic tensions are equal.
Anesthetic partial pressure difference is the driving force which causes gas molecules to move from an area of higher partial pressure to one of lower partial pressure.
In fact, this is the fundamental rule upon which all of the kinetics and the Gas Man simulation are based. It is the direct result of the law of concentration of mass. In this program, anesthetic tensions are expressed as percent of one atmosphere; they are shown as vertical heights, either in containers or on graphs.
The interaction of a compartment with an inflow of relatively anesthetic-laden or anesthetic-devoid flow determines how the anesthetic tension in the compartment changes with time.

25 | P a g e
Anesthetic arrives in the compartment in some carrier gas or liquid. It is the flow of this carrier fluid, compared to the capacity of the compartment, which determines the time course of anesthetic tension change. With time, anesthetic tension within the compartment approaches and finally equals anesthetic tension in the inflow.
With each inflow there must be an equal outflow of carrier (venous blood) from the tissues. The venous anesthetic tension leaving any tissue is presumed to equal average tissue tension in that tissue. This assumes perfect mixing and no shunting within the compartment. The response of a compartment to a sudden or step change in inflow tension is termed the step response. Less for-mally, the step response is called the wash-in of the compartment. This term evokes the way the sudden change in inflow tension "washes in" to the compartment.
Exercise 3-1: Wash-in of a Single Compartment Wash-in of a single compartment produces an exponential curve.
In this first exercise you will simulate the step response of a single compartment – the breathing circuit – and watch the changes in the Gas Man Picture and Graph.
The circuit volume is 8 liters and the gas/gas partition coefficient is 1. The circuit capacity is therefore 8 liters. The inflow carrier gas is the fresh gas flow (FGF), adjustable with the FGF display and control bar (FGF control) at the left edge of the bottom of the Gas Man Picture. The anesthetic tension in the fresh gas flow is that delivered from the vaporizer, and is termed the delivered tension, which is adjustable with the DEL display and control bar at the left edge of the top of the Gas Man Picture. This circuit type is called semi-closed.
SETUP
For each exercise in this book, you will adjust the parameters of the Gas Man program as shown in the summary box, seen to the left here. The parameters are explained on the following page.
Parameter Selection Agent Nitrous Oxide DEL (%) 100 Circuit Semi-closed FGF (L/min) 8 VA (L/min) 0 CO (L/min) 0 View (min) 10 Speed 10x Special None

26 | P a g e
Use of the display and control bar is described in Chapter 2. As a reminder, to raise or lower the displayed value, either: click and hold the up or down arrow, drag up or down anywhere on the indicator bar, or click on the numerical value displayed and enter a new value.
1. Choose New from the File menu in the menu bar at the top of the screen. The settings that appear are the defaults set for the program. See Appendix E to find out how to change these defaults.
2. Select Nitrous Oxide as the anesthetic by clicking on the agent currently shown in the Agent column in row 1 of the Agents table on the Control Panel. The cell in the Agents table will change to a dropdown box. Select Nitrous Oxide from the dropdown. Finalize your choice by pressing the Return key, or clicking outside the dropdown box.
3. Select Semi-Closed for the breathing circuit using the Circuit dropdown in the Simulation Controls section of the Control Panel.
4. Set the Speed to 10X by using the Speed dropdown below the Circuit dropdown.
5. Select the Picture tab to display the Gas Man Picture Panel. Adjust the tension of nitrous oxide delivered (DEL) to 100% using the control bar.
6. Adjust fresh gas flow (FGF) to 8 L/min (bottom left corner). For values not at the top or bottom of the adjustment range, typing in the value is the safest way to enter parameters accurately.
7. Set alveolar ventilation (VA) to 0 (zero) L/min.
8. Set cardiac output (CO) to 0 (zero) L/min. Setting both VA and CO to zero will simulate a breathing circuit without a patient connected.
9. Drag the Graph tab off so that it shows in its own window. At the bottom of the Gas Man Graph, select a View of 5 minutes in the dropdown.

27 | P a g e
Observation
Figure 3-1a shows the Picture and Graph displayed at the completion of parameter adjustment for Exercise 3-1, which will show a single compartment step response or wash-in.
Because alveolar ventilation (VA) is zero, only the breathing circuit (CKT) need be considered. If you have not already done so while reading the text above, change the parameters now.
10. When you are ready to run the simulation exercise, select Run from the File menu, or press the Run icon on the toolbar. Press Pause after one minute of simulated time (six seconds on the clock; 6 seconds at 10x = 1 minute simulated time).

28 | P a g e
Figure 3-1b shows the Picture and Graph displayed after 1.0 minute of simulated time in Exercise 3-1.
Note in the Picture and the Graph that circuit (CKT) has reached about 63% of the 100% delivered at the end of the one minute simulated so far.
Figure 3-1c shows the Picture and Graph displayed at the end of the full five minutes of Exercise 3-1.

29 | P a g e
Note that after five minutes, inspired tension has reach > 99% of Delivered (DEL). Since alveolar ventilation is zero, alveolar (ALV) and vessel rich (VRG) group tensions remain zero, along with muscle (MUS) and fat (FAT).
Discussion
Observe the anesthetic tension height within the semi-closed breathing circuit. The circuit fills rapidly during the first minute (Figure 3-1b). Then the filling process progressively slows (Figure 3-1c). This is because there is initially a large gradient between the 100% anesthetic tension in the delivered gas (PDEL) and the 0% anesthetic tension in the breathing circuit (PI or PCKT). As the breathing circuit “fills” with anesthetic, this difference – and hence the rate of rise – decreases. As these tensions become closer, the circuit tension changes more slowly.
Remember that there is a constant carrier flow from the breathing circuit out the pop-off valve, exactly equal to the inflow of fresh gas. The anesthetic tension in the outflow is equal to the anesthetic tension in the circuit. It is interesting to realize that the anesthetic leaving the circuit is essentially wasted. Had the circuit been emptied and refilled with fresh gas, a smaller delivered quantity (8 L rather than 40 L) would have been required to change its composition.
The curve shape you have just seen is an exponential curve and is described by the equation
PI = PCKT = PDEL x (1- e-t/τ) (Eq. 3-3)
The "P" represents partial pressure and Subscript represents partial pressure in inspired (I), breathing circuit (CKT) and delivered (DEL) gas; "e" is the base of natural logarithms, 2.718....; "t" is time and "τ" (tau) is the time constant, explained below. The “x” represents multiplication. It will often be eliminated from equations here and elsewhere.
It is convenient to measure the time delay associated with this curve using a defined time measure. Sometimes a half-time, t1/2, is used. Half-time is the time required for the curve to achieve 50% of its change.
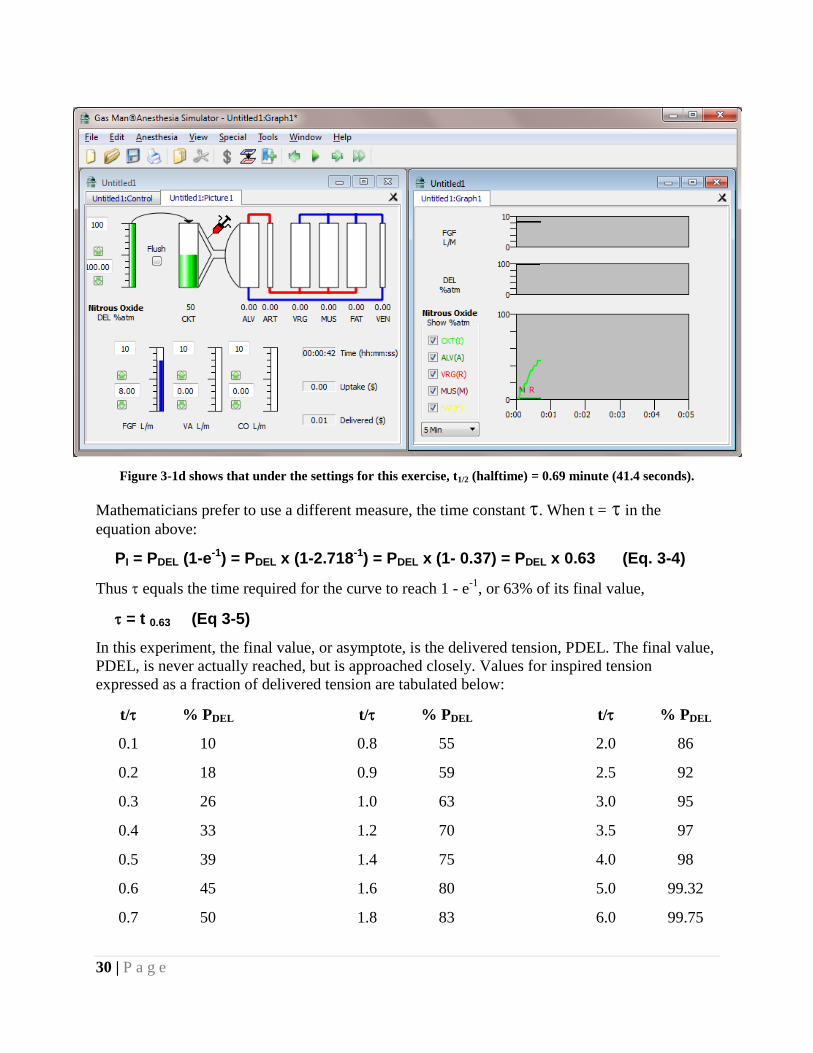
30 | P a g e
Figure 3-1d shows that under the settings for this exercise, t1/2 (halftime) = 0.69 minute (41.4 seconds).
Mathematicians prefer to use a different measure, the time constant τ. When t = τ in the equation above:
PI = PDEL (1-e-1) = PDEL x (1-2.718-1) = PDEL x (1- 0.37) = PDEL x 0.63 (Eq. 3-4)
Thus τ equals the time required for the curve to reach 1 - e-1, or 63% of its final value,
τ = t 0.63 (Eq 3-5)
In this experiment, the final value, or asymptote, is the delivered tension, PDEL. The final value, PDEL, is never actually reached, but is approached closely. Values for inspired tension expressed as a fraction of delivered tension are tabulated below:
t/τ % PDEL t/τ % PDEL t/τ % PDEL
0.1 10 0.8 55 2.0 86
0.2 18 0.9 59 2.5 92
0.3 26 1.0 63 3.0 95
0.4 33 1.2 70 3.5 97
0.5 39 1.4 75 4.0 98
0.6 45 1.6 80 5.0 99.32
0.7 50 1.8 83 6.0 99.75

31 | P a g e
We often measure time in units of time constant. Thus we might say at the end of 1, 2, 3, 4, and 5 time constants, the circuit tension equals 63%, 87%, 95%, and 98%, and 99% of that delivered from the vaporizer. Because Gas Man separates the process into individual breaths, the simulated values are slightly different.
In explaining first order kinetics, the rate coefficient, K, is often computed. There is a specific relationship between the rate coefficient and the time constant: they are reciprocals. That is, K = 1/τ. The units for τ and K are sec and sec-1, respectively. The time constant measures time while the rate coefficient measures rate or speed.
Exercise 3-2: τ = V/F The time constant for wash-in of a single compartment equals effective volume divided by effective inflow rate τ = V/F.
Look back at Figures 3-1b and 3-1c, and note that circuit tension reaches 63% at a time of 1 minute. In Exercise 3-1, volume equaled 8 L and flow equaled 8 L/min. This exemplifies the extremely simple quantification of the relationship between volume, flow, and time constant:
τ = V/F (Eq. 3-6)
Stated in words:
The time constant for a compartment is equal to the ratio of the capacity of the compartment to the flow through that compartment.
To test this hypothesis, we'll change the fresh gas flow in the next exercise.
SETUP
To demonstrate the relationship between inflow rate and time constant, adjust parameters as shown.
Parameter Selection Agent Nitrous Oxide DEL (%) 100 Circuit Semi-closed FGF (L/min) 4 VA (L/min) 0 CO (L/min) 0 View (min) 5 Speed 10x Special None

32 | P a g e
Observation
Figure 3-2 shows the Picture and Graph of Exercise 3-2. The time constant for wash-in of a single compartment equals effective volume divided by effective inflow rate τ = V/F
Watch the Gas Man Picture briefly and note that progress seems to be going about half as fast as before. Bring the Graph forward and visually determine the half-time and time constant. Notice that the time constant is again equal to the ratio of volume to flow. This time,
τ = V/F = 8 L/ (4 L/min) = 2 min.
Discussion
In this exercise, when time reaches two minutes, inspired tension has reached 63% of delivered. This is twice the time required with FGF = 8 L/min in Exercise 3-1. In Exercises 3-1 and 3-2, the relationship between half-time and time constant was t1/2 = 0.69 τ or tl/2/τ = 0.69. The exact value for the constant relating ti to ti/2 is the natural log of 2 (ln 2 = loge 2 = 0.6931...).

33 | P a g e
Exercise 3-3: The Shape of the Exponential Curve Time scale compression shows that all exponential curves have the same shape
SETUP
This next exercise repeats Exercise 3-2, but you will set View to 10 minutes to compress the time scale. To compress the time scale, adjust the parameters as shown.
Observation
Figure 3-3 shows the Gas Man Graph for Exercise 3-3. Time scale compression shows that all exponential curves have the same shape.
Parameter Selection Agent Nitrous Oxide DEL (%) 100 Circuit Semi-closed FGF (L/min) 4 VA (L/min) 0 CO (L/min) 0 View (min) 10 Speed 10x Special None

34 | P a g e
You should see a curve that has the same exponential shape as you saw in Exercise 3-2. This curve, however, is being drawn only half as fast.
Summary
In this chapter, you have observed anesthetic tension when a constant flow of anesthetic-laden fresh gas enters a compartment, mixes completely, and simultaneously forces out an equal quantity of mixed compartment gas. You have seen that this response to a step change in input, called the step response or wash-in, is an exponential curve that has a time constant τ = V/F, and follows the equation PI(t) = PDEL (1-e-t/τ). The rate coefficient, K, is the reciprocal of the time constant τ ; K =1/τ. The time constant of a single compartment equals effective volume divided by effective inflow rate τ = V/F. The rate coefficient for a single compartment equals effective inflow divided by effective volume rate τ = F/V.

35 | P a g e
Chapter 4 Two Sequential Compartments Theory
In this chapter, you will observe the interaction of two sequential compartments: the breathing circuit and the patient's lungs. You have already experimented with a single compartment (the breathing circuit) and its equilibration with gas inflow. The rate at which the second compartment, the lungs, moves toward equilibrium with the first is determined by two factors. One factor is the effective volume of the second compartment, which here is the alveolar volume or functional residual capacity of the patient's lungs (FRC). The second factor is the flow of gas between the two compartments; here it is the alveolar ventilation (VA). Considered alone, the lungs' response to a step change in circuit (or inspired) tension is an exponential curve with a time constant (τ) equal to the ratio of alveolar volume (FRC) to alveolar flow:
τ = FRC/VA.
You can determine the effect of two sequential compartments with the Gas Man program. In the following exercises, you will observe wash-in of the breathing circuit alone, the alveolar volume alone, and the two in combination. You will also observe that increasing delivered and inspired tensions above that desired in the alveoli (overpressure) speeds achieving the desired alveolar tension.

36 | P a g e
Exercise 4-1: The Step Response of a Perfectly Mixed Circuit The step response of a perfectly mixed breathing circuit is an exponential curve with height equal to the tension delivered from the vaporizer, and the time constant equal to circuit volume divided by fresh gas flow:
τ = VCKT/ FGF.
SETUP
Repeat Exercise 3-2 demonstrating wash-in of a single 8 L compartment with a fresh gas flow of 4 L/min, but let the simulation run as fast as possible (Speed = AFAP). The other parameters to be set are shown.
Parameter Selection Agent Nitrous Oxide DEL (%) 100 Circuit Semi-closed FGF (L/min) 4 VA (L/min) 0 CO (L/min) 0 View (min) 10 Speed AFAP Special None

37 | P a g e
Observation
Figure 4-1 displays the Picture and Graph displayed at the end of Exercise 4-1, showing wash-in of the 8 L circuit volume with afresh gas flow of 4 L/min.
Watch the picture for a simulated minute and then observe the shape of the graph. Make a note of the half-time and time constant. The circuit tension rises toward that delivered from the vaporizer, with a time constant equal to the circuit volume divided by fresh gas flow, as we observed in Chapter 3.
Exercise 4-2: The Alveolar Step Response An open or non-rebreathing circuit demonstrates the alveolar step response.
Next, perform a similar experiment with a single 2.5 L alveolar compartment and 2.5 L/min alveolar ventilation, using an open or non-rebreathing circuit, in which inspired anesthetic equals that delivered from the vaporizer.
The step response of the alveolar compartment (FRC) is an exponential curve with height equal to inspired tension, and time constant equal to FRC divided by alveolar ventilation:
τ = FRC/VA.

38 | P a g e
SETUP
Set the parameters as shown. Note that fresh gas flow (FGF) is automatically shown as 10 L/min when Open circuit is chosen.
Observation
Figure 4-2 displays the Picture and Graph at the end of Exercise 4-2, showing wash-in of the patient's 2.5 L alveolar volume (FRC) with a flow (alveolar ventilation) of 2.5 L/min.
Note that the graph displays an alveolar tension curve (ALV), which looks identical to the inspired tension curve (CKT) achieved with a semi-closed circuit in Exercise 4-1. Again, note the half-time and time constant, and make sure that they are the same as the ones you recorded for the circuit compartment in Exercise 4-1.
Parameter Selection Agent Nitrous Oxide DEL (%) 100 Circuit Open FGF (L/min) 10 VA (L/min) 2.5 CO (L/min) 0 View (min) 10 Speed AFAP Special None

39 | P a g e
Discussion
For the alveolar compartment, just as for the breathing circuit,
τ = V/F;
The time constant equals volume divided by flow. This time, volume equals functional residual capacity (FRC) and flow equals alveolar ventilation (VA).
τ = FRC / VA
Exercise 4-3: Wash-in of Two Compartments Wash-in of two compartments in series is slowed by each in an additive fashion.
MTT (mean transit time) = τ1 + τ2
The interaction of two compartments in series can now be studied. (The words series, sequence, and cascade will be used interchangeably.) In this exercise, you will observe the behavior of the breathing circuit and alveolar volume in series.
SETUP
Set the parameters as shown.
Parameter Selection Agent Nitrous Oxide DEL (%) 100 Circuit Semi-closed FGF (L/min) 4 VA (L/min) 2.5 CO (L/min) 0 View (min) 10 Speed AFAP Special None

40 | P a g e
Observation
Figure 4-3 shows the Picture and Graph of the results of Exercise 4-3, displaying a completed 10-minute simulation of anesthetic tension equilibration in two sequential compartments.
At the end of two minutes of simulation, observe the Gas Man Graph and watch it evolve. Inspired anesthetic tension (I) appears to be an exponential curve with τ a little longer than 2 minutes. Looking at points of equal anesthetic tension (equal height) on the graph, it appears that the delay from the time inspired tension (I) reaches a level, to the time alveolar tension (A) reaches the same level, is approximately one minute. Wash-in of the two compartments in series has been slowed by wash-in of each, in an additive manner. The mean transit time is equal to the sum of the two time constants:
MTTtotal = τ1 + τ2•
Discussion
Theoretically, the average delay between the second and first curves is exactly one minute. The definition of average delay between two curves is a measure called the mean transit time (MTT). It is the time, on the average, for a substance to move from one location (breathing circuit) to another (alveolar compartment). For each of our simple, fully mixed compartments, the mean transit time is equal to the time constant (MTT = τ). When compartments are in sequence as these are, the total mean transit time through the system is equal to the sum of the mean transit times through the individual compartments:
MTT = MTTCKT + MTTALV• = τCKT + τALV•

41 | P a g e
Exercise 4-4: Using Overpressure Overpressure can speed the rise in anesthetic tension two compartments away.
The next exercise will explore ways to produce a step rise in alveolar anesthetic tension by briefly increasing delivered and inspired tension above that desired in the alveoli. Use of el-evated partial pressure to achieve a rapid change to a lower level is termed overpressure.
SETUP
Set the parameters as shown.
To understand overpressure and the vaporizer adjustments needed to control anesthetic tension in the alveolar compartment, set the Gas Man parameters as shown. The objective in this exercise is to achieve 70% alveolar tension. By adjusting anesthetic delivered to the breathing circuit (DEL), try to achieve 70% alveolar tension smoothly and quickly, without allowing it to rise above 70%. You will see that it is difficult to control a variable (alveolar tension) when you can only control an input (delivered tension) two compartments away.
Parameter Selection Agent Nitrous Oxide DEL (%) Prepare to adjust! Circuit Semi-closed FGF (L/min) 4 VA (L/min) 2.5 CO (L/min) 0 View (min) 10 Speed 10x Special None

42 | P a g e
Observation
Figure 4-4 displays the Picture and Graph as a result of Exercise 4-4, showing how overpressure can speed the rise in anesthetic tension two compartments away from the location controlled.
Alveolar tension fluctuates as you try to keep it at 70% by adjusting delivered tension (DEL). Your results may differ depending on how you adjusted DEL during the course of this experiment.
Summary
In this chapter, the response of two sequential compartments to a step input to the first compartment has been investigated. The measure of the delay of each compartment is the mean transit time, MTT. For each simple, fully-mixed compartment, MTT = τ. The effects of the two compartments are additive in delaying the response to a step input; the mean transit time is the sum of the individual mean transit times. With some difficulty, delivered tension can be adjusted to optimize the response in the alveolar compartment. This is done by the use of overpressure.

43 | P a g e
Chapter 5 The Alveolar Tension Curve Theory
In this chapter you will study the response of the alveolar compartment to a step change in inspired anesthetic tension. The resulting curve is termed the alveolar tension curve. Analogous to the one compartment example, this could be termed the wash-in of the patient including lungs and tissues, or simply, patient wash-in. But it is far from a simple exponential.
To demonstrate and dissect the alveolar tension curve into its component parts, use the Gas Man Program to simulate anesthetic administration at constant inspired concentration (tension) through an open circuit. Open circuit is the term used to signify that the clinician has perfect control over inspired tension without the patient rebreathing exhaled gases and diluting inspired tension. The terms open and non-rebreathing are used interchangeably.
The alveolar tension curve shape has several important components, each of which must be understood. In this chapter, effects of alveolar ventilation, cardiac output, blood/gas solubility, tissue uptake, and venous return of anesthetic will be demonstrated and explained.
The alveolar tension curve is extremely important; it is the key to understanding inhalation anesthesia uptake and distribution and the process of anesthetic tension equilibration from the vaporizer to the patient's brain and anesthesia depth.

44 | P a g e
Exercise 5-1: The Open Circuit Alveolar Tension Curve The open circuit alveolar tension curve is the alveolar response to a step change in inspired tension, representing patient wash-in.
SETUP
To observe the response of the alveolar compartment to a step change in inspired tension, adjust the parameters as shown.
Observation
Figure 5-1 shows the Picture and Graph of the results of Exercise 5-1 after 15 minutes, displaying anesthetic tension in response to 5 % delivered and inspired isoflurane.
Parameter Selection Agent Isoflurane DEL (%) 5 Circuit Open FGF (L/min) 10 VA (L/min) 4 CO (L/min) 5 View (min) 15 Speed 60x Special None

45 | P a g e
While watching the Gas Man Picture, note the initial rapid rise in ALV (alveolar anesthetic tension). Note also the more sluggish rise in VRG (vessel-rich group) and barely discernible rise in MUS (muscle) and FAT (fat). After about 2 minutes of simulated time, observe the Gas Man Graph. Observe especially the Gas Man Graph and focus on the alveolar curve.
Discussion
Descriptive names are used to designate segments of the alveolar tension curve. The initial rise occurs rapidly. A knee terminates this rise in a plateau that instantly merges into an ascending tail, which continues indefinitely, approaching (asymptotically) inspired tension. The causes of the initial rise, knee, and tail of the alveolar tension curve are important in understanding uptake and distribution of anesthetics and equilibration and equalization of anesthetic tension from location to location. They will be explained in the remainder of this chapter.
Exercise 5-2: The Initial Rise in the Alveolar Tension Curve The initial rise in the alveolar tension curve results from alveolar wash-in responsive to a step change in inspired tension.
The initial rise of the alveolar tension curve is caused by wash-in of the alveolar space with inspired gas, carried by alveolar ventilation. The shape of the initial rise is determined by the interaction of inspired tension, alveolar ventilation, and alveolar volume (FRC). To observe the initial rise in its purest form, the effect of body uptake will be eliminated; we do this by eliminating cardiac output (CO = 0) in the Gas Man model.
SETUP
Set the parameters as shown, putting CO at zero. Set a bookmark for 3 minutes.
Parameter Selection Agent Isoflurane DEL (%) 5 Circuit Open FGF (L/min) 10 VA (L/min) 7.5 CO (L/min) 0 View (min) 15 Speed AFAP Special Set Bookmark @ 3 min

46 | P a g e
Observation
Figure 5-2 shows the Picture and Graph of the results of Exercise 5-2, displaying alveolar anesthetic tension in response to 5 % inspired isoflurane with cardiac output (CO) = 0 and alveolar ventilation (VA) = 7.5
L/min.
Note the rapid rise in alveolar tension as it approaches and equals inspired tension. The time constant,τ appears to be about 0.3 minutes, and can be calculated to be:
τ = V/F = FRC / VA = [2.5 L] / [7.5 L/min] = 0.33 minute.

47 | P a g e
Exercise 5-3: Lower Ventilation Slows Initial Rise in Alveolar Tension The initial rise in alveolar tension is slower with lower alveolar ventilation but alveolar tension asymptotically approaches inspired
SETUP
Set the parameters shown, lowering alveolar ventilation to 1.25.
Observation
Figure 5-3 displays the Picture and Graph of the results of Exercise 5-3, showing the effect of low alveolar ventilation (VA = 1.25 L/min) with CO= 0.
Parameter Selection Agent Isoflurane DEL (%) 5 Circuit Open FGF (L/min) 10 VA (L/min) 1.25 CO (L/min) 0 View (min) 15 Speed 60x Special None

48 | P a g e
The only change you have made is to change alveolar ventilation (VA) from 7.5 L/min to 1.25 L/min. Observe how much slower alveolar tension rises. The time constant is observed to be 2 minutes and is calculated to be:
τ = V/F = FRC / VA = [2.5 L] / [1.25 L/min] = 2 minutes.
Discussion
In this and the previous exercise, alveolar tension reached a final value equal to inspired tension. This complete equalization between inspired and alveolar gas is not possible when there is uptake by blood. Instead, as cardiac output removes anesthetic from the alveolar volume, less anesthetic remains, and alveolar tension is held at a lower value. This will be shown in the next exercise.
Exercise 5-4: Uptake Produces a Knee and Plateau in Alveolar Tension Uptake of anesthetic by cardiac output produces a knee and plateau in the alveolar tension curve
When alveolar tension is viewed graphically, a knee interrupts the rise in alveolar tension when (nonzero) cardiac output removes anesthetic from the alveoli. That is, the previous complete wash-in of the alveolar space is interrupted by uptake into blood. This knee would continue as a flat plateau if anesthetic-containing venous blood did not later return to the lungs. Gas Man has a special feature to demonstrate this. In the menu bar at the top of the Gas Man screen is a drop-down menu labeled Special. If you choose Disable Return from this menu, the simulation will show the effect of cardiac output removing anesthetic from the alveoli, but without the effect of venous blood returning some of it later. This is indicated by the empty venous anesthetic tension bar (VEN) on the right edge of the top half of the screen. In essence, anesthetic is "removed" from venous blood before it returns to the heart and lungs.
SETUP
To observe the knee and plateau of the alveolar tension curve, add cardiac output and adjust the other parameters as shown.
Parameter Selection Agent Isoflurane DEL (%) 5 Circuit Open FGF (L/min) 10 VA (L/min) 1.25 CO (L/min) 1.25 View (min) 15 Speed 10x Special Disable Return

49 | P a g e
After 3 simulated minutes, press the Pause button on the Picture or Graph to interrupt the simulation.
Observation
Figure 5-4 shows the Graph of Exercise 5-4 at the end of 3 minutes of simulation.
Note the knee continuing to a plateau in the alveolar tension curve at approximately 2.1 % isoflurane. In the upper panels of the Graph, and in the Picture, you see that a small alveolar ventilation is bringing 5% isoflurane from the breathing circuit to the patient's lungs. Simultaneously, a small cardiac output is carrying blood and anesthetic away to the body tissues. Tissue anesthetic tensions rise but have no effect on alveolar tension because anesthetic has been removed from venous blood before it returns to the lungs using the Special / Disable Return feature.
Exercise 5-5: Increasing Alveolar Ventilation Raises the Knee and Plateau Increasing alveolar ventilation raises the knee and plateau of the alveolar tension curve
While anesthesia administration is still interrupted, the parameters can be adjusted to explore the effects of alveolar ventilation and cardiac output on the knee or plateau height. We will show that plateau height is elevated by alveolar ventilation and depressed by effective cardiac output. Effective cardiac output is equal to actual cardiac output multiplied by the blood/gas solubility, λB/G.

50 | P a g e
SETUP
(Time elapsed = 3 minutes) Continue with reduced VA.
You should already have completed 3 minutes of anesthesia administration and the simulation should be paused. No anesthetic is returning to the lungs in venous blood since venous return is disabled. To observe the effect of alveolar ventilation on alveolar tension without starting a new simulation, increase alveolar ventilation and then continue the simulation-in-progress by setting the parameters as shown. When the clock reads 6 minutes, click Pause and observe the Graph again.
Parameter Selection Agent Isoflurane DEL (%) 5 Circuit Open FGF (L/min) 10 VA (L/min) 7.5 CO (L/min) 1.25 View (min) 15 Speed 10x Special Disable Return
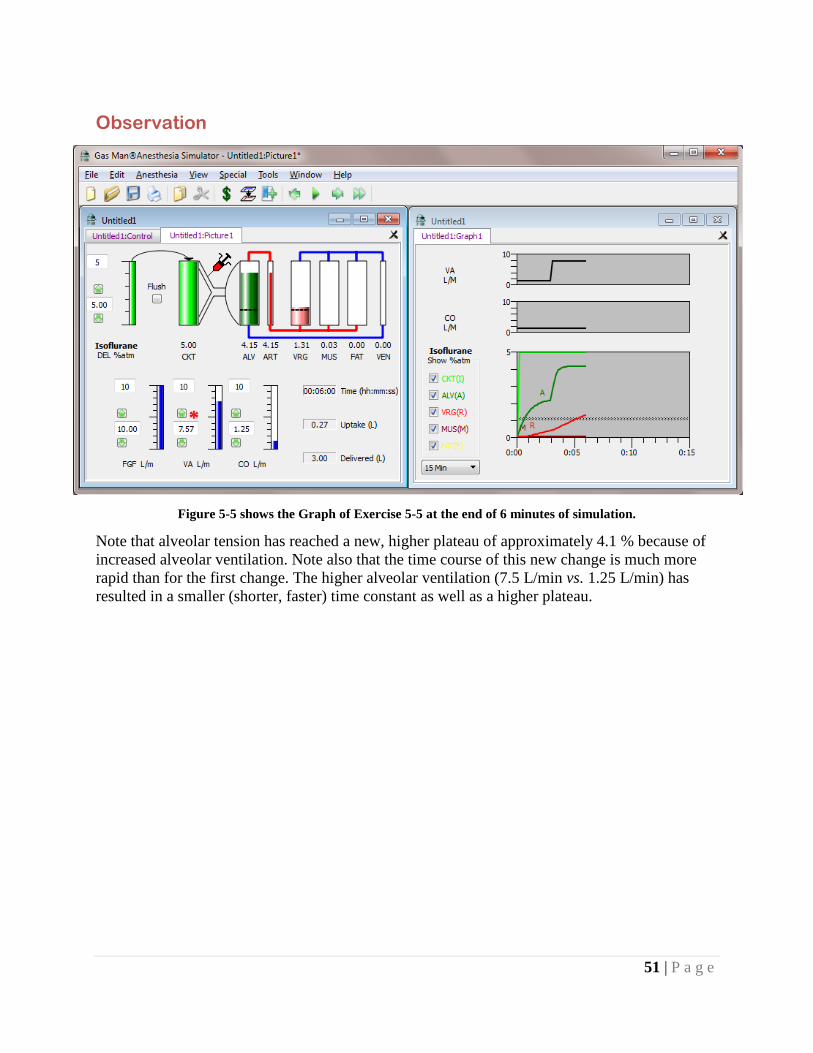
51 | P a g e
Observation
Figure 5-5 shows the Graph of Exercise 5-5 at the end of 6 minutes of simulation.
Note that alveolar tension has reached a new, higher plateau of approximately 4.1 % because of increased alveolar ventilation. Note also that the time course of this new change is much more rapid than for the first change. The higher alveolar ventilation (7.5 L/min vs. 1.25 L/min) has resulted in a smaller (shorter, faster) time constant as well as a higher plateau.

52 | P a g e
Exercise 5-6: Increasing Cardiac Output Lowers the Knee and Plateau Increasing cardiac output lowers the knee and plateau of the alveolar tension curve.
SETUP
(Time elapsed = 6 minutes) Continue with increased CO.
You should have completed 6 minutes of anesthesia administration and the simulation should be interrupted. To observe the effect of cardiac output on alveolar tension, continue where Exercise 5-5 left off by increasing cardiac input to 7.5 L/ min, as shown. Observe the Graph and click Pause at 9 minutes.
Parameter Selection Agent Isoflurane DEL (%) 5 Circuit Open FGF (L/min) 10 VA (L/min) 7.5 CO (L/min) 7.5 View (min) 15 Speed 10x Special Disable Return

53 | P a g e
Observation
Figure 5-6 shows the Graph of Exercise 5-6 at the end of 9 minutes of simulation.
Note that alveolar tension has again fallen to approximately 2.1 %. This is the same level that was reached when cardiac output and alveolar ventilation were both equal but lower (1.25 L/min each, compared with 7.5 L/min each, now).
Exercise 5-7a: Ratio of VA to Effective CO Determines Plateau Height The ratio of alveolar ventilation to effective cardiac output determines the height of the knee and plateau of the alveolar tension curve.
You have seen that the knee or plateau height of the alveolar tension curve appears to be determined by the ratio of alveolar ventilation to cardiac output. To verify this, return to Gas Man for yet another simulation. Reconfirm that the plateau height is unchanged when the ratio of alveolar ventilation to effective cardiac output is constant by selecting new values for VA and CO that are again equal to each other, but different from the previous exercise.

54 | P a g e
SETUP
(Time elapsed = 9 minutes) Adjust VA and CO each to 5 L/min and continue the simulation, as shown.
Observation
Figure 5-7a displays the Picture and Graph at the conclusion of Exercise 5-7, showing the effect of alveolar ventilation and cardiac output on knee height of the alveolar tension curve.
Note that the alveolar tension plateau height is unchanged despite changes you have made in alveolar ventilation and cardiac output. After 3 minutes of 5% delivered isoflurane, alveolar ventilation (VA) is increased from 1.25 to 7.5 L/min. At 6 minutes, cardiac output (CO) is
Parameter Selection Agent Isoflurane DEL (%) 5 Circuit Open FGF (L/min) 10 VA (L/min) 5 CO (L/min) 5 View (min) 15 Speed 10x Special Disable Return

55 | P a g e
likewise increased from 1.25 to 7.5 L/min, restoring the ratio VA/CO to its previous value of 1:1, and the alveolar tension plateau to its previous height. At 9 minutes, alveolar ventilation (VA) and cardiac output (CO) are each adjusted to 5 L/min, and the alveolar tension plateau is again unchanged.
Exercise 5-7b: Plateau Increases with VA At constant CO, increasing VA in a stepwise fashion causes a stepwise rise in alveolar plateau height.
To better visualize the relationship between CO, VA and plateau height, we will look at the impact of increasing VA in a stepwise manner while keeping CO constant at 5 L/min. Since we want to look at the plateau height uninfluenced by venous return, we disable venous return in the Special menu. To eliminate the impact of uptake on alveolar ventilation, we also disable the uptake effect. VA is increased by 1 L/min each minute.
SETUP
To observe the relationship between ventilation and plateau, start with the settings at left. Disable Uptake and Return, and do not enable Vapor. Set breakpoints at every minute up to 10 (1, 2… 10) and 15. At each minute, increase VA by one.
Parameter Selection Agent Isoflurane DEL (%) 5 Circuit Open FGF (L/min) 10 VA (L/min) 0 CO (L/min) 5 View (min) 15 Speed 10x Special Disable Return
Disable Uptake

56 | P a g e
Observation
Figure 5-7b demonstrates the relationship between knee height and alveolar ventilation; as VA increases, so does plateau height.
Alveolar ventilation has been stepped 1 L/min at a time from 0 to 10 L/min with a constant cardiac output of 5 L/min.
Exercise 5-7c: Plateau Increases inversely with CO At constant VA, decreasing CO in a stepwise fashion causes a stepwise rise in alveolar plateau height.
To again visualize the relationship between CO, VA and plateau height, we will look at the impact decreasing CO in a stepwise manner while keeping VA constant at 5 LPM. Since we want to look at the plateau height uninfluenced by venous return, we again disable venous return in the Special Menu. To eliminate the impact of uptake on alveolar ventilation, we disable the uptake effect. CO is decreased by 1 L/min each minute.

57 | P a g e
SETUP
To observe the relationship between CO and plateau, start with the settings at left. Disable Uptake and Return, and do not enable vapor. Set breakpoints at every minute up to 10 (1, 2… 10) and 15. At time = 1 minute, reduce CO by 1L/min and repeat every minute until CO = 0.
Observation
Figure 5-7c shows the rise in knee height as cardiac output is decreased in a stepwise manner from 10 to 0 L/min with an alveolar ventilation of 5 L/min.
You may want to reproduce these figures yourself but diligence is required to produce perfect Graphs. You may also want to use Gas Man's Overlay feature for comparisons (see Appendix E).
Parameter Selection Agent Isoflurane DEL (%) 5 Circuit Open FGF (L/min) 10 VA (L/min) 5 CO (L/min) 10 View (min) 15 Speed 10x Special Disable Return
Disable Uptake

58 | P a g e
Discussion
You have seen that the knee and plateau height of the alveolar tension curve is determined by the ratio of alveolar ventilation to effective cardiac output. Remember that effective cardiac output is equal to the product of cardiac output and blood/gas solubility, λB/G. Anesthetics with different solubilities will have different plateau heights for the same alveolar ventilation and cardiac output. This will be explored in Chapter 6.
Exercise 5-8: Anesthetic in Venous Blood causes Gently-Rising Tail Anesthetic returned to the lungs in venous blood converts the alveolar tension curve plateau into a gently-rising tail.
When anesthetic-laden venous blood is allowed to return to the lungs, total anesthetic delivery to the alveoli increases. Venous delivery increases as tissue anesthetic tensions increase. This converts the previously-seen plateau in alveolar tension into an ascending tail. To demonstrate this, in this next exercise you will suddenly allow the anesthetic in venous blood to reach the lungs normally. This will augment the total quantity of anesthetic delivered to the lungs and hence increase alveolar tension.
SETUP
To understand the tail of the alveolar tension curve created by anesthetic returning from tissues and going to lungs, proceed as shown. Remember that in the previous exercises you selected Special / Disable Return, and this is still preventing anesthetic from returning to the lungs in venous blood. Set a bookmark at 2 minutes.
Parameter Selection Agent Isoflurane DEL (%) 5 Circuit Open FGF (L/min) 10 VA (L/min) 5 CO (L/min) 5 View (min) 15 Speed 10x Special Disable Return

59 | P a g e
Observation
Figure 5-8a displays the Picture and Graph of the alveolar tension curve with anesthetic in venous blood removed before it returns to the lungs.
Observe the flat plateau on the Graph and view the Picture again. As you continue the exercise, note the empty venous anesthetic tension display bar on the right edge of the Picture.
Next, you will allow anesthetic to return to the lungs in venous blood. Use the Special menu in the menu bar and deselect Disable Return; then click Continue.

60 | P a g e
Figure 5-8b displays the Picture and Graph after the transition from venous return disabled to normal venous return.
Notice that anesthetic tension in the alveolar compartment suddenly begins to rise. Observe that the previous knee and flat plateau has been transformed to a knee leading to an ascending tail. This is caused by the return of anesthetic to the lungs in the venous blood.
Figure 5-8c shows superimposed graphs with and without anesthetic in venous return.

61 | P a g e
Note that in Figure 5-8c the flat plateau caused by the absence of venous return has been transformed to an up-going tail as anesthetic returning from tissues re-enters the lungs as a second source of anesthetic.
Discussion
The slowly ascending tail of the open-circuit alveolar tension curve has been produced by the addition of anesthetic returning in venous blood. The actual venous anesthetic tension is the average of the tissue anesthetic tensions weighted by their respective blood flows. For each tissue, the anesthetic tension is determined by the history of arterial blood anesthetic tension and by tissue blood flow and tissue capacity.
If arterial anesthetic tension were constant, tissue anesthetic tension would be an exponential with the time constant appropriate for the tissue and blood flow. The equations that express this are:
PT (t) = Pa x (1-e -t/τ), where
τ = (VT x λT/B) / F
That is, tissue time constant is the ratio of effective tissue volume to the effective flow to the tissue.
Summary
In this chapter, the open (or non-rebreathing) circuit alveolar tension curve has been dissected into its component parts, initial rise, transient plateau, knee, and tail. The maximum possible height is the inspired anesthetic tension. The time constant of the initial rise is the ratio of alveolar ventilation (VA) to alveolar volume (FRC). The knee height is determined by the ratio of alveolar ventilation to the product of cardiac output and blood/gas solubility, which together comprise effective cardiac output. This will be explored in Chapter 6. The multi-exponential tail of the curve is produced by anesthetic returning in venous blood augmenting alveolar tension; its shape is determined by the rate of tissue equilibration.

62 | P a g e
Chapter 6 Plateau Height & Blood Gas Solubility Theory
Each anesthetic has a different value for the blood/gas partition coefficient, referred to as blood/gas solubility (λB/G). The effect of blood/gas solubility on the time course of anesthesia can be observed using the Gas Man program. We will see that high blood/gas solubility lowers the knee of the alveolar tension curve; and low blood/gas solubility raises the knee, making expired more closely approach inspired.
The drugs we will study are halothane, enflurane, isoflurane, the newer agents, sevoflurane and desflurane, and the older insoluble nitrous oxide. Nitrogen is also simulated. The blood/gas solubilities and other values for these exercises are shown in Table 6-l.
Blood/Gas Solubility and its Effect on Plateau Height, A/I Ratio & Overpressure a
Patient parameters: VA =4.00, CO =5.00
1. Drug Iso Enf Hal Sevo Des N20 N2
2. Blood/Gas Solubility 1.30 1.90 2.47 0.65 0.42 0.47 .014
Plateau Height for Max DEL
3. Inspired setting (%) 5.0 5.0 5.0 5.0 18.0 100 400
4. Alveolar plateau height (%) 1.90 1.48 1.22 2.76 11.8 63 3.93
Plateau and Overpressure Ratios a
5. Alveolar / Inspired Plateau Ratio 0.38 0.30 0.24 0.55 0.66 0.63 0.98
6. Inspired / Alveolar (OverP Ratio) 2.63 3.38 4.10 1.81 1.50 1.59 1.02
Overpressure for One MAC
7. MAC (% atm) 1.1% 1.7% 0.8% 2.1% 6.0% 110% 700%
8. Inspired Overpressure for 1 MAC 2.9% 5.7% 3.3% 3.8% 9.0% 175% 714% a Anesthetic has been removed from venous return to maintain the plateau height.
Table 6-1. Parameters and computations for each agent including blood/ gas solubility ratio, plateau height, overpressure ratio, MAC value, and overpressure tension to achieve 1 MAC in the alveoli.

63 | P a g e
Exercise 6-1: Alveolar Tension Curves Have the Same General Shape The alveolar tension curves for different anesthetic agents have generally the same shape. Knee height of the curve varies with blood/gas solubility. Tail shape varies with tissue/gas solubility.
SETUP
To observe the effect of agent choice on the shape of the alveolar tension curve, adjust parameters as shown. After simulating a halothane anesthetic with constant inspired tension, do the same for isoflurane, enflurane, sevoflurane, and desflurane. Each time, set delivered tension from the vaporizer (DEL) to the top of its control bar scale.
Anesthetic tensions in body compartments will show higher values than those used clinically, but we use the maximum setting of DEL for graphic demonstration of this effect.
Finally, repeat the experiment for nitrous oxide, but use the Special menu to Disable Uptake this time. This will avoid confusion by eliminating the effect of uptake on ventilation – the concentration effect, explained in Chapter 8. The graphs resulting from these simulations are shown in Figures 6-1 a, b, c, d, e, and f.
Parameter Selection Agent Halothane, etc DEL (%) (top of the scale) Circuit Open FGF (L/min) 10 VA (L/min) 4 CO (L/min) 5 View (min) 15 Speed AFAP Special see text

64 | P a g e
Observation
Figure 6-1a shows the Picture and Graph after administering halothane at constant inspired tension of 5% for 15 minutes.
Figure 6-1b shows the Picture and Graph after administering enflurane at constant inspired tension of 5% for 15 minutes.
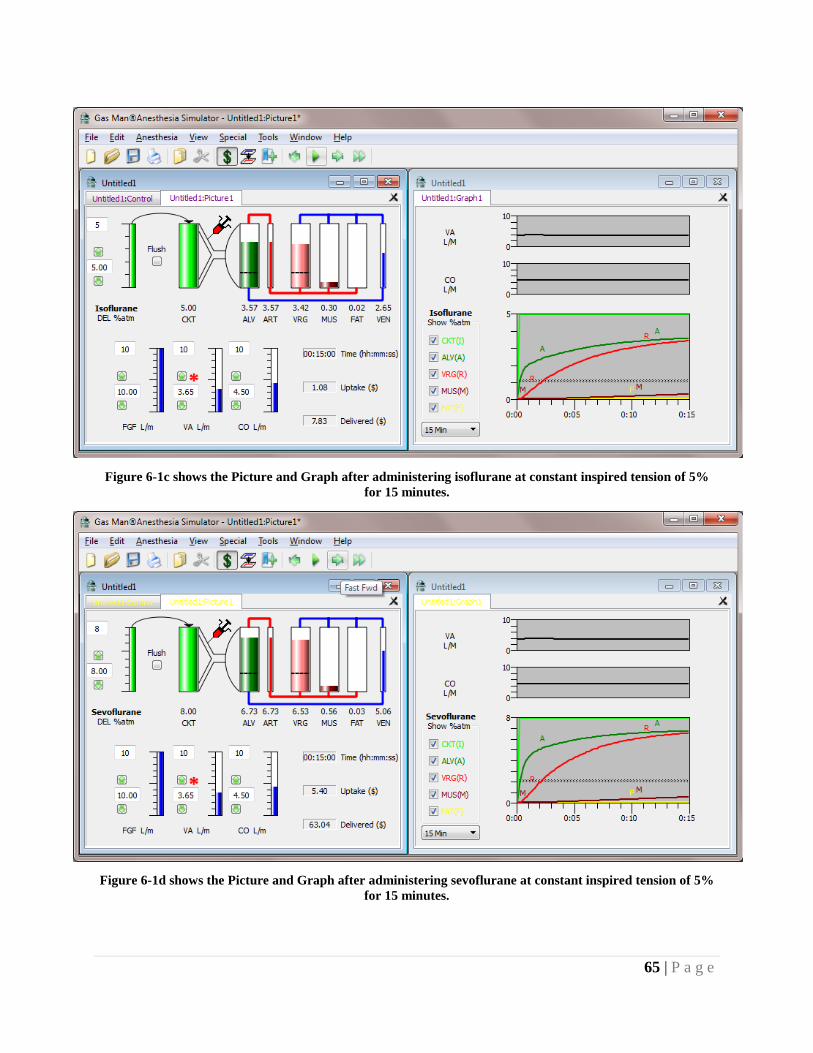
65 | P a g e
Figure 6-1c shows the Picture and Graph after administering isoflurane at constant inspired tension of 5% for 15 minutes.
Figure 6-1d shows the Picture and Graph after administering sevoflurane at constant inspired tension of 5% for 15 minutes.

66 | P a g e
Figure 6-1e shows the Picture and Graph after administering desflurane at constant inspired tension of 18% for 15 minutes.
Figure 6-If shows the Picture and Graph after administering constant inspired tension of 100 % nitrous oxide for 15 minutes. The concentration effect has been eliminated by disabling the effect of uptake (Special menu,
Disable Uptake) on alveolar ventilation, explained in Chapter 8.

67 | P a g e
Discussion
Note that the different anesthetic agents have alveolar tension curves that are similar in overall shape. They all possess an identical initial rise. Knee height differs with agent solubility. Tail shape varies slightly from agent to agent. In all cases, alveolar tension rises rapidly at first, and then more slowly after what is termed the knee. Vessel-rich group (VRG) anesthetic tension follows alveolar soon thereafter (1-3 minutes). Muscle and fat do not develop any significant anesthetic partial pressure during the 15 minutes viewed.
Exercise 6-2: High λB/G Drugs Have Low Plateau and A/I or E/I Drugs with high blood/gas solubility have low alveolar knee and plateau heights and low A/I (Alveolar/Inspired) or E/I (Expired/Inspired) ratios.
To see the effect of blood/gas solubility independent of tissue effects, you will next eliminate the effect of anesthetic in venous blood returning to the lungs and heart. To do so, you will use the Special menu and select Disable Return, as in Chapter 5. This will produce a well-defined plateau height rather than the height of the ill-defined knee beginning a rising tail. It will then be easy to see the effect of blood/gas solubility on the knee height.
SETUP
To demonstrate the plateau height for each anesthetic, adjust parameters as shown. After observing alveolar tension reach a plateau after 2 minutes, note its height or use the File menu and Print the picture and graph. Next, select enflurane, isoflurane, sevoflurane, desflurane, and nitrous oxide and observe, record, or print the plateau height of each.
Note: When simulating nitrous oxide administration, use the Special menu to Disable Uptake before clicking Begin. This will eliminate The Concentration Effect, described in a later chapter.
Parameter Selection Agent Halothane, etc DEL (%) (top of the scale) Circuit Open FGF (L/min) 10 VA (L/min) 4 CO (L/min) 5 View (min) 15 Speed AFAP Special Disable Return

68 | P a g e
Observation
Figure 6-2 shows the Graphs of the alveolar tension plateau for each anesthetic agent plotted on the same axes to allow easy comparison
The alveolar plateau heights for maximum inspired agent are tabulated in Table 6-1 Line 4. The effect of venous return of anesthetic to the lungs was removed by using Disable Return.
Exercise 6-3: Determining the Initial Overpressure Value Alveolar plateau height or A/I ratio, combined with MAC, determine the initial overpressure value required to produce 1 MAC in the alveoli.
In this exercise, we take a break from running Gas Man simulations and explain the concept of Minimum Alveolar Concentration (MAC), and the relationship of alveolar to inspired tension.
Plateau heights are described in terms of ratios of alveolar to inspired tension. Because end-expired tension is a reasonable approximation of alveolar tension, the two terms are often used interchangeably, alveolar/inspired = expired/inspired or A/I = E/I. In reality, they may be different. Expired is what we measure with an airway gas analyzer. Alveolar is what is present in the lungs. Alveolar dead space is the source of the difference. It is not discussed here.
From the results of Exercise 6-2 we can compute the A/I ratios for each drug (see Table 6-1, Line 5). The important point here is that relative plateau height is inversely related to blood/ gas solubility. That is, anesthetics with low blood/gas partition coefficients produce high alveolar anesthetic plateaus. This relationship can be quantified:
PA = PI / ( 1 + λ CO / VA )

69 | P a g e
where PA and PI are alveolar and inspired anesthetic tensions, λ is the blood/gas partition coefficient, and VA and CO are alveolar ventilation and cardiac output, respectively.
One note of caution is required here. In addition to depending on the blood/gas solubility, the plateau height depends on both alveolar ventilation and cardiac output. In the clinical setting, neither of these values can be easily and continuously quantified. If real measurements of plateau height could be made for an agent of known blood/gas solubility, the ratio of cardiac output to alveolar ventilation could be inferred.
If the objective here were to control alveolar tension to a certain plateau height, then it is not the A/I ratio that is useful, but rather the I/A ratio. The relationship between the two is simple: one is the reciprocal of the other. The I/A ratio can be thought of as the overpressure ratio required to achieve the desired tension in the alveoli. The overpressure ratio can be calculated for each of the anesthetic agents (see Table 6-1, Line 6). Thus we see that as blood/gas solubility decreases toward 0, the overpressure ratio (I/A) decreases toward 1.
We know that each of the anesthetic agents requires a different brain level to achieve anesthesia:
The value of brain, blood, and alveolar anesthetic which anesthetizes 50 % of patients is MAC, defined as the Minimum Alveolar Concentration for anesthetization at 1 atmosphere pressure.
At the MAC value, 50% of patients fail to move in response to a surgical incision. The value is assessed by measuring end-expired anesthetic tension 15 minutes after constant expired tension has been established. End-expired gas is taken to represent alveolar gas. Alveolar gas tension is taken to precisely equal arterial blood tension, and brain tension is presumed to equal arterial tension after 15 minutes or 5 time constants of equilibration. A surgical incision is then made. A record is made of whether or not the patient moves. This definitive end-point of yes or no makes statistical analysis convenient. MAC is often measured by successive approximation in a series of patients.
To make the same MAC value applicable at any barometric pressure, the concentration value should be thought of as partial pressure or tension, expressed in percent of one sea level atmo-sphere. This is the approach consistently used in Gas Man.
The MAC values for each gas simulated here are shown in Table 6-l, Line 7. To combine the concepts of MAC and overpressure, assume that the desired alveolar level is 1 MAC. Thus, if you know the overpressure ratio and the MAC value for an anesthetic, you can easily calculate the inspired tension required to produce an alveolar plateau of 1 MAC - it is the product the I/A ratio and MAC:
Inspired overpressure for 1 MAC = I1MAC = I/A ratio x MAC.
Use of appropriate overpressure brings alveolar anesthetic tension to 1 MAC rapidly. You will explore this in the next exercise.

70 | P a g e
Exercise 6-4: Choosing the Solubility-adjusted Overpressure By choosing the solubility-adjusted overpressure value, you can achieve and maintain 1 MAC in the alveoli.
SETUP
In this exercise, you will simulate an overpressure-induced step in alveolar tension to 1 MAC with each of the anesthetics. By leaving venous return disabled in the Gas Man model, you will see a flat plateau in alveolar tension in response to constant inspired tension. By choosing the solubility-adjusted overpressure value, you will achieve and maintain the 1 MAC you desire. Adjust the parameters as shown. Remember to use Disable Return to remove the effect of venous return of anesthetic to the lungs.
Parameter Selection Agent Isoflurane DEL (%) 2.9 Circuit Open FGF (L/min) 10 VA (L/min) 4 CO (L/min) 5 View (min) 5 Speed AFAP Special Disable Return

71 | P a g e
Observation
Figure 6-3 shows the Picture and Graph of the result of Exercise 6-4 after administering 2.9 % isoflurane with an open circuit.
The effect of venous return of anesthetic to the lungs was removed by using Disable Return. The 2.9% overpressure value was calculated based on the blood/gas solubility ratio of isoflurane and a value for ventilation (VA = 4 L/min) and perfusion (CO = 5 L/min).
At the end of 1 minute of simulation, note that you have achieved 1 MAC already. Note also that the alveolar tension does not change as the simulation continues to 5 minutes; you have achieved a 1 MAC plateau. A flat plateau is created in this educational simulation because venous return has been disabled. The plateau height is formed by the balance between anesthetic delivery in ventilation and removal by cardiac output. The plateau is at 1 MAC (1.1 % atm isoflurane) because you correctly calculated the inspired tension to use, based on the alveolar tension desired and the MAC value for the anesthetic agent you selected.
Now that you have produced 1 MAC isoflurane, do the same for the other anesthetic agents: enflurane, halothane, sevoflurane, desflurane, and nitrous oxide. Set DEL according to Table 6-1, Line 8 (Inspired Overpressure for 1 MAC) or calculate it yourself for each anesthetic. Note that for enflurane, the setting required is 5.7%. Adjust the scale of the picture display by entering "6" in the box to the left of the scale, and then adjust the control bar to 5.7 as you normally would. Gas Man portrays common vaporizer scales and limits.
Clinical Note 1: If you have seen anesthetic vaporizers, you may have noticed that some brands and models of enflurane vaporizers deliver 7%, others only up to 5%. Now

72 | P a g e
you know why 7% is an advantage for this drug that has both low potency (high MAC) and relatively high solubility.
Clinical Note 2: One (1) MAC might not be the desired level for a particular patient at a particular time in the course of surgery. All exercises and uses of Gas Man scale with the actual MAC Fraction (F).
Summary
In this chapter, you have compared various anesthetic agents and seen that blood/gas solubilities (blood/gas partition coefficients) significantly affect the height of the knee of the alveolar tension curve. You have calculated and simulated the A/I plateau ratio and the I/A overpressure ratio, along with the overpressure for 1 MAC for each agent. Table 6-1 tabulates pertinent data and calculations you can consider in clinical practice. By choosing the solubility-adjusted overpressure value, you can achieve and maintain any desired anesthetic level (F x MAC) in the alveoli. You have also noted that the tail of the alveolar tension curve is removed by disabling venous return of anesthetic to the lungs, and that this allows you to quantify the change expected shortly after inspired tension is changed.

73 | P a g e
Chapter 7 Overpressure & Optimum Anesthesia Theory
The concept and technique of overpressure has been used for a long time. With proper use of overpressure, inspired anesthetic tension is continually or frequently adjusted to produce a con-stant tension somewhere else, notably the brain or alveoli. In this chapter, we will explore the judicious use of overpressure to achieve a rapid rise and stable maintenance of anesthetic tension somewhere other than where we are controlling it. First we will consider the alveoli (actually the expired gas). Then we will consider the brain as the location in which anesthetic tension is to be controlled.
Overpressure is the term for using a higher partial pressure in the inflow than is desired in the compartment being controlled. In Exercise 4-4, we saw that overpressure could speed the rise in anesthetic tension two compartments away. That is, we adjusted the vaporizer setting to control alveolar anesthetic tension. In Chapter 6 we saw the level of inspired overpressure required to achieve 1 MAC in the alveoli and exhaled gas during the time before anesthetic returns in venous blood. In this chapter we apply the same principle to control alveolar anesthetic tension by adjusting inspired tension in the face of returning anesthetic in venous blood. You will reproduce the halothane simulation published by Eger14, as well as perform similar simulation experiments for the other agents.
To make our work easier, we will eliminate the delay and difficulty in prediction introduced by the breathing circuit and use a perfect non-rebreathing, or open, circuit. In practice, some breathing circuits and anesthesia machines are designed to do this. With conventional anesthesia machines commonly available in the US, a fresh gas flow of 10 L/min will do an adequate job, but it is still not perfect. We will use 1 MAC as our target level.
The dotted line in the alveolar (ALV) and vessel rich group (VRG) compartments represents the MAC level. Your goal in each exercise will be to bring either alveolar or vessel-rich group tension up to 1 MAC and maintain that level.
You may have to continuously adjust the vaporizer setting (DEL) to do this perfectly. First, slow the Speed to 5X or 10X. You can use any of three ways to adjust the vaporizer:
• Drag the DEL control bar by clicking and holding the mouse button • Click the down arrow next to the DEL scale • Select Pause and type in new values as needed or desired.
You may find that dragging the control bar is the most enjoyable method. With the simulation running, move the mouse pointer onto the control bar and click the mouse button. When you do this, the simulation automatically pauses until you release the button, at which time the simulation automatically resumes.

74 | P a g e
A logical vaporizer starting value for each agent is found in Table 6-1, line 8. The inspired tension shown there will raise ALV to 1 MAC immediately. These numbers are the starting values in the exercises.
Exercise 7-1: Maintaining 1 MAC Using Overpressure Carefully adjusted inspired overpressure can achieve and maintain 1 MAC in the alveolar compartment and exhaled gas.
SETUP
To achieve 1 MAC in the alveolar compartment, measured as exhaled gas, adjust the parameters as shown.
Immediately after beginning the simulation, start reducing DEL in one of the three ways described on the previous page. Remember, your goal in each exercise is to bring alveolar tension up to the dotted line (1 MAC) and maintain that level. Keep your eye on the alveolar tension as you adjust the vaporizer setting.
At the end of the 15 minute simulation, you should have produced a graph something like Figure 7-1a. You can repeat this exercise with each of the anesthetic agents, producing graphs like Figures 7-1 b, c, d, and e.
Parameter Selection Agent Isoflurane, etc. DEL (%) 2.9 Circuit Open FGF (L/min) 10 VA (L/min) 4 CO (L/min) 5 View (min) 15 Speed 5x Special none

75 | P a g e
Observation
Figure 7-1a shows the Picture and Graph resulting from keeping anesthesia administration at a constant alveolar tension with isoflurane, achieved by continuous manual adjustment of inspired tension.
Figure 7-1b shows the Picture and Graph resulting from keeping anesthesia administration at a constant alveolar tension with enflurane, achieved by continuous manual adjustment of inspired tension.

76 | P a g e
Figure 7-1c shows the Picture and Graph resulting from keeping anesthesia administration at a constant alveolar tension with halothane, achieved by continuous manual adjustment of inspired tension.
Figure 7-1d shows the Picture and Graph resulting from keeping anesthesia administration at a constant alveolar tension with sevoflurane, achieved by continuous manual adjustment of inspired tension.

77 | P a g e
Figure 7-1e shows the Picture and Graph resulting from keeping anesthesia administration at a constant alveolar tension with desflurane, achieved by continuous manual adjustment of inspired tension.
Observe that when using drugs of lower solubility, such as desflurane and sevoflurane, you need less overpressure to achieve and maintain 1 MAC.
Exercise 7-2: Optimum Anesthesia Uses Overpressure Optimum anesthesia uses inspired and alveolar overpressure to achieve and maintain constant brain anesthetic tension.
SETUP
To attempt optimum administration of anesthesia which maintains brain partial pressure perfectly controlled, adjust the parameters as shown.
Parameter Selection Agent Isoflurane DEL (%) 5 Circuit Open FGF (L/min) 10 VA (L/min) 4 CO (L/min) 5 View (min) 15 Speed 5x Special none

78 | P a g e
Adjust the vaporizer to achieve constant brain (VRG) tension at 1 MAC = 1.1 %, overlying the dotted line. As you adjust inspired tension, observe alveolar tension carefully; allow it to overshoot the 1 MAC line a bit. The alveolar overshoot is the alveolar overpressure which is achieved in the blood. This perfuses the brain and temporarily drives it toward a higher level than its final value of 1 MAC. The overpressure you use in the alveolar compartment should be transient; there should be no overpressure achieved in the brain. But the brain should approach the 1 MAC value quickly.
Clinical Note1: It must be recognized, with some drugs and with some patients, that the high and rapid rise in inspired; alveolar or VRG tension may not be desirable on clinical grounds.
Clinical Note 2: With desflurane, it is important not to allow inspired or expired tension to rise too rapidly. Deviating from this can result in increased heart rate and blood pressure.
Figure 7-2a shows the Picture and Graph of Exercise 7-2, showing an optimum anesthetic course (1 MAC in VRG) with isoflurane.
For each volatile anesthetic agent (isoflurane, enflurane, halothane, sevoflurane, desflurane), the dotted line on the picture and graph represents 1 MAC (see Table 6-1). Repeat this exercise with the other anesthetic agents, trying to achieve vessel rich group tensions that overlay the dotted line at 1 MAC as quickly as possible. In each case, start with the vaporizer set to the top of the control bar. Many variations are possible. Clinical Note 2 applies here, as well.
Figures 7-2 b, c, d, and e show examples of the Picture and Graph for each anesthetic. Yours may look different, depending on the frequency of the adjustments you made and your facility with using the mouse.

79 | P a g e
Figure 7-2b shows the Picture and Graph of Exercise 7-2, showing an optimum anesthetic course (1 MAC in VRG) with enflurane.
Figure 7-2c shows the Picture and Graph of Exercise 7-2, showing an optimum anesthetic course (1 MAC in VRG) with halothane.

80 | P a g e
Figure 7-2d shows the Picture and Graph of Exercise 72, showing an optimum anesthetic course (1 MAC in VRG) with sevoflurane.
Discussion
Ideally, one would like to monitor anesthetic tension in the brain to precisely predict anesthesia depth. This can be done with a number derived from EEG analysis or by observing the clinical signs of anesthesia (pupil size, blood pressure, pulse, respiration, reflex responses to surgical stimulation, etc.).
Inspiratory and expiratory anesthetic tensions can be measured easily with commercial monitors using any one of several technologies. End-expiratory tension is a good approximation to alveolar tension and arterial anesthetic tension. Monitoring inspired and end-expired tensions has proven useful in clinical management.

81 | P a g e
Exercise 7-3: Optimum Clinical Anesthesia Using Overpressure Optimum clinical anesthesia uses vaporizer adjustment for inspired overpressure and alveolar overpressure to achieve and maintain constant brain anesthetic tension.
SETUP
You will now use a high flow, semi-closed circuit to attempt optimum clinical administration of anesthesia. Adjust the parameters as shown.
Adjust the vaporizer to achieve constant brain tension. Start with delivered isoflurane tension set to 5%. At the end of 2 minutes, decrease the delivered isoflurane tension to 3.5%. Continue to decrease the vaporizer setting to cause ALV and VRG anesthetic tensions to overly the 1 MAC line at 1.1 %.
Clinical Note 1 applies.
Parameter Selection Agent Isoflurane, etc. DEL (%) 5 Circuit Semi-closed FGF (L/min) 10 VA (L/min) 4 CO (L/min) 5 View (min) 15 Speed 10x Special none

82 | P a g e
Figure 7-3a shows the Picture and Graph of clinical optimum anesthesia administration (1 MAC in VRG) with isoflurane, achieved by continuous manual adjustment of the vaporizer with FGF = 10 L/min.
Repeat this exercise with the other anesthetic agents, trying to achieve vessel-rich group tensions that overlay the dotted line at 1 MAC as quickly as possible. Many variations are possible. Figures 7-3 b, c, d, and e show examples of the Gas Man Picture and Graph for each anesthetic. Yours may look different, depending on the frequency of the adjustments you made and your facility with using the mouse. Vaporizer settings above 5% are used with agents whose vaporizers are so-equipped, such as Sevoflurane at 8%.

83 | P a g e
Figure 7-3b shows the Picture and Graph of clinical optimum anesthesia administration (1 MAC in VRG) with enflurane, achieved by continuous manual adjustment of the vaporizer with FGF equal to 10 L/min and
an initial vaporizer setting equal to 7%.
Figure 7-3c shows the Picture and Graph of clinical optimum anesthesia administration (1 MAC in VRG) with halothane, achieved by continuous manual adjustment of vaporizer with FGF = 10 L/min.

84 | P a g e
Figure 7-3d shows the Picture and Graph of clinical optimum anesthesia administration (1 MAC in VRG) with sevoflurane, achieved by continuous manual adjustment of vaporizer with FGF = 10 L/min.
Figure 7-3e shows the Picture and Graph of clinical optimum anesthesia administration (1 MAC in VRG) with desflurane, achieved by continuous manual adjustment of vaporizer with FGF = 10 L/min.

85 | P a g e
Summary
Overpressure can be used to bring alveolar or exhaled anesthetic tension to any desired level quickly and easily. In an open circuit, frequent or continuous adjustments of delivered anesthetic tension are required to maintain the desired level. Initial inspired tension should be the target alveolar tension multiplied by the solubility-adjusted overpressure ratio (previous chapter). It must be recognized that with some drugs and with some patients, the high and rapid rise in inspired, alveolar, or VRG tension may not be desirable on clinical grounds.
In this chapter, you have reproduced the classic simulations of anesthesia administration at constant alveolar concentration with an open (non-rebreathing) circuit", and have designed optimum administration of other anesthetic agents on your own.
An optimum anesthetic course provides constant brain anesthetic tension. This is achieved by briefly providing the correct level of arterial overpressure to the brain. Since arterial blood anesthetic tension is considered to equal alveolar, this overpressure can be controlled by controlling alveolar or expired tension. In turn, inspired overpressure achieves the alveolar overpressure required. Finally, because of the limitations of today's breathing circuits, an additional level of vaporizer overpressure is required to bring inspired up to the levels required. Because the brain comes to perfect equilibrium with blood in only a short time, alveolar overpressure will be required only transiently, unlike inspired overpressure which must be maintained as long as anesthetic is being taken up by other tissues, notably muscle and fat.

86 | P a g e
Chapter 8 The High Inspired Concentration Effect Theory
The Concentration Effect explains the observation that alveolar tension approaches inspired tension more rapidly with high inspired concentration than with low. This is explained in the following manner.
When a gas is administered to a patient's lungs, uptake of that gas into the bloodstream tends to decrease lung volume below normal. This volume reduction, were it to occur, would be equal to anesthetic uptake into the blood. Anesthetic uptake into the blood is governed by inspired tension, cardiac output, and blood/gas solubility. To maintain constant lung volume, additional gas is drawn into the lungs with each breath, and inspired alveolar ventilation is elevated.
In the extreme case when the inspired concentration is 100%, the increased inspired ventilation exactly compensates for gas uptake into blood. This was practiced clinically with nitrous oxide in the past11. The end result is that uptake does not delay the rise in alveolar anesthetic tension as is the case with lower inspired tensions. In other words, inspired alveolar ventilation is augmented to bring 100% nitrous oxide into the lungs as fast as nitrous oxide is removed from the lungs by cardiac output. Therefore, with 100% nitrous oxide, alteration of cardiac output should not affect the alveolar tension curve.
If inspired nitrous oxide concentration is less than 100%, lung volume is replaced with a nitrous oxide-plus-oxygen mixture that does not fully compensate for nitrous oxide uptake. Hence, the rise in alveolar tension is not accelerated as much as with a higher concentration. There is a continuum in compensation for uptake between the extremes of 100% anesthetic and trace concentrations.
To study the concentration effect, you will first observe the rapid rise in alveolar tension with 100% nitrous oxide and the slower rise with 40% nitrous oxide inspired. Next you will demonstrate that cardiac output does not affect the alveolar tension curve when 100% nitrous oxide is inspired. Finally, you will observe the slowed alveolar tension curve when the augmentation of inspired alveolar ventilation is totally eliminated in the simulation.
WARNING: Administering 100% nitrous oxide to patients is potentially hazardous. It should rarely be used except for short periods (typically less than 1 minute), and only after previous administration of oxygen (de-nitrogenation, or pre-oxygenation). An oxygen monitor (with alarms) must be used. The Gas Man program allows you to try this and other hazardous anesthetic administrations in simulation so that you can learn basic principles without risking patient harm.

87 | P a g e
Exercise 8-1: The Concentration Effect The concentration effect is demonstrated by administering 100% inspired nitrous oxide followed by administering a lower concentration, and observing the alveolar tension curve in response to each.
SETUP
Set the program parameters as shown. To observe the concentration effect most dramatically, simulate administering 100% inspired nitrous oxide.
Clinical Note: This is not meant to suggest using 100% anesthetic in clinical practice; 70-75% is a more reasonable maximum.
Figure 8-1 shows the Picture and Graph from Exercise 8-1, demonstrating anesthetic tensions after administering 100% nitrous oxide for 10 minutes.
Parameter Selection Agent Nitrous Oxide DEL (%) 100 Circuit Open FGF (L/min) 10 VA (L/min) 4 CO (L/min) 5 View (min) 10 Speed 60x Special none

88 | P a g e
The concentration effect has augmented inspired alveolar ventilation (VA) and sped equilibration between inspired and alveolar tensions. This should never be attempted in clinical practice.
Discussion
Observe how rapidly the alveolar anesthetic tension rises toward 100%; in the Graph alveolar tension reaches inspired tension in about 2.7 minutes. The time constant appears to be 0.6 minutes. Notice also that alveolar ventilation increases from 4.0 to 5.6 L/ min, and then returns slowly toward its original value. The value shown represents inspired alveolar ventilation. Inspired alveolar ventilation is the alveolar ventilation you selected plus the additional inspired ventilation necessary to maintain constant lung volume (FRC) on a breath-by-breath basis. Total body uptake of nitrous oxide is 7.3 L after 10 minutes.
Exercise 8-2: Concentration Effect Varies with Inspired Concentration The concentration effect is smaller with 40% nitrous oxide inspired than with 100%.
SETUP
Set delivered tension (DEL) to 40% while maintaining the other settings, and observe the alveolar tension curve.
Parameter Selection Agent Nitrous Oxide DEL (%) 40 Circuit Open FGF (L/min) 10 VA (L/min) 4 CO (L/min) 5 View (min) 10 Speed 60x Special none

89 | P a g e
Figure 8-2 displays the Picture and Graph from Exercise 8-2, showing a small concentration effect when 40 % nitrous oxide is inspired.
Alveolar tension does not quite equal inspired, even after 10 minutes. Note that alveolar tension no longer reaches inspired tension in the first 3 minutes. Rather, a curve similar to those observed with halothane, enflurane, and isoflurane is produced. Here, the concentration effect plays some role, since alveolar ventilation is seen to rise slightly.
Exercise 8-3: At 100%, CO Has No Effect on ALV Cardiac output has no effect on alveolar tension when 100% anesthetic is inspired.
The concentration effect brings inspired gas into the lungs as cardiac output takes it away. You will next test whether this works in the limiting cases when cardiac output is taken to extremes.

90 | P a g e
SETUP
In the next three simulations, vary cardiac output as follows: first set CO at 1 L/ min; then 10 L/min; and finally 0 L/ min. For each simulation, the parameters should be set as shown.
Figure 8-3a shows the Picture and Graph of anesthetic tensions after administering 100 % nitrous oxide for 10 minutes with cardiac output of 1 L/min.
Alveolar reaches inspired tension in about 2.7 minutes. Total body nitrous oxide uptake is 2.9 L after 10 minutes. Alveolar ventilation rises slightly.
Parameter Selection Agent Nitrous Oxide DEL (%) 100 Circuit Open FGF (L/min) 10 VA (L/min) 4 CO (L/min) 1, then 10, then 0 View (min) 10 Speed AFAP Special none

91 | P a g e
Figure 8-3b shows the Picture and Graph of anesthetic tensions after administering 100 % nitrous oxide for 10 minutes with cardiac output of 10 L/min.
Alveolar tension again reaches inspired tension in about 2.7 minutes, and the alveolar tension curve is again unchanged despite the increase in tissue uptake. Total body nitrous oxide uptake is 11.2 L after 10 minutes of simulation. Alveolar ventilation rises slightly.

92 | P a g e
Figure 8-3c shows the Picture and Graph of alveolar anesthetic tension if there were no uptake into blood (CO = 0). Clinical Note: Never do this in clinical practice. Cardiac Output is important.
As before, alveolar reaches inspired tension in about 2.7 minutes and the alveolar tension curve is unchanged. With no cardiac output, tissue uptake is of course zero. Alveolar ventilation rises negligibly.
Exercise 8-4: Concentration Effect depends on Uptake Effect The concentration effect is removed by eliminating uptake's augmentation of inspired alveolar ventilation.
Next, you will use a special feature of the Gas Man program that eliminates the effect of uptake on alveolar ventilation. This is not possible physiologically, of course, but it serves to emphasize that the Concentration Effect is caused by increased inspired alveolar ventilation secondary to anesthetic uptake into blood. By using the Special menu and selecting Disable Uptake, you can eliminate the concentration effect. When you do, you will see a curve shape representative of the response to trace or low anesthetic tension administration, no matter how high the actual concentration.

93 | P a g e
SETUP
Set the parameters for this exercise as shown, using the Special menu to Disable Uptake.
Figure 8-4 shows the Picture and Graph of Exercise 84, demonstrating anesthetic tensions with 100 % nitrous oxide inspired with the concentration effect removed.
Notice that although alveolar tension rises rapidly at first, a knee occurs at about 1 minute, when alveolar tension reaches about 60% of inspired. The curve is qualitatively similar to the open circuit alveolar tension curves observed earlier for halothane, enflurane, and isoflurane administered in low concentrations. The initial rise, knee, and tail are clearly seen.
Parameter Selection Agent Nitrous Oxide DEL (%) 100 Circuit Open FGF (L/min) 10 VA (L/min) 4 CO (L/min) 5 View (min) 10 Speed AFAP Special Disable Uptake

94 | P a g e
The Concentration Effect might better be called The High Concentration Effect. Even at low concentration the effect of concentration is very important. It is the unique property of High Concentration and therefore high uptake augmenting alveolar ventilation that caused this High Concentration Effect.
The second gas effect is the result of rapid uptake of one gas increasing the alveolar tension of a second, simultaneously administered, gas. This is discussed in detail in Chapter 11.
Summary In this chapter you have seen that the High Concentration Effect (or Concentration Effect) describes the accelerated alveolar tension rise that occurs at high inspired concentration. It is due to the increased inspired alveolar ventilation and increased alveolar anesthetic delivery that accompanies uptake into the bloodstream. When inspired concentration is 100%, this effect is maximized, and alveolar tension rise becomes independent of cardiac output. In Chapter 11, you will see that if a second gas is administered simultaneously, the alveolar tension of the second gas rises higher and faster than it would have if it were present alone. This is termed the second gas effect.

95 | P a g e
Chapter 9 Low Fresh Gas Flow Anesthesia Theory
In a semi-closed breathing circuit, high fresh gas flow allows the inspired anesthetic tension to closely approximate that delivered from the anesthesia machine, even during induction. This relationship is important, since it is the delivered tension that the anesthetist controls. As anesthesia proceeds, expired anesthetic tension rises toward inspired tension. The fresh gas flow may now be lowered since the only consequence is rebreathing the warm, humidified, anesthetic-containing expired gas. For this reason, low flow anesthesia is used by some clinicians for maintenance of anesthesia after induction is completed. Reducing flows from 8 to 2 L/min, for instance, reduces anesthesia cost by about 75%31, 39, 41, 42 while simultaneously providing heat and humidity to inspired gas8.
When real breathing circuits are used with low fresh gas flow, agents can be removed by flushing with oxygen. The Flush button in the Gas Man Picture allows you to simulate this action.
Gas Man also provides the user an ideal circuit for experimentation. Real breathing circuits behave in a manner somewhere between Gas Man's fully mixed semi-closed circuit and the un-mixed, first-in first-out ideal circuit. The ideal circuit has all of the properties of the non-rebreathing or open circuit whenever FGF exceeds ventilation. When FGF is less than ventilation, fresh gas is breathed in preference to exhaled gas. Thus, inspired gas is dominated by fresh gas as long as FGF is high.

96 | P a g e
Exercise 9-1: Reducing Fresh Gas Flow Fresh gas flow can be reduced without changing clinical course.
SETUP
To demonstrate the effect of reducing fresh gas flow during anesthesia, adjust the Gas Man parameters as shown.
Set Bookmarks at 1 minute and 4 minutes for convenience. Start with DEL set to 5 %. After 1 minute, instead of decreasing the vaporizer setting, as most do clinically, decrease the fresh gas flow to 2 L/min. At 4 minutes, decrease DEL to 2%.
Observation
Parameter Selection Agent Isoflurane DEL (%) 5 (see text) Circuit Semi-closed FGF (L/min) 8 (see text) VA (L/min) 4 CO (L/min) 5 View (min) 15 Speed 20x Special None

97 | P a g e
Figure 9-1 shows the Picture and Graph of Exercise 9-1, demonstrating the response to high flow induction with isoflurane for 1 minute, followed by a reduction of FGF and, later, delivered tension (DEL).
Note in Figure 9-1 that the patient's VRG tension rises to and remains constant at 1 MAC despite the changes in FGF and DEL. You can perform additional experiments, adjusting fresh gas flow and delivered tension while trying to produce the same alveolar anesthetic tension curve.
Discussion
After each simulation you run in this exercise, observe the Picture and note the volume of anesthetic delivered to the circuit (Delivered) and the volume taken up by the patient (Uptake). You can infer the efficiency of anesthesia administration by computing the ratio of uptake to delivered quantity. Waste is the difference between delivered and uptake; it shows the opportunity for savings. This is discussed in more detail in Chapter 14, analyzing cost. For now, select the Show Cost icon from the toolbar and note how the differences in volume with different techniques translate to dollars.

98 | P a g e
Exercise 9-2: Circuit Flush Is Faster Circuit Flush reduces anesthetic tension faster than turning off the vaporizer.
SETUP
Set the parameters as shown to start this exercise
Set Bookmarks at 5 minutes and 10 minutes. At the end of 5 minutes, reduce DEL to 0%, and continue the simulation to its end.
Observation
Figure 9-2a shows the first Picture and Graph of Exercise 9-2, wherein DEL is reduced to 0% halfway through a 10 minute anesthetic.
Parameter Selection Agent Isoflurane DEL (%) 5 (see text) Circuit Semi-closed FGF (L/min) 3 VA (L/min) 4 CO (L/min) 5 View (min) 10 Speed 60x Special None

99 | P a g e
Reducing DEL from 5% to zero after 5 minutes produces results in 10minute values of 0.42% for CKT, 0.58% for ALV, and 0.83% for VRG. Save this simulation (you will need to name it) and reduce it to an icon on your desktop by clicking on the down arrow in the upper right corner of the simulation's window.
Open a New simulation and run it using the same parameters, but this time, at 5 minutes, reduce DEL to 0 % and press the Flush button (located between the DEL control bar and the CKT com-partment). Press Continue. The results are shown in Figure 9-2. Once the circuit is flushed, CKT tension immediately falls to zero. Then, anesthetic returns to the circuit in exhaled gas, and circuit tension rises slightly. With this technique you see 10minute values of 0.22% for CKT, 0.33% for ALV, and 0.50% for VRG.
Figure 9-2b shows the second Picture and Graph of Exercise 9-2, wherein the circuit is flushed halfway through a 10 minute anesthetic.
Discussion
With a low fresh gas flow (3 L/min), you see that despite the vaporizer being switched off, inspired tension slowly fell to 0.35% by the end of 10 minutes. However, when you flushed the circuit after setting DEL to zero, circuit tension fell to zero immediately and rose only to 0.22%. Because of this, alveolar tension and vessel rich group tension were much lower after the circuit was flushed than when it was not.
You can further analyze these two techniques by using Gas Man's Overlay feature. Keeping the second simulation open, find the icon of the first simulation on your desktop and double-click to open it. Select Overlay from the View menu or click on the Overlay icon in the toolbar. Select MAC in the right ("Over") column by clicking the radio button to its right. Then observe each compartment's tension over MAC by selecting in sequence in the left ("Show") column DEL,

100 | P a g e
CKT, ALV and VRG. As you move through these overlays, note the following: DEL is the same for both; CKT falls to zero and then rises slightly in the flush technique; ALV falls rapidly in the flushed circuit; and VRG falls more rapidly with the flush technique.
In Chapter 13, you will see that wake up occurs when the VRG falls to some threshold value. It is clear that with low FGF, a flush is needed if the clinician wants the circuit, alveolar, and VRG tensions to fall to a wake up level quickly.
Figure 9-2c shows the Overlay View comparing the CKT/MAC curves with and without a, flushed circuit.
Figure 9-2d shows the Overlay View comparing the ALV/MAC curves with and without a flushed circuit.

101 | P a g e
Exercise 9-3: In a Perfect World… In an Ideal circuit, fresh gas fills the circuit first and then mixes with exhaled gas.
The ideal circuit represents what would happen if there were no gas mixing in the semi-closed circuit. In that case, inspired tension would approach delivered tension more closely. At very low fresh gas flows, both circuits would behave similarly. As fresh gas flow approaches minute ventilation, the ideal circuit behaves more and more like an open circuit. Clinical circuit behavior lies somewhere in between that of the semi-closed and ideal circuits.
SETUP
For this exercise, you will run two simulations according to the parameters shown at left – first using a semi-closed circuit and then using an ideal circuit
Parameter Selection Agent Isoflurane DEL (%) 5 (see text) Circuit Semi-closed; Ideal FGF (L/min) 3 VA (L/min) 4 CO (L/min) 5 View (min) 10 Speed 60x Special None

102 | P a g e
Figure 9-3 shows the Graphs of Exercise 9-3, simulating low f low administration of isoflurane in a semi-closed (left) and ideal (right) circuit.
The Graphs from these two simulations (Figure 9-3) show that with a semi-closed circuit, inspired rises exponentially toward the 5% set on the vaporizer. In an ideal circuit, inspired rises to near 4% very quickly and then begins to level off. This is expected, because in an ideal circuit, inspired gas is comprised preferentially of fresh gas, augmented by the requisite exhaled gas to provide minute ventilation. This augments circuit concentration.
Summary
In low flow anesthesia, fresh gas flow can be decreased after the initial period of rapid anesthesia uptake without sacrificing control of inspired, expired, and VRG tension. Cost savings can be achieved while maintaining the same inspired anesthetic tension, and hence the same clinical anesthesia course, as with high flow technique.
To allow rapid lightening of anesthetic depth, pushing the oxygen flush button clears the breathing circuit of anesthetic agent, at least transiently.
If actual breathing circuits were not well mixed, they could perform more like the Ideal circuit, in which the patient breathes fresh gas in preference to exhaled gas.

103 | P a g e
Chapter 10 Closed-Circuit Anesthesia Theory
Closed-circuit anesthesia is a drug administration technique in which quantities of anesthetic are administered to the patient plus breathing circuit combination in an effort to produce a constant level of anesthesia. Unlike other anesthesia techniques, no gases are allowed to leave the system, other than carbon dioxide, which is absorbed chemically. In a closed system or closed circuit, delivered or inspired tension is usually not adjusted directly. Rather, the rate of anesthetic added to the breathing circuit is controlled.
A prediction of anesthetic uptake based upon patient size allows the amount and timing of anesthesia administration to be decided before the patient's actual response is observed. If the prediction is wrong, the desired anesthesia level will not be attained and the rate of administration will require modification. The use of a monitor for end-expired (or approximately alveolar) anesthetic tension allows this modification to be made easily. Using these monitors, anesthetic drug administration can be tailored to achieve the inspired and alveolar tensions desired.
To achieve the same anesthesia time course with a closed system, the inspired anesthetic tension should be the same as with any other system. With semi-closed and open breathing circuits, inspired anesthetic tension can be controlled indirectly or directly; uptake cannot easily be measured. With the closed-circuit technique, inspired and expired tensions can be measured, and uptake is observed by monitoring the required quantity administered.
To understand a closed-circuit liquid-injection anesthetic induction, remember that the time course of inspired anesthetic should be similar to that required for a conventional semi-closed or open-circuit anesthetic, during both induction and maintenance. Figures 7-1 through 7-3 in Chapter 7 provide guidelines for a desirable time course of inspired anesthetic tension. Using the Gas Man computer simulation, you can inject liquid anesthetic into the breathing circuit and allow it to vaporize there. You can administer these injections so that the inspired anesthetic tension curve is similar to that produced with the semi-closed or open circuit. If you properly control the inspired tension, you should expect the same time course of exhaled or alveolar anesthetic tension you observed before. The same holds true for the anesthetic tension in the brain.
One of the unique features of Gas Man is the ability to represent liquid anesthetic administration. The red-and-black syringe icon is located on the Gas Man screen, attached to the breathing circuit. A single click on the syringe will simulate liquid injection into the breathing circuit.
The default unit dose of the liquid injected is 1.0 mL for desflurane, enflurane and sevoflurane, and 0.5 mL for halothane and isoflurane. This can be adjusted by using the Anesthesia menu, selecting Unit Dose, and typing in the desired value. This "unit dose" should not be confused with the Standard Unit Dose, calculated using formulas found in the closed-circuit anesthesia literature 22, 23, 24. Here, the unit dose is the dose administered each time liquid is injected.

104 | P a g e
For each of the volatile liquid anesthetics, 1 mL of liquid will vaporize the following volumes:
When liquid is injected, the plunger in the syringe moves, and the circuit and inspired tensions rise as if liquid was instantaneously mixed in the single breathing circuit compartment.
Exercise 10-1: Simulating Liquid Injection A closed-circuit liquid anesthetic injection induction can be simulated with Gas Man.
SETUP
To simulate a closed-circuit, liquid¬-injection anesthetic induction, adjust the Gas Man parameters as shown. If Uptake and Delivered show cost in the Picture Panel, click the “$” button on the toolbar (turn it off) to show Uptake and Delivered in L (liters of vapor).
To demonstrate a closed-circuit induction, click the Begin button, move the cursor and click on the anesthetic syringe icon four times over a period of a simulated minute or two. Each click will inject 0.5 mL of liquid isoflurane. The unit dose injected can be changed with the Anesthesia menu, by selecting Unit Dose.
Desflurane 1 mL liquid = 209 mL vapor Enflurane 1 mL liquid = 198 mL vapor Halothane 1 mL liquid = 228 mL vapor Isoflurane 1 mL liquid = 196 mL vapor
Sevoflurane 1 mL liquid = 183 mL vapor
Parameter Selection Agent Isoflurane DEL (%) 0 Circuit Closed FGF (L/min) 0.25 VA (L/min) 4 CO (L/min) 5 View (min) 15 Speed 5x Special none

105 | P a g e
Observation
Figure 10-1 shows the Picture and Graph of Exercise 10-1, demonstrating four injections of 0.5 ml liquid isoflurane into the breathing circuit.
Note in the Graph that inspired anesthetic tension reaches approximately 4% and then trails off to 1% near 7 minutes. Note the Update and Delivered quantities of anesthetic vapor. To see these expressed as cost, click the “$” button on the toolbar. The monetary value depends on the anesthetic cost, which can be changed via the Set Cost… command on the Anesthesia menu. The values Gas Man offers (if they have not been changed at your site) are USA bottle volume and bottle cost as of March 5, 2008.

106 | P a g e
Exercise 10-2: Liquid Injection Can Produce Optimum Anesthesia Closed-circuit liquid injection can produce optimum anesthesia, achieving and maintaining 1 MAC in the brain.
SETUP
To simulate closed-circuit induction and maintenance at 1 MAC using liquid injection, adjust the parameters as shown. If Uptake and Delivered show cost in the Picture Panel, click the “$” button on the toolbar (turn it off) to show Uptake and Delivered in L (liters of vapor).
Make liquid injections by clicking on the syringe icon at appropriate times to produce anesthetic induction and maintenance similar to Exercise 72a, which demonstrated constant brain tension. Each time the inspired tension falls below the desired level, click on the syringe icon again.
Figure 10-2a displays the Picture and Graph of Exercise 10-2, shouting a simulated closed-circuit anesthetic with isoflurane.
Parameter Selection Agent Isoflurane DEL (%) 0 Circuit Closed FGF (L/min) 0.25 VA (L/min) 4 CO (L/min) 5 View (min) 15 Speed 5x Special none

107 | P a g e
You will note that about four injections, or 2 mL, of liquid anesthetic is required to elevate inspired tension and that 0.5 mL increments are then required with decreasing frequency. Try similar inductions for enflurane and halothane and observe results analogous to those shown in Figure 10-2a. Note the volumes delivered and taken up, and consider the potential monetary savings as well as the elegance of the technique. To see these expressed as cost, click the “$” button on the toolbar. The monetary value depends on the anesthetic cost, which can be changed via the Set Cost… command on the Anesthesia menu. The values Gas Man offers (if they have not been changed at your site) are USA bottle volume and bottle cost as of March 5, 2008.
Figure 10-2b displays the Picture and Graph of Exercise 10-2, showing a simulated closed-circuit anesthetic with enflurane.

108 | P a g e
Figure 10-2c displays the Picture and Graph of Exercise 10-2, showing a simulated closed-circuit anesthetic with halothane.
Discussion
The closed-circuit anesthetic inductions you have just performed are similar to those described by Lowe22, and Lowe and Ernst23, but use smaller, more frequent injections. Lowe's technique requires standard unit dose liquid injection at predetermined times based upon a model of the closed system, and on the observation that nitrous oxide requirement decreases approximately in proportion to the square root of times36:This model was validated to be a good approximation by Connor and Philip.47, 48
(1/√ t = 1/t1/2 = t -1/2).
In the next exercise, you will administer closed-circuit anesthesia "by the book".

109 | P a g e
Exercise 10-3: Classic Closed-circuit Approach Liquid injection following the "t-1/2" regimen is a classic closed-circuit approach.
SETUP
To simulate closed-circuit liquid injection anesthesia following the t-1/2 model with isoflurane, adjust the parameters as shown.
Before clicking the Begin button, administer a priming dose of 0.5 mL isoflurane by clicking on the syringe icon, and then adjust Anesthesia / Unit Dose back to its default value, 0.7 mL. Click Begin. Click on the liquid syringe at 1 minute, 4 minutes, and 9 minutes. You can use Special / Set Bookmark or the toolbar Bookmark button to pause the exercise at these precise times.
Parameter Selection Agent Isoflurane DEL (%) 0 Circuit Closed FGF (L/min) 0.25 VA (L/min) 4 CO (L/min) 5 View (min) 15 Speed 5x Special none Unit Dose 0.5 mL

110 | P a g e
Figure 10-3a displays the Picture and Graph of Exercise 10-3, showing a completed 15-minute course of closed-circuit anesthesia with liquid isoflurane, using predetermined times of administration following the
square root of time regimen.
Repeat the closed-circuit liquid injection technique with desflurane and halothane. For desflurane, choose a priming dose of 2.0 mL and a unit dose of 1.5 mL. For halothane, choose a priming dose of 0.5 mL and a unit dose of 0.7 mL. Again, make injections at 1, 4, and 9 minutes. These are examples of the classic closed-circuit approach introduced by Lowe22 and refined by Ernst23. Priming doses used here are smaller.

111 | P a g e
Figure 103b displays the Picture and Graph of Exercise 10-3, showing a completed 15-minute course of dosed-circuit anesthesia with liquid desflurane using predetermined times of administration following the t-1/2
regimen.
Note that when using desflurane, the volume of the priming dose exceeded the volume of the subsequent unit doses, while in isoflurane and halothane, the opposite is true. This is because desflurane's low blood/gas solubility decreases uptake into blood and tissues, but not into the breathing circuit.

112 | P a g e
Figure 10-3c displays the Picture and Graph of Exercise 10-3, showing a completed 15-minute course of closed-circuit anesthesia with liquid halothane using predetermined times of administration following the t--1/2
regimen.
Discussion
The simulations in Exercises 10-2 and 10-3 have shown that liquid anesthetic injection into the breathing-circuit can produce satisfactory anesthesia. Viewing the vessel-rich group has shown that anesthetic tension in the location of interest (the brain) follows a relatively smooth time course. This is evident even when alveolar and especially inspired tension changes dramatically between injections.
Summary
Closed-circuit anesthesia with liquid injection into the breathing circuit can produce the same time course of inspired anesthetic tension, alveolar anesthetic tension, and brain anesthetic tension that conventional high-flow techniques allow. The Gas Man program allows various drug administration techniques to be tested and visualized in simulation.

113 | P a g e
Chapter 11 The Second Gas Effect Theory
If a second gas is administered along with a first gas of high concentration, the alveolar tension of the second gas achieves a greater height than if the first gas weren't present. This is called the second gas effect. This phenomenon was described by Epstein et al.16 and reviewed well by Eger11.
The second gas effect is composed of two parts. First, the concentrating effect describes the higher concentration of the second gas after a large amount of the first (high concentration) gas is removed. Second, the ventilation effect describes the increased inspired ventilation which restores lung volume after the large quantity of the first (high concentration) gas is removed. The ventilation effect increases alveolar tension, as we saw in Chapter 5.
In Chapter 8 we learned that the concentration effect increases the alveolar concentration achieved by a gas of high concentration as a result of its own uptake. This effect causes alveolar tension to rise relatively higher when inspired concentration is high than when it is low. The concentration effect is most notable with inspired concentrations above 70%. When inspired concentration is 100%, this effect is maximal, and alveolar tension rise is unaltered by cardiac output, no matter how high its value.
Clinical note: Do not do this in clinical practice.
In order to study the second gas effect using Gas Man, you will look at two views of the same simulation, one view for each agent:
1. Open a new simulation by opening the File menu and selecting New. Change the agent shown to nitrous oxide. Gas Man calls the first listed agent the "primary" anesthetic.
2. Use the View / New Graph menu and select (Add) Isoflurane. This adds a second agent to the simulation you created in step (1), and creates an additional view of the simulation (a Graph Panel) showing the secondary agent
Note: There is another way to do this. If you select Click to Add in the Agents table in the Control Panel, and select isoflurane, Gas Man will add the second agent and two views – one Graph and one Picture.
3. Drag the two Graphs (Primary: Nitrous Oxide and Additional: Isoflurane) to separate areas of the screen so that they can be viewed simultaneously. (Do this by dragging the tabs for these views away from the one containing the Control Panel.)
You have now created a multi-agent simulation. The uptake of one gas will correctly affect the other gas – illustrating the second gas effect.

114 | P a g e
Exercise 11-1: at Low Concentration, the Second Gas Effect is Slight With the concentration of the first gas 1%, there is little effect on the uptake of a second gas.
SETUP
Set the parameters as shown to start this exercise
Select the “primary” (nitrous oxide) Picture Panel (by clicking in it or using the Window menu) and set the nitrous oxide concentration to 1% (type "1" in the box beside the DEL scale). To best visualize the exercise, the top of the scale should also be set to this value (type "1" in the box at the top left of the DEL scale). In this way, the 1% vaporizer setting fills the entire available vertical height.
Click on the Graph Panel for isoflurane (the “secondary” anesthetic). Now, temporarily create a Picture Panel for it (menu command View / New Picture / Isoflurane). Gas Man adds a tab for this view beside the isoflurane Graph Panel. Click on the new tab to show the Picture Panel for isoflurane. As you did for nitrous oxide, change the isoflurane DEL from its default (2.9%) to 1% and set the top of the DEL scale to 1%. Finally, close the temporary Picture Panel by clicking on the panel’s close icon beside its tab (looks like a hand-drawn ‘X’).
Note: As with most windowing programs, there are many ways to accomplish the same goal. We could have created both views of isoflurane from the Control Panel for the simulation; or, we could have added a view via the context menu for isoflurane in the Agent table. Also, dismissing the Picture Panel for isoflurane is not essential to the experiment – but now you know how to do close a panel!
Make sure the breathing circuit selected is an Open (non-rebreathing) circuit. Click Begin.
Parameter Selection Agent Nitrous Oxide Isoflurane DEL (%) 1% 1% Circuit Open FGF (L/min) 10 VA (L/min) 4 CO (L/min) 5 View (min) 5 Speed AFAP Special None

115 | P a g e
Figure 11-1 shows the nitrous oxide picture and graphs of both nitrous oxide and isoflurane, in which 1% of both nitrous oxide and isoflurane were administered.
Note that in the Picture Panel, alveolar ventilation (VA) has increased from 4.00 to approx. 4.02 L/min. This increase occurred because the small uptake of both nitrous oxide and isoflurane enhanced inspired alveolar ventilation, albeit slightly. Save this simulation (you will need to name it something; I suggest '1pct N2O w Iso'). Next, minimize the three views using the Minimize button in the upper right corner of each view. You will view these again shortly in Overlay mode.

116 | P a g e
Exercise 11-2: at High Concentration, the Second Gas Effect is Dramatic When the concentration of the first gas is almost 100%, the uptake of a second gas is enhanced dramatically.
SETUP
Set the parameters as shown to start this exercise
Open a new simulation of two gases, just as you did in exercise 11-1. Again, choose the primary agent to be nitrous oxide. This time, add isoflurane using the Click to Add drop-down control in the Agents table, and drag the nitrous oxide graph, the isoflurane picture, and the isoflurane graph away from the control panel. Now, set the nitrous oxide control to 100% nitrous oxide. You will want the top of the nitrous oxide scale to read 100% also. Set the isoflurane control to 1% and the top of the isoflurane control to 1% as it was in the previous exercise. Do not be concerned that the total pressure appears to be 101%.
Clinical note: Do not do this in clinical practice.
Next, set the graph duration on both Graph Panels to 5 minutes. On the control panel, make sure the circuit is open, the speed is AFAP. Click Begin.
Parameter Selection Agent Nitrous Oxide Isoflurane DEL (%) 100% 1% Circuit Open FGF (L/min) 10 VA (L/min) 4 CO (L/min) 5 View (min) 5 Speed AFAP Special None

117 | P a g e
Observation
Figure 11-2a shows the Graphs of both Views of Exercise 11-2, using 1% isoflurane and 100 % nitrous oxide.
Observe the alveolar tension curves for isoflurane and nitrous oxide when 100% nitrous oxide is used as the second gas (Figure 11-2a).
Note: Alveolar Ventilation has risen significantly because of the concentration effect, as you might expect, but notice we see it in the isoflurane Picture. Why? Because, unlike DEL, VA is

118 | P a g e
not specific to an anesthetic. There is only one patient, so there is only one value for VA to show regardless of where it appears. Save this simulation and name it ‘100 pct N2Ow Iso.’
In order to compare the two simulations you have run in Exercise 11-1 and 11-2, use the Overlay feature of Gas Man. First, analyze nitrous oxide:
1. Minimize the isoflurane graph.
2. Restore the nitrous oxide graph window from the previous exercise.
3. Choose Overlay from the View menu.
4. Observe alveolar over inspired by clicking on the ALV radio button in the left ("Show") column and the CKT radio button in the right ("Over") column. This is ALV / CKT.
Note in the resulting overlay graph (Figure 11-2b) that the high concentration of nitrous oxide (100%) caused alveolar to closely approach inspired in the first few minutes. With 1% inspired nitrous oxide, however, alveolar tension rises in a manner similar to other agents in low concentration.
Figure 11-2b shows the Overlay View comparing the A/I ratios for nitrous oxide in Exercises 11-1 and 11-2.
Once you have verified The Concentration Effect for the first gas (nitrous oxide), minimize the nitrous oxide windows and open both the isoflurane windows. When you do this, you will notice that their graphs are quite different. The graph obtained in the presence of 1% nitrous oxide (Exercise 11-1) looks like any other 1% isoflurane graph. The graph of isoflurane in the presence of 100% nitrous oxide (Exercise 11-2) shows alveolar tension approaching inspired tension a little more closely in the first few minutes. This is the second gas effect. The rapid uptake of the first gas (nitrous oxide in 1% and 100% concentrations) has minimally and maximally affected the uptake of the second gas, isoflurane, administered in 1% concentration. This overlay is shown in Figure 11-2c.

119 | P a g e
Figure 11-2c shows the Overlay View comparing the A/I ratios for isoflurane in Exercises 11-1 and 11-2, without and with high concentration of nitrous oxide, respectively.
Exercise 11-3: Concentration Effect Using 70% Nitrous Oxide The addition of 70% nitrous oxide enhances the rise of alveolar isoflurane toward inspired isoflurane concentration.
SETUP
Set the parameters as shown to start this exercise
Because 100% nitrous oxide is not compatible with life and should never be administered, in this exercise, you will see the impact of administering nitrous oxide plus isoflurane anesthetic at
Parameter Selection Agent Nitrous Oxide Isoflurane DEL (%) 70% 1% Circuit Open FGF (L/min) 10 VA (L/min) 4 CO (L/min) 5 View (min) 5 Speed AFAP Special None

120 | P a g e
clinically relevant concentrations. Open a new simulation and add a second gas, as before. Use nitrous oxide 70% combined with isoflurane 1%. Using an open circuit, click Begin.
Observation
Overlay the isoflurane curve from Exercise 11-3 with the isoflurane curves from Exercises 11-1 and 11-2. Notice that the alveolar tension for isoflurane rises higher with 70% than with 1% nitrous oxide, and lower than with 100% nitrous oxide (Figure 11-3).
Figure 11-3 shows the Overlay View of the isoflurane A/I curve from each of Exercises 11-1 through 11-3, comparing the second gas effect of 1%, 70% and 100% nitrous oxide.
Summary
In this chapter, you have studied the second gas effect, in which the simultaneous administration of a second gas with a first gas in high concentration causes the alveolar tension of the second gas to rise higher than it would if it were present alone. One percent nitrous oxide exerts almost no effect, 70% nitrous oxide a moderate effect, and 100% nitrous oxide a great effect.

121 | P a g e
Chapter 12 Patient Wake Up Theory
Wake up from a long anesthetic is analogous to induction. During induction, anesthetic tension in all compartments begins at zero. Tissue tensions then rise toward the value set on the vapor-izer. "Fast" compartments (alveolar, vessel-rich group) attain that height quickly, while "slow" compartments (muscle, fat) take longer. At the end of a theoretical "infinite length" anesthetic, all tissue tensions would equal that set on the vaporizer. This would have occurred as all tissue tensions approached arterial and alveolar, alveolar then approached inspired, and inspired approached vaporizer setting.
For emergence, or wake up, the vaporizer or inspired is set to zero and tissue tensions fall toward this zero value. Again, inspired falls, alveolar falls, and the fast compartments fall to the alveolar level quickly while slow compartments take longer. At the end of wake up, all tissue tensions again equal that set on the vaporizer – zero. The amount of time to complete this process may be very long. However, clinically useful falls in VRG tension to awake levels occur in a few to many minutes.
When looked at graphically, the course of anesthetic tensions during induction and wake up appear flipped vertically, or as inverted images of each other. This will be shown in this chapter's simulations.
Exercise 12-1: Wake Up Is the Inverse of Induction
SETUP
To demonstrate that wake up is the inverse of induction, this exercise simulates a long anesthetic using an open circuit. Adjust the parameters as shown at left, and run the simulation for 10 hours (the fastest way to do this is to set View in the Gas Man Graph to 10 hours and run the simulation at AFAP speed).
Parameter Selection Agent Desflurane DEL (%) 9 Circuit Open FGF (L/min) 8 VA (L/min) 4 CO (L/min) 5 View 10 hrs Speed AFAP Special none

122 | P a g e
At the end of 10 hours, switch off the vaporizer (reduce DEL to 0 in the Gas Man Picture), change the simulation speed to 10x and change the View to 5 minutes. Run the simulation for 5 more minutes while observing the Graph. Create a second graph panel from the View menu (View / New Graph / Desflurane), and drag its tab below the original Graph for comparison.
Then, push the scrollbar at the bottom of the new Graph all the way to the left to see the first 5 minutes.
Figure 12-1 shows the Graphs of the first and last 5 minutes of Exercise 12-1, simulating patient wake up after a 10-hour anesthetic with desflurane.

123 | P a g e
Observe in the top graph of Figure 12-1 the effect of suddenly switching off the vaporizer using an open circuit. Note that alveolar tension falls 66% of the way to zero in the first few breaths. Compare the two graphs and note their inverse relationship.
Discussion
Although these two graphs of induction and wake up are nearly identical inverted images, they vary slightly because the anesthetic administration was not "infinite". The difference between these two situations is that after the 10-hour anesthetic, fat tension was approximately 33% of that in the other compartments, whereas after an infinite duration anesthetic, tension in fat would equal 100% of that in all other areas. For this reason, the wake up curve here is actually slightly different from the induction curve. During wake up from the 10-hour anesthetic, alveolar tension was slightly closer to inspired than during induction (or after an infinite length anesthetic). The difference is so small, however, that it is not visible on the computer screen or in the Figure.
Exercise 12-2: Lower Solubility Means Lowers Alveolar Wake-up Tension During wake up, alveolar tension is relatively lower at all times with less soluble agents.
SETUP
For this exercise, open three simulations, using isoflurane at 1.2% in the first, sevoflurane at 2.1% in the second, and desflurane at 6% in the third. Keep them open simultaneously.
In this Exercise, run the same simulation as in the previous exercise, but with three different agents at their clinically relevant concentrations, say 1 MAC in VRG. In this way you are using the agents in their order of solubility. Run each simulation for 10 hours (you can use Run All command from the File menu or click on the Run All icon). At the end of 10 hours, in each simulation, switch off the vaporizer, change view to 10 minutes, and set a bookmark for 10 hours 10 minutes. Run all the simulations for 10 more minutes and then observe their Graphs (if you have a large screen, you can see all three at once using Tile from the View menu).
Parameter Selection Agent Iso Sevo Des DEL (%) 1.2% 2.1% 6% Circuit Open FGF (L/min) 8 VA (L/min) 4 CO (L/min) 5 View 10 hrs Speed AFAP Special None

124 | P a g e
Observation
Keeping all three simulations open, use the Overlay feature to view anesthetic tension in the alveoli and the vessel-rich group normalized to MAC. You will see that as solubility of the anes-thetic decreases, alveolar and VRG tension is relatively lower at all times during wake up (Figures 12-2a and 12-2b).
Figure 12-2a shows the Overlay View of ALV/MAC from the simulations run in Exercise 12-2, simulating patient wake up after a 10-hour anesthetic with isoflurane, sevoflurane and desflurane.
Because anesthetic tension is lower at all times with the less soluble agent, wake up will always be faster. The actual difference in wake up times will depend on the MAC level during the anesthetic and that required for wake up. Although the MAC level during anesthesia is often 1.0 MAC and MACawake is often 0.33 MAC in the VRG, other lower levels of anesthesia are desired for clinical capabilities such as climbing to stretcher, discharge from recovery room, and returning to work.
Recognize that the attainment of these clinical states occurs when the VRG (brain), not the ALV level, reaches these values. Therefore, change the overlay view by selecting VRG in the Show column.
To see how long it takes to reach the MAC fractions state above (0.33, and approximately 0.2, 0.1, and 0.05), proceed as follows:
1. Close the overlay screen.
2. Set the three Graph views to 5 hours, and continue running the simulations out to 15 hours.
3. Show the Overlay again, to display VRG over MAC for the last 5 hours of the simulation.

125 | P a g e
4. Click on the overlay graph and notice that the overlay displays the value at the cursor position along each axis of the graph.
5. Move the cursor along each graph-line to 0.33, 0.2, 0.1, and 0.05 to mimic attainment of the clinical states enumerated above, and see when each agent reaches each state.
Note that the time to reduce anesthetic level to 50% is almost identical for all agents and that this time is less than 4 minutes, even after a 10-hour anesthetic.
When MAC awake is lower, there is more of a distinctive difference between times of agents of different solubilities.
Figure 12-2b shows the Overlay View of VRG/MAC from the simulations run in Exercise 12-2, simulating patient wake up after a 10-hour anesthetic with isoflurane, sevoflurane and desflurane.
Discussion
Look at each of the Graphs in the simulations you ran in Exercise 12-2. Measure the time required to reach 0.33 MAC in the ALV and VRG for each agent. These numbers are tabulated below (keep in mind these numbers are based on the parameters set in the simulations and actual clinical results will vary slightly):
ALV VRG Isoflurane 6.5 9.9
Sevoflurane 2.4 6.3 Desflurane 1.0 4.1
Time to Reach 0.33 MAC (minutes)
Because the wake up curve after a very long anesthetic is the approximate inverse of induction, it can be inferred that kinetic comparisons among agents during induction will apply similarly

126 | P a g e
during wake up. Thus, the plateau heights seen in the first few minutes of anesthesia in Chapter 6 will provide plateaus during emergence. In each case, the fall in agent tension during wake up will mimic the rise during induction.
Keep in mind that during induction, overpressure can be used to compensate for solubility. During wake up, however, there is no way to use "underpressure" to compensate because the vaporizer cannot be set below zero.
Summary
In this chapter, you saw that the alveolar tension wake up curve after a very long anesthetic is the inverse of the induction curve. Because of this similarity, comparing alveolar or brain tension curves during induction provides great insight into tensions expected during wake up. Wake up from less soluble agents occurs earlier than after more soluble agents. Longer duration anesthetics make induction and inverted emergence curves more similar.

127 | P a g e
Chapter 13 Patient Size Theory
Patient size affects the volumes of body compartments as well as the flows (ventilation, cardiac output) which link these compartments. In general, volumes scale linearly with patient weight. This is because most tissues are of reasonably uniform density.
The flows that link the compartments are generally not linear1. The effect of weight on many body processes (e.g., oxygen consumption, carbon dioxide production, spontaneous alveolar ventilation, cardiac output, and fluid requirements) has been shown to be proportional to body weight raised to the 3/4 power. That is, cardio-pulmonary processes are proportional to Kg3/4.
For these reasons, Gas Man scales alveolar ventilation and cardiac output as Kg3/4, while it changes compartment volumes linearly with weight (Kg1). Values for volumes and flows for a 70 kg patient are those found often in the literature: VA = 4 L/min, CO = 5 L/min, and oxygen consumption = 250 mL/min.
The fact that inter-compartment flows scale up less than compartment volumes as weight increases means that kinetic processes speed up in patients of lower weight (smaller size) and slow down in patients of higher weight and size. By using the simulation capabilities of Gas Man, you can experiment with the effect of different agents and administrations in patients of varying size. Within the normal range of human size, the variation is surprisingly small. In addition, because you can vary weights in Gas Man to the extremes of very low or very high weight, you can simulate inhalant anesthetic administration in animals from mouse to large horse or possibly elephant.

128 | P a g e
Exercise 13-1: Kinetics is Faster in Smaller Patients Kinetics is faster with patients of lower size
SETUP
To see the effect of patient size on the alveolar tension curve, simulate administering 1% isoflurane to patients of weights 10 kg, 60 kg, and 120 Kg.
First, open a new simulation with isoflurane 1%, using an open circuit, and set body weight to 10 kg. Next, open two new simulations (not new Views) and set 1% isoflurane with a 60 kg and 120 kg patient respectively. Choose Run All from the File menu, or click on the Run All icon in the toolbar. Now, with the three simulations completed, choose Overlay to observe their respective A/I ratios. Leave these simulations open in order to use them in the next exercise.
Parameter Selection Agent Isoflurane DEL (%) 1 Circuit Open FGF (L/min) 10 VA (L/min) 4 CO (L/min) 5 View (min) 15 Speed AFAP Special none Weight(kg) 10; 60; 120

129 | P a g e
Observation
Figure 13-1 shows the Overlay View of the A/I ratios achieved through administration of 1% isoflurane to patients of 10, 60 and 120 kg in weight.
Note in Figure 13-1 the progressive lowering (and secondary slowing) as weight is increases. Also note how small the difference is within normal adult sizes, even when varying the weight as much as 60kg.

130 | P a g e
Exercise 13-2: Kinetics is Faster in Smaller Animals Kinetics is faster with small animals than with large animals.
SETUP
To compare small and very large animals, add two more simulations, setting parameters as shown at left.
Add two more simulations to those from Exercise 13-1. Run one simulation using the weight of a large mouse, 0.1 Kg, and another using the weight of a small elephant, 1500 kg. Then choose Overlay to view the results.
Parameter Selection Agent Isoflurane DEL (%) 1 Circuit Open FGF (L/min) 10 VA (L/min) 4 CO (L/min) 5 View (min) 15 Speed AFAP Special none Weight(kg) 0.1; 1500

131 | P a g e
Observation
Figure 13-2 shows the Overlay View of the A/I ratios achieved through administration of 1% isoflurane to Patients of 0.1, 10, 600, 120, and 1500 kg in weight.
Figure 13-2 shows the curves of alveolar tension one would expect in very small and very large animals. While the curve of a very small animal is quite different from human weights, as size increases, the change in the curve lessens.
These simulations all used an open circuit, so the effect of anesthetic uptake did not diminish inspired tension in the larger animals. In a semi-closed circuit with limited fresh gas flow and circuit volume, the effect can be dramatic. In addition to a high FGF, larger circuit volumes are needed for larger animals. Circuit volume in Gas Man can be adjusted on the Simulation tab of the Options command found under the Tools menu.
Summary
In this chapter, you have seen that volumes can be modeled as linear with patient weight, while flows can be modeled as proportional to weight to the 3/4 power. When this is done, the alveolar tension curves for animals and patients slow as body weight increases. Very large variations in weight are necessary to demonstrate significant changes in the time course of anesthetic tension.

132 | P a g e
Chapter 14 Analyzing Cost Theory Awareness of the cost of the anesthetic used in surgical procedures is increasingly critical to clinical practice. Cost is affected directly by the anesthetic agent chosen but also by the adminis-tration technique used. The pharmacokinetics of an anesthetic agent and the resulting impact on the patient can lead to the actual cost of a particular anesthetic being quite different from the expectation based solely on price per bottle or mL.
Gas Man enables you to analyze the cost of administration in two ways. First, you can choose to view cost instead of volume in the Uptake and Delivered boxes located in the lower right portion of the Gas Man Picture. You can toggle the display of cost or volume by using the $ icon in the toolbar or choosing Show Cost in the View menu. You can also analyze cost by using the Overlay feature, and choosing the Cost over One vs. time curve for different agents or techniques. It is interesting to compare the "efficiency" of different agents by comparing delivered and uptake costs instead of volumes. The exercises in this chapter demonstrate these features.
Cost computations are done automatically in Gas Man by computing the product of delivered volume and unit cost of the agent selected. Delivered volume in turn is the product of fresh gas flow (FGF) and the vaporizer setting (DEL). Both FGF and DEL can be adjusted continually throughout a simulation as with an actual anesthetic. You can adjust the default cost parameters depending on your institution's actual costs as prices change (see Appendix E), or adjust them in a particular simulation to simulate the effect of price changes.
To change the bottle cost and size in a simulation, invoke the Set Cost… command under the Anesthesia menu, and modify the settings you see there.

133 | P a g e
Exercise 14-1: Determining Cost to Achieve 1 MAC The cost to achieve and maintain 1 MAC of isoflurane in the vessel-rich group can be determined with Gas Man
SETUP
To determine the cost to achieve one MAC, start with the parameters shown at left.
Set a Bookmark at 13 minutes. Click Begin and watch the anesthetic tensions approach 1 MAC in the Graph while observing the cost data in the Picture. At 13 minutes, reduce DEL to 1.5%, and continue the simulation through to 60 minutes. Keep this simulation open for later use.
Parameter Selection Agent Isoflurane DEL (%) 2 Circuit Semi-closed FGF (L/min) 8 VA (L/min) 4 CO (L/min) 5 View (min) 60 Speed 60x Special Show Cost

134 | P a g e
Observation
Figure 14-1 shows the Picture and Graph for Exercise 14-1, which determined the cost of maintaining 1 MAC of isoflurane for 1 hour.
Discussion
By observing the Graph in Figure 14-1, you will note that ALV has reached 1 MAC (the dotted line) at the end of 9 minutes 20 seconds. At the end of 13 minutes, VRG has reached 1 MAC and induction is considered complete. When you paused the simulation at 13 minutes, you should have observed that the delivered cost (anesthetic delivered to the breathing circuit) so far was $2.17 and uptake cost (anesthetic uptake in patient tissues) was $0.32. After you reduced DEL to 1.5% and completed the 1 hour anesthetization, you observed a delivered cost of $8.06 of isoflurane, which provided tissue uptake of $0.96. These administration costs are based on a bottle cost of US$20.47 per 100 ml.

135 | P a g e
Exercise 14-2: Cost to Achieve 1 MAC is Lower with Lower FGF Cost to achieve and maintain 1 MAC in the VRG is lower with lower FGF.
SETUP
To determine the cost to achieve one MAC, start with the parameters shown at left.
In this exercise, you will again simulate a 1 hour anesthetic with isoflurane, but with a higher vaporizer setting combined with a much lower FGF. Set the parameters as shown. Set a Bookmark at 13 minutes. Click Begin. At 13 minutes, reduce DEL to 2.7%, and continue the simulation through to 60 minutes.
Parameter Selection Agent Isoflurane DEL (%) 5 Circuit Semi-closed FGF (L/min) 1 VA (L/min) 4 CO (L/min) 5 View (min) 60 Speed 60x Special Show Cost

136 | P a g e
Observation
Figure 14-2a shows the Picture and Graph of Exercise 14-2, using a FGF of 1 L/min to achieve 1 MAC of isoflurane.
Reducing the FGF from 8 L/min to 1 L/min and increasing DEL from 1% to 5% resulted in ALV reaching 1 MAC only slightly later (10 minutes) than in Exercise 14-1, while 1 MAC in VRG was again achieved by 13 minutes. At this point, delivered cost so far was $0.68 (compared with $2.17) and uptake cost was $0.29, almost as before. At the end of 1 hour, delivered cost was $2.00, compared with $8.06 in Exercise 14-1. Therefore, the 8 L/min administration was four times more costly than the 1 L/min anesthetic while achieving the same effect.
The cost advantage of low flow technique can also be discussed in terms of efficiency. Using a flow of 8 L/min at 2%, the ratio of delivered cost to uptake cost after one hour was 8.3 (eight times as much anesthetic was used as was taken up in the tissues), while using a flow of 1 L/min at 5% results in a ratio of 2.0 (twice as much anesthetic was used as was taken up in the tissues).
Discussion
Compare Exercises 14-1 and 14-2 by using Gas Man's Overlay feature. With both simulations open, select Overlay from the View menu or click on the Overlay icon in the toolbar. Select Cost from the left ("Show") column and One from the right ("Over") column. Note the difference in the slopes of the two curves (Figure 14-2b).

137 | P a g e
Figure 14-2b shows the Overlay View comparing the cost curves in Exercises 14-1 and 14-2.
To confirm that the anesthetic administrations in Exercises 14-1 and 14-2 were clinically similar, first overlay ALV over MAC (Figure 14-2c). Note that in the two simulations, ALV reached 1 MAC at the same time. Next, overlay VRG over MAC and see that VRG tension reached 1 MAC at the same time in the two simulations as well (Figure 14-2d).
Figure 14-2c shows the Overlay View of the ALV/MAC curves in Exercises 14-1 (high flow) and 14-2 (low flow).

138 | P a g e
Figure 14-2d shows the Overlay View of the VRG/MAC curves in Exercises 14-1 (high flow) and 14-2 (low flow).
Exercise 14-3: Low Flow Techniques with New Agents Low flow techniques also decrease the anesthetic cost of new agents.
SETUP
To determine the cost to achieve one MAC, using desflurane, start with the parameters shown at left.
Run two simulations similar to Exercises 14-1 and 14-2, but this time use desflurane. In the first simulation set FGF to 4 L/min and set the vaporizer at 10% for the first eight minutes; then reduce it to 7% for the rest of the hour. Save the first with the name ‘Des 4 LPM.’
Parameter Selection Agent Desflurane Desflurane DEL (%) 10%->7% 18%->8% FGF (L/min) 4 1 Circuit Semi-closed VA (L/min) 4 CO (L/min) 5 View (min) 60 Speed 60x Special Show Cost

139 | P a g e
In the second simulation, set FGF to 1 L/ min and set the vaporizer at 18% for the first ten minutes and reduce it to 8% thereafter. Save the second with the name Des 1 LPM.
Observation
Figure 14-3 shows the Overlay View comparing the cost curves of administering desflurane with regular and low-flow techniques.
Run three more simulations similar to Exercises 14-1 and 14-2, but this time use sevoflurane. In the first simulation, set FGF to 8 L/min and set the vaporizer at 8% for the first minute, then reduce it to 2.5% for the rest of the hour. Save this simulation with the name ‘Sevo 8 LPM.’
In the second simulation, set FGF to 2 L/min and set the vaporizer at 8% for the first four minutes, then reduce it to 3% thereafter. Save this simulation as ‘Sevo 2 LPM.’
In the third simulation, set FGF to 1 L/min and set the vaporizer at 8% for the first eight minutes, then reduce it to 3.8% thereafter. Save this simulation as ‘Sevo 1 LPM.’

140 | P a g e
Observation
Figure 14-4 shows the Overlay View comparing the cost curves of administering isoflurane and desflurane with regular and low-flow techniques.
Figure 14-4 shows the Overlay View comparing the cost curves of administering sevoflurane with regular and low-, and very-low-flow techniques.

141 | P a g e
Discussion
When you have completed all four of the simulations in this Chapter, you will have documented comparative costs as shown in the table below.
FGF Cost Sevoflurane 8 65.35 Desflurane 4 40.76
Sevoflurane 2 21.01 Sevoflurane 1 13.74 Desflurane 1 13.31 Isoflurane 8 $8.06 Isoflurane 1 2.00
Cost of One Hour Anesthetic
These simulations show that the cost of anesthesia administration is more sensitive to FGF than to the agent chosen. Indeed, if you compare the costs of closed circuit anesthesia with isoflurane and desflurane, you would discover that desflurane is actually less expensive than isoflurane at these bottle prices.
Of course, bottle prices in the marketplace can change. The prices used here are the prices of isoflurane and desflurane when desflurane was first sold in the USA, i.e., $78.00 per 100 mL bottle of isoflurane and $70.00 per 240 mL bottle of desflurane on March 5, 2008.
As prices change, quantitative and qualitative results and comparisons will change. Nonetheless, assuming prices remain at these levels or lower, the maximum cost of one hour of anesthesia with FGF = 1 L/min is $10.00 or less. Closed circuit is even less.
Summary Gas Man allows cost comparison between agents and among techniques. In general, cost is more sensitive to fresh gas flow than to agent chosen. All the variables necessary to compare costs can be adjusted in the program - vaporizer settings, length of induction, gas flow, agent supply costs. Questions and answers are limitless.

142 | P a g e
Chapter 15 High Flow during Induction Theory In this chapter we will learn that when rapid and sustained changes in anesthetic level in the brain are desired, high fresh gas flows is necessary. We will compare anesthesia induction with FGF = 6 L/min to FGF = 2 L/min, each with DEL = 6%. This could be actual inhaled anesthesia induction or could be inhaled induction after IV induction.
Exercise 15-1: Simulate Anesthesia Induction with FGF 6 LPM Simulate anesthesia induction with FGF 6 LPM and 6% Delivered sevoflurane
SETUP
To determine the time to achieve one MAC (2.1%) in Inspired, Alveolar, and Brain, start with the parameters shown at left. When you are done, save with the name ‘6 LPM 6%’
Parameter Selection Agent Sevoflurane DEL (%) 6 Circuit Semi-closed FGF (L/min) 6 VA (L/min) 4 CO (L/min) 5 View (min) 15 Speed 60x Special Agent Color Black

143 | P a g e
Observation
Figure 15-1 shows the Picture and Graph for Exercise 15-1, which determined the time to attain 1 MAC of sevoflurane with FGF 6L/m and 6% DEL.
Discussion
We observe anesthesia induction with FGF 6 LPM and 6% Delivered sevoflurane, and note that 1 MAC (2.1%) is achieved in Inspired at 0’ 41”, alveolar at 02’ 00”, and brain at 04’ 53”. Thus the brain reached 1 MAC just under 5 minutes.

144 | P a g e
Exercise 15-2: Simulate Anesthesia Induction with FGF 2 LPM Simulate anesthesia induction with FGF 2 LPM and 6% Delivered sevoflurane
SETUP
To determine the time to achieve one MAC (2.1%) in Inspired, Alveolar, and Brain, start with the parameters shown at left. Note the difference: FGF is now reduced to 2 L/min. When you are done, save with the name ‘2 LPM 6%’
Observation
Figure 15-2 shows the Picture and Graph for Exercise 15-2, which determined the time to attain 1 MAC of sevoflurane with FGF 2L/m and 6% DEL.
Parameter Selection Agent Sevoflurane DEL (%) 6 Circuit Semi-closed FGF (L/min) 2 VA (L/min) 4 CO (L/min) 5 View (min) 15 Speed 60x Special none

145 | P a g e
Discussion
We observe anesthesia induction with FGF 2 LPM and 6% Delivered sevoflurane, and note that 1 MAC (2.1%) is achieved in inspired at 2’ 37”, alveolar at 05’ 49”, and brain at 08’ 57”.
If we define induction as the time when VRG reaches 1 MAC, we have seen that induction takes almost twice as long with FGF = 2 L/min as it does with FGF = 6 L/min.
Exercise 15-3: Induction at 6 L/min is much more rapid than at 2 L/min Induction is much more rapid with FGF = 6 L/min than it is with FGF = 2 L/min
SETUP
With a fresh run of Gas Man®, open the two previously saved exercises (6 LPM 6% and 2 LPM 6%). Fast-run both until they reach 1 MAC in VRG. Then, click the Overlay button on the toolbar and select VRG for the numerator and MAC for the denominator.
One might wonder why with a fresh gas flow ratio of three to one (3:1) induction was not shortened by a factor of 3. This is because higher fresh gas flow shortens the time between that delivered from the vaporizer and that inspired. But, it does not impact the time from inspired to expired or from blood to brain. Since the blood to brain time is three minutes, this accounts for three minutes of the total delay from vaporizer to brain.
Similarly, if one were to increase alveolar ventilation, this would not shorten the anesthetization process very much since the delay imposed by the lungs is only 0.5 minutes. Thus the time savings would be a fraction of 0.5 minutes and would reduce induction time negligibly.
Run Exercise 15-1 Run Exercise 15-2 Show Overlay (See text.)

146 | P a g e
Figure 15-3 shows the Overlay View comparing the VRG curves in Exercises 15-1 and 15-2. This demonstrates the power of graphic overlays comparing locations and simulations.
Figure 15-3 shows the Overlay View comparing the VRG curves in Exercises 15-1 and 15-2.
Summary In this chapter we have seen that inducing anesthesia with a fresh gas flow of 6 L/min rather than 2 L/min reduces induction time from 9 minutes to 5 minutes. We have also seen that Gas Man is an excellent tool to explore clinical issues and discover exciting new insights.

147 | P a g e
Chapter 16 Bolus Controlled Anesthetic Depth Theory In Chapter 15 we saw that with or without intravenous induction, anesthetic level in VRG (vessel-rich tissue group including brain and cardiovascular system) can be brought to 1 MAC quickly. We did this with FGF = 6 L/min and Vaporizer set to 6%.
If that anesthetic were continued with the same settings, anesthetic depth would deepen rapidly. This would happen because despite VRG being at 1 MAC, CKT and ALV, tensions had been elevated to allow VRG to change rapidly. Our job as anesthetists is to change anesthetic depth and then keep it where we want it.
We shall simulate the phenomenon of overdose and then explore methods to assure it does not happen. To do so, we will learn how to achieve the desired anesthetic level quickly and avoid overdose. This is easily achievable once we understand the theory and can apply it.
Discussion
At the completion of Exercise 15-1, Inspired had reached 4.78% and Alveolar had reached 3.37%. See Fig 16-1.
Figure 16-1: Anesthetic level in VRG rapidly achieved 1 MAC.

148 | P a g e
If the anesthetic levels in DEL, CKT, and ALV were maintained at these values, VRG would soon rise to reach 3.37%. The patient would then experience the effects of very deep anesthesia including cardiovascular depression.
To avoid this problem, the anesthetist must bring the anesthetic level in the brain back to a more suitable value, somewhere near 1.0 MAC.
Depth of anesthesia with inhaled agents can be dramatically and rapidly reduced by using inspired agent underpressure, sometimes caused a negative bolus. This is accomplished by reducing the inspired concentration or tension of anesthetic to a level low enough to rapidly bring the brain and cardiovascular system back down to 1 MAC or less. To achieve this, we set the vaporizer to a low setting or turn it off.
Copy and rename Exercise 15-1 “Negative Bolus”. Run the simulation until it pauses at 4’ 53”. Do this rapidly by holding down the shift key while clicking Run.
Note that tensions displayed are CKT = 4.78, ALV = 3.27, VRG = 2.05. If you were to click Run at this time, VRG would head toward ALV and ALV would head toward CKT and CKT would head toward DEL.
If you try this now, you will see the overdose. Now, simply rewind and fast run back to 4’53”
Here we introduce a negative bolus of sevoflurane. We set the vaporizer to zero and leave the FGF at 6 L/min. At the end of one minute, at time = 5’ 53”, we will pause the Gas Man simulation either manually or by setting a bookmark at 5’ 53”.
When the simulation stops, we see CKT, ALV, and VRG all displaying levels near 1 MAC. Because CKT, ALV, and VRG have achieved these values, the patient is in a new equilibrium and we can set FGF and DEL to maintain 1 MAC levels. We do so by setting FGF = 2 L/min and DEL = 3%. Had we left the vaporizer off longer, we could have reduced anesthetic depth still further. This is the power of the negative bolus

149 | P a g e
Figure 15-2: FGF = 2 L/min and DEL = 3% after CKT, ALV, and VRG reach 1 MAC.
We now continue the aesthetic to the end of a 10 minute Gas Man Graph view. Change the graph drop-down to ‘10 Min’ and continue.
Figure 15-3: FGF = 2 L/min and DEL = 3% after 10 minutes.

150 | P a g e
Summary The beauty of the anesthetic path to the brain via the lungs lies in its response time. In Chapter 15, we saw how we can take advantage of that with a bolus up or overpressure that causes a swift response in the VRG. Here we have shown its complement, a negative bolus or underpressure may be used to rapidly reduce anesthetic depth as desired.

151 | P a g e
Chapter 17 Vital Capacity (Deep Breath) Induction Theory Vital Capacity Induction (VCI) is the name of a drug administration technique that begins anesthesia rapidly using only inhaled anesthetic agents breathed in a giant breath. VCI is the beginning of a bolus plus infusion drug administration technique, comparable to TIVA with intravenous agents.
To achieve VCI, the patient exhales to empty the lungs and then inhales from a breathing circuit that is already filled with a high concentration (high tension) of anesthetizing vapors or gases. This is most often performed with sevoflurane in oxygen or in a nitrous oxide plus oxygen mixture. This chapter will focus on sevoflurane in oxygen as the anesthetizing substance. Gas Man and clinical practice both perform induction with either mixture.
Because the inspired tension is high and the lung volume is small before the large breath, the lungs are initially filled with a drug tension close to that which was inspired. Because sevoflurane has a low blood/gas solubility ratio, the tension of sevoflurane in the lungs remains high even as cardiac output carries blood with the same high anesthetic tension to the tissues, most notably the brain. When the circuit is primed with 8% sevoflurane, the initial inspired tension is above 6% and the alveolar, end-tidal, and arterial anesthetic tensions are all above 4% or 2 MAC.
In the first few seconds, alveolar tension is very high (above 4%) but the brain has not yet received anesthetic, so the patient is fully awake. As the brain is perfused with 2 MAC tension of sevoflurane, it is rapidly anesthetized. At the end of 1 minute the brain has then reached 0.5 MAC and the patient has lost consciousness. Moments later the brain reaches 1 MAC. If high delivered concentration is continued while ventilation is maintained, the anesthetic state continues to deepen and the brain reaches 1.5 MAC and 2.0 MAC in the next few minutes. During this time, the skilled anesthetist determines when anesthetic state is sufficient to secure the airway with a laryngeal mask airway or with a tracheal tube. The classic changes in pupil signs and muscle tone associated with induction of anesthesia are visible during this technique. Once the airway is secured, the brain anesthetic level can be quickly reduced to 1 MAC or below as preparation for surgical incision continues. Anesthetic depth can be reduced so quickly that changes in heart rate and blood pressure do not occur. Adding conventional amounts of fentanyl to the bolus of sevoflurane makes hypotension more likely.
Gas Man allows the learner to perform Vital Capacity Induction and explore variations of this technique. Here, we will simulate circuit prime, vital capacity breath, and continued ventilation until the brain reaches 1 MAC. Next we will continue the simulation until the brain reaches 1.5 MAC and then bring the brain back to 1 MAC quickly. Next we will repeat the simulation but continue until the brain reaches 2.0 MAC and again bring the brain back to 1.0 MAC quickly. We will pause and set a bookmark to terminate circuit prime at 3 minutes and then pause and place bookmarks at each significant clinical benchmark.

152 | P a g e
Exercise 17-1: Circuit Prime Prime the Unattached Circuit with Fresh Gas Flow
SETUP
Circuit prime is achieved when fresh gas flows through the breathing circuit while the patient is not yet connected. In clinical practice, closing the pop-off valve, plugging the Y and emptying the reservoir bag three times primes thoroughly. Set the parameters of this exercise by setting FGF = 4 L/min and VA = 0. Run to the bookmark.
Observation
Figure 17-1 shows the Picture and Graph for Exercise 17-1 after the 3 minute circuit prime. The circuit and inspired tensions and concentrations have reached 6.2% and the simulation is paused.
Parameter Selection Agent Sevoflurane DEL (%) 8 Circuit Semi-closed FGF (L/min) 4 VA (L/min) 0 CO (L/min) 5 View (min) 5 Speed 60x Special Bookmark 3’0”

153 | P a g e
Exercise 17-2: VCI Brings Expired to 2 MAC Immediately, VRG to 1.5 MAC Easily Vital Capacity Induction immediately brings expired tension to 2 MAC, then VRG to 1.5 MAC with ease
In this exercise, anesthetic delivery is continued until VRG = 1.5 MAC and the patient is ready for LMA insertion. Vital Capacity Induction immediately brings expired tension to 2 MAC and brain anesthetic depth deepens. Anesthesia depth requirements will differ among patients.
Continue the previous exercise by setting the Speed = 10x and, VA = 40 L/min, and placing a bookmark at 3’ 7”. This will let us simulate a six second (one-tenth minute) giant breath of 4 liters and the simulation will then pause. Next, click Run. When the simulation pauses, observe alveolar and arterial tensions are now 4.73% and VRG tension is zero.
Now set VA = 4 L/min to simulate the normal breathing that usually occurs after the single vital capacity breath. Observe VRG closely and click Run. Click Pause when VRG reaches 1%. This should happen at 4’ 7”. If you have difficulty pausing it there, rewind and set a bookmark at 4’ 7”. Then hold down the Shift Key and click Run several times to fast forward to 4’ 7” and note that VRG tension = 1.05%. Click Run again and pause and set a bookmark when VRG = 2.1%, which happens at 5’ 45”. Since the sequence of “observe, pause, set bookmark, run” is error-prone, we advise setting bookmarks to pause automatically at the correct times. Figure 17-2 lists the bookmarks.
Figure 17-2 shows the bookmarks to use in Exercise 17-2.

154 | P a g e
If you have not yet done so, run to and pause at the last bookmark (at 5’45”). Set a bookmark again when VRG = 3.2% at 7’ 48”. This value of 1.5 MAC in the vessel-rich group is chosen here because it is the level at which placement of the laryngeal-mask airway is reasonable. In this Gas Man exercise it is chosen as the exactly correct level. In clinical practice, this may not be the appropriate level.
In clinical practice, the anesthetist now places the laryngeal mask in the patient’s pharynx in a few seconds and achieves a patent airway with good respiratory flow. Once this depth is reached and the airway is secured, the patient is commonly anesthetized more deeply than she currently needs. Therefore in this exercise and in clinical practice, we seek to bring the patient’s anesthetic depth down to 1.0 MAC as shown by VRG falling to 1 MAC or 2.1%. We do this by administering a ‘negative bolus’ of volatile drug – removing agent from the patient by administering fresh gas flow with zero Delivered tension.
Exercise 17-3: Turning Vaporizer Off Delivers Negative Bolus Turn the vaporizer off to achieve a negative bolus
Turning the vaporizer off with high fresh gas flow lowers circuit and alveolar tensions and brings brain anesthetic level back down to 1 MAC. It serves the purpose of a negative bolus of anesthetic.
In this simulation and in the author’s clinical practice, vaporizer is set to zero, fresh gas flow is maintained at 4 L/min, and the patient breathes or is ventilated normally with VA = 4 L/min. A careful watch is maintained, carefully observing vital signs and inspired and expired agent concentration. Setting the Low ET Agent Alarm to 1.5% is highly recommended.
When the simulation time approaches the Gas Man Graph View of 10 minutes, change the Graph View to 30 minutes to allow the simulation to continue to run. Pause and set a bookmarks when 1 MAC is reached in CKT (circuit or inspired) and again when 1 MAC is reached in the ALV (alveolar or end-tidal) compartments. Pause and set a bookmark at 12’ 31”. At this time, CKT = 1%, ALV = 1.5%, and in clinical practice it is time to turn the agent back on to regain the 1.0 MAC level in the brain. The Low ET alarm at 1.5% should also sound.
Now that the desired depth is reached, fresh gas flow can be reduced to 2 L/min while DEL is set to 4%. At 17’ 03”, the anesthetic state has been returned to 1 MAC and the vaporizer can be reduced to DEL = 3%.
Recognize that the elapsed times recorded for pauses and bookmarks include the three minute circuit prime that preceded clinical care.

155 | P a g e
Observation Figure 17-3 shows the Picture and Graph for Exercise 17-3 at the point where we leave a setting of 3% Delivered partial pressure with FGF = 2 L/m, maintaining VRG = 1.0 MAC after a peak of 1.5 MAC.

156 | P a g e
Exercise 17-4: Achieving 2 MAC in the brain after Vital Capacity Induction VCI to prepare the patient for intubation without the need for other drugs
It is possible to achieve 2 MAC in the brain after Vital Capacity Induction; this prepares the patient for tracheal intubation without the need for other drugs. A brain level of 2.0 MAC is the approximate level to block the autonomic (BP and HR) response to intubation. A literature-based choice for this is 2.0 MAC in the brain. Gas Man will allow you to simulate achieving this level and then returning the patient’s level to 1.0 MAC in the brain.
Set up for this exercise using the information in the following table:
Pause / Bookmark at VRG MAC
.5 1 1.5 2.0
Which Achieves LOC MAC LMA ETT
Times (not including circuit
prime) 1’07” 2’45” 4”45” 7’44”
Table 17-1 shows the VRG levels, times (after prime) and clinical conditions.
Observation
Figure 17-4 shows the Picture and Graph for Exercise 17-4 at the point where we leave a setting of 3% Delivered partial pressure with FGF = 2 L/m, maintaining VRG = 1.0 MAC after a peak of 2.0 MAC.

157 | P a g e

158 | P a g e
Summary In this chapter we have seen that a single deep breath of high inspired sevoflurane concentration can initiate an anesthetic and allow conditions for LMA or tracheal tube placement in just a few minutes, even without the addition of other drugs. Deft use of the vaporizer and fresh gas flow also allows removal of drug rapidly when desired. This allows a prompt return to maintenance depth of anesthesia and can avoid excess-depth and avert hemodynamic side effects. We call this reduction a negative bolus of anesthetic.

159 | P a g e
Chapter 18 VIMA Theory VIMA is the acronym and abbreviation for Volatile Induction and Maintenance of Anesthesia. It rhymes with TIVA – Total Intravenous Anesthesia, and competes with it in our care. Both are extremes of practice, using one mode of administration exclusively, where most anesthesia care combines inhalation and intravenous routes. This chapter, however, addresses pure inhalation anesthesia.
VIMA embodies the idea that inhaled anesthetic drugs provide all of the components of general anesthesia. It further capitalizes on the fact that with inhaled drugs, anesthetic levels from the vaporizer, in the inhaled gas, in the exhaled gas, in the blood, and in the brain can be rapidly and precisely controlled. This is an excellent way of optimizing volatile agent delivery.
This chapter focuses on a single anesthetic technique, Sevoflurane Vital Capacity Induction and Maintenance of Anesthesia. The components of this technique are:
1. Priming the breathing circuit with 8% sevoflurane,
2. Giant breath by patient and return to normal breathing,
3. Rapid attainment of 1.0, 1.5, and 2.0 MAC in the brain,
4. Securement of the patient airway with laryngeal mask airway or tracheal tube,
5. Rapid reduction of brain anesthetic level to 1 MAC,
6. Maintenance of 1 MAC anesthesia until the end of surgery, in this case 45 minutes, and
7. Rapid removal of anesthetic from the patient’s body to quickly attain the awake state.
As you can see, we begin with the VCI technique. Repeat the last exercise in Chapter 17, the result of which is shown below.

160 | P a g e
Figure 18-1 shows the Picture and Graph for Exercise 17-3 at the point where we leave a maintenance setting of 3% Delivered partial pressure.
Exercise 18-1: Maintenance of 1 MAC anesthesia until the end of surgery Maintain anesthetic depth through surgery and rapid wake-up
Assume that the operation will take 45 minutes and set the time axis on the graph view to 45 minutes. Continue the simulation with unchanged FGF = 2 L/min and DEL = 3%. This will maintain 1 MAC in the VRG for the 45 minute duration. Once the simulation stops at the end of the graph, turn off the vaporizer, flush the circuit with oxygen (simulated by pressing the Flush button between the vaporizer and the circuit) and set the Fresh Gas Flow to 8 L/m. Set the time view on the graph to 1 Hour. Continue the simulation until VRG reaches 0.7% or 1/3 MAC, hit Pause, and set a bookmark. Brain at 0.33 MAC is the common level for patient emerging from anesthesia and allowing removal of the airway device. Hit Run to allow the graph to fill once again.

161 | P a g e
Observation
Figure 18-2 shows the Picture and Graph for Exercise 18-1 after rapid wake-up.
With very low partial pressure in the circuit, the patient emerges quickly and exhaled anesthetic is carried away in the high Fresh Gas Flow rather than re-breathed.
Observe that the time shown for this point in the trace is just over 51 minutes, less that 7 minutes after the operation completed.
Summary
This is VIMA – Volatile Induction and Maintenance, followed by rapid wake-up. With this technique, it is possible to rapidly affect and precisely control anesthetic levels from the vaporizer, in the inhaled gas, in the exhaled gas, in the blood, and in the brain to achieve and maintain optimum anesthetic depth. VIMA is a way of optimizing volatile agent delivery.

162 | P a g e
Chapter 19 Don't Turn FGF and DEL Down as soon as End-Tidal Anesthetic Concentration Reaches the Desired Brain Anesthetic Level Theory In Chapter 9 we saw that low fresh gas flow is acceptable during some periods of anesthesia care. In Chapter 15 we saw that when rapid changes in anesthetic level in the brain are desired, high fresh gas flow is necessary.
It is a common misconception to think that when end-tidal anesthetic concentration reaches the desired brain anesthetic level, say 1 MAC, fresh gas flow and vaporizer setting can be lowered. This fails to account for the fact that that when end-tidal or alveolar anesthetic tension attains 1 MAC, the VRG tissues are three minutes from reaching that value. Thus, reducing FGF and DEL when end-tidal concentration just reaches 1 MAC prevents alveolar from sustaining the 1 MAC level, which leads to reduction of end-tidal concentration and the consequence that the brain never reaches 1 MAC.
In this chapter we will look at the process of anesthetization with FGF = 6 L/min with reduction of FGF and DEL when ET = 1 MAC. We will compare this with a similar induction that does not reduce FGF and DEL until a later time.
Exercise 19-1: Turning FGF and DEL Down Too Early Turning FGF and DEL down too early results in light anesthesia
To see the effect of turning the fresh gas flow and delivered concentration down too early, we begin with FGF = 6 L/min and DEL = 6%. When we observe that ALV = 1 MAC (2.1%) we will turn the flow and vaporizer setting down to 2 L/min and 3%. These are common settings during the course of anesthesia. But, because we have decreased anesthesia delivery at a time when the VRG is still absorbing anesthesia because its level is far below 1 MAC, the venous level of anesthesia is still low and alveolar level therefore falls. VRG then no longer approaches the 1 MAC value which was its original target. Instead, it approaches a target which is falling as time goes on. At the end of 15 minutes, VRG has still not reached 1 MAC.

163 | P a g e
SETUP
When ALV reaches 1 MAC at 2 minutes, pause the simulation and set a bookmark. Set FGF = 2 L/min and set DEL = 3%. Then run the simulation to fill out the remainder of the 15 minute view.
Observation
Figure 19-1 shows the Picture and Graph of the results of Exercise 19-1. FGF = 6 L/min and DEL = 6% were reduced to FGF = 2 L/min and DEL = 3% when VRG reached 2.1% or 1 MAC.
Parameter Selection Agent Sevoflurane DEL (%) 6 Circuit Semi-closed FGF (L/min) 6 VA (L/min) 0 CO (L/min) 5 View (min) 15 Speed 60x Special none

164 | P a g e
Exercise 19-2: Maintaining FGF and DEL after ALV Reaches 1 MAC Maintaining FGF and DEL after ALV reaches 1 MAC results in 1 MAC anesthesia
Now simulate maintaining FGF and DEL by waiting 1.5 minutes after ALV reaches 1 MAC to turn down FGF and DEL.
Begin as in Exercise 19-1 but continue the initial setting for 1.5 minutes after ALV = 1 MAC. That time is 3’ 30”. At 3’ 30” reduce FGF and DEL to the same settings as in Exercise 19.2, FGF = 2 L/min and DEL = 3%. Pause the simulation and set a bookmark when VRG reaches 1 MAC, at 4’ 53”. Run the simulation to the end of the 15 minute view the fast way, by holding Shift while clicking Run.
Figure 19-2 shows how things should look at completion.
Figure 19-2 shows the Picture and Graph of the results of Exercise 19-2. FGF = 6 L/min and DEL = 6% were reduced to FGF = 2 L/min and DEL = 3% 1.5 minutes after VRG reached 2.1% or 1 MAC.
With the two simulations filling the view of 15 minutes, save them each, naming them to designate that in one induction was continued until ALV = 1 MAC and the other induction was maintained longer. With both simulations open in a single Gas Man session and both showing the first 15 minutes in the Graph view, compare them with Overlay, showing VRG over MAC.

165 | P a g e
Observation
Figure 19-3 Graphic Overlay showing that anesthesia induction is better when FGF and DEL are not reduced the moment ALV = 1 MAC.
Summary Anesthesia Induction is better when FGF and DEL are not reduced the moment ALV = 1 MAC. If FGF and DEL are reduced when VRG = 1 MAC, anesthetic level in venous blood is not high enough to sustain the current level in alveolar gas and anesthetic levels fall. However, if FGF and DEL are reduced after VRG has attained its desire level, anesthesia is maintained at a steady level.

166 | P a g e
Appendix A Evolution of the Understanding, Modeling & Simulation of Anesthesia Uptake & Distribution
The simulation of anesthesia uptake and distribution has been developed over the last sixty years, and has paralleled the development of our understanding of the subject as well as the capabilities of computer hardware and software. This section describes this development and annotates the bibliography included in this book.
In 195019 and 195120, Kety presented a physical and mathematical representation of the dynamics of anesthetic tension equilibration in the body. He suggested that the body be modeled as several compartments, whose anesthetic partial pressures tended toward equality. The effects of volumes, anesthetic solubilities, and flows between compartments were clearly explained. In 1963, Eger9, MacKrell25, and Mapleson21, each wrote descriptive computer simulations of anesthetic uptake and distribution at constant inspired concentration, using large computers. In 1963, Eger and Guadagni14 developed a model for anesthesia administration at constant alveolar concentration. In the same year, Eger described the concentration effect10. In 1964, Epstein, et al.16 described the second gas effect. In 1965, Eger, Saidman, and Brandstater15 established minimum alveolar concentration (MAC) as the standard of anesthetic potency.
Numerous investigators have added further sophistication to computer simulations by considering various physiologic effects. In 1967, Munson and Bowers28 simulated the effect of hyperventilation on the rate of cerebral anesthetic equilibration. In 1968, Munson, Eger, and Bowers29 simulated the effects of changes in cardiac output and distribution on the rate of cerebral anesthetic equilibration. In 1970, Ashman, Blesser and Epstein1 used a nonlinear model for halothane uptake in humans. Zwart, Smith, and Beneken44 used a multiple model approach to study the interaction of circulation effects and anesthetic uptake in 1972. In 1973, Munson, Eger and Bowers30 studied and simulated the effects of anesthesia-depressed ventilation and cardiac output on anesthetic uptake. In that same year, Mapleson27 integrated circulation time into his digital computer simulation. In 2001, Leroux developed and tested another model.49
Closed-circuit simulations have been performed and numeric closed-form solutions to the mathematical approximations of closed circuit have been devised.47, 48 Non-linear models con-tinue to be used. The ability to maintain anesthesia depth with automated anesthetic vaporizer control has been demonstrated.

167 | P a g e
Appendix B The Gas Man Approach
In 1973, Cowles, Borgstedt and Gillies7 reassessed the evolution of computer simulations in anesthesia and simplified the model to four patient compartments. The mathematics of the Gas Man program follows an approach similar to that of Cowles, et al. The Gas Man program was specifically written as an educational tool to teach the fundamentals of anesthesia uptake and distribution35. Unlike most other simulation programs, a large computer is not required. It stresses partial pressure difference as the driving force for equilibration. It has an advantage over physical hydraulic models, since it is easily transported in the form of a computer disk or file transfer. It is more versatile since it graphs results and has special educational features (optional removal of anesthetic from venous blood, optional concentration effect, optional vaporization effect, and ability to overlay graphs of relationships to uncover subtle aspects of kinetics).
In Gas Man, the patient is modeled as four compartments: the lung, vessel-rich group, muscle, and fat; the breathing circuit is a fifth. The simulation uses Euler's method of solution for the simultaneous differential equations37, 38, with linear coefficients that govern the five-compartment system. For each compartment, the change in anesthetic tension is proportional to the difference between entering and exiting anesthetic quantity, and inversely proportional to compartment capacity; that is, mass is conserved. The volume of the functional residual capacity of the lung is held constant by increasing inspired or expired alveolar ventilation. This is the source of the concentration effect and this drives the second gas effect.
In Gas Man Version 2, if anesthetic tension in any compartment were to change more than 20% during a single time slice at which tensions are computed, the interval time was split in half, allowing the simulation's graphs to be smooth. In Gas Man Version 3 we introduced a better method to assure stability, Exponential Integration (Philip JH, Franklin HM, Ji XB. Gas Man 3 Uses Exponential Integration to Overcome Oscillation Caused by Stiff Integration. ASA 99. Dallas TX. Anesthesiology V91:A590, 1999. Abstract). In Gas Man Version 4 we take further advantage of the advanced graphical user interfaces of Windows™ and Macintosh™ operating systems and XML technologies for data transfer.
The uptake and distribution of inhalation anesthetics depends upon numerous parameters and variables. The model embodied in the Gas Man program utilizes standard values for organ volumes, anesthetic solubilities, and regional blood flows, as shown in Table A-1. In actuality, the value of each of these parameters is at best an estimate for any patient, but they are representative enough for teaching and exploring anesthesia concepts.

168 | P a g e
Model Parameters
Volume Flow Rel. Flow
N20 Iso Enf Hal Des Sevo N2
MAC 110 1.1 1.7 0.8 6.0 2.1 200.0 Circuit 8.0 Alveoli 2.5 Blood 5.00 0.47 1.30 1.90 2.47 0.42 0.65 0.014 VRG 6.0 3.80 0.76 0.42 2.10 2.80 4.80 0.54 1.10 0.010 Muscle 33.0 0.90 0.18 0.54 4.50 4.60 9.90 0.97 2.40 0.014 Fat 14.5 0.30 0.06 1.08 70.00 63.00 150.00 13.00 34.00 0.070
Tissue/Gas partition coefficients
N20 Iso Enf Hal Des Sevo N2 Blood/Gas 0.47 1.30 1.90 2.47 0.42 0.65 0.014 Brain/Blood 0.89 1.11 1.47 1.94 1.29 1.69 0.714 Muscle/Blood 1.15 2.37 2.42 4.01 2.31 3.69 1.000 Fat/Blood 2.30 36.84 33.16 60.73 30.95 53.21 5.000
Tissue/Gas partition coefficients (calculated)
Notes:
Values for volume, flow and relative flow are taken from Lowe and Ernst, 198123. Values for nitrous oxide and enflurane are taken from Eger, 198112.
Values for isoflurane, halothane, desflurane and sevoflurane are taken from Yasuda, Targ and Eger45.
Values for nitrogen are taken from Weathersby and Homer, 198044. Values for sevoflurane are taken from the package insert and Abbott data.

169 | P a g e
Further Considerations on the Use of Gas Man®
Advanced features of anesthesia uptake and distribution have been through the years. Since version 2.0, Gas Man has had the ability to change tissue volumes and their relative flows and allow the user to simulate several interesting clinical phenomena, such as: cachexia and its effect on tissue volumes; the altered perfusion which accompanies hyperventilation and excitement; and the depressed cardiac output and alveolar ventilation secondary to deep anesthesia.
Gas Man is necessarily a limited simulation model - limited by computer resources, by the natural variations in clinical settings, and by the need to preserve Gas Man's educational simplicity. Gas Man does not include the effects of shunts and dead space, intertissue diffusion, incomplete tissue mixing, drug metabolism, or nonpulmonary drug excretion.
Organ Volumes
In certain chronic conditions, tissue volumes can deviate markedly from those in the standard default Gas Man model. Obesity, cachexia, and muscularity obviously affect compartment volumes. Similarly, tissue and blood solubility variations are possible. These can be simulated in Gas Man.
Organ Blood Flows
Blood flow to organs is known to change in certain clinical situations. Specifically, hyperventilation causes cerebral vasoconstriction and hence slowed anesthetic transfer from blood to brain. Excitement (stage II anesthesia) increases muscle blood flow and changes the time course of induction as well.
During deep anesthesia, cardiac output decreases with most agents. Anesthetic depth also changes alveolar ventilation during spontaneous breathing. Some of these effects have been programmed to occur automatically in other simulation programs. Gas Man allows the user to independently adjust cardiac output, relative blood flows and alveolar ventilation to observe these effects.
Breathing Circuit
The semi-closed circuit simulated in the Gas Man program assumes perfect gas mixing and instant vaporization of injected anesthetic liquid. In a real breathing circuit, because the fresh gas flow enters near the inspiratory valve, gases administered to the patient are typically incompletely mixed and contain a preponderance of fresh gas early in each breath. Completely unmixed gas in the breathing circuit has been simulated in Gas Man as the Ideal circuit. Clinical circuits act as if they fall between the ideal and semi-closed circuits that are simulated with Gas Man. Adding a mixing device makes a real breathing circuit function more like the ideal circuit modeled. When anesthetizing large animals, a larger breathing circuit and reservoir bag are often used. This can be simulated in Gas Man by changing the default circuit volume on the Simulation tab of the Default Options dialog, under the Tools / Options… menu.

170 | P a g e
Shunts and Dead Space
Within the lungs, intrapulmonary shunts may allow the delivery of venous blood to the arterial system without equilibrating with alveolar gas. These shunts slow anesthesia induction with blood-insoluble agents. Dead space affects anesthetic induction, decreasing effective ventilation to the alveolar space. In the Gas Man model, dead space has been taken into account by allowing selection of alveolar ventilation rather than total lung minute ventilation.
Inter-tissue Diffusion
Inter-tissue diffusion may occur between fat and muscle; this effect has been ignored in the Gas Man model. Instead, it is assumed that complete mixing occurs in each organ, and that anesthetic tension everywhere within each organ is equal to anesthetic tension in the outflowing venous blood whose volume is a part of the organ volume. Although this is not exactly true clinically, it is a close approximation. Further, the quantity of anesthetic taken up by the arterial blood volume has not been included in Gas Man's calculation of uptake. Circulation times between sequential compartments are all 0.1 minutes.
Summary
The Gas Man theory and program are a natural outgrowth of the work done in the last fifty years on the computer simulation of anesthesia uptake and distribution. It builds on the foundation of earlier models and has important advantages, but also has its limitations. Gas Man does not account for all the phenomena known to affect anesthesia uptake and distribution. Many physiologic subtleties have been ignored to preserve the simple educational value of the program. This program should never be used to govern patient care; instead, it is a powerful tool for educational simulation.

171 | P a g e
Appendix C Gas Man System Defaults
The following is a listing of the data in the file GASMAN.INI, found in the Gas Man directory, as it is configured on the Gas Man package when you first receive it. Use this listing for reference, and for restoring any defaults you may change using the Set Defaults command or directly in the INI file itself. The data for the first agent is annotated.
[Agents] Desflurane, Ether, Enflurane, Halothane, Isoflurane, Sevoflurane, Nitrogen, Nitrous Oxide, Xenon
[Desflurane] Lambda=0.42 Blood/Gas Partition Coefficient VRG=0.54 VRG/Gas Partition Coefficient MUS=0.97 MUS/Gas Partition Coefficient FAT=13 FAT/Gas Partition Coefficient Max=50 Maximum value for vaporizer top High=18 High end of vaporizer scale Default=9 Default vaporizer setting DefUnitDose=1 Unit dose of liquid injected Volatility=209 Vapor/Liquid volume ratio (20'C) MAC=6.0 MAC value BottleCost=115.13 Bottle cost in $US BottleSize=240 Bottle volume in mL
[Ether] [Enflurane] [Halothane] [Isoflurane] Lambda=12 Lambda=1.9 Lambda=2.47 Lambda=1.3 VRG=12 VRG=2.8 VRG=4.8 VRG=2.1 MUS=10 MUS=4.6 MUS=9.9 MUS=4.5 FAT=50 FAT=63 FAT=150 FAT=70 Max=90 Max=33 Max=25 Max=25 High=50 High=5 High=5 High=5 Default=30 Default=3.4 Default=3.3 Default=2.9 DefUnitDose=1 DefUnitDose=0.5 DefUnitDose=0.5 DefUnitDose=0.5 Volatility=230 Volatility=198 Volatility=240 Volatility=196 MAC=6.0 MAC=1.7 MAC=0.8 MAC=1.1 BottleCost=5 BottleCost=122 BottleCost=15 BottleCost=20.47 BottleSize=240 BottleSize=240 BottleSize=240 BottleSize=100

172 | P a g e
[Sevoflurane] [Nitrogen] [Nitrous Oxide] [Xenon] Lambda=0.65 Lambda=0.014 Lambda=0.47 Lambda=0.13 VRG=1.1 VRG=0.010 VRG=0.42 VRG=0.169 MUS=2.4 MUS=0.014 MUS=0.54 MUS=0.26 FAT=34 FAT=0.070 FAT=1.08 FAT=1.3 Max=33 Max=1600 Max=150 Max=150 High=8 High=400 High=100 High=100 Default=3.7 Ambient=80 Default=70 Default=75 DefUnitDose=0.5 DefUnitDose=1.0 DefUnitDose=0.5 Volatility=183 Volatility=287 Volatility=200 MAC=2.1 MAC=200 MAC=110 MAC=70 BottleCost=240.34 BottleCost=0.57 BottleCost=240 BottleSize=250 BottleSize=1000 BottleSize=100
[Ratio] ; of flows [Volumes] [Defaults] VRG=76 CKT=8.0 VA=4 MUS=18 ALV=2.5 CO=5 FAT=6 VRG=6.0 Speed=60 MUS=33.0 Agent=Isoflurane FAT=14.5 Circuit=Semi-closed VEN=1.0 scroll=0 linewidth=2 linelabels=2 Scrollpercent=67 Graphminutes=15 OverlayShow=ALV OverlayOver=Del

173 | P a g e
Appendix D Gas Man Versions & Functions
Gas Man for Apple II (1984) One agent at a time One simulation at a time Black and white
Gas Man 1.0 for Macintosh Macintosh Same as Version 1.0 for Apple II Black and white
Gas Man 2.0 for Windows 3.11 Windows platform Color Multiple agents simultaneously Save simulations Replay simulations
Gas Man Version 2.0.3 for Windows 3.11, 8/20/95 Corrects a sporadic installation problem seen previously. Installs GASMAN.INI in the GASMAN directory not WINDOWS directory.
Gas Man® Version 2.1 for Windows 3.11, 8/21/95
1 Toolbar Additions
1 Go/Stop Toggle Button.
2 Show Cost / Show Volume Toggle Button
default in INI file
3 Set Bookmark with convenient interface
4 Rewind and FF Buttons
Rewind provides a quicker way to repeat the simulation.
FF provides a fast forward show wake conveniently.

174 | P a g e
5 Run All Button runs all open simulations.
6 Overlay Button
Agents, simulation conditions, patients, compartments,
ratios, cost
2 Save Active Window with the simulation
All of the view parameters in the Picture & Graph can be saved with the simulation, such as Show Cost, the simulation run speed, the time view, etc.
3 Printer Revision - full support for the HP Deskjet 500.
4 New Install resolves earlier problems
5 Splash screen with registration
6 Vaporization Effect mathematics added through Special Menu
Increasing DEL increases effective FGF.
Feff = FGF (1+Del) and DELIVERED Flow = DEL x Feff
Cost = DELIVERED Flow x Cost/mL vapor
7 Paste data into EXCEL by time slice
Mac Copy & Paste achieved with Ctrl C Ctrl V, toolbar, Edit Copy Data, F3 Win Copy & Paste achieved with Cmd C Cmd V, toolbar, Edit Copy Data
Gas Man® Version 3 10/21/97
Exponential Integration allows extremely high values of CO and VA
Versions available for
Win 95 and Windows NT PowerMac Mac68xx
Weight adjustment from 50 g to 500 Kg
Tissue volume and relative tissue flow adjustment
OLE aware to facilitate external programming and external use
Info available at www.gasmanweb.com
Gas Man 3.1.8 10/23/03

175 | P a g e
Unicode (Win 2000-XP)
All Platforms from single CD
Windows version imports and exports Macintosh .ini files
Hold down the shift key and click FILE/OPEN, FILE/SAVE, or FILE/SAVE AS
Gas Man 3.1.9 12/11/04
Gas Man for Macintosh unchanged; Still installs from same CD as Win OS versions
Runs in OS 9 Classic Window. Copies and pastes to EXCEL
Windows Enhancements
Win 2000, XP, ME now work perfectly
Copy and Paste into EXCEL and elsewhere (which broke with Win XP) is now fixed
Edit Patient no longer requires TAB key to function correctly
Ctrl+W closes a simulation
Drug Prices are corrected to 11/2004 values from Redbook WAC for Iso, Sevo, Des
Nitrogen Max is increased to 16 Atm = 570 ft
This is in honor of Tanya Streeter’s world record free dive to 525 feet = 14.8 Atm
Gas Man 4.0 2008
Cross-platform code for Windows all versions, Vista, Mac OS X
Macintosh OS 9 Classic no longer required
Tabbed dialog box for all parameters
Displays Panels for Control, Picture, Graph
Gas Man 4.1 2010
Improved stability, reliability, and interoperability on and between all platforms.
Internationalization
Multi-lingual help system
Updated User Manual and Workbook / Laboratory Guide.
XML support

176 | P a g e
Appendix E Advanced Features of Gas Man
Many features have been added to Gas Man since the 1989 release of Version 1.0 for Macintosh. Most are not specific to Gas Man; rather, they implement or adapt features of the Windows and Macintosh graphical user interfaces in ways that benefit the Gas Man model. Some, such as the introduction of exponential integration to its simulation engine, greatly extend the range of Gas Man’s applicability without affecting the user interface. Still others add controls and inputs that support exploration of more diverse clinical situations, or add displays, reports, and other outputs that promote insight. Throughout its development history, features have been added to Gas Man with the consistent goal of providing a broader and deeper set of analytical tools that make the Gas Man model ever more useful to students, teachers, and practicing anesthesiologists.
Most of the features described in this appendix were introduced earlier in the manual. For instance, using multiple windows and setting bookmarks are explained in Chapter 2. The Flush function and the Ideal circuit are demonstrated in Chapter 9. The use of multiple agents is introduced in Chapter 11. Patient Weight is the subject of Chapter 13 and analyzing Cost is covered in Chapter 14.
In this appendix, we examine in detail several advanced features of Gas Man and provide insight into the motivation behind Gas Man’s design. With a deeper understanding and appreciation of its features comes a greater ability to fully exploit the power of Gas Man.
Advanced Inputs and Parameters
Custom and Customized Anesthetics
After a fresh installation and activation with a full user license, Gas Man can simulate the use of the anesthetics desflurane, ether, enflurane, halothane, isoflurane, sevoflurane, nitrogen, nitrous oxide, and xenon. The reason that Gas Man presents those particular anesthetics, however, is not a limitation of the program; it is because Gas Man reads that list of agents, their parameters and properties from a configuration file. New agents, other existing agents, or even user-invented agents can be added to the Gas Man program simply by modifying the configuration file.
Caution: Modifying the list of agents available in Gas Man involves editing the system file ‘GasMan.ini’. Do not attempt this operation if you are not confident in your ability to modify the file system and your facility with the text editor. You should create a back-up of the unaltered GasMan.ini file and retain it until you are certain you do not need it to recover from an error. Editing GasMan.ini incorrectly can result in Gas Man’s malfunction, or a failure of Gas Man to run at all.
Note: Editing Gas Man.ini will affect the entire installation, not just a single simulation, session or user.

177 | P a g e
To add an anesthetic, follow this procedure:
1. Locate the GasMan.ini file in either the Gas Man install directory on Windows, or the application bundle on your Macintosh. For example, the path to this file on Windows might be ‘C:\Program Files\MedMan\GasMan-4.1\GasMan.ini’.
2. Make a backup copy of the file.
3. Open GasMan.ini with a text editor (For example, on a Windows system, using Notepad).
4. Study the file carefully, using Appendix C for reference. You will need to do two things: Add your agent to the list of agents, and add a section for your agent. Avoid changing anything else in the file.
5. To add your agent to the list, append the unique name of your agent to the comma-separated list under heading ‘[Agents]’ – for example, to add “unithane”, alter the list so that it ends with “…, Nitrous Oxide, Xenon, Unithane”.
6. Add a section entitled ‘[Unithane]’ that contains the parameters specified in Appendix C to the end of the GasMan.ini file. Supposing unithane were soluble everywhere with solubility = 1 and vapor/volume ratio = 200, you might add the following section:
[Unithane] Lambda=1.0 ;Blood/Gas Partition Coefficient VRG=1.0 ;VRG/Gas Partition Coefficient MUS=1.0 ;MUS/Gas Partition Coefficient FAT=1.0 ;FAT/Gas Partition Coefficient Max=10 ;Maximum value for vaporizer top High=2 ;High end of vaporizer scale Default=1 ;Default vaporizer setting DefUnitDose=1 ;Unit dose of liquid injected Volatility=200 ;Vapor/Liquid volume ratio (20'C) MAC=6.0 ;MAC value BottleCost=1 ;Bottle cost in $US BottleSize=100 ;Bottle volume in mL Color=green ;Draw as a green line in overlay
Later, you can change the default bottle cost, bottle size, and trace/tab color of any anesthetic without manually editing GasMan.ini (see Agent Defaults below).

178 | P a g e
Program, View, Simulation, Anesthetic, Color and Patient Defaults
Defaults, or pre-sets, are simulation parameter settings that appear before any selection is made. Generally, defaults are saved in the GasMan.ini file described in the previous section. Defaults ease simulation setup in the most common scenarios, reducing repetitive, explicit input. If you find that you have to adjust a setting almost every time you run a simulation, or if you plan to run a series of simulations from a particular starting-point, you might want to specify a more convenient set of defaults in Gas Man.
There are several classes of default, listed below. Unless specified to the contrary, each class of default corresponds to a tab in the Default Options tabbed dialog box, which can be invoked via the Options… command under the Tools menu.
Program Defaults
These pre-sets control how Gas Man looks or performs in general (not in the context of a particular anesthetic, patient, view, etc.). Figure E-1 shows the Default Options dialog with the Program tab selected.
Program default options include:
• The Audible Minute Signal setting controls the audible feedback Gas Man provides as each minute of simulation is completed. Radio buttons allow the user to select Off (no sound), a generic Beep, or one of four custom sound (*.wav) files. The custom sounds are specified in the dialog invoked by pressing the Custom… button. The audible signal is suppressed at speeds above 10x, regardless of this setting.
Figure E-1: Default Options dialog showing Program defaults

179 | P a g e
• Radio buttons in the Graph Line Labels section disable (Off), enable (On), or allow Gas Man to choose (Auto) when to label graph traces with periodic letters or numbers to further identify the trace.
• Radio buttons in the Graph Line Thickness section control the width of the trace lines in Gas Man graphs.
• If scrolling is enabled (via the Enable Scrolling toggle in the Special menu), the graph paper in the Graph Panel scrolls continuously to the left, and graph traces are extended on the right as the simulation progresses. If scrolling is disabled, Gas Man will pause when the tension traces fill (hit the right-hand side of) the graph, and wait for you to continue the simulation. Then, when you continue after a pause, the graph jumps (scrolls) to the left, and the traces are extended until, once again, they fill the graph. The Graph Jump Percent slider controls the maximum distance a graph jumps to the left when you continue – from 25 to 100 percent of the view length. For example, if your view is 15 minutes, a setting of 67 percent would scroll left 10 minutes each time you continue (or less, at the maximum simulation duration of 20 hours).
• The Use Graph Paper checkbox controls the background color of the scrolling (the graph paper) on the Graph Panel.
View Defaults
These pre-sets control how Gas Man initializes Picture and Graph Panels by default. Figure E-2 shows the Default Options dialog with the View tab selected.
Figure E-2: Default Options dialog showing View defaults

180 | P a g e
View default options include:
• Scale refers to both the Y-axis size of the graphs and the range (top) of gauges that display a particular measurement in Gas Man. For example, the scale used for FGF is commonly set to 10 liters per minute. The controls in this group set the default scale for FGF, VA, and CO.
• The View setting sets the default time-axis size shared by the graphs shown in the Gas Man Graph panel. That is, this control selects the default number of minutes represented by the visible graph paper of a newly-created Graph Panel.
• The Show Cost checkbox determines whether, by default, the Picture Panel shows uptake and delivered anesthetic quantities in currency (checked) or liters (unchecked).
• The Enable Scrolling checkbox determines whether, by default, simulations pause when the trace lines in the Graph Panel fill the graph (unchecked) or the graph paper scrolls continuously (checked).
Simulation Defaults
These pre-sets control how Gas Man initializes simulations by default. Figure E-3 shows the Default Options dialog with the Simulation tab selected.
Figure E-3: Default Options dialog showing Simulation defaults

181 | P a g e
Simulation default options include:
• The FGF control sets the flow rate (in liters per minute) to which Gas Man resets whenever a semi-closed circuit is chosen.
• The Circuit Volume control sets the breathing circuit volume in liters. This selection is both a default and a setting; it cannot be modified anywhere else in Gas Man, and it cannot be switched during a simulation.
• The Speed drop-down sets the initial speed for new simulations.
• The Circuit drop-down selects the initial circuit configuration for new simulations.
• The Agent drop-down selects the default agent selected in new simulations.
Agent Defaults
These pre-sets control how Gas Man initializes the default bottle cost, bottle size, and color for each anesthetic agent. Cost and size are parameters to the analysis of cost of anesthesia as described in Chapter 14. Color applies to the font in the tabs of Gas Man Control, Picture and Graph Panels for the agent, and it determines the trace color used when the agent appears in an overlay graph. The default colors also apply whenever the Default Colors command is invoked from the Anesthesia menu (see explanation below). Figure E-4 shows the Default Options dialog with the Agent tab selected.
You can change the default values of size, cost, and color by double-clicking on the value you wish to modify (for example, the word ‘blue’ beside Desflurane in the figure above) to change it to an editable control, and then selecting a new value. Though you can effect these changes from
Figure E-4: Default Options dialog showing Agent defaults

182 | P a g e
within the Gas Man program, they are preserved in the GasMan.ini file. Thus, programmatic changes to anesthetic defaults are functionally equivalent to editing GasMan.ini, and they affect the entire installation, not just a single simulation, session, or user.
The Default Colors command bears some explanation: It is possible to assign arbitrary colors for the agents in any given simulation, for example, when using the Overlay feature, to distinguish between clinical techniques employing the same agent. It is also possible that opening a saved simulation could code agents with unexpected colors, say, if that simulation were sent from another installation. In some cases – especially, when combining multiple simulations with non-standard color codes – the resulting color scheme may be unhelpful or even confusing. The Default Colors command enables you to restore a simulation to the standard color scheme for your site.
Patient Defaults
These pre-sets control how Gas Man initializes patient parameters by default. Figure E-5 shows the Default Options dialog with the Patient tab selected.
Figure E-5: Default Options dialog showing Patient defaults

183 | P a g e
Patient default options include:
• The Weight selection sets the default patient weight. You can specify the weight in either Kilograms or Pounds by selecting the appropriate radio button.
• Cardio-pulmonary rate defaults are set in liters per minute of flow for alveolar ventilation (VA) and cardiac output (CO). Note that changing the patient weight causes cardio-pulmonary rates to scale allometrically, both here (the defaults) and in individual simulations (see Chapter 13 Patient Size). To set cardio-pulmonary rates independently of weight, select weight first.
• The volumes of the various compartments of the Gas Man model are given in liters in the Volumes section. Volumes scale linearly with weight – that is, changing patient weight by some percentage changes these volumes by the same percentage. To set volume defaults independently of weight, select weight first.
• The Flow Percentages control group sets the percentage of blood flowing to each tissue type (each type is considered a separate compartment in the Gas Man Model).
Bookmarks
The Gas Man Bookmark is a metaphor for the way a real bookmark might mark a particular point in a story where one could pause or resume reading. A Gas Man bookmark marks a particular point in time in the evolution of a simulation where one wishes to pause, or a point to which to return (pause during replay). As with its namesake, a Gas Man bookmark is retained in a simulation when it is metaphorically put down (saved) or picked up again (opened).
Bookmarks provide a reliable and precise means to suspend a simulation, regardless of the simulation speed. They are most helpful where issues of comparability arise – for example, to compare outcomes given alternative settings at a particular point in the course of anesthesia, or to compare (perhaps overlay) tension traces over a single induction interval for different anesthetics. Bookmarks allow you to take action or review conditions at a precise point in time.
Bookmark operations are explained in Chapter 2, in the section Using Bookmarks.
Advanced Program Operations
Saving, Opening, and Sharing Simulations
Few are unfamiliar with the concept of creating, editing, saving and re-opening textual documents on a computer, and we barely think about sharing such documents via email, the web, or on disk. The notion also works well for Gas Man, where a record of an experiment (a.k.a. a simulation) can be created, modified, saved, re-opened, and sent over a network in the form of a .GAS file.
We expect documents, for example emails, to travel from endpoint to endpoint without modification, but we all realize, perhaps vaguely, that an email is encoded electronically in various ways during its journey and decoded at its destination for review. We also know that the process is imperfect. When text document encoding and decoding are not precise, formatting is

184 | P a g e
lost, colors change, graphics don’t reappear, and in some cases, characters are modified (especially when documents originate in foreign countries) or replaced with a placeholder that signifies an interpretation error has occurred (often, a question-mark).
Gas Man avoids the problem of encoding modification by encoding experiments in a platform-independent way. On Windows, Mac, or UNIX – on any operating system or version – Gas Man records an experiment to a .GAS file such that Gas Man on any other platform can read it.
But while Gas Man does not suffer difficulties having to do with encoding, it shares the problem text documents have with presentation. An experiment may involve the arrangement of several windows, each with several choices of color and placement, and comparison between tensions at various intervals over the course of an anesthetic. How much of that is, can be, or should be preserved in a .GAS file? There is no universal answer to this question. However, success in transmitting your findings depends on how well you understand the nuances of what is and what is not retained in the .GAS file record and how Gas Man responds as it reads back a .GAS file.
The essential content of a .GAS document comprises a set of conditions and a timeline of selections made and actions taken by the anesthesiologist. The conditions include the set of available anesthetics and their properties (costs, solubilities, etc.), the patient parameters, and the circuit parameters. The actions taken include the selection of agents, adjustments to the vaporizer and other settings, changes to the circuit type, and so on. Both the conditions and actions may be explicit (a manual adjustment to the vaporizer, for example) or implicit (driven by default, as patient parameters often are).
When Gas Man reopens a saved simulation, it creates a single window with a Control Panel and one Picture and one Graph for each anesthetic. As it does, it restores all settings recorded in the .GAS document and supplies defaults for the rest from its local configuration (usually, the .INI file). The following tables list the parameters and properties of a Gas Man simulation by type, indicating which items are persisted into the .GAS document.
Program parameters
Generally, program parameters are not persisted to .GAS documents. Parameter Saved in .GAS document
Page setup No Print select No Audible signal No Graph Line labels No Graph Line thickness No Graph jump percent No Graph paper No
Table E-1: Program Parameters in .GAS files

185 | P a g e
Patient Parameters
Most patient parameters are persisted to .GAS documents. Parameter Saved in .GAS document
Weight Yes Kilograms/Pounds No Compartment Volumes Yes Flow percentages Yes Cardio-pulmonary rates Defaults, No; Setting changes, Yes
Table E-2: Patient Parameters in .GAS files
Anesthetic Properties
Most anesthetic properties are persisted to .GAS documents. Note that Gas Man attempts to record sufficient information in a .GAS document to avoid having the results of saved experiments depend on local cost changes, packaging updates, etc. Also note that it is important to distinguish between the properties of anesthetic agents, described here, and simulation parameters pertaining to the choice and quantity of anesthetics administered, described in the next section (Simulation Parameters).
Property Saved in .GAS document
Standard (.INI) name Yes Local (native language) name Yes Max vaporizer setting Yes Default vaporizer setting Yes Ambient tension Yes Solubility (blood & compartments) Yes MAC Yes Unit (injection) dose Yes Bottle cost Yes Bottle size Yes Volatility Yes Display color Yes Default color No
Table E-3: Anesthetic properties in .GAS files

186 | P a g e
Simulation Parameters and Adjustments
As noted above, the timeline of actions taken and adjustments made by the anesthesiologist – the vaporizer and fresh gas settings, changes to cardio-pulmonary rates, circuit configurations, liquid injections, flushes, etc., and the time each occurs – comprises the essential content of a .GAS file. Miscellaneous additional properties are listed in table E-4.
Parameter Saved in .GAS document
Description Yes Duration Yes Special option selections Yes Bookmarks Yes Anesthetic order Yes
Table E-4: Simulation parameters in .GAS files
View Settings
The view settings that are persisted to .GAS files are listed in table E-5. Setting Saved in .GAS document
Window placement and size No Panel arrangement No Scaling (gauge and graph) Yes Numeric visibility No Scrolling On/Off No Speed (Last chosen only) Yes Graph Panel Duration Yes Show Cost Yes
Table E-5: View settings in .GAS files
Replaying Simulations
In the simple case, simulation replay is modeled after the typical voice or video recording device. You can start, stop, rewind, replay, and fast-forward. The model is hardly complicated by bookmarks – play and fast-forward are interrupted by bookmarks, which cause an automatic pause. Similarly, when scrolling is disabled, graphs cause automatic pauses when they fill.
Replay can be hastened or slowed by adjusting the speed during replay, regardless of the speed at which the experiment was performed. Generally, view setting changes on playback (Graph duration, scaling) affect the presentation of the results, but have no effect on the results themselves.
However, it is possible to make substantive adjustments during playback, such as making a change to cardiac output, or adjusting the vaporizer, which would invalidate the remainder of the previous experimental timeline. When a user makes a substantive change (and Gas Man confirms the user’s intent), Gas Man truncates the simulation at the point of change. Continuing to run the

187 | P a g e
simulation beyond the change point extends the simulation with new, alternate results, just as it would have done had the original simulation included the revising adjustment.
This response applies to any replay, whether a replay after rewind or a replay after opening a previously saved experiment (.GAS file). However, since opening a .GAS document creates a working copy of the saved experiment, it is the working copy and not the .GAS document that gets truncated. No changes are ever made to a simulation saved on disk by virtue of actions taken during replay. The only way to cause Gas Man to change a saved simulation is by invoking the Save or Save As… commands.
Two convenience commands on the Edit menu provide ways to clear the results of the current simulation. Zero Timer clears all results and sets the simulation time to zero, i.e., the beginning of a new simulation. All settings remain as they were just before the Zero Timer command was invoked. Clear All clears all results, sets the simulation time to zero, and resets all settings to their respective defaults. Clear All produces the same results as closing the current simulation and opening a new one, with the exception that the simulation name and description remain unchanged.
Tabs, Windows and Panels (The Model, View, Controller Pattern)
Over decades, software creators have developed and documented software patterns that have proven to work well and result in products that are well-received and readily understood by users. One such pattern called the Model, View, and Controller Pattern is particularly suited to Gas Man. An understanding of how Gas Man exploits this pattern will enhance your ability to operate Gas Man.
According to this pattern, a computer program separates the concerns of its process into three categories. The Model category addresses the underlying construct of concern, for example, a published document might be modeled as a structure of chapters, titles, figures, and so on in a text editor. The model abstracts and generalizes the elements of this structure (by, for example, adding styles, references, etc.), but the model focuses on the real result, or aim of the user – the document.
In Gas Man, the experiment plays the role of the model. The Gas Man model’s elements include anesthetics, vaporizers, and patients (where patients are further modeled as compartments or tissue groups) and the actions that you, the doctor, take to manipulate them. The way in which the elements of the model interact is the substance of this manual’s Chapters 3 through 14 and understanding that interaction is the very goal of this manual. The experiment constitutes the data in a .GAS file.
The next element of the pattern, the View, concerns the manner in which the model is presented to the user. Continuing with our text editor example, an editor may present many views of a document – an outline, a print layout, and an annotated draft are all examples of views. Views are associated with a purpose (an outline to review structure, a print layout to review esthetics) and a suitable perspective (the first chapter, the cover page), and they are created, controlled, and dismissed at the behest of the user, to support whatever interest or focus she may have. There can be any number of views at any given time, and creating, changing the perspective of, or dismissing a view has no effect on the document (model).

188 | P a g e
In Gas Man, the panel plays the role of the View. The three panel types described in Chapter 2 – the Control Panel, the Picture Panel, and the Graph Panel – make up the set of views currently offered by Gas Man. (Technically, the Overlay feature introduced in Chapter 5 and described more fully later in this appendix is also a view to a model consisting of a set of experiments.) In fact, you may notice that this manual sometimes interchanges the word ‘panel’ and ‘view,’ for example, using the term ‘Picture View.’
A Picture Panel is designed for viewing and manipulating the state of an experiment at a given point in its evolution. The compartment schematic helps you visualize the relationships between compartment tensions. Controls on the Picture help you visualize and compare your inputs. Control placement helps you understand the relationship of a control to the way anesthetic is transmitted between the control’s adjacent components. A given Picture Panel limits its perspective to a single agent, so it is common to create multiple Picture views to examine the state of multi-agent simulations. Less often, an additional Picture view is created to concentrate on an individual compartment (or other element of the view, like cost), for example, in order to juxtapose it with the same, limited perspective of another agent.
A Graph Panel is designed to illustrate and emphasize trends, limits, and inflections in the traces of anesthetic tension over some interval during the evolution of an experiment. By manipulating the time-scale and time-frame of this view, you can highlight and examine in detail the important transitions, tendencies, and decision points in a course of anesthesia. Like the Picture, the Graph Panel limits its perspective to a single agent, so multiple Graph Panels are common in multi-agent simulations.
The final element of the pattern, the Controller, is the conceptual engine and control mechanism of the programming pattern. Its function is therefore closely bound to the model. For a text editor, a controller might be comprised of the processor and the inputs needed to, for example, paginate, format, print, or index a document. In Gas Man, it is the virtual simulator along with the controls to adjust the simulated machinery and the simulator itself. For example, the Gas Man controller computes breath-by-breath changes in partial pressure of each anesthetic in each compartment, and provides access to the vaporizer and cardio-pulmonary settings and switches to start, stop, and control the simulator.
The controller is not directly visible to the user; rather, access to its control mechanisms is available through the views, menus, and toolbars of the program, sometimes in multiple, convenient (we hope) locations. For example, you can press the Start button in the toolbar, press Begin in the Control Panel, or invoke the Run command from the File menu with equivalent effect – all operate the switch in the controller that starts or resumes the computation engine. Similarly, you can control alveolar ventilation or cardiac output from any panel – all such controls are connected to the same input in the model.
The astute reader may have noticed that one of the panels – the Control Panel – was mentioned but not included in the discussion of views. Despite the word ‘control’ in its name and its peculiarity (it is a singleton in an experiment, and it does not show visible change as a simulation progresses), it is still a view, albeit one that mostly provides access to the controller. Creating a Control Panel does not create a controller – running Gas Man does that – and closing one does not destroy a controller. The Control Panel is a view that summarizes and controls current

189 | P a g e
parameters applicable to the entire simulation, unlike the Picture and Graph, which focus on a particular anesthetic.
Finally, it is helpful to underscore the relationship and distinctions between windows, which are artifacts of the computer operating system, and views, which provide perspectives on the model. A closer correspondence exists between views (panels) and tabs than between windows and tabs. You can drag tabs (containing panels or views) away from windows to create new windows, and you can drag tabs between windows as long as doing so would not result in a window that contains tabs from different simulations. The important thing to realize is that no matter how many views you create or how you arrange them in windows, they are all just portals through which to view the underlying model, and that while any two views might depict a single aspect of the model in two different ways, they can never present different states or values for a given aspect.
Note: With such an extremely flexible relationship between windows and views comes the possibility of disorganization. The Group Windows command on the Window menu is useful in this context. It gathers all the views for a simulation into a single, tabbed window (one per simulation).
Multiple Agent Simulations
In several exercises earlier in this manual, you created multiple agent simulations – experiments in which a more than one vaporizer (anesthetic) is connected to the breathing circuit. As the instructions indicate, there are several ways to create a multi-agent simulation, and rules that govern when this is done and how the model reacts.
First a rule: You must introduce any agents you plan to use in your experiment before the experiment begins, much as you would connect and set up vaporizers for any agents you plan to administer before an operation. Gas Man will not allow you to add or change agents once the simulation has begun. That does not imply that you must start with a non-zero delivered tension for any agent, of course. So, for example, to simulate a switch from one anesthetic to another mid-way into an operation, start by adding both agents to the experiment, setting a value for induction on the first agent’s vaporizer, and zero on the second vaporizer. At the appropriate time, you can pause, turn down the first vaporizer, and turn up the second.

190 | P a g e
Now, an exception to the rule that creating or destroying a view does not affect the model: You can introduce an additional anesthetic agent by creating a view for an agent that does not yet exist in an experiment. Figure E-6 shows the View menu at the start of a simulation with only isoflurane present. Notice that the menu commands for creating views of agents other than isoflurane are enabled, and they show the prefix ‘(Add)’ to denote that creating such a view will introduce the corresponding agent.
There is no such exception for the inverse operation. Closing a view – even the last remaining view – of an anesthetic does not remove that anesthetic from the experimental setup.
Figure E-6: View menu at the start of a simulation

191 | P a g e
The complete array of operations that introduce, remove, re-key and reorder agents is available from the Control Panel. Figure E-7 shows the context menu available on an occupied row in the Agents table.
Note the presence of the Delete Agent command. This is how one can remove an agent from the experiment setup, say, when it has been introduced in error. Additional functions:
• Create additional views (New Graph, New Picture) from the context menu for an agent. • Change the cost parameters of an agent (Set Cost) from the context menu for an agent. • Add an agent in the last row of the agent table by clicking the cell labeled ‘Click to Add’,
which creates a dropdown from which you can select additional agents. • Replace one agent with another. Clicking the cell naming an existing agent in the table
creates a dropdown from which you can select an alternative. • Change an agent’s key color. Clicking a color creates a dropdown from which you can
select an alternative color for the agent in that row. • Reorder the list of agents. Select a row and click the green arrows to move an agent and
color up or down the list. • Bring all the views for a particular agent to the foreground when their windows are
minimized or their tabs occluded by other views (Bring to Front).
You cannot reorder, add, or delete agents after a simulation begins, and the controls representing those functions will be disabled at any other time than time zero. Also, you will not be able to start a simulation whose agent list contains duplicates.
Figure E-7: Agent context menu at the start of a simulation

192 | P a g e
Circuit flush
The button labeled ‘Flush’ between the vaporizer gauge and the breathing circuit simulates the flushing the breathing circuit with oxygen, which immediately clears all anesthetics from the circuit, as does its real-life counterpart.
One nuance of the Gas Man model arises from Gas Man’s ability to pause, and therefore make multiple adjustments simultaneously and instantaneously, whereas, in real life, they would occur in sequence. Most often, the interpretation is obvious, but not always. In particular, it is possible to simulate any combination of simultaneous flushes and liquid injections. Gas Man will interpret a flush command during a pause by discarding any pending commands to simulate injection made during the pause. On one hand, this is slightly unrealistic (the delivered quantity is not affected); on the other, it allows you to ‘undo’ injections when you have accidentally done too many or lost count. Multiple injections while paused are interpreted to mean a single injection of that multiple of the unit dose.
Flushing the circuit causes a momentary burst in fresh gas flow and short drop-out in delivered tension. These effects are usually visible as a sharp spike on graphs of FGF and deep, narrow valley on graphs of DEL. Sometimes, however, the spike and valleys occur between interpolation points on the graph (exceed the graph’s response time), especially with relatively large-duration views. Injections are marked by a caret on the graph paper as a fall-back measure, but flushes can be missed on the graphs. If it is important to see them graphed, zoom in (use a shorter duration view) or enlarge the graph. In any case, the model contains the accurate results of both injection and flush operations.
Interface Enhancements
Scrolling
The ability to scroll the graph-paper in the Graph Panel is fairly intuitive. Just keep the following in mind:
• The scrollbar is not visible and you cannot scroll if the duration of the simulation is less than the selected view length.
• The ‘thumb’ on the scrollbar is disabled and you cannot manually scroll while the simulation is running.
• As explained in the previous section on Program Defaults, there are interactions between the special scrolling option (Enable Scrolling on the Special menu), the Graph Jump Percent, and the times at which the Gas Man simulator will automatically pause. However, consideration of these interactions is only relevant while the simulation is running.
• By convention, pushing the thumb to the left uncovers an earlier interval of the graph; pushing to the right shows a later timeframe. Time increases to the right of the ordinal, which implies that pushing the thumb to the left moves the graph paper to the right, and vice-versa.
• Gas Man will scroll to the latest interval possible when view length selection changes.

193 | P a g e
Scaling
The heights of each of the scales in the Gas Man Picture can be adjusted. The default height for each scale is set in the system and adjustable using the Set Defaults command from the File menu. For a particular simulation, you can change the scale heights by typing a value in the box at the upper left of each scale (DEL, FGF, VA and CO).
When you change the height of the DEL scale, the height of each of the body compartments changes accordingly (CKT, ALV, ART, VRG, MUS, FAT and VEN). In addition, the height of the DEL scale set in the Picture determines the height of the y-axis of the compartment tension and DEL portions of the Gas Man Graph. Similarly, adjusting the height of the FGF, VA and CO scales in the Picture will change the height of their graphs in the Graph window.
This feature allows you to make the Graph more useful by choosing a y-axis height that maximizes the visibility of the tension traces.
Using the Overlay Feature
One of the most powerful and useful features of Gas Man is the Overlay function. The Gas Man Overlay is an intuitive graphical interface that allows you to:
• View and compare the evolution of agent tension in a single compartment for one or more anesthetics, in units of dollars, percent atmospheres, or MAC
• View and compare the evolution of a ratio of an agent’s tension in any two compartments for one or more anesthetics
• Do either for agents in one or multiple simulations
Several of the exercises in earlier chapters of this manual used the Overlay feature to analyze the results.
The Overlay window consists of a graphical display area and two columns of radio buttons. The graphical display traces the value or the ratio as its y-axis, and time as its x-axis. For overlaying multiple anesthetics, a legend beneath the graph tells you which line corresponds to which agent and simulation. Gas Man disambiguates the traces on the graph by qualifying each legend entry with the minimal combination of agent name, number of agents in the source simulation, patient weight, circuit, and cardio-pulmonary rate that generates a set of unique legend entries.
Gas Man will add a trace to the Overlay for each anesthetic that has an open, non-minimized Graph Panel and at least some data in the graphed interval. Thus, it is possible to select which agents are represented in an overly by scrolling Graph Panels and minimizing certain windows and restoring others.
The timeframe in the Overlay window matches that set in the active Graph Panel at the time the Overlay command is invoked. If the command is invoked when no Graph Panel is active, it will match the longest timeframe among all the open Graph Panels that are not minimized. This is important to remember to ensure you achieve the visual display you seek. If that is not the time view you want in the Overlay, adjust the timeframe of the active graph or make a different graph view active accordingly.

194 | P a g e
Keep in mind that a timeframe denotes both the length and location of a time interval. So, for example, it is entirely possible for Overlay to show a partial trace or no trace at all for a simulation with an open Graph Panel, meaning there are insufficient data (or no data) for that simulation in the interval exposed by the active Graph Panel.
The two columns of radio buttons construct display commands in the "show X over Y" syntax. That is, to show traces of alveolar divided by inspired (the A/I ratio), you select the radio button to the left of ALV (in the Show column) and the button to the right of CKT (in the Over column).
Modeling
Vaporization, injection and uptake
The Enable Vapor command found under the Special menu allows you to simulate effective gas flow. Generally, Gas Man is used without this effect. The exercises in this manual all assume that the total flow into the circuit is determined by the FGF setting, without including the additional volume of gas provided by the anesthetic agent added to the fresh gas flow.
The Enable Vapor command in Gas Man allows you to study the effects of agent vaporization. For instance, it seems logical that enabling agent vaporization would make an anesthetic administration more expensive. Actually, because the addition of vapor to the breathing circuit increases inspired tension, and thereby the level of anesthesia received by the patient, the anesthesiologist will naturally adjust the vaporizer downward to maintain desired tension. The result is that anesthetic cost changes little. You can design experiments with Gas Man to study this more closely.
Liquid Injections are excluded from this effect; effective gas flow is a measurement of output from the vaporizer, whereas injections are made directly into the breathing circuit.
In Gas Man model, uptake is a net measurement. It increases during induction, and decreases as the patient emerges from anesthesia, though currently, it is not allowed to go negative (even in the case of nitrogen, where it is possible to apply “under-pressure” by supplying a breathing mixture in concentrations below ambient). This may change in the future, when Gas Man is expanded to model experiments that begin with the awakening process.
The Ideal Circuit
Gas Man also provides the user an ideal circuit for experimentation. Real breathing circuits behave in a manner somewhere between Gas Man's fully mixed semi-closed circuit and the un-mixed, first-in first-out ideal circuit. The ideal circuit has all of the properties of the non-rebreathing or open circuit whenever FGF exceeds ventilation. When FGF is less than ventilation, fresh gas is breathed in preference to exhaled gas. Thus, inspired gas is dominated by fresh gas as long as FGF is high.

195 | P a g e
Advanced Outputs
Gas Man has a number of printing and output options that are particularly useful in recording, sharing and presenting your findings.
Printing and Previewing
A full record of a Gas Man simulation can be printed on your printer. There are four commands under the File menu related to printing.
The Page Setup... command brings up a dialog box that allows you to set your paper size, page orientation, and other layout options.
The Print Select... command allows you to choose which elements you wish to print:
• Select Printout to include a tabular record of the simulation. The table starts with the description of the simulation, date and time of the printout, patient weight and compartment volumes, relative flows, and the solubilities and volatilities of all agents used. The remainder of the table lists adjustments to the circuit, fresh gas flow, and cardio-pulmonary rates, and changes to delivered tension or injections for each anesthetic, in order by the time at which the adjustment or change was made.
• Select Graphs to include a full page graph of the time course of all four parameters (DEL, FGF, VA, CO), a graph with just CKT, ALV and VRG, and a graph with all five compartment tensions (thus displaying more than the Gas Man Graph screen display). Note that the timeframe of this graph will match that of the Graph view that is active at the time that a Print… command is issued.
The Print Preview… command renders page images of the elements you select with Print Select… to the screen. You can zoom in and out, view them one page at a time, and go directly to the print dialog box from the preview.
The Print… command allows you to identify a printer, select the pages and the number of copies that you want the system to print, and start printing. You can reach the appropriate printer configuration window through this dialog should you require access to print-driver-specific settings.
Exporting to PDF, HTML and XML
In addition to paper copies via the Print… command, Gas Man can create electronic copies of output documents. One common electronic format popularize by Adobe™, Portable Document Format or PDF, is suitable for network transmission, and excels at preserving the layout and artwork when viewed on a wide variety of target computing platforms. Export to PDF, for example, when you wish to attach a report of your findings to an email message.
Of course, the optimum format to upload to a web-site for viewing via World Wide Web would be HTML. Exporting to HTML will produce a subset of web assets that can be served by a web service to create a web page of your results.

196 | P a g e
In recent years, XML has become the ubiquitous format of choice for data transmission between computer systems. The system that does not understand or cannot process XML data is rare; virtually all web browsers – certainly the major ones – can process and display XML, as can virtually all spreadsheet programs, database managers, and print processors. XML is also a human-readable format, because it consists solely of characters with no binary representations, although an XML document might not be pleasant to read without some formatting. Finally, XML documents contain what is called meta-data, or descriptive information, such as the name of each datum, descriptive attributes (like ‘length’), and an inherent, hierarchical structure.
XML files are frequently accompanied by other files known as XML transforms. XML transforms are recipes used by web browsers and other generic programs to extract, rearrange, and present the data in XML files.
Gas Man XML export files contain almost all the data in a .GAS document. Gas Man also ships with several XML transforms, one of which is used to produce the printer output and the HTML that Gas Man exports! Other transforms can be used, for example, by spreadsheet programs to read Gas Man exports (experimental data) into spreadsheets, or to create generic comma separated lists for input into XML-challenged legacy programs and databases.
Capture and Copy
A few more pedestrian methods of extracting data from Gas Man adapt the paradigm of “copy, cut, and paste” to transfer snippets of information between Gas Man and other programs.
Gas Man will create a graphic image, or bitmap, capturing the active view (panel) in response to the Select All command on the Edit menu (Ctrl+A). It will copy that image to the clipboard each time the Copy Selection command on the Edit menu is invoked (appropriating the standard ‘Cut’ command, Ctrl+X). This feature complements the standard active window capture (Alt+Print Screen) and screen capture (Print Screen) functions in Windows.
Any of these means can be used to create images to paste into your presentation or word pro-cessing files. These images can be edited (cropped, annotated, re-colored) in most presentation and graphics software, and translate well across the PC and Macintosh platforms.
Gas Man can also place a single line of comma-separated data describing the current set of tensions for the anesthetic in the active Gas Man view. In response to the Copy Data command on the Edit menu (Ctrl+C), Gas Man will place a comma-separated list of values for simulated time, DEL, CKT, ALV, VRG, MUS, FAT, VEN, uptake in liters, delivered in liters, uptake in dollars, and delivered in dollars. Such a list is suitable for pasting into a spreadsheet database, for example.

197 | P a g e
Bibliography
1. Ashman, MN, Blesser, WB and Epstein, RM. A nonlinear model for the uptake and distribution of halothan in man. Anesthesiology. 1970, 33, p. 419.
2. Barton, F and Nunn, JF. Totally closed circuit nitrous oxide/oxygen anaesthesia. Br J Anaesth. 1975, 33, p. 350.
3. Brandom, BW, Brandom, RB and Cook, DR. Uptake and distribution of halothane in infants: In vivo measurements and computer simuations. Anesth Analg. 1983, 62, p. 404.
4. Brody, S. Bioenergetics and Growth. New York : Reinhold, 1945.
5. Brown, RF. Compartmental system analysis. State of the art IEEE Trans Biomed Eng. 1980, 27, p. 1.
6. Chilcoat, RT. Computer assistance in the control of depth of anaesthesia. Ph. D. Thesis. University of Wales : Welsh National School of Medicine, 1982.
7. Cowles, AL, Borgstedt, HH and Gillies, AJ. A simplified digital method for predicting anesthetic uptake and distribution. Comput Biol Med. 1973, 3, p. 385.
8. Edsall, DW. Economy is not a major benefit of closed-system anesthesia. Anesthesiology. 1981, 54, p. 258.
9. Eger, EI II. A mathematical model of uptake and distribution. [ed.] EM Papper and RJ Kitz. Uptake and Distribution of Anesthetic Agents. New York : McGraw-Hill, 1963, p. 72.
10. —. Effect of inspired anesthetic concentration on the rate of rise of alveolar concentration. Anesthesiology. 1963, 24, p. 153.
11. —. Anesthetic Uptake and Action. Baltimore : Williams & Wilkins, 1974.
12. —. Isoflurane (Forane®): A Compendium and Reference. Madison : Airco, 1981.
13. Eger, EI II and Bahlman, SH. Is the end-tidal anesthtic partial presure an accurate measure of the arterial anesthetic partial pressure? Anesthesiology. 1971, 35, p. 301.
14. Eger, EI II and Guadagni, NP. Halothane uptake in man at constant alveolar concentration. Anesthesiology. 1963, 24, p. 299.
15. Eger, EI II, Saidman, LJ and Brandstater, B. Minimum alveolar anesthetic concentration: A standard of anesthetic potency. Anesthesiology. 1965, 26, p. 756.
16. Epstein, RM, et al. Influence of the concentration effect on the uptake of anesthetic mixtures: The second gas effect. Anesthesiology. 1964, 25, p. 364.
17. Foldes, FF, Ceravolo, AJ and Carpenter, SL. The administration of nitrous oxide-oxygen anesthesia in closed systems. Annals Surgery. 1952, 136, p. 987.
18. Goldberg, IS, et al. A pharmacokinetic model of closed-circuit inhalation anesthesia. Ann Biomed Eng. 1978, 6, p. 231.

198 | P a g e
19. Kety, SS. The physiological and physical factors governing the uptake of anesthetic gases by the body. Anesthesiology. 1950, 11, p. 517.
20. —. The theory and applications of the exchange of inert gas at the lungs and tissues. Pharmacol Rev. 1951, 3, p. 1.
21. Latta, WB and Snider, MT. Uptake and distribution: Hydraulic simulation designed for resident teaching. Scientific Exhibits, Annual Meeting, American Society of Anesthesiologists. San Francisco, CA : s.n., 1976.
22. Lowe, HJ. Dose-Regulated Penthrane® Methoxyflurane Anesthesia. Abbott Laboratories. 1972.
23. Lowe, HF and Ernst, EA. The Quantitative Practice of Anesthesia: Use of Closed Circuit. Baltimore : Williams & Wilkins, 1981.
24. Lowe, HJ, et al. Quantitative closed circuit anesthesia. Anesthesiology Review. August 1974, p. 16.
25. MacKrell, TN. An electrical teaching model. [ed.] EM Papper and RJ Kitz. Uptake and Distribution of Anesthetic Agents. New York : McGraw-Hill, 1963, p. 215.
26. Mapleson, WW. An electrical analogue for the uptake and exchange of inert gases and other agents. J Appl Physiol. 1963, 18, p. 197.
27. —. Circulation-time models of the uptake of inhaled anaesthetics and data for quantifying them. Br J Anaesth. 1973, 45, p. 318.
28. Munson, ES and Bowers, DL. Effects of hyperventilation on the rate of cerebral anesthetic equilibration. Anesthesiology. 1967, 28, p. 377.
29. Munson, ES, Eger, EI II and Bowers, DL. The effects of changes in cardiac output and distribution on the rate of cerebral anesthetic equilibration. Anesthesiology. 1968, 29, p. 533.
30. —. Effects of anesthetic-depressed ventilation and cardiac output on anesthetic uptake: A computer nonlinear simulation. Anesthesiology. 1973, 38, p. 251.
31. Ptael, A and Milliken, RA. Costs of delivery of anesthetic gases reexamined. Anesthesiology. 1981, 55, p. 710.
32. Perl, W, et al. Intertissue diffusion effect for inert fat-soluble gases. J Appl Physiol. 1964, 20, p. 621.
33. Philip, JH. Gas Man pictorial and graphical simulation for teaching anesthesia uptake and distribution. Anesthesiology. 1983, 59, p. A471.
34. Philip, JH, Cooper, JB and Newbower, RS. The Boston Anesthesia System. Presentation Abstract, Low Flow and Closed Circuit Anesthesia Symposium. Denver, CO : s.n., April 1978.
35. Philip, JH. Gas Man® - An example of goal oriented computer-assisted teaching which results in learning. Intl J Clin Monitory & Computing. 1986, 3, p. 165.

199 | P a g e
36. Severinghaus, JW. The rate of uptake of nitrous oxide in man. J Clin Invest. 1954, 33, p. 1183.
37. Soong, TT. Pharmacokinetics with uncertainties in the rate constants. s.l. : Mathematical Biosciences, 1971.
38. —. Random Differential Equations in Science and Engineering. New York : Academic Press, 1979.
39. Spain, JA. Cost of delivery of anesthetic gases reexamined Part III. Anesthesiology. 1981, 55, p. 711.
40. Stoeling, RK and Longnecker, DE. The effect of right-to-left shunt on the rate of increase of arterial anesthetic concentration. Anesthesiology. 1972, 36, p. 352.
41. Virtue, RW. Low flow anesthesia: Advantage in its clinical application, cost, and ecology. [ed.] JA Aldrete, HJ Lowe and RW Virtue. Low Flow and Closed System Anesthesia. New York : Grune and Stratton, 1979.
42. Virtue, RW and Aldrete, JA. Costs of delivery of anesthetic gases reexamined Part II. Anesthesiology. 1981, 55, p. 711.
43. Warsawski, C, Raemer, DB and Philip, JH. A pharmacokinetic model with random rate coefficients. Proceedings of the 10th Annual Northeast Bioengineering Conference. Hanover, NH : s.n., 1982.
44. Weathersby, PH and Homer, ID. Solubility of inert gases in biological fluids and tissues: A review. Undersea Biomed Res. 1980, 7, p. 277.
45. Yasuda, N, Targ, AG and Eger, EI II. Solubility of I-653, Sevoflurane, Isoflurane and Halothane in human tissues. Anesthesiology. Vol. A615 (Abstract), 69.
46. Zwart, A, Smith, NT and Beneken, JEW. Multiple model approach to uptake and distribution of halothane: The use of an analog computer. Computers and Biome Res. 1972, 5, p. 228.
47. The Severinghaus Square Root of Time Rlationship for Anesthetic Uptake and its Implications for the Stability of Compartmental Pharmacokinetics. Connor, CW and Philip, JH. 2008, Physiol. Meas, Vol. 29, pp. 685-701. <http://iopscience.iop.org/0967-3334/29/5/012>.
48. Closed-form solutions for the optimum equivalence of first-order compartmental models and their implications for classical models of closed-circuit anesthesia. Connor, CW and Philip, JH. 2, 2009, Physiol Meas, Vol. 30. <http://stacks.iop.org/0967-3334/30/N11>.
49. Model-based administration of inhalation anaesthesia 1. Developing a system model. Leroux, JG and Booij, LH. 1, Jan 2001, Br J Anaesth, Vol. 86, pp. 12-28.
Related Documents