UK/Norway Co-operation Implementation Group Gas & Infrastructure Action Group Recommendation 8 Gas Quality

Welcome message from author
This document is posted to help you gain knowledge. Please leave a comment to let me know what you think about it! Share it to your friends and learn new things together.
Transcript

UK/Norway Co-operation Implementation Group
Gas & Infrastructure Action Group
Recommendation 8 Gas Quality

CONTENTS 1.0 INTRODUCTION
1.1 Recommendation 8 1.2 Workgroup Structure 1.3 Additional Input
2.0 COMPARISON BETWEEN UK AND NORWEGIAN SPECIFICATIONS
2.1 UK Specifications 2.1.1 GS(M)R 2.1.2 Transco Indicative Specifications
2.2 Norwegian Specification 2.3 Areas of Potential Differences between UK and Norwegian Specifications
2.3.1 Gross Calorific Value (GCV) 2.3.2 CO2 2.3.3 Wobbe Index 2.3.4 Incomplete Combustion Factor and Soot Index
3.0 CAN THE UK SPECIFICATIONS BE CHALLENGED AND AMENDED
3.1 GCV 3.2 CO2 3.3 Wobbe Index 3.4 ICF and SI
4.0 HOW COULD NCS GAS ACHIEVE/COMPLY WITH UK SPECIFICATIONS
4.1 Blending 4.2 Further Processing 4.3 Nitrogen Injection 4.4 CO2 Removal
5.0 GLOBAL COST ESTIMATES FOR OPTIONS DISCUSSED
5.1 Blending 5.2 Further Processing 5.3 Nitrogen Injection 5.4 Changing Specifications 5.5 Burner Upgrades 5.6 CO2 Removal
6.0 OPTION RANKING 7.0 UK GOVERNMENT POSITION 8.0 CONCLUSIONS AND FORWARD ACTION PLAN APPENDIX A: UK Gas Specifications APPENDIX B: GASSCO presentation ‘Gas quality coming from the NCS to UK’ APPENDIX C: Powerpoint presentation APPENDIX D: Advantica Presentation APPENDIX E: Advantica Proposal, Impact of UK Interchangeability Methodology on Future
Natural Gas Supplies

1.0 INTRODUCTION 1.1 Recommendation 8 of the UK/Norway Co-operation Implementation Group
“Promote the need for improved compatibility of UK, Norwegian and Continental gas sales specifications by dialogue between respective ministries and stakeholders”. This Recommendation suggests that there is a mismatch between the specifications for UK Sales Gas and the Norwegian Continental Shelf (NCS). The aim of this report is to summarise the workgroup findings. The report covers the following topics: • Comparison between Norwegian and UK gas specifications • Areas of potential differences • Can the UK specifications be changed? • How can Norwegian gas comply with UK sales gas requirements? • Ranking • UK Government Perspective • Conclusions • Forward action plan This report is designed to accompany a series of PowerPoint presentation slides, contained in Appendix C.
1.2 Workgroup Structure A Workgroup was set up in January 2003 comprising: • David Hainsworth TFEEUK (Leader) • Jonathan Maughan TRANSCO • Mike Wade ConocoPhillips UK • David Elmes Shell UK • Tor Erik Hanson TFE Norge (Meeting 3)
1.3 Additional Input It was felt that although this Gas and Infrastructure Action Group was set up to look at the UK and Norway, any findings, recommendations or forward actions from the Workgroup should take account of the wider picture. The UK will become a net importer of gas in 2005/6 and the same specification issues may arise for other import routes, eg Interconnectors and LNG imports. Consequently we have made informal contact with the following stakeholders in order to establish whether they have similar issues: • Interconnector UK, Operator of the Bacton/Zeebrugge Interconnector
• Centrica, a major supplier of gas in the UK who are also likely to import more gas.
• Members of the EASEE-Gas (European Association for Streamlining of Energy Exchange) group
• Advantica Technology, formally British Gas Research

Their feedback supports the findings drawn in this report. We have also made contact with the UK DTI, which has proved to be very timely as during the Workgroup process the UK Government issued an Energy White Paper which has raised the issue of misalignment of imported gas specifications. A meeting was held with the DTI to allow this to be explored in more detail so that any potential impact on this Workgroup’s conclusions could be assessed and included (see section 7.0).

2.0 COMPARISON BETWEEN UK AND NORWEGIAN SPECIFICATIONS
2.1 UK Specifications
The UK specifications are made up of two parts, those which are specified in law (GS[M]R) and those indicative specifications which are given by Transco as operator of the UK onshore system. The specifications given in GS(M)R are fixed and have to be met until such time as the legislation is changed, whereas Transco may have some flexibility in how they apply their indicative specifications.
2.1.1 Existing Gas Processing Terminals Each Gas Processing Terminal in the UK has a gas quality specification based on commercial agreements between gas buyers and producers and if these terminals were in existence before the introduction of the Network Code in 1996, these gas specifications are contained within the gas entry provisions described in the Network Code. Any changes required to these specifications will need to be agreed with Transco and the UK Shippers.
2.1.2 New Entry Connections Each year, Transco issues a Ten Year Statement (on www.uktransco.com) that amongst other things describes the indicative gas quality specifications (see Appendix A) that Transco can accept at any new landing point. From time to time new suppliers of gas will not be able to comply with these specifications and Transco may be able to provide some flexibility on a case by case basis. However, under no circumstances will Transco agree to a gas quality specification that does not meet the requirements of GS(M)R (as described in Appendix A).
2.2 Norwegian specifications The NCS specification has been derived from operation of the Gassco system and delivery specifications to existing locations. The specifications are included in Appendix A. It should be noted that the Gassco system has many options for blending and as such Gassco may accept gas streams into the system which do not meet the delivery specifications.
2.3 Areas of Potential Differences between UK and Norwegian Specifications The following Table describes the differences between UK (Transco indicative) and Norwegian Specifications. An indicative European specification has also been included in the table for information, which shows that there are further differences to be managed if a wider European perspective is taken on gas specifications. There are many different specifications in use within Europe, we are aware that EASEE-Gas group has just set up a workgroup to look at how European gas specifications could be harmonised.
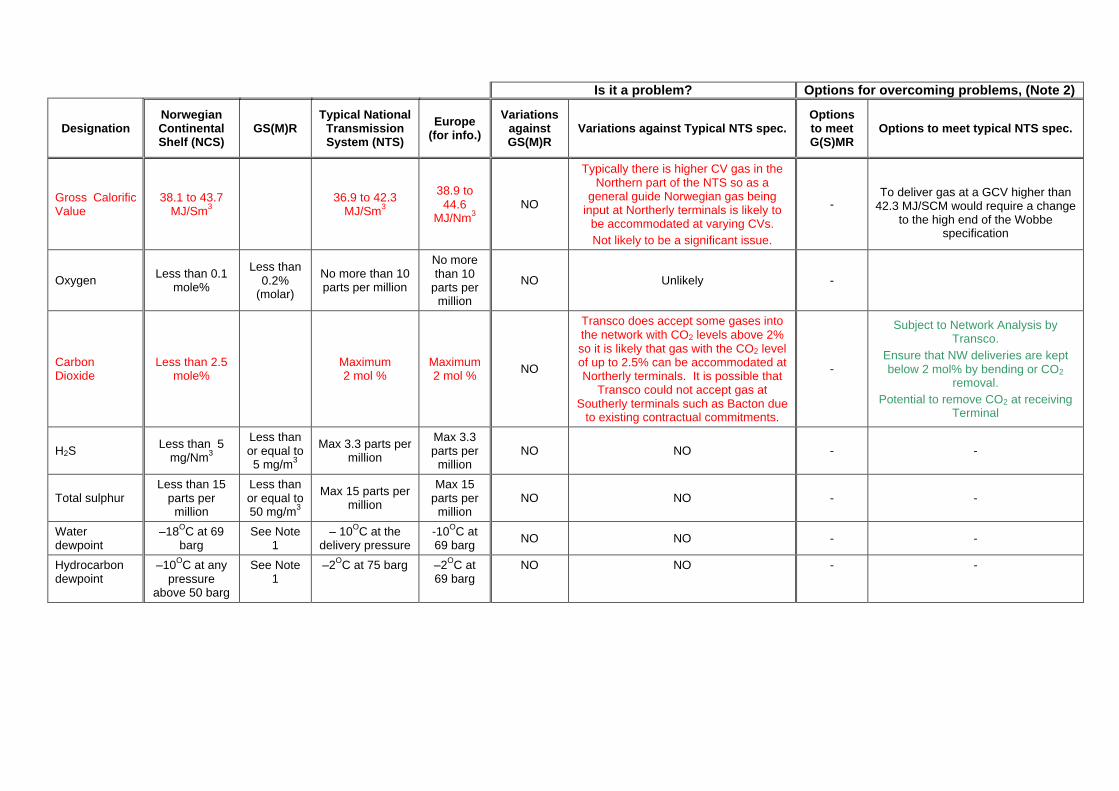
Is it a problem? Options for overcoming problems, (Note 2)
Designation Norwegian Continental Shelf (NCS)
GS(M)R Typical National
Transmission System (NTS)
Europe (for info.)
Variations against GS(M)R
Variations against Typical NTS spec. Options to meet G(S)MR
Options to meet typical NTS spec.
Gross Calorific Value
38.1 to 43.7 MJ/Sm3 36.9 to 42.3
MJ/Sm3
38.9 to 44.6
MJ/Nm3 NO
Typically there is higher CV gas in the Northern part of the NTS so as a
general guide Norwegian gas being input at Northerly terminals is likely to
be accommodated at varying CVs. Not likely to be a significant issue.
-
To deliver gas at a GCV higher than
42.3 MJ/SCM would require a change to the high end of the Wobbe
specification
Oxygen Less than 0.1 mole%
Less than 0.2%
(molar)
No more than 10 parts per million
No more than 10
parts per million
NO Unlikely -
Carbon Dioxide
Less than 2.5 mole% Maximum
2 mol % Maximum 2 mol % NO
Transco does accept some gases into the network with CO2 levels above 2% so it is likely that gas with the CO2 level of up to 2.5% can be accommodated at Northerly terminals. It is possible that
Transco could not accept gas at Southerly terminals such as Bacton due
to existing contractual commitments.
-
Subject to Network Analysis by Transco.
Ensure that NW deliveries are kept below 2 mol% by bending or CO2
removal. Potential to remove CO2 at receiving
Terminal
H2S Less than 5 mg/Nm3
Less than or equal to 5 mg/m3
Max 3.3 parts per million
Max 3.3 parts per
million NO NO - -
Total sulphur Less than 15
parts per million
Less than or equal to 50 mg/m3
Max 15 parts per million
Max 15 parts per
million NO NO - -
Water dewpoint
–18OC at 69 barg
See Note 1
– 10OC at the delivery pressure
-10OC at 69 barg NO NO - -
Hydrocarbon dewpoint
–10OC at any pressure
above 50 barg
See Note 1
–2OC at 75 barg –2OC at 69 barg
NO NO - -

Is it a problem? Options for overcoming problems
Designation Norwegian Continental Shelf (NCS)
GS(M)R (See Note 2)
Typical National Transmission System (NTS)
Europe (for info.)
Variations against GS(M)R
Variations against Typical NTS spec.
Options to meet G(S)MR
Options to meet typical NTS spec.
Wobbe Index 48.3 to 52.8 MJ/Sm3
47.2 to 51.41 MJ/Sm3
48.14 to 51.41 MJ/Sm3
50.9 to 54.0 MJ/Nm3
Norwegian gas at the top of the
Wobbe range is not compatible with
some UK domestic appliances on a
stand alone basis
Norwegian gas at the top of the
Wobbe range is not compatible with
some UK domestic appliances on a
stand alone basis
Challenge validity of spec.
Process, Norway or UK terminal
Blend gases offshore or at UK terminal. Inject nitrogen, to
suppress WI Change out burners in UK to make compatible
with wider quality
Challenge validity of spec.
Process, Norway or UK terminal
Blend gases offshore or at, UK terminal. Inject nitrogen, to
suppress WI Change out burners in
UK to make compatible with wider
quality
Temperature
Not less than 1OC. Not more than
38OC
Not less than 2OC. Not more than 38OC
Maybe a problem but easy to resolve
Maybe a problem but easy to resolve
Can easily heat gas on arrival
Can easily heat gas on arrival
Hydrogen Less than or
equal to 0.1%(molar)
Less than or equal to 0.1
mol %
Maybe, further investigation
required
Maybe, further investigation
required - -
Incomplete Combustion Factor
Less than 0.48
Less than 0.48
Yes, should be treated with Wobbe,
depending on Dutton envelope
can be more restrictive than
Wobbe. ICF limits Wobbe envelope
and therefore Norwegian gas outside the ICF
range will not be compatible with UK
appliances
Yes, should be treated with Wobbe,
depending on Dutton envelope
can be more restrictive than
Wobbe. ICF limits Wobbe envelope
and therefore Norwegian gas outside the ICF
range will not be compatible with UK
appliances
Challenge validity of spec.
Process, Norway or UK terminal
Blend gases offshore or at, UK terminal. Inject nitrogen, to
suppress WI Change out burners in UK to make compatible
with wider quality
Challenge validity of spec.
Process, Norway or UK terminal
Blend gases offshore or at, UK terminal. Inject nitrogen, to
suppress WI Change out burners in
UK to make compatible with wider
quality

Is it a problem? Options for overcoming problems
Soot Index Less than 0.60
Less than 0.60
Yes, should be treated with Wobbe
depending on Dutton envelope
can be more restrictive than
Wobbe. ICF limits Wobbe envelope
and therefore Norwegian gas outside the ICF
range will not be compatible with UK
appliances
Yes, should be treated with Wobbe
depending on Dutton envelope
can be more restrictive than
Wobbe. ICF limits Wobbe envelope
and therefore Norwegian gas outside the ICF
range will not be compatible with UK
appliances
Challenge validity of spec.
Process, Norway or UK terminal
Blend gases offshore or at, UK terminal. Inject nitrogen, to
suppress WI Change out burners in
UK to make compatible with wider
quality
Challenge validity of spec.
Process, Norway or UK terminal
Blend gases offshore or at, UK terminal. Inject nitrogen, to
suppress WI Change out burners in UK to make compatible
with wider quality
Inerts Not more than 7 mol
%
No Unlikely - -
Nitrogen Not more than 5 mol
%
No Unlikely - -
Note 1 Shall be at such levels they do not interfere with the integrity or operation of pipes or any gas appliance which a consumer could reasonably be
expected to operate. Note 2 Where options have been identified to resolve a problem then it is intended that CAPEX and OPEX estimates are developed at a high level for
each option so that they can be ranked.

It can be seen that there is potential for non-interoperability for some of the specifications, particularly GCV, Wobbe Index (together with the related ICF and SI) and CO2, but this will depend on the actual composition of the gas being transported from Norway to the UK. Gassco have plotted a number of gas compositions for potential gas steams to the UK against these three key specifications. These are shown in Figures 2.2.1–2.22. GCV: GCV is anticipated to be within the UK specifications for the Easington pipeline, but a number of the potential streams to Vesterled exceed the UK high limit. CO2: most potential streams are within the UK limit of 2%, although some in both in both the Easington pipeline and Vesterled are predicted to reach above 3%. Wobbe Index: almost all potential streams expected at Easington are within the UK maximum limit, but most of the streams through Vesterled exceed the limit. To complete the comparison against key UK specification limits, we have plotted the 16 potential streams on a ‘Dutton envelope’, as shown in Figure 2.2.2. The Dutton Envelope is a 3-dimensional area within a plot showing Wobbe Index against ICF and SI. Any gas streams which fall outside the 3-dimensional area are deemed unacceptable within the UK framework.
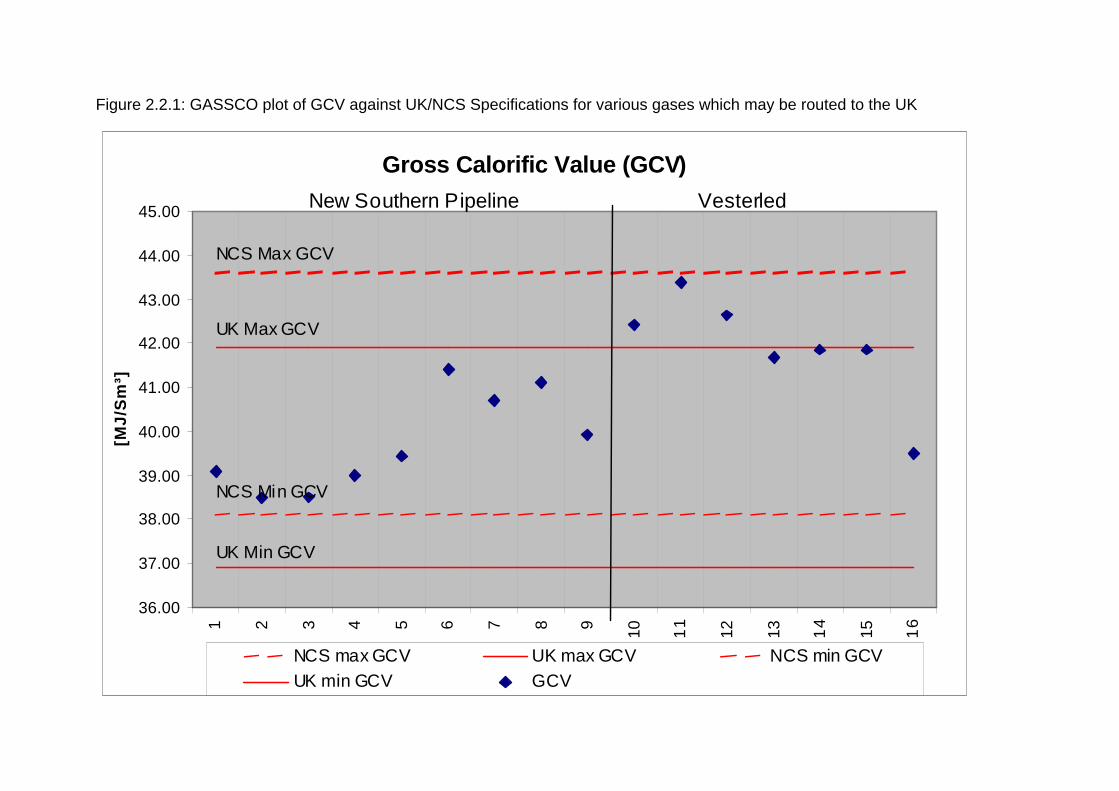
Figure 2.2.1: GASSCO plot of GCV against UK/NCS Specifications for various gases which may be routed to the UK
Gross Calorific Value (GCV)
36.00
37.00
38.00
39.00
40.00
41.00
42.00
43.00
44.00
45.001 2 3 4 5 6 7 8 9 10 11
12 13 14
15 16
[MJ
/Sm
³]
NCS max GCV UK max GCV NCS min GCVUK min GCV GCV
New Southern Pipeline Vesterled
NCS Max GCV
NCS Min GCV
UK Max GCV
UK Min GCV

Figure 2.2.2: GASSCO plot of Wobbe indices against UK/NCS Specifications for various gases which may be routed to the UK
Wobbe Index
47.00
48.00
49.00
50.00
51.00
52.00
53.00
54.00
1 2 3 4 5 6 7 8 9 10 11 12 13 14 15 16
[MJ/
Sm
³]
NCS max WI UK max WI NCS min WI UK min WI WI High WI
New Southern Pipeline Vesterled
NCS Max WI
NCS Min WI
UK Max WI
UK Min WI

Figure 2.2.3: Plot of various Norwegian gas compositions onto a ‘Dutton Envelope’
Gas Interchangeability Diagram
45
46
47
48
49
50
51
52
53
54
0 4 8 12 16 20 24 28 32 36 40 44 48
Non Methane Component in Equivalent Mixture (%)
Wo
bb
e N
um
ber
(MJ/
m3)
NCS 1 NCS 2 NCS 3 NCS 4 NCS 5 NCS 6 NCS 7 NCS 8 NCS 9 NCS 10 NCS 11 NCS 12 NCS 13 NCS 14
Lower Wobbe
Lower Emergency Wobbe
Upper Emergency Wobbe
Upper Wobbe
Incomplete Combustion Factor
Soot Index
Methane-Propane
Methane-Nitrogen

3.0 CAN THE UK SPECIFICATIONS BE CHALLENGED AND AMENDED?
There is potential for Norwegian gas to be different from the requirements of the UK and the aim of this section is to explain how this process could be undertaken.
3.1 GCV
Provided that the GCV of Norwegian gas meets the current upper limit of 42.3 MJ/SCM then it is unlikely that any further GCV restrictions will need to be applied.
3.2 CO2
Transco imposes a CO2 limit at entry to ensure that the integrity of its assets is not compromised and to ensure it can meet any exit requirements. These limits are not contained in GS(M)R and hence are not limited for safety reasons. Transco may be able to discuss different CO2 limits at some locations from the indicative specification of 2% but this can only be done on a case by case basis and where it can be demonstrated that such flexibility is required.
3.3 Wobbe Index, Incomplete Combustion Factor (ICF) and Soot Index (SI) These three specifications are strongly linked as they all relate to the safe burning of gas in domestic appliances. The UK is the only European country to have specifications for ICF and SI, as other countries either adopt a different approach or have a different make-up of domestic appliances. These three specifications were generated based on research work undertaken by British Gas and subsequent development of the “Dutton Envelope”. Advantica Technologies gave the Workgroup a presentation covering this in some detail; we have included this as Appendix B of this report. The issue for the UK surrounds the performance of older domestic appliances, some of which will have been converted from “town gas” to “natural gas” in the 1970’s. It is believed that all appliances which meet current specifications (1990 Gas Appliance Directive 90/396/CEE [“GAD”]), would operate safely with the higher Wobbe Index of most stand alone NCS gases. Consequently there will be scope to change the specification if all UK domestic appliances could be shown to meet current standards. However, it is likely that many appliances in the UK today will date from prior to 1990 and therefore the following steps would be required: - Conduct an appliance survey (it is over 10 years since the last one was carried out and
no organisation in the UK is currently planning to carry out any further surveys).
- Demonstrate to the HSE and gain their agreement for a change to GS(M)R that there are no safety risks to consumers by changing the Wobbe range. Such a demonstration may require the changing or upgrading of many appliances.
For such a process to be successful it is believed that Transco, HSE, Ofgem and the DTI would have to work closely together. The potential costs would largely depend on the number of domestic appliances which would require modification or replacement.

4.0 HOW COULD NCS GAS ACHIEVE/COMPLY WITH UK SPECIFICATIONS?
4.1 Blending Blending is clearly a good solution because it costs nothing technically; however it can be reliant on the availability of particular fields or facilities. If one of these key fields or facilities is unavailable then the loss of blending capacity can result in a significant loss of gas availability. Blending could take place in one or more of three possible ways: • Within the Gassco Infrastructure
• At a UK Receiving Terminal
• Within the Transco system
4.1.1 Blending within the Gassco System The Gassco system is ideally set up for the blending of gases as there are several hubs within the system which receive gas from various fields and terminals. However it should be noted that each delivery pipeline potentially has a different delivery specification to meet, consequently although this provides for flexibility it also imposes potential constraints. Gassco already blends gases in order to meet delivery specifications and is familiar with that mode of operation. See Figure 4.1.1 below.

Figure 4.1.1: GASSCO schematic showing their Network and blending options
NyhamnaVolume
Heimdal Oseberg KollsnesVolume Volume Volume
EtanorFrigg VolumeVolume
KårstøVolume
St. Fergus GraneVolume Volume
SleipnerVolume
South UK EkofiskVolume Volume
Volume
Dunkerque Zeebrugge Emden 1 (NPT) Emden 2 (EMS) DornumVolume Volume Volume Volume Volume
ERF
DraupnerSLR
HRP

4.1.2 Blending at a UK receiving Terminal If other pipelines land at the same terminal as Norwegian gas then there may be the potential for blending of gases, however this must be done upstream of the Transco NTS, otherwise Transco may not meet their Safety requirements (GS[M]R).
4.1.3 Blending within the Transco system Transco are currently unable to offer a blending service for any specification outside of GS(M)R as all gas in Transco’s network covered by the safety case must comply by law with at least GS(M)R.
4.2 Further processing It is possible to build processing facilities to chill any incoming gas such that the heavier components can be removed, thus lowering the gas GCV and Wobbe index. It is anticipated that to meet the UK delivery specifications it would be necessary to chill the gas to –45 Deg C which implies the use of some form of mechanical expansion or refrigeration plant rather than a simple Joule/Thompson expansion.
4.3 Nitrogen injection It is also possible to suppress the Wobbe index of a gas by the injection of nitrogen in order to dilute the gas. Historically this technique has been used either on a continuous basis or intermittently in conjunction with blending. The continuous production of nitrogen is an energy intensive process and hence can result in significant operating costs. Nitrogen injection from storage as an occasional back-up for blending outages is a more financially attractive alternative.
4.4 CO2 removal The removal of relatively small percentages of CO2 from large volumes of gas is technically feasible but tends to be relatively expensive due to the size of process equipment required. As this is unlikely to be a significant issue we have not looked at this topic in detail.
5.0 GLOBAL COST ESTIMATES FOR OPTIONS DISCUSSED 5.1 Blending
The most attractive property of the blending option is that it could well be achieved at no cost. The NCS pipeline system is ideally set up for blending, eg at Heimdal, Sleipner, etc. However there are two potential limitations: • Much of the gas available for blending will be required for fulfilling already existing
sales obligations to European buyers.
• If key producers/facilities are unavailable then blending gas may not be available. This could impact on gas deliveries and result in financial exposure for shippers.
Gassco have carried out a series of blending runs in order to predict the potential Wobbe index at Easington/Dimlington during normal and upset conditions, Figure 5.1.1. It can be seen that from 2007 onwards the gas has the potential to be above the existing UK Wobbe Index upper limit.

Figure 5.1.1: GASSCO plot of potential Wobbe Index range of gas to be delivered to UK over time taking into account blending
Expected Wobbe Index development towards Easington/Dimlingtonvia SLR
47.00
48.00
49.00
50.00
51.00
52.00
53.00
2006 2007 2008 2009 2010
[MJ/
Sm
3]
WI High WI low WI UK Max Spec WI UK Min SpecNCS WI Max Spec NCS WI Min Spec WI High-high WI High-low
NCS Min WI
NCS Max WI
UK Min WI
UK Max WI

Figure 5.1.2: GASSCO plot of potential CO2 range of gas to be delivered to UK over time taking into account blending
Expected CO 2 development towards Easington/Dimlingtonvia SLR
0.0
0.5
1.0
1.5
2.0
2.5
3.0
2006 2007 2008 2009 2010
[mo
l%]
CO2 (WI High) CO2 (WI low) UK CO2 Spec NCS CO2 Spec
UK Max CO2
NCS Max CO2
Expected CO 2 development towards Easington/Dimlingtonvia SLR
0.0
0.5
1.0
1.5
2.0
2.5
3.0
2006 2007 2008 2009 2010
[mo
l%]
CO2 (WI High) CO2 (WI low) UK CO2 Spec NCS CO2 Spec
UK Max CO2
NCS Max CO2

5.2 Further Processing Further processing would require capital expenditure on a plant and ongoing operating costs. Based on assessment of potential projects an indicative cost has been estimated in the range of £0.5 to £1.0 million/year for an annual daily gas throughput capacity of 1 million sm3 (about 0.5p/therm). (This needs a capital cost estimate to be meaningful.)
5.3 Nitrogen Injection Nitrogen injection has been used in the past for compressing the Wobbe mdsc of gas. It has also been studied at a high level in connection with possible future LNG imports to the UK. It is potentially capital and operating cost intensive, a high level estimate of £0.3 million/year for an annual daily gas throughput capacity of one million sm3 has been estimated (about 0.25p/therm). Nitrogen injection can either be used on a continuous basis or intermittently (from storage for example). However it is not a favoured long term solution for Transco as it results in the requirement to transport greater volumes of gas around the network than would be necessary if the gas was not diluted. (As above – a capital cost estimate needs to be included.)
5.4 Specification Change The initial costs associated with challenging/changing specifications tend to be relatively low as this tends to be restricted to study work. In the event, however, that modifications were required to domestic appliances, costs could become enormous. It is understood that there are approximately 43 million domestic gas appliances in the UK. Early estimates suggest that an exercise as comprehensive as that carried out in the 1970s would run into billions of pounds, but until a survey has been carried out it is difficult to be precise. A scope of work is set out in Appendix E. On the positive side, a wider specification should ensure that gas can be brought in at a competitive price and hence there will also be a potential payback as well as cost.

6.0 OPTION RANKING
We have made a simple qualitative analysis, ranking each option against cost and security of supply. The aim of this exercise is to give an overall feel as to the ‘pros and cons’ of each option.
6.1 Wobbe, ICF & Soot Indexes Cost Security of Supply Blending Low Poor Processing Medium Neutral Specification Change
Low/High Good
Nitrogen Injection Medium Neutral
6.2 Ranking Conclusions It can be seen from the above ranking exercise that the most attractive option in terms of security of supply is to change the specifications, however until the true cost to the domestic customer can be verified and balanced against the potential reduction in supply cost it is difficult to conclude whether this would be the best overall option for Norwegian gas. The three other options: blending, processing and nitrogen injection, are similar, all having advantages and disadvantages. The Gassco system has great potential for blending and therefore we asked Gassco to carry out some blending analyses in order to establish how easily the UK specification could be achieved, in the short, medium and long term. Further processing at a receiving terminal obviously has a cost, although this may be offset by potential revenue from NGL’s created during the processing. However, Norwegian gas tends to be dry, offering only the potential for relatively low liquid yields and depending on the loading point delivering the NGL’s economically to an end user could be an issue. Continuous nitrogen injection offers the least elegant solution, as it is a potentially energy intensive process, however using nitrogen from storage as a back-up to blending may be of some merit.
7.0 GOVERNMENT POSITION In February 2003 the UK Government published an Energy White Paper (cm 5761), in which paragraph 6.21 states: “It is possible that gas imports from some sources, particularly LNG, will vary in energy content and may require blending with other gases in the system, special processing on import, or the modification of certain gas appliances. We will keep developments here closely under review. In particular we will monitor the likely effects on gas quality.” It is clear that the DTI has recognised the same issues identified by this workgroup with respect to Wobbe Index, ICF and SI. We met with the DTI to investigate if they have a compatible strategy with the results of this work. The DTI explained that they have recently held a meeting with Ofgem and the HSE. From the meeting they have agreed to work together on the following 2 stage exercise: Stage 1: Study to confirm whether the Wobbe number of imported gas is likely to increase. Stage 2 (contingent): Public consultation on: - the problem (compatibility of high Wobbe gas with certain appliances);
- the policy response (treat the gas or modify/remove the appliances). Timing – approximately one year Clearly the NCS Wobbe Index has the potential to be higher that the current UK specification and therefore this information should be fed into the exercise being initiated by the DTI. It is also believed that significant quantities of LNG available on the open market will have gas with a relatively high Wobbe index. Consequently we can anticipate that there is a high probability that Stage 2 will be initiated, noting the timescale of one year mentioned this would be compatible with the impact of significant additional volumes of gas from Norway to the UK.
8.0 CONCLUSIONS AND FORWARD ACTION PLAN
8.1 Conclusions This report identifies the potential areas of conflict between the UK and Norwegian gas specifications. As a result of the work completed by the sub-group we believe that we can draw the following conclusions. A forward action plan has also been identified, which is necessary before it will be possible to identify the final optimal solution. • Wobbe Index, ICF and SI are the main areas of concern.
• Norwegian gas has the potential to have a higher Wobbe Index than the UK Specification in the future.
• There are several ways of tackling the problem, o Blending o Further processing o Nitrogen Injection o Change the Specification
• There is a bigger UK picture as a result of the need to import gas from other sources
• A change in specification has the potential to be the most elegant solution but it is not possible to quantify the cost/benefit at this time.
• The UK DTI has recognised the specification issue and is working together with Ofgem and HSE.
8.2 Forward Action Plan
The following forward actions have been identified during this work: a) A scope of work to “challenge” the UK specifications has been prepared, this includes
potential costs and timescales of such a study and conclusions would result in a global cost estimate of the change-out or modification of domestic appliances (see Appendix E).
b) Follow up DTI, Ofgem and HSE initiative on specifications.
APPENDIX A – SUMMARY OF UK AND NORWEGIAN GAS SPECIFICATIONS
1. Gas Safety (Management) Regulations
The following is an extract from the Gas Safety (Management Regulations) 1996 which is applicable to any person conveying gas in the UK.
Content and other characteristics of gas
(1) No person shall, subject to paragraphs (2) to (4), convey gas in a network unless the
gas conforms with the requirements specified in Part I of Schedule 3. (2) The network emergency co-ordinator may, where it is necessary to prevent a supply
emergency and in accordance with the arrangements specified in his safety case pursuant to paragraph 3(d) of Schedule 2, authorise, for the period specified in the authorisation, gas not conforming with the requirements specified in Part I of Schedule 3 to be conveyed in the network if the gas conforms with the requirements specified in Part II of that Schedule.
(3) An authorisation under paragraph (2) may be given orally or in writing and may be
withdrawn at any time. (4) Where only one person conveys gas in a network, he may, where it is necessary to
prevent a supply emergency and in accordance with the arrangements specified in his safety case pursuant to paragraph 19 of Schedule I, convey gas which does not conform with the requirements specified in Part I of Schedule 3 if the gas conforms with the requirements specified in Part II of that Schedule.

SCHEDULE 3, Regulation 8
CONTENT AND OTHER CHARACTERISTICS OF GAS PART I
REQUIREMENTS UNDER NORMAL CONDITIONS
1. The content and characteristics of the gas shall be in accordance with the values specified
in the following table. Content or
characteristic Value
hydrogen sulphide content <=5 mg/m3
total sulphur content (including H2S) <=50 mg/m3
hydrogen content <=0.1% (molar)
oxygen content <=0.2% (molar)
impurities
shall not contain solid or liquid material which may interfere with the integrity or operation of pipes or any gas appliance (within the meaning of regulation 2(1) of the 1994 Regulations) which a consumer could reasonably be expected to operate
hydrocarbon dewpoint and water dewpoint
shall be at such levels that they do not interfere with the integrity or operation of pipes or any gas appliance (within the meaning of regulation 2(1) of the 1994 Regulations) which a consumer could reasonably be expected to operate
WN (i) <=51.41 MJ/m3, and (ii) >=47.20 MJ/m3
ICF <=0.48
SI <=0.60
2. The gas shall have been treated with a suitable stenching agent to ensure that it has a distinctive and characteristic odour which shall remain distinctive and characteristic when the gas is mixed with gas which has not been so treated, except that this paragraph shall not apply where the gas is at a pressure of above 7 barg.
3. The gas shall be at a suitable pressure to ensure the safe operation of any gas appliance (within the meaning of regulation 2(1) of the 1994 Regulations) which a consumer could reasonably be expected to operate.
4. (1) Expressions and the abbreviations used in this Part shall have the meanings assigned to them in Part III of this Schedule.
(2) ICF and SI shall be calculated in accordance with Part III of this Schedule.
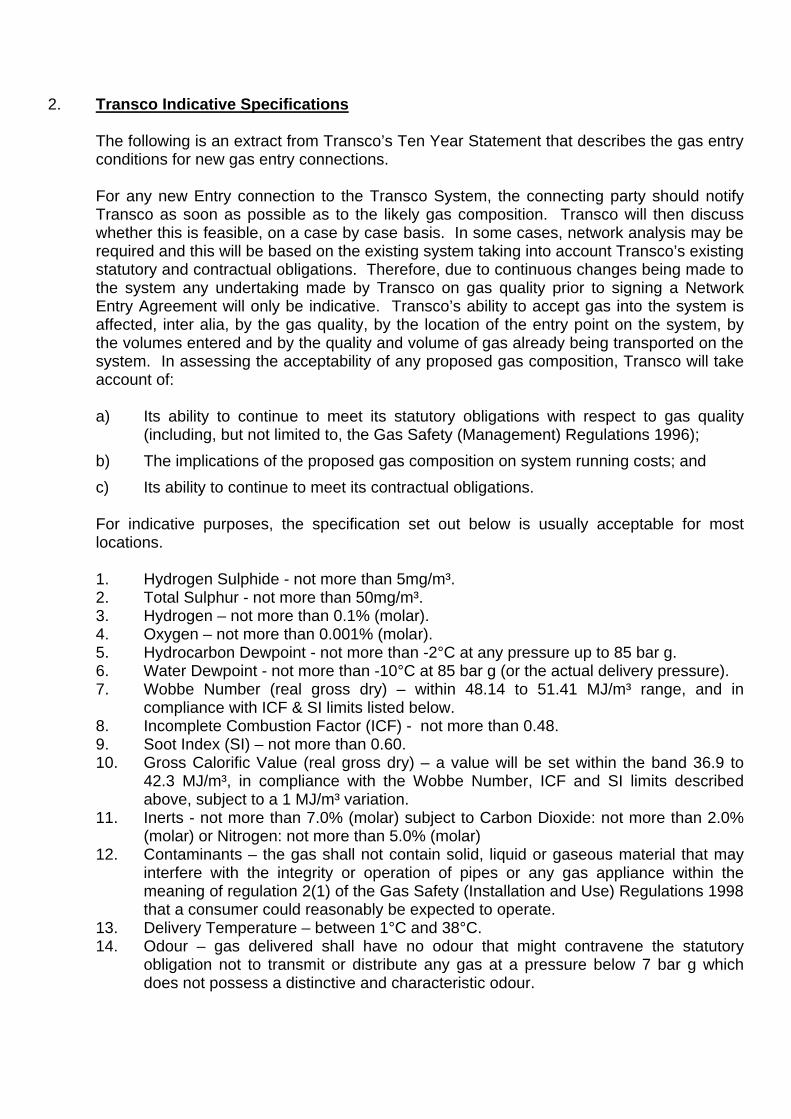
2. Transco Indicative Specifications
The following is an extract from Transco’s Ten Year Statement that describes the gas entry conditions for new gas entry connections. For any new Entry connection to the Transco System, the connecting party should notify Transco as soon as possible as to the likely gas composition. Transco will then discuss whether this is feasible, on a case by case basis. In some cases, network analysis may be required and this will be based on the existing system taking into account Transco’s existing statutory and contractual obligations. Therefore, due to continuous changes being made to the system any undertaking made by Transco on gas quality prior to signing a Network Entry Agreement will only be indicative. Transco’s ability to accept gas into the system is affected, inter alia, by the gas quality, by the location of the entry point on the system, by the volumes entered and by the quality and volume of gas already being transported on the system. In assessing the acceptability of any proposed gas composition, Transco will take account of: a) Its ability to continue to meet its statutory obligations with respect to gas quality
(including, but not limited to, the Gas Safety (Management) Regulations 1996);
b) The implications of the proposed gas composition on system running costs; and
c) Its ability to continue to meet its contractual obligations. For indicative purposes, the specification set out below is usually acceptable for most locations.
1. Hydrogen Sulphide - not more than 5mg/m³. 2. Total Sulphur - not more than 50mg/m³. 3. Hydrogen – not more than 0.1% (molar). 4. Oxygen – not more than 0.001% (molar). 5. Hydrocarbon Dewpoint - not more than -2°C at any pressure up to 85 bar g. 6. Water Dewpoint - not more than -10°C at 85 bar g (or the actual delivery pressure). 7. Wobbe Number (real gross dry) – within 48.14 to 51.41 MJ/m³ range, and in
compliance with ICF & SI limits listed below. 8. Incomplete Combustion Factor (ICF) - not more than 0.48. 9. Soot Index (SI) – not more than 0.60. 10. Gross Calorific Value (real gross dry) – a value will be set within the band 36.9 to
42.3 MJ/m³, in compliance with the Wobbe Number, ICF and SI limits described above, subject to a 1 MJ/m³ variation.
11. Inerts - not more than 7.0% (molar) subject to Carbon Dioxide: not more than 2.0% (molar) or Nitrogen: not more than 5.0% (molar)
12. Contaminants – the gas shall not contain solid, liquid or gaseous material that may interfere with the integrity or operation of pipes or any gas appliance within the meaning of regulation 2(1) of the Gas Safety (Installation and Use) Regulations 1998 that a consumer could reasonably be expected to operate.
13. Delivery Temperature – between 1°C and 38°C. 14. Odour – gas delivered shall have no odour that might contravene the statutory
obligation not to transmit or distribute any gas at a pressure below 7 bar g which does not possess a distinctive and characteristic odour.

APPENDIX B – GASSCO PRESENTATION ‘Gas Quality Coming from the NCS to UK’
North Sea CooperationGas & Infrastructure Work Group
Presentation to the UK and Norwegian Work groups
Stavanger March 20th
Recommendation 8- Gas quality coming from the NCS to UK

Introduction
North Sea CooperationGas & Infrastructure Work Group
Norwegian Work Group
Recommendation 7NTS charges and
Auction system
Recommendation 8Gas Specifications
Recommendation 11Code of Practice
Sub - GroupDefine Scenarios
for the gas quality coming from NCS to UK
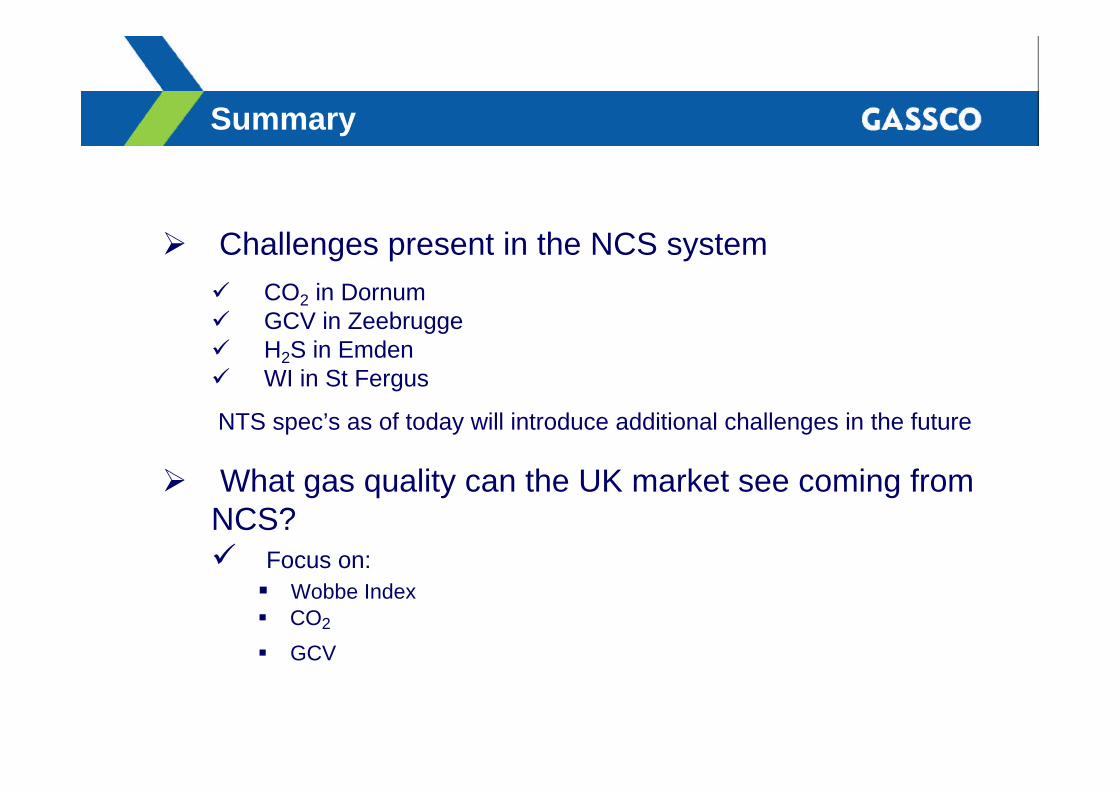
Summary
Ø Challenges present in the NCS systemü CO2 in Dornum ü GCV in Zeebruggeü H2S in Emden ü WI in St Fergus
NTS spec’s as of today will introduce additional challenges in the future
Ø What gas quality can the UK market see coming from NCS?ü Focus on:§ Wobbe Index§ CO2
§ GCV
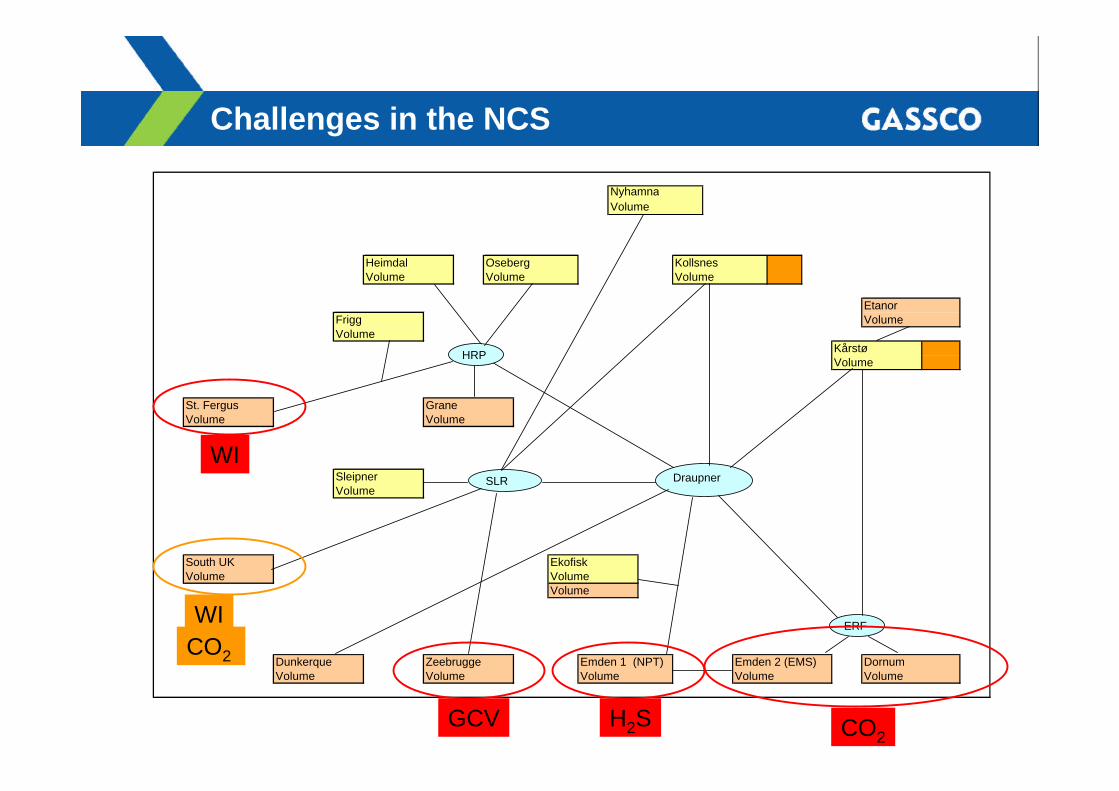
Challenges in the NCS
NyhamnaVolume
Heimdal Oseberg KollsnesVolume Volume Volume
EtanorFrigg VolumeVolume
KårstøVolume
St. Fergus GraneVolume Volume
SleipnerVolume
South UK EkofiskVolume Volume
Volume
Dunkerque Zeebrugge Emden 1 (NPT) Emden 2 (EMS) DornumVolume Volume Volume Volume Volume
ERF
DraupnerSLR
HRP
CO2H2SGCV
WI
WICO2

Assumptions
Ø Dedicated pipeline from NCS to Easington/Dimlington in 2006
Ø Sleipner as tie–in node for Ormen Lange (2007) and starting point for the new pipeline to UK
Ø Volumes and qualities are taken from the input submitted to Gassco by Shippers in the NCS systems for the annual Gas Transport Infrastructure Development Plan conducted in 2002

Sources to UK
SLR
Sleipner
KollsnesOrmen Lange
Easington/-Dimlington
WI
CO2
HRP
Huldra
Draupner
Oseberg
St Fergus
WI
CO2
Grane
New Pipeline to Easington/Dimlington Vesterled

Wobbe Index - Fields
New pipeline to Easington/Dimlington and VesterledWobbe Index
47.00
48.00
49.00
50.00
51.00
52.00
53.00
54.00
1 2 3 4 5 6 7 8 9 10 11 12 13 14 15 16
[MJ/
Sm
³]
NCS max WI UK max WI NCS min WI UK min WI WI High WI
New Southern Pipeline Vesterled
NCS Max WI
NCS Min WI
UK Max WI
UK Min WI
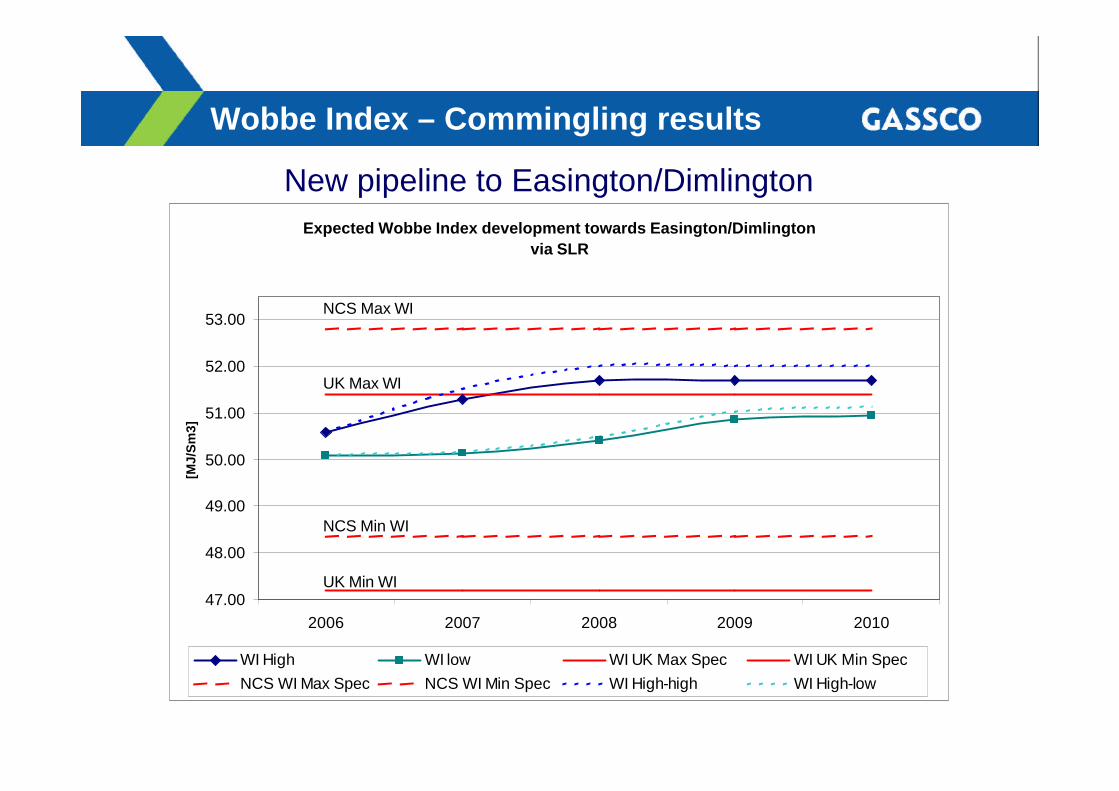
Wobbe Index – Commingling results
New pipeline to Easington/DimlingtonExpected Wobbe Index development towards Easington/Dimlington
via SLR
47.00
48.00
49.00
50.00
51.00
52.00
53.00
2006 2007 2008 2009 2010
[MJ/
Sm
3]
WI High WI low WI UK Max Spec WI UK Min SpecNCS WI Max Spec NCS WI Min Spec WI High-high WI High-low
NCS Min WI
NCS Max WI
UK Min WI
UK Max WI
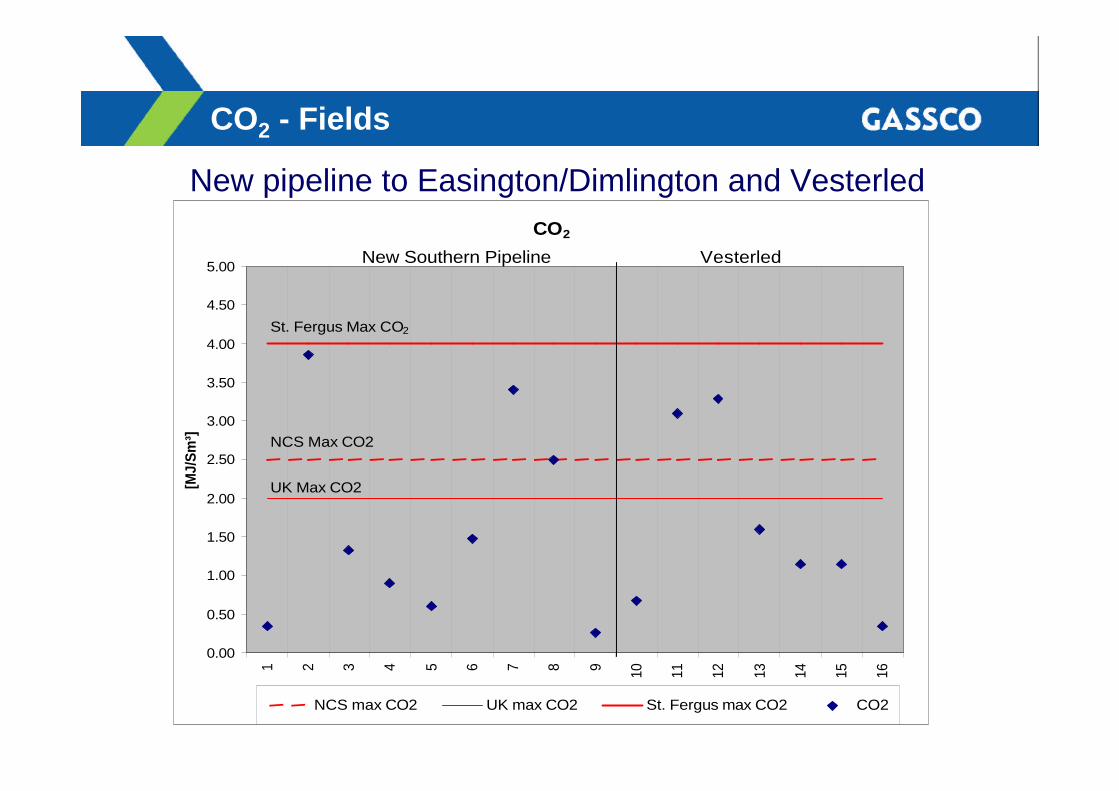
CO2 - Fields
New pipeline to Easington/Dimlington and VesterledCO2
0.00
0.50
1.00
1.50
2.00
2.50
3.00
3.50
4.00
4.50
5.001 2 3 4 5 6 7 8 9 10 11 12 13 14 15 16
[MJ/
Sm
³]
NCS max CO2 UK max CO2 St. Fergus max CO2 CO2
New Southern Pipeline Vesterled
St. Fergus Max CO2
UK Max CO2
NCS Max CO2
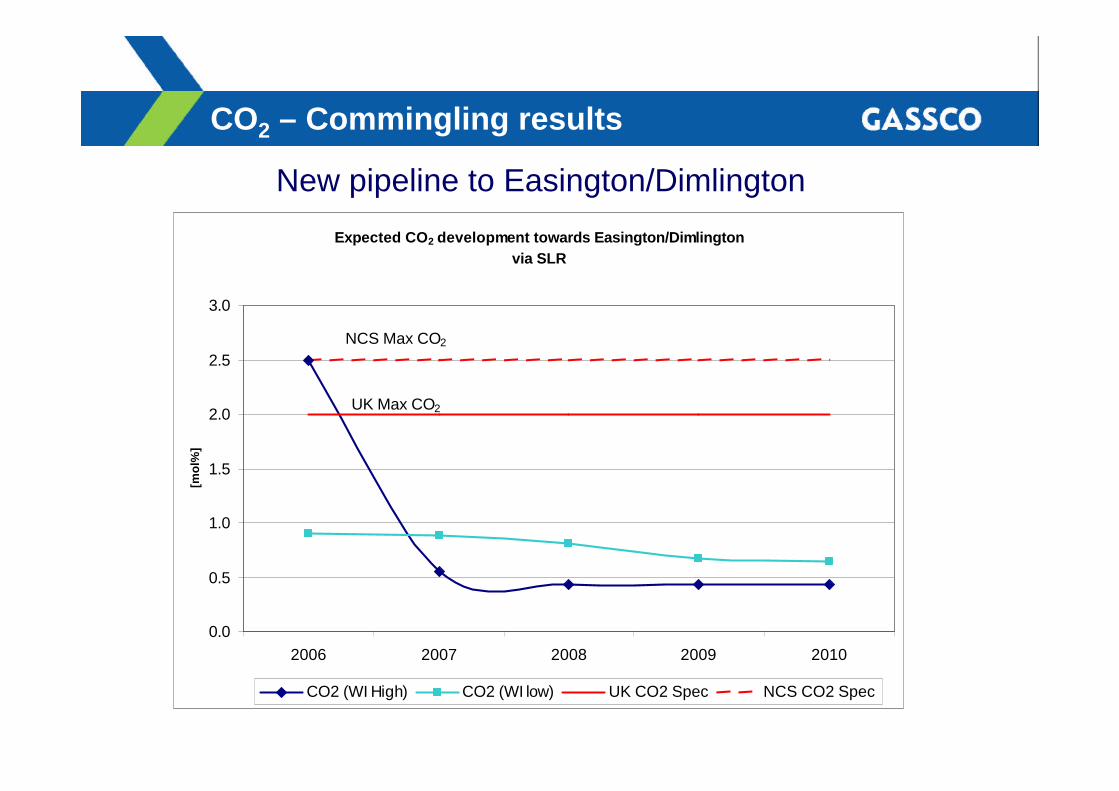
CO2 – Commingling results
New pipeline to Easington/Dimlington
Expected CO2 development towards Easington/Dimlingtonvia SLR
0.0
0.5
1.0
1.5
2.0
2.5
3.0
2006 2007 2008 2009 2010
[mo
l%]
CO2 (WI High) CO2 (WI low) UK CO2 Spec NCS CO2 Spec
UK Max CO2
NCS Max CO2

GCV - Fields
New pipeline to Easington/Dimlington and Vesterled
Gross Calorific Value (GCV)
36.00
37.00
38.00
39.00
40.00
41.00
42.00
43.00
44.00
45.001 2 3 4 5 6 7 8 9 10 11 12 13 14 15 16
[MJ/
Sm
³]
NCS max GCV UK max GCV NCS min GCVUK min GCV GCV
New Southern Pipeline Vesterled
NCS Max GCV
NCS Min GCV
UK Max GCV
UK Min GCV
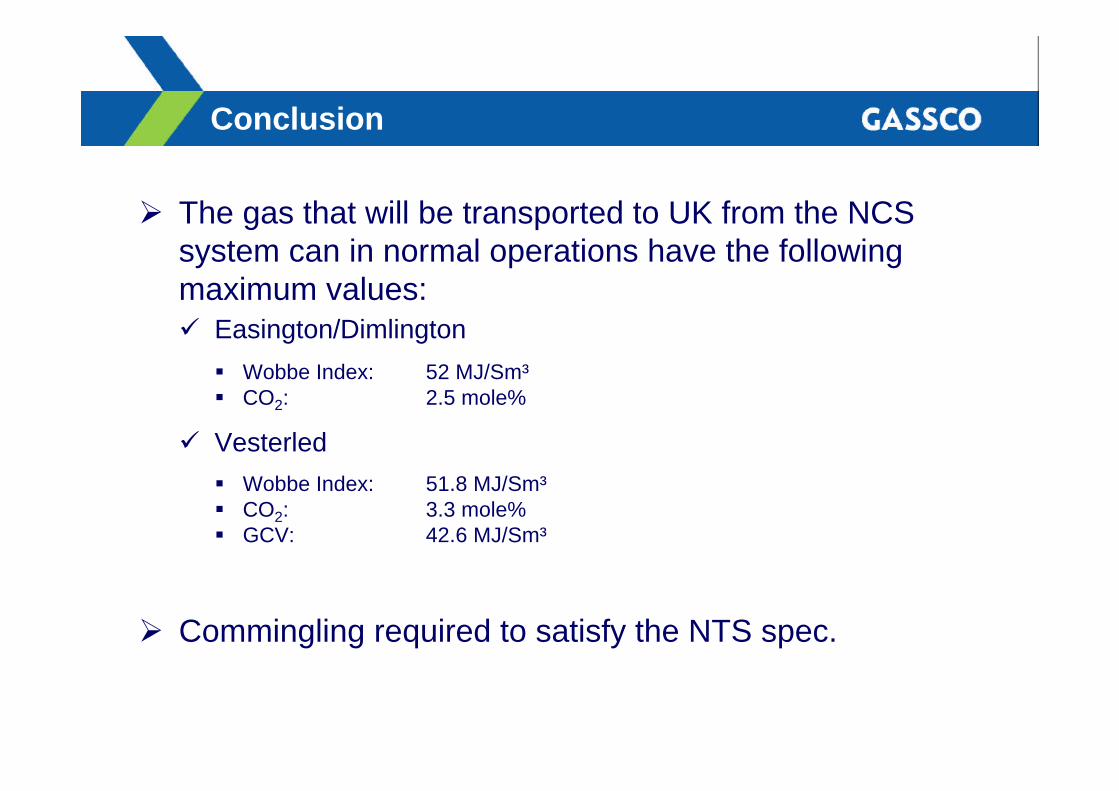
Conclusion
Ø The gas that will be transported to UK from the NCS system can in normal operations have the following maximum values:ü Easington/Dimlington
§ Wobbe Index: 52 MJ/Sm³§ CO2: 2.5 mole%
ü Vesterled§ Wobbe Index: 51.8 MJ/Sm³§ CO2: 3.3 mole%§ GCV: 42.6 MJ/Sm³
Ø Commingling required to satisfy the NTS spec.
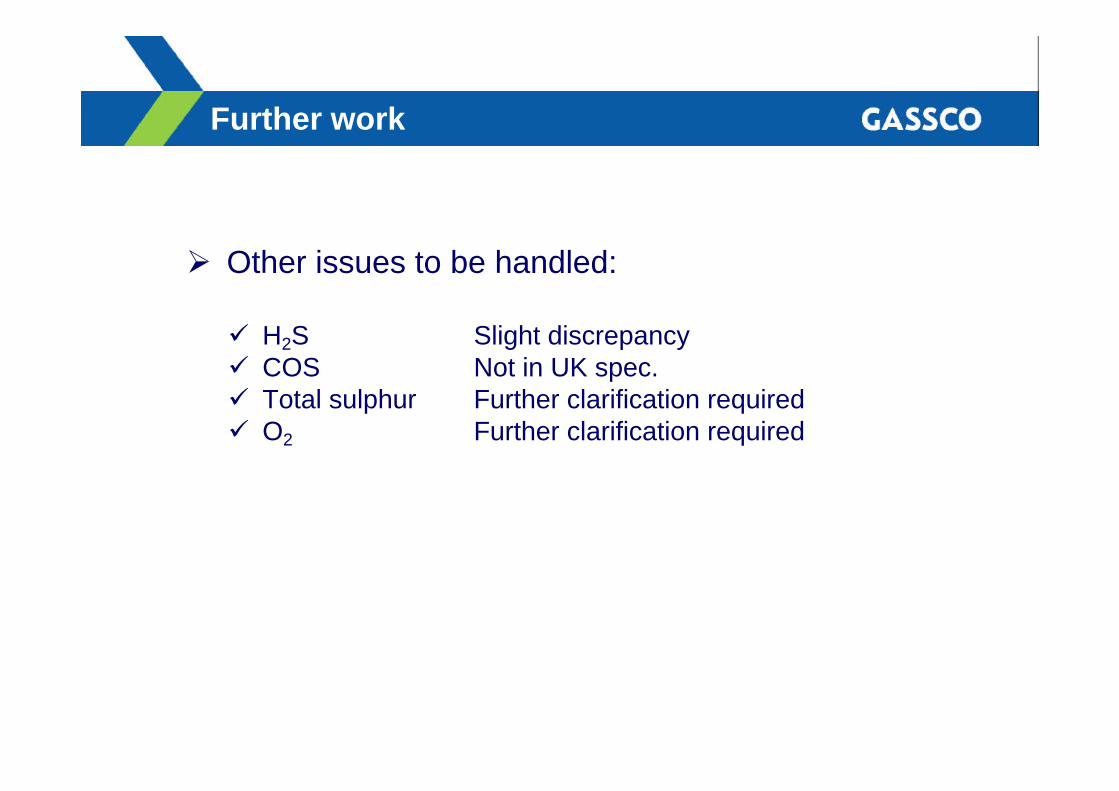
Further work
Ø Other issues to be handled:
ü H2S Slight discrepancy ü COS Not in UK spec. ü Total sulphur Further clarification required ü O2 Further clarification required

APPENDIX C – POWERPOINT PRESENTATION
SPECIFICATIONS Sub-Group
Gas & Infrastructure Action Group
UK/Norway Co-operation Implementation Group

Unlocking Value ThroughCloser Relationships
“Promote the need for improved compatibility of UK, Norwegian and continental gas sales specifications by dialogue between respective Ministries and stakeholders.”
Workgroup Recommendation Nr. 8

Contents
• Process
• Comparison between UK and Norwegian specifications
• Can the UK specifications be amended?
• How can we achieve compliance
• Costs/ranking
• UK Government position
• Conclusions/Forward action plan

Process• Participation
- Conoco Phillips UK Mike Wade- Shell UK David Elmes- TotalFinaElf UK David Hainsworth- Transco UK Jonathan Maughan
• Review and Analysis- Comparison of UK and Norwegian Specifications- Highlight the differences- Establish if/how UK specs may be changed- How could NCS gas meet UK specs?- Brief cost/ranking exercise- Look at the bigger picture- Conclusions/Forward actions

Objectives
• Evaluate whether the UK gas quality specs may restrict/hider the supply of Norwegian gas to the UK market.
• Establish the best option to allow significantly extra volumes of Norwegian gas to reach the UK market whilst respecting the prevailing gas quality specifications.
• Look for an approach that will also be compatible with other supply sources.

Comparison between UK and Norwegian specs
Process• GS(M)R
– The law– Safety
• Transco indicative specs– Compliance with the Law– Other limitations
Issues• Transco have some flexibility with specs not included
in GS(M)R, subject to ‘Network Analysis’

Areas of potential difference between UK and Norwegian specs
• Gross calorific value (GCV)• CO2
• Wobbe Index• Incomplete Combustion Factor (ICF) and Soot Index
(SI)
Issues• Some or all of these topics may or may not be an
issue for Norway depending on gas availability

GASSCO Plot of Various Gases which may be exported to the UK against WI
Wobbe Index
47.00
48.00
49.00
50.00
51.00
52.00
53.00
54.00
1 2 3 4 5 6 7 8 9 10 11 12 13 14 15 16
[MJ/
Sm
³]
NCS max WI UK max WI NCS min WI UK min WI WI High WI
New Southern Pipeline Vesterled
NCS Max WI
NCS Min WI
UK Max WI
UK Min WI
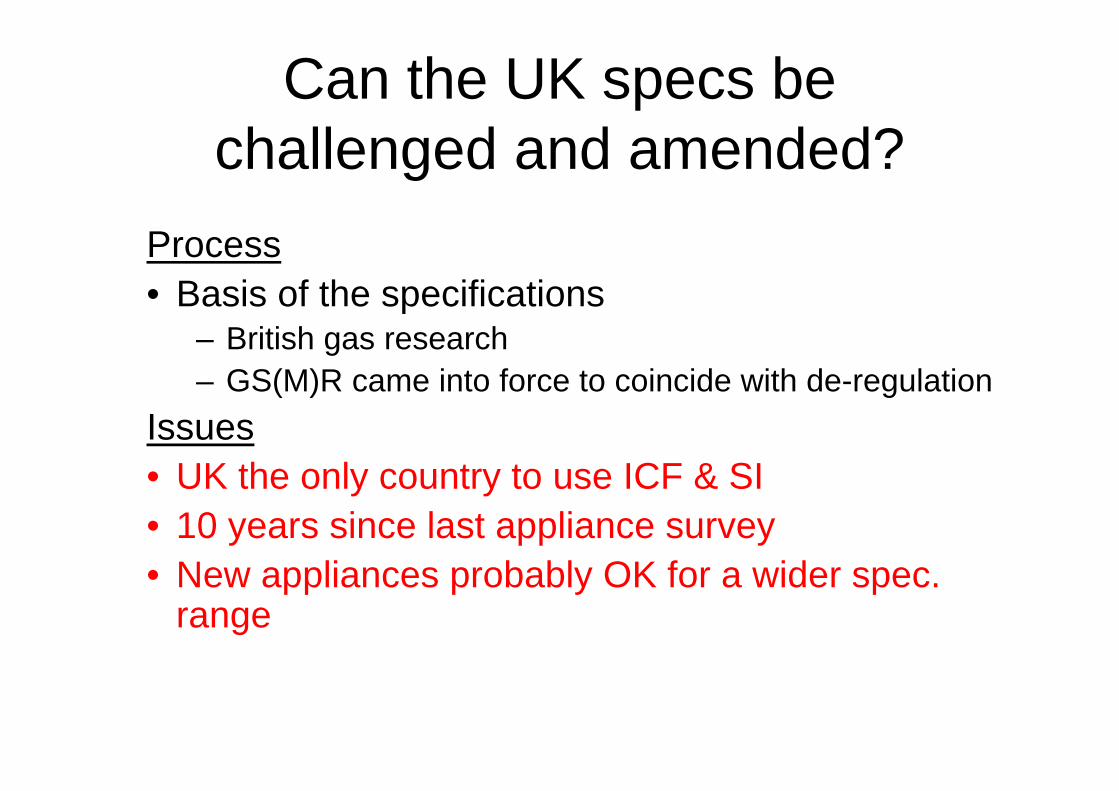
Can the UK specs be challenged and amended?
Process• Basis of the specifications
– British gas research– GS(M)R came into force to coincide with de-regulation
Issues• UK the only country to use ICF & SI• 10 years since last appliance survey• New appliances probably OK for a wider spec.
range

GASSCO Plot showing Likely Range of WI over Time for Gas Deliveries to Easington
Expected Wobbe Index development towards Easington/Dimlingtonvia SLR
47.00
48.00
49.00
50.00
51.00
52.00
53.00
2006 2007 2008 2009 2010
[MJ/
Sm
3]
WI High WI low WI UK Max Spec WI UK Min SpecNCS WI Max Spec NCS WI Min Spec WI High-high WI High-low
NCS Min WI
NCS Max WI
UK Min WI
UK Max WI

How could NCS gas achieve/comply with UK specs?• Blending
• Further processing
• Nitrogen injection
• CO2 removal
Issues
• Costs
• Nitrogen dilution
• What is the bigger picture?

Global cost estimates/Ranking
• Blending, virtually zero cost
• Further processing, 0.5p/therm
• Nitrogen injection, 0.25p/therm
• Challenge the specifications– Small cost, unless you have to change/modify
appliances, then potentially large– Cost difficult to estimate at this time

Ranking
Process• Security of supply • Cost
Results
1. Specification change best for security of supply
2. Too early to say what overall cost of specification change will be
3. Blending is the lowest cost option but raises issues on Security of Supply
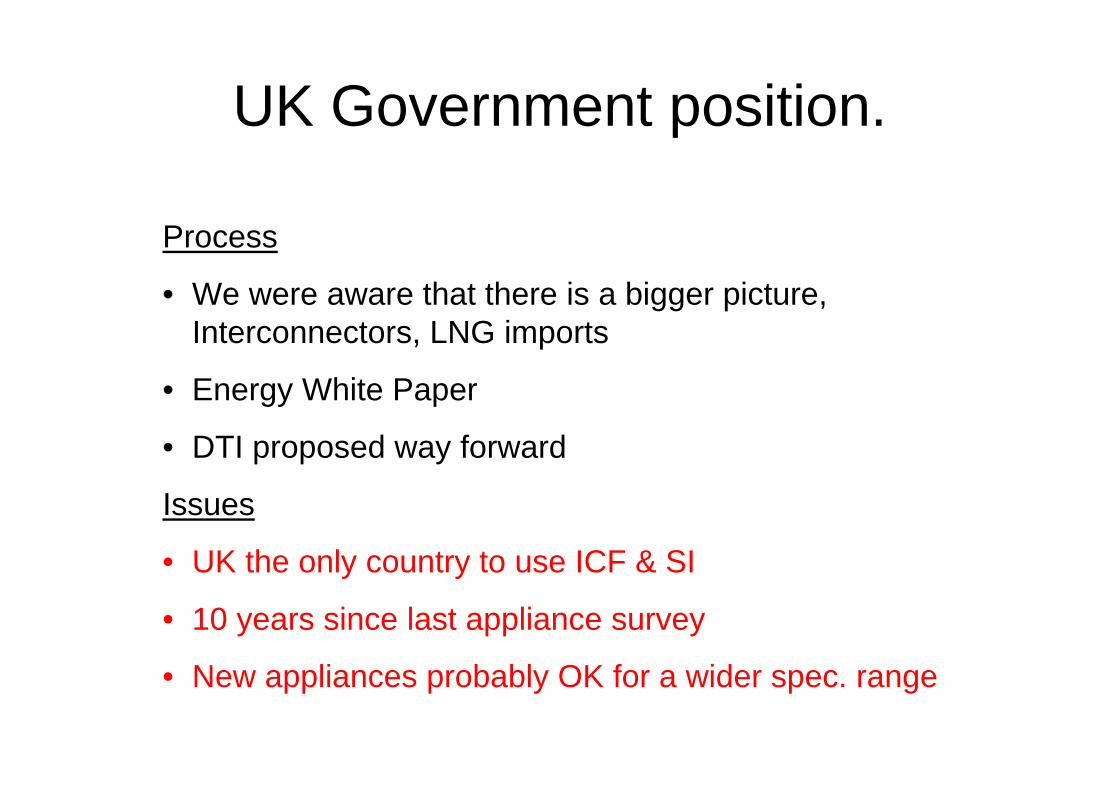
UK Government position.
Process
• We were aware that there is a bigger picture, Interconnectors, LNG imports
• Energy White Paper
• DTI proposed way forward
Issues
• UK the only country to use ICF & SI
• 10 years since last appliance survey
• New appliances probably OK for a wider spec. range

Conclusions
• Wobbe Index, ICF and SI are the main concern
• Norwegian gas has the potential for a higher Wobbe than the current UK Spec.
• There are several methods for tackling the problem
• There is a ‘bigger picture’ due to the need for alternative gas import sources
• DTI, Ofgem have recognised this
• Difficult to quantify at this time the potential cost of a specification change

Forward action plan
• Scope of work established to ‘challenge’UK Specs, agree with other stakeholders?
• Follow-up DTI, Ofgem, HSE initiative
• Lobby DTI for a meeting of all stakeholders to clarify strategy, timetable, deliverables, etc

APPENDIX D – ADVANTICA PRESENTATION
UK Situation Regarding Gas Quality
Presentation to the Marcogaz Gas Quality WGDave Lander28th June 2002

Overview
§ Gas (Calculation of Thermal Energy) Regulations§ Calorific Value measurement§ Customer billing§ Policed by OfGem
§ Gas Safety (Management) Regulations§ Content and characteristics of gas§ Network entry§ Policed by Health and Safety Executive
§ Legacy Agreements inherited by Transco§ British Gas Corporation
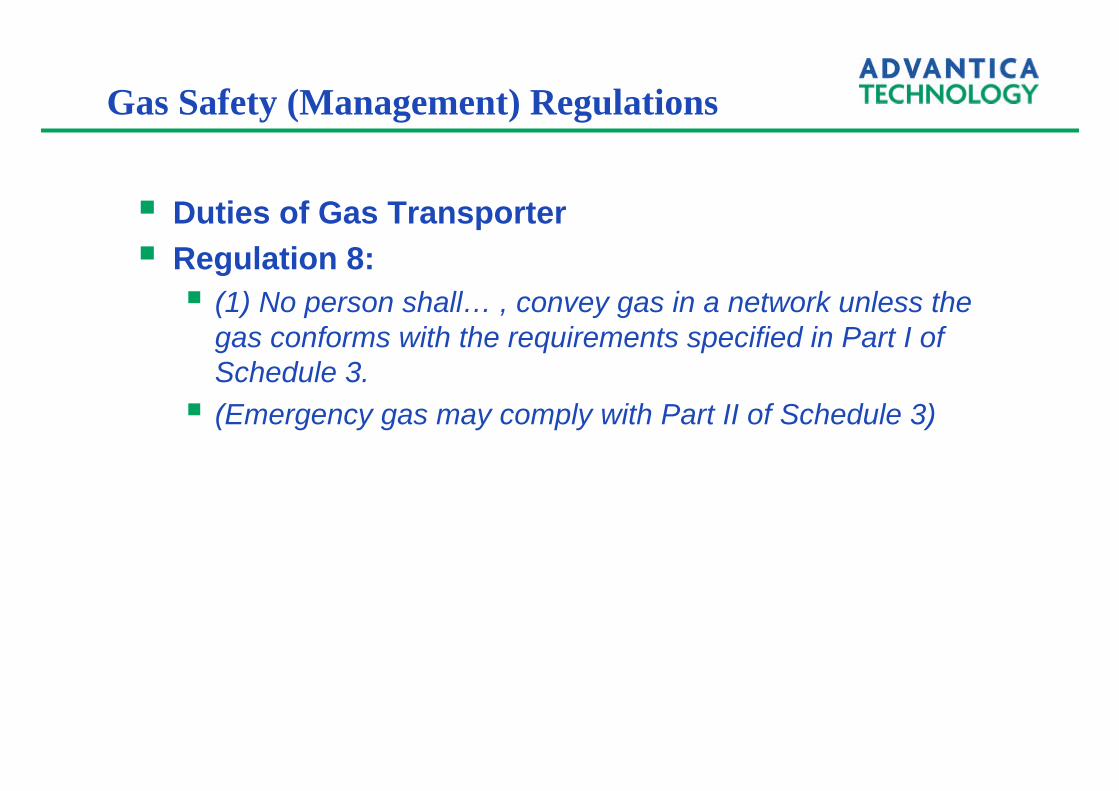
Gas Safety (Management) Regulations
§ Duties of Gas Transporter§ Regulation 8:§ (1) No person shall… , convey gas in a network unless the
gas conforms with the requirements specified in Part I of Schedule 3.§ (Emergency gas may comply with Part II of Schedule 3)

Schedule 3: Content and characteristics
§ Hydrogen sulphide content§ </= 5mg/m³
§ Total sulphur content (including H2S)§ </=50 mg/m³
§ Hydrogen content§ </=0.1 mol%
§ Oxygen content§ </=0.2 mol%
§ Impurities§ Shall not contain solid or liquid material which may interfere
with the integrity or operation of pipes or any gas appliance …which a customer could reasonably be expected to operate
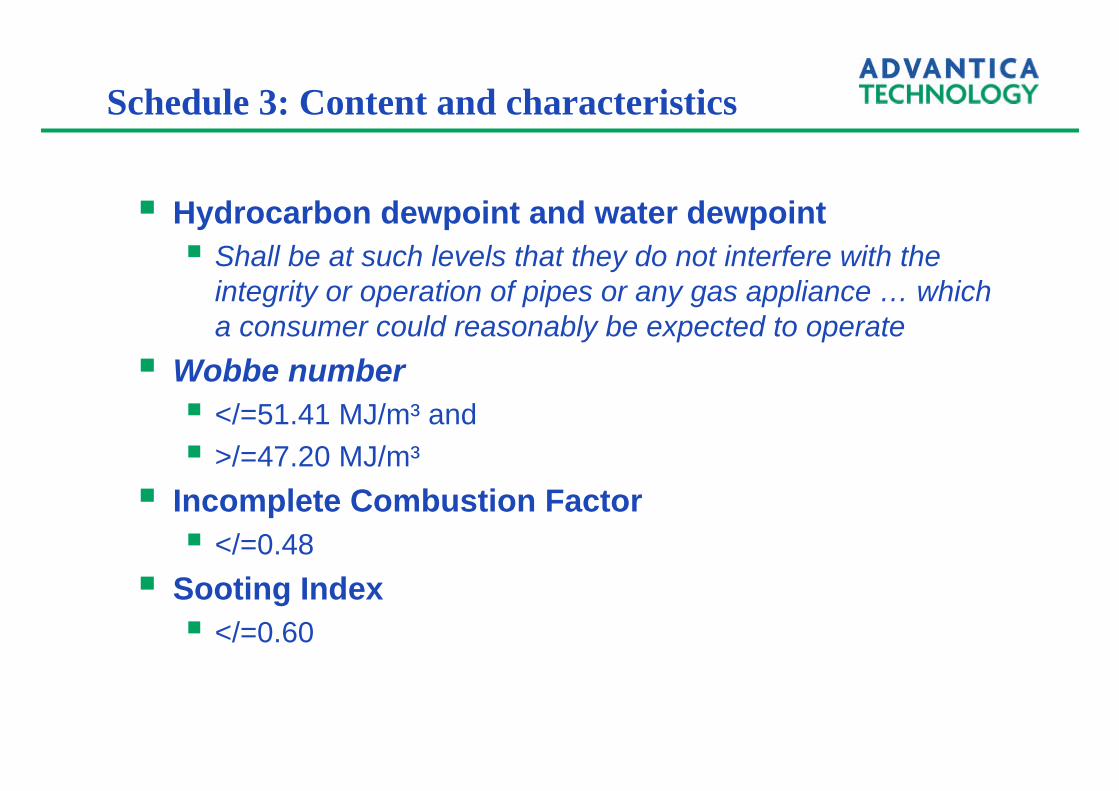
Schedule 3: Content and characteristics
§ Hydrocarbon dewpoint and water dewpoint§ Shall be at such levels that they do not interfere with the
integrity or operation of pipes or any gas appliance … which a consumer could reasonably be expected to operate
§ Wobbe number§ </=51.41 MJ/m³ and§ >/=47.20 MJ/m³
§ Incomplete Combustion Factor§ </=0.48
§ Sooting Index§ </=0.60

Schedule 3: Content and characteristics
§ Odorant§ The gas shall have been treated with a suitable stenching
agent to ensure that it has a distinctive and characteristic odour which shall remain distinctive and characteristic when the gas is mixed with gas which has not so been treated, except that this paragraph shall not apply where the gas is at a pressure of above 7 barg.

Legacy Agreements
§ Inherited from British Gas at privatisation§ Specific to producer/source field§ Summer “relaxation” of water and hydrocarbon
dewpoint§ Hydrocarbon dewpoint could be as high as 10oC, normally
–2oC§ Water dewpoint (crycondentherm) could be as high as 4.4oC
§ Interconnector has adopted a hydrocarbon dew temperature limit of –2oC§ Requires gas transporter to use the network to blend gases
from different sources

UK Specific Gas Quality Parameters
Presentation to the Marcogaz Gas Quality WGDave Lander28th June 2002 (Revised 13th February 2003)

Overview
§ Context§ British Gas Corporation’s approach§ Method of Dutton
§ Privatisation§ Gas Safety (Management) Regulations§ Gas Interchangeability Diagram
Context
§ 1970s, 1980s§ Southern North Sea fields§ anticipated decline§ replaced by other sources (different, more variable)§ eventually manufactured SNGs
§ Drivers for interchangeability method§ Safety - domestic appliances have limited tolerance to
variation in combustion characteristics§ Commercial – reduced gas treatment costs

British Gas Corporation’s approach
§ Dutton § Watson House, Research and
Development Division§ IGE Communication 1246 (1984)

Dutton’s method
§ Tailored to natural gases§ Testing was wide-ranging§ Gases expected to be supplemented by SNG§ Test gases contained hydrogen, carbon monoxide and
alkenes
§ New Approach§ Appliance effects and flame phenomena related to gas
composition§ Previous approach related to calculated functions (usually
related to burning velocity)§ Consistent with developments in gas analysis

Equivalent Composition
§ Gas regarded as:§ methane§ other hydrocarbons§ hydrogen§ inerts
§ Equivalent composition:§ hydrocarbons expressed as an equivalent amount of a
standard hydrocarbon§ inerts expressed as an equivalent amount of a standard inert
§ Results expressed as a 3-dimensional diagram

The higher hydrocarbon group
§ Hydrocarbons other than methane§ Equivalent gas is mixture of methane and propane§ Same ideal volume§ Same average number of carbon atoms per molecule
2C2H6 = C3H8 + CH42C4H10 + CH4 = 3C3H8

Equivalence factors - hydrocarbons
1.5-0.5butene1.0propene2.5-1.5hexane2.0-1.0pentane1.5-0.5butane1.0propane0.50.5ethane
1.0methaneC3H8’CH4’Gas
Equivalent

The inert group
§ Nitrogen is the standard inert§ Equivalent nitrogen§ that amount which, when mixed with all of the non-inert
components, gives a mixture with the same Wobbe number as the original mixture

The 3-dimensional diagram
§ Y-axis: Wobbe number§ X-axis: propane+nitrogen of the equivalent gas§ (Z-axis: hydrogen content)
0
10
20
30
40
50
60
70
80
90
0 20 40 60 80 100
propane + nitrogen, mol%
Wo
bb
e n
um
ber
, MJ/
m3
propane/methane
nitrogen/methane
§ Appliance performance§ plotted as indices§ experimentally-derived

Appliance Malfunction
§ Experimentally determined indices§ Real appliances, not test burners
§ Empirical relationships§ Choose one value of each index to be limiting§ Limits: normal, emergency, extreme emergency§ Indices:§ Lift index§ Incomplete combustion factor§ Soot index§ Light back (not studied – deferred until hydrogen containing
gases distributed)
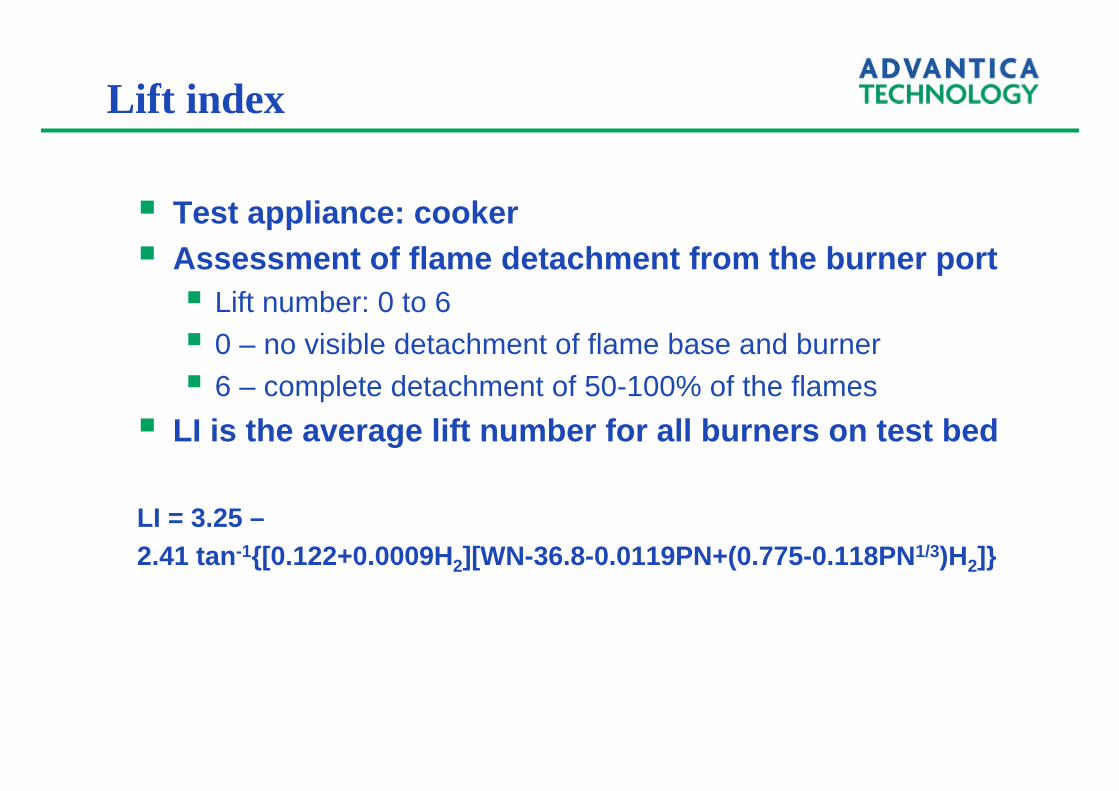
Lift index
§ Test appliance: cooker§ Assessment of flame detachment from the burner port§ Lift number: 0 to 6§ 0 – no visible detachment of flame base and burner§ 6 – complete detachment of 50-100% of the flames
§ LI is the average lift number for all burners on test bed
LI = 3.25 –2.41 tan-1{[0.122+0.0009H2][WN-36.8-0.0119PN+(0.775-0.118PN1/3)H2]}

Incomplete combustion factor
§ Test appliance: instantaneous water heater§ Plot CO/CO2 ratio against appliance heat input§ Average separation between test gas curve and that of
reference gas (methane)§ ICF is number of times the CO/CO2 ratio of the
reference gas has to be doubled to give that of the test gas.
ICF = [WN-50.73+0.03PN]/1.56 – 0.01H2
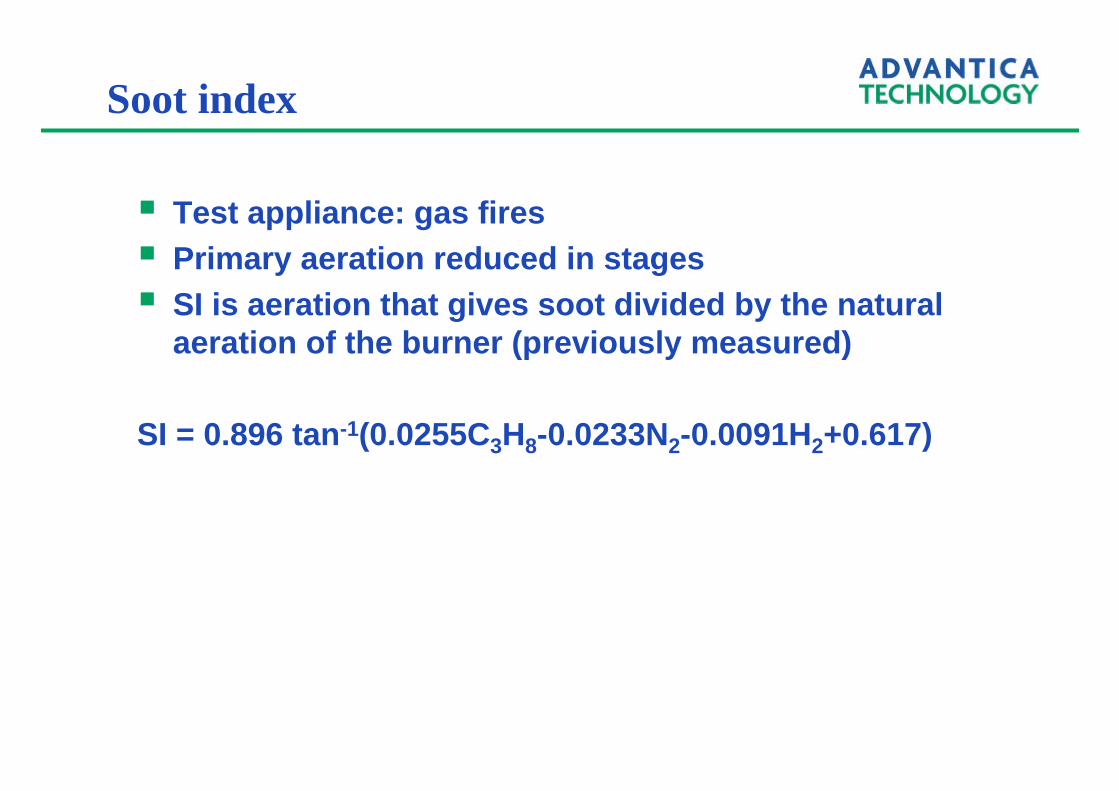
Soot index
§ Test appliance: gas fires§ Primary aeration reduced in stages§ SI is aeration that gives soot divided by the natural
aeration of the burner (previously measured)
SI = 0.896 tan-1(0.0255C3H8-0.0233N2-0.0091H2+0.617)

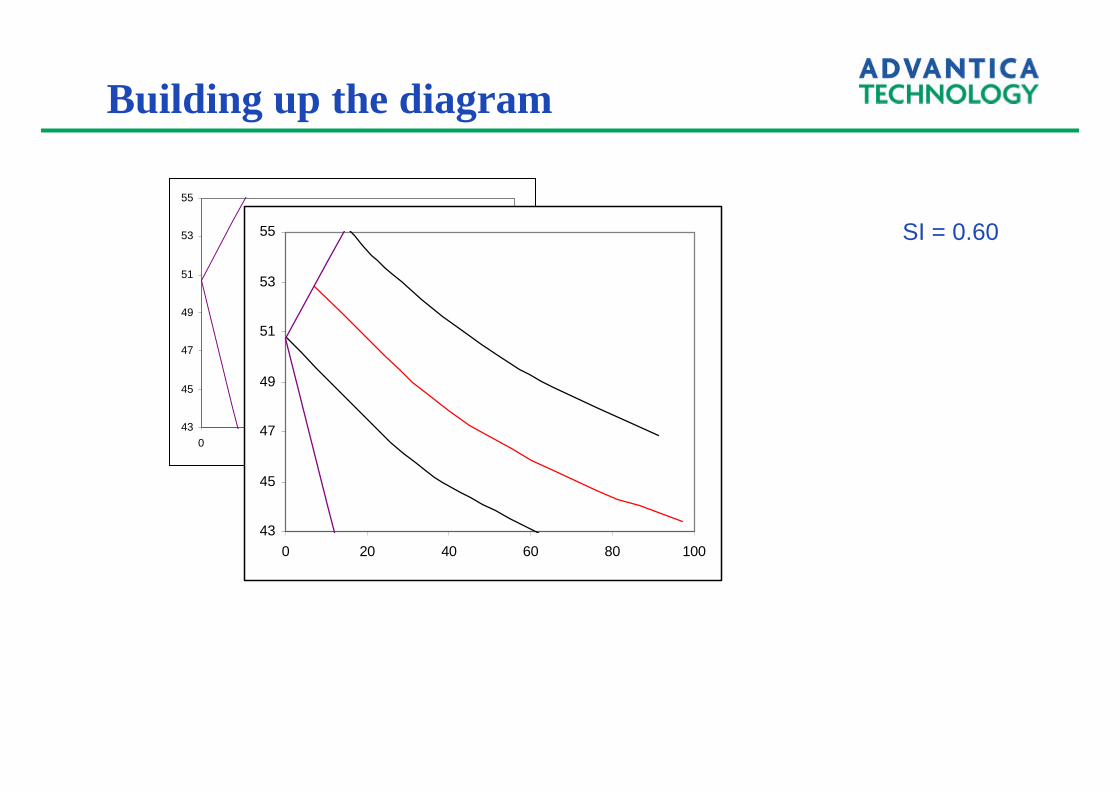
Building up the diagram
43
45
47
49
51
53
55
0 20 40 60 80 100
propane/methane
nitrogen/methane
Building up the diagram
43
45
47
49
51
53
55
0 20 40 60 80 100
43
45
47
49
51
53
55
0 20 40 60 80 100
SI = 0.60

Building up the diagram
43
45
47
49
51
53
55
0 20 40 60 80 10043
45
47
49
51
53
55
0 20 40 60 80 100
43
45
47
49
51
53
55
0 20 40 60 80 100
ICF=0.48

Building up the diagram
43
45
47
49
51
53
55
0 20 40 60 80 10043
45
47
49
51
53
55
0 20 40 60 80 10043
45
47
49
51
53
55
0 20 40 60 80 100
43
45
47
49
51
53
55
0 20 40 60 80 100
Heat Service Limit

Dutton’s Diagram
43
45
47
49
51
53
55
0 20 40 60 80 100
Normal Limits
Emergency Limits
Extreme emergency Limits

Interchangeability volume
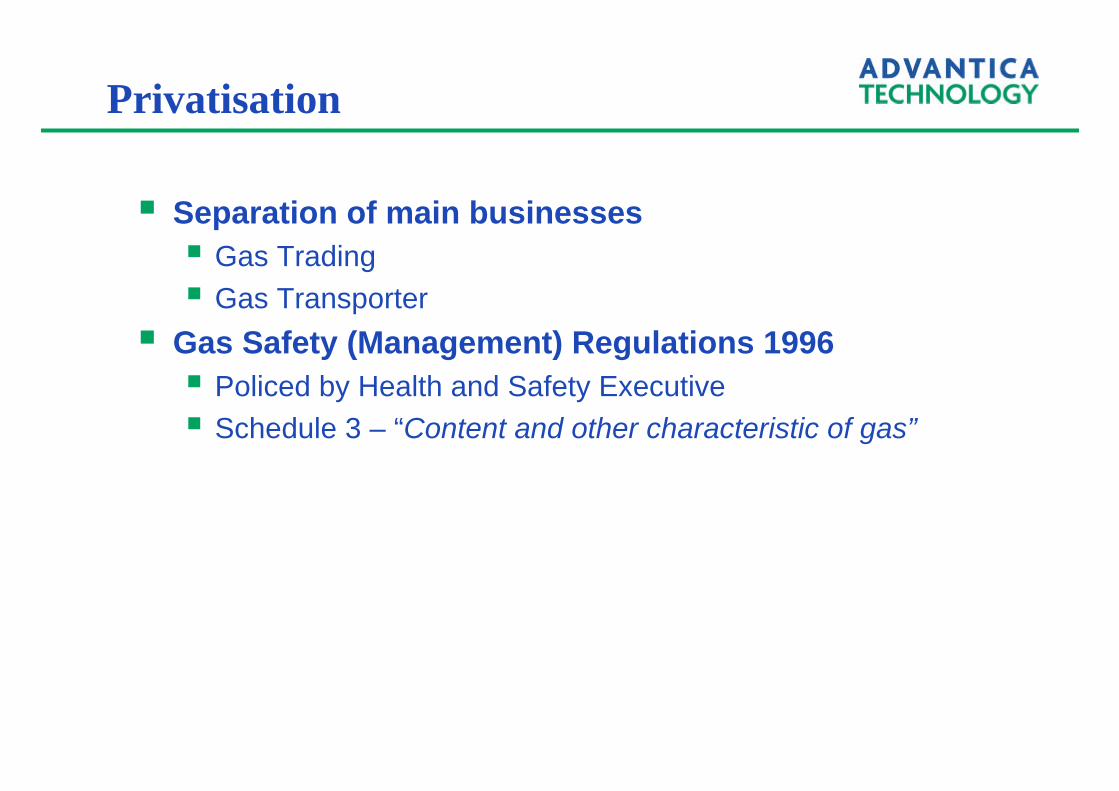
Privatisation
§ Separation of main businesses§ Gas Trading§ Gas Transporter
§ Gas Safety (Management) Regulations 1996§ Policed by Health and Safety Executive§ Schedule 3 – “Content and other characteristic of gas”
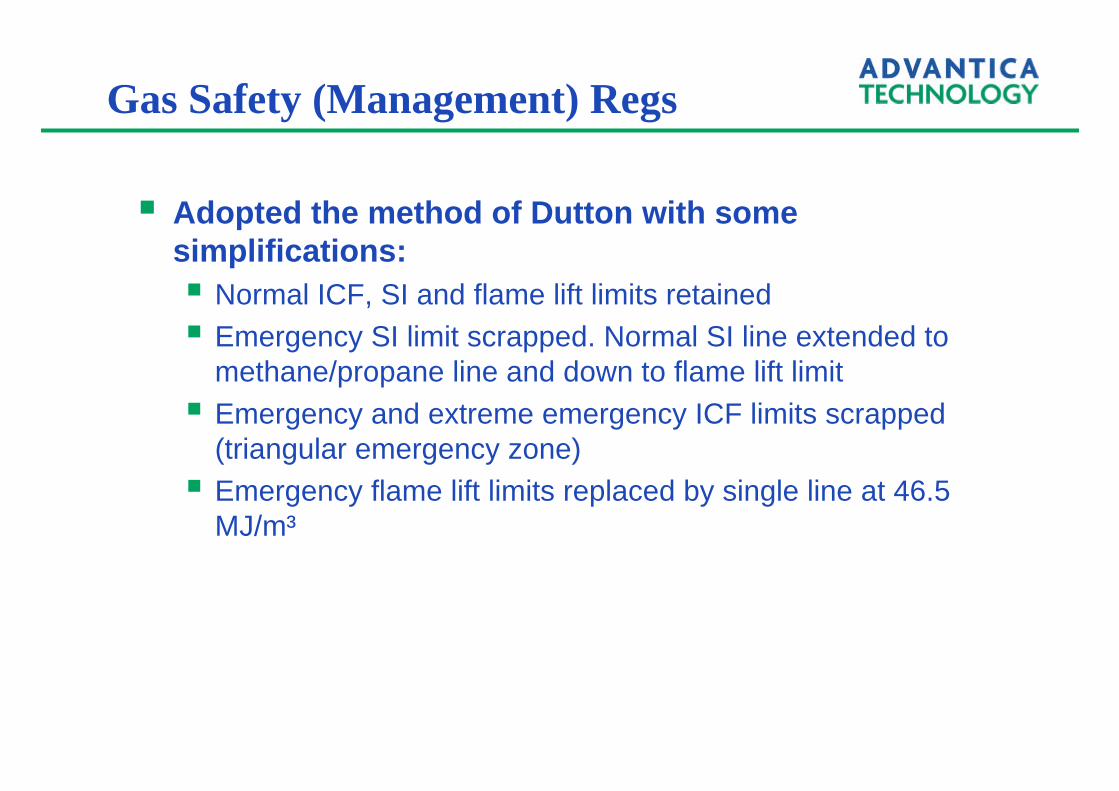
Gas Safety (Management) Regs
§ Adopted the method of Dutton with some simplifications:§ Normal ICF, SI and flame lift limits retained§ Emergency SI limit scrapped. Normal SI line extended to
methane/propane line and down to flame lift limit§ Emergency and extreme emergency ICF limits scrapped
(triangular emergency zone)§ Emergency flame lift limits replaced by single line at 46.5
MJ/m³
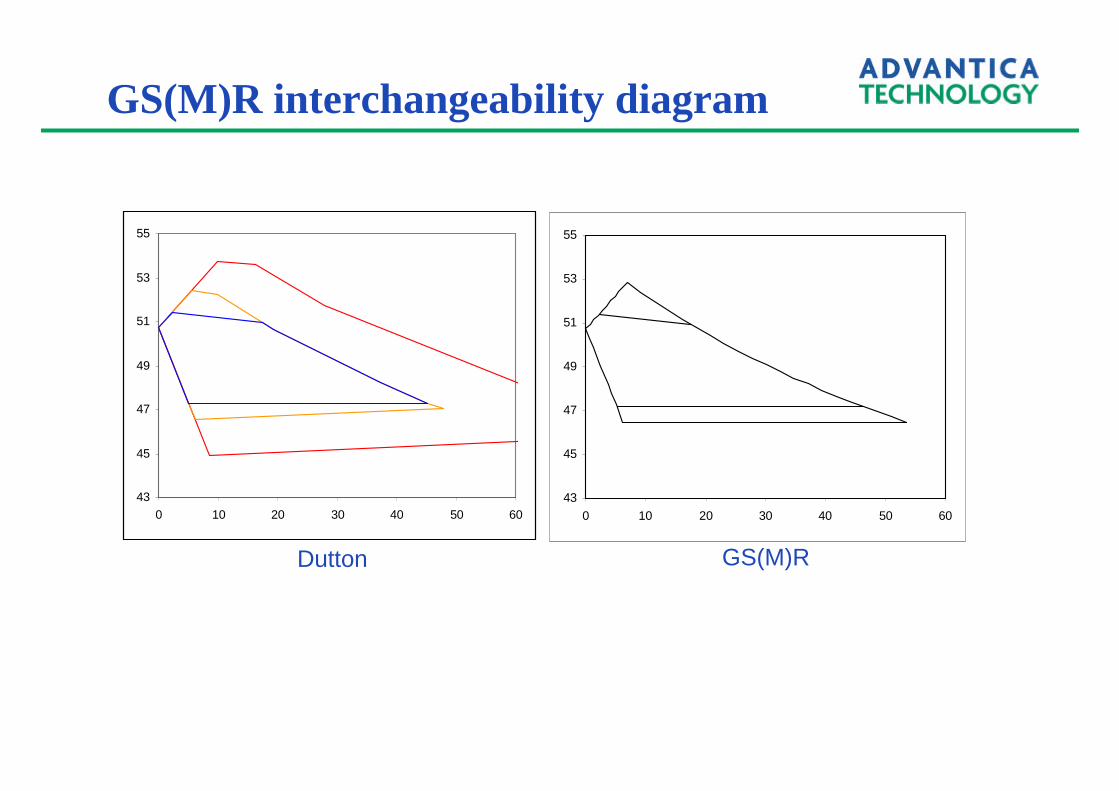
GS(M)R interchangeability diagram
43
45
47
49
51
53
55
0 10 20 30 40 50 6043
45
47
49
51
53
55
0 10 20 30 40 50 60
Dutton GS(M)R

GS(M)R interchangeability diagram
43
45
47
49
51
53
55
0 10 20 30 40 50 6043
45
47
49
51
53
55
0 10 20 30 40 50 60
Dutton GS(M)R
53.6 (+8%)
52.1 (+5%)
51.2 (1978 survey)
47.3 (-5%)
44.9 (Portsmouth low WN trial)

European Activity
Dave Lander28th June 2002
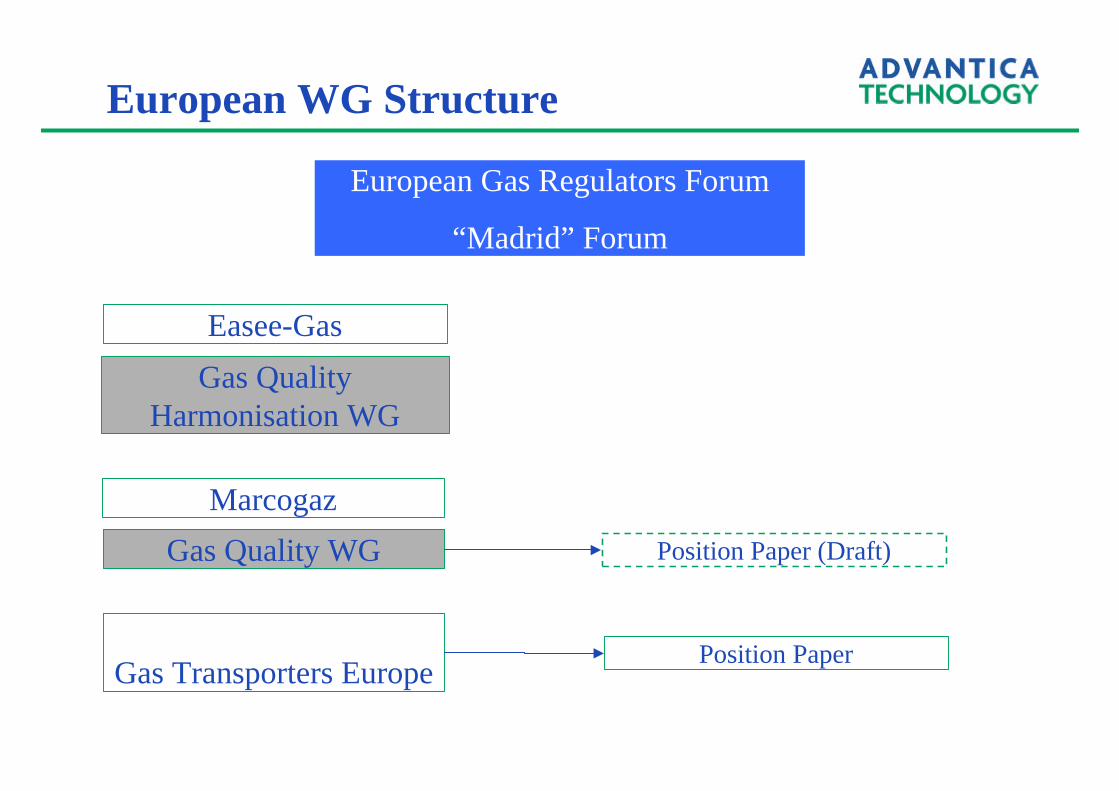
European WG Structure
European Gas Regulators Forum
“Madrid” Forum
Easee-Gas
Gas Quality Harmonisation WG
Marcogaz
Gas Quality WG
Gas Transporters Europe
Position Paper (Draft)
Position Paper

Marcogaz Position Paper
§ Current limits set nationally§ Reflect type, age and condition of local population
§ Since 1993, European appliances must comply with Gas Appliance Directive (“GAD”)§ Tolerate wider range of gas quality
§ Future common European specification should reflect the performance of modern GAD-compliant appliances§ Co-operative work to establish details of the specification§ Wobbe alone is not sufficient - flashback & sooting§ Transitional arrangements to ensure each nation’s population
can accept gas to the new specification (or when)

European Gases
Gas Safety (Management) Regulations 1996Natural Gas Interchangeability Diagram
44
46
48
50
52
54
56
0 10 20 30 40 50 60
% non-CH4 component (equivalent C3H8 + N2)
Wo
bb
e N
um
ber
(M
J/m
3)UK
Dk
F
I
S

European Gases
Gas Safety (Management) Regulations 1996Natural Gas Interchangeability Diagram
44
46
48
50
52
54
56
0 10 20 30 40 50 60
% non-CH4 component (equivalent C3H8 + N2)
Wo
bb
e N
um
ber
(M
J/m
3)
UK
Dk
F
I
S
Delbourg Gas Interchangeability Diagram
9000
10000
11000
12000
13000
14000
15000
25 35 45 55 65 75 85 95
Combustion potential
Ad
just
ed W
ob
be
Nu
mb
er (
kcal
/m3)
UK
Dk
F
I
S

UK Transition
§ Drivers§ Security of supply§ Capacity of the UK network (in energy terms)§ European Commission desire for removal of barriers§ Appliance improvement§ Reduction of CO-related incidents ?§ Energy efficiency§ Reduced emissions
§ Timescale§ 2003 – development of robust case to present to HSE§ 2004 – regulatory change
APPENDIX E – ADVANTICA PROPOSAL, IMPACT OF UK INTERCHANGEABILITY METHODOLOGY ON FUTURE NATURAL GAS SUPPLIES Impact of UK Interchangeability Methodology on Future Natural Gas Supplies Natural gases in use throughout Europe show a relatively wide variation in gas quality and many do not comply with the more-restrictive GS(M)R requirements of the UK. In the long term this will lead to difficulties in pipeline supply from mainland Europe. In the short term it may also cause difficulties for LNG importation projects currently being planned. Background Natural gas entering UK natural gas networks currently has to meet the minimum gas quality requirements set out in Schedule 3 of the Gas Safety (Management) Regulations 1996 (or GS(M)R). One of the key requirements set out in this schedule refers to the interchangeability of natural gases. Gases that are deemed to be interchangeable can be freely used, commingled, or blended with other natural gases within a network without risk of unsafe combustion. The current methodology within GS(M)R for defining interchangeability is based on the method employed by the then British Gas Corporation and developed by Dutton in the 1970s and 1980s. The method considers, for a particular natural gas, its Wobbe number (WN) and three characteristics defined by Dutton and calculated from its composition: Incomplete Combustion Factor (ICF), Sooting Index (SI) and Flame Lift Index (LI). These values are then compared with limiting values established by Dutton. The normal and emergency limit values for WN, ICF, SI (and emergency value of LI) were based on tests performed on domestic appliances representative of the population of the 1970s and a survey of gas appliances carried out in 1978. The limit value for LI was subsequently replaced with a single lower WN value for emergency operation. It must be stressed that all European appliances sold since 1993 are required to comply with the 1990 Gas Appliance Directive 90/396/CEE (“GAD”), and would be able to tolerate a much wider range in gas quality. The current UK limits are dictated by a relatively small fraction of older appliances. Regulatory Changes Regulatory changes will therefore be required for continued supplies of natural gas to the UK and it will be necessary to develop a robust case for such changes. UK appliance surveys were carried out in 1978 and 1990. The results of the earlier survey led to the upper WN limiting value and those of the later survey failed to justify raising the upper WN limit, despite a 12-year interval for turnover of the older “at-risk” appliances (felt to be largely those converted from towns gas use). A robust case for regulatory change is therefore likely to require compilation of information on the current UK domestic appliance population and possibly development of schemes to drive out any “at-risk” appliances remaining since 1990. Methods for compilation of such data might include:
§ A further UK appliance survey.
§ Development of schemes designed to acquire appliance information as part of other visits to domestic premises, such as those made by Transco emergency personnel, meter readers, CORGI service engineers.
§ Customer returns, using a return form issued along with energy bills. This will in turn require co-operation across UK Government departments and gas industry stakeholders to a degree not seen in recent times. Commercial Factors Removal or mitigation of commercial risk and financial impact of such changes to all stakeholders is an additional key issue. Widening of difference between highest and lowest WN natural gases may increase the frequency of calorific value cap applied under the Flow-Weighted Average CV billing regime, which would directly reduce transportation revenue
to Transco. Increase in WN of transported gas could make the increase pipeline capacity in energy terms, however. Secondary effects would also need to be considered, such as the changes in density accompanying shift to higher WN gases and subsequent impact on compression costs. LNG importation projects are at an advanced stage of planning (importation starting 2005/6, bids for capacity are being sought now). Such LNG is likely to be outside of current GS(M)R requirements, having too high a Wobbe number. Nitrogen injection is currently being planned to reduce the Wobbe number, which will increase capital and operating costs. Capital expenditure is probably not avoidable through regulatory change, but savings in future operating costs could be made. Some industries (eg glassmaking) are particularly sensitive to changes in natural gas quality. Any widening of the range in Wobbe number of gas delivered to these industries could lead to larger swings in Wobbe number and calorific value and affect quality or quantity of the process output. Mitigation strategies (eg improved process control) may need to be communicated to and adopted by such industries. National and European Activity The UK is not alone in having national Wobbe limits that are more restrictive than modern appliances complying with GAD and similar (although less extreme) difficulties will need to be addressed. There are a number of European Working Groups addressing the broader inter-operability issues raised by the European Commission’s desire to remove technical and commercial barriers to natural gas trade across national borders. The Marcogaz working group on Gas Quality is currently addressing interchangeability and other gas quality issues. The working group is likely to propose in the long-term movement towards unified national limits based on GAD-compliant appliances and suggesting a generic strategy or “route map” for national gas industries to follow in order make the transition. Timescales for the transition will be country-specific, because their situations are unique. Continued representation at European working groups is important in order to ensure that realistic and attainable strategies emerge with no disadvantage to the UK. Government and Regulators participate at European level through the European Gas Regulatory (“Madrid”) Forum and are aware of the output from the working groups. Acceptance by the European Commission may strengthen the case for governmental support for UK regulatory change. The UK DTI has recently issued its Energy White Paper that contains an acknowledgement of gas quality issues. It is understood that DTI, HSE and Ofgem are in informal discussion already. A suggested way forward Further discussions between stakeholders are clearly required and a UK forum is being proposed to consider a programme of work that will address changes in regulatory framework. The main issues to be addressed will be:
§ Changes that are required and the type and volume of evidence required to support such changes.
§ Appliance population information and prospects for population management initiatives if felt to be necessary.
§ Mechanisms for funding any change. Most stakeholders and suitable representatives have been identified within the industry and a forum is to be arranged. A phased programme of work addressing UK gas quality is suggested and this is summarised below. Further details for Phases 1 and 2 are given Appendix E-1. Phase 1 – Assessment and quantification (Indicative cost £27,000 and 6 weeks to complete) Assessment of what can be done in the short term at lowest cost. This would include: technical re-assessment of the Dutton approach, as incorporated in the GS(M)R; study of recent incident statistics and any other available information; study to assess the scale of appliance survey that would be required to give statistically significant results. Output from this phase would be a report detailing scope for changes to the current limits, the scale, cost and timescales for a UK appliance survey.

Phase 2 – UK Appliance Survey (Indicative cost £619,000 and 9 months to complete, based on a survey of 5,000 Appliances) Execution of a UK Appliance survey to establish: CO/CO2 ratio of all appliances, as found; valid appliance population data; appliance types, models and ages most susceptible incomplete combustion and whether sooting is a factor; appliances to select for withdrawal for laboratory tests. Laboratory tests on high Wobbe number gases on ex-district appliances and on new appliances (as control). Data analysis, liaison with HSE and presentation of conclusions and recommendations to UK forum and HSE. Output from this phase would be a report and database detailing: the effects of any proposed changes to the interchangeability diagram, particularly on older appliances operating at the high Wobbe limit; options showing the trade off in Wobbe limits against likely number of appliances thought to be “at risk” to ensure safety levels are not compromised and recommendations for Phase 3 (population management options). Phase 3 – UK appliance population management (Cost and timescale output from Phase 2) Based on the output from Phase 2, targeted withdrawal of appliances to achieve an agreed revised UK interchangeability specification without compromise of safety levels. Liaison and assistance with changes in GS(M)R. Depending on the results and conclusions of the UK appliance survey in Phase 2, the revised UK specification should be consistent with that suggested for a Common European Gas Specification (based on post 1993, GAD-compliant appliances, see below). However, if the numbers of “at-risk” appliances is excessive, an intermediate stage of appliance withdrawal may be necessary (at a correspondingly reduced Wobbe number range) or desirable. The merits of single- or multiple- staged withdrawal will be assessed during Phase 2. Output from this phase will be a UK appliance population able to cope with a wider range of gas quality and revised GS(M)R that recognise the new appliance population. Ideally the new GS(M)R would be consistent with the future Common European Gas Specification. Phase 4 – Common European Gas Specification In parallel with Phases 1-3 European activity will need to develop and agree a Common European Gas Specification. The current view is that such a specification would be based on the performance of post 1993, GAD-compliant appliances. However such a specification could not be written today. Agreement has not been agreed for the interchangeability parameters (one might hope that the UK approach could form the basis of the new specification, but the rest of Europe has no experience of it and some demonstration of its validity is probably required). In addition tests on modern GAD-compliant appliances will need to be conducted to establish limits in the interchangeability parameters agreed. This activity could be a collaborative programme co-ordinated through GERG (Groupe Européen de Recherche Gazeuse) and the European Framework Programme.

Appendix E-1 - Scope of work for Interchangeability Joint Industry Project Introduction Short term work during 2003/2004 would be directed at examining the upper Wobbe Number limit as set in the Gas Safety & Management Regulations (following Dutton) by the incomplete combustion factor (ICF), irrespective of possible sooting effects of some high CV non-methane gases on some appliances. A previous exercise performed in 1998 concluded that there would be an increase in risk of an incident of 26.5% per MJ/m³ increase in Wobbe Number. This was based on 1998 (and older) appliance data, 1990-95 incident statistics and the calculation method used in 1978 and 1991 analyses of national combustion surveys. Another ‘rule of thumb’ from previous work has been that CO/CO2 ratio doubles for every + 1.5MJ/m³ increase in Wobbe. These figures could be re-assessed in the light of the new appliance population and the latest incident statistics. The following bullet points indicate a scope of work for both a technical re-assessment of the original Dutton Diagram for Interchangeability (aimed primarily at examining the incomplete combustion limit) and a survey of appliances to identify the volume of ‘at risk’ appliances and to validate assumptions made on the tolerance of older appliances to higher Wobbe limits. The following activities should be included: Stage 1: Interchangeability Diagram:
§ Gather the basic assumptions made in the Dutton Diagram. (3m.days)
§ Validate the assumptions against latest data on appliance population and types. (5 m.days)
§ Reassessment of the Dutton model (particularly in respect of incomplete combustion). (8 m.days)
§ Test any proposed modifications to the Interchangeability limits with UK industry and European utilities. (4 m.days)
§ Study of recent incident statistics, to identify appliance types and models. (3 m.days)
§ Plan survey scale to give statistically significant results. (5 m.days)
Stage 1 output would be a report detailing the proposed changes to the Interchangeability Diagram, particularly to incorporate higher Wobbe limits. Stage 2: Appliance Survey: § Planning and executing an X,000 appliance survey to find out:
o CO/CO2 ratio of all X,000 appliances, as found o Valid appliance population data o Appliance types, models and ages most susceptible to incomplete combustion, and whether soot build-up is a
factor o Appliances to select for withdrawal for laboratory tests
(service engineers assumed at 2 appliances per household and 3 households per day + technical support at 10 m.days per 1000 appliances)
§ Laboratory tests on high Wobbe Number gases on ex-district appliances, ongoing throughout the survey (Assume 10 appliances at 5 m.days per appliance)
§ Laboratory tests on new appliances as control (Assume 10 appliances at 5 m.days per appliance)
§ Data analysis and reporting (15 m.days)
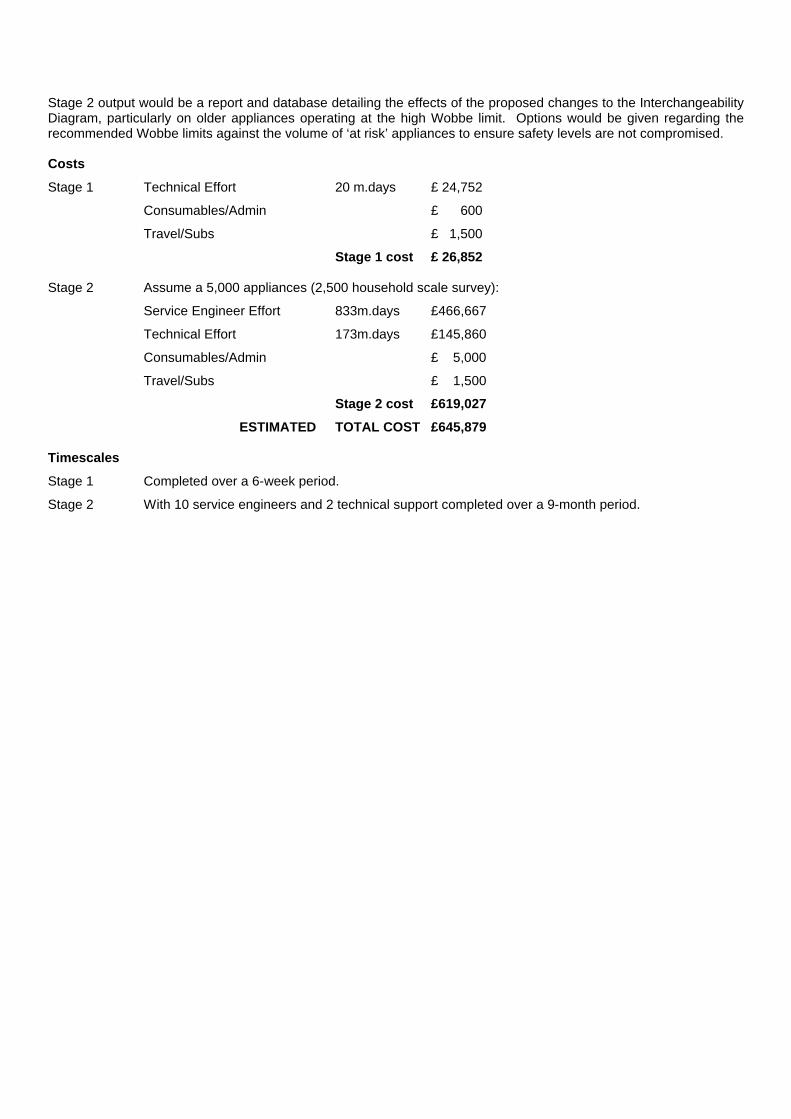
Stage 2 output would be a report and database detailing the effects of the proposed changes to the Interchangeability Diagram, particularly on older appliances operating at the high Wobbe limit. Options would be given regarding the recommended Wobbe limits against the volume of ‘at risk’ appliances to ensure safety levels are not compromised. Costs
Stage 1 Technical Effort 20 m.days £ 24,752
Consumables/Admin £ 600
Travel/Subs £ 1,500
Stage 1 cost £ 26,852 Stage 2 Assume a 5,000 appliances (2,500 household scale survey):
Service Engineer Effort 833m.days £466,667
Technical Effort 173m.days £145,860
Consumables/Admin £ 5,000
Travel/Subs £ 1,500
Stage 2 cost £619,027
ESTIMATED TOTAL COST £645,879 Timescales
Stage 1 Completed over a 6-week period.
Stage 2 With 10 service engineers and 2 technical support completed over a 9-month period.
Related Documents