Gas Diffusion in Closed-Cell Foams Laurent Pilon 1 , Andrei G. Fedorov 2 , and Raymond Viskanta 1 1 Heat Transfer Laboratory School of Mechanical Engineering Purdue University West Lafayette, IN 47907, USA 2 Multiscale Integrated Thermofluidics Laboratory G.W. Woodruff School of Mechanical Engineering Georgia Institute of Technology Atlanta, GA 30332-0405, USA Phone: (765)-494-5632 Fax: (765)-494-0539 E-mail: [email protected] November 14, 2000 1

Welcome message from author
This document is posted to help you gain knowledge. Please leave a comment to let me know what you think about it! Share it to your friends and learn new things together.
Transcript
Gas Diffusion in Closed-Cell Foams
Laurent Pilon1, Andrei G. Fedorov2, and Raymond Viskanta1
1 Heat Transfer LaboratorySchool of Mechanical Engineering
Purdue UniversityWest Lafayette, IN 47907, USA
2 Multiscale Integrated Thermofluidics LaboratoryG.W. Woodruff School of Mechanical Engineering
Georgia Institute of TechnologyAtlanta, GA 30332-0405, USA
Phone: (765)-494-5632Fax: (765)-494-0539
E-mail: [email protected]
November 14, 2000
1
ABSTRACT
The objective of this paper is to present an engineering model based on fundamentally
sound but simplified treatment of mass diffusion phenomena for practical predictions of the
effective diffusion coefficient of gases through closed-cell foams. A special attention was paid
to stating all assumptions and simplifications that define the range of applicability of the
proposed model. The model developed is based on the electrical circuit analogy, and on the
first principles. The analysis suggests that the effective diffusion coefficient through the foam
can be expressed as a product of the geometric factor and the gas diffusion coefficient through
the foam membrane. Validation against experimental data available in the literature gives
satisfactory results. Discrepancies between the model predictions and experimental data
have been observed for gases with high solubility in the condensed phase for which Henry’s
law does not apply. Finally, further experimental data concerning both the foam morphology
and the diffusion coefficient in the membrane are needed to fully validate the model.
Keywords: gas diffusion, aging, effective diffusion coefficient, closed-cell foam.
NOMENCLATURE
b Wall thickness in the cubic model
C Mass concentration
d Cell wall thickness
D Diffusion coefficient
E Activation energy, Equation (7)
f Fugacity
2
G Geometric factor, Equation (26)
Hf Thickness of the foam layer
�i,�j,�k Unit vectors in the x-, y-, and z-directions, respectively
jm Mass transfer rate
< l > Average distance between successive membranes in the foam, Equation (3)
L Linear dimension of the unit cubic cell
M Molecular weight of the gas
n Average number of cells across the foam layer in the direction of the diffusion process (= Hf/L)
p Pressure of the gas in the void
Pe Permeability coefficient
Rm Species diffusion resistance
R Universal gas constant = 8.314J/mol.K
S Solubility of the gas species in the condensed phase
T Temperature
z Axial coordinate
Greek symbols
β Dimensionless wall thickness in the cubic model (=b/L)
ε Parameter, Equation (3)
Γ Foam porosity function, Equation (27)
φ Porosity
ϕ Function of number of closed-cells in the diffusion direction, Equation (27)
Subscripts
3
0 Refers to a reference state
c Refers to condensed phase (liquid or solid)
eff Refers to effective property
f Refers to foam
g Refers to gas phase
i Index of the gas species
STP Standard temperature and pressure
INTRODUCTION
Closed-cell foams consists of gas bubbles separated one from another by a thin membrane
of a continuous condensed phase. The condensed phase can be solid or liquid. Among
foams having solid membrane, the polymeric foams are the most commonly used [1]. They
can be rigid or flexible and the cell geometry can be open or closed. Open-cell polymeric
foams are generally flexible and best for automobile seats, furniture, and acoustic insulation.
Closed-cell polymeric foams are usually rigid and mostly used for thermal insulation in the
construction and refrigeration industries. Indeed, closed-cell foams are very effective thermal
insulators due to entrapped blowing agents used for foaming and having a low thermal con-
ductivity. Unfortunately, the thermal insulating properties and dimensional stability of rigid
closed-cell foams decay significantly with age due to the outward diffusion of the low conduc-
tivity blowing agent and the inward diffusion of higher conductivity air constituents [2, 3].
Typically, air constituents diffuse through foam much faster than commonly used blowing
4
agents such as chlorofluorocarbons [1, 2]. As a result, the short and intermediate term aging
of polymeric foams are due to in-diffusion of air constituents, while long-term aging depends
on depletion of blowing agents.
Liquid foams are frequently encountered as a by-product in bioprocessing (protein sep-
aration) and materials processing (glass melting and casting) or generated for special ap-
plications (firefighing). For example, in glass manufacturing liquid foams are formed at the
free surface of the molten glass due to entrapment of gas bubbles produced as a result of the
batch fusion and fining reactions in the glass melt [4, 5]. Glass foams consist of spherical
and/or polyhedral gas bubbles surrounded by liquid lamellae. In the glass melting process,
foaming is undesirable since it reduces significantly heat transfer rates from the combustion
space to the melt [4, 5], thereby increasing the operating temperature, the NOx-formation
rate, and the energy consumption [4].
Understanding and modeling of the mass diffusion process in foams is, therefore, of major
importance from both fundamental and practical viewpoints. The objective of this paper
is to present an engineering model based on fundamentally sound but simplified treatment
of mass diffusion phenomena for practical predictions of the effective diffusion coefficient of
gases through a foam layer. The model developed is based on the electrical circuit analogy,
and available experimental data are used for model validation.
5
ANALYSIS
Current state of knowledge
In general, the effective diffusion coefficient of a gas species “i” in the foam depends not
only on the diffusion coefficients in the gas and the condensed phases (denoted Dg,i and Dc,i,
respectively) but also on the foam morphology parameters such as the membrane (or wall)
thickness, the unit cell size and shape, the spatial distribution of the cells, the total number
of open cells and on the foam porosity [2, 3, 6, 7]. The foam porosity φ is defined as
φ =ρc − ρf
ρc − ρg
(1)
and it can be easily computed from the experimental measurements of the foam density
(ρf ) and the gas and condensed phases densities, denoted by ρg and ρc, respectively. The
geometry of the unit cell may vary substantially within the same foam, but an idealized unit
cell of high porosity foams can be represented by a regular pentagonal dodecahedron [1, 8].
The presence of open cells tends to increase the effective diffusion coefficient and in polymeric
foams, open cells account for 5% to 15% of the total number of cells [7].
The prediction of gas diffusion through the closed-cell foam can be accomplished via
two different types of models [7]: 1) permeability models and 2) diffusion models. Both
models use either continuous or discrete approaches. Brandreth [7] reviewed advantages and
drawbacks of each model. In brief, the permeability models are based on the assumption that
the permeability coefficient for species “i” through the membrane (Pec,i) can be expressed
as the product of the diffusion coefficient (Dc,i) and the solubility (Sc,i) of the species “i” in
6
the membrane, i.e.,
Pec,i = Dc,iSc,i (2)
This relationship is strictly valid only if steady state conditions are attained, the wall ma-
terial is mainly amorphous, and the Henry’s law is applicable. Brandreth [7] questioned the
appropriateness of Equation (2) in studying the aging of polymeric foams by virtue of the
fact that the steady state and the Henry’s law conditions are hardly satisfied in practice.
Ostrogorsky and Glicksman [3, 6] developed a discrete permeability model based on the elec-
trical circuit anology and Equation (2) resulting in the following expression for the effective
diffusion coefficient through the foam layer:
Deff |f,i(T ) = ε< l >
d
T
TSTP
Pec,i (3)
where < l > is the average distance between successive membranes, d is the membrane
thickness, and Pec,i is the permeability coefficient of the gas through the membrane that
follows an Arrhenius type of law [6]. The parameter ε is defined as the ratio of the membrane
area to the cross-section area of a unique cell, and it is assumed to be equal to 2 corresponding
to spherical shape gas bubbles. The effective diffusion coefficients were found to underpredict
the experimental results by as much as 29% [6], while in other studies [9] the discrepancies
between predictions and measurements were in the range of 25% to 45%. Shankland [10]
modified Equation (3) as follows:
Deff |f,i(T ) = GpSTP
(T
TSTP
)Pec,i (4)
where G is a dimensionless geometric factor depending on the foam structure. Equation (4)
suggests that a plot Deff |f,i(T ) versus pSTP
(T
TSTP
)Pec,i should be a straight line passing
7
through the origin and whose slope is the geometric factor G [10]. Indeed, experimental data
obtained for extruded polystyrene foams [10] support the mathematical form of Equation
(4), but the author emphasized a need for additional information about the foam morphology
to fully validate the model. However, there appears a clear lack of consistency in the ex-
perimental data presented by various authors. Specifically, Page and Glicksman [11] as well
as Fan and Kokko [12] reported the experimental results obtained for different foams over
the temperature range of 30oC to 80oC. Their experimental data indicate that the effective
diffusion coefficient follows an Arrhenius type of law, thereby restricting the applicability of
the model proposed by Shankland [10].
The continuous diffusion models consider the foam as a homogeneous and isotropic
medium through which gas species “i” diffuses with an effective diffusion coefficient Deff |f,i.
The effective diffusion coefficient is determined via an inverse solution of the following species
conservation equation:
∂Ci
∂t= Deff |f,i∇2Ci (5)
The discrete diffusion models consider the foam layer as the repetition of unit cells char-
acterized by their geometry (membrane thickness, cell size and shape) as well as the diffusion
coefficients of the species through the condensed phase (liquid or solid) and through the gas
phase. Several studies showed the significant influence of the foam morphology on the diffu-
sion process through closed-cell foams [13, 14]. The continuous model is by its essence unable
to account for the discreteness of the foam morphology. In contrast, the discrete approach
enables one to express the effective diffusion coefficient in terms of parameters characterizing
the foam structure and composition.
8
Recently, Alsoy [15] reviewed the discrete diffusion models, and a reader is referred to
this publication for citations of the relevant literature. In short, she concluded that the
model developed by Bart and Du Cauze de Nazelle [16] represents the current state-of-the-
art. In this work, one-dimensional diffusion through a series of three-dimensional cubic cells
of uniform wall thickness was considered. The authors neglected the diffusion through the
gas phase, and used the Henry’s law at the membrane/gas phase interface to obtain the
following expression for the effective diffusion coefficient both in a unit cell and in the entire
foam [16, 17]:
Deff |f,i(T ) =(
L
b
)(Dc,iSc,iRT
(1 − φ)Sc,iRT + φ
)(6)
Here, Deff |f,i(T ) is the effective diffusion coefficient of gas “i” expressed as a function of
geometric parameters of the foam [the size of the unit cubic cell (L), the thickness of the
membrane (b), and porosity (φ)], and thermophysical properties [the diffusion coefficient
(Dc,i) and the solubility (Sc,i) of the gas in the condensed phase]. Alsoy [15] reported an
extensive comparison of the effective diffusion coefficient predicted by Equation (6) with the
experimental data obtained for different types of polymeric foams and diffusing gases. The
author observed that Bart and Du Cauze de Nazelle’s model underpredicted the effective
diffusion coefficients by about one to three orders of magnitude [15].
To conclude this overview, there is a great deal of controversy about what type of model
should be used for predicting the effective properties of a foam. In this paper, an attempt is
made to derive an expression of the effective diffusion coefficient of the foam based on the first
principles. It is hoped that the theoretical model developed will contribute to clarifying at
least some of the controversial issues and will provide a framework for developing physically
9
consistent models. In the present work, a cubic unit cell is used as representative model
to predict mass diffusion through the closed-cell foams using electrical circuit analogy. A
special attention was paid to stating all assumptions and simplifications that define the range
of applicability of the proposed model. Finally, the analysis considers multi-gas diffusion
through the foam layer with either liquid or solid condensed phase. The theoretical model
developed is validated against the experimental data available in the literature.
Model Assumptions
A model for mass diffusion of the gas species “i” through a unit cell of the foam layer is
developed using the following assumptions:
1. Foam cells are taken to be closed and separated by the continuous solid or liquid
membranes.
2. The condensed phase of the membranes is assumed to be at rest.
3. Gas diffusion of gas species “i” through the condensed phase is considered to be a
thermally activated process, i.e., the mass diffusion coefficient (Dc,i) depends on the
temperature via the Arrhenius’ law [18]:
Dc,i = Dc,0,iexp(−Ec,i
RT
)(7)
where Dc,0,i and Ec,i are experimentally determined constants.
4. The gas mixture contained in the pores (voids) of the foam behaves as an ideal gas.
5. Mass diffusion only in the vertical z-direction is considered.
10
6. The diffusing gas species “i” is weakly soluble in the condensed phase (i.e., Henry’s
law is applicable)1.
7. The temperature is uniform throughout the unit cell.
8. The pressure in the void remains close to the atmospheric pressure (maximum 5
atm [19]) so that the ideal gas approximation for fugacity is valid.
9. The diffusing gas neither reacts with the condensed phase nor undergoes dissociation
or association.
10. The condensed phase is continuous (i.e., poreless).
11. The foam consists of a succession of identical stacked layers of juxtaposed unit cells.
Thus, the effective diffusion coefficient of gas “i” through the entire foam layer (Deff |f,i)
can be expressed as:
Deff |f,i =
(L
Hf
)Deff,i =
1
nDeff,i (8)
where Deff,i is the effective diffusion coefficient of gas species “i” through a unit cell,
Hf is the foam thickness, and L is the characteristic length of the cubic unit cell.
The ratio Hf/L (=n) represents the number of unit-cell-thick layers constituting the
foam. Note that, as the number of closed-cells in the diffusion direction increases,
the resistance to gas diffusion increases and the effective diffusion coefficient becomes
smaller.
12. Convective gas transport inside the pores is neglected [11].
1This assumption appears not to be valid for CFCl3 (R-11) in rigid polyurethane foams as discussed by
Brandreth [7].
11
13. The changes of the effective diffusion coefficient due to the variation of the foam poros-
ity with temperature (i.e., due to thermal expansion) are neglected compared to the
changes due to the variation of the diffusion coefficients Dc,i and Dg,i with temperature.
Using the above listed assumptions, a model for effective diffusion coefficient in closed-cell
foams is developed based on the cubic representation of the foam unit cell.
Cubic Unit Cell Model
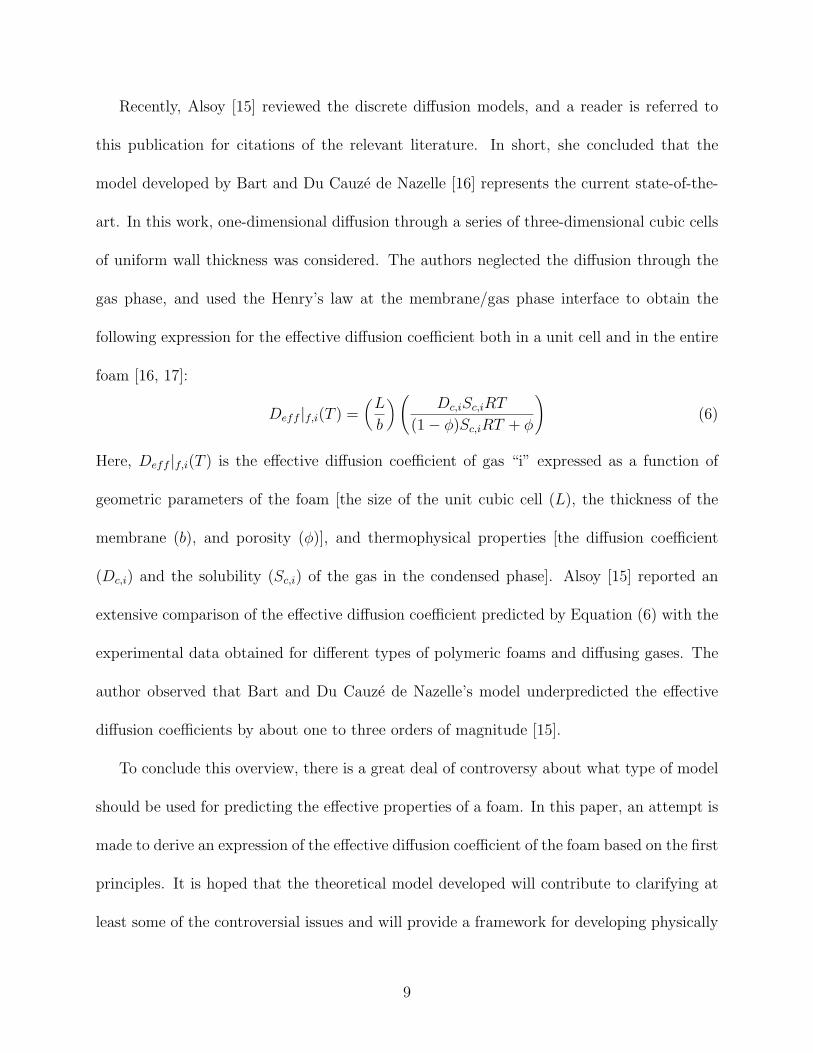
Figure 1 shows a representative unit cell that is used to describe the microstructure of the
foam. The unit cell is a cube of characteristic length L with the pore (void) represented by
a smaller cube. The space between the two cubes is occupied by a condensed phase (solid or
liquid), while the internal cube contains a gas mixture. Based on the definition of porosity
(the volume fraction of the cell occupied by the gas mixture), the relationship between the
wall (membrane) thickness b and the porosity φ can be expressed as
φ =
(1 − 2
b
L
)3
(9)
or, in terms of the dimensionless wall thickness β = b/L, as
β =1
2(1 − 3
√φ) (10)
Three different resistances to diffusion of species “i” in the vertical direction from the
top to the bottom of the unit cell should be considered: 1) the resistance of the condensed
phase, 2) the interface resistance and 3) the resistance of the gas. Wet foams are often
stabilized by the surface active chemicals present at the interface of the lamella. In this
analysis, it is assumed that the resistance to the mass transport provided by the surfactants
12
is negligibly small. It is also assumed that the magnitude of the mass flux is relatively small,
so that the variations of mass concentration of gas species “i” in both phases are small as
well. Then, the quasi-equilibrium conditions can be assumed to exist at the gas/condensed
phase interface [20] which imply the equality of the chemical potentials of the diffusing gas
on both side of the interface. This fact, combined with assumptions 6, 7, 8 and 9, allows us
to apply the generalized Henry’s law to obtain a relationship between species concentrations
on both sides of the gas/condensed phase interface [21]:
Cc,i = Sc,iMifg,i (11)
Here, Cc,i is the concentration and Sc,i is the solubility of the diffusing gas “i” in the condensed
phase, Mi is the molecular weight of the species “i”, and fg,i the fugacity of the species “i” in
the gas phase. Provided that the pressure is low enough and ideal gas approximation holds
(assumption 8), the fugacity fg,i is approximately equal to the partial pressure of species “i”
(pi) on the gas side of the interface [19], so that
Cc,i = Sc,iMipi (12)
Using an ideal-gas equation of state (assumption 4), the concentration of the gas species “i”
in the gas phase can be expressed as
Cg,i =Mi
RTpi (13)
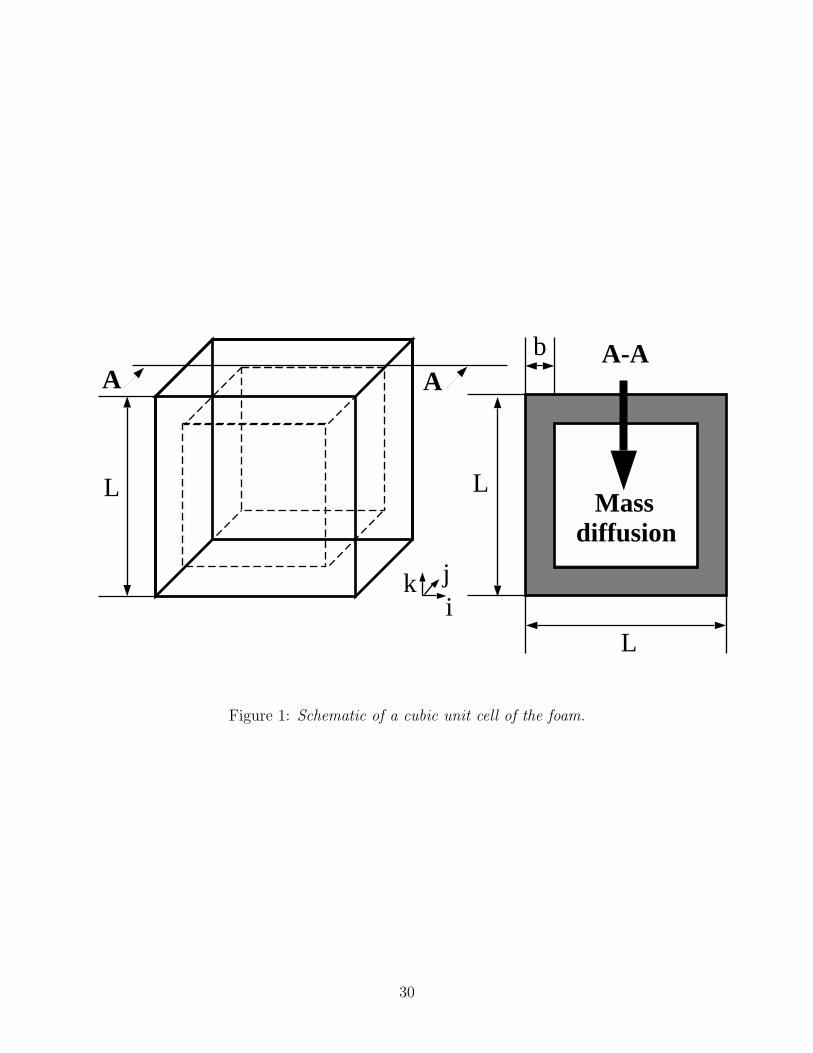
This results in the following jump condition for the species concentrations at the interface:
Cc,i = Sc,iRTCg,i (14)
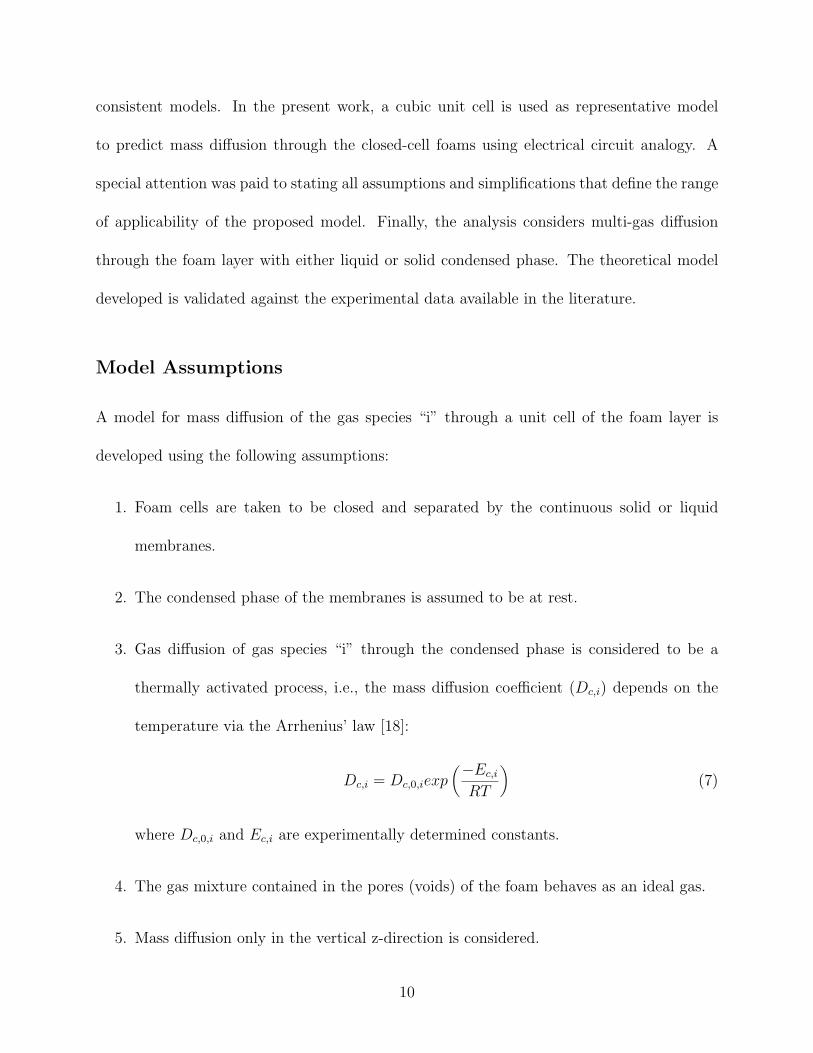
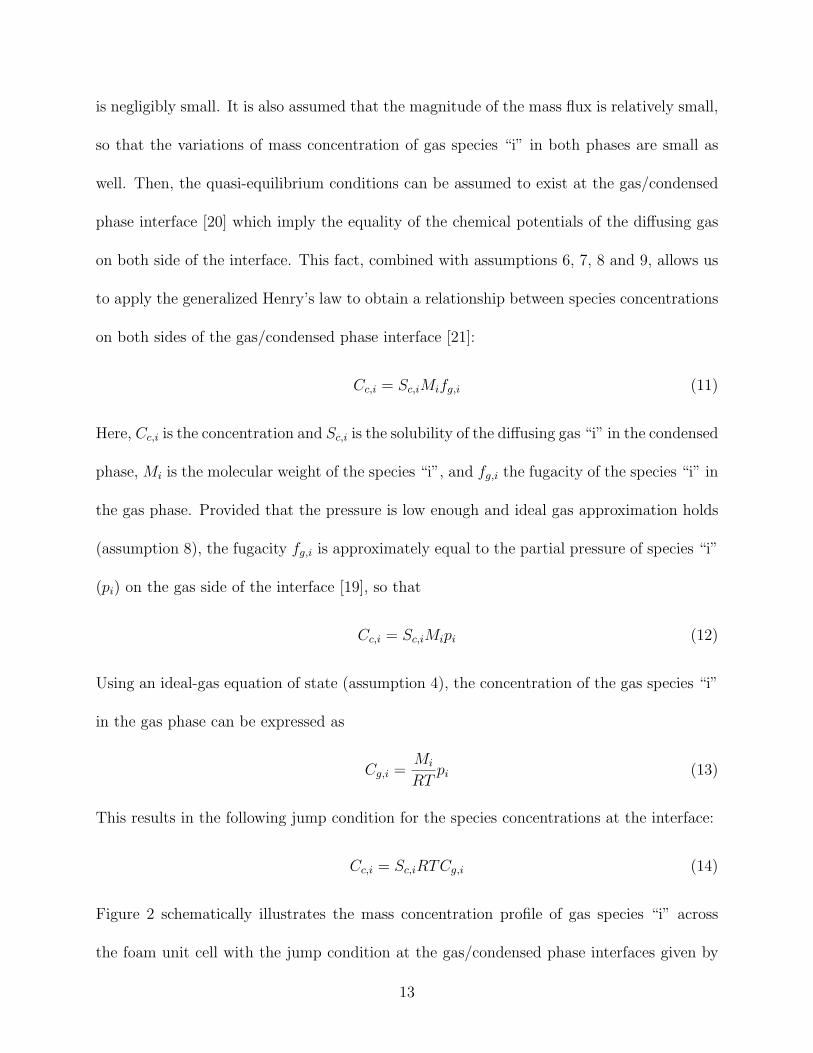
Figure 2 schematically illustrates the mass concentration profile of gas species “i” across
the foam unit cell with the jump condition at the gas/condensed phase interfaces given by
13
Equation (14). Note that, although the concentration profile may appear counter-intuitive,
the chemical potential profile, if plotted, would be a continuous, decreasing function from
top to bottom indicating the direction of the mass transfer.
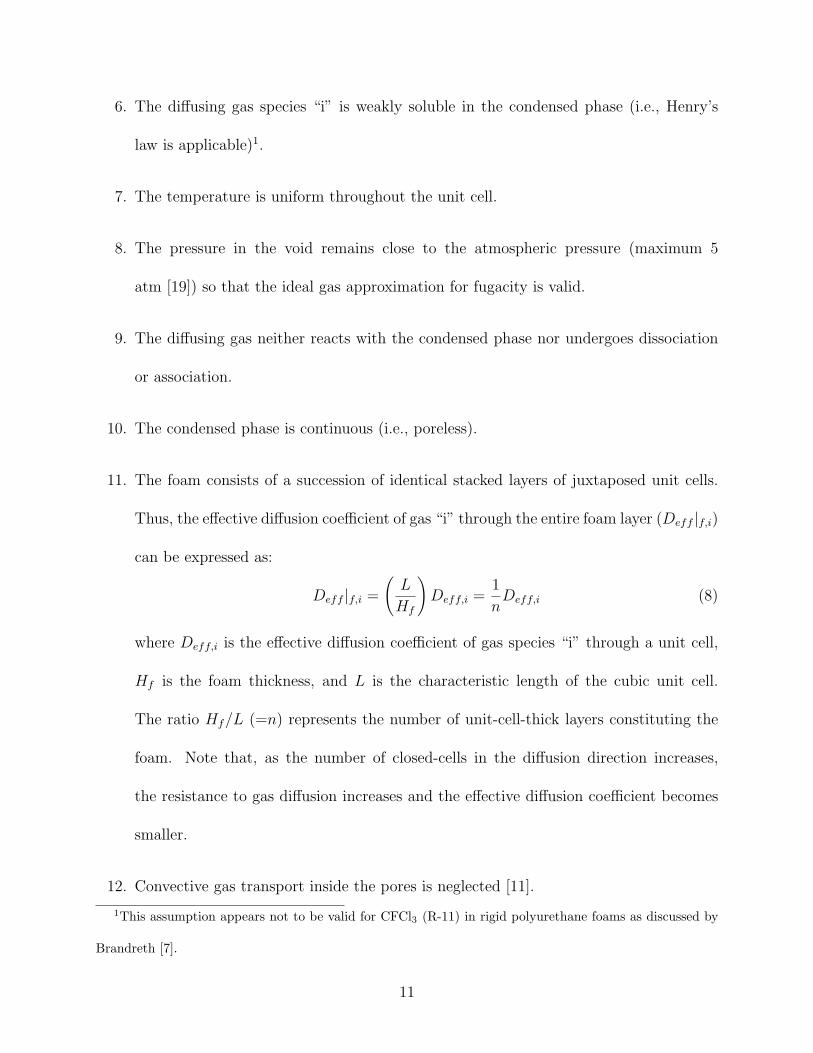
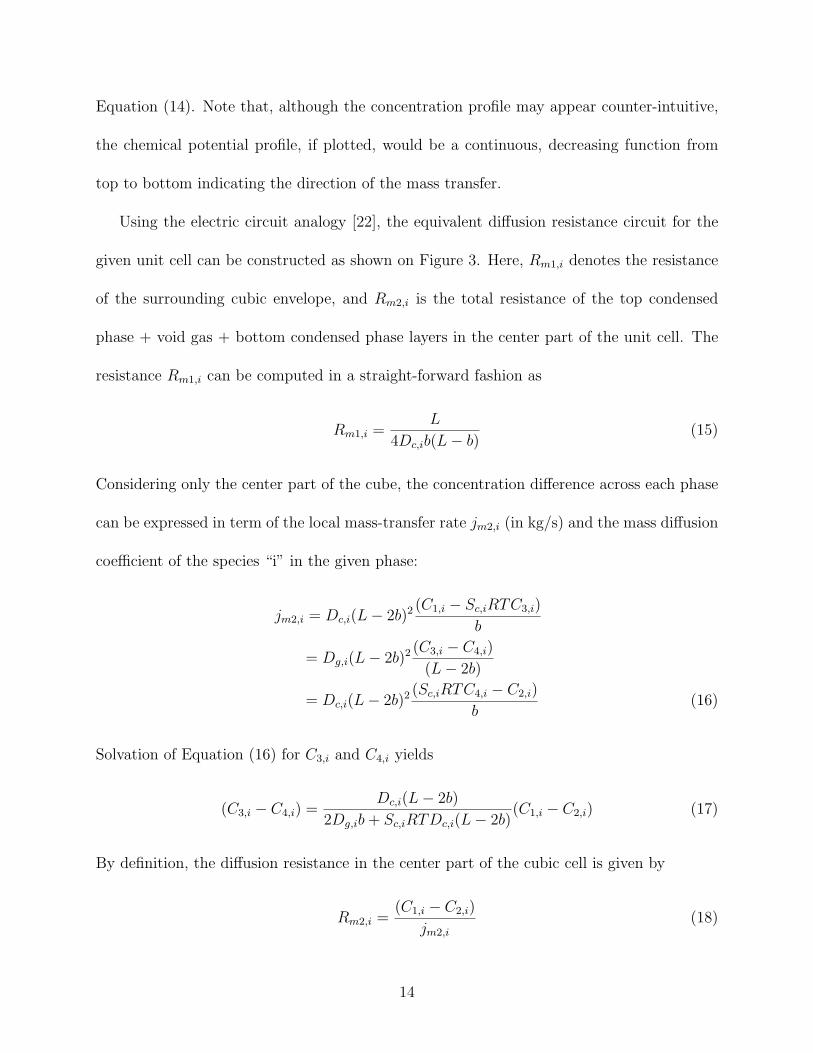
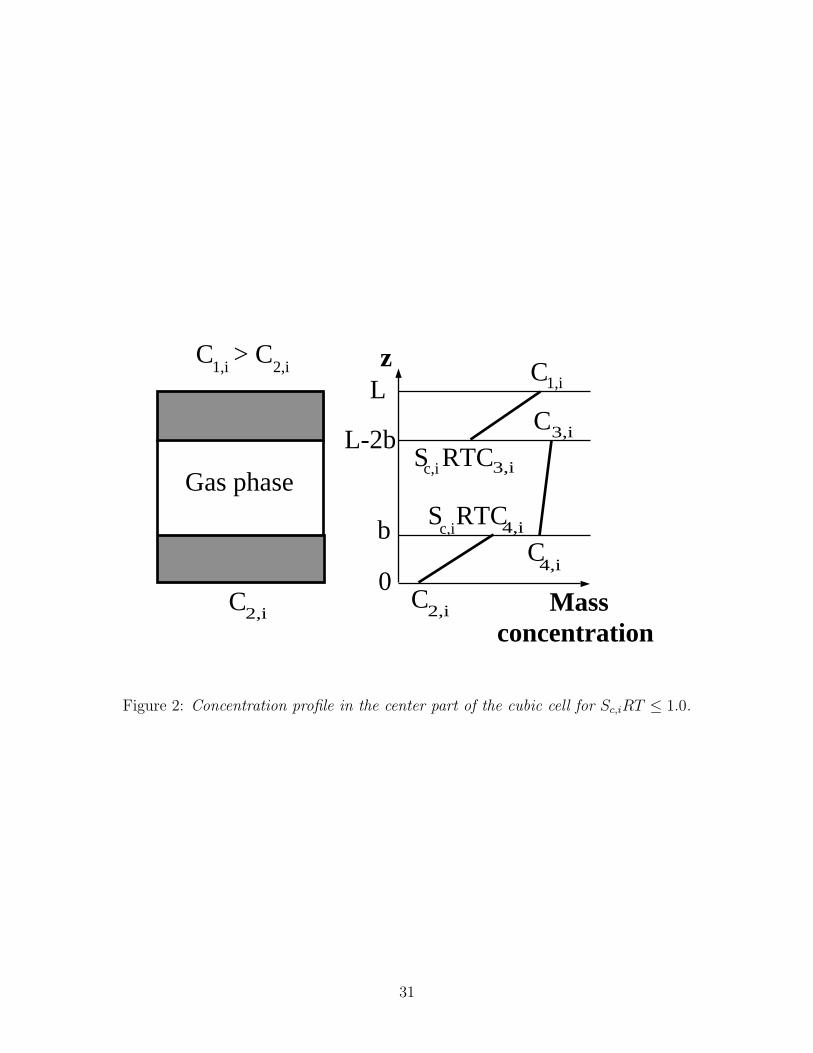
Using the electric circuit analogy [22], the equivalent diffusion resistance circuit for the
given unit cell can be constructed as shown on Figure 3. Here, Rm1,i denotes the resistance
of the surrounding cubic envelope, and Rm2,i is the total resistance of the top condensed
phase + void gas + bottom condensed phase layers in the center part of the unit cell. The
resistance Rm1,i can be computed in a straight-forward fashion as
Rm1,i =L
4Dc,ib(L − b)(15)
Considering only the center part of the cube, the concentration difference across each phase
can be expressed in term of the local mass-transfer rate jm2,i (in kg/s) and the mass diffusion
coefficient of the species “i” in the given phase:
jm2,i = Dc,i(L − 2b)2 (C1,i − Sc,iRTC3,i)
b
= Dg,i(L − 2b)2 (C3,i − C4,i)
(L − 2b)
= Dc,i(L − 2b)2 (Sc,iRTC4,i − C2,i)
b(16)
Solvation of Equation (16) for C3,i and C4,i yields
(C3,i − C4,i) =Dc,i(L − 2b)
2Dg,ib + Sc,iRTDc,i(L − 2b)(C1,i − C2,i) (17)
By definition, the diffusion resistance in the center part of the cubic cell is given by
Rm2,i =(C1,i − C2,i)
jm2,i
(18)
14
or, after using Equations (16) and (17), by the following expression:
Rm2,i =2b
Dc,i(L − 2b)2+
Sc,iRT
Dg,i(L − 2b)(19)
It is clear from Equation (19) that the total diffusion resistance in the center part of the cell
(Rm2,i) consists of the resistances of the two layer of the condensed phase (the first term on
the right-hand side) in series with the resistance of the gas phase (the second term on the
right-hand side).
If the resistances Rm1,i and Rm2,i are specified, the total resistance of a unit cubic cell
Rm,i is computed as follows:
Rm,i =Rm1,iRm2,i
Rm1,i + Rm2,i
(20)
Finally, the effective mass diffusion coefficient of the unit cubic cell (Deff,i) is defined as
Deff,i =jm,i
L(C1,i − C2,i)=
1
Rm,iL(21)
and, by substituting Equations (15) and (19) into Equations (20) and (21), it is given by
Deff,i = Dc,i
[4β(1 − β) +
Dg,i(1 − 2β)2
2Dg,iβ + Sc,iRTDc,i(1 − 2β)
](22)
where the dimensionless wall thickness β can be calculated from Equation (10) if the foam
porosity (φ) is known.
In most of the practical cases, the cell interior (void volume) does not introduce a signifi-
cant resistance to mass diffusion [2, 3, 16] since diffusion coefficient in the gas phase is much
larger than diffusion in the condensed phase (Dg,i � Dc,i). Then, the concentration across
the gas phase can be assumed as essentially constant and Equation (22) simplifies to
Deff,i =Dc,i
2β(1 − 4β + 12β2 − 8β3) (23)
15
Substituting an expression for β from Equation (10) into Equation (23) yields:
Deff,i = Dc,i
(1 +
φ
1 − 3√
φ
)(24)
Note that if the diffusion within the void is neglected, the total diffusion resistance of the
cell consists only of that of the condensed phase, and the interfacial jump conditions and
the solubility of the gas in the condensed phase have no influence on the effective diffusion
coefficient.
Finally, by accounting for the temperature dependence of the mass diffusion coefficient in
the condensed phase Dc,i [see Equation (7)] and considering multiple unit-cell structure of the
foam layer [see Equation (8)], the following expression for the effective diffusion coefficient
of the entire foam layer can be suggested:
Deff |f,i = G(φ, n)Dc,0,iexp(−Ec,i
RT
)(25)
where the geometric factor G(φ, n) is expressed as
G(φ, n) =1
n
(1 +
φ
1 − 3√
φ
)(26)
Note that the effective diffusion coefficient of the foam [Equation (25)] is expressed as the
product of a geometric factor, G(φ, n), and the diffusion coefficient in the foam condensed
phase, Dc,i(T ). The geometric factor G(φ, n) depends on the foam porosity (φ) and on the
average number of cells (n) across the foam thickness in the direction of the diffusion flux.
The cubic cell geometry is, obviously, a simplified representation of the real morphology of
the foam. Therefore, the parameter n (=Hf/L) should be viewed as the number of equivalent
cubic cells that best represent the real foam. Assigning an appropriate value of the linear
dimension of the unit cubic cell L could be used to account for the discrepancy between the
16
model and the reality. For example, one can derive the characteristic length by preserving
one or several foam parameters (e.g., the wall thickness, the interfacial area, the cell volume
or the projected interfacial area onto a plan perpendicular to the direction of diffusion) in
the actual and idealized (model) settings.
The diffusion coefficient of gas species “i” in the condensed phase depends on the physi-
cal and the chemical characteristics of the condensed phase. For example, the gas diffusion
coefficient in a polymeric condensed phase depends not only on the chemical structure of the
specific polymer but also on morphology, density, crystallinity and orientation of molecular
chains in the polymer [18]. However, the chemical structure can be considered to be a pre-
dominant factor [18], and one should carefully consider it in validating and making practical
calculations using the theoretical models developed.
RESULTS AND DISCUSSION
Parametric Calculations
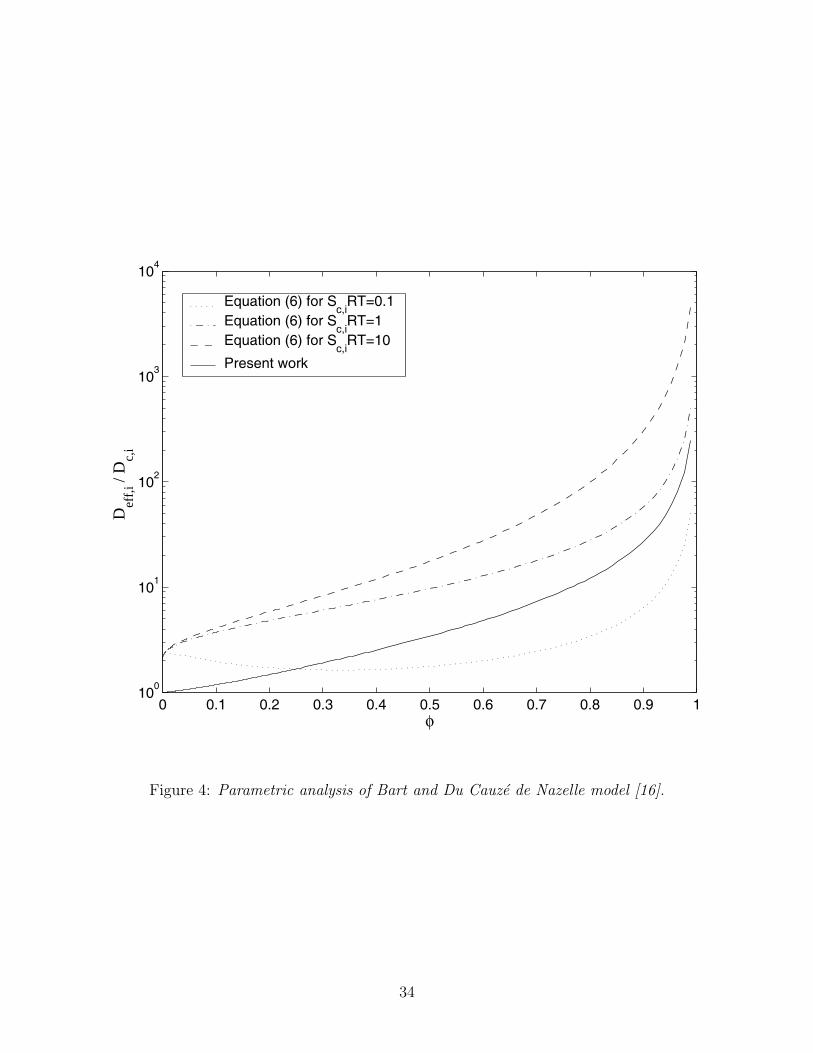
First, a critical analysis of the model developed by Bart and Du Cauze de Nazelle [16] [see
Equation (6)] is presented and important trends are discussed. A main input parameter for
the Bart and Du Cauze de Nazelle’s model is the product Sc,iRT , whose typical values at OoC
in polyurethane foams range between 0.1 and 10 for nitrogen and CFC-11, respectively [16].
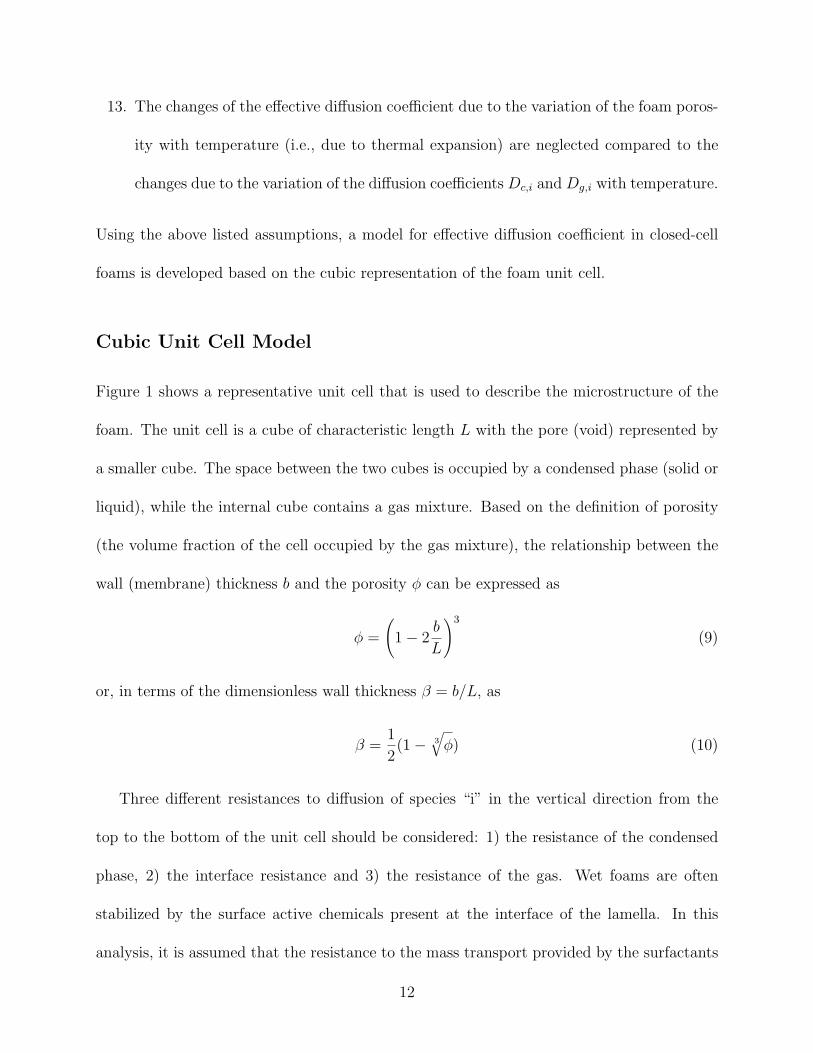
Figure 4 shows the ratio of the effective diffusion coefficient through a unit cell and that
through the condensed phase alone, predicted by Equations (24) and (6) [for different values
of the parameter Sc,iRT ] ploted against the porosity (φ). Intuitively, one expects that
17
as the membrane becomes thinner, the diffusion resistance decreases leading to a larger
effective diffusion coefficient. In other words, the effective diffusion coefficient should increase
continuously as the porosity increases since the resistance of the gas phase is much smaller
than that of the condensed phase, and experimental observations confirm these expectations
for low pressures [2, 11, 23]. However, when Sc,iRT ≤ 1.0 (that is for nitrogen and oxygen
in polyurethane membrane [16]), Equation (6) exhibits an unexpected non-monotonic trend
with the local minima. This trend has also been observed by Briscoe and Savvas [24] in their
numerical study of oxygen and nitrogen gas diffusion through dense polyethylene foams
having an initial pressure in cavities of 4.8 MPa. The authors speculate that the medium
size voids act as “buffers” which prevent rapid variation of the gas pressure in the medium
porosity range, thereby leading to a local minima in the effective diffusion coefficient. In
low porosity foams, the cells are too small to significantly buffer the pressure fluctuations,
whereas in high porosity foams the cavities are much larger than the cell walls and their effect
on pressure is negligible compared to that of the walls. For such high pressure applications,
the ideal gas approximation is not valid [19] and this case falls beyond the scope of this
study.
The simplified cubic model [see Equation (22)] developed here predicts a continuous
increase in the effective diffusion coefficient as the foam porosity increases. The parametric
analysis of the cubic model indicates that if the diffusion coefficient through the membrane
is at least two orders of magnitude greater than the diffusion coefficient through the gas,
then the resistance to gas diffusion presented by the gas phase can be neglected. Thus,
for all practical applications with either liquid or solid condensed phase, one can neglect
the resistance of the gas phase and the simplified models given by Equations (25) and (26)
18
should be adequate for practical calculations.
Validation Against Experimental Data
Tables 1 and 2 summarize the experimental conditions used in the studies concerned with
the effective diffusion coefficients through different polyurethane (PUR) and related polyiso-
cyanurate (PIR) foams as well as other polymeric foams, respectively. Polyurethane foams
and related polyisocyanurate foams comprise the largest family of rigid closed-cell foams [1].
Polyurethane membranes are formed by exothermic chemical reactions between an polyiso-
cyanate and a polyol, and foaming is achieved by evaporation of low boiling point liquids
(blowing agents) such as chlorofluorocarbons (CFC or R) (see Ref.[1] for an in depth discus-
sion)”. Note that the specific type of polyols used for polyurethane foams is rarely mentioned
and often unknown to the authors [17]. This is unfortunate since previous studies [25] showed
that the gas diffusion coefficient through polyurethane membranes depends on the type of
polyol used, whereas the influence of the isocyanate functionality has not been clearly ob-
served. Since Dc,i and Sc,i may vary by several orders of magnitude from one polyurethane
foam to another [25], any reliable assessment of gas diffusion models through polyurethane
foams should be performed for polyurethane foams made out of the same polyol. For in-
stance, Alsoy [15] used the experimental data for the diffusion coefficient of an unknown
type of polyurethane membrane [16] to validate the Bart and Du Cauze de Nazelle’s model
against the experimental data taken from other studies without checking if the polyurethane
foams were generated using the same polyol.
To assess the validity of Equations (25) and (26) for predicting the effective gas diffusion
19
coefficient through the closed-cell foams, one needs to know (i) the chemical structure of
the condensed phase (membrane), (ii) the mass diffusion coefficient of the gas through the
specific membrane and its temperature dependence [Dc,i(T )], (iii) the foam porosity or the
foam density, and (iv) the average number of equivalent cubic cells in the direction of the
diffusion process. Unfortunately, the authors were unable to find a consistent set of data
supplied with all the necessary parameters. Therefore, an indirect approach will be used to
validate the simplified diffusion models against available experimental data.
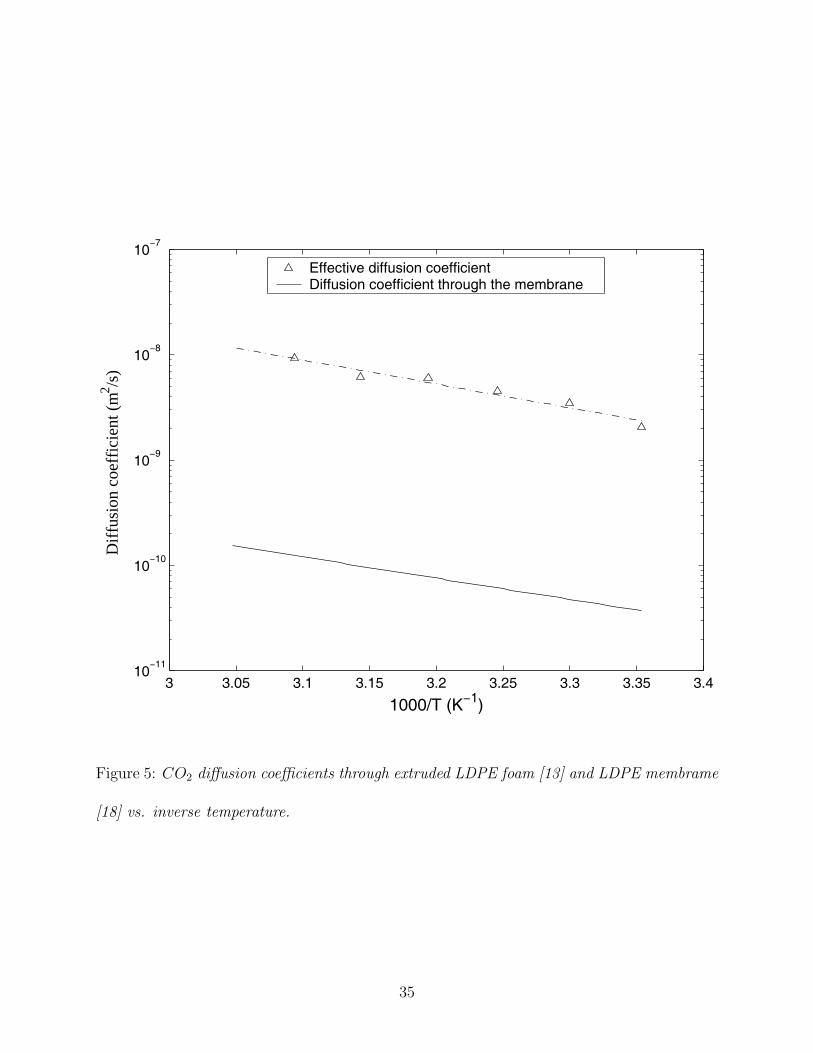
Temperature Dependence of the Effective Diffusion Coefficient
Temperature has been identified as having a significant influence on the effective gas diffusion
coefficient through closed-cell foams [2]. In some cases the effective diffusion coefficient
can change by one order of magnitude when the temperature is increased from 25oC to
80oC [2, 11]. Figure 5 shows the temperature dependence of the effective diffusion coefficient
of carbon dioxide through an extruded low density polyethylene (LDPE) foam [13] and the
diffusion coefficient of carbon dioxide through a polyehtylene membrane obtained in the
literature [18]. One can observe that both lines have practically the same slopes, and this
is in agreement with the trend predicted by the theoretical model developed in this study
assuming that the variation of the geometric factor with temperature is negligible (i.e., no
thermal expansion/construction occurs). Indeed, Equation (25) states that the slope of the
ln(Deff |f,i) vs. 1/T plot and the slope of the ln(Dc,i) vs. 1/T plot should be the same. Note
that for the cases when a temperature gradient exists across the foam layer in the direction of
the diffusion flux, the discrete model can still be applied by approximating the temperature
20
gradient as a step function with constant but different average temperatures for each unit
cell in the foam layer.
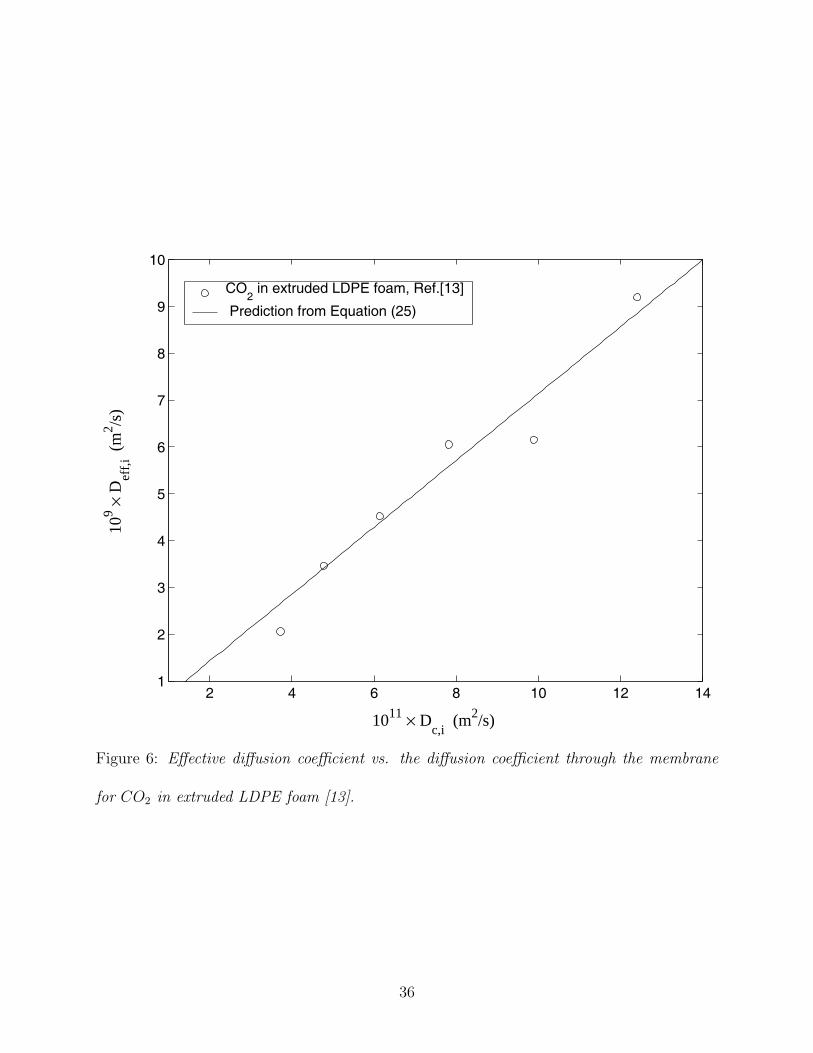
Geometric Factor
As evident from Equations (25) and (26) that the ratio of the foam effective diffusion coef-
ficient to the diffusion coefficient in the membrane is a geometric factor G(φ, n) depending
on the foam morphology only. A plot Deff |f,i(T ) vs. Dc,i(T ) should, therefore, feature a
straight line passing through the origin. Figure 6 depicts the experimental effective diffusion
coefficient for carbon dioxide in the extruded low density polyethylene foam [13] against the
diffusion coefficient through the membrane reported in the literature [18]. It appears that
Equation (25) is capable of correctly predict of the trend over the temperature range of 25oC
to 50oC within an error corresponding to the uncertainty in the experimental data.
Bart and Du Cauze de Nazelle [16] reported data for the effective diffusion coefficient and
the diffusion coefficient through the membrane for an unspecified polyurethane foam with
diffusing gases being oxygen, nitrogen, carbon dioxide, CFC-11 and CFC-22. It is interest-
ing to note that, in general, the geometric factor varies significantly from one gas to another
within the same foam. However, the low solubility gases in polyurethane foam, namely oxy-
gen and nitrogen, yield approximately the same geometric factors within the uncertainty of
the measurements. The geometric factors obtained for the other gases are higher by one to
two orders of magnitude without providing any clear trend. Earlier studies have shown that
the Henry’s law is not valid for CFC-11 in polyurethane foams due to its high solubility [7].
Note that for the polyurethane membrane considered, the solubilities of CO2, CFC-11, and
21
CFC-22 are of the same order of magnitude [16], indicating that Henry’s law may not be
applicable for any of these gases in polyurethane foams.
Due to the lack of consistent and complete set of experimental data, the proposed the-
oretical model can be only approximately validated indirectly. Specifically, Equation (26)
suggests that the geometric factor is the function of the foam porosity Γ(φ) divided by the
equivalent number of cubic cells in the foam layer in the diffusion direction, i.e.,
G(φ, n) =Γ(φ)
n(27)
Then, by considering two foam samples with different porosities but with the membrane
made of the same polymer material, the ratio of the effective diffusion coefficients should be
independent of the temperature and equals to the ratio of the geometric factors only:
Deff |f1,i
Deff |f2,i
=G(φ1, n1)
G(φ2, n2)(28)
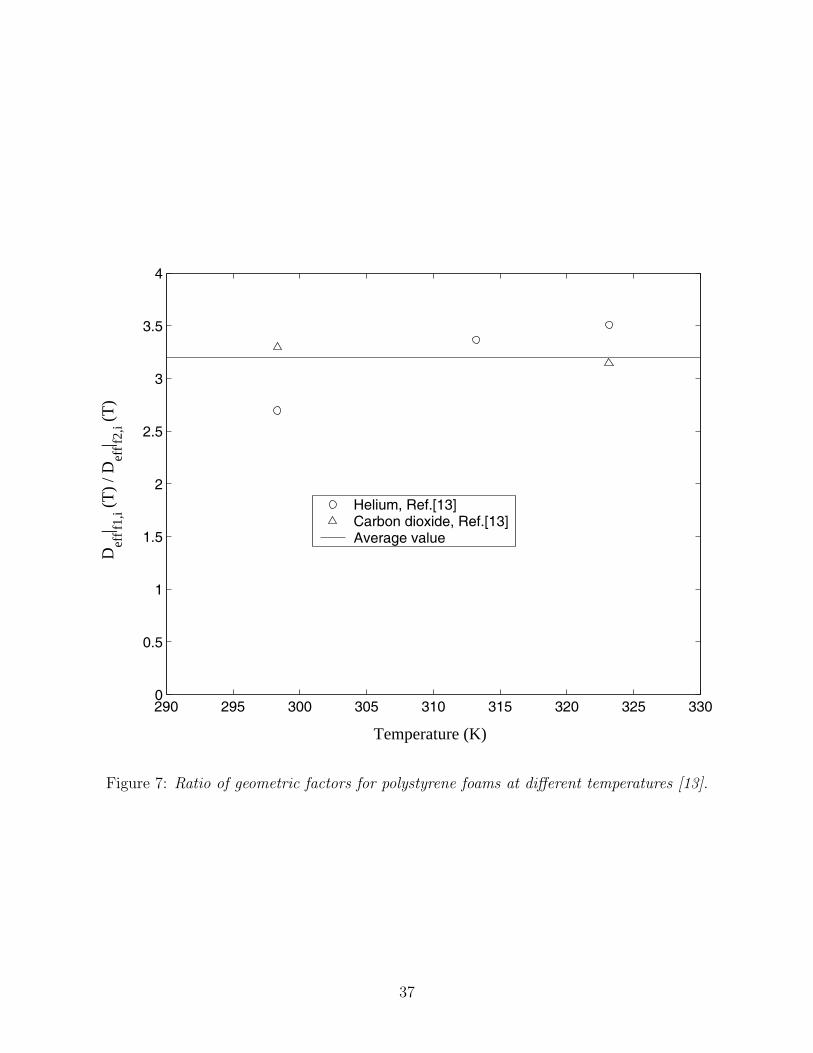
Figure 7 shows the ratio of the geometric factors computed from the experimental data [13]
for diffusion of CO2 and He through two similar polystyrene foams having different porosi-
ties, 0.974 and 0.917. The effective diffusion coefficients through the two samples are quite
different as well as the porosities, but one can note that the geometric factor appears to be
practically independent of the temperature and of the nature of the gas.
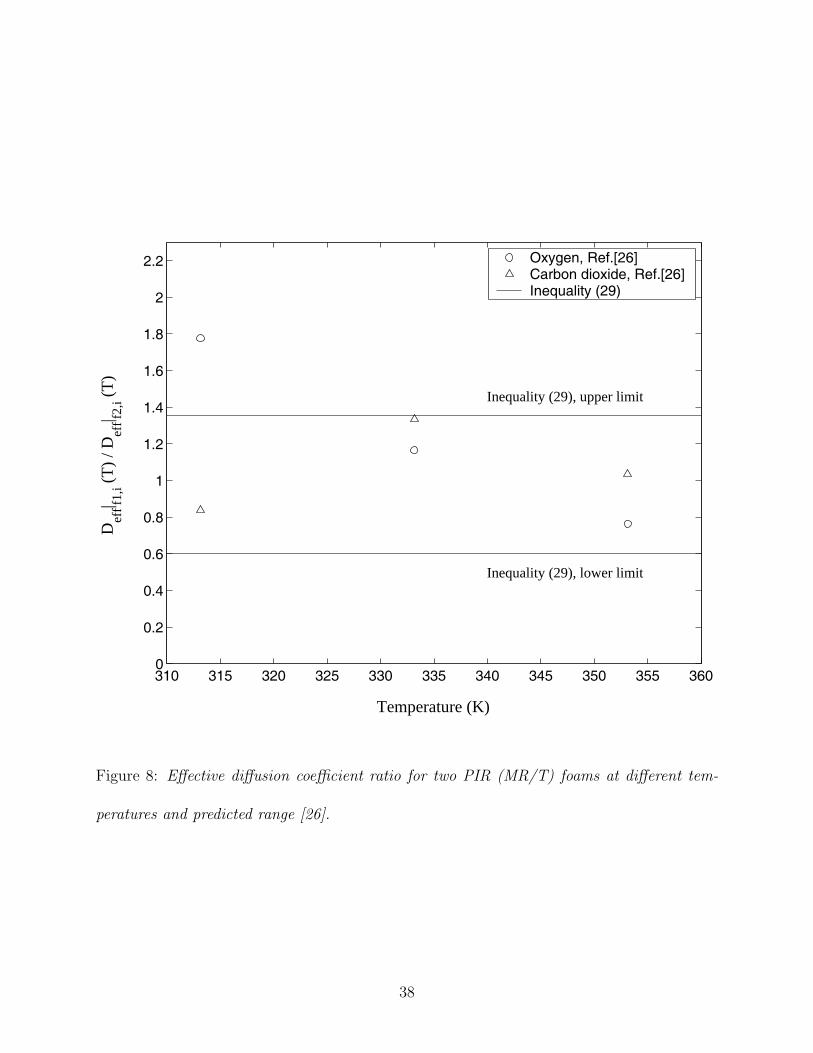
The same analysis has been performed using the experimental data for two polyisocya-
nurate foam samples (samples 17 and 18) containing between 10 to 15 cells and made of
terate-203-mutranol-9171 (T) as the polyol and the isocyanate Mondur [26]. Figure 8 shows
the experimentally determined ratio of the effective diffusion coefficients through the two
foams for oxygen and carbon dioxide. The same ratio has been predicted from Equation
(27) by assuming, as a first approximation, that the equivalent number of cubic cells is the
22
same as the number of cells in the real foam. Then, considering the limiting cases for which
one foam has 10 cells while the other has 15 cells and vice versa, the ratio of the effective
diffusion coefficients should vary between the following limits:
10
15
Γ(φ1)
Γ(φ2)≤ Deff |f1,i
Deff |f2,i
≤ 15
10
Γ(φ1)
Γ(φ2)(29)
where the values for the porosity function Γ(φ) are 154.9 and 134.9 for samples 17 and 18,
respectively. As noted on Figure 8), inequality (29) predicts the correct range for the ratio
of the effective diffusion coefficients for two different gases in foam samples made of the same
condensed phase. These results, using the reported number of cells across the foam layer
as the equivalent number of cubic cells n, tend to confirm the theoretical model developed.
Unfortunately, experimental data providing the precise number of closed-cells across the
foam layer are not available.
CONCLUSIONS
This paper deals with an analysis of the gas diffusion process through closed-cell foams. A
theoretical model has been developed for predicting the effective diffusion coefficient of the
weakly soluble, low pressure gases through solid and wet foams based on the first princi-
ples. The analysis suggests that the effective diffusion coefficient through the foam can be
expressed as a product of the geometric factor and the gas diffusion coefficient through the
foam membrane. The model has been validated by comparing its predictions with available
experimental data, and the following conclusions can be drawn:
• No consistent and complete set of data is available in the literature for comprehensive
model validation. In particular, the reported experimental data lack information on
23
the temperature dependence of the diffusion coefficient in the polymer membrane and
on the average number of unit cell in the foam layer. This data is critically important
for the development of reliable foam diffusion models.
• The available data for different types of polymeric foams support the validity of the
model developed both qualitatively and quantitatively. Discrepancies between the
model predictions and experimental data have been observed for gases with high sol-
ubility in the condensed phase for which Henry’s law does not apply.
• Further work is needed to extend the analysis from ideal gases to real gases as well
as to perform accurate and consistent model validations through carefully designed
experiments.
ACKNOWLEDGEMENTS
This work was supported by the US Department of Energy/ Glass Industry/ Argonne Na-
tional Laboratory/ University collaborative research project. The authors are indebted to
the glass industry representatives for numerous technical discussions and exchange of infor-
mation.
24
References
[1] D. Klempner and K. C. Frisch. 1991. Handbook of polymeric foams and foam technology.
Munich, Hanser Publishers.
[2] A. G. Ostrogorsky and L. R. Glicksman. 1988. “Rapid, steady-state measurement of
the effective diffusion coefficient of gases in closed-cell foams”. Journal of Heat Transfer,
110: 500–506.
[3] A. G. Ostrogorsky and L. R. Glicksman. 1988. “Electrical analogy of gas diffusion in
closed-cell foams”. Journal of Cellular Plastics, 24: 215–230.
[4] P. R. Laimbock. 1998. Foaming of glass melts. PhD thesis, Technical University of
Eindhoven, Eindhoven, The Netherlands.
[5] J. Kappel, R. Conradt, and H. Scholze. 1987. “Foaming behavior on glass melts”.
Glastechnische Berichte, 60, no.6: 189–201.
[6] A. G. Ostrogorsky and L. R. Glicksman. 1986. “Aging of polyurethane foams”. Inter-
national Journal of Heat and Mass Transfer, 29, no. 8: 1169–1176.
[7] D. A. Brandreth. 1997. “Insulation foam aging - a review of the relevant physical phe-
nomena”, in Improved Thermal Insulation: Problems and Perspectives, D. A. Brandreth,
Ed., Technomic Pub., Lancaster, PA.
[8] A Bhakta and E. Ruckenstein. 1997. “Decay of standing foams: drainage, coalescence
and collapse”. Advances in Colloid and Interface Science, 70: 1–124.
25
[9] G. M. R. du Cauze de Nazelle, G. C. J. Bart, A. J. Damners, and A Cunningham.
Sept. 1989. “A fundamental characterization of the ageing of polyurethane rigid foam”,
in International Workshop on Long-Term Thermal Performance of Cellular Platics,
Huntsville, Ontario, Canada.
[10] I. R. Shankland. 1986. “Diffusion of gases in closed-cell foams: a comparison of exper-
iment with theory”, in Annual Technical Conference ANTEC ’86, Society of Plastics
Engineers, Boston, MA.
[11] M. C. Page and L. R. Glicksman. 1992. “Measurements of diffusion coefficients of
alternate blowing agents in closed cell foam insulation”. Journal of Cellular Plastics,
28: 268–283.
[12] Y. Fan and E. Kokko. 1997. “Measurement of gaseous diffusion within zero ODP cellular
plastic insulation”. Journal of Cellular Plastics, 33: 72–90.
[13] I. R. Shankland. 1990. “Measurement of gas diffusion in closed-cell foams”, in Insula-
tion Materials: Testing and Applications, ASTM STP 1030, D. L. McElroy and J. F.
Kimpflen, Eds., American Society for Testing and Materials, Philadelphia, PA.
[14] D. W. Reitz, M. A. Schuetz, and L.R. Glicksman. 1984. “A basic of aging of foam
insulation”. Journal of Cellular Plastics, 20: 104–113.
[15] S. Alsoy. 1999. “Modeling of diffusion in closed cell polymeric foams”. Journal of
Cellular Plastics, 35: 247–271.
[16] G. C. J. Bart and G. M. R. du Cauze de Nazelle. 1993. “Certification of the thermal
conductivity aging of PUR foam”. Journal of Cellular Plastics, 29: 29–42.
26
[17] G. C. J. Bart. 2000. “Comments on a paper in Journal of Cellular Plastics, vol. 29,
1993, pp.29-42”. Personal communications.
[18] J. Brandrup, E. H. Immergut, and Eds. E. A. Grulke. 1999. Polymer handbook, Fourth
edition. New York, John Wiley & Sons.
[19] M. B. King. 1969. Phase equilibrium in mixtures. Oxford, Pergamon Press.
[20] R. B. Bird, W.E. Stewart, and E. N. Lightfoot. 1960. Transport Phenomena. New York,
John Wiley & Sons.
[21] I. M. Klotz and R. M. Rosenberg. 1991. Chemical thermodynamics. Malabar, FL,
Krieger Publishing Company.
[22] F. P. Incropera and D. P. De Witt. 1996. Fundamentals of heat and mass transfer,
Fourth edition. New York, John Wiley & Sons.
[23] G. P. Mitilas and M. K. Kumaran. 1991. “Methods to calculate gas diffusion coefficients
of cellular plastic insulation from experimental data on gas absorption”. Journal of
Thermal Insulation, 14: 342–357.
[24] B. J. Briscoe and T. Savvas. 1998. “Gas diffusion in dense poly(ethylene) foams”.
Advances in Polymer Technology, 17, no.2: 87–106.
[25] W. A Kaplan and R. L. Tabor. 1994. “The effect of polymer structure on the gas
permeability of model polyurethanes”. Journal of Cellular Plastics, 30: 242–272.
27
[26] M. C. Page. 1991. “Effects of alternate blowing agents on the aging of closed-cell foam
insulation”. MS thesis, Department of Mechanical Engineering, Massachusetts Institute
of Technology, Cambridge, MA.
[27] E. Kokko. 1999. “Comments on a paper in Journal of Cellular Plastics, vol. 33, 1997,
pp.72-90”. Personal communication.
[28] M. Svantrom, O. Ramnas, M. Olsson, and U. Jarfelt. 1997. “Determination of effective
diffusion coefficients in rigid polyurethane foam”. Cellular Polymers, 16, no.3: 182–193.
[29] J. R. Booth and D. Bhattarcharjee. 1997. “The effective diffusivity of cyclopentane
and n-pentane in PU and PUIR foams by thin-slice gravimetric analysis”. Journal of
Thermal Insulation and Building Envelops, 20: 339–349.
[30] J. R. Booth. 1991. “Some factors affecting the long-term thermal insulating performance
of extruded polystyrene foams”, in Insulation Materials: Testing and Applications Vol.
2, ASTM STP 1116, R.S. Graves and D. C. Wysocki, Eds., American Society for Testing
and Materials, Philadelphia, PA.
28
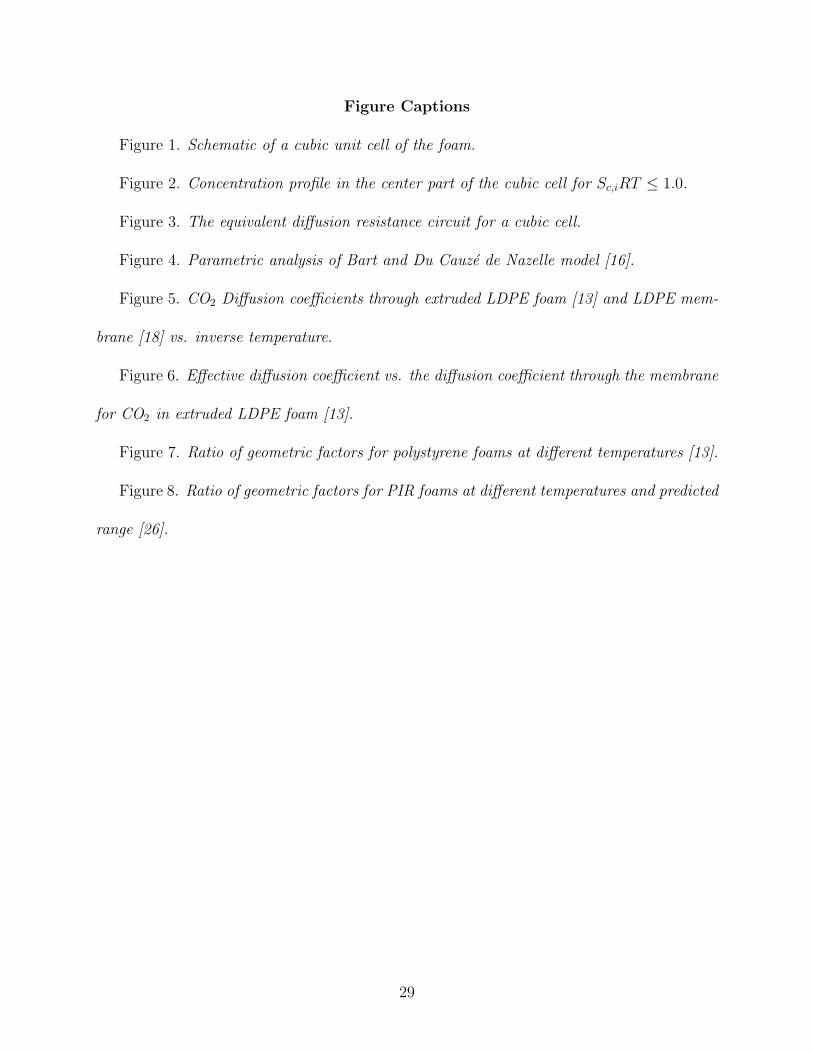
Figure Captions
Figure 1. Schematic of a cubic unit cell of the foam.
Figure 2. Concentration profile in the center part of the cubic cell for Sc,iRT ≤ 1.0.
Figure 3. The equivalent diffusion resistance circuit for a cubic cell.
Figure 4. Parametric analysis of Bart and Du Cauze de Nazelle model [16].
Figure 5. CO2 Diffusion coefficients through extruded LDPE foam [13] and LDPE mem-
brane [18] vs. inverse temperature.
Figure 6. Effective diffusion coefficient vs. the diffusion coefficient through the membrane
for CO2 in extruded LDPE foam [13].
Figure 7. Ratio of geometric factors for polystyrene foams at different temperatures [13].
Figure 8. Ratio of geometric factors for PIR foams at different temperatures and predicted
range [26].
29
k ji
L
AAb A-A
L
LMass
diffusion
Figure 1: Schematic of a cubic unit cell of the foam.
30
3,i
C2,i
C4,i
z
0
b
L
L-2b
Massconcentration
3,iS RTCc,i
C1,i
S RTC4,ic,i
Gas phase
1,iC > C 2,i
C2,i
C
Figure 2: Concentration profile in the center part of the cubic cell for Sc,iRT ≤ 1.0.
31
C1,i
C2,i
Rm1,i Rm2,i
jm,i
jm1,i jm2,i
Figure 3: The equivalent diffusion resistance circuit for a cubic cell.
32
Table Captions
Table 1. Compilation of experimental studies on gas effective diffusion coefficient through
polyurethane (PUR) and related polyisocyanurate (PIR) foams.
Table 2. Compilation of experimental studies on gas diffusion through polymeric foams
other than PUR and PIR foams.
33
0 0.1 0.2 0.3 0.4 0.5 0.6 0.7 0.8 0.9 110
0
101
102
103
104
φ
Def
f,i /
Dc,
i
Equation (6) for Sc,i
RT=0.1 Equation (6) for S
c,iRT=1
Equation (6) for Sc,i
RT=10
Present work
Figure 4: Parametric analysis of Bart and Du Cauze de Nazelle model [16].
34
3 3.05 3.1 3.15 3.2 3.25 3.3 3.35 3.410
−11
10−10
10−9
10−8
10−7
Dif
fusi
on c
oeff
icie
nt (
m2 /s
)
1000/T (K−1)
Effective diffusion coefficient Diffusion coefficient through the membrane
Figure 5: CO2 diffusion coefficients through extruded LDPE foam [13] and LDPE membrame
[18] vs. inverse temperature.
35
2 4 6 8 10 12 141
2
3
4
5
6
7
8
9
10
1011 × Dc,i
(m2/s)
109 ×
Def
f,i (
m2 /s
)
CO2 in extruded LDPE foam, Ref.[13]
Prediction from Equation (25)
Figure 6: Effective diffusion coefficient vs. the diffusion coefficient through the membrane
for CO2 in extruded LDPE foam [13].
36
290 295 300 305 310 315 320 325 3300
0.5
1
1.5
2
2.5
3
3.5
4
Temperature (K)
Def
f| f1,i (
T)
/ Def
f| f2,i (
T)
Helium, Ref.[13] Carbon dioxide, Ref.[13] Average value
Figure 7: Ratio of geometric factors for polystyrene foams at different temperatures [13].
37
310 315 320 325 330 335 340 345 350 355 3600
0.2
0.4
0.6
0.8
1
1.2
1.4
1.6
1.8
2
2.2
Def
f| f1,i (
T)
/ Def
f| f2,i (
T)
Temperature (K)
Inequality (29), upper limit
Inequality (29), lower limit
Oxygen, Ref.[26] Carbon dioxide, Ref.[26] Inequality (29)
Figure 8: Effective diffusion coefficient ratio for two PIR (MR/T) foams at different tem-
peratures and predicted range [26].
38
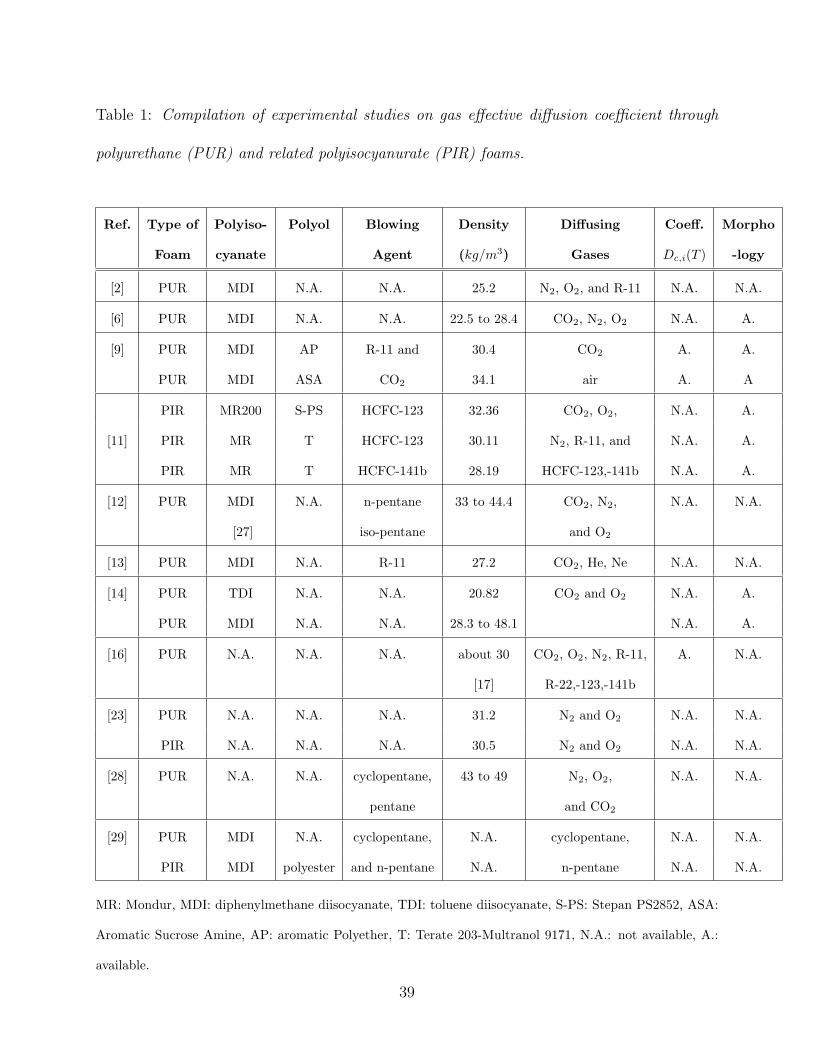
Table 1: Compilation of experimental studies on gas effective diffusion coefficient through
polyurethane (PUR) and related polyisocyanurate (PIR) foams.
Ref. Type of Polyiso- Polyol Blowing Density Diffusing Coeff. Morpho
Foam cyanate Agent (kg/m3) Gases Dc,i(T ) -logy
[2] PUR MDI N.A. N.A. 25.2 N2, O2, and R-11 N.A. N.A.
[6] PUR MDI N.A. N.A. 22.5 to 28.4 CO2, N2, O2 N.A. A.
[9] PUR MDI AP R-11 and 30.4 CO2 A. A.
PUR MDI ASA CO2 34.1 air A. A
PIR MR200 S-PS HCFC-123 32.36 CO2, O2, N.A. A.
[11] PIR MR T HCFC-123 30.11 N2, R-11, and N.A. A.
PIR MR T HCFC-141b 28.19 HCFC-123,-141b N.A. A.
[12] PUR MDI N.A. n-pentane 33 to 44.4 CO2, N2, N.A. N.A.
[27] iso-pentane and O2
[13] PUR MDI N.A. R-11 27.2 CO2, He, Ne N.A. N.A.
[14] PUR TDI N.A. N.A. 20.82 CO2 and O2 N.A. A.
PUR MDI N.A. N.A. 28.3 to 48.1 N.A. A.
[16] PUR N.A. N.A. N.A. about 30 CO2, O2, N2, R-11, A. N.A.
[17] R-22,-123,-141b
[23] PUR N.A. N.A. N.A. 31.2 N2 and O2 N.A. N.A.
PIR N.A. N.A. N.A. 30.5 N2 and O2 N.A. N.A.
[28] PUR N.A. N.A. cyclopentane, 43 to 49 N2, O2, N.A. N.A.
pentane and CO2
[29] PUR MDI N.A. cyclopentane, N.A. cyclopentane, N.A. N.A.
PIR MDI polyester and n-pentane N.A. n-pentane N.A. N.A.
MR: Mondur, MDI: diphenylmethane diisocyanate, TDI: toluene diisocyanate, S-PS: Stepan PS2852, ASA:
Aromatic Sucrose Amine, AP: aromatic Polyether, T: Terate 203-Multranol 9171, N.A.: not available, A.:
available.
39
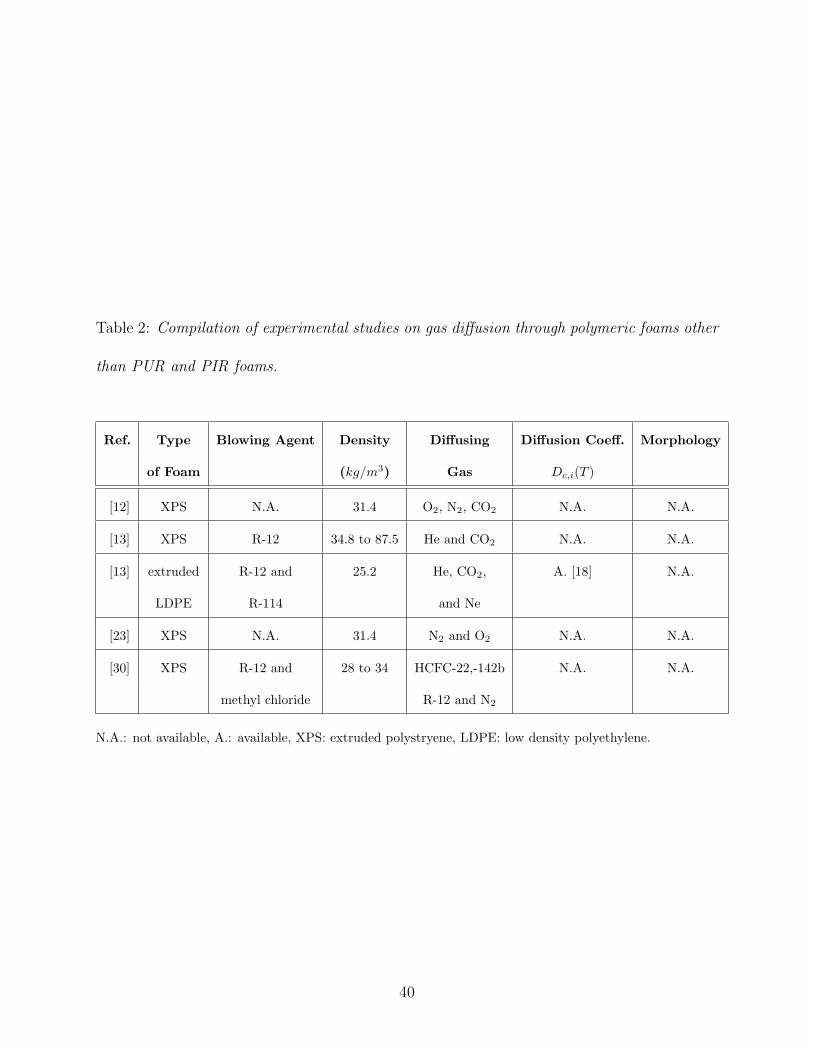
Table 2: Compilation of experimental studies on gas diffusion through polymeric foams other
than PUR and PIR foams.
Ref. Type Blowing Agent Density Diffusing Diffusion Coeff. Morphology
of Foam (kg/m3) Gas Dc,i(T )
[12] XPS N.A. 31.4 O2, N2, CO2 N.A. N.A.
[13] XPS R-12 34.8 to 87.5 He and CO2 N.A. N.A.
[13] extruded R-12 and 25.2 He, CO2, A. [18] N.A.
LDPE R-114 and Ne
[23] XPS N.A. 31.4 N2 and O2 N.A. N.A.
[30] XPS R-12 and 28 to 34 HCFC-22,-142b N.A. N.A.
methyl chloride R-12 and N2
N.A.: not available, A.: available, XPS: extruded polystryene, LDPE: low density polyethylene.
40
Related Documents