Gas Cleanup Technologies Suitable for Biomass Gasification to Liquid Fuels Scott J. Olson 1 , Binh Nguyen-Phuoc 1 and Kelly Ibsen 2 , (1)Energy Technology, Nexant, Inc., 101 Second St., 10th Floor, San Francisco, CA 94105, (2)National Bioenergy Center, National Renewable Energy Laboratory, 1617 Cole Blvd, Golden, CO 80401 2006 AIChE National Meeting San Francisco, California

Welcome message from author
This document is posted to help you gain knowledge. Please leave a comment to let me know what you think about it! Share it to your friends and learn new things together.
Transcript

Gas Cleanup Technologies Suitable for Biomass Gasification to Liquid Fuels
Scott J. Olson1, Binh Nguyen-Phuoc1 and Kelly Ibsen2, (1)Energy Technology, Nexant, Inc., 101 Second St., 10th Floor, San Francisco, CA 94105, (2)National
Bioenergy Center, National Renewable Energy Laboratory, 1617 Cole Blvd, Golden, CO 80401
2006 AIChE National Meeting
San Francisco, California

Contents Sections Page
Executive Summary................................................................................................................ ES-1 Introduction and Methodology.................................................................................................... 1 Section 1 Process Selection Rationale................................................................................... 1-1
1.1 Introduction.................................................................................................................. 1-1 1.2 Process Description and Rationale............................................................................... 1-2
1.2.1 Low-Pressure Syngas Process Description.......................................................... 1-3 1.2.2 High-Pressure Syngas Process Description ......................................................... 1-5
1.3 Discussion.................................................................................................................... 1-6 1.3.1 Technologies Not Chosen.................................................................................... 1-6
Section 2 Equipment Design and Cost Estimates ................................................................ 2-1 2.1 Introduction and Methodology .................................................................................... 2-1 2.2 Key Design Assumptions............................................................................................. 2-2
2.2.1 Sulfur and CO2 Removal ..................................................................................... 2-2 2.2.2 Tar Reforming...................................................................................................... 2-2 2.2.3 Cyclones............................................................................................................... 2-3 2.2.4 Heat Integration ................................................................................................... 2-3 2.2.5 Methanol Compressor.......................................................................................... 2-3
2.3 Operating Costs and Utility Requirements .................................................................. 2-3 2.4 Differences with NREL Biomass to Hydrogen Design ............................................... 2-6
2.4.1 Added Equipment to Chemicals Design.............................................................. 2-6 2.4.2 Increase in Steel Price.......................................................................................... 2-7 2.4.3 Engineering Assumptions .................................................................................... 2-7
2.5 Changing Flows, Conditions, and Compositions......................................................... 2-9 2.5.1 Flowrate Impacts.................................................................................................. 2-9 2.5.2 Composition Impacts ......................................................................................... 2-12
2.6 Follow-Up and Areas for Further Study .................................................................... 2-12 Section 3 Labor Requirements.............................................................................................. 3-1
3.1 Summary ...................................................................................................................... 3-1 3.2 Labor Requirements..................................................................................................... 3-1 3.3 Differences with Emery Energy 70 MWe Case........................................................... 3-4 3.4 Differences with NREL Biomass to Hydrogen Case................................................... 3-4

Contents
Tables and Figures
Table A Syngas Clean-Up Case Summary .............................................................................. ES-2 Table 1-1 Syngas Compositions and Operating Parameters....................................................... 1-1 Table 1-2 Gas Cleanup Requirements ........................................................................................ 1-2 Figure 1-1 General Syngas Clean-Up Process Flow................................................................... 1-2 Table 1-3 Tar Reformer Performance......................................................................................... 1-3 Table 2-1 Catalyst and Chemical Requirements......................................................................... 2-4 Table 2-2 High-Pressure Case Utility Requirements.................................................................. 2-5 Table 2-3 Low-Pressure Case Utility Requirements .................................................................. 2-5 Table 2-4 Examples of Typical Exponents for Equipment Cost Versus Capacity .................. 2-11 Table 3-1 Labor Costs................................................................................................................. 3-3

Executive Summary
In this task, the design team investigated the appropriate process scheme for treatment of wood derived syngas for use in the synthesis of liquid fuels. Two different 2,000 metric tonne per day gasification schemes, a low-pressure, indirect system using the BCL gasifier, and a high-pressure, direct system using GTI gasification technology, were evaluated. Initial syngas conditions from each of the gasifiers was provided to the team by NREL. Nexant was the prime contractor and principal investigator during this task; technical assistance was provided by both GTI and Emery Energy.
The first task explored the different process options available for the removal of the main process impurities, including particulates, sulfur, carbon dioxide, tar, ammonia, and metals. From this list, selection of commercial technologies appropriate for syngas clean-up was made based on the criteria of cost and the ability to meet the final specifications. Preliminary flow schemes were established and presented to NREL; after discussion and modification, final designs, including unit sizes, energy use, capital and operating costs, and labor requirements, were developed. Finally, Nexant performed an analysis to determine how changes in syngas flowrates and compositions would impact the designs, for future reference as the plant size changes.
The technologies chosen for both cases did not differ considerably. Each case possesses the following pieces of equipment:
Cyclones for particulate removal
Tar cracking for the removal of heavy and light hydrocarbons. Steam is injected in varying amounts into the tar cracker to set the appropriate hydrogen to carbon monoxide ratio.
Syngas cooling, necessary for downstream sulfur treatment, and a water quench/venturi scrubber for ammonia and trace contaminant removal
Amine treatment for sulfur and carbon dioxide removal
Zinc oxide beds for additional sulfur removal down to the low levels required for fuels synthesis
Liquid phase oxidation of acid gas for sulfur recovery
The low-pressure gasifier case required the use of a process gas compressor to raise the gas pressure to the level appropriate for downstream treatment and product synthesis. Information was also provided for the level of clean syngas compression necessary to prepare both cases for methanol synthesis.
The results of the analysis for both cases can be seen in Table A below, with information on the capital and operating costs:
Executive Summary
TABLE A SYNGAS CLEAN-UP CASE SUMMARY
Low-Pressure BCL Gasifier
High-Pressure GTI Gasifier
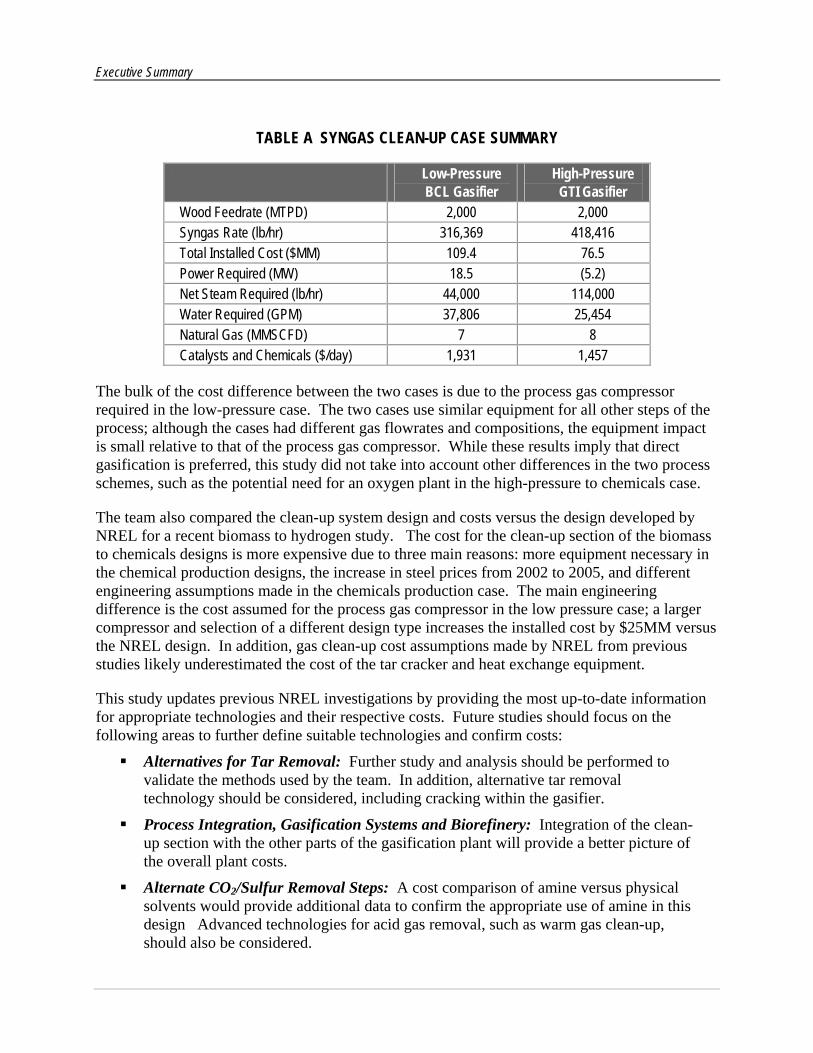
Wood Feedrate (MTPD) 2,000 2,000 Syngas Rate (lb/hr) 316,369 418,416 Total Installed Cost ($MM) 109.4 76.5 Power Required (MW) 18.5 (5.2) Net Steam Required (lb/hr) 44,000 114,000 Water Required (GPM) 37,806 25,454 Natural Gas (MMSCFD) 7 8 Catalysts and Chemicals ($/day) 1,931 1,457
The bulk of the cost difference between the two cases is due to the process gas compressor required in the low-pressure case. The two cases use similar equipment for all other steps of the process; although the cases had different gas flowrates and compositions, the equipment impact is small relative to that of the process gas compressor. While these results imply that direct gasification is preferred, this study did not take into account other differences in the two process schemes, such as the potential need for an oxygen plant in the high-pressure to chemicals case.
The team also compared the clean-up system design and costs versus the design developed by NREL for a recent biomass to hydrogen study. The cost for the clean-up section of the biomass to chemicals designs is more expensive due to three main reasons: more equipment necessary in the chemical production designs, the increase in steel prices from 2002 to 2005, and different engineering assumptions made in the chemicals production case. The main engineering difference is the cost assumed for the process gas compressor in the low pressure case; a larger compressor and selection of a different design type increases the installed cost by $25MM versus the NREL design. In addition, gas clean-up cost assumptions made by NREL from previous studies likely underestimated the cost of the tar cracker and heat exchange equipment.
This study updates previous NREL investigations by providing the most up-to-date information for appropriate technologies and their respective costs. Future studies should focus on the following areas to further define suitable technologies and confirm costs:
Alternatives for Tar Removal: Further study and analysis should be performed to validate the methods used by the team. In addition, alternative tar removal technology should be considered, including cracking within the gasifier.
Process Integration, Gasification Systems and Biorefinery: Integration of the clean-up section with the other parts of the gasification plant will provide a better picture of the overall plant costs.
Alternate CO2/Sulfur Removal Steps: A cost comparison of amine versus physical solvents would provide additional data to confirm the appropriate use of amine in this design Advanced technologies for acid gas removal, such as warm gas clean-up, should also be considered.

Executive Summary
Other Impurities in the Syngas: If it is deemed that the level of items such as metals and halides entering the scrubber will not adversely impact the FT or methanol catalysts, this step could be removed.
Introduction and Methodology
This study provides designs and costs for cleaning wood derived syngas in preparation for feed to liquid fuel synthesis units. Two different starting conditions, one with syngas derived from a low-pressure, indirect gasifier, and one from a high-pressure, direct gasifier, were evaluated. The goal was to provide NREL with a complete design package, including process flow diagrams, equipment specification sheets, mass and energy balances, capital and operating costs, and labor requirements, that can be used to evaluate the feasibility of biomass to chemicals technologies. The study also addressed how the designs would be impacted by changing flowrates and syngas compositions, so that the designs could be adapted to other process conditions.
The work was divided into three main task areas. The first Subtask (2.1) presented a list of possible gas clean-up technologies, with recommendations provided for the most suitable ones for additional analysis. Next, preliminary process flow diagrams were developed, along with an initial material balance (Subtasks 2.2.1 and 2.2.2). This was reviewed with NREL, and modifications made before the final design work began. The final phase consisted of performing equipment sizing, development of costs, and scaling analysis (Subtasks 2.2.3 through 2.2.7).
A variety of resources were used throughout the project to produce the final designs. In gathering the initial technology data, previous team studies, literature reviews, vendor information, and NREL input were all used to establish the items for consideration. Vendors and R&D facilities were especially helpful in providing data for novel technologies, such as tar cracking and liquid phase sulfur oxidation. Team members involved in biomass gasification, GTI and Emery Energy, provided valuable insight on reliability and feasibility issues.
HYSYS was used for modeling the overall process, with vendor input for specialty equipment. Design and performance of the amine system, LO-CATTM unit, tar cracker, and process gas compressor were provided by vendors and estimated through other modeling work. All other process equipment was sized by the HYSYS program. Since the basis for the tar cracker, the NREL TCPDU, is not commercial, data from NREL was used, along with assumptions for bed fluidization needs and heat transfer requirements to produce a size estimate. Greater detail for the assumptions made can be found in Section 2.
Costing was performed in a similar fashion as design, with commercially available software, ICARUS, used for much of the equipment sized using HYSYS. All cost estimates use a second quarter 2005 basis. Quotes were obtained from vendors for unique and capitally intensive items, such as the process gas compressor, cyclones, ZnO beds, and LO-CATTM unit. Industry derived cost curves were used for the amine system and as a check on other process items. Operating costs were developed from vendor supplied information and the energy balance. Finally, labor requirements are derived from a scale-up of a detailed study by Emery Energy specific to biomass gasification. For all results, comparisons were made throughout the study to results from previously developed NREL reports.
Section 1 Process Selection Rationale
1.1 INTRODUCTION The initial task for the Nexant team was to identify and evaluate all commercially available technology for clean-up of wood derived syngas. After a review of technology options with NREL, flow schemes were developed for both the high and low pressure cases. The result of this analysis and justification for the technologies chosen is detailed in this section.
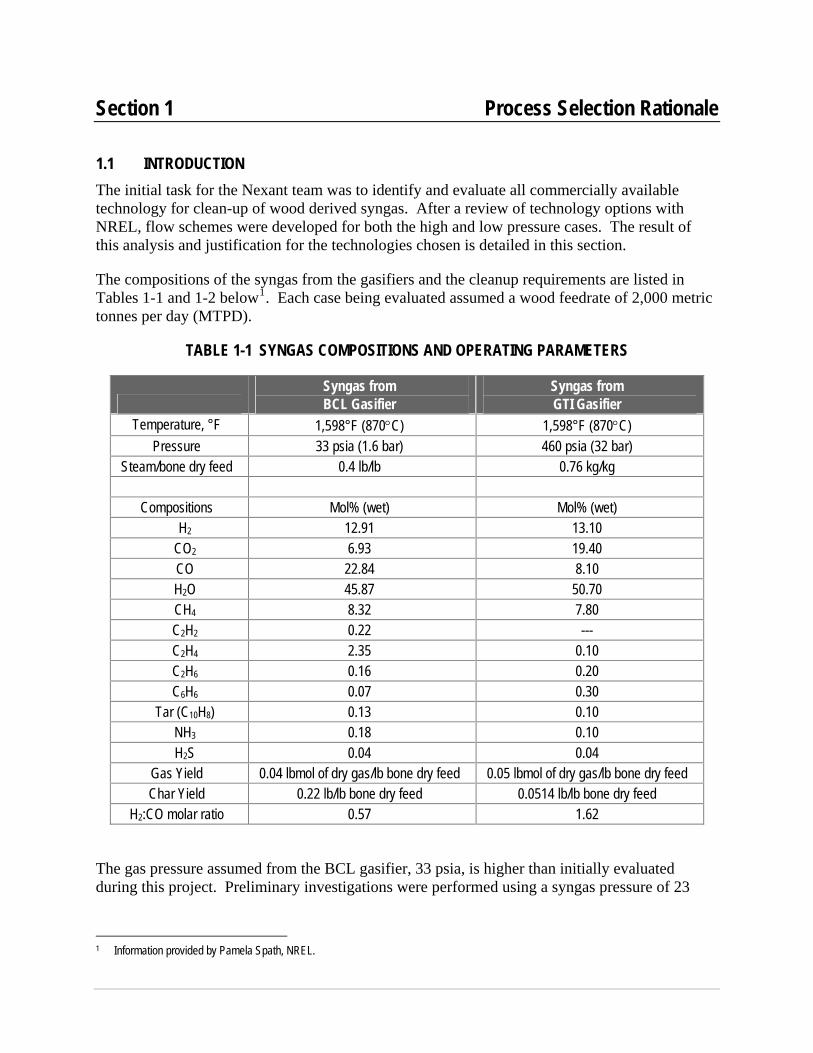
The compositions of the syngas from the gasifiers and the cleanup requirements are listed in Tables 1-1 and 1-2 below1. Each case being evaluated assumed a wood feedrate of 2,000 metric tonnes per day (MTPD).
TABLE 1-1 SYNGAS COMPOSITIONS AND OPERATING PARAMETERS
Syngas from BCL Gasifier
Syngas from GTI Gasifier
Temperature, °F 1,598°F (870°C) 1,598°F (870°C) Pressure 33 psia (1.6 bar) 460 psia (32 bar)
Steam/bone dry feed 0.4 lb/lb 0.76 kg/kg
Compositions Mol% (wet) Mol% (wet) H2 12.91 13.10
CO2 6.93 19.40 CO 22.84 8.10 H2O 45.87 50.70 CH4 8.32 7.80 C2H2 0.22 --- C2H4 2.35 0.10 C2H6 0.16 0.20 C6H6 0.07 0.30
Tar (C10H8) 0.13 0.10 NH3 0.18 0.10 H2S 0.04 0.04
Gas Yield 0.04 lbmol of dry gas/lb bone dry feed 0.05 lbmol of dry gas/lb bone dry feed Char Yield 0.22 lb/lb bone dry feed 0.0514 lb/lb bone dry feed
H2:CO molar ratio 0.57 1.62
The gas pressure assumed from the BCL gasifier, 33 psia, is higher than initially evaluated during this project. Preliminary investigations were performed using a syngas pressure of 23
1 Information provided by Pamela Spath, NREL.
Section 1 Process Selection Rationale
psia. Raising the pressure by 10 psia allows for a simpler and more reliable design, by allowing a water wash upstream of the compression stage.
TABLE 1-2 GAS CLEANUP REQUIREMENTS
Process Contaminants Level Source/Comment Sulfur 0.2 ppm
1 ppmv 60 ppb
Dry, 1981 Boerrigter, et al, 2002
Turk, et al, 2001 Halides 10 ppb Boerrigter, et al, 2002 Fischer-Tropsch Synthesis Nitrogen 10 ppmv NH3
0.2 ppmv NOx 10 ppb HCN
Turk, et al, 2001
Sulfur (not COS) <0.5 ppmv (<0.1 ppmv preferred)
Kung, 1992
Halides 0.001 ppmv Twigg and Spencer 2001 Methanol Synthesis
Fe and Ni 0.005 ppmv Kung, 1992
The main impurities in the syngas exiting the gasifier that must be removed are char, tars, hydrocarbons, sulfur, and CO2. In addition, trace contaminants such as ammonia, metals, halides, and alkali species were of sufficient concern that equipment was added to remove them as well. Finally, the syngas must also be adjusted to obtain the appropriate H2/CO ratio.
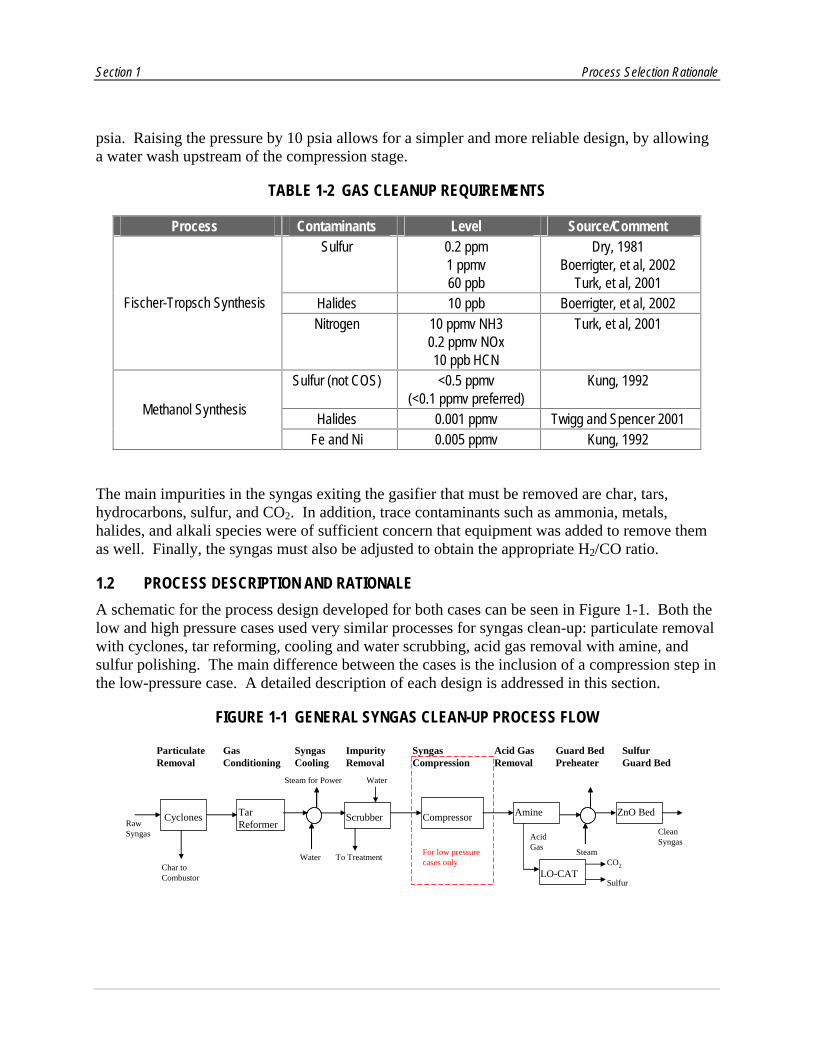
1.2 PROCESS DESCRIPTION AND RATIONALE A schematic for the process design developed for both cases can be seen in Figure 1-1. Both the low and high pressure cases used very similar processes for syngas clean-up: particulate removal with cyclones, tar reforming, cooling and water scrubbing, acid gas removal with amine, and sulfur polishing. The main difference between the cases is the inclusion of a compression step in the low-pressure case. A detailed description of each design is addressed in this section.
FIGURE 1-1 GENERAL SYNGAS CLEAN-UP PROCESS FLOW
CyclonesRaw Syngas
ScrubberTar Reformer
SyngasCooling
Water
LO-CATSulfur
Amine
CO2
ZnO Bed
Particulate Removal
Gas Conditioning
Syngas Compression
For low pressure cases onlyWater
Steam for Power
Char to Combustor
To Treatment
Impurity Removal
Compressor
Acid Gas Removal
Clean Syngas
Guard Bed Preheater
Sulfur Guard Bed
Steam
Acid Gas
Section 1 Process Selection Rationale
1.2.1 Low-Pressure Syngas Process Description Particulate Removal The syngas exiting the gasifier contains impurities that must be removed in order to meet the specifications required for methanol or FT synthesis. Cyclones are used as the initial step in the gas cleanup process to remove the bulk of the char entrained in the syngas stream. This technology is standard in industry due to its low cost and high level of performance for removing particulates. Syngas from the low-pressure gasifier is sent through four parallel cyclones operating at 1598°F and 33 psia.
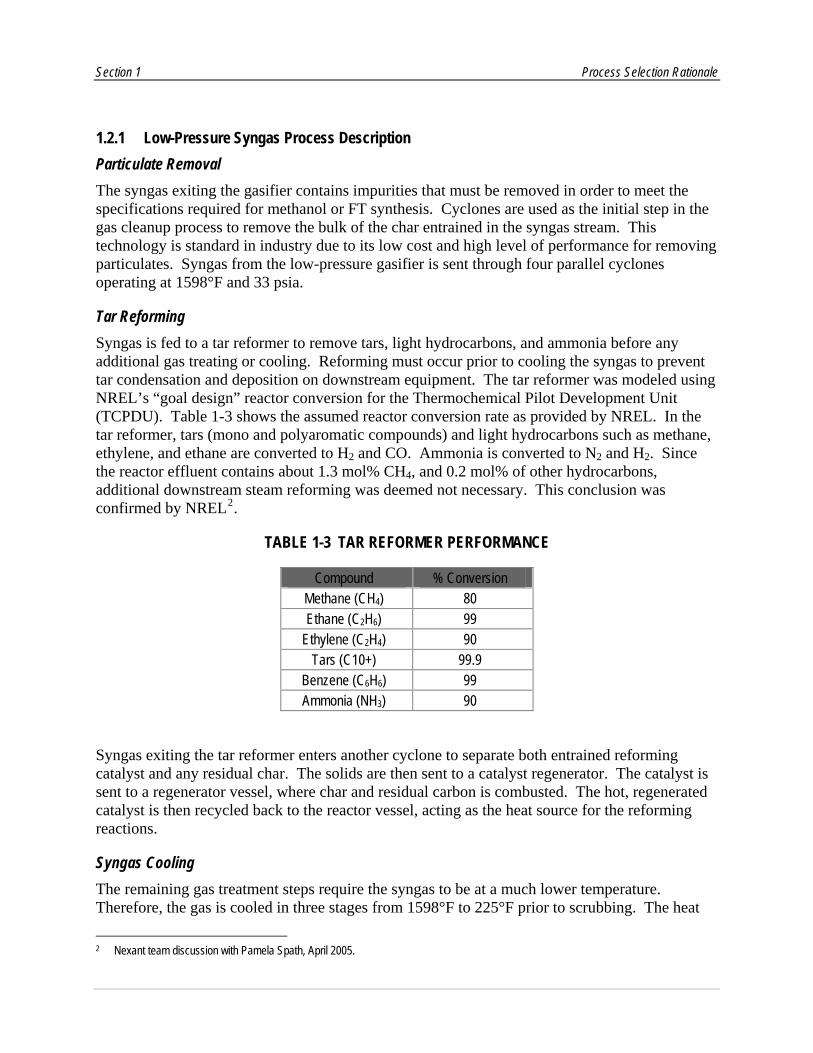
Tar Reforming Syngas is fed to a tar reformer to remove tars, light hydrocarbons, and ammonia before any additional gas treating or cooling. Reforming must occur prior to cooling the syngas to prevent tar condensation and deposition on downstream equipment. The tar reformer was modeled using NREL’s “goal design” reactor conversion for the Thermochemical Pilot Development Unit (TCPDU). Table 1-3 shows the assumed reactor conversion rate as provided by NREL. In the tar reformer, tars (mono and polyaromatic compounds) and light hydrocarbons such as methane, ethylene, and ethane are converted to H2 and CO. Ammonia is converted to N2 and H2. Since the reactor effluent contains about 1.3 mol% CH4, and 0.2 mol% of other hydrocarbons, additional downstream steam reforming was deemed not necessary. This conclusion was confirmed by NREL2.
TABLE 1-3 TAR REFORMER PERFORMANCE
Compound % Conversion Methane (CH4) 80 Ethane (C2H6) 99
Ethylene (C2H4) 90 Tars (C10+) 99.9
Benzene (C6H6) 99 Ammonia (NH3) 90
Syngas exiting the tar reformer enters another cyclone to separate both entrained reforming catalyst and any residual char. The solids are then sent to a catalyst regenerator. The catalyst is sent to a regenerator vessel, where char and residual carbon is combusted. The hot, regenerated catalyst is then recycled back to the reactor vessel, acting as the heat source for the reforming reactions.
Syngas Cooling The remaining gas treatment steps require the syngas to be at a much lower temperature. Therefore, the gas is cooled in three stages from 1598°F to 225°F prior to scrubbing. The heat
2 Nexant team discussion with Pamela Spath, April 2005.
Section 1 Process Selection Rationale
recovered from the process is used for steam generation throughout the system. The process design has been optimized as much as possible to use this steam, reducing the plant utility load. Integration was limited to the needs of the clean-up section; broader heat integration with the overall thermochemical platform or biomass refinery may lead to additional efficiency gains.
Scrubbing and Quench The syngas is sent to the Syngas Venturi Scrubber, C-200, to remove any remaining ammonia, particulates, metals, halides, or alkali remaining in the system. The water circulation rate to the scrubber is adjusted such that the exiting syngas is quenched to the appropriate temperature for feed to the first stage of the compressor.
Compression Any residual condensate in the syngas exiting the scrubber is removed in the Syngas Compressor KO Drum, V-300. The cooled syngas stream is compressed to 445 psia using a 4-stage centrifugal compressor with interstage cooling. The compressor is modeled assuming a horizontally split centrifugal design, with a polytropic efficiency of 78% and 110°F intercoolers. After discussion with compressor vendors3 and internal analysis by Nexant, it was determined that this type of compressor is appropriate for this gas flowrate, pressure ratio, and reliability requirements. While an integrally geared compressor was considered due to its lower cost, this type of compressor was not recommended due to the high flowrate and reliability required. The discharge pressure is designed such that the compressed gas is at the operating pressure range for FT synthesis.
Sulfur Removal Originally, the scheme developed was use of LO-CATTM and ZnO polishing for H2S removal, followed by amine for CO2 removal. After discussions with NREL, this was modified so that amine was used for both H2S and CO2 removal. The ZnO beds remained in the design as a guard/polishing step after the amine unit, while the LO-CATTM unit is now used to remove H2S from the acid gas stream. The benefit of this design is reduced load on both the LO-CATTM and ZnO units; the flow going to the LO-CATTM unit in this case is now only the acid gas stream instead of the entire syngas stream, and the inlet H2S concentration at the ZnO bed is expected to be lower. This should increase the lifespan of the ZnO catalyst.
The syngas exiting the gasifier contains ~400 ppmv of H2S. An amine unit with a high circulation rate can reduce the syngas sulfur concentration to below 10 ppmv, with a target of 2-3 ppmv. Due to the high amount of CO2 removal required, it is this component that drives the circulation rate and unit size, not H2S. The ZnO beds are used as a polishing step to reduce the sulfur concentration to the < 0.1 ppmv level required for methanol and FT synthesis. The gas exiting the amine absorber is heated to the operating temperature of the ZnO beds, 750°F.
For the low-pressure case, DEA was selected, while MDEA is used for the high-pressure case. This selection is based on design simulation runs by matching the desired CO2 and H2S removal
3 Consultation made with both Elliott Compressor and GE.
Section 1 Process Selection Rationale
requirements to the selectivity of the amine solvents. Attempts were also made to choose solvents that minimized net energy requirements.
Water-Gas Shift and CO2 Removal FT synthesis requires a H2/CO ratio of 2:1, and methanol synthesis requires the following stoichiometric ratio of H2, CO, and CO2:
(H2 – CO2) / (CO + CO2) = 2
The syngas stream exiting the ZnO beds has a H2/CO ratio of 1.7 and a stoichiometric ratio of 0.89, which are inadequate for FT or methanol synthesis. A combination of water injection into the tar cracker, followed by CO2 removal in the amine unit, has been selected to adjust these ratios. In methanol synthesis, H2 will react preferentially with CO2 over CO to form methanol. This results in a significantly lowered methanol yield, greatly impacting the process efficiency. In FT synthesis, CO2 acts as a diluent; however, for a design in which the off-gas from the FT reactor is recycled back to the reactor to improve conversion, removal of CO2 is necessary to prevent CO2 buildup in the reactor.
The initial designs for the low pressure system incorporated a shift reactor instead of water injection to assist in obtaining the necessary composition ratios. Further analysis and review with NREL led to the determination that a shift reactor was unnecessary, and that steam injection into the tar cracker is sufficient to perform the required shift. Elimination of this unit operation helps to reduce the overall system cost.
CO2 removal can be achieved through different processes such as chemical (amine) or physical (Selexol or Rectisol) absorption. The syngas stream entering the CO2 removal unit is at about 420 psia and 110°F. Since physical absorption process is best suited for high pressure (>700 psia) and low temperature systems, an amine system was selected to remove CO2 from the syngas. In addition to the syngas already possessing the appropriate operating conditions for chemical absorption, an amine system is also likely to be less expensive than the Selexol or Rectisol system. A side-by-side cost analysis from vendors would be necessary to confirm the optimal design. Approximately 98% of the CO2 in the syngas stream must be removed in order to meet the stoichiometric ratio requirement for methanol synthesis.
The treated syngas exits the amine absorber at approximately 110°F and 440 psia. The treated syngas is sent to either the methanol or FT reactor. For methanol synthesis, the treated gas is compressed and heated to the operating conditions of the methanol reactor, about 1160 psia and 460°F. For FT synthesis, the treated gas is heated to 350°F.
1.2.2 High-Pressure Syngas Process Description The cleanup process scheme for the syngas from the high-pressure gasifier is similar to that of the syngas from the low-pressure gasifier with the exception of the syngas compression step, differences in the heat balances, and process unit size variations due to different syngas compositions and conditions. Information about these differences is presented below.

Section 1 Process Selection Rationale
Similar to the low-pressure case, high-pressure syngas is sent through a series of cyclones to remove the bulk of the char entrained in the syngas stream. The syngas is then sent to the tar reformer for removal of tars, methane, other light hydrocarbons, and ammonia. Steam is added to the syngas entering the tar reformer so that the shift reaction that occurs in the reformer can yield the required H2/CO ratio for methanol or FT synthesis. Due to a more appropriate synthesis ratio in the raw syngas stream, less steam is required relative to the low-pressure case. The reformer effluent is then sent to the water scrubbing unit for removal of residual char, alkali, metals, halides, and ammonia.
Following the water scrubbing unit, the syngas is sent to an amine unit where MDEA is used for the removal of both H2S and CO2. As in the low-pressure case, a LO-CATTM unit is used for sulfur recovery, while ZnO beds are used for reducing the syngas sulfur content to below < 0.1 ppmv H2S. Rationale for process selection of the sulfur and CO2 removal units is similar to that of the low-pressure syngas case, although MDEA was used instead of DEA in the amine system. The treated syngas is sent to either the methanol or FT reactor. For methanol synthesis, the treated gas requires compression and pre-heating to 1160 psia and 460°F prior to entering the methanol reactor. For FT synthesis, the treated gas requires pre-heating to 350°F.
1.3 DISCUSSION 1.3.1 Technologies Not Chosen A list of technologies was provided for performing the various gas cleanup tasks required. From this list, specific technologies have been selected for each of the designs presented here. Below is a list of the technologies that were not chosen, and the rationale behind those decisions.
Particulate Removal Ceramic and Metal Candle Filters: Candle filters could be used in place of cyclones for char and catalyst separation from the syngas stream. Little commercial experience exists in operating these types of filters at the temperatures (1500°F+) that the cyclones operate under. At this temperature, only ceramic filters could be considered. A recent study performed by Nexant for the DOE’s National Energy Technology Laboratory4 examined replacing a third stage cyclone with a ceramic candle filter. The cost of this high temperature filter, even assuming an “nth plant design”, did not justify the change. Because of the limited commercial experience and high cost, these options were eliminated.
Baghouse Filters: As with candle filters, baghouse filters are not appropriate for high temperature applications. Therefore, they cannot replace the cyclones as an effective solids removal option.
Electrostatic Precipitators: Since dry ESPs can only operate up to ~750°F and wet ESPs up to ~200°F, this option cannot replace cyclones for solids removal. In addition, the high cost and waste streams produced make them unattractive relative to other filtration options.
4 “Gasification Alternatives for Industrial Applications: Subtask 3.3—Alternate Design for the Eastern Coal Case, DOE Contract DE-AC26-
99FT40342, April 2005.

Section 1 Process Selection Rationale
Tar and Hydrocarbon Removal Wet Scrubbing: Due to the relatively low content of tar in the syngas stream and the non-power application being considered, wet scrubbing could be considered a viable option for tar removal. However, inclusion of a wet scrubber may make a steam reformer necessary to remove hydrocarbons from the system. In addition, wet scrubbing for tar removal creates considerable waste removal and treatment issues and lowers process efficiencies. A detailed analysis comparing the current configuration with a wet scrubber/steam reformer would be of interest to confirm these assumptions.
Hydrocarbon Reforming (SMR/POx/ATR): Due to the low content of hydrocarbons exiting the tar cracker, it was determined that this step was unnecessary. Both FT and methanol synthesis reactors should be able to handle the quantity of hydrocarbons without severely impacting performance.
Other Technologies: During the course of the design work for the current configuration, other alternatives, such as injection of cracking catalyst directly into the gasifier and changes in gasifier operation, were identified. Limited empirical data for these technology options make them impractical for design use at this time.
Sulfur Removal LO-CAT TM: The initial designs for sulfur removal from the syngas stream used the LO-CATTM technology due to the low net syngas sulfur content. Redesigns of the combined sulfur and CO2 removal system demonstrated that using LO-CATTM for sulfur recovery and amine for sulfur and CO2 removal was more economic.
Physical Solvents: Physical solvents (Rectisol/Selexol processes, for example) typically operate at low temperatures and high pressures. Changes in the stream pressure leaving the scrubber/quench may be required prior to entering a physical solvent unit for optimum performance, whereas the current process conditions are more appropriate for feed to an amine system. In addition, previous Nexant studies have determined little to no cost benefit in implementing a physical solvent system over other treatment methods for systems of this nature. A more in-depth analysis would be required to confirm the cost difference between physical absorbents and an amine/ZnO treatment system.
COS Hydrolysis: Due to the limited COS expected to be produced from a biomass gasification system, this removal step was omitted.

Section 2 Equipment Design and Cost Estimates
2.1 INTRODUCTION AND METHODOLOGY Design and cost estimates were obtained using three major sources:
HYSYS and ICARUS were used to obtain design and cost estimates for generic equipment such as vessels, pumps, compressors, and heat exchangers. The design basis was agreed upon after the submission of the design information outlined in Section 1.
Vendor quotes were obtained for unique and specialized equipment such as cyclones, ZnO catalyst/reactors, LO-CATTM sulfur absorption, and compressors. Some items, such as compressors and blowers, were estimated both by HYSYS/ICARUS and through vendor quotes in order to validate the results.
The amine unit performance and energy requirements were estimated using commercially available software that is specific for amine unit modeling. Once performance requirements were obtained, an industry developed cost curve was used for estimating installed cost.
An updated set of PFDs, as well as Equipment List and Data Sheets, can be found in the full text of this paper, available at http://www.nrel.gov/docs/fy06osti/39945.pdf. The Equipment List groups process equipment by the following categories: reactors, cyclones, vessels, heat exchangers, compressors, pumps, turbines, and packaged units (the amine and LO-CATTM units). Shown in the Equipment List are the following items:
Unit size and weight
Design duty (exchangers)
Design temperature and pressure
Power usage
Materials of construction
Price (uninstalled) on both a Q2 2004 and Q2 2005 basis
Source for cost estimate
Comments and notes
An installation factor of 2.57 was applied to all base equipment costs, with the exception of the process gas compressor, to arrive at the total installed cost. The installation factor was derived based upon previous experience and vendor estimates. An installation factor of 2.47 was used for the compressor based on previous detailed compressor cost analysis. The total installed cost for the low-pressure case is $109MM, while the installed cost for the high-pressure case is $76MM. The difference is largely due to the process gas compressor used in the low-pressure case.
Section 2 Equipment Design and Cost Estimates
2.2 KEY DESIGN ASSUMPTIONS A complete description of the process and rationale for choosing the technologies in this deliverable can be seen in Section 1. Each case assumed a feedrate of 2,000 MTPD. Issues encountered when performing the unit designs are outlined below.
2.2.1 Sulfur and CO2 Removal As mentioned in Section 1, DEA was selected for the low-pressure case, while MDEA is used for the high-pressure case. This selection is based on design simulation runs by matching the desired CO2 and H2S removal requirements to the selectivity of the amine solvents. The level of CO2 removal is the major driving force in determining the amine system size and cost; without the need for CO2 removal, the unit cost decreases significantly.
2.2.2 Tar Reforming Design and cost estimation of the tar reformer/regenerator presented a challenge to the team. Because no commercial data exists on design or cost for the performance outlined by the “goal” TCPDU case, a number of assumptions have been made:
Reaction temperatures equal to the inlet gas temperature (1598 and 1576°F). These temperatures are derived from conversations with NREL. Recent experimental studies at Iowa State University on catalytic tar destruction have demonstrated successful operation at ~1350 to 1550°F 5. Sensitivity cases were run at 1472 and 1200°F; the results show that heat duty is strongly impacted by the reaction temperature. Since the catalyst is the heat carrier in the reaction, the reaction temperature will greatly impact natural gas use and catalyst circulation rates. Minimizing these factors will trade-off with catalyst activity as the reaction temperature is lowered. This may be an area for future optimization and testing at the TCPDU.
Low pressure operation for the regenerator to cut down on combustion air blower costs. This design is assuming the use of a pressurized rotary lock to increase recycle catalyst pressure. There is the risk that a rotary lock may be inadequate for this service due to the high catalyst circulation rates leading to premature erosion. If this is the case, either a lockhopper system or pressurized regenerator vessel would need to be included, significantly adding to the cost.
Catalyst recycle rate based entirely off of thermodynamic requirements. Because of the endothermic reforming reactions, the regenerated catalyst must carry the heat necessary to maintain reactor temperature.
Catalyst heat capacity of 0.25 Btu/lb/°F
Plug flow within the reactor, with a Gas Hour Space Velocity (GHSV) of 2000/hr, to establish the basis for the bed volume and catalyst inventory. The calculated cracker
5 Zhang, R., Brown, R., Suby, A., Cummer, K., “Catalytic Destruction of Tar in Biomass Derived Producer Gas”, Energy Conversion and
Management, Vol. 45, pp. 995-1014, 2004.
Section 2 Equipment Design and Cost Estimates
bed length was multiplied by a factor of four to account for deviations from ideal plug flow.
Bed diameter calculated by first estimating the minimum and maximum bed fluidization velocities, then an average of these estimates taken. Fluidization velocities calculated from catalyst and syngas properties.
Both ASPEN and HYSYS were used to model these systems, with all necessary thermodynamic and kinetic assumptions included. The results from both simulations came out very close to one another with a very high heat duty (~150 to 170 MMBTU/hr) and catalyst circulation rate (~24,000 to 29,000 MTPD) in each case. While the cost of the actual vessels are not very high ($1.3MM to $1.5MM), the catalyst load is substantial, and costs could be high based on what assumptions are made for catalyst losses and system maintenance requirements. Since the catalyst is regenerated in the process, minimizing losses is key to reducing operating costs.
2.2.3 Cyclones A number of assumptions were made for the particle size distribution, efficiency, and outlet particle loading. Since no explicit direction was given by NREL, assumptions using experimental data from small-scale gasifiers was assumed and given to vendors for sizing (99%+ particulate removal and an average particle size of 50 μm).
2.2.4 Heat Integration The process heating and cooling needs were evaluated and heat integration performed to maximize heat recovery. The process design includes a steam cycle that recovers the majority of the process heat by generating steam. For hot process streams that could not be integrated in the steam cycle, cooling water was used to provide cooling duty. A steam turbine is included in the design to generate power from the excess process steam.
2.2.5 Methanol Compressor It was assumed that a clean syngas pressure of 1160 psia was required for methanol synthesis. Therefore, a compression system with interstage cooling has been included in the design.
2.3 OPERATING COSTS AND UTILITY REQUIREMENTS Catalyst and chemical needs, along with utility requirements, can be seen in Tables 2-1 through 2-3. The units with the highest operating cost are the amine system and the tar cracker. Steam cost contributes the largest cost component for the amine unit. A portion of the steam required for the amine unit is extracted from the steam turbine, and the remainder is assumed to be imported. About 44,000 lb/hr of steam is imported for the low-pressure case, and 113,500 lb/hr for the high-pressure case. Imports may be unnecessary if excess steam from elsewhere in the gasification unit is available.
The other major source of operating cost is the catalyst requirement for the tar cracker. The tar cracker specifics were determined by estimating the minimum fluidization velocity, required space velocity, and the required heat duty demanded of the regenerated catalyst. The total

Section 2 Equipment Design and Cost Estimates
amount of catalyst is equal to the settled bed volume of the two fluidized beds, plus an additional 10% for transfer line inventory. Due to the very high heat load and quantity of gas to be handled, the initial catalyst loading is substantial: ~300 tonnes in the HP case, and ~830 tonnes in the LP case.
The remaining catalyst and chemicals cost are in-line with the assumptions made by NREL; in fact, some of the costs used by NREL in the biomass to hydrogen report are used here either for consistency, or because little other information exists. For example, it is unknown what the cost will be of tar cracker catalyst that can perform as expected in the NREL “goal” design.
Nexant has not made assumptions for the total yearly operating cost at this time; this cost could vary considerably based on the assumptions made for plant performance and the assumptions for catalyst, chemicals, and power costs. An estimate for operating cost should be performed for an entire integrated gasification unit or biorefinery, instead of the clean-up unit as a stand-alone facility. Suggestions for proper estimation and reducing operating costs include:
An availability of 85 to 90% would be appropriate for this design
Both low and high pressure designs would likely require steam imports. This could come from purchases or excess steam production elsewhere in the gasification plant
A 0.01% per day catalyst loss in the tar cracker, as assumed by NREL in the “goal” hydrogen design, is appropriate for initial cyclone operation, but will likely degrade over time. Typical catalyst assumptions and make-up rates for similar technologies range from 0.01% to 0.1%.
If a loss rate of 0.01% is assumed, and costs for the ZnO beds are amortized over the year, the daily catalyst and chemical cost is $1931/day for the low-pressure case, and $1457/day for the high pressure case. This takes into account tar cracker losses, ZnO bed replacement, and LO-CATTM requirements. This is shown in Table 2-1 below.
TABLE 2-1 CATALYST AND CHEMICAL REQUIREMENTS
Variable Amount Required Cost Notes Tar
Reformer Catalyst
Low- Pressure Case: 1,820,000 lbs High-Pressure Case: 662,000 lbs
Price: $4.67/lb (NREL H2 Report)
No commercial catalyst is currently available for this operation. Assuming a GHSV of 2000/hr, and a catalyst volume equal to the settled bed volume of the two fluidized beds plus 10% for transfer lines.
ZnO Catalyst
Low-Pressure Case: 777 cubic feet High-Pressure Case: 707 cubic feet
Price: $355/cubic foot (Johnson Matthey).
Initial fill then replaced every year. Catalyst inventory based on H2S removal capacity from 2 ppmv to 0.1 ppmv.
Sulfur Recovery Chemicals
Low-Pressure Case: 1.7 Tonnes/Day of Sulfur Removal High-Pressure Case: 2.4 Tonnes/Day of Sulfur Removal
Price: $191/tonne sulfur removed (GTP Quote)
Assumes price for all LO-CATTM chemicals required. Does not include utility requirements.
Section 2 Equipment Design and Cost Estimates
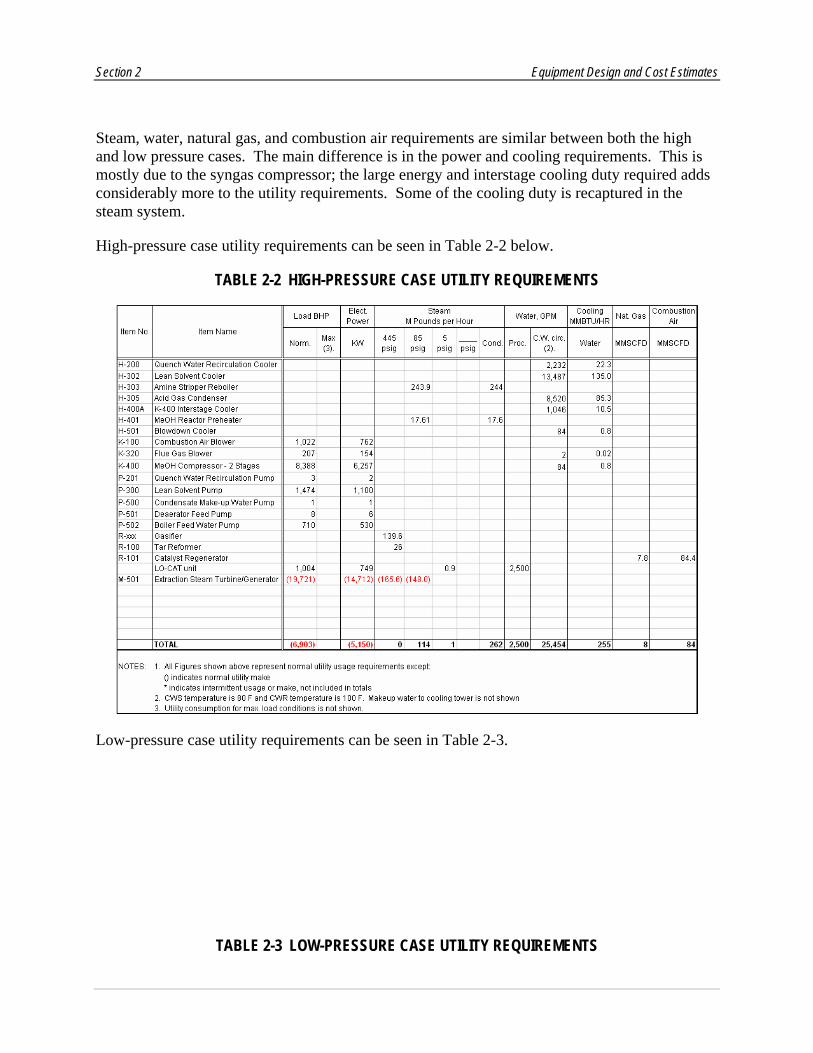
Steam, water, natural gas, and combustion air requirements are similar between both the high and low pressure cases. The main difference is in the power and cooling requirements. This is mostly due to the syngas compressor; the large energy and interstage cooling duty required adds considerably more to the utility requirements. Some of the cooling duty is recaptured in the steam system.
High-pressure case utility requirements can be seen in Table 2-2 below.
TABLE 2-2 HIGH-PRESSURE CASE UTILITY REQUIREMENTS
Low-pressure case utility requirements can be seen in Table 2-3.
TABLE 2-3 LOW-PRESSURE CASE UTILITY REQUIREMENTS

Section 2 Equipment Design and Cost Estimates
2.4 DIFFERENCES WITH NREL BIOMASS TO HYDROGEN DESIGN In general, the cost of the clean-up section of the biomass to chemicals designs is more expensive than for the NREL Biomass to Hydrogen design6. There are three main reasons for this: more equipment necessary in the chemicals designs, the increase in steel prices from 2002 to 2005, and different engineering assumptions made in the chemicals case. Information on each reason will be elaborated upon below.
2.4.1 Added Equipment to Chemicals Design The two major unit operations that are new to this design versus the hydrogen cases are the amine unit and the syngas compressor for methanol synthesis. In the hydrogen cases, a LO-CATTM unit and ZnO bed was used for H2S removal, while the PSA removed carbon dioxide. The chemicals cases also use the LO-CATTM and ZnO units, but instead of a PSA, an amine unit is used for the bulk H2S and CO2 removal. The cost for the amine units is driven largely by the need for CO2 removal; due to the low H2S content in the syngas, the cost of the amine unit would be roughly half as much if CO2 removal was not required. The LO-CATTM unit is used in this case for clean-up of the acid gas stream from the amine unit instead of bulk H2S removal. Because of the CO2 content and different operating requirements versus the hydrogen case, the quote provided by GTP is roughly double the price used in the hydrogen case.
6 Spath, P.; Aden, A.; Eggeman, T.; Ringer, M.; Wallace, B.; Jechura, J. (2005). Biomass to Hydrogen Production Detailed Design and
Economics Utilizing the Battelle Columbus Laboratory Indirectly-Heated Gasifier. 161 pp.; NREL Report No. TP-510-37408.
Section 2 Equipment Design and Cost Estimates
In order to compress the clean syngas up to methanol synthesis pressure, a ~8,000 HP compressor is required. This unit was not necessary in the hydrogen case, adding to the overall cost. Taking into account a $12MM credit by not using the PSA, the LP cost increases by ~$8.5MM, while the HP cost increases by ~$18.5MM due specifically to the extra equipment needed.
2.4.2 Increase in Steel Price NREL used 2002 as the cost basis for the biomass to hydrogen designs, while Nexant is using Q2 2005. The increase in steel price between 2002 and 2005 has been significant, impacting the prices quoted in the Nexant design. The Q2 2005 basis for hot-rolled steel is ~$400 to $450/ton, up from ~$250 to $300/ton in 20027. Steel prices have been very volatile in the last 3 years due to strong worldwide demand, a sharp rise in energy prices, consolidation in the US steel market, and a weak US dollar.
Because of this basis difference, the 2002 NREL basis would need to be escalated not only for inflation but also for steel price in order to put it on the same basis as this study. It is difficult to place a blanket escalation factor on the design due to the impacts that steel price has on different pieces of equipment; for example, this may make up much of the difference in price in equipment like vessels and exchangers, but have less of an impact on compressor prices. Each unit should be evaluated independently to determine the impact that steel price has on overall unit cost.
2.4.3 Engineering Assumptions A side-by-side comparison of all the major process units was performed for the HP and LP cases versus the NREL hydrogen design. A few differences were noticed that are outlined below. A direct comparison cannot be performed on units that were lumped into the “Gas Cleanup” section of the NREL design and not explicitly sized. While the major differences are outlined here, only a brief attempt at determining the cost difference has been made.
Reactors and Columns ZnO Beds: While the size of the ZnO beds in this design is smaller than the hydrogen case, the installed cost is roughly double. This is likely due to the difference in steel price.
Tar Reformer/Regenerator: In the hydrogen design, this is included in the “Cleanup” costs, so no explicit design information is available. The NREL assumption for “Cleanup” took the average of a number of different studies; however, only one of these studies, Weyerhaeuser (2000), had a tar cracker. The “Cleanup” section for the Weyerhaeuser study was ~$9MM greater than the other designs, implying that the majority of the cost may be due to the tar cracker cost. The NREL “Cleanup” assumption may be low since the hydrogen design has a tar cracker, yet only one of the studies used to obtain the “Cleanup” cost also has a tar cracker.
7 For more information, see the Bureau of Labor Statistics “Producer Price Series”, along with Lazaroff, Leon, “Steel Regains Some Luster”,
Detroit Free Press, 25 July 2005

Section 2 Equipment Design and Cost Estimates
Cyclones Since these were part of the “Cleanup” average, no explicit design numbers were provided as part of the hydrogen study. Design quotes from vendors are used for this part of the plant in the chemicals design.
Vessels The Nexant estimate is higher than the hydrogen design due to 1) the venturi and quench being included as part of the “Cleanup” estimate, 2) larger vessel sizes for the steam system than what was assumed in the hydrogen design, and 3) steel prices. Depending on the price assumed for the venturi /quench in the hydrogen design, the Nexant estimate appears to be ~$3MM greater than the hydrogen case.
Heat Exchangers A number of differences exist between the hydrogen and chemicals designs, making the installed cost for exchangers in the chemical production case ~$4MM to $6MM higher than in the hydrogen case:
There is a large cost discrepancy between the exchangers downstream of the tar reformer. The Nexant designs are larger and considerably more expensive; Nexant assumed refractory lining, while it is unclear if this assumption is made in the hydrogen design.
The Nexant design has a number of exchangers not included in the hydrogen design: amine precoolers (HP case), methanol compressor coolers (both cases), and ZnO coolers (both cases).
A few of the exchangers in the hydrogen design are included in the “Cleanup” section, so it is difficult to make a direction comparison.
Compressors and Blowers As mentioned earlier, the syngas compressor for methanol synthesis adds ~$7MM to the installed cost relative to the hydrogen case. This compressor was not necessary in the NREL hydrogen design.
There is a major difference between the NREL and Nexant assumptions for the syngas compressor in the LP case. While NREL shows an installed cost of ~$12MM for a 30,000 HP compressor, Nexant estimates that a ~38,000 HP compressor is required at an installed cost of ~$37MM ($15MM for the equipment alone). The equipment cost comes directly from Elliott Compressor; checks on the validity of the estimate using cost curves, ICARUS, and other vendors show that this is within the +/- 30% estimate desired by the study. The NREL study assumed that an integrally geared compressor type would be appropriate, while this report uses a horizontally split centrifugal compressor recommended by vendors. Analysis using cost estimating software shows that this assumption is the main reason for the cost difference.

Section 2 Equipment Design and Cost Estimates
Pumps Both Nexant and NREL designs are in agreement in regards to the pumps.
Steam Turbine The Nexant estimate is slightly higher than the NREL estimate, ~$12MM installed versus $10MM. This difference is likely due to steel prices.
The other difference that should be pointed out between the hydrogen and chemicals cases is the assumption made for the installation factor. NREL used a 2.47 installation factor, which is derived from literature sources. Nexant used 2.57 in both the HP and LP cases, except on the process gas compressor, where 2.47 is used. These numbers are derived independently from previous experience and vendor engineering estimates. While the factors are very similar to one another, this difference can make a 4% difference ($2MM) on an equipment cost of $20MM.
2.5 CHANGING FLOWS, CONDITIONS, AND COMPOSITIONS Per the scope of work outlined by NREL as part of this project, Nexant has been asked to provide input on how the design estimates will be adjusted if the syngas flowrates or compositions vary. Information for both the high and low-pressure cases, along with the scaling factors appropriate for each major piece of process equipment, are outlined below.
2.5.1 Flowrate Impacts In general the limits on process equipment sizes are usually the result of manufacturing restraints, transportation limits, and maintenance restrictions. For this evaluation, it was assumed that the throughput would be increased by 50% and the equipment size or capacity would increase accordingly. The affects of this change are discussed below with respect to both the low- and high-pressure cases.
Low-Pressure Syngas Design Cases For the Low-Pressure Syngas Design Cases some of the equipment has already reached size limitations that required multiple trains or parallel equipment. Thus, increasing the capacity by 50% will require more parallel equipment and a more complex and expensive piping manifold. Examples include:
Gasifier Cyclones (4 required for the base capacity)
Tar Reformer SG Cooler/Steam Generator (2 required)
Tar Reformer SG Cooler/BFW Preheater (2 required)
Compressor Interstage Cooling - 1st stage (2 required)
Syngas Venturi Scrubber/Quench Tower (2 required)
Thus, for a 50% increase in capacity, the design would require 6 gasifier cyclones, 3 of each major heat exchanger, and 3 venturi scrubbers.
Section 2 Equipment Design and Cost Estimates
Other items, such as the 1st Stage KO Drum, may require either a parallel unit or field construction due to equipment size and weight limitations during transportation. While the limits for ground transportation vary from state to state, typically, codes limit standard transport sizes to ~14 feet in width and height, 53 feet long and 80,000 pounds. Locating this facility in Iowa will mean that most equipment will be transported to the site either by rail or truck. Access to the Mississippi or Missouri Rivers may allow larger vessels to be used. For the 1st Stage KO Drum, the inside diameter would increase to about 16 feet (from a 13 foot diameter) at a capacity 50% greater than the base case. However, when considering transportation by road, auxiliary equipment such as nozzles and flanges must be taken into consideration. This item would be well beyond most road transportation limits in the U.S. To manage this limitation, options are either transportation by rail or barge, parallel pieces of equipment, or field fabrication.
Other equipment may exceed the maximum recommended size for a single train, and would require a second, parallel unit. This includes items such as the Syngas Compressor and the shell and tube heat exchanger for the Flue Gas Cooler/Steam Superheater service. In the latter case, the size of the heat exchanger is actually a maintenance issue. The diameter of the tube bundle of these units is larger than a normal bundle puller could handle (maximum limit is about 6-7 feet diameter). It then becomes an economic question of bringing in special maintenance equipment during turnarounds or using smaller, parallel process equipment.
High-Pressure Syngas Design Cases For the High-Pressure Syngas Design Cases, most of the equipment is smaller than the corresponding equipment for the Low-Pressure Syngas Design Cases as a result of the high pressure operation. Only a few items, when scaled by +50%, would require a parallel unit. Two major exchangers, the Tar Reformer SG Cooler/Steam Generator and Flue Gas Cooler/Steam Superheater, were discussed above. Another area is equipment within the LO-CATTM unit. These include the Inlet Gas KO Drum and the LO-CATTM Oxidizer Vessel. The former would require a vessel with an inside diameter of over 17 feet and the latter would required an inside diameter of about 16 feet. As noted previously, the outside diameter (including nozzles and flanges) would be well beyond most road transportation limits in the U.S. Vendors for process items of this nature can provide input for the appropriate process configuration for this service.
Appropriate vessel sizing for the amine system is also of concern in this design. The amine system contains two relatively large columns – the scrubber and the regenerator. Considering a 50% increase in capacity, the column diameters will increase by about 20 to 25%. In particular, the regeneration column may exceed the transportation size limitations and thus, require parallel trains or field fabrication.
General Information A plant that is 50% larger will require more plot area not only due to the larger equipment and storage, but due to offsite considerations. For example, the flare will have to be designed for a load that is 50% larger. This will require either a taller flare or moving the flare further away from the main process units. A higher flare may meet with height restrictions. Thus, the area that is restricted around the flare may increase.
Section 2 Equipment Design and Cost Estimates
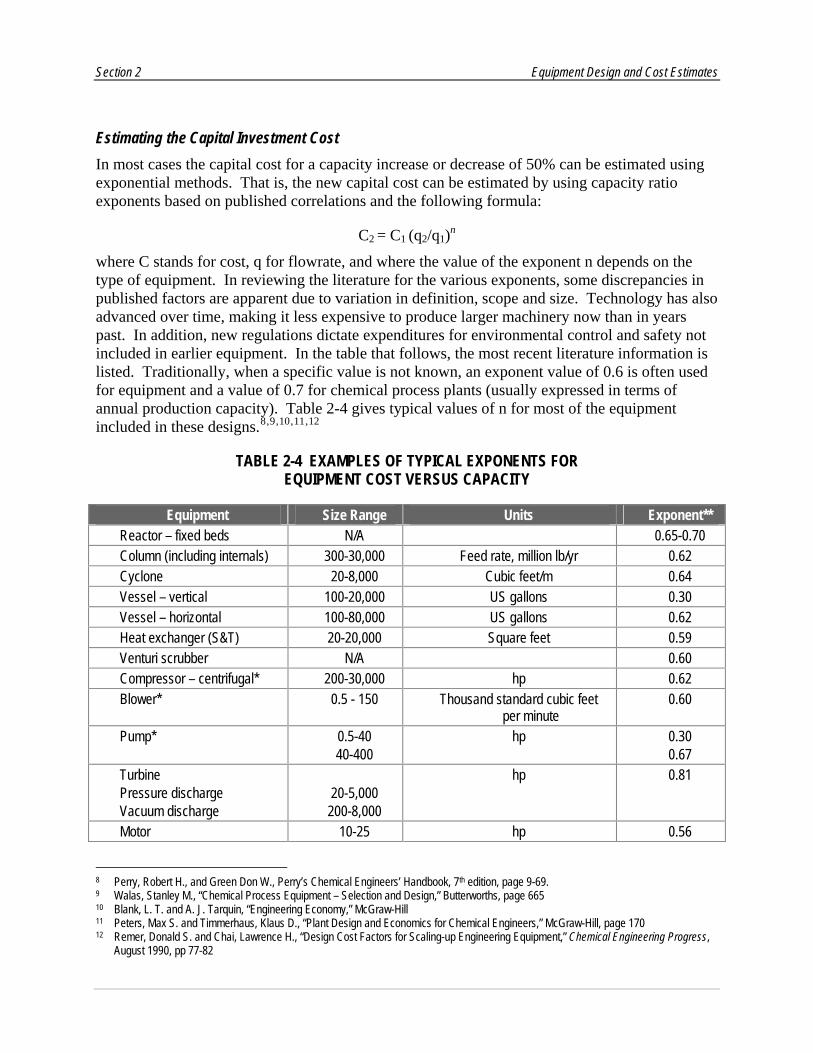
Estimating the Capital Investment Cost In most cases the capital cost for a capacity increase or decrease of 50% can be estimated using exponential methods. That is, the new capital cost can be estimated by using capacity ratio exponents based on published correlations and the following formula:
C2 = C1 (q2/q1)n
where C stands for cost, q for flowrate, and where the value of the exponent n depends on the type of equipment. In reviewing the literature for the various exponents, some discrepancies in published factors are apparent due to variation in definition, scope and size. Technology has also advanced over time, making it less expensive to produce larger machinery now than in years past. In addition, new regulations dictate expenditures for environmental control and safety not included in earlier equipment. In the table that follows, the most recent literature information is listed. Traditionally, when a specific value is not known, an exponent value of 0.6 is often used for equipment and a value of 0.7 for chemical process plants (usually expressed in terms of annual production capacity). Table 2-4 gives typical values of n for most of the equipment included in these designs.8, , , ,9 10 11 12
TABLE 2-4 EXAMPLES OF TYPICAL EXPONENTS FOR EQUIPMENT COST VERSUS CAPACITY
Equipment Size Range Units Exponent** Reactor – fixed beds N/A 0.65-0.70 Column (including internals) 300-30,000 Feed rate, million lb/yr 0.62 Cyclone 20-8,000 Cubic feet/m 0.64 Vessel – vertical 100-20,000 US gallons 0.30 Vessel – horizontal 100-80,000 US gallons 0.62 Heat exchanger (S&T) 20-20,000 Square feet 0.59 Venturi scrubber N/A 0.60 Compressor – centrifugal* 200-30,000 hp 0.62 Blower* 0.5 - 150 Thousand standard cubic feet
per minute 0.60
Pump* 0.5-40 40-400
hp 0.30 0.67
Turbine Pressure discharge Vacuum discharge
20-5,000
200-8,000
hp 0.81
Motor 10-25 hp 0.56
8 Perry, Robert H., and Green Don W., Perry’s Chemical Engineers’ Handbook, 7th edition, page 9-69. 9 Walas, Stanley M., “Chemical Process Equipment – Selection and Design,” Butterworths, page 665 10 Blank, L. T. and A. J. Tarquin, “Engineering Economy,” McGraw-Hill 11 Peters, Max S. and Timmerhaus, Klaus D., “Plant Design and Economics for Chemical Engineers,” McGraw-Hill, page 170 12 Remer, Donald S. and Chai, Lawrence H., “Design Cost Factors for Scaling-up Engineering Equipment,” Chemical Engineering Progress,
August 1990, pp 77-82

Section 2 Equipment Design and Cost Estimates
Equipment Size Range Units Exponent** 25-200 0.77
Package unit N/A 0.75 Other N/A 0.6 – 0.7
* excluding driver ** this estimating method gives only the purchase price of the equipment; additional installation cost for labor, foundations and construction
expenses will make the final cost higher.
2.5.2 Composition Impacts The major units that will be impacted by a large change in syngas composition are the tar reformer and the venturi scrubber. Due to the relatively low concentration of sulfur in the syngas stream, +/-50% fluctuations in the H2S content should not impact how the sulfur removal system is designed. Significant changes in the inlet H2/CO ratio may also require modifications of the design in order to establish the appropriate downstream composition.
The obvious change that will influence the design of the tar reformer is the amount of hydrocarbons in the syngas from the gasifier. Currently, the design is assuming that a separate reformer is not necessary, with the tar reformer converting most hydrocarbons exiting the gasifier. If either the hydrocarbon yield increases or the tar reformer conversion is lower than planned, a separate reformer for light hydrocarbons should be considered. The amount and type of hydrocarbons will affect the operating conditions which will in turn affect the water gas shift reaction. A change in the H2/CO ratio may require divorcing the shift reaction from the tar reformer (i.e., a separate shift reactor instead of just adding steam to the tar reformer).
A 50% increase in particulates may require different/larger cyclones or a redesign of the venturi scrubber in order to handle the larger load. This is largely controlled by the gasifier operation; reliable performance data should be established prior to deciding upon a particulate removal scheme. Higher particulate loading than planned can significantly hurt overall plant performance.
A 50% increase in H2S will not affect the sulfur recovery processes. LO-CATTM can handle between 150 lbs to 20 tonnes of sulfur per day, and concentrations between 100 ppm and about 10% H2S. Even at 50 percent more H2S, the concentration still remains within the operating limits for LO-CATTM. In addition, the solvent circulation rate in the amine unit can be increased to remove additional H2S if the sulfur concentration is higher than expected.
2.6 FOLLOW-UP AND AREAS FOR FURTHER STUDY The analysis performed sets the base case for the clean-up section of two different biomass-to-chemicals designs. After in-depth analysis of these cases, the team has identified a number of areas for further study:
Alternatives for Tar Removal: A number of assumptions have been made for sizing and costing of this unit. Greater study and analysis, both in the laboratory and through simulations, should be performed to determine if the methods used are valid. In addition, alternative tar removal technology should be considered, including:
Section 2 Equipment Design and Cost Estimates
− Introduction of tar cracking catalyst into the gasifier. Typically, this has not been done due to concerns with deactivation and erosion.
− Gasifier operation to reduce hydrocarbon yields.
− Using a water wash for tars, followed by a standard reformer for hydrocarbons. While this increases the cost of quenching and wastewater handling, the cost tradeoff may be economic.
Process Integration, Gasification Systems and Biorefinery: Integration of the clean-up section with the other parts of the gasification plant will provide a better picture of the overall plant costs. In addition, use of this thermochemical platform has been considered for future application into an integrated “biorefinery”. This base case could be used for a determination of the process requirements and offerings that a thermochemical platform could provide.
Alternate CO2/Sulfur Removal Steps: Based on the design information provided and past studies that have been examined, the steps incorporated for CO2 and sulfur removal has been determined to be appropriate at this stage. A cost comparison of amine versus physical solvents and new technologies for acid gas removal would provide additional data to confirm the appropriate use of amine in this design.
New technology is currently being explored to remove sulfur without having to cool to 110°F or below. Since none of this technology is currently commercial, it has not been evaluated for use in this design. If available however, warm sulfur clean-up may increase efficiency in this design, by reducing the amount of reheat necessary prior to entering the shift reactor.
Other Impurities in the Syngas: For the low pressure case, a scrubber has been included to remove residual ammonia, and any metals, halides, or alkali remaining in the system. If it is deemed that the level of these impurities entering the scrubber will not adversely impact the FT or methanol catalysts, this step could be removed.
Task 2: Gas Cleanup Design and Cost Estimates, Wood Feedstock 3-1 Final Report ACO-5-44027 United States Department of Energy/National Renewable Energy Laboratory
Section 3 Labor Requirements
3.1 SUMMARY The labor projections for the 2000 MTPD biomass gasification plant are based on a combination of 1) models developed from Emery Energy’s 70MWe Gasification Plant design completed under prior DOE contracts, 2) additional “adders” for the scale and complexity (chemical plant nature / hydrogen production) of the 2000 MTPD plant being considered, and 3) previous experience of Nexant and other team members. The high pressure, oxygen-blown, 2000 MTPD plant requires labor skills with slightly greater operating experience than power-only facilities, and thus commands a premium for these skills.
The labor rates derived from Emery’s 70 MWe Biomass IGCC (1200 MTPD plant) case were ~$1,650,000 per year (not including subcontracted services) versus the $2,274,720 projected for the labor costs for the 2000 MTPD biomass to chemicals design. This difference of roughly $625,000 represents the higher level of experience needed for the larger plant, greater materials handling rates, and increased labor for plant maintenance. A discussion of the reasons for this difference, along with differences between the recent NREL Biomass to Hydrogen report, is contained below. Some of the main differences with the NREL Hydrogen report include different job descriptions, the use of a back-up shift crew, utilization of contract labor, and lower assumptions for overhead costs.
3.2 LABOR REQUIREMENTS The following labor categories and positions will be required for the 2000 MTPD biomass plant.
General Plant Manager: Responsible for all personnel and plant decisions, including new employee hiring, operator training, fuel contracts, maintenance contracts, general equipment purchases, external communications, and operating schedules. Engineering degree required, with 10+ years of chemical plant operating experience. Salary of $100,000/yr.
Administrative Assistant/Company Controller: Support the general plant manager, manages personnel records, completes company payroll, manages time accounting records, manages company benefits, employee investment accounts, and insurance enrollments. Accountant degree required with 5+ years of experience. Salary of $45,000/yr.
Secretary/Receptionist: Supports the General Plant Manager and Company Controller. Receives visitors, answers phone, and attends to office administrative duties. Salary/Wages of $25,000/yr.
Laboratory Manager: Oversees all laboratory equipment and laboratory technicians. Responsible for product quality; testing performed both on finished product and intermediate streams (via on-line equipment and sample draws). Works straight days, with some overtime possible. Salary/Wages of $50,000/yr.
Laboratory Technician: Responsible for sample gathering, analytical equipment maintenance, and laboratory testing. Works straight days, with some overtime

Section 3 Labor Requirements
possible. Shift operating crew can assist with some sample gathering as necessary; contract equipment technicians can assist with analytical equipment repair as necessary. Salary/Wages of $35,000/yr.
Shift Operating Crew: The plant will be operated by a four-member crew shift each week, with responsibilities defined below:
Shift Superintendent. The shift superintendent is the chief operator who mans the control station and simultaneously directs the activities of the shift crew. The shift superintendent is a degreed engineer who understands the plant, understands the technical and physical operations, and makes key operating decisions. The shift superintendent ensures compliance with plant quality, safety, industrial hygiene, and environmental requirements. 5-10 years of chemical plant operating experience is preferred for this position. Salary of $75,000/yr.
Support Operator. The support operator aids the shift superintendent with plant operation. The support operator is also tasked with bulk material handling such as feedstock receipts/inspection/weigh-in and ash weigh-out/disposal shipments. The support operator attends to feed and ash sampling/characterization, waste water disposal sampling, and provides general plant support in relief of the shift superintendent. The support operator is also tasked with monitoring plant emissions rates, including daily/weekly calibration of effluent gas monitors. The support operator verifies that plant operating records and daily logs are correct. This position coordinates fuel characterizations and waste water analyses. A novice degreed engineer or experienced technician is sufficient for this position. Salary of $45,000/yr
Millwright. The shift millwright conducts hourly and daily equipment inspections, safety rounds, completes scheduled equipment process maintenance, supports equipment maintenance and equipment replacements, contracts and supervises crafts such as pipe fitters, electricians, welders, and special instrument technicians when such functions exceed the millwright’s capabilities. The millwright preferably has an associate degree in mechanical, industrial, or design engineering technology with 5-10 years experience. Salary of $60,000.
Millwright Assistant/Yard Labor. Supports millwright and accompanies millwright and contracted crafts, particularly during dangerous work activities, such as confined space entries and working from heights. The millwright assistant supports tool setup, job errands, and plant cleanup. Salary of $35,000.
Shifts run for 12 hours with two crews per day. Crews report to work 30 minutes prior to the shift turnover to perform receive shift operating instructions and to pass information on critical operations and maintenance. Each crew member is allotted 30 minutes for a meal break. Thus, each shift extends 12.5 hours, with 0.5 hours meal break, or 12 hours of labor. Crews operate on a 4 days on / 4 days off rotation. This requires 84 hours on average per crew member for any two-week pay period.
Five complete shift teams are engaged. The fifth crew provides coverage for individual vacations, sick leave, and holidays. The fifth crew also fills in for continuing training and for
Section 3 Labor Requirements
new hire training. The fifth crew also supports ongoing maintenance and periodic outage/turnaround planning. In addition, the fifth crew supports updates to control system programming, data collection, and instruments. The millwright assistant on the fifth crew supports plant cleanup and janitorial activities. The fifth crew works 40-hour straight days when not substituting for members of the four-crew rotation.
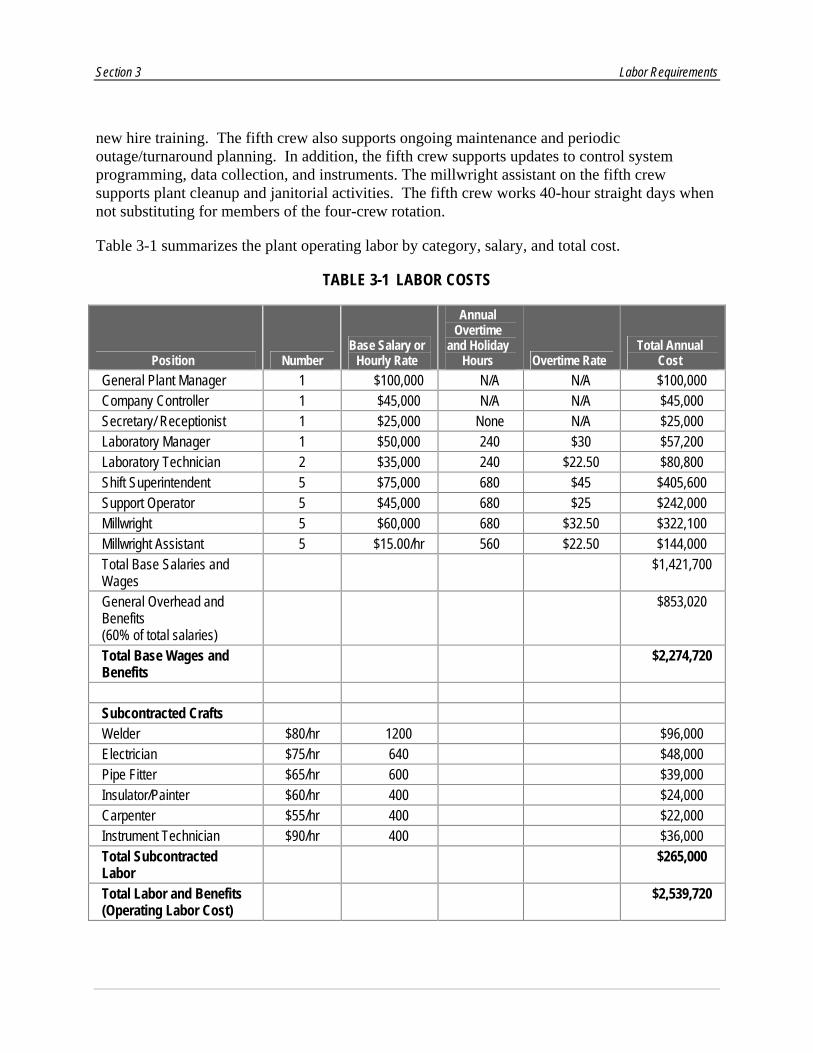
Table 3-1 summarizes the plant operating labor by category, salary, and total cost.
TABLE 3-1 LABOR COSTS
Position Number Base Salary or
Hourly Rate
Annual Overtime
and Holiday Hours Overtime Rate
Total Annual Cost
General Plant Manager 1 $100,000 N/A N/A $100,000 Company Controller 1 $45,000 N/A N/A $45,000 Secretary/ Receptionist 1 $25,000 None N/A $25,000 Laboratory Manager 1 $50,000 240 $30 $57,200 Laboratory Technician 2 $35,000 240 $22.50 $80,800 Shift Superintendent 5 $75,000 680 $45 $405,600 Support Operator 5 $45,000 680 $25 $242,000 Millwright 5 $60,000 680 $32.50 $322,100 Millwright Assistant 5 $15.00/hr 560 $22.50 $144,000 Total Base Salaries and Wages
$1,421,700
General Overhead and Benefits (60% of total salaries)
$853,020
Total Base Wages and Benefits
$2,274,720
Subcontracted Crafts Welder $80/hr 1200 $96,000 Electrician $75/hr 640 $48,000 Pipe Fitter $65/hr 600 $39,000 Insulator/Painter $60/hr 400 $24,000 Carpenter $55/hr 400 $22,000 Instrument Technician $90/hr 400 $36,000 Total Subcontracted Labor
$265,000
Total Labor and Benefits (Operating Labor Cost)
$2,539,720

Section 3 Labor Requirements
3.3 DIFFERENCES WITH EMERY ENERGY 70 MWE CASE Both the complexity and size of this facility increases the labor costs over what Emery Energy has assumed for their 70 MWe biomass gasification facility. The size of the unit (1200 MTPD vs. 2000 MTPD) slightly increases the number of shift workers and contract hours required, but does not increase the plant management or engineering requirements. This represents an economy-of-scale advantage enjoyed by larger gasification facilities; while the total labor requirement is greater than the 1200 MTPD facility, the marginal amount of labor required decreases as plant size increases.
This design contains additional equipment than what is assumed in Emery Energy’s 70 MWe facility design. While this design does not contain a gas turbine, steam turbine, or HRSG, additional equipment includes enhanced sulfur removal (an amine system and ZnO beds), chemicals synthesis equipment, and tar cracking. It is this increase in complexity, rather than the increase in size, that adds the majority of the increase in labor costs.
3.4 DIFFERENCES WITH NREL BIOMASS TO HYDROGEN CASE In the 2005 study, NREL made assumptions for the labor requirements necessary for a 2000 TPD wood gasification to hydrogen plant. The size being considered in this design is exactly the same, and the complexity is roughly the same as the NREL case. The only main difference is the inclusion of chemicals synthesis equipment, which takes the place of the PSA and related equipment required for hydrogen production.
The labor requirements developed for the chemicals synthesis cases are lower by almost $1.5MM due to the assumptions made by the Nexant team. The main differences are highlighted below:
Salary Assumptions: In general, slightly higher salaries are assumed in the chemicals synthesis design for employees such as the plant manager, engineers, and operators. Higher salaries may be necessary to attract workers to facilities employing complicated and novel technologies.
Administrative Assistants: Instead of the three assistants assumed by NREL, this design assumes only two: the company controller/administrative assistant and the main receptionist. The main difference is that the truck handling work performed by the assistant in the NREL design will now be split amongst the millwrights and assistants.
Work Assignments for Shift Workers: As mentioned in the job descriptions, it is assumed that support operators will assist with yard issues, feedstock delivery, and field work, while the superintendent will largely be responsible for control issues. This reduces the need for yard employees and operators whose sole job is to man control boards. The five crews effectively allow for additional personnel capable of supporting offloading and weighing of the biomass feedstock.
Subcontract Labor: In order to reduce the need for full-time staff for part-time work, a number of specific skills, such as welders, electricians, and carpenters, will be

Section 3 Labor Requirements
contracted out. This reduces the overall labor costs and overhead. No subcontract labor was assumed in the NREL hydrogen case.
Overhead: The labor estimate made in this case has roughly half as much full-time staff by utilizing more contract labor and changing the job description of day and shift employees. This is one reason that the estimate for overhead expenses (60%) is less than the biomass to hydrogen case (95%). In addition, the assumption has been made that a small firm will own and operate this facility. In general, overhead has been found to be less in smaller firms than in large multinationals; this assumption could be revised based on the ownership basis. This assumption for the overhead rate has been confirmed by Emery Energy, and is consistent with other small gasification companies that have limited facilities and indirect labor costs.
Overtime Assumptions: The NREL hydrogen case assumed straight salaries for all employees, with no overtime. The chemicals case assumes ~2500 hours of overtime per year, roughly split over the 4 main shift worker categories. Allowing overtime reduces the number of full-time employees required, and decreases overall labor costs versus the NREL hydrogen case.
Back-Up Shift Crew: Unlike the NREL hydrogen design, the back-up fifth shift team would be available to cover a number of different duties during the day shift, decreasing the need for specialty workers in each area.

Related Documents