+ Providing Solutions for Gas Analysis MAX300 - BIO Bioreactor and Fermentation Gas Analyzer

Welcome message from author
This document is posted to help you gain knowledge. Please leave a comment to let me know what you think about it! Share it to your friends and learn new things together.
Transcript

+
Providing Solutions for Gas Analysis
MAX300-BIOBioreactor and Fermentation Gas Analyzer

+Quadrupole Mass Spectrometry (QMS)
For 50 years Extrel has supplied Quadrupole Mass Spectrometers systems and components globally. Over 1300 Research Systems
Over 1500 Laboratory and 1000 Process Systems
3 Nobel Prize Recipients 1985: Dudley R. Hershcbach & Yuan T. Lee for Chemistry
1995: Mario Molena for Chemistry
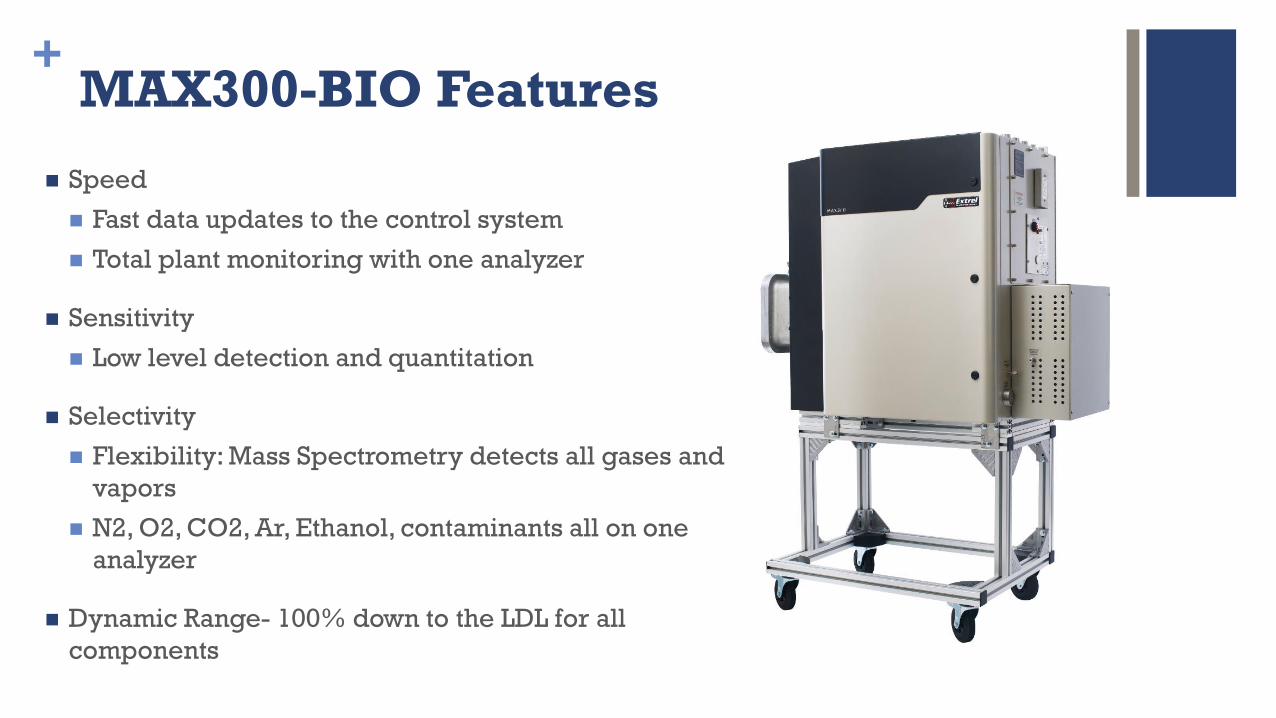
+MAX300-BIO Features
Speed
Fast data updates to the control system
Total plant monitoring with one analyzer
Sensitivity
Low level detection and quantitation
Selectivity
Flexibility: Mass Spectrometry detects all gases and vapors
N2, O2, CO2, Ar, Ethanol, contaminants all on one analyzer
Dynamic Range- 100% down to the LDL for all components

4
Extrel MAX300 Mass Spectrometers Mass Range: 1-250,300,500 AMU
Dual Detector Faraday Plate Electron Multiplier
Quantitative analysis performed at 0.4 seconds/ component
Number of sample streams: 16, 31, 40, 80+
19 mm Quadrupole for high ion transmission: Dynamic Range: 100 % down to 10 ppb Precision: < 0.25% RSD* Stability: < 0.5% RSD over 30 days*
*on 1 % argon measurement
© Copyright 2015 Extrel CMS, LLC

+Alternative Configurations for Industrial Environments
Painted Steel Enclosure
General purpose- Can be AC or fan cooled
Class 1 Div 2 Groups, B, C, D, T3- Z Purge, explosion proof AC
Stainless steel enclosure
C1 Div 1 Groups, B,C,D T3
Stainless steel enclosure, can be AC or H2O cooled
ATEX Zone 1, Group II B+H2, T3 X Purge, explosion proof, corrosive resistant cooling unit, FO for all external communications

+Industrial Bioreactor Applications
Biofuels
Ethanol
Pharmaceutical Products Enzymes
Antibiotics
Steroids
Vitamins
Biomass
Biopolymers
Alcoholic Beverages
Bread Products
Waste Treatment

+Bioreactor and Fermentation Control
Viability of the organism Ideal conditions are required to keep the cells alive and growing
Desired metabolic pathway Cells can perform thousands of types of reactions The conditions inside the bioreactor can be altered to ensure the production of
the desired compound
Process Variables: Temperature- population growth is exothermic, cooling is often required Available Nutrients pH Dissolved O2, CO2
Enzymes, and biocatalysts Accumulation of waste products

+Fermentation off-gas analysis on the MAX300
Additional ppm-level Contaminant Analysis- Methanol, Acetic Acid, Formaldehyde
Name Min. Conc. (%) Max. Conc. (%) Det. Mass STD (+/-ppm)
Water 0 2.5 18 54Nitrogen 70 80 28 267Oxygen 15 25 32 142Argon 1 2 40 25Carbon dioxide 5 10 44 4Ethanol 0 0.2 46 30

+Process Efficiency and Quality Control
Dynamic Modeling – state equations are developed that rely on initial batch conditions and real time measurements as inputs Initial conditions: mass of substrate, starting cell mass, reactor volume, etc. Realtime Parameters: Oxygen uptake rate (OUR) Carbon dioxide evolution rate (CER) Respiratory Quotient (RQ): RQ = CO2 Produced / O2 Consumed Provides Accurate Cell growth, and Viability data RQ can indicate what metabolic pathway is being used For glucose metabolism:, RQ = 1 For Stearic acid, RQ =0.7
The output of the model calculates compares the current state of production to a predetermined ideal.

+RQ on the Mass Spectrometer Single Analyzer Solution
Simultaneously measures all gases thereby eliminating the need for independent flow monitoring
For organisms that fix nitrogen, Argon In and Out can be used to determine total flow
Additional contamination measurement can be performed simultaneously

+RQ and Analysis Technique
Dissolved O2, and CO2 Probes Depends on assuring the function and accuracy of independent probe systems, relatively
long sample time (minutes), slow recovery times
Paramagnetic gas analyzers Depends on the function and accuracy of multiple analyzers
May mandate a discrete set of analyzers for each fermentor
Requires the separate measurement of gas flow into and out of the reactor
Low repeatability ± 5%
FTIR and GC Slow analysis
Limited dynamic range
Complex calibration
Requires the separate measurement of gas flow into and out of the reactor
Low repeatability ± 5%

+Bioreactor Scale up
Benchtop- Multiple reactors (~1-10L) running in parallel under varied conditions
Pilot Volume (200L)- Once an ideal parameter set is defined the approach is scaled up to further characterize the impact of potential control variables
Process- Final outcome of the development work

+MAX300-BIO, Laboratory Configuration
Benchtop Gas Analyzer
Real-Time Analysis with method cycle time in seconds
Characterization of unknowns in dynamic samples
Disposable ionizer with Dual Filaments
Sample Points: 4, 8,16, 31
Questor5 software
Ease of operation and application
Connectivity: Ethernet, Modbus, Serial
© Copyright 2015 Extrel CMS, LLC

+Sampling Requirements
Requirements are the same for any Gas Analyzer Vapor Phase
non-condensing
Particulates
5 micron filter
Pressure Range
20PSI to 0.1PSI (1034 torr to 5 torr)
Flow
100 cc/min
Temperature
Max. 200C
© Copyright 2105 Extrel CMS, LLC

+Rotary Valve Options - 16 and 31 ports
Each port has a separate outlet Cal gases can be plugged
Mount up to 3 valves in series
Sample pump and flow rack can positioned outside of the analyzer cabinet for sub ambient sampling
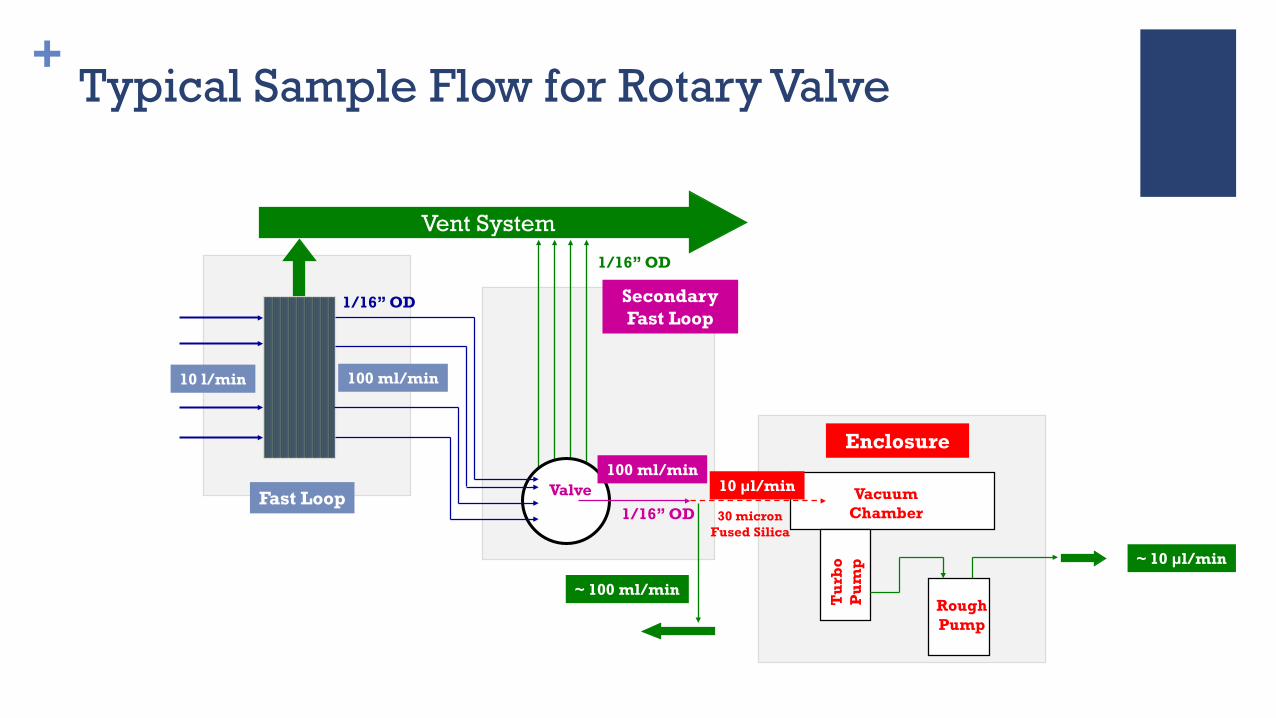
+Typical Sample Flow for Rotary Valve
Fast Loop
Enclosure
Secondary Fast Loop
10 l/min 100 ml/min
1/16” OD
1/16” OD
1/16” OD
Tu
rbo
Pu
mp
Rough Pump
Valve Vacuum Chamber
100 ml/min10 µl/min
30 micron Fused Silica
~ 100 ml/min
Vent System
~ 10 µl/min

+

+Typical Sample Flow for the FAST valve
Enclosure
100 ml/min
1/4” OD
1/16” OD
1/16” OD
Tu
rbo
Pu
mp
Rough Pump
Valve Vacuum Chamber
~5L/min/Stream
10 µl/min
Fused Silica
Vent System
~ 10 µl/min
Individual Samples Points
Valve Sample Pump

+Components of a Mass Spectrometer
Inlet Sample Requirements
Stream Selection Options
Inlet Variations
Ionizer Electron impact (EI) Ionization
Mass Filter Quadrupole Technology
Detector Faraday Plate, Electron Multiplier
Data System Signal Acquisition, Processing and Display

+“Cutaway” of Mass Spectrometer vacuum chamber
Ionizer Quadrupole Mass Filter DetectorsInlet
To Turbo Pump

+The capillary leaks a small amount of sample into the ionizer …
© Copyright 2013 Extrel CMS, LLC
30 micron Fused Silica
-e
Ionizer
-e -e-e-e -e-e-e -e -e-e
where it is bombarded by electrons to make positively charged ions
+++ + +
Ionizer block heated to 180C
Lens Stack
Quad
A current is continuously applied to the (active) filament to heat it up and emit electrons
++++
+++
+ +
Positive charged ions are attracted towards the lens stack where there is a negative voltage …
the ions are pulled out of the ionizer and propelled into the quadrupole mass filter.

+Mechanism of Electron Impact Ionization
© Copyright 2105 Extrel CMS, LLC
M + e M+ + 2e Single Ionization
Double Ionization M + e M++ + 3e
M + e M1+ + R
.+ 2e Fragmentation
Molecule
Filament
Electron (70 eV ) Electron
-

+Simple Fragmentation of Methane
Single Ionization occurs with the electron bombardment causing the CH4 to lose an electron and become CH4+
Largest peak at mass 16 (100)
Additional interactions cause CH4+
to Fragment, losing a H and become CH3+
Mass 15 peak of (81)
Less frequently, the electrons will cause subsequent H losses to CH2+,CH+ and C+ and H+
CH4+ CH3
+ + H
CH2+
CH+
C+
H+
(15)
(14)
(13)
(12)
(1)
(16)
12 13 14 15 16 17
100
1
915
81
7

+How does a mass filter work?
RF and DC voltage is applied to opposite rods
Only ions of the right mass make it all the way down the quad
Other masses are unstable and will strike the quad and be neutralized and pumped away
RF Voltage Supply
DC Voltage Supply
+
+
-
-
+
Looking straight down the quad
+ +

+What is going on inside the chamber?
Ionizer Quadrupole Mass Filter DetectorsInlet
To Turbo Pump

+Fragment Deconvolution

+Extrel 19mm Quadrupole Technology
High Ion Transmission= High Sensitivity + High Stability
Analysis precision: ±0.0025 absolute* Stability: ±0.05 absolute over 30 days* Detection Range: 100% - 10 ppm standard 10 ppb w/ electron multiplier 10 ppt w/ membrane inlet

+Extrel 19 mm Quadrupole Technology
Small Quadrupole analyzers (6 mm, 9 mm) Lower ion transmission means less ion current at the detector = higher LDL
To compensate, the pressure is increased in the ionizer = poor resolution and stability (known as “space charge effects” )
CO2 on 6 mm Quad with “space charge”
CO2 on a 19 mm Quad

+Extrel 19mm Quadrupole Technology
Magnetic Sector Mass Spectrometers Loss of resolution at higher mass means that as molecular weight increases analyzer
selectivity breaks down
To compensate, smaller “high mass” ion slits are used to block, these result in lower ion currents at the detector and decreased sensitivity
10 20 30 40 50 60 70 80 90R
esol
utio
nm/z
Resolution vs. Mass Range
Quad
MagSec
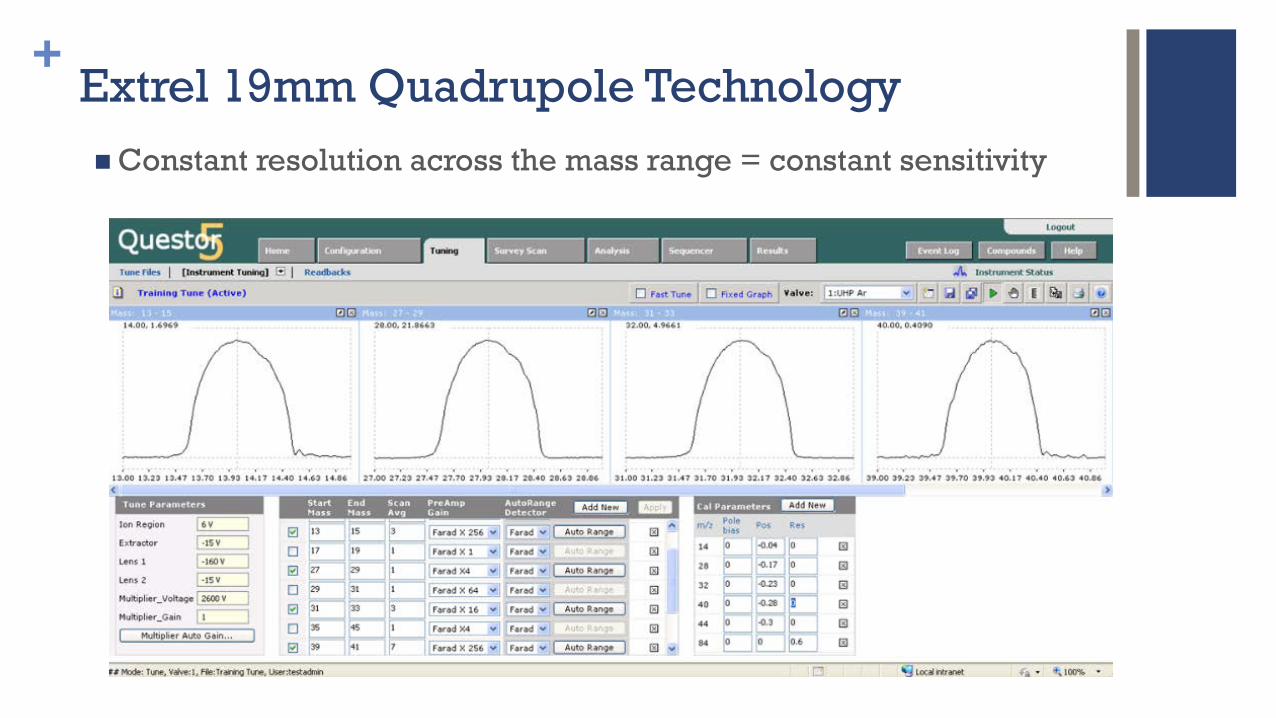
+Extrel 19mm Quadrupole TechnologyConstant resolution across the mass range = constant sensitivity
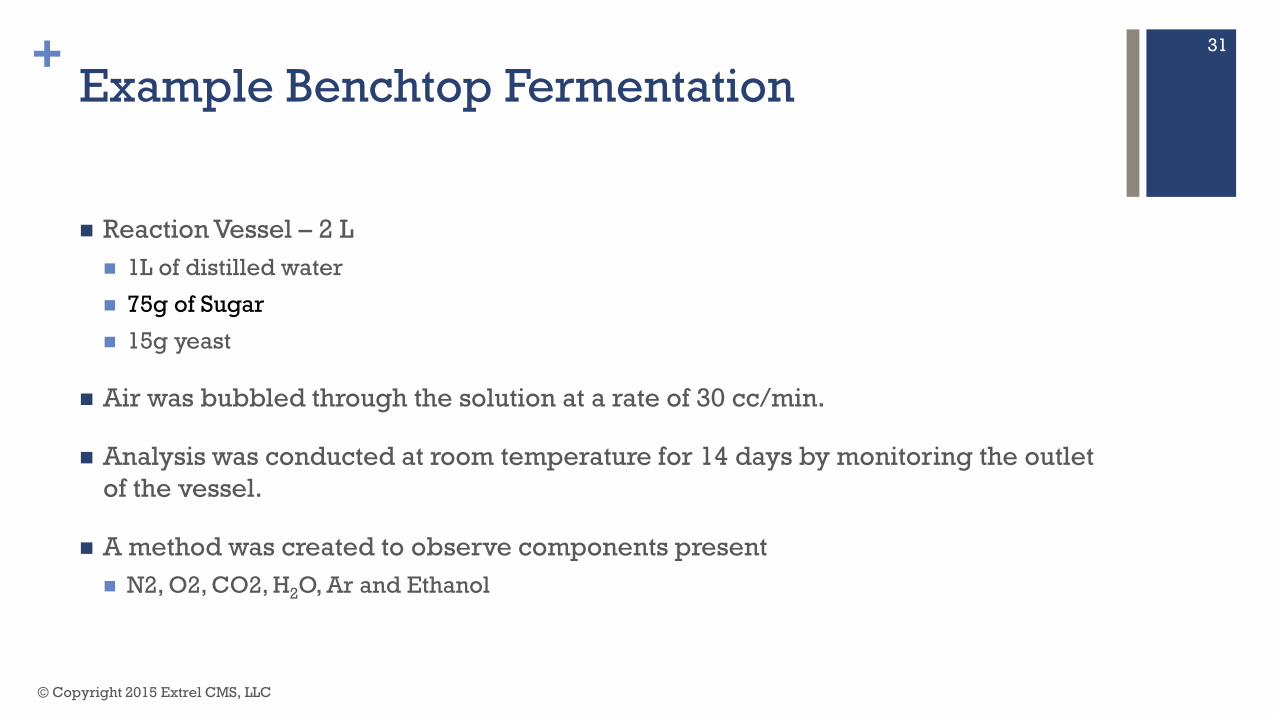
+Example Benchtop Fermentation
Reaction Vessel – 2 L 1L of distilled water
75g of Sugar
15g yeast
Air was bubbled through the solution at a rate of 30 cc/min.
Analysis was conducted at room temperature for 14 days by monitoring the outlet of the vessel.
A method was created to observe components present N2, O2, CO2, H2O, Ar and Ethanol
© Copyright 2015 Extrel CMS, LLC
31

+CO2 and Ethanol Trending During Fermentation
© Copyright 2015 Extrel CMS, LLC
32
3.22%
0.12%
-0.02
0.00
0.02
0.04
0.06
0.08
0.10
0.12
0.14
0.00
0.50
1.00
1.50
2.00
2.50
3.00
3.50
4.00
0 1 2 3 4 5 6 7 8 9 10 11 12 13
Eth
anol
Con
cen
trat
ion
(%)
Per
cen
t Con
cen
trat
ion
(%)
Days
CO2 H2O AR C2H6O

+Data Summary- Calculated liquid concentration from off gas data
© Copyright 2015 Extrel CMS, LLC
33
Production of CO2, began immediately and rapidly reaching its maximum value of 3.25% by hour 30 of the experiment.
Ethanol production lagged behind CO2 roughly 30 hours and steadily increased until hour 150 of the experiment.
Ethanol plateaued at 1200ppm and remained at this level until the experiment was concluded.
Based on Henry’s Law, 1200ppm in the head space equates to 1.5% alcohol in the liquid phase.

+Data Precision
Data trend and precision calculation in the Questor5 control software
This fermentation run also measured ppm-level formaldehyde contamination
High precision ensures tight production control
© Copyright 2015 Extrel CMS, LLC
34
Application Overview – Fermentation Control

+Ethanol Fermentation Conclusion Reduced Cycle Time: Maximum alcohol was achieved after 150 hours, signifying the end of the batch concentration was achieved
and the batch could be concluded. Analyze one component in approximately 400 milliseconds or one full sample analysis in less than 10
seconds. This speed of analysis enables multiple bioreactors to be analyzed with on analyzer.
Improved Yields: Health of the Yeast is observed by monitoring the exponential increase of the CO2 output in the first 30
hours of the experiment. Continuous monitoring of the bio-reaction gives a full understanding of the health of the culture and the
efficiency of the process. The analysis accuracy allows the calculation of the Respiratory Quotient in real-time.
Reduced Waste: Fermentation process problems are indicated by the presence of part per million (ppm) level components.
Dynamic range of 100% down to 10 ppb allows for rapid adjustments of the process without comprising the batch quality.
© Copyright 2015 Extrel CMS, LLC
35

+Endpoint detection
Industrial biosynthesis is a multistage process: The bioreactor is sterilized The growth media is added Contamination- CER <0 prior to inoculation indicates bacterial
contamination Inoculation Cellular growth and multiplication- might use a primary carbon source
ideal for logarithmic growth Secondary metabolite production- switch the nutrient source to drive
the metabolic pathways toward the desired product Product harvest

+Mass Spectrometer Advantages
Efficiency- Increase product yield and decreased cycle time Fast updates for tight control of process variables
Contamination detection
Multiple reactors with a single analyzer Replace the cost and complexity of maintaining and several discrete sets of analyzers
Simultaneous measurement of O2, CO2, N2, and Ar No need to coordinate and maintain multiple analytical systems for RQ
Improved confidence RQ Measurement. Ex) RQ=1 ± 0.7% No need to rely on data from flow meters (± 5%)
+
Process Mass SpectrometryIn Bioreactor Control
Providing Solutions in Gas Analysis
Related Documents