GAP GREEN Journal Issue 2014/1 English Supplementary

Welcome message from author
This document is posted to help you gain knowledge. Please leave a comment to let me know what you think about it! Share it to your friends and learn new things together.
Transcript
GAP$GREEN$Journal$ !!
! ! !!
!!
Issue!2014/1!$English$Supplementary$
!
!
!
Contents$!
! Project!description! ! ! ! ! ! ! ! pages!316!
! Recent!report!analysis! ! ! ! ! ! ! pages!7112!
! Invited!Article! ! ! ! ! ! ! ! ! pages!13124!! !
!
!
!
!
!
!
!
!
GAP GREEN Supplementary for Issue 2014/1 3
1 Project Description
Utilization of Renewable Energy Resources and Increasing Energy
Efficiency in the Southeast Anatolia Region Project
Keynote:
Utilization of Renewable Energy (RE) Resources and Increasing Energy Efficiency (EE) in the Southeast Anatolia Region Project (the Project) is being implemented by the Southeast Anatolia Regional Development Administration of Turkish Ministry of Development (GAP RDA), with the technical support of the United Nations Development Programme (UNDP). The first phase of the Project, covering the analyses and planning studies, was carried out between 2009 and 2011, and the second phase which includes several pilot project and demonstrative activities was initiated in 2012.

GAP GREEN Supplementary for Issue 2014/1 4
1. INTRODUCTION
1.1. Background and Justification
According to the measurements performed by the Turkish General Directorate of Renewable Energy, the Southeast Anatolia Region receives the maximum amount of solar irradiation, compared to all other geographical regions of Turkey. An annual average of 3000 hrs of sunshine offers a considerable potential for both solar thermal applications and solar electricity generation. The Southeast Anatolia Region also has an abundance of biomass potential, consisting of wheat, barley, corn, and cotton wastes.
The Competiveness Agenda developed for the GAP Region emphasizes the strategic importance of utilization of renewable energy resources and increasing energy efficiency in industrial, agricultural, and service sectors, serving to increase the competitiveness of the Region and fostering economic development in a sustainable manner.
Utilization of Renewable Energy Resources and Increasing Energy Efficiency in the Southeast Anatolia Region Project has been incorporated into the GAP Action Plan, which was announced and introduced in 2008, and was initiated through the deployment of national resources.
1.2. Objective
The Project aims at contributing to the development of the Southeast Anatolia Region in a sustainable and socially equitable manner.
In line with the overall objective, the project aims at effective utilization of regional renewable energy resources and increased energy efficiency in industrial, agricultural, and service sectors.
1.3. Initial Concrete Outcomes
During the first phase of the Project, following the identification of the regional potential in renewable energy and energy efficiency, through a participatory process involving both national and regional actors, a regional Renewable Energy and Energy Efficiency Strategy and Action Plan was developed..
2. GAP REEE ACTION PLAN and GAP REEEC
Within the scope of the GAP REEE Action Plan, both economic and social issues were approached on sectoral and horizontal axes in line with the principle of integrity, through a series of activities such as increasing the employment opportunities in the RE and EE sectors, improving the physical and knowledge infrastructure, creating public awareness in the fields of RE and EE, and implementing pilot projects in line with the sectoral priorities.
The Action Plan aims at achieving the following results;
• Decreasing production costs in the Region,
• Bringing the production of renewable energy technologies into the development agenda of the Region,
• Creating new employment opportunities,
• Increasing the rate of energy locally supplied,
• Improving institutional capacities, technical infrastructure, and applied research opportunities,
• Increasing level of agricultural production while decreasing the costs in relation to production processes,
• Enhancing socio-economic development.
During the first phase of the Project, a significant achievement was made in terms of development of research and development infrastructures the fields of RE, and establishment of national and international networks.
In this sense, currently being established at Harran University with the financial support of the Turkish Ministry of Development, the GAP Renewable Energy and Energy Efficiency Center (GAP REEEC) will immensely contribute to the creation of regional applied research infrastructure and capabilities.
GAP GREEN Supplementary for Issue 2014/1 5
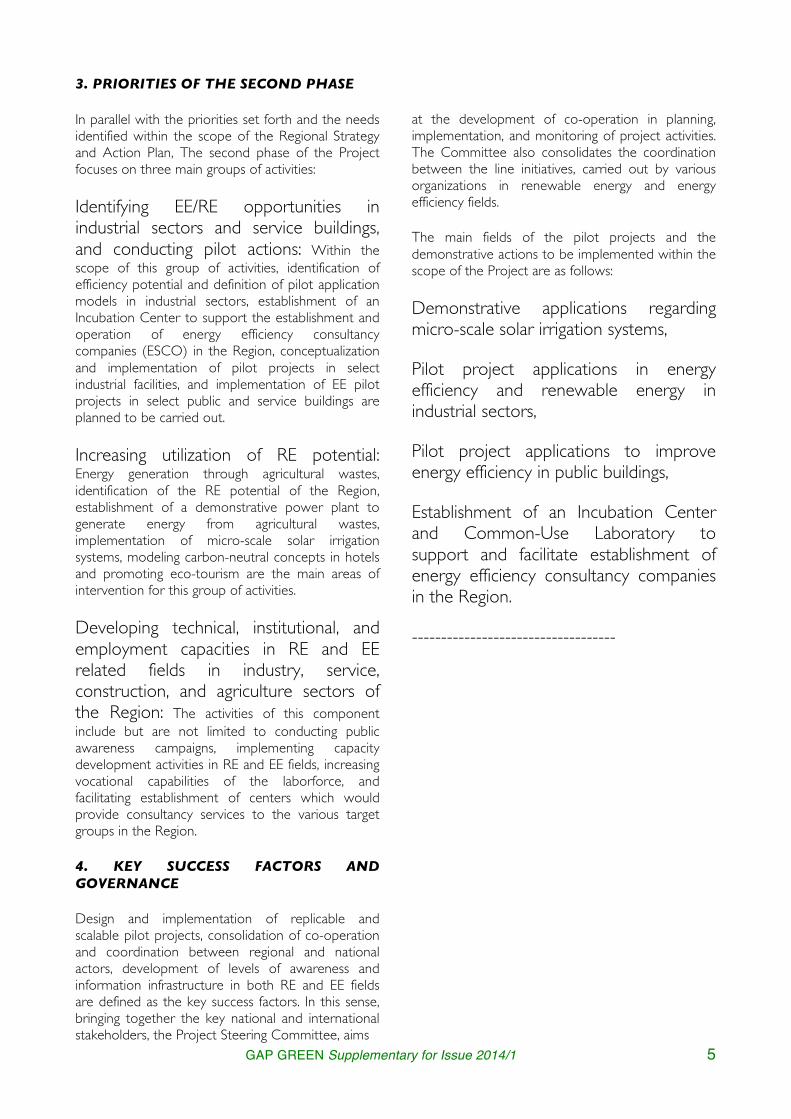
3. PRIORITIES OF THE SECOND PHASE
In parallel with the priorities set forth and the needs identified within the scope of the Regional Strategy and Action Plan, The second phase of the Project focuses on three main groups of activities:
Identifying EE/RE opportunities in industrial sectors and service buildings, and conducting pilot actions: Within the scope of this group of activities, identification of efficiency potential and definition of pilot application models in industrial sectors, establishment of an Incubation Center to support the establishment and operation of energy efficiency consultancy companies (ESCO) in the Region, conceptualization and implementation of pilot projects in select industrial facilities, and implementation of EE pilot projects in select public and service buildings are planned to be carried out.
Increasing utilization of RE potential: Energy generation through agricultural wastes, identification of the RE potential of the Region, establishment of a demonstrative power plant to generate energy from agricultural wastes, implementation of micro-scale solar irrigation systems, modeling carbon-neutral concepts in hotels and promoting eco-tourism are the main areas of intervention for this group of activities.
Developing technical, institutional, and employment capacities in RE and EE related fields in industry, service, construction, and agriculture sectors of the Region: The activities of this component include but are not limited to conducting public awareness campaigns, implementing capacity development activities in RE and EE fields, increasing vocational capabilities of the laborforce, and facilitating establishment of centers which would provide consultancy services to the various target groups in the Region.
4. KEY SUCCESS FACTORS AND GOVERNANCE
Design and implementation of replicable and scalable pilot projects, consolidation of co-operation and coordination between regional and national actors, development of levels of awareness and information infrastructure in both RE and EE fields are defined as the key success factors. In this sense, bringing together the key national and international stakeholders, the Project Steering Committee, aims
at the development of co-operation in planning, implementation, and monitoring of project activities. The Committee also consolidates the coordination between the line initiatives, carried out by various organizations in renewable energy and energy efficiency fields.
The main fields of the pilot projects and the demonstrative actions to be implemented within the scope of the Project are as follows:
Demonstrative applications regarding micro-scale solar irrigation systems,
Pilot project applications in energy efficiency and renewable energy in industrial sectors,
Pilot project applications to improve energy efficiency in public buildings,
Establishment of an Incubation Center and Common-Use Laboratory to support and facilitate establishment of energy efficiency consultancy companies in the Region.
-----------------------------------

GAP GREEN Supplementary for Issue 2014/1 6
Blan
k pa
ge
GAP GREEN Supplementary for Issue 2014/1 7
2 Recent Report Analysis
RENEWABLES 2014 GLOBAL STATUS REPORT: Key
Findings*
* Edited and rephrased from RENEWABLES 2014 GLOBAL STATUS REPORT by the Editorial Board.
GAP GREEN Supplementary for Issue 2014/1 8
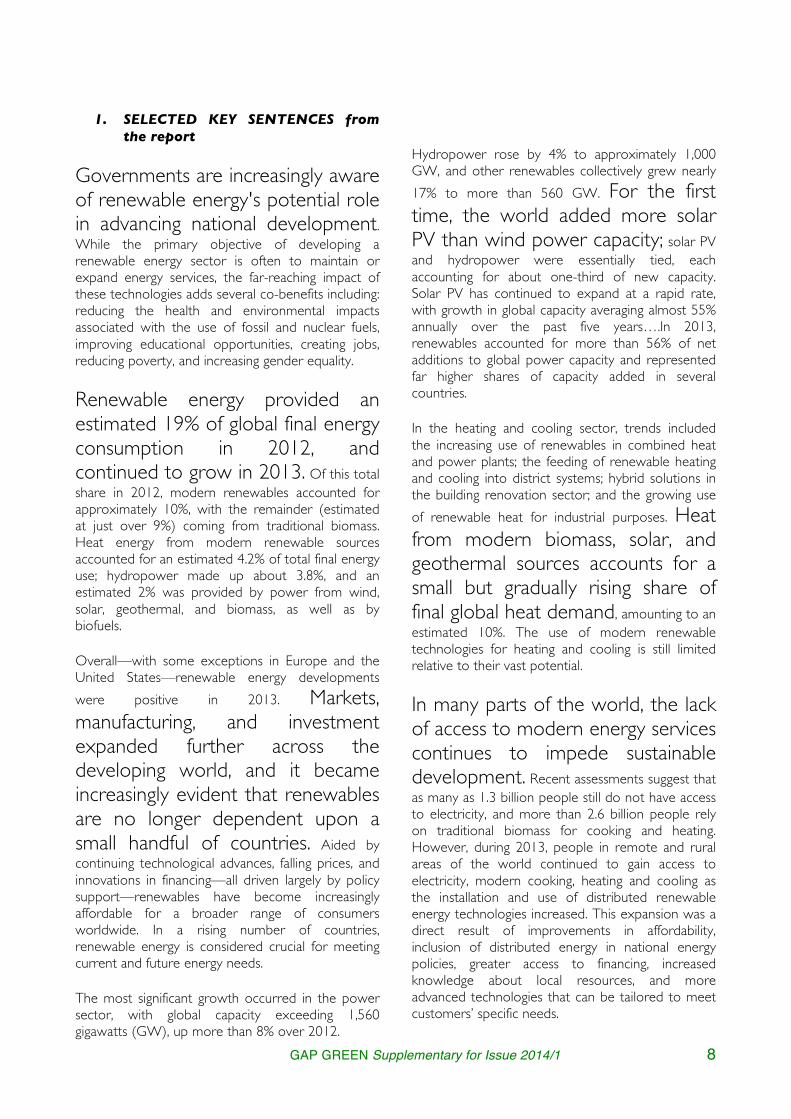
1. SELECTED KEY SENTENCES from the report
Governments are increasingly aware of renewable energy's potential role in advancing national development. While the primary objective of developing a renewable energy sector is often to maintain or expand energy services, the far-reaching impact of these technologies adds several co-benefits including: reducing the health and environmental impacts associated with the use of fossil and nuclear fuels, improving educational opportunities, creating jobs, reducing poverty, and increasing gender equality.
Renewable energy provided an estimated 19% of global final energy consumption in 2012, and continued to grow in 2013. Of this total share in 2012, modern renewables accounted for approximately 10%, with the remainder (estimated at just over 9%) coming from traditional biomass. Heat energy from modern renewable sources accounted for an estimated 4.2% of total final energy use; hydropower made up about 3.8%, and an estimated 2% was provided by power from wind, solar, geothermal, and biomass, as well as by biofuels.
Overall—with some exceptions in Europe and the United States—renewable energy developments were positive in 2013. Markets, manufacturing, and investment expanded further across the developing world, and it became increasingly evident that renewables are no longer dependent upon a small handful of countries. Aided by continuing technological advances, falling prices, and innovations in financing—all driven largely by policy support—renewables have become increasingly affordable for a broader range of consumers worldwide. In a rising number of countries, renewable energy is considered crucial for meeting current and future energy needs.
The most significant growth occurred in the power sector, with global capacity exceeding 1,560 gigawatts (GW), up more than 8% over 2012.
Hydropower rose by 4% to approximately 1,000 GW, and other renewables collectively grew nearly 17% to more than 560 GW. For the first time, the world added more solar PV than wind power capacity; solar PV and hydropower were essentially tied, each accounting for about one-third of new capacity. Solar PV has continued to expand at a rapid rate, with growth in global capacity averaging almost 55% annually over the past five years….In 2013, renewables accounted for more than 56% of net additions to global power capacity and represented far higher shares of capacity added in several countries.
In the heating and cooling sector, trends included the increasing use of renewables in combined heat and power plants; the feeding of renewable heating and cooling into district systems; hybrid solutions in the building renovation sector; and the growing use of renewable heat for industrial purposes. Heat from modern biomass, solar, and geothermal sources accounts for a small but gradually rising share of final global heat demand, amounting to an estimated 10%. The use of modern renewable technologies for heating and cooling is still limited relative to their vast potential.
In many parts of the world, the lack of access to modern energy services continues to impede sustainable development. Recent assessments suggest that as many as 1.3 billion people still do not have access to electricity, and more than 2.6 billion people rely on traditional biomass for cooking and heating. However, during 2013, people in remote and rural areas of the world continued to gain access to electricity, modern cooking, heating and cooling as the installation and use of distributed renewable energy technologies increased. This expansion was a direct result of improvements in affordability, inclusion of distributed energy in national energy policies, greater access to financing, increased knowledge about local resources, and more advanced technologies that can be tailored to meet customers’ specific needs.
GAP GREEN Supplementary for Issue 2014/1 9
2. SELECTED TABLES from the report
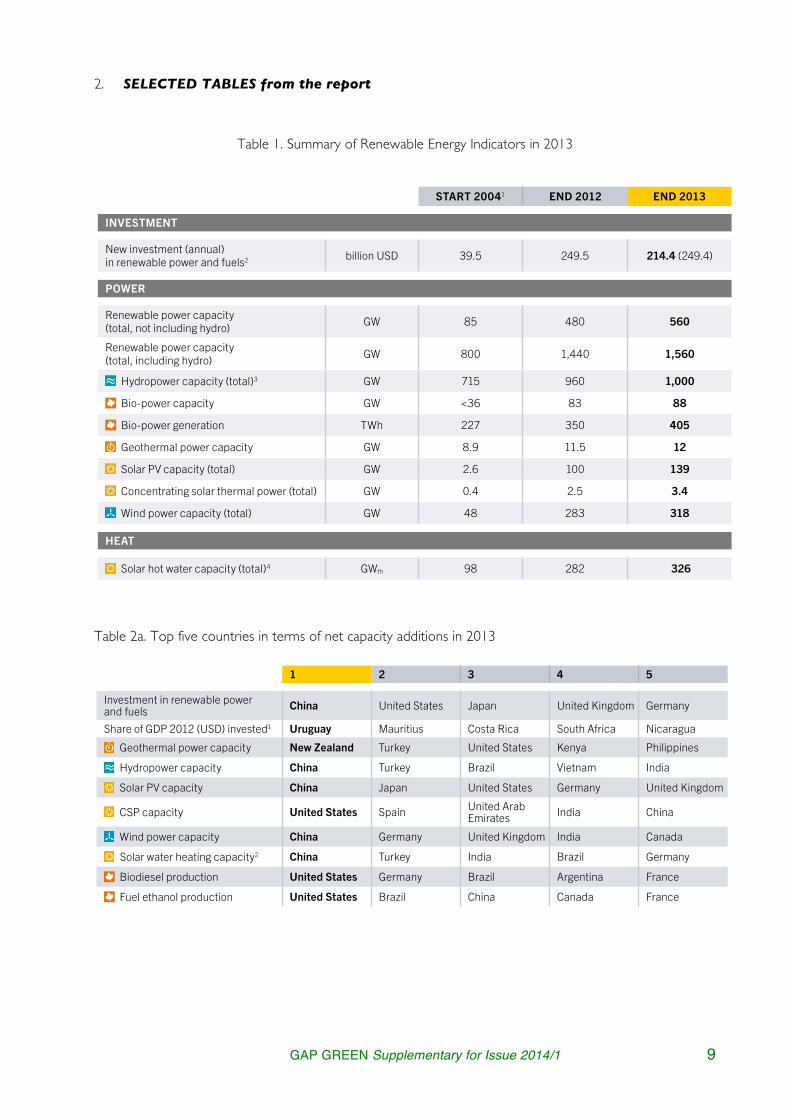
Table 1. Summary of Renewable Energy Indicators in 2013
Table 2a. Top five countries in terms of net capacity additions in 2013
8 9
RENE
WAB
LES
2014
GLO
BAL
STAT
US R
EPOR
T –
KEY
FIND
INGS
As of early 2014, at least 24 countries had adopted renewable heating (and cooling) targets, and at least 19 countries had obligations at the national or state/provincial level. Renewable heating and cooling is also supported through fiscal incentives, as well as through building codes and other measures at the national and local levels in several countries.
As of early 2014, at least 63 countries used regulatory policies to promote the production or consumption of biofuels for transport; this was up from the 49 reported in GSR 2013. Some existing blend mandates were strengthened, and the use of fiscal incentives and public financing expanded. In some countries, however, support for first-generation biofuels was reduced due to environmental and social sustainability concerns. Although most transport-related policies focus on biofuels, many governments continued to explore other options such as increasing the number of vehicles fuelled with biomethane and electricity from renewable sources.
Thousands of cities and towns worldwide have policies, plans, and targets to advance renewable energy, often far outpacing the ambitions of national legislation. Policy momentum continued in 2013 as city and local governments acted to reduce emissions, support and create local industry, relieve grid capacity stress, and achieve security of supply. To accomplish these goals, they increasingly made use of their authority to regulate, make expenditure and procurement decisions, facilitate and ease the financing of renewable energy projects, and influence advocacy and information sharing. As cities seek to share and scale up best practices, highlight their commitments to renewable energy, and account for their achievements, local governments are increasingly prioritising systematic measurement and reporting of climate and energy data.
■ INVESTMENT FLOWSGlobal new investment in renewable power and fuels—not including hydropower projects > 50 megawatts (MW)i—was an estimated USD 214.4 billion in 2013, down 14% relative to 2012 and 23% lower than the record level in 2011. Including the unreported investments in hydropower projects larger than 50 MW, total new investment in renewable power and fuels was at least USD 249.4 billion in 2013.
The second consecutive year of decline in investment—after several years of growth—was due in part to uncertainty over incentive policies in Europe and the United States, and to retroactive reductions in support in some countries. Europe’s renewable energy investment was down 44% from 2012. The year 2013 also saw an end to eight consecutive years of rising renewable energy investment in developing countries.
Yet the global decline also resulted from sharp reductions in technology costs. This was particularly true for solar PV, which saw record levels of new installations in 2013, despite a 22% decline in dollars invested. Lower costs and efficiency improvements made it possible to build onshore wind and solar PV installations in a number of locations around the world in 2013 without subsidy support, particularly in Latin America. Considering only net investment in new power capacity, renewables outpaced fossil fuels for the fourth year running.
Further, despite the overall downward trend in global investment, there were significant exceptions at the country level. The most notable was Japan, where investment in renewable energy (excluding research and development) increased by 80% relative to 2012 levels. Other countries that increased their investment in 2013 included Canada, Chile, Israel, New Zealand, the United Kingdom, and Uruguay. Despite the overall decline in China’s investment, for the first time ever, China invested more in renewable energy than did all of Europe combined, and it invested more in renewable power capacity than in fossil fuels.
Solar power was again the leading sector by far in terms of money committed during 2013, receiving 53% (USD 113.7 billion) of total new investment in renewable power and fuels (with 90% going to solar PV). Wind power followed with USD 80.1 billion. Asset finance of utility-scale projects declined for the second consecutive year, but it again made up the vast majority of total investment in renewable energy, totalling USD 133.4 billion.
Clean energy funds (equities) had a strong year, and clean energy project bonds set a new record in 2013. North America saw the emergence of innovative yield-oriented financing vehicles, and crowd funding moved further into the mainstream in a number of countries. Institutional investors continued to play an increasing role, particularly in Europe, with a record volume of renewable energy investment during the year. Development banks were again an important source of clean energy investment, with some banks pledging to curtail funding for fossil fuels, especially coal power.
■ DISTRIBUTED RENEWABLE ENERGY IN DEVELOPING COUNTRIESIn many parts of the world, the lack of access to modern energy services continues to impede sustainable development. Recent assessments suggest that as many as 1.3 billion people still do not have access to electricity, and more than 2.6 billion people rely on traditional biomass for cooking and heating. However, during 2013, people in remote and rural areas of the world continued to gain access to electricity, modern cooking, heating and cooling as the installation and use of distributed renewable energy technologies increased. This expansion was a direct result of improvements in affordability, inclusion of distributed energy in national energy policies, greater access to financing, increased knowledge about local resources, and more- advanced technologies that can be tailored to meet customers’ specific needs.
Furthermore, increased use of mini-grids supported the spread of renewable energy-powered electrification in un-electrified peri-urban and rural areas. Recent technical advances that enable the integration of renewables in mini-grid systems, combined with information and communication technology (ICT) applications for power management and end-user services, have allowed for a rapid growth in the use of renewables-powered mini-grids.
There is a growing awareness that stand-alone cooking and electri-city systems based on renewables are often the most cost-effective options available for providing energy services to households and businesses in remote areas. As a result, an increasing number of countries is supporting the development of decentralised renewable energy-based systems to expand energy access.
i - Except where noted explicitly, investment data in this section do not include hydropower projects >50 MW because these are not tracked by Bloomberg New Energy Finance, the source for these statistics.
RENEWABLE ENERGY INDICATORS 2013
1 Capacity data are as of the beginning of 2004; other data, such as investment and biofuels production, cover the full year. Numbers are estimates, based on best available information.
2 Investment data are from Bloomberg New Energy Finance (BNEF) and include all biomass, geothermal, and wind generation projects of more than 1 MW; all hydro projects of between 1 and 50 MW; all solar power projects, with those less than 1 MW estimated separately and referred to as small-scale projects or small distributed capacity; all ocean energy projects; and all biofuel projects with an annual production capacity of 1 million litres or more. BNEF estimates that, including the unreported investments in hydropower projects >50 MW, total new investment in renewable power and fuels was at least USD 249.4 billion in 2013.
3 The GSR 2013 reported a global total of 990 GW of hydropower capacity at the end of 2012; this figure has been revised downward due to better data availabil-ity. Data do not include pumped storage.
4 Solar hot water capacity data include water collectors only; including air collectors, estimated totals are 283.4 GW for 2012 and 330 GW for 2013. The number for 2013 is a preliminary estimate. Note that past editions of this table have not considered unglazed water collectors.
5 Biofuel policies include policies listed both under the biofuels obligation/mandate column in Table 3 (Renewable Energy Support Policies) and in Reference Table R18 (National and State/Provincial Biofuel Blend Mandates). The 10 countries identified with biofuels blend mandates in the “Start 2004” column were actually in place as of 2005, the earliest year for which data are available.
Note: Renewable power capacity (including and not including hydropower) and hydropower capacity data are rounded to nearest 5 GW; other capacity numbers are rounded to nearest 1 GW except for global investment, numbers <15, and biofuels, which are rounded to one decimal point. Policy data for 2013 include all countries identified as of early 2014.
START 20041 END 2012 END 2013
INVESTMENT
New investment (annual) in renewable power and fuels2 billion USD 39.5 249.5 214.4 (249.4)
POWER
Renewable power capacity (total, not including hydro) GW 85 480 560
Renewable power capacity (total, including hydro) GW 800 1,440 1,560
Hydropower capacity (total)3 GW 715 960 1,000
Bio-power capacity GW <36 83 88
Bio-power generation TWh 227 350 405
Geothermal power capacity GW 8.9 11.5 12
Solar PV capacity (total) GW 2.6 100 139
Concentrating solar thermal power (total) GW 0.4 2.5 3.4
Wind power capacity (total) GW 48 283 318
HEAT
Solar hot water capacity (total)4 GWth 98 282 326
TRANSPORT
Ethanol production (annual) billion litres 28.5 82.6 87.2
Biodiesel production (annual) billion litres 2.4 23.6 26.3
POLICIES
Countries with policy targets # 48 138 144
Feed-in Number of states / provinces / countries # 34 97 98
RPS / quota policies Number of states / provinces / countries # 11 79 79
Tendering Number of states / provinces / countries # 8 45 55
Heat obligations / mandates Number of countries # n/a 19 19
Biofuel obligations / mandates5 Number of countries # 10 52 63
10 11
RENE
WAB
LES
2014
GLO
BAL
STAT
US R
EPOR
T –
KEY
FIND
INGS
TOP FIVE COUNTRIES
1 Countries considered include only those covered by Bloomberg New Energy Finance; GDP is for 2012 and from the World Bank. The following renewable energy projects are included: all biomass, geothermal, and wind generation projects of more than 1 MW; all hydropower projects of between 1 and 50 MW; all solar power projects, with those less than 1 MW estimated separately and referred to as small-scale projects or small distributed capacity; all ocean energy projects; and all biofuel projects with an annual production capacity of 1 million litres or more.
2 Solar water collector (heating) rankings are for 2012, and are based on capacity of water (glazed and unglazed) collectors only; however, including air collectors would not affect order. Note that past editions of this table have not considered unglazed water collectors.
3 Per capita renewable power capacity ranking considers only those countries that place among the top 20 worldwide for total installed renewable power capacity, not including hydropower.
4 Country rankings for hydropower capacity and generation differ because some countries rely on hydropower for baseload supply whereas others use it more to follow the electric load and match peaks in demand.
5 Not including heat pumps. Rankings are based on a mix of 2010 data and more recent statistics for some countries.6 Capacity, otherwise noted.Note: Most rankings are based on absolute amounts of investment, power generation capacity or output, or biofuels production; if done on a per capita, national GDP, or other basis, the rankings would be quite different for many categories (as seen with per capita rankings for renewable power, solar PV, wind, and solar water collector capacity).
1 2 3 4 5
Investment in renewable power and fuels China United States Japan United Kingdom Germany
Share of GDP 2012 (USD) invested1 Uruguay Mauritius Costa Rica South Africa Nicaragua
Geothermal power capacity New Zealand Turkey United States Kenya Philippines
Hydropower capacity China Turkey Brazil Vietnam India
Solar PV capacity China Japan United States Germany United Kingdom
CSP capacity United States Spain United Arab Emirates India China
Wind power capacity China Germany United Kingdom India Canada
Solar water heating capacity2 China Turkey India Brazil Germany
Biodiesel production United States Germany Brazil Argentina France
Fuel ethanol production United States Brazil China Canada France
ANNUAL INVESTMENT / NET CAPACIT Y ADDITIONS / PRODUCTION IN 2013
1 2 3 4 5
POWER
Renewable power (incl. hydro) China United States Brazil Canada GermanyRenewable power (not incl. hydro) China United States Germany Spain / Italy IndiaRenewable power capacity per capita (not incl. hydro)3 Denmark Germany Portugal Spain / Sweden Austria
Biopower generation United States Germany China Brazil India
Geothermal power United States Philippines Indonesia Mexico Italy
Hydropower4 China Brazil United States Canada Russia
Hydropower generation4 China Brazil Canada United States Russia
Concentrating solar thermal power (CSP) Spain United States United Arab
Emirates India Algeria
Solar PV Germany China Italy Japan United States
Solar PV capacity per capita Germany Italy Belgium Greece Czech Republic
Wind power China United States Germany Spain India
Wind power capacity per capita Denmark Sweden Spain Portugal Ireland
HEAT
Solar water heating2 China United States Germany Turkey Brazil
Solar water heating capacity per capita2 Cyprus Austria Israel Barbados Greece
Geothermal heat5 China Turkey Iceland Japan Italy
TOTAL CAPACIT Y OR GENERATION 6 AS OF END-2013
With the rising awareness that off-grid, low-income customers can provide fast-growing markets for goods and services, and with the emergence of new business and financing models for serving them, rural energy markets are increasingly being recognised as offering potential business opportunities. Many companies have become active across Africa, Asia, and Latin America, selling household-level renewable energy systems and devices. Commercial lenders, social venture capitalists, local and international development entities, governments, and others are actively engaged in the financing of distributed renewable energy. In 2013, levels of participation and progress varied from country to country depending on support policies, broader legal frameworks, and political stability.
■ MARKET AND INDUSTRY TRENDSBIOMASS FOR HEAT, POWER, AND TRANSPORT. Biomass demand continued to grow steadily in the heat,
power, and transport sectors. Total primary energy consumption of biomass reached approximately 57 exajoules (EJ) in 2013, of which almost 60% was traditional biomass, and the remainder was modern bioenergy (solid, gaseous, and liquid fuels). Heating accounted for the majority of biomass use, with modern biomass heat capacity rising about 1% to an estimated 296 gigawatts-thermal (GWth). Global bio-power capacity was up by an estimated 5 GW to 88 GW. Bio-power generation exceeded 400 Terawatt-hours (TWh) during the year, including power generated in combined heat and power (CHP) plants. Demand for modern biomass is driving increased international trade in solid biofuels, including wood pellets.
Liquid biofuels met about 2.3% of global transport fuel demand. In 2013, global production rose by 7.7 billion litres to reach 116.6 billion litres. Ethanol production was up 6% after two years of decline, biodiesel rose 11%, and hydrotreated vegetable oil (HVO) rose by 16% to 3 million litres. New plants for making advanced biofuels, produced from non-food biomass feedstocks, were commissioned in Europe and North America. However, overall investment in new biofuel plant capacity continued to decline from its 2007 peak.
GEOTHERMAL POWER AND HEAT. About 530 MW of new geothermal generating capacity came on line
in 2013. Accounting for replacements, the net increase was about 455 MW, bringing total global capacity to 12 GW. This net capacity growth of 4% compares to an average annual growth rate of 3% for the two previous years (2010–12). Direct use of geothermal energy—for thermal baths and swimming pools, space heating, and agricultural and industrial processes—is estimated to exceed 300 petajoules (PJ) annually, but growth is not robust. Governments and industry continued to pursue technological innovation to increase efficient use of conventional geothermal resources. In parallel, the use of low-temperature fields for both power and heat continued to expand, increasing the application of geothermal energy beyond high-temperature locations.
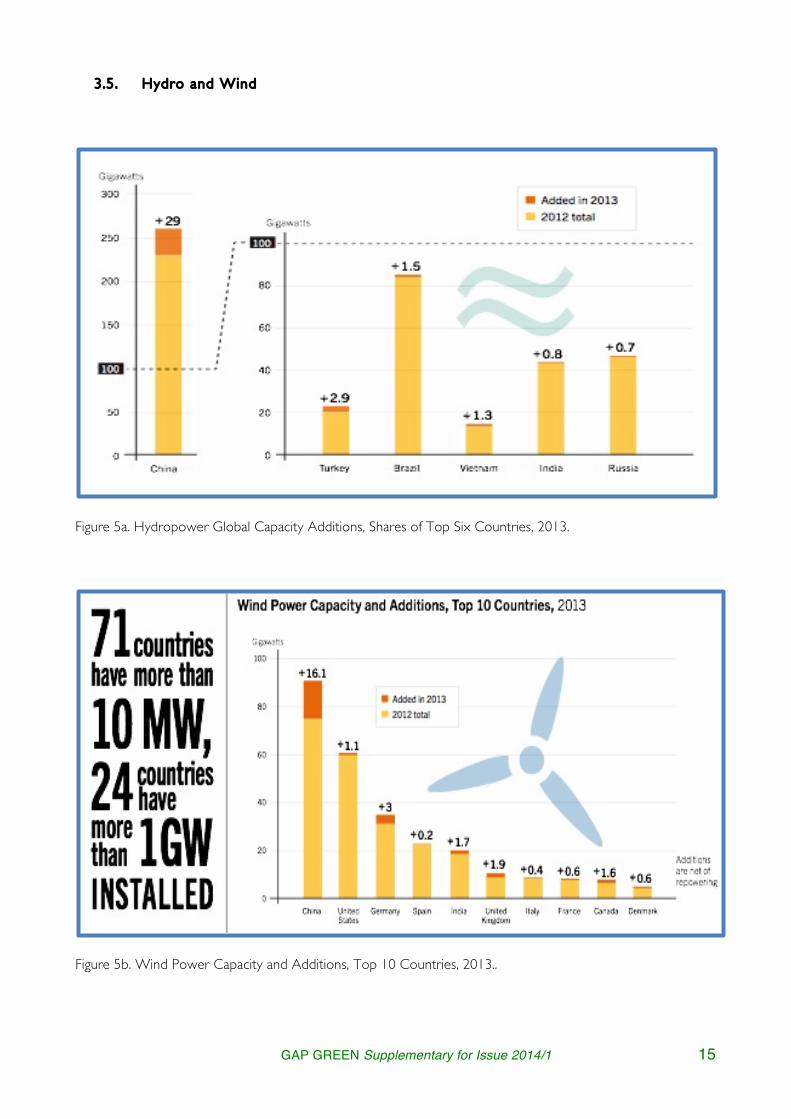
HYDROPOWER. Global hydropower generation during the year was an estimated 3,750 TWh. About 40 GW of
new hydropower capacity was commissioned in 2013, increasing total global capacity by around 4% to approximately 1,000 GW. By far the most capacity was installed in China (29 GW), with significant capacity also added in Turkey, Brazil, Vietnam, India, and Russia. Growth in the industry has been relatively
steady in recent years, fuelled primarily by China’s expansion. Modernisation of ageing hydropower facilities is a growing global market. Some countries are seeing a trend towards smaller reservoirs and multi-turbine run-of-river projects. There also is increasing recognition of the potential for hydropower to complement other renewable technologies, such as variable wind and solar power.
OCEAN ENERGY. Ocean energy capacity, mostly tidal power generation, was about 530 MW by the end of 2013.
In preparation for anticipated commercial projects, a handful of pilot installations were deployed during the year for ongoing tests. Particularly in the United Kingdom and France, there are indications that significant capacity growth will occur in the near future, due to concerted industry focus and government support. Major corporations continued to consolidate their positions in the ocean energy sector through strategic partnerships and acquisitions of technology developers.
SOLAR PHOTOVOLTAICS (PV). The solar PV market had a record year, adding more than 39 GW in 2013 for a total
exceeding 139 GW. China saw spectacular growth, accounting for nearly one-third of global capacity added, followed by Japan and the United States. Solar PV is starting to play a substantial role in electricity generation in some countries, particularly in Europe, while lower prices are opening new markets from Africa and the Middle East to Asia and Latin America. Interest continued to grow in corporate- and community-owned systems, while the number and size of utility-scale systems continued to increase. Although it was a challenging year for many companies, predominantly in Europe, the industry began to recover during 2013. Module prices stabilised, while production costs continued to fall and solar cell efficiencies increased steadily. Many manufacturers began expanding production capacity to meet expected further growth in demand.
CONCENTRATING SOLAR THERMAL POWER (CSP). Global CSP capacity was up nearly 0.9 GW (36%) in 2013
to reach 3.4 GW. While the United States and Spain remained the market leaders, markets continued to shift to developing countries with high levels of insolation. Beyond the leading markets, capacity nearly tripled with projects coming on line in the United Arab Emirates, India, and China. An increasing range of hybrid CSP applications emerged, and thermal energy storage continued to gain in importance. Industry operations expanded further into new markets, and global growth in the sector remained strong, but revised growth projections and competition from solar PV in some countries led a number of companies to close their CSP operations. The trend towards larger plants to take advantage of economies of scale was maintained, while improved design and manufacturing techniques reduced costs.
SOLAR THERMAL HEATING AND COOLING. Solar water and air collector capacity exceeded 283 GWth in
2012 and reached an estimated 330 GWth by the end of 2013. As in past years, China was the main demand driver, accounting for more than 80% of the global market. Demand in key European markets continued to slow, but markets expanded in countries such as Brazil, where solar thermal water heating is cost competitive. The trend towards deploying large domestic systems continued, as did growing interest in the use of solar thermal technologies for district heating, cooling, and industrial applications. China maintained its lead in the manufacture of

GAP GREEN Supplementary for Issue 2014/1 10
Table 2b. Top five countries in terms of total capacity as of end-2013
Table 3. Estimated Direct and Indirect Jobs in Renewable Energy Worldwide, by Industry as of end-2013
10 11
RENE
WAB
LES
2014
GLO
BAL
STAT
US R
EPOR
T –
KEY
FIND
INGS
TOP FIVE COUNTRIES
1 Countries considered include only those covered by Bloomberg New Energy Finance; GDP is for 2012 and from the World Bank. The following renewable energy projects are included: all biomass, geothermal, and wind generation projects of more than 1 MW; all hydropower projects of between 1 and 50 MW; all solar power projects, with those less than 1 MW estimated separately and referred to as small-scale projects or small distributed capacity; all ocean energy projects; and all biofuel projects with an annual production capacity of 1 million litres or more.
2 Solar water collector (heating) rankings are for 2012, and are based on capacity of water (glazed and unglazed) collectors only; however, including air collectors would not affect order. Note that past editions of this table have not considered unglazed water collectors.
3 Per capita renewable power capacity ranking considers only those countries that place among the top 20 worldwide for total installed renewable power capacity, not including hydropower.
4 Country rankings for hydropower capacity and generation differ because some countries rely on hydropower for baseload supply whereas others use it more to follow the electric load and match peaks in demand.
5 Not including heat pumps. Rankings are based on a mix of 2010 data and more recent statistics for some countries.6 Capacity, otherwise noted.Note: Most rankings are based on absolute amounts of investment, power generation capacity or output, or biofuels production; if done on a per capita, national GDP, or other basis, the rankings would be quite different for many categories (as seen with per capita rankings for renewable power, solar PV, wind, and solar water collector capacity).
1 2 3 4 5
Investment in renewable power and fuels China United States Japan United Kingdom Germany
Share of GDP 2012 (USD) invested1 Uruguay Mauritius Costa Rica South Africa Nicaragua
Geothermal power capacity New Zealand Turkey United States Kenya Philippines
Hydropower capacity China Turkey Brazil Vietnam India
Solar PV capacity China Japan United States Germany United Kingdom
CSP capacity United States Spain United Arab Emirates India China
Wind power capacity China Germany United Kingdom India Canada
Solar water heating capacity2 China Turkey India Brazil Germany
Biodiesel production United States Germany Brazil Argentina France
Fuel ethanol production United States Brazil China Canada France
ANNUAL INVESTMENT / NET CAPACIT Y ADDITIONS / PRODUCTION IN 2013
1 2 3 4 5
POWER
Renewable power (incl. hydro) China United States Brazil Canada GermanyRenewable power (not incl. hydro) China United States Germany Spain / Italy IndiaRenewable power capacity per capita (not incl. hydro)3 Denmark Germany Portugal Spain / Sweden Austria
Biopower generation United States Germany China Brazil India
Geothermal power United States Philippines Indonesia Mexico Italy
Hydropower4 China Brazil United States Canada Russia
Hydropower generation4 China Brazil Canada United States Russia
Concentrating solar thermal power (CSP) Spain United States United Arab
Emirates India Algeria
Solar PV Germany China Italy Japan United States
Solar PV capacity per capita Germany Italy Belgium Greece Czech Republic
Wind power China United States Germany Spain India
Wind power capacity per capita Denmark Sweden Spain Portugal Ireland
HEAT
Solar water heating2 China United States Germany Turkey Brazil
Solar water heating capacity per capita2 Cyprus Austria Israel Barbados Greece
Geothermal heat5 China Turkey Iceland Japan Italy
TOTAL CAPACIT Y OR GENERATION 6 AS OF END-2013
With the rising awareness that off-grid, low-income customers can provide fast-growing markets for goods and services, and with the emergence of new business and financing models for serving them, rural energy markets are increasingly being recognised as offering potential business opportunities. Many companies have become active across Africa, Asia, and Latin America, selling household-level renewable energy systems and devices. Commercial lenders, social venture capitalists, local and international development entities, governments, and others are actively engaged in the financing of distributed renewable energy. In 2013, levels of participation and progress varied from country to country depending on support policies, broader legal frameworks, and political stability.
■ MARKET AND INDUSTRY TRENDSBIOMASS FOR HEAT, POWER, AND TRANSPORT. Biomass demand continued to grow steadily in the heat,
power, and transport sectors. Total primary energy consumption of biomass reached approximately 57 exajoules (EJ) in 2013, of which almost 60% was traditional biomass, and the remainder was modern bioenergy (solid, gaseous, and liquid fuels). Heating accounted for the majority of biomass use, with modern biomass heat capacity rising about 1% to an estimated 296 gigawatts-thermal (GWth). Global bio-power capacity was up by an estimated 5 GW to 88 GW. Bio-power generation exceeded 400 Terawatt-hours (TWh) during the year, including power generated in combined heat and power (CHP) plants. Demand for modern biomass is driving increased international trade in solid biofuels, including wood pellets.
Liquid biofuels met about 2.3% of global transport fuel demand. In 2013, global production rose by 7.7 billion litres to reach 116.6 billion litres. Ethanol production was up 6% after two years of decline, biodiesel rose 11%, and hydrotreated vegetable oil (HVO) rose by 16% to 3 million litres. New plants for making advanced biofuels, produced from non-food biomass feedstocks, were commissioned in Europe and North America. However, overall investment in new biofuel plant capacity continued to decline from its 2007 peak.
GEOTHERMAL POWER AND HEAT. About 530 MW of new geothermal generating capacity came on line
in 2013. Accounting for replacements, the net increase was about 455 MW, bringing total global capacity to 12 GW. This net capacity growth of 4% compares to an average annual growth rate of 3% for the two previous years (2010–12). Direct use of geothermal energy—for thermal baths and swimming pools, space heating, and agricultural and industrial processes—is estimated to exceed 300 petajoules (PJ) annually, but growth is not robust. Governments and industry continued to pursue technological innovation to increase efficient use of conventional geothermal resources. In parallel, the use of low-temperature fields for both power and heat continued to expand, increasing the application of geothermal energy beyond high-temperature locations.
HYDROPOWER. Global hydropower generation during the year was an estimated 3,750 TWh. About 40 GW of
new hydropower capacity was commissioned in 2013, increasing total global capacity by around 4% to approximately 1,000 GW. By far the most capacity was installed in China (29 GW), with significant capacity also added in Turkey, Brazil, Vietnam, India, and Russia. Growth in the industry has been relatively
steady in recent years, fuelled primarily by China’s expansion. Modernisation of ageing hydropower facilities is a growing global market. Some countries are seeing a trend towards smaller reservoirs and multi-turbine run-of-river projects. There also is increasing recognition of the potential for hydropower to complement other renewable technologies, such as variable wind and solar power.
OCEAN ENERGY. Ocean energy capacity, mostly tidal power generation, was about 530 MW by the end of 2013.
In preparation for anticipated commercial projects, a handful of pilot installations were deployed during the year for ongoing tests. Particularly in the United Kingdom and France, there are indications that significant capacity growth will occur in the near future, due to concerted industry focus and government support. Major corporations continued to consolidate their positions in the ocean energy sector through strategic partnerships and acquisitions of technology developers.
SOLAR PHOTOVOLTAICS (PV). The solar PV market had a record year, adding more than 39 GW in 2013 for a total
exceeding 139 GW. China saw spectacular growth, accounting for nearly one-third of global capacity added, followed by Japan and the United States. Solar PV is starting to play a substantial role in electricity generation in some countries, particularly in Europe, while lower prices are opening new markets from Africa and the Middle East to Asia and Latin America. Interest continued to grow in corporate- and community-owned systems, while the number and size of utility-scale systems continued to increase. Although it was a challenging year for many companies, predominantly in Europe, the industry began to recover during 2013. Module prices stabilised, while production costs continued to fall and solar cell efficiencies increased steadily. Many manufacturers began expanding production capacity to meet expected further growth in demand.
CONCENTRATING SOLAR THERMAL POWER (CSP). Global CSP capacity was up nearly 0.9 GW (36%) in 2013
to reach 3.4 GW. While the United States and Spain remained the market leaders, markets continued to shift to developing countries with high levels of insolation. Beyond the leading markets, capacity nearly tripled with projects coming on line in the United Arab Emirates, India, and China. An increasing range of hybrid CSP applications emerged, and thermal energy storage continued to gain in importance. Industry operations expanded further into new markets, and global growth in the sector remained strong, but revised growth projections and competition from solar PV in some countries led a number of companies to close their CSP operations. The trend towards larger plants to take advantage of economies of scale was maintained, while improved design and manufacturing techniques reduced costs.
SOLAR THERMAL HEATING AND COOLING. Solar water and air collector capacity exceeded 283 GWth in
2012 and reached an estimated 330 GWth by the end of 2013. As in past years, China was the main demand driver, accounting for more than 80% of the global market. Demand in key European markets continued to slow, but markets expanded in countries such as Brazil, where solar thermal water heating is cost competitive. The trend towards deploying large domestic systems continued, as did growing interest in the use of solar thermal technologies for district heating, cooling, and industrial applications. China maintained its lead in the manufacture of
World China Brazil United States India Bangla-
deshEuropean Unionm
Germany Spain Rest of EUThousand Jobs
Biomassa,b 782 240 152h 58 52 44 210
Biofuels 1,453 24 820f 236i 35 26 3 82
Biogas 264 90 85 9.2 49 0.5 19
Geothermala 184 35 17 1.4 82
Hydropower (Small)c
156 12 8 12 4.7 13 1.5 18
Solar PV 2,273 1,580e 112 100k 56 11 153
CSP 43 143 j 1 28 0
Solar Heating / Cooling
503 350 30g 41 11 1 31
Wind Power 834 356 32 51 48 0.1 138 24 166
Total 6,492d 2,640 894 625 391 114 371l 114 760
GAP GREEN Supplementary for Issue 2014/1 11
3. SELECTED FIGURES from the report
3.1 . Renewable Energy
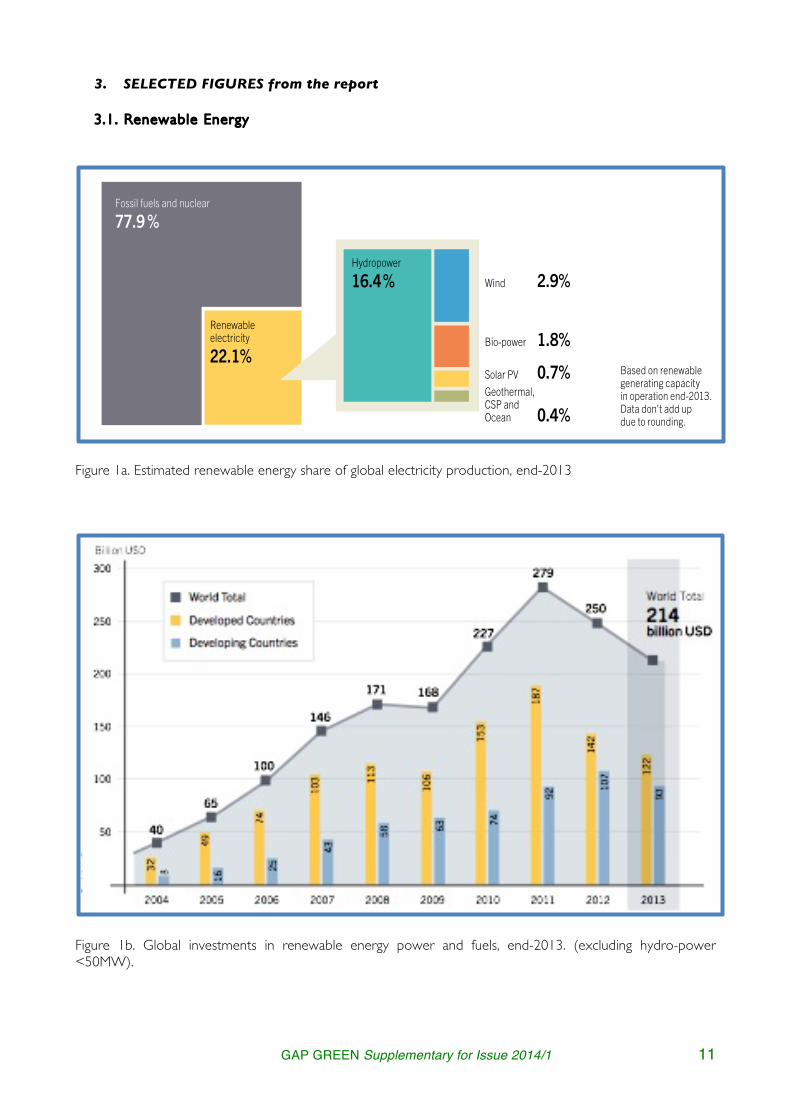
Figure 1a. Estimated renewable energy share of global electricity production, end-2013
Figure 1b. Global investments in renewable energy power and fuels, end-2013. (excluding hydro-power <50MW).
Based on renewable generating capacity in operation at year-end 2013.
Fossil fuels and nuclear
77.9 %
Renewableelectricity
22.1%
Hydropower
16.4%
Bio-power 1.8%
Wind 2.9%
Solar PV 0.7%Geothermal,CSP andOcean 0.4%
Based on renewable generating capacity in operation end-2013.Data don't add up due to rounding.

GAP GREEN Supplementary for Issue 2014/1 12
3.2 . Solar Energy - PV
Figure 2a Solar PV Total Global Capacity, 2004–2013
Figure 2b. Solar PV Capacity and Additions, Top 10 Countries, 2013
Figure 2c Solar PV Capacity and Additions, Top 10 Countries, 2013

GAP GREEN Supplementary for Issue 2014/1 13
3.3 . Solar Energy – Thermal with CSP
Figure 3a. Solar Water Heating Collectors Global Capacity, 2000-2013.
Figure 3b. Solar Water Heating Collectors Global Capacity and shares of Top10 countries in 2012.
Figure 3c Concentrating Solar Thermal Power Global Capacity, by Country or Region, 2004–2013.
China
64%
Rest of the World
13%
Next 9 countries
23%
United States 5.8%Germany 4.2%Turkey 3.9%Brazil 2.1%Australia 1.8%India 1.6%Austria 1.2%Japan 1.1%Israel 1.0%

GAP GREEN Supplementary for Issue 2014/1 14
3.4 . Biomass and Geothermal
Figure 4a. Wood Pellet Global 25 Production, by Country or Region,, 2004-2013.
Figure 4b. Geothermal Power Capacity and Additions, Top 10 Countries and Rest of World, 2013.
GAP GREEN Supplementary for Issue 2014/1 15
3.5 . Hydro and Wind
Figure 5a. Hydropower Global Capacity Additions, Shares of Top Six Countries, 2013.
Figure 5b. Wind Power Capacity and Additions, Top 10 Countries, 2013..

GAP GREEN Supplementary for Issue 2014/1 16
3.6 . Jobs in Renewable Energy
Figure 6. Share of direct and indirect jobs in renewable energy worldwide, by industry.
4. CONCLUDING REMARKS
The recent REN21 report term was successful for Turkey since;
Turkey is the second top country in the world, in terms of net geothermal power capacity additions in 2013, with 112 MW
Turkey is the second top country in the world, in terms of net hydropower capacity additions in 2013, with 2.9 GW
Turkey is the second top country in the world, in terms of net solar thermal heating capacity additions in 2012, with 1.1 GWth
Turkey is the fourth top country in the world, in terms of total solar thermal heating capacity as of end-2012, with 10.8 GWth
Turkey is the second top country in the world, in terms of total geothermal heat capacity per capita as of end-2013.
References
[1] REN21. 2014. Renewables 2014 Global Status Report (Paris: REN21 Secretariat), ISBN 978-3-9815934-2-6.
Bioenergy (Biomass, Biofuels, Biogas)
Geothermal
Hydropower (Small-scale)i
Solar Energy(Solar PV, CSP, Solar Heating/Cooling)
Wind Power
= 40,000 jobsWorld Total
6.5 Million Jobsi - Employment information for large-scale hydropower is incomplete and not inclulded.
GAP GREEN Supplementary for Issue 2014/1 13
3 Article
Strategy development on utilizing
solar energy technologies as drivers of growth for the GAP
Region of Turkey* M. Gursoya , T. Erogana, B. Açikgöza, P. Rodoplua, A.Savurana and M. Sirera
aUNDP, Birlik Mah. 415.Cad. No:11 06610 Cankaya, Ankara, Turkey
Abstract:
A regional growth strategy for the GAP Region based on utilization of appropriate solar energy technologies is developed and introduced here. It is defined as the integrated set of actions, in line with national plans and programs, which for a region creates a unique, defensible, and valuable competitive position in terms of the ability to generate better jobs and growing wealth for the region’s population. Main aim of the strategy is thus chosen as to improve the Region’s economic competitiveness through the development of a sustainable energy supply, mainly by solar energy. It is expected that framework of the strategy outlined here can be a useful tool for any other developing regions of the world.
* This work was presented in poster session of SolarTR-2 Solar Electricity Conference and Exhibition and rearranged for GAP
GREEN Magazine.
GAP GREEN Supplementary for Issue 2014/1 17
1. INTRODUCTION
Turkey is located geographically in a region called the “solar band,” which has the greatest utilization potential for solar energy. The GAP Region boasts the highest solar energy potential in the country with increased installed capacity as a result of technological improvements, economies of scale, and volume production. For the credibility of the Sustainable Growth Strategy for Southeastern Anatolia (GAP) Region of Turkey the use of solar energy is a must.
A regional growth strategy for the GAP Region based on utilization of appropriate solar energy technologies is thus developed and introduced here. The aim of the strategy is to improve the Region’s economic competitiveness through the development of a sustainable energy supply, mainly by solar energy. The framework for the strategy consists of five stages: diagnosing the region, defining options, finding strategic solution hypotheses, prescribing solutions, and creating implementation and evaluation strategies. The analysis of the strategy suggests nine areas that reinforce the impact of solar energy development on the Region’s economic competiveness:
1. Energy cost reductions will lead to lower overall costs in the Region and higher energy supply security. The Region especially industrial sector which needs to increase its competiveness in world markets, currently is burdened with high conventional energy costs.
2. The Region will achieve economic growth as a producer of solar energy (SE) technology products.
3. Domestic as well as foreign producers of these technologies will be attracted by the creation of early and ambitious demand within the Region for these solutions.
4. The Region will establish an REEE Research Center, which will improve education, innovate new technologies, draw investments, and help create partnerships, both with domestic and international firms and research centers.
5. The Region will create new jobs in green tech companies, supported by relevant training programs.
6. By using the irrigation capacity created by the investment in hydropower, very large tracts of de facto virgin land can become arable, and a new
sector in sustainable and organic agriculture can be developed.
7. Investments in SE will affect the supply chain towards higher value-added goods, such as the textile industry, where organic cotton becomes a starting point of a chain for the finishing of sustainable and organic textiles and garment products.
8. By moving from “the cradle of civilization” to a leader in “the birth of sustainable civilization,” the Region will be able to develop a differentiated and unique tourism industry.
9. In becoming the world’s first developing region that is carbon neutral on a net basis, the Region will be able to develop a brand that will lend a competitive advantage to all its industries and help generate both internal and external alignment around and recognition of the strategy.
The strategy is broadly defined here as the integrated set of actions, in line with national plans and programs, which for a region creates a unique, defensible, and valuable competitive position in terms of the ability to generate better jobs and growing wealth for the region’s population. The integrated nature of the strategy is critical to its success. Picking off individual elements might produce some minor gains, but will miss the true opportunity. It’s the convergence of all of the components – renewable energy supply, leaps in energy efficiencies, pursuit of sustainable strategies in key industries – that creates the great attraction and the key differentiation for the GAP Region. It is expected that framework of the strategy outlined here can be a useful tool for any other developing regions of the world.
2. TOOLS OF THE STRATEGY
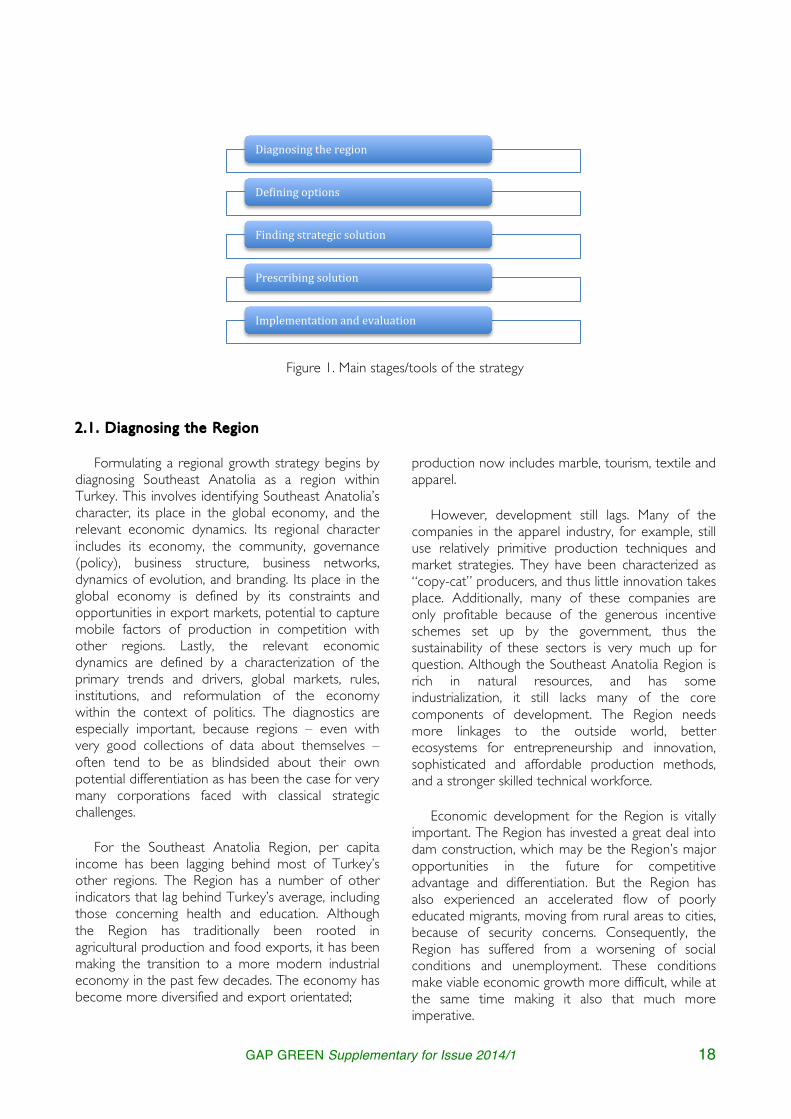
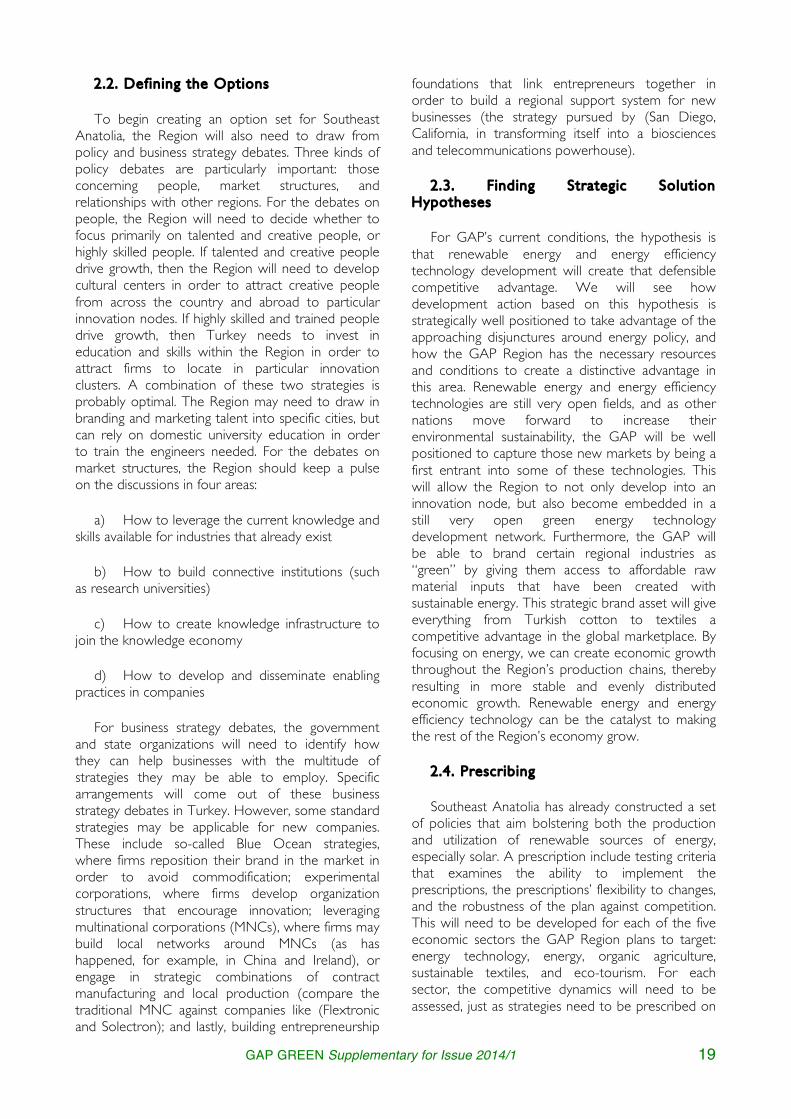
A framework and necessary tools for understanding the regional growth strategy have been developed to address current changes in the global economy and its dynamics. The framework, based on work at University of California Berkeley and Georgia Tech, is set up with five stages: diagnosing the region, defining options, finding strategic solution hypotheses, prescribing solutions, and creating implementation and evaluation strategies, as illustrated in Figure 1. These stages are described below in detail.
GAP GREEN Supplementary for Issue 2014/1 18
Figure 1. Main stages/tools of the strategy
2 .1 . Diagnosing the Region
Formulating a regional growth strategy begins by diagnosing Southeast Anatolia as a region within Turkey. This involves identifying Southeast Anatolia’s character, its place in the global economy, and the relevant economic dynamics. Its regional character includes its economy, the community, governance (policy), business structure, business networks, dynamics of evolution, and branding. Its place in the global economy is defined by its constraints and opportunities in export markets, potential to capture mobile factors of production in competition with other regions. Lastly, the relevant economic dynamics are defined by a characterization of the primary trends and drivers, global markets, rules, institutions, and reformulation of the economy within the context of politics. The diagnostics are especially important, because regions – even with very good collections of data about themselves – often tend to be as blindsided about their own potential differentiation as has been the case for very many corporations faced with classical strategic challenges.
For the Southeast Anatolia Region, per capita income has been lagging behind most of Turkey’s other regions. The Region has a number of other indicators that lag behind Turkey’s average, including those concerning health and education. Although the Region has traditionally been rooted in agricultural production and food exports, it has been making the transition to a more modern industrial economy in the past few decades. The economy has become more diversified and export orientated;
production now includes marble, tourism, textile and apparel.
However, development still lags. Many of the companies in the apparel industry, for example, still use relatively primitive production techniques and market strategies. They have been characterized as “copy-cat” producers, and thus little innovation takes place. Additionally, many of these companies are only profitable because of the generous incentive schemes set up by the government, thus the sustainability of these sectors is very much up for question. Although the Southeast Anatolia Region is rich in natural resources, and has some industrialization, it still lacks many of the core components of development. The Region needs more linkages to the outside world, better ecosystems for entrepreneurship and innovation, sophisticated and affordable production methods, and a stronger skilled technical workforce.
Economic development for the Region is vitally important. The Region has invested a great deal into dam construction, which may be the Region’s major opportunities in the future for competitive advantage and differentiation. But the Region has also experienced an accelerated flow of poorly educated migrants, moving from rural areas to cities, because of security concerns. Consequently, the Region has suffered from a worsening of social conditions and unemployment. These conditions make viable economic growth more difficult, while at the same time making it also that much more imperative.
Diagnosing(the(region(
De-ining(options(
Finding(strategic(solution(
Prescribing(solution(
Implementation(and(evaluation(
GAP GREEN Supplementary for Issue 2014/1 19
2.2 . Def in ing the Options
To begin creating an option set for Southeast Anatolia, the Region will also need to draw from policy and business strategy debates. Three kinds of policy debates are particularly important: those concerning people, market structures, and relationships with other regions. For the debates on people, the Region will need to decide whether to focus primarily on talented and creative people, or highly skilled people. If talented and creative people drive growth, then the Region will need to develop cultural centers in order to attract creative people from across the country and abroad to particular innovation nodes. If highly skilled and trained people drive growth, then Turkey needs to invest in education and skills within the Region in order to attract firms to locate in particular innovation clusters. A combination of these two strategies is probably optimal. The Region may need to draw in branding and marketing talent into specific cities, but can rely on domestic university education in order to train the engineers needed. For the debates on market structures, the Region should keep a pulse on the discussions in four areas:
a) How to leverage the current knowledge and skills available for industries that already exist
b) How to build connective institutions (such as research universities)
c) How to create knowledge infrastructure to join the knowledge economy
d) How to develop and disseminate enabling practices in companies
For business strategy debates, the government and state organizations will need to identify how they can help businesses with the multitude of strategies they may be able to employ. Specific arrangements will come out of these business strategy debates in Turkey. However, some standard strategies may be applicable for new companies. These include so-called Blue Ocean strategies, where firms reposition their brand in the market in order to avoid commodification; experimental corporations, where firms develop organization structures that encourage innovation; leveraging multinational corporations (MNCs), where firms may build local networks around MNCs (as has happened, for example, in China and Ireland), or engage in strategic combinations of contract manufacturing and local production (compare the traditional MNC against companies like (Flextronic and Solectron); and lastly, building entrepreneurship
foundations that link entrepreneurs together in order to build a regional support system for new businesses (the strategy pursued by (San Diego, California, in transforming itself into a biosciences and telecommunications powerhouse).
2 .3 . F inding Strateg ic Solut ion Hypotheses
For GAP’s current conditions, the hypothesis is that renewable energy and energy efficiency technology development will create that defensible competitive advantage. We will see how development action based on this hypothesis is strategically well positioned to take advantage of the approaching disjunctures around energy policy, and how the GAP Region has the necessary resources and conditions to create a distinctive advantage in this area. Renewable energy and energy efficiency technologies are still very open fields, and as other nations move forward to increase their environmental sustainability, the GAP will be well positioned to capture those new markets by being a first entrant into some of these technologies. This will allow the Region to not only develop into an innovation node, but also become embedded in a still very open green energy technology development network. Furthermore, the GAP will be able to brand certain regional industries as “green” by giving them access to affordable raw material inputs that have been created with sustainable energy. This strategic brand asset will give everything from Turkish cotton to textiles a competitive advantage in the global marketplace. By focusing on energy, we can create economic growth throughout the Region’s production chains, thereby resulting in more stable and evenly distributed economic growth. Renewable energy and energy efficiency technology can be the catalyst to making the rest of the Region’s economy grow.
2 .4 . Prescr ib ing
Southeast Anatolia has already constructed a set of policies that aim bolstering both the production and utilization of renewable sources of energy, especially solar. A prescription include testing criteria that examines the ability to implement the prescriptions, the prescriptions’ flexibility to changes, and the robustness of the plan against competition. This will need to be developed for each of the five economic sectors the GAP Region plans to target: energy technology, energy, organic agriculture, sustainable textiles, and eco-tourism. For each sector, the competitive dynamics will need to be assessed, just as strategies need to be prescribed on
GAP GREEN Supplementary for Issue 2014/1 20
how to make each competitive in what markets and market segments.
2 .5 . Implementat ion and Evaluat ion Strategy
Implementation will require changing region and firm behavior. This requires three steps. First is devising tactics for marketing and communication, operations, and finances. Marketing and communication tactics create role models that interested parties can shoot for, develop communication plans, and incorporate “sunset” time clauses. Operational tactics remove significant obstacles to implementation, and financial tactics incentivize change. Second, the implementation strategy will need to deploy and communicate these sets of actions to regional institutions and firms, and use multiple intermediaries. Finally, there will need to be ongoing evaluation and assessment, as well as a recalibration of the strategies, which can be done through the framework this section has outlined.
Every implementation strategy must recognize government constraints. There are packages of things governments can do, but the government must largely work through others in order to achieve its objectives. Each action plan will need to identify those needed partners, as well as identify what new institutional capacities are needed for the action. The current Southeastern Anatolia Project Action Plan accomplishes this by identifying areas for capacity building in peripheral organizations, local administration and regional organizations, as well as the GAP Regional Development Administration. These new institutional capacities should encourage an interactive process of strategic cooperation between public and private actors. The goal of these
interactions should be to elicit information on business opportunities and constraints, as well as generate policy initiatives in response.
3. DIAGNOSING AND PRESCRIBING SOLAR ENERGY SOLUTIONS FOR THE REGION
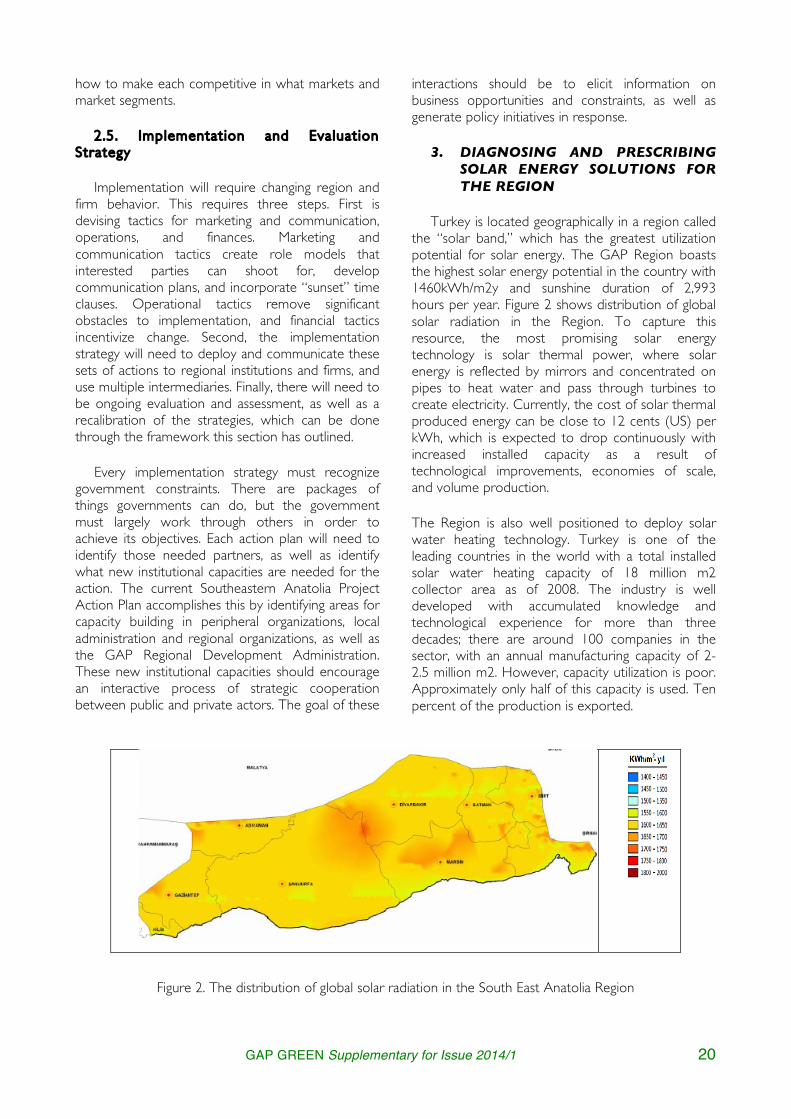
Turkey is located geographically in a region called the “solar band,” which has the greatest utilization potential for solar energy. The GAP Region boasts the highest solar energy potential in the country with 1460kWh/m2y and sunshine duration of 2,993 hours per year. Figure 2 shows distribution of global solar radiation in the Region. To capture this resource, the most promising solar energy technology is solar thermal power, where solar energy is reflected by mirrors and concentrated on pipes to heat water and pass through turbines to create electricity. Currently, the cost of solar thermal produced energy can be close to 12 cents (US) per kWh, which is expected to drop continuously with increased installed capacity as a result of technological improvements, economies of scale, and volume production.
The Region is also well positioned to deploy solar water heating technology. Turkey is one of the leading countries in the world with a total installed solar water heating capacity of 18 million m2 collector area as of 2008. The industry is well developed with accumulated knowledge and technological experience for more than three decades; there are around 100 companies in the sector, with an annual manufacturing capacity of 2-2.5 million m2. However, capacity utilization is poor. Approximately only half of this capacity is used. Ten percent of the production is exported.
Figure 2. The distribution of global solar radiation in the South East Anatolia Region

GAP GREEN Supplementary for Issue 2014/1 21
3.1 . Choice of Solut ions and Technologies
There are many solar technologies in the market that need to be considered for the GAP Region. The intended application is an important factor when selecting one of these technologies because they are intended for different scales. The Region has a high solar energy potential, especially in the provinces of Şanliurfa and Gaziantep, where the insolation incident is highest, and technologies where direct solar irradiance is necessary can be developed. On the other hand, other solar technology does not need as much direct solar irradiance, opening the possibility for the rest of the Region to take advantage of solar power. Turkey and the Region are also rich in manufacturing industries that apply processes similar to the construction of thin films and dye-sensitized solar cells, making this technology suitable for local production, and is the ideal technology for solar irrigation pumps and other small-scale activities.
a) Solar Thermal Technology
From the different solar technologies in the market, solar thermal provides one of the lower electricity costs for the Region (10-12.6 cents/kWh). Most of its major components are built with low-tech manufacturing techniques. It is ideal for low heat applications such as solar hot water heating, thermal cooling, and solar cooking. One drawback is the few technologies available to provide distributed thermal electric generation. Additionally, scales less than 5kW are not developed yet, so is not suited for low load demands yet. Low range technologies could be a prospective pilot project for the Region.
Three different solar thermal technologies can be considered. The first, parabolic trough technology, is suitable for large installations. Costs can be reduced by keeping design simple. Large flat areas are necessary for installation. The second, solar power towers, achieve higher efficiencies by achieving much higher temperatures. The ground where they are being installed does not have to be as flat as for parabolic trough technology. The other solar thermal technology is the parabolic dish design. Systems of all sizes can be achieved with this design, as well as distributed generation. But the installation requires a robust steel frame. Potential regions should be analyzed for foggy and hazy weather, for this may decrease its efficiency.
b) Crysta l l ine S i l icon
Crystalline silicon is the most widely developed solar technology at the present, dominating around 93%
of the market. It can be installed along the whole spectrum of capacities, from stand-alone systems to MW power plants connected to grid. Each panel can be designed for different capacities from 43W to 315W. It is highly reliable with 20 to 25 years of warranty. The highest commercially available efficiencies are about 15% and are likely to further improve in the next few years. Unfortunately, its material and processing cost is high due to the purification and growth process to achieve the cells. It is estimated that for a 1MW plant, a $1 million investment is required. The current price in the market is $4.24/Wp. There is a lack of local support from industries in the GAP Region, and since crystalline silicon is a mature technology, there are limited opportunities for significant innovations.
c) Thin F i lm Technologies
These are among the cheapest solar technologies with a current price of approximately $2.98/Wp, and estimates that the cost will over time go well below $1/Wp. They are suitable for smaller applications, and provide excellent performance under low light. Its manufacturing is based on roll-to-roll printing process, from which the GAP Region can benefit for its knowledge in this type of process. The type of thin film cells that can be produced is dependent on the material used. Thin amorphous silicon can be manufactured with screen-printing, but cell built that way tend to degrade with time losing 15-35% of their efficiency for long solar exposure. When copper indium gallium diselenide is used, efficiencies of 19% are possible, and these thin film cells have potential for low cost manufacturing, but since indium is a rare element, it limits its scale in the marketplace. They degrade at a lower rate than amorphous silicon. The last option is using cadmium telluride, but tellurium is a scarce and toxic element.
d) Dye-Sens it ized Solar Cel ls (DSC)
Dye-sensitized solar cells (DSC) is a relatively new thin film solar cell technology that uses TiO2 nano-particles, which is cheap and non-toxic. It provides a simple manufacturing process and the materials used are low-cost and readily-available. Prices are predicted to be as low as $0.6/Wp. Efficiency is low right now (5-8%), but is expected to increase to 15% in the next couple of years. Even with today’s low efficiency, the price-performance ratio (kWh/m2·annum·dollar) could be high enough to let them be a competitive option in the market. Contrary to solar thermal technology, DSC is optimal for small-scale distributed applications. Its manufacturing is suitable to be developed in the Region for its simple roll-to-roll process that involves

GAP GREEN Supplementary for Issue 2014/1 22
relatively simple printing and coating techniques. An important advantage over other PV technologies is that its efficiency dependence on temperature, which makes them suitable for hot regions (such as deserts).
e) Concentrated Photovolta ics (CPV)
Two options can be considered with this technology. The first, high concentration PV, focuses as much light as possible on the highest efficiency cells presently produced (multi-junction cells with tracker), making them the most cost effective technology for medium- and large-range applications. Efficiencies of up to 40% can be achieved. The second, low concentration PV, is similar but simpler and even less costly. There are, however, fewer companies that produce them. It is estimated that the levelized cost of energy will decrease from 14 to 4 cents/kWh by 2025 in constant 2005 dollars. CPV can be used for medium- to large-scale energy production. It is also easy to upgrade to improve the power output since it can be done while keeping the optics and trackers. For the nature of the technology and materials used, they can only capture direct normal radiance (DNR), but that is not a problem for the GAP Region since most of the sunlight is direct. Current cost of CPV is high, but it is expected to drop to a third of its present value. Production is capital- and material-intensive, so cells should probably be imported from high-tech companies abroad (such as Germany, Spain, US), but this will not be an obstacle if the optics and trackers can be built and installed locally.
3 .2 . R isk and Opportunit ies in Solar Energy Investments
Upfront costs for solar energy technologies are still high, which means that solar technology needs to have significant incentives. Although warranty periods for solar technology are long, without promising incentives solar technology will not be cost-effective for potential investors. Technologies such as DSC are new in the market, and much research and many improvements are needed to lower their cost. Delay and slow progress of research and technology innovations could keep energy production costs high.
On the other hand; many international financial institutions support renewable projects in Turkey. Some of the international institutions that could support the Region include the German
Development Bank (KfW Bankengruppe), the World Bank (as well as its International Bank for Restructuring and Development), Council of Europe Development Bank (CEBD), Agence Française de Développment (AFD), Japan Bank for International Cooperation (JBIC) and the International Finance Corporation (IFC). European energy companies dominate the renewable energy market in the EU, and they have expanded their strategies to include Turkey in their portfolio. The Region has the most reliable solar resource in the country, making it easy to demonstrate the benefits of expanding their strategy to the Region. Major companies include Statkraft, RWE, and EDF. CEZ Group has already entered the Turkish energy sector and holds a significant stake in Sakarya Electricity Regional Distribution Company. It could invest in the Region for the growing solar energy supply and demand, making possible the development of solar power plants in the Region where there is no current grid infrastructure availability.
3 .3 . Domest ic and Export Market Scenar ios
Local manufacturing processes use similar techniques as those used for some solar technology manufacturing. This will ease the manpower training needed and lower manufacturing facilities and machinery investments. The market will also benefit employment in the Region, since according to MENR, each 1MW of solar power generation requires the employment of 33 workers during construction and 10 workers during operation.
Local construction of solar technology inside Southeast Anatolia Region would enable exports both out of the country, and to other regions and provinces of Turkey. The Aegean Region and Mediterranean Coast Region receive reliable and promising solar radiation to develop solar technology. Most of the surrounding countries of Turkey also share advantages with solar radiation. They can all benefit from solar technology being constructed in the GAP Region, since export and transportation will be more cost-effective than from more distant suppliers.
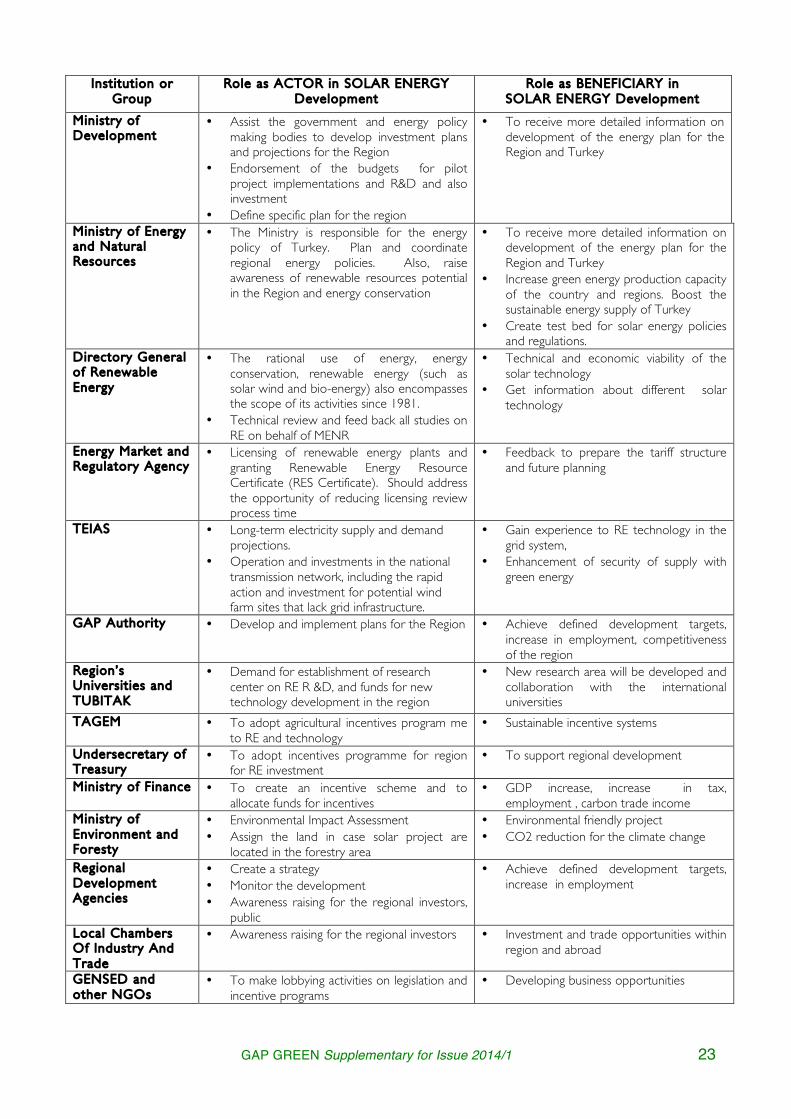
3 .4 . Nat ional Stakeholders as Both Actors and Benef ic iar ies
Governmental and local agencies are described in Table 1, for the purpose of developing incentives, regulations, and relations with potential investors.
TABLE 1. National Stakeholders and their potential roles
GAP GREEN Supplementary for Issue 2014/1 23
Inst i tut ion or Group
Role as ACTOR in SOLAR ENERGY Development
Role as BENEFICIARY in SOLAR ENERGY Development
Min istry of Development
• Assist the government and energy policy making bodies to develop investment plans and projections for the Region
• Endorsement of the budgets for pilot project implementations and R&D and also investment
• Define specific plan for the region
• To receive more detailed information on development of the energy plan for the Region and Turkey
Ministry of Energy and Natura l Resources
• The Ministry is responsible for the energy policy of Turkey. Plan and coordinate regional energy policies. Also, raise awareness of renewable resources potential in the Region and energy conservation
• To receive more detailed information on development of the energy plan for the Region and Turkey
• Increase green energy production capacity of the country and regions. Boost the sustainable energy supply of Turkey
• Create test bed for solar energy policies and regulations.
Directory Genera l of Renewable Energy
• The rational use of energy, energy conservation, renewable energy (such as solar wind and bio-energy) also encompasses the scope of its activities since 1981.
• Technical review and feed back all studies on RE on behalf of MENR
• Technical and economic viability of the solar technology
• Get information about different solar technology
Energy Market and Regulatory Agency
• Licensing of renewable energy plants and granting Renewable Energy Resource Certificate (RES Certificate). Should address the opportunity of reducing licensing review process time
• Feedback to prepare the tariff structure and future planning
TEIAS • Long-term electricity supply and demand projections.
• Operation and investments in the national transmission network, including the rapid action and investment for potential wind farm sites that lack grid infrastructure.
• Gain experience to RE technology in the grid system,
• Enhancement of security of supply with green energy
GAP Authority • Develop and implement plans for the Region • Achieve defined development targets, increase in employment, competitiveness of the region
Region’s Univers i t ies and TUBITAK
• Demand for establishment of research center on RE R &D, and funds for new technology development in the region
• New research area will be developed and collaboration with the international universities
TAGEM
• To adopt agricultural incentives program me to RE and technology
• Sustainable incentive systems
Undersecretary of Treasury
• To adopt incentives programme for region for RE investment
• To support regional development
Min istry of F inance • To create an incentive scheme and to allocate funds for incentives
• GDP increase, increase in tax, employment , carbon trade income
Ministry of Environment and Foresty
• Environmental Impact Assessment • Assign the land in case solar project are
located in the forestry area
• Environmental friendly project • CO2 reduction for the climate change
Regional Development Agencies
• Create a strategy • Monitor the development • Awareness raising for the regional investors,
public
• Achieve defined development targets, increase in employment
Local Chambers Of Industry And Trade
• Awareness raising for the regional investors • Investment and trade opportunities within region and abroad
GENSED and other NGOs
• To make lobbying activities on legislation and incentive programs
• Developing business opportunities
GAP GREEN Supplementary for Issue 2014/1 24
4. CONCLUSIONS
The regional growth strategy taking advantage of the outstanding solar resources of the Region is introduced here. It is the integrated set of actions that create a competitive position and can generate sufficient growth to help bridge the gap in wealth between the Region and the rest of Turkey. It is however vital to note that the key components of the strategy will require additional enabling actions. These will include educational and research initiatives; infrastructure; destination development; coordination between different government agencies and programs; flexibility in planning; proactive regulation; seed funding and much more.
Acknowledgements
Financial and administrative supports provided by the Ministry of Development and GAP-RDA are highly appreciated.
References
[1] Southeastern Anatolia Project Action Plan (2008-2012), May 2008.
[2] GAP Entrepreneur Support Centers Project. “Competitiveness Agenda for the GAP Region.” October 2007.
[3] Undersecretariat of State Planning Organization. Medium Term Programme (2010 – 2012). Official Gazette No. 27351. 16 September 2009.
[4] Project of Utilization of Renewable Energy Resources and Increasing Energy Efficiency in Southeast Anatolia Region (Phase 1): Inception Report, GAP-RDA & UNDP Publication, 2009.
[5] Project of Utilization of Renewable Energy Resources and Increasing Energy Efficiency in Southeast Anatolia Region (Phase 1): Strategy Blue-Print Report, GAP-RDA & UNDP Publication, 2010.
[6] Technology Roadmaps, Solar photovoltaic energy, IEA Report, 2010.
[7] Photovoltaic Barometer, Eurobserv’er, 2010.
[8] Ditlev Engel and Daniel M. Kammen, “Green Jobs and the Clean Energy Economy”, Copenhagen Climate Council, 2009.
……………………………………
Related Documents


