a GAO United States Government Accountability Office Report to Congressional Requesters September 2005 MILITARY PERSONNEL Reporting Additional Servicemember Demographics Could Enhance Congressional Oversight GAO-05-952

Welcome message from author
This document is posted to help you gain knowledge. Please leave a comment to let me know what you think about it! Share it to your friends and learn new things together.
Transcript

GAOUnited States Government Accountability Office
Report to Congressional Requesters
September 2005 MILITARY PERSONNEL
Reporting Additional Servicemember Demographics Could Enhance Congressional Oversight
a
GAO-05-952
What GAO Found
United States Government Accountability Office
Why GAO Did This Study
HighlightsAccountability Integrity Reliability
www.gao.gov/cgi-bin/getrpt?GAO-05-952. To view the full product, including the scope and methodology, click on the link above. For more information, contact Derek B. Stewart at (202) 512-5559 or [email protected].
Highlights of GAO-05-952, a report to Congress Requesters
September 2005
MILITARY PERSONNEL
Reporting Additional Servicemember Demographics Could Enhance Congressional Oversight
Since the institution of the All Volunteer Force in 1973, the military has become older and better educated, with increasing representation of racial and ethnic minorities, females, spouses, and parents. Today’s force also differs from the U.S. civilian workforce in a number of important ways. For example, the military is younger than the civilian workforce. From a racial diversity perspective, the military, as of December 2004, had proportionately fewer Whites, partly because the military has proportionately more African Americans. Although Hispanic representation in the Active Component has markedly increased from 5 percent in 1993 to 9 percent in 2004, it is below the 11 percent for the U.S. civilian workforce. The representation of women in the military, at 16 percent, is below that of women in the U.S. workforce, at 48 percent, partly because of military policy and federal statutes. Although the 1997 government-wide requirements for the collection and reporting of information on race and ethnicity were to have been implemented by January 1, 2003, DOD has not yet fully implemented the requirements and its internal monthly reports continue to use some of the former racial/ethnic categories. This situation makes it difficult for Congress to monitor and directly compare the military and U.S. civilian racial and ethnic compositions. Over the past decade, the Active Component met its overall recruiting goals more frequently than has the Reserve Component. GAO found that a combination of personal, demographic, family, and societal factors, as well as the availability of economic and educational incentives, influence youths’ decision to join or not to join the military. DOD reports that over half of today’s youth are not qualified to serve because they cannot meet the military’s entry standards for health, education, aptitude, or other requirements. DOD has not collected information on a recruit’s socioeconomic status since 1999. Recent DOD research using recruits’ zip codes as a proxy to indicate socioeconomic status and community population density found that the median income of recruits’ communities is similar to that of other youth and that the majority of recruits come from rural and suburban areas. Without ongoing research on recruits’ socioeconomic status and communities, DOD will not be able to promptly and accurately inform Congress and the public about how representation in the services matches that of the applicable U.S. population. In fiscal years 2000, 2002, and 2004, AC enlisted personnel had lower retention rates than officers and there were no consistent differences between the rates of racial/ethnic subgroups. While DOD prepares retention rates, it does not publish active duty retention rates which could be used by Congress in its oversight of military retention and related issues. As of May 28, 2005, 1,841 servicemembers had died and 12,658 had been wounded in support of Operations Iraqi Freedom or Enduring Freedom. Most of those who died or were wounded were Active Component Army or Marine Corps junior enlisted personnel. Among those who died, 71 percent were White, 10 percent were Hispanic, and 9 percent were African American.
The high pace of military operations, thousands of casualties in ongoing military operations, and the services’ recruiting challenges have raised questions about who is serving in today’s military and concern that certain subgroups of the U.S. population may be disproportionately represented among those fighting and dying in support of the war on terrorism. These challenges and concerns have increased the need for information on the demographic characteristics of military personnel.
GAO was asked to address three questions: (1) What are the demographic characteristics of servicemembers and how do they compare to the comparable U.S. civilian workforce? (2) How well are the services meeting their overall recruitment goals, and what influences whether or not individuals join the military? (3) What are the demographic characteristics of servicemembers who remained in the military in fiscal years 2000, 2002, and 2004? GAO was also asked to examine the demographic characteristics of servicemembers who died or were wounded in combat in Operations Iraqi Freedom and Enduring Freedom.
What GAO Recommends
GAO recommends four actions to enhance Congress’ ability to monitor demographic changes in the military.

Contents
Letter 1Results in Brief 3
Background 7The Charge and the Debate of the All Volunteer Force 7DOD Publications and Databases for Force Demographics 8Changing Demographics 9
Demographic Characteristics of Servicemembers
11Question 1 and Summary of Approach 11Summary of Findings 11Findings 14
Recruiting 54Question 2 and Summary of Approach 54Summary of Findings 54Findings 56
Retention 100Question 3 and Summary of Approach 100Summary of Findings 100Findings 102
Casualties 114Additional Question and Summary of Approach 114Summary of Findings 114Findings 116
Conclusions 130
Recommendations for Executive Action
132
Agency Comments and Our Evaluation
133
Page i GAO-05-952 Military Demographics
Contents
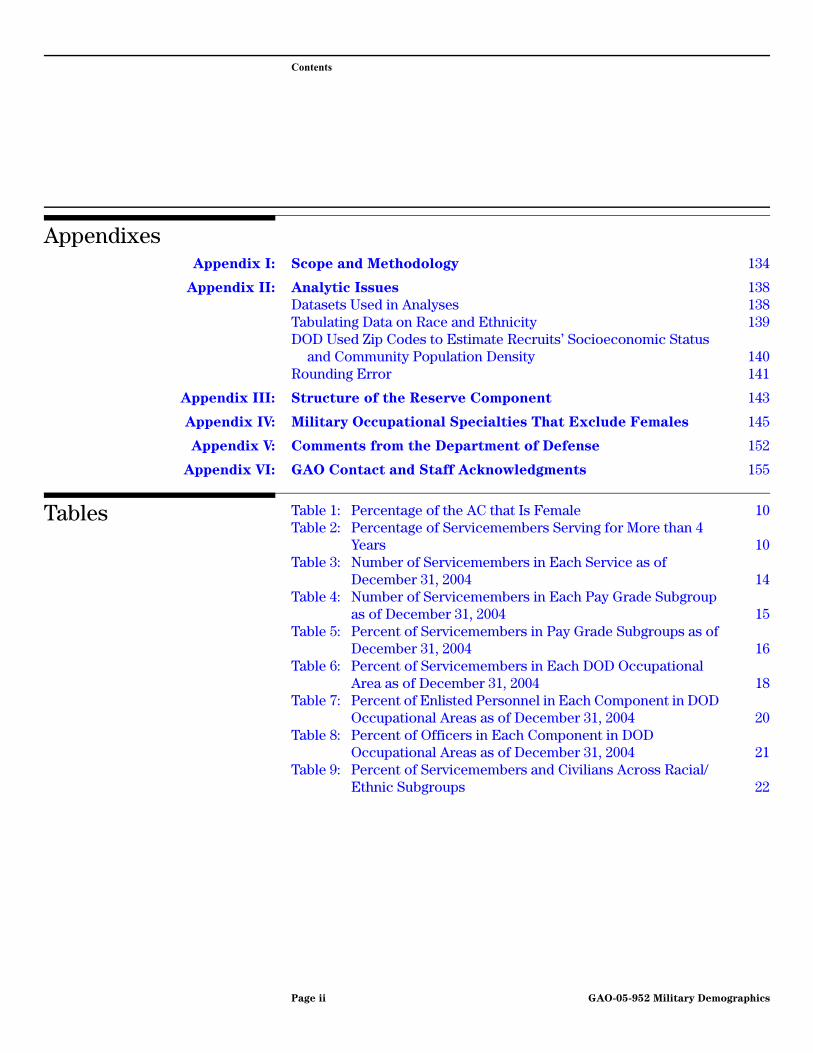
AppendixesAppendix I: Scope and Methodology 134
Appendix II: Analytic Issues 138Datasets Used in Analyses 138Tabulating Data on Race and Ethnicity 139DOD Used Zip Codes to Estimate Recruits’ Socioeconomic Status
and Community Population Density 140Rounding Error 141
Appendix III: Structure of the Reserve Component 143
Appendix IV: Military Occupational Specialties That Exclude Females 145
Appendix V: Comments from the Department of Defense 152
Appendix VI: GAO Contact and Staff Acknowledgments 155
Tables Table 1: Percentage of the AC that Is Female 10Table 2: Percentage of Servicemembers Serving for More than 4
Years 10Table 3: Number of Servicemembers in Each Service as of
December 31, 2004 14Table 4: Number of Servicemembers in Each Pay Grade Subgroup
as of December 31, 2004 15Table 5: Percent of Servicemembers in Pay Grade Subgroups as of
December 31, 2004 16Table 6: Percent of Servicemembers in Each DOD Occupational
Area as of December 31, 2004 18Table 7: Percent of Enlisted Personnel in Each Component in DOD
Occupational Areas as of December 31, 2004 20Table 8: Percent of Officers in Each Component in DOD
Occupational Areas as of December 31, 2004 21Table 9: Percent of Servicemembers and Civilians Across Racial/
Ethnic Subgroups 22
Page ii GAO-05-952 Military Demographics

Contents
Table 10: Percent of Enlisted Personnel and Civilians with a High School Diploma or Equivalent or Some College in the Racial/Ethnic Subgroups 28
Table 11: Percent of Officers and Civilian College Graduates in the Racial/Ethnic Subgroups 30
Table 12: Percent of AC Enlisted Personnel in Each Racial/Ethnic Subgroup and DOD Occupational Area as of December 31, 2004 32
Table 13: Percent of AC Officers in Each Racial/Ethnic Subgroup and DOD Occupational Area as of December 31, 2004 34
Table 14: Percent of RC Enlisted Personnel in Each Racial/Ethnic Subgroup and DOD Occupational Area as of December 31, 2004 36
Table 15: Percent of RC Officers in Each Racial/Ethnic Subgroup and DOD Occupational Area as of December 31, 2004 37
Table 16: Percent of Servicemembers and Civilian Workers in Each Racial/Ethnic and Gender Subgroup 40
Table 17: Distribution of Race/Ethnicity Among Female Servicemembers and Civilians 42
Table 18: Representation of AC Females across and within Enlisted Occupational Areas as of December 31, 2004 44
Table 19: Representation of AC Females across and within Officer Occupational Areas as of December 31, 2004 44
Table 20: Representation of RC Females across and within Enlisted Occupational Areas as of December 31, 2004 46
Table 21: Representation of RC Females across and within Officer Occupational Areas as of December 31, 2004 47
Table 22: Percentage of Servicemembers and Employed Civilians in Educational Categories 50
Table 23: DOD and Service-Specific Educational Standards 70Table 24: Aptitude Standards and Required and Actual Percentages
of Nonprior-service Recruits at or Above the 50th Percentile in Fiscal Year 2004 72
Table 25: Percent of Nonprior-service Accessions Scoring in AFQT Categories I-IIIA during Selected Years 73
Table 26: Examples of DOD Medical Standards which May Have Disqualified Potential Recruits in Fiscal Year 2004 74
Page iii GAO-05-952 Military Demographics
Contents
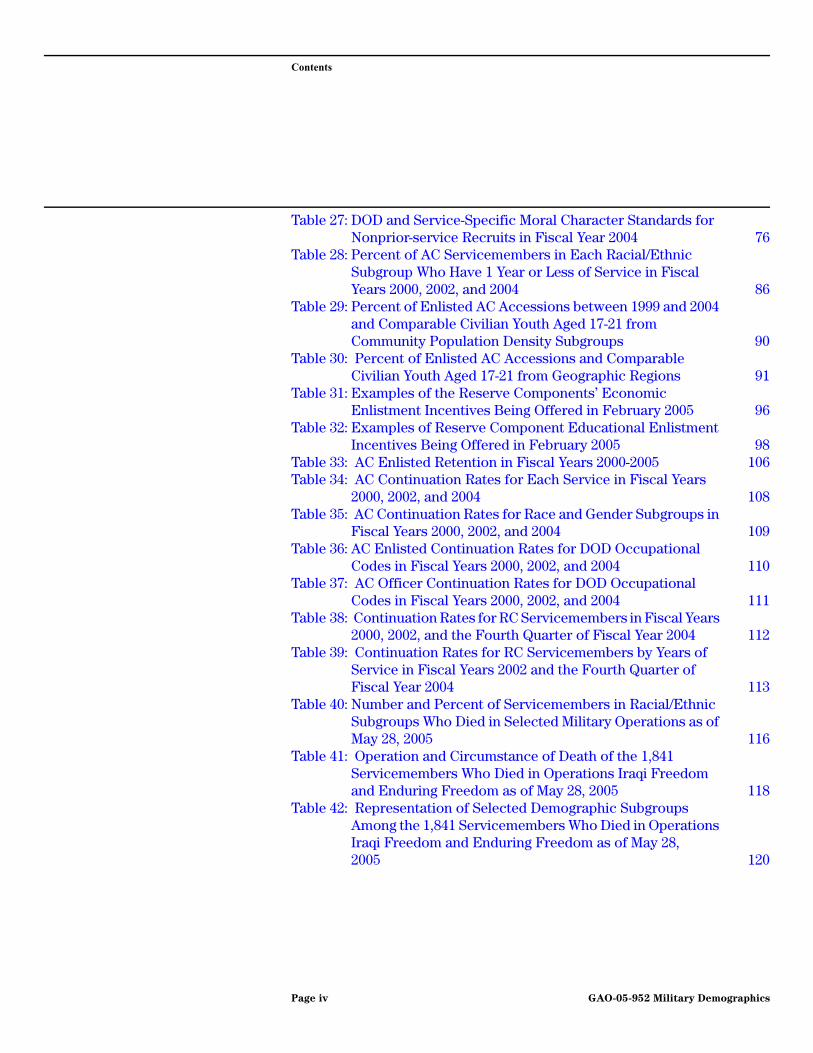
Table 27: DOD and Service-Specific Moral Character Standards for Nonprior-service Recruits in Fiscal Year 2004 76
Table 28: Percent of AC Servicemembers in Each Racial/Ethnic Subgroup Who Have 1 Year or Less of Service in Fiscal Years 2000, 2002, and 2004 86
Table 29: Percent of Enlisted AC Accessions between 1999 and 2004 and Comparable Civilian Youth Aged 17-21 from Community Population Density Subgroups 90
Table 30: Percent of Enlisted AC Accessions and Comparable Civilian Youth Aged 17-21 from Geographic Regions 91
Table 31: Examples of the Reserve Components’ Economic Enlistment Incentives Being Offered in February 2005 96
Table 32: Examples of Reserve Component Educational Enlistment Incentives Being Offered in February 2005 98
Table 33: AC Enlisted Retention in Fiscal Years 2000-2005 106Table 34: AC Continuation Rates for Each Service in Fiscal Years
2000, 2002, and 2004 108Table 35: AC Continuation Rates for Race and Gender Subgroups in
Fiscal Years 2000, 2002, and 2004 109Table 36: AC Enlisted Continuation Rates for DOD Occupational
Codes in Fiscal Years 2000, 2002, and 2004 110Table 37: AC Officer Continuation Rates for DOD Occupational
Codes in Fiscal Years 2000, 2002, and 2004 111Table 38: Continuation Rates for RC Servicemembers in Fiscal Years
2000, 2002, and the Fourth Quarter of Fiscal Year 2004 112Table 39: Continuation Rates for RC Servicemembers by Years of
Service in Fiscal Years 2002 and the Fourth Quarter of Fiscal Year 2004 113
Table 40: Number and Percent of Servicemembers in Racial/Ethnic Subgroups Who Died in Selected Military Operations as of May 28, 2005 116
Table 41: Operation and Circumstance of Death of the 1,841 Servicemembers Who Died in Operations Iraqi Freedom and Enduring Freedom as of May 28, 2005 118
Table 42: Representation of Selected Demographic Subgroups Among the 1,841 Servicemembers Who Died in Operations Iraqi Freedom and Enduring Freedom as of May 28, 2005 120
Page iv GAO-05-952 Military Demographics

Contents
Table 43: Community Population Density and Estimated Socioeconomic Status of the 482 Reservists Who Died in Operations Iraqi Freedom and Enduring Freedom as of May 28, 2005 122
Table 44: Operation for the 12,658 Servicemembers Who Were Wounded in Operations Iraqi Freedom and Enduring Freedom as of May 28, 2005 124
Table 45: Representation of Selected Demographic Subgroups Among the 12,658 Servicemembers Who Were Wounded in Operations Iraqi Freedom and Enduring Freedom as of May 28, 2005 126
Table 46: Community Population Density and Estimated Socioeconomic Status of the 3,197 Reservists Who Were Wounded in Operations Iraqi Freedom and Enduring Freedom as of May 28, 2005 128
Table 47: Military Occupational Specialties That Exclude Females as of March 1997 145
Figures Figure 1: Military Racial and Ethnic Representation 24Figure 2: Percent of Males and Females in Each Component and
among Employed Civilians 38Figure 3: Percentage of the AC, RC, and U.S. Population in Age
Categories 48Figure 4: Percent of Servicemembers and Civilians in Three
Citizenship Subgroups in 2004 52Figure 5: AC and RC Achievement of Enlisted Recruiting Goals for
Fiscal Years 1995 through 2004 64Figure 6: DOD Components’ Achievement of Enlisted Recruiting
Goals for October 1, 2004, through June 30, 2005 66Figure 7: Four General Types of Factors that Influence Youths’
Decisions About Joining 78Figure 8: Economic and Educational Incentives 92
Page v GAO-05-952 Military Demographics
Contents
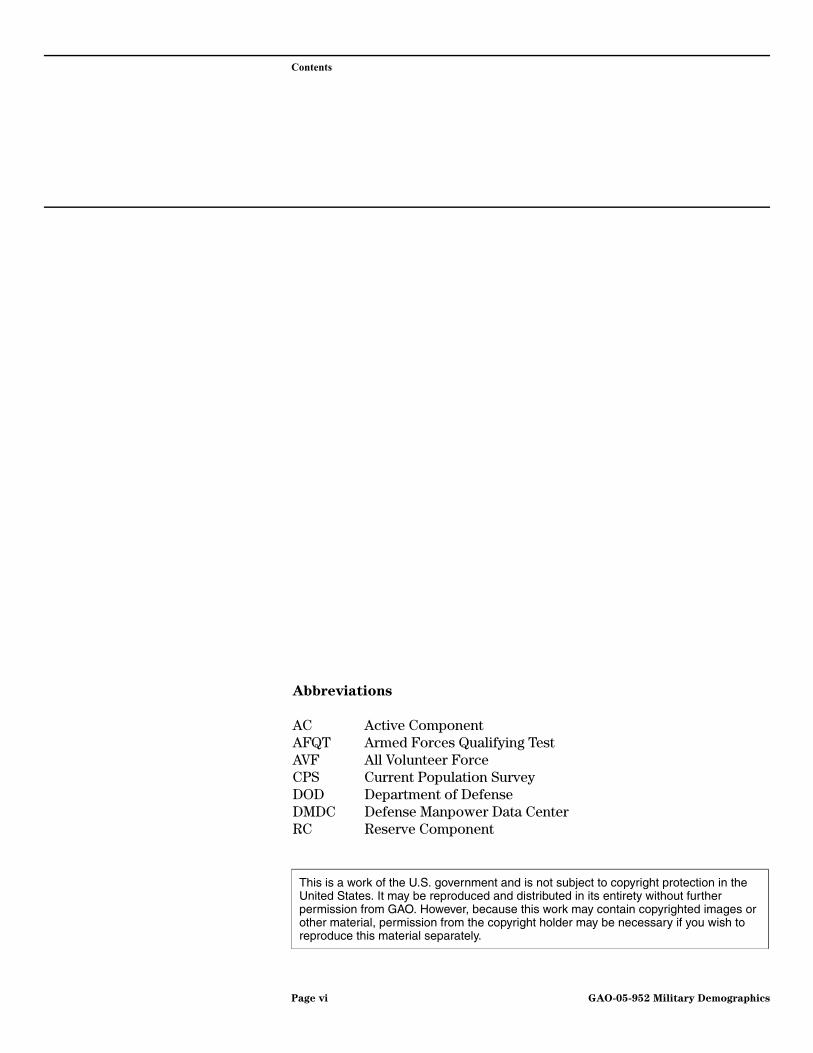
Abbreviations
AC Active ComponentAFQT Armed Forces Qualifying TestAVF All Volunteer ForceCPS Current Population SurveyDOD Department of DefenseDMDC Defense Manpower Data CenterRC Reserve Component
This is a work of the U.S. government and is not subject to copyright protection in the United States. It may be reproduced and distributed in its entirety without further permission from GAO. However, because this work may contain copyrighted images or other material, permission from the copyright holder may be necessary if you wish to reproduce this material separately.
Page vi GAO-05-952 Military Demographics
United States Government Accountability Office
Washington, D.C. 20548
A
September 22, 2005 Letter
The Honorable Ike SkeltonRanking Minority MemberCommittee on Armed ServicesHouse of Representatives
The Honorable Charles RangelHouse of Representatives
Since the advent of the All Volunteer Force (AVF) in 1973, the active duty force has undergone several demographic changes. Our previous examination of the demographic composition of the AVF showed that between 1974 and 2000, the force became older and better educated. The AVF also experienced increases in the proportions of servicemembers who were racial/ethnic minorities, females, married, or parents.1
A number of significant events have occurred within the last 4 years, namely, the September 11, 2001, terrorist attacks and the ensuing Operations Enduring Freedom, Noble Eagle, and Iraqi Freedom. These military commitments increased the pace of operations for U.S. forces, particularly in the Army and Marine Corps. To ensure that the military has sufficient personnel to meet U.S. global commitments, Congress in October 2004 authorized increases in personnel for the Army and Marine Corps.2
Ensuring the availability of sufficient numbers of trained, high-quality personnel in an environment of increased deployment and armed conflict has proven to be one of the greatest personnel challenges faced by the U.S. military since the inception of the AVF. The active Army, the Army Reserve, and the Army National Guard, for example, missed their early fiscal year 2005 recruiting goals. We are currently looking at the military services’ efforts to enhance recruitment and retention of enlisted personnel.
1GAO, Military Personnel: Active Duty Benefits Reflect Changing Demographics, but
Opportunities Exist to Improve, GAO-02-935 (Washington, D.C.: Sept. 18, 2002).
2See the Ronald W. Reagan National Defense Authorization Act for Fiscal Year 2005, Pub. L. No. 108-375, § 401 (2004) and GAO, Military Personnel: DOD Needs to Conduct a Data-
Driven Analysis of Active Military Personnel Levels Required to Implement the Defense
Strategy, GAO-05-200 (Washington, D.C.: Feb. 1, 2005).
Page 1 GAO-05-952 Military DemographicsPage 1 GAO-05-952 Military Demographics

The high pace of military operations, thousands of casualties in ongoing military operations, and the services’ recruiting challenges have raised questions about who is serving in today’s military and concern that certain subgroups of the U.S. population are disproportionately represented among those fighting and dying in support of the war on terrorism. These challenges and concerns have increased the need for information about the demographic characteristics of military personnel.
As agreed with your offices, this report addressed three questions: (1) What are the demographic characteristics of servicemembers, and how do they compare to those of similarly aged and educated civilians in the U.S. workforce? (2) How well are the services meeting their recruitment goals, and what influences whether or not individuals join the military? (3) What are the demographic characteristics of servicemembers who remained in the military in fiscal years 2000, 2002, and 2004? You also asked us to examine the demographic characteristics of servicemembers who died or were wounded in combat in Iraq or Afghanistan in support of Operations Iraqi Freedom or Enduring Freedom.
To address these objectives, we examined Department of Defense (DOD) policies, regulations, and instructions and reviewed laws relating to the staffing of the military. We also reviewed governmentwide guidance on demographic analyses, such as the recent change in the way that information about racial/ethnic groups is to be gathered and displayed, as well as reports on servicemembers’ demographics, recruitment, retention, and casualties issued by GAO, DOD, the services, and individuals from other organizations such as RAND, the Center for Naval Analysis, and the University of Maryland’s Center for Research on Military Organization. Additionally, we interviewed policy officials from the Office of the Under Secretary of Defense for Personnel and Readiness and military researchers from DOD, the services, and other organizations to obtain insights into the factors that influence enlistment decisions, attitudes and opinions of today’s youth, recruiting challenges, characteristics of recruits, and demographic trends. We also requested that the Defense Manpower Data Center provide databases containing demographic data on active and reserve component servicemembers. We determined that the data were sufficiently reliable for our purposes and analyzed the data to identify the demographic characteristics of servicemembers. We conducted our work between August 2004 and July 2005 in accordance with generally accepted government auditing standards. Additional information on our scope, methodology, and analytic procedures are presented in appendixes I and II.
Page 2 GAO-05-952 Military Demographics

Results in Brief According to DOD data, the demographic composition of the military is somewhat different than that of the similarly aged and educated segment of the civilian workforce.3 When compared to comparable civilian workers, the military had proportionately fewer Whites (67 percent in the military compared to 71 percent in the civilian workforce), partly because the military has proportionately more African Americans (17 percent in the military versus 11 percent in the civilian workforce). The representation of American Indian/Alaskan Natives in the military equals that of the civilian workforce (about 1 percent in each). Although Hispanic representation in the military has markedly increased over the last decade to 9 percent, 11 percent of the comparable civilian workforce is of Hispanic ethnicity. Similarly, while Asian Americans/Pacific Islanders are 3 percent of the military, they comprise 5 percent of the civilian workforce. The representation of women in the military, at 16 percent, is partly impacted by military policy and federal statutes denying women access to military specialties involving ground combat. The distribution of racial/ethnic subgroups among female servicemembers differed from that of female civilian workers. For example, African Americans’ representation among female servicemembers at 28 percent was higher than their 13 percent representation among civilian female workers, but Whites’ representation among female servicemembers at 54 percent was below their 71 percent representation among civilian female workers. Two percent of servicemembers are not U.S. citizens. The top three foreign countries of origin identified by servicemembers who are not U.S. citizens or nationals are the Philippines, Mexico, and Jamaica. Also, DOD has not fully implemented the government-wide requirements on the collection and reporting of racial and ethnic data that were to have been implemented by January 1, 2003. The services continue to convert their data on current servicemembers’ race and ethnicity and DOD’s internal monthly reports of servicemember race and ethnicity continue to use the previous racial and ethnicity categories.4 This results in racial and ethnic tabulations that cannot be clearly compared to tabulations of the U.S. population as reported by other federal agencies such as the Bureau of the Census,
3Data for DOD were as of December 2004 and for the civilian workforce were as of 2003. See app. II for a description of the Current Population Survey Annual Social and Economic Supplement, used as the source of civilian data in this report.
4DOD’s internal tabulations do include a category for multiracial individuals, which is consistent with the revised guidelines, but continue to include “Hispanic” as a racial subgroup instead of reporting it separately, in accordance with the revised federal guidelines for self-reported data on race and ethnicity.
Page 3 GAO-05-952 Military Demographics
making it difficult for Congress to compare the military and civilian racial and ethnic compositions. The continued use of the former categories and methods may result in the undercounting of Hispanic servicemembers who belong to a minority racial subgroup.
Over the past decade the Active Component5 (AC) has met its overall recruiting goals more frequently than has the Reserve Component (RC). We found that a combination of personal, demographic, family, and societal factors influence whether or not individuals join the military. According to DOD researchers, at least half of today’s youth between the ages of 16 and 21 are not qualified to serve in the military because they fail to meet the military’s entry standards for education, aptitude, health, moral character, or other requirements. Between fiscal years 2000 and 2004, the AC annually accessed between approximately 176,400 to 183,000 nonprior-service enlisted personnel and about 17,500 to 21,500 officers. However, since fiscal year 2002, the proportion of recruits who are African Americans has declined in the AC. DOD has not routinely surveyed and reported on the socioeconomic status of its servicemembers since 1999 and has not previously routinely reported on the types of communities from which recruits are drawn. A recent DOD analysis of over 1 million recruits found that recruits came from communities representing all socioeconomic levels and, at $44,500, the median income of recruits’ communities roughly equaled the $44,300 median income of the communities of civilian youths. Proportionately more recruits came from the South and West than from the Northeast. Additionally, proportionately more enlisted recruits(45 percent-52 percent) than similarly aged civilian youth (40 percent) came from a rural community. Weaknesses with DOD’s measures of recruits’ socioeconomic status and community population density limit the information provided to Congress to perform its oversight role. To support recruiting, DOD spent over $455 million in fiscal year 2003 for enlistment bonuses, college funds, and loan repayments that were designed, in part, to help the services maintain the required numbers of personnel in critical occupational specialties. Some incentives have increased. While economic
5We use the term “Active Component” to collectively refer to the four active duty services: the Army, Navy, Marine Corps, and Air Force. We use the term “Reserve Component” to collectively refer to the six reserve components: the U.S. Army Reserve, U.S. Army National Guard, U.S. Navy Reserve, U.S. Marine Corps Reserve, U.S. Air Force Reserve, and U.S. Air National Guard. Although the Coast Guard Reserve also assists DOD in meeting its commitments, it comes under the day-to-day control of the Department of Homeland Security rather than DOD. The manpower strengths and analyses reported herein exclude the Coast Guard Reserve.
Page 4 GAO-05-952 Military Demographics

and educational incentives are cited as important factors youth consider in their decisions to join or not join the military, DOD data also shows that the attractiveness of joining the military after high school has declined because of operations in Iraq.
In fiscal years 2000, 2002, and 2004, DOD reported that 85 to 87 percent of all AC enlisted personnel and 90 to 93 percent of AC officers remained in the military. In the RC, 83 to 85 percent of enlisted personnel and 88 to 89 percent of officers remained in the military. In general, active or reserve Air Force continuation rates tended to be higher than rates for the other components. In the AC, there were no consistent differences between the continuation rates of racial/ethnic subgroups and the rates for females were within 2 percentage points of the rates for males in each year examined. While DOD routinely prepares some of these types of retention analyses for use within the department, it does not provide active duty retention rates in reports such as Population Representation in the
Military Services, which could be used by Congress in its oversight of military retention and related issues.
As of May 28, 2005, 1,841 servicemembers had died and 12,658 had been wounded in Operations Iraqi Freedom and Enduring Freedom. Of the 1,841 servicemembers who died, 482 were reservists. Of the 12,658 servicemembers who were wounded, 3,197 were reservists. Most of those who died or were wounded were junior enlisted personnel in the active Army or Marine Corps. Seventy-two percent of those who died were either killed in combat or died later of wounds received while in combat. White servicemembers constituted 71 percent of the deaths although they represented 67 percent of the AC and Selected Reserve6 we examined. In contrast, African Americans accounted for 9 percent of the deaths in these operations although they comprised 17 percent of the AC and Selected Reserve force we studied. Hispanic servicemembers comprised 10 percent of the deaths compared to the 9 percent of the AC and Selected Reserve force we examined. The majority of selected reservists who were killed or wounded during these operations were from communities that DOD classified as being of medium socioeconomic status.
6The Selected Reserve comprises part-time drilling reservists, full-time unit support personnel, Individual Mobilization Augmentees, and reservists who are in training. See app. III for more information on reserve personnel categories.
Page 5 GAO-05-952 Military Demographics

To improve the ability of the public, DOD, and Congress to identify and monitor demographic changes in the race, ethnicity, socioeconomic status, and community population density of servicemembers in the AVF and to enhance Congress’s ability to perform its oversight functions, we are recommending that DOD (1) gather and report data on race and ethnicity that are consistent with the required procedures set forth by the Office of Management and Budget, (2) conduct research to determine a feasible process for assessing the socioeconomic status of recruits and periodically include these findings in annual reports on servicemembers, (3) assess the type of communities recruits come from and periodically include a measure of population density in the annual demographic reports, and (4) include continuation rates on AC and RC personnel in DOD’s annual demographic reports. In commenting on a draft of this report, DOD concurred with our four recommendations.
We are sending copies of this report to the Secretaries of Defense, the Army, the Navy, and the Air Force; the Commandant of the Marine Corps; and the Chiefs of the National Guard Bureau, the Army Reserve, the Army National Guard, the Air Force Reserve, the Air National Guard, the Navy Reserve, and the Marine Corps Reserve. We will also make copies available to others upon request. The report will be available at no charge on GAO’s Web site at http://www.gao.gov.
If you or your staffs have any questions concerning this report, please contact me at (202) 512-5559 or [email protected]. Contact points for our Offices of Congressional Relations and Public Affairs may be found on the last page of this report. GAO staff who made major contributions to this report are listed in appendix VI.
Derek B. StewartDirector, Defense Capabilities and Management
Page 6 GAO-05-952 Military Demographics

Background
The Charge and the Debate of the All Volunteer Force
In 1970, President Nixon directed the Commission on an All Volunteer Armed Force–the Gates Commission--to develop a plan to eliminate conscription and institute an All Volunteer Force (AVF). The commission unanimously recommended the elimination of conscription, while noting that, except during major wars and the latter half of the 20th century, the United States has historically relied on volunteers for its military forces. Prior to the adoption of the AVF, there were a number of arguments made for and against an AVF. Some of these arguments, offered by members of the commission, Congress, military leaders, and the public, follow:
• Arguments against an AVF
• Opinion that military service is an obligation of citizenship.
• Concern that the military would attract an insufficient number of recruits, especially during times of war.
• Concern that because of relatively poorer civilian opportunities, African Americans would be attracted to the higher pay of a voluntary force and therefore would be overrepresented in the force.
• Fear that a volunteer military would not attract a cross section of high-quality American youth, causing a decline in military effectiveness.
• The AVF is costly because of higher costs for benefits and increased pay.
• Arguments for an AVF
• Concern that conscription is inequitable, divisive, and inefficient.
• Availability of more potential recruits in the late 1960s because the “baby boom” generation provided more young men eligible for military service.
• Concern that minorities, especially African Americans, represented a disproportionate share of Vietnam War fatalities.
Page 7 GAO-05-952 Military Demographics

Background
• The higher cost of an AVF transfers the burden of military service from draftees to the population as a whole. The higher cost also is partly offset by lower turnover and fewer people in a training status.
• Conscription is costly because of the higher costs of recruiting, training, and turnover.
Despite opposition from many in the military, Congress, and the administration, the AVF was adopted on July 1,1973, marking the end of conscription.
DOD Publications and Databases for Force Demographics
The Office of the Under Secretary for Personnel and Readiness publishes the demographic characteristics of military personnel in several official documents.
• For 30 years, the Office of Accession Policy has produced the Population Representation in the Military Services,1 which contains
• demographic characteristics such as age, gender, race, and ethnicity, of current active duty personnel and selected reservists (including the Coast Guard);
• military characteristics of current active duty and selected reservists such as pay grade, DOD occupational area, and years of service;
• information on applicants and accessions; and
• trends.
• Similarly, the Office of the Assistant Secretary of Defense for Reserve Affairs annually publishes the Official Guard and Reserve Manpower
Strengths and Statistics which includes data on Selected Reservists as well as reservists in the Individual Ready Reserve, Inactive National Guard, and Retired Reserves (see app. III for more information on reserve personnel categories). The report includes:
1The most recent report can be accessed at http://dod.mil/prhome/poprep2003.
Page 8 GAO-05-952 Military Demographics
Background
• tabulations on current reservists’ demographic and military characteristics such as gender, race, ethnicity, pay grade, and occupational category; and
• data on end strength, accessions, attrition, and retention.
• Data sources—Data for both reports are drawn from databases maintained by the DMDC. (See app. II for more detailed information on the data sources used in this report.)
• The active duty master and loss files are the sources of information for active duty personnel.
• The Reserve Components Common Personnel Data System is the source of information for reserve component personnel.
Changing Demographics
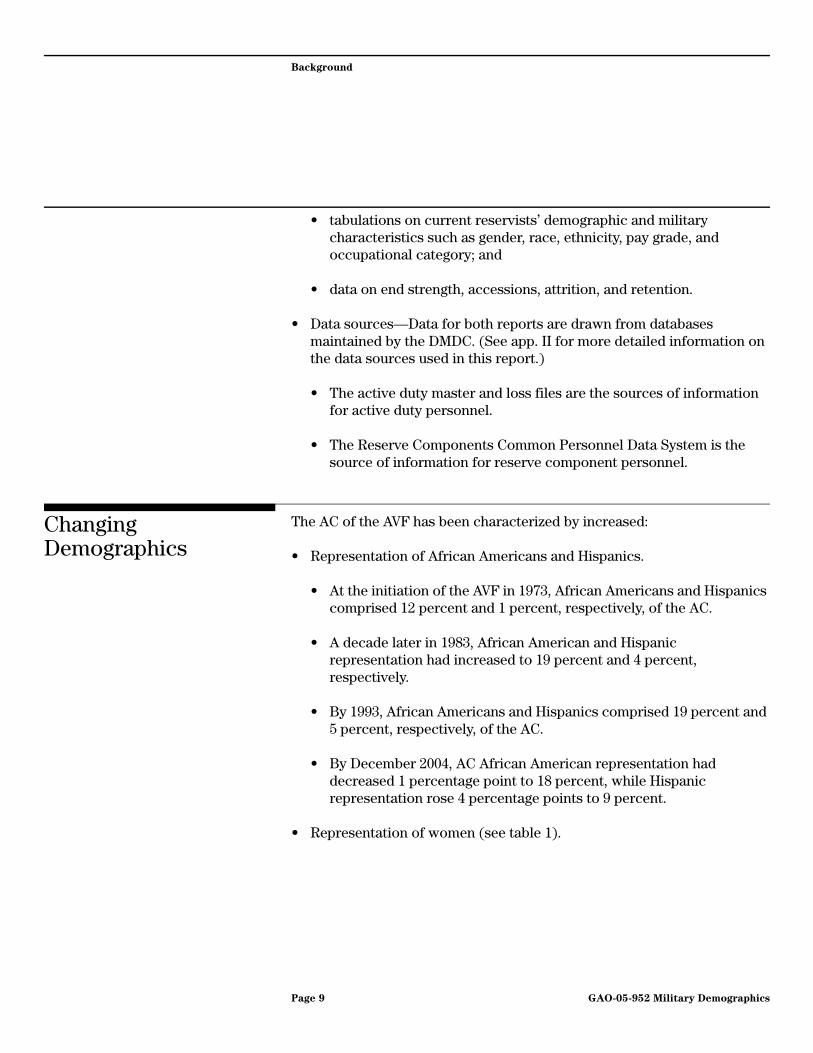
The AC of the AVF has been characterized by increased:
• Representation of African Americans and Hispanics.
• At the initiation of the AVF in 1973, African Americans and Hispanics comprised 12 percent and 1 percent, respectively, of the AC.
• A decade later in 1983, African American and Hispanic representation had increased to 19 percent and 4 percent, respectively.
• By 1993, African Americans and Hispanics comprised 19 percent and 5 percent, respectively, of the AC.
• By December 2004, AC African American representation had decreased 1 percentage point to 18 percent, while Hispanic representation rose 4 percentage points to 9 percent.
• Representation of women (see table 1).
Page 9 GAO-05-952 Military Demographics

Background
Table 1: Percentage of the AC that Is Female
Sources: Percentages are GAO calculations using data from DOD’s Selected Manpower Statistics: Fiscal Year 2003, pp. 44-45, 71-73.
• Retention (see table 2).
Table 2: Percentage of Servicemembers Serving for More than 4 Years
Source: Bernard D. Rostker, “The Gates Commission: Right for the Wrong Reasons,” from The All Volunteer Force: Thirty Years of Service, Brassey’s Inc. (Washington, D.C. 2004), p. 29.
Note: Rows may not total 100 percent because of rounding.
Year Percentage female
Pre-AVF 1964 1
AVF initiation 1973 2
Post-AVF1983 9
1993 12
2003 15
Year
Percentage of each service
Army Navy Marine Corps Air Force
Pre-AVF 1969 18 31 16 46
Post-AVF 2002 51 49 35 66
Page 10 GAO-05-952 Military Demographics

Demographic Characteristics of Servicemembers
Question 1 and Summary of Approach
What are the demographic characteristics of servicemembers and how do they compare to those of similarly aged and educated civilians in the U.S. workforce?
We compared the characteristics of over 2.2 million servicemembers in the AC and RC to a nationally representative sample of civilian workers. We examined almost 1.4 million AC servicemembers who were on active duty on December, 31, 2004. We also examined almost 835,000 RC Selected Reservists in the Army Reserve, Army National Guard, Navy Reserve, Marine Corps Reserve, Air Force Reserve, and Air National Guard. We compared servicemembers’ characteristics to those of employed civilians in the United States, aged 18-49, with at least a high school diploma or equivalent.
Summary of Findings
1A. Military force overview AC servicemembers comprise 63 percent of all servicemembers examined. The components vary both in the extent to which junior personnel comprise the enlisted corps and in their occupational make-up.
1B. Race and ethnicity • There are proportionately more African American and proportionately fewer White servicemembers in the military than in the comparable civilian workforce.
• The proportions of both Hispanics and Asian Americans/Pacific Islanders in the military are slightly lower than in the comparable civilian workforce.
• The proportion of American Indians/Alaskan Natives in the military is about the same as that in the comparable civilian workforce.
1C. Gender About 16 percent of the armed forces are female, with representation being highest in the Air Force and lowest in the Marine Corps.
Page 11 GAO-05-952 Military Demographics

Demographic Characteristics of
Servicemembers
1D. Age We compared the age of servicemembers to that of the entire U.S. population and found that, in general, servicemembers are younger than persons in the U.S. population.
1E. Education We compared the education levels of servicemembers to those of the entire U.S. population and found that proportionately fewer servicemembers have attended college than in the U.S. population.
1F. Citizenship and country of origin
Two percent of all servicemembers are not U.S. citizens. Among the countries of birth most frequently cited by noncitizens are the Philippines, Mexico, and Jamaica.
Page 12 GAO-05-952 Military Demographics

Demographic Characteristics of
Servicemembers
Page 13 GAO-05-952 Military Demographics

Demographic Characteristics of
Servicemembers
Findings
1A. Military Force Overview—Force Strength
Table 3: Number of Servicemembers in Each Service as of December 31, 2004
Source: GAO analysis of DOD-provided data.
aNational Guard servicemembers, with their unique federal and state roles, perform under the command of the President for federal missions such as warfighting and under the command of the state governor for state missions such as responding to natural disasters.
• Over 2.2 million servicemembers from the AC and RC Selected Reserve were in the military on December 31, 2004 (see table 3).
• AC servicemembers comprised 63 percent (1,396,239) of the servicemembers we reviewed.
• There were 834,633 RC Selected Reservists serving as Individual Mobilization Augmentees, drilling reservists, or in unit support or training.1
• The Army is the largest service and the only one with less than half of its personnel in the AC.
Service Active
Selected Reserve
TotalReserve National Guarda
Army 488,143 198,947 335,490 1,022,580
Navy 365,419 79,467 0 444,886
Air Force 365,567 74,875 105,805 546,247
Marine Corps 177,110 40,049 0 217,159
Total 1,396,239 393,338 441,295 2,230,872
1We excluded from our analyses reservists in the Individual Ready Reserve, Inactive National Guard, Standby Reserve, and Retired Reserve. See app. III for a description of RC structure.
Page 14 GAO-05-952 Military Demographics

Demographic Characteristics of
Servicemembers
Table 4: Number of Servicemembers in Each Pay Grade Subgroup as of December 31, 2004
Source: GAO analysis of DOD-provided data.
Notes: AC enlisted subtotal includes 15 AC enlisted personnel with unknown pay grades. AC officer subtotal includes 1 AC officer with unknown pay grade. RC enlisted subtotal includes 7 RC enlisted personnel with unknown pay grades. RC officer subtotal includes 2 RC officers with unknown pay grades.
• Of the 2.2 million servicemembers, almost 1.9 million or 84 percent were enlisted personnel (see table 4).
• In the AC enlisted and officer corps, there are more junior than senior personnel, although the opposite pattern is noted in the RC. The higher proportion of senior personnel in the RC enlisted and officer corps may reflect the fact that many RC accessions have prior military service and therefore entered the RC at a pay grade above the lowest (entry-level) pay grade.
Component
Juniorenlisted(E1-E4)
Seniorenlisted(E5-E9)
Warrantofficers
(WO1-WO5)
Juniorofficers(O1-O3)
Seniorofficers(O4-O6)
General/Flag
officers(O7-O10)
Subtotals
TotalTotal
enlistedTotal
officers
Total AC 609,075 560,794 15,586 126,020 83,867 881 1,169,884 226,355 1,396,239
Total RC 329,429 380,306 9,821 46,373 68,098 597 709,742 124,891 834,633
Total 938,504 941,100 25,407 172,393 151,965 1,478 1,879,626 351,246 2,230,872
Page 15 GAO-05-952 Military Demographics

Demographic Characteristics of
Servicemembers
1A. Military Force Overview—Pay Grade
Table 5: Percent of Servicemembers in Pay Grade Subgroups as of December 31, 2004
Source: GAO analysis of DOD-provided data.
• Some components have proportionately more enlisted personnel than do other components (see table 5).
• The components with the highest proportions of enlisted personnel are both Marine Corps components and the Army National Guard (91 percent to 89 percent).
• The Air Force Reserve and Navy Reserve have the lowest proportions of enlisted personnel (78 percent and 79 percent, respectively).
• The mix of junior (E1-E4) and senior (E5-E9) pay grades in the enlisted force varies across components.
Component
Pay grade subgroup Subtotals
Juniorenlisted(E1-E4)
Seniorenlisted(E5-E9)
Warrantofficers
(WO1-WO5)
Juniorofficers(O1-O3)
Seniorofficers(O4-O6)
General/flag
officers(O7-O10)
Totalenlisted
Totalofficers
Army 46 38 2 8 6 <1 84 16
Navy 40 45 <1 9 6 <1 85 15
Marine Corps 60 29 1 6 3 <1 89 10
Air Force 36 44 0 12 8 <1 80 20
Total AC 44 40 1 9 6 <1 84 16
Army Reserve 38 43 1 8 10 <1 81 19
Army National Guard 48 41 2 5 3 <1 89 10
Navy Reserve 26 53 <1 5 16 <1 79 21
Marine Corps Reserve 71 20 1 1 7 <1 91 9
Air Force Reserve 22 56 0 6 16 <1 78 22
Air National Guard 24 63 0 4 8 <1 87 12
Total RC 39 46 1 6 8 <1 85 15
Total military 42 42 1 8 7 <1 84 16
Page 16 GAO-05-952 Military Demographics

Demographic Characteristics of
Servicemembers
• Junior enlisted personnel make up over half of the enlisted force in the Marine Corps Reserve (71 percent) and active Marine Corps (60 percent).
• In contrast, junior enlisted make up about one quarter of the Air Force Reserve (22 percent), Air National Guard (24 percent), and Navy Reserve (26 percent).
• Although the overall officer corps is about evenly split between junior (8 percent) and senior (7 percent) officer pay grades, the Navy Reserve and Air Force Reserve have two to three times as many senior as junior officers.
Page 17 GAO-05-952 Military Demographics

Demographic Characteristics of
Servicemembers
1A. Military Force Overview—Occupational Areas
Table 6: Percent of Servicemembers in Each DOD Occupational Area as of December 31, 2004
Legend: N.E.C. = Not elsewhere classified.
Source: GAO analysis of DOD-provided data.
Notes: The nonoccupational area includes patients, students, those with unassigned duties, and unknowns. Columns may not total 100 percent due to rounding.
• Table 6 shows that over half of AC and RC enlisted personnel are in three occupational areas:
• electrical/mechanical equipment repair (21 percent and 16 percent, respectively);
• infantry, gun crews, and seamanship (17 percent and 19 percent, respectively); and
• functional support and administration (16 percent and 20 percent, respectively).
• The biggest differences between AC and RC enlisted occupation concentrations is that, relative to the RC, the AC has proportionately more enlisted personnel in:
DOD enlisted occupational codes and areas
Component
DOD officer occupational codes and areas
Component
AC RC AC RC
0 Infantry, gun crews, & seamanship 17 19 N/A N/A N/A
1 Electronic equipment repairers 9 5 1 General officers & executives N.E.C. 1 1
2 Communications & intelligence specialists 10 5 2 Tactical operations officers 36 33
3 Health care specialists 7 6 3 Intelligence officers 5 6
4 Other technical & allied specialists 3 3 4 Engineering and maintenance officers 14 11
5 Functional support & administration 16 20 5 Scientists & professionals 5 7
6 Electrical/mechanical equipment repairers 21 16 6 Health care officers 16 19
7 Craftsworkers 4 6 7 Administrators 6 8
8 Service & supply handlers 9 12 8 Supply, procurement, & allied officers 9 10
9 Nonoccupational 5 8 9 Nonoccupational 6 4
Total 101 100 Total 98 99
Page 18 GAO-05-952 Military Demographics
Demographic Characteristics of
Servicemembers
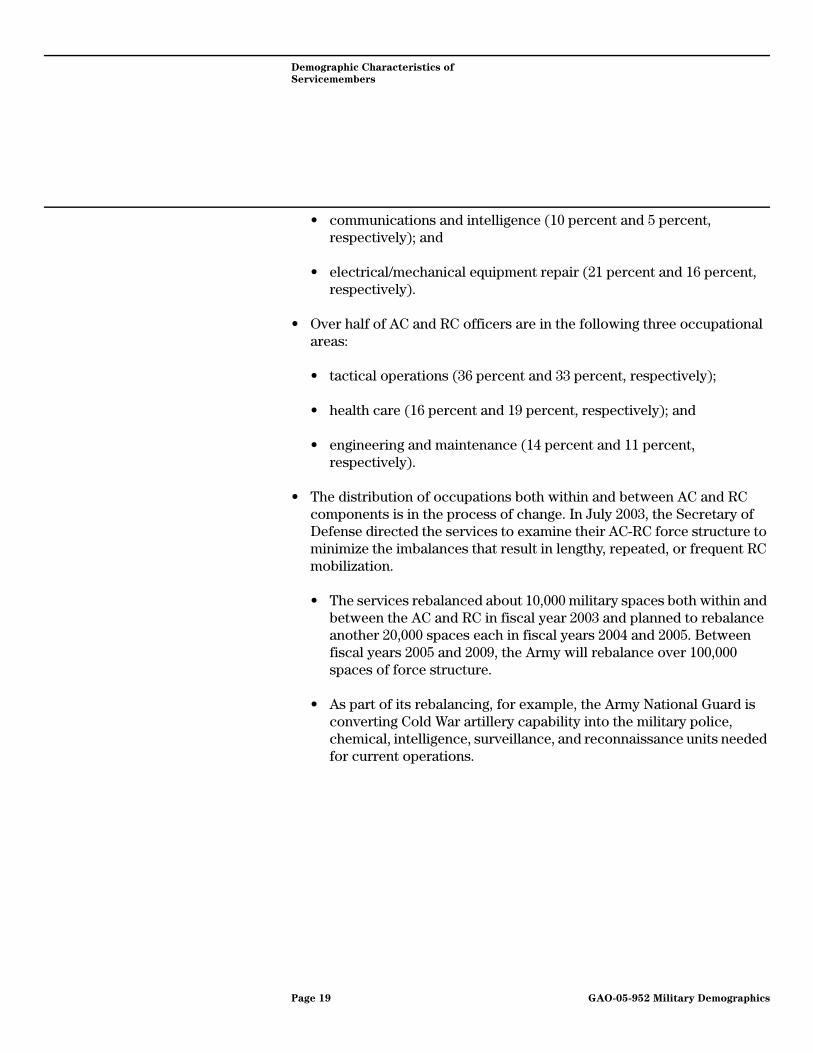
• communications and intelligence (10 percent and 5 percent, respectively); and
• electrical/mechanical equipment repair (21 percent and 16 percent, respectively).
• Over half of AC and RC officers are in the following three occupational areas:
• tactical operations (36 percent and 33 percent, respectively);
• health care (16 percent and 19 percent, respectively); and
• engineering and maintenance (14 percent and 11 percent, respectively).
• The distribution of occupations both within and between AC and RC components is in the process of change. In July 2003, the Secretary of Defense directed the services to examine their AC-RC force structure to minimize the imbalances that result in lengthy, repeated, or frequent RC mobilization.
• The services rebalanced about 10,000 military spaces both within and between the AC and RC in fiscal year 2003 and planned to rebalance another 20,000 spaces each in fiscal years 2004 and 2005. Between fiscal years 2005 and 2009, the Army will rebalance over 100,000 spaces of force structure.
• As part of its rebalancing, for example, the Army National Guard is converting Cold War artillery capability into the military police, chemical, intelligence, surveillance, and reconnaissance units needed for current operations.
Page 19 GAO-05-952 Military Demographics

Demographic Characteristics of
Servicemembers
1A. Military Force Overview—Occupational Areas
Table 7: Percent of Enlisted Personnel in Each Component in DOD Occupational Areas as of December 31, 2004
Source: GAO analysis of DOD-provided data.
Notes: The nonoccupational area includes patients, students, those with unassigned duties, and unknowns. Columns may not total 100 percent due to rounding.
DOD enlisted occupational codes and areas
AC RC
Army NavyAir
ForceMarineCorps
ArmyReserve
ArmyNational
GuardNavy
Reserve
MarineCorps
ReserveAir ForceReserve
AirNational
Guard
0 Infantry, gun crews, & seamanship
26 9 10 23 8 30 11 31 11 10
1 Electronic equipment repairers
6 13 9 7 2 3 10 4 5 9
2 Communications & intelligence specialists
11 9 8 7 4 6 7 8 3 4
3 Health care specialists 8 9 7 0 10 4 9 0 11 4
4 Other technical & allied specialists
3 1 4 3 4 3 1 1 3 5
5 Functional support & administration
16 12 21 16 26 14 22 12 27 22
6 Electrical/mechanical equipment repairers
14 29 25 16 11 14 19 13 22 28
7 Craftsworkers 2 6 5 2 6 4 14 3 6 6
8 Service & supply handlers 13 7 5 12 19 13 7 15 5 6
9 Nonoccupational 1 6 6 13 10 9 1 11 8 6
Total 100 101 100 99 100 100 101 98 101 100
Page 20 GAO-05-952 Military Demographics

Demographic Characteristics of
Servicemembers
Table 8: Percent of Officers in Each Component in DOD Occupational Areas as of December 31, 2004
Legend: N.E.C. = Not elsewhere classified.
Source: GAO analysis of DOD-provided data.
Notes: The nonoccupational area includes patients, students, those with unassigned duties, and unknowns. Columns may not total 100 percent due to rounding.
• The enlisted occupational structure varies among the active components (see table 7).
• In the AC, the Army and Marine Corps have a higher proportion (over a fifth) of their enlisted forces in the occupations which are part of the infantry, gun crews, and seamanship occupational area than did the active Navy and Air Force.
• In contrast, the active Navy and Air Force have their greatest concentrations of enlisted personnel in electrical/mechanical equipment repair occupations.
• At least a third of officers in each active and reserve component except the Army Reserve (17 percent) and the Air Force Reserve (31 percent) were in tactical operations (see table 8).
DOD officer occupational codes and areas
AC RC
Army NavyAir
ForceMarineCorps
ArmyReserve
ArmyNational
GuardNavy
Reserve
MarineCorps
ReserveAir ForceReserve
AirNational
Guard
1 General officers & executives N.E.C.
<1 <1 1 4 <1 1 <1 11 2 3
2 Tactical operations officers 36 39 33 45 17 44 38 47 31 37
3 Intelligence officers 6 4 5 5 5 3 11 5 7 3
4 Engineering and maintenance officers
15 12 15 11 10 11 12 10 12 14
5 Scientists & professionals 6 4 6 3 11 3 4 5 9 5
6 Health care officers 17 20 16 0 31 8 20 0 24 15
7 Administrators 7 4 7 8 9 7 6 7 7 10
8 Supply, procurement, & allied officers
10 6 9 13 13 10 6 13 8 6
9 Nonoccupational 2 11 5 11 1 11 2 <1 1 3
Total 99 100 97 100 97 98 99 98 101 96
Page 21 GAO-05-952 Military Demographics
Demographic Characteristics of
Servicemembers
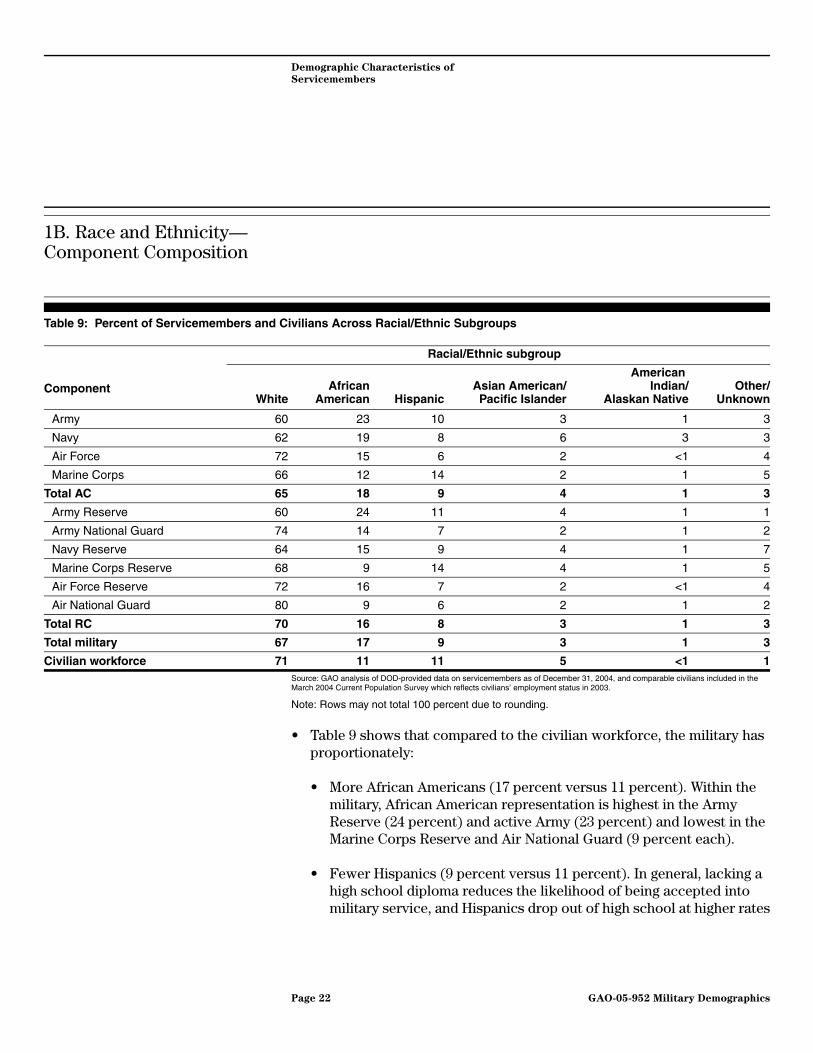
1B. Race and Ethnicity—Component Composition
Table 9: Percent of Servicemembers and Civilians Across Racial/Ethnic Subgroups
Source: GAO analysis of DOD-provided data on servicemembers as of December 31, 2004, and comparable civilians included in the March 2004 Current Population Survey which reflects civilians’ employment status in 2003.
Note: Rows may not total 100 percent due to rounding.
• Table 9 shows that compared to the civilian workforce, the military has proportionately:
• More African Americans (17 percent versus 11 percent). Within the military, African American representation is highest in the Army Reserve (24 percent) and active Army (23 percent) and lowest in the Marine Corps Reserve and Air National Guard (9 percent each).
• Fewer Hispanics (9 percent versus 11 percent). In general, lacking a high school diploma reduces the likelihood of being accepted into military service, and Hispanics drop out of high school at higher rates
Component
Racial/Ethnic subgroup
WhiteAfrican
American HispanicAsian American/Pacific Islander
American Indian/
Alaskan NativeOther/
Unknown
Army 60 23 10 3 1 3
Navy 62 19 8 6 3 3
Air Force 72 15 6 2 <1 4
Marine Corps 66 12 14 2 1 5
Total AC 65 18 9 4 1 3
Army Reserve 60 24 11 4 1 1
Army National Guard 74 14 7 2 1 2
Navy Reserve 64 15 9 4 1 7
Marine Corps Reserve 68 9 14 4 1 5
Air Force Reserve 72 16 7 2 <1 4
Air National Guard 80 9 6 2 1 2
Total RC 70 16 8 3 1 3
Total military 67 17 9 3 1 3
Civilian workforce 71 11 11 5 <1 1
Page 22 GAO-05-952 Military Demographics
Demographic Characteristics of
Servicemembers
than members of other racial/ethnic subgroups.2 Within the military, Hispanic representation is highest in both Marine Corps components (14 percent each) and lowest in the active Air Force and Air National Guard (6 percent each).
• Fewer Whites (67 percent versus 71 percent) and Asian Americans/Pacific Islanders (3 percent versus 5 percent).
• The components differ in overall minority representation.
• The AC is 65 percent White and 34 percent minority.
• The RC is 70 percent White and 30 percent minority.
• The active Army and Army Reserve each have a minority representation of about 40 percent compared to the Air National Guard, which has a 20 percent minority representation.
2Anita U. Hattiangadi, Gary Lee, and Aline O. Quester, Recruiting Hispanics: The Marine
Corps Experience Final Report, CRM D0009071.A2, Center for Naval Analysis (Alexandria, Va.: January 2004).
Page 23 GAO-05-952 Military Demographics

Demographic Characteristics of
Servicemembers
1B. Race and Ethnicity—New Federal Requirements
Figure 1: Military Racial and Ethnic Representation
• The previously presented analysis on race/ethnicity and those in later parts of this report must be understood in the context of recent changes in the procedures for collecting and reporting information on racial and ethnic group membership.
• In 1997, the Office of Management and Budget issued Statistical Policy Directive Number 15, “Race and Ethnic Standards for Statistics and Administrative Reporting,” indicating that by January 1, 2003, federal agencies would collect information on race and ethnicity by:
• asking about race and ethnicity in two separate questions, with the ethnicity question preceding the race question;
Source: Joint Combat Camera Center.
Page 24 GAO-05-952 Military Demographics

Demographic Characteristics of
Servicemembers
• using a minimum of five single race subgroups: American Indian or Alaska Native, Asian, Black or African American, Native Hawaiian or Other Pacific Islander, and White;
• enabling individuals to indicate more than one racial identity; and
• using two ethnic subgroups—Hispanic or Latino versus Not Hispanic or Latino—for self-reported data collections.
• In addition to changing the way racial and ethnic data are collected, the revised directive also changed the way federal agencies report this data by,
• prohibiting use of the term “nonwhite,”
• allowing the use of a “combined format” in which being of Hispanic or Latino ethnicity is one of six racial/ethnic categories when reporting observer-collected data.
• In March 2000, the Office of Management and Budget issued OMB Bulletin No. 00-02, which provided guidance on the aggregation and allocation of multiple race responses by encouraging federal agencies to:
• report multiple race individuals separately from single race individuals, and
• report racial combinations representing more than 1 percent of the population in an area.
Page 25 GAO-05-952 Military Demographics

Demographic Characteristics of
Servicemembers
1B. Race and Ethnicity—DOD’s Implementation of the New Requirements
• Prior to 2003, DOD generally tabulated and reported servicemember race and ethnicity in the following subgroups: Hispanic, White, Black, Asian or Pacific Islander, and American Indian or Alaskan native, and Other or Unknown. Some DOD reports combined several subgroups to report on four categories: Hispanic, White, Black, and Other.
• DOD has implemented the new guidelines when collecting racial and ethnicity data from recruits.
• In 2003, DOD revised the form (DD 1966) used to capture information on recruits to comply with the newly issued guidance. The revised form, however, did not require recruits to respond to questions on race and ethnicity, and instead, enabled them to choose a “Decline to respond” option.
• The Office of Accession Policy indicated that providing this option resulted in more servicemembers declining to supply the information. DOD plans to begin using another version of the form without the “Decline to respond” option in October 2005.
• The components are taking different approaches to updating race and ethnicity in servicemembers’ personnel records. A DOD official told us that race and ethnicity data in one reserve component database were expunged and reentered when servicemembers updated their files. Additionally, we were told that:
• the Air Force reserve components cleared personnel records of the old racial/ethnic data and began entering new data consistent with the revised guidelines, and
• the active Air Force notified its personnel that they should access the Virtual Personnel Center and confirm or revise the data.
• Although the varying approaches taken by the components to update personnel records can be expected to result in varying levels of compliance, DOD officials told us that an internal study showed that 90
Page 26 GAO-05-952 Military Demographics

Demographic Characteristics of
Servicemembers
percent of active duty servicemembers had the same race code before and after implementation of the new guidance.3
• Although the components are in the process of gathering or confirming their data on current servicemembers’ race and ethnicity to comply with the new guidance, DOD still reports race and ethnicity in the old format.
• DOD’s internal monthly report of servicemember demographics, DMDC EO 3035, still uses the previous racial and ethnicity categories in which,
• Hispanic remains one of five single race subgroups instead of being reported separately, and
• Asian Americans, Hawaiians, and Other Pacific Islanders are in one racial subgroup (instead of two subgroups—Asian and Native Hawaiian/Other Pacific Islander—in accordance with the new guidance).
• DOD’s Information Delivery System produces demographic reports of servicemembers using the former racial/ethnic subgroups of White, African American, Hispanic, Asian/Pacific Islander, and Alaska Native, although the reports also include a Multirace/Unknown subgroup.
• The Office of Accession Policy excluded racial/ethnic breakouts of current servicemembers from its Population Report of the Military
Services: Fiscal Year 2003 (such breakouts are, however, available for accessions) although the office does plan to include these analyses in future reports.
• DOD’s continued use of the former racial and ethnic categories makes it difficult to directly compare race and ethnicity in the U.S. population to that in the military.
3DOD compared the race codes of 929,651 servicemembers who were on active duty in both March 2002 and March 2005.
Page 27 GAO-05-952 Military Demographics
Demographic Characteristics of
Servicemembers
1B. Race and Ethnicity—Enlisted Personnel
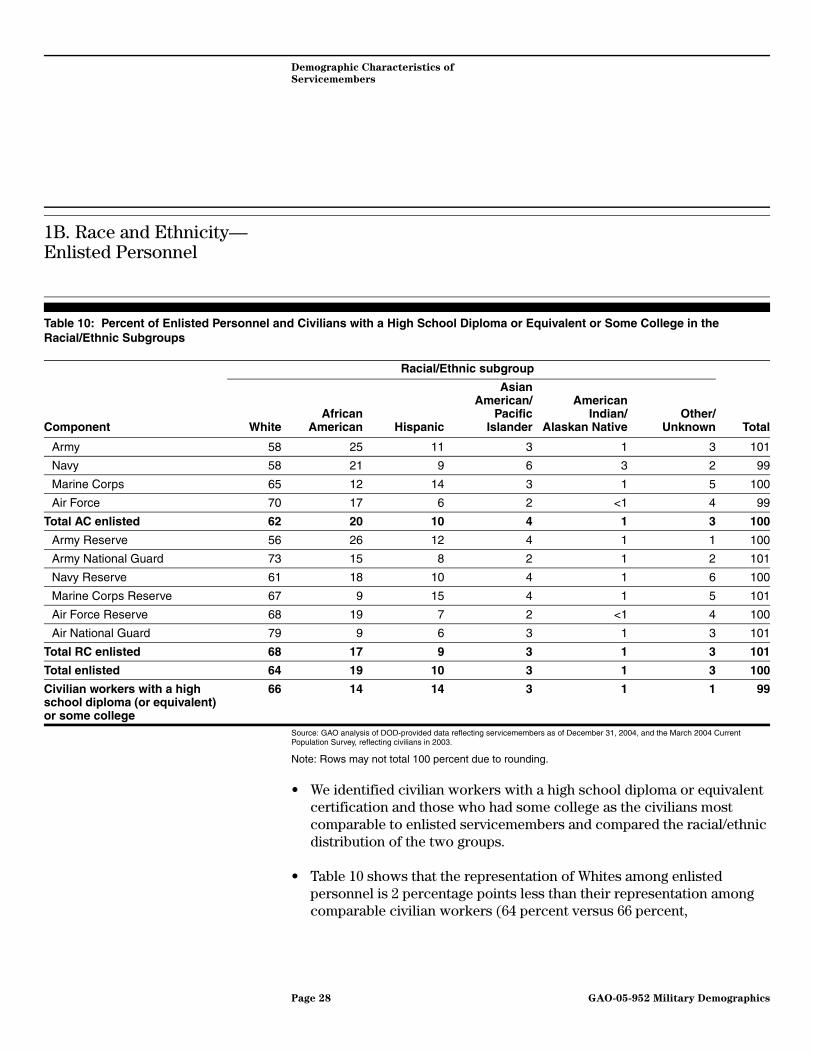
Table 10: Percent of Enlisted Personnel and Civilians with a High School Diploma or Equivalent or Some College in the Racial/Ethnic Subgroups
Source: GAO analysis of DOD-provided data reflecting servicemembers as of December 31, 2004, and the March 2004 Current Population Survey, reflecting civilians in 2003.
Note: Rows may not total 100 percent due to rounding.
• We identified civilian workers with a high school diploma or equivalent certification and those who had some college as the civilians most comparable to enlisted servicemembers and compared the racial/ethnic distribution of the two groups.
• Table 10 shows that the representation of Whites among enlisted personnel is 2 percentage points less than their representation among comparable civilian workers (64 percent versus 66 percent,
Component
Racial/Ethnic subgroup
TotalWhiteAfrican
American Hispanic
AsianAmerican/
PacificIslander
AmericanIndian/
Alaskan NativeOther/
Unknown
Army 58 25 11 3 1 3 101
Navy 58 21 9 6 3 2 99
Marine Corps 65 12 14 3 1 5 100
Air Force 70 17 6 2 <1 4 99
Total AC enlisted 62 20 10 4 1 3 100
Army Reserve 56 26 12 4 1 1 100
Army National Guard 73 15 8 2 1 2 101
Navy Reserve 61 18 10 4 1 6 100
Marine Corps Reserve 67 9 15 4 1 5 101
Air Force Reserve 68 19 7 2 <1 4 100
Air National Guard 79 9 6 3 1 3 101
Total RC enlisted 68 17 9 3 1 3 101
Total enlisted 64 19 10 3 1 3 100
Civilian workers with a high school diploma (or equivalent) or some college
66 14 14 3 1 1 99
Page 28 GAO-05-952 Military Demographics
Demographic Characteristics of
Servicemembers
respectively). The representation of White enlisted personnel varies by component.
• In the AC, the Air Force has the highest proportion of enlisted Whites at 70 percent, and the Army and Navy have the lowest at 58 percent.
• In the RC, the Air National Guard and Army National Guard have the highest proportions at 79 percent and 73 percent, respectively, and the Army Reserve has the lowest proportion at 56 percent.
• The racial/ethnic distribution of minority enlisted personnel varies from that for civilian workers with a high school diploma or equivalent or some college. Compared to these civilians, the military’s enlisted pay grades have proportionately:
• more African Americans (19 percent versus 14 percent for civilians), and
• fewer Hispanics (10 percent versus 14 percent for civilians).
• African American representation among enlisted personnel is highest in the Army Reserve (26 percent) and active Army (25 percent).
• Hispanic enlisted representation is highest in the two Marine Corps components (14 percent and 15 percent).
Page 29 GAO-05-952 Military Demographics

Demographic Characteristics of
Servicemembers
1B. Race and Ethnicity—Officers
Table 11: Percent of Officers and Civilian College Graduates in the Racial/Ethnic Subgroups
Source: GAO analysis of DOD-provided data reflecting servicemembers as of December 31, 2004, and the March 2004 Current Population Survey reflecting civilians in March 2003.
Note: Rows may not total 100 percent due to rounding.
• Findings from table 11 indicate that the racial/ethnic representation of the officer corps is similar to that of the civilian college-graduate workforce, except
• White representation is higher among military officers (79 percent) than among civilian college graduates (75 percent), and
• Asian American/Pacific Islander representation is lower among military officers (3 percent) than among civilian college graduates (8 percent).
Component
Racial/Ethnic subgroup
TotalWhiteAfrican
American Hispanic
AsianAmerican/
PacificIslander
AmericanIndian/
AlaskanNative
Other/Unknown
Army 75 13 5 3 <1 3 99
Navy 81 8 5 3 <1 3 100
Marine Corps 77 7 6 2 1 7 100
Air Force 82 7 4 2 <1 5 100
Total AC officers 79 9 5 3 <1 4 100
Army Reserve 73 16 6 3 <1 2 100
Army National Guard 84 7 5 2 <1 1 99
Navy Reserve 77 5 4 3 <1 12 101
Marine Corps Reserve 82 5 5 2 1 6 101
Air Force Reserve 85 6 3 1 <1 3 98
Air National Guard 87 5 3 2 <1 2 99
Total RC officers 80 9 4 2 <1 3 98
Total officers 79 9 5 3 <1 4 100
Civilian college graduates in the workforce 75 9 7 8 <1 1 100
Page 30 GAO-05-952 Military Demographics
Demographic Characteristics of
Servicemembers
• The comparison of the racial/ethnic distribution of officers to enlisted personnel (provided earlier in table 10) shows that
• Although White representation among officers is higher than in the college educated workforce (79 percent versus 75 percent, respectively), White representation among enlisted personnel is lower than comparably educated civilians (64 percent versus 66 percent, respectively).
• Although African American representation among officers is equal to that of the college workforce (9 percent for both), African American representation among enlisted personnel exceeds that of comparably educated civilians (19 percent versus 14 percent, respectively, as shown in table 10 on the previous page).
• Hispanic representation among both officers and enlisted is below that of comparably educated civilians (5 percent of officers versus 7 percent of comparably educated civilians are Hispanic; 10 percent of enlisted personnel versus 14 percent of comparably educated civilians are Hispanic).
Page 31 GAO-05-952 Military Demographics

Demographic Characteristics of
Servicemembers
1B. Race and Ethnicity—Active Component Enlisted Occupational Areas
Table 12: Percent of AC Enlisted Personnel in Each Racial/Ethnic Subgroup and DOD Occupational Area as of December 31, 2004
Source: GAO analysis of DOD-provided data.
Notes: The nonoccupational area includes patients, students, those with unassigned duties, and unknowns. Rows may not total 100 percent due to rounding.
• The occupational areas with the highest concentration of AC White enlisted personnel in table 12 are:
• the nonoccupational area (which includes patients, students, and those with unassigned duties) at 72 percent;
DOD enlisted occupational codes and areas
Racial/Ethnic subgroup
TotalWhiteAfrican
American Hispanic
AsianAmerican/
PacificIslander
American Indian/
AlaskanNative
Other/Unknown
0 Infantry, gun crews, & seamanship 69 14 11 3 1 3 101
1 Electronic equipment repairers 69 15 9 3 2 3 101
2 Communications & intelligence specialists 67 18 9 3 1 3 101
3 Health care specialists 52 25 11 7 1 4 100
4 Other technical & allied specialists 67 17 9 3 1 3 100
5 Functional support & administration 45 34 12 4 1 4 100
6 Electrical/mechanical equipment repairers 67 15 9 4 2 3 100
7 Craftsworkers 66 17 9 4 2 3 101
8 Service & supply handlers 53 28 11 4 1 3 100
9 Nonoccupational 72 14 4 4 3 4 101
Total AC enlisted personnel 62 20 10 4 1 3 100
Page 32 GAO-05-952 Military Demographics

Demographic Characteristics of
Servicemembers
• infantry, gun crews, and seamanship (69 percent) and electronic equipment repair (69 percent); and communications and intelligence specialists (67 percent), other technical and allied specialists (67 percent), and electrical/mechanical equipment repairers (67 percent).
• The occupational areas with the highest concentrations of AC African American enlisted personnel are:
• functional support and administration (34 percent),
• service and supply handlers (28 percent), and
• health care specialists (25 percent).
• The occupational areas with the highest concentrations of AC Hispanic enlisted personnel are:
• functional support and administration (12 percent), and
• infantry, gun crews, and seamanship (11 percent); health care specialists (11 percent); and service and supply handlers (11 percent).
• The racial/ethnic composition of enlisted occupational areas reflects both servicemembers’ preferences and eligibility, as determined by, for example, the Armed Services Vocational Aptitude Battery test score or other requirements.
Page 33 GAO-05-952 Military Demographics

Demographic Characteristics of
Servicemembers
1B. Race and Ethnicity—Active Component Officer Occupational Areas
Table 13: Percent of AC Officers in Each Racial/Ethnic Subgroup and DOD Occupational Area as of December 31, 2004
Legend: N.E.C. = Not elsewhere classified.
Source: GAO analysis of DOD-provided data.
Notes: Nonoccupational area includes patients, students, those with unassigned duties, and unknowns. Rows may not total 100 percent due to rounding.
• Table 13 shows that among AC officers, the occupational areas with the highest concentrations of Whites are:
• general officers and executives not elsewhere classified (91 percent),
• tactical operations officers (85 percent), and
• scientists and professionals (83 percent).
DOD officer occupational codes and areas
Racial/Ethnic subgroup
TotalWhiteAfrican
American Hispanic
AsianAmerican/
PacificIslander
American Indian/
AlaskanNative
Other/Unknown
1 General officers & executives N.E.C. 91 5 2 <1 <1 2 100
2 Tactical operations officers 85 5 5 2 <1 3 100
3 Intelligence officers 79 8 5 3 <1 4 99
4 Engineering and maintenance officers 74 13 5 3 <1 4 99
5 Scientists & professionals 83 7 4 3 <1 3 100
6 Health care officers 76 9 4 5 <1 5 99
7 Administrators 69 17 6 2 <1 4 98
8 Supply, procurement, & allied officers 69 17 6 3 <1 4 99
9 Nonoccupational 78 5 5 3 <1 9 100
Total AC officers 79 9 5 3 <1 4 100
Page 34 GAO-05-952 Military Demographics

Demographic Characteristics of
Servicemembers
• The occupational areas with the highest concentrations of AC African Americans are:
• administrators (17 percent), and supply, procurement, and allied officers (17 percent); and
• engineering and maintenance officers (13 percent).
• The representation of Hispanics and Asian Americans/Pacific Islanders in each occupational area except general officers and executives is within 2 percentage points of their average representation within the AC officer corps.
Page 35 GAO-05-952 Military Demographics

Demographic Characteristics of
Servicemembers
1B. Race and Ethnicity—Reserve Component Occupational Categories
Table 14: Percent of RC Enlisted Personnel in Each Racial/Ethnic Subgroup and DOD Occupational Area as of December 31, 2004
Source: GAO analysis of DOD-provided data.
Notes: Nonoccupational area includes patients, students, those with unassigned duties, and unknowns. Rows may not total 100 percent due to rounding.
DOD enlisted occupational codes and areas
Racial/Ethnic subgroup
TotalWhiteAfrican
American Hispanic
AsianAmerican/
PacificIslander
American Indian/
AlaskanNative
Other/Un-
known
0 Infantry, gun crews, & seamanship 75 11 8 2 1 2 99
1 Electronic equipment repairers 72 13 8 3 1 3 100
2 Communications & intelligence specialists 75 11 8 3 1 3 101
3 Health care specialists 62 21 10 4 1 3 101
4 Other technical & allied specialists 72 15 9 2 1 2 101
5 Functional support & administration 57 27 10 3 1 3 101
6 Electrical/mechanical equipment repairers 73 13 9 2 1 2 100
7 Craftsworkers 72 14 8 2 1 3 100
8 Service & supply handlers 63 22 10 2 1 2 100
9 Nonoccupational 70 14 9 4 1 3 101
Total RC enlisted personnel 68 17 9 3 1 3 101
Page 36 GAO-05-952 Military Demographics

Demographic Characteristics of
Servicemembers
Table 15: Percent of RC Officers in Each Racial/Ethnic Subgroup and DOD Occupational Area as of December 31, 2004
Legend: N.E.C. = Not elsewhere classified.
Source: GAO analysis of DOD-provided data.
Notes: Nonoccupational area includes patients, students, those with unassigned duties, and unknowns. Rows may not total 100 percent due to rounding.
• In tables 14 and 15, the distribution of Hispanic, Asian American/Pacific Islander, and American Indian/Alaskan Native enlisted personnel and officers in each occupational area is within 2 percentage points of their overall distribution within the RC.
• In contrast, compared to their overall representation in the RC, White enlisted personnel are more often found in the infantry, gun crews, and seamanship occupational area; White officers are more often found in the general officer and executive occupational area.
• Relative to their overall representation in the RC, African American enlisted personnel were less often found in the infantry, gun crews, and seamanship and more often found in functional support and administration and service and supply handler occupational areas. African American officers were more often found in the administrator and supply, procurement, and allied officer occupational areas.
DOD officer occupational codes and area
Racial/Ethnic subgroup
TotalWhiteAfrican
American Hispanic
AsianAmerican/
PacificIslander
American Indian/
AlaskanNative
Other/Un-
known
1 General officers & executives N.E.C. 92 3 3 1 <1 2 101
2 Tactical operations officers 87 4 4 2 <1 3 100
3 Intelligence officers 81 5 4 3 <1 6 99
4 Engineering and maintenance officers 79 11 5 3 <1 3 101
5 Scientists & professionals 84 7 4 2 <1 3 100
6 Health care officers 75 12 5 3 <1 4 99
7 Administrators 73 16 6 2 1 3 101
8 Supply, procurement, & allied officers 73 16 6 2 1 3 101
9 Nonoccupational 78 10 5 3 <1 4 100
Total RC officers 80 9 4 2 <1 3 98
Page 37 GAO-05-952 Military Demographics

Demographic Characteristics of
Servicemembers
1C. Gender—Component Composition
Figure 2: Percent of Males and Females in Each Component and among Employed Civilians
• Overall, 16 percent of the military is female: 15 percent of the AC and 17 percent of the RC (see fig. 2).
• The Marine Corps Reserve has the lowest representation of women (5 percent).
• The Army Reserve (24 percent) and Air Force Reserve (23 percent) have the highest representations of women.
• The National Defense Authorization Acts of fiscal years 1992, 1993, and 1994 enabled women to be permanently assigned to combat aircraft and combatant ships. Since 1994, DOD policy has allowed women to be assigned to any unit except those below the brigade level whose primary
0 10 20 30 40 50 60 70 80 90 100
Marine Corps Reserve
Active Marine Corps
Army Guard
Active Navy
Active Army
Air National Guard
Active Air Force
Navy Reserve
Air Force Reserve
Army Reserve
Source: GAO analysis of DOD-provided data on servicemembers as of December 31, 2004 and the March 2004 CurrentPopulation Survey which reflects civilians employment status in March 2003.
Percent
21
19
18
14
14
13
6
5
24
23
79
81
82
86
86
87
94
95
76
77
AC15% 48%17%
U.S.RC
Females
Males
Page 38 GAO-05-952 Military Demographics

Demographic Characteristics of
Servicemembers
mission is to engage in direct combat on the ground. (See app. IV for occupations which exclude females.)
• GAO and RAND estimated that the combat exclusion policy results in women being excluded from about 15 percent to 20 percent of all military positions. These positions are in units such as infantry, special forces, and units such as Army ground surveillance radar units that collocate with direct ground combat units.4
4GAO, Gender Issues: Information on DOD’s Assignment Policy and Direct Ground
Combat Definition, GAO/NSIAD-99-7 (Washington, D.C.: Oct. 1998) and Margaret C. Harrell and Laura L. Miller, New Opportunities for Military Women, Effects Upon Readiness,
Cohesion, and Morale, RAND MR-896-OSD (Washington, D.C.: 1997).
Page 39 GAO-05-952 Military Demographics
Demographic Characteristics of
Servicemembers
1C. Gender—Component Racial/Ethnic and Gender Composition
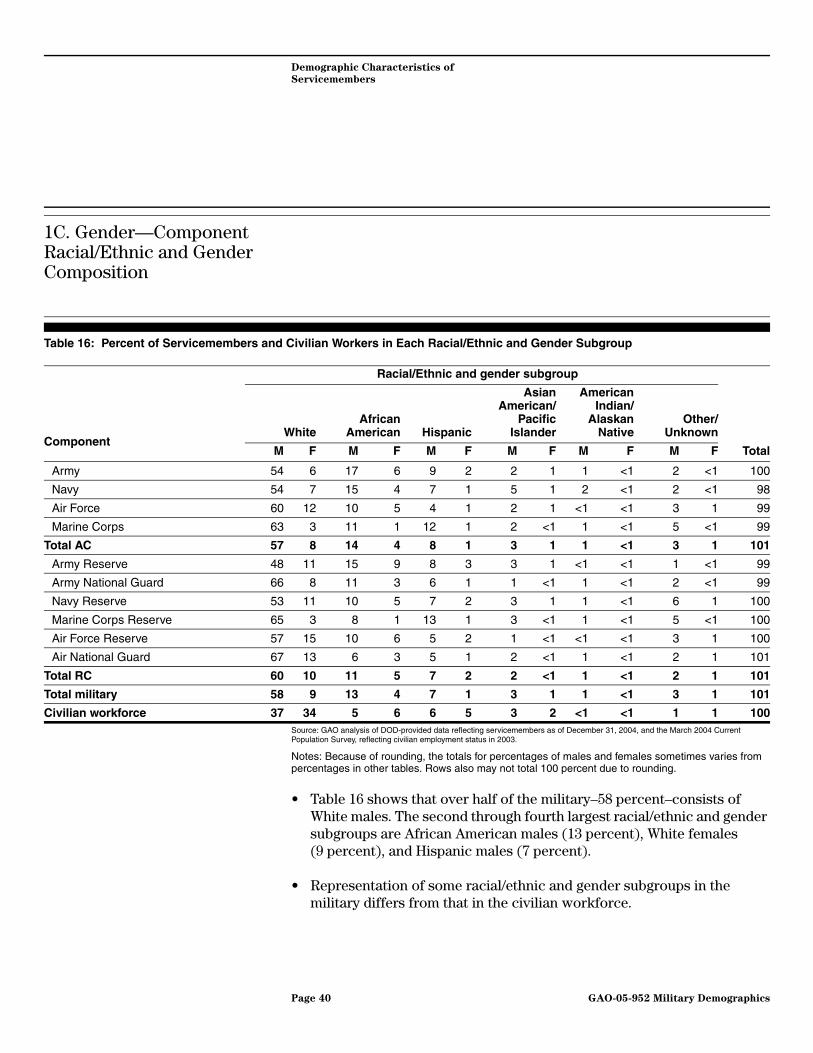
Table 16: Percent of Servicemembers and Civilian Workers in Each Racial/Ethnic and Gender Subgroup
Source: GAO analysis of DOD-provided data reflecting servicemembers as of December 31, 2004, and the March 2004 Current Population Survey, reflecting civilian employment status in 2003.
Notes: Because of rounding, the totals for percentages of males and females sometimes varies from percentages in other tables. Rows also may not total 100 percent due to rounding.
• Table 16 shows that over half of the military–58 percent–consists of White males. The second through fourth largest racial/ethnic and gender subgroups are African American males (13 percent), White females(9 percent), and Hispanic males (7 percent).
• Representation of some racial/ethnic and gender subgroups in the military differs from that in the civilian workforce.
Component
Racial/Ethnic and gender subgroup
Total
WhiteAfrican
American Hispanic
AsianAmerican/
PacificIslander
AmericanIndian/
AlaskanNative
Other/Unknown
M F M F M F M F M F M F
Army 54 6 17 6 9 2 2 1 1 <1 2 <1 100
Navy 54 7 15 4 7 1 5 1 2 <1 2 <1 98
Air Force 60 12 10 5 4 1 2 1 <1 <1 3 1 99
Marine Corps 63 3 11 1 12 1 2 <1 1 <1 5 <1 99
Total AC 57 8 14 4 8 1 3 1 1 <1 3 1 101
Army Reserve 48 11 15 9 8 3 3 1 <1 <1 1 <1 99
Army National Guard 66 8 11 3 6 1 1 <1 1 <1 2 <1 99
Navy Reserve 53 11 10 5 7 2 3 1 1 <1 6 1 100
Marine Corps Reserve 65 3 8 1 13 1 3 <1 1 <1 5 <1 100
Air Force Reserve 57 15 10 6 5 2 1 <1 <1 <1 3 1 100
Air National Guard 67 13 6 3 5 1 2 <1 1 <1 2 1 101
Total RC 60 10 11 5 7 2 2 <1 1 <1 2 1 101
Total military 58 9 13 4 7 1 3 1 1 <1 3 1 101
Civilian workforce 37 34 5 6 6 5 3 2 <1 <1 1 1 100
Page 40 GAO-05-952 Military Demographics

Demographic Characteristics of
Servicemembers
• White males are 58 percent of the military compared to 37 percent of civilian workers. In contrast, African American males are 13 percent of the military compared to 5 percent of civilian workers.
• White females are 9 percent of the military compared to 34 percent of civilian workers. In contrast, Hispanic females are 1 percent in the military compared to 5 percent of civilian workers.
• All other differences between military and civilian workforce representation are 2 percentage points or less.
• Compared to the other components, the Army Reserve has the largest percentage (52 percent) of its servicemembers who are other than White males.
Page 41 GAO-05-952 Military Demographics

Demographic Characteristics of
Servicemembers
1C. Gender—Racial/Ethnic Composition of Female Servicemembers
Table 17: Distribution of Race/Ethnicity Among Female Servicemembers and Civilians
Source: GAO analysis of DOD-provided data reflecting servicemembers as of December 31, 2004, and the March 2004 Current Population Survey reflecting civilian employment status in 2003.
Notes: 350,278 female AC and Selected Reserve servicemembers and 42,004,449 (weighted) female civilian workforce participants were included in this analysis. Rows may not total 100 percent due to rounding.
• Minority racial/ethnic females comprise 46 percent of all female servicemembers, compared to 29 percent of all employed civilian females (see table 17).
• African American females participate in the military at a rate more than twice their civilian workforce participation. Twenty-eight percent of female servicemembers are African Americans compared to 13 percent of female civilian workers.
Component (percent of the entire component that is female)
Racial/Ethnic subgroup
TotalWhiteAfrican
American Hispanic
AsianAmerican/
PacificIslander
AmericanIndian/
AlaskanNative
Other/Un-
known
Army (14%) 42 39 11 4 1 3 100
Navy (14%) 52 28 9 5 3 3 100
Air Force (19%) 61 23 6 3 1 6 100
Marine Corps (6%) 54 18 18 3 2 6 101
AC females (15%) 52 30 9 4 2 4 101
Army Reserve (24%) 47 36 11 4 1 1 100
Army National Guard (23%) 62 25 8 2 1 2 100
Navy Reserve (21%) 55 24 10 3 1 7 100
Marine Corps Reserve (5%) 59 15 16 5 1 4 100
Air Force Reserve (23%) 63 24 7 2 <1 4 100
Air National Guard (18%) 73 15 6 3 1 3 101
RC females (17%) 58 27 9 3 1 3 101
Female servicemembers (16%) 54 28 9 3 1 3 98
Females in the civilian workforce (48%) 71 13 10 5 <1 1 100
Page 42 GAO-05-952 Military Demographics

Demographic Characteristics of
Servicemembers
• The proportion of military females who are Hispanic (9 percent) is similar to the proportion of civilian females who are Hispanic (10 percent).
• The representation of racial/ethnic minorities among female servicemembers varies by component.
• The active Army (58 percent) and Army Reserve (53 percent) have the highest proportions of racial/ethnic minorities among their female personnel.
• In contrast, the Air National Guard (27 percent) has the lowest proportion of racial/ethnic minorities among its female personnel.
• Except for their lower representation in both Marine Corps components and the Air National Guard, African American females comprise 23 percent to 39 percent of female servicemembers in each of the other components.
Page 43 GAO-05-952 Military Demographics

Demographic Characteristics of
Servicemembers
1C. Gender—Active Component Occupational Areas and Gender
Table 18: Representation of AC Females across and within Enlisted Occupational Areas as of December 31, 2004
Source: GAO analysis of DOD-provided data.
Note: The nonoccupational area includes patients, students, those with unassigned duties, and unknowns. The second column does not total 100 percent because of rounding.
Table 19: Representation of AC Females across and within Officer Occupational Areas as of December 31, 2004
DOD enlisted occupational codes and areas Percent of occupational area
that is femalePercent of females in the military who are
in the occupational area
0 Infantry, gun crews, & seamanship 4 5
1 Electronic equipment repairers 9 5
2 Communications & intelligence specialists 16 10
3 Health care specialists 34 16
4 Other technical & allied specialists 16 3
5 Functional support & administration 31 33
6 Electrical/mechanical equipment repairers 6 9
7 Craftsworkers 7 2
8 Service & supply handlers 17 11
9 Nonoccupational 13 5
Total 15 99
DOD officer occupational codes and areasPercent of occupational area
that is femalePercent of females in the military who are
in the occupational area
1 General officers & executives N.E.C. 4 <1
2 Tactical operations officers 5 11
3 Intelligence officers 18 6
4 Engineering and maintenance officers 13 12
5 Scientists & professionals 15 5
6 Health care officers 36 37
7 Administrators 28 11
8 Supply, procurement, & allied officers 19 11
9 Nonoccupational 10 4
Total 15 97
Page 44 GAO-05-952 Military Demographics

Demographic Characteristics of
Servicemembers
Legend: N.E.C. = Not elsewhere classified.
Source: GAO analysis of DOD-provided data.
Notes: The nonoccupational area includes patients, students, those with unassigned duties, and unknowns. The second column does not total 100 percent because of rounding.
• The first columns in tables 18 and 19 show that although female servicemembers constitute 15 percent of the AC military, AC females are concentrated in health care and administrative occupations.
• The enlisted occupational areas with the highest concentrations of female servicemembers are health care specialists (34 percent) and functional support and administration (31 percent).
• The officer occupational areas with the highest concentrations of females are health care officers (36 percent) and administrators (28 percent).
• The second columns in tables 18 and 19 show that when data on only females are examined, the enlisted occupational areas with the largest female representation are functional support and administration (33 percent) and health care specialists (16 percent), and the officer occupational area is health care officers (37 percent).
• Overall, females are excluded from 178 enlisted occupational specialties (5 percent of all enlisted occupational specialties), mostly in infantry, gun crew, and seamanship; electronic equipment repairers; and electrical/mechanical equipment repairers occupational areas (see app. IV). Females are excluded from 17 officer specialties (less than 1 percent of all officer specialties).
Page 45 GAO-05-952 Military Demographics

Demographic Characteristics of
Servicemembers
1C. Gender—Reserve Component Occupational Areas and Gender
Table 20: Representation of RC Females across and within Enlisted Occupational Areas as of December 31, 2004
Source: GAO analysis of DOD-provided data.
Notes: The nonoccupational area includes patients, students, those with unassigned duties, and unknowns. The second column does not total 100 percent because of rounding.
DOD enlisted occupational codes and areas Percent of occupational areathat is female
Percent of females in the military whoare in the occupational area
0 Infantry, gun crews, & seamanship 5 6
1 Electronic equipment repairers 10 3
2 Communications & intelligence specialists 12 4
3 Health care specialists 37 13
4 Other technical & allied specialists 17 3
5 Functional support & administration 36 41
6 Electrical/mechanical equipment repairers 7 6
7 Craftsworkers 8 3
8 Service & supply handlers 17 12
9 Nonoccupational 21 10
Total 17 101
Page 46 GAO-05-952 Military Demographics

Demographic Characteristics of
Servicemembers
Table 21: Representation of RC Females across and within Officer Occupational Areas as of December 31, 2004
Legend: N.E.C. = Not elsewhere classified.
Source: GAO analysis of DOD-provided data.
Notes: The nonoccupational area includes patients, students, those with unassigned duties, and unknowns. The second column does not total 100 percent because of rounding.
• Like their AC counterparts, RC female servicemembers are also concentrated in health care and administrative occupations (see tables 20 and 21).
• The enlisted occupational areas with the greatest concentrations of females are health care specialists (37 percent) and functional support and administration (36 percent).
• The officer occupational areas with the greatest concentrations of females are health care officers (42 percent) and administrators (32 percent).
• Also like their AC peers, when data on only females are considered, the enlisted occupational area with the greatest concentration of female enlisted personnel is functional support and administration (41 percent). The officer occupational area with the greatest concentration of female personnel is health care officers (46 percent).
DOD officer occupational codes and areasPercent of occupational area
that is femalePercent of females in the military who
are in the occupational area
1 General officers & executives N.E.C. 4 <1
2 Tactical operations officers 3 6
3 Intelligence officers 19 6
4 Engineering and maintenance officers 12 8
5 Scientists & professionals 13 5
6 Health care officers 42 46
7 Administrators 32 14
8 Supply, procurement, & allied officers 20 11
9 Nonoccupational 13 3
Total 18 99
Page 47 GAO-05-952 Military Demographics

Demographic Characteristics of
Servicemembers
1D. Age
Figure 3: Percentage of the AC, RC, and U.S. Population in Age Categories
Note: The chart for the U.S. population omits the 21 percent of the U.S. population under 15 years of age and the 7 percent of the U.S. population 75 years of age or older.
• Figure 3 shows that overall, 69 percent of AC and 49 percent of RC servicemembers are between the ages of 20 and 34, compared to 21 percent of the U.S. population.
• The RC has five times the proportion of older servicemembers as the AC—15 percent of the RC compared to 3 percent of the AC is at least 45 years of age.
• The ages of AC servicemembers ranged from 17-73 and their average age was 28.3 years.
0
10
20
30
40
50
60
70
80
90
100
45+35-4425-3420-2417-19
Percentage
Years of age Years of age
Reserve component
Active component
6
21
34
7
28
35
20
29
U.S. population
Source: GAO analysis of DOD-provided data relfecting servicemember age as ofDecember 31, 2004, and decennial census reflecting the age of the U.S. population in 2000.
0
10
20
30
40
50
60
70
80
90
100
46-7435-4425-3420-2415-19
20
29
77
14
16
29
Page 48 GAO-05-952 Military Demographics
Demographic Characteristics of
Servicemembers
• In comparison, RC servicemembers ranged from 17-67 years of age, and their average age was 33.2 years.
• Civilians aged 18-49 analyzed from the Current Population Survey to whom we compared servicemembers had an average age of 34.3 years.
Page 49 GAO-05-952 Military Demographics

Demographic Characteristics of
Servicemembers
1E. Education
Table 22: Percentage of Servicemembers and Employed Civilians in Educational Categories
Sources: GAO analysis of DOD-provided data reflecting servicemember education as of December 31, 2004. Data for employed U.S. population 18 years of age and older from Table 5a, Educational Attainment of Civilians 16 Years and Over by Labor Force Status, Age, Sex, Race, and Hispanic Origin: 2004, Current Population Survey, U.S. Census Bureau, http://census.gov, downloaded July 26, 2005.
• Proportionately more servicemembers than employed persons in the U.S. population aged 18 and older had earned a high school diploma or its equivalent (see table 22).
• Four percent of AC servicemembers and 7 percent of RC servicemembers did not have a high school diploma or its equivalent.
• In contrast, 10 percent of employed persons in the U.S. population aged 18 and older did not have a high school diploma or its equivalent.
Highest educational attainment for servicemembers
Component
AC RC
Unknown 3 3
Less than high school 1 4
High school equivalency 4 4
High school diploma 68 51
Some college 7 16
Baccalaureate degree 11 15
Graduate degree 6 7
Total servicemembers 100 100
Highest educational attainment for employed U.S. population 18 years of age and older
Less than high school 10
High school diploma or equivalency 30
Some college 29
Baccalaureate degree 20
Graduate degree 10
Total employed U.S. population 18 years of age and older 99
Page 50 GAO-05-952 Military Demographics

Demographic Characteristics of
Servicemembers
• Although 24 percent of AC servicemembers had at least some college education, 38 percent of RC servicemembers were comparably educated.
• In general, employed civilians had more postsecondary school educational attainment than either AC or RC servicemembers. About 59 percent of employed persons in the U.S. population aged 18 and older compared to 24 percent of the AC and 38 percent of the RC had at least some college education.
Page 51 GAO-05-952 Military Demographics

Demographic Characteristics of
Servicemembers
1F. Citizenship and Country of Birth
Figure 4: Percent of Servicemembers and Civilians in Three Citizenship Subgroups in 2004
Note: Non-U.S. citizens are those who owe permanent allegiance to the United States, such as persons born in American Samoa or the Swains Island.
• Compared to the comparable civilian workforce, the military has proportionately fewer non-U.S. citizens or nationals (see fig. 4). Two percent of the AC and RC (over 40,000 servicemembers) are non-U.S. citizens compared to about 7 percent of civilian workers.
1%Citizen data missing
2%Noncitizens and nationals
97%•
U.S. citizens (by birth ornaturalization)
Source: GAO analysis of DOD-provided data reflecting servicemembers as of December 31, 2004and the March 2004 Current Population Survey, reflecting civilian employment status in March 2003.
7%Noncitizensand nationals
•
•93%
U.S. citizens (by birth ornaturalization)
Military Civilian
The top countries of birth of servicememberswho are non-U.S. citizens or nationals
Philippines (12%)Unknown (39%)United Sates (8%)Mexico (7%)Jamaica (3%)
The five countries of birth of civilianswho are non-U.S. citizens or nationals
Mexico (26%)India (7%)Philippines (4%)China (4%)Elsewhere (4%)
Page 52 GAO-05-952 Military Demographics

Demographic Characteristics of
Servicemembers
• Thirty-nine percent (about 19,500) of all servicemembers who were not U.S. citizens or nationals had “unknown” for the country of birth in their personnel record, and most (almost 15,500) were in the RC.
• DOD records also showed that the personnel records of 12 percent of the noncitizens and nationals (almost 4,200 servicemembers) indicated their country of birth was the United States. This finding was surprising because persons born in the United States are U.S. citizens, and it could not be explained by DOD officials.
• In Executive Order 13269 issued July 3, 2002, the President exempted aliens and noncitizen nationals, serving honorably in an active duty status on September 11, 2001, or thereafter, from the usual requirements for becoming a citizen (for example, the number of years an individual must wait between applying and receiving citizenship). By Spring 2005, DOD officials reported that over 20,000 military personnel had become citizens since September 11, 2001, and that DOD was processing 5,000 more applications for citizenship.5
5Statement of Under Secretary of Defense for Personnel and Readiness, David S.C. Chu, before the Senate Armed Services Personnel Subcommittee on April 5, 2005.
Page 53 GAO-05-952 Military Demographics

Recruiting
Question 2 and Summary of Approach
How well are the services meeting their recruitment goals, and what influences whether or not individuals join the military?
We reviewed recent GAO, DOD, and others’ studies and data on enlistment goals and rates, recruiting, and the factors that shape youths’ intentions to join the military. To identify changes in the demographic make-up of new servicemembers, we obtained and analyzed data on servicemembers who had 1 year or less of military service and examined DOD analyses of recruits’ socioeconomic status and home community. We also met with DOD and service representatives to discuss trends in recruiting and factors affecting the Army’s ability to recruit. Finally, we reviewed the economic and educational incentives available to recruits. Although we discuss findings for both enlisted personnel and officers, we primarily focus on the former because enlisted personnel comprise 84 percent of all servicemembers.
Summary of Findings
2A. Recruiting overview For fiscal years 2000 through 2003, the AC annually accessed about 176,400 to about 183,000 nonprior-service enlisted personnel and about 17,500 to about 21,500 officers.
2B. Achieving enlisted recruiting goals
Over the past decade, the AC met its recruiting goals more frequently than did the RC.
• Over the past decade, some components, particularly in the Army, have less frequently met their enlisted recruiting goals than have other components.
• DOD estimates that over half of the youth in the U.S. population between the ages of 16 and 21 do not meet the minimum requirements for enlistment.
• Personal, demographic, family, and societal factors influence youths’ enlistment decisions.
Page 54 GAO-05-952 Military Demographics

Recruiting
2C. Recruit characteristics Since fiscal year 2000, the proportion of recruits who are African Americans has declined, while the proportion of Hispanic recruits has increased. Recruits tend to be disproportionately from the middle class and from Southern and Western regions of the United States.
2D. Enlistment incentives The military has increased its educational and economic incentives in an attempt to meet its recruiting goals.
Page 55 GAO-05-952 Military Demographics

Recruiting
Findings
2A. Recruiting Overview • Congress mandates the services’ endstrengths. The National Defense Authorization Act for Fiscal Year 2005 established the following AC endstrengths:
• Army—512,400,
• Navy—365,900,
• Marine Corps—178,000, and
• Air Force—359,700.
• Additionally, the National Defense Authorization Act for Fiscal Year 2005 authorized the Secretary of Defense to increase the authorized end strengths of the active Army and active Marine Corps by an additional 10,000 and 6,000, respectively, to support the operations in Iraq and Afghanistan.
• In fiscal year 2004, the Army achieved its accession goal in part by drawing from its delayed entry program, a pool of individuals who have signed a contract to join the military at a future date up to 1 year in advance. Typically, the Army likes to have 35 percent of its annual accession goal in the delayed entry program, but by the end of fiscal year 2004, the delayed entry program had been reduced to 18 percent of the Army’s annual accession goal.
Page 56 GAO-05-952 Military Demographics

Recruiting
• Enlisted and officer recruiting differ partly because the accession of enlisted personnel is typically more immediate than the accession of most officers. The two major officer accession programs—the military academies1 and Reserve Officers’ Training Corps—take up to 4 years to produce newly commissioned officers. The military fulfills its remaining requirements for officers through Officer Candidate School and Officer Training School. Consequently, today’s policy decisions on officer recruiting shape the future availability of officers and depend on the extent to which retention rates and the need for officers are accurately forecasted.2
1See GAO, Military Education: DOD Needs to Enhance Performance Goals and Measures
to Improve Oversight of Military Academies, GAO-03-1000 (Washington, D.C.: Sept. 10, 2003) for information on the military academies.
2Lawrence Kapp, Recruiting and Retention: A Brief Overview of Fiscal Year 2004 and
Fiscal Year 2005 for Active Duty Enlisted Personnel, Congressional Research Service (Washington, D.C.: March 2005).
Page 57 GAO-05-952 Military Demographics
Recruiting
2A. Recruiting Overview—Active Component
• AC enlisted accessions—Each year for fiscal years 2000 through 2004, the AC accessed approximately 176,400 to 183,000 nonprior-service enlisted recruits.
• More of these accessions joined the Army than any other service:
• 39 to 43 percent joined the Army,
• 22 to 27 percent joined the Navy,
• 17 to 20 percent joined the Air Force, and
• 16 to 18 percent joined the Marine Corps.
• In fiscal year 2004, all active components met their goal.
• AC officer accessions—Each fiscal year from 2000 through 2003, about 17,500 to 21,500 officers were accessed into the AC.
• The percentage of officers accessed by each service is as follows:
• 30 to 34 percent joined the Army,
• 31 to 37 percent joined the Air Force,
• 22 to 29 percent joined the Navy, and
• 7 to 9 percent joined the Marine Corps.
• In fiscal year 2004, the active services accessed over 16,400 officers to active duty. Only the Air Force, with its shortfall of 12 percent (comprised mostly of medical specialty direct appointments), missed its commissioned officer recruiting goal that year.3
• Active duty officers and enlisted personnel are required to be available to serve for 8 years, although some of that service may be in a reserve component.
3Statement of Under Secretary of Defense for Personnel and Readiness, David S.C. Chu, before the Senate Armed Services Personnel Subcommittee, April 5, 2005, p 20.
Page 58 GAO-05-952 Military Demographics

Recruiting
Page 59 GAO-05-952 Military Demographics

Recruiting
2A. Recruiting Overview—Reserve Component
• RC enlisted accessions—Each year for fiscal years 2000 through 2004, the RC accessed about 118,000 to 153,000 enlisted personnel.
• More of these accessions joined the Army National Guard and Army Reserve than any other service.
• 40 to 44 percent joined the Army National Guard,
• 25 to 32 percent joined the Army Reserve,
• 10 to 11 percent joined the Navy Reserve,
• 6 to 7 percent joined the Marine Corps Reserve,
• 6 to 7 percent joined the Air National Guard, and
• 5 to 8 percent joined the Air Force Reserve.
• In fiscal year 2004, the components accessed about 118,000 enlisted personnel to the RC, and all components except the Army National Guard and Air National Guard met their goal.
• 41 percent joined the Army National Guard,
• 28 percent joined the Army Reserve,
• 10 percent joined the Navy Reserve,
• 8 percent joined the Air Force Reserve,
• 7 percent joined the Marine Corps Reserve, and
• 7 percent joined the Air National Guard.
Page 60 GAO-05-952 Military Demographics

Recruiting
• One difference between AC and RC recruiting is that the latter relies heavily on recruits who have prior military service. An official in the Office of the Secretary of Defense for Reserve Affairs told us that currently, about 63 percent of the RC has prior military experience. For example,
• In fiscal year 2003, 52 percent of Air National Guard accessions had prior military service.4
• In fiscal year 2004, at least one-quarter of Marine Corps Reserve recruits had prior military service.5
• Historically, about 25 percent of active duty servicemembers leaving the Air Force enter the Air Force Reserve, accounting for a significant portion of Air Force Reserve accessions.6
4Statement of Lieutenant General Daniel James III, Director, Air National Guard, before the Senate Armed Services Personnel Subcommittee, April 13, 2005.
5Statements of Lieutenant General Dennis M. McCarthy, Commander, Marine Forces Reserve, before the Senate Armed Services Personnel Subcommittee on April 13, 2005, and Lieutenant General H.P. Osman, Deputy Commandant for Manpower and Reserve Affairs, United States Marine Corps Reserve, before the Senate Armed Services Personnel Subcommittee, April 5, 2005.
6Statement of Lieutenant General John A. Bradley, Chief of Air Force Reserve, before the Senate Armed Services Personnel Subcommittee, April 13, 2005.
Page 61 GAO-05-952 Military Demographics

Recruiting
2A. Recruiting Overview—Reserve Component
Stop-loss is a policy instituted by the services that requires military personnel to remain in the service beyond the end of their obligation.7 Because it reduces the number of prior service recruits available to join the RC at a given point in time and because many entering the RC have prior military service, stop-loss has been cited as a factor particularly affecting the reserve components’ ability to meet recruitment goals.
• The Air Force was the first to issue a stop-loss in the aftermath of the September 11th attack, although this has since ended.
• The Army is the only service with stop-loss currently in effect, and the Army’s Deputy Chief of Staff for Personnel testified in April 2005 that, during January 2005, the stop-loss program affected 12,353 servicemembers in the Army’s active and reserve components. The Army’s current unit-based (rather than being driven by occupational specialty) stop-loss policy for its reserve components has remained continuously in effect since it was instituted in 2001.8
• Although the reserve components rely partly on recruits with prior military service to meet their recruiting goals, the Under Secretary of Defense for Personnel and Readiness noted in April 2005 that because of high AC retention, increasing percentages of RC recruits had no prior military service and that “approximately 50 percent are now expected to come directly from civilian life.”
7Stop-loss authority is provided by 10 U.S.C. §12305. For a description of the services’ implementation of stop-loss after September 11, 2001, see app. VI in Military Personnel:
DOD Needs to Address Long-term Reserve Force Availability and Related Mobilization
and Demobilization Issues, GAO 04-1031 (Washington, D.C.: Sept. 15, 2004).
8See GAO 04-1031.
Page 62 GAO-05-952 Military Demographics

Recruiting
Page 63 GAO-05-952 Military Demographics

Recruiting
2B. Achieving Enlisted Recruiting Goals—Performance in Fiscal Years 1995 to 2004
Figure 5: AC and RC Achievement of Enlisted Recruiting Goals for Fiscal Years 1995 through 2004
• Figure 5 shows that over the past 10 years, the AC has met its enlisted recruiting goals more frequently than the RC.
• Except for 2 years in the late 1990s, a period of low unemployment and economic expansion, the AC met its recruiting goals.
• The RC did not meet its goals for 6 of the past 10 years.
• DOD researchers reported that events, such as the war in Iraq and increased operational tempo, have made meeting recruiting goals more difficult.
• In April 2005 testimony to the Military Personnel Subcommittee of the Senate Armed Services Committee, the Assistant Secretary of Defense
Percent of enlisted recruiting goal achieved
1995 1996 1997 1998 1999 2000 2001 2002 2003 2004
Year
Reserve components
Active components
Source: DMDC Information Delivery System.
88
98
100
100
105
101
101
101
102
96
96
97100
102
98
100
96
101
96
101
0
100
120
90
110
Page 64 GAO-05-952 Military Demographics

Recruiting
for Reserve Affairs said that although the RC was having difficulty meeting its recruiting objectives, reserve reenlistments in fiscal year 2004 were slightly higher than in previous fiscal years.
• Also, the components typically start a new fiscal year with youth who have already signed enlistment contracts and have agreed to delay entry into the military until a later time. Overcoming monthly recruiting deficits may require that components acquire recruits from the delayed entry program. The reduction in the size of the delayed entry program may result in insufficient numbers of recruits being available in future months.
Page 65 GAO-05-952 Military Demographics
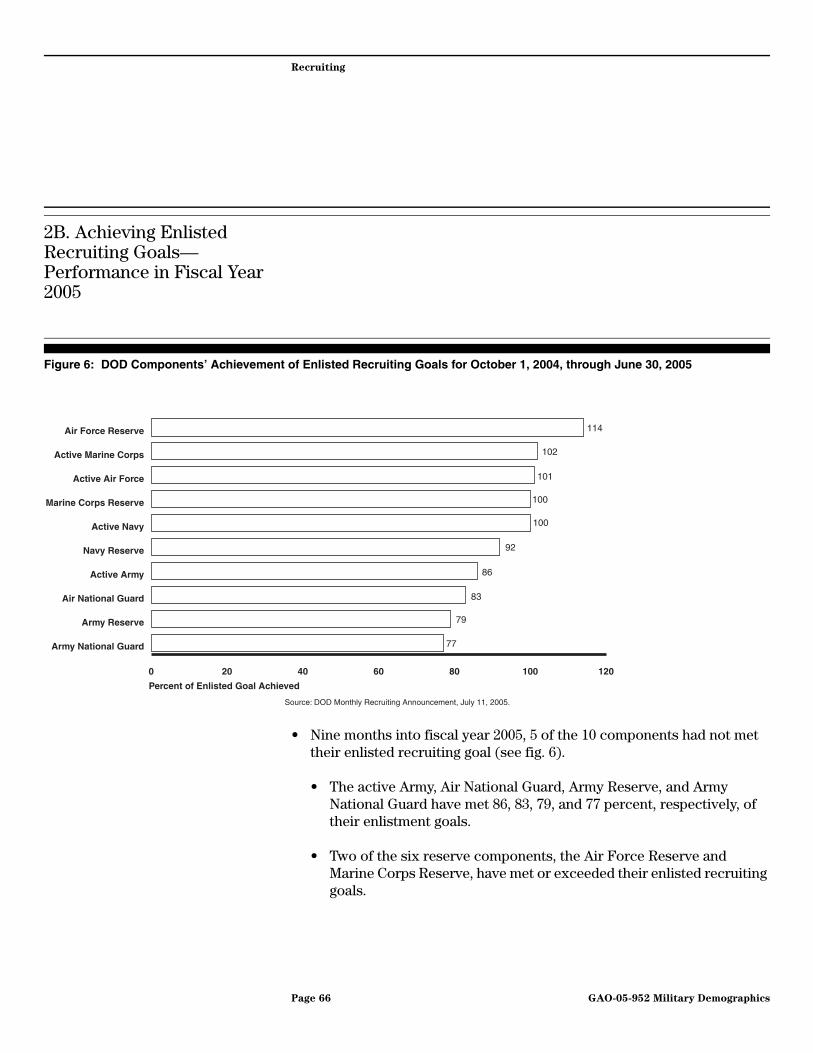
Recruiting
2B. Achieving Enlisted Recruiting Goals—Performance in Fiscal Year 2005
Figure 6: DOD Components’ Achievement of Enlisted Recruiting Goals for October 1, 2004, through June 30, 2005
• Nine months into fiscal year 2005, 5 of the 10 components had not met their enlisted recruiting goal (see fig. 6).
• The active Army, Air National Guard, Army Reserve, and Army National Guard have met 86, 83, 79, and 77 percent, respectively, of their enlistment goals.
• Two of the six reserve components, the Air Force Reserve and Marine Corps Reserve, have met or exceeded their enlisted recruiting goals.
0 20 40 60 80 100 120
Army National Guard
Army Reserve
Air National Guard
Active Army
Navy Reserve
Active Navy
Marine Corps Reserve
Active Air Force
Active Marine Corps
Air Force Reserve
Source: DOD Monthly Recruiting Announcement, July 11, 2005.
Percent of Enlisted Goal Achieved
114
101
102
100
100
86
92
83
77
79
Page 66 GAO-05-952 Military Demographics

Recruiting
• DOD found that the public’s perceptions about military enlistment has changed and that youth and their parents believe that deployment to a hostile environment is very likely for some types of servicemembers. Officials also said that fear of death and serious injury is an increasingly important factor affecting potential recruits’ decisions about whether they will join.
Page 67 GAO-05-952 Military Demographics

Recruiting
2B. Achieving Enlisted Recruiting Goals—Youth Ineligibility
• DOD researchers have estimated that over half of U.S. youth aged 16 to 21 could be ineligible to join the military because they cannot meet DOD or service entry standards.9 DOD accession officials stated that inability to meet medical and physical requirements accounts for much of the ineligibility among youth.
• DOD Directive 1304.26 establishes the educational, aptitude, medical, and moral character standards for entry into the military, as well as other standards such as those for age, citizenship, and number of dependent children.10
• Many youth are ineligible because they cannot meet DOD or service standards for:
• education, as indicated by DOD’s preference for accessions with a high school diploma;
• mental aptitude, as indicated by receipt of an acceptable score on the Armed Forces Qualification Test;
• physical fitness, as indicated by the absence of certain medical conditions and the ability to perform the physical challenges of military training; and
• moral character, as indicated by few or no criminal convictions or antisocial behavior.
9National Research Council, Attitudes, Aptitudes, and Aspirations of American Youth; DOD, Overview Report June 2003 Youth Poll 5, December 2003, p. 71.
10If married, a recruit can have no more than two dependents under age 18. If unmarried, a recruit must give up custody of dependent children.
Page 68 GAO-05-952 Military Demographics

Recruiting
• The services may use more rigorous standards than those prescribed by DOD and create additional standards for areas not covered by DOD.
• Senior officials are allowed to issue waivers for some standards. Comparing data for 1991 to those for 2000 shows that the extent to which certain types of waivers were issued to enlisted accessions changed. For example, the number of moral waivers appeared to have declined, while physical and other types of waivers appear to have increased.11
11National Research Council, Attitudes, Aptitudes, and Aspirations of American Youth, briefing fig. 4-9.
Page 69 GAO-05-952 Military Demographics

Recruiting
2B. Achieving Enlisted Recruiting Goals—Youth Ineligibility and Educational Standards
Table 23: DOD and Service-Specific Educational Standards
Sources: DOD Directive 1304.26, Qualification Standards for Enlistment, Appointment, and Induction. Service-specific standards were provided by the Office of Accession Policy.
• All of the services except the Army have educational standards that exceed DOD’s standard of having at least 90 percent of accessions possessing a high school diploma (see table 23).
• The Navy and Marine Corps standard is 95 percent, and the Air Force’s educational standard is 99 percent.
• Recruits with an alternate educational credential such as a general educational development high school equivalency diploma or a certificate of completion may be assigned a lower enlistment priority because DOD’s research shows that holders of an alternate educational credential are less likely than high school diploma graduates to complete military training and their initial obligation.
• DOD educational standards reduce the number of youth eligible for recruitment because DOD requires that at least 90 percent of recruits have a high school diploma, but only 71 percent of all high school students graduate with their class.12 Higher rates of high school completion may be reported in the Current Population Survey and other research, but in addition to high school diploma graduates they include
DOD educational standardAt least 90 percent of recruits must have a high school diploma.
Service-specific educational standards
Army Navy Marine Corps Air Force
At least 90 percent high school diploma graduates
At least 95 percent high school diploma graduates
At least 95 percent high school diploma graduates
At least 99 percent high school diploma graduates
12Manhattan Institute for Policy Research, Public High School Graduation Rates and
College-Readiness: 1991-2002, February 2005.
Page 70 GAO-05-952 Military Demographics

Recruiting
high school equivalency and general educational development diplomas for adults 25 and older.
• In 2002, 52 percent of Hispanics graduated from high school compared to 56 percent of African Americans and 78 percent of Whites. However, of the youth who graduated from high school in 2002 only 40 percent of Whites, 23 percent of African Americans, and 20 percent, of Hispanics had the skills needed to attend a 4-year college.13
• Most high school graduates qualified for college actually enrolled and this upward trend in college enrollment, both immediately after graduation and in the decade after high school, potentially reduces the number of youth interested in becoming enlisted personnel.14
13National Research Council, Attitudes, Aptitudes, and Aspirations of American Youth, briefing fig. 4-11.
14National Research Council, Attitudes, Aptitudes, and Aspirations of American Youth.
Page 71 GAO-05-952 Military Demographics

Recruiting
2B. Achieving Enlisted Recruiting Goals—Youth Ineligibility and Aptitude Standards
Table 24: Aptitude Standards and Required and Actual Percentages of Nonprior-service Recruits at or Above the 50th Percentile in Fiscal Year 2004
Sources: AFQT percentiles and categories from Armor and Sackett, “Manpower Quality in the All-Volunteer Force,” Ch. 6 from The All-Volunteer Force: Thirty Years of Service. Service-specific standards were provided by the Office of Accession Policy. Data on the services’ 2004 actual accessions is from Recruiting and Retention: An Overview of FY 2004 and FY 2005 Results for Active and Reserve Component Enlisted Personnel, Congressional Research Service, pg. 10.
• Although DOD requires that at least 60 percent of recruits be from AFQT Categories I-IIIA, the services require that 63 to 77 percent be from Categories I-IIIA (see table 24).
• The number of potential recruits available to enlist is less than the size of the youth population as a whole because DOD can generally access no more than 4 percent of its recruits from those with the lowest third of all AFQT scores.
• The percentage of new recruits scoring at or above the 50th percentile of the AFQT is higher than it was before the AVF (see table 25).
DOD aptitude standardDOD uses the Armed Forces Qualification Test (AFQT) to gauge the verbal and quantitative aptitude of potential enlisted recruits. Based on their AFQT score, applicants are assigned to one of six categories.
Percentile Category Percentile Category
93-99 I 31-49 IIIB
65-92 II 10-30 IV
50-64 IIIA 1-9 V
DOD policyRequires a minimum of 60 percent from Categories I-IIIA and a maximum of 4 percent from Category IV.
Federal statute (10 U.S.C., 520)Allows a maximum of 20 percent from Category IV, all of whom must be high school graduates. Unless required to meet established strength requirements, enlistment is denied to Category V applicants who have not graduated from high school.
Service-specific standards
For categories I-IIIA Army Navy Marine Corps Air Force
Goal 65% 70% 63% 77%
2004 actual accessions 72% 70% 69% 82%
Page 72 GAO-05-952 Military Demographics

Recruiting
Table 25: Percent of Nonprior-service Accessions Scoring in AFQT Categories I-IIIA during Selected Years
Sources: Data for 1957 and 1968 are from Paul F. Hogan, Curtis K. Simon, and John T. Warner, “Sustaining the Force in an Era of Transformation,” Ch. 5 from The All-Volunteer Force: Thirty Years of Service, Barbara A. Bicksler, Curtis L. Gilroy, and John T. Warner, eds., (Washington, D.C.: Brassey, 2004), Table 2 on p. 61. Data for remaining years are from Population Representation in the Military Services: Fiscal Year 2003, Table D-7, obtained from the Under Secretary of Defense for Personnel and Readiness homepage at http://dod.mil/prhome.
Era YearPercent nonprior service recruits in AFQT Categories I-IIIA
Pre-AVF 1957 43 in Categories I-III
1968 38 in Categories I-III
AVF initiation 1973 58
Post-AVF
1983 57
1993 71
2000 66
2001 66
2002 69
2003 72
Page 73 GAO-05-952 Military Demographics

Recruiting
2B. Achieving Enlisted Recruiting Goals—Youth Ineligibility and Medical Standards
Table 26: Examples of DOD Medical Standards which May Have Disqualified Potential Recruits in Fiscal Year 2004
Source: DOD Instruction 6130.4, Medical Standards for Appointment, Enlistment, or Induction in the Armed Forces.
• Medical conditions result in DOD drawing recruits from only a portion of the overall youth population. DOD research suggests that at least 26 percent of youth have a medical or physical condition that could make them ineligible to join.15
• DOD officials told us that medical and physical conditions, such as those shown in table 26, were the top reasons youth are ineligible to join the military.
• The Centers for Disease Control and Prevention reported that as of 2002, about 12 percent of children under 18 years of age had been diagnosed with asthma.
DOD medical standards
Recruits should be:
• free of contagious/infectious diseases, • free of medical conditions or physical defects that might require excessive time away from duty or likely result in separation due
to medical unfitness, and• capable of completing training, adapting to the military environment, and performing duties without aggravating existing physical
or medical defects or conditions.
Department of Defense Instruction 6130.4 identifies:
• medical conditions which, unless waived by DOD officials, disqualify applicants. For example, applicants currently affected by or with a history of the following would be disqualified: human immunodeficiency virus,
• coronary heart disease, asthma (diagnosed and symptomatic after age 13), endocrine and metabolic disorders such as diabetes mellitus, and alcohol or drug dependence or abuse.
• learning, psychiatric, and behavioral disorders such as the following, which, unless waived, disqualify applicants: attention deficit hyperactivity disorder, anxiety disorders, and alcohol dependence.
15DOD, Overview Report: June 2003 Youth Poll 5, December 2003 p. 72.
Page 74 GAO-05-952 Military Demographics
Recruiting
• The National Center for Health Statistics found that obesity among 12-19 year olds increased from 6 percent in 1974 to 16 percent in 2002.
• The Centers for Disease Control and Prevention reported that the percentage of 5-17 year olds for whom an antidepressant was prescribed or provided tripled from about 2 percent in 1994 to 6 percent in 2000-2002.16
16Centers for Disease Control and Prevention, Chartbook on Trends in the Health of
Americans, p. 63.
Page 75 GAO-05-952 Military Demographics

Recruiting
2B. Achieving Enlisted Recruiting Goals— Youth Ineligibility and Moral Character Standards
Table 27: DOD and Service-Specific Moral Character Standards for Nonprior-service Recruits in Fiscal Year 2004
Sources: DOD standards are from DOD Directive 1304.26, Qualification Standards for Enlistment, Appointment, and Induction, and service-specific standards were from Marine Corps Order P1100.72, Navy Instruction 1130.8f, and Air Force Instruction 36-2002.
• The number of potential recruits available to enlist is less than the size of the overall youth population because some youth with criminal records or evidence of antisocial behavior will be ineligible to enlist (see table 27 for standards). Researchers at the Army’s Center for Accession Research said that about 2 percent of the 17-21 aged population who are qualified for service in the Army were ineligible because they have been incarcerated.
• Illegal drug use is a moral character condition that might result in some potential recruits being disqualified to enlist.
DOD moral character standards
Recruits cannot:
• have previously separated from the military under conditions other than honorable or for the good of the service, • have exhibited antisocial behavior; • be under a form of judicial restraint (for example, bond, probation, imprisonment, or parole); or• have a “significant criminal record (although service secretaries may authorize “exceptions in meritorious cases, for the enlistment
of…persons convicted of felonies.”)
Service-specific moral character standards that disqualify applicants
Army Navy Marine Corps Air Force
Six or more minor traffic offenses, three or more nonminor traffic offenses, two or more misdemeanors, or one or more convictions for driving under the influence or felony.
Six or more minor traffic offenses, three or more nontraffic offenses, three or less minor misdemeanors, or one or more felonies.
Five or more minor traffic offenses, two or more serious traffic offenses, four or more class one minor nontraffic offenses, or two or less serious offenses, one felony.
Six or more minor traffic offenses in any 365-day period during the last 3 years, two or more minor nontraffic offenses in the last 3 years, three or more in a lifetime, or one or more misdemeanors or felonies.
Page 76 GAO-05-952 Military Demographics

Recruiting
• In 2000, about 25 percent of high school seniors said that they had used an illicit drug in the previous 30 days.17
• A recent study reported that about 39 percent of high school seniors, about 31 percent of sophomores, and about 15 percent of youth in their last year of middle school reported having used illicit drugs in the previous 12 months.18
17National Research Council, Attitudes, Aptitudes, and Aspirations of American Youth, briefing fig. 4-16.
18National Institutes of Health, National Results of Adolescent Drug Use: Overview of key
Findings 2004.
Page 77 GAO-05-952 Military Demographics
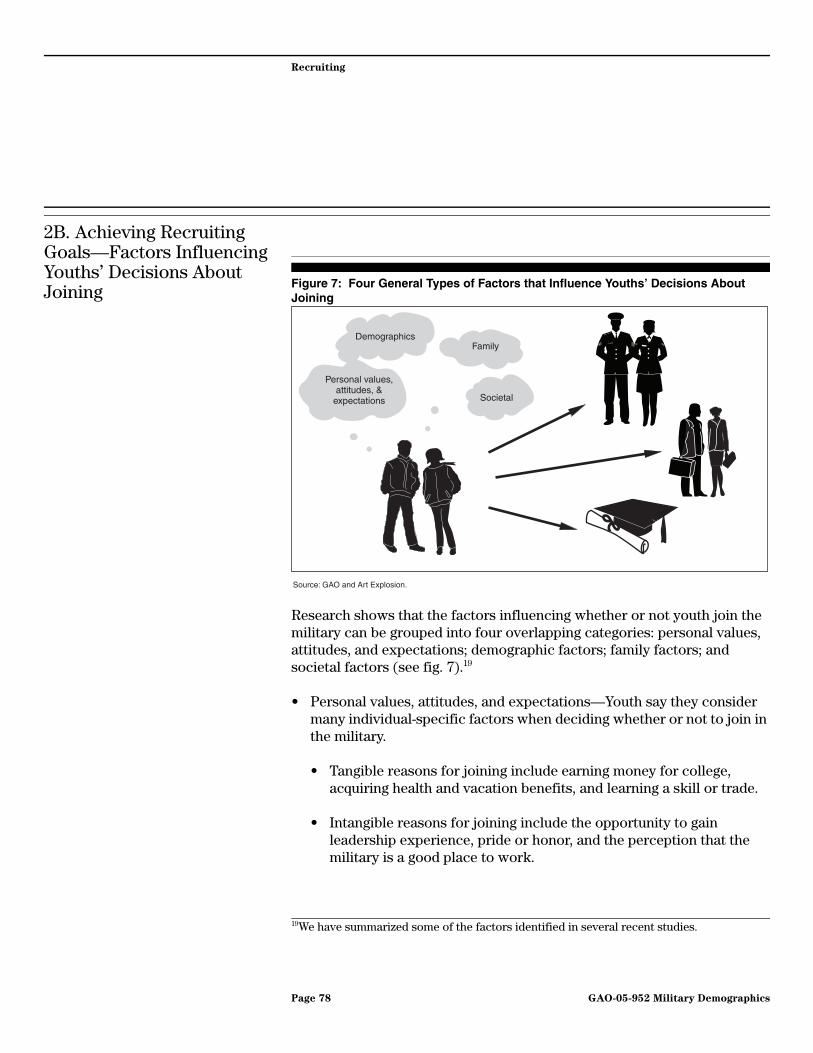
Recruiting
2B. Achieving Recruiting Goals—Factors Influencing Youths’ Decisions About Joining
Figure 7: Four General Types of Factors that Influence Youths’ Decisions About Joining
Research shows that the factors influencing whether or not youth join the military can be grouped into four overlapping categories: personal values, attitudes, and expectations; demographic factors; family factors; and societal factors (see fig. 7).19
• Personal values, attitudes, and expectations—Youth say they consider many individual-specific factors when deciding whether or not to join in the military.
• Tangible reasons for joining include earning money for college, acquiring health and vacation benefits, and learning a skill or trade.
• Intangible reasons for joining include the opportunity to gain leadership experience, pride or honor, and the perception that the military is a good place to work.
19We have summarized some of the factors identified in several recent studies.
Personal values,attitudes, &
expectations
Source: GAO and Art Explosion.
Family
Societal
Demographics
Page 78 GAO-05-952 Military Demographics

Recruiting
• Historically, many African Americans enlisted for tangible reasons and were more likely than White or Hispanic enlisted personnel to be in noncombat occupations and make a career of the military.
• Research suggests that Whites and Hispanics appear to be more likely than African Americans to report joining the military for intangible reasons such as adventure, being part of an elite team, or doing something for one’s country.20
• DOD officials say the perception of the military as a good place to work has been affected by current events. For example, DOD research shows that a majority of African American youth polled said the war on terrorism made them less likely to join the military.
20DOD, Youth Poll 6, November, 2003 and DMDC, Youth Attitude Tracking Study, July 2000.
Page 79 GAO-05-952 Military Demographics

Recruiting
2B. Achieving Recruiting Goals—Factors Influencing Youths’ Decisions About Joining
• Demographic factors—Members of certain subgroups such as males, Hispanics, African Americans, and youth from the South or West, are disproportionately more likely than their peers in corresponding subgroups to enlist and make it a career. Conversely, the likelihood of enlisting declines with age and education. 21
• Race and ethnicity—African Americans are more likely than Whites to actually apply for enlistment. Hispanics are more likely than non-Hispanics to say they are interested in and actually apply for enlistment. In addition, African Americans and Hispanics are more likely to make the military a career than are Whites.
• Gender—Males are more likely than females to apply for enlistment. However, interest in enlistment among male high school seniors has declined over the last 3 decades.22
• Changing trends—Recently, interest in military service has declined among African Americans.23
• Family factors—Decisions about joining are influenced by variables such as the number of parents in the household and family support for joining.
• Number of parents in household—Having fewer parents in the home is associated with a greater likelihood that males will enlist.24
21DMDC, Youth Attitude Tracking Study, July 2000.
22National Research Council, Attitudes, Aptitudes, and Aspirations of American Youth:
Implications for Military Recruitment, briefing fig. 6-4.
23Meredith A. Kleykamp, Military Enlistment Decision Making among Youth: The
Influence of Educational Goals, Military Institutional Presence, and Family Background;
DOD, Youth Poll Wave 7, May 2004, Overview Report.
24Jerald G. Bachman, David R. Segal, Peter Freedman-Doan, and Patrick M. O’Malley, “Who Chooses Military Service? Correlates of Propensity and Enlistment in the U.S. Armed Forces,” Military Psychology, vol. 12, no. 1 (2000).
Page 80 GAO-05-952 Military Demographics

Recruiting
• Family support for enlistment—Although both mothers and fathers influence a youth’s decision to enlist, a National Research Council/National Academies of Science study indicated that mothers are more influential than fathers.25
• Changing trends—DOD research indicates that parental support for military service for their child has decreased over the past year and that opposition to military service is stronger among African American parents than among parents of other racial/ethnic subgroups.26
25Attitudes, Aptitudes, and Aspirations of American Youth.
26Findings from the 2004 Image Equity Study as reported by the U.S. Army Accessions Command in a briefing entitled “State of the Youth Market.”
Page 81 GAO-05-952 Military Demographics

Recruiting
2B. Achieving Recruiting Goals—Factors Influencing Youths’ Decisions About Joining
• Other DOD research suggests that compared to youth of other racial/ethnic subgroups, African American youth are more likely to perceive that if they were to join the military, they would not receive support for that decision from the people in their lives.27
• Declining veteran population—Because of the declining veteran population, youth today are less likely than in the past to have one or more parents who are veterans. Research has also shown that children of current or former servicemembers are more likely than other youth to join.
• Societal factors—Decisions about joining are also influenced by broader societal factors such as the following.
• Exposure to the military—Closure and downsizing of military installations results in youth today being less likely than in the past to be directly exposed to military personnel and facilities.
• Postsecondary school opportunities—The increased availability of funding for post-secondary education enables some youth with limited financial resources to attend college directly after high school.
27DOD, Youth Poll Wave 7, May 2004, Overview Report.
Page 82 GAO-05-952 Military Demographics

Recruiting
• Civilian labor market—High civilian unemployment is associated with higher enlistment rates.28 For example, during the low civilian unemployment of the late 1990s, some components failed to meet their recruiting goals. Although there are regional differences, the current low unemployment rate results in civilian opportunities for youth considering post-high school options.
• Changing trends—Some researchers suggest that the attractiveness of joining the military after high school, relative to attending college or obtaining a civilian job, has declined because of operations in Iraq. College is the preferred choice of many youth who are eligible for military enlistment. About two-thirds of high school graduates enroll in college, but about one-third of these will leave after their first year.29
28Beth Asch, et al., Military Recruiting and Retention After the Fiscal Year 2000 Military
Pay Legislation, RAND MR-1532-08D, (Santa Monica, CA.: 2002).
29National Research Council, Attitudes, Aptitudes, and Aspirations of American Youth; Meredith A. Kleykamp, Military Enlistment Decision Making among Youth: The Influence
of Educational Goals, Military Institutional Presence, and Family Background.
Page 83 GAO-05-952 Military Demographics
Recruiting
2C. Recruit Characteristics—Active Component Race/Ethnicity
• DOD researchers also have reported a declining representation of African Americans among AC recruits.
• DOD’s semi-annual youth polls have noted that between November 2003 and November 2004: 30
• African American and Hispanic youth’s inclination to join the military declined, although
• White youth’s inclination to join remained stable. 31
• The youth polls also tracked youth’s perception of the favorability of the U.S. military and found evidence that between November 2003 and November 2004:
• African American youth’s perception of the favorability of the military has declined, although
• White and Hispanic youth’s perception of the favorability of the military remained unchanged.32
• Researchers suggest that parents’ favorability/support toward military service for their child has steadily decreased over the past year. Opposition to military service is stronger among African American parents than among parents from other racial/ethnic subgroups.
30DOD, Overview Report: May 2004 Youth Poll Report 7 and Crosstabulations.
31DOD, November 2004 Youth Poll 8 Final Brief.
32DOD, November 2004 Youth Poll 8 Final Brief.
Page 84 GAO-05-952 Military Demographics

Recruiting
• Similarly, a DOD study of the attitudes of people who influence youths’ decision to join the military suggests that relative to influencers from other racial/ethnic subgroups, African American influencers were less likely to recommend military service and less likely to approve of the U.S. military presence in Iraq and the administration’s handling of foreign affairs.33
33 DOD, 2004 Influencer Poll Report and Crosstabulations.
Page 85 GAO-05-952 Military Demographics

Recruiting
2C. Recruit Characteristics—Active Component Race/Ethnicity
Table 28: Percent of AC Servicemembers in Each Racial/Ethnic Subgroup Who Have 1 Year or Less of Service in Fiscal Years 2000, 2002, and 2004
Source: GAO analysis of DOD-provided data.
Note: Rows may not total 100 percent due to rounding.
• The concerns that we cited earlier about the comparability of racial and ethnic data collected before and after January 2003, when federal agencies were required to have implemented the new guidelines, also apply to the findings in table 28. Although we generally avoid reporting racial/ethnic trends because of the changes in the way these data are collected and reported, in the data DOD provided, we were able to identify comparable racial/ethnic subgroups for AC servicemembers in fiscal years 2000, 2002, and 2004. We were unable to do so for RC servicemembers.
Component/fiscal year
Percent of AC servicemembers with 1 year or less of service
TotalWhiteAfrican
American Hispanic
AsianAmerican/
PacificIslander
AmericanIndian/
AlaskanNative
Other/Unknown
Army/ 2004 66 16 12 4 1 2 101
Army/ 2002 62 22 11 3 1 1 100
Army/ 2000 60 23 10 3 1 2 99
Navy/2004 64 20 4 3 5 4 100
Navy /2002 56 21 13 5 4 2 101
Navy/2000 57 20 12 5 4 1 99
Marine Corps/2004 70 8 12 0 1 10 101
Marine Corps/2002 69 12 14 2 1 1 99
Marine Corps/2000 69 13 14 2 1 2 101
Air Force/2004 76 14 3 2 1 4 100
Air Force/2002 69 16 5 1 <1 8 99
Air Force/2000 70 17 7 <1 <1 6 100
Page 86 GAO-05-952 Military Demographics

Recruiting
• For fiscal years 2000 and 2004, African American representation among AC servicemembers with 1 year or less of service declined in three active components. The decline was 7 percentage points for the Army, 5 percentage points for the Marine Corps, and 3 percentage points for the Air Force.34
• In the Navy, Hispanic representation among those with 1 year or less of service declined by 8 percentage points from fiscal year 2000 to fiscal year 2004.
34Our analysis of servicemembers with 1 year or less of military service does not take into account that some recruits will leave the military prior to completing their first year of service or that recruits from some subgroups may be more likely to leave prematurely than recruits from other subgroups.
Page 87 GAO-05-952 Military Demographics

Recruiting
2C. Recruit Characteristics—Socioeconomic Status
• The wealthiest and the poorest segments of the applicable U.S. population are less likely than others to serve in the military. The wealthiest have other post-high school options such as attending college, and the poorest are more likely to be ineligible because of medical, aptitude, or moral disqualifiers.35
• For fiscal year 2004, DOD’s Office of Accession Policy found that recruits came from areas defined by zip codes whose median incomes were similar to those of civilian youth in general—about $44,500 for recruits compared to about $44,300 for civilian youth.36
• DOD used the median household income of the recruits’ and civilians’ home communities to represent socioeconomic status because data typically used to identify socioeconomic status are not collected on recruits. DOD performed the analyses with commercial marketing industry software that uses data from the U.S. Census Bureau and other sources to identify the social and economic characteristics of each U.S. postal zip code.
• DOD also found that the recruits came from communities in which the median income increased from about $43,000 in fiscal year 2000 to about $44,500 in fiscal year 2004 (all values in constant 2003 dollars). The largest increase, about $2,500, came between fiscal years 2001 and 2002. Researchers suggested that it represented a patriotic response to the September 11th terrorist attacks, after which a larger than usual number of recruits from higher income households joined the military.
35David R. Segal and Mady Wechsler Segal, “America’s Military Population,” Population
Bulletin, vol. 59, no. 4 (2004).
36 The analyses included 1.08 million AC nonprior-service-enlisted accessions for fiscal years 1999 through 2004 and 16.7 million comparable youth aged 17 to 21. The civilian youth excluded high school dropouts but included youth with general educational development diplomas or another credential of high school equivalency.
Page 88 GAO-05-952 Military Demographics

Recruiting
2C. Recruit Characteristics—Socioeconomic Status
• While the analyses provide some insight into the socioeconomic status of the families from which recruits come, the validity of the findings should be considered relative to concerns that include the following issues.
• Although the software can create a distribution of estimated income for the households from which the recruits were drawn, the software does not provide a comparable distribution showing the percentage of homes with various levels of income. This limits DOD’s ability to determine how well households from all socioeconomic levels are represented by recruits.
• The average income for a community (as represented by a zip code) may not represent the actual income of the recruit’s household.
• Socioeconomic status is often a measure of something more than income. For example, it might be a combination of household income, parents’ educations and occupations, and home ownership.
• If a family with a higher income lives in an area with a higher cost of living, that family’s socioeconomic status could be less than a family with less income living in a geographic area with a lower cost of living.
• DOD’s earlier study of socioeconomic status showed that recruits came from all socioeconomic levels but were proportionately most likely to come from the lower three quarters of the distribution of socioeconomic status.
• DOD’s Population Representation in the Military Services: Fiscal
Year 1999 indicated that less than 25 percent of the AC nonprior-service recruits in 1999 came from U.S. households that were classified as being in either the top or bottom quartiles of socioeconomic levels.
• DOD’s Office of Accession Policy reported that it stopped gathering socioeconomic status information because of concerns that included questions about how accurately recruits could report their family’s income.
Page 89 GAO-05-952 Military Demographics

Recruiting
2C. Recruit Characteristics—Population Density of Home Community
Table 29: Percent of Enlisted AC Accessions between 1999 and 2004 and Comparable Civilian Youth Aged 17-21 from Community Population Density Subgroups
Source: DOD.
Note: Rows may not total to 100 percent due to rounding.
• For fiscal years 1999 through 2004, rural areas provided a disproportionately higher percentage of nonprior-service AC enlisted accessions than did suburban and urban areas (see table 29). This was true for all four active components.
• These analyses were part of the previously described study in which DOD’s Office of Accession Policy examined recruits’ socioeconomic level.
• Using recruits’ zip codes and commercial marketing industry software, DOD’s Office of Accession Policy segmented the accession and civilian populations into rural, suburban, and urban subgroups. The software contains zip-code-based data on population density and
Active Component
Community population density subgroup
TotalRural Suburban Urban
Army 48 42 10 100
Navy 45 42 13 100
Marine Corps 48 42 10 100
Air Force 52 42 7 101
17-21 year old civilian youth with a high school diploma or equivalent 40 46 14 100
Page 90 GAO-05-952 Military Demographics
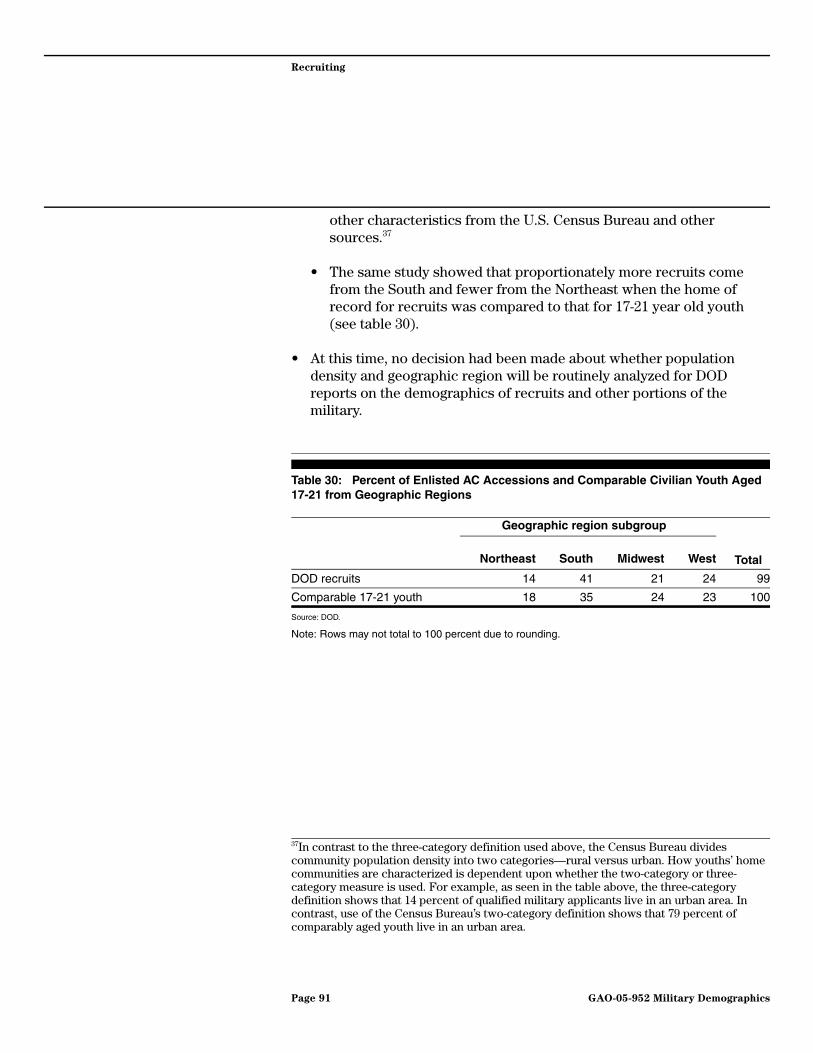
Recruiting
other characteristics from the U.S. Census Bureau and other sources.37
• The same study showed that proportionately more recruits come from the South and fewer from the Northeast when the home of record for recruits was compared to that for 17-21 year old youth (see table 30).
• At this time, no decision had been made about whether population density and geographic region will be routinely analyzed for DOD reports on the demographics of recruits and other portions of the military.
Table 30: Percent of Enlisted AC Accessions and Comparable Civilian Youth Aged 17-21 from Geographic Regions
Source: DOD.
Note: Rows may not total to 100 percent due to rounding.
37In contrast to the three-category definition used above, the Census Bureau divides community population density into two categories—rural versus urban. How youths’ home communities are characterized is dependent upon whether the two-category or three-category measure is used. For example, as seen in the table above, the three-category definition shows that 14 percent of qualified military applicants live in an urban area. In contrast, use of the Census Bureau’s two-category definition shows that 79 percent of comparably aged youth live in an urban area.
Geographic region subgroup
TotalNortheast South Midwest West
DOD recruits 14 41 21 24 99
Comparable 17-21 youth 18 35 24 23 100
Page 91 GAO-05-952 Military Demographics

Recruiting
2D. Enlistment Incentives
Figure 8: Economic and Educational Incentives
• Youth weigh various economic and educational factors when deciding whether or not to enlist.
• Economic incentives such as enlistment bonuses, degree bonuses, and occupational specialty bonuses provide cash at the time of enlistment or shortly thereafter.
• Educational incentives such as the Montgomery GI Bill, educational allowances, and student loan repayment have a longer-term economic benefit.
• Other incentives such as retirement also have a long-term economic value.
• The amount of and eligibility for incentives varies by component and may change depending on the recruiting environment.
• According to the Office of the Secretary of Defense for Compensation, DOD spent over $455 million in fiscal year 2003 for all types of economic and educational enlistment incentives.
Economic incentives
Source: GAO and Art Explosion.
Education incentives
Page 92 GAO-05-952 Military Demographics

Recruiting
• The military has increased the educational and economic incentives for enlisting. For example, in 2005 we reported that the National Guard would increase enlistment bonuses for nonprior-service recruits from $8,000 to $10,000 and the Army would increase themaximum college scholarship from $50,000 to $70,000.38
• Some services have also increased the number of recruiters. For example,
• the Army plans to add over 900 recruiters to its current force of 5,065 recruiters in fiscal year 2005 and
• the Marine Corps plans to add 425 recruiters to its current force of 2,600 recruiters by fiscal year 2007.
• Despite increased incentives, recruiting remains difficult. This was demonstrated by the Army’s May 20, 2005, 1-day suspension of recruiting in order to retrain recruiters after reports of recruiters violating policies.
38See Military Personnel: Preliminary Observations on Recruiting and Retention Issues
within the U.S. Armed Forces, GAO-05-419T (Washington, D.C.: Mar. 16, 2005).
Page 93 GAO-05-952 Military Demographics

Recruiting
2D. Enlistment Incentives—Economic Enlistment Incentives
• DOD offers a variety of economic incentives for enlistment. For example, DOD’s Office of Compensation reported that in fiscal year 2003, almost $334 million was spent on enlistment bonuses.39 Other economic incentives include:
• a bonus for enlistment in a specific hard-to-fill military specialties for up to $20,000,
• a National Call to Service Program bonus in which recruits may choose to receive a cash bonus of $5,000 or a monthly entitlement allowance of up to about $1,000,
• a “quick ship” bonus in which recruits who are able to immediately join are eligible for up to $9,000, and
• college degree bonuses for up to $40,000.
• When comparing military and civilian compensation packages, potential recruits may not recognize the full value of some benefits such as retirement.
• We40 recently reported that:
• The most recent Quadrennial Review of Military Compensation found, on average, military pay was at the 70th percentile or higher of the wages provided to comparably educated civilians.
• DOD does not effectively educate servicemembers about the competitiveness of their total compensation packages.
• Studies show that youth and newly enlisted servicemembers place greater value on financial compensation such as pay while retirement and other benefits are of greater value to midcareer servicemembers.
39Data provided by the Office of the Secretary of Defense (Compensation).
40GAO, Military Personnel: DOD Needs to Improve the Transparency and Reassess the
Reasonableness, Appropriateness, Affordability, and Sustainability of Its Military
Compensation System, GAO-05-798 (Washington, D.C.: July 19, 2005).
Page 94 GAO-05-952 Military Demographics

Recruiting
• One difference between the total compensation of servicemembers and civilians is that servicemembers’ pay comprises a smaller proportion of total compensation than does pay for civilians. For example, servicemembers also receive allowances for housing and subsistence/food that few civilians would receive.
Page 95 GAO-05-952 Military Demographics

Recruiting
2D. Enlistment Incentives—Economic Enlistment Incentives
Table 31: Examples of the Reserve Components’ Economic Enlistment Incentives Being Offered in February 2005
Source: Office of the Secretary of Defense for Reserve Affairs.
Army ReserveArmy National Guard Navy Reserve
Marine Corps Reserve Air Force Reserve
Air National Guard
Enlistment bonus
$3,000, $5,000, or $8,000 for 6-year contract
$8,000 for 6-year contract
$5,000 for 6 years for nonprior-service recruits
$8,000 for 6-year contract
$8,000 for 6 years for nonprior-service recruits
$5,000 for a 6-year contract for nonprior-service recruits
Affiliation bonus
$50 per month x months remaining on military obligation
$50 per month x months remaining on military obligation
$50 per month x months remaining on military obligation
$50 per monthx months of remaining obligation
$50 per month x months remaining on military obligation
$50 per month x months remaining on military obligation
Prior service bonus
$5,000 for 6-year contract or two 3-year bonuses; $2,500 for the first 3 and $2,000 for the second 3, served consecutively
Only two 3-year bonuses; $2,500 the first 3 and $2,000 for the second 3, served consecutively
$2,500 for 3 years, $5,000 for 6-year contract
$5,000 for 6-year contract
$2,500 for 3-year contract
$2,000 for second 3-year contract
$8,000 for 6-year contract or two 3-year bonuses; $4,000 for the first 3 and $3,500 for the second 3, served consecutively
$5,000 for 6-year contract
Loan repayment
$10,000 or $20,000 depending on select critical skills
Max $10,000; Only for repayment of existing loans;nonprior-service: for initial contract only; prior service: those who immediately reenlist or extend for a period not less than 3 years, if for reenlistment/ extension bonus
None None Max $15,000; annual payments of $5,000 for 3 years
15 percent or $500 per qualifying loan, not to exceed $2,500 per member per year and $20,000 over lifetime of member, for 6-year enlistment or reenlistment
Page 96 GAO-05-952 Military Demographics

Recruiting
Table 31 provides examples of some of the economic incentives offered by the RC.
• These examples of incentives illustrate some of the tools that recruiters are provided to help them with their mission.
• The examples highlight the extent to which the components emphasize different types of incentives.
• Because the active components use the same types of incentives and may alter the levels of incentives to match their recruiting environment, a similar table of AC economic enlistment incentives is not provided.
Page 97 GAO-05-952 Military Demographics

Recruiting
2D. Enlistment Incentives—Educational Incentives
Table 32: Examples of Reserve Component Educational Enlistment Incentives Being Offered in February 2005
Source: Office of the Secretary of Defense for Reserve Affairs.
• Examples of some of the educational incentives offered by DOD and the services are the:
• Montgomery GI Bill and College Funds which provide funds for up to 36 months (see table 32);
• College First program, which provides recruits a stipend to attend college for up to 24 months; and
• National Call to Service Program, which offers recruits the option of choosing to have a qualifying student loan repaid for up to $18,000 (or the previously mentioned economic incentives).
Army ReserveArmy National Guard Navy Reserve
Marine Corps Reserve
Air Force Reserve
Air National Guard
Basic Montgomery GI Bill
$282 per month
$282 per month $282 per month
$282 per month $282 per month
$282 per month
College fund $100, $200, or $350 per month
$350 per monthAvailable to nonprior service, officer candidate school, and SMP
$350 per month
$350 per month $350 per month
$350 per month for critical Air Force Specialty Codes
Page 98 GAO-05-952 Military Demographics

Recruiting
• In addition to these incentives, there is also evidence that longer-term educational incentives may be more attractive to some applicants than other benefits.41 Several studies have suggested that benefits providing money for college or repaying student loans may be an incentive to join the military for youth with college aspirations and limited financial resources.42 Therefore, providing educational incentives may be particularly important today since many potential recruits are eligible for and interested in attending college.
41Hogan, Simon, & Warner, “Sustaining the Force in an Era of Transformation.”
42Congressional Budget Office, January 2004; Attitudes, Aptitudes, and Aspirations of
American Youth, Chapter 5; Rebecca Asch, Can Du, and Matthias Schonlau, Policy Options
for Military Recruiting in the College Market, RAND (Santa Monica, Ca.: 2004).
Page 99 GAO-05-952 Military Demographics

Retention
Question 3 and Summary of Approach
What are the demographic characteristics of servicemembers who remained in the military in fiscal years 2000, 2002, and 2004?
We identified and compared the DOD-provided rates at which servicemembers in service, pay grade, years of service, racial/ethnic, gender, and occupational subgroups remained in the military in fiscal years 2000, 2002, and 2004. Continuation rates represent the number of subgroup members who remained in the military for an entire fiscal year divided by the number of servicemembers who were in the subgroup at the beginning of the fiscal year.1 We noted differences in the extent to which subgroups remained in the military in fiscal years 2000, 2002, and 2004. In general, we discuss differences of 3 percentage points or more between subgroups. An ongoing GAO effort is examining in greater detail the services’ retention goals and achievements. 2
Summary of Findings
3A. Overview of military retention
With several exceptions, the AC has generally met or exceeded its overall retention goals for enlisted personnel over the last 5 years.
3B. AC continuation • In each year examined, proportionately fewer enlisted personnel than officers remained in the military.
1Because fiscal year 2004 continuation rates for RC servicemembers had not been published at the time of this report, we examined fourth quarter continuation rates for RC servicemembers in 2004.
2Although we did not address this in our report, it is important to note that not all servicemembers leaving the AC or RC are leaving the military entirely. As discussed in the previous section of this report, some AC members will enter the RC. In examining servicemembers who left the Selected Reserve in fiscal year 2003, the Center for Naval Analysis found that less than 50 percent actually left the RC and that most switched to the Individual Ready Reserve or to the Retired Reserve.
Page 100 GAO-05-952 Military Demographics
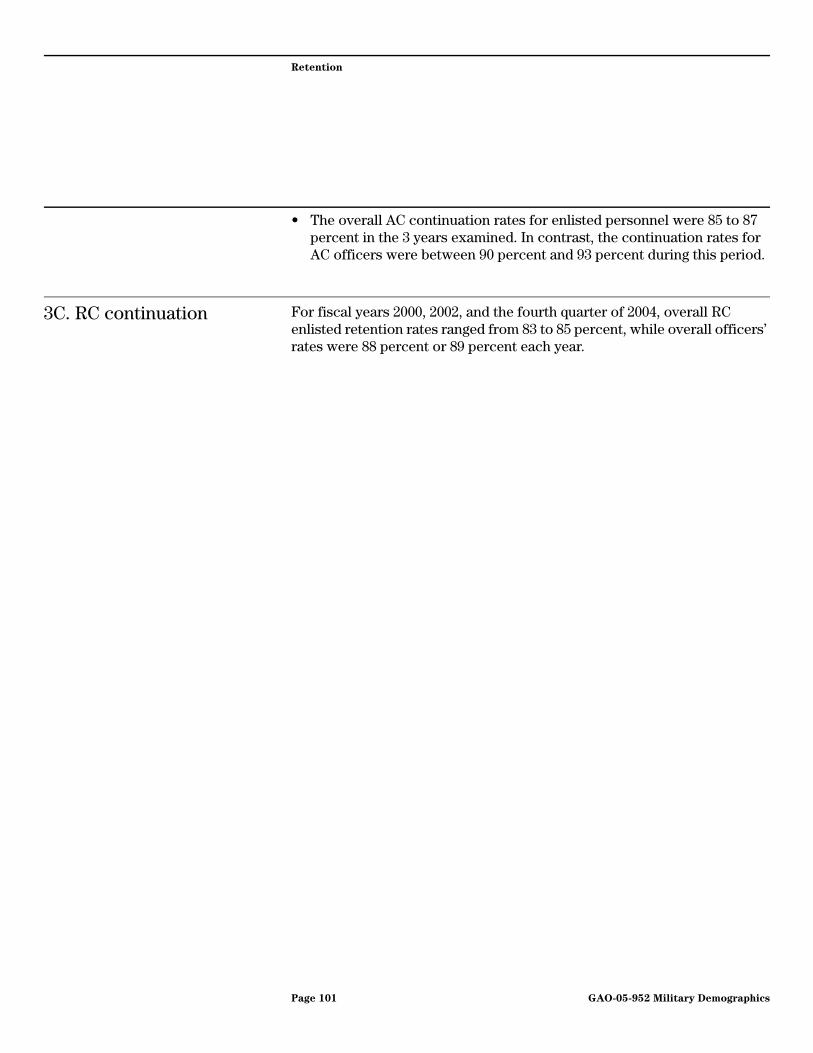
Retention
• The overall AC continuation rates for enlisted personnel were 85 to 87 percent in the 3 years examined. In contrast, the continuation rates for AC officers were between 90 percent and 93 percent during this period.
3C. RC continuation For fiscal years 2000, 2002, and the fourth quarter of 2004, overall RC enlisted retention rates ranged from 83 to 85 percent, while overall officers’ rates were 88 percent or 89 percent each year.
Page 101 GAO-05-952 Military Demographics

Retention
Findings
3A. Overview of Military Retention—Military Policies and Practices
• Military personnel policies and practices that influence retention include those addressing the following issues.
• All entrants are obligated to serve 8 years. Almost all personnel who choose to leave active duty prior to completion of 8 years of service must serve the remaining balance of their obligation in the RC.3
• Enlisted recruits sign an initial “contract”—which can range from 2 to 6 years—that specifies the length of their active duty service. After enlisted personnel have fulfilled their contract and the active duty portion of their military service obligation, they may opt to: (a) reenlist by signing another contract or (b) leave active duty and serve the remainder of their 8-year obligation in a reserve component.
• Officers who have completed their initial service are not required to sign subsequent contracts to remain in the military.
• The military’s “up or out” system forces turnover among officers and enlisted personnel who are not consistently promoted.
• Research on first-term enlisted personnel showed that those promoted more quickly than usual reenlisted at higher rates than those promoted at a slower than the usual rate.4
3Recruits who join the military under the National Call to Service Program, which was initiated on October 1, 2003, are required to serve on active duty for 15 months, after which they must serve either an additional period on active duty as determined by the Secretary of Defense, or 24 months in an active status in the Selected Reserve. After meeting these requirements and without a break in service, recruits must then serve the balance of their obligation in one of the following: on active duty; in the Selected Reserve; in the Individual Ready Reserve; or in the Peace Corps, Americorps, or other national service program jointly designated by the Secretary of Defense and the head of such a program. The National Call to Service Program will end on December 31, 2007.
4RAND, How Does Deployment Affect Retention of Military Personnel? Research Brief, RB-7557-OSD (Santa Monica, Ca.: 2003).
Page 102 GAO-05-952 Military Demographics

Retention
• The stop-loss policy temporarily prevents leaving the military even when an obligation is finished. As a result, it may artificially inflate retention rates for the period when the policy was in effect and artificially deflate retention rates for the months after it is rescinded.
• Reenlistment/retention bonuses are available for certain hard-to-retain specialties (e.g., Air Force combat controllers).
• Some special opportunities for additional education or training result in servicemembers incurring an additional service obligation.
Page 103 GAO-05-952 Military Demographics

Retention
3A. Overview of Military Retention—Military Policies and Practices
• Each service has its own method for tracking enlisted retention.
• The Army and Marine Corps set numeric retention goals and track retention relative to those goals.
• The Army tracks the retention of initial term (first enlistment, regardless of length); midcareer (second or subsequent enlistments with less than 10 years of service); and career (second or subsequent enlistments with 10 or more years of service).
• The Marine Corps tracks retention by first enlistment and second or subsequent enlistment.
• The Navy and Air Force set goals in terms of percentages of those eligible to reenlist.
• The Navy’s most important retention categories are Zone A (up to 6 years of service), Zone B (6 years of service to less than 10 years of service), and Zone C (10 years of service to less than 14 years of service).
• The Air Force tracks retention by first term (first enlistment, regardless of length); second term (second enlistment); and career (third or subsequent enlistment).
• A DOD official in the Officer and Enlisted Personnel Management Directorate told us that DOD is in the process of developing a retention measure that will be used by all services.
• Every year the Office of the Assistant Secretary of Defense for Reserve Affairs publishes the Official Guard & Reserve Manpower Strengths &
Statistics, which includes information that might be useful to track RC retention such as:
• monthly reenlistments and extensions by pay grade;
• reenlistments and extensions by race, sex, aptitude, and civilian educational attainment;
• continuation rates for officers and enlisted personnel in each component for recent years; and
Page 104 GAO-05-952 Military Demographics
Retention
• continuation rates for officers and enlisted personnel in each component by year of service.
• AC retention rates are available via DMDC’s Information Delivery System, an on-line data warehouse. Persons wishing to access the data warehouse must send a request to DMDC. Among the reports provided are several that would assist in tracking retention, such as,
• active duty enlisted and officer continuation rates broken out by service, gender, years of service, DOD occupational category, and race;
• active duty separations; and
• reserve and guard attrition and losses.
Page 105 GAO-05-952 Military Demographics

Retention
3A. Overview of Military Retention—Enlisted Retention Goals
Table 33: AC Enlisted Retention in Fiscal Years 2000-2005
Sources: Fiscal year 2000, 2002, and 2004 data from GAO 05-419T. Data for fiscal year 2005 in April 2005 testimony by the Under Secretary of Defense for Personnel and Readiness before the Senate Armed Services Personnel Subcommittee.
aThe actual percentage achieved was 94.6, resulting in the component being slightly short of its goal of 95%.
• Table 33 shows that for the active components in fiscal years 2000, 2002, and 2004:
• the Army and Marine Corps met or exceeded their overall retention goals in each of the 3 years for each category of enlisted personnel;
• the Navy met its retention goals except for career personnel in fiscal year 2002 and first term/initial enlisted personnel in fiscal year 2004; and
ServiceEnlistment category
Fiscal year 2000 Fiscal year 2002 Fiscal year 2004 Fiscal year 2005 (thru February, 2005)
Annual Annual Annual Mission
Goal Actual
Percent of goal
met Goal Actual
Percent of goal
met Goal Actual
Percent of goal
met Mission ActualPerformance of mission Goal
Army
First term/initial 20,000 21,402 107 19,100 19,433 102 23,000 24,903 108 12,094 11,165 92% 26,935
Midcareer 23,700 24,118 102 22,700 23,074 102 20,292 21,120 104 10,378 9,991 96% 23,773
Career 24,300 25,791 106 15,000 15,700 105 2,808 13,987 109 5,874 7,180 122% 13,454
Navy
First term/initial * 30% * 56% 59% Exceeded 56% 54% Short 53% 59% Exceeded 53%
Midcareer * 47% * 73% 75% Exceeded 70% 70% Exceeded 69% 69% Met mission 69%
Career * 57% * 90% 87% Short 85% 87% Exceeded 85% 85% Met mission 85%
Marine Corps
First term/initial 5,791 5,846 101 5,900 6,050 10 5,974 6,011 101 2,972 4,953 Exceeded 5,944
Subsequent * 63% * 5,784 7,258 125 5,628 7,729 137 2,540 3,072 Exceeded 5,079
Air Force
First term/initial 55% 53% Short 55% 72% Exceeded 55% 63% Exceeded 55% 55% Met mission 55%
Midcareer 75% 70% Short 75% 78% Exceeded 75% 70% Short 75% 59% Short 75%
Career 95% 91% Short 95% 95%a Short 95% 97% Exceeded 95% 94% Short 95%
Page 106 GAO-05-952 Military Demographics
Retention
• the Air Force missed its retention goals for: all categories of enlisted personnel in fiscal year 2000, career personnel in fiscal year 2002, and midcareer personnel in fiscal year 2004.
• Although DOD expects to meet its fiscal year 2005 active duty retention goals, the Office of Military Personnel Policy provided an information paper dated December 2004 acknowledging that retention may suffer because of an improving civilian labor market and high operational tempo.
• An ongoing GAO effort is examining in greater detail the degree to which components have met their overall retention goals, met their retention goals for hard-to-fill critical occupations, and the steps taken to achieve their retention goals.
Page 107 GAO-05-952 Military Demographics

Retention
3B. Active Component—Continuation Rates
Table 34: AC Continuation Rates for Each Service in Fiscal Years 2000, 2002, and 2004
Legend: N/A=Not applicable because the Air Force does not have any warrant officers.
Source: DOD.
• Table 34 shows that, across the 3 examined years, the overall continuation rates for each type of servicemember remained flat, varying by 3 percentage points or less.
• In general, continuation rates for enlisted personnel were lower than those for warrant and commissioned officers.
• In fiscal years 2002 and 2004, Air Force enlisted personnel had higher continuation rates than enlisted personnel from other services.
Service
AC continuation rate (percent)
Enlisted personnel Warrant Officers Commissioned officers
Fiscal year 2000
Fiscal year 2002
Fiscal year 2004
Fiscal year 2000
Fiscal year 2002
Fiscal year 2004
Fiscal year 2000
Fiscal year 2002
Fiscal year 2004
Army 83 85 82 91 93 92 90 93 92
Navy 85 89 86 85 92 88 90 93 91
Marine Corps 83 83 83 91 91 90 91 93 92
Air Force 87 91 90 N/A N/A N/A 90 94 93
Total 85 87 86 90 93 92 90 93 92
Page 108 GAO-05-952 Military Demographics

Retention
Table 35: AC Continuation Rates for Race and Gender Subgroups in Fiscal Years 2000, 2002, and 2004
Source: DOD.
• Table 35 shows that for the period examined, continuation rates were generally highest in the first and second years of service for both officers and enlisted personnel. Enlisted continuation peaked again at 10 years of service, ranging between 84 and 90 percent in the years examined.
• In general, the continuation rates between most racial subgroups were within 3 percentage points of each other in each of the years examined.
• The continuation rates for female enlisted personnel and officers were no more than 2 percentage points lower than the rates for their male peers in each year examined.
Type of AC subgroup
AC continuation rate (percent)
Enlisted personnel Officers
Fiscal year2000
Fiscal year2002
Fiscal year2004
Fiscal year2000
Fiscal year2002
Fiscal year2004
Years of service
1 87 88 89 99 99 98
2 90 90 91 98 99 98
3 84 87 86 95 96 95
4 60 68 65 85 88 87
5 81 84 78 85 90 87
6 83 86 85 88 93 90
10 84 90 89 87 93 94
20 50 64 55 76 80 78
Race White 84 86 85 90 93 92
African American 86 88 86 92 94 92
Other/Multiracial 86 87 88 91 94 93
Unknown 77 88 84 90 94 93
Gender Male 85 87 85 90 94 92
Female 83 86 83 90 92 90
Page 109 GAO-05-952 Military Demographics

Retention
3B. Active Component—Enlisted Continuation Rates
Table 36: AC Enlisted Continuation Rates for DOD Occupational Codes in Fiscal Years 2000, 2002, and 2004
Source: DOD.
Note: The nonoccupational area includes patients, students, and those with unassigned duties,
• Among AC enlisted personnel, continuation rates between DOD occupational areas differed by 5 percentage points or less in each year examined (see table 36).
• The rates for enlisted personnel in the following DOD occupational areas increased by at least 3 percentage points from fiscal year 2000 to fiscal year 2002:
• health care specialists,
• other technical and allied specialists,
• electrical and mechanical equipment repairers, and
• craftsworkers.
DOD enlisted occupational codes and areas
AC enlisted continuation rate (percent)
Fiscal year2000
Fiscal year2002
Fiscal year2004
0 Infantry, gun crews, & seamanship 82 84 83
1 Electronic equipment repairers 85 87 86
2 Communications & intelligence specialists
84 87 84
3 Health care specialists 85 88 86
4 Other technical & allied specialists 85 88 85
5 Functional support & administration 86 88 86
6 Electrical & mechanical equipment repairers
85 88 86
7 Craftsworkers 84 88 85
8 Service & supply handlers 83 85 83
9 Nonoccupational 85 86 88
Page 110 GAO-05-952 Military Demographics
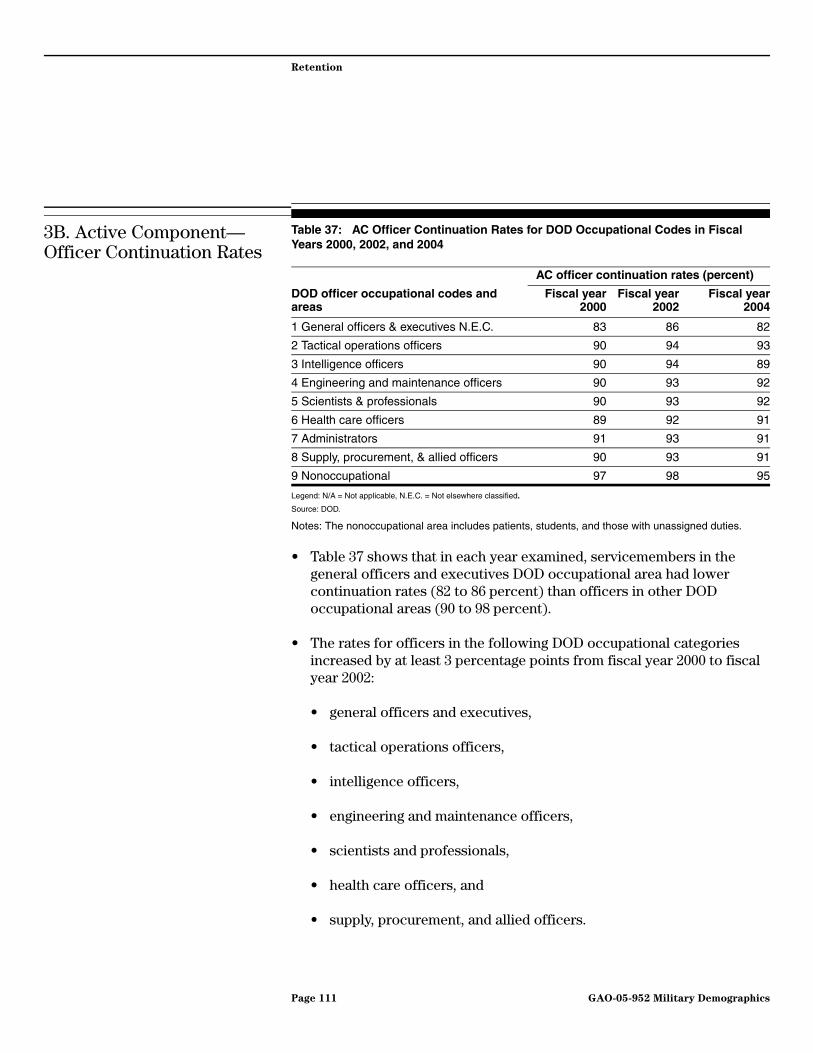
Retention
3B. Active Component—Officer Continuation Rates
Table 37: AC Officer Continuation Rates for DOD Occupational Codes in Fiscal Years 2000, 2002, and 2004
Legend: N/A = Not applicable, N.E.C. = Not elsewhere classified.
Source: DOD.
Notes: The nonoccupational area includes patients, students, and those with unassigned duties.
• Table 37 shows that in each year examined, servicemembers in the general officers and executives DOD occupational area had lower continuation rates (82 to 86 percent) than officers in other DOD occupational areas (90 to 98 percent).
• The rates for officers in the following DOD occupational categories increased by at least 3 percentage points from fiscal year 2000 to fiscal year 2002:
• general officers and executives,
• tactical operations officers,
• intelligence officers,
• engineering and maintenance officers,
• scientists and professionals,
• health care officers, and
• supply, procurement, and allied officers.
DOD officer occupational codes and areas
AC officer continuation rates (percent)
Fiscal year2000
Fiscal year2002
Fiscal year2004
1 General officers & executives N.E.C. 83 86 82
2 Tactical operations officers 90 94 93
3 Intelligence officers 90 94 89
4 Engineering and maintenance officers 90 93 92
5 Scientists & professionals 90 93 92
6 Health care officers 89 92 91
7 Administrators 91 93 91
8 Supply, procurement, & allied officers 90 93 91
9 Nonoccupational 97 98 95
Page 111 GAO-05-952 Military Demographics

Retention
3C. Reserve Component—Continuation Rates
Table 38: Continuation Rates for RC Servicemembers in Fiscal Years 2000, 2002, and the Fourth Quarter of Fiscal Year 2004a
Source: Official Guard & Reserve Manpower Strengths & Statistics: FY 2004.
aThe Official Guard & Reserve Manpower Strengths & Statistics: FY 2004 contains data for each quarter in 2004 and does not present data for all of fiscal year 2004.
• In the three time periods examined, total RC enlisted continuation rates were 83 percent or 85 percent; total RC officers’ continuation rates were 88 percent or 89 percent (see table 38).
• In fiscal years 2002 and the fourth quarter of 2004, continuation rates for servicemembers in the Air National Guard were higher than those for servicemembers in the other reserve components.
Type of RC subgroup
RC continuation rate (percent)
Enlisted personnel Officers
Fiscalyear2000
Fiscalyear2002
Fiscal year2004
(4th quarter)
Fiscalyear2000
Fiscalyear2002
Fiscal year2004
(4th quarter)
Component Army Reserve 78 80 82 83 87 87
Army National Guard 83 83 85 91 92 92
Navy Reserve 80 81 80 87 85 86
Marine Corps Reserve 78 80 79 82 83 79
Air Force Reserve 89 93 89 91 92 90
Air National Guard 90 94 91 92 94 93
Total 83 85 85 88 89 89
Page 112 GAO-05-952 Military Demographics

Retention
Table 39: Continuation Rates for RC Servicemembers by Years of Service in Fiscal Years 2002 and the Fourth Quarter of Fiscal Year 2004
Source: Official Guard & Reserve Manpower Strengths & Statistics: FY 2004.
• Table 39 shows that, for RC enlisted personnel in 2002 and the fourth quarter of 2004, continuation rates were generally high at 1 to 3 years of service (82 to 89 percent). Rates were even higher at 15 years of service (93 to 94 percent).
• Continuation rates among officers were higher at 15 years of service (94 and 95 percent) than at other years of service examined.
Years of service
RC continuation rate (percent)
Enlisted personnel Officers
2002 2004 (4TH quarter) 2002 2004 (4TH quarter)
1 82 85 93 94
2 84 89 89 92
3 84 88 89 90
4 82 87 89 92
5 68 73 86 88
6 74 77 89 89
10 85 85 90 90
15 94 93 94 95
20 88 84 88 87
25 86 83 87 86
Page 113 GAO-05-952 Military Demographics
Casualties
Additional Question and Summary of Approach
What are the Characteristics of Servicemembers Who Died or Were Wounded in Combat in Iraq and Afghanistan in Support of Operations Iraqi Freedom and Enduring Freedom?
DOD provided GAO with data on characteristics of servicemembers who died or were wounded while serving in Operations Enduring Freedom and Iraqi Freedom as of May 28, 2005. For each person listed as a casualty, the data included the operation in which the casualty occurred, type of casualty, service and component, pay grade, race/ethnicity, and gender. For reservists, the Office of the Secretary of Defense for Accession Policy also used the home-of-record zip code and the previously cited marketing software to (1) determine the population density (town/rural, suburban, or urban) of the servicemember’s community and (2) estimate the average socioeconomic level of the servicemember’s community because DOD does not have a record of socioeconomic level for each individual servicemember’s family. Similar population density and socioeconomic level analyses were not conducted on active duty personnel because the findings would have largely been influenced by the clustering of AC servicemembers in the immediate vicinity of a limited number of military installations. Also, some AC servicemembers’ home of record may reflect their current address, whereas others might not have changed their home of record from where they lived years earlier.
Summary of Findings
Historical overview of deaths
As of May 28, 2005, the number of deaths from the two examined operations were almost five times those sustained during the first Persian Gulf War but were a fraction of the deaths sustained during the Vietnam Conflict and Korean War.
Deaths As of May 28, 2005, 1,841 servicemembers died while serving in Operations Iraqi Freedom and Enduring Freedom. The majority of deaths involved servicemembers who were active Army or Marine Corps, White, junior enlisted, males, between the ranks of E1 to E4.
Page 114 GAO-05-952 Military Demographics

Casualties
Wounded As of May 28, 2005, a total of 12,658 servicemembers had been wounded while serving in Operation Iraqi Freedom, and Enduring Freedom. Forty-seven percent of those wounded while serving in Operation Iraqi Freedom and 23 percent of those wounded while serving in Operation Enduring Freedom returned to duty within 72 hours. The majority of wounded servicemembers were active Army or Marine Corps, White, junior enlisted, males, between the ranks of E1 to E4.
Page 115 GAO-05-952 Military Demographics

Casualties
Findings
Historical Overview of Deaths—Servicemember Deaths in Selected Current and Past Military Operations and the Race/Ethnicity of Those Who Died
Table 40: Number and Percent of Servicemembers in Racial/Ethnic Subgroups Who Died in Selected Military Operations as of May 28, 2005
Sources: Data on active duty deaths for the Korean War, Vietnam Conflict, and the Persian Gulf War (also known as Operations Desert Shield/Storm) are from Washington Headquarters Service’s Web site, web1.whs.osd.mil, downloaded on April 1, 2005. Deaths during Operations Enduring and Iraqi Freedom are a GAO analysis of DOD-provided data.
Note: Columns may not total 100 percent due to rounding.
• Table 40 shows that as of May 28, 2005, the combined deaths for Operations Iraqi Freedom and Enduring Freedom were nearly five times the number of deaths in the Persian Gulf War, but about 5 percent and 3 percent the number of deaths in the Korean War and Vietnam Conflict, respectively.
Racial/Ethnic subgroup
Servicemember deaths
Korean War Vietnam Conflict Persian Gulf War
Operations IraqiFreedom and Enduring
Freedom
# % # % # % # %
White 29,274 80 49,810 86 292 76 1296 70
African American 3,075 8 7,241 12 66 17 191 10
Hispanic 881 2 349 1 15 4 183 10
Asian American/Pacific Islander 389 1 368 1 3 1 65 4
American Indian/Alaskan Native 104 <1 226 <1 3 1 17 1
Other/Multiple race/Unknown 2,853 8 204 <1 3 1 89 5
Total deaths 36,576 100 58,198 100 382 100 1,841 100
Page 116 GAO-05-952 Military Demographics
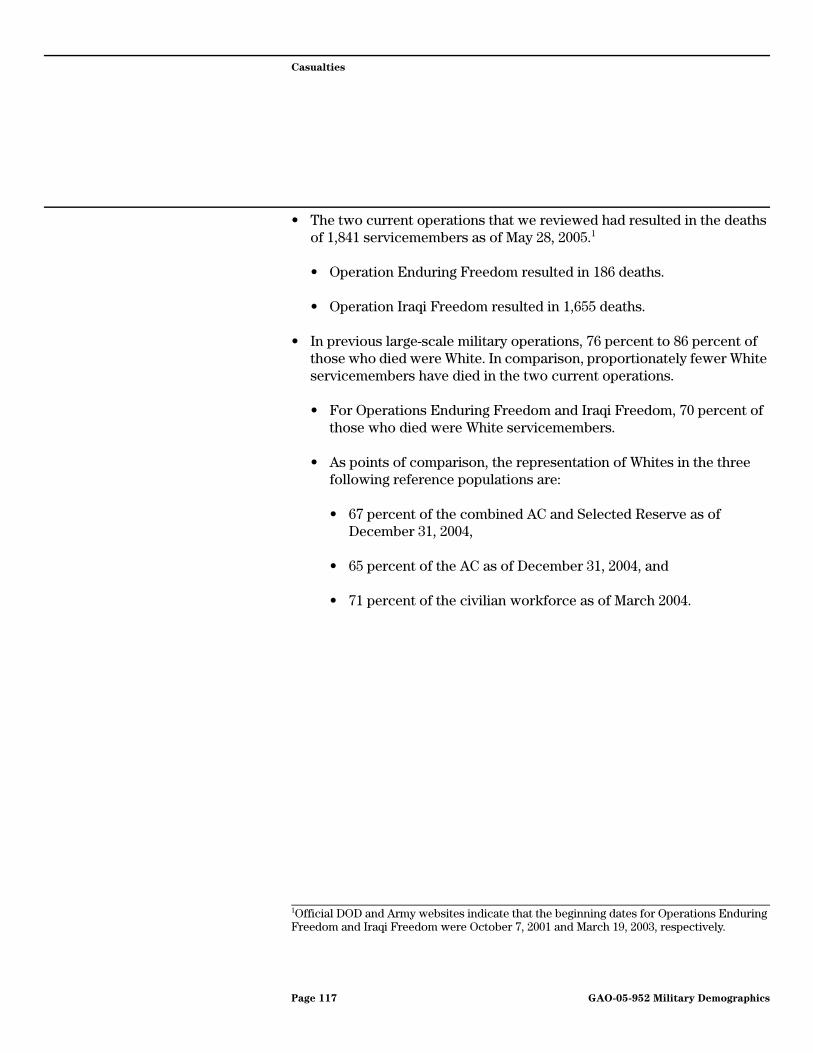
Casualties
• The two current operations that we reviewed had resulted in the deaths of 1,841 servicemembers as of May 28, 2005.1
• Operation Enduring Freedom resulted in 186 deaths.
• Operation Iraqi Freedom resulted in 1,655 deaths.
• In previous large-scale military operations, 76 percent to 86 percent of those who died were White. In comparison, proportionately fewer White servicemembers have died in the two current operations.
• For Operations Enduring Freedom and Iraqi Freedom, 70 percent of those who died were White servicemembers.
• As points of comparison, the representation of Whites in the three following reference populations are:
• 67 percent of the combined AC and Selected Reserve as of December 31, 2004,
• 65 percent of the AC as of December 31, 2004, and
• 71 percent of the civilian workforce as of March 2004.
1Official DOD and Army websites indicate that the beginning dates for Operations Enduring Freedom and Iraqi Freedom were October 7, 2001 and March 19, 2003, respectively.
Page 117 GAO-05-952 Military Demographics

Casualties
Deaths—Operation in Which the Death Occurred and the Circumstance of Death
Table 41: Operation and Circumstance of Death of the 1,841 Servicemembers Who Died in Operations Iraqi Freedom and Enduring Freedom as of May 28, 2005
Source: GAO analysis of DOD-provided data.
Notes: Operation Iraqi Freedom includes casualties in Iraq as well as in other countries such as Germany. Operation Enduring Freedom includes casualties in Afghanistan, the Philippines, Pakistan, Kuwait, Persian Gulf, Guantanamo Bay, Djibouti, Uzbekistan, Arabian Sea, Qatar, and the North Arabian Peninsula.
The totals for operation and circumstance of death may not sum to 100 percent due to rounding. To calculate row totals, we counted <1s as 0s. Therefore, the actual row totals may differ from those in the table.
Table 41 provides information on the operation, service, and circumstance of death for the 1,841 servicemembers who died in support of Operations Iraqi Freedom and Enduring Freedom as of May 28, 2005.
• Operation—Operation Iraqi Freedom accounted for about 91 percent (1,655) of the deaths, and Operation Enduring Freedom accounted for 10 percent (186).
Operation and circumstance of death
Percent of deaths in Operations Iraqi Freedom and Enduring Freedom
Army Marine Corps Navy Air Force Total
Operation Iraqi Freedom 61 27 2 1 91
Enduring Freedom 7 1 1 1 10
Circumstance of death
Killed in action 36 18 1 1 56
Died of wounds 13 3 <1 <1 16
Accident 13 5 <1 1 19
Illness 2 <1 <1 <1 2
Self-inflicted 2 <1 <1 <1 2
Pending 1 <1 <1 <1 1
Other 1 <1 <1 <1 1
Page 118 GAO-05-952 Military Demographics
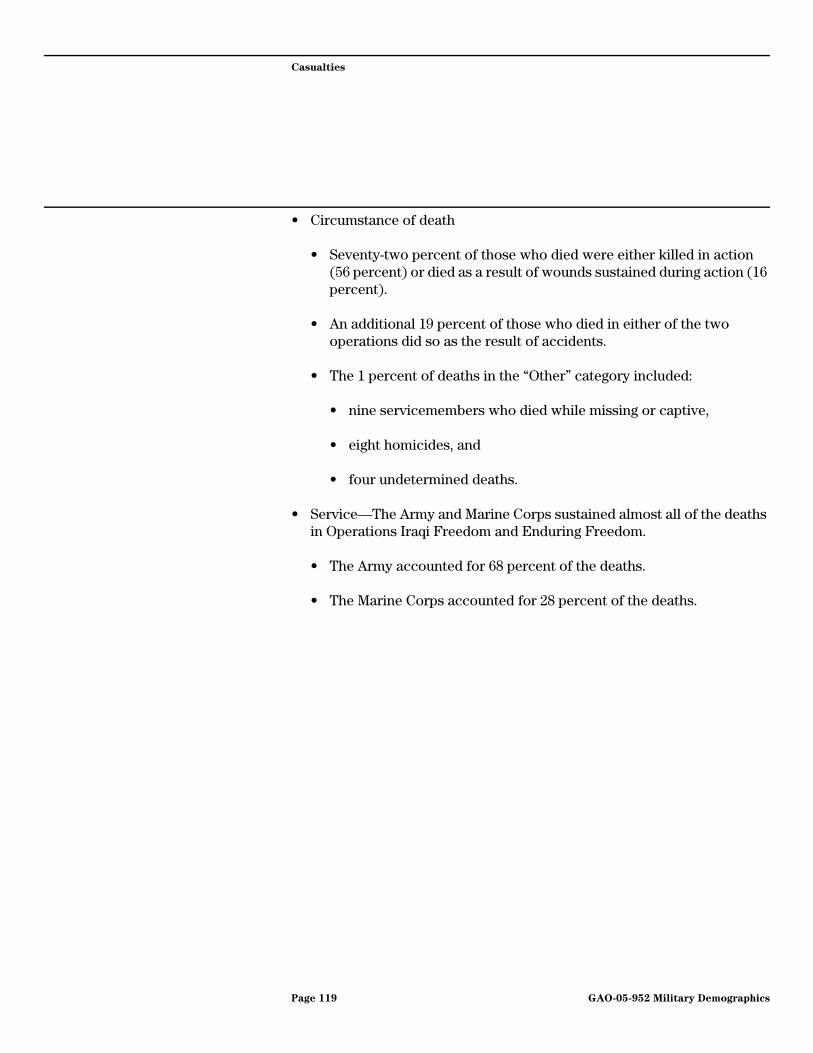
Casualties
• Circumstance of death
• Seventy-two percent of those who died were either killed in action (56 percent) or died as a result of wounds sustained during action (16 percent).
• An additional 19 percent of those who died in either of the two operations did so as the result of accidents.
• The 1 percent of deaths in the “Other” category included:
• nine servicemembers who died while missing or captive,
• eight homicides, and
• four undetermined deaths.
• Service—The Army and Marine Corps sustained almost all of the deaths in Operations Iraqi Freedom and Enduring Freedom.
• The Army accounted for 68 percent of the deaths.
• The Marine Corps accounted for 28 percent of the deaths.
Page 119 GAO-05-952 Military Demographics
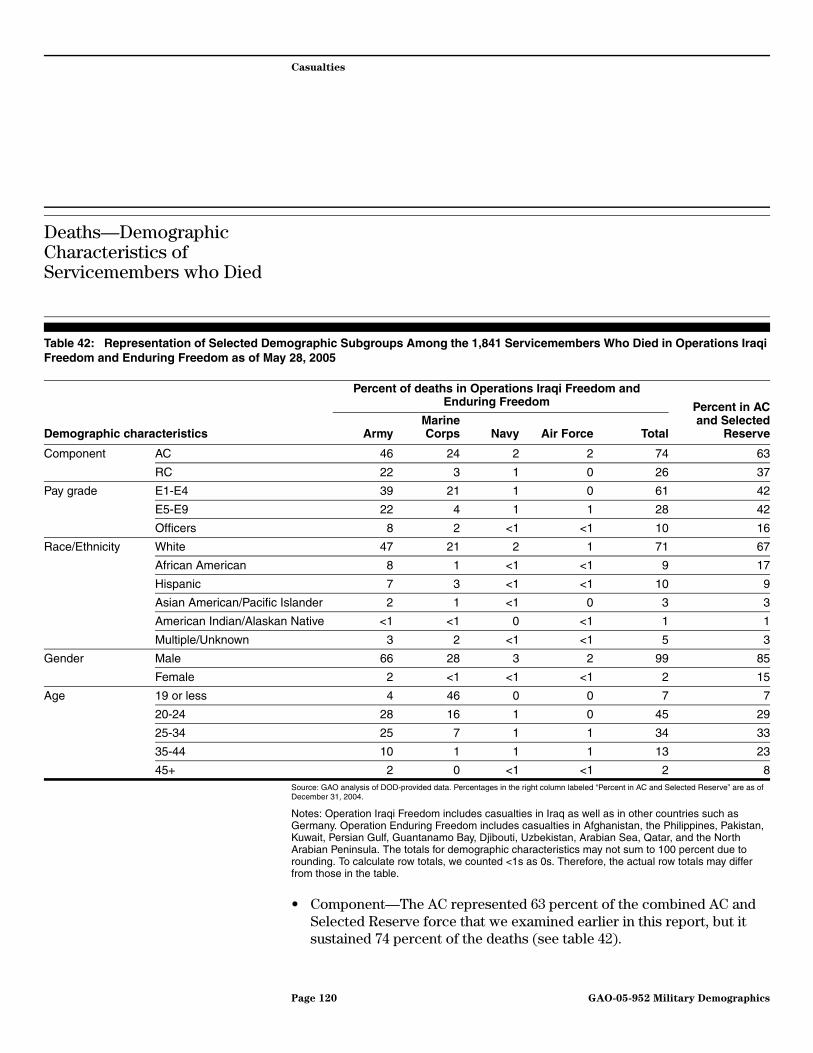
Casualties
Deaths—Demographic Characteristics of Servicemembers who Died
Table 42: Representation of Selected Demographic Subgroups Among the 1,841 Servicemembers Who Died in Operations Iraqi Freedom and Enduring Freedom as of May 28, 2005
Source: GAO analysis of DOD-provided data. Percentages in the right column labeled “Percent in AC and Selected Reserve” are as of December 31, 2004.
Notes: Operation Iraqi Freedom includes casualties in Iraq as well as in other countries such as Germany. Operation Enduring Freedom includes casualties in Afghanistan, the Philippines, Pakistan, Kuwait, Persian Gulf, Guantanamo Bay, Djibouti, Uzbekistan, Arabian Sea, Qatar, and the North Arabian Peninsula. The totals for demographic characteristics may not sum to 100 percent due to rounding. To calculate row totals, we counted <1s as 0s. Therefore, the actual row totals may differ from those in the table.
• Component—The AC represented 63 percent of the combined AC and Selected Reserve force that we examined earlier in this report, but it sustained 74 percent of the deaths (see table 42).
Demographic characteristics
Percent of deaths in Operations Iraqi Freedom and Enduring Freedom Percent in AC
and SelectedReserveArmy
MarineCorps Navy Air Force Total
Component AC 46 24 2 2 74 63
RC 22 3 1 0 26 37
Pay grade E1-E4 39 21 1 0 61 42
E5-E9 22 4 1 1 28 42
Officers 8 2 <1 <1 10 16
Race/Ethnicity White 47 21 2 1 71 67
African American 8 1 <1 <1 9 17
Hispanic 7 3 <1 <1 10 9
Asian American/Pacific Islander 2 1 <1 0 3 3
American Indian/Alaskan Native <1 <1 0 <1 1 1
Multiple/Unknown 3 2 <1 <1 5 3
Gender Male 66 28 3 2 99 85
Female 2 <1 <1 <1 2 15
Age 19 or less 4 46 0 0 7 7
20-24 28 16 1 0 45 29
25-34 25 7 1 1 34 33
35-44 10 1 1 1 13 23
45+ 2 0 <1 <1 2 8
Page 120 GAO-05-952 Military Demographics

Casualties
• Pay grade
• The death rate for junior enlisted personnel was 19 percentage points higher than their representation in the combined AC and Selected Reserve on December 31, 2004.
• The death rates for both senior enlisted personnel and officers were lower than their representation in the force.
• Race/ethnicity
• Whites constituted 67 percent of the AC and Selected Reserve on December 31, 2004, but sustained proportionately more (71 percent) of the deaths resulting from Operations Iraqi Freedom and Enduring Freedom.
• In contrast, African Americans were 17 percent of the described force, and 9 percent of those killed in the two operations.
• For the other four racial/ethnic subgroups, all of the comparisons of the force-to-death rates were within 2 percentage points.
• Gender—Males constituted 85 percent of the examined force while sustaining 99 percent of the deaths.
Page 121 GAO-05-952 Military Demographics

Casualties
Deaths—Population Density and Estimated Socioeconomic Status for Reservists
Table 43: Community Population Density and Estimated Socioeconomic Status of the 482 Reservists Who Died in Operations Iraqi Freedom and Enduring Freedom as of May 28, 2005
Source: GAO analysis of DOD-provided data.
Notes: Ninety-eight servicemembers whose zip-codes were unknown are not included in these analyses. Operation Iraqi Freedom includes casualties in Iraq as well as in other countries such as Germany. Operation Enduring Freedom includes casualties in Afghanistan, the Philippines, Pakistan, Kuwait, Persian Gulf, Guantanamo Bay, Djibouti, Uzbekistan, Arabian Sea, Qatar, and the North Arabian Peninsula. The totals for characteristics derived from home community zip code may not sum to 100 percent due to rounding. To calculate row totals, we counted <1s as 0s. Therefore, the actual row totals may be higher than those in the table.
Table 43 provides the population density and estimated socioeconomic status on the 482 reservists who died in Operations Iraqi Freedom and Enduring Freedom as of May 28, 2005.2
• The reservists who died were more likely to come from town/rural and urban areas and less likely to come from areas that DOD has identified as suburban (based on the reservists’ zip codes).
Characteristics derived from home community zip code
Percent of deaths in Operations Iraqi Freedom and Enduring Freedom
ArmyMarineCorps Navy Air Force Total
Population density of home community
Urban 26 4 0 0 30
Suburban 12 4 2 <1 18
Town/rural 48 3 0 1 52
Estimated socioeconomic status
High 9 3 0 1 13
Medium 50 6 2 <1 58
Low 27 2 0 0 29
2A GAO analysis of the DOD-provided data identified 482 servicemembers who died as reservists.
Page 122 GAO-05-952 Military Demographics

Casualties
• Nearly one of every three (30 percent) came from the 14 percent of communities with the highest population density and were labeled as urban by DOD.
• Over half (52 percent) of deceased reservists came from the 40 percent of communities with the lowest population density by DOD.
• In contrast, 18 percent of the deceased reservists were from the 46 percent of communities that were labeled as suburban by DOD.
• Almost 6 of 10 (58 percent) deceased reservists came from communities that DOD—through use of commercial marketing software and zip codes—classified as being of medium socioeconomic status.3
• Because of the previously discussed limitations with using zip codes and community-based characteristics to estimate individuals’ actual socioeconomic status, these findings (and later similar findings on wounded servicemembers) need to be viewed with caution.
3The marketing software used by DOD assigns socioeconomic status to communities based upon economic and social information from federal and commercial databases. The software partitions the U.S. into market segments with unique socioeconomic characteristics.
Page 123 GAO-05-952 Military Demographics

Casualties
Wounded—Operation in which Servicemembers Were Wounded and Analysis of the Wounded by Service
Table 44: Operation for the 12,658 Servicemembers Who Were Wounded in Operations Iraqi Freedom and Enduring Freedom as of May 28, 2005
Source: GAO analysis of DOD-provided data.
Notes: Operation Iraqi Freedom includes casualties in Iraq as well as in other countries such as Germany. Operation Enduring Freedom includes casualties in Afghanistan, the Philippines, Pakistan, Kuwait, Persian Gulf, Guantanamo Bay, Djibouti, Uzbekistan, Arabian Sea, Qatar, and the North Arabian Peninsula. The totals for operation may not sum to 100 percent due to rounding. To calculate row totals, we counted <1s as 0s. Therefore, the actual row totals may be higher than those in the table.
Table 44 provides the operation and service of the 12,658 servicemembers who were wounded in support of Operations Iraqi Freedom and Enduring Freedom as of May 28, 2005.
• Operation—97 percent of the wounded servicemembers received their wounds in Operation Iraqi Freedom, and 3 percent received theirs in Operation Enduring Freedom.
• Wounded while in action—The Army sustained nearly two-thirds (65 percent) of the wounded personnel in the two operations, and Marines accounted for most (31 percent) of the remaining wounded servicemembers. As we showed earlier when answering question 1:
• the Army represents almost half (46 percent) of the combined AC and Selected Reserve examined, and
• the Marine Corps represents about 10 percent of all examined servicemembers.
Operation
Percent of wounded in Operations Iraqi Freedom and Enduring Freedom
Army Marine Corps Navy Air Force Total
Operation Iraqi Freedom 63 31 2 1 97
Enduring Freedom 3 <1 <1 <1 3
Wounded while in action 65 31 2 2 100
Page 124 GAO-05-952 Military Demographics
Casualties
• Forty-seven percent (5,723 servicemembers) of those wounded while serving in Operation Iraqi Freedom returned to duty within 72 hours.
• Twenty-three percent (108 servicemembers) of those wounded while serving in Operation Enduring Freedom returned to duty within 72 hours.
Page 125 GAO-05-952 Military Demographics

Casualties
Wounded—Demographic Characteristics of Servicemembers Who Were Wounded
Table 45: Representation of Selected Demographic Subgroups Among the 12,658 Servicemembers Who Were Wounded in Operations Iraqi Freedom and Enduring Freedom as of May 28, 2005
Source: GAO analysis of DOD-provided data. Percentages in the right column labeled “Percent in AC and Selected Reserve” are as of December 31, 2004.
Notes: Gender-179 Marine Corps servicemembers whose gender was reported as “unknown” or “not captured” in DOD reports were added to the male gender subgroup. Age-1065 servicemembers were of unknown age. The totals for demographic characteristics may not sum to 100 percent due to rounding. To calculate row totals, we counted <1s as 0s. Therefore, the actual row totals may be higher than those in the table.
Demographic characteristics
Percent of wounded in Operations Iraqi Freedom and Enduring Freedom Percent in AC
and SelectedReserveArmy
MarineCorps Navy Air Force Total
Component AC 45 27 2 1 75 63
RC 21 3 <1 <1 24 37
Pay grade E1-E4 39 24 1 1 65 42
E5-E9 22 5 1 1 29 42
Officers 5 2 <1 <1 7 16
Race/ethnicity White 46 22 1 1 70 67
African American 7 1 <1 <1 8 17
Hispanic 7 4 <1 <1 11 9
Asian American/ Pacific Islander 2 1 <1 <1 3 3
American Indian/ Alaskan Native 1 <1 <1 0 1 1
Multiple/unknown <1 2 <1 <1 2 3
Gender Male 63 29 2 1 95 85
Female 2 <1 0 <1 2 15
Age 19 or less 4 10 <1 <1 14 7
20-24 28 14 1 <1 43 29
25-34 24 6 1 1 32 33
35-44 8 1 <1 <1 9 23
45+ 1 <1 <1 <1 1 8
Page 126 GAO-05-952 Military Demographics

Casualties
• Component—Three-fourths of the wounded servicemembers were from the AC, and 24 percent were from the RC (see table 45). In comparison, the AC was almost two-thirds (63 percent) and the RC was about one-third (37 percent) of the combined AC and Selected Reserve as of December 31, 2004.
• Pay grade—Nearly two-thirds (65 percent) of wounded servicemembers were junior enlisted personnel in pay grades E4 and below. As we showed earlier, junior enlisted comprise 42 percent of the examined AC and RC.
• Race/Ethnicity—The representation of Whites and African Americans among those wounded is different from their representation among the 2.2 million AC and Selected Reserve servicemembers in the military as of December 31, 2004.
• The representation of Whites among the wounded (70 percent) was 3 percentage points higher than their representation in the examined force (67 percent).
• In contrast, the representation of African Americans among the wounded was 9 percentage points less than their 17 percent representation in the force.
• For each of the other four racial/ethnic subgroups, their percentage for wounded and their representation in the force were within 2 percentages of one another.
• Gender—Males constituted 95 percent of the wounded, but they were 85 percent of the examined force.
Page 127 GAO-05-952 Military Demographics

Casualties
Wounded—Population Density and Estimated Socioeconomic Status for Reservists
Table 46: Community Population Density and Estimated Socioeconomic Status of the 3,197 Reservists Who Were Wounded in Operations Iraqi Freedom and Enduring Freedom as of May 28, 2005
Source: GAO analysis of DOD-provided data.
Note: Four hundred and sixty servicemembers whose zip codes were unknown are not included in this analysis. The totals for characteristics derived from home community zip code may not sum to 100 percent due to rounding. To calculate row totals, we counted <1s as 0s. Therefore, the actual row totals may be higher than those in the table.
• Table 46 shows that of the 3,197 reservists who were wounded in Operations Iraqi Freedom and Enduring Freedom as of May 28, 2005,4
• 29 percent were from the 14 percent of communities with the highest population density and which were labeled as urban by DOD, and
• over half (51 percent) were from the 40 percent of communities that had the lowest population density and were labeled as town/rural by DOD.
• The majority (59 percent) of wounded reservists came from communities that DOD—through the use of commercial marketing
Characteristics derived from home community zip code
Percent of wounded in Operations Iraqi Freedom and Enduring Freedom
Army Marine Corps Navy Air Force Total
Population density of home community
Urban 26 3 <1 <1 29
Suburban 15 2 1 <1 18
Town/rural 47 3 <1 1 51
Estimated socioeconomic status
High 9 1 0 <1 10
Medium 51 5 2 1 59
Low 28 2 <1 <1 30
4A GAO analysis of the DOD-provided data identified 3,197 wounded servicemembers as reservists.
Page 128 GAO-05-952 Military Demographics

Casualties
software and zip codes—classified as being of medium socioeconomic status.
• Ten percent of wounded reservists came from communities DOD identified as being of high socioeconomic status, while
• Thirty percent of wounded reservists came from communities DOD characterized as being of low socioeconomic status.
Page 129 GAO-05-952 Military Demographics

Conclusions
Eight years after the announcement and 2½ years beyond the required date, DOD and the components are still in the process of implementing the Office of Management and Budget’s 1997 guidance on gathering and reporting racial and ethnic subgroup membership. Consequently, at this time, comparing the distribution of race and ethnicity in the military to that of the U.S. population yields an imprecise estimate of the extent to which the military reflects the larger society on these demographic characteristics. In addition, because the components have taken different approaches to updating servicemember records, the extent to which direct comparisons of race and ethnicity across the components yield reliable and accurate results is unclear at this time. DOD’s reporting on the percentage of Hispanics is particularly problematic. The 1997 guidance on how federal agencies should collect and report racial and ethnic data enabled individuals to indicate whether or not they are Hispanic separately from their racial group. In contrast, the prior procedures for data gathering and reporting did not allow an individual to report that she or he was both Hispanic and a member of a racial subgroup. As a result of failing to use the revised procedures that require separate tabulations of racial and ethnic subgroup membership, DOD’s internal reports may introduce uncertainty about membership in racial subgroups since anyone identified as Hispanic was not also included in a racial subgroup. Additionally, because DOD’s internal reports assign all servicemembers of Hispanic ethnicity to one racial subgroup irrespective of the race to which they actually belong, DOD’s data tabulation and recoding of race and ethnicity may undercount the number of racial minorities in the military.
Although there is congressional and public interest in the socioeconomic status of the households and the types of communities from which recruits are drawn, DOD has not routinely reported such information in recent years. Without current information on the socioeconomic status of servicemembers, DOD cannot accurately and reliably respond to concerns that particular socioeconomic subgroups are underrepresented among those serving in the military. We listed problems associated with the measure DOD recently used to identify socioeconomic status for the analyses included in this report. The challenges associated with the former and current measurements of socioeconomic status might suggest that there is still a need for accurate information on this demographic characteristic. In contrast, DOD’s use of zip codes may provide an adequate measure of the population density (for example, rural, urban, and suburban) of recruits’ home of record once DOD has had more of an opportunity to explore the strengths and weaknesses of the commercial marketing software used in the analyses and the types of information that
Page 130 GAO-05-952 Military Demographics

Conclusions
DOD gathers on recruits. DOD’s prompt efforts to fill the void of information on recruits’ communities were responsive to the needs of Congress and the public for this type of information, but longer term use of analyses of this type could identify problems that were not detected in this initial set of analyses. Without ongoing research on recruits’ socioeconomic status and communities, DOD will not be able to promptly and accurately inform Congress and the public about how representation in the services matches that of the applicable U.S. population.
Continuation rates for Active Component servicemembers are available from a Defense Manpower Data Center Web site to individuals who have been granted access by DOD, but active duty continuation rates are not routinely published. As a result, Congress and interested members of the public may not be fully aware of the large percentage of personnel that the services retain each year. Also, the current high operational tempo of both active duty and reserve component servicemembers has raised concerns about the extent to which servicemembers, particularly reservists, will continue their military service in the future. Without better access to this type of data and the ability to identify and monitor changes in retention, Congress may not have the information it needs to (1) provide oversight of DOD and (2) address retention issues whenever they may begin to emerge. Also, failure to make the ongoing retention findings more accessible may require other specialized efforts or studies to obtain that information.
Page 131 GAO-05-952 Military Demographics
Recommendations for Executive Action
To improve the ability of the public, department, and Congress to identify and monitor demographic changes in the race, ethnicity, socioeconomic status, and community population density of servicemembers in the All-Volunteer Force and to enhance Congress’s ability to perform its oversight functions, we recommend that the Secretary of Defense direct the Under Secretary of Defense for Personnel and Readiness to take the following four actions:
• Gather and report data on racial and ethnic subgroup membership in a manner that is consistent with the required procedures set forth by the Office of Management and Budget in 1997. In addition to requiring that recruits provide their racial and ethnic subgroup membership using revised categories and procedures, DOD should also determine procedures that could be used for updating the information on servicemembers who previously provided their racial and ethnic subgroup membership with different subgroup categories and questions.
• Conduct research to determine a feasible process for assessing the socioeconomic status of recruits, implement that process, and periodically include findings on the socioeconomic status of recruits’ households in annual reports on servicemembers in the active and reserve components.
• Conduct research to determine a feasible process for assessing the type of community (for example, rural, suburban, and urban) from which recruits were drawn and periodically include a measure of population density in the annual reports that describe the demographic characteristics of recruits in the active and reserve components.
• Include continuation rates on active and reserve component personnel in DOD’s annual demographic reports. Implementation of the recommendation could use findings from the analyses that the Defense Manpower Data Center already conducts for the department.
Page 132 GAO-05-952 Military Demographics
Agency Comments and Our Evaluation
In commenting on a draft of this report, DOD concurred with our four recommendations and indicated the department is currently working with the Defense Manpower Data Center (DMDC) to determine how best to capture the data recommended in our report. DOD further indicated that the coordination will continue until a viable methodology is established and data are reported. DOD pointed out, and we agree, that measures of recruits’ socioeconomic status and community population density are unlikely to significantly change from one year to the next and that such measures need not be published every year. We have revised our second and third recommendations to reflect this. DOD’s comments are reprinted in their entirety in appendix V.
Page 133 GAO-05-952 Military Demographics

Appendix I
AppendixesScope and Methodology Appendix I
To compare the demographic characteristics of servicemembers in the active components or in the Selected Reserve to those of similarly aged and educated civilians in the U.S. workforce, we began by reviewing applicable laws, such as the National Defense Authorization Acts of fiscal years 1992, 1993, and 1994, which enabled women to be permanently assigned to combat aircraft and combatant ships; Executive Order 13269 which shortened the time noncitizens must wait before receiving citizenship, and United States Code Title 10 Section 520 which established enlistment aptitude standards. We reviewed Department of Defense-wide and service-specific policies such as DOD Instruction 1336.5, Automated Extract of Active Duty Military Personnel Records; DOD Instruction 7730.54, Reserve Components Common Personnel Data System; and DOD Directive 1205.17, Official National Guard and Reserve Component Personnel Data. We also reviewed U.S. Census Bureau technical reports such as the Current
Population Survey Technical Paper 63RV: Design and Methodology. We visited or conducted telephone interviews with DOD and service officials from the following offices: Office of the Secretary of Defense (Reserve Affairs); Defense Manpower Data Center (both East and West-coast offices); Office of the Deputy Under Secretary of Defense (Equal Opportunity); Office of Army Demographics; U.S. Army Research Institute for the Behavioral and Social Sciences; and the Office of Naval Personnel, Research, Studies and Technology. We also visited or conducted telephone interviews with experts from academic and private-sector organizations conducting military personnel research including the Center for Naval Analyses, Center for Research on Military Organization at the University of Maryland, and RAND. We obtained and analyzed data extracted by the Defense Manpower Data Center from the Active Duty Master Personnel File and the Reserve Components Common Personnel Data System. These extracts contained selected variables on the over 2.2 million active duty and Selected Reservists in the military on December 31, 2004. We limited our analyses of reservists to only those in the Selected Reserve (see app. III for more information on reserve personnel categories) because we wanted to compare our findings to those contained in DOD’s annual Population
Representation in the Military Services.1 We also compared the results of our analyses of servicemembers to those published in the December 2004 Defense Manpower Data Center (DMDC) EO 3035 report. To identify the demographic characteristics of comparable civilian personnel, we analyzed data from the Annual Social and Economic Supplement of the Current
1The report can be accessed at the home page for the Office of the Secretary of Defense for Personnel and Readiness at http://www.dod.mil/prhome/poprep2003.
Page 134 GAO-05-952 Military Demographics

Appendix I
Scope and Methodology
Population Survey on employed civilians who were 18-49 years of age and possessed at least a high school diploma or equivalent. We determined that this subset of the United States population is comparable to AC and Selected Reserve personnel because the majority of servicemembers are in this age range, have a high school diploma or equivalent certification, and, by nature of their military affiliation, receive some type of compensation in exchange for their service. This subsetting resulted in 64,414 survey respondents (representing 87,411,786 Americans or almost a third of the total U.S. population2) being included in our civilian analyses. We did not use data from the 2000 decennial census for these and other analyses in this report because we determined that the cost and time required to procure the special analyses we needed would negatively affect our ability to produce a timely report.
To assess the extent to which the services met their recruitment goals and the factors that influence an individual’s decision to join or not join the military, we examined applicable federal statutes such as Section 520 of Title 10 United States Code and reviewed DOD and service-specific policies on the qualification standards for enlistment such as DOD Directive 1304.26, Qualification Standards for Enlistment, Appointment, and
Induction, and DOD Instruction 6130.4, Medical Standards for
Appointment, Enlistment, or Induction in the Armed Forces. We also examined DOD policy on reenlistment incentives and contacted, visited, conducted telephone interviews, or collected studies on recruiting, the youth population, and related issues from the following offices: Department of Defense Joint Advertising, Market Research and Studies; Office of the Secretary of Defense for Accession Policy; Office of the Secretary of Defense for Reserve Affairs (Manpower and Personnel); U.S. Military Entrance Processing Command; U.S. Army Accessions Command; Office of the Deputy Assistant Secretary of the Army for Human Resources; U.S. Army Personnel Command; Office of the Assistant Secretary of the Navy for Manpower and Reserve Affairs; Navy Recruiting Command, Marine Corps Recruiting Command; Marine Corps Office of Equal Opportunity; Air Force Education and Training Command; Air Force Personnel Center; Air Force Reserve Personnel Directorate, Air Force Office of Testing Policy and Research Integration; Centers for Naval Analysis; RAND; and the Center for Research on Military Organization at the University of Maryland. We obtained information on DOD’s expenditures on enlistment incentives from the Office of the Secretary of
2Based on a total U.S. population size of 281,421,906, as determined by the 2000 census.
Page 135 GAO-05-952 Military Demographics

Appendix I
Scope and Methodology
Defense (Compensation). We accessed and evaluated data from DMDC’s Information Delivery System (DOD’s data warehouse) and Defense Market Research Executive Notes. We obtained the results of a study jointly performed by the Office of the Secretary of Defense (Accession Policy) and the Center for Army Accessions on the socioeconomic status and community population density of over 1 million active and reserve component recruits. We evaluated whether or not there has been a change in the extent to which members of racial/ethnic subgroups are entering the military by analyzing the race and ethnicity of almost 540,000 active duty servicemembers with 1 year or less of military service in fiscal years 2000, 2002, and 2004.
To identify the demographic characteristics of servicemembers who remained in the military and address our third objective, we reviewed DOD retention and recruiting announcements, examined data on the services’ retention goals and achievements for AC enlistment retention for each fiscal year from 2000 through February 2005, and collected previously published research by RAND, the Centers for Naval Analysis, and the Center for Research on Military Organization at the University of Maryland. We interviewed an official from the Officer and Enlisted Personnel Management Directorate in the Office of the Secretary of Defense and discussed retention with subject matter experts at RAND and the Center for Research on Military Organization at the University of Maryland. We accessed DOD’s Information Delivery System and obtained the continuation rates for AC servicemembers and we extracted RC continuation rates from Official Guard & Reserve Manpower Strengths &
Statistics: Fiscal Year 2004 Summary.
To identify the demographic characteristics of servicemembers who died or were wounded in combat in Iraq or Afghanistan in support of Operations Iraqi Freedom or Enduring Freedom, we requested that DOD’s Washington Headquarters Services provide information on each applicable servicemember. That office developed a file that combined casualty data obtained from Central Command with demographic data appended to each servicemember’s record by DMDC, using files that we had previously assessed for data reliability. The data reflect casualties as of May 28, 2005. To identify reservists’ socioeconomic status and their community’s population density we extracted the zip codes of reservists’ homes of record and requested that the Office of Secretary of Defense (Accession Policy) analyze them using PRIZM,® commercial marketing software by Claritas, Inc. which assigns zip-codes to 1 of 64 market segments based
Page 136 GAO-05-952 Military Demographics

Appendix I
Scope and Methodology
upon economic and social data from the Bureau of the Census and other sources.
We determined that the data used in the preparation of this report were sufficiently reliable to answer our objectives. For example, we interviewed personnel knowledgeable about the data sources we used, inquiring about their methods for ensuring that the data were accurate. We reviewed available data for inconsistencies and, when applicable, performed computer testing to assess data validity and reliability. Among other things, appendix II describes the primary databases from which we obtained data extracts.
We conducted our review between August 2004 and July 2005 in accordance with generally accepted government auditing standards.
Page 137 GAO-05-952 Military Demographics

Appendix II
Analytic Issues Appendix II
Datasets Used in Analyses
Data on servicemembers were primarily taken from two military databases and one monthly report. Data on civilians were primarily taken from a large-scale civilian survey.
Active Duty Military Personnel Master File
The Active Duty Military Personnel Master File is Department of Defense’s (DOD) centralized database of all individuals on active duty in the Army, Navy, Marine Corps, and Air Force.1 We used extracts that DOD provided from this file as the basis for all of our analyses of Active Component (AC) personnel. The file is maintained by the Defense Manpower Data Center (DMDC) which updates it monthly based upon information submitted from each of the services. The file contains information on personal characteristics such as name, social security number, date of birth, gender, race, ethnic group, and education, as well as information on military characteristics such as service, pay grade, months of service, and duty occupation. Data are available on active duty servicemembers back to 1971. The Active Duty Military Personnel Master File is also one source of information for demographic reports available through DOD’s Information Delivery System on active duty personnel.
Reserve Components Common Personnel Data System
The Reserve Components Common Personnel Data System is a centralized database of current and past members of the Army National Guard, Army Reserve, Navy Reserve, Marine Corps Reserve, Air Force Reserve, and Air National Guard, and is DOD’s official source of reserve accession, loss, and reenlistment information. The file was created in 1975 and is updated monthly based upon submissions by the reserve components. It contains information on reservists’ personal characteristics such as name, social security number, date of birth, gender, home address, and education, as well as information on their military characteristics such as service, reserve component, drilling status, prior service status, and date of initial entry into the reserve forces. This is also one source of information for demographic reports available through DOD’s Information Delivery System on reservists.
1It also contains data on active duty personnel in the Coast Guard, Public Health Service, and the National Oceanic and Atmospheric Administration who were not included in these analyses.
Page 138 GAO-05-952 Military Demographics

Appendix II
Analytic Issues
Defense Manpower Data Center EO 3035 Monthly Report
Each month the Defense Manpower Data Center produces an EO 3035 report which includes cross-tabulations of pay grade, gender, and race/ethnicity for servicemembers in each active duty component, the AC, and the Coast Guard. A separate, comparable report is compiled for the reserve components. The findings contained in the EO 3035 reports are computed using information from the active duty and reserve files described above. As mentioned earlier in this report, the six racial/ethnic categories tabulated are: White, American Indian/Alaskan Native, Asian American/Pacific Islander, Black, Hispanic, and Multiracial/Unknown. This differs from the 1997 guidance from the Office of Management and Budget on the separate reporting of race and ethnicity.
Current Population Survey Annual Social and Economic Supplement
The Current Population Survey is a monthly survey conducted via personal and telephone interviews by the Census Bureau. The survey, which is based on the civilian noninstitutional population of the United States, contains information such as age, education, gender, occupation, hours of work, number of jobs held, duration of unemployment, part- or full-time status, and earnings on about 112,000 persons living in almost 60,000 households. In March, the Census Bureau fields the Annual Social and Economic Supplement to provide additional labor force information on topics such as work experience, income, and benefits. Data for employment and income refer to the preceding year, although demographic data refer to the time of the survey. Therefore, our analysis of the March 2004 Current Population Survey Annual Social and Economic Supplement reflects respondents’ employment status in 2003 and their personal characteristics as of March 2004.
Tabulating Data on Race and Ethnicity
Although the current guidelines require that executive agencies identify new racial categories and separately report race and ethnicity, we decided to continue using the former racial/ethnic categories in a combined format because (1) data using the old racial/ethnic format were available on the majority of servicemembers we examined and (2) some military components are still transitioning to the new procedures.
To identify race/ethnicity in the DOD datasets, we first determined whether or not an individual was Hispanic by assigning to the Hispanic subgroup all servicemembers whose ethnic group on the DOD files was Cuban, Latin American with Hispanic descent, Mexican, Puerto Rican, or Other Hispanic descent. Next, we determined race by assigning servicemembers belonging
Page 139 GAO-05-952 Military Demographics
Appendix II
Analytic Issues
to a single race group to one of the following subgroups: White, African American, American Indian/Alaskan Native, and Asian (which includes Pacific Islanders, Asian Americans, and Native Hawaiians). Servicemembers for whom race was missing, unknown, or who had multiple races were assigned to one “Other/Unknown” race/ethnic subgroup.2
The revision of standards on the collection and reporting of data on race and ethnicity limits the ability to clearly discern changes in racial and ethnic representation before and after the new guidance was implemented. Additionally, because DOD components may be at differing stages of compliance with the 1997 guidance, tabulations of race and ethnicity over the next few years may reflect inconsistencies in the extent to which various federal organizations, both within and outside of DOD, have complied with the new directives. For these reasons, we decided to limit our analyses of racial and ethnic trends to only one analysis—an examination of AC servicemembers’ continuation rates in fiscal years 2000, 2002, and 2004 by race and ethnicity.
DOD Used Zip Codes to Estimate Recruits’ Socioeconomic Status and Community Population Density
DOD last reported the results of analyses on recruits’ socioeconomic status in the Population Representation in the Military Services: Fiscal Year
1999. At that time, the socioeconomic status of enlisted accessions was estimated from information recruits provided on family status; parental educational attainment, employment status, and occupation; and home ownership. A commonly used socioeconomic index based upon parents’ education, income, and occupational prestige was also created and analyzed.3
DOD has ceased routinely collecting this information from recruits and we were told that one problem with attempting to measure the socioeconomic status of youth’s households is that young people may not know their parents’ income or other information needed to create a measure of socioeconomic status. However, the March 2003 Status of Forces Survey of
2If we were able to determine that an individual belonged to more than one race, we also assigned that individual to the “Other/Unknown” racial/ethnic subgroup.
3The TSEI socioeconomic index is described in R.M. Hauser and J.R. Warren, Socioeconomic Indexes for Occupations: A Review, Update, and Critique (Madison, Wisc: Center for Demography and Ecology, October 1996).
Page 140 GAO-05-952 Military Demographics

Appendix II
Analytic Issues
Active Duty Members did ask active duty servicemembers to recall their family structure and the education, employment status, and occupation of their parents at the time they joined the military. Because of concerns about the reliability of data based upon respondents’ ability to recall circumstances of years past, we elected not to analyze and report these data.
To estimate recruits’ socioeconomic status and the home community population density in the absence of data supplied by recruits, military researchers in the Office of Accession Policy and the Army’s Center for Accessions Research matched recruits’ zip codes to public and private databases containing economic and social information on all U.S. zip codes. DOD used mean household income, as determined by Bureau of the Census estimates, as the indicator of socioeconomic status. To indicate the population density for recruits’ home communities, DOD classified the zip codes using two sets of definitions: (1) the Census Bureau’s definitions of rural and urban communities4 and (2) definitions of rural, suburban, and urban communities used by commercial marketing software. 5
Using zip codes as the basis for estimates of socioeconomic status and population density is admittedly flawed. The assumption that household income is the main determinate of status ignores the fact that household income may subject to temporary or seasonal fluctuations and that research shows that education and occupation are more stable, reliable indicators of socioeconomic status. Also, median household income may not be a meaningful reflection of status for individuals from economically stratified communities that are heavily populated by residents at either end of the economic spectrum. Similarly, using zip code as an indicator of community population density ignores the possibility that population clusters may form within a particular community.
Rounding Error We rounded percentages to whole numbers as follows. If the tenth place (first place to the right of the decimal) equaled .4 or below, we retained the
4The U.S. Census Bureau defines rural areas as open country and settlements with fewer than 2,500 residents. Urban areas, of which there are two types—urbanized areas and urban clusters—comprise larger places and the densely settled areas around them.
5DOD used marketing software developed by Claritas Inc. to group zip codes by population density.
Page 141 GAO-05-952 Military Demographics

Appendix II
Analytic Issues
original whole percentage. If the tenth place was .5 or above, we rounded up to the next highest whole percentage. Percentages that were more than 0 and less than .4 were written as <1.
Page 142 GAO-05-952 Military Demographics

Appendix III
Structure of the Reserve Component Appendix III
The Department of Defense has six reserve components: Army Reserve, Army National Guard, Navy Reserve, Marine Corps Reserve, Air Force Reserve, and Air National Guard. Reserve forces can be divided into three categories: Ready Reserve, Standby Reserve, and Retired Reserve. While the Army Reserve, Navy Reserve, Air Force Reserve, and Marine Corps Reserve each consist of all three types of reservists, the Army National Guard and Air National Guard are composed solely of Ready Reserve personnel.
Ready Reserve The Ready Reserve consists of Reserve Component units, individual reservists assigned to active component units, and individuals subject to recall to active duty to augment the active forces in time of war or national emergency. In fiscal year 2004, the Ready Reserve contained 1,145,035 servicemembers, comprising about 98 percent of the total reserve manpower. The Ready Reserve consists of three subgroups: the Selected Reserve, the Individual Ready Reserve, and the Inactive National Guard.
Selected Reserve This group comprises about 74 percent of the total reserve manpower and is composed of those units and individuals designated by their respective services and approved by the Chairman of the Joint Chiefs of Staff as so essential to initial wartime missions that they have priority for training, equipment, and personnel over all other reserve elements. The Selected Reserve, which contained 851,395 members in September 2004, is divided into three categories:
Unit members
Unit members include both part-time drilling reservists and two types of full-time unit support personnel: (1) Active Guard and Reserve personnel, whose duty it is to organize, administer, recruit, or train Reserve Component units and (2) Military technicians who are federal civilians providing full-time support for units.
Individual Mobilization Augmentees
Individual Mobilization Augmentees are trained individuals assigned to an active component.
Page 143 GAO-05-952 Military Demographics

Appendix III
Structure of the Reserve Component
Training pipeline
Reservists in the training pipeline are nondeployable personnel who have not yet completed initial active duty for training or are professional training.
Individual Ready Reserve (IRR) This group consists mainly of trained individuals who have previously served in Active Component units or in the Selected Reserve and who have a remaining military service obligation. Members of the Individual Ready Reserve are liable for involuntary mobilization to active duty for training or deployment. In fiscal year 2004, there were 284,201 reservists in this category.
Inactive National Guard This group consists of National Guard personnel who are attached to a specific unit but are temporarily unable to participate in regular training. Currently, this category is used only by the Army National Guard. In fiscal year 2004, there were 1,428 reservists in this category.
Standby Reserve Personnel assigned to the Standby Reserve have completed all obligated or required service or have been removed from the Ready Reserve because of civilian employment, temporary hardship, or disability. Standby Reservists maintain their military affiliation but are not required to perform training or to be assigned to a unit. In fiscal year 2004, there were 21,549 reservists in this category.
Retired Reserve The Retired Reserve consists of personnel who have been placed in a retirement status based on the completion of 20 or more qualifying years of Reserve Component or Active Component service. A member of the Retired Reserve does not receive retired pay until reaching age 60, unless he or she has 20 or more years of active duty military service. In fiscal year 2004, there were 1,132,454 former servicemembers who had retired from a reserve component.
Page 144 GAO-05-952 Military Demographics

Appendix IV
Military Occupational Specialties That Exclude Females Appendix IV
Table 47: Military Occupational Specialties That Exclude Females as of March 1997
DOD occupational code/ Military occupational specialty Service occupation title Army Navy
Marine Corps Air Force
0 Infantry, Gun crews, Seamanship Specialists x x x x
11B Infantryman x N/A N/A N/A
11C Indirect Fire Infantryman x N/A N/A N/A
11H Heavy Antiarmor Weapons Infantryman x N/A N/A N/A
11M Fighting Vehicle Infantryman x N/A N/A N/A
11Z Infantry Senior Sergeant x N/A N/A N/A
0311 Rifleman N/A N/A x N/A
0313 LAV Crewman N/A N/A x N/A
0321 Reconnaissance Man N/A N/A x N/A
0331 Machinegunner N/A N/A x N/A
0341 Mortar Man N/A N/A x N/A
0351 Assaultman N/A N/A x N/A
0352 Anti-Tank/ Assault Guided Missileman N/A N/A x N/A
0369 Infantry Unit Leader N/A N/A x N/A
18B Special Forces Weapons Sergeant x N/A N/A N/A
18C Special Forces Engineer Sergeant x N/A N/A N/A
18D Special Forces Medical Sergeant x N/A N/A N/A
18E Special Forces Communications Sergeant x N/A N/A N/A
18F Special Forces Assistant Operations and Intelligence Sergeant x N/A N/A N/A
18Z Special Forces Senior Sergeant x N/A N/A N/A
9533 Special Warfare Combatant Craft Crewman N/A x N/A N/A
9534 Seal Delivery Vehicle (SDV) Team Technician N/A x N/A N/A
19E M48-M60 Armor Crewman x N/A N/A N/A
19K M1 Armor Crewman x N/A N/A N/A
19Z Armor Senior Sergeant x N/A N/A N/A
1812 M1A1 Tank Crewman N/A N/A x N/A
1833 Assault Amphibious Vehicle Crewman N/A N/A x N/A
12B Combat Engineer x N/A N/A N/A
12C Bridge Crewmember x N/A N/A N/A
13B Cannon Crewmember x N/A N/A N/A
16R VULCAN Crewmember x N/A N/A N/A
0811 Field Artillery Cannoneer N/A N/A x N/A
0844 Field Artillery Fire Control Man N/A N/A x N/A
Page 145 GAO-05-952 Military Demographics

Appendix IV
Military Occupational Specialties That
Exclude Females
0861 Fire Support Man N/A N/A N/A
13M Multiple Launch Rocket System (MLRS) Crewmember x N/A N/A N/A
13P Multiple Launch Rocket System/Fire Direction Specialist x N/A N/A N/A
14J Early Warning System Operator x N/A N/A N/A
14R Line of Sight-Forward-Heavy Crewmember x N/A N/A N/A
14S Avenger Crewmember x N/A N/A N/A
16P CHAPARRAL Crewmember x N/A N/A N/A
16S Man Portable Air Defense Systems (MANPADS) Crewmember x N/A N/A N/A
1T231 Pararescue Apprentice N/A N/A N/A x
1T251 Pararescue Journeyman N/A N/A N/A x
1T271 Pararescue Craftsman N/A N/A N/A x
1T291 Pararescue Superintendent N/A N/A N/A x
9562 Deep Submergence Vehicle Operator N/A x N/A N/A
9563 Deep Submergence Vehicle Crewmember N/A x N/A N/A
1 Electronic Equipment Repairers
ET 14SM SWS Navigation System Maintenance Technician N/A x N/A N/A
ET 14TM TRIDENT I/II Radio Frequency (RF) Equipment Maintenance Technician
N/A N/A N/A
ET 14TO TRIDENT I/II Radio Frequency (RF) Equipment Operator N/A x N/A N/A
CTM9238 Submarine Carry-on Equipment Maintenance Technician N/A x N/A N/A
ET 14BF Project SSN 637 ESM Technician N/A x N/A N/A
ET 14BG SSN 768-773 ESM Technician N/A x N/A N/A
ET 14CM SSN Radio Frequency (RF) Equipment Technician N/A x N/A N/A
ET 14CT Submarine Conversion Technician N/A x N/A N/A
ET 14EB SSN 668 Class ESM Technician N/A x N/A N/A
ET 14EM SSN ESM Equipment Maintenance Technician N/A x N/A N/A
ET 14EP SSN 719-767 ESM Technician N/A x N/A N/A
ET 14ET ESM Technician (All Classes) N/A x N/A N/A
ET 14FA TRIDENT Submarine Electronics Technician Command and Control System
N/A x N/A N/A
ET 14HB SSN 637 Class ESM Technician N/A x N/A N/A
ET 14HH SSN 21 Class ESM Technician N/A x N/A N/A
ET 14IC Former IC(SS) N/A x N/A N/A
ET 14JA TRIDENT ESM Technician N/A x N/A N/A
ET 14NM Navigation Equipment Maintenance Technician N/A x N/A N/A
ET 14NO Navigation Equipment Operator N/A x N/A N/A
(Continued From Previous Page)
DOD occupational code/ Military occupational specialty Service occupation title Army Navy
Marine Corps Air Force
Page 146 GAO-05-952 Military Demographics

Appendix IV
Military Occupational Specialties That
Exclude Females
ET 14QM Former QM(SS) N/A x N/A N/A
ET 14RD SSN 637 Class Navigation Technician N/A x N/A N/A
ET 14RM Former RM (SS) N/A x N/A N/A
ET 14RO SSN Radio Frequency (RF) Equipment Operator N/A x N/A N/A
ET 14SF SSN 594/688 Class Navigation Technician N/A x N/A N/A
ET 14TG SSN 637/688 Class Navigation Technician N/A x N/A N/A
ET 14TK SSN 21 Navigation Technician N/A x N/A N/A
ET 14ZA AN/BRD-7 Submarine Radio Direction Finding (RDF) Set Maintenance. Technician
N/A x N/A N/A
FT 1174 Combat Control System MK 1 Vertical Launch System Technician N/A x N/A N/A
FT 1175 Combat Control System MK 1 MOD 1 Advanced Capability Subsystem Technician
N/A x N/A N/A
FT 1194 AN/BSY-2(V) Advanced Maintainer N/A x N/A N/A
FT 1196 Underwater Fire Control System MK 113 MOD 9 Technician N/A x N/A N/A
FT 1312 CCS MK 2 MOD 0 Maintenance Technician N/A x N/A N/A
FT 1313 CCS MK 2 MOD 1 Maintenance Technician N/A x N/A N/A
FT 1315 CCS MK 2 MOD 3 Maintenance Technician N/A x N/A N/A
FT 1320 TRIDENT MK 118 Combat Control System Maintenance Technician
N/A x N/A N/A
FTG Fire Control Technician G (Gunfire Control) N/A x N/A N/A
IC 4737 TRIDENT Submarine Ship Control and ASMO and Maintenance Technician (Level III)
N/A x N/A N/A
FT Fire Control Technician N/A x N/A N/A
FT 1179 AN/BSY-1 (XN-1)(V) Organizational Level Maintenance Technician
N/A x N/A N/A
FTB Fire Control Technician B (Ballistic Missile Fire Control) N/A x N/A N/A
MT Missile Technician N/A x N/A N/A
MT 3305 Missile Tech (MK88 MOD 2/MK98 MOD 0 FC Sys with TRIDENT-1 SSBN/Backfit SSBN)
N/A x N/A N/A
MT 3307 Missile Technician (MK 98 MOD 1) TRIDENT II D-5 SWS N/A x N/A N/A
MT 3310 Missile Technician (TRIDENT I (C-4) SWS) N/A x N/A N/A
MT 3311 Missile Technician (TRIDENT II (D-5) SWS) N/A x N/A N/A
MT 3317 Missile Technician (TRIDENT-I SSBN) N/A x N/A N/A
MT 3319 Missile and Missile Checkout Technician (TRIDENT D-5 SWS SSBN)
N/A x N/A N/A
RM 23JH Submarine Radioman Tactical Communications Equipment Technician
N/A x N/A N/A
(Continued From Previous Page)
DOD occupational code/ Military occupational specialty Service occupation title Army Navy
Marine Corps Air Force
Page 147 GAO-05-952 Military Demographics

Appendix IV
Military Occupational Specialties That
Exclude Females
STS Sonar Technician S (Submarine) N/A x N/A N/A
STS0418 AN/BSY-1 (XN-1) (V)Basic Organizational Maintenance Technician
N/A x N/A N/A
STS0419 AN/BSY-1 (XN-1) (V) Advanced Organizational Maintenance Technician
N/A x N/A N/A
STS0421 Sub Special Purpose Acoustic Equipment Maintenance Technician
N/A x N/A N/A
STS0422 BQQ-5/5 (Series) Submarine Sonar Advanced Maintenance Technician
N/A x N/A N/A
STS0424 AN/BQQ-6 trident Level II Journeyman Operation & Maintenance Technician
N/A x N/A N/A
STS0425 AN/BQQ-6 TRIDENT Level III Master Operation & Maintenance Technician
N/A x N/A N/A
STS0495 Sonar Technician AN/BQQ5 Series (B/C/D/E) Advanced Maintainer
N/A x N/A N/A
STS0501 Submarine Sonar Master Analyst N/A x N/A N/A
RM 23EY Submarine Radioman Strategic Communications Equipment Technician
N/A x N/A N/A
RM 23JS Submarine Radioman Tactical Communications Equipment Technician
N/A x N/A N/A
RM 23MZ Submarine Radioman Communications Combined Maintenance Technician
N/A x N/A N/A
RM 23NJ Submarine Radioman Communications Combined Maintenance Technician
N/A x N/A N/A
RM 23SM SSN ECS Maintenance Technician N/A x N/A N/A
RM 23SO SSN ECS Operator N/A x N/A N/A
RM 23TA TRIDENT Radioman Exterior Comm Sub-Systems Operations and Maint Technician
N/A x N/A N/A
RM 23TB TRIDENT Radioman Exterior Comm Sub-Systems Operations and Maint Technician
N/A x N/A N/A
RM 23TC TRIDENT Radioman Exterior Comm Sub-Systems Operations and Maint Technician
N/A x N/A N/A
RM 23TM TRIDENT ECS Maintenance Technician N/A x N/A N/A
RM 23TO TRIDENT ECS Operator N/A x N/A N/A
ET 3323 Central Navigation Computer (CNC) Tech (CP-890B OR TRIDENT SSBN)
N/A x N/A N/A
ET 3324 Ships Inertial Navigation System (SINS) Technician N/A x N/A N/A
ET 3327 Navigation AIDS (NAVAIDS) N/A x N/A N/A
ET 3328 Navigation Electronic Technician N/A x N/A N/A
(Continued From Previous Page)
DOD occupational code/ Military occupational specialty Service occupation title Army Navy
Marine Corps Air Force
Page 148 GAO-05-952 Military Demographics

Appendix IV
Military Occupational Specialties That
Exclude Females
ET 9611 AN/SSN-2(V)4 maintainer N/A x N/A N/A
OS 0325 AN/SSN-2(V) 4 Operator N/A x N/A N/A
2 Communications and Intelligence
13R FA Firefinder Radar Operator x N/A N/A N/A
0842 Field Artillery Radar Operator N/A N/A x N/A
96R Ground Surveillance Systems Operator x N/A N/A N/A
13C Automated Fire Support Systems Specialist x N/A N/A N/A
13E Cannon Fire Direction Specialist x N/A N/A N/A
13F Fire Support Specialist x N/A N/A N/A
19D Cavalry Scout x N/A N/A N/A
0848 Field Artillery Operations Man N/A N/A x N/A
1C231 Combat Control Apprentice N/A N/A N/A x
1C251 Combat Control Journeyman N/A N/A N/A x
1C271 Combat Control Craftsman N/A N/A N/A x
1C291 Combat Control Superintendent N/A N/A N/A x
1C431 Tactical Air Command And Control Apprentice N/A N/A N/A x
1C451 Tactical Air Command And Control Journeyman N/A N/A N/A x
1C471 Tactical Air Command And Control Craftsman N/A N/A N/A x
1C491 Tactical Air Command And Control Superintendent N/A N/A N/A x
3 Health Care
HM 8427 Fleet Marine Force Reconnaissance Corpsman N/A x N/A N/A
HM 8491 Special Operations Independent Duty Corpsman N/A x N/A N/A
HM 8492 Special Operations Technician N/A x N/A N/A
HM 8402 Submarine Force Independent Duty Corpsman N/A x N/A N/A
HM 8403 Special Amphibious Reconnaissance Independent Duty Corpsman
N/A x N/A N/A
4 Other Technical and Allied
82C Field Artillery Surveyor x N/A N/A N/A
0847 Artillery Meteorological Man N/A N/A x N/A
5320 Basic Combatant Swimmer N/A x N/A N/A
5323 SDV Pilot/Navigator/DDS Operator N/A x N/A N/A
5326 Combatant Swimmer (SEAL) N/A x N/A N/A
5301 UDT/SEAL Candidate N/A x N/A N/A
5 Functional Support and Administration
9579 Chief of the Boat (all Submarines) N/A x N/A N/A
(Continued From Previous Page)
DOD occupational code/ Military occupational specialty Service occupation title Army Navy
Marine Corps Air Force
Page 149 GAO-05-952 Military Demographics

Appendix IV
Military Occupational Specialties That
Exclude Females
6 Electrical/Mechanical Equip Repairers
63D Self-Propelled Field Artillery System Mechanic x N/A N/A N/A
63E M1 ABRAMS Tank System Mechanic x N/A N/A N/A
63N M60A1/A3 Tank System Mechanic x N/A N/A N/A
63T BFV System Mechanic x N/A N/A N/A
24M VULCAN System Mechanic x N/A N/A N/A
24N CHAPARRAL System Mechanic x N/A N/A N/A
45D Self-Propelled Field Artillery Turret Mechanic x N/A N/A N/A
45E M1 ABRAMS Tank Turret Mechanic x N/A N/A N/A
45N M60A1/A3 Tank Turret Mechanic x N/A N/A N/A
45T Bradley Fighting Vehicle System Turret Mechanic x N/A N/A N/A
MM 4230 SSN/SSBN Auxiliary Equipment Operator N/A x N/A N/A
MM 4231 SSN/SSBN Auxiliary Equipment Technician N/A x N/A N/A
MM 4232 SSN/SSBN Weapons Equipment Operator N/A x N/A N/A
MM 4233 SSN/SSBN Weapons Equipment Technician N/A x N/A N/A
MM 4245 SSN/SSBN Basic Auxiliary Equipment Technician N/A x N/A N/A
MM 4246 SSBN Diesel Engine (Fairbanks-Morse) Maintenance Technician N/A x N/A N/A
3351 Submarine Nuclear Propulsion Plant Emergency Welder N/A x N/A N/A
3353 Submarine Nuclear Propulsion Plant - Reactor Control N/A x N/A N/A
3354 Submarine Nuclear Propulsion Plant - Electrical N/A x N/A N/A
3355 Submarine Nuclear Propulsion Plant -Mechanical N/A x N/A N/A
3356 Submarine Nuclear Propulsion Plant – Engineer Laboratory Technician
N/A x N/A N/A
3359 Submarine Nuclear Propulsion Plant - Special Category N/A x N/A N/A
3363 Submarine Nuclear Propulsion Plant Supervisor- reactor Control N/A x N/A N/A
3364 Submarine Nuclear Propulsion Plant Supervisor- Electrical N/A x N/A N/A
3365 Submarine Nuclear Propulsion Plant Supervisor- Mechanical N/A x N/A N/A
3366 Submarine Nuclear Propulsion Plant Supervisor- Engineering Laboratory Technician
N/A x N/A N/A
7 Craftsworkers
52G Transmission and Distribution Specialist x N/A N/A N/A
8 Service and Supply Handlers
9 Nonoccupational
18X Special Forces Candidate (Reporting Code) x N/A N/A N/A
1C211 Combat Control Helper N/A N/A N/A x
1C411 Tactical Air command And Control Helper N/A N/A N/A x
(Continued From Previous Page)
DOD occupational code/ Military occupational specialty Service occupation title Army Navy
Marine Corps Air Force
Page 150 GAO-05-952 Military Demographics

Appendix IV
Military Occupational Specialties That
Exclude Females
Source: DOD 1312.1-1, Occupational Conversion Index: Enlisted/Officer/Civilian.
1T211 Pararescue Helper N/A N/A N/A x
(Continued From Previous Page)
DOD occupational code/ Military occupational specialty Service occupation title Army Navy
Marine Corps Air Force
Page 151 GAO-05-952 Military Demographics

Appendix V
Comments from the Department of Defense Appendix V
Page 152 GAO-05-952 Military Demographics

Appendix V
Comments from the Department of Defense
Page 153 GAO-05-952 Military Demographics

Appendix V
Comments from the Department of Defense
Page 154 GAO-05-952 Military Demographics

Appendix VI
GAO Contact and Staff Acknowledgments Appendix VI
GAO Contact Derek B. Stewart, (202) 512-5559 or [email protected]
Acknowledgments In addition to the contact named above, Jack E. Edwards, Assistant Director, William Bates, Virginia A. Chanley, Jonathan Clark, George M. Duncan, Gregg J. Justice, III, John G. Smale, Mitchell B. Karpman, Renee McElveen, Jacquelyn S. Randolph, and Dale O. Wineholt also made key contributions to this report.
Page 155 GAO-05-952 Military Demographics
(350581)
GAO’s Mission The Government Accountability Office, the audit, evaluation and investigative arm of Congress, exists to support Congress in meeting its constitutional responsibilities and to help improve the performance and accountability of the federal government for the American people. GAO examines the use of public funds; evaluates federal programs and policies; and provides analyses, recommendations, and other assistance to help Congress make informed oversight, policy, and funding decisions. GAO’s commitment to good government is reflected in its core values of accountability, integrity, and reliability.
Obtaining Copies of GAO Reports and Testimony
The fastest and easiest way to obtain copies of GAO documents at no cost is through GAO’s Web site (www.gao.gov). Each weekday, GAO posts newly released reports, testimony, and correspondence on its Web site. To have GAO e-mail you a list of newly posted products every afternoon, go to www.gao.gov and select “Subscribe to Updates.”
Order by Mail or Phone The first copy of each printed report is free. Additional copies are $2 each. A check or money order should be made out to the Superintendent of Documents. GAO also accepts VISA and Mastercard. Orders for 100 or more copies mailed to a single address are discounted 25 percent. Orders should be sent to:
U.S. Government Accountability Office441 G Street NW, Room LMWashington, D.C. 20548
To order by Phone: Voice: (202) 512-6000 TDD: (202) 512-2537 Fax: (202) 512-6061
To Report Fraud, Waste, and Abuse in Federal Programs
Contact:
Web site: www.gao.gov/fraudnet/fraudnet.htmE-mail: [email protected] answering system: (800) 424-5454 or (202) 512-7470
Congressional Relations
Gloria Jarmon, Managing Director, [email protected] (202) 512-4400U.S. Government Accountability Office, 441 G Street NW, Room 7125 Washington, D.C. 20548
Public Affairs Paul Anderson, Managing Director, [email protected] (202) 512-4800U.S. Government Accountability Office, 441 G Street NW, Room 7149 Washington, D.C. 20548
Related Documents