Report to the Ranking Minority Member, Subcommittee on Social Security, Committee on Ways and Means, House of Representatives United States General Accounting Office GAO April 2003 SOCIAL SECURITY AND MINORITIES Earnings, Disability Incidence, and Mortality Are Key Factors That Influence Taxes Paid and Benefits Received GAO-03-387

Welcome message from author
This document is posted to help you gain knowledge. Please leave a comment to let me know what you think about it! Share it to your friends and learn new things together.
Transcript
Report to the Ranking Minority Member, Subcommittee on Social Security, Committee on Ways and Means, House of Representatives
United States General Accounting Office
GAO
April 2003
SOCIAL SECURITY AND MINORITIES
Earnings, Disability Incidence, and Mortality Are Key Factors That Influence Taxes Paid and Benefits Received
GAO-03-387
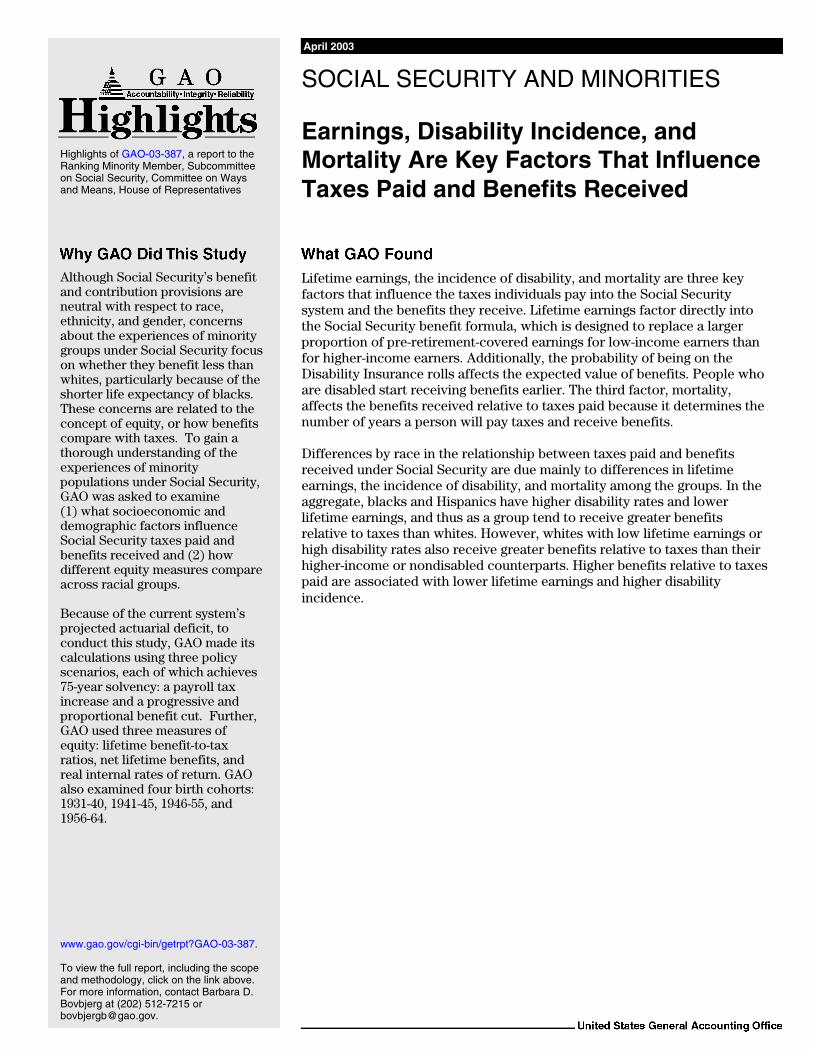
Lifetime earnings, the incidence of disability, and mortality are three key factors that influence the taxes individuals pay into the Social Security system and the benefits they receive. Lifetime earnings factor directly into the Social Security benefit formula, which is designed to replace a larger proportion of pre-retirement-covered earnings for low-income earners than for higher-income earners. Additionally, the probability of being on the Disability Insurance rolls affects the expected value of benefits. People who are disabled start receiving benefits earlier. The third factor, mortality, affects the benefits received relative to taxes paid because it determines the number of years a person will pay taxes and receive benefits. Differences by race in the relationship between taxes paid and benefits received under Social Security are due mainly to differences in lifetime earnings, the incidence of disability, and mortality among the groups. In the aggregate, blacks and Hispanics have higher disability rates and lower lifetime earnings, and thus as a group tend to receive greater benefits relative to taxes than whites. However, whites with low lifetime earnings or high disability rates also receive greater benefits relative to taxes than their higher-income or nondisabled counterparts. Higher benefits relative to taxes paid are associated with lower lifetime earnings and higher disability incidence.
Although Social Security’s benefit and contribution provisions are neutral with respect to race, ethnicity, and gender, concerns about the experiences of minority groups under Social Security focus on whether they benefit less than whites, particularly because of the shorter life expectancy of blacks. These concerns are related to the concept of equity, or how benefits compare with taxes. To gain a thorough understanding of the experiences of minority populations under Social Security, GAO was asked to examine (1) what socioeconomic and demographic factors influence Social Security taxes paid and benefits received and (2) how different equity measures compare across racial groups. Because of the current system’s projected actuarial deficit, to conduct this study, GAO made its calculations using three policy scenarios, each of which achieves 75-year solvency: a payroll tax increase and a progressive and proportional benefit cut. Further, GAO used three measures of equity: lifetime benefit-to-tax ratios, net lifetime benefits, and real internal rates of return. GAO also examined four birth cohorts: 1931-40, 1941-45, 1946-55, and 1956-64.
www.gao.gov/cgi-bin/getrpt?GAO-03-387. To view the full report, including the scope and methodology, click on the link above. For more information, contact Barbara D. Bovbjerg at (202) 512-7215 or [email protected].
Highlights of GAO-03-387, a report to the Ranking Minority Member, Subcommittee on Social Security, Committee on Ways and Means, House of Representatives
April 2003
SOCIAL SECURITY AND MINORITIES
Earnings, Disability Incidence, and Mortality Are Key Factors That Influence Taxes Paid and Benefits Received
Page i GAO-03-387 Social Security
Letter 1
Results in Brief 3 Background 4 Certain Key Factors Influence Racial Groups’ Receipt of Social
Security Benefits and Payment of Social Security Taxes 6 Higher Benefits Relative to Taxes Paid are Associated with Lower
Lifetime Earnings and Higher Disability Incidence 8 Concluding Observations 15 Agency Comments 16
Appendix I Scope and Methodology 18
Equity Measures 18 Benchmark Policy Scenarios 19 Modeling Income in the Near Term 24 The Effects of Mortality 26
Appendix II Social Security Equity Measures 28
Appendix III GAO Contacts and Staff Acknowledgments 64
GAO Contacts 64 Staff Acknowledgments 64
Bibliography 65
Related GAO Products 67
Tables
Table 1: Life Expectancy, by Race 15 Table 2: Expected Number of Years in Retirement for an Individual,
Age 20 in 2001 15 Table 3: Summary of Policy Scenario Parameters 24
Contents
Page ii GAO-03-387 Social Security
Figures
Figure 1: OASDI Lifetime Benefit-to-Tax Ratio for Individuals Born between 1931 and 1940 9
Figure 2: OASDI Median Lifetime Benefit-to-Tax Ratio for Individuals Born between 1931 and 1940 10
Figure 3: Percent of Race/Ethnic Group by Shared Earnings Quintile for Individuals Born between 1931 and 1940 11
Figure 4: Median Lifetime Benefit-to-Tax Ratio for Individuals Born between 1931 and 1940 12
Figure 5: Percent of MINT3 Sample and Percent of MINT3 Sample Who Are DI Beneficiaries, by Race/Ethnicity 13
Figure 6: Percent of MINT3 Sample and Percent of MINT3 Sample Dying before Age 62, by Race/Ethnicity 14
Figure 7: OASDI Real IRR for Individuals Born between 1931 and 1940, under the Progressive Benefit Cut Scenario 28
Figure 8: OASDI Real IRR for Individuals Born between 1931 and 1940, under the Proportional Benefit Cut Scenario 29
Figure 9: OASDI Real IRR for Individuals Born between 1931 and 1940, under the Payroll Tax Increase Scenario 30
Figure 10: OASDI Median Lifetime Net Benefits for Individuals Born between 1931 and 1940, under the Progressive Benefit Cut Scenario 31
Figure 11: OASDI Median Lifetime Net Benefits for Individuals Born between 1931 and 1940, under the Proportional Benefit Cut Scenario 32
Figure 12: OASDI Median Lifetime Net Benefits for Individuals Born between 1931 and 1940, under the Payroll Tax Increase Scenario 33
Figure 13: OASDI Median Lifetime Benefit-to-Tax Ratio for Individuals Born between 1931 and 1940, under the Progressive Benefit Cut Scenario 34
Figure 14: OASDI Median Lifetime Benefit-to-Tax Ratio for Individuals Born between 1931 and 1940, under the Proportional Benefit Cut Scenario 35
Figure 15: OASDI Median Lifetime Benefit-to-Tax Ratio for Individuals Born between 1931 and 1940, under the Payroll Tax Increase Scenario 36
Figure 16: OASDI Real IRR for Individuals Born between 1941 and 1945, under the Progressive Benefit Cut Scenario 37
Figure 17: OASDI Real IRR for Individuals Born between 1941 and 1945, under the Proportional Benefit Cut Scenario 38
Page iii GAO-03-387 Social Security
Figure 18: OASDI Real IRR for Individuals Born between 1941 and 1945, under the Payroll Tax Increase Scenario 39
Figure 19: OASDI Median Lifetime Net Benefits for Individuals Born between 1941 and 1945, under the Progressive Benefit Cut Scenario 40
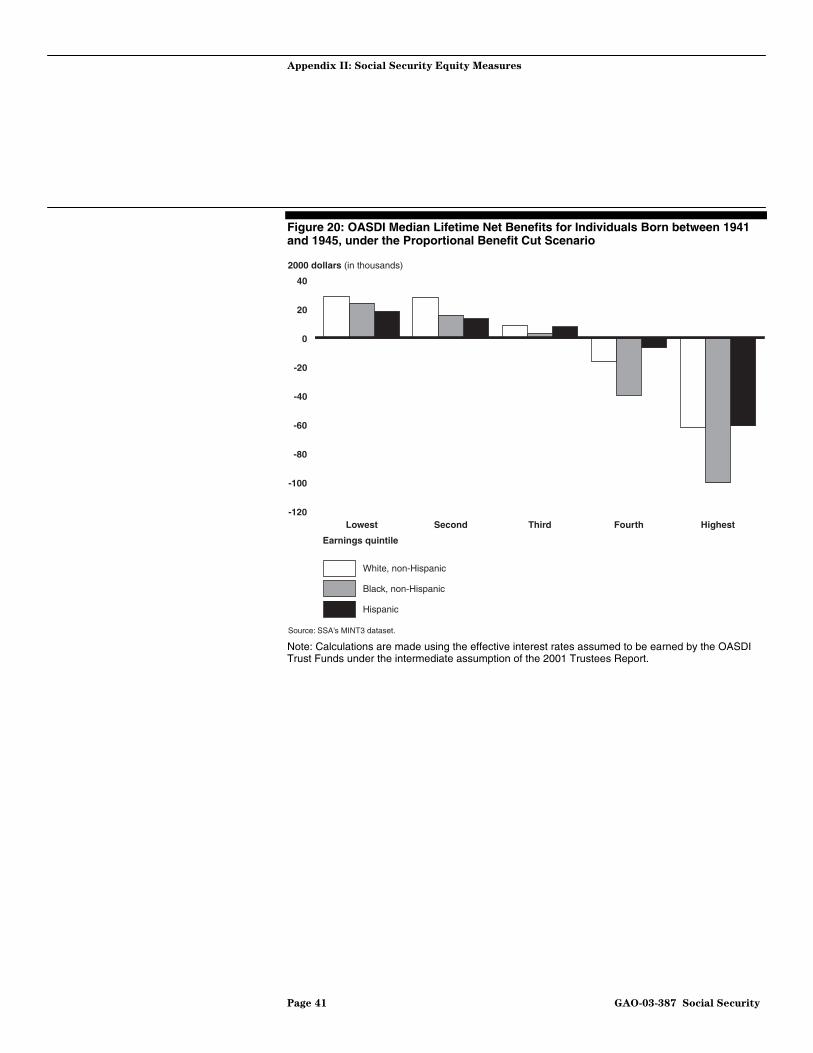
Figure 20: OASDI Median Lifetime Net Benefits for Individuals Born between 1941 and 1945, under the Proportional Benefit Cut Scenario 41
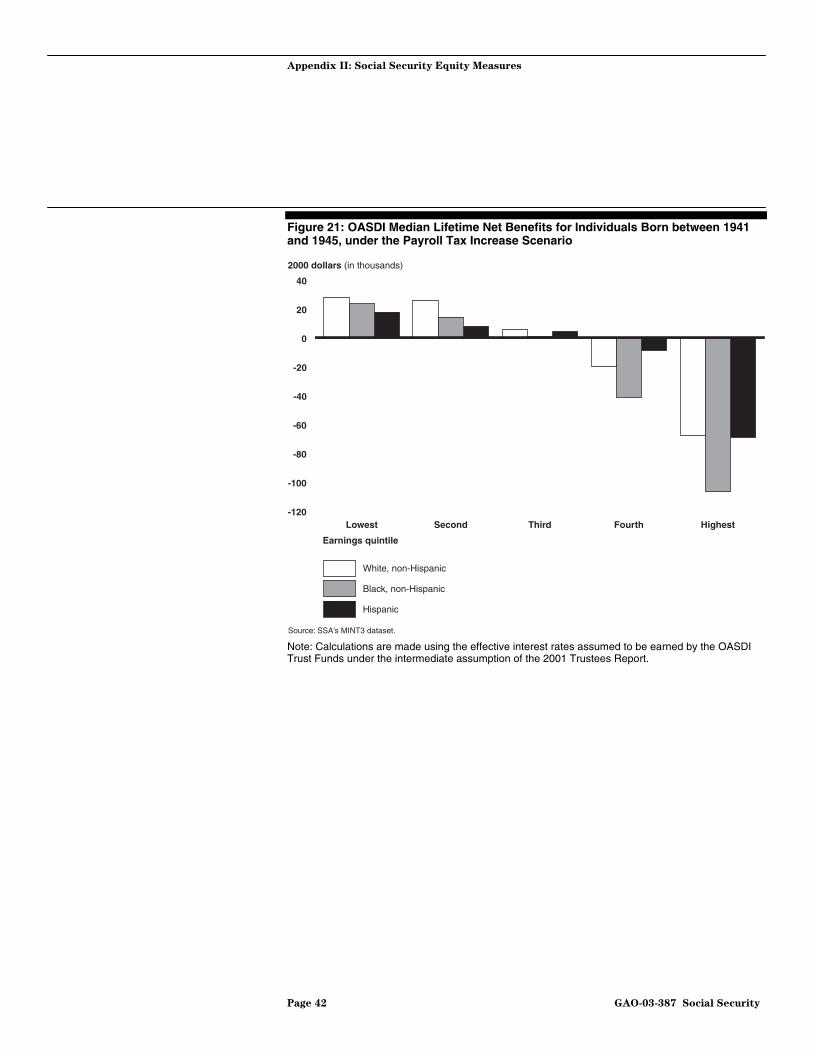
Figure 21: OASDI Median Lifetime Net Benefits for Individuals Born between 1941 and 1945, under the Payroll Tax Increase Scenario 42
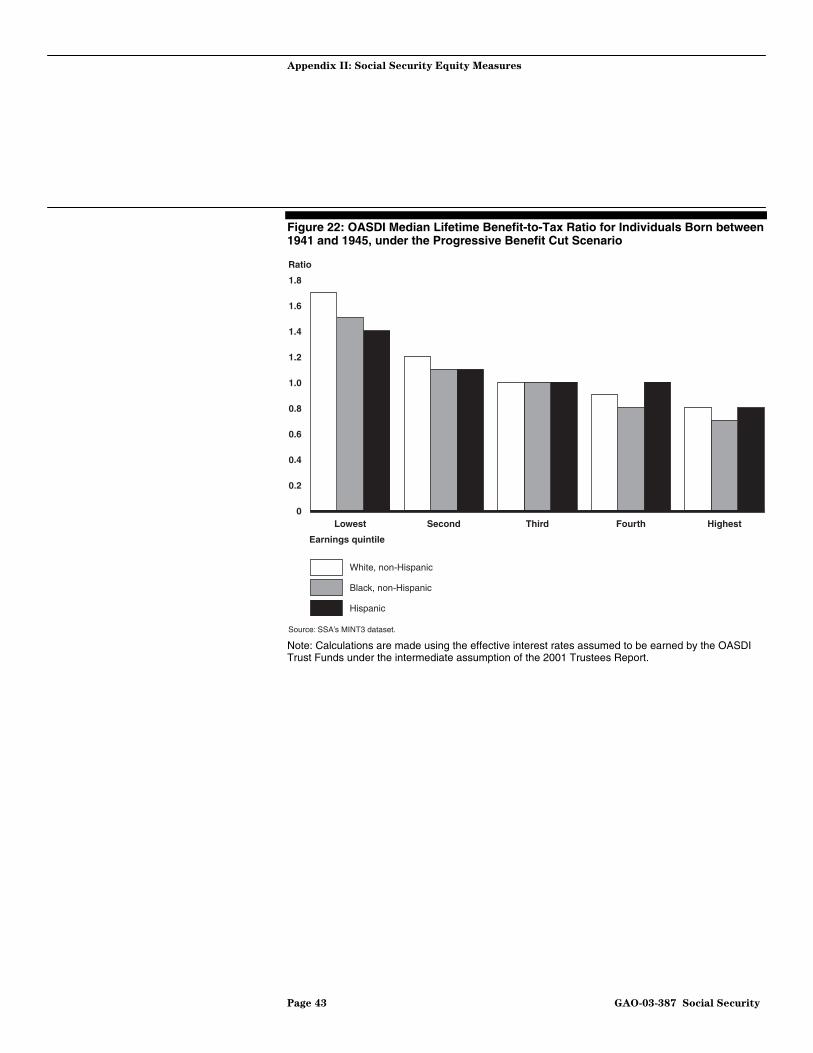
Figure 22: OASDI Median Lifetime Benefit-to-Tax Ratio for Individuals Born between 1941 and 1945, under the Progressive Benefit Cut Scenario 43
Figure 23: OASDI Median Lifetime Benefit-to-Tax Ratio for Individuals Born between 1941 and 1945, under the Proportional Benefit Cut Scenario 44
Figure 24: OASDI Median Lifetime Benefit-to-Tax Ratio for Individuals Born between 1941 and 1945, under the Payroll Tax Increase Scenario 45
Figure 25: OASDI Real IRR for Individuals Born between 1946 and 1955, under the Progressive Benefit Cut Scenario 46
Figure 26: OASDI Real IRR for Individuals Born between 1946 and 1955, for the Proportional Benefit Cut Scenario 47
Figure 27: OASDI Real IRR for Individuals Born between 1946 and 1955, under the Payroll Tax Increase Scenario 48
Figure 28: OASDI Median Lifetime Net Benefits for Individuals Born between 1946 and 1955, under the Progressive Benefit Cut Scenario 49
Figure 29: OASDI Median Lifetime Net Benefits for Individuals Born between 1946 and 1955, under the Proportional Benefit Cut Scenario 50
Figure 30: OASDI Median Lifetime Net Benefits for Individuals Born between 1946 and 1955, under the Payroll Tax Increase Scenario 51
Figure 31: OASDI Median Lifetime Benefit-to-Tax Ratio for Individuals Born between 1946 and 1955, under the Progressive Benefit Cut Scenario 52
Figure 32: OASDI Median Lifetime Benefit-to-Tax Ratio for Individuals Born between 1946 and 1955, under the Proportional Benefit Cut Scenario 53
Page iv GAO-03-387 Social Security
Figure 33: OASDI Median Lifetime Benefit-to-Tax Ratio for Individuals Born between 1946 and 1955, under the Payroll Tax Increase Scenario 54
Figure 34: OASDI Real IRR for Individuals Born between 1956 and 1964, under the Progressive Benefit Cut Scenario 55
Figure 35: OASDI Real IRR for Individuals Born between 1956 and 1964, under the Proportional Benefit Cut Scenario 56
Figure 36: OASDI Real IRR for Individuals Born between 1956 and 1964, under the Payroll Tax Increase Scenario 57
Figure 37: OASDI Median Lifetime Net Benefits for Individuals Born between 1956 and 1964, under the Progressive Benefit Cut Scenario 58
Figure 38: OASDI Median Lifetime Net Benefits for Individuals Born between 1956 and 1964, under the Proportional Benefit Cut Scenario 59
Figure 39: OASDI Median Lifetime Net Benefits for Individuals Born between 1956 and 1964, under the Payroll Tax Increase Scenario 60
Figure 40: OASDI Median Lifetime Benefit-to-Tax Ratio for Individuals Born between 1956 and 1964, under the Progressive Benefit Cut Scenario 61
Figure 41: OASDI Median Lifetime Benefit-to-Tax Ratio for Individuals Born between 1956 and 1964, under the Proportional Benefit Cut Scenario 62
Figure 42: OASDI Median Lifetime Benefit-to-Tax Ratio for Individuals Born between 1956 and 1964, under the Payroll Tax Increase Scenario 63
Page v GAO-03-387 Social Security
Abbreviations
AIME Average Indexed Monthly Earnings DI Disability Insurance IRR Internal Rates of Return MBR Master Beneficiary Records MINT Modeling Income in the Near Term MTR Maintain Tax Rates OASDI Old-Age, Survivors, and Disability Insurance OASI Old-Age and Survivors Insurance PIA Primary Insurance Amount SER Social Security Summary Earnings Records SIPP Survey of Income and Program Participation SSA Social Security Administration
This is a work of the U.S. Government and is not subject to copyright protection in the United States. It may be reproduced and distributed in its entirety without further permission from GAO. It may contain copyrighted graphics, images or other materials. Permission from the copyright holder may be necessary should you wish to reproduce copyrighted materials separately from GAO’s product.
Page 1 GAO-03-387 Social Security
April 23, 2003
The Honorable Robert T. Matsui Ranking Minority Member Subcommittee on Social Security Committee on Ways and Means House of Representatives
Dear Mr. Matsui:
In 2002, the Social Security program paid out approximately $454 billion in retired worker, dependent, survivor, and disability insurance benefits to about 46.4 million recipients.1 Protecting against loss of earnings due to disability, retirement, and death, the social insurance program is an important source of retirement income security for both minority and nonminority workers and their families. While approximately 18 percent of white retirees aged 65 and older rely on Social Security as their only source of retirement income, about 38 percent of minority retirees aged 65 and older rely on it to the same extent.2 However, the Social Security Administration’s (SSA) projections suggest that the trust funds that finance Old-Age, Survivors, and Disability Insurance (OASDI) will begin running cash deficits in 2018 and will be exhausted by 2042; thus, the program in its current form is unsustainable in the long term.3
Although Social Security’s benefit and contribution provisions are neutral with respect to race, ethnicity, and gender, concerns about the
1The numbers of beneficiaries are for the month of December 2002, while the benefit amounts given are amounts paid during 2002.
2The racial/ethnic groups examined in this study are Hispanics, non-Hispanic blacks, and non-Hispanic whites; we use the terms Hispanics, blacks, and whites when referring to these groups, respectively. We use the term minorities to refer to Hispanics and blacks and nonminorities to refer to whites. Due to data limitations, the Asian, Native Hawaiian/Pacific Islander, and American Indian/Alaska Native racial/ethnic groups were excluded from our sample.
3Each year the Board of Trustees of the Federal Old-Age, Survivors and Disability Insurance trust funds report in detail on the funds’ current status and their projected condition over the next 75 years. The current information on the financial condition of OASDI funds is based on the intermediate assumptions of the 2003 Trustees Report. Examined separately, the Old-Age and Survivors Insurance trust fund is projected to be exhausted by 2044, and the Disability Insurance trust fund by 2028.
United States General Accounting Office
Washington, DC 20548
Page 2 GAO-03-387 Social Security
experiences of minority groups under Social Security focus on whether they benefit less than whites from the Social Security system, particularly because of their shorter life expectancies. These concerns are related to the concept of equity, or how benefits compare with taxes. To gain a thorough understanding of the experiences of minority populations under Social Security, you asked us to examine (1) what socioeconomic and demographic factors influence Social Security taxes paid and benefits received and (2) how different equity measures compare across racial groups.
Because of the current system’s projected actuarial deficit, we made our calculations using three policy scenarios, each of which achieves 75-year solvency—a payroll tax increase and two benefit-reduction only benchmarks.4 The benefit-reduction-only benchmarks gradually phase in reductions from 2005 to 2035; the reductions are accomplished by changing the parameters of the benefit formula in various ways to achieve either progressive or proportional reductions. The proportional benefit cut reduces the benefit formula factors proportionally across all earnings levels, while the progressive benefit cut reduces the benefit formula factors by smaller scales for lower earners. To conduct our analyses, we asked SSA’s Office of Policy to apply the three scenarios to the latest version of its microsimulation model, Modeling Income in the Near Term (MINT3). The MINT3 model includes some dependent and survivor beneficiaries, such as current and divorced spouses, as well as widows, but does not include child beneficiaries. The model does, however, control for the exclusion of children.5 The MINT3 examines four birth cohorts: 1931-40, 1941-45, 1946-55, and 1956-64. In our analysis, we used three measures of equity—the extent to which returns are commensurate with contributions: lifetime benefit-to-tax ratios, net lifetime benefits (benefits minus taxes), and real internal rates of return.6 For our equity measures,
4SSA’s Office of the Chief Actuary provided long-range estimates of the effects that each of these benchmarks would have on the financial status of the OASDI program, using the intermediate assumptions of the 2001 Trustees Report. The MINT3 model incorporates economic and demographic assumptions of both the 2002 and the 2001 Trustees Reports. See appendix I for a detailed discussion of the benchmarks.
5Aged parents and widowed mothers and fathers also are excluded from the MINT3 analysis, and these exclusions also are controlled for in the model.
6Contributions to the social security system are not investments. Rates of return are calculated by determining what rate of interest would set contributions equal to the benefits received. In this report, we focus on the benefit-to-tax ratio. See appendix II for a detailed presentation of the other equity measures.

Page 3 GAO-03-387 Social Security
we use the “shared” concept of benefits and earnings, which incorporates some spousal taxes and benefits along with those of the individual worker. For ease of exposition, this report focuses on one birth cohort and one equity measure: the 1931-40 birth cohort and the lifetime benefit-to-tax ratio.7
We conducted our work between January 2002 and April 2003 in accordance with generally accepted government auditing standards. A more detailed discussion of our scope and methodology appears in appendix I.
Lifetime earnings, the incidence of disability, and mortality are three key factors that influence the taxes individuals pay into the Social Security system and the benefits they receive. Lifetime earnings factor directly into Social Security’s progressive benefit formula, which replaces a larger proportion of covered earnings for low-income earners than it does for higher-income earners when an insured event (death, disability, or retirement) occurs. Additionally, the probability of being on the Disability Insurance (DI) rolls affects the expected value of benefits. People who are disabled start receiving benefits earlier and pay taxes for fewer years. The third factor, mortality, affects the benefits received relative to taxes paid because it determines the number of years a person will pay taxes and whether and for how long an individual receives benefits.
Differences by race in the relationship between taxes paid and benefits received under Social Security are due mainly to differences in lifetime earnings, the incidence of disability, and mortality among the groups. In the aggregate, blacks and Hispanics have higher disability rates and lower lifetime earnings, and thus as a group tend to receive greater benefits relative to taxes than whites. However, whites with low lifetime earnings or high disability rates also receive greater benefits relative to taxes than their higher-income or nondisabled counterparts. Higher benefits relative to taxes paid are associated with lower lifetime earnings and higher disability incidence.
7The results are similar across cohort groups, but not across equity measures. See appendix II for a detailed presentation of the cohorts and the equity measures.
Results in Brief
Page 4 GAO-03-387 Social Security
Title II of the Social Security Act, as amended, establishes the Old-Age, Survivors, and Disability Insurance program, which is generally known as Social Security. The program provides cash benefits to retired and disabled workers and their dependents and survivors. The Congress designed Social Security benefits, at least implicitly, with a focus on replacing lost wages.8 Because the program is financed on a modified pay-as-you-go basis, payroll tax contributions of those currently working are transferred to current beneficiaries. Current beneficiaries include insured workers who are entitled to retirement or disability benefits, and their dependents, as well as survivors of deceased insured workers. The progressive benefit structure effectively provides greater insurance protection relative to contributions to earners with lower wages than to high-wage earners. Workers become eligible when they have enough quarters of coverage under Social Security, (i.e., quarters of the year with earnings from which Social Security taxes are deducted); they and their employers pay payroll taxes on those covered earnings to finance benefits.9 In 2002, 153 million people had earnings covered by Social Security, and 46.4 million people received approximately $454 billion in OASDI benefits.
Social Security was originally an old-age retirement program. However, the Social Security Amendments of 1939 added two new categories of benefits: dependent benefits paid to the spouse and minor children of a retired worker, and survivor benefits paid to the family after the death of a covered worker. In calendar year 2002, about 10 million people received approximately $106 billion in survivor and dependent benefits. Further, the amount of Old-Age and Survivors Insurance (OASI) benefits paid in 2002 totaled $388 billion for 39 million recipients.
Established in 1956, Social Security Disability Insurance provides monthly payments to eligible workers with disabilities who are under the normal retirement age and to their dependents.10 To be eligible for DI benefits as
8The original formula, as well as subsequent modifications, computed benefits as a percentage of wages covered under the program in a way that favors lower earners.
9In general, a worker needs 40 quarters of coverage to be eligible for retirement benefits. For workers who become disabled or die before age 62, the number of quarters of coverage required for eligibility depends on their age at the time the worker is disabled or dies.
10In 1956, the Social Security Act was amended to provide benefits to disabled workers aged 50-64 and disabled adult children. Over the next 4 years, Congress broadened the scope of the program, permitting disabled workers under age 50 and their dependents to qualify for benefits, and eventually disabled workers at any age could qualify.
Background
Page 5 GAO-03-387 Social Security
an adult, a person must have enough quarters of covered earnings11 and must be unable to perform any substantial gainful activity by reason of a medically determinable physical or mental impairment that is expected to result in death or that has lasted or can be expected to last for a continuous period of at least 12 months.12 As with retired worker benefits, disability benefits are funded by payroll taxes paid by covered employees and their employers. In calendar year 2002, about 7.2 million individuals received approximately $65.6 billion in DI benefits.13
Our previous work on Social Security includes research on the effects of Social Security reform on women, the disability insurance program, the effects of increasing the retirement age, and adequacy issues associated with the program. See our related products section for a listing of our previous work in this area.
Further, analysis by other organizations also has examined the experiences of minority groups under Social Security. Incorporating both different earnings and life expectancies of the racial/ethnic groups, some of the research has focused on the relative importance of Social Security for minorities.14 Others have suggested that blacks benefit less than whites under the current system and that both blacks and Hispanics would
11The eligibility requirements for DI are different from the requirements for OASI.
12Work activity is generally considered substantial and gainful if the person’s earnings exceed a particular level established by statute and regulations.
13These numbers do not include adult disabled children who are dependents of deceased or retired workers, disabled widows and widowers, or disabled parents, who receive their disability benefits from the Old-Age and Survivors Insurance program. About $5.7 billion were paid out of the program’s trust fund to these beneficiaries.
14See Steve Goss, “Problems with ‘Social Security’s Rate of Return: A Report of the Heritage Center for Data Analysis’,” Deputy Chief Actuary, Social Security Administration, memorandum, February 4, 1998; Alexa Hendley and Natasha Bilimoria, “Minorities and Social Security: An Analysis of Racial and Ethnic Differences in the Current Program,” Social Security Bulletin 62(2), 1999; and Kilolo Kijakazi “The Importance of Social Security to People of Color and Women,” Center on Budget and Policy Priorities, July 2001, and “African Americans, Hispanic Americans, and Social Security: The Shortcomings of the Heritage Foundation Reports,” October 1998.
Page 6 GAO-03-387 Social Security
experience higher returns under a system that incorporated individual accounts.15
Following the analysis of Cohen, Steuerle and Carasso,16 our analysis takes a broader approach to the measurement of Social Security. We analyze data on the overall program, OASDI, as well as the component programs, OASI and DI.
A variety of socioeconomic and demographic factors influence the receipt of Social Security—most significantly, lifetime earnings, the incidence of disability,17 and mortality. Lifetime earnings factor directly into the progressive benefit formula, which replaces a larger proportion of pre-retirement covered earnings for low-income earners than it does for higher-income earners. Additionally, the probability of being on the Disability Insurance rolls affects the expected value of benefits. Finally, mortality determines the number of years an individual will receive benefits and pay taxes and, therefore, the total benefits received.
One key factor affecting the level of Social Security benefits is earnings. The calculation of Social Security benefits is designed to replace a larger proportion of the earnings of lower earners than it does for higher earners. Thus, the benefit formula is progressive. For example, workers who retire at the normal retirement age in 2003 with scaled, low lifetime covered earnings will have benefits that replace approximately 56 percent of their
15See William W. Beach and Gareth G. Davis, “Social Security’s Rate of Return,” Heritage Foundation, January 1998, and “Social Security’s Rate of Return for Hispanic Americans,” Heritage Foundation, March 1998; and Michael Tanner, “Disparate Impact: Social Security and African Americans,” CATO Institute, February 2001.
16See Lee Cohen, C. Eugene Steuerle and Adam Carasso, “The Effects of Disability Insurance on Redistribution Within Social Security by Gender, Lifetime Earnings, Education, and Race,” Fifteenth Annual Conference of the National Academy of Social Insurance, January 2003; “The Effects of Disability Insurance on Redistribution Within Social Security by Gender, Lifetime Earnings, Education, and Race,” Fifty-Fifth Annual Scientific Meeting of the Gerontological Society of America, November 2002; “The Effects of Disability Insurance on Redistribution Within Social Security by Gender, Education, Race, and Income,” Fourth Annual Joint Conference for the Retirement Research Consortium, May 2002; and “Social Security Redistribution by Education, Race, and Income: How Much and Why,” Third Annual Conference of the Retirement Research Consortium, May 2001.
17The disability incidence rate is the probability that a worker enters the DI rolls in a given year; it is defined as the number of people who are DI-entitled divided by the number of people who are DI-insured.
Certain Key Factors Influence Racial Groups’ Receipt of Social Security Benefits and Payment of Social Security Taxes

Page 7 GAO-03-387 Social Security
earnings. Workers with scaled, medium lifetime earnings will have about 42 percent of their earnings replaced, and workers with lifetime earnings at the maximum taxable level will have approximately 30 percent replaced.18
The probability of becoming disabled also affects the expected value of Social Security benefits. DI recipients start drawing Social Security earlier and simultaneously see their tax liability reduced; in general, they will receive greater benefits in relation to the taxes they pay. DI benefits are based on the same formula as OASI benefits, so that benefits for low-income workers replace a larger proportion of their earnings. The average age of disabled workers is approximately 50.19
Disability trends will have a significant effect on future Social Security program costs as the Baby Boom generation ages. The highest rates of disability incidence within the DI program occur from age 50 to 65. Because of changing demographics, the number of DI beneficiaries is expected to more than double over the next 75 years, from the current 7.2 million to more than 16 million.20
Finally, mortality rates determine the expected number of years a person will contribute taxes and receive benefits and, therefore, the amount of total benefits received.21 For example, if a nondisabled person dies before retirement, that individual’s benefit-to-tax ratio is expected to be lower
18Information on replacement ratios applies to individuals who retire at the normal retirement age. Persons retiring at the early eligibility age will have a different benefit calculation. The payment of taxes is contingent upon being alive and not being disabled.
19Mortality rates for persons with disabilities differ from, and generally are higher than, those for the nondisabled population.
20The number of OASI beneficiaries is also expected to more than double over the next 75 years, from the current 39 million to more than 97 million.
21Mortality is reflected in life expectancy.
Page 8 GAO-03-387 Social Security
than the ratio for an individual who lives to receive retirement benefits.22 Individuals who die before retirement will no longer make contributions to the Social Security program. However, they may have dependents who would benefit from the survivor portion of the program.
Differences by race in the relationship between taxes paid and benefits received under Social Security are due to differences in lifetime earnings, the incidence of disability, and mortality between the groups. In the aggregate, blacks and Hispanics have higher disability rates and lower lifetime earnings, and thus receive greater benefits relative to taxes than whites. However, whites with low lifetime earnings and high disability rates also receive greater benefits relative to taxes than their higher-income and nondisabled counterparts. Because blacks have higher mortality than whites, their ratio of benefits to taxes may be lower in comparison, but this depends, in part, on whether they have survivors.23 Although blacks die younger than whites, and may receive fewer years of retirement benefits, they may also leave survivors who receive benefits for more years than their white counterparts.
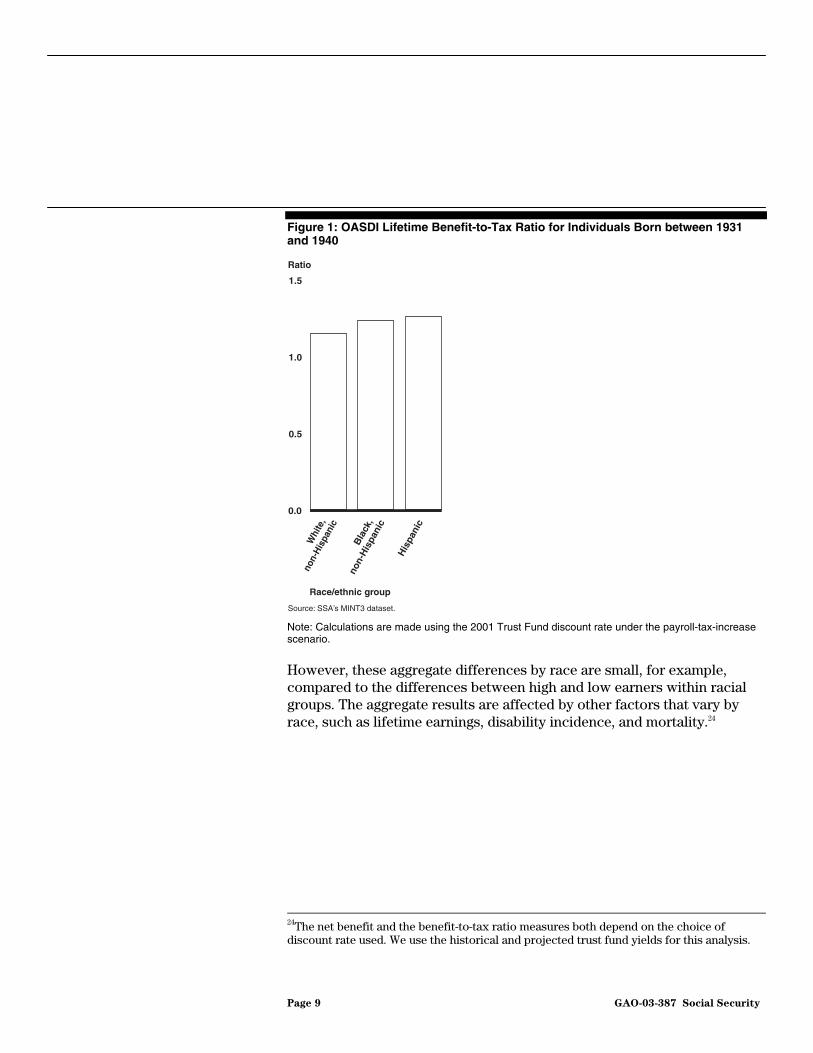
In the aggregate, blacks and Hispanics generally have higher disability rates and lower lifetime earnings, and thus receive greater benefits relative to taxes than whites. Figure 1 presents the median lifetime benefit-to-tax ratio for the 1931-40 birth cohort.
22We conducted separate examinations of OASDI, along with the OASI and DI components of the Social Security program for each of the four birth cohorts. We did not conduct a separate analysis of the Old-Age Insurance component of the program, which partly explains why our results differ from some researchers. For example, the Old-Age Insurance, or retirement, portion of Social Security is highly dependent on life expectancy and excludes dependents and survivor benefits, and in general, minority groups experience shorter life expectancies than whites. Therefore, when examined under the Old-Age Insurance component of the program, some minority groups, blacks in particular, would experience lower equity measures relative to whites. Additional information on differing mortality patterns is provided in appendix I.
23Although the available evidence on mortality suggests that the life expectancy for Hispanics is higher than it is for whites, the accuracy of these estimates is questionable. For example, researchers note that it is difficult to construct precise life tables for Hispanics because there is a tendency to misclassify the race/ethnicity of Hispanics on the death certificates.
Higher Benefits Relative to Taxes Paid are Associated with Lower Lifetime Earnings and Higher Disability Incidence
As a Group, on Average Minorities Accrue Higher Benefits in Relation to the Taxes They Pay
Page 9 GAO-03-387 Social Security
Figure 1: OASDI Lifetime Benefit-to-Tax Ratio for Individuals Born between 1931 and 1940
Note: Calculations are made using the 2001 Trust Fund discount rate under the payroll-tax-increase scenario.
However, these aggregate differences by race are small, for example, compared to the differences between high and low earners within racial groups. The aggregate results are affected by other factors that vary by race, such as lifetime earnings, disability incidence, and mortality.24
24The net benefit and the benefit-to-tax ratio measures both depend on the choice of discount rate used. We use the historical and projected trust fund yields for this analysis.
Ratio
0.0
0.5
1.0
1.5
His
pani
c
Bla
ck,
non-
His
pani
c
Whi
te,
non-
His
pani
c
Source: SSA’s MINT3 dataset.
Race/ethnic group
Page 10 GAO-03-387 Social Security
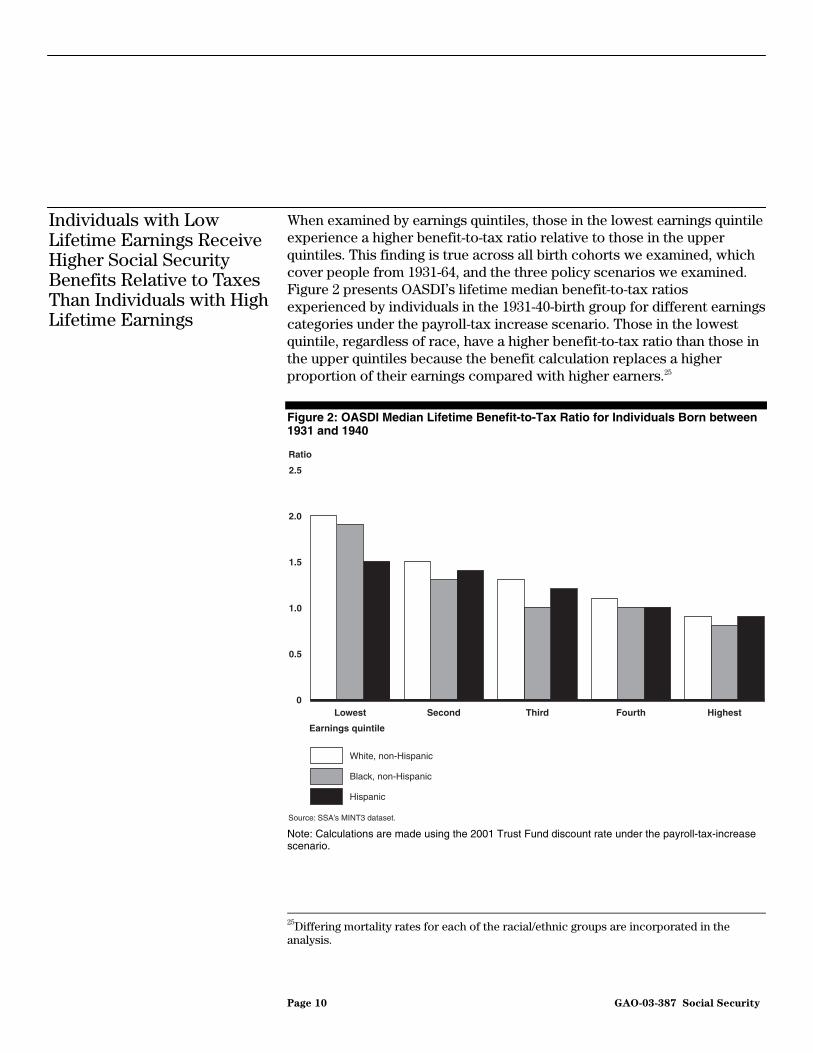
When examined by earnings quintiles, those in the lowest earnings quintile experience a higher benefit-to-tax ratio relative to those in the upper quintiles. This finding is true across all birth cohorts we examined, which cover people from 1931-64, and the three policy scenarios we examined. Figure 2 presents OASDI’s lifetime median benefit-to-tax ratios experienced by individuals in the 1931-40-birth group for different earnings categories under the payroll-tax increase scenario. Those in the lowest quintile, regardless of race, have a higher benefit-to-tax ratio than those in the upper quintiles because the benefit calculation replaces a higher proportion of their earnings compared with higher earners.25
Figure 2: OASDI Median Lifetime Benefit-to-Tax Ratio for Individuals Born between 1931 and 1940
Note: Calculations are made using the 2001 Trust Fund discount rate under the payroll-tax-increase scenario.
25Differing mortality rates for each of the racial/ethnic groups are incorporated in the analysis.
Individuals with Low Lifetime Earnings Receive Higher Social Security Benefits Relative to Taxes Than Individuals with High Lifetime Earnings
Ratio
0
0.5
1.0
1.5
2.0
2.5
HighestFourthThirdSecondLowest
Earnings quintile
White, non-Hispanic
Black, non-Hispanic
Hispanic
Source: SSA’s MINT3 dataset.
Page 11 GAO-03-387 Social Security
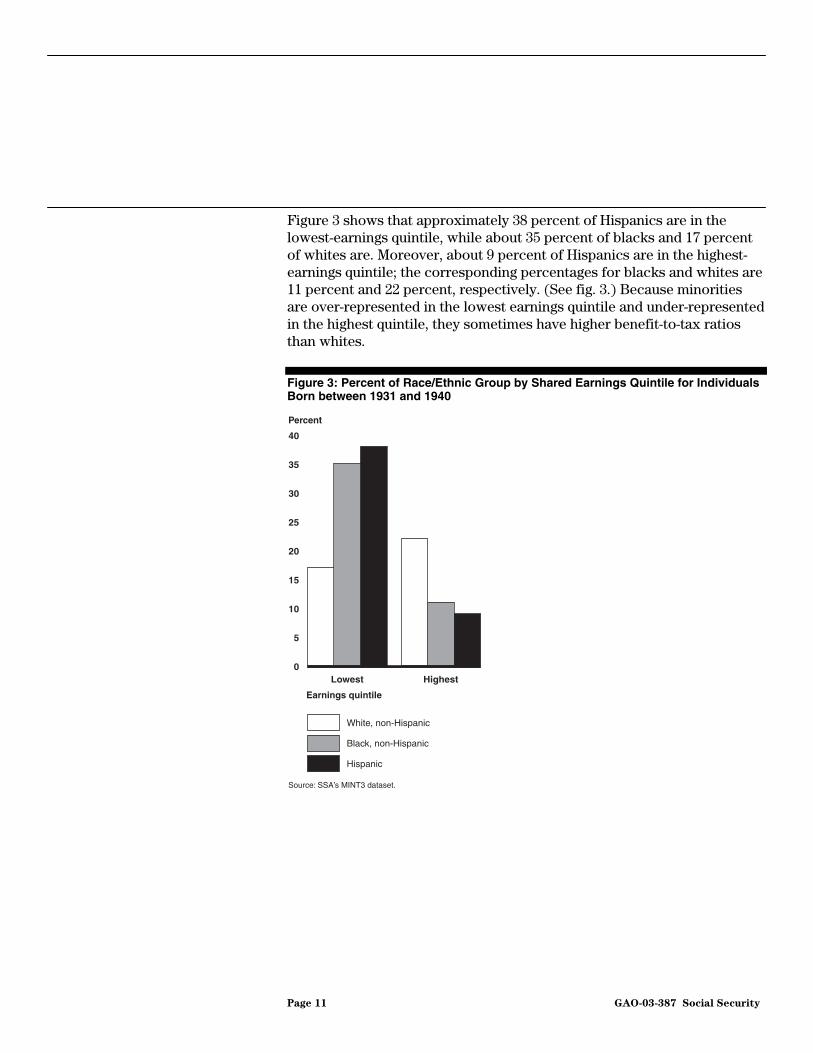
Figure 3 shows that approximately 38 percent of Hispanics are in the lowest-earnings quintile, while about 35 percent of blacks and 17 percent of whites are. Moreover, about 9 percent of Hispanics are in the highest-earnings quintile; the corresponding percentages for blacks and whites are 11 percent and 22 percent, respectively. (See fig. 3.) Because minorities are over-represented in the lowest earnings quintile and under-represented in the highest quintile, they sometimes have higher benefit-to-tax ratios than whites.
Figure 3: Percent of Race/Ethnic Group by Shared Earnings Quintile for Individuals Born between 1931 and 1940
0
5
10
15
20
25
30
35
40
ZYXHighestLowest
Percent
Earnings quintile
White, non-Hispanic
Black, non-Hispanic
Hispanic
Source: SSA’s MINT3 dataset.

Page 12 GAO-03-387 Social Security
In general, groups who are more likely to be disabled receive greater OASDI benefits relative to taxes paid than those who are not disabled. As shown in figure 4, low-income individuals, particularly blacks, achieve higher benefit-to-tax ratios under OASDI (when the disability program is included) than under OASI.
Figure 4: Median Lifetime Benefit-to-Tax Ratio for Individuals Born between 1931 and 1940
Note: Calculations are made using the 2001 Trust Fund discount rate, under the payroll-tax increase scenario.
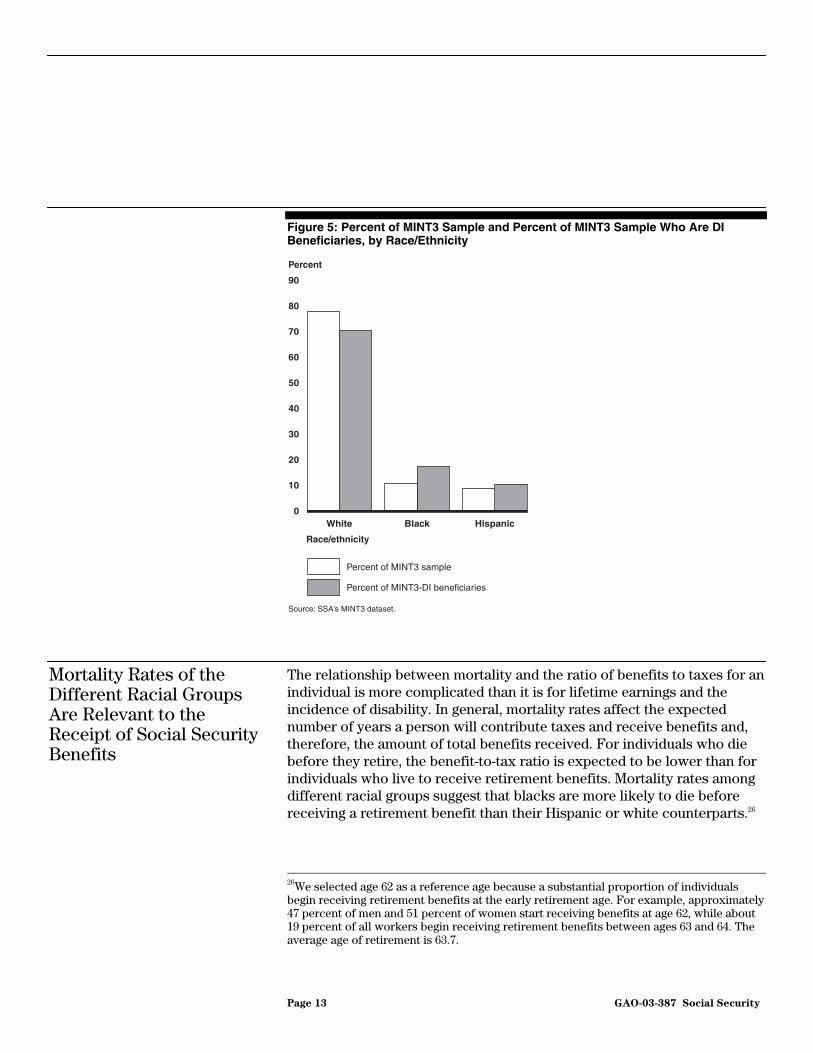
This is because in addition to having lower lifetime earnings than whites, blacks are more likely to be on DI than whites or Hispanics. As shown in figure 5, blacks make up 10.3 percent of the sample, but 16.9 percent of the DI beneficiaries, while Hispanics make up about 8.4 percent of the sample, and 10.1 percent of DI beneficiaries. Whites are the only group to make up a smaller percent of DI beneficiaries than of the whole sample.
Disability Insurance Yields Higher Benefits Relative to Taxes for Individuals Who Are Low Earners Than for Individuals Who Are High Earners
Ratio
Earnings quintile
White, non-Hispanic
Black, non-Hispanic
Hispanic
Source: SSA’s MINT3 dataset.
0.0
0.5
1.0
1.5
2.0
2.5
HighestLowest
Ratio
OASI OASDI
0.0
0.5
1.0
1.5
2.0
2.5
HighestLowest
Page 13 GAO-03-387 Social Security
Figure 5: Percent of MINT3 Sample and Percent of MINT3 Sample Who Are DI Beneficiaries, by Race/Ethnicity
The relationship between mortality and the ratio of benefits to taxes for an individual is more complicated than it is for lifetime earnings and the incidence of disability. In general, mortality rates affect the expected number of years a person will contribute taxes and receive benefits and, therefore, the amount of total benefits received. For individuals who die before they retire, the benefit-to-tax ratio is expected to be lower than for individuals who live to receive retirement benefits. Mortality rates among different racial groups suggest that blacks are more likely to die before receiving a retirement benefit than their Hispanic or white counterparts.26
26We selected age 62 as a reference age because a substantial proportion of individuals begin receiving retirement benefits at the early retirement age. For example, approximately 47 percent of men and 51 percent of women start receiving benefits at age 62, while about 19 percent of all workers begin receiving retirement benefits between ages 63 and 64. The average age of retirement is 63.7.
Mortality Rates of the Different Racial Groups Are Relevant to the Receipt of Social Security Benefits
0
10
20
30
40
50
60
70
80
90
ZYXHispanicBlackWhite
Percent
Race/ethnicity
Percent of MINT3 sample
Percent of MINT3-DI beneficiaries
Source: SSA’s MINT3 dataset.
Page 14 GAO-03-387 Social Security
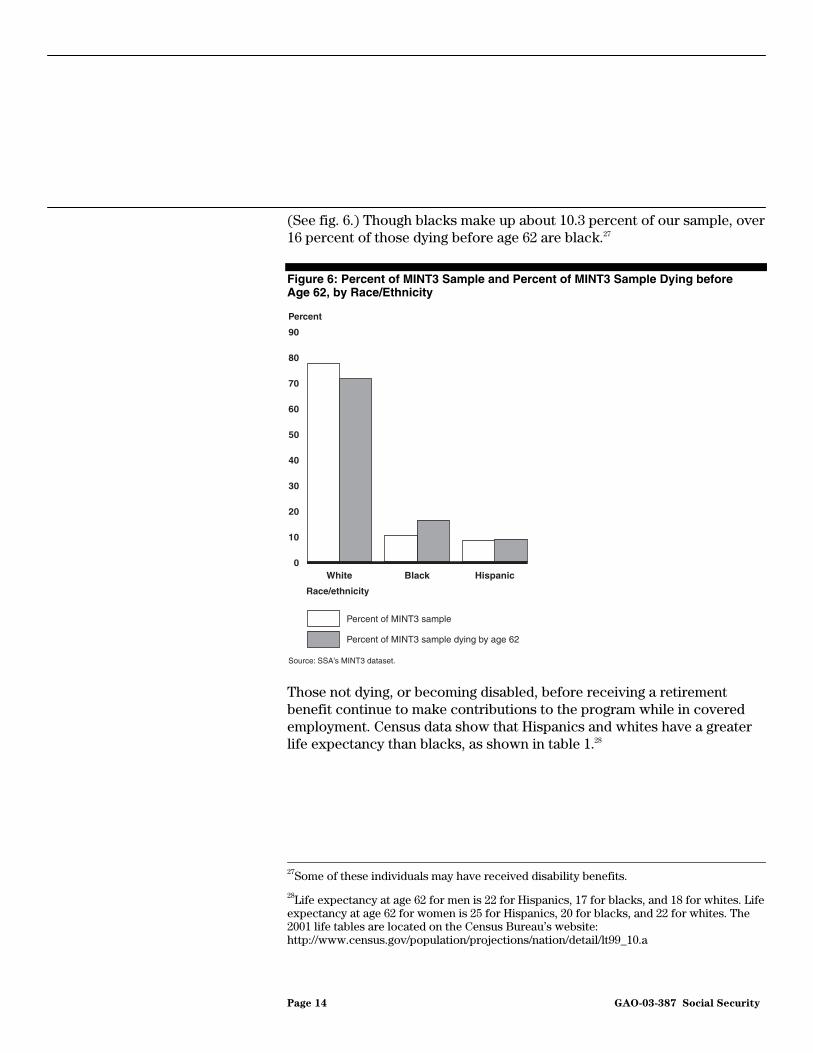
(See fig. 6.) Though blacks make up about 10.3 percent of our sample, over 16 percent of those dying before age 62 are black.27
Figure 6: Percent of MINT3 Sample and Percent of MINT3 Sample Dying before Age 62, by Race/Ethnicity
Those not dying, or becoming disabled, before receiving a retirement benefit continue to make contributions to the program while in covered employment. Census data show that Hispanics and whites have a greater life expectancy than blacks, as shown in table 1.28
27Some of these individuals may have received disability benefits.
28Life expectancy at age 62 for men is 22 for Hispanics, 17 for blacks, and 18 for whites. Life expectancy at age 62 for women is 25 for Hispanics, 20 for blacks, and 22 for whites. The 2001 life tables are located on the Census Bureau’s website: http://www.census.gov/population/projections/nation/detail/lt99_10.a
0
10
20
30
40
50
60
70
80
90
ZYXHispanicBlackWhite
Percent
Race/ethnicity
Percent of MINT3 sample
Percent of MINT3 sample dying by age 62
Source: SSA’s MINT3 dataset.
Page 15 GAO-03-387 Social Security
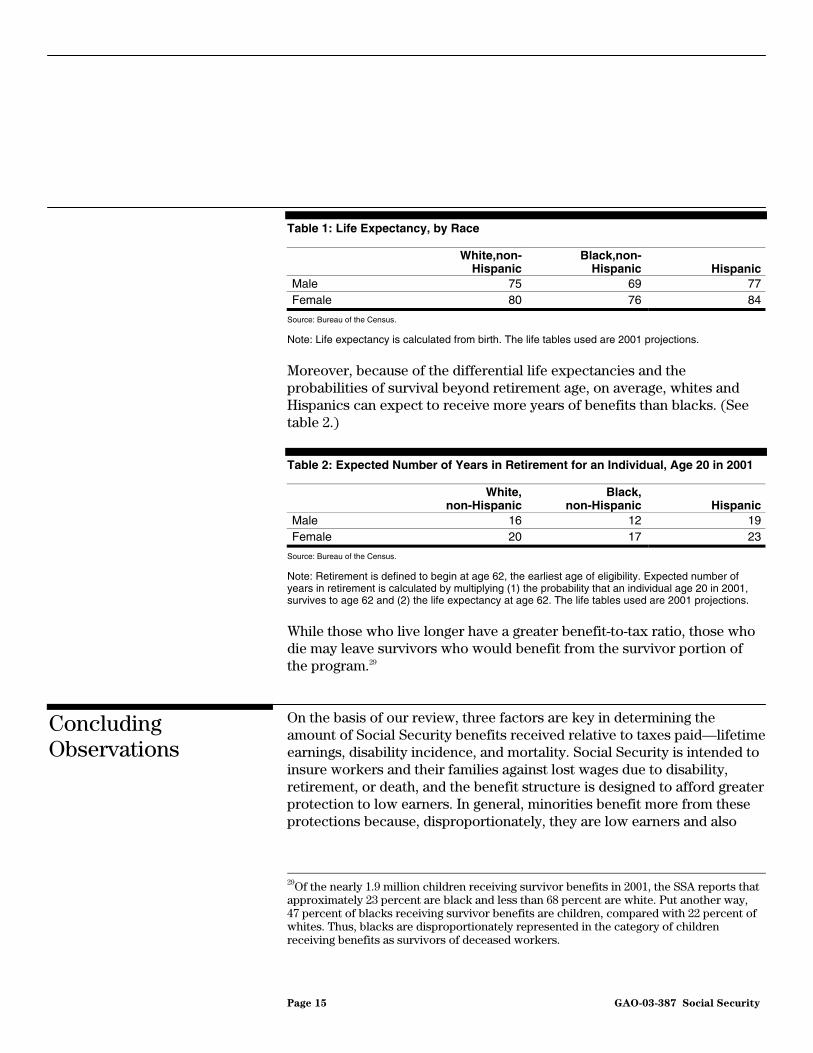
Table 1: Life Expectancy, by Race
White,non-
Hispanic Black,non-
Hispanic HispanicMale 75 69 77Female 80 76 84
Source: Bureau of the Census.
Note: Life expectancy is calculated from birth. The life tables used are 2001 projections.
Moreover, because of the differential life expectancies and the probabilities of survival beyond retirement age, on average, whites and Hispanics can expect to receive more years of benefits than blacks. (See table 2.)
Table 2: Expected Number of Years in Retirement for an Individual, Age 20 in 2001
White,
non-Hispanic Black,
non-Hispanic HispanicMale 16 12 19Female 20 17 23
Source: Bureau of the Census.
Note: Retirement is defined to begin at age 62, the earliest age of eligibility. Expected number of years in retirement is calculated by multiplying (1) the probability that an individual age 20 in 2001, survives to age 62 and (2) the life expectancy at age 62. The life tables used are 2001 projections.
While those who live longer have a greater benefit-to-tax ratio, those who die may leave survivors who would benefit from the survivor portion of the program.29
On the basis of our review, three factors are key in determining the amount of Social Security benefits received relative to taxes paid—lifetime earnings, disability incidence, and mortality. Social Security is intended to insure workers and their families against lost wages due to disability, retirement, or death, and the benefit structure is designed to afford greater protection to low earners. In general, minorities benefit more from these protections because, disproportionately, they are low earners and also
29Of the nearly 1.9 million children receiving survivor benefits in 2001, the SSA reports that approximately 23 percent are black and less than 68 percent are white. Put another way, 47 percent of blacks receiving survivor benefits are children, compared with 22 percent of whites. Thus, blacks are disproportionately represented in the category of children receiving benefits as survivors of deceased workers.
Concluding Observations
Page 16 GAO-03-387 Social Security
have a greater likelihood of receiving disability benefits. Because of their lower life expectancies, blacks gain the most advantage from disability or survivors’ benefits while, due to their higher life expectancies, Hispanics receive retirement benefits for a longer period and, therefore, receive higher lifetime benefits. As a group, blacks gain from Social Security’s progressive benefit formula, the early retirement option, and comprehensive insurance plans. Hispanics also gain from the progressive benefit formula, and they have the ability to gain more from Social Security’s annual cost-of-living adjustment because they live longer.
Given the long-run financial problems facing Social Security, policymakers are considering a variety of potential reforms to make the system sustainable. Reforms that do so by tying benefits more directly to contributions may affect the progressivity of the system and are likely to disproportionately affect equity for minorities as measured in this report. Further, disability, survivors’, and dependents’ benefits also could be affected by any changes to the structure of the program.
The choices the Congress will make to restore Social Security’s long-term solvency and sustainability could affect the distributional effects of the program. Thus, if progressivity remains one of the important goals for the program, the debate over system reforms should consider the extent to which the specific reforms might alter that progressivity, as it is likely to have a disproportionate impact on minorities, absent other, mitigating, changes.
We provided a draft of this report to SSA and the Bureau of the Census. SSA provided technical comments, which we have incorporated where appropriate.
We are sending copies of this report to SSA and Census. We will also make copies available to others on request. In addition, the report will be available at no charge on GAO’s Web site at http://www.gao.gov.
Agency Comments

Page 17 GAO-03-387 Social Security
If you have any questions concerning this report, please contact me at (202) 512-7215. See appendix III for other contacts and staff acknowledgments.
Sincerely yours,
Barbara D. Bovbjerg Director, Education, Workforce and Income Security Issues
Appendix I: Scope and Methodology
Page 18 GAO-03-387 Social Security
This appendix provides more details about our analysis of the taxes paid and benefits received by minority and nonminority participants in the Social Security program. To conduct our assessment, we examined three socioeconomic and demographic factors that are relevant to racial groups’ receipt of Social Security benefits—earnings, the disability incidence rate, and mortality. Additionally, we used three measures of equity–lifetime benefit-to-tax ratio, net lifetime benefits, and internal rates of return—to analyze the relationship between Social Security contributions and benefits under Old-Age, Survivors and Disability Insurance (OASDI), Old-Age and Survivors Insurance (OASI) and Disability Insurance (DI). Further, we examined four birth cohorts of Social Security beneficiaries: individuals born during the Depression, 1931-40; those born during WWII, 1941-45; the early Baby Boomers, 1946-55, and the late Baby Boomers, 1956-64.
We also used three benchmark-policy scenarios that restore the 75-year actuarial balance of the Social Security system–-a payroll tax increase, a progressive benefit reduction, and a proportional benefit reduction.1 These scenarios were applied to the microsimulation model, Modeling Income in the Near Term2 (MINT3) to determine the relationship between taxes paid and benefits received from the program. Social Security’s Office of the Chief Actuary has scored the benchmark policy scenarios using the intermediate assumptions of the 2001 Trustees Report.
The Social Security program addresses the twin goals of individual equity and social adequacy. Equity3 refers to how benefits compare with taxes; adequacy refers to the level and certainty of benefits provided to retirees,
1For a detailed description of the development of these policy scenarios, see U.S. General Accounting Office, Social Security: Program’s Role in Helping Ensure Income Adequacy, GAO-02-62 (Washington, D.C.: Nov. 30, 2001). Although these scenarios ensure solvency for the next 75 years, they do not achieve “sustainable solvency,” solvency beyond the 75-year period.
2Information on the MINT3 model is provided in a separate section of this appendix.
3Our equity measures employ the shared concept of benefit and earnings. For taxes, shared refers to the full measure of taxes paid as a single person (before marriage) and half of the taxes paid by both spouses during marriage. For benefits, shared includes half the benefits paid to the couple while both spouses survive plus the full benefit paid to the surviving spouse. Although certain dependent benefits are excluded from the analysis, the “shared” concept does capture some survivor benefits. The section on the MINT model provides a more detailed explanation. Both lifetime benefit/lifetime tax ratio and the net lifetime benefits discount taxes and benefits to 2000 dollars.
Appendix I: Scope and Methodology
Equity Measures
Appendix I: Scope and Methodology
Page 19 GAO-03-387 Social Security
the disabled, dependents, and survivors. Three equity measures are used to determine how groups compare in terms of the taxes they pay and the benefits they receive under Social Security. The equity measures we used were the ratio of lifetime benefits to lifetime taxes, net lifetime benefits, and real internal rates of return. The ratio of lifetime benefits to lifetime taxes presents information on the relationship between the value of taxes paid and the value of benefits received. The ratio compares the interest-adjusted value of lifetime benefits with lifetime taxes. Net lifetime benefits are benefits minus taxes over the course of an individual’s lifetime; net lifetime benefits also are interest adjusted. Internal rates of return (IRR) for Social Security reflect the constant discount rate that equates the present discounted value of taxes with the present discounted value of benefits.4
According to current projections of the Social Security trustees for the next 75 years, revenues will not be adequate to pay full benefits as defined under current law. Therefore, estimating future Social Security benefits should reflect that actuarial deficit and account for the fact that some combination of benefit reductions and revenue increases will be necessary to restore long-term solvency. To illustrate a full range of possible outcomes, we use previously developed policy scenarios5 that would achieve 75-year solvency either by only increasing payroll taxes or by only reducing benefits. These policies have been scored by the Social Security Administration’s Office of the Chief Actuary.
We use only one tax-increase-only benchmark policy scenario because policies that only increase payroll tax rates have no effect on benefits. Our tax-increase-only benchmark raises payroll tax rates immediately (in 2002). We increase OASI and DI taxes separately by the amount of the actuarial deficit of each fund. It results in the smallest tax rate in 2077 of those we considered and spreads the tax burden most evenly across generations; this is the primary basis for our selection. The later that taxes
4Equity is only one of Social Security’s objectives. The program’s insurance features inherently place great emphasis on helping ensure that beneficiaries have adequate income; without its built-in income transfers across and within birth groups, Social Security would provide identical rates of return on contributions.
5See U.S. General Accounting Office, Social Security: Program’s Role in Helping Ensure
Income Adequacy, GAO-02-62 (Washington, D.C.: Nov. 30, 2001).
Benchmark Policy Scenarios
Tax Increase Only Policy
Appendix I: Scope and Methodology
Page 20 GAO-03-387 Social Security
are increased, the higher the tax rate needed to achieve 75-year solvency, and in turn the higher the tax burden on later taxpayers and lower on earlier taxpayers. Alternative approaches to increasing revenues could have very different effects on individual equity.
We use two benefit-reduction benchmarks for our analysis. Both benefit-reduction benchmarks take the form of reductions in Social Security’s Primary Insurance Amount (PIA) formula factors; they differ in the relative size of those reductions across the three factors, which are 90, 32, and 15 percent under current law. Each benchmark has three dimensions of specification: scope, phase-in period, and the factor changes themselves.
When workers retire, become disabled, or die, Social Security uses their lifetime earnings records to determine each worker’s PIA, on which the individual’s benefit and any dependent and survivor benefits are based. PIA is the result of two elements—the Average Indexed Monthly Earnings (AIME) and the benefit formula. The AIME for a retired worker is determined by taking the 35 highest earnings years in the lifetime earnings record, indexing them, and taking the average. The AIME for disabled workers is based on fewer years of earnings. To determine the PIA, AIME is then applied to a step-like formula, shown here for 2001.
PIA = 90% * (AIME1 ≤$561)
+ 32% * (AIME2 > $561 and ≤$3381)
+ 15% * (AIME3 > $3381),
where AIMEi is the applicable portion of AIME.
The PIA is the basic monthly benefit, unless it is further adjusted based on early and delayed retirement, the spouse’s benefit, and other factors.
For our analysis, we want the benefit reductions in our benchmarks to apply very generally to all types of benefits, including disability and survivor benefits as well as old-age benefits. Our objective is to find policies that achieve 75-year solvency while reflecting the distributional effects of the current program as closely as possible. Therefore, it would not be appropriate to reduce some benefits and not others. If disabled and
Benefit-Reduction Only Policies
Scope
Appendix I: Scope and Methodology
Page 21 GAO-03-387 Social Security
survivor benefits were not reduced at all, reductions in other benefits would be deeper than shown in this analysis.
We selected a phase-in period that begins with those reaching age 62 in 2005 and continues for 30 years. We chose this phase-in period to achieve a balance between two competing objectives: minimizing the size of the ultimate benefit reduction and minimizing the size of each year’s incremental reduction to avoid notches and unduly large incremental reductions. Since later birth cohorts are generally agreed to experience lower rates of return on their contributions already under current law, minimizing the size of the ultimate benefit reduction would minimize further reductions in later cohorts’ rates of return. The smaller each year’s reduction, the longer it will take for benefit reductions to achieve solvency and in turn, the deeper the eventual reductions will have to be. However, the smallest possible ultimate reduction would be achieved by reducing benefits immediately for all new retirees by over 10 percent; this would create a “notch” however, that is, create some marked inequities between beneficiaries close to each other in age.
Our analysis shows that a 30-year phase-in should produce incremental annual reductions that would be of lesser size and thus avoid significant notches. Therefore, it would be preferable to longer phase-in periods, which would require deeper ultimate reductions.
In addition, we believe it is appropriate to delay the first year of the benefit reductions for a few years because those within a few years of retirement would not have had adequate time to adjust their retirement planning if the reductions applied immediately. The Maintain Tax Rates (MTR) benchmark in the 1994-96 Advisory Council Report also provided for a similar delay.6
Each of our benefit-reduction benchmarks are variations of changes in PIA formula factors and all are special cases of the following generalized form, where Fi represents the 3 PIA formula factors, which are 90, 32, and 15 percent under current law.
6Advisory Council on Social Security: Report of the 1994-1996 Advisory Council on
Social Security, Vols. 1 and 2. (Washington, D.C.: Jan. 1997).
Phase-in Period
Defining the Primary Insurance Amount Formula Factor Reductions
Appendix I: Scope and Methodology
Page 22 GAO-03-387 Social Security
yxii
tit weightyweightxFFF •−••−=+ )( 20011
where
t = the year of the factor,
x = constant proportional benefit reduction,
y = constant “subtractive” benefit reduction, and
weight x and weight y determine the relative effects of x and y and sum to 1.
Our potential benchmarks can now be described as follows:
Proportional Offset: weight x = 1 and weight y = 0. The value of x is calculated to achieve 75-year solvency, given the chosen phase-in period and scope of reductions.
The formula specifies that the proportional reduction is always taken as a proportion of the base-year factor value rather than the prior year. This maintains a constant rate of benefit reduction from year to year. In contrast, taking the reduction as a proportion of the prior year’s factor value implies a decelerating of the benefit reduction over time because the prior year’s factor gets smaller with each reduction. To achieve the same level of 75-year solvency, this would require a greater proportional reduction in earlier years because of the smaller reductions in later years.
The proportional offset hits lower earners especially hard because the constant x percent of the higher formula factors results in a larger percentage reduction over that segment of the formula, while the higher formula factors apply to the lower earnings segments of the formula. For example, in a year when the cumulative size of the proportional reduction has reached 10 percent, the 90-percent factor would then have been reduced by 9 percentage points, the 32-percent factor by 3.2 percentage points, and the 15-percent factor by 1.5 percentage points. As a result, earnings below the first bendpoint would be replaced at 9 percentage points less than current law, while earnings above the second bendpoint would be replaced at only 1.5 percentage points less than current law. Still, the proportional offset is easily described as a constant percentage reduction of current law benefits for everyone. In the example,
Appendix I: Scope and Methodology
Page 23 GAO-03-387 Social Security
beneficiaries of all earnings levels would have their benefits reduced by 10 percent.
Progressive Offset: weight x = 0 and weight y = 1. The value of y is calculated to achieve 75-year solvency, given the chosen phase-in period and scope of reductions.
This offset results in equal percentage point reductions in the formula factors, by definition, and subjects earnings across all segments of the PIA formula to the same reduction. Therefore, the offset avoids hitting lower earners especially hard as the proportional offset does.
As it happens, this offset produces exactly the same effect as the offset we used in our 1990 analysis of a partial privatization proposal.7 In that analysis, we were charged with finding a benefit reduction that would leave the redistributive effects of the program unchanged while allowing a diversion of 2 percentage points of contributions into individual accounts. We calculated these benefit reductions by computing the Social Security annuity value of the balance of a hypothetical account that earned interest on the diverted contributions at the rate of return for each individual’s cohort as a whole. We demonstrated the distributional neutrality of this benefit reduction by showing that if all individuals earned exactly the cohort rate of return on their individual accounts, then their income under the proposal from Social Security and the new accounts would be exactly the same as under current law.
The hypothetical account approach to reducing benefits must be translated into our PIA factor changes because such a reduction is proportional to AIME, not to PIA. The contributions to a hypothetical account are proportional to earnings. Therefore, a benefit reduction based on such an account would also be proportional to earnings; that is
Benefit reduction = y *AIME
Therefore, the new PIA would be
PIA new =90% * AIME1 + 32% * AIME2 + 15% * AIME3 - y * AIMET
7See U.S. General Accounting Office, Social Security: Analysis of a Proposal to Privatize
Trust Fund Reserves, GAO/HRD-91-22 (Washington, D.C.: Dec. 12, 1990).
Appendix I: Scope and Methodology
Page 24 GAO-03-387 Social Security
Where AIMEi is the applicable portion of AIME and AIMET is the total AIME. In turn,
PIA new =(90% - y) * AIME1 + (32% - y) * AIME2 + (15% - y) * AIME3
Thus, the reduction from a hypothetical account can be translated into a change in the PIA formula factors.
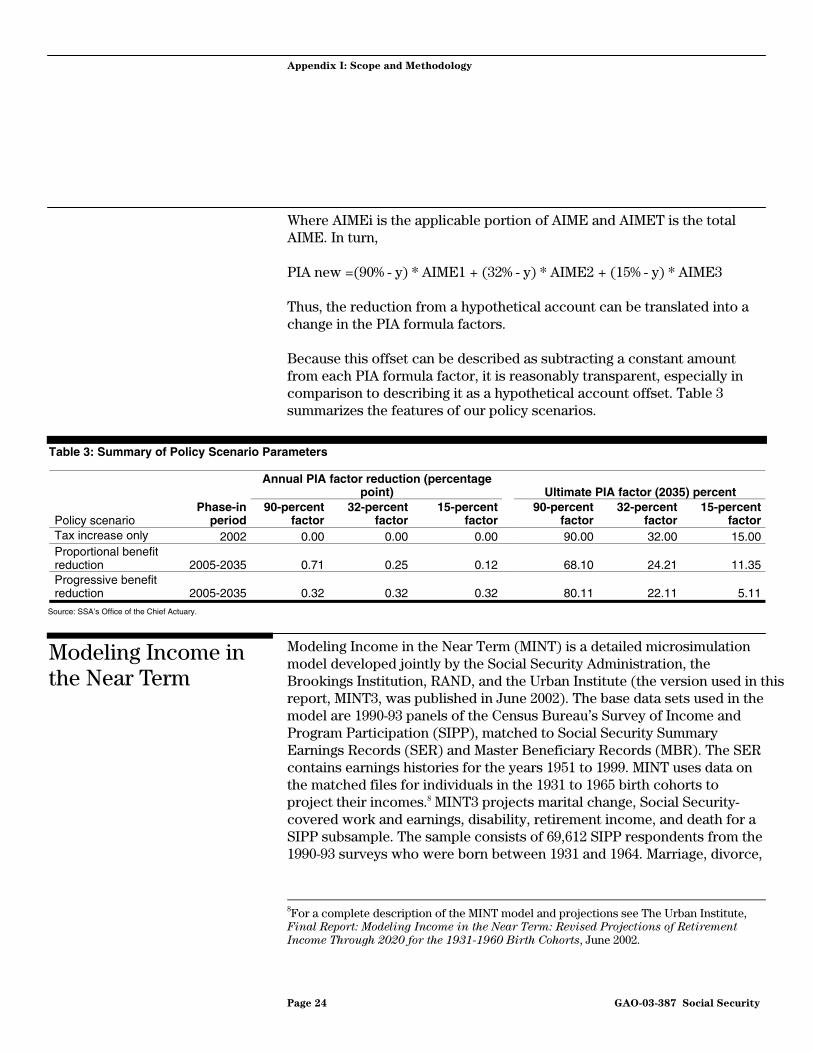
Because this offset can be described as subtracting a constant amount from each PIA formula factor, it is reasonably transparent, especially in comparison to describing it as a hypothetical account offset. Table 3 summarizes the features of our policy scenarios.
Table 3: Summary of Policy Scenario Parameters
Annual PIA factor reduction (percentage
point)
Ultimate PIA factor (2035) percent
Policy scenario Phase-in
period 90-percent
factor 32-percent
factor15-percent
factor 90-percent
factor 32-percent
factor 15-percent
factorTax increase only 2002 0.00 0.00 0.00 90.00 32.00 15.00Proportional benefit reduction 2005-2035 0.71 0.25 0.12
68.10 24.21 11.35
Progressive benefit reduction 2005-2035 0.32 0.32 0.32
80.11 22.11 5.11
Source: SSA’s Office of the Chief Actuary.
Modeling Income in the Near Term (MINT) is a detailed microsimulation model developed jointly by the Social Security Administration, the Brookings Institution, RAND, and the Urban Institute (the version used in this report, MINT3, was published in June 2002). The base data sets used in the model are 1990-93 panels of the Census Bureau’s Survey of Income and Program Participation (SIPP), matched to Social Security Summary Earnings Records (SER) and Master Beneficiary Records (MBR). The SER contains earnings histories for the years 1951 to 1999. MINT uses data on the matched files for individuals in the 1931 to 1965 birth cohorts to project their incomes.8 MINT3 projects marital change, Social Security-covered work and earnings, disability, retirement income, and death for a SIPP subsample. The sample consists of 69,612 SIPP respondents from the 1990-93 surveys who were born between 1931 and 1964. Marriage, divorce,
8For a complete description of the MINT model and projections see The Urban Institute, Final Report: Modeling Income in the Near Term: Revised Projections of Retirement
Income Through 2020 for the 1931-1960 Birth Cohorts, June 2002.
Modeling Income in the Near Term
Appendix I: Scope and Methodology
Page 25 GAO-03-387 Social Security
and re-marriage are projected with hazard models allowing up to nine marriages, although after retirement, only one re-marriage is allowed. Marital status is projected for each respondent until death. Work and earnings are taken from the SER, and earnings are projected from 2000 to 2031. Spouse earnings are also based on the SER. Earnings of missing spouses are imputed from similar survey respondents, and complete earnings histories are imputed for respondents who did not report a Social Security number. The MINT model provides SSA with the capability to assess the distributional impact of changes to the Social Security program.
MINT projects earnings histories for persons in the sample who have not yet completed their careers. MINT also projects the year of initial receipt of Social Security benefits and benefit amounts, in addition to other sources of retirement income including pensions, asset income, and earnings of working Social Security beneficiaries.
Methodologically, we chose MINT3 for this report for
• its capability to project marital changes, Social Security-covered work and earnings, disability, retirement, and mortality;
• its ability to prospectively assess and model various Social Security programmatic alternatives;
• its ability to examine a large portion of the Social Security population (those born between 1931 and 1964, in the current analysis); and
• its ability to examine various subgroups, notably by race and ethnicity; and its use as a policy tool already employed by SSA;
While the MINT model provides data that are well-suited to our analysis, there are some shortcomings of those data as well. First, the model excludes a number of dependent and survivor beneficiaries in the projections of benefits that are received on a primary insured worker’s record. Among the excluded groups are children of disabled, retired, or deceased workers.9 In order to correct for this omission, SSA reduced the OASI and DI tax rates—both historical and prospective—by the
9Other excluded groups include aged parents and widowed mothers and fathers.
Appendix I: Scope and Methodology
Page 26 GAO-03-387 Social Security
percentage of program expenditures that were paid to those excluded beneficiaries.10
As noted earlier, in our analysis, we use the “shared” measure of OASDI taxes and benefits. For this measure, during years in which the individual is unmarried—either as a beneficiary or as a payroll taxpayer—the full measure of the individual’s taxes paid or benefits received (regardless of whose earnings those benefits are based upon) is counted. While the individual is married, the taxes or benefits counted are half of the sum of the individual’s total payroll taxes or benefits plus the spouse’s total payroll taxes or benefits.11
The U.S. Census Bureau, under the Department of Commerce, publishes population projections for the United States. Mortality assumptions are represented as life tables for selected calendar years from 1999 to 2100 and are published by age, gender, race, and Hispanic origin. We used the published 2001 life tables for the non-Hispanic white, non-Hispanic Black, and Hispanic populations to determine the number of years an individual, age 20 in 2001, could expect to receive benefits. These tables are located on the Bureau’s website at: http://www.census.gov/population/projections/nation/detail/lt99_10.a
Mortality affects the benefits received relative to taxes paid because it determines the number of years a person will pay taxes and receive benefits. Furthermore, mortality rates affect individuals’ lifetime earnings and their incidences of disability. Finally, mortality affects the amount of benefits paid to survivors of deceased workers.
10The tax reductions were the same across race/ethnic groups, which may introduce bias in our results. Blacks account for only about 10 percent of the total OASDI caseload, but they account for approximately 22 percent of child beneficiaries. Furthermore, while average benefits for blacks relative to whites is approximately 85 percent and 90 percent for retired workers and disabled workers, respectively, the ratio is about 78 percent for surviving children. Thus, a race-blind reduction in that tax rate for omitting child beneficiaries would artificially lower the measures of generosity of OASDI for blacks relative to whites since there are relatively fewer white children beneficiaries than black children beneficiaries. On the other hand, the fact that white surviving children receive higher benefits, on average, than black surviving child beneficiaries offsets this effect to some degree.
11Since MINT tracks some but not all past and future family relationships and the benefits that are due those individuals, the shared measure does not account for all taxes and benefits connected to each earnings record. However, we relied on the recommendation of SSA’s Office of Policy that the shared measures most closely match taxes paid and benefits received.
The Effects of Mortality
Appendix I: Scope and Methodology
Page 27 GAO-03-387 Social Security
Incorporating survivors who have a right to benefits on the decedent’s social security record complicates the impact of mortality on our measures of social security benefits relative to taxes paid. For example, dependent children and their surviving parents may begin to receive survivor benefits. Aged (60 years or older) widows may begin to receive benefits, or they may experience a change in the amount of benefits they receive, as well as a change in whether the benefits are based on their own or their deceased spouses’ earnings.
As noted above, Hispanics generally have the lowest mortality rates and blacks have the highest. Earlier work using the MINT3 model shows that, in practice, higher mortality tends to lower our measures of benefits relative to taxes.12 Internal rates of return for blacks and Hispanics fall further than those for whites when examining the effects of incorporating actual mortality patterns.
12The Cohen, Steuerle, and Carasso (2001) study uses the MINT2 model under current law.
Appendix II: Social Security Equity Measures
Page 28 GAO-03-387 Social Security
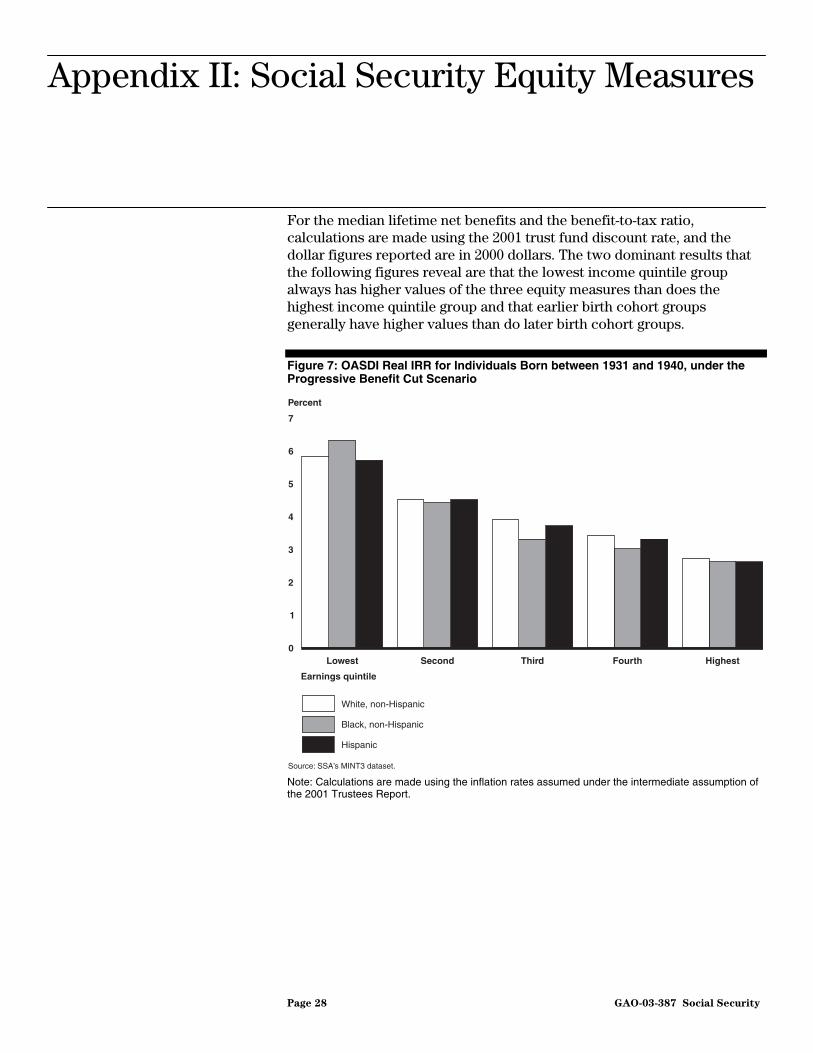
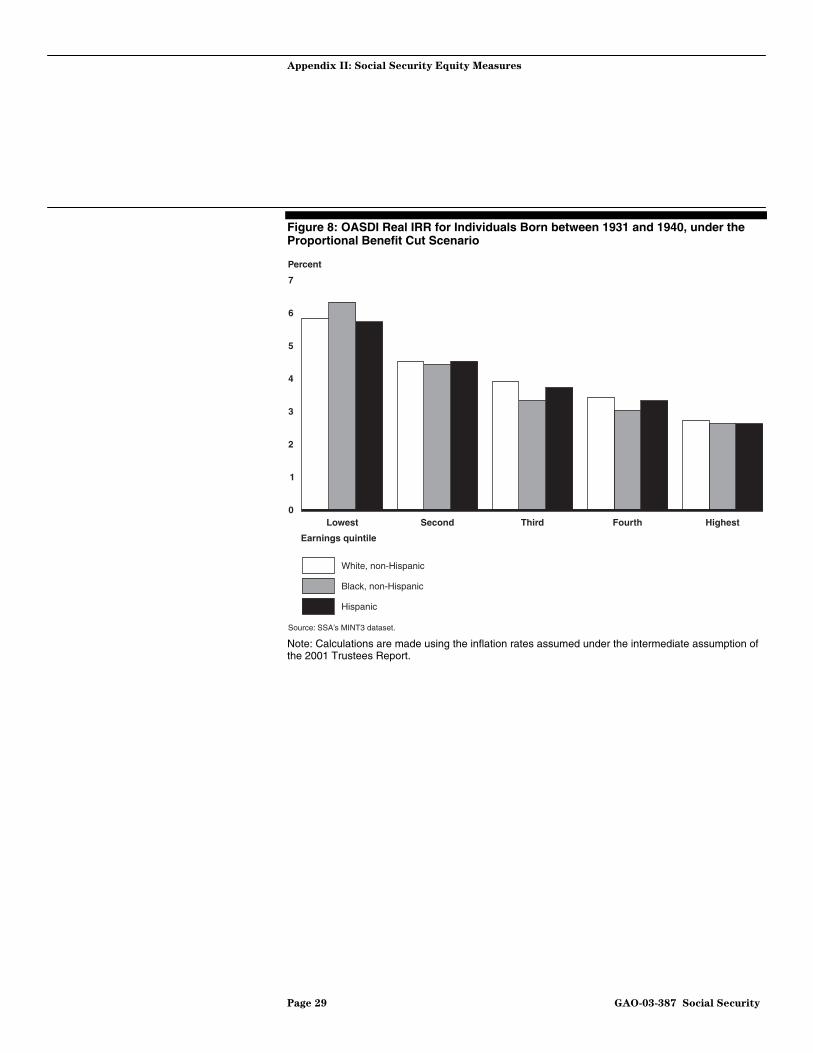
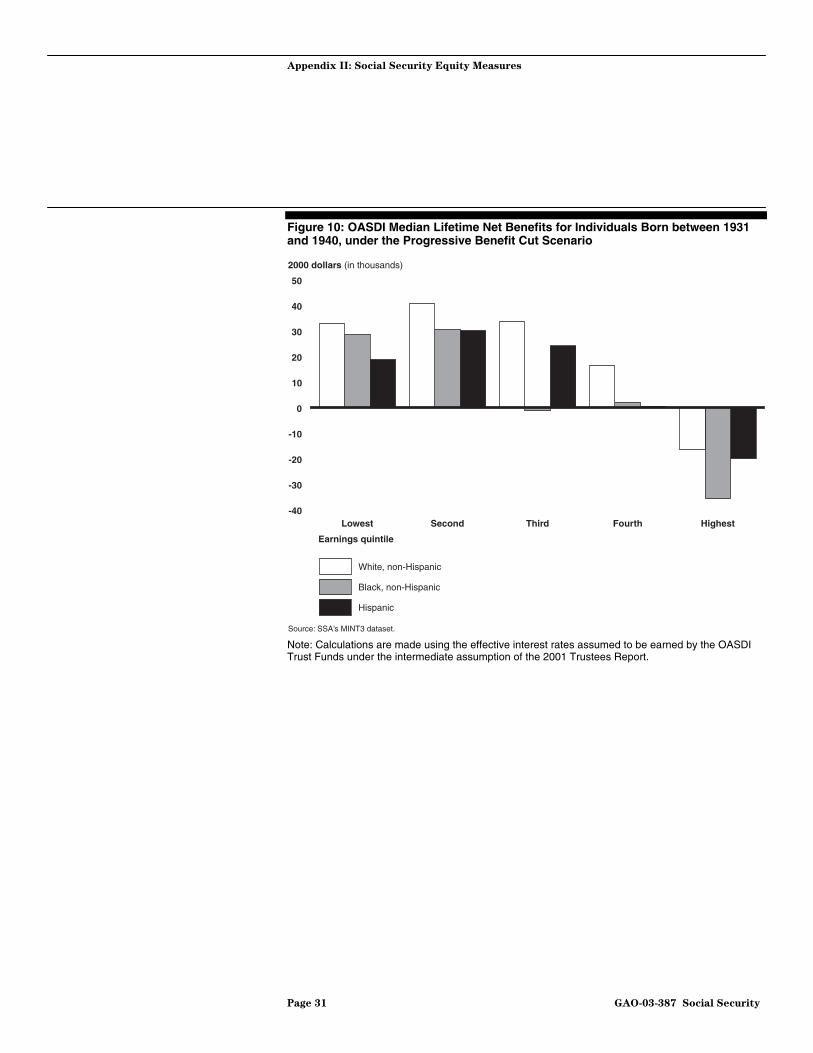
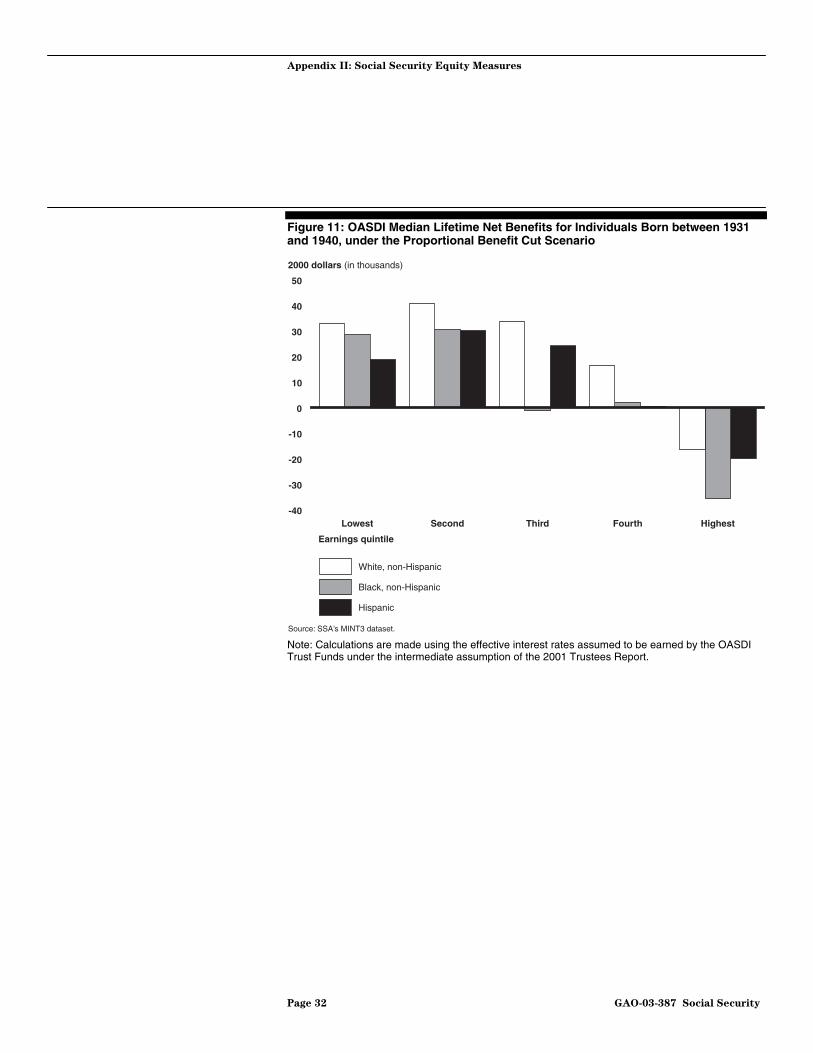
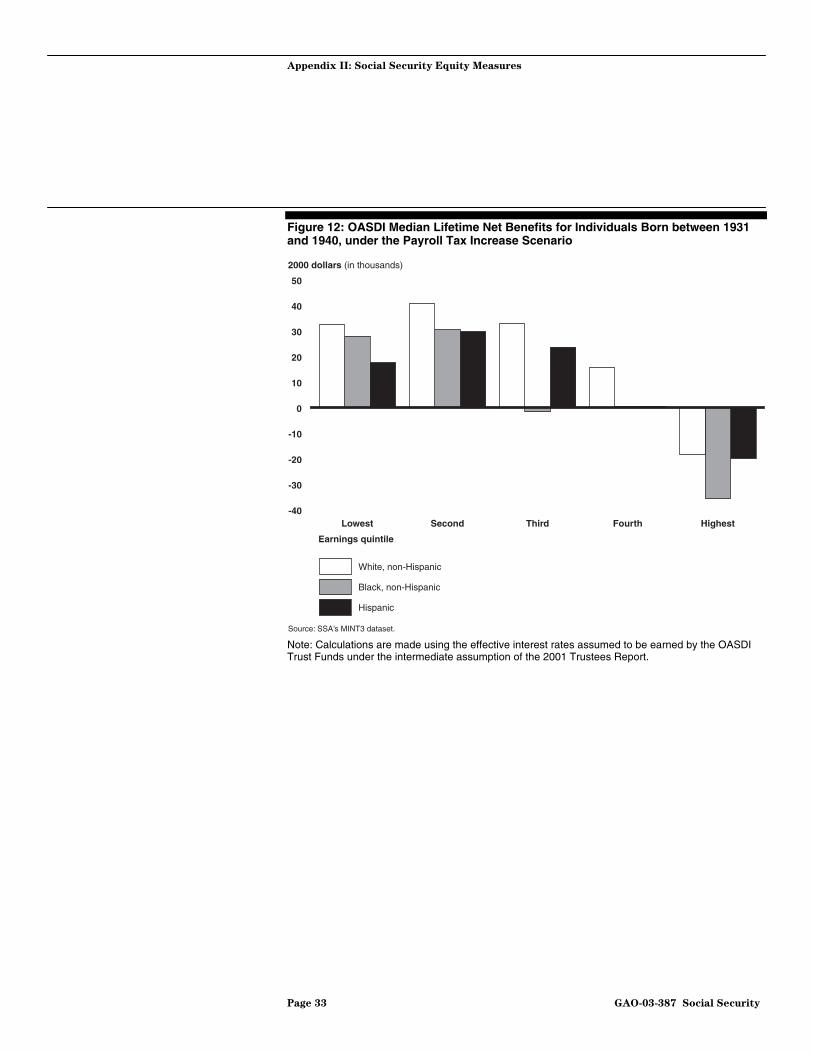
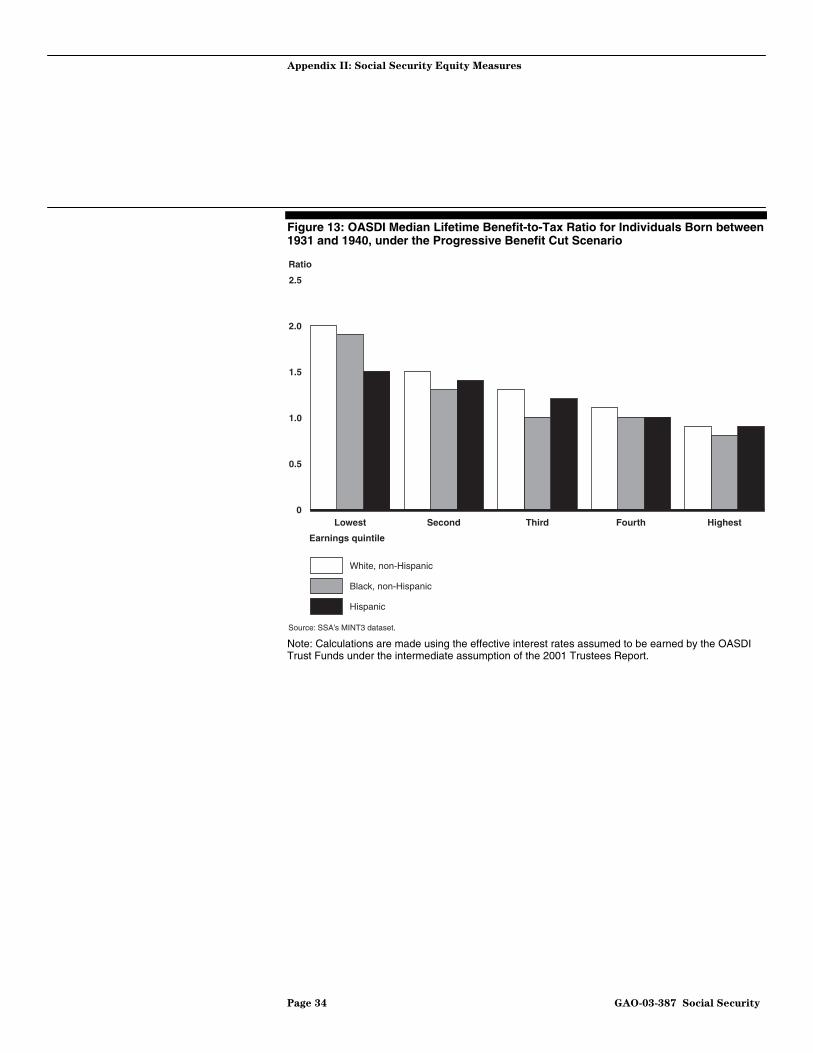
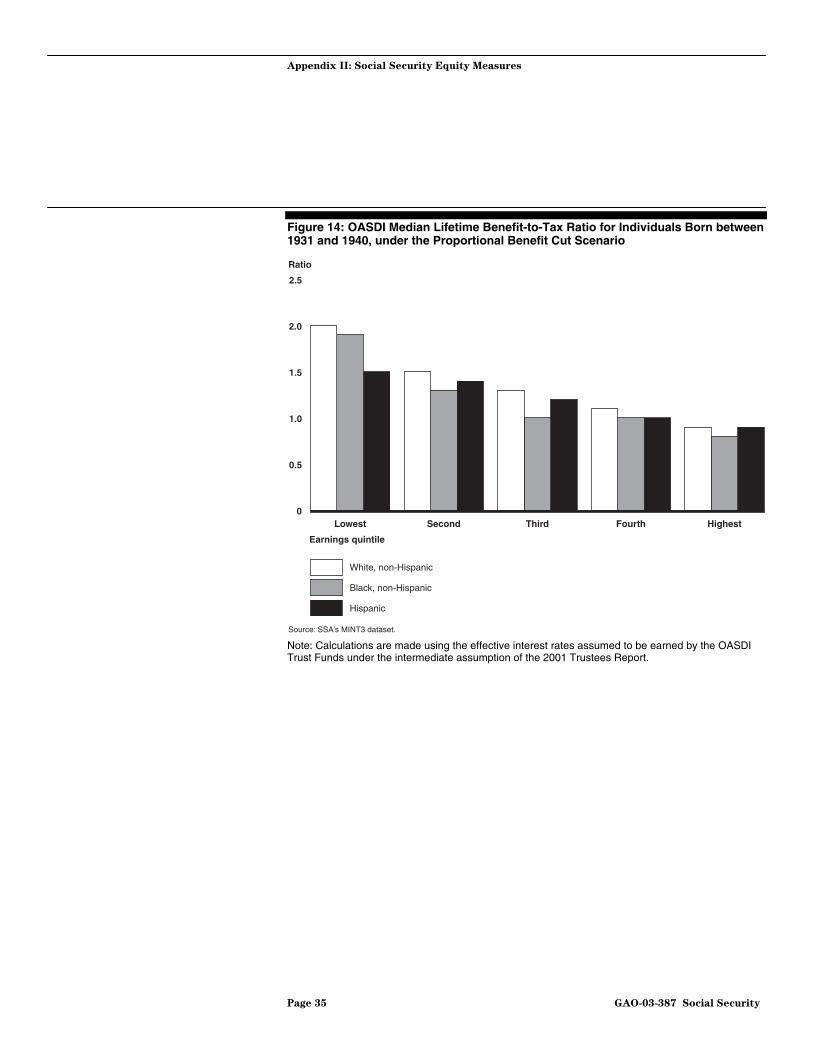
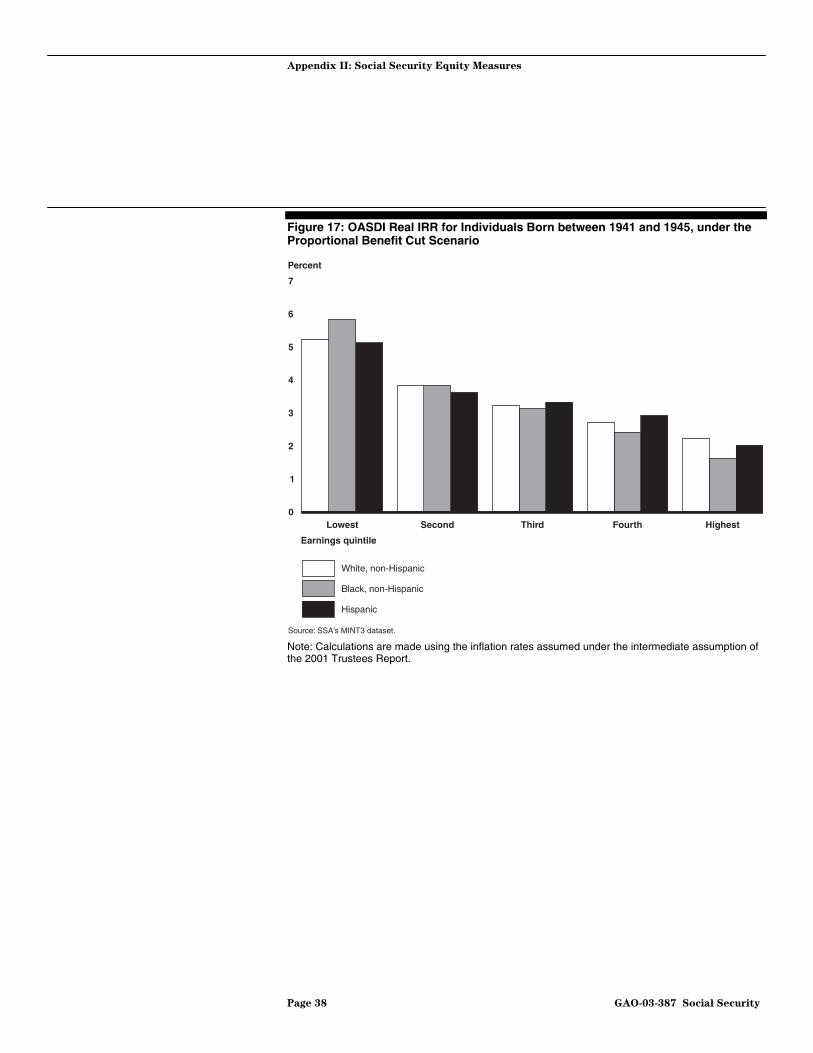
For the median lifetime net benefits and the benefit-to-tax ratio, calculations are made using the 2001 trust fund discount rate, and the dollar figures reported are in 2000 dollars. The two dominant results that the following figures reveal are that the lowest income quintile group always has higher values of the three equity measures than does the highest income quintile group and that earlier birth cohort groups generally have higher values than do later birth cohort groups.
Figure 7: OASDI Real IRR for Individuals Born between 1931 and 1940, under the Progressive Benefit Cut Scenario
Note: Calculations are made using the inflation rates assumed under the intermediate assumption of the 2001 Trustees Report.
Appendix II: Social Security Equity Measures
Percent
0
1
2
3
4
5
6
7
HighestFourthThirdSecondLowest
Earnings quintile
White, non-Hispanic
Black, non-Hispanic
Hispanic
Source: SSA’s MINT3 dataset.
Appendix II: Social Security Equity Measures
Page 29 GAO-03-387 Social Security
Figure 8: OASDI Real IRR for Individuals Born between 1931 and 1940, under the Proportional Benefit Cut Scenario
Note: Calculations are made using the inflation rates assumed under the intermediate assumption of the 2001 Trustees Report.
Percent
0
1
2
3
4
5
6
7
HighestFourthThirdSecondLowest
Earnings quintile
White, non-Hispanic
Black, non-Hispanic
Hispanic
Source: SSA’s MINT3 dataset.

Appendix II: Social Security Equity Measures
Page 30 GAO-03-387 Social Security
Figure 9: OASDI Real IRR for Individuals Born between 1931 and 1940, under the Payroll Tax Increase Scenario
Note: Calculations are made using the inflation rates assumed under the intermediate assumption of the 2001 Trustees Report.
Percent
0
1
2
3
4
5
6
7
HighestFourthThirdSecondLowest
Earnings quintile
White, non-Hispanic
Black, non-Hispanic
Hispanic
Source: SSA’s MINT3 dataset.
Appendix II: Social Security Equity Measures
Page 31 GAO-03-387 Social Security
Figure 10: OASDI Median Lifetime Net Benefits for Individuals Born between 1931 and 1940, under the Progressive Benefit Cut Scenario
Note: Calculations are made using the effective interest rates assumed to be earned by the OASDI Trust Funds under the intermediate assumption of the 2001 Trustees Report.
-40
-30
-20
-10
0
10
20
30
40
50
HighestFourthThirdSecondLowest
2000 dollars (in thousands)
Earnings quintile
White, non-Hispanic
Black, non-Hispanic
Hispanic
Source: SSA’s MINT3 dataset.
Appendix II: Social Security Equity Measures
Page 32 GAO-03-387 Social Security
Figure 11: OASDI Median Lifetime Net Benefits for Individuals Born between 1931 and 1940, under the Proportional Benefit Cut Scenario
Note: Calculations are made using the effective interest rates assumed to be earned by the OASDI Trust Funds under the intermediate assumption of the 2001 Trustees Report.
-40
-30
-20
-10
0
10
20
30
40
50
HighestFourthThirdSecondLowest
2000 dollars (in thousands)
Earnings quintile
White, non-Hispanic
Black, non-Hispanic
Hispanic
Source: SSA’s MINT3 dataset.
Appendix II: Social Security Equity Measures
Page 33 GAO-03-387 Social Security
Figure 12: OASDI Median Lifetime Net Benefits for Individuals Born between 1931 and 1940, under the Payroll Tax Increase Scenario
Note: Calculations are made using the effective interest rates assumed to be earned by the OASDI Trust Funds under the intermediate assumption of the 2001 Trustees Report.
-40
-30
-20
-10
0
10
20
30
40
50
HighestFourthThirdSecondLowest
2000 dollars (in thousands)
Earnings quintile
White, non-Hispanic
Black, non-Hispanic
Hispanic
Source: SSA’s MINT3 dataset.
Appendix II: Social Security Equity Measures
Page 34 GAO-03-387 Social Security
Figure 13: OASDI Median Lifetime Benefit-to-Tax Ratio for Individuals Born between 1931 and 1940, under the Progressive Benefit Cut Scenario
Note: Calculations are made using the effective interest rates assumed to be earned by the OASDI Trust Funds under the intermediate assumption of the 2001 Trustees Report.
Ratio
0
0.5
1.0
1.5
2.0
2.5
HighestFourthThirdSecondLowest
Earnings quintile
White, non-Hispanic
Black, non-Hispanic
Hispanic
Source: SSA’s MINT3 dataset.
Appendix II: Social Security Equity Measures
Page 35 GAO-03-387 Social Security
Figure 14: OASDI Median Lifetime Benefit-to-Tax Ratio for Individuals Born between 1931 and 1940, under the Proportional Benefit Cut Scenario
Note: Calculations are made using the effective interest rates assumed to be earned by the OASDI Trust Funds under the intermediate assumption of the 2001 Trustees Report.
0
0.5
1.0
1.5
2.0
2.5
HighestFourthThirdSecondLowest
Ratio
Earnings quintile
White, non-Hispanic
Black, non-Hispanic
Hispanic
Source: SSA’s MINT3 dataset.

Appendix II: Social Security Equity Measures
Page 36 GAO-03-387 Social Security
Figure 15: OASDI Median Lifetime Benefit-to-Tax Ratio for Individuals Born between 1931 and 1940, under the Payroll Tax Increase Scenario
Note: Calculations are made using the effective interest rates assumed to be earned by the OASDI Trust Funds under the intermediate assumption of the 2001 Trustees Report.
0
0.5
1.0
1.5
2.0
2.5
HighestFourthThirdSecondLowest
Ratio
Earnings quintile
White, non-Hispanic
Black, non-Hispanic
Hispanic
Source: SSA’s MINT3 dataset.

Appendix II: Social Security Equity Measures
Page 37 GAO-03-387 Social Security
Figure 16: OASDI Real IRR for Individuals Born between 1941 and 1945, under the Progressive Benefit Cut Scenario
Note: Calculations are made using the inflation rates assumed under the intermediate assumption of the 2001 Trustees Report.
0
1
2
3
4
5
6
7
HighestFourthThirdSecondLowest
Percent
Earnings quintile
White, non-Hispanic
Black, non-Hispanic
Hispanic
Source: SSA’s MINT3 dataset.
Appendix II: Social Security Equity Measures
Page 38 GAO-03-387 Social Security
Figure 17: OASDI Real IRR for Individuals Born between 1941 and 1945, under the Proportional Benefit Cut Scenario
Note: Calculations are made using the inflation rates assumed under the intermediate assumption of the 2001 Trustees Report.
0
1
2
3
4
5
6
7
HighestFourthThirdSecondLowest
Percent
Earnings quintile
White, non-Hispanic
Black, non-Hispanic
Hispanic
Source: SSA’s MINT3 dataset.

Appendix II: Social Security Equity Measures
Page 39 GAO-03-387 Social Security
Figure 18: OASDI Real IRR for Individuals Born between 1941 and 1945, under the Payroll Tax Increase Scenario
Note: Calculations are made using the inflation rates assumed under the intermediate assumption of the 2001 Trustees Report.
0
1
2
3
4
5
6
7
HighestFourthThirdSecondLowest
Percent
Earnings quintile
White, non-Hispanic
Black, non-Hispanic
Hispanic
Source: SSA’s MINT3 dataset.

Appendix II: Social Security Equity Measures
Page 40 GAO-03-387 Social Security
Figure 19: OASDI Median Lifetime Net Benefits for Individuals Born between 1941 and 1945, under the Progressive Benefit Cut Scenario
Note: Calculations are made using the effective interest rates assumed to be earned by the OASDI Trust Funds under the intermediate assumption of the 2001 Trustees Report.
-120
-100
-80
-60
-40
-20
0
20
40
HighestFourthThirdSecondLowest
2000 dollars (in thousands)
Earnings quintile
White, non-Hispanic
Black, non-Hispanic
Hispanic
Source: SSA’s MINT3 dataset.
Appendix II: Social Security Equity Measures
Page 41 GAO-03-387 Social Security
Figure 20: OASDI Median Lifetime Net Benefits for Individuals Born between 1941 and 1945, under the Proportional Benefit Cut Scenario
Note: Calculations are made using the effective interest rates assumed to be earned by the OASDI Trust Funds under the intermediate assumption of the 2001 Trustees Report.
-120
-100
-80
-60
-40
-20
0
20
40
HighestFourthThirdSecondLowest
2000 dollars (in thousands)
Earnings quintile
White, non-Hispanic
Black, non-Hispanic
Hispanic
Source: SSA’s MINT3 dataset.
Appendix II: Social Security Equity Measures
Page 42 GAO-03-387 Social Security
Figure 21: OASDI Median Lifetime Net Benefits for Individuals Born between 1941 and 1945, under the Payroll Tax Increase Scenario
Note: Calculations are made using the effective interest rates assumed to be earned by the OASDI Trust Funds under the intermediate assumption of the 2001 Trustees Report.
-120
-100
-80
-60
-40
-20
0
20
40
HighestFourthThirdSecondLowest
2000 dollars (in thousands)
Earnings quintile
White, non-Hispanic
Black, non-Hispanic
Hispanic
Source: SSA’s MINT3 dataset.
Appendix II: Social Security Equity Measures
Page 43 GAO-03-387 Social Security
Figure 22: OASDI Median Lifetime Benefit-to-Tax Ratio for Individuals Born between 1941 and 1945, under the Progressive Benefit Cut Scenario
Note: Calculations are made using the effective interest rates assumed to be earned by the OASDI Trust Funds under the intermediate assumption of the 2001 Trustees Report.
0
0.2
0.4
0.6
0.8
1.0
1.2
1.4
1.6
1.8
HighestFourthThirdSecondLowest
Ratio
Earnings quintile
White, non-Hispanic
Black, non-Hispanic
Hispanic
Source: SSA’s MINT3 dataset.

Appendix II: Social Security Equity Measures
Page 44 GAO-03-387 Social Security
Figure 23: OASDI Median Lifetime Benefit-to-Tax Ratio for Individuals Born between 1941 and 1945, under the Proportional Benefit Cut Scenario
Note: Calculations are made using the effective interest rates assumed to be earned by the OASDI Trust Funds under the intermediate assumption of the 2001 Trustees Report.
0
0.2
0.4
0.6
0.8
1.0
1.2
1.4
1.6
1.8
HighestFourthThirdSecondLowest
Ratio
Earnings quintile
White, non-Hispanic
Black, non-Hispanic
Hispanic
Source: SSA’s MINT3 dataset.

Appendix II: Social Security Equity Measures
Page 45 GAO-03-387 Social Security
Figure 24: OASDI Median Lifetime Benefit-to-Tax Ratio for Individuals Born between 1941 and 1945, under the Payroll Tax Increase Scenario
Note: Calculations are made using the effective interest rates assumed to be earned by the OASDI Trust Funds under the intermediate assumption of the 2001 Trustees Report.
0
0.2
0.4
0.6
0.8
1.0
1.2
1.4
1.6
1.8
HighestFourthThirdSecondLowest
Ratio
Earnings quintile
White, non-Hispanic
Black, non-Hispanic
Hispanic
Source: SSA’s MINT3 dataset.

Appendix II: Social Security Equity Measures
Page 46 GAO-03-387 Social Security
Figure 25: OASDI Real IRR for Individuals Born between 1946 and 1955, under the Progressive Benefit Cut Scenario
Note: Calculations are made using the inflation rates assumed under the intermediate assumption of the 2001 Trustees Report.
0
1
2
3
4
5
6
7
HighestFourthThirdSecondLowest
Percent
Earnings quintile
White, non-Hispanic
Black, non-Hispanic
Hispanic
Source: SSA’s MINT3 dataset.

Appendix II: Social Security Equity Measures
Page 47 GAO-03-387 Social Security
Figure 26: OASDI Real IRR for Individuals Born between 1946 and 1955, for the Proportional Benefit Cut Scenario
Note: Calculations are made using the inflation rates assumed under the intermediate assumption of the 2001 Trustees Report.
0
1
2
3
4
5
6
7
HighestFourthThirdSecondLowest
Percent
Earnings quintile
White, non-Hispanic
Black, non-Hispanic
Hispanic
Source: SSA’s MINT3 dataset.
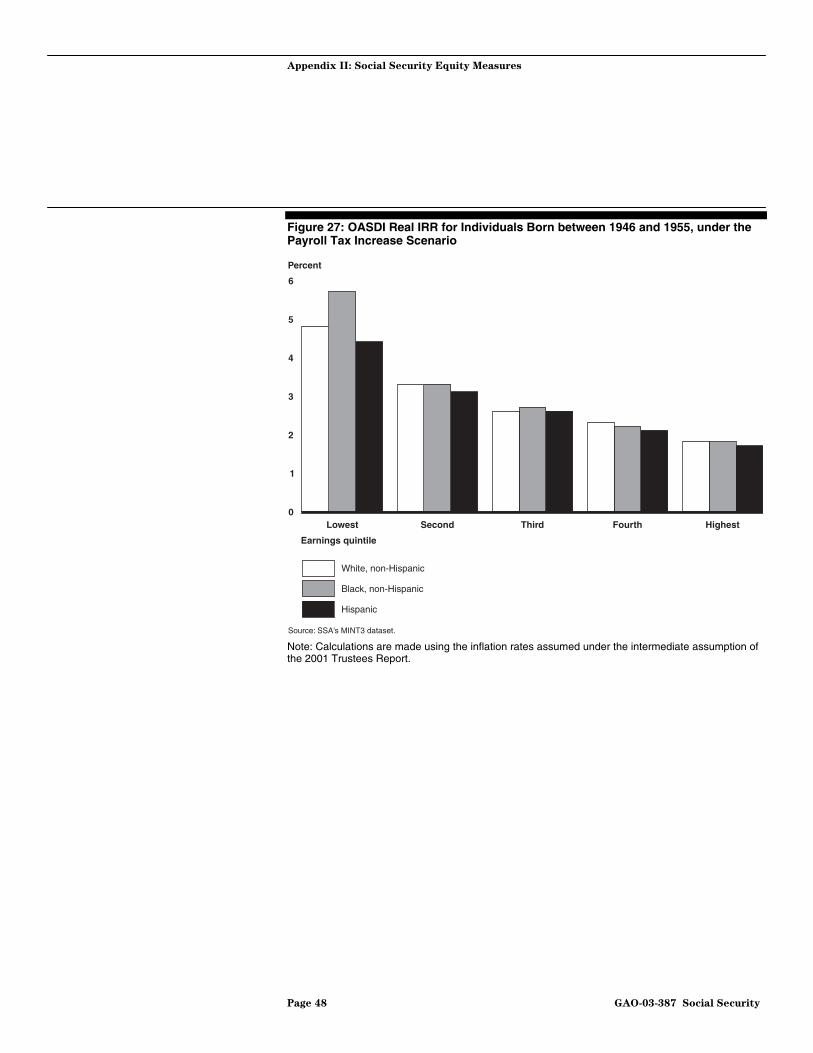
Appendix II: Social Security Equity Measures
Page 48 GAO-03-387 Social Security
Figure 27: OASDI Real IRR for Individuals Born between 1946 and 1955, under the Payroll Tax Increase Scenario
Note: Calculations are made using the inflation rates assumed under the intermediate assumption of the 2001 Trustees Report.
0
1
2
3
4
5
6
HighestFourthThirdSecondLowest
Percent
Earnings quintile
White, non-Hispanic
Black, non-Hispanic
Hispanic
Source: SSA’s MINT3 dataset.

Appendix II: Social Security Equity Measures
Page 49 GAO-03-387 Social Security
Figure 28: OASDI Median Lifetime Net Benefits for Individuals Born between 1946 and 1955, under the Progressive Benefit Cut Scenario
Note: Calculations are made using the effective interest rates assumed to be earned by the OASDI Trust Funds under the intermediate assumption of the 2001 Trustees Report.
-120
-100
-80
-60
-40
-20
0
20
40
HighestFourthThirdSecondLowest
2000 dollars (in thousands)
Earnings quintile
White, non-Hispanic
Black, non-Hispanic
Hispanic
Source: SSA’s MINT3 dataset.

Appendix II: Social Security Equity Measures
Page 50 GAO-03-387 Social Security
Figure 29: OASDI Median Lifetime Net Benefits for Individuals Born between 1946 and 1955, under the Proportional Benefit Cut Scenario
Note: Calculations are made using the effective interest rates assumed to be earned by the OASDI Trust Funds under the intermediate assumption of the 2001 Trustees Report.
-120
-100
-80
-60
-40
-20
0
20
40
HighestFourthThirdSecondLowest
2000 dollars (in thousands)
Earnings quintile
White, non-Hispanic
Black, non-Hispanic
Hispanic
Source: SSA’s MINT3 dataset.
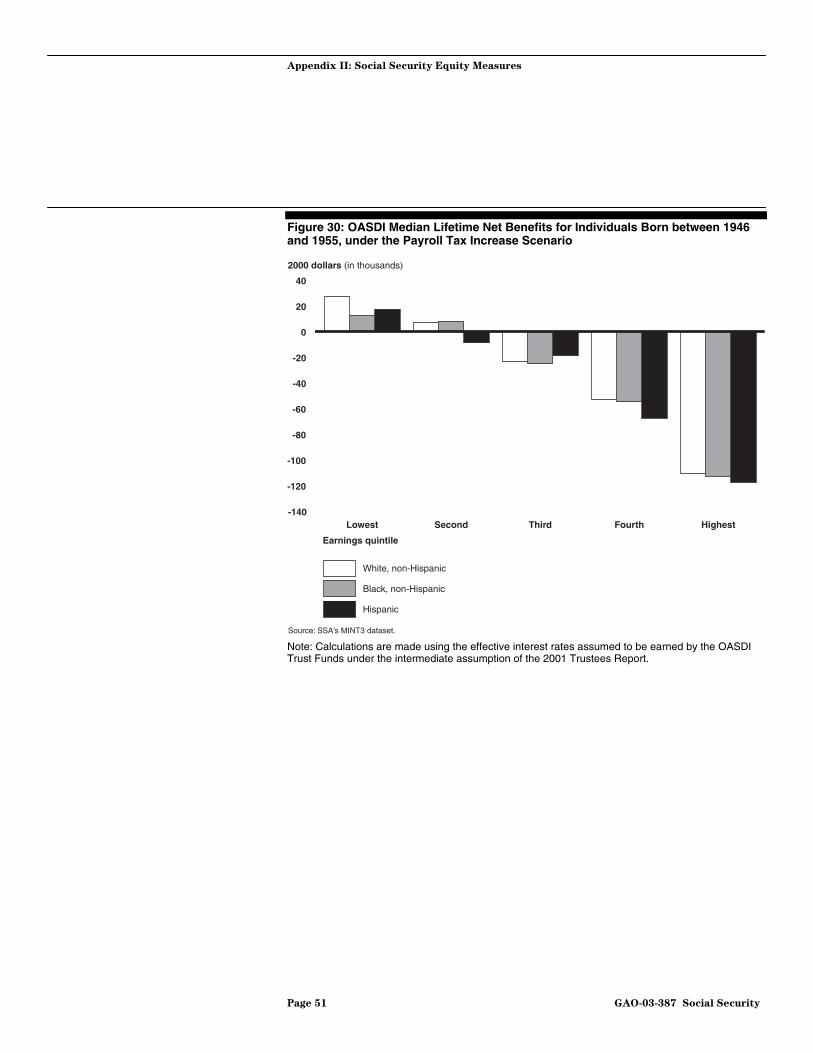
Appendix II: Social Security Equity Measures
Page 51 GAO-03-387 Social Security
Figure 30: OASDI Median Lifetime Net Benefits for Individuals Born between 1946 and 1955, under the Payroll Tax Increase Scenario
Note: Calculations are made using the effective interest rates assumed to be earned by the OASDI Trust Funds under the intermediate assumption of the 2001 Trustees Report.
-140
-120
-100
-80
-60
-40
-20
0
20
40
HighestFourthThirdSecondLowest
2000 dollars (in thousands)
Earnings quintile
White, non-Hispanic
Black, non-Hispanic
Hispanic
Source: SSA’s MINT3 dataset.

Appendix II: Social Security Equity Measures
Page 52 GAO-03-387 Social Security
Figure 31: OASDI Median Lifetime Benefit-to-Tax Ratio for Individuals Born between 1946 and 1955, under the Progressive Benefit Cut Scenario
Note: Calculations are made using the effective interest rates assumed to be earned by the OASDI Trust Funds under the intermediate assumption of the 2001 Trustees Report.
0
0.2
0.4
0.6
0.8
1.0
1.2
1.4
1.6
HighestFourthThirdSecondLowest
Ratio
Earnings quintile
White, non-Hispanic
Black, non-Hispanic
Hispanic
Source: SSA’s MINT3 dataset.

Appendix II: Social Security Equity Measures
Page 53 GAO-03-387 Social Security
Figure 32: OASDI Median Lifetime Benefit-to-Tax Ratio for Individuals Born between 1946 and 1955, under the Proportional Benefit Cut Scenario
Note: Calculations are made using the effective interest rates assumed to be earned by the OASDI Trust Funds under the intermediate assumption of the 2001 Trustees Report.
0
0.2
0.4
0.6
0.8
1.0
1.2
1.4
1.6
HighestFourthThirdSecondLowest
Ratio
Earnings quintile
White, non-Hispanic
Black, non-Hispanic
Hispanic
Source: SSA’s MINT3 dataset.

Appendix II: Social Security Equity Measures
Page 54 GAO-03-387 Social Security
Figure 33: OASDI Median Lifetime Benefit-to-Tax Ratio for Individuals Born between 1946 and 1955, under the Payroll Tax Increase Scenario
Note: Calculations are made using the effective interest rates assumed to be earned by the OASDI Trust Funds under the intermediate assumption of the 2001 Trustees Report.
0
0.2
0.4
0.6
0.8
1.0
1.2
1.4
1.6
HighestFourthThirdSecondLowest
Ratio
Earnings quintile
White, non-Hispanic
Black, non-Hispanic
Hispanic
Source: SSA’s MINT3 dataset.

Appendix II: Social Security Equity Measures
Page 55 GAO-03-387 Social Security
Figure 34: OASDI Real IRR for Individuals Born between 1956 and 1964, under the Progressive Benefit Cut Scenario
Note: Calculations are made using the inflation rates assumed under the intermediate assumption of the 2001 Trustees Report.
0
1
2
3
4
5
6
HighestFourthThirdSecondLowest
Percent
Earnings quintile
White, non-Hispanic
Black, non-Hispanic
Hispanic
Source: SSA’s MINT3 dataset.

Appendix II: Social Security Equity Measures
Page 56 GAO-03-387 Social Security
Figure 35: OASDI Real IRR for Individuals Born between 1956 and 1964, under the Proportional Benefit Cut Scenario
Note: Calculations are made using the inflation rates assumed under the intermediate assumption of the 2001 Trustees Report.
0
1
2
3
4
5
6
HighestFourthThirdSecondLowest
Percent
Earnings quintile
White, non-Hispanic
Black, non-Hispanic
Hispanic
Source: SSA’s MINT3 dataset.
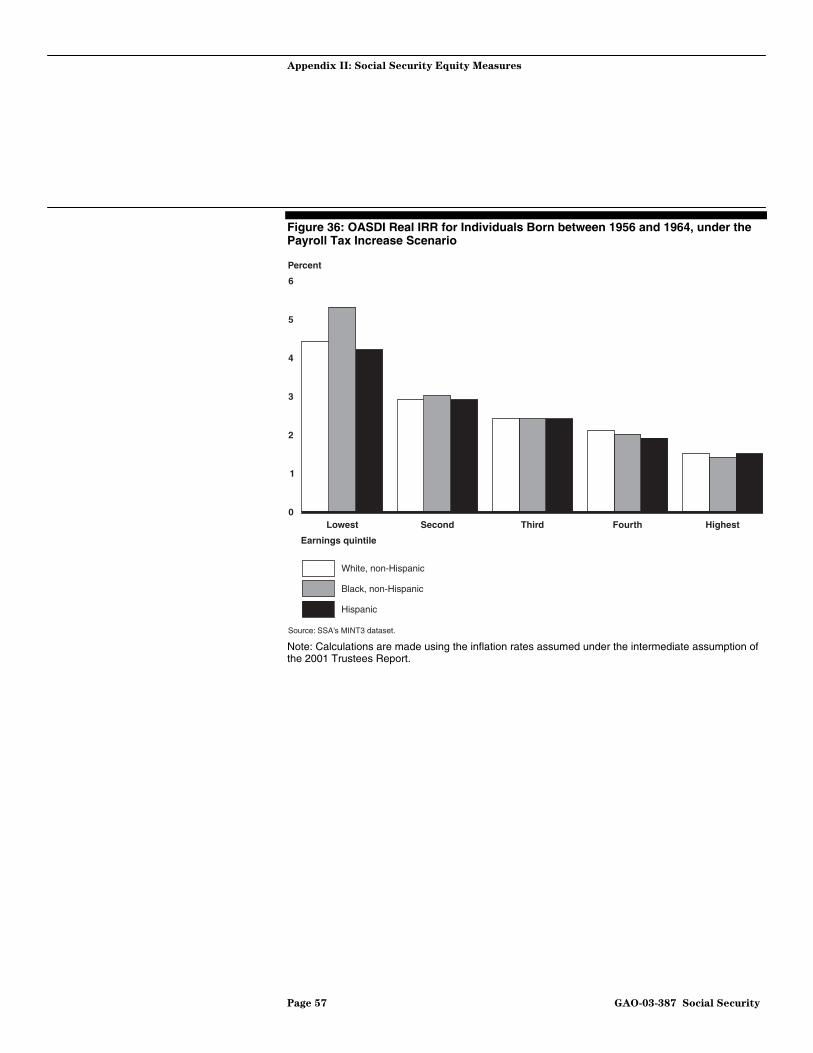
Appendix II: Social Security Equity Measures
Page 57 GAO-03-387 Social Security
Figure 36: OASDI Real IRR for Individuals Born between 1956 and 1964, under the Payroll Tax Increase Scenario
Note: Calculations are made using the inflation rates assumed under the intermediate assumption of the 2001 Trustees Report.
0
1
2
3
4
5
6
HighestFourthThirdSecondLowest
Percent
Earnings quintile
White, non-Hispanic
Black, non-Hispanic
Hispanic
Source: SSA’s MINT3 dataset.

Appendix II: Social Security Equity Measures
Page 58 GAO-03-387 Social Security
Figure 37: OASDI Median Lifetime Net Benefits for Individuals Born between 1956 and 1964, under the Progressive Benefit Cut Scenario
Note: Calculations are made using the effective interest rates assumed to be earned by the OASDI Trust Funds under the intermediate assumption of the 2001 Trustees Report.
-200
-150
-100
-50
0
50
HighestFourthThirdSecondLowest
2000 dollars (in thousands)
Earnings quintile
White, non-Hispanic
Black, non-Hispanic
Hispanic
Source: SSA’s MINT3 dataset.

Appendix II: Social Security Equity Measures
Page 59 GAO-03-387 Social Security
Figure 38: OASDI Median Lifetime Net Benefits for Individuals Born between 1956 and 1964, under the Proportional Benefit Cut Scenario
Note: Calculations are made using the effective interest rates assumed to be earned by the OASDI Trust Funds under the intermediate assumption of the 2001 Trustees Report.
-160
-120
-80
-40
0
40
HighestFourthThirdSecondLowest
2000 dollars (in thousands)
Earnings quintile
White, non-Hispanic
Black, non-Hispanic
Hispanic
Source: SSA’s MINT3 dataset.
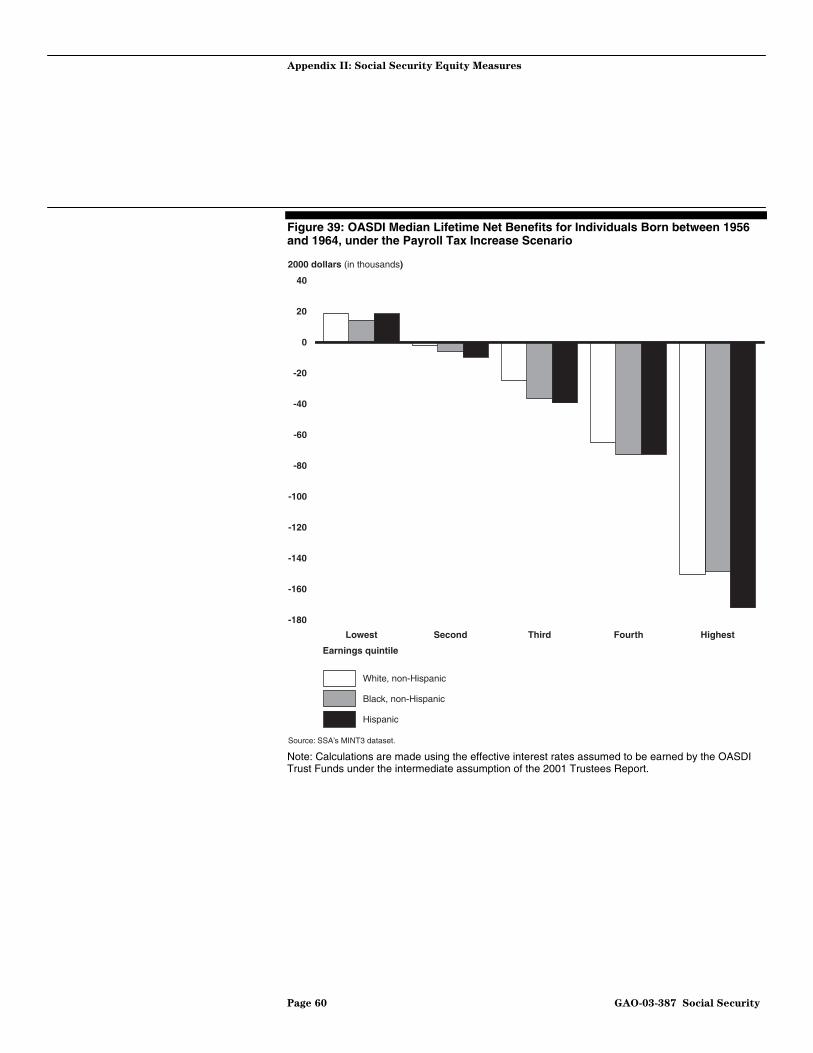
Appendix II: Social Security Equity Measures
Page 60 GAO-03-387 Social Security
Figure 39: OASDI Median Lifetime Net Benefits for Individuals Born between 1956 and 1964, under the Payroll Tax Increase Scenario
Note: Calculations are made using the effective interest rates assumed to be earned by the OASDI Trust Funds under the intermediate assumption of the 2001 Trustees Report.
-180
-160
-140
-120
-100
-80
-60
-40
-20
0
20
40
HighestFourthThirdSecondLowest
2000 dollars (in thousands)
Earnings quintile
White, non-Hispanic
Black, non-Hispanic
Hispanic
Source: SSA’s MINT3 dataset.
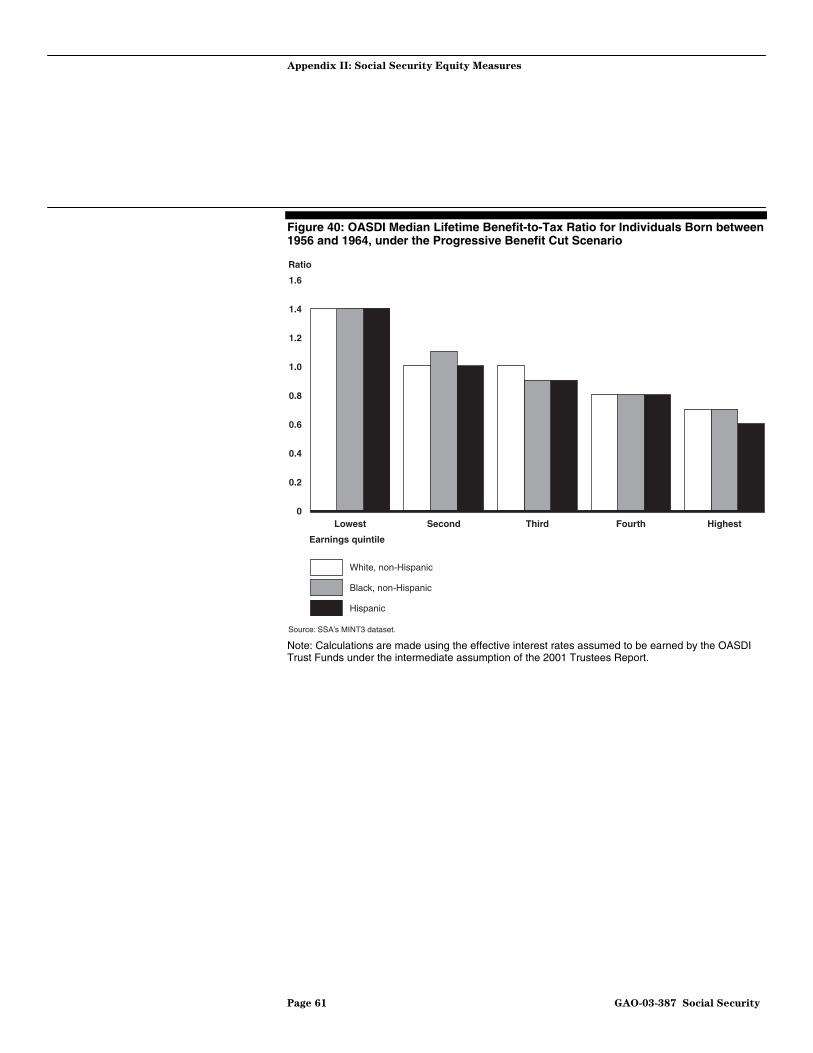
Appendix II: Social Security Equity Measures
Page 61 GAO-03-387 Social Security
Figure 40: OASDI Median Lifetime Benefit-to-Tax Ratio for Individuals Born between 1956 and 1964, under the Progressive Benefit Cut Scenario
Note: Calculations are made using the effective interest rates assumed to be earned by the OASDI Trust Funds under the intermediate assumption of the 2001 Trustees Report.
0
0.2
0.4
0.6
0.8
1.0
1.2
1.4
1.6
HighestFourthThirdSecondLowest
Ratio
Earnings quintile
White, non-Hispanic
Black, non-Hispanic
Hispanic
Source: SSA’s MINT3 dataset.

Appendix II: Social Security Equity Measures
Page 62 GAO-03-387 Social Security
Figure 41: OASDI Median Lifetime Benefit-to-Tax Ratio for Individuals Born between 1956 and 1964, under the Proportional Benefit Cut Scenario
Note: Calculations are made using the effective interest rates assumed to be earned by the OASDI Trust Funds under the intermediate assumption of the 2001 Trustees Report.
0
0.2
0.4
0.6
0.8
1.0
1.2
1.4
1.6
HighestFourthThirdSecondLowest
Ratio
Earnings quintile
White, non-Hispanic
Black, non-Hispanic
Hispanic
Source: SSA’s MINT3 dataset.
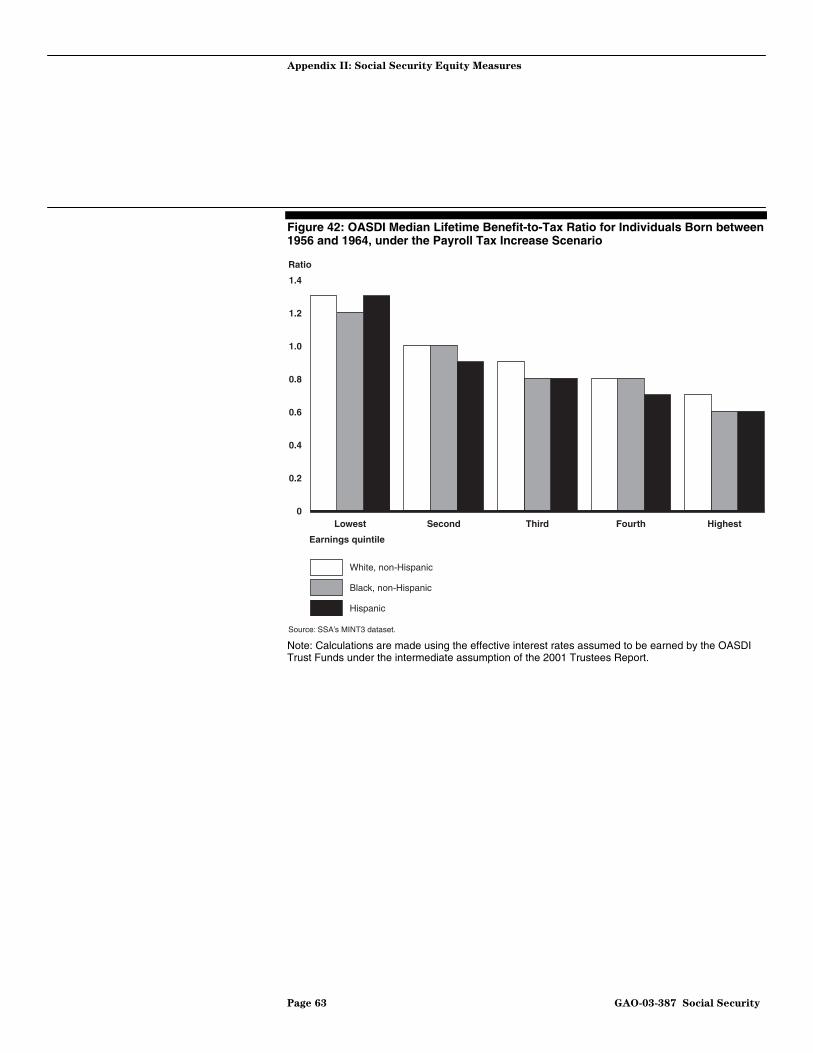
Appendix II: Social Security Equity Measures
Page 63 GAO-03-387 Social Security
Figure 42: OASDI Median Lifetime Benefit-to-Tax Ratio for Individuals Born between 1956 and 1964, under the Payroll Tax Increase Scenario
Note: Calculations are made using the effective interest rates assumed to be earned by the OASDI Trust Funds under the intermediate assumption of the 2001 Trustees Report.
0
0.2
0.4
0.6
0.8
1.0
1.2
1.4
HighestFourthThirdSecondLowest
Ratio
Earnings quintile
White, non-Hispanic
Black, non-Hispanic
Hispanic
Source: SSA’s MINT3 dataset.
Appendix III: GAO Contacts and Staff
Acknowledgments
Page 64 GAO-03-387 Social Security
Alicia Puente Cackley, (202) 512-7022 Gretta L. Goodwin, (202) 512-7952
In addition to those named above, the following individuals made significant contributions to this report: Brendan Cushing-Daniels and Patrick DiBattista, Education, Workforce, and Income Security Issues; Joseph Applebaum, Robert Parker, Joan Vogel, and Grant Mallie, Applied Research and Methods; Jeffrey Baldwin-Bott, International Affairs and Trade; Richard Burkard and Roger Thomas, General Counsel; and Lee Cohen, the Social Security Administration.
Appendix III: GAO Contacts and Staff Acknowledgments
GAO Contacts
Staff Acknowledgments
Bibliography
Page 65 GAO-03-387 Social Security
Hayward, Mark D., and Melonie Heron. (1999) “Racial Inequality in Active Life Among Adult Americans,” Demography 36(1): 77-91.
Honig, Majorie. 2000. “Minorities Face Retirement: Worklife Disparities Repeated?” in Olivia S. McMillan, P. Brett Hammond, and Anna M. Rappaport, eds. Forecasting Retirement Needs and Retirement Wealth, Pension Research Council. Philadelphia: University of Pennsylvania Press: 208-234.
Lian, Robert Keng Heong, Emiliano A. Valdez, and Chan Kee Low (2000) “Actuarial Analysis of Retirement Income Replacement Ratios,” Journal of
Actuarial Practice 8(1-2): 147-176.
Leimer, Dean R., “Simulating the Long-Run Aggregate Economic and Intergenerational Redistributive Effects of Social Security Policy” (1992) ORS Working Paper 56, Division of Economic Research.
Leimer, Dean R., “Cohort-Specific Measures of Lifetime Net Social Security Transfers” (1994) ORS Working Paper 59, Division of Economic Research.
Liebman, Jeffrey B., “Redistribution in the Current U.S. Social Security System” (2001) National Bureau of Economic Research working paper 8625. http://www.nber.org/papers/w8625.
Nichols, Orlo R., Michael D. Clingman, and Milton P. Glanz (2001) “Internal Real Rates of Return under the OASDI Program for Hypothetical Workers,” Social Security Administration, Office of the Chief Actuary Actuarial Note 144.
Sorlie, Paul D., Eric Backlund, Norman J. Johnson, and Eugene Rogot (1993) “Mortality by Hispanic Status In the United States,” JAMA 270(20): 2464-2468.
Sorlie, Paul D., Eugene Rogot, and Norman J. Johnson (1992) “Validity of Demographic Characteristics on the Death Certificate,” Epidemiology 3(2): 181-184.
Sze, Michael, Stephen C. Goss and Jose Gomez de Leon (1998). “Effect of Aging Population with Declining Mortality on Social Security and NAFTA Countries,” North American Actuarial Journal 2(4): 83-107.
Bibliography
Bibliography
Page 66 GAO-03-387 Social Security
Urban Institute. Final Report: Modeling Income in the Near Term:
Revised Projections of Retirement Income Through 2020 for the
1931-1960 Birth Cohorts, June 2002.
Related GAO Products
Page 67 GAO-03-387 Social Security
Social Security: Analysis of Reform Models Developed by the President’s
Commission to Strengthen Social Security. GAO-03-310. Washington, D.C.: January 15, 2003.
Social Security: Program’s Role in Helping Ensure Income Adequacy. GAO-02-62. Washington, D.C.: November 30, 2001.
Social Security Reform: Potential Effects on SSA’s Disability Program
and Beneficiaries. GAO-01-35. Washington, D.C.: January 24, 2001.
Social Security: Issues in Comparing Rates of Return with Market
Investments. GAO/HEHS-99-110. Washington, D.C.: August 5, 1999.
Social Security Reform: Implications of Raising the Retirement Age. GAO/HEHS-99-112. Washington, D.C.: August 27, 1999.
Social Security and Minorities: Current Benefits and Implications of
Reform. GAO/T-HEHS-99-60. Washington, D.C.: February 10, 1999.
Social Security Reform: Different Approaches for Addressing Program
Solvency. GAO/HEHS-98-33. Washington, D.C.: July 22, 1998.
Social Security Reform: Implications for Women’s Retirement Income. GAO/HEHS-98-42. Washington, D.C.: December 31, 1997.
Related GAO Products
(207057)

The General Accounting Office, the audit, evaluation and investigative arm of Congress, exists to support Congress in meeting its constitutional responsibilities and to help improve the performance and accountability of the federal government for the American people. GAO examines the use of public funds; evaluates federal programs and policies; and provides analyses, recommendations, and other assistance to help Congress make informed oversight, policy, and funding decisions. GAO’s commitment to good government is reflected in its core values of accountability, integrity, and reliability.
The fastest and easiest way to obtain copies of GAO documents at no cost is through the Internet. GAO’s Web site (www.gao.gov) contains abstracts and full-text files of current reports and testimony and an expanding archive of older products. The Web site features a search engine to help you locate documents using key words and phrases. You can print these documents in their entirety, including charts and other graphics.
Each day, GAO issues a list of newly released reports, testimony, and correspondence. GAO posts this list, known as “Today’s Reports,” on its Web site daily. The list contains links to the full-text document files. To have GAO e-mail this list to you every afternoon, go to www.gao.gov and select “Subscribe to daily E-mail alert for newly released products” under the GAO Reports heading.
The first copy of each printed report is free. Additional copies are $2 each. A check or money order should be made out to the Superintendent of Documents. GAO also accepts VISA and Mastercard. Orders for 100 or more copies mailed to a single address are discounted 25 percent. Orders should be sent to:
U.S. General Accounting Office 441 G Street NW, Room LM Washington, D.C. 20548
To order by Phone: Voice: (202) 512-6000 TDD: (202) 512-2537 Fax: (202) 512-6061
Contact:
Web site: www.gao.gov/fraudnet/fraudnet.htm E-mail: [email protected] Automated answering system: (800) 424-5454 or (202) 512-7470
Jeff Nelligan, managing director, [email protected] (202) 512-4800 U.S. General Accounting Office, 441 G Street NW, Room 7149 Washington, D.C. 20548
GAO’s Mission
Obtaining Copies of GAO Reports and Testimony
Order by Mail or Phone
To Report Fraud, Waste, and Abuse in Federal Programs
Public Affairs
Related Documents