Ganesha on the Dashboard

Ganesha on the dashboard
Aug 03, 2015
Welcome message from author
This document is posted to help you gain knowledge. Please leave a comment to let me know what you think about it! Share it to your friends and learn new things together.
Transcript
Ganesha on the Dashboard
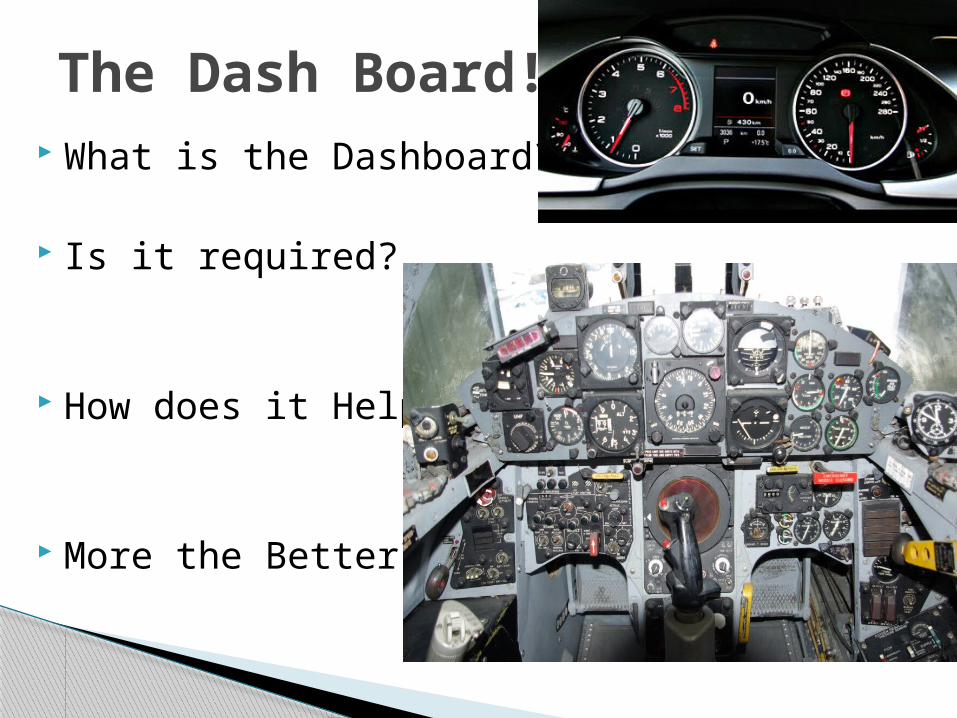
What is the Dashboard?
Is it required?
How does it Help?
More the Better?
The Dash Board!!
Why Ganesha on most Dashboards????
What does it Signify?
What is the Impact?
The Ganesha!!!
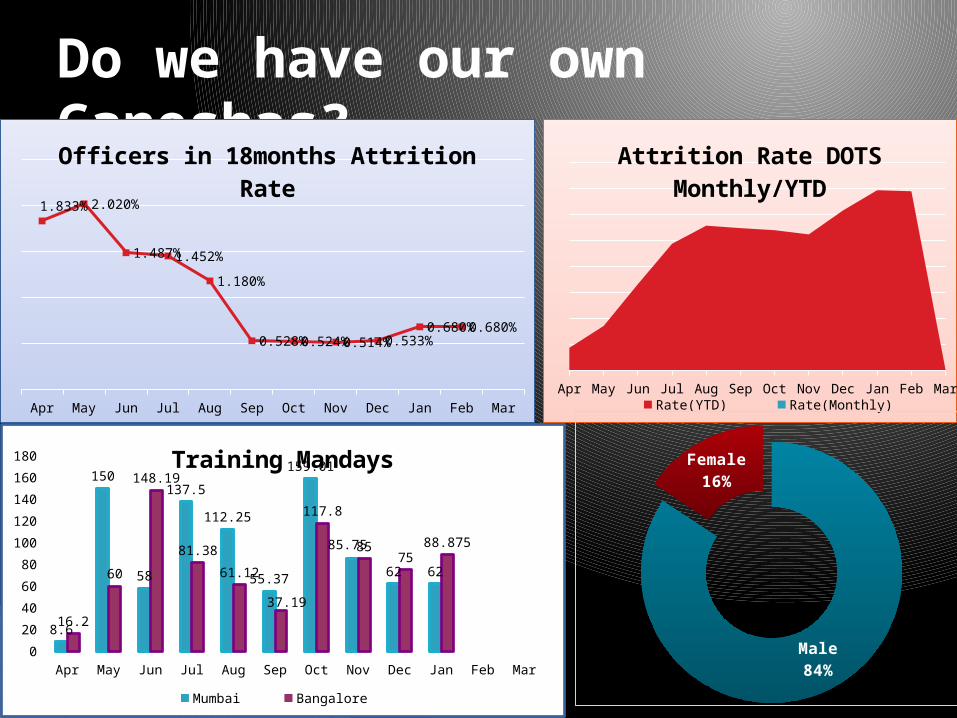
Do we have our own Ganeshas?
Apr May Jun Jul Aug Sep Oct Nov Dec Jan Feb Mar
Attrition Rate DOTS Monthly/YTD
Rate(YTD) Rate(Monthly)
Male84%
Female16%
Apr May Jun Jul Aug Sep Oct Nov Dec Jan Feb Mar
1.833% 2.020%
1.487%1.452%
1.180%
0.528%0.524%0.514%0.533%0.680%0.680%
Officers in 18months Attrition Rate
Apr May Jun Jul Aug Sep Oct Nov Dec Jan Feb Mar0
20
40
60
80
100
120
140
160
180
8.6
150
58
137.5
112.25
55.37
159.01
85.75
62 62
16.2
60
148.19
81.38
61.12
37.19
117.8
8575
88.875
Training Mandays
Mumbai Bangalore
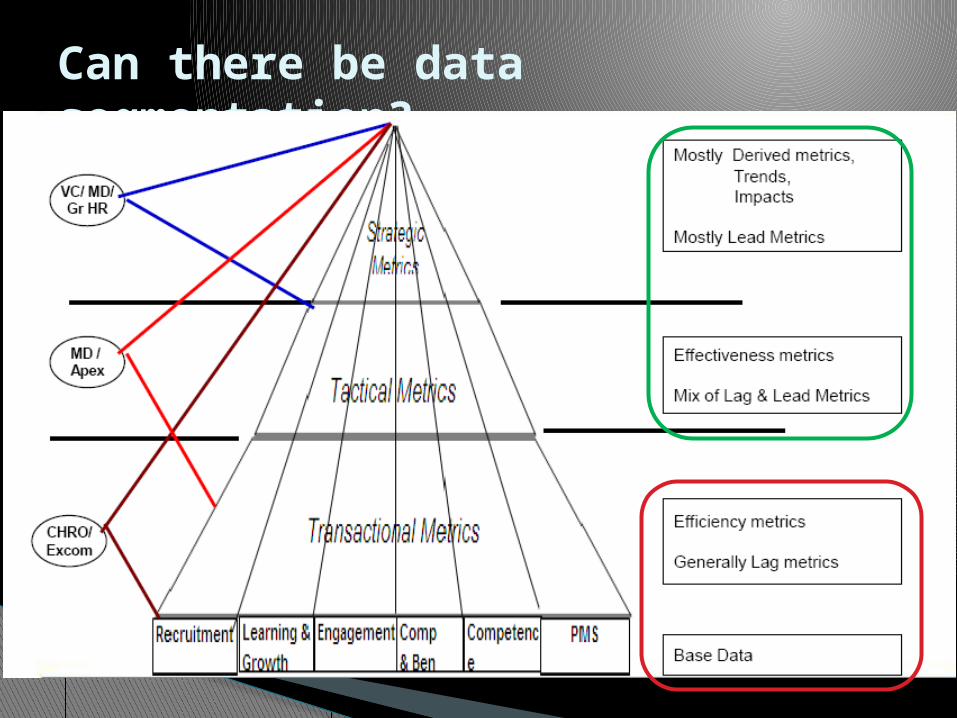
Can there be data segmentation?
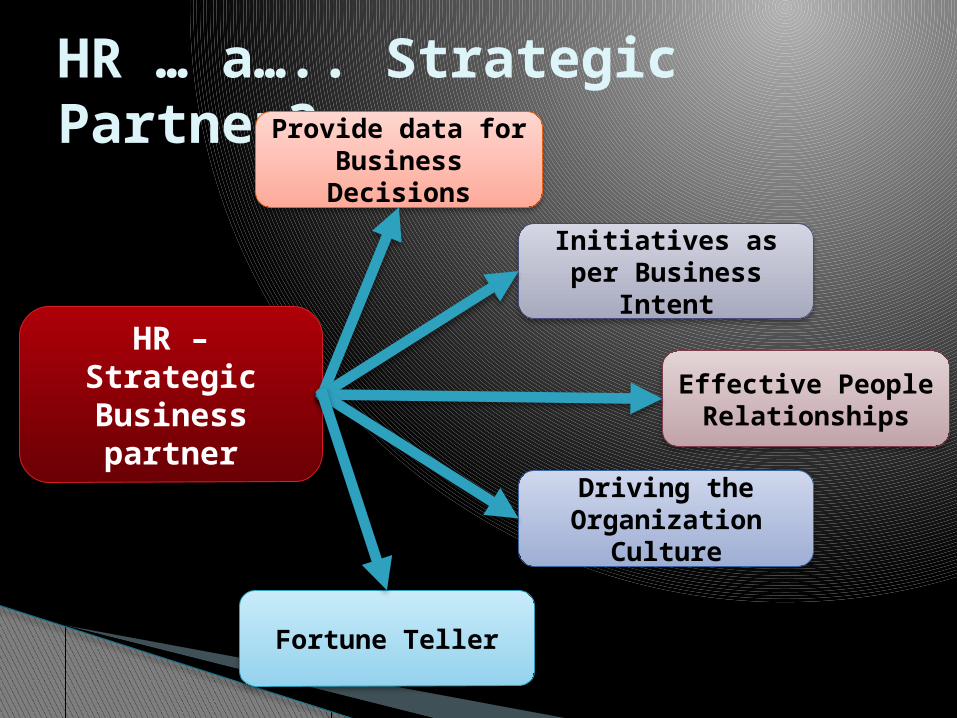
HR … a….. Strategic Partner?
HR – Strategic Business partner
Initiatives as per Business Intent
Provide data for Business Decisions
Driving the Organization
Culture
Effective People Relationships
Fortune Teller
HR Metrics Driving Decisions
Can Metrics drive Decision?
What are top 3 Metrics you can think of which can help drive decisions?
Why are Metrics required?
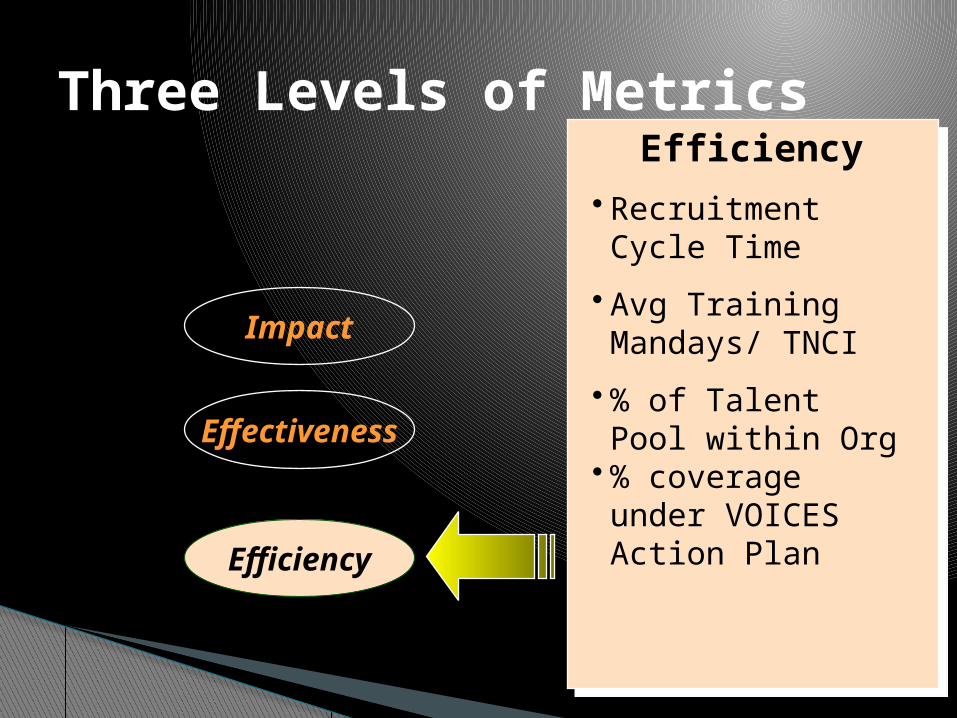
Three Levels of Metrics
Effectiveness
Efficiency
Impact
Efficiency• Recruitment Cycle Time
• Avg Training Mandays/ TNCI
• % of Talent Pool within Org
• % coverage under VOICES Action Plan
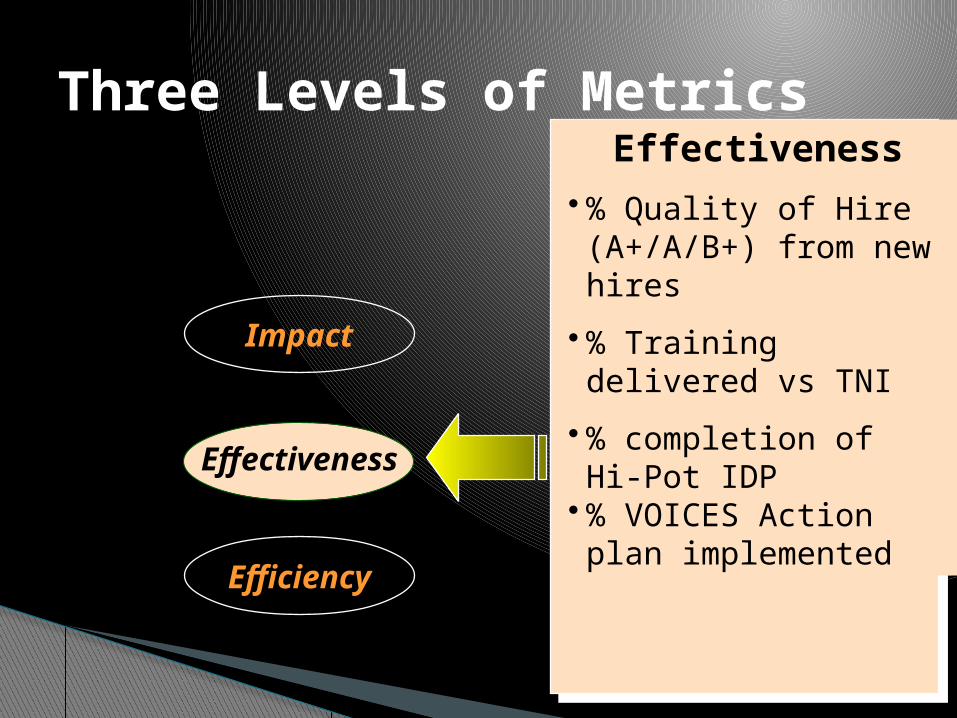
Three Levels of Metrics
Effectiveness
Efficiency
Impact
Effectiveness• % Quality of Hire (A+/A/B+) from new hires
• % Training delivered vs TNI
• % completion of Hi-Pot IDP
• % VOICES Action plan implemented
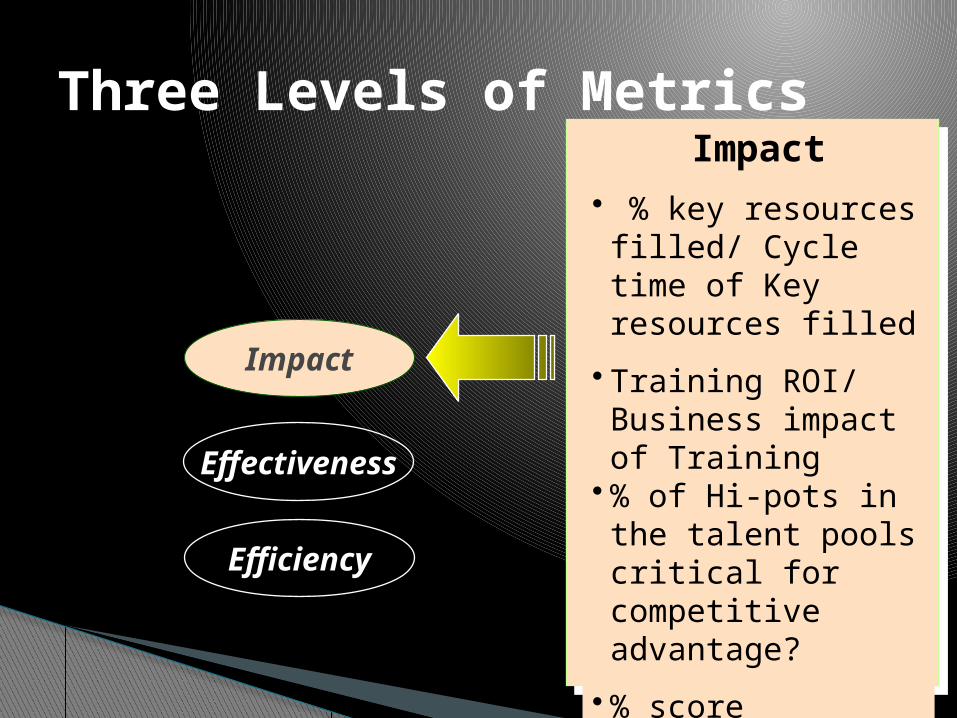
Three Levels of Metrics
Effectiveness
Efficiency
Impact• % key resources filled/ Cycle time of Key resources filled
• Training ROI/ Business impact of Training
• % of Hi-pots in the talent pools critical for competitive advantage?
• % score improvement/vs % implementation
Impact
The Culture Cultivator
Change Champion
The set of shared attitudes, values, goals and practices that characterizes an institution or organization.
the set of values, conventions or social practices associated with a particular field, activity or societal characteristic.
What is Culture???
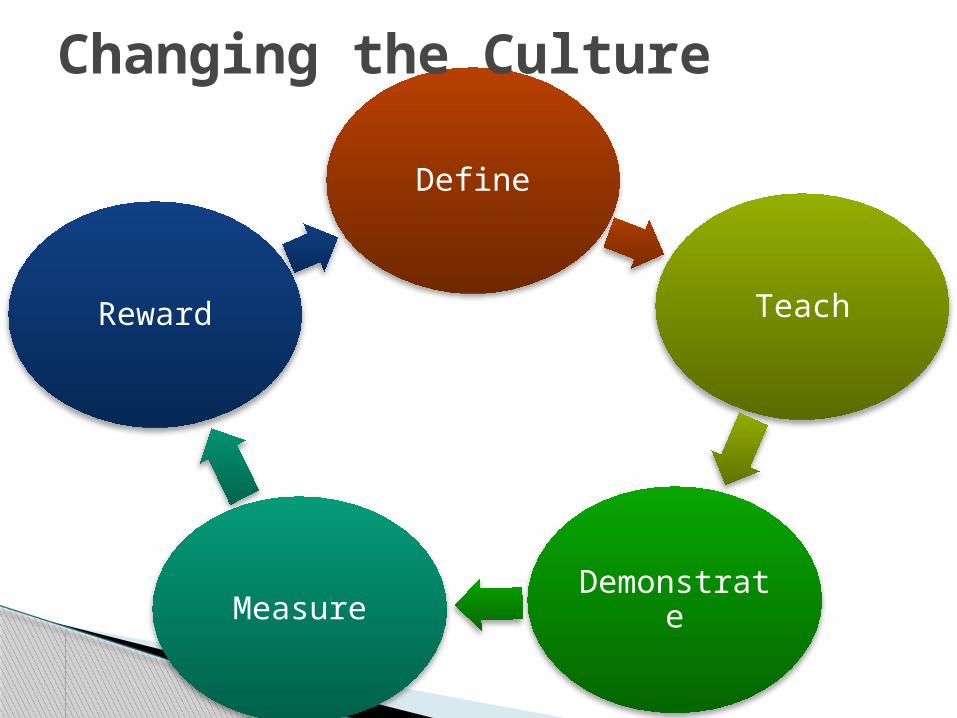
Define
Teach
DemonstrateMeasure
Reward
Changing the Culture
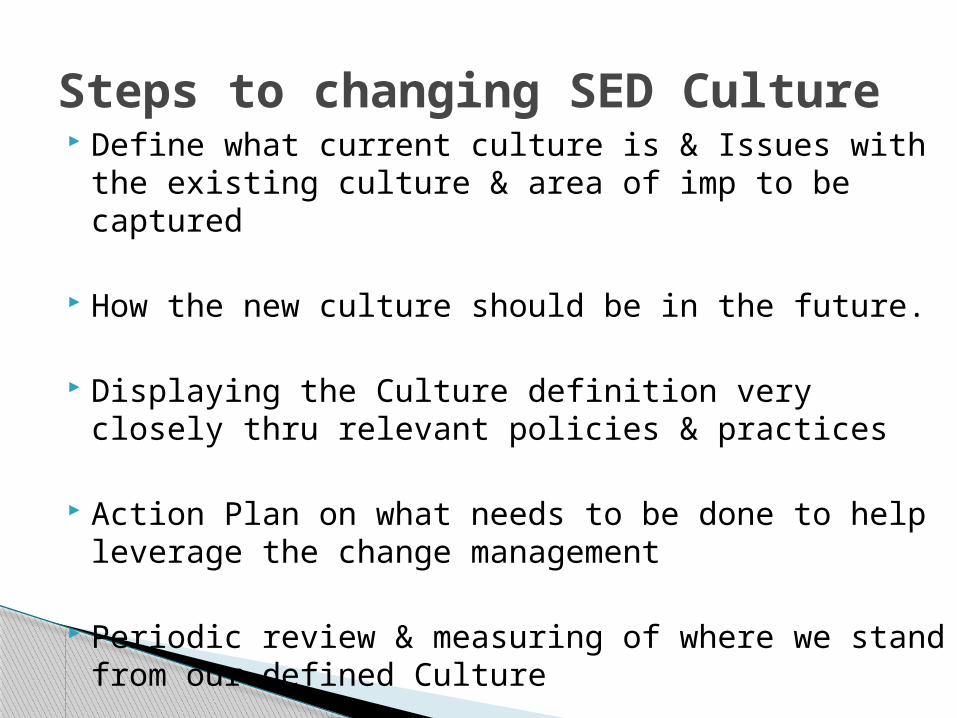
Define what current culture is & Issues with the existing culture & area of imp to be captured
How the new culture should be in the future.
Displaying the Culture definition very closely thru relevant policies & practices
Action Plan on what needs to be done to help leverage the change management
Periodic review & measuring of where we stand from our defined Culture
Steps to changing SED Culture
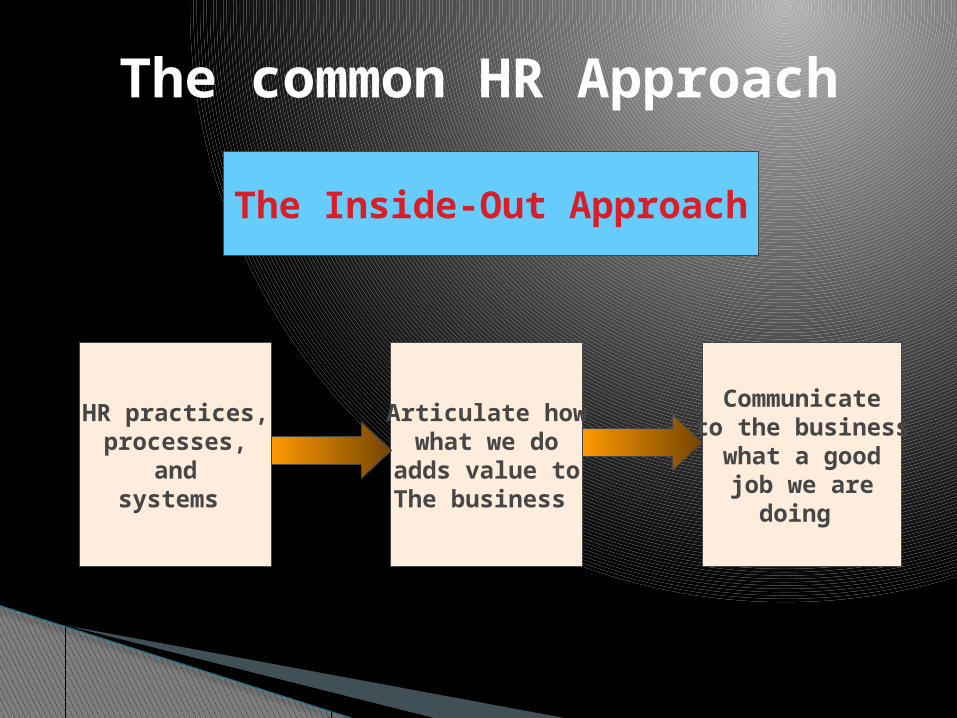
The common HR Approach
HR practices,processes,
andsystems
Articulate howwhat we do
adds value toThe business
Communicateto the business
what a goodjob we are
doing
The Inside-Out Approach
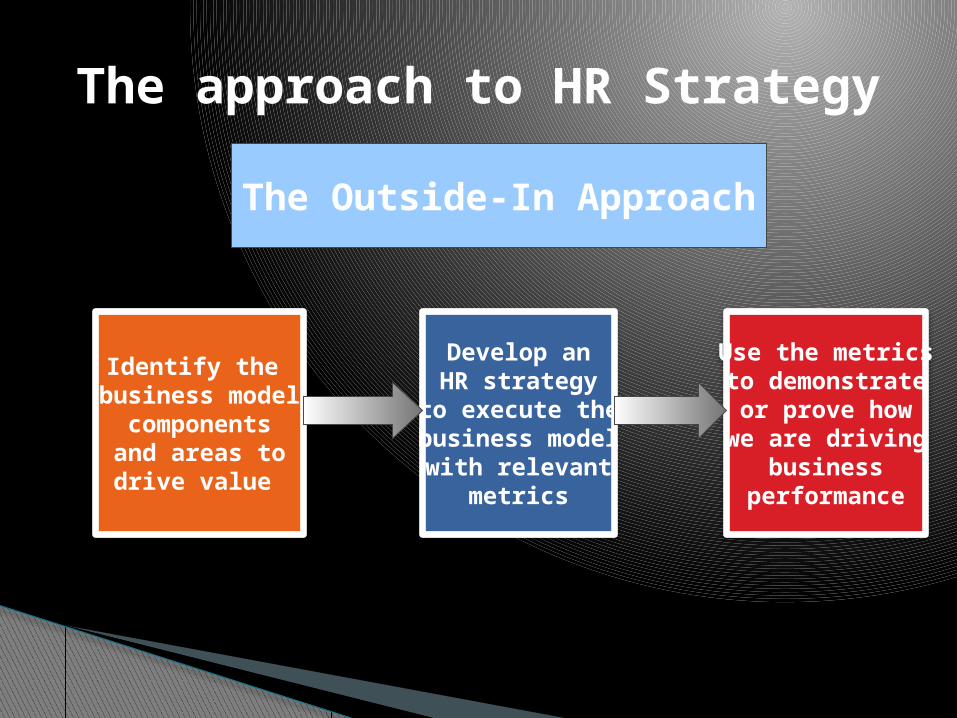
The approach to HR Strategy
Identify the business model
componentsand areas todrive value
Develop anHR strategy
to execute thebusiness modelwith relevant
metrics
Use the metricsto demonstrateor prove howwe are driving
businessperformance
The Outside-In Approach
Thank You………
Related Documents