Roundtable Part 2: Our panelists name their top investment ideas for 2021. PAGE 22 Picks From the Pros > 63142 VOL. CI NO. 4 JANUARY 25, 2021 $5.00 WHAT BIDEN MEANS FOR THE MARKETS • PAGES 6, 12 MSGS MSFT Madison Square Garden Sports Microsoft GAN NEP SBGI AGR Avangrid GAN NextEra Energy Partners Sinclair Broadcast Group WLKP VIV NOC GLD ASIX PM DHI MPACX D.R. Horton Matthews Asia Growth Westlake Chemical Partners Telefônica Brasil Northrop Grumman SPDR Gold Shares AdvanSix Philip Morris International SCOTT BLACK SONAL DESAI MARIO GABELLI RUPAL J. BHANSALI

Welcome message from author
This document is posted to help you gain knowledge. Please leave a comment to let me know what you think about it! Share it to your friends and learn new things together.
Transcript
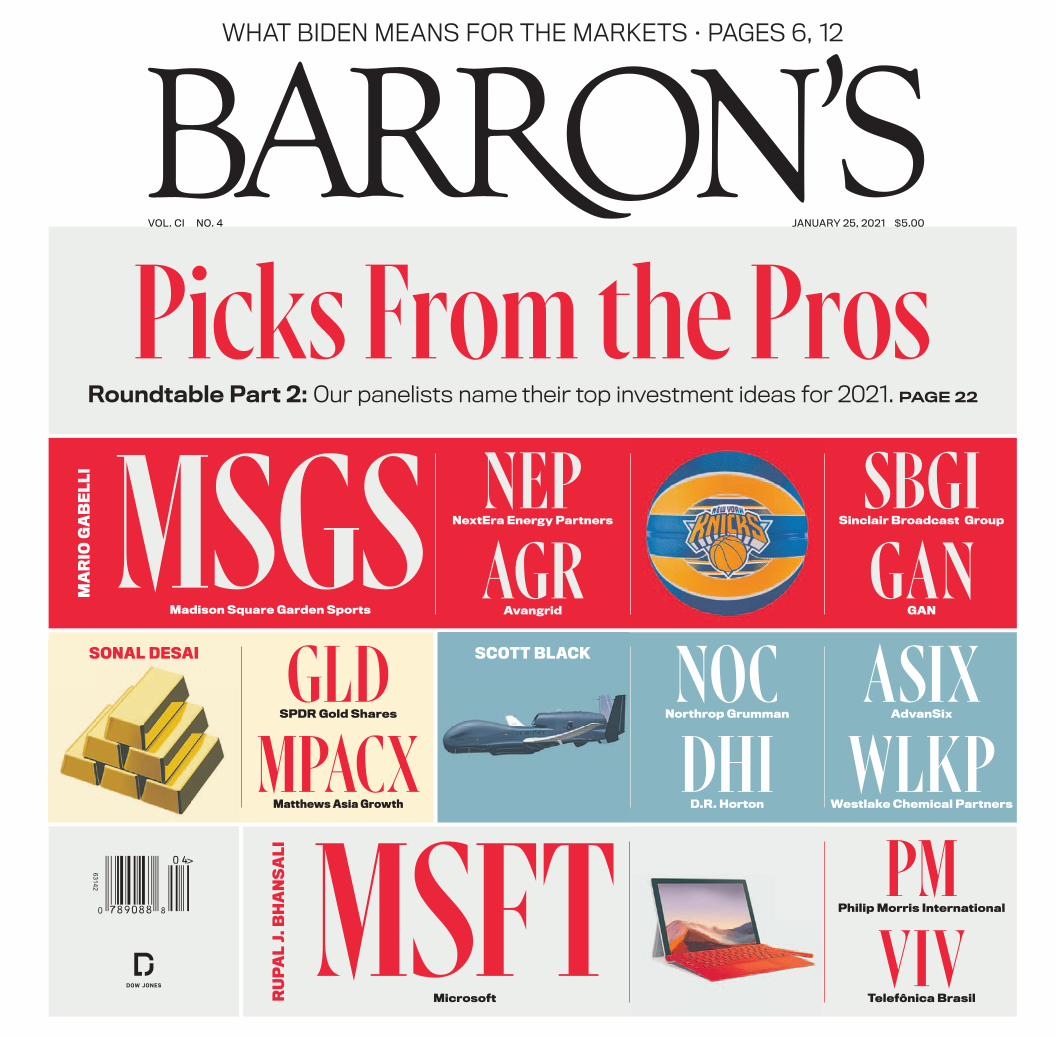
Roundtable Part 2: Our panelists name their top investment ideas for 2021. PAGE 22
Picks From the Pros
>
63142
VOL. CI NO. 4 JANUARY 25, 2021 $5.00
WHAT BIDEN MEANS FOR THE MARKETS • PAGES 6, 12
MSGS
MSFT
Madison Square Garden Sports
Microsoft
GANNEP SBGIAGRAvangrid GAN
NextEra Energy Partners Sinclair Broadcast Group
WLKP
VIV
NOCGLD ASIX
PMDHIMPACXD.R. HortonMatthewsAsia Growth Westlake Chemical Partners
Telefônica Brasil
Northrop GrummanSPDRGold Shares AdvanSix
PhilipMorris International
SCOTT BLACKSONAL DESAI
MARIOGABELLI
RUPALJ.BHANSALI
C O N T E N T S 0 1 . 2 5 . 2 1 VO L . C I NO . 4
Index P.4
Review&Preview P.10
Mailbag P.39
InsideScoop P.M7
ChartingtheMarket P.M9
Winners&Losers P.M10
ResearchReports P.M11
MarketView P.M12
Cover Illustrations byHelen Green
© 2021 Dow Jones & Company, Inc. All Rights Reserved.
Our newspapers are 100% sourced from sustainable certified mills.
BARRON’S (USPS 044-700) (ISSN 1077-8039) Published everyMonday. Editorial and Publication Headquarters: 1211 Avenue ofthe Americas, New York, N.Y. 10036. Periodicals postage paid atChicopee, MA and other mailing offices. Postmaster: Send addresschanges to Barron’s, 200 Burnett Rd., Chicopee, MA 01020
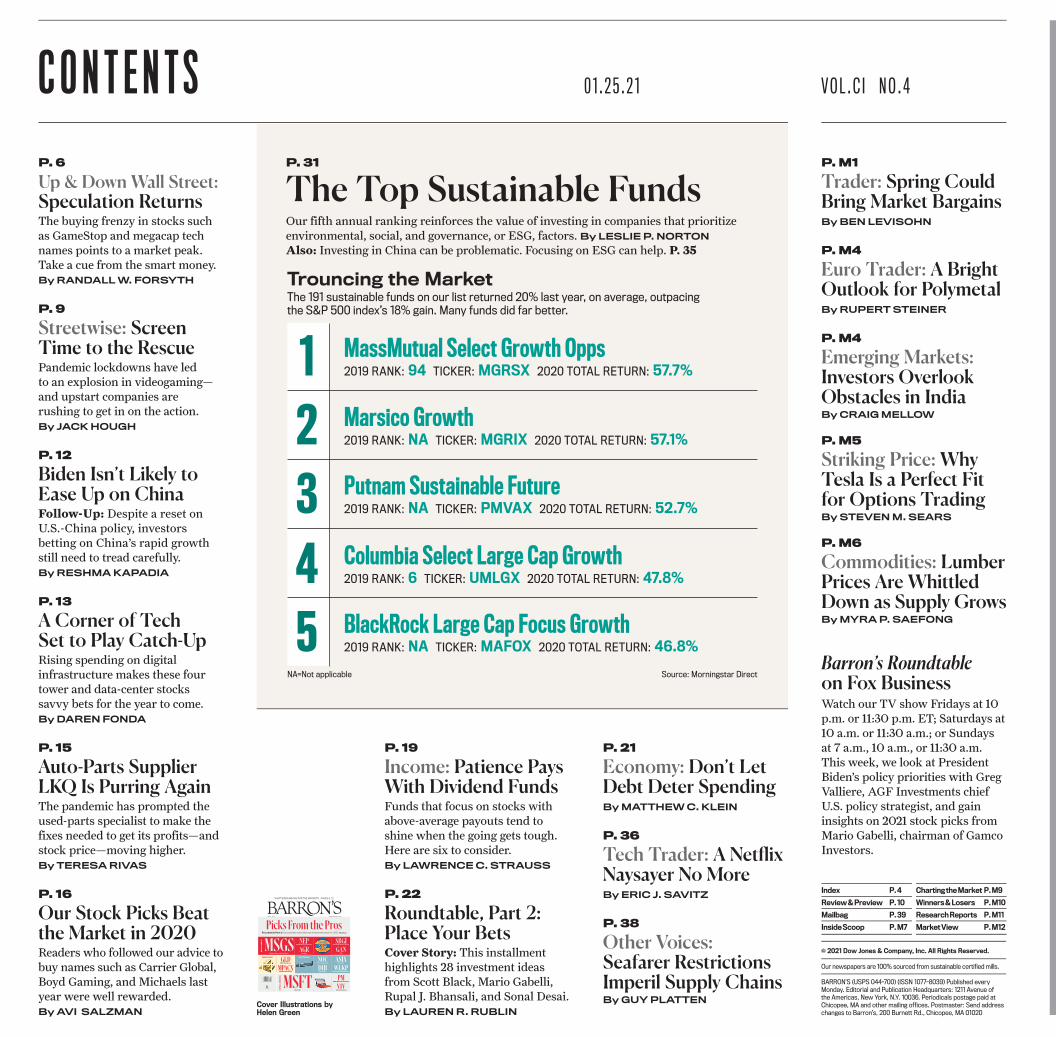
MassMutual Select Growth Opps2019 RANK: 94 TICKER: MGRSX 2020 TOTAL RETURN: 57.7%
Marsico Growth2019 RANK: NA TICKER: MGRIX 2020 TOTAL RETURN: 57.1%
Putnam Sustainable Future2019 RANK: NA TICKER: PMVAX 2020 TOTAL RETURN: 52.7%
Columbia Select Large Cap Growth2019 RANK: 6 TICKER: UMLGX 2020 TOTAL RETURN: 47.8%
BlackRock Large Cap Focus Growth2019 RANK: NA TICKER: MAFOX 2020 TOTAL RETURN: 46.8%
The 191 sustainable funds on our list returned 20% last year, on average, outpacingthe S&P 500 index’s 18% gain. Many funds did far better.
Trouncing the Market
Source: Morningstar DirectNA=Not applicable
2345
1
P.31
The Top Sustainable FundsOur fifth annual ranking reinforces the value of investing in companies that prioritizeenvironmental, social, and governance, or ESG, factors. ByLESLIEP.NORTON
Also: Investing in China can be problematic. Focusing on ESG can help. P. 35
P.6
Up & Down Wall Street:Speculation ReturnsThe buying frenzy in stocks suchas GameStop and megacap technames points to a market peak.Take a cue from the smart money.ByRANDALLW.FORSYTH
P.9
Streetwise: ScreenTime to the RescuePandemic lockdowns have ledto an explosion in videogaming—and upstart companies arerushing to get in on the action.ByJACKHOUGH
P. 12
Biden Isn’t Likely toEase Up on ChinaFollow-Up: Despite a reset onU.S.-China policy, investorsbetting on China’s rapid growthstill need to tread carefully.ByRESHMAKAPADIA
P. 13
A Corner of TechSet to Play Catch-UpRising spending on digitalinfrastructure makes these fourtower and data-center stockssavvy bets for the year to come.ByDARENFONDA
P. 15
Auto-Parts SupplierLKQ Is Purring AgainThe pandemic has prompted theused-parts specialist to make thefixes needed to get its profits—andstock price—moving higher.ByTERESARIVAS
P. 16
Our Stock Picks Beatthe Market in 2020Readers who followed our advice tobuy names such as Carrier Global,Boyd Gaming, and Michaels lastyear were well rewarded.ByAVI SALZMAN
P. 19
Income: Patience PaysWith Dividend FundsFunds that focus on stocks withabove-average payouts tend toshine when the going gets tough.Here are six to consider.ByLAWRENCEC.STRAUSS
P.22
Roundtable, Part 2:Place Your BetsCover Story: This installmenthighlights 28 investment ideasfrom Scott Black, Mario Gabelli,Rupal J. Bhansali, and Sonal Desai.ByLAURENR.RUBLIN
P.21
Economy: Don’t LetDebt Deter SpendingByMATTHEWC.KLEIN
P.36
Tech Trader: A NetflixNaysayer No MoreByERIC J.SAVITZ
P.38
Other Voices:Seafarer RestrictionsImperil Supply ChainsByGUYPLATTEN
P.M1
Trader: Spring CouldBring Market BargainsByBENLEVISOHN
P.M4
Euro Trader: A BrightOutlook for PolymetalByRUPERTSTEINER
P.M4
Emerging Markets:Investors OverlookObstacles in IndiaByCRAIGMELLOW
P.M5
Striking Price: WhyTesla Is a Perfect Fitfor Options TradingBySTEVENM.SEARS
P.M6
Commodities: LumberPrices Are WhittledDown as Supply GrowsByMYRAP.SAEFONG
Barron’s Roundtableon Fox BusinessWatch our TV show Fridays at 10p.m. or 11:30 p.m. ET; Saturdays at10 a.m. or 11:30 a.m.; or Sundaysat 7 a.m., 10 a.m., or 11:30 a.m.This week, we look at PresidentBiden’s policy priorities with GregValliere, AGF Investments chiefU.S. policy strategist, and gaininsights on 2021 stock picks fromMario Gabelli, chairman of GamcoInvestors.
Roundtable Part 2: Our panelists name their top investment ideas for 2021. PAGE 22
Picks From the Pros
>
63142
VOL. CI NO. 4 JANUARY 25, 2021 $5.00
WHAT BIDEN MEANS FOR THE MARKETS • PAGES 6, 12
MSGS
MSFT
Madison Square Garden Sports
Microsoft
GANNEP SBGIAGRAvangrid GAN
NextEra Energy Partners Sinclair Broadcast Group
WLKP
VIV
NOCGLD ASIX
PMDHIMPACXD.R. HortonMatthewsAsia Growth Westlake Chemical Partners
Telefônica Brasil
NorthropGrummanSPDRGold Shares AdvanSix
Philip Morris International
SCOTT BLACKSONAL DESAI
MARIOGABELLI
RUPALJ.BHANSALI
January 25, 2021 BARRON’S 3
The Refinitiv Lipper Fund Awards are based on the Lipper Leader for Consistent Return rating, which is a risk-adjusted performance measure calculated over 36, 60 and 120 months. Lipper Leaders fund ratings do not constitute and are not intended to constitute investment advice or an offer to sell or thesolicitation of an offer to buy any security of any entity in any jurisdiction. For more information, see lipperfundawards.com. Lipper Fund Awards from Refinitiv, ©2021 Refinitiv. All rights reserved. Used under license. The award is based on a review of risk-adjusted performance of 33 companies for 2020.The award pertains only to the Nuveen funds in the fixed-income category. Certain funds have fee waivers in effect. Without such waivers ratings could be lower.Past performance does not guarantee future results. This material is not intended to be a recommendation or investment advice, does not constitute a solicitation to buy, sell or hold a security or an investment strategy, and is not provided in a fiduciary capacity. The information provided doesnot take into account the specific objectives or circumstances of any particular investor, or suggest any specific course of action. Investment decisions should be made based on an investor’s objectives and circumstances and in consultation with his or her advisors.
Before investing, carefully consider fund investment objectives, risks, charges and expenses. For this and other information that should be read carefully,please request a prospectus or summary prospectus from your financial professional or Nuveen at 800.752.8700 or visit nuveen.com.Nuveen Securities, LLC, member FINRA and SIPC. 20854 GAD-1134692CR-W0420X
Income strategies asdeep as our heritage
• Over 120 years as an income provider
• Expertise across municipal bonds,taxable fixed income and real assets
• Awarded 2020 Best Fixed IncomeLarge Fund Company
nuveen.com/income
4 BARRON’S January 25, 2021
A Abbott Laboratories . . . . . . . . . . . . . . . . . . . . . . . 11Activision Blizzard . . . . . . . . . . . . . . . . . . . . . . . . . . 9Advance Auto Parts . . . . . . . . . . . . . . . . . . . . . . . . 15Advanced Micro Devices . . . . . . . . . . . . . . . . . . . 11AdvanSix . . . . . . . . . . . . . . . . . . . . . . . . . . . . . . . . . . 26Alcoa . . . . . . . . . . . . . . . . . . . . . . . . . . . . . . . . . . . . . M9Alibaba Group Holding . . . . . . . . . . . . . . . . . . . M9Altria Group . . . . . . . . . . . . . . . . . . . . . . . . . . . . 11,25Amazon.com . . . . . . . . . . . . . . . . . . . . . . . . . . . . . . . 16AMC Entertainment . . . . . . . . . . . . . . . . . . . . . . M9American Airlines Group . . . . . . . . . . . . . . . . . . . 11American Express . . . . . . . . . . . . . . . . . . . . . . . . . 11American Tower . . . . . . . . . . . . . . . . . . . . . . . . . . . 13Anthem . . . . . . . . . . . . . . . . . . . . . . . . . . . . . . . . . . . . 11A.P. Moeller-Maersk . . . . . . . . . . . . . . . . . . . . . . . 11Apple . . . . . . . . . . . . . . . . . . . . . . . . . . . . . . . . 11,19,28AT&T . . . . . . . . . . . . . . . . . . . . . . . . . . . . . . . . . . . . . 11AutoZone . . . . . . . . . . . . . . . . . . . . . . . . . . . . . . . . . . 15Avangrid . . . . . . . . . . . . . . . . . . . . . . . . . . . . . . . . . . 29
B Bally's . . . . . . . . . . . . . . . . . . . . . . . . . . . . . . . . . . . . . 30Bank of America . . . . . . . . . . . . . . . . . . . . . . . . . . . 19Bayerische Motoren Werke . . . . . . . . . . . . . . . . 28Best Buy . . . . . . . . . . . . . . . . . . . . . . . . . . . . . . . . . . 19Bicycle Therapeutics . . . . . . . . . . . . . . . . . . . . . .M7BioNTech . . . . . . . . . . . . . . . . . . . . . . . . . . . . . . . . . . 16Boeing . . . . . . . . . . . . . . . . . . . . . . . . . . . . . . . . . . . . . 11Boyd Gaming . . . . . . . . . . . . . . . . . . . . . . . . . . . . . . 16
C Capital One Financial . . . . . . . . . . . . . . . . . . . . . . 11Carnival . . . . . . . . . . . . . . . . . . . . . . . . . . . . . . . . . . M7Carrier Global . . . . . . . . . . . . . . . . . . . . . . . . . . . . . 16Carvana . . . . . . . . . . . . . . . . . . . . . . . . . . . . . . . . . . . 16Caterpillar . . . . . . . . . . . . . . . . . . . . . . . . . . . . . . . . . 11Charter Communications . . . . . . . . . . . . . . . . 11,13Chevron . . . . . . . . . . . . . . . . . . . . . . . . . . . . . . . . . . . 11China Construction Bank . . . . . . . . . . . . . . . . . . 35China Mobile . . . . . . . . . . . . . . . . . . . . . . . . . . . .12,26Clearwater Paper . . . . . . . . . . . . . . . . . . . . . . . . M11Coherent . . . . . . . . . . . . . . . . . . . . . . . . . . . . . . . . . . 10Colgate-Palmolive . . . . . . . . . . . . . . . . . . . . . . . . . . 11Comcast . . . . . . . . . . . . . . . . . . . . . . . . . . . . . . . . .11,13Copart . . . . . . . . . . . . . . . . . . . . . . . . . . . . . . . . . . . . . 15CoreSite Realty . . . . . . . . . . . . . . . . . . . . . . . . . . . . 13Cosco Shipping Holdings . . . . . . . . . . . . . . . . . . . 11Crown Castle International . . . . . . . . . . . . . . 11,13
D Danaher . . . . . . . . . . . . . . . . . . . . . . . . . . . . . . . . . . . 11DermTech . . . . . . . . . . . . . . . . . . . . . . . . . . . . . . . . M7Deutsche Telekom . . . . . . . . . . . . . . . . . . . . . . . . . 29DISH Network . . . . . . . . . . . . . . . . . . . . . . . . . . . . 13Dow . . . . . . . . . . . . . . . . . . . . . . . . . . . . . . . . . . . . . . . 11D.R. Horton . . . . . . . . . . . . . . . . . . . . . . . . . . . . . . . 27
E Electronic Arts . . . . . . . . . . . . . . . . . . . . . . . . . . . . . 9Eli Lilly . . . . . . . . . . . . . . . . . . . . . . . . . . . . . . . . . . . 11Entain . . . . . . . . . . . . . . . . . . . . . . . . . . . . . . . . 30,M11Enzo Biochem . . . . . . . . . . . . . . . . . . . . . . . . . . . . M7Equinix . . . . . . . . . . . . . . . . . . . . . . . . . . . . . . . . . . . . 13
F Facebook . . . . . . . . . . . . . . . . . . . . . . . . . . . . . . . . . . 11Fastenal . . . . . . . . . . . . . . . . . . . . . . . . . . . . . . . . . . . 15FirstCash . . . . . . . . . . . . . . . . . . . . . . . . . . . . . . . . . . 16Flutter Entertainment . . . . . . . . . . . . . . . . . . . . . 29Ford Motor. . . . . . . . . . . . . . . . . . . . . . . . . .10,28,M2Formula One Group . . . . . . . . . . . . . . . . . . . . . . . . 29Fox . . . . . . . . . . . . . . . . . . . . . . . . . . . . . . . . . . . . . . . . 29
G GAN . . . . . . . . . . . . . . . . . . . . . . . . . . . . . . . . . . . . . . 30GCP Applied Technologies . . . . . . . . . . . . . . . . . 29General Electric . . . . . . . . . . . . . . . . . . . . . . . . . . . 11General Motors . . . . . . . . . . . . . . . . . . . . . . . . . 10,28Genuine Parts . . . . . . . . . . . . . . . . . . . . . . . . . . . 15,29Gevo . . . . . . . . . . . . . . . . . . . . . . . . . . . . . . . . . . . . . .M9
Gritstone Oncology . . . . . . . . . . . . . . . . . . . . . . . M9
H Home Depot . . . . . . . . . . . . . . . . . . . . . . . . . . . . . . . 19Honeywell International . . . . . . . . . . . . . . . . . 11,26Hyster-Yale Materials Handling . . . . . . . . . . . . 24Hyundai Motor . . . . . . . . . . . . . . . . . . . . . . . . . . . . 28
I IAC/InterActiveCorp. . . . . . . . . . . . . . . . . . . . . . . 30Iberdrola . . . . . . . . . . . . . . . . . . . . . . . . . . . . . . . . . . 29IBM . . . . . . . . . . . . . . . . . . . . . . . . . . . . . . . . . . . 10,M9Inditex . . . . . . . . . . . . . . . . . . . . . . . . . . . . . . . . . . . . 35Intel . . . . . . . . . . . . . . . . . . . . . . . . . . . . . . . . . . . 10,M9Invesco . . . . . . . . . . . . . . . . . . . . . . . . . . . . . . . . . . . . 11
J Johnson & Johnson . . . . . . . . . . . . . . . . . . . . . . . . 11
K Kandi Technologies Group . . . . . . . . . . . . . . . . . 16Kimball Electronics . . . . . . . . . . . . . . . . . . . . . . . . 27Kimberly-Clark . . . . . . . . . . . . . . . . . . . . . . . . . . . . 11Koninklijke Philips . . . . . . . . . . . . . . . . . . . . . . 11,27
L Lam Research . . . . . . . . . . . . . . . . . . . . . . . . . . . . . 11Liberty Braves . . . . . . . . . . . . . . . . . . . . . . . . . . . . 29LKQ. . . . . . . . . . . . . . . . . . . . . . . . . . . . . . . . . . . . . . . 15Lockheed Martin . . . . . . . . . . . . . . . . . . . . . . . . . . 11Lumentum Holdings . . . . . . . . . . . . . . . . . . . 10,M9
MMadison Square Garden Sports . . . . . . . . . . . . 29Magna International . . . . . . . . . . . . . . . . . . . . . . . 28Mastercard . . . . . . . . . . . . . . . . . . . . . . . . . . . . . . . . 11
McDonald's . . . . . . . . . . . . . . . . . . . . . . . . . . . . . . . . 11Meituan . . . . . . . . . . . . . . . . . . . . . . . . . . . . . . . . . . . 35MGM Resorts International . . . . . . . . . . . 30,M11Microsoft . . . . . . . . . . . . . . . . . . . . . . . . . . . . 11,24,M1Mondelez International . . . . . . . . . . . . . . . . . . . . 11MSCI . . . . . . . . . . . . . . . . . . . . . . . . . . . . . . . . . . . . . . 11Muenchener Rueckversicherungs-Gesellschaft24
N Netflix . . . . . . . . . . . . . . . . . . . . . . . . . . . . 10,26,36,M1News Corp . . . . . . . . . . . . . . . . . . . . . . . . . . . . . . . . 29Nexteer Automotive Group. . . . . . . . . . . . . . . . .27NextEra Energy. . . . . . . . . . . . . . . . . . . . . . . . . . . 29NextEra Energy Partners . . . . . . . . . . . . . . . . . 29Nikola . . . . . . . . . . . . . . . . . . . . . . . . . . . . . . . . . . . . . 16Nintendo . . . . . . . . . . . . . . . . . . . . . . . . . . . . . . . . . . 26Norfolk Southern . . . . . . . . . . . . . . . . . . . . . . . . . . 11Northrop Grumman . . . . . . . . . . . . . . . . . . . . . 11,24
O O'Reilly Automotive . . . . . . . . . . . . . . . . . . . . . . . . 15Otis Worldwide . . . . . . . . . . . . . . . . . . . . . . . . . . . . 16
P PayPal Holdings . . . . . . . . . . . . . . . . . . . . . . . . . . . 34PDC Energy . . . . . . . . . . . . . . . . . . . . . . . . . . . . M11Pfizer . . . . . . . . . . . . . . . . . . . . . . . . . . . . . . . . . . . .M11Philip Morris International . . . . . . . . . . . . . . . . 25Playtika Holding . . . . . . . . . . . . . . . . . . . . . . . . . . . . 9Plug Power . . . . . . . . . . . . . . . . . . . . . . . . . . . . . . . . 29PNM Resources . . . . . . . . . . . . . . . . . . . . . . . . . . . 29Prologis . . . . . . . . . . . . . . . . . . . . . . . . . . . . . . . . . . . 11
R Raytheon Technologies . . . . . . . . . . . . . . . . . . . . . 11RH . . . . . . . . . . . . . . . . . . . . . . . . . . . . . . . . . . . . . . M11Riot Blockchain . . . . . . . . . . . . . . . . . . . . . . . . . . .M9
S Salesforce.com . . . . . . . . . . . . . . . . . . . . . . . . . . . . . 26SBA Communications . . . . . . . . . . . . . . . . . . . . . . 13ServiceNow . . . . . . . . . . . . . . . . . . . . . . . . . . . . . . . . 11Signature Bank . . . . . . . . . . . . . . . . . . . . . . . . . . M11Sinclair Broadcast Group . . . . . . . . . . . . . . . . . . 29Snam . . . . . . . . . . . . . . . . . . . . . . . . . . . . . . . . . . . . . . 24SoftBank Group . . . . . . . . . . . . . . . . . . . . . . . . . . . 29Sony . . . . . . . . . . . . . . . . . . . . . . . . . . . . . . . . . . . . . . . 26Southwest Airlines . . . . . . . . . . . . . . . . . . . . . . . . . 11SPDR Gold Shares . . . . . . . . . . . . . . . . . . . . . . . . 30Square. . . . . . . . . . . . . . . . . . . . . . . . . . . . . . . . . . . . .34Starbucks . . . . . . . . . . . . . . . . . . . . . . . . . . . . . . . . . . 11Stellantis . . . . . . . . . . . . . . . . . . . . . . . . . . . . . . . . . . 10Stryker . . . . . . . . . . . . . . . . . . . . . . . . . . . . . . . . . . . . 11SunPower. . . . . . . . . . . . . . . . . . . . . . . . . . . . . . . . .M9
T Take-Two Interactive Software . . . . . . . . . . . . . 9Telecom Italia . . . . . . . . . . . . . . . . . . . . . . . . . . . . . 25Telefonica Brasil . . . . . . . . . . . . . . . . . . . . . . . . . . . 25Tencent Holdings . . . . . . . . . . . . . . . . . . . . . . . . . . 35Tenneco . . . . . . . . . . . . . . . . . . . . . . . . . . . . . . . . . . M7Tesla . . . . . . . . . . . . . . . . . . . . . . . 10,11,16,24,M3,M5Texas Instruments . . . . . . . . . . . . . . . . . . . . . . . . . 113M. . . . . . . . . . . . . . . . . . . . . . . . . . . . . . . . . . . . . . . . .11T-Mobile US . . . . . . . . . . . . . . . . . . . . . . . . . . . . 13,25Toyota Motor . . . . . . . . . . . . . . . . . . . . . . . . . . . . . M3Triton International . . . . . . . . . . . . . . . . . . . . . . . . 11T. Rowe Price Group . . . . . . . . . . . . . . . . . . . . . . . 11Twitter . . . . . . . . . . . . . . . . . . . . . . . . . . . . . . . . . . . . 16
V Verizon Communications . . . . . . . . . . . . . . . . . . . 11Viatris . . . . . . . . . . . . . . . . . . . . . . . . . . . . . . . . . . . M11Visa . . . . . . . . . . . . . . . . . . . . . . . . . . . . . . . . . . . . . . . 11
WWestlake Chemical Partners . . . . . . . . . . . . . . . 27Westwater Resources . . . . . . . . . . . . . . . . . . . . . M9
I N D E X Our index lists significant companies mentioned in stories and columns,plus Research Reports, and Corrections & Amplifications. The referencesare to the first page of the item in which the company is mentioned.
For Customer Service, call 1 (800) 544-0422, or go tocustomercenter.barrons.com. For reprints of articles,call 1 (800) 843-0008, or go to djreprints.com.
EXECUTIVEEDITOR BobRose SENIORMANAGINGEDITOR LaurenR.Rublin
DEPUTYEDITOR AlexEule DEPUTYEDITOR BenLevisohnEDITORIALDIRECTOR, INVESTING&ASSETMANAGEMENT BeverlyGoodman
EDITORIALDIRECTOR,MAGAZINE Phil Roosevelt
MANAGINGEDITOR,DIGITAL Matt Bemer MANAGINGEDITOR, FEATURES JeffreyCaneMANAGINGEDITOR, ENTERPRISEBrianHershberg
ASSISTANTMANAGINGEDITORS MaryRomano, Robert Sabat
ASSOCIATEEDITORS AndrewBary, RandallW. Forsyth, JackHough,ReshmaKapadia, Eric J. Savitz
SENIORWRITERS BillAlpert,DarenFonda,MatthewC.Klein, Leslie P.Norton,AlRoot, Avi Salzman,Alexandra Scaggs, LawrenceC. Strauss
REPORTERS LisaBeilfuss,MaxA.Cherney,CarletonEnglish,Nicholas Jasinski, Evie Liu,JoshNathan-Kazis, TeresaRivas, Connor Smith, Jacob Sonenshine, BenWalsh
STORYEDITORS HenryCutter, EdLin, ErinMcCarthy
COPYDESK Michael J. Burlingham,RichardRescigno, Robert Teitelman
IDEASEDITOR Matt Peterson
DEPUTYDIGITALMANAGINGEDITOR Zoe Szathmary
SENIORAUDIOMANAGER Mette Lützhøft DIGITALPRODUCERS Robert Cushing, ClareMcKeen
DESIGNDIRECTOR ChrisMihal ARTDIRECTORS Robert Connolly, NickHallam, SueNgDIRECTOROFPHOTOGRAPHY Sarina Finkelstein PHOTOEDITORS SamKelly, Nicole Silver
RESEARCHDIRECTOR PaulineYuelys RESEARCHER DanLam
STATISTICSMANAGER Michael T. Kokoszka STATISTICIAN DarrenChima
MANAGER,ADVERTISINGSERVICES JamesH. Balmer ASSOCIATEMANAGER WardS.McGuinessNEWS [email protected] STATISTICS [email protected] CUSTOMERSERVICE 800-544-0422
GLOBALHEAD,WEALTH&ASSETMANAGEMENT JackOtter
Barron’s is a trademark of Dow Jones and its affiliates. Barron’s (USPS 044-700) (ISSN 1077-8039) Published every Monday. Editorial and PublicationHeadquarters: 1211 Avenue of the Americas, New York, N.Y. 10036. Periodicals postage paid at Chicopee, MA and other mailing offices. RegularU.S. subscription rate: one year, $223. Entire editorial content of this publication copyrighted by Dow Jones & Co., Inc. and must not be reproducedin whole or in part without special permission. Unsolicited manuscripts should be accompanied by self-addressed envelope with proper postage. Alladvertising published in Barron’s is subject to the applicable rate card, copies of which are available from the Advertising Director, 1211 Avenue of the
Americas, New York, N.Y. 10036. Barron’s reserves the right not to accept an advertiser’s order. Only publication of an advertisement shall constitute acceptanceof the advertiser's order. Postmaster: Send address changes to Barron’s, 200 Burnett Rd., Chicopee, MA 01020.
RupertMurdochExecutive Chairman,News CorpRobert ThomsonCEO,News Corp Almar LatourCEO,Dow Jones
SENIORVICEPRESIDENT, BARRON’SGROUPMaeM.ChengASSOCIATEPUBLISHER, BARRON’SGROUPDanShar
MANAGINGEDITORS, BARRON’SGROUP DuncanMavin, Dave PettitHEADOF INTERNATIONAL, BARRON’SGROUP FrancescoGuerrera
w00
4_p2
bw02
5000
_0_w
0040
0_1_
____
___x
a202
1_01
123
-Jan
-21
04:3
4:49
January 25, 2021 BARRON’S 5
“New York Life Investments” is both a service mark, and the common trade name, of certain investment advisors affiliated with New York Life Insurance Company.
The products and services of New York Life Investments' boutiques are not available in all jurisdictions or regions where such provision would be contrary to
local laws or regulations. 1824398
We invest in our clients, identifying new ideas and opportunities.
Where there are risks, we do our best to manage them.
This is how we work with you and for you.
Strategies intended to deliver real outcomes and build long-term wealth.
We see investing as a mutual effort—one that works only if we all succeed.
We’re in it together to move forward together. That’s how it works.
That’s how it has worked for our parent, New York Life, for over 175 years.
And how it’ll continue to work. That’s our promise.
We believe in you and in us.
Relationships built for the long term but relevant for the times we live in today.
In the power of what we can do together.
More than capital alone. More than algorithms or optimistic forecasts.
Building equity in something far bigger than just a portfolio.
And that is what makes us different.
More than investing. Invested.
6 BARRON’S January 25, 2021
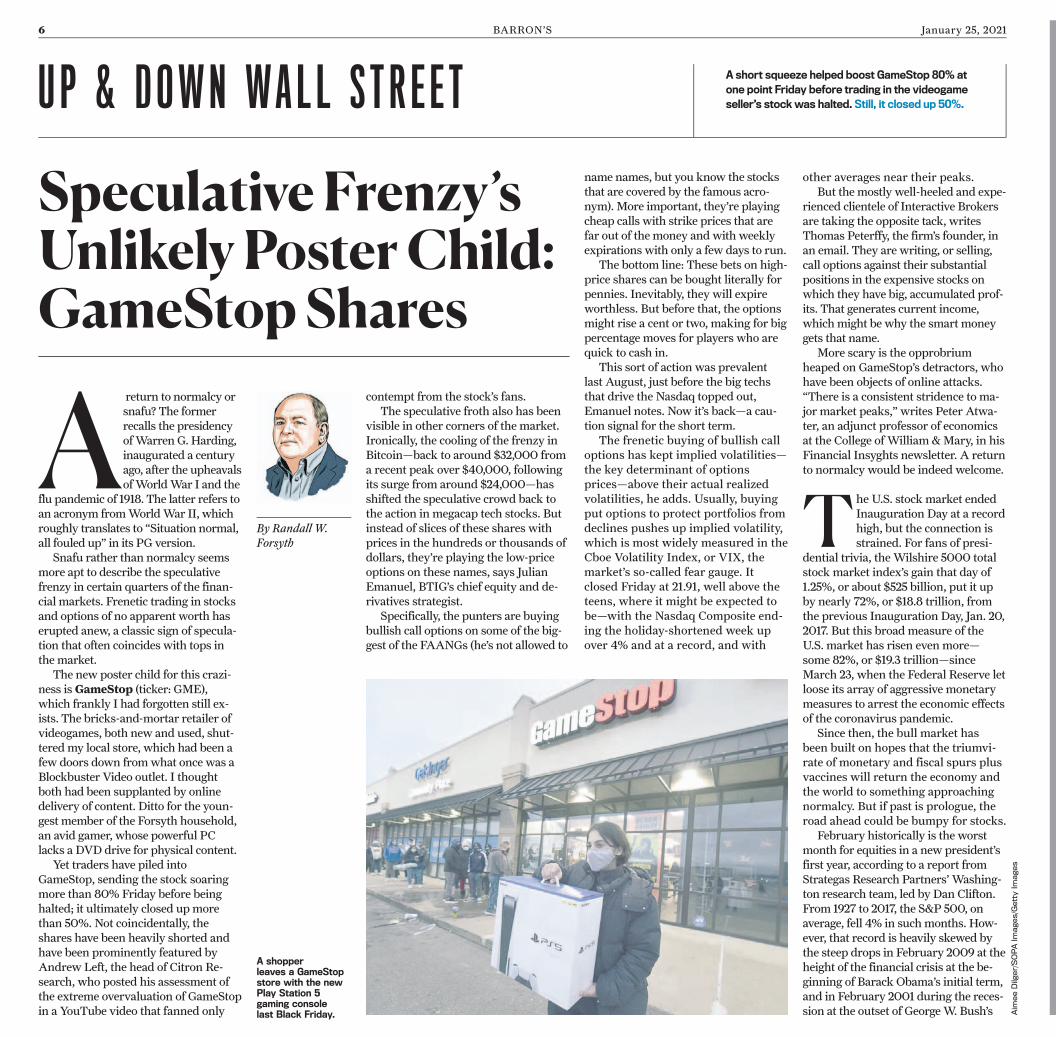
U P & D OWN WA L L S T R E E T A short squeeze helped boost GameStop 80% atone point Friday before trading in the videogameseller’s stockwas halted. Still, it closed up 50%.
Speculative Frenzy’sUnlikely Poster Child:GameStop Shares
A return to normalcy orsnafu? The formerrecalls the presidencyofWarren G. Harding,inaugurated a centuryago, after the upheavalsofWorldWar I and the
flu pandemic of 1918. The latter refers toan acronym fromWorldWar II, whichroughly translates to “Situation normal,all fouled up” in its PG version.
Snafu rather than normalcy seemsmore apt to describe the speculativefrenzy in certain quarters of the finan-cial markets. Frenetic trading in stocksand options of no apparent worth haserupted anew, a classic sign of specula-tion that often coincides with tops inthe market.
The new poster child for this crazi-ness isGameStop (ticker: GME),which frankly I had forgotten still ex-ists. The bricks-and-mortar retailer ofvideogames, both new and used, shut-teredmy local store, which had been afew doors down fromwhat once was aBlockbuster Video outlet. I thoughtboth had been supplanted by onlinedelivery of content. Ditto for the youn-gest member of the Forsyth household,an avid gamer, whose powerful PClacks a DVD drive for physical content.
Yet traders have piled intoGameStop, sending the stock soaringmore than 80% Friday before beinghalted; it ultimately closed upmorethan 50%. Not coincidentally, theshares have been heavily shorted andhave been prominently featured byAndrew Left, the head of Citron Re-search, who posted his assessment ofthe extreme overvaluation of GameStopin a YouTube video that fanned only
contempt from the stock’s fans.The speculative froth also has been
visible in other corners of the market.Ironically, the cooling of the frenzy inBitcoin—back to around $32,000 froma recent peak over $40,000, followingits surge from around $24,000—hasshifted the speculative crowd back tothe action in megacap tech stocks. Butinstead of slices of these shares withprices in the hundreds or thousands ofdollars, they’re playing the low-priceoptions on these names, says JulianEmanuel, BTIG’s chief equity and de-rivatives strategist.
Specifically, the punters are buyingbullish call options on some of the big-gest of the FAANGs (he’s not allowed to
name names, but you know the stocksthat are covered by the famous acro-nym). More important, they’re playingcheap calls with strike prices that arefar out of the money andwith weeklyexpirations with only a few days to run.
The bottom line: These bets on high-price shares can be bought literally forpennies. Inevitably, they will expireworthless. But before that, the optionsmight rise a cent or two, making for bigpercentage moves for players who arequick to cash in.
This sort of action was prevalentlast August, just before the big techsthat drive the Nasdaq topped out,Emanuel notes. Now it’s back—a cau-tion signal for the short term.
The frenetic buying of bullish calloptions has kept implied volatilities—the key determinant of optionsprices—above their actual realizedvolatilities, he adds. Usually, buyingput options to protect portfolios fromdeclines pushes up implied volatility,which is most widely measured in theCboe Volatility Index, or VIX, themarket’s so-called fear gauge. Itclosed Friday at 21.91, well above theteens, where it might be expected tobe—with the Nasdaq Composite end-ing the holiday-shortened week upover 4% and at a record, and with
By Randall W.Forsyth
A shopperleaves a GameStopstore with the newPlay Station 5gaming consolelast Black Friday.
other averages near their peaks.But the mostly well-heeled and expe-
rienced clientele of Interactive Brokersare taking the opposite tack, writesThomas Peterffy, the firm’s founder, inan email. They are writing, or selling,call options against their substantialpositions in the expensive stocks onwhich they have big, accumulated prof-its. That generates current income,whichmight be why the smart moneygets that name.
More scary is the opprobriumheaped on GameStop’s detractors, whohave been objects of online attacks.“There is a consistent stridence to ma-jor market peaks,” writes Peter Atwa-ter, an adjunct professor of economicsat the College ofWilliam &Mary, in hisFinancial Insyghts newsletter. A returnto normalcy would be indeed welcome.
T he U.S. stock market endedInauguration Day at a recordhigh, but the connection isstrained. For fans of presi-
dential trivia, theWilshire 5000 totalstock market index’s gain that day of1.25%, or about $525 billion, put it upby nearly 72%, or $18.8 trillion, fromthe previous Inauguration Day, Jan. 20,2017. But this broad measure of theU.S. market has risen even more—some 82%, or $19.3 trillion—sinceMarch 23, when the Federal Reserve letloose its array of aggressive monetarymeasures to arrest the economic effectsof the coronavirus pandemic.
Since then, the bull market hasbeen built on hopes that the triumvi-rate of monetary and fiscal spurs plusvaccines will return the economy andthe world to something approachingnormalcy. But if past is prologue, theroad ahead could be bumpy for stocks.
February historically is the worstmonth for equities in a new president’sfirst year, according to a report fromStrategas Research Partners’Washing-ton research team, led by Dan Clifton.From 1927 to 2017, the S&P 500, onaverage, fell 4% in suchmonths. How-ever, that record is heavily skewed bythe steep drops in February 2009 at theheight of the financial crisis at the be-ginning of Barack Obama’s initial term,and in February 2001 during the reces-sion at the outset of GeorgeW. Bush’s A
imeeDilg
er/SOPA
Images/G
ettyIm
ages
January 25, 2021 BARRON’S 7
first term, after the dot-com bubble burst.For now, much of the bullishness is a
product of fiscal actions, taken or antici-pated. The $900 billion measure enactedat the end of 2020 provides $600 checksfor most Americans, while a massive $1.9trillion plan proposed by President JoeBiden’s administration would add another$1,400, for a total of $2,000.
But the February just after a new presi-dent takes up residence in the WhiteHouse brings “governing into focus,” theStrategas team writes. That could meanthat the Biden program’s high expecta-tions get scaled back. Some critics contendthat $1.9 trillion is more than needed, es-pecially if the full effects of the stimulushit the economy in the second half, just asenough Americans are vaccinated to fi-nally release the pent-up demand forgoods and services built up over nearly 1½years of curtailed activity.
Jim Paulsen, chief investment strategist atthe Leuthold Group, further contends thatthe fiscal andmonetary thrusts already aresubstantially greater than in past timeswhen joblessness was at levels similar tonow. The 11.7%U6 “under-employment”rate (which includes part-timers whowant afull-time job, plus people marginally at-tached to the labor market) is in line withthose of the recoveries that followed the1982, 1990, and 2007-09 recessions. More-over, he adds, the latest rebound has beenfar quicker.
In addition, he continues, policy ismuch more stimulative this time. Thebroad M2 money supply was growing at a25.1% annual rate in December, four timesas fast as in September 2014, when U6 wasat the current level. The fiscal deficit, at15.2% of gross domestic product, was fourtimes greater than in November 1993. Andthe 10-year Treasury yield, at 0.90% inDecember, was one-seventh the level inDecember 1986.
All this adds up to “too much cowbell,”as in the classic Saturday Night Live sketch.Paulsen says that could produce muchhigher inflation, possibly forcing the Fedand fiscal authorities to tighten policies,rekindling recession. (For another view,see Matthew Klein’s Economy column,page 21.)
The Fed, however, has stated its willing-ness to let inflation rise considerably overits 2% target to make up for previous short-falls. The projections released at the De-cember Federal Open Market Committeemeeting show a consensus calling for thefederal-funds target rate to remain near thecurrent 0% to 0.25% through 2023. So pre-
mature tightening seems unlikely.A more proximate worry for stocks
should be that, after the anticipated fiscallargess of up to $1.9 trillion from the Bidenteam, tax increases are likely for infra-structure and clean-energy initiatives.
That won’t necessarily result in a fullrepeal of the Trump tax cuts, former FedChair Janet Yellen, Biden’s Treasury Secre-tary nominee, said at her confirmationhearing on Tuesday, notes Ian Katz of Cap-ital Alpha Partners in a client note. Oncethe pandemic is no longer depressing theeconomy, Yellen said, the administrationwould propose repealing parts of the taxact “that benefited the highest-incomeAmericans and large companies.”
The Strategas research team thinks thecurrent corporate tax rate of 21% could belifted to 28%, halfway back to the 35% thatprevailed prior to the Tax Cut and Jobs Actof 2017. (For S&P 500 companies, the ef-fective rate actually fell to 17.7% in 2018from 24.4% in 2017, the researchersfound.) But, they add, it doesn’t seem thata future corporate tax hike has been dis-counted by the market, based on the rela-tive price action of stocks of more highlytaxed companies.
Very high-income investors could alsoface increased levies on dividends and capi-tal gains, the Strategas team points out. Un-der the Biden plan, capital gains and divi-dends could be taxed at a total federal rate of43.4% for those earningmore than $1 mil-lion a year. The capital-gains rate hasn’tbeen over 30% since 1978. Cap-gains rateincreases also result in fewer investors cash-ing in realized gains, they add.
The Biden proposal also would lift theeffective tax rate on dividends to 60% from40% (after taking into account the doubletaxation of payouts at the corporate andpersonal levels). Since the 2003 tax cut,which effectively lowered the effective fed-eral rate to 45% from 60%, a 25-year de-cline in the total of companies paying divi-dends has reversed.
As for stock repurchases—a more tax-efficient way to return cash to sharehold-ers—Strategas points out that Biden hasbeen critical of these since he was a sena-tor. The administration might tighten ruleson buybacks, while requiring more disclo-sure and shareholder approval.
Whatever the politics of higher taxes onwell-heeled investors, the economics sug-gests they aren’t positive for stock prices, allelse being equal. WhatWashington givethin stimulus, it might taketh in taxes. B
email: [email protected]
Up & Down Wall Street Continued
Serving our clients for over 30 years
DUE DILIGENCEBackground investigations
LITIGATION SUPPORTInternal investigations
Forensic and cyber investigations
SECURITYAssessments and travel
For further information contact:[email protected]
212-308-8500
Upgradeyour advisor.Get advice on managing your wealthand connect with a top advisor at
barrons.com/directory
©2020 DowJones & Company. All Rights Reserved. 2E205
8 BARRON’S January 25, 2021
QQQINVESCONASDAQ NEXTGEN 100 ETF
QQQINVESCONASDAQ 100 ETF
IVNQXINVESCONASDAQ 100MUTUAL FUND
Three new ways to access the growth potential of the Nasdaq;three new ways to seek growth for your clients.
NOT A DEPOSIT NOT FDIC INSURED NOT GUARANTEED BY THE BANK MAY LOSE VALUE NOT INSURED BY ANY FEDERAL GOVERNMENT AGENCY
There are risks involved with investing in ETFs, including possible loss of money. ETFs are subject to risks similar to those of stocks. Investments focused in a particular sector, such as technology, are subject to greater risk, and are moregreatly impacted by market volatility, than more diversified investments. An investment cannot be made directly into any index.
BEFORE INVESTING,CONSIDERTHEFUND’SINVESTMENTOBJECTIVES,RISKS,CHARGESANDEXPENSES.VISITINVESCO.COM/FUNDPROSPECTUSFOR A PROSPECTUS CONTAINING THIS INFORMATION. READ IT CAREFULLY BEFORE INVESTING.Invesco Distributors, Inc. NA 9,595
Innovationloves company.Meet the three newmembers of theInvesco QQQ family.

January 25, 2021 BARRON’S 9
S T R E E TW I S E If there is a spoiler, it might be a comingwave ofinitial public offerings that could flood the marketwith videogame shares.
Roblox, Videogaming,And the Boom MarketIn Desperate Parents
M y bad parent-ing is aboutto get its ownstock listing.Ticker symbol:RBLX. Techni-cally, that’s for
a company called Roblox, but it’smore or less the same thing.
See, I used to be a solid B- as a dad,bribing my kids with M&Ms to doextra math drills and forcing theminto overmanaged sports leagues toburn off the calories. Then the pan-demic shut down in-person activitiesand turned my home into a daytimeturf war between the Zoom SchoolGang and the Department of HomeOffice Security. Evenings bring sweetrelief, my wife and I have discovered,so long as we allow our kids to raisethemselves as feral videogamers.Their favorite habitat is Roblox ontheir iPads.
Scold me if you must, but my familyisn’t alone. Roblox says its users in-clude two-thirds of U.S. children ages9 to 12. During the first nine monthsof 2020, the number of daily users rose82%, to 31 million. Hours played morethan doubled, to 22 billion.
That’s nothing compared withwhat happened to the company’svalue. Consider: The best-sellingvideogame property of all time is theGrand Theft Auto franchise, and itsowner, Take-Two Interactive Soft-ware (ticker: TTWO), has enjoyeda stock gain of more than 1,500%over the past decade, its recent valueat $23 billion. Roblox’s value, mean-while, has jumped to $30 billion from$4 billion over the past year, judging
by the terms of funding rounds ear-lier this month and last February.
Roblox was first launched for per-sonal computers in 2006, and is to-day played on Apple and Androidmobile devices, Xbox One gamingmachines, and Oculus Rift virtual-reality headsets. It’s not one game butrather millions of them—a “humanco-experience platform,” as the com-pany puts it. The games are made bysome seven million player-develop-ers, of whom nearly a million makemoney for their efforts. Graphics areblocky and cartoonish.
Games are free to play, but develop-ers can charge for things like a weaponthat launches eight pumpkins at once,or a “Doge hat” to give a player’s avatarthe head of a dog from a past internetmeme. Let your children onto Robloxand there will soon be incessant re-quests for the in-game currencyRobux, bought with real money. Theremight also be a sharp increase in in-stances of the littlest one trying to callyou “dude,” my field work indicates.Players can meet up in games withtheir real-world friends and commu-
nicate through a chat feature. Robloxfilters these messages for inappropri-ate content, not always thoroughly,and employs a small army of gamemonitors.
The company had planned aninitial public offering last year, butdelayed it, and then announced thismonth that it would instead pursuea direct listing, whereby companiesbegin trading but don’t issue newshares or raise money. The stockcould begin trading next month.
Roblox isn’t yet profitable, in partbecause it recognizes revenue fromin-game purchases little by little overthe gaming lives of its users. Revenuerose 68%, to $589 million, in the firstnine months of last year. Bookings,a simpler measure of money comingin, jumped 171%, to $1.24 billion.
MKM Partners analyst Eric Han-dler estimates that Roblox has re-cently been averaging $100 million infree cash flow a quarter. Assume thatfigure could quickly double and youcan make a case for Roblox’s valuationresembling that of Take-Two, the pric-iest of the legacy videogame makers,at 39 times projected free cash flow.Activision Blizzard (ATVI) trades at29 times and Electronic Arts (EA),23 times. All three stocks soared lastyear, as time playing videogames ex-ploded.
And it’s not just kids. Adults 45to 54 increased their game time by59% last year, according to the NPDGroup, a market researcher. Spend-ing rose faster. Last year, the globalvideogame business took in an esti-mated $180 billion. That’s about $80billion more than the movie businessat its peak.
Could now be as good as it gets forinvestors? “What’s so fascinatingabout this fiscal year for us, as greatas it has been...is it is still a very lightrelease year,” Take-Two CEO StraussZelnick told me this past week. “Thebulk of the titles that made up theyear existed previously, and havebeen ongoing consumer experiences.”Over the next five years, he expects torelease more than 90 new titles,which he says is double the pipelinethat Take-Two had a few years ago.
M KM’s Handler likes Ac-tivision Blizzard for itspromising release calen-dar, including Call of
Duty: Mobile, which came out inChina on Christmas. He says it couldbe a $500 million to $600 milliongame this year. He also likes Elec-tronic Arts for its recent acquisitionof Codemasters, which makes racinggames that haven’t yet added muchrecurring revenue from in-gameservices.
If there is a spoiler, it might be acoming wave of initial public offer-ings, which will generate excitementbut could also flood the market withvideogame shares. Playtika Holding(PLTK), a maker of casual casino-type games, came public earlier thismonth, and was recently valued atclose to $13 billion. Beyond Roblox,candidates for going public this yearinclude mobile game makers App-Lovin and Scopely, which couldbe valued at several billion dollarsapiece, and Epic Games, maker of theshoot-’em-up blockbuster Fortnite,which was valued in an August fund-ing round at more than $17 billion.
That should give bulls pause. Also,the long-term outlook for videogam-ing is bright—but near term, oncegroup activities resume, I might haveto start parenting again. That willmean switching my kids from Robloxto their previous human co-experi-ence platforms, like Little League,which has a chat feature called yell-ing stuff, and where players can altertheir in-game appearance for free bysliding in dirt. B
email: [email protected]
Barron’s StreetwiseIn a weekly podcast by Barron’s, columnist Jack Hough looks
at the companies, people, and trends you should be watching.
This is Wall Street like you’ve never heard before. Subscribe
to Barron’s Streetwise on Spotify, Apple Podcasts,
or your favorite listening app.
BARRONS.COM/PODCASTS
By Jack Hough
10 BARRON’S January 25, 2021
R E V I EW 30,996.98Dow Industrials: +182.72
511.02Dow Global Index: +7.87
1.09%10-year treasury note: -0.01
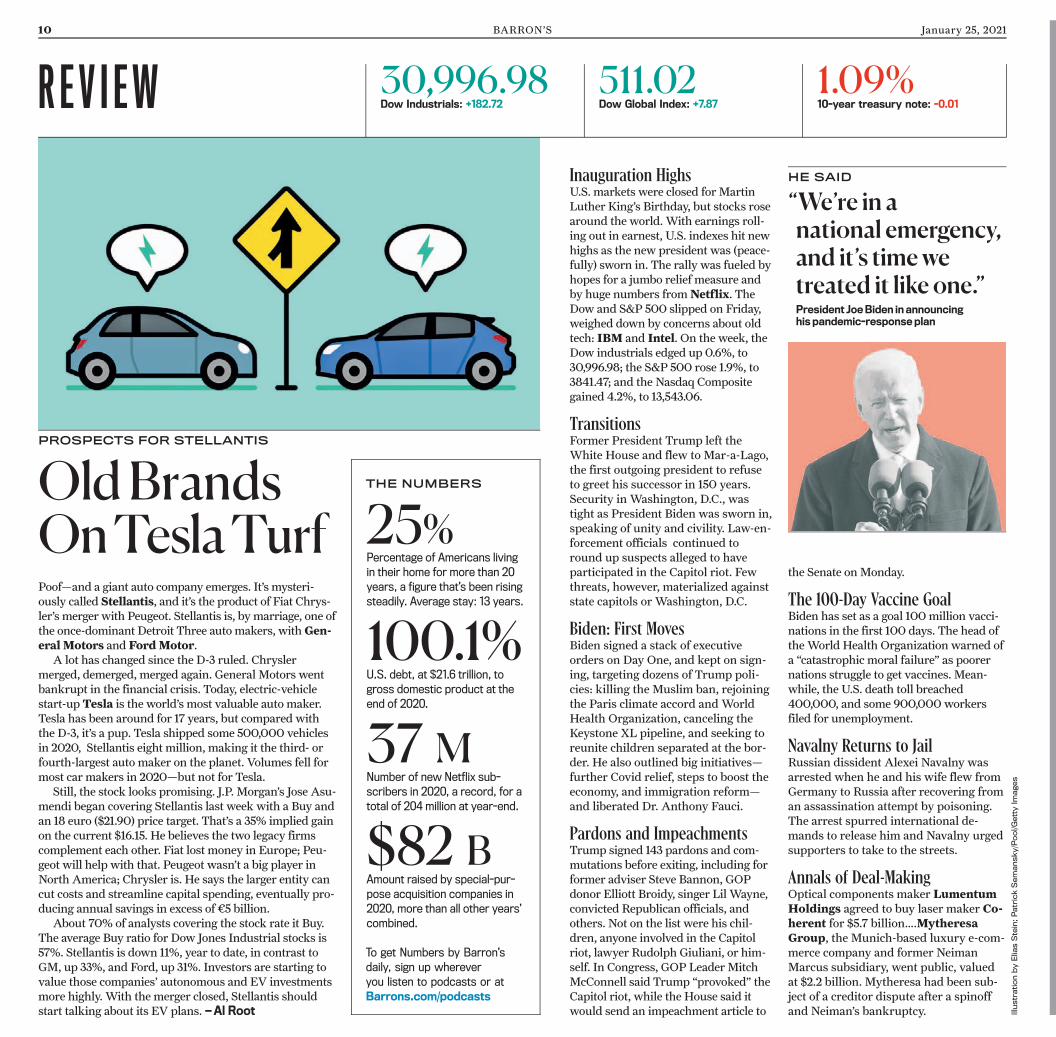
PROSPECTS FOR STELLANTIS
Inauguration HighsU.S. markets were closed for MartinLuther King’s Birthday, but stocks rosearound the world.With earnings roll-ing out in earnest, U.S. indexes hit newhighs as the new president was (peace-fully) sworn in. The rally was fueled byhopes for a jumbo relief measure andby huge numbers fromNetflix. TheDow and S&P 500 slipped on Friday,weighed down by concerns about oldtech: IBM and Intel. On the week, theDow industrials edged up 0.6%, to30,996.98; the S&P 500 rose 1.9%, to3841.47; and the Nasdaq Compositegained 4.2%, to 13,543.06.
TransitionsFormer President Trump left theWhite House and flew to Mar-a-Lago,the first outgoing president to refuseto greet his successor in 150 years.Security in Washington, D.C., wastight as President Biden was sworn in,speaking of unity and civility. Law-en-forcement officials continued toround up suspects alleged to haveparticipated in the Capitol riot. Fewthreats, however, materialized againststate capitols or Washington, D.C.
Biden: First MovesBiden signed a stack of executiveorders on Day One, and kept on sign-ing, targeting dozens of Trump poli-cies: killing the Muslim ban, rejoiningthe Paris climate accord andWorldHealth Organization, canceling theKeystone XL pipeline, and seeking toreunite children separated at the bor-der. He also outlined big initiatives—further Covid relief, steps to boost theeconomy, and immigration reform—and liberated Dr. Anthony Fauci.
Pardons and ImpeachmentsTrump signed 143 pardons and com-mutations before exiting, including forformer adviser Steve Bannon, GOPdonor Elliott Broidy, singer Lil Wayne,convicted Republican officials, andothers. Not on the list were his chil-dren, anyone involved in the Capitolriot, lawyer Rudolph Giuliani, or him-self. In Congress, GOP Leader MitchMcConnell said Trump “provoked” theCapitol riot, while the House said itwould send an impeachment article to
Old BrandsOn Tesla TurfPoof—and a giant auto company emerges. It’s mysteri-ously called Stellantis, and it’s the product of Fiat Chrys-ler’s merger with Peugeot. Stellantis is, by marriage, one ofthe once-dominant Detroit Three auto makers, withGen-eralMotors and FordMotor.
A lot has changed since the D-3 ruled. Chryslermerged, demerged, merged again. General Motors wentbankrupt in the financial crisis. Today, electric-vehiclestart-upTesla is the world’s most valuable auto maker.Tesla has been around for 17 years, but compared withthe D-3, it’s a pup. Tesla shipped some 500,000 vehiclesin 2020, Stellantis eight million, making it the third- orfourth-largest auto maker on the planet. Volumes fell formost car makers in 2020—but not for Tesla.
Still, the stock looks promising. J.P. Morgan’s Jose Asu-mendi began covering Stellantis last week with a Buy andan 18 euro ($21.90) price target. That’s a 35% implied gainon the current $16.15. He believes the two legacy firmscomplement each other. Fiat lost money in Europe; Peu-geot will help with that. Peugeot wasn’t a big player inNorth America; Chrysler is. He says the larger entity cancut costs and streamline capital spending, eventually pro-ducing annual savings in excess of €5 billion.
About 70% of analysts covering the stock rate it Buy.The average Buy ratio for Dow Jones Industrial stocks is57%. Stellantis is down 11%, year to date, in contrast toGM, up 33%, and Ford, up 31%. Investors are starting tovalue those companies’ autonomous and EV investmentsmore highly.With the merger closed, Stellantis shouldstart talking about its EV plans. —Al Root
25%Percentage of Americans livingin their home for more than 20years, a figure that’s been risingsteadily. Average stay: 13 years.
100.1%U.S. debt, at $21.6 trillion, togross domestic product at theend of 2020.
37 MNumber of new Netflix sub-scribers in 2020, a record, for atotal of 204 million at year-end.
$82 BAmount raised by special-pur-pose acquisition companies in2020, more than all other years’combined.
To get Numbers by Barron’sdaily, sign up whereveryou listen to podcasts or atBarrons.com/podcasts
THE NUMBERS
HE SAID
“We’re in anational emergency,and it’s time wetreated it like one.”President JoeBiden in announcinghis pandemic-responseplan
the Senate onMonday.
The 100-Day Vaccine GoalBiden has set as a goal 100million vacci-nations in the first 100 days. The head oftheWorld Health Organization warned ofa “catastrophic moral failure” as poorernations struggle to get vaccines. Mean-while, the U.S. death toll breached400,000, and some 900,000workersfiled for unemployment.
Navalny Returns to JailRussian dissident Alexei Navalny wasarrested when he and his wife flew fromGermany to Russia after recovering froman assassination attempt by poisoning.The arrest spurred international de-mands to release him and Navalny urgedsupporters to take to the streets.
Annals of Deal-MakingOptical components maker LumentumHoldings agreed to buy laser maker Co-herent for $5.7 billion….MytheresaGroup, the Munich-based luxury e-com-merce company and former NeimanMarcus subsidiary, went public, valuedat $2.2 billion. Mytheresa had been sub-ject of a creditor dispute after a spinoffand Neiman’s bankruptcy. Ill
ustrationbyElia
sSte
in;PatrickSemansky/P
ool/G
ettyIm
ages
January 25, 2021 BARRON’S 11
P R E V I EW
SPIRALING CONTAINER COSTS
Sign up for the Review &Preview daily newsletter atBarrons.com/reviewpreview
Monday 1/25Kimberly-Clark and Philips reportquarterly results.
The Federal Reserve Bank of Chi-cago releases its National Activity in-dex for December. Consensus estimateis for a 0.10 reading, below December’s0.27 figure. The recent data for theindex suggest a slightly above-averagegrowth rate for the economy after apowerful third-quarter rebound.
Tuesday 1/263M,Advanced Micro Devices,American Express, Capital OneFinancial, General Electric, In-vesco, Johnson & Johnson, Lock-heed Martin,Microsoft, Prologis,Raytheon Technologies, Star-bucks, Texas Instruments, and Ve-rizon Communications announceearnings.
The Conference Board releases itsConsumer Confidence index for Janu-ary. Economists forecast a 91.6 read-ing, three points more than in Decem-ber. Consumer confidence remainswell below prepandemic levels.
Wednesday 1/27Abbott Laboratories,Anthem,AT&T, Boeing, Crown Castle Inter-national,General Dynamics, LamResearch,Norfolk Southern, Ser-viceNow, and Stryker report quar-terly results.
The Federal OpenMarket Commit-tee announces its monetary-policydecision. The central bank is all butassured to keep the federal-funds rateunchanged at near zero. ButWallStreet is interested to learn if andwhen the Fed will consider paring itsbond purchases, currently at $120billion a month.
The Census Bureau releases thedurable goods report for December.New orders for manufactured durablegoods are expected to rise 0.8%month
over month to $246 billion.
Thursday 1/28Altria Group,American AirlinesGroup, Comcast,Danaher,Dow,Mastercard,McDonald’s,MondelezInternational,MSCI,NorthropGrumman, Southwest Airlines,T. Rowe Price Group, andVisaannounce earnings.
The Bureau of EconomicAnalysisreports its advance estimate for fourth-quarter gross domestic product. Con-sensus estimate is for the economy tohave grown at a seasonally adjustedannual rate of 4.3%, after a record paceof 33.4% in the third quarter.
Friday 1/29Caterpillar, Charter Communica-tions, Chevron, Colgate-Palmolive,Eli Lilly, andHoneywell Interna-tional host conference calls to discussquarterly results.
The BEA reports personal incomeand spending data for December. Econ-omists forecast both personal incomeand expenditures to tick down 0.1%month over month. In November, in-come fell 1.1%; spending declined 0.4%.
Coming EarningsConsensusEstimate Yearago
M
AGNC Investment (Q4) $2.58 $0.48
T
3M (Q4) 2.15 1.95
AdvancedMicroDevices (Q4) 0.47 0.32
AlaskaAir (Q4) -2.86 1.46
AmericanExpress (Q4) 1.30 2.03
C.H.RobinsonWorldwide (Q4) 0.97 0.73
MoreEarningsonPageM36.
Consensus EstimateDay ConsensusEst LastPeriod
T JanuaryConsumerConfidence 89.2 88.6
TH Q4GDP 4.3% 33.4%
DecemberWholesale Inventories 0.20% 0.0%
DecemberNewHomeSales 850,000 841,000
F DecemberPersonal Income 0.00% -1.1%
JanuaryMichiganSentiment - f 79.2 79.2
Unlessotherwise indicated, timesareEastern. a-Advanced;f-Final; p-Preliminary; r-Revised Source: FactSet
Formore informationabout comingeconomic reports- andwhat theymean - go toBarron’s freeEconomicCalendar atwww.barrons.com
Half of the six largest U.S. companies bymarket cap report results. Apple, Facebook,
and Tesla will also host calls to discuss their earnings after the market close.
Wednesday
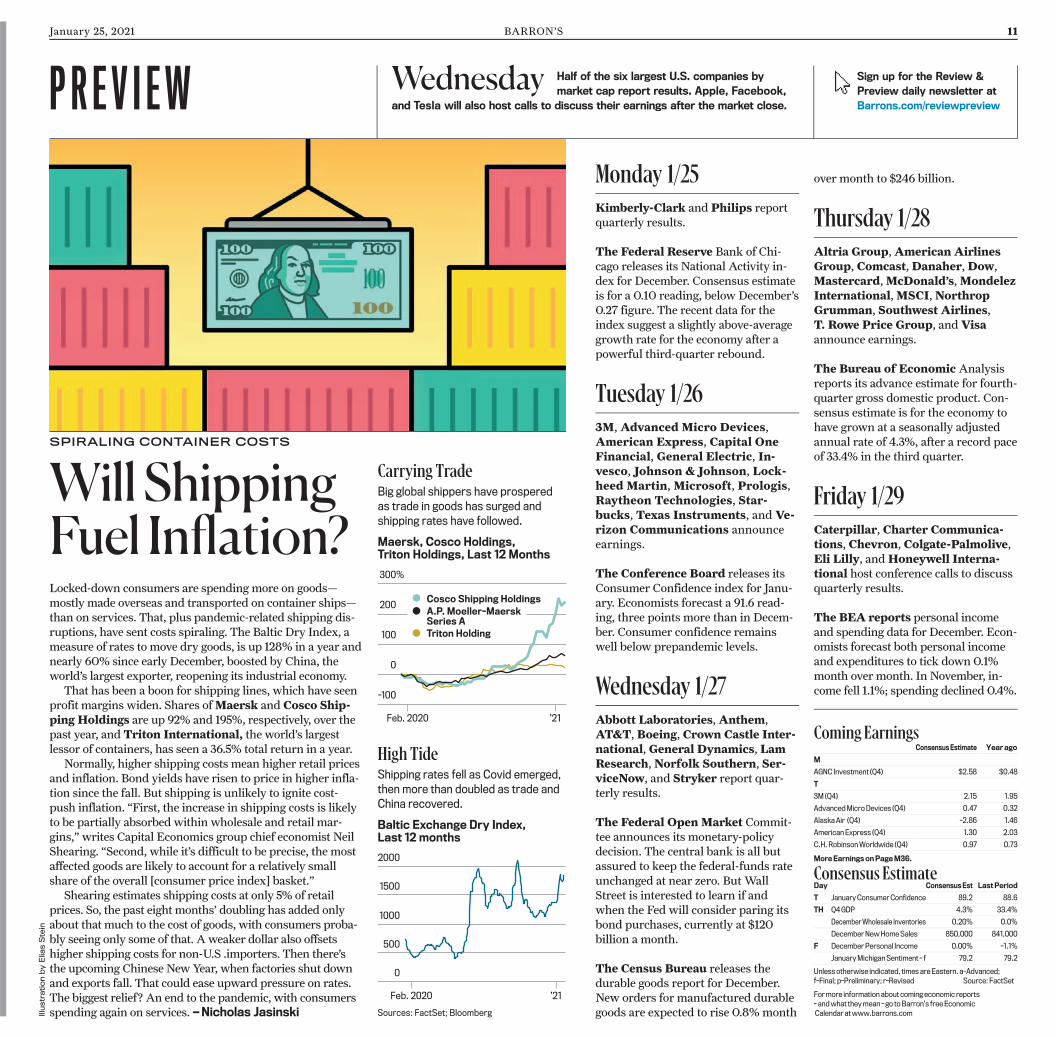
Will ShippingFuel Inflation?Locked-down consumers are spending more on goods—mostly made overseas and transported on container ships—than on services. That, plus pandemic-related shipping dis-ruptions, have sent costs spiraling. The Baltic Dry Index, ameasure of rates to move dry goods, is up 128% in a year andnearly 60% since early December, boosted by China, theworld’s largest exporter, reopening its industrial economy.
That has been a boon for shipping lines, which have seenprofit margins widen. Shares ofMaersk and Cosco Ship-ping Holdings are up 92% and 195%, respectively, over thepast year, andTriton International, the world’s largestlessor of containers, has seen a 36.5% total return in a year.
Normally, higher shipping costs mean higher retail pricesand inflation. Bond yields have risen to price in higher infla-tion since the fall. But shipping is unlikely to ignite cost-push inflation. “First, the increase in shipping costs is likelyto be partially absorbed within wholesale and retail mar-gins,” writes Capital Economics group chief economist NeilShearing. “Second, while it’s difficult to be precise, the mostaffected goods are likely to account for a relatively smallshare of the overall [consumer price index] basket.”
Shearing estimates shipping costs at only 5% of retailprices. So, the past eight months’ doubling has added onlyabout that much to the cost of goods, with consumers proba-bly seeing only some of that. Aweaker dollar also offsetshigher shipping costs for non-U.S .importers. Then there’sthe upcoming Chinese NewYear, when factories shut downand exports fall. That could ease upward pressure on rates.The biggest relief? An end to the pandemic, with consumersspending again on services. —Nicholas Jasinski
Carrying TradeBig global shippers have prosperedas trade in goods has surged andshipping rates have followed.
Sources: FactSet; Bloomberg
High TideShipping rates fell as Covid emerged,then more than doubled as trade andChina recovered.
Cosco Shipping HoldingsA.P. Moeller-MaerskSeries ATriton Holding
Feb. 2020 ’21
-100
0
100
200
300%
Maersk, Cosco Holdings,Triton Holdings, Last 12 Months
Baltic Exchange Dry Index,Last 12 months
Feb. 2020 ’21
0
500
1000
1500
2000
IllustrationbyElia
sSte
in
12 BARRON’S January 25, 2021
F O L L OW - U P While China policy may be less volatile, investorsshould brace for continued complexities based ona changing relationship between the two nations.
Expect Biden to TakeTough Stance on China
Exchange to delist some of the stocks,including telecoms like China Mobile(ticker: 941.Hong Kong). Though in-vestors have until November to divest,many have already struggled to selltheir shares.
Adding to the uncertainty, the Chi-nese telecoms on Friday asked theNYSE to reconsider the delisting. Asthe new administration reviews recentTrump administration orders, it couldrein in some provisions or removecompanies from the list if they decidethe rationale to ban them was weak.
More broadly, the Biden China ap-proach is likely to be clearer, more mul-tilateral, and less ad-hoc. The selectionof Kurt Campbell, the top Asia diplo-mat in the Obama administration, for anew role as Indo-Pacific coordinatorsignals that the new team is thinkingabout more coherent policies, bothdomestically and among U.S. allies,that would have a better chance to sur-vive, says Scott Kennedy, senior advi-sor and trustee chair in Chinese Busi-ness and Economics at the Center forStrategic and International Studies.
Delisting threats could persist, butfund managers still see a chance U.S.
and Chinese regulators may compro-mise on legislation delisting Chinesecompanies if they fail to comply withU.S. audit rules within three years.
Another reason for investor cau-tion: The State Department on Tues-day just before Biden took office de-termined that China had committed“genocide and crimes against human-ity,” against the Uighurs, a Muslimminority group in Xianjiang prov-ince—a view shared by Secretary ofState nominee Anthony Blinken.
That may pave the way for sanc-tions or technology restrictions. Con-gress may also reintroduce a bill put-ting the burden on companies toprove no connection to goods made by
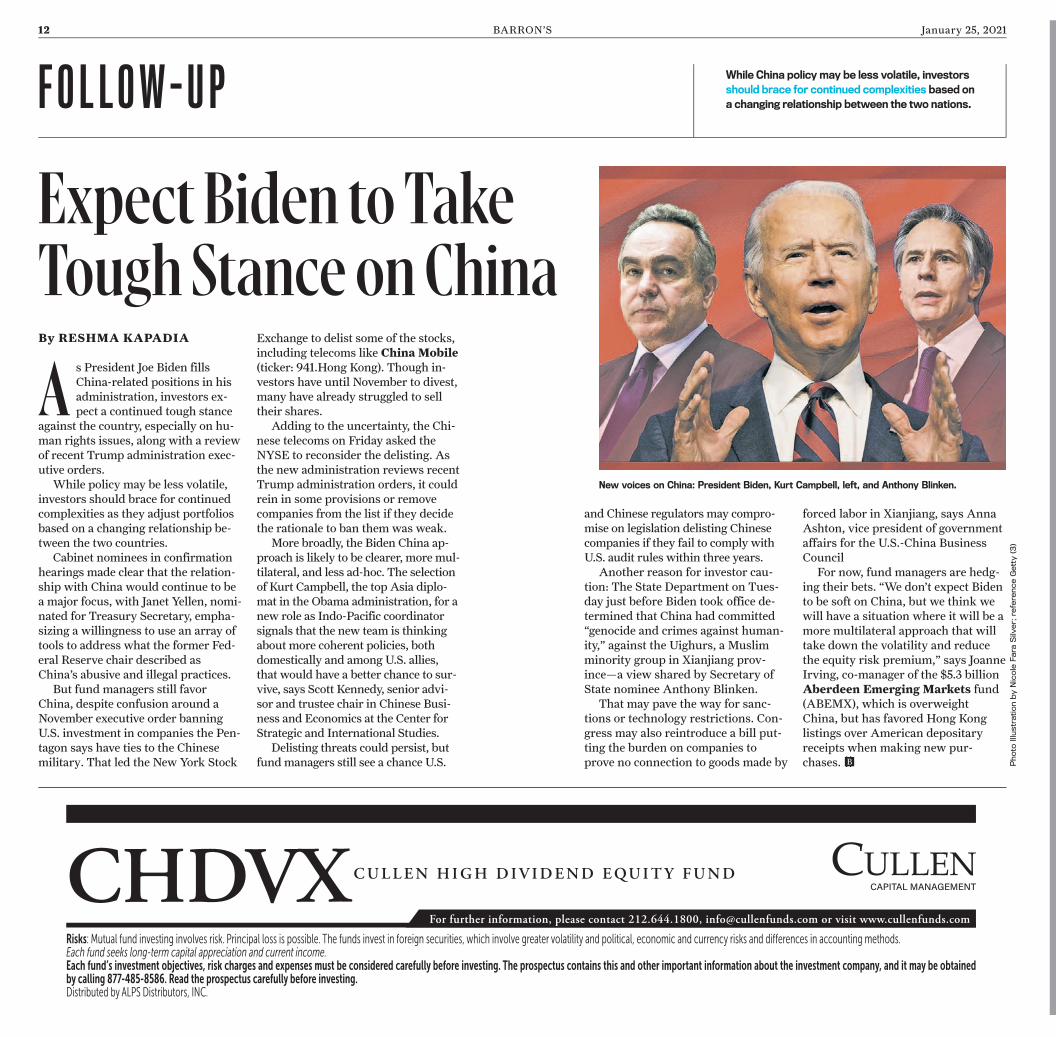
As President Joe Biden fillsChina-related positions in hisadministration, investors ex-pect a continued tough stance
against the country, especially on hu-man rights issues, along with a reviewof recent Trump administration exec-utive orders.
While policy may be less volatile,investors should brace for continuedcomplexities as they adjust portfoliosbased on a changing relationship be-tween the two countries.
Cabinet nominees in confirmationhearings made clear that the relation-ship with China would continue to bea major focus, with Janet Yellen, nomi-nated for Treasury Secretary, empha-sizing a willingness to use an array oftools to address what the former Fed-eral Reserve chair described asChina’s abusive and illegal practices.
But fund managers still favorChina, despite confusion around aNovember executive order banningU.S. investment in companies the Pen-tagon says have ties to the Chinesemilitary. That led the New York Stock
By RESHMA KAPADIA
New voices on China: President Biden, Kurt Campbell, left, and Anthony Blinken.
forced labor in Xianjiang, says AnnaAshton, vice president of governmentaffairs for the U.S.-China BusinessCouncil
For now, fund managers are hedg-ing their bets. “We don’t expect Bidento be soft on China, but we think wewill have a situation where it will be amore multilateral approach that willtake down the volatility and reducethe equity risk premium,” says JoanneIrving, co-manager of the $5.3 billionAberdeen Emerging Markets fund(ABEMX), which is overweightChina, but has favored Hong Konglistings over American depositaryreceipts when making new pur-chases. B P
hoto
IllustrationbyNicole
Fara
Silv
er;
refe
renceGetty(3
)
Risks: Mutual fund investing involves risk. Principal loss is possible. The funds invest in foreign securities, which involve greater volatility and political, economic and currency risks and differences in accounting methods.Each fund seeks long-term capital appreciation and current income.Each fund’s investment objectives, risk charges and expenses must be considered carefully before investing. The prospectus contains this and other important information about the investment company, and it may be obtainedby calling 877-485-8586. Read the prospectus carefully before investing.Distributed by ALPS Distributors, INC.
For further information, please contact 212.644.1800, [email protected] or visit www.cullenfunds.com
CHDVXCULLEN HIGH DIV IDEND EQUITY FUND
January 25, 2021 BARRON’S 13
They’ll need to upgrade antennas,radios, and other equipment, startinga new growth cycle for the towercompanies.
At the same time, data centersare benefiting from a shift to cloud-computing, digital storage, and othertech trends accelerated by thepandemic.
Two tower companies are particu-larly well positioned in the year tocome: Crown Castle International(CCI) and SBA Communications(SBAC). Among data centers,Equinix (EQIX) and CoreSite Realty(COR) look appealing. The stocks areall structured as real estate invest-ment trusts, or REITs, with CrownCastle and CoreSite each yieldingmore than 3%.
The merger of T-Mobile US andSprint temporarily clouded the picturefor tower companies and weighed ontheir stocks in 2020. The consolida-tion removed an important customerfrom the market. T-Mobile, the No. 3wireless player in the U.S., plans todecommission 35,000 legacy towersused by Sprint.
Most of the leasing losses are ini-tially expected atAmerican Tower(AMT), the largest tower player, al-though Crown Castle and SBA willalso lose Sprint towers over time.Ultimately, less than a third of Sprint’slegacy towers are likely to survive,according to LightShed Partners ana-lyst Walter Piecyk.
Those Sprint losses are nowfactored intoWall Street estimates.Crown is forecast to generate $6.71 ashare in adjusted funds from opera-tions, REITs’ preferred measure ofoperating earnings, in the coming year,up from $6.08. SBA’s AFFO is seenrising 9%, to $10.25 a share. Revenuecould rise 5% for both companies, ac-cording to consensus estimate, as tow-ers get C-band-related antennas andother equipment upgrades.
The three major wireless carriersare each adding about $2 billion totheir capital-expenditure plans in2021. T-Mobile is making the biggestrelative boost, with spending forecastto hit $13.6 billion this year, up from$11.4 billion in 2020; it has to upgradeequipment to improve performance on
its 2.5 GHz network, which was bol-stered by its Sprint deal.
Despite losing Sprint, the wirelessmarketplace is actually getting morecrowded, with satellite and cable com-panies angling to get into the business.Dish Network (DISH) plans to builda 5G network with 15,000 sites byJune 2023. Comcast (CMCSA) andCharter Communications (CHTR)have been buying spectrum and mayhave spent billions on C-band; finalresults are expected to be releasednext month. They could start deploy-ing some of it on towers over the nextfew years.
Overall, Piecyk estimates that theindustry should get back to double-digit growth in AFFO.
While Crown and SBA are generalbeneficiaries of the 5G buildout, thereare specific reasons to own each stock.Crown is a bet on small cells and therevival of its fiberoptic business.
The company invested more than$11 billion in fiber in recent years,mainly selling the service to enter-prise customers, while adding small-cell nodes for wireless, which allowproviders to fill in service gaps indense population areas. It has been acontroversial strategy; the returns andgrowth on fiber are much lower thanon large-scale macro towers, andCrown has been under pressure byactivist investor Elliott Managementto stop investing in small cells andenterprise fiber.
The fiber business has weighedon Crown’s multiple, but it may be thevalue in the stock, says Cowen analystColby Synesael, who notes that Crownrecently reshuffled the leadership of itsfiber group in an effort to jump-startthe turnaround. Since then, Dish hassigned a contract to use Crown’s fiberalong with up to 20,000 of its towersto help build out its new 5G network.
Morgan Stanley analyst SimonFlannery calls Crown his top pick intowers. He sees the stock hitting$187, based on a multiple of 26 times2022 estimates of $7.10 a share inAFFO. Crown historically trades atan average 21 times, but strongtower-leasing trends warrant ahigher multiple, he says.
SBA is a more traditional bet ondomestic wireless towers, which havethe best business model in telecominfrastructure, Flannery says. Theyaccount for 75% of SBA’s revenue;more than 60% of the company’stowers are in the top 100 domesticmarkets.
4Ways to Play aBoom inDigitalInfrastructureCell tower and data center stocks have lagged behind,despite their key role in the digital transformation
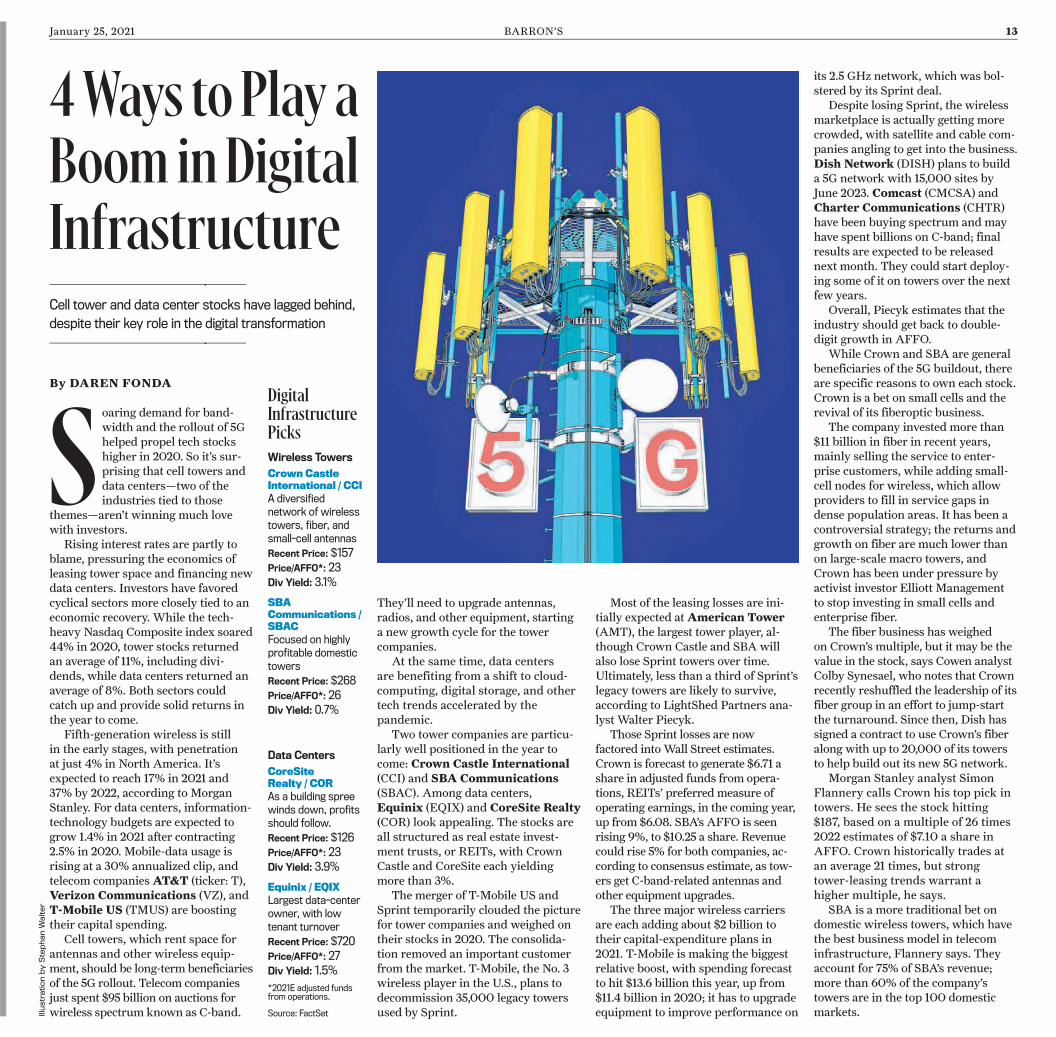
Soaring demand for band-width and the rollout of 5Ghelped propel tech stockshigher in 2020. So it’s sur-prising that cell towers anddata centers—two of theindustries tied to those
themes—aren’t winning much lovewith investors.
Rising interest rates are partly toblame, pressuring the economics ofleasing tower space and financing newdata centers. Investors have favoredcyclical sectors more closely tied to aneconomic recovery. While the tech-heavy Nasdaq Composite index soared44% in 2020, tower stocks returnedan average of 11%, including divi-dends, while data centers returned anaverage of 8%. Both sectors couldcatch up and provide solid returns inthe year to come.
Fifth-generation wireless is stillin the early stages, with penetrationat just 4% in North America. It’sexpected to reach 17% in 2021 and37% by 2022, according to MorganStanley. For data centers, information-technology budgets are expected togrow 1.4% in 2021 after contracting2.5% in 2020. Mobile-data usage isrising at a 30% annualized clip, andtelecom companiesAT&T (ticker: T),Verizon Communications (VZ), andT-Mobile US (TMUS) are boostingtheir capital spending.
Cell towers, which rent space forantennas and other wireless equip-ment, should be long-term beneficiariesof the 5G rollout. Telecom companiesjust spent $95 billion on auctions forwireless spectrum known as C-band.
By DAREN FONDADigitalInfrastructurePicksWireless Towers
Crown CastleInternational / CCIA diversifiednetwork of wirelesstowers, fiber, andsmall-cell antennasRecent Price: $157Price/AFFO*: 23Div Yield: 3.1%
SBACommunications /SBACFocused on highlyprofitable domestictowersRecent Price: $268Price/AFFO*: 26Div Yield: 0.7%
Data Centers
CoreSiteRealty / CORAs a building spreewinds down, profitsshould follow.Recent Price: $126Price/AFFO*: 23Div Yield: 3.9%
Equinix / EQIXLargest data-centerowner, with lowtenant turnoverRecent Price: $720Price/AFFO*: 27Div Yield: 1.5%
*2021E adjusted fundsfrom operations.
Source: FactSetIllustrationbySte
phanWalter
w013_p2bw
025000_0_w01300_1________xa2021_w
-opt_01.pdf1
23-Jan-21 08:11:26
14 BARRON’S January 25, 2021
The C-band auctions should be a “signif-icant driver” of leasing in the second halfof 2021, Brendan Cavanagh, SBA’s chieffinancial officer, recently told investors.
“U.S. towers are the gold standard, andSBA has the most exposure to the busi-ness,” says MoffettNathanson analyst NickDel Deo, who calls SBA his top tower pick.He expects the stock to hit $320 in the next12 months, from a recent $272.
While tower companies are poised tobenefit from our ever-growing wirelessconnectivity, data centers are the facilita-tors of our addiction to data. Tech trendssuch as cloud computing, outsourcing ofcorporate servers, and increased demandfor data analytics are driving demand.
Cloud capex is expected to grow 16%in the first half of the year and 10% in thesecond half, according to Morgan Stanley.
CoreSite has actually missed potentialbusiness in recent years as the companyran short of inventory. But it’s now comingoff a building spree in core markets such asthe San Francisco Bay Area, Northern Vir-ginia, and Los Angeles. AFFO growth isexpected to jump from 5.4% this year to7.3% in 2022.
“They generate the best returns on in-vested capital, but the stock trades in linewith the group,” Del Deo says. At a recent$126, CoreSite trades at 23 times AFFOestimates for 2021. Del Deo has a pricetarget of $142 on the stock.
Equinix trades at a premium to CoreSite,at 27 times Wall Street’s estimate for 2021AFFO—but it’s the largest and arguablybest-positioned data-center owner. Tenantturnover is low, and the company’s globalportfolio of facilities in urban areas can’tbe easily replicated. Equinix has a largedevelopment pipeline, including expansionplans in India, and it has built strategicalliances with several tech giants, includingMicrosoft (MSFT),Amazon.com(AMZN), and Cisco Systems (CSCO).
Credit Suisse analyst Sami Badri hasOutperform ratings on Equinix and Core-Site. “Both companies have built highlyconnected ecosystems that offer key advan-tages to their customers versus other datacenters,” he says.
Badri has a $915 target on Equinix, nearthe top of Wall Street estimates. That maybe a stretch, and would require the stock toexpand its already premium multiple. Butearnings growth alone could drive gains inthe year to come. At a consistent 27 timesAFFO, the stock could hit $800 in a year,an 11% gain.
Towers and data centers may be thesleepy part of the technology market. Butthey could also be the least volatile part oftech in the coming year. In 2021, it’s worthpaying up for some stability. B
HOW DO YOU MANAGERISK WHEN THE WORLD IS
UPS IDE DOWN?
We can't control what's next, but we can help navigate it. CME Group provides 24-houraccess to trading opportunities in every investable asset class, allowing market participantsworldwide to manage risk and capture opportunities. For every economic twist and turn,when the new normal is anything but… CME Group.
V IS IT CMEGROUP.COM/ACT ION
Derivatives are not suitable for all investors and involve the risk of losing more than the amount originally deposited and any profit you might have made. Thiscommunication is not a recommendation or offer to buy, sell or retain any specific investment or service. Copyright © 2020 CME Group Inc. All rights reserved.
January 25, 2021 BARRON’S 15
lot on a muffler or rearviewmirror.The stock dropped 1.3% last year as
Covid-19 led to fewer miles driven formany people—meaning less wear andtear on vehicles and fewer accidents,causing scrap-metal prices to increase.
But most of LKQ’s problems havebeen self-inflicted. For years, LKQwas a consolidation story, snappingup smaller players and building adominant business, both in the U.S.and Europe. Yet the synergies thatshould have resulted from thisacquisition binge never emerged. Thecompany’s operating margins declinedeach year from 2015 to 2019, andexpenses were higher than theyshould have been. Covid-19 has forcedLKQ to get leaner—and that couldallow the stock to benefit from thereopening of the economy in 2021.
“LKQ, like a lot of other companies,realized that they can do more withless” during the pandemic, says JoshWein, a portfolio manager at HennessyFunds, which bought the stock inOctober. “Companies use it as anexcuse to do what they should havedone anyway—get rid of some fat.”
Disappointment has been the nameof the game for LKQ in recent years.The stock has been range-bound atabout $20 to $43 since late 2012 asmetrics such as return on assets andreturn on equity fell and debt rose. Ithas become easy to doubt an LKQturnaround. “We’ve owned the stocksince 2014, and it has been a perennialdisappointment,” says Lamar Villere,partner and portfolio manager atVillere & Co., which recently sold thestock. “The problem is, it’s six yearslater and [things are] moving moreslowly than hoped.”
S till, 2021 might be the year thatLKQ finally lives up to thepromises it made. The stock hasalready gained more than 6%
this year, putting it on course to finallybreak out of its trading range.
The company has reduced oper-ating expenses by about 6% in thefirst nine months of 2020, and LKQ’sstreamlined operations mean thatmargins are also a major focus. Bothnet margins and earnings beforeinterest and taxes, or Ebit, at 4.3% and7.8%, respectively, were lower in 2019than they were five years prior. Yetanalysts expect these to improve in2020, to 6.2% and 9%, both above thecompany’s five-year average.
Moreover, after years of mergersand acquisitions, LKQ has pulled backfromM&A, unlocking free cash flowand allowing the company to paydown debt and repurchase stock.Analysts expect that net debt will fallsome $600 million in 2021 to $3.5billion, on free cash flow of $859million, roughly double the levels itsaw from 2015 to 2018.
“LKQ is in the early-to-middleinnings of a multiyear plan, and theimprovement in profitability, coupledwith a return to [sales] growth nextyear, should drive multiple expan-sion,” says Stephens analyst DanielImbro, who points to the recent stringof better-than-expected earningsreports from the company.
Consensus estimates call for LKQ’searnings per share to have edged upjust 2.5% year over year in 2020 to$2.43, with revenue dipping 7.5%, to
$11.56 billion. Yet 2021 looks brighter,with earnings per share expected tojump 13% to a record $2.7forced ittoget leaner 5 on a 5.8% rise in sales to$12.22 billion.
Despite the positive outlook, LKQ’sprice/earnings ratio fell from about 20times at the beginning of 2020 to 14.5times at the end of the year, at a timewhen the S&P 500’s multiple rosefrom roughly 21 times to 31 times. Thegood news is that the low expectationsembedded in the multiple could workin LKQ’s favor, especially if it managesto right its European division.
The stock is cheap: At 13.7 times2021 earnings, it’s trading below itsfive-year average of 14.4 times, andbelow the P/E of peers like GenuineParts (GPC) andO’Reilly Auto-motive (ORLY), whose multiples arein the high teens, and Copart (CPRT)and Fastenal (FAST), which changehands for more than 30 times thisyear’s earnings.
“As execution improves, you’regoing to see the multiple recover,” saysImbro. He has a $44 price target onLKQ stock, up 17% fromWednesday’sclose of $37.60.
None of this takes into account theeconomic factors that should helpLKQ in 2021. The pandemic will end,and the reopening will unleash pent-up demand from motorists eager totravel again. And Americans, stilldealing with an uncertain economicoutlook, could be motivated to fix,rather than replace, damaged cars.
If 2020 taught us anything, it’s toexpect the unexpected. That includesa longtime lemon finally moving intothe fast lane. B
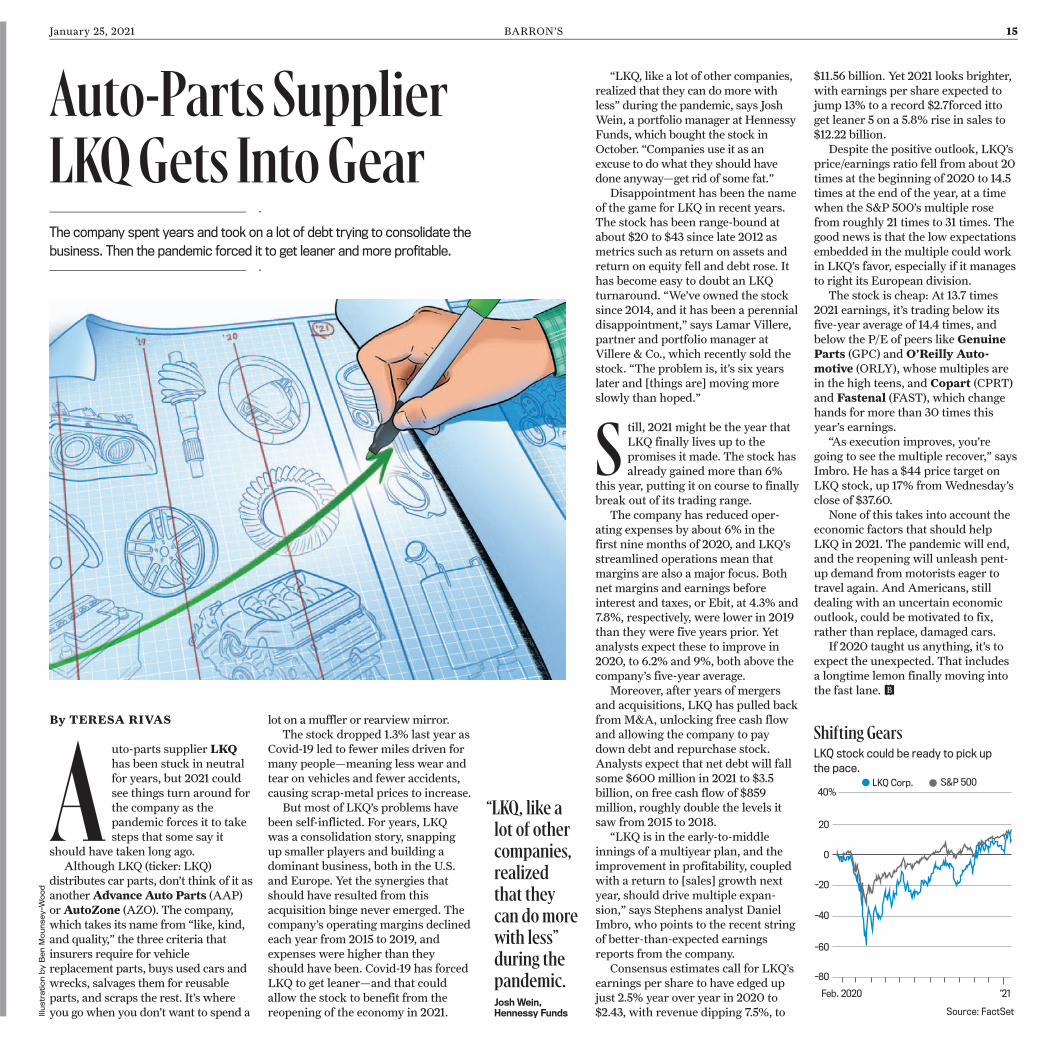
Auto-Parts SupplierLKQGets Into GearThe company spent years and took on a lot of debt trying to consolidate the
business. Then the pandemic forced it to get leaner and more profitable.
“LKQ, like alot of othercompanies,realizedthat theycan domorewith less”during thepandemic.Josh Wein,Hennessy Funds
Auto-parts supplier LKQhas been stuck in neutralfor years, but 2021 couldsee things turn around forthe company as thepandemic forces it to takesteps that some say it
should have taken long ago.Although LKQ (ticker: LKQ)
distributes car parts, don’t think of it asanotherAdvance Auto Parts (AAP)orAutoZone (AZO). The company,which takes its name from “like, kind,and quality,” the three criteria thatinsurers require for vehiclereplacement parts, buys used cars andwrecks, salvages them for reusableparts, and scraps the rest. It’s whereyou go when you don’t want to spend a
By TERESA RIVAS
IllustrationbyBenMounsey-W
ood
Shifting GearsLKQ stock could be ready to pick upthe pace.
Source: FactSet
40%
20
0
-20
-40
-60
-80
Feb. 2020 ’21
S&P 500LKQ Corp.
16 BARRON’S January 25, 2021
end of the year, versus 20.4% for thebenchmarks they are tracked against.It was the second straight year that webeat the benchmarks, after a three-year drought.
That said, Barron’s didn’t do aswell with its bearish picks. On aver-age, those rose more than their bench-marks, meaning that investors whoavoided stocks based on our reportingmight have missed out on gains—or ifthey shorted the stocks, they mighthave lost money.
Barron’s tracks the performance ofstock picks every year in an attempt ataccountability. It’s an imperfect pro-
cess, but one that hopefully showswhere we have succeeded and wherewe can improve. We track only articlesthat chose three stocks or fewer, sothat larger sector bets aren’t part ofthe tally. And the stocks chosen incolumns like Tech Trader aren’tincluded, either.
If Barron’swriters change theiropinion on a stock in a follow-up, thegain or loss is locked in on the date ofthe follow-up, similar to when an in-vestor decides to liquidate a position.As for benchmarks, we track large-caps against the S&P 500, mid-capsagainst the S&PMidCap 400, andsmall-caps against the Russell 2000.
Although wemissedTesla (ticker:TSLA), which rose 743% in 2020, Bar-ron’s found some special situations thatpaid off handsomely for investors.
In April, Andrew Bary wrote aboutthe two companies that had spun offfrom United Technologies—CarrierGlobal (CARR) andOtisWorldwide(OTIS)—and the company thatemerged from the merger, RaytheonTechnologies (RTX). The first two ofthose stocks had enormous gainsthrough the end of the year. Carrier,which makes air-conditioning andheating systems, returned 177%through the end of the year. Its prod-ucts have become crucial for trans-porting the Covid-19 vaccine producedby Pfizer (PFE) and BioNTech(BNTX), which must be kept inextremely cold temperatures.
Otis, an elevator maker, has prof-ited from the success of its servicesbusiness, which accounts for about80% of earnings. Its stock has re-turned 48%.
Boyd Gaming (BYD) more thandoubled after Barron’s recommendedthe gambling stock in May. With casi-nos closed, the stock had tumbled inthe weeks before, but Lawrence C.Strauss predicted that Boyd wouldrebound because a lot of its profitscome from regional casinos thatwould attract people who might notwant to get on a plane.
Tech stocks drove much of lastyear’s rally, and they helped our re-sults, as well. Sales atAmazon.com(AMZN) boomed as Americansbought more online instead of goinginto stores. We had recommended iteven before the pandemic began todevastate bricks-and-mortar retailers.Shares rose 74% after Jack Hough’sJanuary call.
Another winner wasTwitter(TWTR), which had fallen 3% over
the prior year when Bill Alpert wroteabout it in a June cover story. Twitterwas in a battle with President DonaldTrump at the time over warning labelson his tweets regarding factual accu-racy and violence. It has since barredTrump entirely. But the company’simproving ad services and its ability todominate conversation have kept itrelevant and helped propel the stock to55% gains through the end of the year.
Other picks didn’t do as well.FirstCash (FCFS), the nation’s largestoperator of pawnshops, tends to dowell during recessions, but the latestone was an exception—the corona-virus downturn was bad for just aboutevery retail business. An evictionmoratorium, meanwhile, meant thatpeople could delay selling off posses-sions at pawnshops.
Another pick, Bank of America(BAC), slumped as low interest rateshurt returns. That said, Bank ofAmerica is already up 5% this year, aslong-term interest rates have trendedhigher and banks are back in favor.
Our bearish picks performedpoorly—or rather they did too well,on average. It was the first time in thepast six years that our bearish picksrose more than their benchmarks, onaverage. They returned some 80%,even as their benchmarks returned27%. One problem might have beenthat there were just seven negativecalls last year.
Of those, two did correctly warninvestors about coming turbulence. AChinese electric-auto maker namedKandi Technologies Group (KNDI)lost 51% after we pointed out the chal-lenges that the company faces in get-ting Americans to buy its cars.
AndNikola (NKLA) fell as doubtsgrew about the highflying electric-truck company’s prospects. FounderTrevor Milton resigned in September.
Negative Barron’s pieces on otherstocks—some of them also richlyvalued—didn’t come to fruition duringthe year. Plug Power (PLUG), whichdevelops hydrogen fuel-cell systems,kept rising after our skeptical Julyarticle, and it has kept rocketinghigher, nearly doubling since the startof this year. That is despite the com-pany still being unprofitable.
A skeptical take on online used-cardealer Carvana (CVNA) also hasn’tpanned out. Carvana rose as Ameri-cans went online to buy cars amid thepandemic. That success hasn’t yetturned into profits, but investors areclearly optimistic about the future. B
HowOur 2020 Stock PicksOutran aRampaging BullBarron’s writers outperformed stock market benchmarks for the second consecutive year,
helped by Carrier, Amazon, Boyd Gaming, and Twitter. Our bearish calls didn’t fare as well.
Barron’s picked stocks thatbeat a red-hot market in2020—and we didn’t evenchoose Tesla.
In a year of turmoil andhardship, as the pandemicthrottled the economy, the
stock market persevered, with theS&P 500 index rising 16%. Someoverseas markets did even better.
Stocks that were highlighted inbullish Barron’s articles had a totalreturn of 24.7% from the last tradingday before publication through the
By AVI SALZMAN
IllustrationbyGluekit
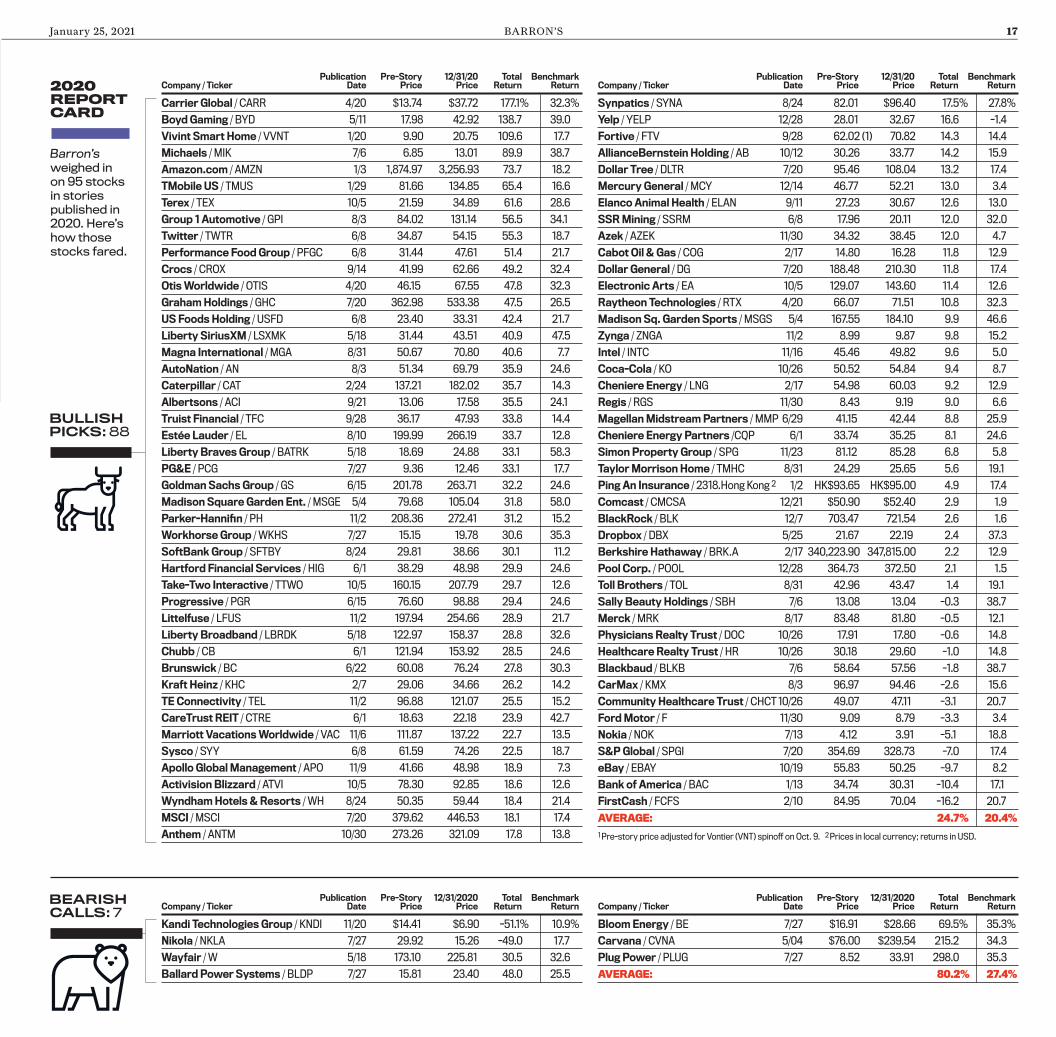
January 25, 2021 BARRON’S 17
Carrier Global / CARR 4/20 $13.74 $37.72 177.1% 32.3%
Boyd Gaming / BYD 5/11 17.98 42.92 138.7 39.0
Vivint Smart Home / VVNT 1/20 9.90 20.75 109.6 17.7
Michaels / MIK 7/6 6.85 13.01 89.9 38.7
Amazon.com / AMZN 1/3 1,874.97 3,256.93 73.7 18.2
TMobile US / TMUS 1/29 81.66 134.85 65.4 16.6
Terex / TEX 10/5 21.59 34.89 61.6 28.6
Group 1 Automotive / GPI 8/3 84.02 131.14 56.5 34.1
Twitter / TWTR 6/8 34.87 54.15 55.3 18.7
Performance Food Group / PFGC 6/8 31.44 47.61 51.4 21.7
Crocs / CROX 9/14 41.99 62.66 49.2 32.4
OtisWorldwide / OTIS 4/20 46.15 67.55 47.8 32.3
GrahamHoldings / GHC 7/20 362.98 533.38 47.5 26.5
US Foods Holding / USFD 6/8 23.40 33.31 42.4 21.7
Liberty SiriusXM / LSXMK 5/18 31.44 43.51 40.9 47.5
Magna International / MGA 8/31 50.67 70.80 40.6 7.7
AutoNation / AN 8/3 51.34 69.79 35.9 24.6
Caterpillar / CAT 2/24 137.21 182.02 35.7 14.3
Albertsons / ACI 9/21 13.06 17.58 35.5 24.1
Truist Financial / TFC 9/28 36.17 47.93 33.8 14.4
Estée Lauder / EL 8/10 199.99 266.19 33.7 12.8
Liberty Braves Group / BATRK 5/18 18.69 24.88 33.1 58.3
PG&E / PCG 7/27 9.36 12.46 33.1 17.7
Goldman Sachs Group / GS 6/15 201.78 263.71 32.2 24.6
Madison Square Garden Ent. / MSGE 5/4 79.68 105.04 31.8 58.0
Parker-Hannifin / PH 11/2 208.36 272.41 31.2 15.2
Workhorse Group / WKHS 7/27 15.15 19.78 30.6 35.3
SoftBank Group / SFTBY 8/24 29.81 38.66 30.1 11.2
Hartford Financial Services / HIG 6/1 38.29 48.98 29.9 24.6
Take-Two Interactive / TTWO 10/5 160.15 207.79 29.7 12.6
Progressive / PGR 6/15 76.60 98.88 29.4 24.6
Littelfuse / LFUS 11/2 197.94 254.66 28.9 21.7
Liberty Broadband / LBRDK 5/18 122.97 158.37 28.8 32.6
Chubb / CB 6/1 121.94 153.92 28.5 24.6
Brunswick / BC 6/22 60.08 76.24 27.8 30.3
Kraft Heinz / KHC 2/7 29.06 34.66 26.2 14.2
TE Connectivity / TEL 11/2 96.88 121.07 25.5 15.2
CareTrust REIT / CTRE 6/1 18.63 22.18 23.9 42.7
Marriott VacationsWorldwide / VAC 11/6 111.87 137.22 22.7 13.5
Sysco / SYY 6/8 61.59 74.26 22.5 18.7
Apollo Global Management / APO 11/9 41.66 48.98 18.9 7.3
Activision Blizzard / ATVI 10/5 78.30 92.85 18.6 12.6
WyndhamHotels & Resorts / WH 8/24 50.35 59.44 18.4 21.4
MSCI / MSCI 7/20 379.62 446.53 18.1 17.4
Anthem / ANTM 10/30 273.26 321.09 17.8 13.8
Synpatics / SYNA 8/24 82.01 $96.40 17.5% 27.8%
Yelp / YELP 12/28 28.01 32.67 16.6 -1.4
Fortive / FTV 9/28 62.02 (1) 70.82 14.3 14.4
AllianceBernstein Holding / AB 10/12 30.26 33.77 14.2 15.9
Dollar Tree / DLTR 7/20 95.46 108.04 13.2 17.4
Mercury General / MCY 12/14 46.77 52.21 13.0 3.4
Elanco Animal Health / ELAN 9/11 27.23 30.67 12.6 13.0
SSRMining / SSRM 6/8 17.96 20.11 12.0 32.0
Azek / AZEK 11/30 34.32 38.45 12.0 4.7
Cabot Oil & Gas / COG 2/17 14.80 16.28 11.8 12.9
Dollar General / DG 7/20 188.48 210.30 11.8 17.4
Electronic Arts / EA 10/5 129.07 143.60 11.4 12.6
Raytheon Technologies / RTX 4/20 66.07 71.51 10.8 32.3
Madison Sq. Garden Sports / MSGS 5/4 167.55 184.10 9.9 46.6
Zynga / ZNGA 11/2 8.99 9.87 9.8 15.2
Intel / INTC 11/16 45.46 49.82 9.6 5.0
Coca-Cola / KO 10/26 50.52 54.84 9.4 8.7
Cheniere Energy / LNG 2/17 54.98 60.03 9.2 12.9
Regis / RGS 11/30 8.43 9.19 9.0 6.6
MagellanMidstreamPartners / MMP 6/29 41.15 42.44 8.8 25.9
Cheniere Energy Partners /CQP 6/1 33.74 35.25 8.1 24.6
Simon Property Group / SPG 11/23 81.12 85.28 6.8 5.8
TaylorMorrison Home / TMHC 8/31 24.29 25.65 5.6 19.1
Ping An Insurance / 2318.Hong Kong 2 1/2 HK$93.65 HK$95.00 4.9 17.4
Comcast / CMCSA 12/21 $50.90 $52.40 2.9 1.9
BlackRock / BLK 12/7 703.47 721.54 2.6 1.6
Dropbox / DBX 5/25 21.67 22.19 2.4 37.3
Berkshire Hathaway / BRK.A 2/17 340,223.90 347,815.00 2.2 12.9
Pool Corp. / POOL 12/28 364.73 372.50 2.1 1.5
Toll Brothers / TOL 8/31 42.96 43.47 1.4 19.1
Sally Beauty Holdings / SBH 7/6 13.08 13.04 -0.3 38.7
Merck / MRK 8/17 83.48 81.80 -0.5 12.1
Physicians Realty Trust / DOC 10/26 17.91 17.80 -0.6 14.8
Healthcare Realty Trust / HR 10/26 30.18 29.60 -1.0 14.8
Blackbaud / BLKB 7/6 58.64 57.56 -1.8 38.7
CarMax / KMX 8/3 96.97 94.46 -2.6 15.6
Community Healthcare Trust / CHCT10/26 49.07 47.11 -3.1 20.7
FordMotor / F 11/30 9.09 8.79 -3.3 3.4
Nokia / NOK 7/13 4.12 3.91 -5.1 18.8
S&PGlobal / SPGI 7/20 354.69 328.73 -7.0 17.4
eBay / EBAY 10/19 55.83 50.25 -9.7 8.2
Bank of America / BAC 1/13 34.74 30.31 -10.4 17.1
FirstCash / FCFS 2/10 84.95 70.04 -16.2 20.7
AVERAGE: 24.7% 20.4%
1Pre-story price adjusted for Vontier (VNT) spinoff on Oct. 9. 2Prices in local currency; returns in USD.
Kandi Technologies Group / KNDI 11/20 $14.41 $6.90 -51.1% 10.9%
Nikola / NKLA 7/27 29.92 15.26 -49.0 17.7
Wayfair / W 5/18 173.10 225.81 30.5 32.6
Ballard Power Systems / BLDP 7/27 15.81 23.40 48.0 25.5
BloomEnergy / BE 7/27 $16.91 $28.66 69.5% 35.3%
Carvana / CVNA 5/04 $76.00 $239.54 215.2 34.3
Plug Power / PLUG 7/27 8.52 33.91 298.0 35.3
AVERAGE: 80.2% 27.4%
2020REPORTCARD
weighed inon 95 stocksin storiespublished in2020. Here’show thosestocks fared.
BEARISHCALLS:7
BULLISHPICKS:88
Publication Pre-Story 12/31/20 Total BenchmarkCompany / Ticker Date Price Price Return Return
Publication Pre-Story 12/31/20 Total BenchmarkCompany / Ticker Date Price Price Return Return
Publication Pre-Story 12/31/2020 Total BenchmarkCompany / Ticker Date Price Price Return Return
Publication Pre-Story 12/31/2020 Total BenchmarkCompany / Ticker Date Price Price Return Return
Barron’s

18 BARRON’S January 25, 2021
A NEW PODCAST
FOR ADVISORS,BY ADVISORS.
©2020 Dow Jones & Company. All Rights Reserved. 4E215
The Way Forward is available on barrons.com/podcasts. Subscribe
to The Way Forward on Spotify, Apple Podcasts, or your favorite
listening app.
The Way Forward is part of a weekly
series featuring insights from top advisors
and industry standouts on managing
wealth, leading through crisis and
planning for the future.
January 25, 2021 BARRON’S 19
I N C OM E I N V E S T I N G Dividend stocks outpaced the broader marketin 25 of the 41 five-year rolling periodsfrom 1976 through 2020.
6 Dividend Funds forLong-Term Investors
A lthough dividendstocks lagged behindflashier tech stocksduring the pandemiclast year, their “long-term investment caseremains solid.”
So concludes Amy Arnott, a portfo-lio strategist at Morningstar, in a re-cent note. A lot of the mutual fundsthat specialize in these stocks “reallysuffered from not having as much techexposure” as others did, Arnott tellsBarron’s. These equity income funds,Arnott adds, also took a hit, owing tothe many dividend cuts and suspen-sions last year as companies tried topreserve cash.
From Feb. 19 of last year, when themarket peaked at what was then a re-cord high, throughMarch 23, the aver-age stock dividend fund had a returnof minus 36.6%, versus minus 33.5%for the S&P 500 index, according toMorningstar. TheMSCI USAHighDividend Yield Index notched aslightly better result, with a gross re-turn of minus 32.6% over that stretch.
Looking at the full year, the Tech-nology Select Sector SPDR fund(ticker: XLK), a proxy for large tech-nology companies, returned 43.6% in2020, well above the S&P 500’s 18.4%return or the S&P 500DividendAristocrats’ 8.7%.
However, Arnott observes, dividendstocks have acquitted themselves betterduring other challenging periods—per-formance levels they maywell return toin future rough patches. In fact, divi-dend shares outpaced the broader mar-ket in 25 of the 41 five-year rolling peri-ods from 1976 through 2020. But aswith so much else during the pan-demic, 2020was an aberration forthese issues.
“They’ve typically fared best during
periods of slow economic growth andsluggish market returns, such as theearly part of the [2000s] and in the1980s, when stagflation dragged downmarket returns,” Arnott pointed out inher Jan. 11 note.
In contrast, dividend stocks trailedthe broader market throughmuch ofthe 1990s when the tech-stock bubblewas inflating. They “tend to fare worstduring more ebullient times, such as1995-99 and the generally strong periodfrom 2016 through 2020,” she wrote.
Arnott also looked at payout stocks’trailing 20-year returns and volatility,as measured by standard deviation.The MSCI USAHigh Dividend YieldIndex had a 20-year annual return of7.89%, versus 7.49% for the S&P 500.That dividend index also was less vol-atile over that period, with a standarddeviation of 13.23, nearly two percent-age points better than the broadermarket’s 15.08.
“Stocks with above-average divi-dends have generally held up rela-tively well in previous market down-turns,” Arnott wrote, pointing to thefourth quarter of 1987, the early
2000s, and the fourth quarter of 2018as examples.
To supplement Arnott’s observa-tions, Barron’s looked at some of theequity income funds we have writtenabout in recent years.
None of these outperformed theS&P 500 over the past 12 months.Nearly all of them, however, have fin-ished in the top half of their Morning-star category when measured bythree- and five-year returns—andmany have strong performance overeven longer periods, as well.
T. Rowe Price Dividend Growth(PRDGX), which tries to generate in-come and capital appreciation, has aone-year return of 12.3%, ranking sec-ond among the funds included in theaccompanying table.
As of Dec. 31, the portfolio’s topsector weighting was technology at22.2%, followed by health care at16.5%, and financials at 12.8%. Thefund’s top two holdings wereMicro-soft (MSFT), which yields just 1%,andApple (AAPL), which yields amere 0.6%. Nonetheless, Microsofthas returned about 36% over the pastyear, dividends included, and Applehas gained about 67%.
The Columbia Dividend Incomefund (GSFTX) has a one-year returnof 9.2%. A fourth-quarter tailwind forthe fund was an overweight positionin bank stocks ,such as Bank ofAmerica (BAC), which yields 2.2%,and JPMorgan Chase (JPM), 2.7%.
“The segment benefited from thequarter’s rotation into value,” accord-
ing to the fund managers’ commentaryon the company’s website, adding thatbank stocks helped as well.
JPMorgan Equity Income (OI-EIX) had a tougher time, with a returnof 4.8% over the past 12 months, plac-ing it in the middle of the pack amongits peers.
Under longtime leadmanager ClareHart, the portfolio has placed in the tophalf of its Morningstar peer group overthe past three and five years and in thetop 10% over the past 10 and 15 years.“Underperformance was predomi-nantly a function of what we don’t own,rather than what we do,” according toan assessment of the fund’s fourth-quarter performance by Hart and oneof her colleagues, Jamie Steinhardt.
The managers also pointed out thatBest Buy (BBY) andHome Depot(HD) “gave back some of their gains[despite] both companies reportingdouble-digit earnings growth.”
The fund did benefit from financialholdings, such as Bank of America.
Actively managed funds aren’t theonly option for investors. There arevarious ETFs, which typically hew toan index and don’t have a manageractively buying and selling stocks.
TheVanguard Dividend Appre-ciation ETF (VIG) has a one-yearreturn of 13%, tops among the fundsincluded in the table, helped by anultralow expense ratio of 0.06%.
The fund,which tries to track theNasdaqUSDividendAchieversSe-lect Index, recently held 212 stocks,with amedianmarket capitalization ofabout $158 billion, giving it a large-capbent.As ofDec. 31, its biggest sectorweightingwas consumer discretionaryat 22.8%, followedby industrials at20.8%, andhealth care at 14.9%.Tech-nology clocked in at 12.5%—showingthat a dividend stock funddoesn’t needa big tech overweighting to performwellright now.
“The bottom line is that every downmarket is different, and dividend-ori-ented stocks won’t excel in every one,”Arnott’s note concluded. “Overall,though, they tend to hold up a bit bet-ter than average during times of mar-ket turbulence and have generatedattractive risk-adjusted returns overlonger periods.” B
By Lawrence C.Strauss
Beaten but Not BrokenDespite recent underperformance, the long-term case for dividend funds “remains solid,” concludes a recent Morn-ingstar note. The funds included here all have placed in the top half of their peer groups over the past three years.
1-Year Dividend Net ExpenseFund or Index / Ticker Return Yield AUM (bil.) Ratio
Columbia Dividend Income / GSFTX 9.2% 1.7% $28.9 0.69%
Franklin Equity Income / FISEX 6.2 2.2 2.8 0.86
JPMorgan Equity Income / OIEIX 4.8 2.3 37.5 0.98
T. Rowe Price Dividend Growth / PRDGX 12.3 1.1 18.0 0.63
Vanguard Dividend Growth / VDIGX 8.5 1.8 47.4 0.27
Vanguard Dividend Appreciation ETF / VIG 13.0 1.9 53.2 0.06
S&P 500 16.7 1.5 NA NA
Note: Returns as of Jan. 15. NA=Not applicable Sources: Morningstar; Bloomberg; company reports

20 BARRON’S January 25, 2021
*Applies to U.S. exchange-listed stocks, ETFs, and options. A $0.65 per contract fee applies for options trades. TDAmeritrade, Inc., member FINRA/SIPC. © 2020 TDAmeritrade.
A commission-freetrade is only assmart as you are.
Now that commission-free trading is the norm, it’s time to rethink howwe define value. That’s why, alongwith $0 online equity commissions,* we offer personalized education to sharpen your skills, a trader supportteam trained to answer any question, and powerful charting and analysis capabilities on thinkorswim®.
Bottom line: real value comes from everything TDAmeritrade offers tomake you an even smarter trader.
Discover true value at tdameritrade.com/value
January 25, 2021 BARRON’S 21
T H E E C O N OMY The level of federal debt has soared by roughly$15 trillion since the end of 2008, but Americans’total indebtedness has stayed basically flat.
Why Biden Shouldn’tLet the Federal DebtDeter Spending Spree
P resident Joe Biden takesoffice at a time of mo-mentous opportunity.With vaccinationsunder way and moremoney heading intoAmericans’ pockets, the
U.S. economy is set up to boom in thenext few years, potentially boosted bypandemic-induced productivity gains.
But America also faces significantchallenges in the decade ahead—whether it’s shifting to renewable-energy resources to reduce carbonemissions, reviving the manufacturingbase, or confronting an increasinglyaggressive China—and meeting themwill probably require substantial pub-lic investment.
Trillions of dollars of additionalgovernment spending will probably beneeded. And Congress and the Bidenadministration should do everythingthey can to address those challenges,even if it means adding trillions moreto the U.S.’s $21 trillion debt load.
Yes, those eager to object to the newpresident’s agenda are correct that theratio of debt to national income is al-ready higher than at any point sinceWorldWar II. But that’s not an argu-ment against spending much more.
Instead, there are two compellingreasons to deficit-spend at a vast scale.First, market signals suggest that pub-lic borrowing has been far too low tomeet the private sector’s needs for along time, which means that addi-tional federal debt would be helpfulfor savers both at home and abroad.Current spending plans don’t seem tobe altering this basic reality. Second,investments that boost growth—
whether in infrastructure, pollutioncontrol, scientific research, education,or public health—effectively pay forthemselves. A richer society can af-ford to carry more debt.
While the level of federal debt hassoared by some $15 trillion since theend of 2008, Americans’ total indebt-edness has not—even with the pan-demic. Rising government borrowinghas been offset by a much larger econ-omy and by lower levels of privatedebt. Thus, while the ratio of federaldebt to gross domestic product hasrisen from about 50% to over 100%,the ratio of private debt has droppedfrom about 290% to about 240% overthe same period, leaving overall indebt-edness roughly unchanged.
This is why the massive increase in
the federal government’s debt hasn’tcoincided with an increase in interestrates. Instead, interest rates havefallen precipitously because publicborrowing hasn’t been sufficient tomeet the income and savings needsof households and businesses.
If the government was spending toomuch money into the economy rela-tive to how much it was taking outwith taxes, the difference would showup in wide-ranging price increases ofconsumer goods and services. Thathasn’t happened so far, and in factFederal Reserve officials have beenfrustrated for years by inflation thathas been below target.
Similarly, if the Biden administra-tion’s plans for borrowing and spend-ing were excessive, inflation-sensitiveassets’ prices would adjust in anticipa-tion. But sophisticated investors don’tseem worried about inflation at all,even if they are less concerned aboutdeflation than they were back inMarch.
The prices of most commodities—including copper, silver, oil, wheat, andcotton—remain far lower than 10 yearsago. And the prices of inflation optionsimply only a 1-in-5 chance that theconsumer price index will rise morethan 3% each year over the next fiveyears, on average, and only a 10%chance that prices will rise more than
3.4% each year. Those implied oddsare far lower than the implied odds in2012, and about the same as in 2017-18.
The persistent weakness of infla-tion explains why the Fed and othercentral banks around the world havefelt compelled to lower interest ratessince the late 1980s in an attempt tostoke private borrowing and spending.That in turn explains why the federalgovernment is spending far less ondebt service now than it was 30 yearsago—even though the debt level is somuch higher now. It all suggests thereis a great deal of scope to borrow andspend more money without harmingthe economy.
On top of all this, borrowing andspending on the right things shouldalso increase the economy’s productivecapacity, which would make everyonebetter off and further reduce the riskof excessive consumer price increases.
Consider that in August 2007—just before the global financial crisis—economists at the CongressionalBudget Office expected that the U.S.economy could sustainably grow about2.6% each year, at least through the endof 2017. Had that happened, the U.S.economy would have been 12% biggerthan it was. That gap represents a tre-mendous loss of income and wealth.
Rather than acknowledge the mag-nitude of the financial crisis, though,the CBO concluded that its pre-crisisforecast was simply too optimistic. Fornearly a decade, the CBO continuouslydowngraded its estimate of the Ameri-can economy’s potential—until theTrump administration and Congressignored the estimates and decided tocut taxes and boost spending.
The resulting uptick in investmentwas modest, but it was enough that, bythe eve of the pandemic, the CBO hadconcluded that the U.S. had more roomto grow than it had previously be-lieved. The accelerating economy low-ered total U.S. indebtedness from theend of 2016 to the end of 2019 even asthe federal budget deficit rose.
Already, the CBO is forecasting apermanent loss in income due to thecoronavirus. That would be a disaster,but the upshot for the new adminis-tration is that it can be preventedwith enough money and focus now. B
Debt PerspectivesThe interest costs on federal government debt are well below the peak years in the 1980s and 1990s,while overall national indebtedness has remained flat thanks to private deleveraging, even after a surgein federal borrowing to combat the financial crisis and pandemic.
Sources: Federal Reserve Board; Bureau of Economic Analysis; Barron’s calculations
Federal government net interest paymentsrelative to gross domestic product
U.S. debts as a share of national income
5%
4
400%
300
200
300
0
3
2
1
0
1930 ’40 ’50 ’60 ’70 ’80 ’90 2000 ’10 ’20 1952 ’60 ’70 ’80 ’90 2000 ’10 ’20
Paul Volcker becomesFed chairman
U.S. enters WW II
Private nonfinantial sectors
Domestic finantial sectors
Federal government
By Matthew C.Klein
22 BARRON’S January 25, 2021
Company / Ticker Price 1/8/21
Snam / SRG.Italy €4.65
Munich Re / MUV2.Germany 242.60
Telefônica Brasil / VIV $8.36
Philip Morris International / PM 83.09
Microsoft / MSFT 219.62
Rupal J. Bhansali’s Picks
Source: Bloomberg

January 25, 2021 BARRON’S 23
2021BARRON’SROUNDTABLEWEEK 2
28 PICKSTO BEATTHE MARKET
Rupal J. Bhansali, Scott Black,Mario Gabelli, and Sonal Desaishare their top investment ideas
ByLAUREN R. RUBLIN
Illustrations by HELEN GREEN

24 BARRON’S January 25, 2021
2021 RoundtablePanelists
Todd AhlstenCIO and lead portfolio manager,Parnassus Core Equity
Parnassus Investments
San Francisco
Sonal DesaiCIO and portfolio manager
Franklin Templeton Fixed Income
San Mateo, Calif.
James AndersonPartner and head of Global Equities
Baillie Gifford
Edinburgh
Henry EllenbogenCIO and managing partner
Durable Capital Partners
Chevy Chase, Md.
Rupal J. BhansaliCIO and portfolio managerInternational & Global Equities
Ariel Investments
New York
Mario GabelliChairman and CEO
Gamco Investors
Greenwich, Conn.
Scott BlackFounder and president
Delphi Management
Boston
William PriestExecutive chairman and co-CIO
Epoch Investment Partners
New York
Abby Joseph CohenAdvisory director and seniorinvestment strategist
Goldman Sachs
New York
Meryl WitmerGeneral partner
Eagle Capital Partners
New York
In America, it was a week of momen-tous change, as one president’s termended and another’s began. But onWall Street, it was business as usual:The stock market hit another high,and the biggest tech stocks continuedto soar. Small wonder that manyinvestors now decry a dearth ofbargains—except for those who stillthink Tesla is cheap at 200 timesearnings, and those who know howto spot genuine deals.
The members of the Barron’s Round-table belong to the second group, asyou’ll see from this week’s Roundtableinstallment, which highlights 28 invest-ment recommendations from Rupal J.Bhansali, of Ariel Investments; ScottBlack, of Delphi Management; MarioGabelli, the boss at Gamco Investors;and Sonal Desai, chief investmentofficer of Franklin Templeton FixedIncome. Their picks range from thefamiliar—likeMicrosoft (ticker:MSFT) andNorthrop Grumman(NOC)—to the obscure—Hyster-YaleMaterials Handling (HY), anyone?But all of them share several character-istics: They trade at relatively cheapvaluations, and could be worth more,maybe muchmore, as operations andbusiness conditions improve. Thatmany sport tantalizing yields onlymakes themmore inviting.
When this year’s Roundtable meton Jan. 11 and Jan. 12 on Zoom, our 10panelists forecast a snappy reboundfor the U.S. economy after last year’sgrim, pandemic-fueled recession. Butthe group, whose big-picture viewswere featured in last week’s issue,predicted merely muted gains for thebroad market, not to mention bonds,given 2020’s exuberant rally andthe past 11 years’ cumulative gains.(Could that explain the profusion oftulips on Mario’s desk?)
Read on for an edited version of thestock- and bond-picking conversation.In next week’s final Roundtable pack-age, you’ll hear from the rest of oursavvy crew.
Barron’s: Rupal, what investmentideas have you brought us today?Rupal Bhansali: Given my negativemarket outlook, I believe we need tobe much more defensive in our in-vestment exposure this year. Divi-dend yields will become a biggersource of total returns in the stockmarket, especially given the low levelof interest rates and bond yields. Youcan find stocks today that yield morethan high-yield bonds—and dividendyields can grow, whereas fixed-in-come yields can’t.
I have five picks. All are uncorre-lated with the broad stock market. Nordo I want a single theme cascadingthrough my holdings, because then itbecomes a binary bet.
I mentioned the attractiveness ofEuropean stocks this morning. My firstpick is Snam [SRG.Italy], a utility thatisn’t well known in the U.S. Utilitystocks have done well here as incomeproxies. That isn’t the case interna-tionally. Snam is a regulated gas-transmission utility based in Italy,which is increasingly becoming thegas-storage and transmission hub ofEurope. Historically, Europe has pro-cured most of its gas from Russia, butits dependence on Russia has been asource of concern. Snam is the solu-tion. Snam needs to invest billions ofeuros to create a gas-pipeline infra-structure, so a low-single digit rate ofrevenue growth is assured. Returns onthis investment spend are also guaran-teed, because it is a regulated utility.Despite these attributes, there is agrowing concern that the businessof transporting gas is going to be up-ended by renewable energy. I believethis overhang is unwarranted.
Renewable energy is an incrementalsource of energy, but it won’t replacegas-fired power plants anytime soon.Could gas transmission become astranded asset 25 years from now?Possibly, but it is premature to thinkabout pricing that in now. In fact, gaspipelines are being constructed in away that will enable them to be retro-fitted to transport hydrogen, the next-generation renewable energy source.
What does Snam trade for?Bhansali:The stock has been tradingaround 4.60 euros. [Snam also tradesin the U.S. under the ticker SNMRY.] Ithas a price/earnings multiple in the lowteens, with a dividend yield of 5.5%.The company has a higher level of debtcompared to my other picks, but be-cause it is a regulated utility, its debt is
highly rated. I see the stock as more ofa single or double than a home run. Itprovides ballast in turbulent times andoffers steady income with steadygrowth.
I like companies with strong bal-ance sheets and an outlook deter-mined more by self-help than quanti-tative easing, stimulus spending, taxrates, or other macroeconomic trends,or the coming of a Covid vaccine. Iwant to have a portfolio that will per-form, no matter what. My second ideain Europe isMunich Re [MUV2.Ger-many], one of the world’s leading rein-surance companies. It is well capital-ized, with a solvency ratio of 200%.One thing people haven’t realized isthat the reinsurance industry is a bigbeneficiary of climate change. One ofthe biggest adverse impacts of climatechange is the increase in natural catas-trophes, which reinsurance compa-nies tend to reinsure. In the first 50years of the 20th century, the worldhad, on average, about 20 natural ca-tastrophes a year. In the past 10 to 20years, we’ve been averaging about 300to 350 natural catastrophes a year. Notonly is the frequency rising, but theseverity is far greater.
The reinsurance market is oligopo-listic, with few players. From time totime, new entrants dabble in the mar-ket via sidecars, thinking it is a low- tono-risk investment, but last year, theylost their shirts as unexpected lossesmounted. That will reduce the appe-tite for new entrants, so the incum-bents are likely to be writing most ofthe business.
Munich Re is one of the most pru-dent, conservative underwriters inthe world. It tends to have good loss-reserve ratios. Investors get exposure toan industry with both secular and cy-clical tailwinds, as the market typicallyhardens [premiums rise as reinsurancedemand exceeds supply] after a big lossyear like 2020. Should interest rates goup—and I’m not predicting they will,but that looks to be the tendency—thatis an added bonus for the company’sinvestment returns. Munich Re has a4% dividend yield, lower than some ofmy other ideas. If the market has a 10%to 20% pullback, I would look to aver-age down [buymore at lower prices].At a recent price of €242, the stock is agood value. And, it is uncorrelated withmy other stock picks.
What is your next idea?Bhansali: Telecom is one of my favor-ite sectors. Perhaps you’ve heard me
IJanuary 25, 2021 BARRON’S 25
call telecom companies the new con-sumer staples. I was intrigued by BillPriest’s T-Mobile US [TMUS] recom-mendation [in 2021’s first Roundtableinstallment], but T-Mobile’s balancesheet scares me. The company has alot of debt. I am recommending a dif-ferent telecom—one with a far stron-ger balance sheet, in a country thathas also seen consolidation of its tele-com market. The country is Brazil,and the company is Telefônica Bra-sil [VIV], the leading player in Brazil’swireless market, with 77 million sub-scribers and about a 32% marketshare. Brazil’s telecom sector is goingthrough an in-market consolidation,which is beneficial in any industrywith high fixed costs, where scale isan advantage.
More important, Brazil’s regula-tory framework is improving. Regu-lators have taken an enlightenedview: If you create too much competi-tion and don’t allow incumbents tomake money, it prevents them frominvesting. Through a merger, fourplayers will be reduced to three. Reg-ulators also have allowed the top twoplayers—TIM Brasil, a subsidiary ofTelecom Italia [TIT.Italy], and Vivo,Telefônica Brasil’s wireless unit—toshare networks, which enables themto reduce capital spending.
Telefônica Brasil has an AAA-ratedbalance sheet, remarkable in a worldwhere companies are gorging on debt.The headline dividend yield screens atonly 1% to 2%, but Brasil confers a taxadvantage on what it calls a return oncapital, which is a dividend, as wewould understand it. As a conse-quence, the effective yield is 7.5%.Finally, in my view, the Brazilian realis undervalued. As I said this morn-ing, the dollar is more likely to depre-ciate, and international currencies aremore likely to appreciate. For a dollar-based investor, owning a nondollar-denominated asset like TelefônicaBrasil could enable you to makemoney in two ways: capital apprecia-tion and currency appreciation.
Bill, are you worried aboutT-Mobile’s debt?William Priest: T-Mobile has a lot ofdebt stemming from its acquisition ofSprint. But significant cost savings willcome out of this merger. T-Mobile alsohas a pricing advantage as we get intothe deployment of 5G opportunities.The debt is high, but I don’t expectthat paying it down will be a problem.Bhansali:My next stock is controver-
sial and may not play well from aheadline basis, but is an example of aninvestment opportunity that couldprovide idiosyncratic alpha [excessreturn, relative to the broad stock mar-ket]. The stock is Philip Morris In-ternational [PM], the internationalarm of the old Philip Morris, whichsplit into the U.S. arm,Altria Group[MO], and Philip Morris International,run out of Switzerland.
Everyone views nicotine as harm-ful, but it isn’t harmful in and of itself.It causes harm when you burn it—thatis, light a cigarette. I am not condon-ing smoking, but there are more thanone billion chain smokers in the worldtoday, and they need help in reducingthe adverse effects on their healthfrom smoking.
In years past, pharmaceutical com-panies came up with nicotine patches
Company / Ticker Price 1/8/21
AdvanSix / ASIX $22.11
Kimball Electronics / KE 17.11
Westlake Chemical Partners / WLKP 21.99
D.R. Horton / DHI 66.96
Magna International / MGA 75.85
Northrop Grumman / NOC 288.33
Scott Black’s Picks
Source: BloombergCourtesyofNorthropGrumman

26 BARRON’S January 25, 2021
and gum to help such smokers stopsmoking. These products were evenapproved by the Food and Drug Ad-ministration, but failed to gain marketacceptance because they didn’t delivera similar experience to smoking.Philip Morris International has comeup with a product called IQOS—anelectronic device that heats tobaccojust enough to release nicotine vapors,but not enough to burn the tobacco.The letters are thought to stand forI quit original smoking.
PhilipMorris has converted about 10million smokers to IQOS. The companyspent more than $6 billion on researchand development and clinical trials forthe product, and leading health-carebodies around the world have approvedit as lowering the risk of consumingnicotine. In fact, clinical data show adramatic reduction of risk of 90%-plus,a game changer for chain smokers.
Sales fell last year because of Covid,but we expect them to pick up again.By 2025, Philip Morris hopes to gener-ate 40% of its revenue from IQOS.Weexpect the company to earn $10 billionto $11 billion this year, and it will dis-tribute the majority of its earnings individends. The stock yields about5.5%, and the P/E multiple is around15. Admittedly, this isn’t a mainstreaminvestment idea, as tobacco stocks areconsidered sin stocks, but I believewe’re better off encouraging compa-nies to invent a product that signifi-cantly lowers the risk of consumingnicotine and secondhand smoke.
Can Philip Morris sell IQOS di-rectly in the U.S., or must it sellthe product through Altria?Bhansali: It has a distribution ar-rangement in the U.S. with Altria, butthe vast majority of the opportunity isin international markets, where it sellsdirectly. Japan is one of its biggest andmost successful markets for IQOS.Priest: China has always had an issuewith foreign-based tobacco compa-nies. Is that a problem for IQOS? Sec-ondly, what do people who use IQOSlike about the product, other than thefact that it’s healthier than smoking?Bhansali: China’s tobacco market is anational monopoly. The governmentowns it, so the market isn’t open forprivate companies. But there is a largeopportunity outside China. As forIQOS users, unlike nicotine patches orgums, this product gives them an ap-proximate sensation of smoking. Thatis why adoption has been high.
I try to discuss stocks that readers
might not know. Meanwhile, Micro-soft has been sitting right under mynose. We have owned the stock foralmost a decade. It is the poster childfor everything right with technologycompanies, whether it’s SaaS [soft-ware as a service] business models orproductivity enhancement. You mightwonder what is left to squeeze out ofthis name after a near-tenfold increasein market value in the past nine years.A number of things aren’t yet fullypriced into the stock.
Microsoft is trading for roughly 25times June 2023 earnings. The com-pany nets more than $50 billion ofprofit every year, and earnings cangrow by double digits in coming years.The biggest opportunity is Azure, Mi-crosoft’s hybrid public/private cloudservice. AmazonWeb Services, in con-trast, operates only a public cloud. Formost large companies, particularly infinancial services and health care, dataprivacy is very important, and it is go-ing to become even more so. In order tohave control over data, sometimes evenphysical control in a particular juris-diction, you need to have a privatecloud. Microsoft’s Azure is the onlyscaled player that offers a private anda public cloud.While Azure has doneextremely well, it is probably in thethird inning of a nine-inning story.
What else isn’t priced in?Bhansali:Another vector of opportu-nity is videogaming. Microsoft ownsXbox, which has overtaken Sony’s[SNE] PlayStation in popularity. Now,Microsoft is on its way to becoming theNetflix [NFLX] of gaming. Just as westreammedia content, Microsoft‘sxCloud will stream videogames. Thenext generation of games won’t requireconsoles. Gamers want subscription-based streaming models becausegames are quite expensive. Microsofthas a library of games and produces itsown content. What’s more,Nintendo[NTDOY] and PlayStation have agreedto let their games be hosted onMicro-soft’s xCloud, so it is likely to becomethe dominant platform for consumers.
Microsoft 365 (which includes Office365 andWindows 10) is yet anothergrowth vector. Office 365 has a lot oftraction, as we all use Outlook, Power-Point,Word, and Excel. ButWindows,the underlying operating system, hasn’tyet seen the same traction and growthrate. Again, the best is yet to come.
So far, Salesforce.com [CRM]has been the unchallenged leader incustomer-relationship management
software. But Microsoft is beefing upits own CRM business, Microsoft Dy-namics 365. In most businesses, Micro-soft hasn’t been first to the party, but itcatches up rapidly. I expect that to hap-pen in the CRM space. Dynamics 365is a plug-and-play module that worksmuch faster and seamlessly out of thegate than alternatives. It is anotheropportunity that isn’t well understood.
Finally, [Microsoft’s] LinkedIn is theonly B2B [business to business] socialnetwork, and that means advertiserscan domicrotargeting, which is ex-tremely valuable.While the user en-gagementmight not seem likemuch,LinkedIn is coming up on a billion us-ers. Today, graduating students fromanywalk of life make sure their profilegoes on LinkedIn. This marks an inflec-tion point, and speaks to the power ofthe platform in the professional world.Priest:We have a large holding inMicrosoft, but three things concernme. They have a latency problem withtheir cloud. AWS has a faster cloud. Inthe gaming world, Fortnite is going todominate. And, Salesforce.com re-cently purchased Slack and plans toestablish its own rival to MicrosoftTeams. It seems some things are mov-ing away fromMicrosoft.Bhansali: The public cloud is fasterbecause it doesn’t have the same secu-rity firewalls as the private cloud.More controls mean that it will takeslightly longer to access data. Regard-ing Teams, it’s the incumbent tool,so Salesforce is unlikely to upend it.And, yes, Fortnite is a spectacularsuccess story, but it was played on the
Xbox and will be played on Micro-soft’s streaming platform.
Microsoft is a $1.7 trillion-in-mar-ket-cap company. Can videogamesreally move the needle at this point?Bhansali: I gave you several growthdrivers, not just one. Sometimes, wethink of trillion-dollar companies asbeing mature and devoid of opportuni-ties. All of these are blockbuster oppor-tunities. And, unlike the Teslas [TSLA]of the market, Microsoft sells for a rela-tively modest multiple of future earn-ings, and has net cash on its balancesheet and recurring revenue streams.We spent a lot of time this morningdiscussing the economic outlook forincreased productivity. Microsoft’s goalis to improve the productivity of enter-prises and their employees.
You recommended ChinaMobile[CHL] at several past Roundtables.The Trump administration put thecompany on its sanctions list be-cause of its ties to China’s military.What should investors do now?Bhansali:My fundamental bullish viewon ChinaMobile’s business prospectsand undervalued stock hasn’t changed,but it’s an academic question now thatthe U.S. government has issued an exec-utive order that prevents U.S. personsfrom buying the stock after Jan. 11, 2021,and compels them to sell any existingholdings byNov. 11, 2021. Obviously, wewill abide by the law.
Thank you, Rupal. Scott, you’re next.Scott Black:We look for companieslikely to have rising sales and earningsthis year, strong balance sheets, andsustainable cash positions, and thatgenerate free cash flow. As valueinvestors, we like low P/E ratios.I build my own earnings models.
My first pick isAdvanSix [ASIX],a chemical company spun out ofHoneywell International [HON] inOctober 2016. It has three manufactur-ing sites in the U.S. AdvanSix makesan array of chemicals and ammoniumsulfate fertilizer. It could generateabout $1.23 billion of revenue this year,up 11%. Pretax income will be about$81 million. Taxed at 25%, that’s $60.8million in net income, or $2.16 a share.The stock trades for $22.11, or 10.2times expected earnings and 1.47 timesbook value. The market cap is only$621 million. There is no dividend.Return on equity is about 13%; returnon total capital, 9%.
We estimate that AdvanSix will gen-
“Microsoft owns Xbox,which has overtaken Sony’sPlayStation in popularity.Now, Microsoft is on its wayto becoming the Netflixof gaming. Just as we streammedia content, Microsoft‘sxCloud will streamvideogames.”Rupal J. Bhansali
January 25, 2021 BARRON’S 27
erate free cash flow of about $46 mil-lion this year. It has roughly $313 mil-lion of debt, and another $112 million inlines of credit. Net debt to Ebitda [earn-ings before interest, taxes, depreciation,and amortization] is 3.1 times, but theyare targeting a 2.5 ratio.
AdvanSix’s main addressable mar-ket is building and construction. Thenext-biggest market is fertilizer, and thethird is acetone, used in paints andadhesives in the auto industry. Thecompany has strong internal cost con-trols, and creates a formal five-yearstrategic plan to address strengths,weaknesses, opportunities, and threats.This isn’t a glamorous industry. Thecompany isn’t a disruptor. But it hasrising earnings and a cheap stock.
We can’t argue with that.Black: We own a lot of technologycompanies, but many stocks havegone up sharply. Kimball Electron-ics [KE] is under the radar. The stockis $17.11, and the market cap is $433million, with no dividend. Kimball isa global provider of electronic manu-facturing services. It offers engineer-ing and supply-chain support for theautomotive, medical, industrial, andpublic-safety markets. It also makesnonelectrical components. The com-pany has a June fiscal year. We expectrevenue to grow 8% this year, to $1.3billion, yielding operating income of$58 million to $61 million. Interestexpense is only $3.3 million. We seepretax income of $54.8 million to$57.8 million, and $1.77 to $1.87 inearnings per share, with the midpointat $1.82. On a calendar-year basis,Kimball could earn $1.95, giving thestock an 8.8 P/E multiple, and a mul-tiple of 1.08 times book value. Thecompany will earn an 11.5% returnon equity, and has almost no debt.Free cash flow could total $35 millionthis year.
The revenue mix is about 38% auto-mobiles, 33%medical, 23% industrial,and 6% other. Philips [PHG] accountsfor 16% of revenue, andMichigan-basedNexteer Automotive Group[1316.Hong Kong], 14%. The businessis sticky; 30 customers account foralmost 80% of revenue, and have beencustomers for more than 10 years.Kimball has 11 manufacturing facilitiesaround the world.
Next,Westlake Chemical Part-ners [WLKP] will appeal to investorslooking for yield. It was spun out ofWestlake Chemical [WLK] in 2014.It trades for $21.99, and the market
cap is $774 million. Westlake is a lim-ited partnership. It pays an annualdividend of $1.89, for an 8.6% yield.The company has production capacityof 3.72 million pounds of ethylene. Itprovides ethylene to Westlake Chemi-cal. It is guaranteed a certain price,regardless of the price of its feedstockor the market price for the chemical.
We expect Westlake to have $1.25billion in revenue this year, and oper-ating income of $347 million. Interestexpense will be $10 million; the debtis owed to the parent company, whichstill owns 77.2% of the partnership.Earnings available to other sharehold-ers, like me, will total $77 million, or$2.19 a share, up from $1.97 for 2020.Return on equity is an impressive27%. Westlake Chemical Partners istrading for 10 times expected earn-ings. Investors needn’t worry aboutthe solvency of Westlake Chemical,which takes 100% of the partnership’soutput. It will have about $8.2 billionof revenue this year, and $3.25 a sharein earnings. It has a low net debt-to-
equity ratio of 0.37. To summarize,Westlake Chemical Partners offersa rich yield. It has a strong balancesheet and a deep-pocketed parent, andthe potential for capital appreciation.
Do you expect small-caps, ingeneral, to rebound this year?Last year was great for large-caps.Black: Contrary to what peoplethought, small- and mid-cap growthstocks outperformed the S&P 500 lastyear. The Russell 2000 Growth indexreturned 34.6%; the Russell 2500Growth index returned 40.5%. Thatcompares with the S&P’s total returnof 18.4%. The multiples on the growthindexes are astronomical: The Russell2000 Growth trades for 34 times for-ward earnings and 2500 Growth is at38.5 times forward earnings. The S&P500 has a P/E of 23.
My next pick, home builderD.R.Horton [DHI], has a market capital-ization of $24.4 billion. The stockclosed on Friday [Jan. 8] at $66.96.Horton pays an annual dividend of 80cents a share and yields 1.2%. The com-pany is based in Arlington, Texas, andis the largest home builder in the U.S.In fiscal 2020, it delivered 65,388 newhomes, and has guided for 77,000 to80,000 this year. My earnings modelis based on the midpoint: 78,500. Theiraverage home price last year was$299,100. Assuming 3% price inflation,we see $24.19 billion of home-buildingrevenue this fiscal year, ending in Sep-tember.With financial services, totalrevenue will come to nearly $25 billion.We calculate pretax profit at $3.8 bil-lion, up from $3 billion last year, basedon more homes built, operating lever-age, and higher gross margins. Hortoncould net $2.92 billion, or $8.01 a share.Return on equity should be about22.4%. Net debt to equity is only 10%.Horton generated $1.13 billion in freecash last fiscal year.
With mortgage rates as low as2.87%, Horton has the wind at itsback. The Horton brand, designed formove-up buyers, accounts for 66% ofrevenue. Express, for entry-level buy-ers, contributes 28%. Emerald, forhigh-end buyers, is 3%, as is Freedom,which targets downsizers. Hortonoperates in 88 markets in 29 states,and is No. 1, 2, or 3 in most of its mar-kets. The company knows, down tothe individual house, how profitableit is. It wants to grow revenue by 10%to 15% per annum for the next threeto five years, with earnings growing atan even faster rate. You’re paying 8.4
Company / Ticker Price 1/8/21
NextEra Energy Partners / NEP $79.76
Avangrid / AGR 46.97
GCP Applied Technologies / GCP 25.47
Hyster-Yale Materials Handling / HY 65.98
Deutsche Telekom / DTE.Germany €15.20
Genuine Parts / GPC $103.34
Madison Square Garden Sports / MSGS 182.54
Liberty Braves Group / BATRA 26.25
Fox / FOX 29.62
Sinclair Broadcast Group / SBGI 32.49
GAN / GAN 21.71
Mario Gabelli’s Picks
Source: Bloomberg
28 BARRON’S January 25, 2021
times earnings for a company thatearns well over 20% on book value.Horton has a five-year inventory oflots; it owns 30% outright and hasa call option on the other 70%.
Have you another pick, Scott?Black:Magna International [MGA]trades for $75.85. It has a $23.7 billionmarket cap and pays a dividend of $1.60a share, yielding 2.1%. It is the third-largest auto original equipment manu-facturer, or OEM, in the world. It hasfour divisions: Body exteriors andstructures accounts for 42% of revenue,power and vision is 29%, seating is14%, and complete vehicles is the rest.I estimate revenue of $38 billion thisyear, and Ebit [earnings before interestand taxes] of $2.85 billion.We get pre-tax profits of $2.75 billion, and net in-come of $2.02 billion, or $6.75 a share.Return on equity is 18%, and the P/E is11.2.We expect Magna to generate $1.5billion to $2 billion of free cash flowthis year.
Magna doesn’t see the growth ofelectric vehicles as a big threat to itsbusiness because the power-train por-tion of traditional vehicles is under10% of revenue. The company workswith EV companies, although notwith Tesla. Its customer roster hasbeen steady in recent years, with Gen-eral Motors [GM] contributing 15%of revenue; FordMotor [F], 13%; andBMW [BMW.Germany], 14%.
Auto companies expect OEMs tocut their prices by 1% to 3% a year,and Magna complies, but has toimprove its manufacturing efficien-cies to compensate.Bhansali: IfApple [AAPL] movesinto the EV industry, as seems likely,this could be an opportunity forMagna.Black: I agree. So far, it appears thatApple will team up withHyundaiMotor [005380.Korea].
My last recommendation is Nor-throp Grumman. The stock is tradingfor $288.33, and the market cap is $48billion—big for Delphi. The companypays a $5.80 dividend, for a yield of2%. Northrop is a major aerospace anddefense manufacturer, based in FallsChurch, Va. Its core competencies arestrategic deterrence, stealth, and cyber.The company has four divisions: Aero-nautics is 32% of revenue; defense sys-tems, 20%; mission systems, 28%; andspace, 24%. Among their major pro-grams is Skyborg, which combines AIintegration with UAV [unmanned aer-ial vehicle] combat systems, and
the ground-based strategic deterrent,which will replace the Minuteman IIIprogram, an intercontinental ballisticmissile system.
For last year, Northrop should post$35.85 billion of revenue. That’s afterthe planned sale of its federal IT andmission-support services business for$3.4 billion. After deducting interestexpense of $590million and adjustingfor other items, we get pretax profits of
$4.69 billion to $4.83 billion. Taxed at16.5%, that’s net income of $3.92 billionto $4.03 billion, or about $24.50 ashare. Return on equity is 33.4%, andreturn on total capital, about 18.5%. At11.8 times expected earnings, this stockis dirt cheap. Northrop generates morethan $2.5 billion of free cash flow, yearafter year, and this year it could exceed$3 billion.
The U.S. government accounts for
Fund / Ticker Price 1/8/21
Matthews Asia Growth / MPACX $41.25
SPDR Gold Shares / GLD 173.34
Payden Emerging Markets Bond / PYEWX 13.83
Franklin High Income / FVHIX 1.88
Franklin Federal Tax-Free Income / FAFTX 12.31
Franklin High Yield Tax-Free Income / FHYVX 10.44
Sonal Desai’s Picks
Source: Bloomberg

January 25, 2021 BARRON’S 29
ing euro. The stock pays 60 eurocents, for a 3.9% current return.
Switching gears, about 40millionused cars are sold in the U.S. everyyear.Genuine Parts [GPC] sells auto-motive replacement parts under theNAPA brand for the more than one-quarter billion vehicles on the road inthe U.S. and over one billion world-wide. The stock is trading around$100, the market cap is $15 billion, andthe company has $2 billion of debt. Inthe U.S., about 80% of auto-parts salesare for do-it-yourself repairs, and 20%are do-it-for-me. Business was sluggishin 2020 because of the absence of do-it-for-me work. Also, the company’s in-ternational operations have sufferedfrom Covid-related lockdowns.Whenlockdowns end in Europe, and thereis renewed growth in the company’sAustralia/New Zealand operations,demand could surge for auto partsand repairs.
Genuine Parts should have $18billion in revenue this year, with $6billion coming fromMotion Indus-tries, its industrial-parts distributionbusiness. In the next four years, therewill be a surge in cars in the four- toeight-year-old bracket and a cyclicalrecovery at Motion. The companycould earn close to $7 a share by 2023,with earnings growing about 9% ayear thereafter. Unfortunately, theypay a big dividend [$3.16 a share],which I don’t like, because taxes ondividends are likely to rise.
Howwill growing sales of electricvehicles affect Genuine Parts?
83% of revenue, and sales to non-U.S.military services are 15%. The companyhas an $81.3 billion backlog, which rep-resents more than two years of futurerevenue. In themost recent quarter, thebook-to-bill ratio was 2.2. Northropoffers stability and earnings growth,and it is focused on areas that are a pri-ority of the U.S. Department of Defense.
Thanks, Scott. Mario, are youready to share your ideas?Mario Gabelli:Yes. I’m going to talkabout clusters of stocks. One theme is“love our planet,” or companies focusedon climate change and sustainability. I’llecho Bill’s recommendation [in the firstRoundtable installment] ofNextEraEnergy Partners [NEP]. James Robo[the chairman and CEO] has done afabulous job of creating that investmentvehicle, or “yieldco,” which develops,owns, and manages onshore wind andsolar projects. The stock trades for $80;there are 175 million shares, including60% owned byNextEra Energy[NEE]. The entire environmental eco-system is going to get enormous atten-tion from investors. NEP is expectedto grow its $2.38-per-share annualdistribution to $4.15 by year-end 2024.
Avangrid [AGR], an energy andutility company, is another love-the-planet play. It trades for $47, andhas 309 million shares; Iberdrola[IBE.Spain], the Spanish utility andanother of my favorite stocks, owns260 million shares. Avangrid an-nounced in October that it plans toacquire PNM Resources [PNM],which we also own. Iberdrola under-stands the renewables world and iswell positioned in the U.S. I have sug-gested that the company spin out aportion of Avangrid’s renewablesbusiness as a yieldco, similar to Next-Era Energy’s spinout of NextEraEnergy Partners, and thereby createa higher valuation. The PNM dealwill add significantly to Avangrid’srevenue and Ebitda, and you’ll get adecent dividend. Avangrid’s currentreturn is 3.85%.
Our revenue estimate for 2022, in-cluding PNM, is $8.9 billion, and ourearnings-per-share estimate is $2.60,after allowing for the sale of shares tofinance the PNM acquisition.
What else do you like?Gabelli: GCP Applied Technolo-gies’ [GCP] main product lines arecement and concrete additives. Theyalso have a smaller waterproofing-membrane business, which makes
products used in residential roofing.The company should benefit frominfrastructure spending on roads,bridges, and inland waterways. Thestock sells for $25; there are 73 millionshares, and the market capitalization is$1.8 billion. The company has about$120 million in net cash. GCPwill earn$1 a share on $975 million in revenuein 2022, with chemicals about $555million and building products, $420million. Activist Starboard Value hasadded directors and controls the board.
Infrastructure spending should bol-ster demand for forklift trucks. Hyster-YaleMaterials Handling, based inCleveland, sells forklifts and aftermar-ket parts. The stock sells for $66, andthere are around 16.8million shares,of which 13million are common shares,and 3.9million are Class B shares with10 votes per share. The CEO and hisfamily own 3.3 million, or 85% of theClass B voting shares.
Hyster-Yale will earn $6.10 a sharein two years, up from $2.10 this year.Aside from earnings increases, I aminterested in Hyster-Yale, as it hasspent $200million over the past five orsix years to develop its own hydrogenfuel-cell technology. At the last Hyster-Yale investor meeting, I asked, “Whynot monetize your hydrogen-cell opera-tion?” Since then, Plug Power [PLUG]shares rose from $4 to more than $60in the past year because investors areviewing hydrogen as an alternativeenergy source. Plug sold $1.5 billionof shares to South Korea–based SKGroup, and that stock now has a mar-ket cap of $25 billion. Hyster-Yale ishaving its next investor day inMay.The stock could double in the next twoyears, assuming that Nuvera, the hy-drogen business, becomes profitable.
What else appeals to you?Gabelli: Deutsche Telekom[DTE.Germany] is trading for €15. Ifyou back out the company’s stake inT-Mobile US, and associated debt,you’re getting the German and Euro-pean telecom companies for €3. Theoperating company, ex-TMUS, couldearn 65 euro cents in 2021, going to95 euro cents in 2022. In addition,Deutsche Telekom has the option ofbuying an additional 101.5 millionshares—an additional 8.2% stake—inT-Mobile US from SoftBank Group[9984.Japan]. It is an interesting wayto play the postpandemic recoverystory in Germany and continuedmomentum of T-Mobile US, and youmight get the benefit of an appreciat-
Gabelli: Battery and hybrid electricvehicles should account for about 170million cars in the world by 2030. Atthat time, the automotive populationshould be around 1.4 billion vehicles.They will consume fewer engine partsper car, but the existing base willremain quite fertile for the sale ofreplacement parts.
Finally, I want to put down a lot ofbets on the gaming business. I can playit by owning sports teams, media com-panies, and companies that supply theiGaming infrastructure. Sports teamswill get fees from online gambling,which is growing.Madison SquareGarden Sports [MSGS] sells for about$180 a share. There are 24millionshares; 20million are nonvoting. TheDolan family owns the four millionshares of voting stock. MSGS owns theNewYork Knicks and the NewYorkRangers. At some point, Jimmy [Dolan,MSGS’ executive chairman] has to fig-ure out what he wants to do withMSGS.We believe there would be (andare) buyers for the NewYork Knicks.
I also like Liberty Braves Group[BATRA]. The stock is $25, and thereare 60 million shares outstanding.Liberty Braves, better known as theAtlanta Braves, is controlled by JohnMalone’s Liberty Media through an-other Liberty entity, Formula OneGroup [FWONK]. At some point,Liberty Braves, which is a trackingstock, will be sold. We estimate thatit will go for $45 a share.
Next, Fox [FOX] is $30 a share.[Fox and Barron’s parentNews Corp(NWS) share common ownership.]FOX Bet has a valuable partnershipwith Flutter Entertainment[FLTR.UK], which controls FanDuel, agaming company. Fox also has a sportsnetwork, and owns Fox News. Adver-tising spending on TVwill pick upwith a consumer-led economic recov-ery, and Fox will benefit. Contractswith the NFL and other sports leagueswill be renewed, but at a higher cost.Fox has about 600million shares,including 257 million voting shares.I recommend buying the voting stock,as it sells for about the same price asthe nonvoting shares. Buy the sharesbased on the benefits of online sportsbetting, coupled with a good sports andlocal business. I estimate revenue forthe fiscal year ending on June 30 of$12.4 billion, going to $13 billion infiscal 2022, and earnings per share of$2.45, climbing to $2.65 in fiscal 2022.
Sinclair Broadcast Group [SBGI]is also attractive. Sinclair is selling the
“Madison Square Garden Sportsowns the NewYork Knicks andthe NewYork Rangers. At somepoint, Jimmy [Dolan, MSGS’executive chairman] has tofigure outwhat hewants to dowithMSGS.We believe therewould be (and are) buyersfor the NewYork Knicks.”Mario Gabelli
30 BARRON’S January 25, 2021
naming rights to its regional sportsnetworks, or RSNs, toBally’s [BALY],the gaming company. Sinclair has 75million shares, trading at $32, for amarket cap of $2.5 billion.While debtlooks significant at $12.5 billion, $8billion is nonrecourse and tied to theRSN business. Meanwhile, the RSNbusiness will bounce back, with reve-nue growth from the recovery in thesports-related ecosystem, and they aregoing to enjoy significant cash frombroadcasting. Sinclair has warrantsto buy a significant piece of Bally’s atnominal prices, and the online sports-betting business at Bally’s is doing well.
I estimate revenue for calendar2020 from broadcasting at around$3.3 billion, dropping to $3 billion thisyear, but rising to $3.5 billion in 2022,with Ebitda of $1 billion rising to$1.2 billion in 2022.
Barry Diller’s IAC/InterActive-Corp [IAC] is the largest holderofMGMResorts International[MGM], which is pursuing a bid forEntain [ENT.UK], the owner of Lad-brokes. [On Jan. 19, MGMwithdrew itspreliminary offer to merge with En-tain.]We likeGAN [GAN], a B2B pro-vider of iGaming and sports-bettinginfrastructure and services to sportsbooks like FanDuel andWynnBET.The company came public last May andis trading for $20. There are 38 millionshares. GAN earns a percentage of thegaming revenue that its sports-bookcustomers generate, so its revenuegrows with theirs. We expect GAN tocontinue signing new client engage-ments as more states legalize sportsbetting and iGaming. Eventually, webelieve GANwill be acquired at a sig-nificant premium to its current price.
Thank you,Mario. Sonal, the flooris yours.Sonal Desai: I’ll start with theMat-thewsAsia Growth fund [MPACX].Asia has done a much better job on thevirus front than the rest of the world,so this is a way to capture that recovery.China was the sole major global econ-omy to post positive growth in 2020,and has experienced a largely V-shaperebound in manufacturing and con-sumption. Other Asian countries, suchas Japan and South Korea, are also re-covering steadily, and are beneficiariesof structural growth in new technolo-gies and the diversification of globaltechnology supply chains. Many Asiancompanies have successfully executedduring the pandemic and shouldemerge from the crisis in stronger com-
petitive positions.Weakness in the U.S.dollar will also likely continue to helpAsian equities in the year ahead.
Matthews Asia has almost a third ofits holdings invested in Japan. Last year,I recommended the Japanese yen. Thisyear, I’d rather invest in Asian stocks.
I still think gold is good to hold, soI’m going to recommend the SPDRGold Shares exchange-traded fund[GLD], which I also recommended lastyear. This reflects my strong view thatcommodity prices will do well, inflationis picking up, and the dollar will remainweak. Given these three elements, it isworth holding gold for a while longer.
Gold has been trading around$1,900 an ounce. How high doyou see the gold price going?Desai: I’m not a gold specialist, butI think gold could easily go up to$2,200. I’m not saying it will happenin the next month or two, but produc-tion of gold is quite low right now. Iprefer gold to Bitcoin. Gold is a time-honored store of value.
I also like emerging markets, butyou have to be very careful—not allemerging markets look attractive. Iwill stick with my pick from last year:the Payden Emerging MarketsBond fund [PYEWX]. I like the teammanaging it, and it has an optimal mixof approximately 70% U.S. dollar-denominated debt and 30% local-currency debt. Emerging markets aregiving us yield at a time when yieldis needed. [The Payden fund yields4.42%.] Spread levels over developed-market government bonds shouldcontinue to attract inflows, and inves-tors remain structurally underweightemerging market debt. Not all emerg-ing markets have handled the pan-demic well, but in some cases—suchas India, with its vaccine rollout—they are doing surprisingly well.And many benefit from youngerpopulations, with many no longerimposing lockdown restrictions.
What else should income investorsconsider?Desai: There is very little income to behad within the fixed-income universe,and there is even $17 trillion in nega-tive-yielding global debt. So high-yielddebt should look good to investors,even if valuations aren’t cheap.Webelieve the potential for further spreadtightening, combined with lower dura-tion exposure and the relative yieldpickup, will continue to make high-yield assets attractive in 2021.
The Franklin High Income fund[FVHIX; managed by Franklin Tem-pleton] yields 5.3%. Investors need torecognize that they have to take addi-tional risk if they want that yield, butwith vaccines now available and theeconomic recovery as our base case,that’s a supportive backdrop. The de-fault rate should be manageable, andother issues are further down the road.
The other reason I like high yield isthat it is lower duration. I see Trea-sury yields increasing in the secondhalf of the year, so I prefer to staywith lower duration. In the rest of theworld, especially Europe and Japan,you aren’t likely to see yields rise theway they will in the U.S.
Is there any reason to own a 10-year Treasury note or other long-dated bonds now?Desai: I would not be extending dura-tion anywhere. But some fixed-incomeinvestors are obliged to hold a certainamount of Treasuries. To generate anattractive return, investors must in-crease their level of risk, and they needto reduce duration—thus, high-yieldbonds. Last year, I recommendedinvestment-grade credits. I can’t recom-mend investment-grade at this stage.
The next stimulus bill in the U.S.could include aid to state and localgovernments. Do you see opportu-nities in municipal bonds?Desai:Within my top picks are twomunicipal bond funds: FranklinFederal Tax-Free Income [FAFTX]and Franklin High Yield Tax Free
Income [FHYVX]. Tax-free munisdon’t look particularly attractive, un-less you think tax rates are going to goup. I see that happening later in theyear. High-yield munis could do wellthis year. There is going to be a lot offiscal stimulus. Investment-grade mu-nis are safer than high-yield, but offerless yield. I would recommend bothfunds to capture the tax-free benefits,plus the federal fiscal support. It seemspretty clear the Biden administrationwill give assistance to municipal gov-ernments, and I think it will be sizable.ToddAhlsten: Sonal, I know youexpect inflation to pick up this year.But are you thinking about the possi-bility of a deflationary spiral a fewyears down the road?Desai: It’s a great question. I don’tthink it will happen next year or in thenext several years. Everyone points tothe parallels with Japan, but the U.S.isn’t Japan. U.S. demographics don’teven begin to approximate Japan’s.Consider Korea, China, Germany,Italy—a whole host of other countrieswhose demographics are an order ofmagnitude worse than U.S. demo-graphics. None of them is seeing defla-tion. Demographics in the U.S. don’tsuggest a deflationary spiral.
Creative destruction is very real inthe U.S. Firms go bankrupt. You don’thave zombie companies, as Japan didfor a long time, until productivitygrowth turned things around. So, I’mnot too worried about the Japanifica-tion of the U.S. The assumption thatproductivity growth is permanentlybehind us—that somehow every tech-nological advance that was ever goingto happen has happened and is in ourpast—is hugely, vastly arrogant.Abby Joseph Cohen: In Japan, themost important zombie companies werethe banks. Poorly performing assetswere kept on bank balance sheets indef-initely, limiting the ability to lend. Incontrast, the U.S. responded quicklyduring the global financial crisis, bene-fiting frommore stringent accountingand regulation for banks. Bad assetswere written down, often dramatically.This was hugely important in puttingthe financial system right and gettingthe economy moving again.Desai: It’s enormous. It is an additionalreasonwhy the recovery from the cur-rent crisis is going to be significantlydifferent than from the financial crisis.
Thank you, Sonal. B
Additional editing by Nicholas Jasinski
“I’m not a gold specialist, but Ithink gold could easily go upto $2,200 [an ounce]. I’m notsaying it will happen in thenext month or two, butproduction of gold is quitelow right now. I prefer goldto Bitcoin. Gold is a time-honored store of value.”Sonal Desai
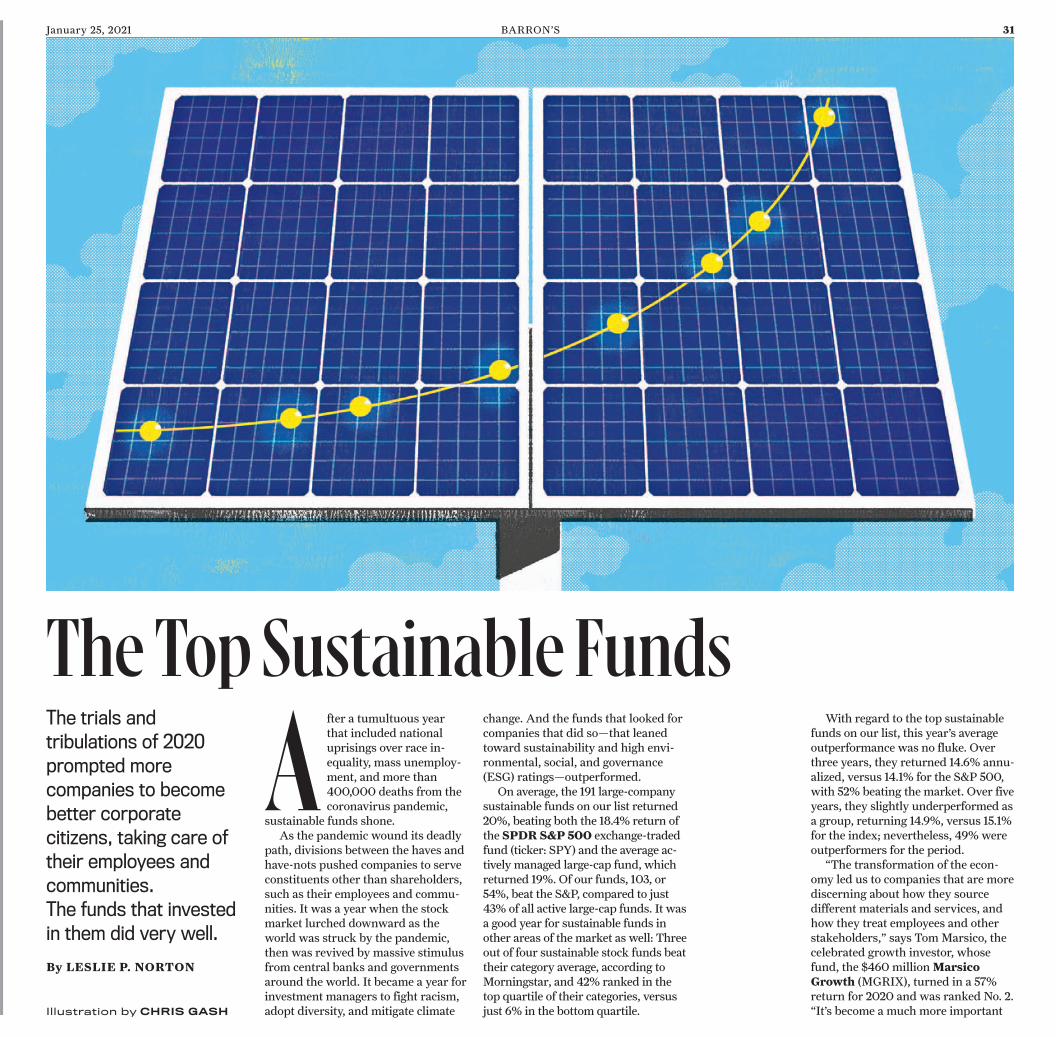
January 25, 2021 BARRON’S 31
After a tumultuous yearthat included nationaluprisings over race in-equality, mass unemploy-ment, and more than400,000 deaths from thecoronavirus pandemic,
sustainable funds shone.As the pandemic wound its deadly
path, divisions between the haves andhave-nots pushed companies to serveconstituents other than shareholders,such as their employees and commu-nities. It was a year when the stockmarket lurched downward as theworld was struck by the pandemic,then was revived by massive stimulusfrom central banks and governmentsaround the world. It became a year forinvestment managers to fight racism,adopt diversity, and mitigate climate
change. And the funds that looked forcompanies that did so—that leanedtoward sustainability and high envi-ronmental, social, and governance(ESG) ratings—outperformed.
On average, the 191 large-companysustainable funds on our list returned20%, beating both the 18.4% return ofthe SPDR S&P 500 exchange-tradedfund (ticker: SPY) and the average ac-tively managed large-cap fund, whichreturned 19%. Of our funds, 103, or54%, beat the S&P, compared to just43% of all active large-cap funds. It wasa good year for sustainable funds inother areas of the market as well: Threeout of four sustainable stock funds beattheir category average, according toMorningstar, and 42% ranked in thetop quartile of their categories, versusjust 6% in the bottom quartile.
With regard to the top sustainablefunds on our list, this year’s averageoutperformance was no fluke. Overthree years, they returned 14.6% annu-alized, versus 14.1% for the S&P 500,with 52% beating the market. Over fiveyears, they slightly underperformed asa group, returning 14.9%, versus 15.1%for the index; nevertheless, 49% wereoutperformers for the period.
“The transformation of the econ-omy led us to companies that are morediscerning about how they sourcedifferent materials and services, andhow they treat employees and otherstakeholders,” says TomMarsico, thecelebrated growth investor, whosefund, the $460 millionMarsicoGrowth (MGRIX), turned in a 57%return for 2020 and was ranked No. 2.“It’s become a much more important
The Top Sustainable FundsThe trials andtribulations of 2020prompted morecompanies to becomebetter corporatecitizens, taking care oftheir employees andcommunities.The funds that investedin them did very well.
By LESLIE P. NORTON
Illustration by CHRIS GASH
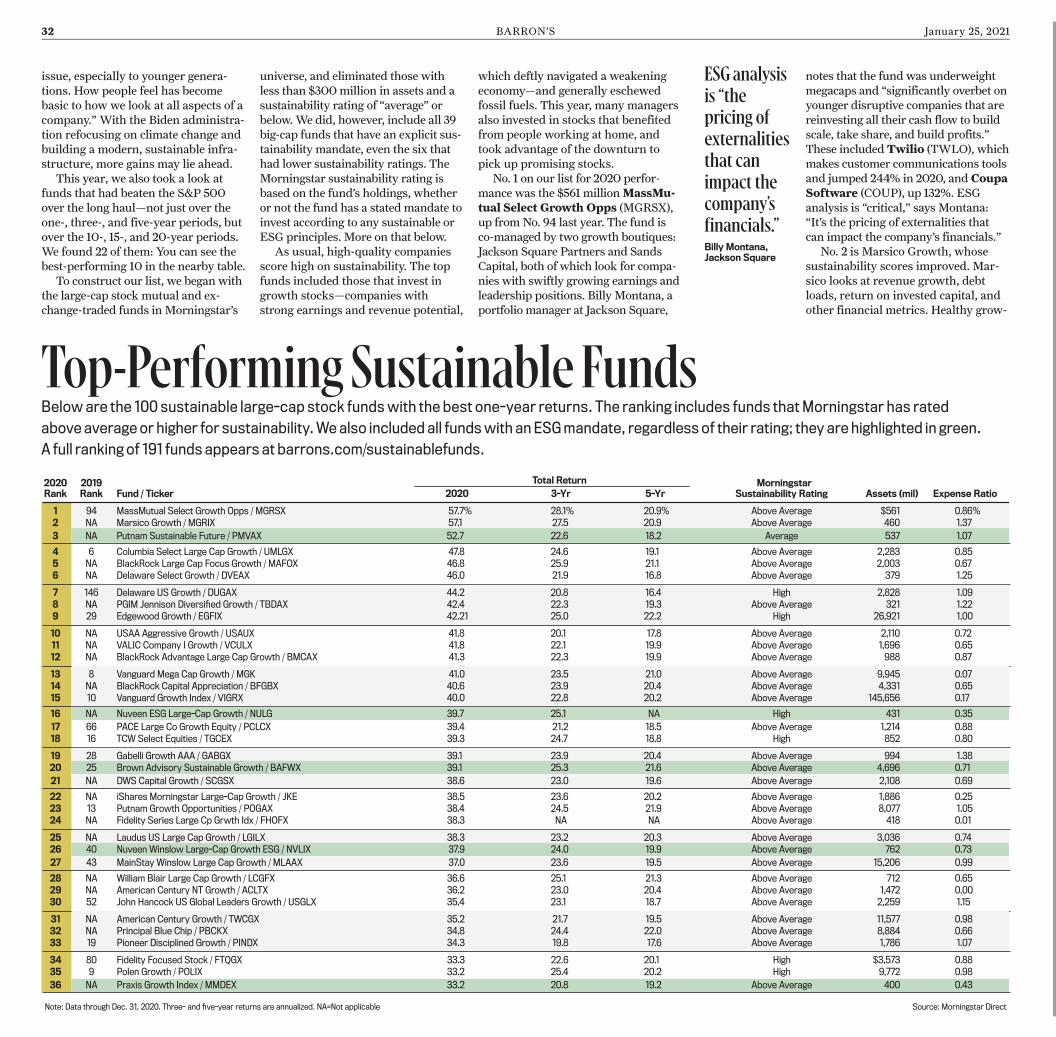
32 BARRON’S January 25, 2021
issue, especially to younger genera-tions. How people feel has becomebasic to how we look at all aspects of acompany.” With the Biden administra-tion refocusing on climate change andbuilding a modern, sustainable infra-structure, more gains may lie ahead.
This year, we also took a look atfunds that had beaten the S&P 500over the long haul—not just over theone-, three-, and five-year periods, butover the 10-, 15-, and 20-year periods.We found 22 of them: You can see thebest-performing 10 in the nearby table.
To construct our list, we began withthe large-cap stock mutual and ex-change-traded funds in Morningstar’s
universe, and eliminated those withless than $300million in assets and asustainability rating of “average” orbelow.We did, however, include all 39big-cap funds that have an explicit sus-tainability mandate, even the six thathad lower sustainability ratings. TheMorningstar sustainability rating isbased on the fund’s holdings, whetheror not the fund has a stated mandate toinvest according to any sustainable orESG principles. More on that below.
As usual, high-quality companiesscore high on sustainability. The topfunds included those that invest ingrowth stocks—companies withstrong earnings and revenue potential,
which deftly navigated a weakeningeconomy—and generally eschewedfossil fuels. This year, many managersalso invested in stocks that benefitedfrom people working at home, andtook advantage of the downturn topick up promising stocks.
No. 1 on our list for 2020 perfor-mance was the $561 millionMassMu-tual Select Growth Opps (MGRSX),up fromNo. 94 last year. The fund isco-managed by two growth boutiques:Jackson Square Partners and SandsCapital, both of which look for compa-nies with swiftly growing earnings andleadership positions. Billy Montana, aportfolio manager at Jackson Square,
notes that the fund was underweightmegacaps and “significantly overbet onyounger disruptive companies that arereinvesting all their cash flow to buildscale, take share, and build profits.”These includedTwilio (TWLO), whichmakes customer communications toolsand jumped 244% in 2020, and CoupaSoftware (COUP), up 132%. ESGanalysis is “critical,” says Montana:“It’s the pricing of externalities thatcan impact the company’s financials.”
No. 2 is Marsico Growth, whosesustainability scores improved. Mar-sico looks at revenue growth, debtloads, return on invested capital, andother financial metrics. Healthy grow-
ESG analysisis “thepricing ofexternalitiesthat canimpact thecompany’sfinancials.”Billy Montana,Jackson Square
2020 2019 Total Return MorningstarRank Rank Fund / Ticker 2020 3-Yr 5-Yr Sustainability Rating Assets (mil) Expense Ratio
1 94 MassMutual Select Growth Opps / MGRSX 57.7% 28.1% 20.9% Above Average $561 0.86%2 NA Marsico Growth / MGRIX 57.1 27.5 20.9 Above Average 460 1.37
3 NA Putnam Sustainable Future / PMVAX 52.7 22.6 18.2 Average 537 1.07
4 6 Columbia Select Large Cap Growth / UMLGX 47.8 24.6 19.1 Above Average 2,283 0.855 NA BlackRock Large Cap Focus Growth / MAFOX 46.8 25.9 21.1 Above Average 2,003 0.676 NA Delaware Select Growth / DVEAX 46.0 21.9 16.8 Above Average 379 1.25
7 146 Delaware US Growth / DUGAX 44.2 20.8 16.4 High 2,828 1.098 NA PGIM Jennison Diversified Growth / TBDAX 42.4 22.3 19.3 Above Average 321 1.229 29 Edgewood Growth / EGFIX 42.21 25.0 22.2 High 26,921 1.00
10 NA USAA Aggressive Growth / USAUX 41.8 20.1 17.8 Above Average 2,110 0.7211 NA VALIC Company I Growth / VCULX 41.8 22.1 19.9 Above Average 1,696 0.6512 NA BlackRock Advantage Large Cap Growth / BMCAX 41.3 22.3 19.9 Above Average 988 0.87
13 8 Vanguard Mega Cap Growth / MGK 41.0 23.5 21.0 Above Average 9,945 0.0714 NA BlackRock Capital Appreciation / BFGBX 40.6 23.9 20.4 Above Average 4,331 0.6515 10 Vanguard Growth Index / VIGRX 40.0 22.8 20.2 Above Average 145,656 0.17
16 NA Nuveen ESG Large-Cap Growth / NULG 39.7 25.1 NA High 431 0.35
17 66 PACE Large Co Growth Equity / PCLCX 39.4 21.2 18.5 Above Average 1,214 0.8818 16 TCW Select Equities / TGCEX 39.3 24.7 18.8 High 852 0.80
19 28 Gabelli Growth AAA / GABGX 39.1 23.9 20.4 Above Average 994 1.3820 25 Brown Advisory Sustainable Growth / BAFWX 39.1 25.3 21.6 Above Average 4,696 0.71
21 NA DWS Capital Growth / SCGSX 38.6 23.0 19.6 Above Average 2,108 0.69
22 NA iShares Morningstar Large-Cap Growth / JKE 38.5 23.6 20.2 Above Average 1,886 0.2523 13 Putnam Growth Opportunities / POGAX 38.4 24.5 21.9 Above Average 8,077 1.0524 NA Fidelity Series Large Cp Grwth Idx / FHOFX 38.3 NA NA Above Average 418 0.01
25 NA Laudus US Large Cap Growth / LGILX 38.3 23.2 20.3 Above Average 3,036 0.7426 40 Nuveen Winslow Large-Cap Growth ESG / NVLIX 37.9 24.0 19.9 Above Average 762 0.73
27 43 MainStay Winslow Large Cap Growth / MLAAX 37.0 23.6 19.5 Above Average 15,206 0.99
28 NA William Blair Large Cap Growth / LCGFX 36.6 25.1 21.3 Above Average 712 0.6529 NA American Century NT Growth / ACLTX 36.2 23.0 20.4 Above Average 1,472 0.0030 52 John Hancock US Global Leaders Growth / USGLX 35.4 23.1 18.7 Above Average 2,259 1.15
31 NA American Century Growth / TWCGX 35.2 21.7 19.5 Above Average 11,577 0.9832 NA Principal Blue Chip / PBCKX 34.8 24.4 22.0 Above Average 8,884 0.6633 19 Pioneer Disciplined Growth / PINDX 34.3 19.8 17.6 Above Average 1,786 1.07
34 80 Fidelity Focused Stock / FTQGX 33.3 22.6 20.1 High $3,573 0.8835 9 Polen Growth / POLIX 33.2 25.4 20.2 High 9,772 0.98
36 NA Praxis Growth Index / MMDEX 33.2 20.8 19.2 Above Average 400 0.43
Note: Data through Dec. 31, 2020. Three- and five-year returns are annualized. NA=Not applicable Source: Morningstar Direct
Top-Performing Sustainable FundsBelow are the 100 sustainable large-cap stock fundswith the best one-year returns. The ranking includes funds that Morningstar has rated
above average or higher for sustainability.We also included all fundswith an ESGmandate, regardless of their rating; they are highlighted in green.
A full ranking of 191 funds appears at barrons.com/sustainablefunds.
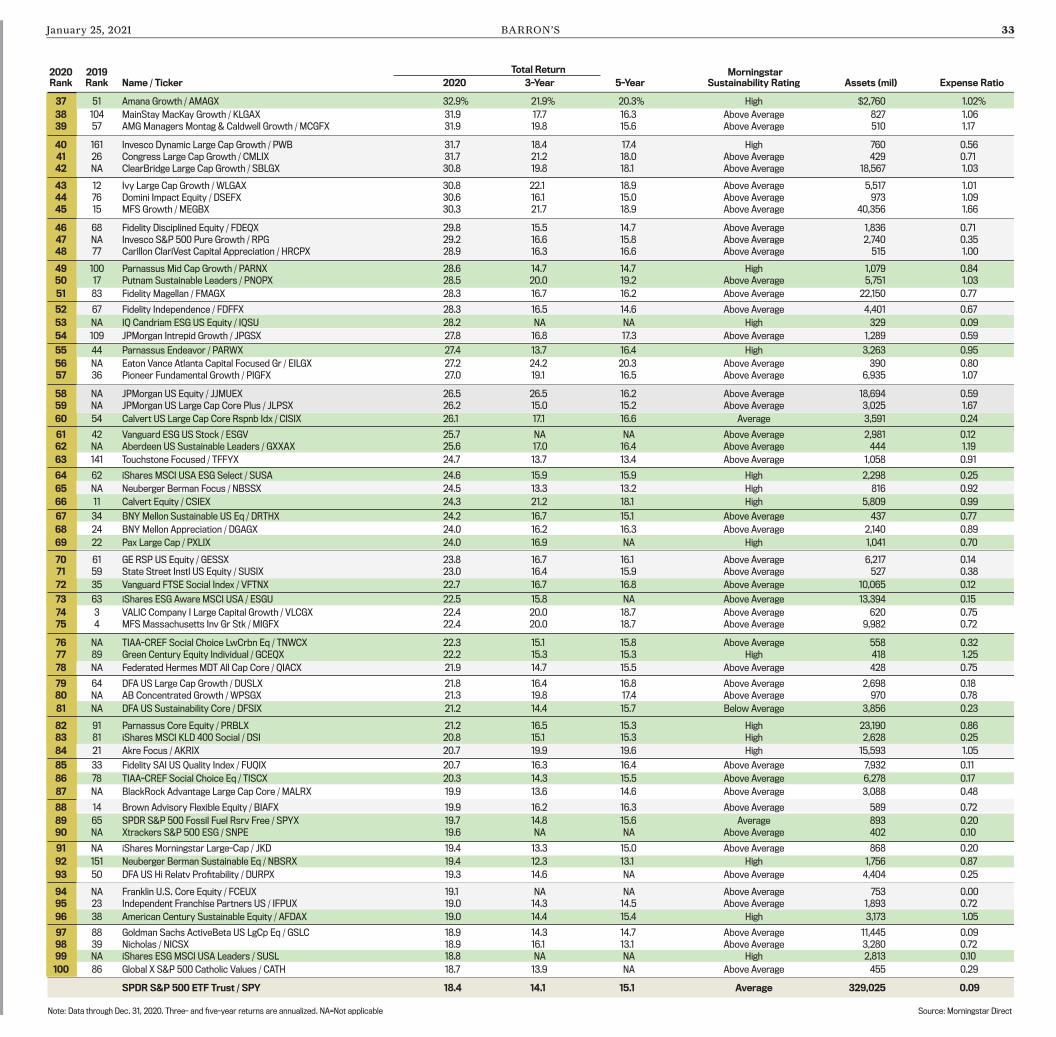
January 25, 2021 BARRON’S 33
2020 2019 Total Return MorningstarRank Rank Name / Ticker 2020 3-Year 5-Year Sustainability Rating Assets (mil) Expense Ratio
37 51 Amana Growth / AMAGX 32.9% 21.9% 20.3% High $2,760 1.02%
38 104 MainStay MacKay Growth / KLGAX 31.9 17.7 16.3 Above Average 827 1.0639 57 AMG Managers Montag & Caldwell Growth / MCGFX 31.9 19.8 15.6 Above Average 510 1.17
40 161 Invesco Dynamic Large Cap Growth / PWB 31.7 18.4 17.4 High 760 0.5641 26 Congress Large Cap Growth / CMLIX 31.7 21.2 18.0 Above Average 429 0.7142 NA ClearBridge Large Cap Growth / SBLGX 30.8 19.8 18.1 Above Average 18,567 1.03
43 12 Ivy Large Cap Growth / WLGAX 30.8 22.1 18.9 Above Average 5,517 1.0144 76 Domini Impact Equity / DSEFX 30.6 16.1 15.0 Above Average 973 1.0945 15 MFS Growth / MEGBX 30.3 21.7 18.9 Above Average 40,356 1.66
46 68 Fidelity Disciplined Equity / FDEQX 29.8 15.5 14.7 Above Average 1,836 0.7147 NA Invesco S&P 500 Pure Growth / RPG 29.2 16.6 15.8 Above Average 2,740 0.3548 77 Carillon ClariVest Capital Appreciation / HRCPX 28.9 16.3 16.6 Above Average 515 1.00
49 100 Parnassus Mid Cap Growth / PARNX 28.6 14.7 14.7 High 1,079 0.8450 17 Putnam Sustainable Leaders / PNOPX 28.5 20.0 19.2 Above Average 5,751 1.03
51 83 Fidelity Magellan / FMAGX 28.3 16.7 16.2 Above Average 22,150 0.77
52 67 Fidelity Independence / FDFFX 28.3 16.5 14.6 Above Average 4,401 0.67
53 NA IQ Candriam ESG US Equity / IQSU 28.2 NA NA High 329 0.09
54 109 JPMorgan Intrepid Growth / JPGSX 27.8 16.8 17.3 Above Average 1,289 0.59
55 44 Parnassus Endeavor / PARWX 27.4 13.7 16.4 High 3,263 0.95
56 NA Eaton Vance Atlanta Capital Focused Gr / EILGX 27.2 24.2 20.3 Above Average 390 0.8057 36 Pioneer Fundamental Growth / PIGFX 27.0 19.1 16.5 Above Average 6,935 1.07
58 NA JPMorgan US Equity / JJMUEX 26.5 26.5 16.2 Above Average 18,694 0.5959 NA JPMorgan US Large Cap Core Plus / JLPSX 26.2 15.0 15.2 Above Average 3,025 1.67
60 54 Calvert US Large Cap Core Rspnb Idx / CISIX 26.1 17.1 16.6 Average 3,591 0.24
61 42 Vanguard ESG US Stock / ESGV 25.7 NA NA Above Average 2,981 0.1262 NA Aberdeen US Sustainable Leaders / GXXAX 25.6 17.0 16.4 Above Average 444 1.19
63 141 Touchstone Focused / TFFYX 24.7 13.7 13.4 Above Average 1,058 0.91
64 62 iShares MSCI USA ESG Select / SUSA 24.6 15.9 15.9 High 2,298 0.25
65 NA Neuberger Berman Focus / NBSSX 24.5 13.3 13.2 High 816 0.92
66 11 Calvert Equity / CSIEX 24.3 21.2 18.1 High 5,809 0.99
67 34 BNY Mellon Sustainable US Eq / DRTHX 24.2 16.7 15.1 Above Average 437 0.77
68 24 BNY Mellon Appreciation / DGAGX 24.0 16.2 16.3 Above Average 2,140 0.89
69 22 Pax Large Cap / PXLIX 24.0 16.9 NA High 1,041 0.70
70 61 GE RSP US Equity / GESSX 23.8 16.7 16.1 Above Average 6,217 0.1471 59 State Street Instl US Equity / SUSIX 23.0 16.4 15.9 Above Average 527 0.38
72 35 Vanguard FTSE Social Index / VFTNX 22.7 16.7 16.8 Above Average 10,065 0.12
73 63 iShares ESG Aware MSCI USA / ESGU 22.5 15.8 NA Above Average 13,394 0.15
74 3 VALIC Company I Large Capital Growth / VLCGX 22.4 20.0 18.7 Above Average 620 0.7575 4 MFS Massachusetts Inv Gr Stk / MIGFX 22.4 20.0 18.7 Above Average 9,982 0.72
76 NA TIAA-CREF Social Choice LwCrbn Eq / TNWCX 22.3 15.1 15.8 Above Average 558 0.3277 89 Green Century Equity Individual / GCEQX 22.2 15.3 15.3 High 418 1.25
78 NA Federated Hermes MDT All Cap Core / QIACX 21.9 14.7 15.5 Above Average 428 0.75
79 64 DFA US Large Cap Growth / DUSLX 21.8 16.4 16.8 Above Average 2,698 0.1880 NA AB Concentrated Growth / WPSGX 21.3 19.8 17.4 Above Average 970 0.78
81 NA DFA US Sustainability Core / DFSIX 21.2 14.4 15.7 Below Average 3,856 0.23
82 91 Parnassus Core Equity / PRBLX 21.2 16.5 15.3 High 23,190 0.8683 81 iShares MSCI KLD 400 Social / DSI 20.8 15.1 15.3 High 2,628 0.25
84 21 Akre Focus / AKRIX 20.7 19.9 19.6 High 15,593 1.05
85 33 Fidelity SAI US Quality Index / FUQIX 20.7 16.3 16.4 Above Average 7,932 0.11
86 78 TIAA-CREF Social Choice Eq / TISCX 20.3 14.3 15.5 Above Average 6,278 0.17
87 NA BlackRock Advantage Large Cap Core / MALRX 19.9 13.6 14.6 Above Average 3,088 0.48
88 14 Brown Advisory Flexible Equity / BIAFX 19.9 16.2 16.3 Above Average 589 0.72
89 65 SPDR S&P 500 Fossil Fuel Rsrv Free / SPYX 19.7 14.8 15.6 Average 893 0.2090 NA Xtrackers S&P 500 ESG / SNPE 19.6 NA NA Above Average 402 0.10
91 NA iShares Morningstar Large-Cap / JKD 19.4 13.3 15.0 Above Average 868 0.20
92 151 Neuberger Berman Sustainable Eq / NBSRX 19.4 12.3 13.1 High 1,756 0.87
93 50 DFA US Hi Relatv Profitability / DURPX 19.3 14.6 NA Above Average 4,404 0.25
94 NA Franklin U.S. Core Equity / FCEUX 19.1 NA NA Above Average 753 0.0095 23 Independent Franchise Partners US / IFPUX 19.0 14.3 14.5 Above Average 1,893 0.72
96 38 American Century Sustainable Equity / AFDAX 19.0 14.4 15.4 High 3,173 1.05
97 88 Goldman Sachs ActiveBeta US LgCp Eq / GSLC 18.9 14.3 14.7 Above Average 11,445 0.0998 39 Nicholas / NICSX 18.9 16.1 13.1 Above Average 3,280 0.7299 NA iShares ESG MSCI USA Leaders / SUSL 18.8 NA NA High 2,813 0.10
100 86 Global X S&P 500 Catholic Values / CATH 18.7 13.9 NA Above Average 455 0.29
SPDR S&P 500 ETF Trust / SPY 18.4 14.1 15.1 Average 329,025 0.09
Note: Data through Dec. 31, 2020. Three- and five-year returns are annualized. NA=Not applicable Source: Morningstar Direct
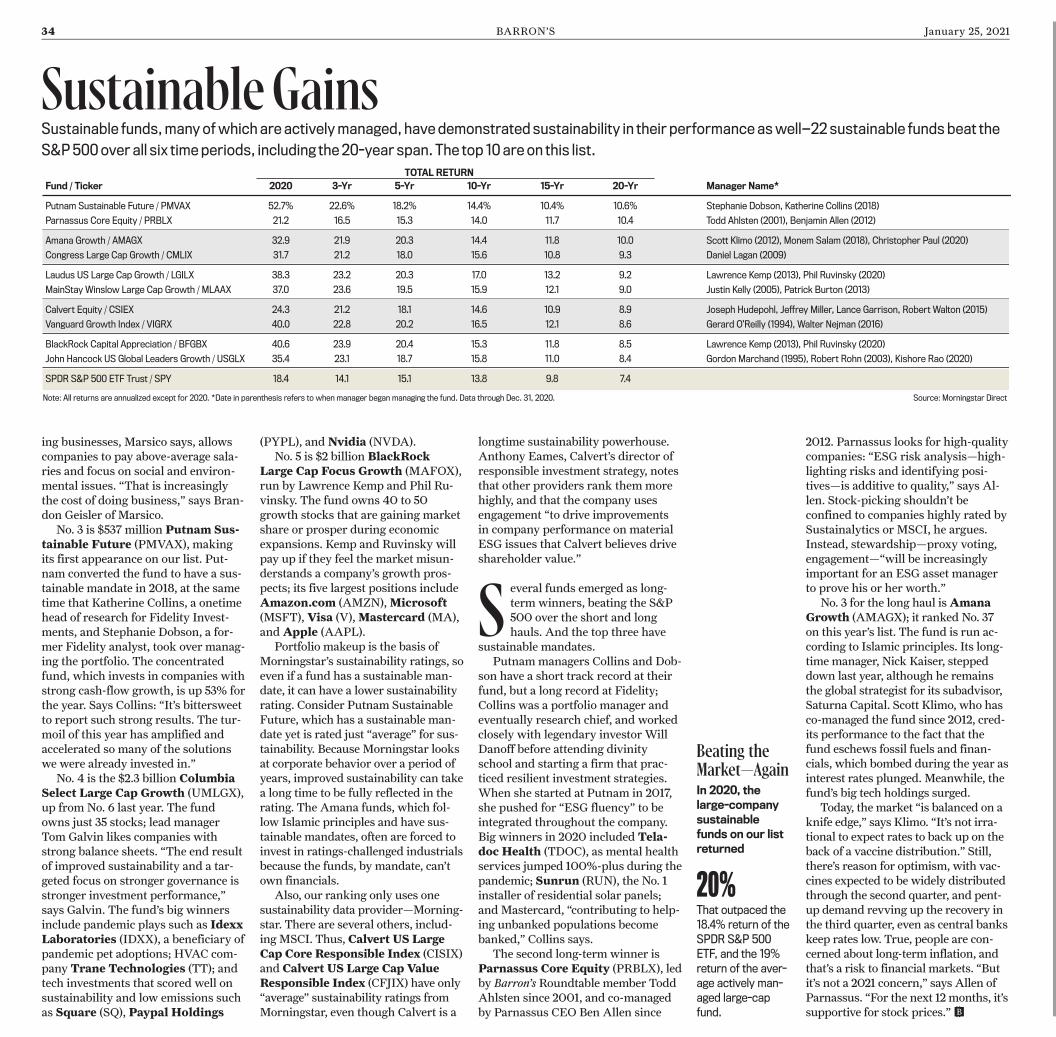
34 BARRON’S January 25, 2021
ing businesses, Marsico says, allowscompanies to pay above-average sala-ries and focus on social and environ-mental issues. “That is increasinglythe cost of doing business,” says Bran-don Geisler of Marsico.
No. 3 is $537 million Putnam Sus-tainable Future (PMVAX), makingits first appearance on our list. Put-nam converted the fund to have a sus-tainable mandate in 2018, at the sametime that Katherine Collins, a onetimehead of research for Fidelity Invest-ments, and Stephanie Dobson, a for-mer Fidelity analyst, took over manag-ing the portfolio. The concentratedfund, which invests in companies withstrong cash-flow growth, is up 53% forthe year. Says Collins: “It’s bittersweetto report such strong results. The tur-moil of this year has amplified andaccelerated so many of the solutionswe were already invested in.”
No. 4 is the $2.3 billion ColumbiaSelect Large Cap Growth (UMLGX),up from No. 6 last year. The fundowns just 35 stocks; lead managerTom Galvin likes companies withstrong balance sheets. “The end resultof improved sustainability and a tar-geted focus on stronger governance isstronger investment performance,”says Galvin. The fund’s big winnersinclude pandemic plays such as IdexxLaboratories (IDXX), a beneficiary ofpandemic pet adoptions; HVAC com-pany Trane Technologies (TT); andtech investments that scored well onsustainability and low emissions suchas Square (SQ), Paypal Holdings
(PYPL), andNvidia (NVDA).No. 5 is $2 billion BlackRock
Large Cap Focus Growth (MAFOX),run by Lawrence Kemp and Phil Ru-vinsky. The fund owns 40 to 50growth stocks that are gaining marketshare or prosper during economicexpansions. Kemp and Ruvinsky willpay up if they feel the market misun-derstands a company’s growth pros-pects; its five largest positions includeAmazon.com (AMZN),Microsoft(MSFT),Visa (V),Mastercard (MA),andApple (AAPL).
Portfolio makeup is the basis ofMorningstar’s sustainability ratings, soeven if a fund has a sustainable man-date, it can have a lower sustainabilityrating. Consider Putnam SustainableFuture, which has a sustainable man-date yet is rated just “average” for sus-tainability. Because Morningstar looksat corporate behavior over a period ofyears, improved sustainability can takea long time to be fully reflected in therating. The Amana funds, which fol-low Islamic principles and have sus-tainable mandates, often are forced toinvest in ratings-challenged industrialsbecause the funds, by mandate, can’town financials.
Also, our ranking only uses onesustainability data provider—Morning-star. There are several others, includ-ing MSCI. Thus, Calvert US LargeCap Core Responsible Index (CISIX)and Calvert US Large Cap ValueResponsible Index (CFJIX) have only“average” sustainability ratings fromMorningstar, even though Calvert is a
longtime sustainability powerhouse.Anthony Eames, Calvert’s director ofresponsible investment strategy, notesthat other providers rank them morehighly, and that the company usesengagement “to drive improvementsin company performance on materialESG issues that Calvert believes driveshareholder value.”
S everal funds emerged as long-term winners, beating the S&P500 over the short and longhauls. And the top three have
sustainable mandates.Putnam managers Collins and Dob-
son have a short track record at theirfund, but a long record at Fidelity;Collins was a portfolio manager andeventually research chief, and workedclosely with legendary investor WillDanoff before attending divinityschool and starting a firm that prac-ticed resilient investment strategies.When she started at Putnam in 2017,she pushed for “ESG fluency” to beintegrated throughout the company.Big winners in 2020 included Tela-doc Health (TDOC), as mental healthservices jumped 100%-plus during thepandemic; Sunrun (RUN), the No. 1installer of residential solar panels;and Mastercard, “contributing to help-ing unbanked populations becomebanked,” Collins says.
The second long-term winner isParnassus Core Equity (PRBLX), ledby Barron’s Roundtable member ToddAhlsten since 2001, and co-managedby Parnassus CEO Ben Allen since
2012. Parnassus looks for high-qualitycompanies: “ESG risk analysis—high-lighting risks and identifying posi-tives—is additive to quality,” says Al-len. Stock-picking shouldn’t beconfined to companies highly rated bySustainalytics or MSCI, he argues.Instead, stewardship—proxy voting,engagement—“will be increasinglyimportant for an ESG asset managerto prove his or her worth.”
No. 3 for the long haul isAmanaGrowth (AMAGX); it ranked No. 37on this year’s list. The fund is run ac-cording to Islamic principles. Its long-time manager, Nick Kaiser, steppeddown last year, although he remainsthe global strategist for its subadvisor,Saturna Capital. Scott Klimo, who hasco-managed the fund since 2012, cred-its performance to the fact that thefund eschews fossil fuels and finan-cials, which bombed during the year asinterest rates plunged. Meanwhile, thefund’s big tech holdings surged.
Today, the market “is balanced on aknife edge,” says Klimo. “It’s not irra-tional to expect rates to back up on theback of a vaccine distribution.” Still,there’s reason for optimism, with vac-cines expected to be widely distributedthrough the second quarter, and pent-up demand revving up the recovery inthe third quarter, even as central bankskeep rates low. True, people are con-cerned about long-term inflation, andthat’s a risk to financial markets. “Butit’s not a 2021 concern,” says Allen ofParnassus. “For the next 12 months, it’ssupportive for stock prices.” B
Beating theMarket—AgainIn 2020, thelarge-companysustainablefunds on our listreturned
20%That outpaced the18.4% return of theSPDR S&P 500ETF, and the 19%return of the aver-age actively man-aged large-capfund.
TOTAL RETURNFund / Ticker 2020 3-Yr 5-Yr 10-Yr 15-Yr 20-Yr Manager Name*
Putnam Sustainable Future / PMVAX 52.7% 22.6% 18.2% 14.4% 10.4% 10.6% Stephanie Dobson, Katherine Collins (2018)
Parnassus Core Equity / PRBLX 21.2 16.5 15.3 14.0 11.7 10.4 Todd Ahlsten (2001), Benjamin Allen (2012)
Amana Growth / AMAGX 32.9 21.9 20.3 14.4 11.8 10.0 Scott Klimo (2012), Monem Salam (2018), Christopher Paul (2020)
Congress Large Cap Growth / CMLIX 31.7 21.2 18.0 15.6 10.8 9.3 Daniel Lagan (2009)
Laudus US Large Cap Growth / LGILX 38.3 23.2 20.3 17.0 13.2 9.2 Lawrence Kemp (2013), Phil Ruvinsky (2020)
MainStay Winslow Large Cap Growth / MLAAX 37.0 23.6 19.5 15.9 12.1 9.0 Justin Kelly (2005), Patrick Burton (2013)
Calvert Equity / CSIEX 24.3 21.2 18.1 14.6 10.9 8.9 Joseph Hudepohl, Jeffrey Miller, Lance Garrison, Robert Walton (2015)
Vanguard Growth Index / VIGRX 40.0 22.8 20.2 16.5 12.1 8.6 Gerard O’Reilly (1994), Walter Nejman (2016)
BlackRock Capital Appreciation / BFGBX 40.6 23.9 20.4 15.3 11.8 8.5 Lawrence Kemp (2013), Phil Ruvinsky (2020)
John Hancock US Global Leaders Growth / USGLX 35.4 23.1 18.7 15.8 11.0 8.4 Gordon Marchand (1995), Robert Rohn (2003), Kishore Rao (2020)
SPDR S&P 500 ETF Trust / SPY 18.4 14.1 15.1 13.8 9.8 7.4
Note: All returns are annualized except for 2020. *Date in parenthesis refers to when manager began managing the fund. Data through Dec. 31, 2020. Source: Morningstar Direct
Sustainable GainsSustainable funds,many ofwhich are activelymanaged, have demonstrated sustainability in their performance aswell—22 sustainable funds beat the
S&P500 over all six time periods, including the 20-year span. The top 10 are on this list.
January 25, 2021 BARRON’S 35
pollution and emissions.Dozens of countries have con-
demned China’s treatment of Uighurs.On Tuesday, the U.S. State Depart-ment declared it to be genocide.Human-rights issues will remain athorny issue for companies that makelabor-intensive consumer goods andwant to protect their supply chains,which are critical for manufacturersall over the world.
“The headlines that jar customersin theWest are about buying productsmade in Asia and someplace in thesupply chain where you have forcedlabor,” says Sudhir Roc-Sennett, headof ESG at Vontobel Quality Growth, the$34 billion equities arm of VontobelAsset Management. That creates regu-latory risk and brand risk for compa-nies, he adds.
Multinationals, wary of criticism,are newly vigilant about supply chains.Last year,Hennes &Mauritz (ticker:
HM.B.Sweden), which runs H&Mstores, cut ties with a supplier saidto have been using Uighur detainees.Meanwhile, an influential report fromthe Australian Strategic Policy Institutelast year alleged that the supply chainsof more than 83 well-known globalbrands may have used Uighur labor.The U.S. has sanctioned a number ofsuppliers to such brands.
Recently, a weeklong campaign al-leging that Inditex (ITX.Spain), whoseZara unit sells fashion to youthful con-sumers, used Uighur forced labor gen-erated nearly 100,000 interactionsand mentions on Facebook, Twitter,and Instagram, according to Storyful.
In an email to Barron’s, an Inditexrepresentative said the retailer “takesa zero-tolerance approach towardforced labor of any kind and hasstringent policies and actions in placeto ensure that it does not take placeanywhere in our supply chain....Inditex does not have commercialrelations with any factory in Xinji-ang, China.”
Investing in China—which ac-counts for roughly 40% of the MSCIEmerging Markets Index—can be adifficult proposition. But it can beeased with environmental, social, andgovernance, or ESG, approaches.
Last year, China committed tocarbon neutrality by 2060. It hasintroduced policies to drive that tran-sition, including one of the world’slargest emissions-trading programs.It’s investing in green transportation,including high-speed rail and electricvehicles. “There has been an impor-tant shift in the direction of a greenway of doing things,” says Luiz Peix-oto, emerging markets economist atBNP Paribas.
Chinese companies often ignorecommunications from ratings firmsabout improving their ESG scores.“We have the lowest response ratefor Chinese companies comparedwith any other country in our cover-age,” says Wilco van Heteren ofSustainalytics.
That’s about to change. This year,Chinese regulators are requiring com-panies traded on the Shanghai andShenzhen exchanges to report on ESGrisks, as Hong Kong–listed companiesalready do. Once companies disclose,you can track their progress. In 2019,about 85% of the large CSI 300 com-panies released official ESG disclo-sures, up from 54% in 2013.
“We see a lot of top-down momen-
tum” for ESG disclosures, says Kath-lyn Collins, ESG analyst at MatthewsAsia. More Chinese companies sportthe lower CCC and B sustainabilityratings from MSCI than other emerg-ing market and developed marketcompanies. But once MSCI beganrating Chinese companies for ESG,“there was a small increase in BB-and AA-rated issuers,” explainsXiaoshu Wang of MSCI’s ESG re-search team.
Proxy voting is also on the rise.A Calvert study of Proxy Insight datafor Calvert and the world’s 10 largestinvestors showed that the number ofshareholder resolutions voted on roseto 1,610 in 2019 from 979 in 2015,with most of those coming fromChina, says Calvert’s Jade Huang.
Homegrown demand for ESG willhelp. In 2019, inflows into ESG-theme ETFs in China totaled $20.5billion, versus $4.9 billion in 2018,according to a report by Ping An.ESG investments also outperformed.And the number of Chinese signato-ries to the United Nations–backedPrinciples for Responsible Invest-ment, which offers a blueprint forcompanies to incorporate ESG invest-ment practices, now totals 52, makingit the fastest-growing region behindLatin America.
Social issues such as privacy, labor,and human rights will remain prob-lematic in China, necessitating vigi-lance by companies that operate thereand their investors.
For now, China does have ESGleaders. The KraneShares MSCIChina ESG Leaders exchange-traded fund (KESG), which is basedon the MSCI China ESG Leaders in-dex, includes 149 large- and mid-capcompanies, and limits individual con-stituent weightings to 10% and sectorweightings to 40%. Its largest hold-ings include China ConstructionBank (939.Hong Kong), online food-delivery company Meituan(3690.Hong Kong), and tech con-glomerate Tencent Holdings (700.Hong Kong). The firm also offers theKraneShares MSCI China Envi-ronment Index ETF (KGRN).
Both funds are tiny. Still, Krane-Shares founder Jonathan Krane ishopeful. “When you use ESGscreens, it takes you into New China,where you’re focused more on tech-nology companies, green companies,EV companies.”
In other words, the most promis-ing parts of the Chinese market. B
The TroubleWithChina’s ESGRatingsEven as China is criticized for its social practices, it’s making rapidprogress on its environmental actions. Here’s how to dodge the pitfalls.
Social issuessuch asprivacy,labor, andhumanrights willremainproblematicin China.
China is on a path to becom-ing the largest economy inthe world—but many in-vestors remain wary of it.
The country has at-tracted international con-demnation for its harsh
treatment of the Uighur Muslim mi-nority group in Xinjiang province—treatment that includes restrictionson travel, education, speech, andworship, as well as forced steriliza-tion and abortion. China has crackeddown on pro-democracy initiatives inHong Kong. And its record on corpo-rate governance is spotty, at best.
Yet even as China is criticized forits social practices, it’s making rapidprogress on its environmental ac-tions. The world’s largest greenhouse-gas emitter, it has big ambitions tomake its economy green, slashing
By LESLIE P. NORTON

36 BARRON’S January 25, 2021
T E C H T R A D E R As Netflix starts to generate cash, the companyhas a lot more flexibility. Sports, news, music, orgaming could be next.
For All Us NetflixSkeptics, It’s FinallyTime to Concede
When it comestoNetflix,Barron’s hasa long recordof beingwrong.We’ve been
negative on the stock almost from theday the company came public in 2002.It reflects the well-intentioned work ofmultiple writers raising a range ofquestions about the company, from itssustainability to its valuation.
Back in 2004, I wrote that Netflix(ticker: NFLX) could be crushed byWalmart (WMT) and Blockbuster inthe DVD-by-mail business. That wasbefore Netflix turned to streaming,and I warned that “in the long run,consumers will download most oftheir movies, rather than buy or rentthem.” I got the future right—but thewinner wrong. “The stock’s valuationtriggers vertigo,” I added. At the time,Netflix had a market value of $1.8 bil-lion. Now it’s $256 billion. In the caseof real disruption, fundamental analy-sis just doesn’t apply.
In 2020, Netflix rallied 67%, gettinga boost from shuttered movie theatersand other entertainment venues. It wasamong the more obvious stay-at-homeplays. Netflix has gained another 8%this year. And while the ghost of for-mer Barron’s editor Alan Abelsonmight haunt me for it, I predict furtherNetflix gains from here.
The Netflix story fundamentallychanged this past week, with the sur-prising news that the company nowplans to break even on a free-cash-flow basis this year. The company hadpreviously forecast a loss of up to $1
By Eric J. Savitz
billion on the year.With more than 203 million sub-
scribers paying on average $11 amonth, Netflix now generates enoughcash to cover its production costs. Asthe subscriber base continues to ex-pand, the level of cash generationshould grow.
“We believe we no longer have aneed to raise external financing forour day-to-day operations,” the com-pany said this past week in its fourth-quarter shareholder letter. Netflix,which has $16 billion in debt out-standing, said it would soon pay down$500 million of maturing debt fromcash on hand, “as we are currentlywell above our minimum cash needs.”Netflix added that as it generates ex-cess cash, it would “explore” stockbuybacks—something it hasn’t donesince 2011.
There was other good news in thispast week’s earnings report: Netflixadded a net of 8.5 million subscribersin the fourth quarter, easily beating itsforecast of six million net adds. Reve-nue was up 22%, to $6.6 billion. And
its profit guidance for the currentquarter was well aboveWall Streetestimates. Still, the big news was therevelation that Netflix is no longer amoney pit. It’s now well on the way tobecoming a cash machine.
Rich Greenfield, a longtime mediaand entertainment analyst and co-founder of boutique research firmLightshed Partners, says for yearsHollywood insiders doubted Netflix’sfinancial sustainability, arguing thecompany could never pay back thedebt it piled up to finance content.“That was their rallying cry, year afteryear,” Greenfield says.
But with increased scale the eco-nomics have begun to work in Net-flix’s favor, increasing the competitiverisks for traditional studios. Green-field estimates that the company’s 200million subscribers represent about600 million viewers, roughly twicethe number of people that bought tick-ets for Avengers: Endgame, the mostsuccessful movie of all time.
That huge audience—and the cashflow it generates—should enable Net-flix to make movies and TV shows ateven greater scale without sacrificingquality. Netflix is now promising todeliver at least one new movie a weekin 2021, just as traditional film studiosstruggle with low attendance at U.S.movie theaters.
Separately, Netflix has proven thatit can retain customers even as itraises prices. Despite an October pricehike in the U.S., net subscriber growthin the U.S./Canada market last quarterwas triple what Wall Street had ex-pected. Greenfield notes that the $14monthly price remains a bargain in
the world of entertainment.The worry that Netflix would lose
market share to streaming newcomerslike Disney+, Peacock, or HBOMaxalso seems to be melting away. So far,there’s no evidence consumers areswitching services; what they’re doingis adding new subscriptions. The ser-vices can all thrive, Greenfield says.The losers are traditional TV bundlerslike cable and satellite TV.
Greenfield says the conversation onNetflix has shifted from “when theyare going to run out of money” to“how are they going to spend all thiscash.” For the next few years, hethinks Netflix will do the basics—pay-ing down debt and buying back stock,while beefing up content offerings inlarge overseas markets such as India.In 2024 and beyond, he says, youcould see it start to invest in new ar-eas—potentially sports, news, music,or gaming.
Morgan Stanley analyst BenjaminSwinburne last week reiterated hisOverweight rating on Netflix shares,upping his price target from $650 to$700, suggesting another 20% ofgains from the recent close. He seesthe breakthrough to positive cash flowas an opportunity for Netflix to pressits advantage.
“Longer term, it would not surpriseus if Netflix is more open about mov-ing into new verticals such as sports,or if it takes a more opportunistic ap-proach to acquisitions,” Swinburnewrote. “For now, however, it is likelyto return excess [free cash flow] toshareholders.”
And there is nothing wrong withthat. B
Kamachi209/D
reamstime
The conversation about Netflix has shiftedfrom “when they are going to run out ofmoney” to “how are they going to spend allthis cash,” says veteran media analyst RichGreenfield of Lightshed Partners.

January 25, 2021 BARRON’S 37
Looking for a trading firm that supports you?We’ve got your back.When you need trading expertise, you have it. Our trading specialists are some of the best inthe industry. Schwab is rated a Top Broker for Customer Service by Investor’s Business Daily.
When you’re placing trades, you can expect fast, high-quality order executions that canoften save you money.
When you’re not 100% happy,we’ll work with you to make things right. Schwab is the onlybrokerage firm to offer a Satisfaction Guarantee.
From Investor’s Business Daily, January 27, 2020. © 2020 Investor’s Business Daily, Inc. All rights reserved. Used by permission and protected by the Copyright Laws of the United States.Price improvement and savings per order based on performance for market orders in S&P 500 stocks with order size between 500– 1,999 shares as of Q3 2020. Price improvement is not guaranteed. Past performanceis no guarantee of future results.If you are not completely satisfied for any reason, at your request Charles Schwab & Co., Inc. (“Schwab”), Charles Schwab Bank (“Schwab Bank”), or another Schwab affiliate, as applicable, will refund any eligible feerelated to your concern within the required time frames. Schwab reserves the right to change or terminate the guarantee at any time. Go to schwab.com/satisfaction to learn what’s included and how it works.© 2020 Charles Schwab & Co., Inc. All rights reserved. Member SIPC. (0920-0A3P) ADP112284-00
It’s time for a change. It’s time to trade up to Schwab.Learn more at Schwab.com/Trading
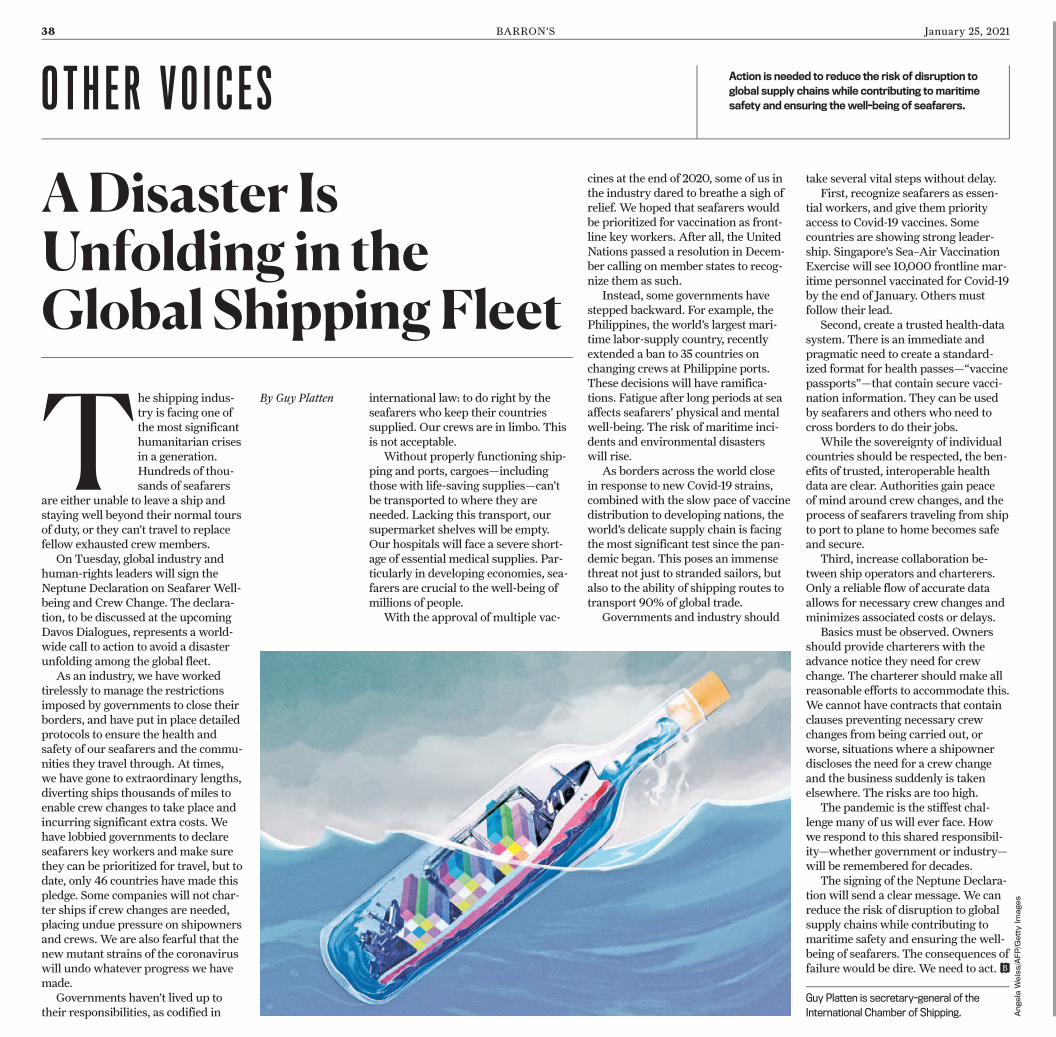
38 BARRON’S January 25, 2021
O T H E R V O I C E S Action is needed to reduce the risk of disruption toglobal supply chainswhile contributing tomaritimesafety and ensuring thewell-being of seafarers.
A Disaster IsUnfolding in theGlobal Shipping Fleet
T he shipping indus-try is facing one ofthe most significanthumanitarian crisesin a generation.Hundreds of thou-sands of seafarers
are either unable to leave a ship andstaying well beyond their normal toursof duty, or they can’t travel to replacefellow exhausted crewmembers.
On Tuesday, global industry andhuman-rights leaders will sign theNeptune Declaration on SeafarerWell-being and Crew Change. The declara-tion, to be discussed at the upcomingDavos Dialogues, represents a world-wide call to action to avoid a disasterunfolding among the global fleet.
As an industry, we have workedtirelessly to manage the restrictionsimposed by governments to close theirborders, and have put in place detailedprotocols to ensure the health andsafety of our seafarers and the commu-nities they travel through. At times,we have gone to extraordinary lengths,diverting ships thousands of miles toenable crew changes to take place andincurring significant extra costs. Wehave lobbied governments to declareseafarers key workers and make surethey can be prioritized for travel, but todate, only 46 countries have made thispledge. Some companies will not char-ter ships if crew changes are needed,placing undue pressure on shipownersand crews.We are also fearful that thenewmutant strains of the coronaviruswill undo whatever progress we havemade.
Governments haven’t lived up totheir responsibilities, as codified in
international law: to do right by theseafarers who keep their countriessupplied. Our crews are in limbo. Thisis not acceptable.
Without properly functioning ship-ping and ports, cargoes—includingthose with life-saving supplies—can’tbe transported to where they areneeded. Lacking this transport, oursupermarket shelves will be empty.Our hospitals will face a severe short-age of essential medical supplies. Par-ticularly in developing economies, sea-farers are crucial to the well-being ofmillions of people.
With the approval of multiple vac-
cines at the end of 2020, some of us inthe industry dared to breathe a sigh ofrelief. We hoped that seafarers wouldbe prioritized for vaccination as front-line key workers. After all, the UnitedNations passed a resolution in Decem-ber calling on member states to recog-nize them as such.
Instead, some governments havestepped backward. For example, thePhilippines, the world’s largest mari-time labor-supply country, recentlyextended a ban to 35 countries onchanging crews at Philippine ports.These decisions will have ramifica-tions. Fatigue after long periods at seaaffects seafarers’ physical and mentalwell-being. The risk of maritime inci-dents and environmental disasterswill rise.
As borders across the world closein response to new Covid-19 strains,combined with the slow pace of vaccinedistribution to developing nations, theworld’s delicate supply chain is facingthe most significant test since the pan-demic began. This poses an immensethreat not just to stranded sailors, butalso to the ability of shipping routes totransport 90% of global trade.
Governments and industry should
By Guy Platten
take several vital steps without delay.First, recognize seafarers as essen-
tial workers, and give them priorityaccess to Covid-19 vaccines. Somecountries are showing strong leader-ship. Singapore’s Sea–Air VaccinationExercise will see 10,000 frontline mar-itime personnel vaccinated for Covid-19by the end of January. Others mustfollow their lead.
Second, create a trusted health-datasystem. There is an immediate andpragmatic need to create a standard-ized format for health passes—“vaccinepassports”—that contain secure vacci-nation information. They can be usedby seafarers and others who need tocross borders to do their jobs.
While the sovereignty of individualcountries should be respected, the ben-efits of trusted, interoperable healthdata are clear. Authorities gain peaceof mind around crew changes, and theprocess of seafarers traveling from shipto port to plane to home becomes safeand secure.
Third, increase collaboration be-tween ship operators and charterers.Only a reliable flow of accurate dataallows for necessary crew changes andminimizes associated costs or delays.
Basics must be observed. Ownersshould provide charterers with theadvance notice they need for crewchange. The charterer should make allreasonable efforts to accommodate this.We cannot have contracts that containclauses preventing necessary crewchanges from being carried out, orworse, situations where a shipownerdiscloses the need for a crew changeand the business suddenly is takenelsewhere. The risks are too high.
The pandemic is the stiffest chal-lenge many of us will ever face. Howwe respond to this shared responsibil-ity—whether government or industry—will be remembered for decades.
The signing of the Neptune Declara-tion will send a clear message.We canreduce the risk of disruption to globalsupply chains while contributing tomaritime safety and ensuring the well-being of seafarers. The consequences offailure would be dire.We need to act. B
Guy Platten is secretary-general of theInternational Chamber of Shipping. A
ngela
Weiss/A
FP/G
ettyIm
ages

January 25, 2021 BARRON’S 39
MA I L B A G Send letters to [email protected]. To be considered forpublication, correspondence must bear the writer’s name,address, and phone number. Letters are subject to editing.
The Readback, a podcast taking youinside the latest stories, is availablewherever you listen to podcasts.
income equality. Check the graduationand truancy rates. It isn’t racism whenyou don’t hire a candidate—no matterthe race—because he or she doesn’thave the needed skills.Charles NekvasilColumbus, Ohio
To the Editor:I was much impressed with JamesAnderson’s comment, “What lastyear makes me think is that we allneed a huge dose of humility.” Thatresonates with all of us who havesought to be on guard against theDunning-Kruger effect [a cognitivebias whereby people overestimatetheir own competence in a given do-main]. And it was also interesting tonote that Anderson’s 2020 picksperformed best among your experts.
Clearly, there is no performance-based invitation to return, as one ofyour experts had 75% of her long selec-tions down 20% to 30%—in a strongmarket—and 100% of her shorts up byas much as 60% to almost 80%. A finalthanks to Anderson for not giving hisviews on the economic prospects of theUnited Kingdom. I am able to sleepbetter as a result, although, like a child,I occasionally wake up screaming,thinking about the economic future ofthe U.K. Singapore-on-the-Thames?Delusional.James D. Alban-DaviesRye, N.Y.
To the Editor:Thank you for your article makinga case for index funds. Actually, itwasn’t really an article on indexfunds. It was your 2020 Roundtablereview of stock picks. Of a total of 58stocks picked by the experts, only 15beat the S&P 500. Like I said, a casefor index funds.Steve MartinNorthbrook, Ill.
To the Editor:As always, I enjoyed reading yourinsightful Roundtable, but given thetimes and circumstances, a namechange is in order: the RectangularTableau.Paul MattenNaples, Fla.
Free-Speech RightsTo the Editor:With regard to “Why RepealingSection 230 Could Ruin the Internet”(Tech Trader, Jan. 15), the irony of thedigital information age is that it hasgiven respectability to uninformed,gauche, even ignorant opinion.YouTube, Facebook, Google+, Twitter,10 million bloggers bombard us 24/7.
We don’t need Section 230 because itis redundant.We have something calledthe First Amendment. I avoid social-media sophistry because it has distortedfreedom of speech into hate speechwithimpunity. Section 230 is a lawyer’sdream. It has allowed government tointerfere where interference is unwar-ranted.We need only one set of lawsthat apply to all media. That lawwasestablished in the Bill of Rights in 1791.
I subscribe to TheWall Street Jour-nal and Barron’s because they do anexcellent job of attempting to presentonly the most tempered and accurateinformation. Being an adult means youare responsible for your conduct.B.J. KhalifahGrosse Pointe Park, Mich.
To the Editor:Eric J. Savitz is correct that makingamendments to the 1996 Communica-tions Decency Act should be studiedcarefully and not made in great haste.The U.S. Senate will probably stop in-temperate measures from becominglaw, but manymembers of Congressare whipping themselves into a frenzyfor different reasons.
However, any free-speech rights wemay still have are more important tome than the market value or utility ofAmazon.com, Twitter, or Facebook.We
cannot delegate the regulation of theFirst Amendment to three private com-panies with their own ideas of whatfree-speech rights we get to have.StephenWeeksHouston
“You can kick the can downthe road only so far before youcome to a dead end.”Fred Johnson, on Barrons.com
Stock PicksAnd IdeasFor 2021To the Editor:Regarding “The 2021 Roundtable” (Cover Story, Jan. 15),I agree that there will be a lot of pent-up demand onceenough people get the vaccine, but what happens afterthe party? High stock valuations, a $27 trillion debt that’sclimbing rapidly, rampant speculation in initial publicofferings, stocks like Tesla with a market cap higher thanthe top 11 car companies combined, Bitcoin going throughthe roof, retiring baby boomers, record low interest ratesthat have nowhere to go but up, and inflation. It’s not 2021I’m worried about; it’s when all of these issues have to beaddressed. You can kick the can down the road only sofar before you come to a dead end.Fred JohnsonOn Barrons.com
To the Editor:Meryl Witmer’s comments need to be repeated againand again. We are not going to get income equality untilwe get education equality. Public schools in city aftercity, including Chicago, my former home, are not pre-paring young people for careers—and certainly not for
Seeking NominationsOn Educational Inclusion
Barron’s is looking to recognize or-ganizations that are having a mean-ingful impact in addressing unevenaccess to education in the U.S.
Educational inclusion is thetheme of this year’s installment ofthe Barron’s Celebrates program.Challenges that parents and chil-dren face in gaining access to educa-tional resources aren’t new. But dif-ficulties have intensified with theCovid-19 crisis and remote learning.
Organizations that are making adifference are encouraged to partici-pate. Programs and organizationseligible include those that help pro-vide access to technology and tutor-ing; support schools and teachers inproviding access to learning; andassist families that face difficultiesjuggling responsibilities for at-hometeaching, caregiving, and work. Pro-grams should serve kindergarten to12th-grade education in the U.S.
Up to three organizations will beselected to be highlighted in Barron’sand at an event later this year. En-trants will be judged on purpose,scalability, and effectiveness. Bar-ron’swill name independent judgeswho will review the submissions.
The deadline for entering isFeb. 15. Nominations may be sub-mitted using this link: barrons.com/celebrates/nominate.
40 BARRON’S January 25, 2021
©2020 MFS Investment Management 41613.2
CAN YOUR FIXED INCOME STAND THE TEST OF TIME?Markets change, but the role fixed income plays shouldn’t. It should aim to provide the essentials
of income, diversification and risk management for your clients. That’s why, for more than 50 years,
MFS has held an unwavering belief in our traditional approach. We call it Essential Fixed Income®.
See why we focus on rigorously researched credit atmfs.com/fixedincome
EssentialFixed Income®
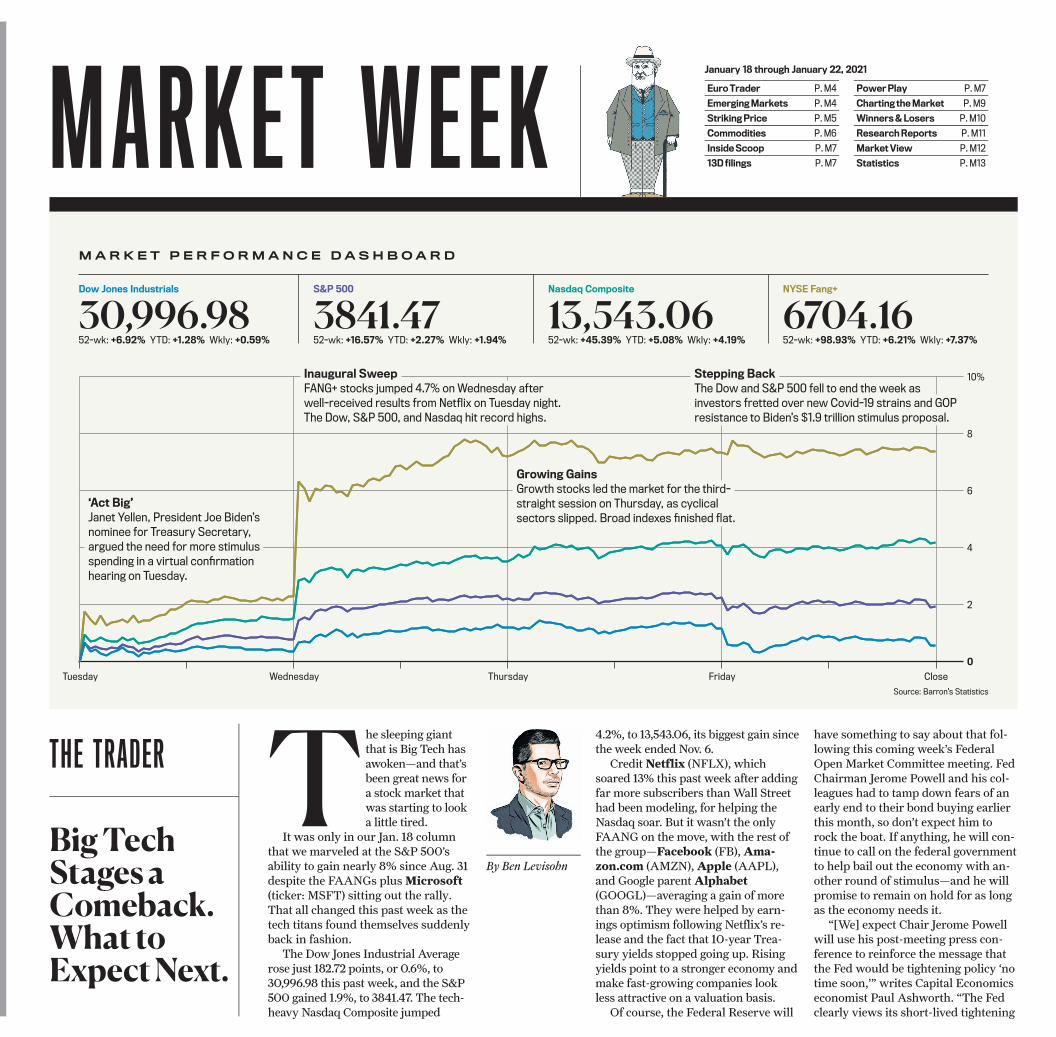
CYAN
MAGENTA
YELLOW
BLACK
Composite
Composite
CMYKMARKET WEEK
January 18 through January 22, 2021
EuroTrader P.M4
EmergingMarkets P.M4
StrikingPrice P.M5
Commodities P.M6
InsideScoop P.M7
13D filings P.M7
PowerPlay P.M7
Charting theMarket P.M9
Winners&Losers P.M10
ResearchReports P.M11
MarketView P.M12
Statistics P.M13
30,996.9852-wk: +6.92% YTD: +1.28% Wkly: +0.59%
Dow Jones Industrials
3841.47S&P 500
52-wk: +16.57% YTD: +2.27% Wkly: +1.94%
13,543.06Nasdaq Composite
52-wk: +45.39% YTD: +5.08% Wkly: +4.19%
6704.16NYSE Fang+
52-wk: +98.93% YTD: +6.21% Wkly: +7.37%
10%
0
4
2
6
8
Tuesday Wednesday Thursday Close
Source: Barron’s Statistics
Friday
M A R K E T P E R F O R M A N C E D A S H B O A R D
‘Act Big’Janet Yellen, President Joe Biden’snominee for Treasury Secretary,argued the need for more stimulusspending in a virtual confirmationhearing on Tuesday.
Inaugural SweepFANG+ stocks jumped 4.7% on Wednesday afterwell-received results from Netflix on Tuesday night.The Dow, S&P 500, and Nasdaq hit record highs.
Stepping BackThe Dow and S&P 500 fell to end the week asinvestors fretted over new Covid-19 strains and GOPresistance to Biden’s $1.9 trillion stimulus proposal.
Growing GainsGrowth stocks led the market for the third-straight session on Thursday, as cyclicalsectors slipped. Broad indexes finished flat.
THE TRADER
Big TechStages aComeback.What toExpect Next.
T he sleeping giantthat is Big Tech hasawoken—and that’sbeen great news fora stock market thatwas starting to looka little tired.
It was only in our Jan. 18 columnthat we marveled at the S&P 500’sability to gain nearly 8% since Aug. 31despite the FAANGs plusMicrosoft(ticker: MSFT) sitting out the rally.That all changed this past week as thetech titans found themselves suddenlyback in fashion.
The Dow Jones Industrial Averagerose just 182.72 points, or 0.6%, to30,996.98 this past week, and the S&P500 gained 1.9%, to 3841.47. The tech-heavy Nasdaq Composite jumped
4.2%, to 13,543.06, its biggest gain sincethe week ended Nov. 6.
CreditNetflix (NFLX), whichsoared 13% this past week after addingfar more subscribers thanWall Streethad been modeling, for helping theNasdaq soar. But it wasn’t the onlyFAANG on the move, with the rest ofthe group—Facebook (FB),Ama-zon.com (AMZN),Apple (AAPL),and Google parentAlphabet(GOOGL)—averaging a gain of morethan 8%. They were helped by earn-ings optimism following Netflix’s re-lease and the fact that 10-year Trea-sury yields stopped going up. Risingyields point to a stronger economy andmake fast-growing companies lookless attractive on a valuation basis.
Of course, the Federal Reserve will
have something to say about that fol-lowing this coming week’s FederalOpen Market Committee meeting. FedChairman Jerome Powell and his col-leagues had to tamp down fears of anearly end to their bond buying earlierthis month, so don’t expect him torock the boat. If anything, he will con-tinue to call on the federal governmentto help bail out the economy with an-other round of stimulus—and he willpromise to remain on hold for as longas the economy needs it.
“[We] expect Chair Jerome Powellwill use his post-meeting press con-ference to reinforce the message thatthe Fed would be tightening policy ‘notime soon,’”writes Capital Economicseconomist Paul Ashworth. “The Fedclearly views its short-lived tightening
By Ben Levisohn
M40 X W L C 10 11 12 H G R P BARRON’S 4 8 3 F A D 6 7 9 0 I January 25, 2021
Wewould like to welcome and thank the following sponsors andschools for participating in Barron’s in Education to improve financial
proficiency for the next generation.
Helping develop the next generationof business leaders.If you are interested in partnering with Barron’s in Educationand to learn more contact: [email protected]
© 2021 Dow Jones & Company, Inc. All rights reserved. 4E5157
Peter A. RohrManaging Director
PrivateWealth AdvisorThe Rohr Group
Merrill LynchWealthManagement
Will GoodsonSeniorVice President - InvestmentsGoodson & Nichols FinancialGroup ofWells Fargo Advisors
William F. Medico IIICo-Founder & Senior PartnerJacobiWealth Advisors
Carol AndersonSeniorWealth Planner
Michael J. HirthlerChief InvestmentOfficer&FounderJacobi Capital Management, LLC
TommyMcBrideManagingDirector
WealthManagementAdvisorMcBride&Associates
Merrill LynchWealthManagement
P2B
W025000-0-M
00100-1--------XA
CL,C
N,C
X,D
L,DM
,DX
,EE
,EU
,FL,H
O,K
C,M
W,N
C,N
E,N
Y,P
H,P
N,R
M,S
A,S
C,S
L,SW
,TU
,WB
,WE
BG
,BM
,BP
,CC
,CH
,CK
,CP
,CT
,DN
,DR
,FW
,HL,H
O,LA
,LD,LG
,LK,M
I,ML,P
I,PV
,RO
,TD
,WO
P2B
W02
5000
-0-M
0010
0-1-
----
---X
A
M2 BARRON’S January 25, 2021
several years ago as a mistake and is muchmore likely to err on the side of caution thistime around—to avoid another ‘taper tan-trum’ in the bond markets.”
But what’s really needed now is progressin combating Covid-19. As the virus goes, sogoes the market. In 2020, that meantwatching the change in the number ofCovid cases for evidence that the reopeningwas continuing apace. Now, the market istaking its cues from the pace of vaccina-tions, in particular the percentage of thepopulation that is vaccinated weekly, ex-plains UBS strategist Keith Parker.
The small-company Russell 2000 hasbeen especially responsive to accelerationsin the pace of dosing—the number of peo-ple getting vaccinated is now over900,000 a day—and could get a boost ifthat number continues to increase. ByParker’s math, a doubling in the rate couldlift the index by an additional 6% to 9% bythe middle of the second quarter, and theS&P 500 by 3% to 5%.
“The current number of allocated U.S.doses points to potential for the pace todouble, though bottlenecks still remain,” hewrites. “Removing bottlenecks for adminis-tering doses would present an upside casenear-term in our view.”
That doesn’t mean we shouldn’t expect acorrection—and perhaps soon. Lori Calva-sina, chief U.S. equity strategist at RBC Capi-tal Markets, notes the S&P 500 has beenfollowing a pattern typical of recessionssince 1990, one that sees the recovery occurin three phases: an initial recovery, a periodof consolidation, and a second rebound.
The initial recovery has lasted an averageof 10 months, with an average return of48%. That was followed by a period of con-solidation that lasted from two to sevenmonths and saw stocks sink an average of17%. That was then followed by anotherrally that saw stocks gain an average of 19%.
The current bounce from theMarch lowshas lasted about 10 months and produced
gains of just over 71%. If the market followsthe historical pattern, it should pull back byspring—but that will be a buying opportu-nity. “My assumption is that we’ll see a con-tinuation of the recovery rather than a dou-ble-dip recession,” Calvasina says. “If youthink that, you have to buy the dip.”
But it may also be time to add some pro-tection to your portfolio. The market’s de-mand for risky, high-beta, cyclically orientedstocks has meant that stocks with low vola-tility have gotten left behind. The returndifferential between the MSCI USAMini-mumVolatility Index, which owns a portfo-lio of low-volatility stocks, and the MSCIUSA Index is now at its widest level since1999, says John Kolovos, chief technicalstrategist at Macro Risk Advisors. Owningsome of these left-behind companies couldbe the way to add some ballast to a portfolioin case of a drop, Kolovos says.
“Buy some utilities, buy some staples,” heexplains. “Those are the most oversold in anenvironment of market froth and excess.”
Just be sure to sell them again once thecorrection is over.
Revenge of the NerdsLike muscle cars revving their engines at astoplight, shares of FordMotor (F) andGeneral Motors (GM) finally took off thispast week. Long-suffering investors arebreathing a sigh of relief, but they shouldn’ttake profits just yet. The ride isn’t over.
GM stock rose 11% this holiday-short-ened week, and Ford shares gained 17%,leaving both stocks up more than 30% yearto date. It’s the best start to the year since1987. What’s all the excitement about? In-vestors are finally giving these traditionalauto makers credit for their electric-vehicleand autonomous-driving investments.
GM kicked things off Tuesday, announc-ing an investment fromMicrosoft in itsCruise autonomous-driving company thatGM bought in 2016. The deal values Cruiseat about $30 billion. GM owns roughly 70%
Vital SignsFriday's Week's Week's
Close Change %Chg.
DJ Industrials 30996.98 +182.72 +0.59
DJTransportation 12856.54 -89.74 -0.69
DJUtilities 857.94 -3.15 -0.37
DJ65Stocks 10248.19 +11.62 +0.11
DJUSMarket 972.49 +17.96 +1.88
NYSEComp. 14951.84 +57.68 +0.39
NYSEAmerComp. 2500.31 -9.21 -0.37
S&P500 3841.47 +73.22 +1.94
S&PMidCap 2462.53 +38.50 +1.59
S&PSmallCap 1231.70 +19.79 +1.63
Nasdaq 13543.06 +544.56 +4.19
ValueLine (arith.) 8435.18 +82.28 +0.99
Russell 2000 2168.76 +45.56 +2.15
DJUSTSMFloat 40458.32 +760.90 +1.92
LastWeek WeekEarlier
NYSEAdvances 1,956 1,827
Declines 1,285 1,402
Unchanged 42 50
NewHighs 489 673
NewLows 13 34
AvDailyVol (mil) 4,805.7 4,947.2
Dollar (Finex spot index) 90.21 90.77
T-Bond (CBTnearby futures) 168-280 168-260
CrudeOil (NYM light sweet crude) 52.27 52.36
InflationKR-CRB (FuturesPrice Index) 172.85 175.25
Gold (CMXnearby futures) 1855.70 1829.30
Interactive Brokers Rated #1Best Online Broker 2020 by Barron’s*
01-IB21-1400CH1358
ibkr.com/compareus
IBKR chargesmargin loan rates1
from0.75% to 1.59%
Member - NYSE, FINRA, SIPC – *Interactive Brokers rated #1, Best Online Broker according to Barron’sBest Online Brokers Survey of 2020: February 21, 2020. For more information see, ibkr.com/info -Barron’s is a registered trademark of Dow Jones & Co. Inc. [1] Margin Loan rate as of 01/04/2021.IB calculates the interest charged on margin loans using the applicable rates for each interest rate tierlisted on its website. Rates shown apply to IBKR Pro clients only. Rates subject to change.For additional information on margin loan rates, see ibkr.com/interest
Trading on margin is only for sophisticated investors withhigh risk tolerance. You may lose more than your initial investment.
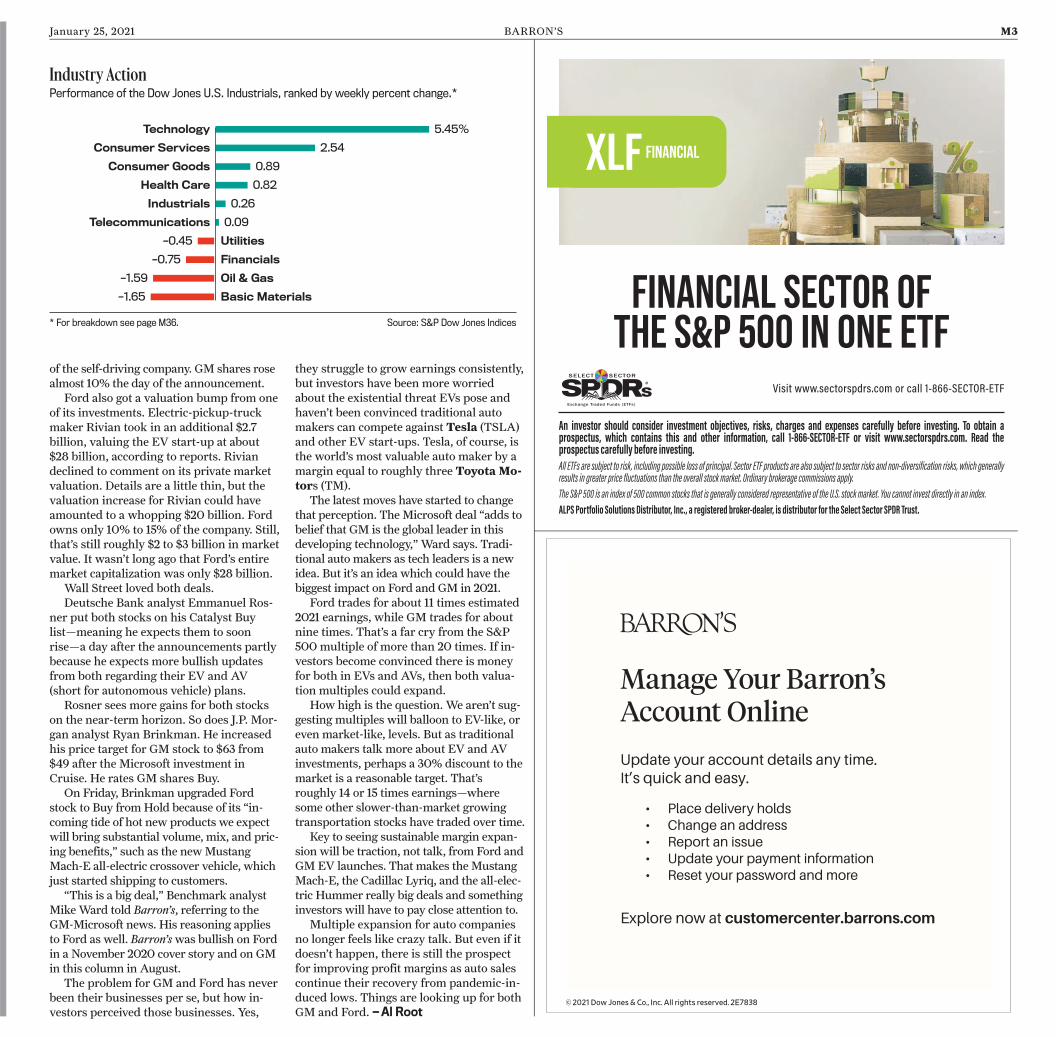
January 25, 2021 BARRON’S M3
of the self-driving company. GM shares rosealmost 10% the day of the announcement.
Ford also got a valuation bump from oneof its investments. Electric-pickup-truckmaker Rivian took in an additional $2.7billion, valuing the EV start-up at about$28 billion, according to reports. Riviandeclined to comment on its private marketvaluation. Details are a little thin, but thevaluation increase for Rivian could haveamounted to a whopping $20 billion. Fordowns only 10% to 15% of the company. Still,that’s still roughly $2 to $3 billion in marketvalue. It wasn’t long ago that Ford’s entiremarket capitalization was only $28 billion.
Wall Street loved both deals.Deutsche Bank analyst Emmanuel Ros-
ner put both stocks on his Catalyst Buylist—meaning he expects them to soonrise—a day after the announcements partlybecause he expects more bullish updatesfrom both regarding their EV and AV(short for autonomous vehicle) plans.
Rosner sees more gains for both stockson the near-term horizon. So does J.P. Mor-gan analyst Ryan Brinkman. He increasedhis price target for GM stock to $63 from$49 after the Microsoft investment inCruise. He rates GM shares Buy.
On Friday, Brinkman upgraded Fordstock to Buy fromHold because of its “in-coming tide of hot new products we expectwill bring substantial volume, mix, and pric-ing benefits,” such as the newMustangMach-E all-electric crossover vehicle, whichjust started shipping to customers.
“This is a big deal,” Benchmark analystMikeWard told Barron’s, referring to theGM-Microsoft news. His reasoning appliesto Ford as well. Barron’swas bullish on Fordin a November 2020 cover story and on GMin this column in August.
The problem for GM and Ford has neverbeen their businesses per se, but how in-vestors perceived those businesses. Yes,
they struggle to grow earnings consistently,but investors have been more worriedabout the existential threat EVs pose andhaven’t been convinced traditional automakers can compete against Tesla (TSLA)and other EV start-ups. Tesla, of course, isthe world’s most valuable auto maker by amargin equal to roughly three Toyota Mo-tors (TM).
The latest moves have started to changethat perception. TheMicrosoft deal “adds tobelief that GM is the global leader in thisdeveloping technology,”Ward says. Tradi-tional auto makers as tech leaders is a newidea. But it’s an idea which could have thebiggest impact on Ford and GM in 2021.
Ford trades for about 11 times estimated2021 earnings, while GM trades for aboutnine times. That’s a far cry from the S&P500 multiple of more than 20 times. If in-vestors become convinced there is moneyfor both in EVs and AVs, then both valua-tion multiples could expand.
How high is the question. We aren’t sug-gesting multiples will balloon to EV-like, oreven market-like, levels. But as traditionalauto makers talk more about EV and AVinvestments, perhaps a 30% discount to themarket is a reasonable target. That’sroughly 14 or 15 times earnings—wheresome other slower-than-market growingtransportation stocks have traded over time.
Key to seeing sustainable margin expan-sion will be traction, not talk, from Ford andGMEV launches. That makes the MustangMach-E, the Cadillac Lyriq, and the all-elec-tric Hummer really big deals and somethinginvestors will have to pay close attention to.
Multiple expansion for auto companiesno longer feels like crazy talk. But even if itdoesn’t happen, there is still the prospectfor improving profit margins as auto salescontinue their recovery from pandemic-in-duced lows. Things are looking up for bothGM and Ford. —Al Root
Industry ActionPerformance of the Dow Jones U.S. Industrials, ranked by weekly percent change.*
Technology 5.45%
Consumer Services 2.54
Consumer Goods 0.89
Health Care 0.82
Industrials 0.26
Telecommunications 0.09
Utilities–0.45
Financials–0.75
Oil & Gas–1.59
Basic Materials–1.65
Source: S&P Dow Jones Indices* For breakdown see page M36.
Visit www.sectorspdrs.com or call 1-866-SECTOR-ETF
FINANCIAL SECTOR OFTHE S&P 500 IN ONE ETF
An investor should consider investment objectives, risks, charges and expenses carefully before investing. To obtain aprospectus, which contains this and other information, call 1-866-SECTOR-ETF or visit www.sectorspdrs.com. Read theprospectus carefully before investing.
All ETFs are subject to risk, including possible loss of principal. Sector ETF products are also subject to sector risks and non-diversification risks, which generallyresults in greater price fluctuations than the overall stock market. Ordinary brokerage commissions apply.
The S&P 500 is an index of 500 common stocks that is generally considered representative of the U.S. stock market. You cannot invest directly in an index.
ALPS Portfolio Solutions Distributor, Inc., a registered broker-dealer, is distributor for the Select Sector SPDR Trust.
©2021 Dow Jones & Co., Inc. All rights reserved. 2E7838
• Place delivery holds• Change an address• Report an issue• Update your payment information• Reset your password and more
Manage Your Barron’sAccount Online
Explore now at customercenter.barrons.com
Update your account details any time.It’s quick and easy.

M4 BARRON’S January 25, 2021
E U R O P E A N T R A D E R
G old and silver have alwaysbeen havens for investors dur-ing difficult times, but findingan entry point can be a chal-
lenge. Investing in a precious-metalsminer is one option.
London-listed Polymetal Interna-tional (ticker: POLY.UK) is a top-10 goldproducer and a top-5 silver producer,with assets in Russia and Kazakhstan.
Shares in the Anglo-Russian firm haverisen 212% over the past five years and39.1% in the past 12 months, to 16.94pounds sterling ($23 ), as investors seek-ing to reduce volatility in their portfolioand hedge against inflation boosted de-mand.
Gold climbed to an eight-week high to$1,900 an ounce on the first day of trad-ing of the new year, as the emergence ofmore infectious strains of Covid-19 trig-gered deeper global lockdowns.
Polymetal, which has nine gold andsilver-producing mines, gave an updateon its production pipeline at the end oflast year, promising a 17% increase ingold volume over the next five years. Thecompany sports a 3.5% dividend yield.
Krishan Agarwal, an analyst at Citi,has marked the stock a Buy and thinks itcould rise further because of the com-pany’s significant gold reserves. Poly-metal has boosted its reserve estimates atits Kyzyl mine in Russia, implying a 25%increase.
That should extend the mine’s life to30 years, one of the longest in the globalgold universe, Agarwal wrote at the endof last year. He has a £24.50 price targeton Polymetal. He added: “We expect thecompany to beat its 2020 production andcash cost guidance.”
RBC Capital Markets set the same tar-get for the stock in a December note, andRussian investment bank VTB Capitalestimates a 124% rise, to £38.
Polymetal, which has a market value
of £8 billion, employs 11,611 workers andis the second-largest gold producer inRussia. It fetches a multiple of 8.7 timesthis year’s expected earnings and is val-ued at a 20% premium to its peers. TheFTSE 100–listed company posted a pre-tax profit of $618 million for the 2020calendar year, up from $426 million in2018, on sales of $2.2 billion.
Maxim Nazimok, Polymetal’s chieffinancial officer, tells Barron’s that 2020“was certainly challenging for the globalmining industry due to the Covid-19 out-break.” Despite this, Polymetal avoided“any meaningful disruption to operationsand delivered on our production targets,”he said. “We have also continued to movewith our growth projects on schedule.”
Polymetal generated record cash flow,thanks in part to higher precious metalsprices, lower local currencies and robustoperating results, he said. In the yearahead, Polymetal will see the “commis-sioning and start of production at Nezhdamine and progress on other projects inour long-term pipeline,” Nazimok said.
The company, which dates to 1998,was founded by private-equity boss Alex-ander Nesis, who still retains a 28% stakein the business. Established in Saint Pe-tersburg, Polymetal accumulated minesand focused on assets that had beenlargely left inactive since Soviet-era ex-ploration.
The business is well-positioned tobenefit from the transfer to sustainableenergy because it owns platinum metalmines. These also contain palladium,which with copper form the cells used forsolar power.
In a December note on mining, Citianalysts wrote, “We remain very bullishon palladium and rhodium, with palla-dium set to reach $3,000 an ounce overthe next 6 to 12 months.” WhilePolymetal owns mines containing palla-dium, it has yet to decide to extract it.
Polymetal’s stock may be a bright spotfor investors this year. B
By Rupert Steiner
EM E R G I N G M A R K E T S
Covid Can’t Stop India’sStock Market Rally
I ndia’s coronavirus vaccine cam-paign, which kicked off Jan. 16, ishaving a rocky start. Thanks to itsvaccine-production prowess, the
country has dibs on 500 million doses ofthe promising Oxford-AstraZeneca jab.Instead, Prime Minister Narendra Modi’sgovernment is distributing a domesticallydesigned vaccine from Bharat Biotech,with no published trial results. Somefront-of-line medical workers are saying,“No thanks.”
“It’s an odd move to go with an optionthat has no data,” says Andrea Taylor, ascientist at the Duke Global Health Inno-vation Center. “I’m quite puzzled.”
Investors couldn’t care less, however.Life is all but back to normal in India’scities, a V-shaped-looking recovery isunder way, and markets are on fire. TheiShares MSCI India exchange-tradedfund (ticker: INDA) has jumped by aquarter since Nov. 1, outpacing even the18% gain in Chinese stocks.
“The vaccination drive is a noneventfrom the market’s point of view,” saysJimeet Modi, CEO of Samco Securities inMumbai (and no relation to the head ofgovernment). “Cars and housing sales arein strong recovery, and you can’t book adecent hotel room until March.”
One market driver has nothing to dowith India itself. IT-outsourcing power-houses such as Infosys (INFY) and TataConsultancy Services (532540. India),No. 3 and 4 in the market index, havesoared on anticipation of global post-Covid demand. But the nation of 1.4 bil-lion is also beating the pandemic for rea-sons not entirely understood, butpossibly due to a young population (aver-age age 27), high previous exposure toinfectious diseases, and signs of herdimmunity in the densest population cen-ters. Whatever the explanation, reportedcases and deaths are down sixfold from apeak in September, unleashing pent-up
consumer demand.“The Covid situation has astonishingly
normalized,” says Venkat Pasupuleti, co-portfolio manager for India at Dalton In-vestments. “White-collar people are start-ing to spend the savings they racked up.”
IT shares are starting to look fullyvalued, Pasupuleti and Modi say. Butdomestically facing firms have benefitedstructurally from the pandemic, by cut-ting costs and gobbling market sharefrom distressed competitors in India’shuge informal sector.
“The stock market is skewed towardcompanies that benefit from the crisis,”Pasupuleti says. Dalton is particularlyleaning toward “large front-line banks”such as ICICI Bank (IBN) andAxisBank (532215.India), where nonperform-ing loan piles have proved smaller thanpreviously feared.
A longer-term boost for India couldcome fromModi’s latest plan to boostmanufacturing, known as the produc-tion-linked incentive, says Rohit Chopra,an emerging markets portfolio managerat Lazard Asset Management.
The program looks to filch jobs fromChina by offering generous subsidies formaking a wide variety of goods in India.It could turn the country into an exporterof cellphones, auto parts, and other lucra-tive wares, Chopra predicts. “We havesome of the highest India weightings inour portfolio’s history right now,” hesays. “There is a really strong case forIndia emerging as a middle-income coun-try over the next decade.”
Public-health expert Taylor warns thatother countries have mistakenly assumedthey were over Covid, and Indian data isunderreported at best. “People are enjoy-ing a false sense of security, and Indiawill pay for it,” she says.
But investors are ready for the ‘20s toroar now. “Very few pockets are exhibit-ing value, but you could see another 20%gain anyway,” Jimeet Modi says. “This isa bull market.” B
By Craig Mellow
Anglo-Russian PolymetalShould Shine for Investors
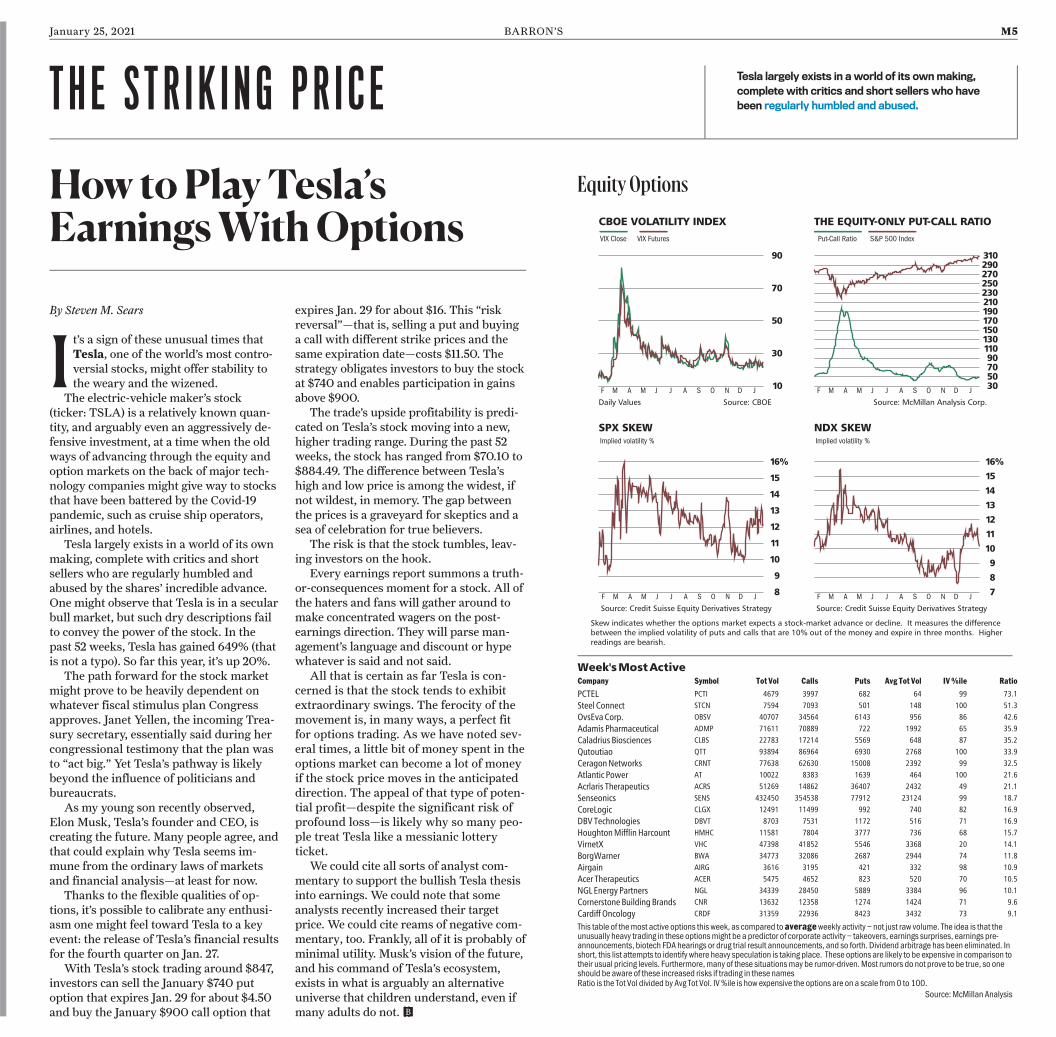
January 25, 2021 BARRON’S M5
T H E S T R I K I N G P R I C E Tesla largely exists in a world of its ownmaking,complete with critics and short sellers who havebeen regularly humbled and abused.
How to Play Tesla’sEarnings With Options
I t’s a sign of these unusual times thatTesla, one of the world’s most contro-versial stocks, might offer stability tothe weary and the wizened.
The electric-vehicle maker’s stock(ticker: TSLA) is a relatively known quan-tity, and arguably even an aggressively de-fensive investment, at a time when the oldways of advancing through the equity andoption markets on the back of major tech-nology companies might give way to stocksthat have been battered by the Covid-19pandemic, such as cruise ship operators,airlines, and hotels.
Tesla largely exists in a world of its ownmaking, complete with critics and shortsellers who are regularly humbled andabused by the shares’ incredible advance.One might observe that Tesla is in a secularbull market, but such dry descriptions failto convey the power of the stock. In thepast 52 weeks, Tesla has gained 649% (thatis not a typo). So far this year, it’s up 20%.
The path forward for the stock marketmight prove to be heavily dependent onwhatever fiscal stimulus plan Congressapproves. Janet Yellen, the incoming Trea-sury secretary, essentially said during hercongressional testimony that the plan wasto “act big.” Yet Tesla’s pathway is likelybeyond the influence of politicians andbureaucrats.
As my young son recently observed,Elon Musk, Tesla’s founder and CEO, iscreating the future. Many people agree, andthat could explain why Tesla seems im-mune from the ordinary laws of marketsand financial analysis—at least for now.
Thanks to the flexible qualities of op-tions, it’s possible to calibrate any enthusi-asm one might feel toward Tesla to a keyevent: the release of Tesla’s financial resultsfor the fourth quarter on Jan. 27.
With Tesla’s stock trading around $847,investors can sell the January $740 putoption that expires Jan. 29 for about $4.50and buy the January $900 call option that
expires Jan. 29 for about $16. This “riskreversal”—that is, selling a put and buyinga call with different strike prices and thesame expiration date—costs $11.50. Thestrategy obligates investors to buy the stockat $740 and enables participation in gainsabove $900.
The trade’s upside profitability is predi-cated on Tesla’s stock moving into a new,higher trading range. During the past 52weeks, the stock has ranged from $70.10 to$884.49. The difference between Tesla’shigh and low price is among the widest, ifnot wildest, in memory. The gap betweenthe prices is a graveyard for skeptics and asea of celebration for true believers.
The risk is that the stock tumbles, leav-ing investors on the hook.
Every earnings report summons a truth-or-consequences moment for a stock. All ofthe haters and fans will gather around tomake concentrated wagers on the post-earnings direction. They will parse man-agement’s language and discount or hypewhatever is said and not said.
All that is certain as far Tesla is con-cerned is that the stock tends to exhibitextraordinary swings. The ferocity of themovement is, in many ways, a perfect fitfor options trading. As we have noted sev-eral times, a little bit of money spent in theoptions market can become a lot of moneyif the stock price moves in the anticipateddirection. The appeal of that type of poten-tial profit—despite the significant risk ofprofound loss—is likely why so many peo-ple treat Tesla like a messianic lotteryticket.
We could cite all sorts of analyst com-mentary to support the bullish Tesla thesisinto earnings. We could note that someanalysts recently increased their targetprice. We could cite reams of negative com-mentary, too. Frankly, all of it is probably ofminimal utility. Musk’s vision of the future,and his command of Tesla’s ecosystem,exists in what is arguably an alternativeuniverse that children understand, even ifmany adults do not. B
By Steven M. Sears
Equity OptionsCBOE VOLATILITY INDEXVIX Close VIX Futures
10
30
50
70
90
F M A M J J A S O N D J
Source: CBOEDaily Values
THE EQUITY-ONLY PUT-CALL RATIOPut-Call Ratio S&P 500 Index
30507090110130150170190210230250270290310
F M A M J J A S O N D J
Source: McMillan Analysis Corp.
SPX SKEWImplied volatility %
8
9
10
11
12
13
14
15
16%
F M A M J J A S O N D J
Source: Credit Suisse Equity Derivatives Strategy
NDX SKEWImplied volatility %
7
8
9
10
11
12
13
14
15
16%
F M A M J J A S O N D J
Source: Credit Suisse Equity Derivatives Strategy
Skew indicates whether the options market expects a stock-market advance or decline. It measures the differencebetween the implied volatility of puts and calls that are 10% out of the money and expire in three months. Higherreadings are bearish.
Week'sMostActiveCompany Symbol Tot Vol Calls Puts AvgTot Vol IV%ile RatioPCTEL PCTI 4679 3997 682 64 99 73.1Steel Connect STCN 7594 7093 501 148 100 51.3OvsEva Corp. OBSV 40707 34564 6143 956 86 42.6Adamis Pharmaceutical ADMP 71611 70889 722 1992 65 35.9Caladrius Biosciences CLBS 22783 17214 5569 648 87 35.2Qutoutiao QTT 93894 86964 6930 2768 100 33.9CeragonNetworks CRNT 77638 62630 15008 2392 99 32.5Atlantic Power AT 10022 8383 1639 464 100 21.6Acrlaris Therapeutics ACRS 51269 14862 36407 2432 49 21.1Senseonics SENS 432450 354538 77912 23124 99 18.7CoreLogic CLGX 12491 11499 992 740 82 16.9DBV Technologies DBVT 8703 7531 1172 516 71 16.9HoughtonMifflin Harcount HMHC 11581 7804 3777 736 68 15.7VirnetX VHC 47398 41852 5546 3368 20 14.1BorgWarner BWA 34773 32086 2687 2944 74 11.8Airgain AIRG 3616 3195 421 332 98 10.9Acer Therapeutics ACER 5475 4652 823 520 70 10.5NGL Energy Partners NGL 34339 28450 5889 3384 96 10.1Cornerstone Building Brands CNR 13632 12358 1274 1424 71 9.6Cardiff Oncology CRDF 31359 22936 8423 3432 73 9.1
This table of themost active options this week, as compared toaverageweekly activity – not just raw volume. The idea is that theunusually heavy trading in these optionsmight be a predictor of corporate activity – takeovers, earnings surprises, earnings pre-announcements, biotech FDA hearings or drug trial result announcements, and so forth. Dividend arbitrage has been eliminated. Inshort, this list attempts to identify where heavy speculation is taking place. These options are likely to be expensive in comparison totheir usual pricing levels. Furthermore,many of these situationsmay be rumor-driven.Most rumors do not prove to be true, so oneshould be aware of these increased risks if trading in these namesRatio is the Tot Vol divided by Avg Tot Vol. IV%ile is how expensive the options are on a scale from0 to 100.
Source:McMillan Analysis
M6 BARRON’S January 25, 2021
Lumber Rally May FadeIf Housing Market Cools
L umber prices more than doubledlast year to touch a record high,but the rally has faded on the backof a rebound in supplies. With the
value of the commodity down sharply inthe new year, prospects for fresh recordshave dimmed.
“The flight to homeownership and thereallocation of discretionary money to-ward home-improvement projects” in thewake of the Covid-19 pandemic contrib-uted to the 2020 rally, says Greg Kuta,president of lumber broker Westline Capi-tal Strategies. “Federal government inter-vention and the creation of free money inthe form of low interest rates” fed home-ownership demand and boosted home-im-provement construction, he says. “Theperfect storm allowed demand to over-whelm housing [as well as] lumber supplyin 2020.”
Lumber futures climbed 115% in 2020,after hitting a record settlement of $928.20per 1,000 board feet on Sept. 1.
Most of the lumber manufacturing sup-ply chain initially shut down whenCovid-19 hit, creating a supply constraint,says Joe Sanderson, managing director ofnatural resources at Domain Timber Advi-sors. That happened at a time when “newhousing starts and the repair-and-remodelsector rose significantly.”
Many lumber manufacturers have sincecome back online, he says, leading to im-proved supply. There has also been a “fun-damental change” in the U.S. workforce, aspeople look to build additions to theirhomes for better teleworking environ-ments, says Sanderson. There’s likely “tobe increased demand for a larger housedesign, which could bolster lumber pricesfor the foreseeable future.”
Even so, he doesn’t expect to see anydrastic price changes this year, with arange of $550 to $650, but also says signifi-cant tax-policy changes may “cool” hous-ing starts or other parts of the economy,
leading to a price drop. On Jan. 21, lumbersettled at $748 per 1,000 board feet, withprices down more than 14% this year.
The rollout of Covid-19 vaccines, mean-while, might be bearish for lumber. Vaccinescould lead to a slowdown in housing con-struction and lumber demand, saysMichaelGayed, portfolio manager of theATACUSRotation exchange-traded fund (ticker:RORO), which uses lumber and gold pricesto help gauge volatility in equities.
Those vaccinated against Covid-19might move back to cities, where steel isthe dominant choice for construction, hesays. Still, a “secular shift” to work-from-home arrangements in the suburbs, whichmainly use lumber for construction, pro-vides a bullish case for prices.
Gayed, who analyzes the lumber-goldrelationship to gauge risk in the financialmarkets, sees the severe decline in lumberthis year as “a big warning sign that wecould be entering a serious risk-off periodsooner than people think.”
Lumber is a leading indicator of hous-ing, which is a leading economic indicator,so “lumber’s performance has importantimplications on future growth, inflation,construction and credit creation for theeconomy.” Meanwhile, gold is more of ahaven commodity and tends to do well inhigh-risk periods for the stock market.
Comparing the two commodities “tellsyou a lot about risk” and in 2020, lumbervastly outpaced gold performance, saysGayed. With the pullback in prices thisyear, lumber “may be starting to warn thatthe future will be more challenged than wethink for the stock market.” Lookingahead, volatility is likely to “remain ele-vated for all markets” and lumber willprobably “gyrate meaningfully,” he says.
Westline Capital’s Kuta sees a widetrading range of $450 to $1,150 this year,but admits that price forecasting “with anydegree of certainty is…useless for the fore-seeable future,” as the industry grappleswith the new norm “coming out of a case-study year like 2020.” B
By Myra P. Saefong
C OMMO D I T I E S
“This is when wereally get to excel.”The average Barron’s-ranked advisor
has almost three decades of experience
and has thrived through adversity. Find
an advisor who has the experience to
navigate uncertainty.
Visit the Guide to Wealth at
barrons.com/guide
G U I D E T O W E A LT H
NEW+ IMPROVED!New interface.More insights.New finder tool.
©2020 Dow Jones & Company. All Rights Reserved. 2E210
“How Top Advisors are Navigating the Crisis,” Barron’s. 3/19/20
January 25, 2021 BARRON’S M7
I N S I D E S C O O P
Carnival SeesWaveOf Insider Stock Sales
including dividend-equivalent stockassociated with the release of re-stricted share units. He owns another565,199 shares through a trust that hecontrols.
Chief Financial Officer David Bern-stein sold 49,031 Carnival shares onJan. 14 for a total of $1 million, anaverage price of $21.12 each. He nowowns 74,156, including dividend-equivalent shares.
Arnaldo Perez, general counsel andsecretary, sold 14,215 Carnival sharesfor $300,220, also on Jan. 14 and ata per share average price of $21.12.Perez now owns 31,357 shares, includ-ing dividend-equivalent shares. Perezalso owns another 34,832 Carnivalshares through a trust.
Carnival didn’t respond to a requestto make the executives available forcomment on their stock sales.
None of the executives sold stocklast year. B
Carnivalexecutives,including CEOArnold Donald,sold nearly $3million of stockof the cruiseoperator aftera recent slump.
IncreasesIn HoldingsDermTech (DMTK)RTW Investments increased itsinterest in the maker of skin-cancertests to 13.1% through a publicoffering. On Jan. 7, RTW bought200,000 DermTech shares at theoffering price of $29.50 apiece,increasing the investment firm’sholding to 3,118,666 DermTechcommon shares; 31,450 of whichunderlie exercisable warrants.
DermTech will use the proceedsfrom the offering to fund “furthercommercialization of its clinicalcommercial tests, accelerate pipe-line development, and for generalcorporate purposes.”
DecreasesIn HoldingsTenneco (TEN)Icahn Enterprises reported in twoseparate disclosures that it hadreduced an investment in themaker of automotive components.
Icahn Enterprises first sold699,560 Tenneco Class A shares onJan. 12 through Jan. 14 at pricesranging from $11.02 to $11.65 pershare. Icahn Enterprises then soldanother 165,658 Tenneco sharesfrom Jan. 15 through Jan. 20 at$10.75 to $10.83 each.
Icahn Enterprises now holds12.7% of Tenneco’s outstandingClass A stock, or 8,061,085 shares.In addition, it owns all of Tenneco’soutstanding, nonvoting Class Bstock, which stands at 18,101,189shares.
Bicycle Therapeutics(BCYC)Vertex Venture Managementrevealed that it had slashed itsstake in the U.K.-based biothera-peutics firm by nearly half to883,475 American depositary re-ceipts.Vertex Venture sold a totalof 737,693 Bicycle ADRs from Dec.14 through Jan. 19, at $19.20 to$28.56 each. Vertex now owns theequivalent of 4.2% of Bicycle’s out-standing ordinary shares.
Seeds ofDiscontentAt Corteva
POWER PLAY
Carnival stock cratered lastyear, as the coronaviruspandemic wiped out themarket for cruises, andin mid-January, three topexecutives, including chiefexecutive Arnold Donald,
sold shares.Carnival (ticker: CCL) shares
plunged 67% in 2020, and that wasfollowing a December boost.
On Jan. 11, Carnival stock dippedafter the company preliminarily re-ported a large fourth-quarter loss. Theshares are now down about 5% thisyear.
CEO Donald sold 62,639 Carnivalshares on Jan. 14 for $1.3 million, anaverage per share price of $21.12.According to a form he filed with theSecurities and Exchange Commission,Donald now owns 170,371 shares,
By ED LIN I t’s less than a month into 2021,and already an activist battle isbrewing.
Starboard Value, the hedgefund led by Jeff Smith, is looking totake control of seed giant Corteva’s(ticker: CTVA) board and is callingon the company to replace CEO JimCollins. While Corteva is a rela-tively young company, the result ofa spin-off from DowDupont in2019, Starboard contends that itsoperating performance could be“meaningfully improved.”
Starboard’s assessment comesafter Corteva stock gained nearly40% last year, and set an all-timehigh this month, thanks in largepart to a surge in agricultural com-modity prices. But Starboard notedin a letter to Corteva’s board thatthe company has had a “litany ofmissed promises and unforced er-rors” as the fund called out thecompany for not improving itsprofitability. Starboard is aiming togain eight of Corteva’s 12 boardseats at the annual meeting, whichhas yet to be scheduled.
Corteva countered that it is at an“inflection point” and its work overthe past 18 months will soon bereflected in earnings. It also ex-pressed confidence in CEO Collins.
The market so far appears un-sure of the outcome of the loomingstruggle. Corteva stock fell roughly5% since Starboard’s letter wasreleased—though much of thatcould be investors taking profits.
Starboard is no stranger to activ-ist dustups. It launched six cam-paigns last year and won 24 boardseats, making it one of the busiesthedge funds of 2020, according todata from Lazard. It disclosed a1.6% stake in $30 billion Cortevalate last year.
The two sides have had talks,but the battle has clearly begun . B
By CARLETON ENGLISH
Activist HoldingsEnzoBiochem (ENZ)Roumell Asset Managementdisclosed a 2,761,229-share stake inthe molecular-diagnostics biotech.
Jim Roumell, president of Rou-mell Asset Management, addresseda letter dated Jan. 14 to Enzo Bio-chem’s board, writing that it shouldaccept Chairman and CEO ElazarRabbani’s conditional resignationthat he tendered on Jan. 8. Per EnzoBiochem’s bylaws, the board has 90days to convene and either accept ordelay the resignation. Rabbani of-fered to step down, as he did not
receive a majority of votes for re-elec-tion at Enzo Biochem’s 2020 annualmeeting of shareholders. Roumell As-set Management believes “there is [no]reason to wait 90 days to accept Rab-bani’s resignation” and urged the boardto “abide by the will of the company’sshareholders and promptly acceptRabbani’s resignation.”
On Jan. 20, Enzo Biochem an-nounced the formation of two newboard committees. One will guidestrategic partnerships, acquisitions,and divestitures, and the other willhelp drive the development of seniorleadership at the firm. The boardprovided no update on Rabbani’sresignation.
These disclosures arefrom 13Ds filed withthe Securities andExchange Commission.13Ds are filed within10 days of an entity’sattaining more than5% in any class of acompany’s securities.Subsequent changesin holdings or inten-tions must be re-ported in amendedfilings. This material isfrom Jan. 14 throughJan. 20, 2021. Source:InsiderScore.com

M8 BARRON’S January 25, 2021
© 2021 Dow Jones & Company, Inc. All rights reserved. 4E5153
Building upon the foundation set by Barron's first Wealth Gap conference in
September 2020, Solutions Today for a Better Tomorrow expands beyond
wwhyhy it's important to address the gap, focusing on two key factors in howow
to close the gap: access to capital and access to opportunity.
The two-day conference will feature experts in banking, housing, health
care, criminal justice, and more, with programming starting daily at noon ET.
January 26-27, 2021
Register today at: barrons.com/wealthgap
FEATURED SPEAKERS
Solutions Todayfor a Better Tomorrow
Marla BlowSen ior V ice Pres ident of Soc ia l Impact ,
The Center for Inc lus ive Growth, Mastercard
Bill BynumChief Execut ive Off icer, HOPE
Arne DuncanManag ing Par tner, Emerson Co l lect ive
Brandee McHaleHead of C i t i Communi ty Invest ing & Deve lopment
and Pres ident of C i t i Foundat ion
Chuck RobbinsCha irman and Ch ief Execut ive Off icer, C isco
Dr. Rajiv J. ShahPres ident , The Rockefe l ler Foundat ion
SOLUTIONS TODAY FOR A BETTER TOMORROW
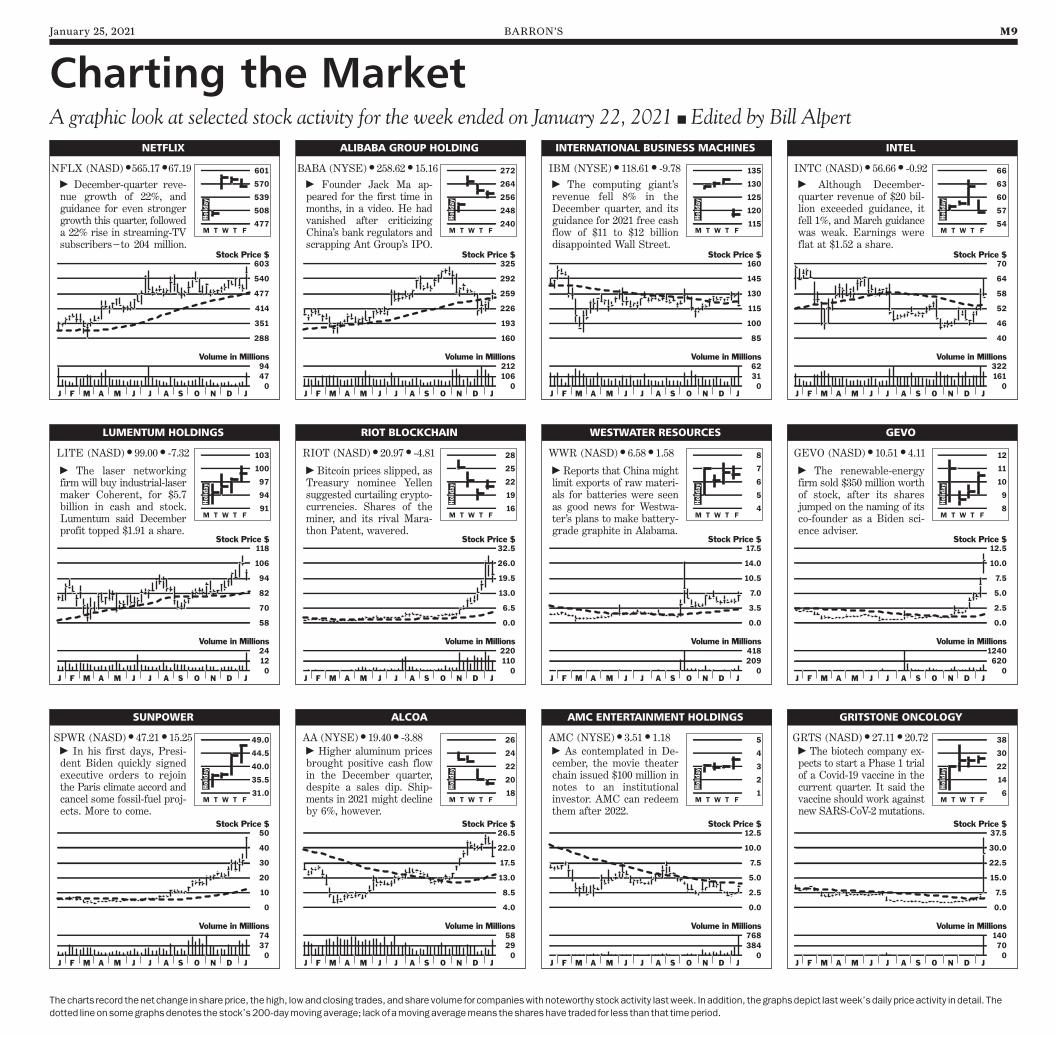
January 25, 2021 BARRON’S M9
Charting the Market
Thecharts record thenet change in shareprice, thehigh, lowandclosing trades, andshare volume for companieswithnoteworthy stockactivity lastweek. In addition, thegraphsdepict lastweek’sdaily priceactivity in detail. The
dotted lineonsomegraphsdenotes thestock’s200-daymovingaverage; lackof amovingaveragemeans theshareshave traded for less than that timeperiod.
A graphic look at selected stock activity for the week ended on January 22, 2021 n Edited by Bill AlpertNETFLIX
NFLX (NASD) •565.17 •67.19
477
508
539
M T W T F
570
601
Holiday
288
351
414
477
540
603Stock Price $
047
J F M A M J J A S O N D J
94Volume in Millions
� December-quarter reve-nue growth of 22%, andguidance for even strongergrowth this quarter, followeda 22% rise in streaming-TVsubscribers—to 204 million.
LUMENTUM HOLDINGS
LITE (NASD) • 99.00 • -7.32
91
94
97
M T W T F
100
103
Holiday
58
70
82
94
106
118Stock Price $
012
J F M A M J J A S O N D J
24Volume in Millions
� The laser networkingfirm will buy industrial-lasermaker Coherent, for $5.7billion in cash and stock.Lumentum said Decemberprofit topped $1.91 a share.
SUNPOWER
SPWR (NASD) • 47.21 • 15.25
31.0
35.5
40.0
M T W T F
44.5
49.0
Holiday
0
10
20
30
40
50Stock Price $
037
J F M A M J J A S O N D J
74Volume in Millions
� In his first days, Presi-dent Biden quickly signedexecutive orders to rejointhe Paris climate accord andcancel some fossil-fuel proj-ects. More to come.
ALIBABA GROUP HOLDING
BABA (NYSE) • 258.62 • 15.16
240
248
256
M T W T F
264
272
Holiday
160
193
226
259
292
325Stock Price $
0106
J F M A M J J A S O N D J
212Volume in Millions
� Founder Jack Ma ap-peared for the first time inmonths, in a video. He hadvanished after criticizingChina’s bank regulators andscrapping Ant Group’s IPO.
RIOT BLOCKCHAIN
RIOT (NASD) • 20.97 • -4.81
16
19
22
M T W T F
25
28Holiday
0.0
6.5
13.0
19.5
26.0
32.5Stock Price $
0110
J F M A M J J A S O N D J
220Volume in Millions
� Bitcoin prices slipped, asTreasury nominee Yellensuggested curtailing crypto-currencies. Shares of theminer, and its rival Mara-thon Patent, wavered.
ALCOA
AA (NYSE) • 19.40 • -3.88
18
20
22
M T W T F
24
26
Holiday
4.0
8.5
13.0
17.5
22.0
26.5Stock Price $
029
J F M A M J J A S O N D J
58Volume in Millions
� Higher aluminum pricesbrought positive cash flowin the December quarter,despite a sales dip. Ship-ments in 2021 might declineby 6%, however.
INTERNATIONAL BUSINESS MACHINES
IBM (NYSE) • 118.61 • -9.78
115
120
125
M T W T F
130
135
Holiday
85
100
115
130
145
160Stock Price $
031
J F M A M J J A S O N D J
62Volume in Millions
� The computing giant’srevenue fell 8% in theDecember quarter, and itsguidance for 2021 free cashflow of $11 to $12 billiondisappointed Wall Street.
WESTWATER RESOURCES
WWR (NASD) • 6.58 • 1.58
4
5
6
M T W T F
7
8
Holiday
0.0
3.5
7.0
10.5
14.0
17.5Stock Price $
0209
J F M A M J J A S O N D J
418Volume in Millions
� Reports that China mightlimit exports of raw materi-als for batteries were seenas good news for Westwa-ter’s plans to make battery-grade graphite in Alabama.
AMC ENTERTAINMENT HOLDINGS
AMC (NYSE) • 3.51 • 1.18
1
2
3
M T W T F
4
5
Holiday
0.0
2.5
5.0
7.5
10.0
12.5Stock Price $
0384
J F M A M J J A S O N D J
768Volume in Millions
� As contemplated in De-cember, the movie theaterchain issued $100 million innotes to an institutionalinvestor. AMC can redeemthem after 2022.
INTEL
INTC (NASD) • 56.66 • -0.92
54
57
60
M T W T F
63
66
Holiday
40
46
52
58
64
70Stock Price $
0161
J F M A M J J A S O N D J
322Volume in Millions
� Although December-quarter revenue of $20 bil-lion exceeded guidance, itfell 1%, and March guidancewas weak. Earnings wereflat at $1.52 a share.
GEVO
GEVO (NASD) • 10.51 • 4.11
8
9
10
M T W T F
11
12
Holiday
0.0
2.5
5.0
7.5
10.0
12.5Stock Price $
0620
J F M A M J J A S O N D J
1240Volume in Millions
� The renewable-energyfirm sold $350 million worthof stock, after its sharesjumped on the naming of itsco-founder as a Biden sci-ence adviser.
GRITSTONE ONCOLOGY
GRTS (NASD) • 27.11 • 20.72
6
14
22
M T W T F
30
38
Holiday
0.0
7.5
15.0
22.5
30.0
37.5Stock Price $
070
J F M A M J J A S O N D J
140Volume in Millions
� The biotech company ex-pects to start a Phase 1 trialof a Covid-19 vaccine in thecurrent quarter. It said thevaccine should work againstnew SARS-CoV-2 mutations.
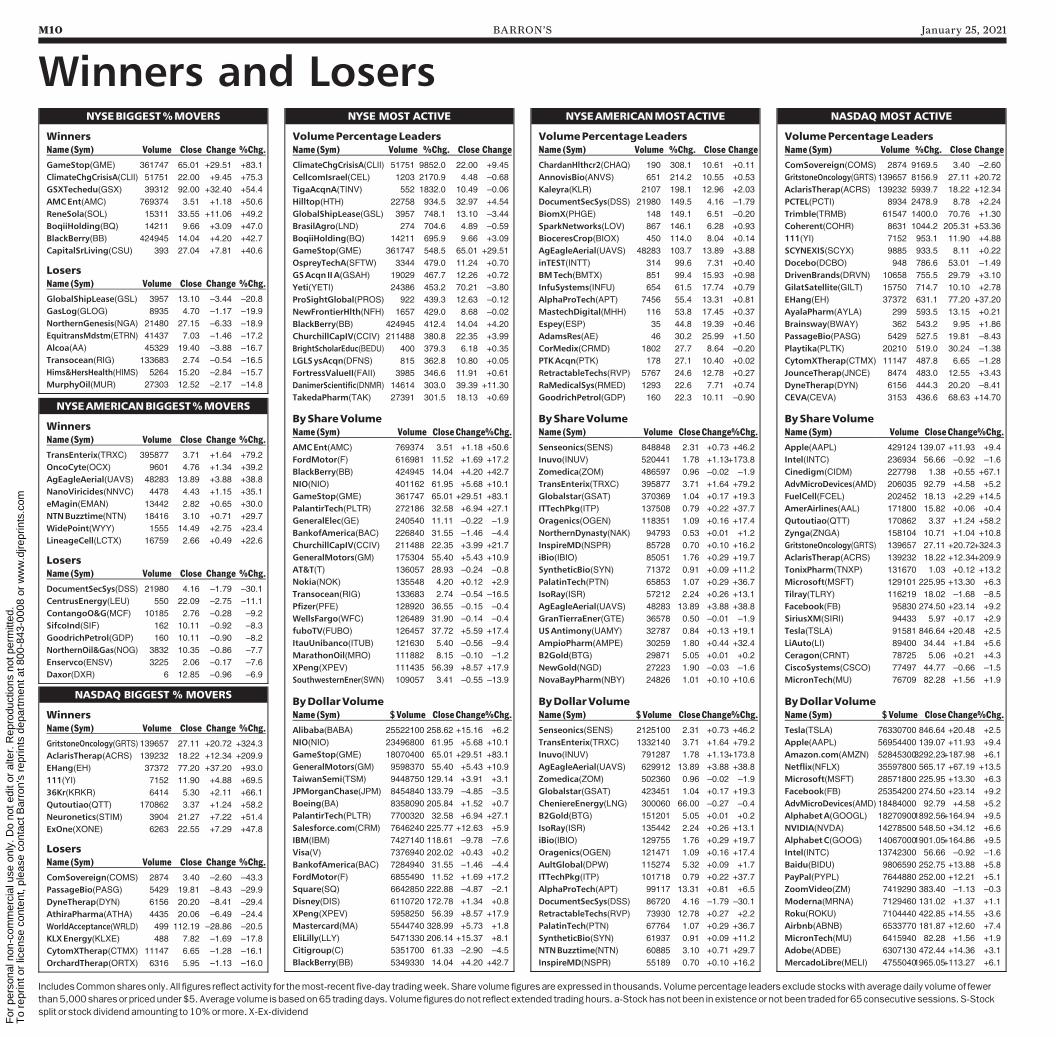
M10 BARRON’S January 25, 2021
Winners and LosersNYSEBIGGEST%MOVERS
WinnersName (Sym) Volume Close Change %Chg.GameStop(GME) 361747 65.01 +29.51 +83.1ClimateChgCrisisA(CLII) 51751 22.00 +9.45 +75.3GSXTechedu(GSX) 39312 92.00 +32.40 +54.4AMCEnt(AMC) 769374 3.51 +1.18 +50.6ReneSola(SOL) 15311 33.55 +11.06 +49.2BoqiiHolding(BQ) 14211 9.66 +3.09 +47.0BlackBerry(BB) 424945 14.04 +4.20 +42.7CapitalSrLiving(CSU) 393 27.04 +7.81 +40.6
LosersName (Sym) Volume Close Change %Chg.GlobalShipLease(GSL) 3957 13.10 –3.44 –20.8GasLog(GLOG) 8935 4.70 –1.17 –19.9NorthernGenesis(NGA) 21480 27.15 –6.33 –18.9EquitransMdstm(ETRN) 41437 7.03 –1.46 –17.2Alcoa(AA) 45329 19.40 –3.88 –16.7Transocean(RIG) 133683 2.74 –0.54 –16.5Hims&HersHealth(HIMS) 5264 15.20 –2.84 –15.7MurphyOil(MUR) 27303 12.52 –2.17 –14.8
NYSE MOST ACTIVE
VolumePercentageLeadersName (Sym) Volume %Chg. Close ChangeClimateChgCrisisA(CLII) 51751 9852.0 22.00 +9.45CellcomIsrael(CEL) 1203 2170.9 4.48 –0.68TigaAcqnA(TINV) 552 1832.0 10.49 –0.06Hilltop(HTH) 22758 934.5 32.97 +4.54GlobalShipLease(GSL) 3957 748.1 13.10 –3.44BrasilAgro(LND) 274 704.6 4.89 –0.59BoqiiHolding(BQ) 14211 695.9 9.66 +3.09GameStop(GME) 361747 548.5 65.01 +29.51OspreyTechA(SFTW) 3344 479.0 11.24 +0.70GSAcqn IIA(GSAH) 19029 467.7 12.26 +0.72Yeti(YETI) 24386 453.2 70.21 –3.80ProSightGlobal(PROS) 922 439.3 12.63 –0.12NewFrontierHlth(NFH) 1657 429.0 8.68 –0.02BlackBerry(BB) 424945 412.4 14.04 +4.20ChurchillCapIV(CCIV) 211488 380.8 22.35 +3.99BrightScholarEduc(BEDU) 400 379.3 6.18 +0.35LGLSysAcqn(DFNS) 815 362.8 10.80 +0.05FortressValueII(FAII) 3985 346.6 11.91 +0.61DanimerScientific(DNMR) 14614 303.0 39.39 +11.30TakedaPharm(TAK) 27391 301.5 18.13 +0.69
ByShareVolumeName (Sym) Volume CloseChange%Chg.AMCEnt(AMC) 769374 3.51 +1.18 +50.6FordMotor(F) 616981 11.52 +1.69 +17.2BlackBerry(BB) 424945 14.04 +4.20 +42.7NIO(NIO) 401162 61.95 +5.68 +10.1GameStop(GME) 361747 65.01 +29.51 +83.1PalantirTech(PLTR) 272186 32.58 +6.94 +27.1GeneralElec(GE) 240540 11.11 –0.22 –1.9BankofAmerica(BAC) 226840 31.55 –1.46 –4.4ChurchillCapIV(CCIV) 211488 22.35 +3.99 +21.7GeneralMotors(GM) 175304 55.40 +5.43 +10.9AT&T(T) 136057 28.93 –0.24 –0.8Nokia(NOK) 135548 4.20 +0.12 +2.9Transocean(RIG) 133683 2.74 –0.54 –16.5Pfizer(PFE) 128920 36.55 –0.15 –0.4WellsFargo(WFC) 126489 31.90 –0.14 –0.4fuboTV(FUBO) 126457 37.72 +5.59 +17.4ItauUnibanco(ITUB) 121630 5.40 –0.56 –9.4MarathonOil(MRO) 111882 8.15 –0.10 –1.2XPeng(XPEV) 111435 56.39 +8.57 +17.9SouthwesternEner(SWN) 109057 3.41 –0.55 –13.9
ByDollarVolumeName (Sym) $Volume CloseChange%Chg.Alibaba(BABA) 25522100 258.62 +15.16 +6.2NIO(NIO) 23496800 61.95 +5.68 +10.1GameStop(GME) 18070400 65.01 +29.51 +83.1GeneralMotors(GM) 9598370 55.40 +5.43 +10.9TaiwanSemi(TSM) 9448750 129.14 +3.91 +3.1JPMorganChase(JPM) 8454840 133.79 –4.85 –3.5Boeing(BA) 8358090 205.84 +1.52 +0.7PalantirTech(PLTR) 7700320 32.58 +6.94 +27.1Salesforce.com(CRM) 7646240 225.77 +12.63 +5.9IBM(IBM) 7427140 118.61 –9.78 –7.6Visa(V) 7376940 202.02 +0.43 +0.2BankofAmerica(BAC) 7284940 31.55 –1.46 –4.4FordMotor(F) 6855490 11.52 +1.69 +17.2Square(SQ) 6642850 222.88 –4.87 –2.1Disney(DIS) 6110720 172.78 +1.34 +0.8XPeng(XPEV) 5958250 56.39 +8.57 +17.9Mastercard(MA) 5544740 328.99 +5.73 +1.8EliLilly(LLY) 5471330 206.14 +15.37 +8.1Citigroup(C) 5351700 61.33 –2.90 –4.5BlackBerry(BB) 5349330 14.04 +4.20 +42.7
NYSEAMERICANMOSTACTIVE
VolumePercentageLeadersName (Sym) Volume %Chg. Close ChangeChardanHlthcr2(CHAQ) 190 308.1 10.61 +0.11AnnovisBio(ANVS) 651 214.2 10.55 +0.53Kaleyra(KLR) 2107 198.1 12.96 +2.03DocumentSecSys(DSS) 21980 149.5 4.16 –1.79BiomX(PHGE) 148 149.1 6.51 –0.20SparkNetworks(LOV) 867 146.1 6.28 +0.93BioceresCrop(BIOX) 450 114.0 8.04 +0.14AgEagleAerial(UAVS) 48283 103.7 13.89 +3.88inTEST(INTT) 314 99.6 7.31 +0.40BMTech(BMTX) 851 99.4 15.93 +0.98InfuSystems(INFU) 654 61.5 17.74 +0.79AlphaProTech(APT) 7456 55.4 13.31 +0.81MastechDigital(MHH) 116 53.8 17.45 +0.37Espey(ESP) 35 44.8 19.39 +0.46AdamsRes(AE) 46 30.2 25.99 +1.50CorMedix(CRMD) 1802 27.7 8.64 –0.20PTKAcqn(PTK) 178 27.1 10.40 +0.02RetractableTechs(RVP) 5767 24.6 12.78 +0.27RaMedicalSys(RMED) 1293 22.6 7.71 +0.74GoodrichPetrol(GDP) 160 22.3 10.11 –0.90
ByShareVolumeName (Sym) Volume CloseChange%Chg.Senseonics(SENS) 848848 2.31 +0.73 +46.2Inuvo(INUV) 520441 1.78 +1.13+173.8Zomedica(ZOM) 486597 0.96 –0.02 –1.9TransEnterix(TRXC) 395877 3.71 +1.64 +79.2Globalstar(GSAT) 370369 1.04 +0.17 +19.3ITTechPkg(ITP) 137508 0.79 +0.22 +37.7Oragenics(OGEN) 118351 1.09 +0.16 +17.4NorthernDynasty(NAK) 94793 0.53 +0.01 +1.2InspireMD(NSPR) 85728 0.70 +0.10 +16.2iBio(IBIO) 85051 1.76 +0.29 +19.7SyntheticBio(SYN) 71372 0.91 +0.09 +11.2PalatinTech(PTN) 65853 1.07 +0.29 +36.7IsoRay(ISR) 57212 2.24 +0.26 +13.1AgEagleAerial(UAVS) 48283 13.89 +3.88 +38.8GranTierraEner(GTE) 36578 0.50 –0.01 –1.9USAntimony(UAMY) 32787 0.84 +0.13 +19.1AmpioPharm(AMPE) 30259 1.80 +0.44 +32.4B2Gold(BTG) 29871 5.05 +0.01 +0.2NewGold(NGD) 27223 1.90 –0.03 –1.6NovaBayPharm(NBY) 24826 1.01 +0.10 +10.6
ByDollarVolumeName (Sym) $Volume CloseChange%Chg.Senseonics(SENS) 2125100 2.31 +0.73 +46.2TransEnterix(TRXC) 1332140 3.71 +1.64 +79.2Inuvo(INUV) 791287 1.78 +1.13+173.8AgEagleAerial(UAVS) 629912 13.89 +3.88 +38.8Zomedica(ZOM) 502360 0.96 –0.02 –1.9Globalstar(GSAT) 423451 1.04 +0.17 +19.3CheniereEnergy(LNG) 300060 66.00 –0.27 –0.4B2Gold(BTG) 151201 5.05 +0.01 +0.2IsoRay(ISR) 135442 2.24 +0.26 +13.1iBio(IBIO) 129755 1.76 +0.29 +19.7Oragenics(OGEN) 121471 1.09 +0.16 +17.4AultGlobal(DPW) 115274 5.32 +0.09 +1.7ITTechPkg(ITP) 101718 0.79 +0.22 +37.7AlphaProTech(APT) 99117 13.31 +0.81 +6.5DocumentSecSys(DSS) 86720 4.16 –1.79 –30.1RetractableTechs(RVP) 73930 12.78 +0.27 +2.2PalatinTech(PTN) 67764 1.07 +0.29 +36.7SyntheticBio(SYN) 61937 0.91 +0.09 +11.2NTNBuzztime(NTN) 60885 3.10 +0.71 +29.7InspireMD(NSPR) 55189 0.70 +0.10 +16.2
NASDAQ MOST ACTIVE
VolumePercentageLeadersName (Sym) Volume %Chg. Close ChangeComSovereign(COMS) 2874 9169.5 3.40 –2.60GritstoneOncology(GRTS) 139657 8156.9 27.11 +20.72AclarisTherap(ACRS) 139232 5939.7 18.22 +12.34PCTEL(PCTI) 8934 2478.9 8.78 +2.24Trimble(TRMB) 61547 1400.0 70.76 +1.30Coherent(COHR) 8631 1044.2 205.31 +53.36111(YI) 7152 953.1 11.90 +4.88SCYNEXIS(SCYX) 9885 933.5 8.11 +0.22Docebo(DCBO) 948 786.6 53.01 –1.49DrivenBrands(DRVN) 10658 755.5 29.79 +3.10GilatSatellite(GILT) 15750 714.7 10.10 +2.78EHang(EH) 37372 631.1 77.20 +37.20AyalaPharm(AYLA) 299 593.5 13.15 +0.21Brainsway(BWAY) 362 543.2 9.95 +1.86PassageBio(PASG) 5429 527.5 19.81 –8.43Playtika(PLTK) 20210 519.0 30.24 –1.38CytomXTherap(CTMX) 11147 487.8 6.65 –1.28JounceTherap(JNCE) 8474 483.0 12.55 +3.43DyneTherap(DYN) 6156 444.3 20.20 –8.41CEVA(CEVA) 3153 436.6 68.63 +14.70
ByShareVolumeName (Sym) Volume CloseChange%Chg.Apple(AAPL) 429124 139.07 +11.93 +9.4Intel(INTC) 236934 56.66 –0.92 –1.6Cinedigm(CIDM) 227798 1.38 +0.55 +67.1AdvMicroDevices(AMD) 206035 92.79 +4.58 +5.2FuelCell(FCEL) 202452 18.13 +2.29 +14.5AmerAirlines(AAL) 171800 15.82 +0.06 +0.4Qutoutiao(QTT) 170862 3.37 +1.24 +58.2Zynga(ZNGA) 158104 10.71 +1.04 +10.8GritstoneOncology(GRTS) 139657 27.11 +20.72+324.3AclarisTherap(ACRS) 139232 18.22 +12.34+209.9TonixPharm(TNXP) 131670 1.03 +0.12 +13.2Microsoft(MSFT) 129101 225.95 +13.30 +6.3Tilray(TLRY) 116219 18.02 –1.68 –8.5Facebook(FB) 95830 274.50 +23.14 +9.2SiriusXM(SIRI) 94433 5.97 +0.17 +2.9Tesla(TSLA) 91581 846.64 +20.48 +2.5LiAuto(LI) 89400 34.44 +1.84 +5.6Ceragon(CRNT) 78725 5.06 +0.21 +4.3CiscoSystems(CSCO) 77497 44.77 –0.66 –1.5MicronTech(MU) 76709 82.28 +1.56 +1.9
ByDollarVolumeName (Sym) $Volume CloseChange%Chg.Tesla(TSLA) 76330700 846.64 +20.48 +2.5Apple(AAPL) 56954400 139.07 +11.93 +9.4Amazon.com(AMZN) 528453003292.23+187.98 +6.1Netflix(NFLX) 35597800 565.17 +67.19 +13.5Microsoft(MSFT) 28571800 225.95 +13.30 +6.3Facebook(FB) 25354200 274.50 +23.14 +9.2AdvMicroDevices(AMD) 18484000 92.79 +4.58 +5.2AlphabetA(GOOGL) 182709001892.56+164.94 +9.5NVIDIA(NVDA) 14278500 548.50 +34.12 +6.6AlphabetC(GOOG) 140670001901.05+164.86 +9.5Intel(INTC) 13742300 56.66 –0.92 –1.6Baidu(BIDU) 9806590 252.75 +13.88 +5.8PayPal(PYPL) 7644880 252.00 +12.21 +5.1ZoomVideo(ZM) 7419290 383.40 –1.13 –0.3Moderna(MRNA) 7129460 131.02 +1.37 +1.1Roku(ROKU) 7104440 422.85 +14.55 +3.6Airbnb(ABNB) 6533770 181.87 +12.60 +7.4MicronTech(MU) 6415940 82.28 +1.56 +1.9Adobe(ADBE) 6307130 472.44 +14.36 +3.1MercadoLibre(MELI) 47550401965.05+113.27 +6.1
NYSEAMERICANBIGGEST%MOVERS
WinnersName (Sym) Volume Close Change %Chg.TransEnterix(TRXC) 395877 3.71 +1.64 +79.2OncoCyte(OCX) 9601 4.76 +1.34 +39.2AgEagleAerial(UAVS) 48283 13.89 +3.88 +38.8NanoViricides(NNVC) 4478 4.43 +1.15 +35.1eMagin(EMAN) 13442 2.82 +0.65 +30.0NTNBuzztime(NTN) 18416 3.10 +0.71 +29.7WidePoint(WYY) 1555 14.49 +2.75 +23.4LineageCell(LCTX) 16759 2.66 +0.49 +22.6
LosersName (Sym) Volume Close Change %Chg.DocumentSecSys(DSS) 21980 4.16 –1.79 –30.1CentrusEnergy(LEU) 550 22.09 –2.75 –11.1ContangoO&G(MCF) 10185 2.76 –0.28 –9.2SifcoInd(SIF) 162 10.11 –0.92 –8.3GoodrichPetrol(GDP) 160 10.11 –0.90 –8.2NorthernOil&Gas(NOG) 3832 10.35 –0.86 –7.7Enservco(ENSV) 3225 2.06 –0.17 –7.6Daxor(DXR) 6 12.85 –0.96 –6.9
NASDAQ BIGGEST % MOVERS
WinnersName (Sym) Volume Close Change %Chg.GritstoneOncology(GRTS) 139657 27.11 +20.72 +324.3AclarisTherap(ACRS) 139232 18.22 +12.34 +209.9EHang(EH) 37372 77.20 +37.20 +93.0111(YI) 7152 11.90 +4.88 +69.536Kr(KRKR) 6414 5.30 +2.11 +66.1Qutoutiao(QTT) 170862 3.37 +1.24 +58.2Neuronetics(STIM) 3904 21.27 +7.22 +51.4ExOne(XONE) 6263 22.55 +7.29 +47.8
LosersName (Sym) Volume Close Change %Chg.ComSovereign(COMS) 2874 3.40 –2.60 –43.3PassageBio(PASG) 5429 19.81 –8.43 –29.9DyneTherap(DYN) 6156 20.20 –8.41 –29.4AthiraPharma(ATHA) 4435 20.06 –6.49 –24.4WorldAcceptance(WRLD) 499 112.19 –28.86 –20.5KLXEnergy(KLXE) 488 7.82 –1.69 –17.8CytomXTherap(CTMX) 11147 6.65 –1.28 –16.1OrchardTherap(ORTX) 6316 5.95 –1.13 –16.0
IncludesCommonsharesonly. All figures reflect activity for themost-recent five-day tradingweek.Share volume figuresareexpressed in thousands.Volumepercentage leadersexcludestockswithaveragedaily volumeof fewerthan5,000sharesor pricedunder$5.Averagevolume isbasedon65 tradingdays.Volume figuresdonot reflect extended tradinghours. a-Stockhasnot been inexistenceor not been traded for 65consecutive sessions.S-Stocksplit or stockdividendamounting to10%ormore.X-Ex-dividend
For
per
sona
l non
-com
mer
cial
use
onl
y. D
o no
t edi
t or
alte
r. R
epro
duct
ions
not
per
mitt
ed.
To
repr
int o
r lic
ense
con
tent
, ple
ase
cont
act B
arro
n's
repr
ints
dep
artm
ent a
t 800
-843
-000
8 or
ww
w.d
jrepr
ints
.com
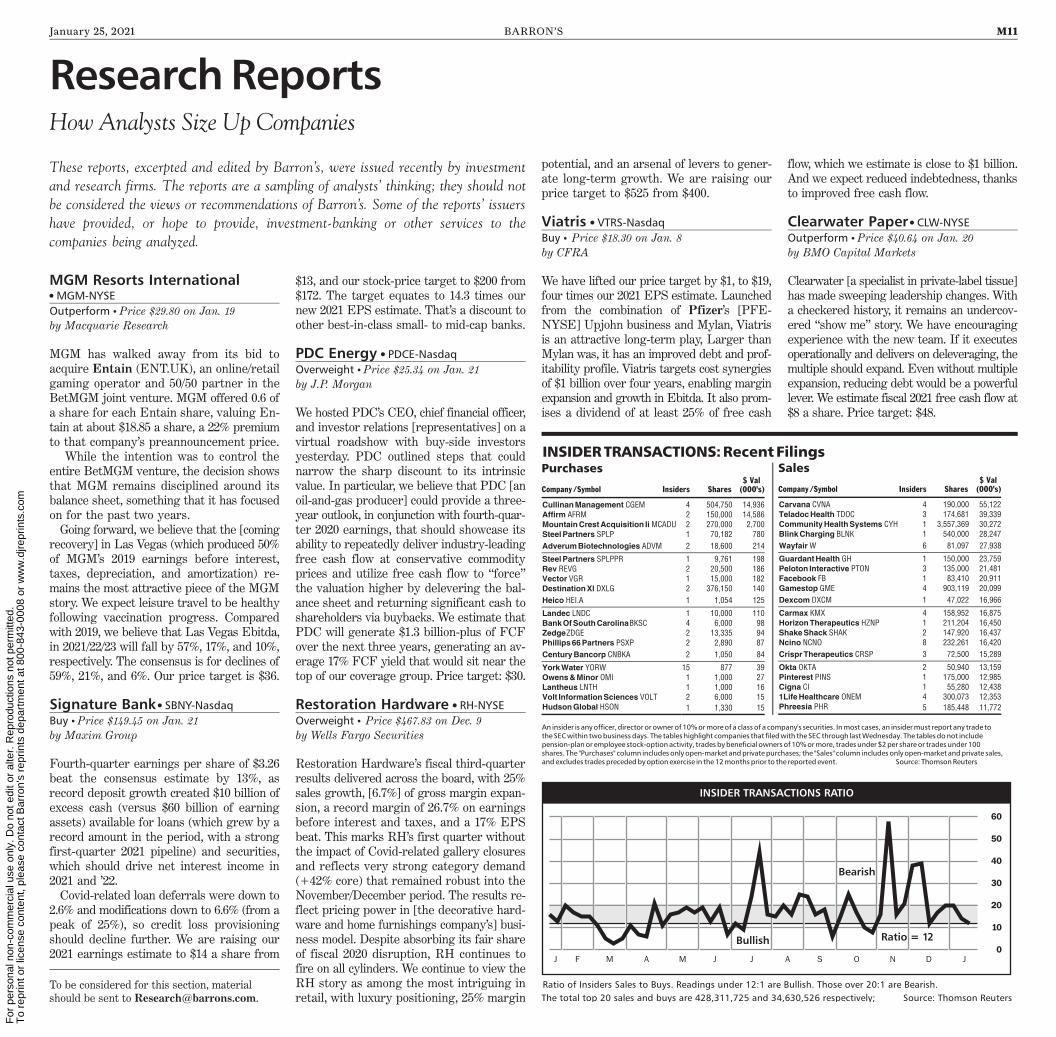
January 25, 2021 BARRON’S M11
Research ReportsHow Analysts Size Up Companies
These reports, excerpted and edited by Barron’s, were issued recently by investmentand research firms. The reports are a sampling of analysts’ thinking; they should notbe considered the views or recommendations of Barron’s. Some of the reports’ issuershave provided, or hope to provide, investment-banking or other services to thecompanies being analyzed.
To be considered for this section, materialshould be sent to [email protected].
MGM Resorts International• MGM-NYSEOutperform • Price $29.80 on Jan. 19by Macquarie Research
MGM has walked away from its bid toacquire Entain (ENT.UK), an online/retailgaming operator and 50/50 partner in theBetMGM joint venture. MGM offered 0.6 ofa share for each Entain share, valuing En-tain at about $18.85 a share, a 22% premiumto that company’s preannouncement price.While the intention was to control the
entire BetMGM venture, the decision showsthat MGM remains disciplined around itsbalance sheet, something that it has focusedon for the past two years.Going forward, we believe that the [comingrecovery] in Las Vegas (which produced 50%of MGM’s 2019 earnings before interest,taxes, depreciation, and amortization) re-mains the most attractive piece of the MGMstory. We expect leisure travel to be healthyfollowing vaccination progress. Comparedwith 2019, we believe that Las Vegas Ebitda,in 2021/22/23 will fall by 57%, 17%, and 10%,respectively. The consensus is for declines of59%, 21%, and 6%. Our price target is $36.
Signature Bank• SBNY-NasdaqBuy • Price $149.45 on Jan. 21by Maxim Group
Fourth-quarter earnings per share of $3.26beat the consensus estimate by 13%, asrecord deposit growth created $10 billion ofexcess cash (versus $60 billion of earningassets) available for loans (which grew by arecord amount in the period, with a strongfirst-quarter 2021 pipeline) and securities,which should drive net interest income in2021 and ’22.Covid-related loan deferrals were down to2.6% and modifications down to 6.6% (from apeak of 25%), so credit loss provisioningshould decline further. We are raising our2021 earnings estimate to $14 a share from
$13, and our stock-price target to $200 from$172. The target equates to 14.3 times ournew 2021 EPS estimate. That’s a discount toother best-in-class small- to mid-cap banks.
PDC Energy • PDCE-NasdaqOverweight • Price $25.34 on Jan. 21by J.P. Morgan
We hosted PDC’s CEO, chief financial officer,and investor relations [representatives] on avirtual roadshow with buy-side investorsyesterday. PDC outlined steps that couldnarrow the sharp discount to its intrinsicvalue. In particular, we believe that PDC [anoil-and-gas producer] could provide a three-year outlook, in conjunction with fourth-quar-ter 2020 earnings, that should showcase itsability to repeatedly deliver industry-leadingfree cash flow at conservative commodityprices and utilize free cash flow to “force”the valuation higher by delevering the bal-ance sheet and returning significant cash toshareholders via buybacks. We estimate thatPDC will generate $1.3 billion-plus of FCFover the next three years, generating an av-erage 17% FCF yield that would sit near thetop of our coverage group. Price target: $30.
Restoration Hardware • RH-NYSEOverweight • Price $467.83 on Dec. 9by Wells Fargo Securities
Restoration Hardware’s fiscal third-quarterresults delivered across the board, with 25%sales growth, [6.7%] of gross margin expan-sion, a record margin of 26.7% on earningsbefore interest and taxes, and a 17% EPSbeat. This marks RH’s first quarter withoutthe impact of Covid-related gallery closuresand reflects very strong category demand(+42% core) that remained robust into theNovember/December period. The results re-flect pricing power in [the decorative hard-ware and home furnishings company’s] busi-ness model. Despite absorbing its fair shareof fiscal 2020 disruption, RH continues tofire on all cylinders. We continue to view theRH story as among the most intriguing inretail, with luxury positioning, 25% margin
potential, and an arsenal of levers to gener-ate long-term growth. We are raising ourprice target to $525 from $400.
Viatris • VTRS-NasdaqBuy • Price $18.30 on Jan. 8by CFRA
We have lifted our price target by $1, to $19,four times our 2021 EPS estimate. Launchedfrom the combination of Pfizer’s [PFE-NYSE] Upjohn business and Mylan, Viatrisis an attractive long-term play, Larger thanMylan was, it has an improved debt and prof-itability profile. Viatris targets cost synergiesof $1 billion over four years, enabling marginexpansion and growth in Ebitda. It also prom-ises a dividend of at least 25% of free cash
flow, which we estimate is close to $1 billion.And we expect reduced indebtedness, thanksto improved free cash flow.
Clearwater Paper • CLW-NYSEOutperform • Price $40.64 on Jan. 20by BMO Capital Markets
Clearwater [a specialist in private-label tissue]has made sweeping leadership changes. Witha checkered history, it remains an undercov-ered “show me” story. We have encouragingexperience with the new team. If it executesoperationally and delivers on deleveraging, themultiple should expand. Even without multipleexpansion, reducing debt would be a powerfullever. We estimate fiscal 2021 free cash flow at$8 a share. Price target: $48.
INSIDER TRANSACTIONS RATIO
0
10
20
30
40
50
60
J F M A M J J A S O N D J
Ratio of Insiders Sales to Buys. Readings under 12:1 are Bullish. Those over 20:1 are Bearish.The total top 20 sales and buys are 428,311,725 and 34,630,526 respectively; Source: Thomson Reuters
Bearish
Bullish Ratio = 12
INSIDERTRANSACTIONS:RecentFilingsPurchases
$ ValCompany /Symbol Insiders Shares (000's)
CullinanManagement CGEM 4 504,750 14,936Affirm AFRM 2 150,000 14,586MountainCrestAcquisition IiMCADU 2 270,000 2,700SteelPartners SPLP 1 70,182 780AdverumBiotechnologies ADVM 2 18,600 214
SteelPartners SPLPPR 1 9,761 198Rev REVG 2 20,500 186Vector VGR 1 15,000 182DestinationXl DXLG 2 376,150 140Heico HEI.A 1 1,054 125
Landec LNDC 1 10,000 110BankOfSouthCarolinaBKSC 4 6,000 98ZedgeZDGE 2 13,335 94Phillips66Partners PSXP 2 2,890 87CenturyBancorp CNBKA 2 1,050 84
YorkWater YORW 15 877 39Owens&Minor OMI 1 1,000 27Lantheus LNTH 1 1,000 16Volt InformationSciences VOLT 2 6,000 15HudsonGlobal HSON 1 1,330 15
Sales$ Val
Company /Symbol Insiders Shares (000's)
Carvana CVNA 4 190,000 55,122TeladocHealth TDOC 3 174,681 39,339CommunityHealthSystems CYH 1 3,557,369 30,272BlinkCharging BLNK 1 540,000 28,247WayfairW 6 81,097 27,938
GuardantHealth GH 1 150,000 23,759Peloton Interactive PTON 3 135,000 21,481Facebook FB 1 83,410 20,911Gamestop GME 4 903,119 20,099Dexcom DXCM 1 47,022 16,966
Carmax KMX 4 158,952 16,875HorizonTherapeutics HZNP 1 211,204 16,450ShakeShack SHAK 2 147,920 16,437Ncino NCNO 8 232,261 16,420CrisprTherapeutics CRSP 3 72,500 15,289
Okta OKTA 2 50,940 13,159Pinterest PINS 1 175,000 12,985Cigna CI 1 55,280 12,4381LifeHealthcare ONEM 4 300,073 12,353Phreesia PHR 5 185,448 11,772
An insider is anyofficer, directororownerof10%ormoreof a classof a company's securities. Inmost cases, an insidermust report any trade totheSECwithin twobusinessdays. The tableshighlight companies that filedwith theSEC through lastWednesday. The tablesdonot includepension-planor employee stock-optionactivity, tradesbybeneficial ownersof10%ormore, tradesunder$2per shareor tradesunder100shares. The "Purchases" column includesonlyopen-market andprivatepurchases; the "Sales" column includesonlyopen-market andprivate sales,andexcludes tradesprecededbyoptionexercise in the12monthsprior to the reportedevent. Source: ThomsonReuters
For
per
sona
l non
-com
mer
cial
use
onl
y. D
o no
t edi
t or
alte
r. R
epro
duct
ions
not
per
mitt
ed.
To
repr
int o
r lic
ense
con
tent
, ple
ase
cont
act B
arro
n's
repr
ints
dep
artm
ent a
t 800
-843
-000
8 or
ww
w.d
jrepr
ints
.com
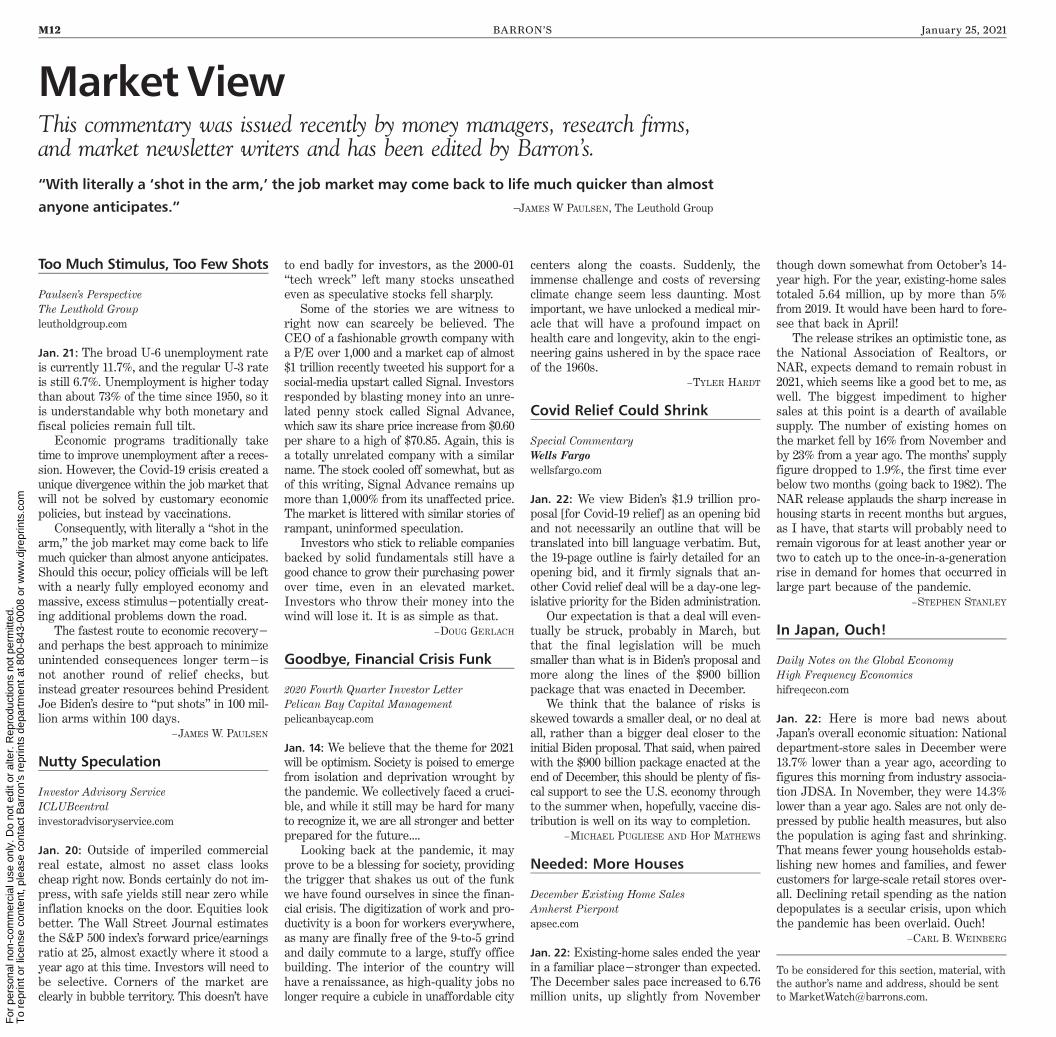
M12 BARRON’S January 25, 2021
Market View
Too Much Stimulus, Too Few Shots
Paulsen’s PerspectiveThe Leuthold Groupleutholdgroup.com
Jan. 21: The broad U-6 unemployment rateis currently 11.7%, and the regular U-3 rateis still 6.7%. Unemployment is higher todaythan about 73% of the time since 1950, so itis understandable why both monetary andfiscal policies remain full tilt.Economic programs traditionally take
time to improve unemployment after a reces-sion. However, the Covid-19 crisis created aunique divergence within the job market thatwill not be solved by customary economicpolicies, but instead by vaccinations.Consequently, with literally a “shot in the
arm,” the job market may come back to lifemuch quicker than almost anyone anticipates.Should this occur, policy officials will be leftwith a nearly fully employed economy andmassive, excess stimulus—potentially creat-ing additional problems down the road.The fastest route to economic recovery—
and perhaps the best approach to minimizeunintended consequences longer term—isnot another round of relief checks, butinstead greater resources behind PresidentJoe Biden’s desire to “put shots” in 100 mil-lion arms within 100 days.
—JAMES W. PAULSEN
Nutty Speculation
Investor Advisory ServiceICLUBcentralinvestoradvisoryservice.com
Jan. 20: Outside of imperiled commercialreal estate, almost no asset class lookscheap right now. Bonds certainly do not im-press, with safe yields still near zero whileinflation knocks on the door. Equities lookbetter. The Wall Street Journal estimatesthe S&P 500 index’s forward price/earningsratio at 25, almost exactly where it stood ayear ago at this time. Investors will need tobe selective. Corners of the market areclearly in bubble territory. This doesn’t have
to end badly for investors, as the 2000-01“tech wreck” left many stocks unscathedeven as speculative stocks fell sharply.Some of the stories we are witness to
right now can scarcely be believed. TheCEO of a fashionable growth company witha P/E over 1,000 and a market cap of almost$1 trillion recently tweeted his support for asocial-media upstart called Signal. Investorsresponded by blasting money into an unre-lated penny stock called Signal Advance,which saw its share price increase from $0.60per share to a high of $70.85. Again, this isa totally unrelated company with a similarname. The stock cooled off somewhat, but asof this writing, Signal Advance remains upmore than 1,000% from its unaffected price.The market is littered with similar stories oframpant, uninformed speculation.Investors who stick to reliable companies
backed by solid fundamentals still have agood chance to grow their purchasing powerover time, even in an elevated market.Investors who throw their money into thewind will lose it. It is as simple as that.
—DOUG GERLACH
Goodbye, Financial Crisis Funk
2020 Fourth Quarter Investor LetterPelican Bay Capital Managementpelicanbaycap.com
Jan. 14: We believe that the theme for 2021will be optimism. Society is poised to emergefrom isolation and deprivation wrought bythe pandemic. We collectively faced a cruci-ble, and while it still may be hard for manyto recognize it, we are all stronger and betterprepared for the future....Looking back at the pandemic, it may
prove to be a blessing for society, providingthe trigger that shakes us out of the funkwe have found ourselves in since the finan-cial crisis. The digitization of work and pro-ductivity is a boon for workers everywhere,as many are finally free of the 9-to-5 grindand daily commute to a large, stuffy officebuilding. The interior of the country willhave a renaissance, as high-quality jobs nolonger require a cubicle in unaffordable city
centers along the coasts. Suddenly, theimmense challenge and costs of reversingclimate change seem less daunting. Mostimportant, we have unlocked a medical mir-acle that will have a profound impact onhealth care and longevity, akin to the engi-neering gains ushered in by the space raceof the 1960s.
—TYLER HARDT
Covid Relief Could Shrink
Special CommentaryWells Fargowellsfargo.com
Jan. 22: We view Biden’s $1.9 trillion pro-posal [for Covid-19 relief] as an opening bidand not necessarily an outline that will betranslated into bill language verbatim. But,the 19-page outline is fairly detailed for anopening bid, and it firmly signals that an-other Covid relief deal will be a day-one leg-islative priority for the Biden administration.Our expectation is that a deal will even-
tually be struck, probably in March, butthat the final legislation will be muchsmaller than what is in Biden’s proposal andmore along the lines of the $900 billionpackage that was enacted in December.We think that the balance of risks is
skewed towards a smaller deal, or no deal atall, rather than a bigger deal closer to theinitial Biden proposal. That said, when pairedwith the $900 billion package enacted at theend of December, this should be plenty of fis-cal support to see the U.S. economy throughto the summer when, hopefully, vaccine dis-tribution is well on its way to completion.
—MICHAEL PUGLIESE AND HOP MATHEWS
Needed: More Houses
December Existing Home SalesAmherst Pierpontapsec.com
Jan. 22: Existing-home sales ended the yearin a familiar place—stronger than expected.The December sales pace increased to 6.76million units, up slightly from November
though down somewhat from October’s 14-year high. For the year, existing-home salestotaled 5.64 million, up by more than 5%from 2019. It would have been hard to fore-see that back in April!The release strikes an optimistic tone, as
the National Association of Realtors, orNAR, expects demand to remain robust in2021, which seems like a good bet to me, aswell. The biggest impediment to highersales at this point is a dearth of availablesupply. The number of existing homes onthe market fell by 16% from November andby 23% from a year ago. The months’ supplyfigure dropped to 1.9%, the first time everbelow two months (going back to 1982). TheNAR release applauds the sharp increase inhousing starts in recent months but argues,as I have, that starts will probably need toremain vigorous for at least another year ortwo to catch up to the once-in-a-generationrise in demand for homes that occurred inlarge part because of the pandemic.
—STEPHEN STANLEY
In Japan, Ouch!
Daily Notes on the Global EconomyHigh Frequency Economicshifreqecon.com
Jan. 22: Here is more bad news aboutJapan’s overall economic situation: Nationaldepartment-store sales in December were13.7% lower than a year ago, according tofigures this morning from industry associa-tion JDSA. In November, they were 14.3%lower than a year ago. Sales are not only de-pressed by public health measures, but alsothe population is aging fast and shrinking.That means fewer young households estab-lishing new homes and families, and fewercustomers for large-scale retail stores over-all. Declining retail spending as the nationdepopulates is a secular crisis, upon whichthe pandemic has been overlaid. Ouch!
—CARL B. WEINBERG
To be considered for this section, material, withthe author’s name and address, should be sentto [email protected].
“With literally a ‘shot in the arm,’ the job market may come back to life much quicker than almost
anyone anticipates.” —JAMES W PAULSEN, The Leuthold Group
This commentary was issued recently by money managers, research firms,and market newsletter writers and has been edited by Barron’s.
For
per
sona
l non
-com
mer
cial
use
onl
y. D
o no
t edi
t or
alte
r. R
epro
duct
ions
not
per
mitt
ed.
To
repr
int o
r lic
ense
con
tent
, ple
ase
cont
act B
arro
n's
repr
ints
dep
artm
ent a
t 800
-843
-000
8 or
ww
w.d
jrepr
ints
.com

January 25, 2021 BARRON’S M13
New York Stock Exchange Composite List
A45.84 8.56 AAR AIR .8 dd 37.16 –1.04 .13 ... ... .07530.89 14.71 ABB ABB 2.2 12 30.43 +1.08 .67 .78 1.25 .825242.95 19.79 ABMIndustries ABM 1.9 dd 39.69 –1.50 ... 2.48 ... .1911.38 3.51 ACCOBrands ACCO 3.0 11 8.80 –0.03 1.06 1.27 1.05 .06556.59 25.11 ADCTherap ADCT ... dd 33.36 +0.82 –1.89 –3.54 –2.79 ...17.21 3.41 ADT ADT 1.6 dd 9.00 +0.22 ... 1.12 1.14 .03512.14 9.90 AEA-Bridges IMPX.UT ... ... 12.02 +0.44 ... ... ... ...11.09 9.65 AEA-BridgesA IMPX ... ... 10.97 +0.30 ... ... ... ...2.22 0.65 AEA-BridgesWt IMPX.WT ... ... 2.05 +0.08 ... ... ... ...55.73 21.76 AECOM ACM ... dd 53.68 –0.05 –1.16 2.66 3.02 ...28.68 8.11 AES AES 2.2 dd 27.10 –0.50 .45 1.40 1.56 .150553.38 23.07 Aflac AFL 2.8 7 46.43 –0.05 4.43 4.91 4.87 .33118.11 35.33 AGCO AGCO .6 42 114.09 –0.04 1.63 ... ... .1616.70 1.46 AGMortgage MITT 3.9 dd 3.05 +0.12 2.39 –14.87 .15 .033.05 1.29 AHBeloA AHC 8.1 dd 1.97 +0.02 ... .22 .28 .047.78 1.91 AMCEnt AMC .0 dd 3.51 +1.18 ... –4.12 –5.31 .0389.22 36.65 AMNHealthcare AMN ... 40 75.08 +2.87 2.40 ... ... ...16.53 5.02 AMTD Intl HKIB ... ... 6.50 –0.10 .55 3.57 2.40 ...2.27 0.34 ARCDocument ARC 2.1 14 1.92 –0.17 .07 ... .10 .017.75 3.17 ASETech ASX 1.2 20 7.52 +0.41 .26 .41 .49 .136392.00 29.04 ASGN ASGN ... 26 90.41 +4.57 3.28 4.67 ... ...38.82 26.08 AT&T T 7.2 19 28.93 –0.24 1.89 3.50 3.70 .5210.94 3.43 A10Networks ATEN ... 79 9.91 +0.05 –.23 .27 .51 ...66.16 31.82 AXISCapital AXS 3.4 dd 48.84 –2.08 3.37 ... ... .4242.62 26.35 Azek AZEK ... dd 41.70 +0.47 ... .74 .89 ...51.68 19.31 AZZ AZZ 1.4 99 48.74 +1.36 1.84 2.00 2.67 .1731.00 16.20 Aaron's AAN ... ... 20.70 –0.77 ... ... 2.01 ...115.14 61.61 AbbottLabs ABT 1.6 60 112.84 +1.54 2.06 3.55 4.42 .45113.41 62.55 AbbVie ABBV 4.7 23 110.86 +0.34 5.28 10.48 12.24 1.3024.76 7.42 Abercrombie&Fitch ANF .0 dd 24.32 +0.06 .60 ... 1.21 .2026.25 9.10 AcadiaRealty AKR .0 57 15.09 –0.64 .62 ... ... .2915.11 5.22 AccelEnt ACEL ... dd 10.36 –0.04 –.09 .22 .55 ...271.18 137.15 Accenture ACN 1.4 31 254.77 +1.12 7.89 ... 9.05 .8821.20 7.96 AcornIntl ATV ... 7 20.87 +0.07 3.81 2.60 2.73 ...129.07 67.46 AcuityBrands AYI .4 19 122.89 +4.91 6.27 8.20 8.94 .1342.83 20.65 Acushnet GOLF 1.5 33 41.06 +0.62 1.60 1.08 1.73 .1558.39 3.31 Adecoagro AGRO ... dd 7.75 –0.22 –.01 –.28 .59 ...38.26 5.90 Adient ADNT ... dd 35.36 +0.25 –5.83 3.18 4.27 ...10.46 10.21 AditEdTech ADEX.UT ... ... 10.35 +0.06 ... ... ... ...39.30 19.76 AdtalemGlbEduc ATGE ... 10 38.75 +1.85 –1.58 2.92 2.84 ...177.92 71.33 AdvanceAuto AAP .6 24 163.76 –1.49 6.84 8.59 9.55 .2597.04 22.13 AdvDrainageSys WMS .4 46 94.05 +4.54 –3.21 2.59 1.58 .0923.00 8.06 AdvanSix ASIX ... 37 22.77 +0.90 1.43 1.21 2.91 ...4.40 1.80 Aegon AEG 1.4 10 4.23 –0.15 .63 .42 .68 .0713.00 1.34 Aenza AENZ ... dd 2.39 +0.16 –1.61 –.10 .13 ...64.86 10.42 AerCap AER ... dd 41.21 –2.01 8.51 ... ... ...57.27 32.15 AerojetRocket AJRD .0 34 52.51 +0.05 1.69 ... ... 5.00115.20 44.37 AffiliatedMgrs AMG .0 49 113.11 +2.79 .31 12.88 ... .01129.34 61.13 AgilentTechs A .6 55 126.33 +0.12 2.30 3.70 4.19 .19489.23 31.00 AgnicoEagle AEM 2.0 27 70.69 +2.04 2.00 1.88 3.85 .3580.51 45.23 AgreeRealty ADC 3.8 35 64.84 +1.01 1.93 1.73 1.80 .20747.55 8.41 AirLease AL 1.5 9 42.50 –0.78 5.09 4.33 4.86 .16327.89 167.43 AirProducts APD 1.9 33 283.60 –3.31 8.49 9.29 10.49 1.3413.54 9.96 AjaxI AJAX.UT ... ... 13.49 +0.71 ... ... ... ...13.35 11.00 AjaxI AJAX ... ... 12.62 +0.63 ... ... ... ...4.30 2.50 AjaxIWt AJAX.WT ... ... 3.60 +0.07 ... ... ... ...154.66 70.99 AlamoGroup ALG .4 31 153.79 +2.29 5.33 5.59 7.24 .1411.58 3.34 AlamosGold AGI ... 30 7.95 +0.08 .25 ... ... ...67.48 20.02 AlaskaAir ALK .0 dd 54.47 +0.82 6.19 –2.82 4.39 .37578.79 30.46 AlbanyIntl AIN 1.0 25 76.72 +0.69 ... 3.48 3.09 .20188.35 48.89 Albemarle ALB .9 49 173.71 –6.43 5.02 3.97 5.27 .38518.25 12.91 Albertsons ACI 2.3 10 17.50 +0.21 ... 3.13 1.85 .1026.20 5.16 Alcoa AA ... dd 19.40 –3.88 –.91 1.29 1.01 ...74.48 39.37 Alcon ALC ... dd 74.03 +3.86 –1.34 ... ... ...23.32 8.32 Alexander&Baldwin ALEX 4.1 cc 16.68 –0.33 –.51 .10 .37 .15346.20 223.03 Alexanders ALX 6.4 38 279.68 +3.54 11.74 9.38 13.01 4.50179.79 109.22 AlexandriaRlEst ARE 2.6 39 168.84 +0.47 3.12 3.10 2.81 1.0917.36 9.53 AlgonquinPwr AQN 3.6 21 17.30 +0.40 1.05 .68 .74 .1551319.32 169.95 Alibaba BABA ... 37 258.62 +15.16 8.15 ... 79.83 ...847.95 426.87 Alleghany Y .0 dd 585.38 –20.56 59.39 14.22 42.88 15.00
20.78 4.95 AlleghenyTechs ATI ... dd 18.12 –0.33 1.85 –.55 –.47 ...139.24 77.37 Allegion ALLE 1.1 35 113.61 –0.80 4.29 4.81 4.67 .3284.71 48.22 Allete ALE 3.8 19 65.71 –4.01 3.59 ... 3.68 .6175112.20 20.51 AllianceData ADS 1.2 12 70.82 –0.20 5.46 8.37 12.02 .2136.45 13.24 AllianceBernstein AB 7.7 13 36.03 +0.89 2.49 ... ... .6946.98 26.15 AllisonTransm ALSN 1.5 15 44.63 +3.79 4.91 2.73 3.83 .17125.92 64.13 Allstate ALL 2.0 8 110.43 +2.03 14.03 12.71 12.63 .5441.99 10.22 AllyFinancial ALLY 1.9 20 40.61 –0.27 4.34 4.13 5.10 .1919.84 7.74 AlpineIncmProp PINE 5.4 92 16.25 +1.00 ... .25 .26 .2210.90 3.59 AltaEquipment ALTG ... dd 10.27 +0.21 ... –.67 .28 ...3.34 0.45 AltaEquipWt ALTG.WT ... ... 2.70 +0.02 ... ... ... ...185.75 75.17 Alteryx AYX ... dd 125.83 +5.18 ... ... .74 ...38.30 15.96 AlticeUSA ATUS ... cc 36.12 +0.72 ... .65 1.67 ...13.07 9.86 AltimarAcqn ATAC.UT ... ... 11.65 –0.05 ... ... ... ...12.07 10.00 AltimarAcqnA ATAC ... ... 10.98 +0.08 ... ... ... ...3.78 1.30 AltimarAcqnWt ATAC.WT ... ... 2.20 –0.16 ... ... ... ...15.21 12.24 AltimeterGrw2 AGCB ... ... 13.93 +1.43 ... ... ... ...50.77 30.95 Altria MO 8.2 cc 41.83 +0.63 –.70 4.38 4.62 .869.95 4.60 AlumofChina ACH ... 81 8.50 –0.16 ... ... ... ...11.50 9.51 AlussaEnergy ALUS.UT ... ... 11.28 –0.17 ... ... ... ...10.81 9.25 AlussaEnergyA ALUS ... cc 10.42 +0.04 ... ... ... ...1.89 0.47 AlussaEnergyWt ALUS.WT ... ... 1.79 +0.16 ... ... ... ...22.48 8.74 AmbacFin AMBC ... dd 15.64 –0.25 –4.69 –5.74 –.87 ...10.15 3.24 AmbacFinWt AMBC.WT ... ... 5.00 +0.31 ... ... ... ...4.53 1.90 Ambev ABEV ... 23 2.80 –0.25 .19 .10 .12 ...12.40 5.80 Amcor AMCR 4.2 24 11.09 +0.04 .38 .71 .76 .117587.66 58.74 Ameren AEE 2.8 21 72.88 –1.51 3.35 ... 3.77 .51563.45 13.38 Ameresco AMRC ... 54 59.12 +5.09 ... 1.01 1.22 ...18.04 10.12 AmericaMovil AMX 2.4 35 14.28 –0.11 ... 18.19 25.27 .177117.94 10.41 AmericaMovil A AMOV 2.4 37 14.88 +0.51 ... .62 1.30 .177148.15 20.15 AmericanAssets AAT 3.5 46 28.98 +0.04 .84 1.26 .85 .2510.62 2.50 AmericanAxle AXL ... dd 9.68 +0.94 –4.31 –.11 1.10 ...49.02 20.13 AmCampus ACC 4.5 82 41.70 –1.32 .60 .43 .31 .4724.80 6.54 AmerEagle AEO 2.3 dd 24.28 +1.49 1.12 ... ... .137534.25 9.07 AmEqtyLf AEL 1.1 3 29.90 –0.60 2.68 .97 4.25 .32138.13 67.00 AmerExpress AXP 1.4 31 126.14 +3.99 7.99 3.34 ... .43115.03 44.01 AmericanFin AFG 2.4 30 84.84 –2.86 9.85 7.50 9.08 .5032.04 17.50 AmHomes4Rent AMH .6 cc 31.17 +0.93 ... ... .25 .0556.42 16.07 AIG AIG 3.2 dd 40.08 –1.27 3.74 ... 4.36 .3215.98 5.99 AmRltyInv ARL ... 17 9.58 –0.49 –1.00 –4.46 –4.43 ...11.98 5.57 AmericanRenal ARA ... dd 11.50 +0.03 –.68 .10 .14 ...96.64 65.11 AmerStWater AWR 1.7 36 80.51 –0.86 2.28 2.26 2.37 .335272.20 174.32 AmerTowerREIT AMT 2.0 53 223.92 +4.03 4.24 ... 5.05 1.2119.56 11.35 AmerVanguard AVD .4 51 18.44 +0.64 .46 ... ... .02172.56 92.00 AmerWaterWorks AWK 1.4 44 160.91 +1.19 3.43 ... ... .5541.80 21.34 AmericanWell AMWL ... dd 29.48 +0.17 –.38 –1.28 –.69 ...10.55 10.05 AmericasTechAcqn ATA.UT ... ... 10.55 +0.10 ... ... ... ...41.29 23.30 AmericoldRealty COLD 2.4 81 35.40 +1.24 .26 .37 .65 .21214.50 80.01 Ameriprise AMP 2.0 15 211.79 +3.51 13.92 14.47 19.41 1.04112.48 72.06 AmerisourceBrgn ABC 1.6 dd 107.76 +0.96 –16.65 8.41 9.19 .44125.81 54.82 Ametek AME .6 31 117.35 –1.65 3.75 3.90 4.26 .185.56 2.40 AmnealPharm AMRX ... 12 4.97 +0.14 ... .62 .71 ...7.74 1.94 Ampco-Pitt AP ... 10 6.92 +0.11 –1.67 .20 .26 ...137.18 63.05 Amphenol APH .9 35 132.24 +0.50 3.75 ... 4.23 .296.46 0.49 AmplifyEnergy AMPY .0 dd 2.00 –0.05 –1.20 –7.45 –.53 .109.08 3.98 Amrep AXR ... dd 7.80 –0.19 –.73 .40 .76 ...76.37 26.04 Anaplan PLAN ... dd 71.55 +0.65 –1.15 –.30 –.27 ...38.50 12.66 AngloGoldAsh AU ... 34 23.21 +1.13 –.03 2.66 ... ...78.47 32.58 AB InBev BUD 1.6 dd 66.61 –2.03 ... 2.03 3.16 .566910.50 3.51 AnnalyCap NLY 10.9 dd 8.36 +0.07 –1.60 ... 1.12 .228.80 1.69 AnteroMidstream AM 15.1 dd 8.13 –0.37 –.80 –.23 .87 .30757.83 0.64 AnteroResources AR ... dd 6.67 –0.59 –1.11 –.24 –.33 ...340.98 171.03 Anthem ANTM 1.2 16 314.09 –12.33 18.47 ... ... .953.80 0.79 AnworthMtg ANH 7.6 dd 2.64 +0.12 –.65 ... ... .05238.19 143.93 Aon AON .9 27 206.46 –1.47 6.37 9.65 10.74 .4641.00 35.99 AptIncmREIT AIRC ... ... 39.20 +0.67 ... ... .61 ...7.42 3.27 ApartmtInv AIV 34.1 5 4.81 –0.08 3.90 .02 –.01 .983118.70 4.30 APiGroup APG ... ... 18.56 +0.96 ... ... ... ...18.76 4.12 ApolloComRlEst ARI 11.8 47 11.84 +0.34 1.40 1.13 1.19 .3555.39 19.46 ApolloGlbMgmt APO 5.0 dd 46.43 –1.52 3.71 1.81 2.58 .5111.92 9.90 ApolloStratGr APSG.UT ... ... 11.65 +0.34 ... ... ... ...11.11 9.65 ApolloStratGrA APSG ... ... 10.91 +0.26 ... ... ... ...2.54 1.00 ApolloStratGrWt APSG.WT ... ... 2.34 +0.16 ... ... ... ...
15.78 4.48 AppleHospREIT APLE .0 dd 13.21 +0.37 .77 ... ... .1086.06 30.66 AppliedIndlTechs AIT 1.5 cc 84.32 +0.92 .62 3.49 4.17 .32141.33 79.84 Aptargroup ATR 1.0 44 138.19 –0.64 3.66 4.01 4.41 .36152.78 29.22 Aptiv APTV .0 21 139.49 –3.26 3.85 1.77 4.05 .2246.66 9.65 Aramark ARMK 1.2 dd 35.46 –1.09 –1.83 –.25 1.73 .1115.32 3.54 ArborRealty ABR 8.4 16 14.63 +0.25 1.27 .96 1.46 .3225.76 6.64 ArcelorMittal MT ... dd 22.43 –1.52 –2.42 ... 2.60 ...62.19 21.80 ArchResources ARCH .0 dd 51.12 +0.76 13.52 –15.81 3.48 .5053.99 28.92 ArcherDaniels ADM 2.7 19 52.82 +0.62 2.44 ... 3.68 .3610.36 2.09 Archrock AROC 5.9 dd 9.75 +0.13 .70 ... .27 .14531.59 5.80 Arconic ARNC ... 19 28.13 –2.16 ... .12 2.01 ...8.00 2.92 ArcosDorados ARCO .0 dd 5.50 +0.30 ... .40 .23 .0364.11 28.14 Arcosa ACA .3 26 62.48 –0.66 2.32 ... ... .0540.01 8.55 ArcusBiosci RCUS ... dd 38.41 +1.43 –1.93 –2.10 –2.33 ...21.54 9.20 Ardagh ARD 3.3 dd 18.13 +0.22 ... ... 1.60 .157.92 2.61 ArdmoreShipping ASC .0 7 3.35 –0.22 –.69 .10 .09 .0517.72 2.78 AresCommRealEst ACRE 10.9 23 12.14 +0.20 1.28 1.28 ... .3349.86 20.20 AresMgmt ARES 3.5 85 45.28 +0.14 1.06 1.68 ... .4054.50 29.91 Argan AGX 2.2 cc 44.86 –1.04 –2.73 1.37 ... 1.0068.72 25.00 ArgoGroup ARGO 2.8 dd 44.66 –0.68 –.25 .25 3.06 .31320.34 156.63 AristaNetworks ANET ... 35 311.21 –5.86 10.63 8.93 9.93 ...6.77 1.40 ArlingtonAsset AAIC ... dd 3.86 –0.07 .31 .25 .27 ...9.01 1.20 ArloTech ARLO ... dd 8.11 +0.22 –1.14 –.92 –.66 ...19.43 6.40 ArmadaHoffler AHH 3.8 25 11.51 +0.14 .41 .51 .46 .1121.15 4.95 ArmourRes ARR 10.6 dd 11.31 +0.32 –4.59 1.54 ... .105.60 1.12 ArmstrongFlooring AFI ... dd 4.21 +0.11 –2.42 –.79 –.70 ...111.46 57.96 ArmstrongWorld AWI 1.1 dd 79.40 –4.36 4.32 3.60 3.94 .21108.27 39.25 ArrowElec ARW ... 18 104.89 +1.00 –2.44 7.30 9.10 ...55.25 17.69 ArtisanPtrsAsset APAM 5.3 18 52.79 +0.05 2.65 3.29 4.55 .8340.12 20.57 Asana ASAN ... dd 38.97 +0.34 ... –1.23 –1.04 ...172.32 39.36 AsburyAutomotive ABG ... 15 162.45 –0.01 9.55 12.53 11.63 ...11.96 10.00 AscendantDigital ACND.UT ... ... 11.50 +0.27 ... ... ... ...11.00 9.57 AscendantDigA ACND ... ... 10.55 +0.05 ... ... ... ...2.25 0.93 AscendantDigWt ACND.WT ... ... 1.87 +0.16 ... ... ... ...27.25 1.27 AshfordHosp AHT ... dd 2.67 –0.06 –15.80 –41.90 –20.07 ...89.24 38.88 AshlandGlobal ASH 1.3 dd 85.65 +0.67 –8.39 4.37 4.96 .27521.56 4.09 AspenAerogels ASPN ... dd 18.88 –1.42 –.60 –.74 –.67 ...10.87 9.85 AspirCnsUn ASPL.UT ... ... 10.66 –0.05 ... ... ... ...10.72 9.65 AspirCnsA ASPL ... ... 10.24 +0.08 ... ... ... ...1.65 0.73 AspirCnsWt ASPL.WT ... ... 1.48 –0.10 ... ... ... ...34.02 13.94 AssetMarkFin AMK ... dd 24.79 +0.71 –.01 ... ... ...21.49 10.23 AssociatedBanc ASB 3.7 10 19.32 –0.79 1.86 1.42 1.55 .1848.26 24.19 AssocCapital AC .6 dd 35.25 –0.21 ... ... ... .10143.67 76.27 Assurant AIZ 2.0 21 134.90 –5.27 5.84 ... ... .6648.67 13.64 AssuredGuaranty AGO 2.2 9 36.27 –2.22 4.04 2.85 2.74 .2025.51 1.20 AtHomeGroup HOME ... dd 24.93 +2.20 –3.35 ... 1.55 ...18.59 3.78 Atento ATTO ... dd 17.58 +0.88 –5.63 ... .30 ...50.43 13.37 Athene ATH ... 10 43.29 –1.08 11.41 ... 7.96 ...50.50 10.85 AtkoreIntl ATKR ... 16 48.38 –0.35 3.10 3.96 4.47 ...3.06 1.70 AtlanticPower AT ... dd 3.01 +0.09 –.39 .30 .25 ...11.13 9.82 AtlStreetAcqn ASAQ.UT ... ... 11.09 +0.16 ... ... ... ...10.49 9.55 AtlStreetAcqn ASAQ ... ... 10.38 +0.19 ... ... ... ...
... ... AtlStreetAcqnWt ASAQ.WT ... ... 1.41 ... ... ... ... ...12.73 5.39 Atlas ATCO 4.4 12 11.38 +0.24 1.72 1.08 1.16 .12511.31 9.93 AtlasCrestInvt ACIC.UT ... ... 11.12 +0.11 ... ... ... ...11.82 9.73 AtlasCrestInvt ACIC ... ... 10.60 +0.18 ... ... ... ...2.35 1.30 AtlasCrestInvtWt ACIC.WT ... ... 1.86 –0.04 ... ... ... ...121.08 77.92 AtmosEnergy ATO 2.8 18 89.09 –0.94 4.89 5.04 5.39 .62526.40 3.71 AuroraCannabis ACB ... dd 10.65 –1.39 –25.28 ... ... ...110.91 59.54 Autohome ATHM .7 28 110.37 +7.49 3.91 28.90 32.73 .7795.93 38.16 Autoliv ALV .0 50 88.50 +1.56 5.29 2.76 6.52 .6278.33 20.59 AutoNation AN ... 17 76.69 +2.52 4.97 ... 6.79 ...1297.82 684.91 AutoZone AZO ... 16 1227.16 –21.17 71.93 75.68 84.58 ...184.41 55.50 Avalara AVLR ... dd 163.91 +6.78 –.68 –.04 –.15 ...229.40 118.17 Avalonbay AVB 3.9 35 164.73 +0.73 5.63 4.31 3.54 1.5957.24 35.62 Avangrid AGR 3.8 23 46.39 +0.68 2.26 1.97 ... .4450.00 19.46 AvanosMedical AVNS ... cc 47.56 +0.49 –.96 .69 1.11 ...12.31 9.85 AvantiAcqn AVAN.UT ... ... 11.98 +0.48 ... ... ... ...11.19 9.65 AvantiAcqnA AVAN ... ... 10.90 +0.37 ... ... ... ...2.30 0.61 AvantiAcqnWt AVAN.WT ... ... 2.16 +0.16 ... ... ... ...30.73 6.66 Avantor AVTR ... cc 30.52 +1.57 –.84 ... 1.12 ...23.53 6.13 Avaya AVYA ... dd 23.50 +2.30 –7.45 4.20 4.66 ...164.11 76.96 AveryDennison AVY 1.6 25 156.68 –2.65 3.57 6.88 ... .6246.38 8.69 Avient AVNT 2.0 57 42.52 –0.31 7.58 1.67 2.31 .212553.00 32.09 Avista AVA 4.2 21 38.66 –1.67 2.97 1.97 2.05 .40531.48 12.92 AxaltaCoating AXTA ... 70 27.57 –1.50 1.06 1.18 1.76 ...43.48 13.69 AxosFinancial AX ... 13 41.74 –0.06 2.98 3.16 3.18 ...44.55 5.30 Azul AZUL ... dd 21.21 –0.02 –5.36 ... ... ...53.60 11.81 AzurePowerGlbl AZRE ... dd 44.87 –1.18 –.74 ... .04 ...
B31.93 10.39 B&GFoods BGS 6.3 15 30.05 +1.82 1.17 2.35 2.36 .47549.26 31.66 BCE BCE 5.9 23 43.03 –0.86 2.54 2.31 2.57 .65186.37 1.91 BEST BEST ... dd 2.27 +0.26 ... –3.96 –1.37 ...21.38 5.69 BGStaffing BGSF 3.0 71 13.45 –0.19 1.28 1.51 1.17 .1074.41 29.78 BHPGroup BHP 3.3 23 71.79 +1.18 ... 5.32 ... 1.3060.97 23.64 BHPGroup BBL 4.1 19 58.27 +0.63 ... ... ... 1.3047.46 18.84 BJ'sWholesale BJ ... 16 42.25 +2.33 1.35 3.04 1.82 ...15.75 6.41 BPMidstream BPMP 11.1 8 12.52 –0.43 1.58 1.59 ... .347538.20 14.74 BP BP 7.8 dd 23.87 –0.39 1.20 –1.21 1.77 .3157.65 1.26 BPPrudhoe BPT ... 4 2.91 –0.04 ... 4.22 4.98 ...8.27 2.27 BRF BRFS ... 12 3.82 –0.17 .09 .44 .19 ...18.28 6.00 BRTApartments BRT 5.7 dd 15.46 +0.19 .05 –1.02 –.63 .2270.57 40.40 BWXTech BWXT 1.3 20 58.18 –1.67 2.55 3.00 ... .196.42 0.77 Babcock&Wilcox BW ... dd 6.28 +1.54 –3.87 –.47 –.37 ...109.19 41.50 BadgerMeter BMI .7 60 100.08 +1.66 1.61 1.69 1.81 .1824.04 9.12 BakerHughes BKR 3.2 dd 22.17 –0.70 –14.73 .68 1.07 .18102.76 51.26 Ball BLL .7 58 90.74 +0.32 1.66 2.93 3.40 .1554.85 7.22 Bally's BALY .0 dd 53.26 +0.85 ... –.85 1.68 .1019.38 6.44 BancCalifornia BANC 1.3 dd 17.90 +0.48 ... .94 1.09 .065.11 2.10 BancoBBVA BBAR ... 2 2.81 –0.15 3.15 1.05 ... ...5.80 2.49 BancoBilbaoViz BBVA 4.7 dd 4.88 –0.07 .53 ... ... .17447.19 2.58 BancoBradesco BBDO 2.0 11 4.16 –0.26 ... ... ... .0032
- Earnings -52-Week Tick - Week’s - Last This Next DivHigh Low Name Sym Yld P/E Last Chg. Year Year Year Amt
- Earnings -52-Week Tick - Week’s - Last This Next DivHigh Low Name Sym Yld P/E Last Chg. Year Year Year Amt
- Earnings -52-Week Tick - Week’s - Last This Next DivHigh Low Name Sym Yld P/E Last Chg. Year Year Year Amt
- Earnings -52-Week Tick - Week’s - Last This Next DivHigh Low Name Sym Yld P/E Last Chg. Year Year Year Amt
Barron's 50-StockAverage............. 35CashTrack ..................................... 28Charting theMarket ...................... 9Closed-EndFunds.......................... 32ComingEarnings ........................... 36ConferenceCall Calendar............... 26Delta Tactical Sentiment ................ 35Distributions&Offerings ............... 37DividendBoosts - Reductions......... 39
DividendEx-PaymentDates ........... 39DJAverages ................................... 34DJU.S. TotalMarket IndustryGroups 36DowJonesAverages ...................... 34DowJonesPer ShareValues ........... 35ExchangeTradedPortfolios ........... 23Federal ReserveDataBank ............. 38ForeignExchange .......................... 38Global StockMarkets..................... 27
Gold&Silver Prices......................... 38GoldMining Index ......................... 38Indexes P/Es&Yields ...................... 35Initial PublicOfferings.................... 36Investor SentimentReadings ......... 38Key ForeignMarket Indexes ........... 27Market Lab .................................... 34MoneyRates,U.S.&Foreign .......... 38MoneySupply ............................... 38
Mutual Funds ................................ 28N.Y. StockExchange ...................... 13NasdaqNationalMarket................ 19NewCorporate Listings ................. 39NewHighs&Lows ......................... 37NYSEHalf-HourlyVolume.............. 36OtherMarket Indexes .................... 34Pulseof theEconomy..................... 36SECForm144Filings...................... 35StockSplits - SpecialDividends ...... 39
StockVolume ................................ 35TopSavingsDeposit Yields............. 33TradingDiary ................................. 34Vital Signs...................................... 2Week InStocks............................... 35WeeklyBondStatistics................... 38Winners&Losers Stocks ................ 10
For statistical queries please contact theStatistics Team: 609-520-4799or email: [email protected]
The Week’s Statistics Bonus Tables: M26, M36 & M39
FIVE-DAY DOW COMPOSITE
Monday Tuesday Wednesday Thursday Friday31260
31135
31010
30885
3076010 12 2 4pm 10 12 2 4pm 10 12 2 4pm 10 12 2 4pm 10 12 2 4pm
HOLIDAY +116.26 +257.86 -12.37 -179.03
(Prev Fri'sClose)
Back in the Saddle: After falling the prior week, the Dow gained 0.6% in Joe Biden’s firstweek as president. Apple jumped 9% on the week, while IBM fell 7.6% after announcingweak sales and weak guidance.
NOTICE TO READERS:Sign up for the Weekly Market Lab Newsletter: barrons.com/newsletters
Please visit the new Market Lab home page on barrons.com under Data.www.barrons.com/market-data/market-lab
For
per
sona
l non
-com
mer
cial
use
onl
y. D
o no
t edi
t or
alte
r. R
epro
duct
ions
not
per
mitt
ed.
To
repr
int o
r lic
ense
con
tent
, ple
ase
cont
act B
arro
n's
repr
ints
dep
artm
ent a
t 800
-843
-000
8 or
ww
w.d
jrepr
ints
.com
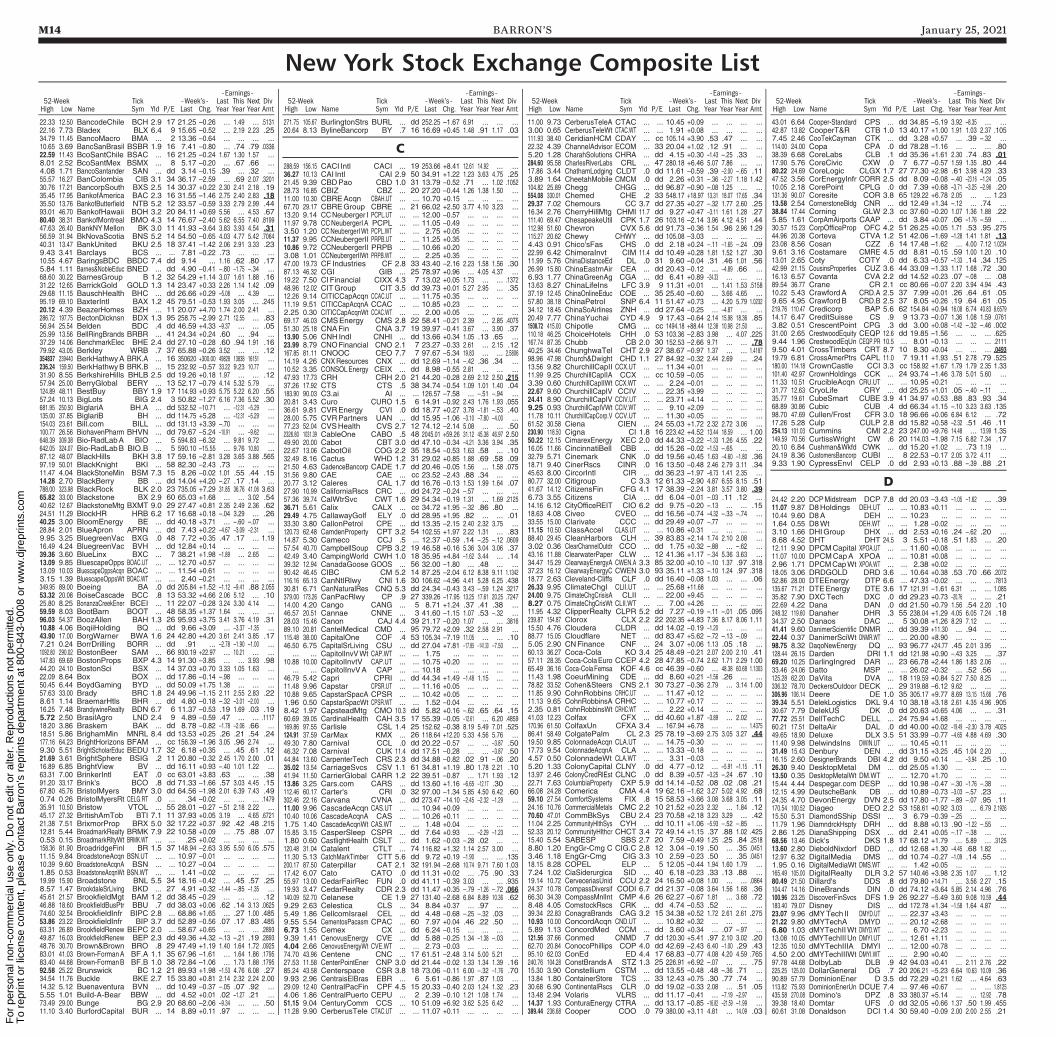
M14 BARRON’S January 25, 2021
New York Stock Exchange Composite List
22.33 12.50 BancodeChile BCH 2.9 17 21.25 –0.26 ... 1.49 ... .513122.16 7.73 Bladex BLX 6.4 9 15.65 –0.52 ... 2.19 2.23 .2534.79 11.45 BancoMacro BMA ... 2 13.36 –0.64 ... ... ... ...10.65 3.69 BancSanBrasil BSBR 1.9 16 7.41 –0.80 ... .74 .79 .033622.59 11.43 BcoSantChile BSAC ... 16 21.25 –0.24 1.67 1.30 1.57 ...8.01 2.52 BcoSantMex BSMX ... 8 5.17 –0.20 ... .67 .66 ...4.08 1.71 BancoSantander SAN ... dd 3.14 –0.15 .39 ... .32 ...55.57 16.27 BanColombia CIB 3.1 34 36.17 –2.59 ... .69 2.07 .320130.76 17.21 BancorpSouth BXS 2.5 14 30.37 +0.22 2.30 2.41 2.18 .1935.45 17.95 BankofAmerica BAC 2.3 16 31.55 –1.46 2.75 2.40 2.83 .1835.50 13.76 BankofButterfield NTB 5.2 12 33.57 –0.59 3.33 2.79 2.99 .4493.01 46.70 BankofHawaii BOH 3.2 20 84.11 +0.69 5.56 ... 4.53 .6780.40 38.31 BankofMontreal BMO 4.3 14 76.67 –2.40 5.62 6.55 7.40 .819947.63 26.40 BankNYMellon BK 3.0 11 41.93 –3.64 3.83 3.93 4.54 .3156.59 31.94 BkNovaScotia BNS 5.2 14 54.50 –0.65 4.03 4.77 5.42 .706440.31 13.47 BankUnited BKU 2.5 18 37.41 –1.42 2.06 2.91 3.33 .239.43 3.41 Barclays BCS ... ... 7.81 –0.22 .73 ... ... ...10.55 4.67 BaringsBDC BBDC 7.4 dd 9.14 ... 1.16 .62 .80 .175.84 1.11 Barnes&NobleEduc BNED ... dd 4.90 –0.41 –.80 –1.75 –.34 ...68.60 30.22 BarnesGroup B 1.2 32 54.29 +1.14 3.07 1.61 1.88 .1631.22 12.65 BarrickGold GOLD 1.3 14 23.47 +0.33 2.26 1.14 1.42 .0929.68 11.15 BauschHealth BHC ... dd 26.66 +0.29 –5.08 ... 4.39 ...95.19 69.10 BaxterIntl BAX 1.2 45 79.51 –0.53 1.93 3.05 ... .24520.12 4.39 BeazerHomes BZH ... 11 20.07 +4.70 1.74 2.00 2.41 ...286.72 197.75 BectonDicknsn BDX 1.3 95 258.75 –2.99 2.71 12.55 ... .8356.94 25.54 Belden BDC .4 dd 46.59 +4.33 –9.37 ... ... .0525.99 13.56 BellRingBrands BRBR ... 41 24.34 +0.24 .60 ... .94 ...37.29 14.06 BenchmarkElec BHE 2.4 dd 27.10 –0.28 .60 .94 1.91 .1679.92 43.05 Berkley WRB .7 37 65.88 –0.26 3.52 ... ... .12354837 239440 BerkHathwyA BRK.A ... 16 350620 +300.00 49828 13838 16151 ...236.24 159.50 BerkHathwyB BRK.B ... 15 232.92 –0.57 33.22 9.23 10.77 ...31.90 8.55 BerkshireHills BHLB 2.5 dd 19.26 +0.18 1.97 ... ... .1257.94 25.00 BerryGlobal BERY ... 13 52.17 –0.79 4.14 5.32 5.79 ...124.89 48.11 BestBuy BBY 1.9 17 114.93 +0.93 5.75 5.22 6.20 .5557.24 10.13 BigLots BIG 2.4 3 50.82 –1.27 6.16 7.36 5.52 .30681.95 250.50 BiglariA BH.A ... dd 532.52 –10.71 ... –12.31 –5.29 ...135.00 37.85 BiglariB BH ... dd 114.75 +5.28 ... –12.31 –5.29 ...154.03 23.61 Bill.com BILL ... dd 131.13 +3.39 –.70 ... ... ...100.77 26.56 BiohavenPharm BHVN ... dd 79.67 –5.24 –10.91 ... –9.62 ...648.39 309.38 Bio-RadLabA BIO ... 5 594.83 –6.32 ... 9.81 9.72 ...642.05 324.07 Bio-RadLabB BIO.B ... 5 590.10 –15.55 ... 9.76 10.80 ...87.12 48.07 BlackHills BKH 3.8 17 59.16 –2.81 3.28 3.65 3.88 .56597.19 50.01 BlackKnight BKI ... 58 82.30 –2.43 .73 ... ... ...11.47 4.04 BlackStoneMin BSM 7.3 15 8.26 –0.02 1.01 .55 .44 .1514.28 2.70 BlackBerry BB ... dd 14.04 +4.20 –.27 .17 .14 ...788.00 323.98 BlackRock BLK 2.0 23 735.05 +7.29 31.85 36.76 41.06 3.6365.82 33.00 Blackstone BX 2.9 60 65.03 +1.68 ... ... 3.02 .5440.62 12.67 BlackstoneMtg BXMT 9.0 29 27.47 +0.81 2.35 2.49 2.36 .6224.51 11.29 BlockHR HRB 6.2 17 16.68 +0.18 –.04 3.29 ... .2640.25 3.00 BloomEnergy BE ... dd 40.18 +3.71 ... –.60 –.07 ...28.84 2.01 BlueApron APRN ... dd 7.43 +0.22 –4.67 –3.09 –2.31 ...9.95 3.25 BluegreenVac BXG .0 48 7.72 +0.35 .47 .17 ... 1.1916.49 4.24 BluegreenVac BVH ... dd 12.84 +0.14 ... ... ... ...39.36 3.60 BlueLinx BXC ... 7 38.21 +1.98 –1.89 ... 2.65 ...13.09 9.85 BluescapeOpps BOAC.UT ... ... 12.70 +0.57 ... ... ... ...13.09 10.03 BluescapeOppsAcqn BOAC ... ... 11.54 +0.61 ... ... ... ...3.15 1.39 BluescapeOppsWt BOAC.WT ... ... 2.40 –0.21 ... ... ... ...349.95 89.00 Boeing BA .0 dd 205.84 +1.52 –1.12 –9.41 .88 2.05553.32 20.08 BoiseCascade BCC .8 13 53.32 +4.66 2.06 5.12 ... .1025.80 8.25 BonanzaCreekEner BCEI ... 11 22.07 –0.28 3.24 3.30 4.14 ...59.59 8.03 BootBarn BOOT ... 48 58.35 +1.37 1.64 ... ... ...96.03 54.37 BoozAllen BAH 1.3 26 95.93 +3.75 3.41 3.76 4.19 .3110.88 4.06 BoqiiHolding BQ ... dd 9.66 +3.09 ... –3.37 –1.35 ...43.90 17.00 BorgWarner BWA 1.6 24 42.80 +4.20 3.61 2.41 3.85 .177.21 0.24 BorrDrilling BORR ... dd .91 ... –2.78 –1.90 –1.00 ...1092.80 290.02 BostonBeer SAM ... 66 930.19 +22.97 ... 10.21 ... ...147.83 69.69 BostonProps BXP 4.3 14 91.30 –3.85 ... ... 3.93 .9844.20 24.10 BostonSci BSX ... 14 37.03 +0.70 3.33 1.05 1.63 ...22.09 8.64 Box BOX ... dd 17.86 –0.14 –.98 ... ... ...50.45 6.44 BoydGaming BYD ... dd 50.09 +1.75 1.38 ... ... ...57.63 33.00 Brady BRC 1.8 24 49.96 –1.15 2.11 2.55 2.83 .228.61 1.14 BraemarHtls BHR ... dd 4.80 –0.18 –.32 –3.01 –2.00 ...16.25 7.48 BrandywineRealty BDN 6.7 6 11.37 –0.53 .19 1.69 .03 .195.72 2.50 BrasilAgro LND 2.4 9 4.89 –0.59 .47 ... ... .111718.20 3.86 Braskem BAK ... dd 8.78 –0.82 –1.78 –2.06 .66 ...18.51 5.86 BrighamMin MNRL 8.4 dd 13.53 +0.25 .26 .21 .54 .24177.16 64.23 BrightHorizons BFAM ... cc 156.39 –1.96 3.05 .96 2.74 ...9.30 5.51 BrightScholarEduc BEDU 1.7 32 6.18 +0.35 ... .45 .61 .1221.69 3.61 BrightSphere BSIG .2 11 20.80 –0.32 2.45 1.70 2.00 .0116.89 6.85 BrightView BV ... dd 16.11 +0.93 –.40 1.01 1.22 ...63.31 7.00 BrinkerIntl EAT .0 cc 63.01 +3.83 .63 ... ... .3891.20 33.17 Brink's BCO .8 dd 71.33 –1.66 .57 3.03 4.45 .1567.80 45.76 BristolMyers BMY 3.0 dd 64.56 –1.98 2.01 6.39 7.43 .490.74 0.26 BristolMyersRt CELG.RT .0 ... .34 –0.02 ... ... ... .147935.91 10.50 Bristow VTOL ... 55 28.01 –0.27 –.51 2.18 2.22 ...45.17 27.32 BritishAmTob BTI 7.1 11 37.93 +0.05 3.19 ... 4.65 .672121.38 7.51 BrixmorProp BRX 5.0 32 17.22 +0.37 .92 .42 .48 .21512.81 5.44 BroadmarkRealty BRMK 7.9 22 10.58 +0.09 ... .75 .88 .070.53 0.15 BroadmarkRltyWt BRMK.WT ... ... .25 +0.02 ... ... ... ...158.36 81.90 BroadridgeFinl BR 1.5 37 148.94 –2.63 3.95 5.50 6.05 .57511.15 9.84 BroadstoneAcqn BSN.UT ... ... 10.97 –0.01 ... ... ... ...10.39 9.60 BroadstoneAcqnA BSN ... ... 10.27 –0.04 ... ... ... ...1.85 0.53 BroadstoneAcqnWt BSN.WT ... ... 1.41 –0.02 ... ... ... ...19.99 15.90 Broadstone BNL 5.5 34 18.16 –0.42 ... .45 .57 .258.57 1.47 BrookdaleSrLiving BKD ... 27 4.91 +0.32 –1.44 –.85 –1.35 ...45.61 21.57 BrookfieldMgt BAM 1.2 dd 38.45 –0.29 ... ... ... .1246.88 18.60 BrookfieldBusPtr BBU .7 dd 38.03 +0.06 .62 .14 3.13 .062574.60 32.54 BrookfieldInfr BIPC 2.8 ... 68.86 +1.65 ... .27 1.00 .48553.86 23.22 BrookfieldInfr BIP 3.7 dd 52.89 –0.56 .07 .17 .83 .48563.31 26.89 BrookfieldRenew BEPC 2.0 ... 58.67 +0.65 ... ... ... .289349.87 16.03 BrookfieldRenew BEP 2.3 dd 49.36 +4.32 –.13 –.21 .19 .289348.76 30.70 Brown&Brown BRO .8 29 47.49 +1.19 1.40 1.64 1.72 .092583.01 41.03 Brown-FormanA BF.A 1.1 35 67.96 –1.61 ... 1.64 1.86 .179583.40 44.68 Brown-FormanB BF.B 1.0 38 72.84 –1.06 ... 1.73 1.88 .179592.58 25.22 Brunswick BC 1.2 21 89.93 +1.98 –1.53 4.76 6.08 .2734.54 11.76 Buckle BKE 2.7 15 33.80 +0.81 2.14 2.32 2.24 2.0014.32 5.12 Buenaventura BVN ... dd 10.49 –0.37 –.05 .07 .92 ...5.55 1.01 Build-A-Bear BBW ... dd 4.52 +0.01 .02 –1.27 .21 ...73.49 29.00 Bunge BG 2.9 20 68.60 –2.06 –9.34 ... ... .5011.10 3.40 BurfordCapital BUR ... 14 8.89 +0.11 .97 ... ... ...
271.75 105.67 BurlingtonStrs BURL ... dd 252.25 –1.67 6.91 ... ... ...20.64 8.13 BylineBancorp BY .7 16 16.69 +0.45 1.48 .91 1.17 .03
C288.59 156.15 CACI Intl CACI ... 19 253.66 +8.41 12.61 14.92 ... ...36.27 10.13 CAI Intl CAI 2.9 50 34.91 +1.22 1.23 3.63 4.75 .2521.45 9.39 CBDPao CBD 1.0 31 13.79 –0.52 .71 ... 1.02 .105228.73 16.85 CBIZ CBZ ... 20 27.20 –0.44 1.26 1.38 1.50 ...11.00 10.30 CBREAcqn CBAH.UT ... ... 10.70 +0.15 ... ... ... ...67.70 29.17 CBREGroup CBRE ... 21 66.02 +2.50 3.77 4.10 3.23 ...13.20 9.14 CCNeuberger I PCPL.UT ... ... 12.00 –0.57 ... ... ... ...11.97 9.78 CCNeubergerIA PCPL ... ... 11.05 –0.49 ... ... ... ...3.50 1.20 CCNeubergerIWt PCPL.WT ... ... 2.75 +0.05 ... ... ... ...11.37 9.95 CCNeubergerII PRPB.UT ... ... 11.25 +0.35 ... ... ... ...10.86 9.72 CCNeubergerII PRPB ... ... 10.66 +0.20 ... ... ... ...3.08 1.01 CCNeubergerIIWt PRPB.WT ... ... 2.25 +0.35 ... ... ... ...47.00 19.73 CF Industries CF 2.8 33 43.40 –2.16 2.23 1.58 1.56 .3087.13 46.32 CGI GIB ... 25 78.97 +0.96 ... 4.05 4.37 ...19.22 7.50 CIFinancial CIXX 4.3 7 13.02 +0.05 1.73 ... ... .137248.96 12.02 CITGroup CIT 3.5 dd 39.73 +0.01 5.27 2.95 ... .3512.26 9.14 CITICCapAcqn CCAC.UT ... ... 11.75 +0.35 ... ... ... ...11.19 9.51 CITICCapAcqnA CCAC ... ... 10.85 +0.23 ... ... ... ...2.25 0.30 CITICCapAcqnWt CCAC.WT ... ... 2.00 +0.05 ... ... ... ...69.17 46.03 CMSEnergy CMS 2.8 22 58.41 –0.21 2.39 ... 2.85 .407551.30 25.18 CNAFin CNA 3.7 19 39.97 –0.41 3.67 ... 3.90 .3713.90 5.06 CNH Indl CNHI ... dd 13.66 +0.34 1.05 .13 .65 ...23.99 8.79 CNOFinancial CNO 2.1 7 23.27 –0.33 2.61 ... 2.15 .12167.85 81.11 CNOOC CEO 7.7 7 97.67 –5.34 19.83 ... ... 2.580614.19 4.26 CNXResources CNX ... dd 12.69 –1.14 –.42 .36 .34 ...10.52 3.35 CONSOLEnergy CEIX ... dd 8.98 –0.55 2.81 ... ... ...47.93 17.73 CRH CRH 2.0 21 44.20 –0.28 2.69 2.12 2.50 .21537.26 17.92 CTS CTS .5 38 34.74 –0.54 1.09 1.01 1.40 .04183.90 90.03 C3.ai AI ... ... 126.57 –7.58 ... –.51 –.94 ...20.81 3.43 Curo CURO 1.5 6 14.91 –0.92 2.43 1.76 1.93 .05536.61 9.81 CVREnergy CVI .0 dd 18.77 +0.27 3.78 –1.81 –.53 .4028.00 5.75 CVRPartners UAN ... dd 15.95 –1.06 –3.10 –7.80 –4.00 ...77.23 52.04 CVSHealth CVS 2.7 12 74.12 –2.14 5.08 ... ... .502326.80 1031.39 CableOne CABO .5 48 2045.01 +59.26 31.12 45.38 46.97 2.5049.90 20.00 Cabot CBT 3.0 dd 47.10 –0.34 –4.21 3.36 3.94 .3522.67 13.06 CabotOil COG 2.2 35 18.54 –0.53 1.63 .58 ... .1032.49 8.16 Cactus WHD 1.2 31 29.02 +0.85 1.88 .69 .58 .0921.50 4.63 CadenceBancorp CADE 1.7 dd 20.46 –0.05 1.56 ... 1.58 .07531.56 9.80 CAE CAE ... cc 23.52 –2.43 .88 .34 ... ...20.77 3.12 Caleres CAL 1.7 dd 16.76 –0.13 1.53 1.99 1.64 .0727.90 10.99 CaliforniaRscs CRC ... dd 24.72 –0.24 –.57 ... ... ...57.36 39.74 CalWtrSvc CWT 1.6 29 54.34 –0.19 1.31 ... 1.69 .212536.71 5.61 Calix CALX ... cc 34.72 +1.95 –.32 .86 .80 ...29.49 4.75 CallawayGolf ELY .0 dd 28.95 +1.95 .82 ... ... .0133.30 3.80 CallonPetrol CPE ... dd 13.35 –2.15 2.40 2.32 3.75 ...120.73 62.48 CamdenProperty CPT 3.2 54 102.55 +1.97 2.22 1.31 ... .8314.87 5.30 Cameco CCJ .5 ... 12.37 –0.59 .14 –.25 –.12 .060957.54 40.70 CampbellSoup CPB 3.2 19 46.58 +0.16 5.36 3.04 3.06 .3742.49 3.40 CampingWorld CWH 1.0 18 35.95 +4.84 –1.62 3.44 ... .1439.32 12.94 CanadaGoose GOOS ... 56 32.00 –1.80 ... .48 ... ...90.42 46.45 CIBC CM 5.2 14 87.25 –2.04 6.12 8.38 9.11 1.1342116.16 65.13 CanNtlRlwy CNI 1.6 30 106.62 –4.96 4.41 5.28 6.25 .43830.81 6.71 CanNaturalRes CNQ 5.3 dd 24.34 –0.43 3.43 –.59 1.24 .3217379.00 173.26 CanPacRlwy CP .9 27 339.26 –17.95 13.25 17.61 20.25 .724714.00 4.20 Cango CANG ... 5 8.71 +1.24 .37 .41 .38 ...46.57 20.51 Cannae CNNE ... 3 41.60 –1.15 1.07 .53 –.32 ...28.03 15.46 Canon CAJ 4.4 39 21.17 –0.20 1.07 ... ... .381689.10 20.81 CantelMedical CMD ... 95 79.72 +2.09 .32 2.58 2.91 ...115.48 38.00 CapitalOne COF .4 53 105.34 –7.19 11.05 ... ... .1046.50 6.75 CapitalSrLiving CSU ... dd 27.04 +7.81 –17.85 –141.30 –7.50 ...... ... CapitolInvVWt CAP.WT ... ... 1.75 ... ... ... ... ...
10.88 10.00 CapitolInvtV CAP.UT ... ... 10.75 +0.20 ... ... ... ...... ... CapitolInvVA CAP ... ... 10.18 ... ... ... ... ...
46.79 5.42 Capri CPRI ... dd 44.34 +1.49 –1.48 1.15 ... ...11.48 9.96 Capstar CPSR.UT ... ... 11.16 +0.05 ... ... ... ...10.88 9.65 CapstarSpacA CPSR ... ... 10.42 +0.05 ... ... ... ...1.96 0.50 CapstarSpacWt CPSR.WT ... ... 1.52 –0.04 ... ... ... ...8.42 1.97 CapsteadMtg CMO 10.3 dd 5.82 +0.16 –.62 .65 .64 .1560.69 39.05 CardinalHealth CAH 3.5 17 55.39 –0.05 –12.61 ... 6.20 .4859169.86 97.55 Carlisle CSL 1.4 25 152.62 –0.38 8.19 5.49 7.01 .525124.91 37.59 CarMax KMX ... 26 118.64 +12.20 5.33 4.56 5.76 ...49.30 7.80 Carnival CCL .0 dd 20.22 –0.57 ... ... –3.87 .5046.32 7.08 Carnival CUK 11.4 dd 17.51 –0.28 ... ... –3.87 .5044.84 13.60 CarpenterTech CRS 2.3 dd 34.88 –0.82 .02 .91 –.06 .2035.02 13.54 CarriageSvcs CSV 1.1 61 34.81 +1.19 .80 1.78 2.21 .1041.94 11.50 CarrierGlobal CARR 1.2 22 39.51 –0.87 ... 1.71 1.93 .1213.86 3.25 Cars.com CARS ... dd 13.60 +1.16 –6.65 –12.17 .30 ...112.46 60.17 Carter's CRI .0 32 97.00 –1.34 5.85 4.50 6.42 .60302.46 22.16 Carvana CVNA ... dd 273.47 –14.10 –2.45 –2.32 –1.29 ...11.00 9.96 CascadeAcqn CAS.UT ... ... 10.94 +0.09 ... ... ... ...10.40 10.06 CascadeAcqnA CAS ... ... 10.26 +0.11 ... ... ... ...1.75 1.40 CascadeAcqnWt CAS.WT ... ... 1.48 +0.04 ... ... ... ...15.85 3.15 CasperSleep CSPR ... dd 7.64 +0.93 ... –2.29 –1.23 ...1.80 0.60 CastlightHealth CSLT ... dd 1.62 –0.03 –.28 .02 ... ...120.48 31.04 Catalent CTLT ... 74 116.82 +1.32 1.14 2.57 3.00 ...11.30 5.13 CatchMarkTimber CTT 5.6 dd 9.72 +0.19 –1.90 ... ... .135200.17 87.50 Caterpillar CAT 2.1 32 191.94 –2.68 10.74 9.71 7.60 1.0317.42 6.07 Cato CATO .0 dd 11.31 +0.02 ... .75 .90 .3355.97 13.00 CedarFairRec FUN .0 dd 41.11 –0.39 3.03 ... ... .93519.93 3.47 CedarRealty CDR 2.3 dd 11.47 +0.35 –.79 –1.26 –.72 .066140.09 52.70 Celanese CE 1.9 27 131.40 –2.68 6.84 8.89 10.36 .629.29 2.63 Celestica CLS ... 34 8.84 +0.37 ... .97 ... ...5.49 1.86 CellcomIsrael CEL ... dd 4.48 –0.68 –.25 –.32 .03 ...9.55 5.54 CementosPacasm CPAC ... 60 7.97 +0.04 .46 .22 .50 ...6.73 1.55 Cemex CX ... dd 6.24 –0.15 ... ... ... ...9.39 1.41 CenovusEnergy CVE ... dd 5.88 –0.25 1.34 –1.38 –.03 ...4.04 2.66 CenovusEnergyWt CVE.WT ... ... 2.73 –0.03 ... ... ... ...74.70 43.96 Centene CNC ... 17 61.51 –2.48 3.14 5.00 5.21 ...27.53 11.58 CenterPointEner CNP 3.0 dd 21.44 –0.02 1.33 1.34 1.39 .1685.24 43.58 Centerspace CSR 3.8 18 73.06 –0.11 6.00 –.32 –1.76 .709.93 2.96 CentraisElBras EBR ... 6 5.61 –0.86 1.97 .87 1.03 ...29.09 12.40 CentralPacFin CPF 4.5 15 20.33 –0.40 2.03 1.24 1.32 .234.06 1.86 CentralPuerto CEPU ... 2 2.39 –0.10 1.21 1.08 1.74 ...51.15 9.04 CenturyComm CCS ... 10 51.09 +6.92 3.62 5.25 6.42 ...11.28 9.90 CerberusTele CTAC.UT ... ... 11.07 +0.11 ... ... ... ...
11.00 9.73 CerberusTeleA CTAC ... ... 10.45 +0.09 ... ... ... ...3.00 0.65 CerberusTeleWt CTAC.WT ... ... 1.91 +0.08 ... ... ... ...111.93 38.40 CeridianHCM CDAY ... cc 105.14 +3.90 .53 .47 ... ...22.32 4.39 ChannelAdvisor ECOM ... 33 20.04 +1.02 .12 .91 ... ...5.20 1.28 CharahSolutions CHRA ... dd 4.15 +0.30 –1.43 –.25 .33 ...284.60 95.58 CharlesRiverLabs CRL ... 47 280.18 +6.46 5.07 7.86 ... ...17.86 3.44 ChathamLodging CLDT .0 dd 11.61 –0.59 .39 –2.00 –.65 .113.89 1.64 CheetahMobile CMCM .0 dd 2.26 +0.31 –.36 –2.27 1.18 1.42104.82 25.89 Chegg CHGG ... dd 96.87 –0.90 –.08 1.25 ... ...554.08 330.01 Chemed CHE .2 33 548.17 +18.97 13.31 18.07 17.65 .3429.37 7.02 Chemours CC 3.7 dd 27.35 +0.27 –.32 1.77 2.60 .2516.34 2.76 CherryHillMtg CHMI 11.7 dd 9.27 +0.47 –3.11 1.61 1.28 .27111.40 69.47 ChesapeakeUtil CPK 1.7 26 103.16 –2.14 3.96 4.12 4.51 .44112.98 51.60 Chevron CVX 5.6 dd 91.73 –0.36 1.54 .96 2.96 1.29115.27 20.62 Chewy CHWY ... dd 105.08 –3.03 ... ... ... ...4.43 0.91 Chico'sFas CHS .0 dd 2.18 +0.24 –.11 –1.65 –.24 .0922.99 6.42 ChimeraInvt CIM 11.4 dd 10.49 +0.28 1.81 1.52 1.27 .3011.99 5.76 ChinaDistanceEd DL .0 31 9.60 –0.04 .31 .46 1.01 .5626.99 15.80 ChinaEastrnAir CEA ... dd 20.43 –0.12 ... –4.89 .66 ...6.93 1.77 ChinaGreenAg CGA ... dd 6.41 +0.89 –24.33 ... ... ...13.63 8.27 ChinaLifeIns LFC 3.9 9 11.31 +0.01 ... 1.41 1.53 .515837.19 12.45 ChinaOnlineEduc COE ... 35 25.40 –0.60 ... 3.66 4.65 ...57.80 38.18 ChinaPetrol SNP 6.4 11 51.47 +0.73 ... 4.20 5.79 1.023234.12 18.45 ChinaSoAirlines ZNH ... dd 27.64 –0.25 ... –4.87 ... ...20.49 7.77 ChinaYuchai CYD 4.9 9 17.43 –0.64 2.14 15.98 18.36 .851508.72 415.00 Chipotle CMG ... cc 1494.18 +88.44 12.38 10.98 21.50 ...110.18 46.25 ChoiceHotels CHH .0 53 103.36 –2.83 3.98 ... 4.07 .225167.74 87.35 Chubb CB 2.0 30 152.53 –2.66 9.71 ... ... .7840.25 34.46 ChunghwaTel CHT 2.9 27 38.67 –0.97 1.37 ... ... 1.418798.96 47.98 Church&Dwight CHD 1.1 27 84.92 –0.32 2.44 2.69 ... .2413.56 9.82 ChurchillCapII CCX.UT ... ... 11.34 +0.01 ... ... ... ...11.99 9.25 ChurchillCapIIA CCX ... cc 10.59 –0.05 ... ... ... ...3.39 0.60 ChurchillCapIIWt CCX.WT ... ... 2.24 –0.01 ... ... ... ...22.67 9.60 ChurchillCapIV CCIV ... ... 22.35 +3.99 ... ... ... ...24.41 8.90 ChurchillCapIV CCIV.UT ... ... 23.71 +4.14 ... ... ... ...9.25 0.93 ChurchillCapIVWt CCIV.WT ... ... 9.10 +2.09 ... ... ... ...11.78 10.11 ChurchillCapCorp.V CCV.UT ... ... 11.30 +0.05 ... ... ... ...61.52 30.58 Ciena CIEN ... 24 55.03 +1.72 2.32 2.72 3.06 ...230.90 118.50 Cigna CI 1.8 16 223.42 +4.52 13.44 18.59 ... 1.0050.22 12.15 CimarexEnergy XEC 2.0 dd 44.33 –3.22 –1.33 1.26 4.55 .2216.05 11.66 CincinnatiBell CBB ... dd 15.26 –0.02 –1.53 –.65 ... ...32.79 5.71 Cinemark CNK .0 dd 19.56 +0.45 1.63 –4.60 –1.80 .3618.71 9.40 CinerRscs CINR .0 16 13.50 –0.48 2.46 2.79 3.11 .3445.63 8.00 CircorIntl CIR ... dd 36.23 –1.97 –6.73 1.41 2.35 ...80.77 32.00 Citigroup C 3.3 12 61.33 –2.90 4.87 6.55 8.15 .5141.67 14.12 CitizensFin CFG 4.1 17 38.39 –2.24 3.81 3.57 3.80 .396.73 3.55 Citizens CIA ... dd 6.04 –0.01 –.03 .11 .12 ...14.16 6.12 CityOfficeREIT CIO 6.2 dd 9.75 –0.20 –.13 ... ... .1518.63 4.08 Civeo CVEO ... dd 16.56 –0.74 –4.32 –.33 –.74 ...33.55 15.00 Clarivate CCC ... dd 29.49 +0.07 –.77 ... ... ...11.15 10.50 ClassAccel CLAS.UT ... ... 10.86 +0.31 ... ... ... ...88.40 29.45 CleanHarbors CLH ... 39 83.83 +2.14 1.74 2.10 2.08 ...3.02 0.36 ClearChannelOutdr CCO ... dd 1.75 +0.32 –.88 ... –.62 ...43.16 11.88 ClearwaterPaper CLW ... 12 41.36 +1.17 –.34 5.36 3.63 ...34.47 15.29 ClearwayEnergyA CWEN.A 3.3 85 32.00 +0.10 –.10 1.37 .97 .31837.23 16.12 ClearwayEnergyC CWEN 3.0 93 35.11 +1.33 –.10 1.24 .97 .31818.77 2.63 Cleveland-Cliffs CLF .0 dd 16.40 –0.08 1.03 ... ... .0626.33 9.95 ClimateChgI CLII.UT ... ... 25.68 +11.68 ... ... ... ...24.00 9.75 ClimateChgCrisisA CLII ... ... 22.00 +9.45 ... ... ... ...8.27 0.75 ClimateChgCrisWt CLII.WT ... ... 7.00 +4.26 ... ... ... ...11.95 4.32 ClipperRealty CLPR 5.2 dd 7.27 –0.19 –.11 –.01 .05 .095239.87 154.87 Clorox CLX 2.2 22 202.35 +4.83 7.36 8.17 8.06 1.1115.50 4.76 Cloudera CLDR ... dd 14.02 –0.19 –1.20 ... ... ...88.77 15.05 Cloudflare NET ... dd 83.47 +5.62 –.72 –.13 –.09 ...5.05 2.90 CNFinance CNF ... 24 3.07 +0.06 1.13 .05 .18 ...60.13 36.27 Coca-Cola KO 3.4 25 48.49 –0.21 2.07 2.00 2.10 .4157.11 28.35 Coca-ColaEuro CCEP 4.2 28 47.85 –0.74 2.62 1.71 2.29 1.0065.49 36.16 Coca-ColaFemsa KOF 4.6 cc 46.39 –0.60 ... 48.38 60.68 1.130311.43 1.98 CoeurMining CDE ... dd 8.60 +0.21 –1.56 .26 ... ...78.82 33.52 Cohen&Steers CNS 2.1 30 73.27 –0.36 2.79 ... 3.14 1.0011.85 9.90 CohnRobbins CRHC.UT ... ... 11.47 +0.12 ... ... ... ...11.13 9.65 CohnRobbinsA CRHC ... ... 10.77 +0.17 ... ... ... ...2.35 0.81 CohnRobbinsWt CRHC.WT ... ... 2.22 +0.14 ... ... ... ...41.03 12.23 Colfax CFX ... dd 40.60 +1.87 –3.89 ... 2.02 ...170.96 61.50 ColfaxUn CFXA 3.4 ... 167.94 +6.78 ... ... ... 1.437586.41 58.49 ColgatePalm CL 2.3 25 78.19 –3.69 2.75 3.05 3.27 .4419.50 9.85 ColonnadeAcqn CLA.UT ... ... 14.75 –0.30 ... ... ... ...17.73 9.54 ColonnadeAcqnA CLA ... ... 13.33 –0.18 ... ... ... ...4.57 0.50 ColonnadeWt CLA.WT ... ... 3.31 –0.03 ... ... ... ...5.20 1.33 ColonyCapital CLNY .0 dd 4.77 –0.12 ... –5.91 –1.15 .1113.97 2.46 ColonyCredRlEst CLNC .0 dd 8.39 +0.57 –3.25 –.24 .67 .1022.71 7.63 ColumbiaProperty CXP 5.9 dd 14.14 –0.52 .08 .02 .08 .2166.08 24.28 Comerica CMA 4.4 19 62.16 –1.62 3.27 5.02 4.92 .6859.10 27.54 ComfortSystems FIX .8 15 58.53 +3.66 3.08 3.68 3.05 .1124.16 10.76 CommercialMetals CMC 2.2 10 21.52 +0.23 2.32 ... 1.84 .1270.60 47.01 CommBkSys CBU 2.4 23 70.58 +2.18 3.23 3.29 ... .4211.04 2.25 CommunityHlthSys CYH ... dd 10.11 +1.06 –5.93 –.52 –.85 ...52.33 20.12 CommunityHlthcr CHCT 3.4 72 49.14 +1.15 .37 .88 1.02 .42515.40 5.54 SABESP SBS 2.7 20 7.59 –0.49 1.25 .25 .84 .25188.80 1.20 EngGr-Cmg C CIG.C 2.8 12 3.04 –0.19 .50 ... .35 .04513.46 1.18 EngGr-Cmg CIG 3.3 10 2.59 –0.23 .50 ... .35 .045118.15 8.28 COPEL ELP ... 5 12.05 –0.44 1.94 1.60 1.79 ...7.24 1.02 CiaSiderurgica SID ... 40 6.18 –0.23 .33 .13 .88 ...19.14 10.72 CerveceriasUnid CCU 2.2 24 16.50 +0.08 1.00 ... ... .086424.37 10.78 CompassDiversif CODI 6.7 dd 21.37 –0.08 3.64 1.56 1.68 .3666.30 34.39 CompassMnlInt CMP 4.6 26 62.27 –0.67 1.81 ... 3.68 .728.48 4.05 ComstockRscs CRK ... dd 4.74 –0.53 .52 ... ... ...39.34 22.83 ConagraBrands CAG 3.2 15 34.38 +0.52 1.72 2.61 2.61 .27510.93 10.00 ConcordAcqn CND.UT ... ... 10.82 +0.32 ... ... ... ...5.89 1.13 ConcordMed CCM ... dd 3.60 +0.34 ... .07 –.97 ...121.56 37.66 Conmed CNMD .7 dd 120.30 +5.41 .97 2.10 3.02 .2062.70 20.84 ConocoPhillips COP 4.0 dd 42.69 –2.43 6.40 –1.00 .29 .4395.10 62.03 ConEd ED 4.4 17 68.83 –0.77 4.08 4.20 4.59 .765240.76 104.28 ConstBrandsA STZ 1.3 25 226.91 +6.92 –.07 ... ... .7515.30 3.90 Constellium CSTM ... dd 13.55 –0.48 .48 –.36 .71 ...13.84 1.80 ContainerStore TCS ... 33 12.43 +0.75 .30 .77 .74 ...30.68 6.90 ContinentalRscs CLR .0 dd 19.02 –0.33 2.08 ... .51 .0513.48 2.94 Volaris VLRS ... dd 11.17 –0.41 ... –7.19 –2.97 ...14.37 1.93 ConturaEnergy CTRA ... dd 13.17 –0.85 –16.82 –21.59 –1.99 ...389.44 236.68 Cooper COO .0 79 380.00 +3.11 4.81 ... 14.09 .03
43.01 6.64 Cooper-Standard CPS ... dd 34.85 –5.19 3.92 –8.35 ... ...42.87 13.82 CooperT&R CTB 1.0 13 40.17 +1.00 1.91 1.03 2.37 .1057.45 2.46 CooTekCayman CTK ... dd 3.28 +0.57 ... .39 –.32 ...114.00 24.00 Copa CPA .0 dd 78.28 –1.16 ... ... ... .8038.39 6.68 CoreLabs CLB .1 dd 35.36 +1.61 2.30 .74 .83 .0117.90 5.76 CoreCivic CXW .0 7 6.77 –0.57 1.59 1.35 .80 .4480.22 24.69 CoreLogic CLGX 1.7 27 77.30 +2.98 .61 3.98 4.29 .3347.52 3.56 CorEnergyInfr CORR 2.5 dd 8.09 –0.08 –.40 –23.16 –1.24 .0510.05 2.18 CorePoint CPLG .0 dd 7.39 +0.68 –3.71 –3.25 –2.96 .20131.36 90.07 Coresite COR 3.8 65 129.22 +6.78 2.05 ... ... 1.2313.58 2.54 CornerstoneBldg CNR ... dd 12.49 +1.34 –.12 ... .74 ...38.84 17.44 Corning GLW 2.3 cc 37.60 –0.20 1.07 1.36 1.88 .225.85 1.61 CorpAmAirports CAAP ... dd 3.84 +0.07 .06 –1.76 –.59 ...30.57 15.23 CorpOfficeProp OFC 4.2 51 26.25 +0.05 1.71 .53 .95 .27544.96 20.38 Corteva CTVA 1.2 51 42.06 –1.69 –1.28 1.41 1.81 .1323.08 8.56 Cosan CZZ .6 14 17.48 –1.62 ... 4.00 7.12 1.02349.61 3.16 Costamare CMRE 4.5 dd 8.81 –0.15 .59 1.00 1.20 .1013.01 2.65 Coty COTY .0 dd 6.33 –0.57 –1.33 .14 .34 .12542.99 21.15 CousinsProperties CUZ 3.6 44 33.09 –1.33 1.17 1.68 .72 .3016.13 6.57 Covanta CVA 2.2 dd 14.52 +0.23 .07 –.08 ... .0889.54 36.77 Crane CR 2.1 cc 80.66 –0.07 2.20 3.94 4.94 .4310.22 5.43 CrawfordA CRD.A 2.5 37 7.99 +0.01 .26 .64 .61 .059.65 4.95 CrawfordB CRD.B 2.5 37 8.05 +0.26 .19 .64 .61 .05219.76 110.47 Credicorp BAP 5.6 62 154.84 +0.94 16.08 6.74 40.83 8.657914.17 6.47 CreditSuisse CS .9 9 13.73 –0.07 1.36 1.08 1.59 .07613.82 0.51 CrescentPoint CPG .3 dd 3.00 +0.08 –1.42 –.32 –.46 .00231.00 2.65 CrestwoodEquity CEQP 12.6 dd 19.85 –1.56 ... ... ... .6259.44 1.96 CrestwoodEqUn CEQP.PR 10.5 ... 8.01 –0.13 ... ... ... .21119.50 4.01 CrossTimbers CRT 8.7 10 8.30 +0.04 ... ... ... .049319.79 6.81 CrossAmerPtrs CAPL 11.0 7 19.11 +1.93 .51 2.78 .79 .525180.00 114.18 CrownCastle CCI 3.3 cc 158.92 +1.67 1.79 1.79 2.35 1.33101.40 42.97 CrownHoldings CCK ... 24 93.74 –1.46 3.78 5.01 5.60 ...11.33 10.51 CrucibleAcqn CRU.UT ... ... 10.95 +0.21 ... ... ... ...31.77 12.63 CryoLife CRY ... dd 25.25 +1.01 .05 –.40 –.11 ...35.77 19.61 CubeSmart CUBE 3.9 41 34.97 +0.53 .88 .83 .93 .3468.89 30.86 Cubic CUB .4 dd 66.34 +1.15 –.10 3.23 3.63 .13598.70 47.69 Cullen/Frost CFR 3.0 18 96.66 +0.06 6.84 6.12 ... .7217.26 5.28 Culp CULP 2.8 dd 15.82 +0.58 –2.32 .51 .46 .11254.13 101.03 Cummins CMI 2.2 23 247.00 +9.76 14.48 ... 13.99 1.35149.59 70.56 CurtissWright CW .6 20 114.03 –1.98 7.15 6.82 7.34 .1720.10 6.84 Cushman&Wkfd CWK ... dd 15.20 +1.02 ... .73 1.19 ...24.19 8.36 CustomersBancorp CUBI ... 8 22.53 –0.17 2.05 3.72 4.11 ...9.33 1.90 CypressEnvl CELP .0 dd 2.93 +0.13 .88 –.39 .88 .21
D24.42 2.20 DCPMidstream DCP 7.8 dd 20.03 –3.43 –1.05 –1.62 ... .3911.07 9.87 D8Holdings DEH.UT ... ... 10.83 +0.11 ... ... ... ...10.44 9.60 D8A DEH ... ... 10.23 ... ... ... ... ...1.64 0.55 D8Wt DEH.WT ... ... 1.28 –0.02 ... ... ... ...3.10 1.66 DHIGroup DHX ... dd 2.53 +0.16 .24 –.62 .20 ...8.68 4.52 DHT DHT 24.5 3 5.51 –0.18 .51 1.83 ... .2012.11 9.90 DPCMCapital XPOA.UT ... ... 11.60 +0.08 ... ... ... ...11.07 10.00 DPCMCapA XPOA ... ... 10.81 +0.08 ... ... ... ...2.96 1.71 DPCMCapWt XPOA.WT ... ... 2.38 +0.02 ... ... ... ...18.05 3.06 DRDGOLD DRD 3.6 ... 10.64 +0.38 .53 .70 .66 .207252.86 28.00 DTEEnergy DTP 6.6 ... 47.33 –0.02 ... ... ... .7813135.67 71.21 DTEEnergy DTE 3.6 17 121.91 –1.61 6.31 ... ... 1.08535.82 7.90 DXCTech DXC .0 dd 29.23 +0.73 –20.76 ... ... .2122.69 4.22 Dana DAN .0 dd 21.50 +0.79 1.56 .54 2.20 .10248.32 119.60 Danaher DHR .3 55 238.04 +1.29 4.05 6.05 7.24 .1834.37 2.50 Danaos DAC ... 5 30.08 +1.26 8.29 7.12 ... ...41.41 9.60 DanimerScientific DNMR ... dd 39.39 +11.30 ... .94 ... ...22.44 0.37 DanimerSciWt DNMR.WT ... ... 20.00 +8.90 ... ... ... ...98.75 8.32 DaqoNewEnergy DQ ... 93 96.77 +24.77 .45 2.01 3.95 ...128.44 26.15 Darden DRI 1.1 dd 121.98 +0.90 –.43 3.25 ... .3769.20 10.25 DarlingIngred DAR ... 23 66.78 +2.44 1.86 1.83 2.06 ...33.46 24.06 Datto MSP ... ... 26.02 –0.32 ... .52 .56 ...125.28 62.20 DaVita DVA ... 18 119.59 +0.84 5.27 7.50 8.25 ...336.32 78.70 DeckersOutdoor DECK ... 29 319.88 –6.12 9.62 ... ... ...306.96 106.14 Deere DE 1.0 35 305.17 +9.77 8.69 13.15 15.66 .7639.34 5.51 DelekLogistics DKL 9.4 10 38.18 +3.18 2.61 4.35 4.96 .90530.67 7.79 DelekUS DK .0 dd 20.63 +0.65 4.06 ... ... .3177.72 25.51 DellTechC DELL ... 24 75.94 +1.68 ... ... ... ...60.21 17.51 DeltaAir DAL .0 dd 40.00 +0.02 –19.49 –2.30 3.78 .402549.65 18.90 Deluxe DLX 3.5 51 33.99 –0.77 –4.65 4.88 4.69 .3011.40 9.98 DelwindsIns DWIN.UT ... ... 10.45 +0.11 ... ... ... ...31.49 15.43 Denbury DEN ... dd 31.15 +3.25 .45 1.04 2.20 ...16.15 2.60 DesignerBrands DBI 4.2 dd 9.50 +0.14 ... –3.94 .25 .1026.30 9.40 DesktopMetal DM ... dd 25.05 +1.30 ... ... ... ...13.50 0.35 DesktopMetalWt DM.WT ... ... 12.70 +1.70 ... ... ... ...15.44 4.44 Despegar.com DESP ... dd 10.98 –0.47 –.30 –1.76 –.38 ...12.15 4.99 DeutscheBank DB ... dd 10.89 –0.73 –3.03 –.57 .23 ...24.35 4.70 DevonEnergy DVN 2.5 dd 17.80 –1.77 –.89 –.07 .95 .11170.54 100.52 Diageo DEO 2.2 53 158.61 +0.92 3.03 ... 6.79 2.192615.50 5.31 DiamondSShip DSSI ... 3 6.79 –0.39 –.25 ... ... ...11.79 1.96 DiamndrckHspty DRH ... dd 8.88 +0.13 .90 –1.22 –.55 ...2.86 1.25 DianaShipping DSX ... dd 2.41 +0.05 –.17 –.38 ... ...68.56 13.46 Dick's DKS 1.8 17 68.12 +1.79 ... 5.89 ... .312513.60 2.80 DieboldNixdorf DBD ... dd 12.68 +1.30 –4.45 .68 1.82 ...12.97 6.32 DigitalMedia DMS ... dd 10.74 –0.27 –1.09 .14 .55 ...1.95 0.16 DigitalMediaWt DMS.WT ... ... 1.42 +0.05 ... ... ... ...165.49 105.00 DigitalRealty DLR 3.2 57 140.46 +3.98 2.35 1.07 ... 1.1280.49 21.50 Dillard's DDS .8 dd 79.80 +14.71 ... 3.56 2.27 .15104.47 14.16 DineBrands DIN .0 dd 74.12 +3.64 5.85 2.14 4.96 .76100.96 23.25 DiscoverFinSvcs DFS 1.9 26 92.27 –5.49 3.60 9.08 10.59 .44183.40 79.07 Disney DIS ... dd 172.78 +1.34 –1.58 1.64 4.87 ...23.07 9.96 dMYTech II DMYD.UT ... ... 22.37 +3.43 ... ... ... ...21.22 9.80 dMYTechA DMYD ... ... 20.12 +2.68 ... ... ... ...6.80 1.03 dMYTechIIWt DMYD.WT ... ... 6.70 +2.23 ... ... ... ...13.08 10.05 dMYTechIIIUn DMYI.UT ... ... 12.61 +1.11 ... ... ... ...12.35 10.50 dMYTechIIIA DMYI ... ... 12.00 +0.78 ... ... ... ...4.50 2.00 dMYTechIIIWt DMYI.WT ... ... 2.90 +0.40 ... ... ... ...97.78 44.68 DolbyLab DLB .9 42 94.03 +0.41 ... 2.11 2.76 .22225.25 125.00 DollarGeneral DG .7 20 206.21 –5.23 6.64 10.63 10.09 .3690.89 57.79 DominionEner D 3.5 dd 72.29 +0.21 1.62 ... 4.64 .63113.82 75.93 DominionEnerUn DCUE 7.4 ... 97.46 +0.67 ... ... ... 1.8125435.58 270.08 Domino's DPZ .8 33 380.37 +5.14 ... ... 12.92 .7839.38 18.40 Domtar UFS .0 dd 32.05 +0.66 1.37 .50 1.99 .45560.61 31.08 Donaldson DCI 1.4 30 59.40 –0.09 2.00 2.00 2.55 .21
- Earnings -52-Week Tick - Week’s - Last This Next DivHigh Low Name Sym Yld P/E Last Chg. Year Year Year Amt
- Earnings -52-Week Tick - Week’s - Last This Next DivHigh Low Name Sym Yld P/E Last Chg. Year Year Year Amt
- Earnings -52-Week Tick - Week’s - Last This Next DivHigh Low Name Sym Yld P/E Last Chg. Year Year Year Amt
- Earnings -52-Week Tick - Week’s - Last This Next DivHigh Low Name Sym Yld P/E Last Chg. Year Year Year Amt
For
per
sona
l non
-com
mer
cial
use
onl
y. D
o no
t edi
t or
alte
r. R
epro
duct
ions
not
per
mitt
ed.
To
repr
int o
r lic
ense
con
tent
, ple
ase
cont
act B
arro
n's
repr
ints
dep
artm
ent a
t 800
-843
-000
8 or
ww
w.d
jrepr
ints
.com
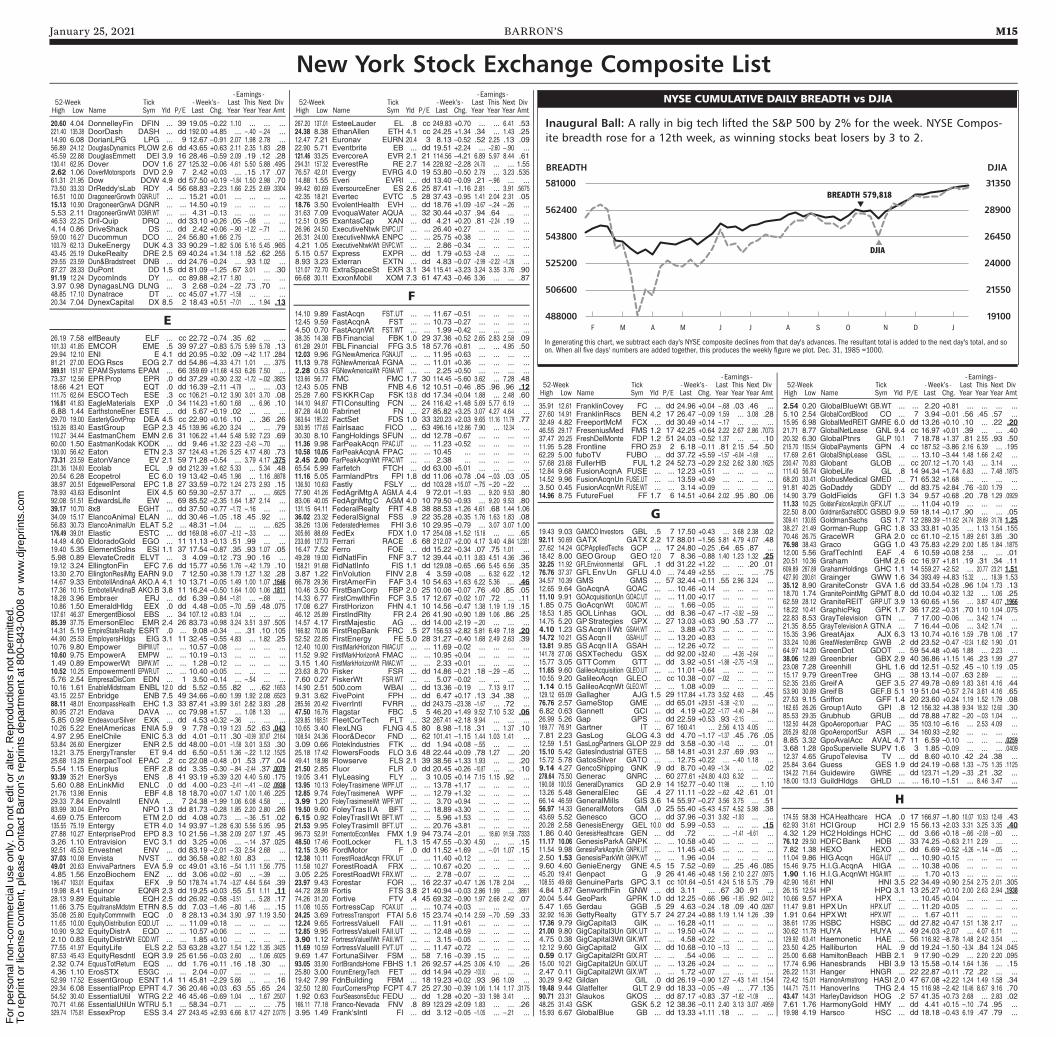
January 25, 2021 BARRON’S M15
New York Stock Exchange Composite List
20.60 4.04 DonnelleyFin DFIN ... 39 19.05 –0.22 1.10 ... ... ...221.40 135.38 DoorDash DASH ... dd 192.00 +4.85 ... –.40 –.24 ...14.90 6.08 DorianLPG LPG ... 9 12.67 –0.91 2.07 1.98 2.78 ...56.89 24.12 DouglasDynamics PLOW 2.6 dd 43.65 +0.63 2.11 2.35 1.83 .2845.59 22.88 DouglasEmmett DEI 3.9 16 28.46 –0.59 2.09 .19 .12 .28130.41 62.95 Dover DOV 1.6 27 125.32 –0.06 4.61 5.50 5.88 .4952.62 1.06 DoverMotorsports DVD 2.9 7 2.42 +0.03 ... .15 .17 .0761.31 21.95 Dow DOW 4.9 dd 57.50 +0.19 –1.84 1.50 2.98 .7073.50 33.33 DrReddy'sLab RDY .4 56 68.83 –2.23 1.66 2.25 2.69 .330416.51 10.00 DragoneerGrowth DGNR.UT ... ... 15.21 +0.01 ... ... ... ...15.13 10.90 DragoneerGrwA DGNR ... ... 14.50 +0.19 ... ... ... ...5.53 2.11 DragoneerGrwWt DGNR.WT ... ... 4.31 –0.13 ... ... ... ...46.53 22.25 Dril-Quip DRQ ... dd 33.10 +0.26 .05 –.08 ... ...4.14 0.86 DriveShack DS ... dd 2.42 +0.06 –.90 –1.22 –.71 ...59.00 16.27 Ducommun DCO ... 24 56.80 +1.66 2.75 ... ... ...103.79 62.13 DukeEnergy DUK 4.3 33 90.29 –1.82 5.06 5.16 5.45 .96543.45 25.19 DukeRealty DRE 2.5 69 40.24 +1.34 1.18 .52 .62 .25529.55 23.59 Dun&Bradstreet DNB ... dd 24.76 –0.24 ... .93 1.02 ...87.27 28.33 DuPont DD 1.5 dd 81.09 –1.25 .67 3.01 ... .3091.19 12.24 DycomInds DY ... cc 89.88 +2.17 1.80 ... ... ...3.97 0.98 DynagasLNG DLNG ... 3 2.68 –0.24 –.22 .73 .70 ...48.85 17.10 Dynatrace DT ... cc 45.07 +1.77 –1.58 ... ... ...20.34 7.04 DynexCapital DX 8.5 2 18.43 +0.51 –7.01 ... 1.94 .13
E26.19 7.58 elfBeauty ELF ... cc 22.72 –0.74 .35 .62 ... ...101.33 41.85 EMCOR EME .5 39 97.27 –0.83 5.75 5.99 5.78 .1329.94 12.10 ENI E 4.1 dd 20.95 –0.32 .09 –.42 1.17 .28481.21 27.00 EOGRscs EOG 2.7 dd 54.86 –4.33 4.71 1.01 ... .375369.51 151.97 EPAMSystems EPAM ... 66 359.69 +11.68 4.53 6.26 7.50 ...73.37 12.56 EPRProp EPR .0 dd 37.29 +0.30 2.32 –1.72 –.02 .382518.66 4.21 EQT EQT .0 dd 16.39 –2.11 –4.79 ... ... .03111.75 62.64 ESCOTech ESE .3 cc 106.21 –0.12 3.90 3.01 3.70 .08116.61 41.83 EagleMaterials EXP .0 34 114.23 +1.60 1.68 ... 6.96 .106.88 1.44 EarthstoneEner ESTE ... dd 5.67 –0.19 .02 ... ... ...29.70 19.00 EasterlyGovtProp DEA 4.5 cc 22.90 +0.16 .10 ... .36 .26153.26 83.40 EastGroup EGP 2.3 45 139.96 +6.20 3.24 ... ... .79110.27 34.44 EastmanChem EMN 2.6 31 106.22 +1.44 5.48 5.92 7.23 .6960.00 1.50 EastmanKodak KODK ... dd 9.46 +1.32 2.23 –2.43 –.70 ...130.00 56.42 Eaton ETN 2.3 37 124.43 +1.26 5.25 4.17 4.80 .7373.31 23.59 EatonVance EV 2.1 59 71.28 –0.54 ... 3.79 4.17 .375231.36 124.60 Ecolab ECL .9 dd 212.39 +1.62 5.33 ... 5.34 .4820.54 6.28 Ecopetrol EC 6.0 19 13.42 –0.45 1.96 ... 1.16 .887838.97 20.51 EdgewellPersonal EPC 1.8 27 33.59 –0.72 1.24 2.73 2.93 .1578.93 43.63 EdisonInt EIX 4.5 60 59.30 –2.57 3.77 ... ... .662592.08 51.51 EdwardsLife EW ... 69 85.52 –2.35 1.64 1.87 2.14 ...39.17 10.70 8x8 EGHT ... dd 37.50 +0.77 –1.72 –.16 ... ...34.09 15.17 ElancoAnimal ELAN ... dd 30.46 –1.05 .18 .45 .92 ...56.83 30.73 ElancoAnimalUn ELAT 5.2 ... 48.31 –1.04 ... ... ... .625176.49 39.01 Elastic ESTC ... dd 169.08 +6.07 –2.12 –.33 ... ...14.49 4.60 EldoradoGold EGO ... 11 11.13 –0.13 .51 .99 ... ...19.40 5.35 ElementSolns ESI 1.1 37 17.54 –0.87 .35 .93 1.07 .055.98 0.89 ElevateCredit ELVT ... 3 4.09 –0.12 .73 .90 .16 ...19.12 3.24 EllingtonFin EFC 7.6 dd 15.77 +0.56 1.76 –.42 1.79 .1013.30 2.70 EllingtonResiMtg EARN 9.0 7 12.50 +0.38 1.79 1.27 1.32 .2814.67 9.33 EmbotellAndinaA AKO.A 4.1 10 13.71 –0.05 1.49 1.00 1.07 .164617.36 10.15 EmbotellAndinaB AKO.B 3.8 11 16.24 –0.50 1.64 1.00 1.06 .181118.28 3.96 Embraer ERJ ... dd 6.39 –0.84 –1.81 ... –.68 ...10.86 1.50 EmeraldHldg EEX .0 dd 4.48 –0.05 –.70 .59 .48 .075137.61 46.37 EmergentBiosol EBS ... 34 107.12 +0.83 1.04 ... ... ...85.39 37.75 EmersonElec EMR 2.4 26 83.73 +0.98 3.24 3.51 3.97 .50514.31 5.19 EmpireStateRealty ESRT .0 ... 9.08 –0.34 ... .31 .10 .10544.90 25.53 EmployersHldgs EIG 3.1 11 32.45 –0.55 4.83 ... 1.82 .2510.76 9.80 Empower EMPW.UT ... ... 10.57 –0.08 ... ... ... ...10.60 9.75 EmpowerA EMPW ... ... 10.19 –0.13 ... ... ... ...1.49 0.89 EmpowerWt EMPW.WT ... ... 1.28 –0.12 ... ... ... ...10.52 10.25 EmpowermentI EPWR.UT ... ... 10.40 +0.05 ... ... ... ...5.76 2.54 EmpresaDisCom EDN ... 1 3.50 –0.14 ... –.54 ... ...10.16 1.61 EnableMidstream ENBL 12.0 dd 5.52 –0.55 .82 ... .62 .165343.15 22.57 Enbridge ENB 7.5 49 34.66 –0.60 1.99 1.92 2.08 .652388.11 48.01 EncompassHealth EHC 1.3 33 87.41 +3.99 3.61 2.82 3.83 .2880.95 27.21 Endava DAVA ... cc 79.98 +1.57 ... 1.08 1.33 ...5.85 0.99 EndeavourSilver EXK ... dd 4.53 +0.32 –.36 ... ... ...10.26 5.22 EnelAmericas ENIA 5.9 9 7.78 –0.19 1.23 .52 .63 .0434.97 2.95 EnelChile ENIC 5.3 dd 4.01 –0.11 .30 –43.99 307.67 .216453.84 26.60 Energizer ENR 2.5 dd 48.00 –0.01 –1.58 3.01 3.53 .3013.21 3.75 EnergyTransfer ET 9.4 dd 6.50 –0.51 1.36 –.22 1.12 .152525.68 13.28 EnerpacTool EPAC .2 cc 22.08 –0.48 .01 .53 .77 .045.54 1.15 Enerplus ERF 2.8 dd 3.35 –0.30 –.84 –2.44 .37 .007993.39 35.21 EnerSys ENS .8 41 93.19 +5.39 3.20 4.40 5.60 .1755.60 0.88 EnLinkMid ENLC .0 dd 4.00 –0.23 –2.41 –.41 –.02 .093821.76 13.98 Ennis EBF 4.8 18 18.70 +0.07 1.47 1.00 1.46 .22529.33 7.84 EnovaIntl ENVA ... 7 24.38 –1.99 1.06 6.08 4.58 ...83.99 30.04 EnPro NPO 1.3 dd 81.73 –0.28 1.85 2.20 2.80 .264.69 0.75 Entercom ETM 2.0 dd 4.08 +0.73 ... –.36 .51 .02135.55 75.19 Entergy ETR 4.0 14 93.97 –1.28 6.30 5.56 5.95 .9527.88 10.27 EnterpriseProd EPD 8.3 10 21.56 –1.38 2.09 2.07 1.97 .453.26 1.10 Entravision EVC 3.1 dd 3.25 +0.06 ... –.14 .37 .02592.51 45.53 Envestnet ENV ... dd 83.19 –2.01 –.33 2.54 2.68 ...37.03 10.08 Envista NVST ... dd 36.58 +0.82 1.60 .83 ... ...49.01 20.63 EnvivaPartners EVA 5.9 cc 49.01 +3.16 –.54 1.11 1.56 .7754.85 1.56 EnzoBiochem ENZ ... dd 3.06 +0.02 –.60 ... –.39 ...196.47 103.01 Equifax EFX .9 50 178.74 +1.74 –3.27 4.64 5.64 .3919.98 8.41 Equinor EQNR 2.3 dd 19.25 +0.03 .55 .51 1.11 .1128.13 9.89 Equitable EQH 2.5 dd 26.92 –0.58 –3.51 ... 5.28 .1711.66 3.75 EquitransMdstm ETRN 8.5 dd 7.03 –1.46 –.80 1.46 ... .1535.08 25.80 EquityCommnwlth EQC .0 8 28.13 +0.34 3.90 .97 1.19 3.5011.65 10.00 EquityDistribution EQD.UT ... ... 11.09 +0.18 ... ... ... ...10.90 9.32 EquityDistrA EQD ... ... 10.57 +0.06 ... ... ... ...2.10 0.83 EquityDistrWt EQD.WT ... ... 1.85 +0.10 ... ... ... ...77.55 41.97 EquityLife ELS 2.2 53 63.28 +3.27 1.54 1.22 1.35 .342587.53 45.43 EquityResdntl EQR 3.9 25 61.56 –0.03 2.60 ... 1.06 .60252.32 0.74 EquusTotReturn EQS ... dd 1.76 +0.11 .16 .18 .30 ...4.36 1.10 ErosSTX ESGC ... ... 2.04 –0.07 ... ... ... ...52.99 17.52 EssentGroup ESNT 1.4 11 45.81 –2.29 5.66 ... ... .1629.34 6.08 EssentialProp EPRT 4.7 36 20.46 +0.03 .63 .55 .65 .2454.52 30.40 EssentialUtil WTRG 2.2 46 45.46 –0.69 1.04 ... 1.67 .250770.71 41.66 EssentialUtilUn WTRU 5.1 ... 58.34 –0.71 ... ... ... .75329.74 175.81 EssexProp ESS 3.4 27 243.45 +2.93 6.66 8.17 4.27 2.0775
267.20 137.01 EsteeLauder EL .8 cc 249.83 +0.70 ... ... 6.41 .5324.38 8.38 EthanAllen ETH 4.1 cc 24.25 +1.34 .34 ... 1.43 .2512.47 7.21 Euronav EURN 20.4 3 8.13 –0.52 .52 2.25 .13 .0922.90 5.71 Eventbrite EB ... dd 19.51 +2.24 ... –2.60 –.90 ...121.46 33.25 EvercoreA EVR 2.1 21 114.56 –4.21 6.89 5.97 8.44 .61294.31 157.32 EverestRe RE 2.7 14 228.92 –2.28 24.70 ... ... 1.5576.57 42.01 Evergy EVRG 4.0 19 53.80 –0.50 2.79 ... 3.23 .53514.88 1.55 Everi EVRI ... dd 13.40 –0.09 .21 –.96 ... ...99.42 60.69 EversourceEner ES 2.6 25 87.41 –1.16 2.81 ... 3.91 .567542.35 18.21 Evertec EVTC .5 28 37.43 –0.95 1.41 2.04 2.31 .0518.76 3.50 EvolentHealth EVH ... dd 18.76 +1.09 –3.67 –.24 –.26 ...31.63 7.09 EvoquaWater AQUA ... 32 30.44 +0.37 .94 .64 ... ...12.51 0.95 ExantasCap XAN ... dd 4.21 +0.20 .81 –2.24 .19 ...26.96 24.50 ExecutiveNtwk ENPC.UT ... ... 26.40 +0.27 ... ... ... ...26.31 24.00 ExecutiveNtwkA ENPC ... ... 25.75 +0.38 ... ... ... ...4.21 1.05 ExecutiveNtwkWt ENPC.WT ... ... 2.86 –0.34 ... ... ... ...5.15 0.57 Express EXPR ... dd 1.79 +0.53 –2.49 ... ... ...8.93 3.23 Exterran EXTN ... dd 4.83 –0.07 –2.99 –2.22 –1.26 ...121.07 72.70 ExtraSpaceSt EXR 3.1 34 115.41 +3.23 3.24 3.35 3.76 .9066.68 30.11 ExxonMobil XOM 7.3 61 47.43 –0.46 3.36 ... ... .87
F14.10 9.89 FastAcqn FST.UT ... ... 11.67 –0.51 ... ... ... ...12.45 9.59 FastAcqnA FST ... ... 10.73 –0.27 ... ... ... ...4.50 0.70 FastAcqnWt FST.WT ... ... 1.99 –0.42 ... ... ... ...38.35 14.38 FBFinancial FBK 1.0 29 37.36 +0.52 2.65 2.83 2.58 .0961.28 29.01 FBLFinancial FFG 3.5 18 57.76 +0.81 ... ... 4.95 .5012.03 9.96 FGNewAmerica FGNA.UT ... ... 11.95 +0.63 ... ... ... ...11.13 9.78 FGNewAmericaA FGNA ... ... 11.01 +0.36 ... ... ... ...2.28 0.53 FGNewAmericaWt FGNA.WT ... ... 2.25 +0.50 ... ... ... ...123.66 56.77 FMC FMC 1.7 30 114.45 –5.60 3.62 ... 7.28 .4812.43 5.05 FNB FNB 4.6 12 10.51 –0.46 .85 .96 .96 .1225.28 7.60 FSKKRCap FSK 13.8 dd 17.34 +0.04 1.88 ... 2.48 .60144.10 94.87 FTIConsulting FCN ... 24 116.42 +1.48 5.69 5.77 6.19 ...87.28 44.00 Fabrinet FN ... 27 85.82 +3.25 3.07 4.27 4.64 ...363.64 195.22 FactSet FDS 1.0 33 320.23 +2.03 9.65 11.16 11.79 .77530.95 177.65 FairIsaac FICO ... 63 496.16 +12.86 7.90 ... 12.34 ...30.30 8.10 FangHoldings SFUN ... dd 12.78 –0.67 ... ... ... ...11.36 9.98 FarPeakAcqn FPAC.UT ... ... 11.23 +0.52 ... ... ... ...10.58 10.05 FarPeakAcqnA FPAC ... ... 10.45 ... ... ... ... ...2.45 2.00 FarPeakAcqnWt FPAC.WT ... ... 2.38 ... ... ... ... ...65.54 5.99 Farfetch FTCH ... dd 63.00 +5.01 ... ... ... ...11.16 5.05 FarmlandPtrs FPI 1.8 dd 11.06 +0.78 .04 –.03 .03 .05136.50 10.63 Fastly FSLY ... dd 103.28 +15.07 –.75 –.20 –.22 ...77.90 41.26 FedAgriMtgA AGM.A 4.4 9 72.01 –1.93 ... 9.20 9.53 .8083.06 40.05 FedAgriMtgC AGM 4.0 10 79.50 –0.93 ... 9.20 9.53 .80131.15 64.11 FederalRealty FRT 4.8 38 88.53 +1.26 4.61 .68 1.44 1.0636.02 23.32 FederalSignal FSS .9 22 35.28 +0.35 1.76 1.63 1.83 .0838.26 13.06 FederatedHermes FHI 3.6 10 29.95 –0.79 ... 3.07 3.07 1.00305.66 88.69 FedEx FDX 1.0 17 254.08 +1.52 15.18 ... ... .65233.66 127.73 Ferrari RACE .6 68 212.07 +2.00 4.17 3.40 4.84 1.235116.47 7.52 Ferro FOE ... dd 15.22 –0.34 .07 .75 1.01 ...49.28 19.00 FidNatlFin FNF 3.7 12 39.44 +0.11 3.83 4.51 4.36 .36158.21 91.68 FidNatlInfo FIS 1.1 dd 129.08 –0.65 .66 5.45 6.56 .353.87 1.22 FinVolution FINV 2.8 4 3.59 +0.08 ... 6.32 6.22 .1266.78 29.36 FirstAmerFin FAF 3.4 10 54.63 +1.63 6.22 5.36 ... .4610.46 3.50 FirstBanCorp FBP 2.0 25 10.06 –0.07 .76 .40 .85 .0514.33 6.77 FirstCmwlthFin FCF 3.5 17 12.67 +0.02 1.07 .72 ... .1117.08 6.27 FirstHorizon FHN 4.1 10 14.56 –0.47 1.38 1.19 1.19 .1546.12 25.89 FirstIndRlty FR 2.4 26 41.90 +0.90 1.89 1.06 .86 .2514.57 4.17 FirstMajestic AG ... dd 14.00 +2.19 –.20 ... ... ...166.82 70.06 FirstRepBank FRC .5 27 156.53 +2.82 5.81 6.49 7.18 .2052.52 22.85 FirstEnergy FE 5.0 28 31.27 –0.40 1.68 2.49 2.63 .3912.40 10.00 FirstMarkHorizon FMAC.UT ... ... 11.69 –0.02 ... ... ... ...11.52 9.92 FirstMarkHorizonA FMAC ... ... 10.95 +0.04 ... ... ... ...3.15 1.40 FirstMarkHorizonWt FMAC.WT ... ... 2.33 +0.01 ... ... ... ...23.63 8.70 Fisker FSR ... dd 14.86 –0.21 .18 –.29 –.45 ...7.60 0.27 FiskerWt FSR.WT ... ... 5.07 –0.02 ... ... ... ...14.90 2.51 500.com WBAI ... dd 13.36 –0.19 ... 7.13 9.17 ...9.31 3.62 FivePoint FPH ... dd 6.47 +0.17 .13 .34 .38 ...285.56 20.42 FiverrIntl FVRR ... dd 243.75 –23.38 –1.67 ... .72 ...47.50 16.76 Flagstar FBC .5 5 46.20 +1.49 9.52 7.10 5.32 .06329.85 168.51 FleetCorTech FLT ... 32 267.41 +2.18 9.94 ... ... ...10.65 3.40 FlexLNG FLNG 4.5 80 8.98 –1.18 .31 ... 1.37 .10108.54 24.36 Floor&Decor FND ... 62 101.41 –1.15 1.44 1.03 1.41 ...3.09 0.66 FlotekIndustries FTK ... dd 1.94 +0.08 –.55 ... ... ...25.18 17.42 FlowersFoods FLO 3.6 48 22.44 +0.09 .78 1.27 ... .2049.41 18.98 Flowserve FLS 2.1 39 38.56 +1.33 1.93 ... ... .2021.50 2.85 Fluor FLR .0 dd 20.45 +0.26 –10.87 ... ... .1019.05 3.41 FlyLeasing FLY ... 3 10.05 +0.14 7.15 1.15 .92 ...13.95 10.13 FoleyTrasimene WPF.UT ... ... 13.78 +1.17 ... ... ... ...12.85 9.74 FoleyTrasimeneA WPF ... ... 12.79 +1.32 ... ... ... ...3.99 1.20 FoleyTrasimeneWt WPF.WT ... ... 3.70 +0.94 ... ... ... ...19.50 9.60 FoleyTras IIA BFT ... ... 18.89 +3.30 ... ... ... ...6.15 0.92 FoleyTrasIIWt BFT.WT ... ... 5.96 +1.53 ... ... ... ...21.53 9.95 FoleyTrasimII BFT.UT ... ... 20.76 +3.81 ... ... ... ...96.73 52.91 FomentoEconMex FMX 1.9 94 73.74 –2.01 ... 18.60 91.58 .733348.50 17.46 FootLocker FL 1.3 15 47.55 –0.30 4.50 ... ... .1512.15 3.96 FordMotor F .0 dd 11.52 +1.69 ... –.01 1.07 .1512.38 10.11 ForestRoadAcqn FRX.UT ... ... 11.40 +0.12 ... ... ... ...11.58 10.27 ForestRoadA FRX ... ... 10.67 +0.20 ... ... ... ...3.05 2.25 ForestRoadWt FRX.WT ... ... 2.78 –0.07 ... ... ... ...23.97 9.43 Forestar FOR ... 16 22.37 +0.47 1.26 1.78 2.04 ...44.72 28.59 Fortis FTS 3.8 21 40.94 –0.03 2.86 1.99 ... .386174.26 31.20 Fortive FTV .4 45 69.32 –0.90 1.97 2.66 2.42 .0711.08 10.55 FortressCap FCAX.UT ... ... 10.74 +0.03 ... ... ... ...24.25 3.69 FortressTransport FTAI 5.6 15 23.74 +0.14 2.59 –.70 .59 .3312.24 9.65 FortressValueII FAII ... ... 11.91 +0.61 ... ... ... ...12.85 9.95 FortressValueII FAII.UT ... ... 12.48 +0.59 ... ... ... ...3.90 1.12 FortressValueIIWt FAII.WT ... ... 3.15 –0.05 ... ... ... ...11.69 10.59 FortressValueIII FVT.UT ... ... 11.47 +0.72 ... ... ... ...9.69 1.47 FortunaSilver FSM ... 58 7.16 –0.39 .15 ... ... ...93.05 33.90 FortBrandsHome FBHS 1.1 26 92.57 +4.25 3.06 4.10 ... .2625.80 3.00 ForumEnergyTech FET ... dd 14.94 +0.29 –103.00 ... ... ...19.42 7.99 FdnBuilding FBM ... 18 19.23 +0.02 .93 .96 1.09 ...32.50 12.80 FourCornersProp FCPT 4.7 25 27.30 –0.39 1.06 1.14 1.17 .31751.92 0.63 FourSeasonsEduc FEDU ... dd 1.28 +0.20 –.33 1.98 3.41 ...166.11 77.18 Franco-Nevada FNV .8 89 123.29 +2.09 1.83 ... ... .263.95 1.49 Frank'sIntl FI ... dd 3.12 –0.05 –1.05 ... –.21 ...
35.91 12.61 FranklinCovey FC ... dd 24.96 +0.04 –.68 .03 .46 ...27.60 14.91 FranklinRscs BEN 4.2 17 26.47 –0.09 1.59 ... 3.08 .2832.49 4.82 FreeportMcM FCX ... dd 30.49 +0.14 –.17 ... ... ...46.55 29.17 FreseniusMed FMS 1.2 17 42.25 +0.64 2.22 2.67 2.86 .707337.47 20.25 FreshDelMonte FDP 1.2 51 24.03 –0.52 1.37 ... ... .1011.95 5.28 Frontline FRO 25.9 2 6.18 –0.11 .81 2.15 .54 .5062.29 5.00 fuboTV FUBO ... dd 37.72 +5.59 –1.57 –6.04 –1.69 ...57.68 23.68 FullerHB FUL 1.2 24 52.73 –0.29 2.52 2.62 3.80 .162512.84 9.68 FusionAcqnA FUSE ... ... 12.23 +0.51 ... ... ... ...14.52 9.96 FusionAcqnUn FUSE.UT ... ... 13.59 +0.49 ... ... ... ...3.50 0.45 FusionAcqnWt FUSE.WT ... ... 3.14 +0.09 ... ... ... ...14.96 8.75 FutureFuel FF 1.7 6 14.51 +0.64 2.02 .95 .80 .06
G19.43 9.03 GAMCOInvestors GBL .5 7 17.50 +0.43 ... 3.68 2.38 .0292.11 50.69 GATX GATX 2.2 17 88.01 –1.56 5.81 4.79 4.07 .4827.62 14.24 GCPAppliedTechs GCP ... 17 24.80 –0.25 .64 .65 .87 ...18.42 8.00 GEOGroup GEO 12.0 7 8.36 –0.88 1.40 1.23 1.32 .2532.25 11.92 GFLEnvironmental GFL .1 dd 31.22 +1.22 ... ... .20 .0176.76 37.37 GFLEnvUn GFLU 4.0 ... 74.49 +2.55 ... ... ... .7534.57 10.39 GMS GMS ... 57 32.44 –0.11 .55 2.96 3.24 ...12.65 9.64 GoAcqnA GOAC ... ... 10.46 +0.14 ... ... ... ...11.10 9.91 GOAcquisitionUn GOAC.UT ... ... 11.00 +0.17 ... ... ... ...1.85 0.75 GoAcqnWt GOAC.WT ... ... 1.66 –0.05 ... ... ... ...18.53 1.85 GOLLinhas GOL ... dd 8.36 –0.47 –.17 –3.92 –.59 ...14.75 5.20 GPStrategies GPX ... 27 13.03 +0.63 .90 .53 .77 ...4.10 1.23 GSAcqn IIWt GSAH.WT ... ... 3.88 +0.73 ... ... ... ...14.72 10.21 GSAcqn II GSAH.UT ... ... 13.20 +0.83 ... ... ... ...13.81 9.85 GSAcqn IIA GSAH ... ... 12.26 +0.72 ... ... ... ...141.78 27.06 GSXTechedu GSX ... dd 92.00 +32.40 ... –4.26 –2.64 ...15.77 3.05 GTTComm GTT ... dd 3.92 +0.51 –1.88 –2.75 –1.58 ...11.65 9.60 GalileoAcquisition GLEO.UT ... ... 11.01 –0.64 ... ... ... ...10.55 9.20 GalileoAcqn GLEO ... cc 10.38 –0.07 –.02 ... ... ...1.14 0.15 GalileoAcqnWt GLEO.WT ... ... 1.08 +0.09 ... ... ... ...129.12 65.09 Gallagher AJG 1.5 29 117.84 +1.73 3.52 4.63 ... .4576.76 2.57 GameStop GME ... dd 65.01 +29.51 –5.38 –2.10 ... ...6.82 0.63 Gannett GCI ... dd 4.19 +0.22 –1.77 –4.40 –.84 ...26.99 5.26 Gap GPS ... dd 22.59 +0.53 .93 –2.15 ... ...169.77 76.91 Gartner IT ... 67 160.41 ... 2.56 4.13 4.05 ...7.81 2.23 GasLog GLOG 4.3 dd 4.70 –1.17 –1.37 .45 .76 .0512.59 1.51 GasLogPartners GLOP 22.9 dd 3.58 –0.30 –1.43 ... ... .0115.10 5.42 GatesIndustrial GTES ... 58 14.81 +0.31 2.37 .69 .93 ...15.72 5.78 GatosSilver GATO ... ... 12.75 +0.22 ... –.40 1.18 ...9.14 4.27 GencoShipping GNK .9 dd 8.70 +0.49 –1.34 ... ... .02278.64 75.50 Generac GNRC ... 60 277.61 +24.80 4.03 6.32 ... ...190.08 100.55 GeneralDynamics GD 2.9 14 152.77 –0.40 11.98 ... ... 1.1013.26 5.48 GeneralElec GE .4 27 11.11 –0.22 –.62 .42 .61 .0166.14 46.59 GeneralMills GIS 3.6 14 55.97 –0.27 3.56 3.75 ... .5156.97 14.33 GeneralMotors GM .0 25 55.40 +5.43 4.57 4.52 5.98 .3843.69 5.52 Genesco GCO ... dd 37.96 –0.31 3.92 –1.93 ... ...20.28 2.58 GenesisEnergy GEL 10.0 dd 5.99 –0.53 ... ... ... .151.86 0.40 GenesisHealthcare GEN ... dd .72 ... ... –1.41 –6.61 ...11.17 10.06 GenesisParkA GNPK ... ... 10.58 +0.40 ... ... ... ...11.54 9.98 GenesisParkAcqnUn GNPK.UT ... ... 11.45 +0.45 ... ... ... ...2.50 1.53 GenesisParkWt GNPK.WT ... ... 1.96 +0.04 ... ... ... ...9.60 4.60 GenieEnergy GNE 4.5 15 7.52 –0.69 ... .25 .46 .08545.20 19.41 Genpact G .9 26 41.46 +0.48 1.56 2.10 2.27 .0975108.55 49.68 GenuineParts GPC 3.1 cc 101.64 –0.51 4.24 5.18 5.75 .794.84 1.87 GenworthFin GNW ... dd 3.11 ... .67 .30 .91 ...20.04 5.44 GeoPark GPRK 1.0 dd 12.25 –0.66 .96 –1.95 .92 .04125.47 1.65 Gerdau GGB .5 29 4.63 –0.24 .18 .09 .40 .026732.92 16.36 GettyRealty GTY 5.7 24 27.24 +0.88 1.19 1.14 1.26 .3917.36 9.79 GigCapital3 GIK ... ... 16.28 +0.11 ... ... ... ...21.00 9.80 GigCapital3Un GIK.UT ... ... 19.50 +0.74 ... ... ... ...4.75 0.38 GigCapital3Wt GIK.WT ... ... 4.58 +0.22 ... ... ... ...12.12 9.60 GigCapital2 GIX ... dd 10.68 –0.10 –.13 ... ... ...0.59 0.17 GigCapital2Rt GIX.RT ... ... .54 +0.06 ... ... ... ...15.00 10.21 GigCapital2Un GIX.UT ... ... 13.26 +0.24 ... ... ... ...2.47 0.11 GigCapital2Wt GIX.WT ... ... 1.72 +0.07 ... ... ... ...30.29 9.42 Gildan GIL .0 dd 26.19 –0.90 1.27 –.43 1.41 .15419.48 9.44 Glatfelter GLT 2.9 dd 18.33 –0.05 –.49 ... .77 .13590.71 23.31 Glaukos GKOS ... dd 87.17 +0.83 .37 –1.62 –1.09 ...48.25 31.43 GSK GSK 5.2 12 38.36 –0.11 2.40 3.13 3.07 .495915.93 6.67 GlobalBlue GB ... dd 13.33 +1.11 .18 ... ... ...
2.54 0.20 GlobalBlueWt GB.WT ... ... 2.20 +0.81 ... ... ... ...5.10 2.54 GlobalCordBlood CO ... 7 3.94 –0.01 .56 .45 .57 ...15.95 6.98 GlobalMedREIT GMRE 6.0 dd 13.26 +0.10 .10 ... .22 .2021.71 8.77 GlobalNetLease GNL 9.4 cc 16.97 +0.01 .39 ... ... .4020.32 6.30 GlobalPtnrs GLP 10.1 7 18.78 +1.37 .81 2.55 .93 .50215.70 105.54 GlobalPayments GPN .4 cc 187.52 –3.86 2.16 6.39 ... .19517.69 2.61 GlobalShipLease GSL ... ... 13.10 –3.44 1.48 1.66 2.42 ...230.47 70.83 Globant GLOB ... cc 207.12 –1.70 1.43 ... 3.14 ...111.43 56.74 GlobeLife GL .8 14 94.34 –1.74 6.83 ... 7.48 .187568.20 33.41 GlobusMedical GMED ... 71 65.32 +1.68 ... ... ... ...91.81 40.25 GoDaddy GDDY ... dd 83.75 +2.84 .76 –3.00 1.79 ...14.90 3.79 GoldFields GFI 1.3 34 9.57 +0.68 .20 .78 1.29 .092911.33 10.25 GoldenFalconAcqnUn GFX.UT ... ... 11.04 +0.19 ... ... ... ...22.50 8.00 GoldmanSachsBDC GSBD 9.9 59 18.14 –0.17 .90 ... ... .05309.41 130.85 GoldmanSachs GS 1.7 12 289.39 –11.62 24.74 28.69 31.78 1.2538.27 21.49 Gorman-Rupp GRC 1.8 33 33.81 +0.35 ... 1.13 1.54 .15570.46 26.75 GraceWR GRA 2.0 cc 61.10 –2.15 1.89 2.61 3.85 .3076.98 38.43 Graco GGG 1.0 43 75.83 +2.29 2.00 1.85 1.84 .187512.00 5.56 GrafTechIntl EAF .4 6 10.59 +0.08 2.58 ... ... .0120.51 10.36 Graham GHM 2.6 cc 16.97 +1.81 .19 .31 .34 .11609.89 267.89 GrahamHoldings GHC 1.1 14 559.27 +2.52 ... 20.77 23.21 1.51427.90 200.61 Grainger GWW 1.6 34 393.49 +4.83 15.32 ... 18.39 1.5335.12 8.90 GraniteConstr GVA 1.6 dd 33.54 +0.28 .96 1.04 1.73 .1318.70 1.74 GranitePointMtg GPMT 8.0 dd 10.04 +0.32 1.32 ... 1.06 .2562.59 28.12 GraniteREIT GRP.UT 3.9 13 60.65 +1.56 ... 3.87 4.07 .196618.22 10.41 GraphicPkg GPK 1.7 36 17.22 –0.31 .70 1.10 1.04 .07522.83 8.53 GrayTelevision GTN ... 7 17.00 –0.06 ... 3.42 1.74 ...21.35 8.55 GrayTelevisionA GTN.A ... 7 16.44 –0.06 ... 3.42 1.74 ...15.35 3.96 GreatAjax AJX 6.3 13 10.74 +0.16 1.59 .78 1.06 .1733.24 10.86 GreatWesternBncp GWB .2 dd 23.52 –0.47 –12.24 1.62 1.90 .0164.97 14.20 GreenDot GDOT ... 59 54.48 +0.46 1.88 ... 2.23 ...38.06 12.89 Greenbrier GBX 2.9 40 36.86 +1.15 1.46 .23 1.99 .2723.08 7.28 Greenhill GHL 1.6 dd 12.51 –0.52 .45 –.10 1.19 .0515.17 9.79 GreenTree GHG ... 38 13.14 –0.07 .63 2.89 ... ...52.35 23.65 Greif A GEF 3.5 27 49.78 –0.69 1.83 3.61 4.16 .4453.90 30.89 Greif B GEF.B 5.1 19 51.04 –0.57 2.74 3.61 4.16 .6527.53 9.15 Griffon GFF 1.4 20 23.60 +0.24 1.19 1.52 1.79 .08162.65 26.26 Group1Auto GPI .8 12 156.32 +4.38 9.34 18.32 12.60 .3085.53 29.35 Grubhub GRUB ... dd 78.88 +7.82 –.20 –.03 1.04 ...132.50 44.28 GpoAeroportuar PAC ... 35 103.10 –6.16 ... 2.53 4.09 ...205.29 82.08 GpoAeroportSur ASR ... 34 160.93 –2.92 ... ... ... ...8.85 3.32 GpoAvalAcc AVAL 4.7 11 6.59 –0.10 ... ... ... .02593.68 1.28 GpoSupervielle SUPV 1.6 3 1.85 –0.09 ... ... ... .040912.37 4.65 GrupoTelevisa TV ... dd 8.60 +0.10 .42 .24 .38 ...25.84 3.64 Guess GES 1.9 dd 24.19 –0.68 1.33 –.75 1.35 .1125134.22 71.64 Guidewire GWRE ... dd 123.71 –1.29 –.33 .21 .32 ...18.00 13.13 GuildHldgs GHLD ... ... 16.10 –1.51 ... 8.46 3.47 ...
H174.55 58.38 HCAHealthcare HCA .0 17 166.97 –1.80 10.07 10.53 12.49 .4362.93 31.61 HCIGroup HCI 2.9 15 56.13 +2.03 3.31 3.25 3.35 .404.32 1.29 HC2Holdings HCHC ... dd 3.66 +0.18 –.66 –2.08 –.60 ...76.12 29.50 HDFCBank HDB ... 33 74.25 –0.63 2.11 2.29 ... ...7.82 1.38 HEXO HEXO ... dd 6.69 –0.52 –5.26 –.14 –.05 ...11.04 9.86 HIGAcqn HIGA.UT ... ... 10.90 +0.15 ... ... ... ...15.46 9.75 H.I.G.AcqnA HIGA ... ... 10.38 +0.06 ... ... ... ...1.90 1.16 H.I.G.AcqnWt HIGA.WT ... ... 1.70 +0.13 ... ... ... ...42.90 16.61 HNI HNI 3.5 22 34.49 +0.90 2.54 2.75 2.01 .30526.15 12.54 HP HPQ 3.1 13 25.27 +0.10 2.00 2.63 2.94 .193810.66 9.57 HPXA HPX ... ... 10.45 +0.04 ... ... ... ...11.47 9.81 HPXUn HPX.UT ... ... 11.20 +0.05 ... ... ... ...1.91 0.64 HPXWt HPX.WT ... ... 1.67 +0.11 ... ... ... ...38.61 17.95 HSBC HSBC ... dd 27.82 +0.47 1.51 1.38 2.17 ...30.62 11.78 HUYA HUYA ... 49 24.03 +2.07 ... 4.07 6.11 ...129.92 63.41 Haemonetic HAE ... 56 116.92 –8.78 1.48 2.42 3.54 ...23.50 4.25 Halliburton HAL .9 dd 19.24 –1.50 –3.34 .84 1.24 .04525.00 6.68 HamiltonBeach HBB 2.1 9 17.90 –0.29 ... 2.20 2.20 .09517.74 6.96 Hanesbrands HBI 3.9 13 15.58 –0.14 1.64 1.36 ... .1526.22 11.31 Hanger HNGR ... 22 22.87 –0.11 .72 .22 ... ...72.42 15.01 HannonArmstrong HASI 2.0 47 67.08 +2.22 1.24 1.49 1.58 .34144.71 75.11 HanoverIns THG 2.4 15 116.98 –2.42 10.46 8.67 9.16 .7043.47 14.31 HarleyDavidson HOG .2 57 41.35 +0.73 2.68 ... 2.83 .027.61 1.76 HarmonyGold HMY ... dd 4.41 +0.15 –.10 .74 .95 ...19.98 4.19 Harsco HSC ... dd 18.18 –0.43 6.19 .47 .79 ...
- Earnings -52-Week Tick - Week’s - Last This Next DivHigh Low Name Sym Yld P/E Last Chg. Year Year Year Amt
- Earnings -52-Week Tick - Week’s - Last This Next DivHigh Low Name Sym Yld P/E Last Chg. Year Year Year Amt
- Earnings -52-Week Tick - Week’s - Last This Next DivHigh Low Name Sym Yld P/E Last Chg. Year Year Year Amt
- Earnings -52-Week Tick - Week’s - Last This Next DivHigh Low Name Sym Yld P/E Last Chg. Year Year Year Amt
31350
28900
26450
24000
21550
19100
581000
562400
543800
525200
506600
488000
BREADTH DJIA
F M A M J J A S O N D J
NYSE CUMULATIVE DAILY BREADTH vs DJIA
In generating this chart, we subtract each day's NYSE composite declines from that day's advances. The resultant total is added to the next day's total, and soon. When all five days' numbers are added together, this produces the weekly figure we plot. Dec. 31, 1985 =1000.
BREADTH 579,818s
DJIAs
Inaugural Ball: A rally in big tech lifted the S&P 500 by 2% for the week. NYSE Compos-ite breadth rose for a 12th week, as winning stocks beat losers by 3 to 2.
For
per
sona
l non
-com
mer
cial
use
onl
y. D
o no
t edi
t or
alte
r. R
epro
duct
ions
not
per
mitt
ed.
To
repr
int o
r lic
ense
con
tent
, ple
ase
cont
act B
arro
n's
repr
ints
dep
artm
ent a
t 800
-843
-000
8 or
ww
w.d
jrepr
ints
.com
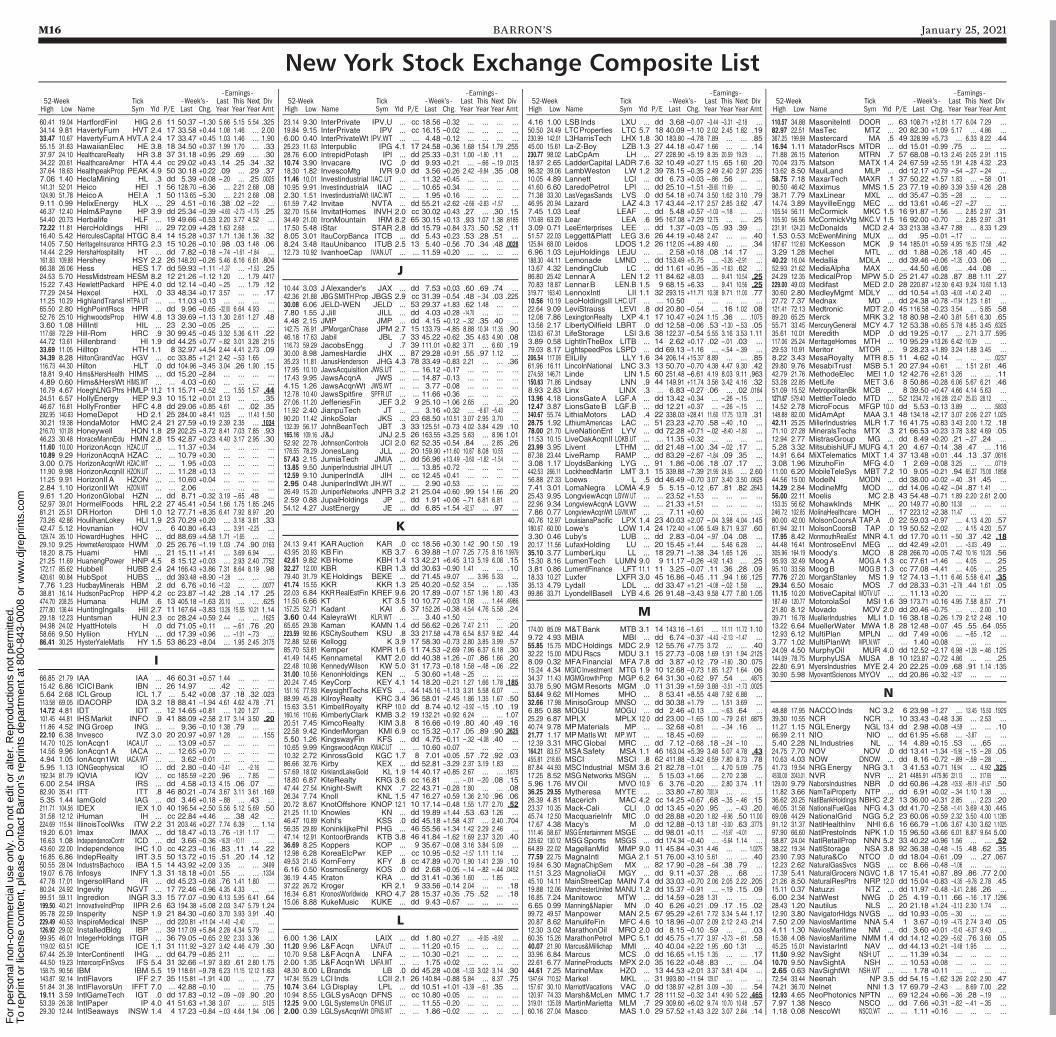
M16 BARRON’S January 25, 2021
New York Stock Exchange Composite List
60.41 19.04 HartfordFinl HIG 2.6 11 50.37 –1.30 5.66 5.15 5.54 .32534.14 9.81 HavertyFurn HVT 2.4 17 33.58 +0.44 1.08 1.46 ... 2.0033.47 10.67 HavertyFurnA HVT.A 2.4 17 33.47 +0.45 1.03 1.46 ... 1.9055.15 31.83 HawaiianElec HE 3.8 18 34.50 +0.37 1.99 1.70 ... .3337.97 24.10 HealthcareRealty HR 3.8 37 31.18 +0.95 .29 .69 ... .3034.22 20.61 HealthcareAmer HTA 4.4 cc 29.02 +0.43 .14 .25 .34 .3237.64 18.63 HealthpeakProp PEAK 4.9 50 30.18 +0.22 .09 ... .29 .377.06 1.40 HeclaMining HL .3 dd 5.39 +0.08 –.20 ... .25 .0025141.31 52.01 Heico HEI .1 56 128.70 –6.36 ... 2.21 2.68 .08124.90 51.78 HeicoA HEI.A .1 50 113.65 –5.30 ... 2.21 2.68 .089.11 0.99 HelixEnergy HLX ... 29 4.51 –0.16 .38 .02 –.22 ...46.37 12.40 Helm&Payne HP 3.9 dd 25.34 –0.39 –4.60 –2.73 –1.75 .2554.40 20.73 Herbalife HLF ... 19 49.66 –0.53 2.20 3.77 4.52 ...72.22 11.81 HercHoldings HRI ... 29 72.09 +4.28 1.63 2.68 ... ...16.40 5.42 HerculesCapital HTGC 8.4 14 15.28 +0.37 1.71 1.36 1.36 .3214.05 7.50 HeritageInsurance HRTG 2.3 15 10.26 –0.10 .98 .03 1.48 .0614.44 2.29 HershaHospitality HT ... dd 7.82 –0.18 –.74 –1.61 –1.84 ...161.83 109.88 Hershey HSY 2.2 26 148.20 –0.26 5.46 6.16 6.61 .80466.38 26.06 Hess HES 1.7 dd 59.93 –1.11 –1.37 ... –1.53 .2524.53 5.70 HessMidstream HESM 8.2 12 21.26 –1.12 1.20 ... 1.79 .441715.22 7.43 HewlettPackard HPE 4.0 dd 12.14 –0.40 –.25 ... 1.79 .1277.29 24.54 Hexcel HXL .0 33 48.34 +0.17 3.57 ... ... .1711.25 10.29 HighlandTransI HTPA.UT ... ... 11.03 +0.13 ... ... ... ...65.50 2.80 HighPointRscs HPR ... dd 9.96 –0.65 –32.00 6.64 4.93 ...52.76 25.10 HighwoodsProp HIW 4.8 13 39.69 –1.13 1.30 2.61 1.27 .483.60 1.08 HillIntl HIL ... 23 2.30 –0.05 .25 ... ... ...117.68 72.29 Hill-Rom HRC .9 30 99.45 –0.45 3.32 5.36 6.11 .2244.72 13.61 Hillenbrand HI 1.9 dd 44.25 +0.77 –.82 3.01 3.28 .21533.69 11.05 Hilltop HTH 1.1 8 32.97 +4.54 2.44 4.41 2.73 .0934.39 8.28 HiltonGrandVac HGV ... cc 33.85 +1.21 2.42 –.53 1.65 ...116.73 44.30 Hilton HLT .0 dd 104.96 –3.45 3.04 .26 1.90 .1518.81 9.40 Hims&HersHealth HIMS ... dd 15.20 –2.84 ... ... ... ...4.89 0.60 Hims&HersWt HIMS.WT ... ... 4.03 –0.60 ... ... ... ...16.79 4.67 HoeghLNGPtrs HMLP 11.2 11 15.71 –0.52 ... 1.55 1.57 .4424.51 6.57 HollyEnergy HEP 9.3 10 15.12 +0.01 2.13 ... ... .3546.67 16.81 HollyFrontier HFC 4.8 dd 29.06 +0.85 4.61 ... .02 .35292.95 140.63 HomeDepot HD 2.1 25 284.00 +8.41 10.25 ... 11.43 1.5030.21 19.38 HondaMotor HMC 2.4 21 27.59 +0.19 2.39 2.35 ... .1034216.70 101.08 Honeywell HON 1.8 29 202.25 –3.72 8.41 7.03 7.85 .9346.23 30.48 HoraceMannEdu HMN 2.8 15 42.87 +0.23 4.40 3.17 2.95 .3011.60 10.00 HorizonAcqn HZAC.UT ... ... 11.37 +0.34 ... ... ... ...10.89 9.29 HorizonAcqnA HZAC ... ... 10.79 +0.30 ... ... ... ...3.00 0.75 HorizonAcqnWt HZAC.WT ... ... 1.95 +0.03 ... ... ... ...11.90 9.98 HorizonAcqnII HZON.UT ... ... 11.28 +0.13 ... ... ... ...11.25 9.91 HorizonIIA HZON ... ... 10.60 +0.04 ... ... ... ...2.84 1.10 HorizonIIWt HZON.WT ... ... 2.06 ... ... ... ... ...9.61 1.20 HorizonGlobal HZN ... dd 8.71 –0.32 3.19 –.65 .48 ...52.97 39.01 HormelFoods HRL 2.2 27 45.41 +0.54 1.66 1.75 1.85 .24581.21 25.51 DRHorton DHI 1.0 12 77.71 +8.35 6.41 7.92 8.97 .2073.26 42.86 HoulihanLokey HLI 1.9 23 70.29 +0.20 ... 3.18 3.81 .3342.47 5.12 Hovnanian HOV ... 6 40.80 +6.43 ... 3.91 –2.25 ...129.74 35.10 HowardHughes HHC ... dd 88.69 +4.58 1.71 –1.65 ... ...29.10 9.25 HowmetAerospace HWM .0 25 26.76 –1.19 1.03 .74 .90 .016318.20 8.75 Huami HMI ... 21 15.11 +1.41 ... 3.69 6.94 ...21.25 11.69 HuanengPower HNP 4.5 8 15.12 +0.03 ... 2.93 2.40 .7752172.17 85.62 Hubbell HUBB 2.4 24 166.43 +3.86 7.31 8.64 8.19 .98420.61 90.84 HubSpot HUBS ... dd 393.48 +8.90 –1.28 ... ... ...7.76 1.23 HudbayMinerals HBM .2 dd 6.76 +0.16 –1.32 ... ... .007738.81 16.14 HudsonPacProp HPP 4.2 cc 23.87 –1.42 .28 .14 .17 .25474.70 208.25 Humana HUM .6 13 405.18 –1.63 20.10 ... ... .625277.80 136.44 HuntingIngalls HII 2.7 11 167.64 –3.83 13.26 15.55 10.21 1.1429.18 12.23 Huntsman HUN 2.3 cc 28.24 +0.59 2.44 ... ... .162594.98 24.02 HyattHotels H .0 dd 71.05 +0.11 ... –.61 .76 .2058.66 9.50 Hyliion HYLN ... dd 17.39 +0.96 ... –1.01 –.73 ...86.41 30.25 HysterYaleMatls HY 1.5 53 86.23 +8.04 ... 1.95 2.45 .3175
I66.85 21.79 IAA IAA ... 46 60.31 +0.57 1.44 ... ... ...15.42 6.86 ICICIBank IBN ... 26 14.97 ... .42 ... ... ...5.64 2.68 ICLGroup ICL 1.7 ... 5.42 +0.08 .37 .18 .32 .023113.58 69.05 IDACORP IDA 3.2 18 88.41 –1.94 4.61 4.62 4.78 .7114.72 4.81 IDT IDT ... 12 14.65 +0.81 ... 1.20 1.27 ...101.45 44.81 IHSMarkit INFO .9 41 88.09 +2.58 2.17 3.14 3.50 .2011.86 4.52 INGGroep ING ... ... 9.36 –0.10 1.38 .79 ... ...22.10 6.38 Invesco IVZ 3.0 20 20.97 +0.97 1.28 ... ... .15514.70 10.25 IonAcqn1 IACA.UT ... ... 13.09 +0.57 ... ... ... ...14.56 9.96 IonAcqn1A IACA ... ... 12.65 +0.70 ... ... ... ...4.94 1.05 IonAcqn1Wt IACA.WT ... ... 3.62 –0.01 ... ... ... ...5.95 1.13 IONGeophysical IO ... dd 2.80 –0.40 –3.41 ... –2.16 ...192.34 81.79 IQVIA IQV ... cc 185.59 –2.20 .96 ... 7.85 ...6.00 2.54 IRSA IRS ... dd 4.58 +0.13 4.15 .06 .07 ...82.90 35.41 ITT ITT .8 46 80.21 –0.74 3.67 3.11 3.61 .1695.35 1.44 IamGold IAG ... dd 3.46 +0.18 –.88 ... .43 ...211.71 104.56 IDEX IEX 1.0 40 196.54 +2.50 5.56 5.12 5.69 .5031.58 12.12 iHuman IH ... cc 22.84 +4.46 ... .38 .42 ...224.69 115.94 IllinoisToolWks ITW 2.2 31 203.46 +0.27 7.74 6.39 ... 1.1419.20 6.01 Imax IMAX ... dd 18.47 +0.13 .76 –1.91 1.17 ...16.63 1.08 IndependenceContr ICD ... dd 3.66 –0.36 –16.20 –10.11 ... ...43.60 22.00 Independence IHC 1.0 cc 42.23 –0.16 .83 .11 .14 .2216.85 6.86 IndepRealty IRT 3.5 50 13.72 +0.15 .51 .20 .14 .1250.55 28.04 IndustrsBachoco IBA 1.5 14 43.92 +2.09 3.35 ... ... .349919.07 6.76 Infosys INFY 1.3 31 18.18 +0.01 .55 ... ... .133447.78 17.01 IngersollRand IR ... dd 45.23 –0.68 .76 1.41 1.80 ...80.24 24.92 Ingevity NGVT ... 17 72.46 –0.96 4.35 4.33 ... ...99.51 59.11 Ingredion INGR 3.3 15 77.07 –0.90 6.13 5.95 6.41 .64199.50 40.21 InnovativeIndProp IIPR 2.6 63 194.38 +5.08 2.03 3.47 5.79 1.2495.78 22.59 Insperity NSP 1.9 21 84.30 –0.60 3.70 3.93 3.91 .40229.49 40.53 InspireMedical INSP ... dd 220.81 +11.04 –1.40 –2.40 ... ...126.92 29.02 InstalledBldg IBP ... 39 117.09 +5.84 2.28 4.34 5.79 ...99.95 46.01 IntegerHoldings ITGR ... 36 79.05 –0.65 2.92 2.33 3.36 ...119.02 63.51 ICE ICE 1.1 31 111.92 –3.27 3.42 4.46 4.79 .3067.44 25.39 InterContinentl IHG ... dd 64.79 –0.85 2.11 ... ... ...44.50 19.23 IntercorpFinSvcs IFS 5.4 31 32.66 –1.97 3.83 .61 2.80 1.75158.75 90.56 IBM IBM 5.5 19 118.61 –9.78 6.23 11.15 12.12 1.63143.87 92.14 IntlFlavors IFF 2.7 35 115.81 –1.91 4.00 ... ... .7751.84 31.38 IntlFlavorsUn IFFT 7.0 ... 42.88 –0.10 ... ... ... .7519.11 3.59 IntlGameTech IGT .0 dd 17.83 –0.12 –.09 –.09 .90 .2053.39 26.38 IntlPaper IP 4.0 41 51.63 +1.38 3.07 ... ... .512529.30 12.44 IntlSeaways INSW 1.4 4 17.23 –0.84 –.03 4.64 1.94 .06
23.14 9.30 InterPrivate IPV.U ... cc 18.56 –0.32 ... ... ... ...19.84 9.15 InterPrivate IPV ... cc 16.15 –0.02 ... ... ... ...6.00 0.40 InterPrivateWt IPV.WT ... ... 4.48 –0.12 ... ... ... ...25.23 11.63 Interpublic IPG 4.1 17 24.58 –0.36 1.68 1.54 1.79 .25528.76 6.00 IntrepidPotash IPI ... dd 25.33 –0.31 1.00 –1.80 .11 ...10.74 3.90 Invacare IVC .0 dd 9.93 +0.21 ... –.66 –.19 .012518.30 1.82 InvescoMtg IVR 9.0 dd 3.56 +0.26 2.42 –9.84 .35 .0811.46 10.01 Investindustrial IIAC.UT ... ... 11.32 +0.45 ... ... ... ...10.95 9.91 InvestindustrialA IIAC ... ... 10.65 +0.34 ... ... ... ...2.30 1.51 InvestindustrialWt IIAC.WT ... ... 1.95 +0.16 ... ... ... ...61.59 7.42 Invitae NVTA ... dd 55.21 +2.62 –2.66 –2.83 –1.57 ...32.70 15.64 InvitatHomes INVH 2.0 cc 30.02 +0.43 .27 ... .30 .1534.49 21.00 IronMountain IRM 8.2 65 30.15 +0.13 .93 1.07 1.38 .618517.50 5.48 iStar STAR 2.8 dd 15.79 +0.84 3.73 .50 .52 .118.05 3.01 ItauCorpBanca ITCB ... dd 5.43 +0.23 .53 .28 .51 ...8.24 3.48 ItauUnibanco ITUB 2.5 13 5.40 –0.56 .70 .34 .48 .002812.73 10.92 IvanhoeCap IVAN.UT ... ... 11.59 +0.20 ... ... ... ...
J10.44 3.03 JAlexander's JAX ... dd 7.53 +0.03 .60 .69 .74 ...42.36 21.88 JBGSMITHProp JBGS 2.9 cc 31.39 –0.54 .48 –.34 .03 .22530.08 6.06 JELD-WEN JELD ... 53 29.37 +1.83 .62 1.48 ... ...7.80 1.55 J.Jill JILL ... dd 4.03 +0.28 –14.70 ... ... ...4.48 2.15 JMP JMP ... dd 4.15 +0.12 –.32 .35 .40 ...142.75 76.91 JPMorganChase JPM 2.7 15 133.79 –4.85 8.88 10.34 11.35 .9046.18 17.63 Jabil JBL .7 33 45.22 +0.62 .35 4.63 4.90 .08116.73 59.29 JacobsEngg J .7 39 111.01 +0.82 3.71 ... 6.60 .1930.00 8.98 JamesHardie JHX ... 87 29.28 +0.91 .55 .97 1.12 ...35.23 11.81 JanusHenderson JHG 4.3 78 33.49 –0.83 2.21 ... ... .3617.95 10.10 JawsAcquisition JWS.UT ... ... 16.12 –0.17 ... ... ... ...17.43 9.95 JawsAcqnA JWS ... ... 14.87 –0.13 ... ... ... ...4.15 1.26 JawsAcqnWt JWS.WT ... ... 3.77 –0.08 ... ... ... ...12.78 10.40 JawsSpitfire SPFR.UT ... ... 11.66 +0.36 ... ... ... ...27.06 11.20 JefferiesFin JEF 3.2 9 25.10 –1.06 2.65 ... ... .2011.92 2.40 JianpuTech JT ... ... 3.16 +0.32 ... –8.67 –5.40 ...90.20 11.42 JinkoSolar JKS ... 23 68.50 +10.51 3.07 2.95 3.70 ...132.39 56.17 JohnBeanTech JBT .3 33 125.51 –0.73 4.02 3.84 4.29 .10165.16 109.16 J&J JNJ 2.5 26 163.55 +3.25 5.63 ... 8.96 1.0152.92 22.78 JohnsonControls JCI 2.0 62 52.35 +0.54 .84 ... 2.85 .26178.55 78.29 JonesLang JLL ... 20 159.90 +11.60 10.87 8.08 10.55 ...57.43 2.15 JumiaTech JMIA ... dd 56.96 +13.49 –3.60 –1.82 –1.54 ...13.85 9.50 JuniperIndustrial JIH.UT ... ... 13.85 +0.72 ... ... ... ...12.59 9.10 JuniperIndlA JIH ... cc 12.45 +0.41 ... ... ... ...2.95 0.48 JuniperIndlWt JIH.WT ... ... 2.90 +0.53 ... ... ... ...26.49 15.20 JuniperNetworks JNPR 3.2 21 25.04 +0.60 .99 1.54 1.66 .202.59 0.88 JupaiHoldings JP ... dd 1.91 +0.06 –.71 6.81 6.81 ...54.12 4.27 JustEnergy JE ... dd 6.85 +1.54 –52.57 ... .97 ...
K24.13 9.41 KARAuction KAR .0 cc 18.56 +0.30 1.42 .90 1.50 .1943.95 20.93 KBFin KB 3.7 6 39.88 –1.07 7.25 7.75 8.16 1.997942.61 9.82 KBHome KBH 1.4 13 42.21 +6.45 3.13 5.19 6.08 .1532.27 12.00 KBR KBR 1.3 dd 30.63 –0.90 1.41 ... ... .1079.40 31.79 KEHoldings BEKE ... dd 71.45 +9.07 ... 3.96 5.33 ...41.74 15.55 KKR KKR 1.3 25 40.20 –0.52 3.54 ... ... .13522.03 6.84 KKRRealEstFin KREF 9.6 20 17.89 –0.07 1.57 1.96 1.80 .4311.50 6.66 KT KT 3.5 10 10.77 +0.03 1.08 ... 1.44 .4986157.25 52.71 Kadant KAI .6 37 152.26 –0.38 4.54 4.76 5.58 .243.60 0.44 KaleyraWt KLR.WT ... ... 3.40 +1.50 ... ... ... ...65.65 29.38 Kaman KAMN 1.4 dd 56.62 –0.26 7.47 2.11 ... .20223.59 92.86 KSCitySouthern KSU .8 33 217.58 +4.78 6.54 8.57 9.82 .4472.88 52.66 Kellogg K 3.9 17 58.30 –0.73 2.80 3.85 3.99 .5785.70 53.81 Kemper KMPR 1.6 11 74.53 –2.69 7.96 6.37 6.18 .3041.49 14.45 Kennametal KMT 2.0 dd 40.38 +1.26 –.07 .86 1.66 .2022.48 10.98 KennedyWilson KW 5.0 31 17.73 –0.18 1.58 –.48 –.06 .2231.00 10.56 KenonHoldings KEN ... 5 30.60 +1.48 –.25 ... ... ...20.24 7.45 KeyCorp KEY 4.1 14 18.20 –0.21 1.27 1.66 1.78 .185151.16 77.93 KeysightTechs KEYS ... 44 145.16 –1.13 3.31 5.58 6.07 ...88.99 45.28 KilroyRealty KRC 3.4 36 58.01 –2.45 1.86 1.35 1.67 .5015.63 3.51 KimbellRoyalty KRP 10.0 dd 8.74 +0.12 –3.92 –.15 .10 .19160.16 110.66 KimberlyClark KMB 3.2 19 132.21 +0.92 6.24 ... ... 1.0720.51 7.45 KimcoRealty KIM 3.8 8 16.66 +0.19 .80 .40 .49 .1622.58 9.42 KinderMorgan KMI 6.9 cc 15.32 –0.17 .05 .89 .90 .26255.50 1.26 KingswayFin KFS ... dd 4.75 –0.11 –.32 –4.08 .40 ...10.65 9.99 KingswoodAcqn KWAC.UT ... ... 10.60 +0.07 ... ... ... ...10.32 2.72 KinrossGold KGC 1.7 8 7.01 +0.05 .57 .72 .92 .0386.66 32.76 Kirby KEX ... dd 52.81 –3.29 2.37 3.19 1.83 ...57.69 18.02 KirklandLakeGold KL 1.9 14 40.17 +0.85 2.67 ... ... .187518.80 6.87 KiteRealty KRG 3.6 cc 16.81 ... –.01 –.20 .08 .1547.44 27.54 Knight-Swift KNX .7 22 43.71 –0.28 1.80 ... ... .0826.34 7.74 Knoll KNL 1.5 47 16.27 +0.59 1.36 2.10 .96 .0620.72 8.67 KnotOffshore KNOP 12.1 10 17.14 –0.48 1.55 1.77 2.70 .5221.25 11.10 Knowles KN ... dd 19.89 +1.44 .53 .63 1.26 ...46.47 10.89 Kohl's KSS .0 dd 45.18 +1.58 4.37 ... 2.40 .70456.35 29.89 KoninklijkePhil PHG ... 46 55.56 +1.34 1.42 2.29 2.46 ...47.14 12.91 KontoorBrands KTB 3.8 46 41.84 –1.62 1.69 2.37 3.20 .4036.69 8.25 Koppers KOP ... 9 35.67 –0.08 3.16 3.84 5.09 ...12.98 6.28 KoreaElcPwr KEP ... cc 10.95 –0.52 –1.57 1.11 1.14 ...49.53 21.45 KornFerry KFY .8 cc 47.89 +0.70 1.90 1.41 2.39 .106.16 0.50 KosmosEnergy KOS .0 dd 2.68 –0.05 –.14 –.82 –.44 .045236.19 4.45 Kraton KRA ... dd 31.41 –0.36 1.60 ... 1.85 ...37.22 26.72 Kroger KR 2.1 9 33.56 –0.14 2.04 ... ... .1816.34 6.81 KronosWorldwide KRO 4.7 28 15.37 +0.35 .75 .52 ... .1815.06 8.88 KukeMusic KUKE ... dd 9.43 –0.67 ... ... ... ...
L6.00 1.36 LAIX LAIX ... dd 1.80 +0.27 ... –9.05 –8.92 ...11.20 9.96 L&FAcqn LNFA.UT ... ... 11.20 +0.15 ... ... ... ...10.70 9.58 L&FAcqnA LNFA ... ... 10.30 –0.21 ... ... ... ...2.00 1.35 L&FAcqnWt LNFA.WT ... ... 1.75 +0.02 ... ... ... ...48.30 8.00 LBrands LB .0 dd 45.28 +0.08 –1.33 3.02 3.14 .30147.84 55.29 LCI Inds LCII 2.1 26 140.84 –0.88 5.84 ... 8.37 .7510.74 3.64 LGDisplay LPL ... dd 10.51 +1.01 –3.39 –.61 .35 ...10.94 8.55 LGLSysAcqn DFNS ... cc 10.80 +0.05 ... ... ... ...12.25 9.00 LGLSystemsUn DFNS.UT ... ... 11.55 –0.20 ... ... ... ...2.00 0.39 LGLSysAcqnWt DFNS.WT ... ... 1.86 –0.02 ... ... ... ...
4.16 1.00 LSB Inds LXU ... dd 3.68 –0.07 –3.44 –3.31 –2.18 ...50.50 24.49 LTCProperties LTC 5.7 18 40.09 –1.10 2.02 2.45 1.82 .19230.99 142.01 L3HarrisTech LHX 1.8 30 183.80 –4.78 7.89 ... ... .8545.00 15.61 La-Z-Boy LZB 1.3 27 44.18 +0.47 1.66 ... ... .14230.77 98.02 LabCpAm LH ... 27 228.90 +5.19 8.35 20.59 19.29 ...18.97 2.65 LadderCapital LADR 7.6 32 10.49 +0.27 1.15 .65 1.60 .2096.32 39.06 LambWeston LW 1.2 39 78.15 –0.35 2.49 2.40 2.97 .23510.05 4.89 Lannett LCI ... dd 6.73 +0.03 –.86 .56 ... ...41.60 6.60 LaredoPetrol LPI ... dd 25.10 –1.51 –29.60 11.69 ... ...71.38 33.30 LasVegasSands LVS .0 dd 54.18 +0.74 3.50 1.62 3.10 .7946.95 20.94 Lazard LAZ 4.3 17 43.44 –2.17 2.57 2.85 3.62 .477.45 1.03 Leaf LEAF ... dd 5.48 +0.57 –1.03 –.18 ... ...170.68 63.20 Lear LEA .6 95 167.08 +7.29 12.75 ... ... .253.09 0.71 LeeEnterprises LEE ... dd 1.37 –0.03 –.05 .93 .39 ...51.57 22.03 Leggett&Platt LEG 3.6 26 44.19 +0.48 2.47 ... ... .40125.84 68.00 Leidos LDOS 1.2 26 112.05 +4.89 4.60 ... ... .346.96 1.03 LejuHoldings LEJU ... ... 2.58 +0.18 .08 .14 .17 ...188.30 44.11 Lemonade LMND ... dd 153.49 +5.75 ... –3.26 –2.91 ...13.67 4.32 LendingClub LC ... dd 11.61 +0.95 –.35 –1.63 .62 ...86.80 25.42 LennarA LEN 1.2 11 84.62 +8.03 ... 9.41 10.54 .2570.83 18.87 LennarB LEN.B 1.5 9 68.15 +6.33 ... 9.41 10.56 .25319.77 163.40 LennoxIntl LII 1.1 32 293.15 +11.71 10.38 9.71 11.00 .7710.56 10.19 LeoHoldingsII LHC.UT ... ... 10.50 ... ... ... ... ...22.64 9.09 LeviStrauss LEVI .8 dd 20.80 –0.54 ... .16 1.02 .0812.08 7.86 LexingtonRealty LXP 4.1 17 10.47 +0.24 1.15 .36 ... .107513.58 2.17 LibertyOilfield LBRT .0 dd 12.58 –0.06 .53 –1.30 –.53 .05123.63 67.31 LifeStorage LSI 3.6 38 122.37 –0.54 5.55 3.16 3.53 1.113.89 0.58 LightInTheBox LITB ... 14 2.62 +0.17 .02 –.01 .03 ...79.03 8.17 LightspeedPos LSPD ... dd 69.13 –1.16 ... –.54 –.39 ...206.54 117.06 EliLilly LLY 1.6 34 206.14 +15.37 8.89 ... ... .8561.96 16.11 LincolnNational LNC 3.3 13 50.70 –0.70 4.38 4.47 9.30 .42274.58 146.71 Linde LIN 1.5 60 251.48 –6.61 4.19 8.03 9.11 .963150.63 71.86 Lindsay LNN .9 44 149.91 +11.74 3.56 3.42 4.16 .328.93 2.83 Linx LINX .3 ... 6.83 –0.27 .06 ... .02 .018413.96 4.18 LionsGateA LGF.A ... dd 13.42 +0.34 ... –.26 –.15 ...12.47 3.87 LionsGateB LGF.B ... dd 12.21 +0.37 ... –.26 –.15 ...340.67 55.74 LithiaMotors LAD .4 22 338.03 +28.41 11.60 17.75 13.78 .3128.75 1.92 LithiumAmericas LAC ... 51 23.23 +2.70 .58 –.40 .10 ...78.00 21.70 LiveNationEnt LYV ... dd 72.28 +0.71 –.02 –8.40 –1.80 ...11.53 10.15 LiveOakAcqnII LOKB.UT ... ... 11.35 +0.32 ... ... ... ...23.99 3.95 Livent LTHM ... dd 21.48 –1.00 .34 –.02 .17 ...87.38 23.44 LiveRamp RAMP ... dd 83.29 –2.67 –1.84 .09 .35 ...3.08 1.17 LloydsBanking LYG ... 91 1.86 –0.06 .18 .07 .17 ...442.53 266.11 LockheedMartin LMT 3.1 15 339.88 –7.39 21.95 24.55 ... 2.6056.88 27.33 Loews L .5 dd 46.49 –0.70 3.07 3.40 3.50 .06257.41 3.01 LomaNegra LOMA 4.9 5 5.15 –0.12 .67 .81 .82 .264325.43 9.95 LongviewAcqn LGVW.UT ... ... 23.52 +1.53 ... ... ... ...22.96 9.34 LongviewAcqnA LGVW ... ... 21.33 +1.51 ... ... ... ...7.86 0.77 LongviewAcqnWt LGVW.WT ... ... 7.11 +0.60 ... ... ... ...40.76 12.97 LouisianaPacific LPX 1.4 23 40.03 +2.07 –.04 3.98 4.04 .145180.67 60.00 Lowe's LOW 1.4 24 172.40 +1.06 5.49 8.71 9.37 .603.30 0.46 Luby's LUB ... dd 2.83 –0.04 –.97 .04 .08 ...20.17 11.56 LufaxHolding LU ... 20 15.45 +1.44 ... 5.46 6.28 ...35.10 3.77 LumberLiqu LL ... 18 29.71 –1.38 .34 1.65 1.26 ...15.30 8.16 LumenTech LUMN 9.0 9 11.17 –0.26 –4.92 1.43 ... .253.81 0.86 LumentFinance LFT 11.1 11 3.25 –0.07 .11 .36 .28 .0918.33 10.27 Luxfer LXFR 3.0 45 16.86 –0.45 .11 .94 1.66 .12535.13 4.79 Lydall LDL ... dd 33.47 +1.21 –4.08 –.02 1.58 ...99.86 33.71 LyondellBasell LYB 4.6 26 91.48 –3.43 9.58 4.77 7.80 1.05
M174.00 85.09 M&TBank MTB 3.1 14 143.16 –1.61 ... 11.11 11.72 1.109.72 4.93 MBIA MBI ... dd 6.74 –0.37 –4.43 –2.13 –1.47 ...55.85 15.75 MDCHoldings MDC 2.9 12 55.76 +7.75 3.72 ... ... .4032.22 15.00 MDURscs MDU 3.1 15 27.73 –0.08 1.69 1.91 1.94 .21258.09 0.32 MFAFinancial MFA 7.8 dd 3.87 +0.12 .79 –1.60 .30 .07515.24 4.34 MGIC Investment MTG 1.9 10 12.68 –0.73 1.85 1.27 1.64 .0634.37 11.43 MGMGrowthProp MGP 6.2 64 31.30 +0.62 .97 .54 ... .487533.78 5.90 MGMResorts MGM .0 11 31.39 +1.59 3.88 –3.51 –1.73 .002553.64 9.62 MIHomes MHO ... 8 53.41 +8.55 4.48 7.92 6.88 ...32.66 17.98 MinisoGroup MNSO ... dd 30.38 +1.79 ... 1.51 3.69 ...6.85 0.88 MOGU MOGU ... dd 2.46 +0.13 ... –.63 .64 ...25.29 6.87 MPLX MPLX 12.0 dd 23.00 –1.65 1.00 –.79 2.61 .687540.74 9.78 MPMaterials MP ... ... 32.68 +0.81 ... –.34 .16 ...21.77 1.17 MPMatlsWt MP.WT ... ... 18.45 +0.69 ... ... ... ...12.39 3.31 MRCGlobal MRC ... dd 7.12 –0.68 .18 –.24 –.10 ...164.21 83.57 MSASafety MSA 1.1 46 163.04 +5.39 3.48 5.07 4.78 .43455.81 218.65 MSCI MSCI .8 62 411.88 –3.42 6.59 7.80 8.73 .7887.84 44.93 MSC Industrial MSM 3.6 21 82.78 –1.01 ... 4.70 5.09 .7517.25 8.52 MSGNetworks MSGN ... 5 15.03 +1.66 ... 2.70 2.38 ...5.96 1.76 MVOil MVO 10.9 6 3.76 –0.20 ... 2.80 3.74 .1136.25 29.55 Mytheresa MYTE ... ... 33.80 +7.80 7020.04 ... ... ...26.39 4.81 Macerich MAC 4.2 cc 14.25 +0.67 .68 –.35 –.46 .1523.37 10.35 Mack-Cali CLI .0 dd 13.45 +0.20 .95 ... –.43 .2045.74 12.50 MacquarieInfr MIC .0 dd 28.88 +0.20 1.82 –9.96 .50 11.0017.67 4.38 Macy's M .0 dd 12.88 –0.13 1.81 –3.00 .63 .3775111.46 58.67 MSGEntertainment MSGE ... dd 98.01 +0.11 ... –15.97 –4.01 ...225.62 130.12 MSGSports MSGS ... dd 174.34 –0.40 ... –5.64 1.14 ...64.89 22.02 MagellanMid MMP 9.0 11 45.84 +0.31 4.46 ... ... 1.027577.59 22.75 MagnaIntl MGA 2.1 51 76.00 +3.10 5.61 ... ... .4019.84 6.30 MagnaChipSem MX ... 82 17.90 –0.28 –.64 .38 .79 ...11.51 3.23 MagnoliaOil MGY ... dd 9.11 +0.37 .28 ... .68 ...45.10 14.11 MainStreetCap MAIN 7.4 dd 33.03 +0.70 2.06 2.05 2.22 .20519.88 12.06 ManchesterUnited MANU 1.2 dd 15.37 –0.91 ... –.19 .15 .0916.85 7.24 Manitowoc MTW ... dd 14.59 –0.28 1.31 ... ... ...6.65 0.99 Manning&Napier MN .0 40 6.26 +0.21 .09 .17 .15 .0299.72 49.57 Manpower MAN 2.5 67 95.29 +2.61 7.72 3.34 5.44 1.1720.87 8.62 ManulifeFin MFC 4.6 10 18.96 –0.07 2.09 2.12 2.43 .21412.30 3.02 MarathonOil MRO 2.0 dd 8.15 –0.10 .59 ... ... .0360.35 15.26 MarathonPetrol MPC 5.1 dd 45.75 +1.77 3.97 –3.73 –.61 .5840.07 21.90 Marcus&Millichap MMI ... 40 40.04 +2.22 1.95 .60 1.31 ...33.96 6.84 Marcus MCS .0 dd 16.65 +1.15 1.35 ... ... .1722.61 6.77 MarineProducts MPX 2.0 35 16.22 +0.48 .83 ... ... .0444.61 7.25 MarineMax HZO ... 13 44.53 +2.01 3.37 3.81 4.04 ...1347.64 710.52 Markel MKL ... 31 993.80 –11.64 129.07 ... ... ...157.67 30.10 MarriottVacations VAC .0 dd 138.97 +2.81 3.09 –.30 ... .54120.97 74.33 Marsh&McLen MMC 1.7 28 111.52 –0.32 3.41 4.90 5.22 .465319.01 135.08 MartinMarietta MLM .7 29 309.60 +6.02 9.74 10.70 10.48 .5760.16 27.04 Masco MAS 1.0 29 57.52 +1.43 3.22 3.07 2.84 .14
110.57 34.88 MasoniteIntl DOOR ... 63 108.71 +12.81 1.77 6.04 7.29 ...82.97 22.51 MasTec MTZ ... 20 82.30 +1.09 5.17 ... 4.86 ...367.25 199.99 Mastercard MA .5 49 328.99 +5.73 ... 6.33 8.22 .4416.94 1.11 MatadorRscs MTDR ... dd 15.01 –0.99 .75 ... ... ...71.88 26.15 Materion MTRN .7 57 68.08 –0.13 2.45 2.05 2.91 .11570.04 23.75 Matson MATX 1.4 24 67.59 +2.55 1.91 4.28 4.32 .2313.62 8.50 MauiLand MLP ... dd 12.17 +0.79 –.54 –.27 –.24 ...58.75 7.18 MaxarTech MAXR .1 37 50.22 +1.57 1.83 ... –.58 .0180.50 46.42 Maximus MMS 1.5 23 77.19 +0.89 3.39 3.59 4.26 .2838.71 7.79 MaxLinear MXL ... dd 35.47 –0.35 –.28 ... ... ...14.74 3.89 MayvilleEngg MEC ... dd 13.61 +0.46 –.27 –.27 ... ...105.54 56.11 McCormick MKC 1.5 16 91.87 –1.56 ... 2.85 2.97 .31105.50 56.56 McCormickVtg MKC.V 1.5 16 92.00 –0.70 ... 2.85 2.97 .31231.91 124.23 McDonalds MCD 2.4 33 213.38 +3.47 7.88 ... 8.33 1.291.53 0.53 McEwenMining MUX ... dd .95 –0.01 –.17 ... ... ...187.67 112.60 McKesson MCK .9 14 185.01 +0.59 4.95 16.35 17.58 .423.29 1.28 Mechel MTL ... dd 1.88 –0.26 .18 .40 .45 ...40.22 16.04 Medallia MDLA ... dd 39.46 –0.06 –1.35 .03 .06 ...52.93 21.62 MediaAlpha MAX ... ... 44.50 +6.06 ... .44 .08 ...24.29 12.35 MedicalProp MPW 5.0 25 21.47 +0.28 .87 .88 1.11 .27229.00 49.03 Medifast MED 2.0 28 220.87 +12.30 6.43 9.24 10.60 1.1330.60 2.80 MedleyMgmt MDLY ... dd 10.54 +1.03 –6.00 –1.40 2.40 ...27.72 7.37 Mednax MD ... dd 24.38 +0.78 –17.94 1.23 1.61 ...121.41 72.13 Medtronic MDT 2.0 45 116.58 –0.23 3.54 ... 5.85 .5889.20 65.25 Merck MRK 3.2 18 80.98 –2.40 3.81 5.61 6.30 .6555.71 33.45 MercuryGeneral MCY 4.7 12 53.38 +0.65 5.78 4.85 3.45 .632535.61 10.01 Meredith MDP .0 dd 19.25 –0.17 ... 2.71 3.77 .595117.06 25.24 MeritageHomes MTH ... 10 95.29 +13.26 6.42 10.39 ... ...29.53 10.91 Meritor MTOR ... 9 28.23 +1.89 3.24 1.88 3.45 ...8.22 3.43 MesaRoyalty MTR 8.5 11 4.62 +0.14 ... ... ... .023729.80 9.76 MesabiTrust MSB 5.1 20 27.94 +0.61 ... 1.51 2.61 .4642.79 21.76 MethodeElec MEI 1.0 12 42.76 +2.61 3.26 ... ... .1153.28 22.85 MetLife MET 3.6 8 50.86 –0.28 6.06 5.67 6.21 .4651.09 15.52 MetropolitanBk MCB ... 8 39.50 +0.47 4.66 4.14 5.63 ...1271.67 579.40 MettlerToledo MTD ... 52 1234.72 +16.28 22.47 25.03 28.12 ...14.52 2.78 MicroFocus MFGP 10.0 dd 5.53 –0.13 3.89 ... ... .5833148.88 82.00 MidAmApt MAA 3.1 48 134.18 +2.17 3.07 2.06 2.27 1.02542.11 25.25 MillerIndustries MLR 1.7 16 41.75 +0.83 3.43 2.00 1.72 .1871.10 27.28 MineralsTechs MTX .3 21 66.53 +0.23 3.78 3.82 4.69 .0512.94 2.77 MistrasGroup MG ... dd 8.49 +0.20 .21 –.27 .24 ...5.28 3.32 MitsubishiUFJ MUFG 4.1 20 4.67 –0.14 .38 .47 ... .11614.91 6.64 MiXTelematics MIXT 1.4 37 13.48 +0.01 .44 .13 .37 .06163.08 1.96 MizuhoFin MFG 4.0 1 2.69 –0.08 3.25 ... ... .071911.00 6.20 MobileTeleSys MBT 7.2 10 9.05 –0.21 .94 65.27 75.00 .185844.56 15.00 ModelN MODN ... dd 38.00 +0.02 –.40 .31 .45 ...14.29 2.84 ModineMfg MOD ... dd 14.06 +0.42 –.04 .87 1.41 ...56.00 22.11 Moelis MC 2.8 43 54.48 –0.71 1.89 2.20 2.61 2.00153.35 56.62 MohawkInds MHK ... 20 149.77 +0.80 10.30 ... ... ...246.72 102.85 MolinaHealthcare MOH ... 17 223.12 +2.38 11.47 ... ... ...80.00 42.00 MolsonCoorsA TAP.A .0 22 59.03 –0.97 ... 4.13 4.20 .5761.94 32.11 MolsonCoorsB TAP .0 19 50.52 –2.02 ... 4.15 4.20 .5717.95 8.42 MonmouthRealEst MNR 4.1 dd 17.70 +0.11 –.50 .37 .42 .1844.48 16.41 MontroseEnvl MEG ... dd 42.49 +2.01 ... –3.03 .49 ...305.96 164.19 Moody's MCO .8 28 266.70 +0.05 7.42 10.16 10.20 .5695.93 32.49 MoogA MOG.A 1.3 cc 77.61 –1.46 ... 4.05 ... .2595.10 33.58 MoogB MOG.B 1.3 cc 77.08 –4.41 ... 4.05 ... .2577.76 27.20 MorganStanley MS 1.9 12 74.13 –1.11 6.46 5.58 6.41 .3529.34 6.50 Mosaic MOS .7 dd 28.33 –0.31 –2.78 .44 1.61 .0511.15 10.20 MotiveCapital MOTV.UT ... ... 11.13 +0.20 ... ... ... ...187.49 120.77 MotorolaSol MSI 1.6 39 173.71 +0.16 4.95 7.58 8.57 .7121.80 8.12 Movado MOV 2.0 dd 20.46 –0.75 ... ... 2.00 .1039.71 16.78 MuellerIndustries MLI 1.0 16 38.18 –0.26 1.79 2.12 2.48 .1013.22 6.64 MuellerWater MWA 1.8 28 12.48 –0.07 .45 .55 .64 .05512.93 6.12 MultiPlan MPLN ... dd 7.49 +0.06 ... –.65 .12 ...3.77 1.02 MultiPlanWt MPLN.WT ... ... 1.40 +0.08 ... ... ... ...24.09 4.50 MurphyOil MUR 4.0 dd 12.52 –2.17 6.98 –1.28 –.46 .125144.09 78.75 MurphyUSA MUSA .8 10 123.87 –0.72 4.86 ... ... .2522.80 6.91 MyersIndustries MYE 2.4 20 22.25 –0.09 .68 .91 1.14 .13530.90 5.98 MyovantSciences MYOV ... dd 20.86 +0.32 –3.37 ... ... ...
N48.88 17.95 NACCOInds NC 3.2 6 23.98 –1.27 ... 13.45 15.50 .192539.30 10.55 NCR NCR ... 10 33.43 –0.48 3.36 ... 2.53 ...11.27 1.15 NGLEnergy NGL 13.4 dd 2.98 +0.08 –4.59 ... ... .1066.99 2.11 NIO NIO ... dd 61.95 +5.68 ... –3.87 ... ...5.40 2.28 NL Industries NL ... 14 4.89 +0.15 .53 ... .65 ...24.75 7.70 NOV NOV .0 dd 13.41 –1.34 –15.96 –.15 –.28 .0510.63 4.03 NOW DNOW ... dd 8.16 –0.72 –.89 –.59 –.28 ...41.73 19.54 NRGEnergy NRG 3.1 3 41.53 +0.71 16.94 ... 4.92 .3254530.00 2043.01 NVR NVR ... 21 4485.91 +475.96 221.13 ... 317.65 ...129.00 9.79 NaborsIndustries NBR .0 dd 60.86 –4.28 –105.50 –86.18 –81.57 .5011.82 3.66 NamTaiProperty NTP ... dd 6.91 +0.02 –.34 1.10 1.38 ...36.62 20.25 NatlBankHoldings NBHC 2.2 13 36.00 +0.31 2.85 ... 2.23 .2046.05 31.58 NationalFuelGas NFG 4.3 dd 41.70 –2.58 –1.41 3.69 4.30 .44569.08 44.29 NationalGrid NGG 5.2 23 60.06 +0.59 2.32 3.50 4.00 1.128591.12 31.37 NatlHealthInv NHI 6.6 16 66.79 –1.06 3.67 4.30 3.62 1.102597.90 66.60 NatlPrestoInds NPK 1.0 15 96.50 +3.66 6.01 8.87 9.64 5.0058.87 24.04 NatlRetailProp NNN 5.2 33 40.22 +0.96 1.56 ... ... .5238.22 19.34 NatlStorage NSA 3.8 92 36.38 –0.48 –.15 .48 .62 .3523.90 7.93 Natura&Co NTCO .0 dd 18.04 –0.61 .09 ... .27 .06712.23 2.62 NaturalGasSvcs NGS ... cc 8.66 –0.48 –1.06 ... ... ...17.39 5.41 NaturalGrocers NGVC 1.8 17 15.41 +0.87 .89 .86 .77 2.0021.26 8.50 NaturalResPtrs NRP 12.0 dd 15.04 –0.83 –4.35 –9.78 2.78 .4515.11 0.37 Natuzzi NTZ ... dd 11.97 –0.48 –3.41 2.86 .26 ...6.00 2.34 NatWest NWG .0 25 4.19 –0.11 .66 –.16 .17 .129628.43 1.20 Nautilus NLS ... 20 21.18 +1.24 –3.13 2.30 1.74 ...12.90 3.80 NavigatorHldgs NVGS ... dd 10.93 –0.05 –.30 ... ... ...7.50 2.09 NaviosMaritime NNA 5.4 1 3.67 –0.19 –4.75 2.74 3.40 .054.11 1.30 NaviosMaritime NM ... dd 3.60 +0.01 –12.43 –6.37 9.43 ...15.38 4.08 NaviosMaritime NMM 1.4 dd 14.12 +0.29 –5.62 .76 3.66 .0545.25 15.01 NavistarIntl NAV ... dd 44.13 +0.21 –3.48 1.95 ... ...11.50 9.92 NavSight NSH.UT ... ... 11.39 +0.34 ... ... ... ...10.70 9.50 NavSightA NSH ... ... 10.53 +0.08 ... ... ... ...2.65 0.63 NavSightWt NSH.WT ... ... 1.78 +0.11 ... ... ... ...72.54 33.44 Neenah NP 3.5 dd 54.15 –1.62 3.26 2.02 2.90 .4774.21 36.70 Nelnet NNI 1.3 17 69.79 –2.43 ... 8.69 7.00 .2212.93 4.65 NeoPhotonics NPTN ... 69 12.24 +0.66 –.36 .28 –.19 ...7.97 1.38 Nesco NSCO ... dd 7.66 +0.31 –.82 –.41 –.35 ...1.18 0.08 NescoWt NSCO.WT ... ... 1.11 +0.16 ... ... ... ...
- Earnings -52-Week Tick - Week’s - Last This Next DivHigh Low Name Sym Yld P/E Last Chg. Year Year Year Amt
- Earnings -52-Week Tick - Week’s - Last This Next DivHigh Low Name Sym Yld P/E Last Chg. Year Year Year Amt
- Earnings -52-Week Tick - Week’s - Last This Next DivHigh Low Name Sym Yld P/E Last Chg. Year Year Year Amt
- Earnings -52-Week Tick - Week’s - Last This Next DivHigh Low Name Sym Yld P/E Last Chg. Year Year Year Amt
For
per
sona
l non
-com
mer
cial
use
onl
y. D
o no
t edi
t or
alte
r. R
epro
duct
ions
not
per
mitt
ed.
To
repr
int o
r lic
ense
con
tent
, ple
ase
cont
act B
arro
n's
repr
ints
dep
artm
ent a
t 800
-843
-000
8 or
ww
w.d
jrepr
ints
.com

January 25, 2021 BARRON’S M17
New York Stock Exchange Composite List
19.82 16.65 Netstreit NTST 4.5 ... 17.77 +0.47 ... –.12 .29 .20188.14 65.05 Nevro NVRO ... dd 175.96 +0.77 –3.37 –2.60 ... ...10.01 7.00 NewFrontierHlth NFH ... dd 8.68 –0.02 ... –.14 .02 ...2.34 0.66 NewFrontierWt NFH.WT ... ... 2.05 –0.06 ... ... ... ...6.00 0.94 NewHome NWHM ... dd 5.56 +0.18 –.40 .37 .47 ...43.82 21.14 NewJerseyRscs NJR 3.8 17 35.43 –2.30 2.04 1.71 2.13 .3325187.43 102.01 NewOrientalEduc EDU ... 67 169.11 –3.70 2.61 ... 4.70 ...80.19 33.49 NewRelic NEWR ... dd 79.36 +3.49 –1.52 –.19 ... ...17.66 2.91 NewResidInvt NRZ 8.2 dd 9.79 +0.39 1.34 ... 1.50 .208.35 1.72 NewSeniorInvt SNR 4.7 dd 5.48 –0.17 ... –.16 –.20 .06530.00 7.60 NewYorkCityReit NYC 4.1 dd 9.82 –0.33 ... ... ... .1011.90 7.72 NYCmntyBcp NYCB 6.2 13 11.04 +0.09 .77 .90 1.09 .1752.40 26.13 NYTimesA NYT .5 53 49.86 +0.84 ... .91 ... .06465.29 304.65 NewMarket NEU 1.8 18 415.34 –7.45 22.73 21.48 23.16 1.9072.22 33.00 Newmont NEM 2.6 19 61.75 –0.11 3.81 ... ... .405.44 0.65 NewparkResources NR ... dd 2.65 –0.20 –.14 ... ... ...10.41 2.57 NexaResources NEXA 4.2 dd 8.90 +0.14 –1.11 –.62 .01 .377520.47 6.34 NexPointRealEst NREF 9.7 ... 16.50 –0.45 ... 1.48 1.75 .4052.87 21.06 NexPointResidentl NXRT 3.1 32 43.49 +0.97 4.03 ... ... .341385.03 43.70 NextEraEnergy NEE 1.7 43 84.21 +2.17 1.94 ... ... .3556.19 46.37 NextEra6.219%Un NEE.PRQ 5.1 ... 54.72 +1.24 ... ... ... .777463.70 35.40 NextEraEnergyUn NEE.PRO 3.8 ... 63.45 +1.53 ... ... ... .60954.96 33.92 NextEraEnergyUn NEE.PRP 4.9 ... 54.20 +1.02 ... ... ... .659986.41 29.01 NextEraEnergy NEP 2.7 dd 84.99 +2.65 –1.51 1.29 ... .5955.84 1.00 NexTierOilfield NEX ... dd 3.59 –0.24 –.86 ... –.94 ...22.53 11.62 NielsenHoldings NLSN 1.1 dd 21.73 –0.40 –1.17 1.57 1.64 .06147.95 60.00 Nike NKE .8 79 139.35 –1.37 ... ... 3.88 .2756.59 0.38 NineEnergy NINE ... dd 2.79 –0.16 –7.43 –3.61 –2.43 ...30.46 19.56 NiSource NI 3.8 dd 21.93 –1.00 .87 1.31 1.35 .2150.00 20.42 NoahHoldings NOAH ... 23 49.58 +0.78 ... ... ... ...5.14 2.34 Nokia NOK ... 29 4.20 +0.12 ... .27 .25 ...26.41 14.08 NomadFoods NOMD ... 22 25.90 +0.50 ... ... ... ...5.85 3.55 NomuraHoldings NMR 3.8 8 5.47 –0.24 .62 ... ... .191345.62 8.92 Norbord OSB 2.0 15 43.08 +3.16 –.51 5.89 5.07 .22569.00 2.30 NordicAmTankers NAT 15.7 5 2.87 –0.11 –.07 .41 .08 .0441.31 11.72 Nordstrom JWN .0 dd 37.37 +1.13 3.18 ... ... .37258.17 112.62 NorfolkSouthern NSC 1.5 31 244.22 –8.73 10.25 ... ... .9411.71 4.11 NorthAmConstr NOA 1.2 9 10.13 –0.13 1.09 1.57 1.45 .03075.74 2.19 NoEuroOil NRT 8.0 11 3.98 +0.47 ... ... ... .0242.71 9.84 NorthernGenesis NGA.UT ... ... 32.07 –8.93 ... ... ... ...35.25 9.60 NorthernGenesis NGA ... ... 27.15 –6.33 ... ... ... ...13.98 0.76 NorthernGenesisWt NGA.WT ... ... 9.98 –3.49 ... ... ... ...12.16 11.19 NorthernGenesisII NGAB.UT ... ... 11.87 +0.22 ... ... ... ...21.00 9.87 NorthernStar STIC.UT ... ... 15.88 –0.44 ... ... ... ...19.54 11.50 NorthernStarAcqn STIC ... ... 14.61 –0.52 ... ... ... ...6.23 2.06 NorthernStarAcqnWt STIC.WT ... ... 3.82 –0.18 ... ... ... ...385.01 263.31 NorthropGrum NOC 1.9 20 298.16 –2.59 13.22 ... ... 1.4577.26 41.71 NorthwestNat NWN 4.4 21 43.24 –1.47 2.07 ... ... .4858.12 7.03 NorwegCruise NCLH ... dd 24.59 –0.79 4.30 –8.47 –5.36 ...99.84 69.18 Novartis NVS 2.1 31 96.90 +1.27 5.13 ... ... 3.087473.92 49.24 NovoNordisk NVO 1.3 27 72.83 +0.80 ... 2.92 3.15 .517859.71 12.31 NuSkinEnts NUS 2.6 20 57.82 +2.13 3.10 3.40 3.82 .37558.52 27.53 Nucor NUE 3.0 39 54.78 –0.69 4.14 ... ... .40529.36 4.98 NuSTAREnergy NS 10.3 dd 15.49 –0.43 –2.30 –2.17 1.24 .4055.12 23.85 Nutrien NTR 3.4 cc 52.70 –0.94 1.70 1.75 2.33 .4528.75 10.54 nVentElectric NVT 3.0 dd 23.63 –0.63 1.29 ... ... .175
O21.66 8.63 OFGBancorp OFG 1.5 23 19.14 –0.98 .92 1.34 1.91 .0746.43 23.01 OGEEnergy OGE 5.1 dd 31.36 +0.06 2.16 2.05 2.19 .402515.64 4.31 O-IGlass OI .0 7 13.29 +0.60 –2.58 1.16 1.61 .0596.97 63.67 ONEGas OGS 3.3 20 70.79 –1.20 3.51 3.66 3.83 .5878.48 12.16 ONEOK OKE 8.7 30 42.84 –1.33 3.07 2.72 2.96 .93564.39 34.98 OakStreetHealth OSH ... dd 54.75 +1.40 ... –.54 –.44 ...11.62 9.69 OaktreeAcqnIIA OACB ... ... 10.87 +0.37 ... ... ... ...12.25 9.97 OaktreeAcqnII OACB.UT ... ... 11.34 +0.71 ... ... ... ...2.58 0.99 OaktreeAcqnIIWt OACB.WT ... ... 2.10 –0.09 ... ... ... ...43.60 8.52 OccidentalPetrol OXY .2 dd 21.49 –0.90 –1.22 –3.81 –2.37 .0111.18 2.29 OccidentalPetrolWt OXY.WT ... ... 9.09 –0.92 ... ... ... ...14.18 2.01 OceaneeringIntl OII ... dd 10.54 –1.04 –3.52 –.49 –.53 ...32.51 4.22 OcwenFinancial OCN ... cc 26.07 –0.21 –15.90 .12 –.24 ...2.41 0.35 Oi OIBR.C ... dd 2.00 –0.24 –1.91 –.02 –.02 ...38.47 28.53 OilDriAmerica ODC 3.1 13 34.04 +0.41 2.65 1.43 1.46 .2613.80 1.52 OilStatesIntl OIS ... dd 6.11 –0.62 –3.90 ... ... ...23.62 11.88 OldRepublic ORI 4.6 17 18.39 –0.47 3.51 1.93 1.75 1.0028.30 8.76 Olin OLN 3.1 dd 25.93 –0.13 –.07 –1.24 .55 .2045.22 13.33 OmegaHealthcare OHI 7.5 54 35.97 +0.12 1.58 .78 1.66 .6711.23 9.88 Omnichannel OCA.UT ... ... 11.23 +0.23 ... ... ... ...10.45 9.91 OmnichannelA OCA ... ... 10.28 +0.06 ... ... ... ...2.00 1.25 OmnichannelWt OCA.WT ... ... 1.92 +0.12 ... ... ... ...80.25 44.50 Omnicom OMC 4.2 14 62.57 –0.55 6.06 5.07 5.51 .6511.96 10.03 one AONE.UT ... ... 11.74 +0.24 ... ... ... ...11.28 9.70 oneA AONE ... ... 11.15 +0.30 ... ... ... ...2.81 0.83 oneWt AONE.WT ... ... 2.30 +0.30 ... ... ... ...29.00 9.71 OneLiberty OLP 8.8 15 20.40 –0.77 .88 ... .78 .4528.80 9.02 OneConnectFinTech OCFT ... dd 22.28 +0.77 –.77 –.55 –.47 ...55.16 12.21 OneMain OMF 3.6 11 50.26 –3.86 6.27 5.67 6.55 .456.84 3.52 OneSmartIntl ONE ... dd 3.89 +0.30 ... .86 2.09 ...58.94 20.32 OntoInnovation ONTO ... dd 57.79 +2.14 .06 1.87 2.58 ...19.18 7.45 Ooma OOMA ... dd 15.22 +0.55 –.89 .43 .35 ...33.55 14.21 OppenheimerA OPY 1.5 7 32.38 –0.20 ... ... ... 1.0066.20 39.71 Oracle ORCL 1.6 18 60.36 –1.42 3.08 4.36 4.35 .2414.61 9.93 Orange ORAN 4.5 10 11.71 –0.11 1.15 ... 1.27 .4736.89 1.53 OrchidIslandCap ORC 14.5 cc 5.37 –0.05 .43 .92 1.06 .06519.20 5.93 OrionEngCarbons OEC .0 37 16.70 –0.18 1.45 1.00 1.38 .206.09 1.53 OrionGroup ORN ... 11 5.85 +0.06 –.18 .58 .35 ...89.21 52.65 Orix IX 3.6 10 83.52 –2.94 10.92 7.78 10.06 1.6762117.93 53.44 OrmatTech ORA .4 71 106.55 –1.48 1.72 ... 1.55 .1196.95 46.72 Oshkosh OSK 1.4 20 94.98 +0.97 4.72 5.33 7.12 .3313.53 4.65 OsiskoGoldRoyal OR 1.3 dd 11.93 +0.10 –1.17 .23 .26 .039112.80 9.40 OspreyTechUn SFTW.UT ... ... 12.36 +1.20 ... ... ... ...11.78 9.11 OspreyTechA SFTW ... dd 11.24 +0.70 ... ... ... ...2.28 0.51 OspreyTechWt SFTW.WT ... ... 1.92 +0.27 ... ... ... ...68.21 38.00 OtisWorldwide OTIS 1.2 32 64.88 –0.65 ... 2.45 2.62 .2031.20 7.07 OutfrontMedia OUT .0 dd 17.90 –1.38 .97 .21 .87 .382.81 1.61 OverseasShip OSG ... 5 2.16 –0.06 .10 ... ... ...19.80 2.10 Ovintiv OVV 2.2 dd 17.15 –0.20 .90 ... ... .093831.90 3.63 Owens&Minor OMI .0 dd 27.57 –0.12 –1.03 1.94 2.46 .002587.89 28.56 OwensCorning OC 1.2 dd 84.55 +1.58 3.68 ... ... .26
16.12 8.09 OwlRock ORCC 9.4 14 13.20 –0.04 1.53 1.31 1.21 .0874.92 30.37 OxfordIndustries OXM 1.4 dd 71.29 –0.11 4.05 ... 2.94 .25
PQ29.58 4.06 PBFEnergy PBF .0 dd 8.28 +0.28 2.64 ... –4.44 .3021.58 3.06 PBFLogistics PBFX 11.9 4 10.06 –0.23 1.71 1.81 1.95 .3018.34 6.25 PG&E PCG ... dd 11.72 –0.52 –14.50 ... ... ...126.76 91.42 PG&EUn PCGU 4.7 ... 117.87 –2.59 ... ... ... 1.37523.81 6.88 PGT Innovations PGTI ... 36 23.52 +0.88 .74 .95 1.16 ...7.51 1.36 PHXMinerals PHX 1.3 dd 3.01 +0.18 –1.41 –.10 –.08 .0181.82 23.63 PJTPartners PJT .3 22 77.78 –1.68 1.21 4.22 4.40 .0530.90 15.91 PLDT PHI 3.8 12 29.35 –1.38 2.01 2.32 2.25 .780611.00 9.88 PMVConsumer PMVC.UT ... ... 10.96 +0.11 ... ... ... ...10.40 9.60 PMVConsumer PMVC ... ... 10.32 +0.02 ... ... ... ...1.94 0.58 PMVConsumerWt PMVC.WT ... ... 1.60 +0.18 ... ... ... ...162.74 79.41 PNCFin PNC 3.0 9 152.57 –2.21 16.96 8.72 11.64 1.1556.14 27.08 PNMResources PNM 2.7 20 48.64 –0.06 .97 2.28 2.33 .327567.39 26.27 POSCO PKX 2.1 24 59.98 –1.62 4.89 ... ... .9031153.81 69.77 PPG Ind PPG 1.6 31 137.82 –10.22 4.45 7.04 7.93 .5436.83 18.12 PPL PPL 6.0 14 27.82 –0.75 2.37 2.42 2.48 .41516.50 8.50 PQGroup PQG .0 48 15.16 –0.25 .59 .68 .81 1.8060.50 11.02 ProgHoldings PRG .0 dd 50.82 –7.80 .46 3.52 3.46 .038166.58 19.73 PROS PRO ... dd 44.31 –0.99 –1.72 ... ... ...172.73 102.48 PSBusinessParks PSB 3.1 33 137.14 –0.04 3.95 3.53 2.99 1.05108.84 28.40 PVH PVH .0 dd 97.79 –2.49 5.60 ... 6.51 .0375148.14 71.05 PackagingCpAm PKG 2.8 28 140.40 –2.13 7.34 5.86 ... 1.0050.26 12.33 PagerDuty PD ... dd 48.87 +3.31 –.77 –.29 –.21 ...59.38 13.58 PagSeguroDig PAGS ... 66 56.09 +3.58 ... 4.28 6.34 ...33.50 8.90 PalantirTech PLTR ... dd 32.58 +6.94 ... .07 .12 ...375.00 125.47 PaloAltoNtwks PANW ... dd 364.62 –0.25 –2.76 ... ... ...14.85 8.72 PampaEnergia PAM ... 7 12.39 –0.44 9.50 1.80 2.87 ...13.99 10.42 PanaceaAcqn PANA.UT ... ... 11.99 +0.09 ... ... ... ...12.52 9.55 PanaceaAcqnA PANA ... ... 11.07 +0.17 ... ... ... ...3.85 1.75 PanaceaAcqnWt PANA.WT ... ... 2.86 +0.15 ... ... ... ...21.35 5.72 ParPacific PARR ... dd 14.04 +0.54 .80 –4.60 –1.16 ...75.89 9.64 ParTechnology PAR ... dd 70.50 +1.89 –.96 –.96 –.51 ...15.00 5.54 ParamountGroup PGRE 3.1 dd 9.00 –0.12 –.16 –.08 –.19 .0717.68 9.14 ParkAerospace PKE 2.8 47 14.29 –0.05 .47 .62 .78 .1024.27 3.99 ParkHotels PK .0 dd 18.16 +0.83 1.44 ... ... .45293.80 93.00 ParkerHannifin PH 1.3 30 275.17 –10.00 9.29 ... 12.36 .8845.40 24.67 Parsons PSN ... 44 38.56 –0.20 1.30 1.95 2.14 ...8.40 0.26 PartyCity PRTY ... dd 7.46 +0.67 –5.71 –.44 .48 ...471.08 163.42 PaycomSoftware PAYC ... cc 409.80 +10.80 3.09 ... ... ...9.87 0.80 PeabodyEnergy BTU ... dd 3.38 –0.58 –2.04 ... ... ...10.09 5.08 Pearson PSO 2.5 23 9.72 +0.55 .43 .37 .51 .077126.04 5.39 PebblebrookHotel PEB .0 dd 20.52 –0.05 .63 ... ... .0140.65 10.58 PembinaPipeline PBA 6.9 23 27.77 +0.39 2.00 1.58 1.79 .16414.75 0.36 PAReit PEI 3.6 dd 2.21 +0.85 ... –.46 –.50 .0270.00 13.14 PennyMacFin PFSI 1.0 4 59.69 +3.16 4.89 21.10 14.29 .1523.79 3.50 PennyMacMtg PMT 10.5 cc 17.98 +0.76 2.42 .15 2.23 .4766.84 19.99 PenskeAuto PAG 2.6 12 65.32 +0.91 5.28 6.21 5.81 .4259.11 22.01 Pentair PNR 1.4 28 57.98 +0.39 2.09 2.44 2.68 .20277.00 121.80 Penumbra PEN ... dd 244.04 +15.58 1.34 –.25 .64 ...54.49 7.41 PerformanceFood PFGC ... dd 51.54 +0.36 –1.01 ... ... ...14.21 9.90 PeridotAcqn PDAC.UT ... ... 14.16 +1.43 ... ... ... ...12.74 9.60 PeridotAcqnA PDAC ... ... 12.50 +1.00 ... ... ... ...3.50 0.66 PeridotAcqnWt PDAC.WT ... ... 3.35 +0.71 ... ... ... ...27.38 25.25 PeriphasCap PCPC.UT ... ... 25.80 –0.27 ... ... ... ...162.70 62.91 PerkinElmer PKI .2 41 151.91 +3.39 2.04 ... ... .074.02 2.11 PermianBasin PBT 6.9 11 3.41 –0.13 .42 1.12 1.29 .01152.06 0.46 PermianvilleRT PVL 14.9 5 1.09 +0.03 ... .17 .05 .00385.76 1.00 PermRock PRT 4.4 13 3.18 +0.06 ... .20 .08 .015963.86 40.01 Perrigo PRGO 2.1 dd 43.29 –0.42 1.07 4.11 4.28 .22531.21 21.50 PershingSquare PSTH ... ... 29.20 –0.52 ... ... ... ...14.00 5.20 PershingSquWt PSTH.WT ... ... 10.30 –0.51 ... ... ... ...29.44 14.03 Perspecta PRSP 1.0 dd 26.89 +0.64 –4.17 2.06 ... .0747.95 27.68 PetroChina PTR 5.0 dd 32.71 –0.34 ... ... ... 1.263615.02 4.01 PetroleoBrasil PBR .9 dd 10.19 –0.71 1.56 –1.63 .94 .086714.21 4.16 PetroleoBrasilA PBR.A ... dd 9.89 –0.72 1.56 –1.57 .89 ...43.08 26.41 Pfizer PFE 4.3 24 36.55 –0.15 2.87 ... 3.00 .3990.17 56.01 PhilipMorris PM 5.9 16 80.68 –0.26 4.61 ... ... 1.20101.99 40.04 Phillips66 PSX 5.0 dd 72.55 +0.81 6.77 –.70 ... .9063.42 19.00 Phillips66Ptrs PSXP 12.3 7 28.55 –2.23 4.29 ... ... .8752.65 1.12 PhoenixNewMedia FENG .0 1 1.53 +0.11 ... –.59 ... 1.371213.90 1.27 PhoenixTree DNK ... ... 2.90 +0.02 ... ... ... ...71.24 16.01 Phreesia PHR ... dd 69.80 +6.84 –4.50 –.46 –.37 ...20.78 11.01 PhysiciansRealty DOC 5.1 41 18.21 +0.27 .39 .31 .36 .2324.78 11.26 PiedmontOfficeA PDM 5.2 5 16.07 –0.38 1.82 1.70 .23 .2116.07 9.89 PineIslandAcqn PIPP.UT ... ... 13.78 –0.90 ... ... ... ...14.94 9.95 PineIslandA PIPP ... ... 12.90 –0.81 ... ... ... ...4.00 1.99 PineIslandWt PIPP.WT ... ... 3.32 –0.16 ... ... ... ...37.80 12.02 PingIdentity PING ... dd 32.30 +2.60 –.02 ... ... ...105.51 60.05 PinnacleWest PNW 4.3 14 77.09 –1.46 4.77 5.07 5.00 .8376.88 10.10 Pinterest PINS ... dd 73.08 +3.33 –3.24 .28 .64 ...147.24 48.62 PioneerNatRscs PXD 1.7 cc 131.16 +3.78 4.50 ... ... .55106.67 31.95 PiperSandler PIPR 1.5 40 101.65 –2.02 7.69 7.82 7.88 .3758.15 1.67 PitneyBowes PBI 2.8 dd 7.19 –0.25 1.10 .64 .39 .0588.77 23.77 PlanetFitness PLNT ... cc 79.33 –1.76 1.41 .09 1.46 ...34.64 4.60 Plantronics PLT .0 dd 33.28 +0.49 –20.86 ... ... .1511.13 0.70 PlayAGS AGS ... dd 5.83 –0.45 –.33 ... ... ...21.50 7.79 PlymouthIndREIT PLYM 5.3 dd 15.17 +0.20 –2.88 –1.53 –.83 .20121.35 37.35 Polaris PII 2.1 cc 118.73 +10.81 5.20 7.31 ... .6210.69 10.31 Pontem PNTM.UT ... ... 10.48 +0.01 ... ... ... ...63.08 31.96 PortlandGenElec POR 3.9 23 41.79 –1.53 2.39 1.56 ... .4075111.48 68.97 PostHoldings POST ... dd 98.94 +0.12 .01 3.76 4.95 ...19.48 10.84 PostalRealty PSTL 4.9 dd 16.24 +0.04 –.30 ... ... .21529.60 5.44 PrecisionDrilling PDS ... dd 20.89 –2.21 .30 –7.32 ... ...13.55 5.01 PrefApartment APTS 9.2 dd 7.57 –0.29 –2.73 –3.08 –3.58 .17546.12 27.40 PrestigeCnsHlth PBH ... 12 38.08 +0.56 2.78 3.18 3.30 ...14.55 4.05 PretiumResources PVG ... 22 10.51 +0.01 .22 .81 1.04 ...11.10 10.00 PrimaveraCap PV.UT ... ... 10.87 ... ... ... ... ...11.17 9.85 PrimeImpactI PIAI.UT ... ... 11.07 +0.22 ... ... ... ...10.98 9.51 PrimeImpactIA PIAI ... ... 10.54 +0.13 ... ... ... ...1.99 0.85 PrimeImpactIWt PIAI.WT ... ... 1.85 +0.19 ... ... ... ...141.34 61.20 Primerica PRI 1.2 15 135.98 –2.07 8.62 ... 10.86 .4016.70 6.33 PrimoWater PRMW 1.5 dd 16.13 –0.17 .02 .51 .49 .0634.18 12.67 ProAssurance PRA 1.0 dd 19.42 –0.73 .02 ... ... .05146.92 94.34 Procter&Gamble PG 2.4 25 130.00 –4.78 4.96 5.67 6.06 .7907102.05 62.18 Progressive PGR .4 11 92.31 –2.49 6.72 ... 5.47 4.50
112.37 59.82 Prologis PLD 2.3 46 101.22 +3.54 ... ... ... .5811.02 1.36 ProPetro PUMP ... dd 8.31 +0.44 1.57 –.80 –.51 ...16.26 7.26 ProSightGlobal PROS ... 16 12.63 –0.12 ... .85 1.29 ...75.22 42.02 ProsperityBcshs PB 2.8 13 70.25 +0.72 4.52 ... ... .49203.88 63.19 ProtoLabs PRLB ... 92 192.95 +24.32 2.35 2.48 2.61 ...24.25 9.05 ProvidentFinSvcs PFS 4.7 16 19.37 +0.16 1.74 1.23 1.39 .2397.24 38.62 PrudentialFin PRU 5.3 dd 82.62 –0.99 10.11 ... 11.72 1.1039.75 15.68 Prudential PUK 1.6 dd 38.25 –0.75 .61 3.42 3.63 .107462.15 34.75 PublicServiceEnt PEG 3.4 15 58.36 –1.02 3.33 ... 3.45 .49240.75 155.37 PublicStorage PSA 3.6 34 222.79 –1.60 7.29 6.60 7.36 2.0049.70 17.12 PulteGroup PHM 1.1 10 48.89 +6.19 3.66 4.88 5.94 .1424.63 7.93 PureStorage PSTG ... dd 22.98 +0.12 –.79 ... .28 ...12.39 3.62 Puxin NEW ... dd 6.94 +1.20 –.88 3.23 8.87 ...8.90 3.46 PzenaInvtMgmt PZN 1.4 43 8.57 +0.13 .46 .70 .75 .033.41 0.26 QEPResources QEP .0 29 3.13 +0.20 –.41 .33 –.29 .0272.60 42.64 QTSRealty QTS 2.9 dd 64.07 +2.48 ... ... ... .47139.81 47.17 Q2Holdings QTWO ... dd 139.69 +10.58 –1.53 .11 .29 ...55.27 32.97 Qiagen QGEN ... 66 54.33 +1.13 –.18 2.10 ... ...6.97 2.00 QuadGraphics QUAD .0 dd 4.02 –0.53 ... .45 .43 .15283.54 108.14 QuakerChemical KWR .6 cc 273.90 +2.63 2.08 ... 6.93 .39526.59 7.90 QuanexBldg NX 1.3 21 25.20 –0.37 1.17 1.35 ... .0879.86 23.77 QuantaServices PWR .3 29 77.66 +1.50 ... 3.60 ... .06132.73 9.74 QuantumScape QS ... ... 49.68 –4.31 ... –.13 ... ...43.48 0.74 QuantumScapeWt QS.WT ... ... 33.48 –3.02 ... ... ... ...3.42 1.17 Qudian QD ... 10 2.12 +0.31 1.70 1.77 ... ...131.81 73.02 QuestDiag DGX 1.8 15 124.46 +0.07 6.28 10.49 10.62 .5610.99 4.55 QuotientTech QUOT ... dd 10.19 +0.32 –.41 –.51 –.09 ...
R27.26 16.81 RELX RELX 2.3 31 25.54 +0.76 .99 ... 1.18 .172540.78 14.40 RE/MAX RMAX 2.2 57 39.66 +1.28 1.40 1.85 2.18 .2211.92 3.50 REV REVG .0 dd 11.31 +2.18 –.48 .55 .93 .05524.02 73.14 RH RH ... 64 502.02 –5.34 9.07 ... 19.25 ...110.59 66.02 RLI RLI 1.0 36 101.02 –0.86 4.23 2.51 2.69 1.0016.60 3.88 RLJLodging RLJ .3 dd 14.28 –0.26 .59 –2.68 –1.61 .0130.97 12.00 RLXTech RLX ... ... 29.51 ... ... ... ... ...5.25 1.72 RPC RES ... dd 3.87 +0.04 –.41 –.31 ... ...98.35 42.85 RPM RPM 1.7 26 86.97 +0.70 2.34 4.26 4.69 .3814.94 4.62 RPTRealty RPT .0 14 9.43 –0.06 1.04 ... .14 .223.23 0.72 RRDonnelley RRD .0 dd 2.50 –0.03 –1.31 .88 .40 .035.81 2.21 RYBEducation RYB ... dd 2.45 –0.14 ... .11 .05 ...25.89 9.53 RadianGroup RDN 2.4 10 20.67 –1.02 3.20 1.66 2.66 .12527.75 9.40 Rafael RFL ... dd 26.05 +0.80 ... ... ... ...128.29 59.82 RalphLauren RL .0 dd 108.47 –1.60 ... ... 6.49 .687510.31 1.61 RangeResources RRC ... dd 8.70 –1.50 –6.92 –.06 .88 ...7.51 2.27 RangerEnergySvcs RNGR ... dd 4.64 –0.16 .21 –1.11 –.68 ...17.77 5.70 Ranpak PACK ... dd 17.55 +1.64 ... –.22 .07 ...105.18 54.21 RaymondJames RJF 1.5 18 102.04 –0.90 5.83 ... 7.81 .398.63 0.90 RayonierAdvMatls RYAM ... dd 7.42 +0.04 –.57 –.23 –.57 ...32.21 15.96 Rayonier RYN 3.4 97 32.02 +0.88 .46 .22 ... .2793.45 40.71 RaytheonTech RTX 2.8 dd 67.58 –1.62 6.41 ... ... .47516.90 3.92 ReadyCapital RC 11.3 18 12.38 +0.74 1.72 1.67 1.47 .3516.50 2.09 Realogy RLGY ... dd 16.00 +0.38 –1.65 ... ... ...84.92 38.00 RealtyIncome O 4.7 50 59.84 +1.19 1.38 ... 1.39 .23453.48 1.16 RedLionHotels RLH ... dd 3.47 +0.01 –.76 ... ... ...14.12 10.03 RedBallAcqn RBAC.UT ... ... 11.43 –0.57 ... ... ... ...12.40 9.90 RedBallAcqnA RBAC ... ... 10.83 –0.26 ... ... ... ...3.29 1.29 RedBallAcqnWt RBAC.WT ... ... 2.00 –0.64 ... ... ... ...18.01 2.14 RedwoodTrust RWT 6.0 dd 9.27 +0.62 1.46 ... .84 .14146.97 51.99 RegalBeloit RBC .9 31 133.60 –1.76 5.66 4.34 6.76 .3032.55 10.33 RegionalMgmt RM 2.6 12 30.93 –0.68 3.80 ... ... .2018.71 6.94 RegionsFin RF 3.5 22 17.74 –0.49 1.50 1.58 1.71 .15517.74 4.22 Regis RGS ... dd 9.23 +0.66 –4.77 ... ... ...156.32 55.39 ReinsGrp RGA 2.5 14 110.18 –1.15 13.62 7.54 10.87 .7015.08 10.66 ReinventTechPtrs RTP.UT ... ... 15.08 +2.27 ... ... ... ...13.99 10.35 ReinventTechA RTP ... ... 13.95 +2.05 ... ... ... ...4.40 1.98 ReinventTechWt RTP.WT ... ... 4.21 +0.85 ... ... ... ...13.49 10.70 ReinventTechZ RTPZ.UT ... ... 13.37 +0.92 ... ... ... ...12.98 11.04 ReinventTechZA RTPZ ... ... 12.71 +0.86 ... ... ... ...4.00 3.02 ReinventTechZWt RTPZ.WT ... ... 3.41 +0.31 ... ... ... ...135.33 70.57 RelianceSteel RS 2.0 21 126.22 –1.41 10.34 ... ... .625202.68 113.27 RenaissanceRe RNR .9 12 155.04 –4.70 16.29 ... 15.05 .3535.77 0.85 ReneSola SOL ... dd 33.55 +11.06 ... .01 .31 ...8.20 0.45 Renren RENN ... ... 5.70 –0.33 ... –1.65 –1.65 ...10.95 9.49 ReplayAcqn RPLA ... cc 10.24 –0.01 ... ... ... ...12.53 9.60 ReplayAcqnUn RPLA.UT ... ... 11.04 –0.05 ... ... ... ...2.31 0.45 ReplayAcqnWt RPLA.WT ... ... 1.55 –0.24 ... ... ... ...103.79 65.37 RepublicSvcs RSG 1.8 30 94.40 +0.59 3.33 3.38 3.68 .42526.09 3.72 ResideoTech REZI ... dd 25.06 +0.07 .29 ... 1.38 ...224.24 108.85 ResMed RMD .7 46 215.52 +3.90 4.27 ... ... .398.61 1.14 ResoluteForest RFP ... dd 8.09 +0.56 –.51 .78 ... ...67.33 25.08 RestaurantBrands QSR 3.5 33 60.08 –2.83 ... 2.16 2.78 .5213.25 2.87 RetailPropofAmer RPAI 2.6 70 9.36 –0.10 .15 .07 .07 .0635.53 8.32 RetailValue RVI 7.4 dd 15.71 –0.03 2.46 –5.54 –1.04 1.1623.09 3.96 Revlon REV ... dd 10.18 –0.24 –2.97 ... ... ...36.47 7.17 Revolve RVLV ... 56 36.21 +1.00 –.09 .63 .68 ...97.16 33.81 RexAmerRes REX ... cc 88.52 +2.76 1.18 –.55 7.68 ...53.48 31.79 RexfordIndlRealty REXR 1.7 86 49.68 +2.02 .47 .46 .28 .21549.08 18.87 Rexnord RXN .8 34 42.28 –0.64 1.45 ... ... .0816.20 10.96 RibbitLeapA LEAP ... ... 15.00 –0.33 15.08 –4.40 –3.13 ...16.79 11.03 RibbitLeapUn LEAP.UT ... ... 15.61 –0.37 ... ... ... ...7.70 2.63 RibbitLeapWt LEAP.WT ... ... 4.99 +0.18 ... ... ... ...14.43 9.91 RiceAcqn RICE.UT ... ... 13.80 +1.74 ... ... ... ...12.95 10.20 RiceAcqnA RICE ... ... 12.32 +1.23 ... ... ... ...3.43 1.60 RiceAcqnWt RICE.WT ... ... 3.12 +0.81 ... ... ... ...405.46 134.85 RingCentral RNG ... dd 384.52 +11.59 ... .96 1.16 ...86.90 35.35 RioTinto RIO 4.7 18 81.40 +0.93 ... 7.29 9.13 1.5578.64 25.92 RitchieBros RBA 1.4 40 63.04 +2.57 1.37 1.73 2.01 .2222.45 8.86 RiteAid RAD ... dd 19.78 +1.53 –8.50 .49 .74 ...69.00 32.38 RobertHalf RHI 2.0 24 68.31 +4.52 3.90 ... 3.08 .3434.42 17.50 RocketCos. RKT ... 1 20.05 +0.45 ... 3.85 1.89 ...268.91 115.38 Rockwell ROK 1.6 30 265.97 +10.37 8.77 8.70 9.49 1.0751.02 32.20 RogersCommB RCI 3.1 20 48.29 +0.69 ... 2.64 3.04 .3729184.82 75.72 Rogers ROG ... cc 167.97 –1.17 2.53 4.92 6.24 ...43.00 20.48 Rollins ROL .6 73 37.02 –0.22 .41 .57 .53 .053338.90 9.50 RomeoPower RMO ... cc 19.31 –2.77 .13 –.32 –.45 ...17.47 0.40 RomeoPowerWt RMO.WT ... ... 7.57 –2.38 ... ... ... ...455.72 240.00 RoperTech ROP .5 28 419.22 +7.60 16.82 12.65 14.57 .562510.75 10.42 RotorAcqn ROT.UT ... ... 10.49 +0.03 ... ... ... ...
86.14 49.55 RoyalBkCanada RY 4.0 14 84.30 –0.76 5.83 6.78 7.40 .8351129.04 19.25 RoyalCaribbean RCL .0 dd 71.96 –0.96 8.95 –18.41 –13.25 .7857.38 21.26 RoyalDutchA RDS.A 4.1 dd 39.28 –0.91 ... 1.96 2.74 .33358.68 19.19 RoyalDutchB RDS.B 5.1 dd 37.35 –0.80 ... 1.30 2.74 .33326.55 9.51 RushStreetInt RSI ... dd 23.89 –0.35 ... –.59 ... ...13.35 0.60 RushStreetIntWt RSI.WT ... ... 11.72 +0.91 ... ... ... ...69.95 22.62 RyderSystem R 3.3 dd 68.24 +0.78 –.47 ... ... .5618.52 3.76 RyersonHolding RYI ... dd 13.76 –0.58 2.17 ... 1.37 ...91.56 13.25 RymanHospitality RHP .0 dd 66.63 –1.13 2.81 –8.07 –4.28 .95
S169.30 90.90 SAP SAP 1.0 28 127.48 +2.48 ... 6.41 5.92 1.7119379.87 186.06 S&PGlobal SPGI .9 32 315.14 +9.19 8.60 ... ... .6712.12 9.76 SCHealth SCPE.UT ... ... 11.58 +0.29 ... ... ... ...10.79 9.50 SCHealth SCPE ... cc 10.51 +0.13 .08 ... ... ...2.18 0.81 SCHealthWt SCPE.WT ... ... 1.83 –0.02 ... ... ... ...11.77 9.25 SCVX SCVX.UT ... ... 11.47 –0.12 ... ... ... ...12.37 9.20 SCVX SCVX ... ... 10.69 –0.01 ... ... ... ...1.95 0.33 SCVXWt SCVX.WT ... ... 1.94 +0.14 ... ... ... ...43.73 22.23 Seacor CKH ... 83 43.66 +1.66 1.38 ... ... ...11.83 1.46 SeacorMarine SMHI ... dd 2.97 –0.25 –3.95 –2.30 –2.60 ...14.12 5.85 SFL SFL 9.0 ... 6.70 –0.19 .83 .77 .55 .1528.96 17.03 SINOPEC SHI 6.4 dd 22.88 +0.21 ... ... ... 1.477413.61 3.60 SITECenters SITC 1.8 71 11.37 –0.07 .33 ... ... .0574.99 45.60 SJWGroup SJW 1.9 45 67.61 +1.34 .82 2.06 ... .3227.30 14.07 SKTelecom SKM 2.8 19 25.70 +0.66 1.16 ... ... .893498.73 36.19 SLGreenRealty SLG 6.0 26 62.85 –1.13 3.19 2.25 ... .303310.40 0.90 SMEnergy SM .2 dd 8.92 +0.47 –1.66 –.21 –1.10 .014.77 0.51 SOS SOS ... ... 2.11 –0.06 ... –1.23 3.20 ...60.06 25.50 SPX SPXC ... 25 59.87 +2.56 1.58 2.84 3.12 ...63.69 15.74 SPXFLOW FLOW ... dd 55.13 +0.10 –2.23 1.13 1.95 ...36.49 12.98 SQZBiotech SQZ ... dd 26.17 –2.53 ... –3.70 –2.38 ...34.50 17.54 STAG Indl STAG 4.7 38 31.06 +0.46 .35 .76 .38 .120840.11 13.00 StoreCapital STOR 4.5 36 31.71 +0.85 1.24 ... ... .3641.19 23.02 SabineRoyalty SBR 7.4 12 30.38 +0.08 3.02 2.96 3.04 .16711.99 0.74 SafeBulkers SB ... dd 1.83 +0.01 .04 –.25 .20 ...11.11 4.43 SafeguardSci SFE ... dd 6.82 +0.23 2.64 –1.22 –.93 ...76.76 38.85 Safehold SAFE .9 67 76.10 +1.18 .89 ... ... .162259.62 11.61 SailPointTechs SAIL ... dd 58.90 +2.59 –.10 ... ... ...284.50 115.29 Salesforce.com CRM ... 59 225.77 +12.63 .15 3.09 3.49 ...16.56 6.28 SallyBeauty SBH ... 14 13.99 +0.56 .99 1.89 2.07 ...4.25 1.39 SanJuanBasin SJT 5.0 33 3.76 +0.51 ... 1.75 2.09 .058611.25 9.56 SandbridgeAcqn SBG.UT ... ... 11.25 +0.27 ... ... ... ...10.48 9.64 SandbridgeAcqnA SBG ... ... 10.45 +0.03 ... ... ... ...1.88 0.56 SandbridgeAcqnWt SBG.WT ... ... 1.56 +0.16 ... ... ... ...5.27 0.70 SandRidgeEnergy SD ... dd 4.70 –0.31 –12.68 –1.09 1.09 ...10.63 3.32 SandstormGold SAND ... cc 6.64 –0.01 .09 ... ... ...27.21 9.74 SantanderCons SC 3.8 14 23.40 –0.22 2.86 2.30 2.44 .2227.94 5.94 SaratogaInvt SAR 6.9 8 23.80 +1.67 5.98 2.11 ... .4218.43 1.25 Sasol SSL ... dd 10.67 –0.06 ... .78 1.52 ...57.16 23.49 SaulCenters BFS 6.7 25 31.53 –0.31 1.57 1.75 1.47 .5336.22 11.87 Schlumberger SLB 2.0 dd 24.41 –0.50 –7.57 .89 1.33 .12528.13 15.36 SchneiderNatl SNDR 1.1 22 23.35 +0.63 ... 1.21 1.55 .06562.04 28.00 SchwabC SCHW 1.2 28 58.40 –0.35 2.12 2.68 2.85 .1844.29 20.00 SchweitzerMaud SWM 4.3 15 41.35 –0.67 2.76 3.47 3.45 .44101.89 45.45 ScienceApplicat SAIC 1.5 29 100.90 +2.59 3.83 6.11 7.35 .3747.80 10.70 ScorpioBulkers SALT 1.1 dd 17.67 –0.05 6.60 ... –.57 .0530.97 8.28 ScorpioTankers STNG 3.3 4 12.08 –1.70 –.97 2.22 1.20 .10231.67 76.50 ScottsMiracleGro SMG 1.1 34 231.00 +10.11 6.81 8.28 8.69 .6211.24 3.53 ScullyRoyalty SRL ... dd 7.29 –0.20 –1.12 –.17 .22 ...28.85 8.86 SculptorCapMgmt SCU .0 dd 17.96 +0.09 1.57 ... 3.14 .53238.42 35.61 Sea SE ... dd 236.49 +10.44 ... ... ... ...22.86 5.25 SeabridgeGold SA ... dd 19.91 +0.12 –.14 –.12 –.17 ...47.90 17.06 SealedAir SEE 1.4 15 45.50 +1.10 1.69 3.08 3.24 .1636.96 6.75 SeaWorldEnt SEAS ... dd 30.21 +0.57 1.10 –4.09 –.76 ...7.56 2.22 SelectEnergySvcs WTTR ... dd 5.56 –0.30 .03 –.97 –.62 ...31.30 10.00 SelectMedical SEM ... 18 28.40 –0.12 1.10 1.62 1.64 ...29.00 15.76 SelectQuote SLQT ... ... 24.99 +1.45 –.16 .85 1.20 ...161.87 88.00 SempraEnergy SRE 3.4 9 121.45 –0.71 7.29 ... ... 1.04561.64 18.25 SensataTechs ST ... 96 57.84 +3.12 1.76 2.66 3.44 ...78.69 38.24 SensientTech SXT 2.0 48 76.24 +1.11 1.94 2.77 2.99 .398.39 3.31 SequansComms SQNS ... ... 8.10 +0.85 –1.56 –1.16 –.37 ...40.14 5.00 SeritageGrowth SRG ... dd 15.41 +0.48 –1.77 ... ... ...52.99 33.93 ServiceCorp SCI 1.6 20 51.09 +1.05 1.99 2.60 2.57 .21566.74 238.93 ServiceNow NOW ... cc 541.09 +27.33 3.18 ... 5.43 ...116.65 30.01 ShakeShack SHAK ... dd 111.21 –0.05 .61 –.67 .29 ...20.12 12.20 ShawCommB SJR 5.2 18 17.49 –0.17 ... 1.05 1.13 .077621.53 5.70 ShellMidstream SHLX 16.7 9 11.04 –0.39 1.66 1.31 1.47 .46758.00 325.43 SherwinWilliams SHW .7 36 732.17 +6.62 16.49 21.66 26.77 1.3476.95 30.00 Shift4Paymts FOUR ... dd 71.13 +1.06 ... –.85 .32 ...35.56 17.09 ShinhanFin SHG 3.9 5 29.79 –0.53 6.00 ... 5.56 1.67381285.19 305.30 Shopify SHOP ... cc 1196.70 +26.23 ... ... ... ...77.07 28.76 Shutterstock SSTK 1.2 51 70.95 +1.00 .57 2.32 2.43 .2117.44 3.50 Sibanye-Stillwater SBSW .6 21 16.68 +0.61 .01 2.40 3.64 .095942.91 5.60 SignetJewelers SIG .0 dd 36.31 –3.05 1.40 ... 3.80 .378.06 1.50 SilverBowRscs SBOW ... dd 5.71 –0.11 9.74 2.43 4.28 ...81.43 7.60 SilvergateCapital SI ... 56 76.16 +8.12 ... ... ... ...147.80 42.25 SimonProperty SPG 5.4 20 95.49 +2.49 ... ... ... 1.30105.89 47.02 SimpsonMfg SSD .9 24 102.97 +3.48 2.98 4.24 4.33 .23177.09 53.29 SiteOneLandscape SITE ... 69 176.87 +11.47 1.82 2.53 2.82 ...39.79 8.75 SixFlags SIX .0 dd 35.36 –1.15 2.11 –4.87 ... .2544.50 17.06 SkechersUSA SKX ... 54 36.56 –0.10 ... ... ... ...29.94 9.81 Skillz SKLZ ... ... 28.01 +3.27 ... –.30 –.28 ...17.06 1.35 SkillzWt SKLZ.WT ... ... 14.80 +2.30 ... ... ... ...37.03 10.82 SkylineChamp SKY ... 38 35.07 +2.53 1.02 1.04 1.33 ...44.15 15.10 SlackTech WORK ... dd 42.65 +0.85 ... –.07 ... ...75.49 30.91 Smartsheet SMAR ... dd 72.54 +2.27 –.85 –.42 ... ...58.97 33.81 SmithAO AOS 1.8 30 57.76 +0.93 ... 2.00 2.38 .2652.26 26.07 Smith&Nephew SNN 1.6 51 45.35 +2.42 1.38 1.34 ... .288125.62 91.88 Smucker SJM 3.2 15 114.24 +0.15 6.84 8.69 ... .9057.39 7.89 Snap SNAP ... dd 53.57 +3.26 –.75 –.63 ... ...183.23 90.72 SnapOn SNA 2.8 17 177.98 +9.41 12.41 10.00 10.70 1.23429.00 208.55 Snowflake SNOW ... dd 285.68 –5.62 ... –.89 –.66 ...9.43 1.85 SocialCapHedVWt IPOE.WT ... ... 8.21 +0.51 ... ... ... ...19.47 10.56 SocialCapHedIV IPOD.UT ... ... 18.47 +1.79 ... ... ... ...5.73 2.43 SocialCapHedosIVWt IPOD.WT ... ... 5.59 +0.60 ... ... ... ...18.14 10.85 SocialCapHedIVA IPOD ... ... 17.20 +1.65 ... ... ... ...26.85 10.18 SocialCapHedV IPOE.UT ... ... 23.73 +1.96 ... ... ... ...
- Earnings -52-Week Tick - Week’s - Last This Next DivHigh Low Name Sym Yld P/E Last Chg. Year Year Year Amt
- Earnings -52-Week Tick - Week’s - Last This Next DivHigh Low Name Sym Yld P/E Last Chg. Year Year Year Amt
- Earnings -52-Week Tick - Week’s - Last This Next DivHigh Low Name Sym Yld P/E Last Chg. Year Year Year Amt
- Earnings -52-Week Tick - Week’s - Last This Next DivHigh Low Name Sym Yld P/E Last Chg. Year Year Year Amt
For
per
sona
l non
-com
mer
cial
use
onl
y. D
o no
t edi
t or
alte
r. R
epro
duct
ions
not
per
mitt
ed.
To
repr
int o
r lic
ense
con
tent
, ple
ase
cont
act B
arro
n's
repr
ints
dep
artm
ent a
t 800
-843
-000
8 or
ww
w.d
jrepr
ints
.com
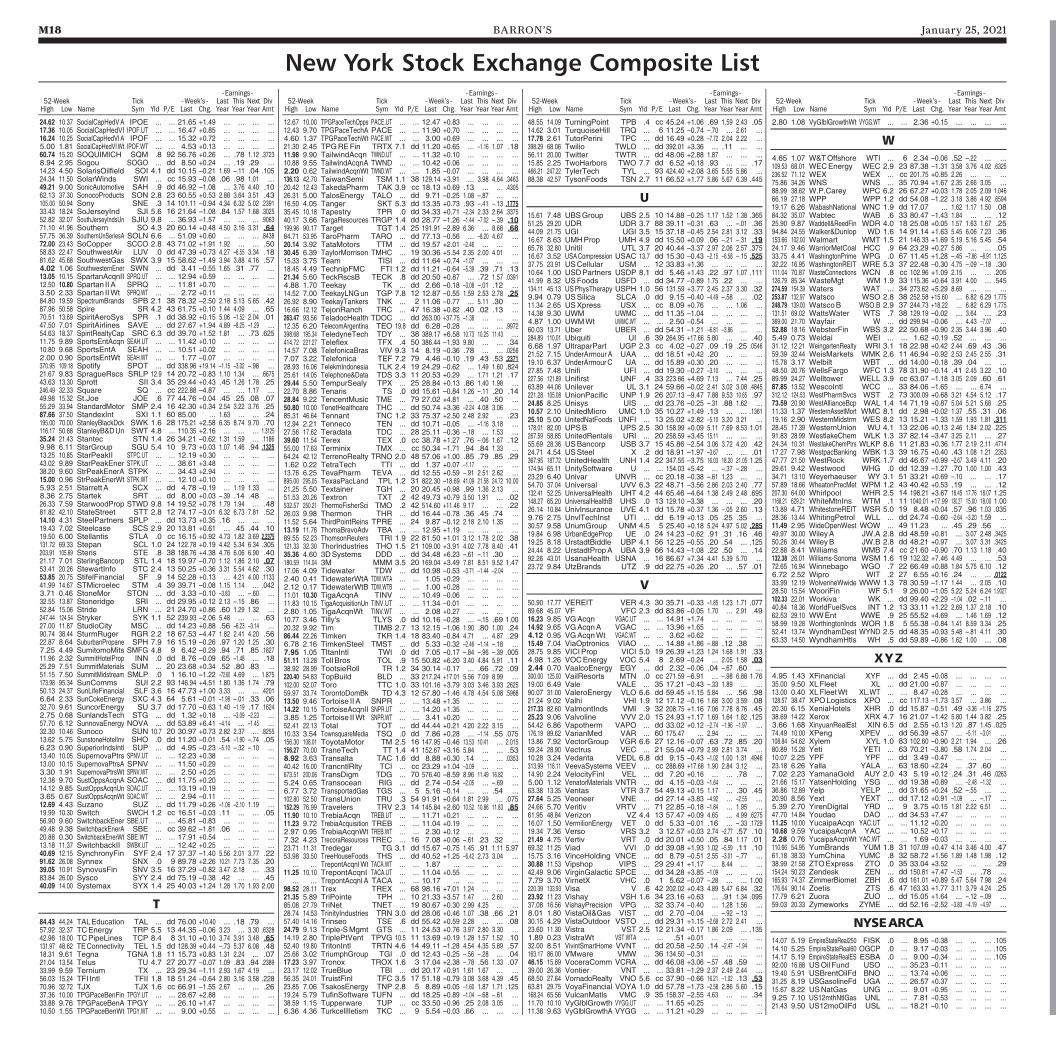
M18 BARRON’S January 25, 2021
New York Stock Exchange Composite List
24.62 10.37 SocialCapHedVA IPOE ... ... 21.65 +1.49 ... ... ... ...17.36 10.05 SocialCapHedVI IPOF.UT ... ... 16.47 +0.85 ... ... ... ...16.24 10.25 SocialCapHedVIA IPOF ... ... 15.32 +0.72 ... ... ... ...5.00 1.81 SocialCapHedVIWt IPOF.WT ... ... 4.53 +0.13 ... ... ... ...60.74 15.20 SOQUIMICH SQM .8 92 56.76 +0.26 ... .78 1.12 .37238.94 2.95 Sogou SOGO ... dd 8.50 +0.24 ... .19 .29 ...14.23 4.50 SolarisOilfield SOI 4.1 dd 10.15 –0.21 1.69 –.11 .04 .10524.34 11.50 SolarWinds SWI ... cc 15.93 –0.08 .06 .98 1.01 ...49.21 9.00 SonicAutomotive SAH .9 dd 46.92 –1.08 ... 3.76 4.40 .1062.13 37.30 SonocoProducts SON 2.8 23 60.55 +0.53 2.88 3.64 3.51 .43105.00 50.94 Sony SNE .3 14 101.11 –0.94 4.34 6.32 5.02 .239133.43 18.24 SoJerseyInd SJI 5.6 16 21.64 –1.08 .84 1.57 1.68 .302552.82 32.07 SouthJerseyIndsUn SJIU 9.8 ... 36.93 –1.57 ... ... ... .906371.10 41.96 Southern SO 4.3 20 60.14 +0.48 4.50 3.16 3.31 .6457.75 36.39 SouthernUnSeriesA SOLN 6.6 ... 51.09 +0.60 ... ... ... .843872.00 23.43 SoCopper SCCO 2.8 43 71.02 +1.91 1.92 ... ... .5058.83 22.47 SouthwestAir LUV .0 dd 47.39 +0.73 4.27 –6.55 3.34 .1881.62 45.68 SouthwestGas SWX 3.9 15 58.62 –1.49 3.94 3.88 4.16 .574.02 1.06 SouthwesternEner SWN ... dd 3.41 –0.55 1.65 .31 .77 ...13.05 10.15 SpartanAcqnII SPRQ.UT ... ... 12.94 +0.59 ... ... ... ...12.50 10.80 Spartan IIA SPRQ ... ... 11.81 +0.70 ... ... ... ...3.50 2.33 Spartan IIWt SPRQ.WT ... ... 2.72 +0.11 ... ... ... ...84.80 19.59 SpectrumBrands SPB 2.1 38 78.32 –2.50 2.18 5.13 5.65 .4287.96 50.58 Spire SR 4.2 43 61.75 +0.10 1.44 4.09 ... .6570.51 13.69 SpiritAeroSys SPR .1 dd 38.92 +0.15 5.06 –1.52 2.04 .0147.50 7.01 SpiritAirlines SAVE ... dd 27.67 +1.94 4.89 –8.25 –1.29 ...54.63 18.37 SpiritRealtyCap SRC 6.3 dd 39.70 +1.52 1.81 ... .73 .62511.75 9.89 SportsEntAcqn SEAH.UT ... ... 11.42 +0.10 ... ... ... ...10.80 9.68 SportsEntA SEAH ... ... 10.51 +0.02 ... ... ... ...2.00 0.90 SportsEntWt SEAH.WT ... ... 1.77 –0.07 ... ... ... ...370.95 109.18 Spotify SPOT ... dd 338.96 +19.14 –1.15 –3.02 –.98 ...21.67 9.83 SpragueRscs SRLP 12.9 14 20.72 –0.83 1.10 1.34 ... .667543.63 13.30 Sprott SII 3.4 35 29.44 +0.43 .45 1.26 1.78 .25246.49 32.33 Square SQ ... cc 222.88 –4.87 ... ... 1.17 ...49.98 15.32 St.Joe JOE .6 77 44.76 –0.04 .45 .25 .08 .0755.29 33.94 StandardMotor SMP 2.4 16 42.30 +0.34 2.54 3.22 3.76 .2587.66 37.50 StandexInt SXI 1.1 60 85.00 ... 1.63 ... ... .24195.00 70.00 StanleyBlackDck SWK 1.6 28 175.21 +2.58 6.35 8.74 9.70 .70116.17 50.68 StanleyB&DUn SWT 4.8 ... 110.35 +2.16 ... ... ... 1.312535.24 21.43 Stantec STN 1.4 26 34.21 –0.62 1.31 1.59 ... .11869.98 6.11 StarGroup SGU 5.4 10 9.73 +0.03 1.07 1.46 .94 .132513.25 10.85 StarPeakII STPC.UT ... ... 12.19 +0.30 ... ... ... ...43.02 9.89 StarPeakEner STPK.UT ... ... 38.61 +3.48 ... ... ... ...38.20 9.60 StrPeakEnerA STPK ... ... 34.43 +2.94 ... ... ... ...15.00 0.96 StrPeakEnerWt STPK.WT ... ... 12.10 +0.10 ... ... ... ...5.93 2.51 Starrett A SCX ... dd 4.78 –0.19 ... 1.19 1.33 ...8.36 2.75 Startek SRT ... dd 8.00 +0.03 –.39 .14 .48 ...26.33 7.59 StarwoodProp STWD 9.8 14 19.52 +0.78 1.79 1.94 ... .4881.82 42.10 StateStreet STT 2.8 12 74.17 –3.01 6.32 6.73 7.81 .5214.10 4.31 SteelPartners SPLP ... dd 13.73 +0.35 .16 ... ... ...19.43 7.02 Steelcase SCS 2.9 20 13.81 +0.61 ... .45 .44 .1019.50 6.00 Stellantis STLA .0 cc 16.15 +0.92 4.73 1.82 3.69 2.2375131.72 69.33 Stepan SCL 1.0 24 122.78 +0.19 4.42 5.34 6.34 .305203.91 105.69 Steris STE .8 38 188.76 +4.38 4.76 6.06 6.90 .4021.17 7.01 SterlingBancorp STL 1.4 18 19.97 –0.70 1.12 1.86 2.10 .0753.41 20.26 StewartInfo STC 2.4 13 50.25 +0.36 3.31 5.54 4.62 .3053.85 20.75 StifelFinancial SF .9 14 52.28 +0.13 ... 4.21 4.00 .113341.99 14.67 STMicroelec STM .4 39 39.71 –0.08 1.15 1.14 ... .0423.71 0.46 StoneMor STON ... dd 3.33 –0.10 –3.83 ... –.60 ...32.55 13.87 Stoneridge SRI ... dd 29.95 +0.12 2.13 –.15 .86 ...52.84 15.06 Stride LRN ... 21 24.70 +0.86 .60 1.29 1.32 ...247.44 124.54 Stryker SYK 1.1 52 239.93 –2.06 5.48 ... ... .6327.00 11.87 StudioCity MSC ... dd 14.23 +0.88 .56 –6.23 –3.14 ...90.74 38.44 SturmRuger RGR 2.2 18 67.53 –4.47 1.82 2.41 4.20 .5622.87 8.64 SuburbanPropane SPH 7.9 16 15.19 –0.26 .97 1.20 1.25 .307.25 4.49 SumitomoMits SMFG 4.8 9 6.42 –0.29 .94 .71 .85 .182711.96 2.32 SummitHotelProp INN .0 dd 8.76 –0.09 .65 –1.48 ... .1825.29 7.51 SummitMaterials SUM ... 20 23.68 +0.34 .52 .80 .83 ...51.15 7.50 SummitMidstream SMLP .0 1 16.10 –1.22 –72.60 4.69 ... 1.875173.98 95.34 SunComms SUI 2.2 93 146.94 +4.51 1.80 1.36 1.74 .7950.13 24.37 SunLifeFinancial SLF 3.6 16 47.73 +1.00 3.33 ... ... .42016.64 2.33 SunCokeEnergy SXC 4.3 64 5.61 –0.01 –1.98 –.01 .33 .0632.70 9.61 SuncorEnergy SU 3.7 dd 17.70 –0.63 1.40 –1.19 .17 .16242.75 0.68 SunlandsTech STG ... dd 1.32 +0.18 ... –3.09 –2.23 ...57.70 6.12 SunnovaEnergy NOVA ... dd 53.89 +6.41 –4.14 ... –1.45 ...32.30 10.46 Sunoco SUN 10.7 20 30.97 +0.73 2.82 2.37 ... .825513.62 5.75 SunstoneHotelInv SHO .0 dd 11.20 –0.01 .54 –1.90 –.74 .056.23 0.90 SuperiorIndsIntl SUP ... dd 4.95 –0.23 –5.10 –.32 –.10 ...13.40 10.05 SupernovaPtrs SPNV.UT ... ... 12.23 +0.38 ... ... ... ...13.00 10.15 SupernovaPtrsA SPNV ... ... 11.50 +0.29 ... ... ... ...3.30 1.91 SupernovaPtrsWt SPNV.WT ... ... 2.50 +0.25 ... ... ... ...12.38 9.70 SustOppsAcqnA SOAC ... dd 11.75 +0.20 ... ... ... ...14.12 9.85 SustOppsAcqnUn SOAC.UT ... ... 13.19 +0.19 ... ... ... ...3.65 0.67 SustOppsAcqnWt SOAC.WT ... ... 2.94 –0.11 ... ... ... ...12.69 4.43 Suzano SUZ ... dd 11.79 +0.26 –1.06 –2.10 1.19 ...19.99 10.30 Switch SWCH 1.2 cc 16.51 –0.03 .11 ... ... .0556.90 9.60 SwitchbackEner SBE.UT ... ... 45.81 –0.83 ... ... ... ...49.48 9.38 SwitchbackEnerA SBE ... cc 39.62 –1.81 .06 ... ... ...20.88 0.30 SwitchbackEnerWt SBE.WT ... ... 17.91 +0.54 ... ... ... ...13.18 11.37 SwitchbackII SWBK.UT ... ... 12.42 +0.25 ... ... ... ...40.69 12.15 SynchronyFin SYF 2.4 17 37.37 –1.40 5.56 2.01 3.77 .2291.62 26.08 Synnex SNX .0 9 89.78 +2.26 10.21 7.73 7.35 .2039.05 10.91 SynovusFin SNV 3.5 16 37.29 –0.82 3.47 2.18 ... .3383.84 26.00 Sysco SYY 2.4 dd 75.19 –0.38 .42 ... ... .4540.09 14.00 Systemax SYX 1.4 25 40.03 +1.24 1.28 1.70 1.93 2.00
T84.43 44.24 TALEducation TAL ... dd 76.00 +10.40 ... .18 .79 ...57.92 32.37 TCEnergy TRP 5.5 13 44.35 –0.06 3.23 ... 3.30 .632842.98 18.00 TCPipeLines TCP 8.4 8 31.10 +0.10 3.74 3.91 3.48 .65131.97 48.62 TEConnectivity TEL 1.5 dd 128.39 +0.44 –.73 5.37 6.08 .4818.31 9.61 Tegna TGNA 1.8 11 15.73 +0.83 1.31 2.24 ... .0721.04 13.54 Telus TU 4.7 27 20.77 –0.07 1.09 .83 .94 .238933.99 9.59 Ternium TX ... 23 29.34 –1.11 2.93 1.67 4.19 ...56.03 15.24 TFI Intl TFII 1.8 18 51.24 –0.64 2.80 3.16 3.58 .22870.96 32.72 TJX TJX 1.6 cc 66.91 –1.55 2.67 ... ... .2637.36 10.00 TPGPaceBenFin TPGY.UT ... ... 28.67 +2.88 ... ... ... ...33.88 9.76 TPGPaceBenA TPGY ... ... 26.10 +1.47 ... ... ... ...10.50 1.55 TPGPaceBenWt TPGY.WT ... ... 9.00 +0.55 ... ... ... ...
12.67 10.00 TPGPaceTechOpps PACE.UT ... ... 12.47 +0.83 ... ... ... ...12.43 9.70 TPGPaceTechA PACE ... ... 11.90 +0.70 ... ... ... ...4.60 1.37 TPGPaceTechWt PACE.WT ... ... 3.00 +0.69 ... ... ... ...21.30 2.45 TPGREFin TRTX 7.1 dd 11.20 +0.65 ... –1.16 1.07 .1811.98 9.90 TailwindAcqn TWND.UT ... ... 11.32 +0.10 ... ... ... ...10.88 9.55 TailwindAcqnA TWND ... ... 10.42 +0.06 ... ... ... ...2.20 0.62 TailwindAcqnWt TWND.WT ... ... 1.85 –0.07 ... ... ... ...136.13 42.70 TaiwanSemi TSM 1.1 38 129.14 +3.91 ... 3.98 4.64 .346320.42 12.43 TakedaPharm TAK 3.9 cc 18.13 +0.69 .13 ... ... .430526.31 5.00 TalosEnergy TALO ... dd 9.71 –0.25 1.08 –.87 ... ...16.50 4.05 Tanger SKT 5.3 dd 13.35 +0.73 .93 –.41 –.13 .177535.45 10.18 Tapestry TPR .0 dd 34.33 +0.71 –2.34 2.33 2.64 .337540.17 3.66 TargaResources TRGP 1.4 dd 28.77 –1.26 –1.44 –7.02 –.39 .10199.96 90.17 Target TGT 1.4 25 191.91 –2.89 6.36 ... 8.68 .6884.71 53.95 TaroPharm TARO ... dd 77.13 –0.56 ... –8.20 4.67 ...20.14 3.92 TataMotors TTM ... dd 19.57 +2.01 –2.46 ... ... ...30.45 6.39 TaylorMorrison TMHC ... 19 30.36 +5.54 2.35 2.00 4.01 ...15.33 3.75 Team TISI ... dd 11.64 +0.74 –1.07 ... ... ...18.45 4.49 TechnipFMC FTI 1.2 dd 11.21 –0.64 –5.39 .39 .71 .1321.34 5.60 TeckRscsB TECK .8 dd 20.50 +0.87 ... .72 1.57 .03914.88 1.70 Teekay TK ... dd 2.66 –0.18 –3.08 –.01 .12 ...14.52 7.00 TeekayLNGun TGP 7.8 12 12.87 –0.55 1.59 2.53 2.78 .2526.92 8.90 TeekayTankers TNK ... 2 11.06 –0.77 ... 5.11 .30 ...16.66 12.12 TejonRanch TRC ... 47 16.38 +0.82 .40 .02 .13 ...263.47 93.56 TeladocHealth TDOC ... dd 263.00 +37.75 –1.38 ... ... ...12.35 6.20 TelecomArgentina TEO 19.8 dd 6.28 –0.28 ... ... ... .9972398.68 195.34 TeledyneTech TDY ... 38 389.17 +6.58 10.73 10.25 11.43 ...414.72 221.27 Teleflex TFX .4 50 386.44 –1.93 9.80 ... ... .3414.57 7.08 TelefonicaBras VIV 9.3 14 8.19 –0.36 .78 ... ... .02567.07 3.22 Telefonica TEF 7.2 79 4.46 –0.10 .19 .43 .53 .237128.93 16.06 TelekmIndonesia TLK 2.4 19 24.29 –0.62 ... 1.49 1.60 .82425.61 14.05 Telephone&Data TDS 3.3 11 20.53 +0.29 ... 1.71 1.21 .1729.44 5.50 TempurSealy TPX ... 25 28.84 +0.13 .86 1.40 1.98 ...22.70 8.86 Tenaris TS .0 dd 15.61 –0.84 1.26 –.11 .20 .1428.84 9.22 TencentMusic TME ... 79 27.02 +4.81 ... .40 .50 ...50.80 10.00 TenetHealthcare THC ... dd 50.74 +3.36 –2.24 4.08 3.06 ...85.31 46.64 Tennant TNC 1.2 33 75.37 +2.50 2.48 2.92 ... .2312.94 2.21 Tenneco TEN ... dd 10.71 –0.05 ... –1.16 3.18 ...27.56 17.62 Teradata TDC ... 28 25.11 –0.36 –.18 ... 1.53 ...39.60 11.54 Terex TEX .0 cc 38.78 +1.27 .76 –.06 1.67 .1255.00 17.63 Terminix TMX ... cc 50.34 –1.71 .94 .84 1.33 ...64.24 42.12 TerrenoRealty TRNO 2.0 48 57.06 +1.00 .85 .79 .85 .291.62 0.22 TetraTech TTI ... dd 1.37 +0.07 –1.17 ... ... ...13.76 6.25 TevaPharm TEVA ... dd 12.55 +0.59 –.91 2.51 2.62 ...895.00 295.05 TexasPacLand TPL 1.2 31 822.30 –18.69 41.09 21.58 24.72 10.0021.25 5.50 Textainer TGH ... 20 20.45 +0.98 .99 1.36 2.13 ...51.53 20.26 Textron TXT .2 42 49.73 +0.79 3.50 1.91 ... .02532.57 250.21 ThermoFisherSci TMO .2 42 514.60 +11.46 9.17 ... ... .2226.03 9.98 Thermon THR ... dd 16.44 –0.78 .36 .45 .74 ...11.52 5.64 ThirdPointReins TPRE ... 24 9.87 –0.12 2.18 2.10 1.35 ...13.19 11.76 ThomaBravoAdv TBA ... ... 12.95 +1.19 ... ... ... ...89.55 52.23 ThomsonReuters TRI 1.9 22 81.50 +1.01 3.12 1.78 2.02 .38121.33 32.30 ThorIndustries THO 1.5 21 109.00 +3.91 4.02 7.78 8.40 .4135.36 4.60 3DSystems DDD ... dd 34.48 +6.23 –.61 –.11 .30 ...180.59 114.04 3M MMM 3.5 20 169.04 +3.49 7.81 8.51 9.52 1.4717.06 4.09 Tidewater TDW ... dd 10.98 –0.53 –3.71 –1.44 –2.04 ...2.40 0.41 TidewaterWtA TDW.WTA ... ... 1.05 +0.29 ... ... ... ...2.12 0.17 TidewaterWtB TDW.WTB ... ... 1.00 +0.28 ... ... ... ...11.01 10.30 TigaAcqnA TINV ... ... 10.49 –0.06 ... ... ... ...11.83 10.15 TigaAcquisitionUn TINV.UT ... ... 11.34 –0.01 ... ... ... ...2.80 1.05 TigaAcqnWt TINV.WT ... ... 2.08 +0.27 ... ... ... ...10.77 3.46 Tilly's TLYS .0 dd 10.16 –0.28 ... –.15 .69 1.0020.32 9.92 Tim TIMB 2.7 13 12.15 –1.06 1.90 .80 1.00 .2486.44 22.26 Timken TKR 1.4 18 83.40 –0.84 4.71 ... 4.87 .296.78 2.16 TimkenSteel TMST ... dd 5.33 –0.32 –2.46 –1.14 –.18 ...7.95 1.05 TItanIntl TWI .0 dd 7.05 –0.17 –.84 –.96 –.39 .00551.11 13.28 Toll Bros TOL .9 15 50.82 +6.20 3.40 4.84 5.91 .1138.92 28.99 TootsieRoll TR 1.2 34 30.14 –0.17 ... .66 .72 .09220.40 54.83 TopBuild BLD ... 33 217.24 +17.01 5.56 7.09 8.99 ...102.00 52.07 Toro TTC 1.0 33 101.16 +3.79 3.03 3.46 3.93 .262559.97 33.74 TorontoDomBk TD 4.3 12 57.80 –1.46 4.78 4.54 5.08 .596813.50 9.46 Tortoise II A SNPR ... ... 13.48 +1.35 ... ... ... ...14.22 10.15 TortoiseAcqnII SNPR.UT ... ... 14.20 +1.35 ... ... ... ...3.85 1.25 Tortoise IIWt SNPR.WT ... ... 3.41 +0.20 ... ... ... ...52.41 22.13 Total TOT ... dd 44.44 +0.21 4.20 2.22 3.15 ...10.33 3.54 TownsquareMedia TSQ .0 dd 7.86 +0.28 ... –1.14 .55 .075156.30 108.01 ToyotaMotor TM 2.5 16 147.95 –0.46 13.53 10.41 ... 2.015156.27 70.00 TraneTech TT 1.4 41 152.67 +3.16 5.84 ... ... .538.92 3.63 Transalta TAC 1.6 dd 8.88 +0.30 .14 ... ... .035340.42 16.00 TrancntlRlty TCI ... cc 23.29 +1.04 –3.09 ... ... ...673.51 200.06 TransDigm TDG ... 70 576.40 –8.59 8.96 11.49 16.82 ...5.24 0.65 Transocean RIG ... dd 2.74 –0.54 –2.05 ... –.69 ...6.77 3.72 TransportadGas TGS ... 5 5.16 –0.14 ... ... .54 ...102.80 52.50 TransUnion TRU .3 54 91.91 +0.64 1.81 2.99 ... .075152.29 76.99 Travelers TRV 2.3 14 145.84 +2.60 10.52 10.86 11.83 .8511.90 10.10 TrebiaAcqn TREB.UT ... ... 11.71 +0.21 ... ... ... ...11.23 9.72 TrebiaAcquisition TREB ... ... 11.04 +0.19 ... ... ... ...2.97 0.95 TrebiaAcqnWt TREB.WT ... ... 2.30 +0.12 ... ... ... ...7.32 4.23 TrecoraResources TREC ... 16 7.08 +0.06 –.61 .23 .32 ...23.71 11.31 Tredegar TG 3.1 dd 15.67 –0.75 1.45 .91 1.11 5.9753.98 33.50 TreeHouseFoods THS ... dd 40.52 +1.25 –6.42 2.73 3.04 ...... ... TrepontAcqnIWt TACA.WT ... ... 1.87 ... ... ... ... ...
11.25 10.10 TrepontAcqnI TACA.UT ... ... 11.04 +0.55 ... ... ... ...... ... TrepontAcqnIA TACA ... ... 10.17 ... ... ... ... ...
98.52 28.11 Trex TREX ... 68 98.16 +7.01 1.24 ... ... ...21.35 5.89 TriPointe TPH ... 10 21.33 +3.57 1.47 ... 2.60 ...85.08 27.79 TriNet TNET ... 19 80.67 +0.30 2.99 4.25 ... ...28.74 14.53 TrinityIndustries TRN 3.0 dd 28.06 +0.46 1.07 .38 .66 .2157.40 14.16 Trinseo TSE .6 dd 55.42 +0.59 2.28 ... ... .0824.79 9.13 Triple-SMgmt GTS ... 11 24.53 +0.76 3.97 2.80 3.30 ...14.19 2.80 TriplePtVent TPVG 10.5 11 13.69 +0.19 1.28 1.57 1.52 .1052.40 19.80 TritonIntl TRTN 4.6 14 49.11 –1.28 4.54 4.35 5.89 .5725.66 3.02 TriumphGroup TGI .0 dd 12.43 –0.25 –.56 –.28 ... .0417.23 3.97 Tronox TROX 1.6 3 17.04 +2.38 –.78 .56 1.33 .0723.17 12.02 TrueBlue TBI ... dd 20.17 +0.91 1.61 1.67 ... ...56.35 24.01 TruistFinl TFC 3.5 17 51.18 –0.79 3.08 3.68 4.39 .4523.85 7.06 TsakosEnergy TNP 2.8 5 8.89 +0.05 –1.60 1.87 1.71 .12519.24 5.79 TufinSoftware TUFN ... dd 18.25 +0.89 –1.04 –.68 –.61 ...38.59 1.15 Tupperware TUP ... cc 33.50 +0.96 .25 2.08 3.05 ...6.36 4.36 TurkcellIletism TKC ... 9 5.54 –0.03 .66 ... ... ...
48.55 14.09 TurningPoint TPB .4 cc 45.24 +1.06 .69 1.59 2.43 .0514.62 3.01 TurquoiseHill TRQ ... 6 11.25 –0.74 –.70 ... 2.61 ...17.78 2.61 TutorPerini TPC ... dd 16.49 +0.28 –7.72 2.04 2.22 ...398.29 68.06 Twilio TWLO ... dd 392.01 +3.36 ... .11 ... ...56.11 20.00 Twitter TWTR ... dd 48.06 +2.88 1.87 ... ... ...15.85 2.25 TwoHarbors TWO 7.7 dd 6.52 +0.18 .93 ... ... .17466.21 247.22 TylerTech TYL ... 93 424.40 +2.08 3.65 5.55 5.86 ...88.38 42.57 TysonFoods TSN 2.7 11 66.52 +1.77 5.86 5.67 6.39 .445
U15.61 7.48 UBSGroup UBS 2.5 10 14.88 –0.25 1.17 1.52 1.38 .36551.25 29.20 UDR UDR 3.7 88 39.11 –0.31 .63 ... –.01 .3644.09 21.75 UGI UGI 3.5 15 37.18 –0.45 2.54 2.81 3.12 .3316.67 8.63 UMHProp UMH 4.9 dd 15.50 +0.09 .06 –.21 –.31 .1965.76 32.80 Unitil UTL 3.7 20 40.44 –3.37 2.97 2.06 2.57 .37516.67 3.52 USACompression USAC 13.7 dd 15.30 –0.43 –2.15 –6.58 –.15 .52537.75 23.91 USCellular USM ... 12 33.83 +1.36 ... ... ... ...10.64 1.00 USDPartners USDP 8.1 dd 5.46 +1.43 .22 .97 1.07 .11141.99 8.32 USFoods USFD ... dd 34.77 –0.89 1.75 .22 ... ...134.11 45.13 USPhysTherapy USPH 1.0 56 131.59 +3.77 2.45 2.37 3.30 .329.94 0.79 USSilica SLCA .0 dd 9.15 –0.40 –4.49 –.58 ... .0211.34 2.65 USXpress USX ... cc 8.09 +0.76 ... ... 1.06 ...14.38 9.30 UWM UWMC ... dd 11.35 –1.04 ... ... ... ...4.87 1.00 UWMWt UWMC.WT ... ... 2.50 –0.54 ... ... ... ...60.03 13.71 Uber UBER ... dd 54.31 –1.21 –6.81 –3.86 ... ...284.89 110.01 Ubiquiti UI .6 39 264.95 +17.66 5.80 ... ... .406.68 1.97 UltraparPart UGP 2.3 cc 4.02 –0.27 .09 .19 .25 .054621.52 7.15 UnderArmourA UAA ... dd 18.51 +0.42 .20 ... ... ...19.10 6.37 UnderArmourC UA ... dd 15.89 +0.30 .20 ... ... ...27.85 7.48 Unifi UFI ... dd 19.30 –0.27 –3.10 ... ... ...227.56 121.89 Unifirst UNF .4 33 223.66 +4.69 7.13 ... 7.44 .2563.89 44.06 Unilever UL 3.1 24 59.66 –0.02 2.41 3.02 3.08 .4845221.28 105.08 UnionPacific UNP 1.9 26 207.13 –9.47 7.88 9.53 10.65 .9724.85 8.25 Unisys UIS ... dd 23.76 –0.25 –.31 .88 1.62 ...10.57 2.10 UnitedMicro UMC 1.0 35 10.27 +1.49 .13 ... ... .136125.10 5.00 UnitedNatFoods UNFI ... 13 25.02 +2.82 –5.10 3.20 3.21 ...178.01 82.00 UPSB UPS 2.5 30 158.99 +0.09 5.11 7.69 8.53 1.01267.59 58.85 UnitedRentals URI ... 20 258.59 +3.45 15.11 ... ... ...55.69 28.36 USBancorp USB 3.7 15 45.86 –2.54 3.06 3.72 4.20 .4224.71 4.54 USSteel X .2 dd 18.91 –1.97 –3.67 ... ... .01367.95 187.72 UnitedHealth UNH 1.4 22 347.55 –3.75 16.03 18.20 21.05 1.25174.94 65.11 UnitySoftware U ... ... 154.03 +5.42 ... –.37 –.28 ...23.29 6.40 Univar UNVR ... cc 20.18 –0.38 –.61 1.23 ... ...54.70 37.04 Universal UVV 6.3 22 48.71 –3.56 2.86 2.03 2.40 .77132.41 52.25 UniversalHealth UHT 4.2 44 65.46 –4.64 1.38 2.49 2.48 .695148.27 65.20 UniversalHealthB UHS .0 13 129.10 –3.38 ... ... ... .2026.14 10.84 UnivInsurance UVE 4.1 dd 15.78 +0.37 1.36 –.05 2.60 .139.76 2.75 UnvlTechInst UTI ... dd 6.19 +0.13 .05 .25 .35 ...30.57 9.58 UnumGroup UNM 4.5 5 25.40 +0.18 5.24 4.97 5.02 .28519.84 6.98 UrbanEdgeProp UE .0 24 14.23 –0.62 .91 .31 .16 .4619.25 8.18 UrstadtBiddle UBP 4.1 56 12.25 –0.55 .20 .54 ... .12524.44 8.22 UrstadtPropA UBA 3.9 66 14.43 –1.08 .22 .50 ... .1492.26 43.01 UsanaHealth USNA ... 16 86.67 +7.34 4.41 5.39 5.70 ...23.72 9.84 UtzBrands UTZ .9 dd 22.75 +0.26 .20 ... .57 .01
V50.90 17.77 VEREIT VER 4.3 30 35.71 –0.33 –1.85 1.23 1.71 .07789.68 45.07 VF VFC 2.3 dd 83.86 –0.05 1.70 ... 2.91 .4916.23 9.85 VGAcqn VGAC.UT ... ... 14.91 +1.74 ... ... ... ...14.92 9.65 VGAcqnA VGAC ... ... 13.96 +1.65 ... ... ... ...4.12 0.95 VGAcqnWt VGAC.WT ... ... 3.62 +0.62 ... ... ... ...15.49 7.04 ViaOptronics VIAO ... ... 14.88 +1.86 –.88 .12 .38 ...28.75 9.85 VICIProp VICI 5.0 19 26.39 +1.23 1.24 1.68 1.91 .334.98 1.26 VOCEnergy VOC 5.4 8 2.69 –0.24 ... 2.05 1.58 .032.44 0.70 VaalcoEnergy EGY ... dd 2.32 –0.06 .04 –.67 .60 ...300.00 125.00 VailResorts MTN .0 cc 271.59 –6.91 ... –.98 6.88 1.7619.00 6.49 Vale VALE ... 35 17.21 –0.43 –.33 1.89 ... ...90.07 31.00 ValeroEnergy VLO 6.6 dd 59.45 +1.15 5.84 ... .56 .9821.24 9.02 Valhi VHI 1.9 12 17.12 –0.16 1.68 3.00 3.59 .08217.33 82.60 ValmontInds VMI .9 32 208.75 +1.16 7.06 7.78 8.76 .4525.23 9.06 Valvoline VVV 2.0 15 24.93 +1.17 1.69 1.64 1.82 .12554.42 6.86 Vapotherm VAPO ... dd 33.02 +0.12 –2.74 –1.96 –1.97 ...176.19 89.62 VarianMed VAR ... 60 175.47 ... 2.94 ... ... ...13.86 7.92 VectorGroup VGR 6.6 27 12.16 –0.07 .63 .72 .85 .2059.24 28.90 Vectrus VEC ... 21 55.04 +0.79 2.99 2.81 3.74 ...10.28 3.24 Vedanta VEDL 6.8 dd 9.15 –0.43 –1.02 1.00 1.31 .4946313.99 118.11 VeevaSystems VEEV ... cc 288.69 +17.68 1.90 2.84 3.12 ...14.90 2.24 VelocityFinl VEL ... dd 7.20 +0.16 ... ... .78 ...5.00 1.12 VenatorMaterials VNTR ... dd 4.15 –0.03 –1.64 ... ... ...63.38 13.35 Ventas VTR 3.7 54 49.13 +0.15 1.17 ... .30 .4527.64 5.25 Veoneer VNE ... dd 27.14 +3.83 –4.92 ... –2.55 ...24.66 5.70 Veritiv VRTV ... 71 22.85 –0.18 –1.84 ... 1.95 ...61.95 48.84 Verizon VZ 4.4 13 57.47 +0.09 4.65 ... 4.99 .627516.07 1.50 VermilionEnergy VET .0 dd 5.33 –0.01 .16 ... –.33 .172919.34 7.36 Verso VRS 3.2 3 12.57 +0.03 2.74 –2.77 .57 .1021.49 4.75 Vertiv VRT .0 dd 20.01 +0.50 .05 .84 1.17 .0169.32 11.25 Viad VVI .0 dd 39.08 +1.93 1.02 –5.59 .11 .1015.75 3.16 VinceHolding VNCE ... dd 8.79 –0.51 2.55 –3.01 –.77 ...30.88 11.53 Vipshop VIPS ... 29 29.41 +1.17 ... 8.44 ... ...42.49 9.06 VirginGalactic SPCE ... dd 34.28 +3.85 –1.09 ... ... ...7.79 3.70 VirnetX VHC .0 1 5.62 –0.07 –.28 ... ... 1.00220.39 133.93 Visa V .6 42 202.02 +0.43 4.89 5.47 6.84 .3223.92 11.23 Vishay VSH 1.6 34 23.16 +0.63 ... .91 1.34 .09537.08 16.56 VishayPrecision VPG ... 32 33.74 –0.40 ... 1.28 1.56 ...8.01 1.80 VistaOil&Gas VIST ... dd 2.70 –0.04 ... –.92 –.13 ...30.15 4.29 VistaOutdoor VSTO ... dd 29.31 +1.15 –2.68 2.72 2.41 ...23.60 11.30 Vistra VST 2.5 12 21.34 –0.17 1.86 2.09 ... .1351.89 0.23 VistraWt VST.WTA ... ... .51 +0.01 ... ... ... ...32.00 8.51 VivintSmartHome VVNT ... dd 20.58 –2.50 .14 –2.47 –1.94 ...163.17 86.00 VMware VMW ... 36 134.50 –0.31 ... ... ... ...46.15 15.89 VoceraComm VCRA ... dd 46.08 +3.06 –.57 .48 .59 ...39.00 26.36 Vontier VNT ... ... 33.81 –1.29 2.37 2.49 2.44 ...68.50 27.64 VornadoRealty VNO 5.6 cc 37.90 –0.66 16.21 –1.02 .13 .5363.81 29.75 VoyaFinancial VOYA 1.0 dd 57.78 –1.73 –2.58 2.86 5.60 .15168.24 65.56 VulcanMatls VMC .9 35 158.37 –2.55 4.63 ... ... .3411.70 10.10 VyGlblGrowth VYGG.UT ... ... 11.65 +0.25 ... ... ... ...11.38 9.63 VyGlblGrowthA VYGG ... ... 11.21 +0.29 ... ... ... ...
2.80 1.08 VyGlblGrowthWt VYGG.WT ... ... 2.36 +0.15 ... ... ... ...
W4.65 1.07 W&TOffshore WTI ... 6 2.34 –0.06 .52 –.22 ... ...109.53 68.01 WECEnergy WEC 2.9 23 87.38 –1.31 3.58 3.76 4.02 .6325236.52 71.12 WEX WEX ... cc 201.75 +0.85 2.26 ... ... ...75.86 34.26 WNS WNS ... 35 70.94 +1.67 2.35 2.66 3.05 ...88.99 38.62 W.P.Carey WPC 6.2 26 67.27 +0.03 1.78 2.05 2.09 1.04666.19 27.18 WPP WPP 1.2 dd 54.08 –1.22 3.18 3.86 4.92 .659419.17 6.26 WabashNational WNC 1.9 dd 17.07 ... 1.62 1.17 1.50 .0884.32 35.07 Wabtec WAB .6 33 80.47 –1.43 1.84 ... ... .1225.90 9.87 Waddell&ReedFin WDR 4.0 18 25.08 +0.05 1.57 1.63 1.67 .2594.84 24.55 Walker&Dunlop WD 1.6 14 91.14 +1.63 5.45 6.06 7.23 .36153.66 102.00 Walmart WMT 1.5 21 146.33 +1.69 5.19 5.16 5.45 .5424.17 9.46 WarriorMetCoal HCC .9 64 23.29 +0.27 5.86 ... ... .0533.75 4.41 WashingtonPrime WPG .0 67 11.45 +1.28 –.45 –7.86 –8.91 1.12532.22 16.95 WashingtonREIT WRE 5.3 37 22.48 –0.30 4.75 –.09 –.18 .30111.04 70.87 WasteConnections WCN .8 cc 102.96 +1.09 2.15 ... ... .205126.79 85.34 WasteMgt WM 1.9 33 115.36 +0.64 3.91 4.00 ... .545274.59 154.39 Waters WAT ... 34 273.62 +5.29 8.69 ... ... ...253.87 132.97 Watsco WSO 2.8 38 252.58 +15.60 ... 6.82 6.29 1.775248.79 139.00 WatscoB WSO.B 2.9 37 244.73 +18.22 ... 6.82 6.29 1.775131.51 69.02 WattsWater WTS .7 38 129.19 –0.02 ... 3.64 ... .23369.00 21.70 Wayfair W ... dd 299.94 –0.06 ... 4.43 –7.07 ...52.88 18.16 WebsterFin WBS 3.2 22 50.68 –0.90 2.35 3.44 3.96 .405.49 0.73 Weidai WEI ... ... 1.62 +0.19 .52 ... ... ...31.12 12.21 WeingartenRealty WRI 3.1 18 22.98 +0.42 2.44 .69 .43 .3659.39 32.44 WeisMarkets WMK 2.6 11 46.94 –0.92 2.53 2.45 2.55 .3115.78 3.17 Welbilt WBT ... dd 14.00 –0.18 .39 .04 ... ...48.50 20.76 WellsFargo WFC 1.3 78 31.90 –0.14 .41 2.45 3.22 .1089.99 24.27 Welltower WELL 3.9 cc 63.07 –1.18 3.05 2.09 .60 .6187.85 13.52 WescoIntl WCC ... 33 84.06 –1.65 ... ... 6.74 ...312.12 124.53 WestPharmSvcs WST .2 73 300.09 +0.68 3.21 4.54 5.12 .1773.59 20.90 WestAllianceBcp WAL 1.4 14 71.19 +0.87 5.04 5.21 5.68 .2511.33 1.37 WesternAssetMort WMC 8.1 dd 2.98 –0.02 1.37 .55 .31 .0619.16 2.90 WesternMidstrm WES 8.2 13 15.21 –1.33 1.59 1.93 1.81 .31128.45 17.39 WesternUnion WU 4.1 13 22.06 +0.13 2.46 1.84 2.02 .22591.83 28.99 WestlakeChem WLK 1.3 37 82.14 –3.47 3.25 2.11 ... .2724.34 10.31 WestlakeChemPtrs WLKP 8.6 11 21.83 +0.36 1.77 2.19 2.11 .471417.27 7.98 WestpacBanking WBK 1.3 39 16.75 +0.40 .43 1.08 1.21 .235347.77 21.50 WestRock WRK 1.7 dd 46.67 +0.99 –2.67 3.49 4.11 .2029.61 9.42 Westwood WHG .0 dd 12.39 –1.27 .70 1.00 1.00 .4334.71 13.10 Weyerhaeuser WY 3.1 51 33.21 +0.69 –.10 ... ... .1757.89 18.66 WheatonPrecMet WPM 1.2 43 40.42 +0.53 .19 ... ... .12207.30 64.00 Whirlpool WHR 2.5 14 198.21 +3.67 18.45 17.76 18.07 1.251168.21 629.21 WhiteMtnIns WTM .1 11 1040.01 +17.99 130.27 15.00 18.00 1.0013.89 4.71 WhitestoneREIT WSR 5.0 19 8.48 +0.04 .57 .96 1.03 .03528.36 13.44 WhitingPetrol WLL ... dd 24.74 –0.60 –2.64 –3.20 1.59 ...11.49 2.95 WideOpenWest WOW ... 49 11.23 ... .45 .29 .56 ...49.97 30.00 WileyA JW.A 2.8 dd 48.59 +0.81 ... 3.07 2.48 .342550.26 30.44 WileyB JW.B 2.8 dd 48.21 +0.97 ... 3.07 3.31 .342522.88 8.41 Williams WMB 7.4 cc 21.60 –0.90 .70 1.13 1.18 .40132.38 26.01 Williams-Sonoma WSM 1.6 19 132.32 +7.46 4.49 ... ... .5372.65 16.94 Winnebago WGO .7 22 66.49 +0.88 1.84 5.75 6.10 .126.72 2.52 Wipro WIT .2 27 6.55 +0.16 .24 ... ... .012233.99 12.19 WolverineWwide WWW 1.3 78 30.59 –1.17 1.44 ... 2.05 .1028.50 15.54 WooriFin WF 5.1 9 26.00 –1.05 5.22 5.24 6.24 1.9027102.33 22.01 Workiva WK ... dd 99.40 +2.29 –1.04 .02 –.11 ...40.84 18.36 WorldFuelSvcs INT 1.2 13 33.11 +1.22 2.69 1.37 2.18 .1062.53 29.10 WWEnt WWE .9 25 55.52 +4.69 ... 1.46 1.69 .1258.99 19.28 WorthingtonInds WOR 1.8 5 55.38 –0.84 1.41 8.59 3.34 .2552.41 13.74 WyndhamDest WYND 2.5 dd 48.35 +0.93 5.48 –.81 4.11 .3063.33 14.50 WyndhamHtls WH .5 dd 59.89 –0.86 1.62 1.00 ... .08
XYZ4.95 1.43 XFinancial XYF ... dd 2.45 +0.08 ... ... ... ...35.00 9.50 XLFleet XL ... dd 21.00 +0.87 ... ... ... ...13.00 0.40 XLFleetWt XL.WT ... ... 8.47 +0.28 ... ... ... ...128.57 38.47 XPOLogistics XPO ... cc 117.13 –1.73 3.57 ... 3.86 ...20.30 6.15 XeniaHotels XHR .0 dd 15.87 –0.51 .49 –3.36 –1.16 .27538.69 14.22 Xerox XRX 4.7 16 21.07 –1.42 5.80 1.44 3.82 .253.66 1.68 XinyuanRealEst XIN 6.5 dd 2.55 +0.13 1.20 .87 1.45 .02574.49 10.00 XPeng XPEV ... dd 56.39 +8.57 ... –5.11 –3.01 ...108.84 54.62 Xylem XYL 1.0 83 102.60 –0.90 2.21 1.94 ... .2680.89 15.28 Yeti YETI ... 63 70.21 –3.80 .58 1.74 2.04 ...10.07 2.25 YPF YPF ... dd 3.49 –0.47 ... ... ... ...23.18 6.26 Yalla YALA ... 63 18.60 +2.24 ... .37 .60 ...7.02 2.23 YamanaGold AUY 2.0 43 5.19 +0.12 .24 .31 .46 .026321.66 15.17 YatsenHolding YSG ... dd 19.38 +0.89 ... –2.48 –1.32 ...36.86 12.89 Yelp YELP ... dd 31.65 +0.24 .52 –.55 ... ...20.90 8.56 Yext YEXT ... dd 17.12 +0.91 –1.09 ... –.17 ...5.39 2.70 YirenDigital YRD ... 9 3.75 +0.15 1.81 2.22 6.51 ...47.70 14.84 Youdao DAO ... dd 34.53 +7.47 ... ... ... ...11.25 10.00 YucaipaAcqn YAC.UT ... ... 11.12 +0.20 ... ... ... ...10.68 9.59 YucaipaAcqnA YAC ... ... 10.52 +0.17 ... ... ... ...2.28 0.76 YucaipaAcqnWt YAC.WT ... ... 1.69 –0.03 ... ... ... ...110.66 54.95 YumBrands YUM 1.8 31 107.09 +0.47 4.14 3.46 4.00 .4761.18 38.33 YumChina YUMC .8 32 58.72 +1.56 1.89 1.48 1.98 .1238.99 21.58 ZTOExpress ZTO .0 35 33.04 +3.52 ... ... ... .29154.24 50.23 Zendesk ZEN ... dd 150.81 +7.47 –1.53 ... .78 ...165.93 74.37 ZimmerBiomet ZBH .6 dd 161.01 +0.89 5.47 5.64 7.98 .24176.64 90.14 Zoetis ZTS .6 47 163.33 +1.77 3.11 3.79 4.24 .2517.79 6.21 Zuora ZUO ... dd 15.05 +1.64 ... –.12 –.09 ...59.03 20.33 Zymeworks ZYME ... dd 52.16 –2.52 –3.83 –4.19 –4.97 ...
NYSEARCA14.07 5.19 EmpireStateReal250 FISK .0 ... 8.95 –0.38 ... ... ... .10514.10 5.25 EmpireStateReal60 OGCP .0 ... 9.17 –0.03 ... ... ... .10514.17 5.19 EmpireStateRealES ESBA .0 ... 9.00 –0.34 ... ... ... .10592.00 16.88 USOil Fund USO ... ... 35.23 –0.11 ... ... ... ...19.40 5.91 USBrentOilFd BNO ... ... 13.74 +0.06 ... ... ... ...31.25 8.19 USGasolineFd UGA ... ... 26.57 +0.37 ... ... ... ...15.67 8.22 USNatGas UNG ... ... 9.01 –0.95 ... ... ... ...9.25 7.10 US12mthNtlGas UNL ... ... 7.81 –0.53 ... ... ... ...21.43 9.50 US12moOilFd USL ... ... 18.21 –0.10 ... ... ... ...
- Earnings -52-Week Tick - Week’s - Last This Next DivHigh Low Name Sym Yld P/E Last Chg. Year Year Year Amt
- Earnings -52-Week Tick - Week’s - Last This Next DivHigh Low Name Sym Yld P/E Last Chg. Year Year Year Amt
- Earnings -52-Week Tick - Week’s - Last This Next DivHigh Low Name Sym Yld P/E Last Chg. Year Year Year Amt
- Earnings -52-Week Tick - Week’s - Last This Next DivHigh Low Name Sym Yld P/E Last Chg. Year Year Year Amt
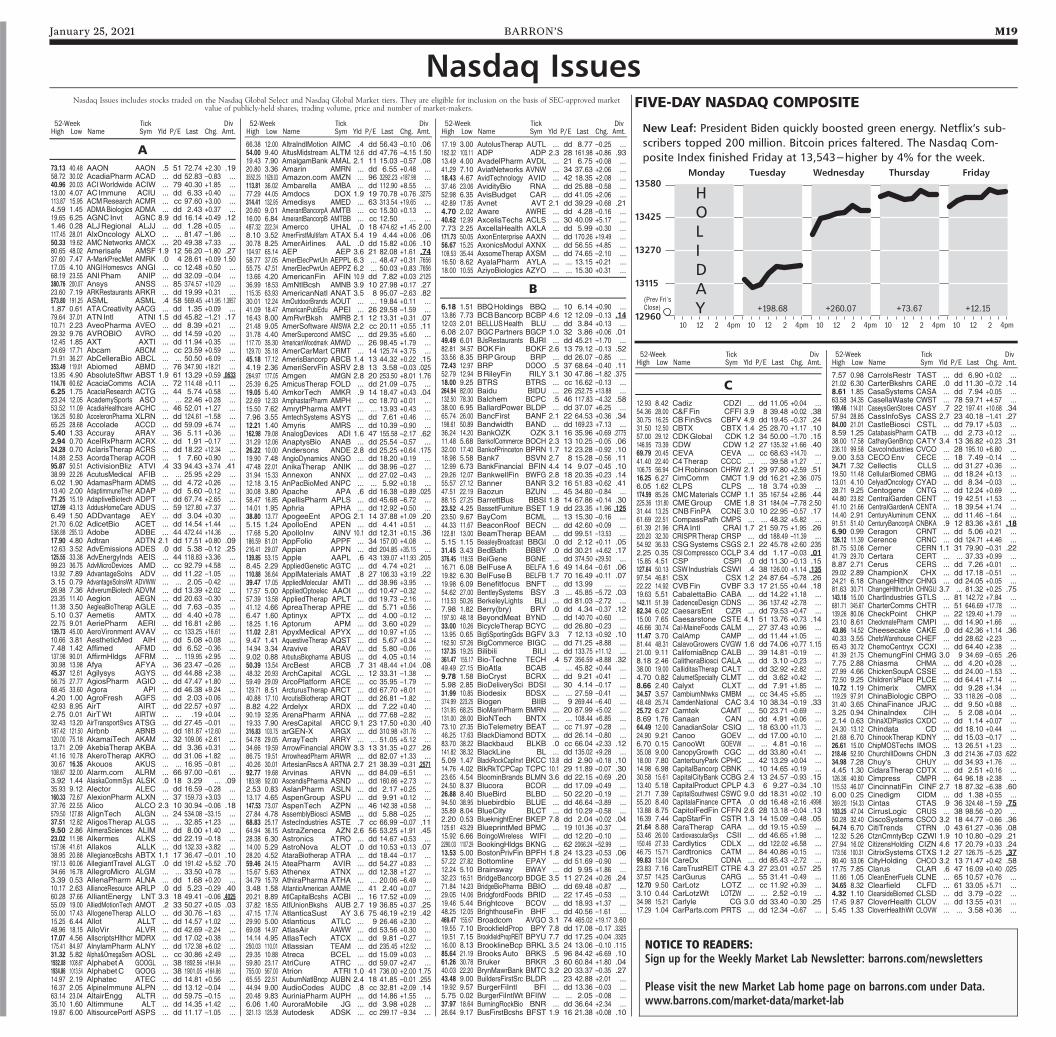
January 25, 2021 BARRON’S M19
52-Week Tick DivHigh Low Name Sym Yld P/E Last Chg. Amt.
52-Week Tick DivHigh Low Name Sym Yld P/E Last Chg. Amt.
52-Week Tick DivHigh Low Name Sym Yld P/E Last Chg. Amt.
52-Week Tick DivHigh Low Name Sym Yld P/E Last Chg. Amt.
52-Week Tick DivHigh Low Name Sym Yld P/E Last Chg. Amt.
Nasdaq IssuesNasdaq Issues includes stocks traded on the Nasdaq Global Select and Nasdaq Global Market tiers. They are eligible for inclusion on the basis of SEC-approved market
value of publicly-held shares, trading volume, price and number of market-makers.
A73.13 40.48 AAON AAON .5 51 72.74 +2.30 .1958.72 30.02 AcadiaPharm ACAD ... dd 52.83 –0.83 ...40.96 20.03 ACIWorldwide ACIW ... 79 40.30 +1.85 ...13.00 4.07 AC Immune ACIU ... dd 6.33 +0.40 ...113.87 15.95 ACMResearch ACMR ... cc 97.60 +3.00 ...4.59 1.45 ADMABiologics ADMA ... dd 2.43 +0.37 ...19.65 6.25 AGNC Invt AGNC 8.9 dd 16.14 +0.49 .121.46 0.28 ALJRegional ALJJ ... dd 1.28 +0.05 ...117.45 28.01 AlxOncology ALXO ... ... 81.47 –1.86 ...50.33 19.62 AMCNetworks AMCX ... 20 49.38 +7.33 ...80.65 48.02 Amerisafe AMSF 1.9 12 56.20 –1.80 .2737.60 7.47 A-MarkPrecMet AMRK .0 4 28.61 +0.09 1.5017.05 4.10 ANGIHomesvcs ANGI ... cc 12.48 +0.50 ...68.19 23.55 ANIPham ANIP ... dd 32.09 –0.04 ...380.76 200.07 Ansys ANSS ... 85 374.57 +10.29 ...23.60 7.19 ARKRestaurants ARKR ... dd 19.99 +0.31 ...573.80 191.25 ASML ASML .4 58 569.45 +41.95 1.39571.87 0.61 ATACreativity AACG ... dd 1.35 +0.09 ...79.64 37.01 ATN Intl ATNI 1.5 dd 45.82 –1.21 .1710.71 2.23 AveoPharma AVEO ... dd 8.39 +0.21 ...29.32 9.76 AVROBIO AVRO ... dd 14.59 +0.20 ...12.45 1.85 AXT AXTI ... dd 11.94 +0.35 ...24.69 17.71 Abcam ABCM ... cc 23.59 +0.59 ...71.91 36.27 AbCelleraBio ABCL ... ... 50.50 +6.09 ...353.49 119.01 Abiomed ABMD ... 76 347.90 +18.21 ...13.95 4.90 AbsoluteSftwr ABST 1.9 61 13.29 +0.59 .0633114.76 60.62 AcaciaComms ACIA ... 72 114.48 +0.11 ...6.25 1.75 AcaciaResearch ACTG ... 44 5.74 +0.58 ...23.24 12.05 AcademySports ASO ... ... 22.46 +0.28 ...53.52 11.09 AcadiaHealthcare ACHC ... 46 52.01 +1.27 ...136.25 50.80 AcceleronPharma XLRN ... dd 124.61 –1.58 ...65.25 28.68 Accolade ACCD ... dd 59.09 +6.74 ...5.40 1.33 Accuray ARAY ... 36 5.11 +0.36 ...2.94 0.70 AcelRxPharm ACRX ... dd 1.91 –0.17 ...24.28 0.70 AclarisTherap ACRS ... dd 18.22 +12.34 ...14.88 2.53 AcordaTherap ACOR ... 1 7.60 +0.90 ...95.87 50.51 ActivisionBliz ATVI .4 33 94.43 +3.74 .4138.99 22.26 AcutusMedical AFIB ... ... 25.95 +2.29 ...6.02 1.90 AdamasPharm ADMS ... dd 4.72 +0.26 ...13.40 2.00 AdaptimmuneTher ADAP ... dd 5.60 –0.12 ...71.25 15.19 AdaptiveBiotech ADPT ... dd 67.74 +2.65 ...127.99 43.13 AddusHomeCare ADUS ... 59 127.80 +7.37 ...6.49 1.50 ADDvantage AEY ... dd 3.04 +0.30 ...21.70 6.02 AdicetBio ACET ... dd 14.54 +1.44 ...536.88 255.13 Adobe ADBE ... 44 472.44 +14.36 ...17.90 4.80 Adtran ADTN 2.1 dd 17.51 +0.80 .0912.63 3.52 AdvEmissions ADES .0 dd 5.38 –0.12 .25125.55 33.38 AdvEnergyInds AEIS ... 44 118.83 +3.36 ...99.23 36.75 AdvMicroDevices AMD ... cc 92.79 +4.58 ...13.92 7.89 AdvantageSolns ADV ... dd 11.22 –1.05 ...3.15 0.79 AdvantageSolnsWt ADVWW ... ... 2.05 –0.42 ...26.98 7.36 AdverumBiotech ADVM ... dd 13.39 +2.02 ...23.35 11.40 Aegion AEGN ... dd 20.63 –0.30 ...11.38 3.50 AegleaBioTherap AGLE ... dd 7.63 –0.35 ...5.10 0.37 Aemetis AMTX ... dd 4.40 +0.78 ...22.75 9.01 AeriePharm AERI ... dd 16.81 +2.86 ...139.73 45.00 AeroVironment AVAV ... cc 133.25 +16.61 ...10.66 3.81 AestheticMed AIH ... dd 5.08 +0.08 ...7.48 1.42 Affimed AFMD ... dd 6.52 –0.36 ...137.98 90.01 AffirmHldgs AFRM ... ... 119.95 +2.95 ...30.98 13.98 Afya AFYA ... 36 23.47 –0.26 ...45.37 12.61 Agilysys AGYS ... dd 44.88 +2.38 ...56.75 27.77 AgiosPharm AGIO ... dd 47.47 +1.80 ...68.45 33.60 Agora API ... dd 46.38 +9.24 ...4.20 1.00 AgroFresh AGFS ... dd 2.03 +0.06 ...42.93 8.95 AirT AIRT ... dd 22.57 +0.97 ...2.75 0.01 AirTWt AIRTW ... ... .19 +0.04 ...32.43 13.20 AirTransportSvcs ATSG ... dd 27.45 –0.01 ...187.42 121.50 Airbnb ABNB ... dd 181.87 +12.60 ...120.00 75.18 AkamaiTech AKAM ... 32 109.06 +2.61 ...13.71 2.09 AkebiaTherap AKBA ... dd 3.36 +0.31 ...41.16 10.78 AkeroTherap AKRO ... dd 31.06 +1.82 ...30.67 16.35 Akouos AKUS ... ... 16.95 –0.81 ...108.67 32.00 Alarm.com ALRM ... 66 97.00 –0.61 ...3.92 1.44 AlaskaCommSys ALSK .0 18 3.29 ... .0935.93 9.12 Alector ALEC ... dd 16.59 –0.28 ...160.33 72.67 AlexionPharm ALXN ... 37 159.73 +3.03 ...37.76 22.55 Alico ALCO 2.3 10 30.94 –0.06 .18579.50 127.88 AlignTech ALGN ... 24 534.08 –33.15 ...37.51 12.82 AligosTherap ALGS ... ... 32.85 +1.23 ...9.50 2.86 AlimeraSciences ALIM ... dd 8.00 +1.40 ...23.02 11.98 Alkermes ALKS ... dd 22.19 –0.18 ...157.96 41.61 Allakos ALLK ... dd 132.33 +3.82 ...38.95 20.88 AllegianceBcshs ABTX 1.1 17 36.47 –0.01 .10197.13 60.06 AllegiantTravel ALGT .0 dd 191.42 +5.52 .7034.66 16.78 AllegroMicro ALGM ... ... 33.50 +0.78 ...3.39 0.53 AllenaPharm ALNA ... dd 1.68 +0.20 ...10.17 2.63 AllianceResource ARLP .0 dd 5.23 –0.29 .4060.28 37.66 AlliantEnergy LNT 3.3 18 49.41 –0.06 .402555.09 19.00 AlliedMotionTech AMOT .2 33 50.27 +0.05 .0355.00 17.43 AllogeneTherap ALLO ... dd 30.76 –1.63 ...15.25 6.44 Allot ALLT ... dd 14.57 +1.02 ...48.96 18.15 AlloVir ALVR ... dd 42.69 –2.24 ...17.07 4.56 AllscriptsHlthcr MDRX ... dd 17.02 +0.38 ...175.41 84.97 AlnylamPharm ALNY ... dd 172.38 +6.02 ...31.32 5.82 Alpha&OmegaSem AOSL ... cc 30.86 +2.49 ...1932.08 1008.87 AlphabetA GOOGL ... 38 1892.56 +164.94 ...1934.86 1013.54 AlphabetC GOOG ... 38 1901.05 +164.86 ...14.97 2.19 Alphatec ATEC ... dd 14.81 +0.56 ...16.37 2.05 AlpineImmune ALPN ... dd 13.12 –0.04 ...63.14 23.04 AltairEngg ALTR ... dd 59.75 –0.15 ...35.10 1.60 Altimmune ALT ... dd 14.35 +1.42 ...19.87 6.00 AltisourcePortf ASPS ... dd 11.17 –1.05 ...
66.38 12.00 AltraIndlMotion AIMC .4 dd 56.43 –0.10 .0654.00 9.40 AltusMidstream ALTM 12.6 dd 47.76 –4.15 1.5019.43 7.90 AmalgamBank AMAL 2.1 11 15.03 –0.57 .0820.80 3.36 Amarin AMRN ... dd 6.55 +0.48 ...3552.25 1626.03 Amazon.com AMZN ... 96 3292.23 +187.98 ...113.81 36.02 Ambarella AMBA ... dd 112.90 +8.55 ...77.29 44.05 Amdocs DOX 1.9 19 70.78 +0.76 .3275314.41 132.95 Amedisys AMED ... 63 313.54 +19.65 ...20.60 9.01 AmerantBancorpA AMTB ... cc 15.30 +0.13 ...16.00 6.84 AmerantBancorpB AMTBB ... cc 12.50 ... ...487.32 222.34 Amerco UHAL .0 18 474.62 +1.45 2.008.10 3.52 AmerFirstMultifam ATAX 5.4 19 4.44 +0.06 .0630.78 8.25 AmerAirlines AAL .0 dd 15.82 +0.06 .10104.97 65.14 AEP AEP 3.6 21 82.08 +1.61 .7458.77 37.05 AmerElecPwrUn AEPPL 6.3 ... 48.47 +0.31 .765655.75 47.51 AmerElecPwrUn AEPPZ 6.2 ... 50.03 +0.83 .765613.66 4.20 AmericanFin AFIN 10.9 dd 7.82 +0.03 .212536.99 18.53 AmNtlBcsh AMNB 3.9 10 27.98 +0.17 .27115.35 63.93 AmericanNatl ANAT 3.5 8 95.07 –2.63 .8230.01 12.24 AmOutdoorBrands AOUT ... ... 19.84 +0.11 ...41.09 18.47 AmericanPubEdu APEI ... 26 29.58 –1.59 ...16.43 8.00 AmRvrBksh AMRB 2.1 12 13.31 +0.31 .0721.48 9.05 AmerSoftware AMSWA 2.2 cc 20.11 +0.55 .1131.78 4.40 AmerSupercond AMSC ... dd 29.35 +5.60 ...117.70 35.30 AmericanWoodmark AMWD ... 26 98.45 +1.79 ...129.70 35.18 AmerCarMart CRMT ... 14 125.74 +3.75 ...45.18 17.12 AmerisBancorp ABCB 1.4 13 44.32 +0.22 .154.19 2.36 AmeriServFin ASRV 2.8 13 3.58 –0.03 .025264.97 177.05 Amgen AMGN 2.8 20 253.50 +8.01 1.7625.39 6.25 AmicusTherap FOLD ... dd 21.09 –0.75 ...19.05 5.40 AmkorTech AMKR .9 14 18.47 +0.43 .0422.69 12.33 AmphastarPharm AMPH ... cc 18.70 +0.01 ...15.50 7.62 AmrytPharma AMYT ... ... 13.93 +0.43 ...7.96 3.55 AmtechSystems ASYS ... dd 7.61 +0.46 ...12.21 1.40 Amyris AMRS ... dd 10.39 –0.90 ...162.98 79.08 AnalogDevices ADI 1.6 47 155.58 –2.17 .6231.29 12.06 AnaptysBio ANAB ... dd 25.54 –0.57 ...26.22 10.00 Andersons ANDE 2.8 dd 25.25 +0.64 .17519.90 7.48 AngioDynamics ANGO ... dd 18.20 +0.19 ...47.48 22.01 AnikaTherap ANIK ... dd 38.96 –0.27 ...31.94 15.33 Annexon ANNX ... dd 27.02 –0.43 ...12.18 3.15 AnPacBioMed ANPC ... ... 5.92 +0.18 ...30.08 3.80 Apache APA .6 dd 16.38 –0.89 .02558.47 16.85 ApellisPharm APLS ... dd 45.68 –6.72 ...14.01 1.95 Aphria APHA ... dd 12.92 +0.50 ...38.80 13.77 ApogeeEnt APOG 2.1 14 37.88 +1.09 .205.15 1.24 ApolloEnd APEN ... dd 4.41 +0.51 ...17.68 5.20 ApolloInv AINV 10.1 dd 12.31 +0.15 .36186.59 81.01 AppFolio APPF ... 34 157.00 +4.08 ...216.41 29.07 Appian APPN ... dd 204.85 +35.15 ...139.85 53.15 Apple AAPL .6 43 139.07 +11.93 .2058.45 2.29 AppliedGenetic AGTC ... dd 4.74 +0.21 ...110.88 36.64 ApplMaterials AMAT .8 27 106.33 +3.19 .2239.47 17.05 AppliedMolecular AMTI ... dd 38.96 +3.95 ...17.57 5.00 AppliedOptoelec AAOI ... dd 10.47 –0.32 ...57.39 13.58 AppliedTherap APLT ... dd 19.73 –2.16 ...41.12 4.66 ApreaTherap APRE ... dd 5.71 +0.56 ...6.47 1.60 Aptinyx APTX ... dd 4.00 –0.12 ...18.25 1.16 Aptorum APM ... dd 3.60 +0.29 ...11.02 2.81 ApyxMedical APYX ... dd 10.97 +1.05 ...9.47 1.41 AquestiveTherap AQST ... dd 5.67 +0.34 ...14.94 3.34 Aravive ARAV ... dd 5.80 –0.06 ...9.02 0.88 ArbutusBiopharma ABUS ... dd 4.05 +0.14 ...50.39 13.54 ArcBest ARCB .7 31 48.44 +1.04 .0848.32 20.93 ArchCapital ACGL ... 12 33.31 –1.38 ...59.49 29.09 ArcoPlatform ARCE ... cc 35.95 –1.79 ...129.71 8.51 ArcturusTherap ARCT ... dd 67.70 +8.01 ...40.88 17.10 ArcutisBiotherap ARQT ... dd 26.81 –1.82 ...8.82 4.22 Ardelyx ARDX ... dd 7.22 +0.40 ...90.19 32.95 ArenaPharm ARNA ... dd 77.68 –2.82 ...19.33 7.90 AresCapital ARCC 9.1 23 17.50 +0.30 .40316.83 103.75 arGEN-X ARGX ... dd 310.98 +31.76 ...54.78 29.05 ArrayTech ARRY ... ... 51.05 +5.12 ...34.66 19.59 ArrowFinancial AROW 3.3 13 31.35 +0.27 .2686.75 19.51 ArrowheadPharm ARWR ... dd 82.07 +1.33 ...40.26 30.01 ArtesianRscsA ARTNA 2.7 21 38.39 –0.31 .257192.77 19.68 Arvinas ARVN ... dd 84.09 –6.51 ...183.98 92.00 AscendisPharma ASND ... dd 160.66 +2.73 ...2.53 0.83 AslanPharm ASLN ... dd 2.17 +0.25 ...13.17 4.65 AspenGroup ASPU ... dd 9.91 +0.12 ...147.53 73.07 AspenTech AZPN ... 46 142.38 +0.58 ...27.84 4.78 AssemblyBiosci ASMB ... dd 5.88 –0.25 ...68.83 25.17 AstecIndustries ASTE .7 cc 66.99 –0.07 .1164.94 36.15 AstraZeneca AZN 2.6 56 53.25 +1.91 .4528.38 6.30 Astronics ATRO ... dd 14.67 +0.53 ...14.00 5.29 AstroNova ALOT .0 dd 10.53 +0.13 .0728.20 4.52 AtaraBiotherap ATRA ... dd 18.44 –0.17 ...59.46 24.15 AteaPharm AVIR ... dd 54.27 +0.83 ...15.67 5.63 Athenex ATNX ... dd 12.38 +1.27 ...34.79 15.79 AthiraPharma ATHA ... ... 20.06 –6.49 ...3.48 1.58 AtlanticAmerican AAME ... 41 2.40 +0.07 ...20.21 8.89 AtlCapitalBcshs ACBI ... 16 17.52 +0.09 ...37.82 18.55 AtlUnionBkshs AUB 2.7 19 36.85 +0.37 .2547.15 17.74 AtlanticaSust AY 3.6 75 46.19 +2.19 .4229.90 5.00 Atlanticus ATLC ... 9 26.46 +2.30 ...69.08 14.97 AtlasAir AAWW ... dd 53.56 +0.30 ...14.14 4.95 AtlasTech ATCX ... dd 9.81 –0.27 ...250.03 110.01 Atlassian TEAM ... dd 235.45 +12.52 ...29.35 10.88 Atreca BCEL ... dd 15.09 +0.03 ...59.80 23.17 AtriCure ATRC ... dd 59.07 +2.47 ...755.00 567.00 Atrion ATRI 1.0 41 736.00 +2.00 1.7565.55 22.51 AuburnNatlBncp AUBN 2.4 18 41.85 –0.01 .25544.94 9.00 AudioCodes AUDC .8 cc 32.81 +2.09 .1420.48 9.83 AuriniaPharm AUPH ... dd 14.86 +1.55 ...6.06 1.40 AuroraMobile JG ... dd 3.98 +0.28 ...321.13 125.38 Autodesk ADSK ... cc 299.17 –9.34 ...
17.19 3.00 AutolusTherap AUTL ... dd 8.77 –0.25 ...182.32 103.11 ADP ADP 2.3 28 161.98 +0.86 .9313.49 4.00 AvadelPharm AVDL ... 21 6.75 +0.08 ...41.29 7.10 AviatNetworks AVNW ... 34 37.63 +2.06 ...18.43 4.67 AvidTechnology AVID ... 42 18.35 +2.08 ...37.46 23.06 AvidityBio RNA ... dd 25.88 –0.58 ...52.98 6.35 AvisBudget CAR ... dd 41.05 +2.06 ...42.89 17.85 Avnet AVT 2.1 dd 39.29 +0.68 .214.70 2.02 Aware AWRE ... dd 4.28 –0.16 ...40.62 12.99 AxcelisTechs ACLS ... 30 40.09 +5.17 ...7.73 2.25 AxcellaHealth AXLA ... dd 5.99 +0.30 ...171.73 50.05 AxonEnterprise AAXN ... dd 170.26 +19.49 ...56.67 15.25 AxonicsModul AXNX ... dd 56.55 +4.85 ...109.53 35.44 AxsomeTherap AXSM ... dd 74.65 –2.10 ...16.50 8.62 AyalaPharm AYLA ... ... 13.15 +0.21 ...18.00 10.55 AziyoBiologics AZYO ... ... 15.30 +0.31 ...
B6.18 1.51 BBQHoldings BBQ ... 10 6.14 +0.90 ...13.86 7.73 BCBBancorp BCBP 4.6 12 12.09 –0.13 .1412.03 2.01 BELLUSHealth BLU ... dd 3.84 +0.13 ...6.08 2.07 BGCPartners BGCP 1.0 32 3.86 +0.06 .0149.49 6.01 BJsRestaurants BJRI ... dd 45.21 –1.70 ...82.81 34.57 BOKFin BOKF 2.6 13 79.12 –0.13 .5233.56 8.35 BRPGroup BRP ... dd 26.07 –0.85 ...72.43 12.97 BRP DOOO .5 37 68.64 –0.40 .1152.79 12.94 BRileyFin RILY 3.1 30 47.86 –1.82 .37518.00 9.25 BTRS BTRS ... cc 16.62 –0.13 ...264.94 82.00 Baidu BIDU ... 26 252.75 +13.88 ...132.50 78.30 Balchem BCPC .5 46 117.83 –4.32 .5838.00 6.95 BallardPower BLDP ... dd 37.07 +6.25 ...65.74 26.00 BancFirst BANF 2.1 22 64.53 +0.36 .34198.61 50.89 Bandwidth BAND ... dd 169.23 +7.13 ...36.24 14.20 BankOZK OZK 3.1 16 35.96 +0.69 .277511.48 5.68 BankofCommerce BOCH 2.3 13 10.25 –0.05 .0632.00 17.40 BankofPrinceton BPRN 1.7 12 23.28 –0.92 .1018.98 5.58 Bank7 BSVN 2.7 8 15.28 –0.56 .1112.99 6.73 BankFinancial BFIN 4.4 14 9.07 –0.45 .1029.26 12.07 BankwellFin BWFG 2.8 18 20.35 +0.23 .1455.57 27.12 Banner BANR 3.2 16 51.83 +0.62 .4147.51 22.19 Baozun BZUN ... 45 34.80 –0.84 ...88.15 27.25 BarrettBus BBSI 1.8 14 67.86 +0.14 .3023.52 4.25 BassettFurniture BSET 1.9 dd 23.35 +1.96 .12523.50 9.67 BayCom BCML ... 13 15.30 –0.16 ...44.33 11.67 BeaconRoof BECN ... dd 42.60 +0.09 ...122.81 13.00 BeamTherap BEAM ... dd 99.51 –13.53 ...5.15 1.15 BeasleyBroadcast BBGI .0 dd 2.12 +0.11 .0531.45 3.43 BedBath BBBY .0 dd 30.21 +4.62 .17376.45 118.55 BeiGene BGNE ... dd 374.50 +29.50 ...16.71 6.08 BelFuseA BELFA 1.6 49 14.64 –0.61 .0619.82 6.30 BelFuseB BELFB 1.7 70 16.49 +0.11 .0719.98 6.09 Benefitfocus BNFT ... dd 13.99 ... ...54.62 27.00 BentleySystems BSY .3 ... 45.85 –5.72 .03113.53 50.26 BerkeleyLights BLI ... dd 81.03 –2.72 ...7.98 1.82 Berry(bry) BRY .0 dd 4.34 –0.37 .12197.50 48.18 BeyondMeat BYND ... dd 140.70 +0.60 ...33.00 10.26 BicycleTherap BCYC ... dd 26.80 –0.23 ...13.95 0.65 Big5SportingGds BGFV 3.3 7 12.13 +0.92 .10162.50 57.26 BigCommerce BIGC ... dd 71.25 +8.88 ...137.35 19.25 Bilibili BILI ... dd 133.75 +11.12 ...361.47 155.17 Bio-Techne TECH .4 57 356.59 +8.88 .3249.49 27.15 BioAtla BCAB ... ... 45.82 +0.44 ...9.78 1.58 BioCryst BCRX ... dd 9.21 +0.41 ...5.98 2.85 BioDeliverySci BDSI ... 30 4.14 –0.17 ...31.99 10.85 Biodesix BDSX ... ... 27.59 –0.41 ...374.99 223.25 Biogen BIIB ... 9 269.44 –6.40 ...131.95 68.25 BioMarinPharm BMRN ... 20 87.99 +5.02 ...131.00 28.00 BioNTech BNTX ... ... 108.44 +6.85 ...73.10 27.35 BioTelemetry BEAT ... cc 71.97 –0.28 ...46.25 17.63 BlackDiamond BDTX ... dd 26.14 –0.80 ...83.70 38.22 Blackbaud BLKB .0 cc 66.04 +2.33 .12141.82 38.32 BlackLine BL ... dd 135.02 +9.28 ...5.09 1.47 BlackRockCapInvt BKCC 13.8 dd 2.90 +0.18 .1014.76 4.02 BlkRkTCPCap TCPC 10.1 29 11.89 –0.07 .3023.65 4.54 BloominBrands BLMN 3.6 dd 22.15 +0.69 .2024.50 8.37 Blucora BCOR ... dd 17.09 +0.49 ...26.88 8.40 BlueBird BLBD ... 50 22.20 –0.19 ...94.50 38.95 bluebirdbio BLUE ... dd 46.64 –3.89 ...35.89 8.04 BlueCity BLCT ... dd 10.29 –0.58 ...2.20 0.53 BlueknightEner BKEP 7.8 dd 2.04 +0.02 .04125.61 43.29 BlueprintMed BPMC ... 19 101.36 +0.37 ...15.92 6.66 BoingoWireless WIFI ... dd 12.20 –0.10 ...2290.03 1107.29 BookingHldgs BKNG ... 62 2066.24 –52.99 ...13.53 5.00 BostonPrivFin BPFH 1.8 24 13.23 +0.53 .0657.22 27.82 Bottomline EPAY ... dd 51.69 –0.90 ...12.24 5.10 Brainsway BWAY ... dd 9.95 +1.86 ...32.23 16.51 BridgeBancorp BDGE 3.5 11 27.24 +0.26 .2471.84 14.23 BridgeBioPharma BBIO ... dd 69.48 +0.87 ...29.05 14.06 BridgfordFoods BRID ... 22 17.45 –0.53 ...19.46 5.44 Brightcove BCOV ... dd 18.93 +1.37 ...48.25 12.05 BrighthouseFin BHF ... dd 40.56 –1.61 ...469.47 155.67 Broadcom AVGO 3.1 74 465.02 +19.17 3.6019.55 7.10 BrookfieldProp BPY 7.8 dd 17.08 –0.17 .332519.51 7.15 BrookfieldPropREIT BPYU 7.7 dd 17.25 +0.04 .332516.00 8.13 BrooklineBcp BRKL 3.5 24 13.06 –0.10 .11585.64 21.19 BrooksAuto BRKS .5 96 84.42 +6.69 .1061.26 30.78 Bruker BRKR .3 60 60.84 +1.80 .0440.03 22.20 BrynMawrBank BMTC 3.2 20 33.37 –0.35 .2743.48 9.00 BuildersFirstSrc BLDR ... 23 42.88 +2.01 ...19.92 9.57 BurgerFiIntl BFI ... dd 13.36 –0.03 ...5.75 0.02 BurgerFiIntlWt BFIIW ... ... 2.05 –0.08 ...37.97 18.64 BurningRockBio BNR ... dd 36.64 +2.34 ...26.64 9.17 BusFirstBcshs BFST 1.9 16 21.38 +0.08 .10
C12.93 8.42 Cadiz CDZI ... dd 11.05 +0.04 ...54.36 28.00 C&FFin CFFI 3.9 8 39.48 +0.02 .3830.75 16.25 CBFinSvcs CBFV 4.9 dd 19.45 –0.37 .2431.50 12.50 CBTX CBTX 1.4 25 28.70 +1.17 .1057.00 29.12 CDKGlobal CDK 1.2 34 50.00 –1.70 .15146.95 73.39 CDW CDW 1.2 27 135.32 +1.66 .4069.79 20.45 CEVA CEVA ... cc 68.63 +14.70 ...41.40 22.40 C4Therap CCCC ... ... 39.58 +1.27 ...106.75 56.94 CHRobinson CHRW 2.1 29 97.80 +2.59 .5116.25 6.27 CimComm CMCT 1.9 dd 16.21 +2.36 .0756.05 1.62 CLPS CLPS ... 18 3.74 +0.39 ...174.99 85.26 CMCMaterials CCMP 1.1 35 167.54 +2.86 .44225.36 131.80 CMEGroup CME 1.8 31 184.04 –7.78 2.5031.44 13.25 CNBFinPA CCNE 3.0 10 22.95 –0.57 .1761.69 22.51 CompassPath CMPS ... ... 48.32 +5.82 ...61.39 21.96 CRA Intl CRAI 1.7 21 59.75 +1.95 .26220.20 32.30 CRISPRTherap CRSP ... dd 188.49 –11.39 ...54.92 36.33 CSGSystems CSGS 2.1 22 45.78 +2.60 .2352.25 0.35 CSICompressco CCLP 3.4 dd 1.17 –0.03 .0115.85 4.51 CSP CSPI .0 dd 11.30 –0.13 .15127.64 50.13 CSWIndustrials CSWI .4 38 126.00 +1.14 .13597.54 46.81 CSX CSX 1.2 24 87.64 –5.78 .2622.22 14.92 CVBFin CVBF 3.3 17 21.55 +0.44 .1819.63 5.51 CabalettaBio CABA ... dd 14.22 +1.18 ...142.11 51.39 CadenceDesign CDNS ... 36 137.42 +2.78 ...82.34 6.02 CaesarsEnt CZR ... dd 79.53 –0.47 ...15.00 7.65 Caesarstone CSTE 4.1 51 13.76 +0.73 .1446.66 30.74 Cal-MaineFoods CALM ... 27 37.43 +0.96 ...11.47 3.70 CalAmp CAMP ... dd 11.44 +1.05 ...81.44 48.31 CalavoGrowers CVGW 1.6 dd 74.06 +0.77 1.1521.00 9.11 CaliforniaBncp CALB ... 39 14.81 –0.19 ...8.18 2.46 CalitheraBiosci CALA ... dd 3.10 –0.23 ...38.00 19.00 CalliditasTherap CALT ... dd 32.92 +2.82 ...4.70 0.82 CalumetSpecialty CLMT ... dd 3.62 +0.42 ...8.66 2.40 Calyxt CLXT ... dd 7.91 +1.85 ...34.57 3.57 CambiumNtwks CMBM ... cc 34.45 +5.85 ...48.48 25.74 CamdenNational CAC 3.4 10 38.34 –0.19 .3325.72 6.27 Camtek CAMT ... 50 23.71 –0.69 ...8.69 1.76 Canaan CAN ... dd 4.91 +0.06 ...64.49 12.00 CanadianSolar CSIQ ... 18 63.00 +11.73 ...24.90 9.21 Canoo GOEV ... dd 17.00 +0.10 ...6.70 0.15 CanooWt GOEVW ... ... 4.81 –0.16 ...35.08 9.00 CanopyGrowth CGC ... dd 33.80 +0.41 ...18.00 7.80 CanterburyPark CPHC ... 42 13.29 +0.04 ...14.98 6.98 CapitalBancorp CBNK ... 10 14.65 +0.19 ...30.58 15.61 CapitalCityBank CCBG 2.4 13 24.57 –0.93 .1513.40 5.18 CapitalProduct CPLP 4.3 6 9.27 –0.34 .1021.71 7.39 CapitalSouthwest CSWC 9.0 dd 18.31 +0.02 .1055.20 8.40 CapitalaFinance CPTA .0 dd 16.48 +2.16 .499813.88 8.75 CapitolFedFin CFFN 2.6 28 13.18 –0.04 .1316.39 7.44 CapStarFin CSTR 1.3 14 15.09 –0.48 .0521.64 8.88 CaraTherap CARA ... dd 19.15 +0.59 ...53.46 26.00 CardiovascularSys CSII ... dd 46.65 +1.98 ...150.46 27.33 Cardlytics CDLX ... dd 122.02 +6.58 ...46.75 15.71 Cardtronics CATM ... 84 40.86 +0.15 ...99.83 13.04 CareDx CDNA ... dd 85.43 –2.72 ...23.83 7.16 CareTrustREIT CTRE 4.3 27 23.01 +0.57 .2537.57 14.25 CarGurus CARG ... 55 31.41 –0.49 ...12.70 9.50 CarLotz LOTZ ... cc 11.92 +0.39 ...3.10 0.44 CarLotzWt LOTZW ... ... 2.52 –0.19 ...34.98 15.21 Carlyle CG 3.0 dd 33.40 –0.30 .2517.29 1.04 CarParts.com PRTS ... dd 12.34 –0.67 ...
7.57 0.98 CarrolsRestr TAST ... dd 6.90 +0.02 ...21.02 6.30 CarterBkshrs CARE .0 dd 11.30 –0.72 .148.61 1.85 CasaSystems CASA ... dd 7.94 +0.05 ...63.58 34.35 CasellaWaste CWST ... 78 59.71 +4.57 ...199.46 114.01 CaseysGenStores CASY .7 22 197.41 +10.68 .3457.94 28.85 CassInfoSys CASS 2.7 23 40.18 –1.41 .2784.00 21.01 CastleBiosci CSTL ... dd 79.17 +5.03 ...8.59 1.25 CatabasisPharm CATB ... dd 2.73 +0.12 ...38.00 17.58 CathayGenBncp CATY 3.4 13 36.82 +0.23 .31236.10 99.58 CavcoIndustries CVCO ... 28 195.10 +6.80 ...9.00 3.53 CECOEnv CECE ... 18 7.49 –0.14 ...34.71 7.32 Cellectis CLLS ... dd 31.27 +0.36 ...19.50 11.48 CellularBiomed CBMG ... dd 18.24 +0.13 ...13.01 4.10 CelyadOncology CYAD ... dd 8.34 –0.03 ...28.71 9.25 Centogene CNTG ... dd 12.24 +0.69 ...44.80 23.82 CentralGarden CENT ... 19 42.51 +1.53 ...41.10 21.66 CentralGardenA CENTA ... 18 39.54 +1.74 ...14.40 2.91 CenturyAluminum CENX ... dd 11.46 –1.64 ...91.51 51.40 CenturyBancorpA CNBKA .9 12 83.36 +3.61 .186.90 0.99 Ceragon CRNT ... dd 5.06 +0.21 ...126.12 11.39 Cerence CRNC ... dd 124.71 +4.46 ...81.75 53.08 Cerner CERN 1.1 31 79.90 –0.31 .2241.79 29.70 Certara CERT ... ... 37.33 +0.99 ...8.87 2.71 Cerus CERS ... dd 7.26 +0.01 ...29.02 2.89 ChampionX CHX ... dd 17.18 –0.51 ...24.21 6.18 ChangeHlthcr CHNG ... dd 24.05 +0.05 ...81.63 30.71 ChangeHlthcrUn CHNGU 3.7 ... 81.32 +0.25 .75143.18 15.00 ChartIndustries GTLS ... 81 142.72 +7.84 ...681.71 345.67 CharterComms CHTR ... 51 646.69 +17.78 ...139.26 80.06 CheckPoint CHKP ... 22 129.40 +1.79 ...23.10 8.61 CheckmatePharm CMPI ... dd 14.90 +1.66 ...43.86 14.52 Cheesecake CAKE .0 dd 42.36 +1.14 .3640.33 3.55 ChefsWarehouse CHEF ... dd 28.62 +2.23 ...65.43 30.72 ChemoCentryx CCXI ... dd 64.40 +2.38 ...41.39 21.75 ChemungFinl CHMG 3.0 9 34.69 –0.65 .267.75 2.88 Chiasma CHMA ... dd 4.20 +0.28 ...27.99 4.66 ChickenSoupA CSSE ... dd 24.00 –1.53 ...72.50 9.25 Children'sPlace PLCE ... dd 64.41 +7.14 ...10.72 1.19 Chimerix CMRX ... dd 9.28 +1.34 ...119.29 97.91 ChinaBiologic CBPO ... 33 118.26 –0.08 ...31.40 3.65 ChinaFinance JRJC ... dd 9.50 +0.88 ...3.25 0.94 ChinaIndex CIH ... 5 2.08 +0.04 ...2.14 0.63 ChinaXDPlastics CXDC ... dd 1.14 +0.07 ...24.30 13.12 Chindata CD ... dd 18.10 +0.44 ...21.68 6.70 ChinookTherap KDNY ... dd 15.03 –0.17 ...26.61 15.00 ChipMOSTechs IMOS ... 13 26.51 +1.23 ...218.46 52.90 ChurchillDowns CHDN .3 dd 214.36 +7.03 .62234.98 7.28 Chuy's CHUY ... dd 34.93 +1.76 ...4.45 1.30 CidaraTherap CDTX ... dd 2.51 +0.16 ...126.36 40.80 Cimpress CMPR ... 64 96.18 +2.38 ...115.53 46.07 CincinnatiFin CINF 2.7 18 87.32 –6.38 .606.00 0.25 Cinedigm CIDM ... dd 1.38 +0.55 ...369.20 154.33 Cintas CTAS .9 36 324.48 –1.59 .75103.25 47.04 CirrusLogic CRUS ... 38 98.56 –0.20 ...50.28 32.40 CiscoSystems CSCO 3.2 18 44.77 –0.66 .3664.74 6.70 CitiTrends CTRN .0 43 61.27 –0.36 .0812.32 5.26 CtznCmntyBcp CZWI 1.9 10 10.80 –0.29 .2127.94 16.02 CitizensHolding CIZN 4.6 17 20.79 +0.33 .24173.56 100.31 CitrixSystems CTXS 1.2 27 126.75 –5.25 .3780.40 53.06 CityHolding CHCO 3.2 13 71.47 +0.42 .5817.75 7.85 Clarus CLAR .6 47 16.09 +0.40 .02511.66 1.05 CleanEnerFuels CLNE ... 65 10.57 +0.76 ...34.65 8.32 Clearfield CLFD ... 61 33.05 +5.71 ...4.32 1.10 ClearsideBiomed CLSD ... dd 3.79 –0.22 ...17.45 9.87 CloverHealth CLOV ... dd 13.55 +0.31 ...5.45 1.33 CloverHealthWt CLOVW ... ... 3.58 +0.36 ...
FIVE-DAY NASDAQ COMPOSITE
Monday Tuesday Wednesday Thursday Friday13580
13425
13270
13115
1296010 12 2 4pm 10 12 2 4pm 10 12 2 4pm 10 12 2 4pm 10 12 2 4pm
HOLIDAY +198.68 +260.07 +73.67 +12.15
(Prev Fri'sClose)
New Leaf: President Biden quickly boosted green energy. Netflix’s sub-scribers topped 200 million. Bitcoin prices faltered. The Nasdaq Com-posite Index finished Friday at 13,543—higher by 4% for the week.
NOTICE TO READERS:Sign up for the Weekly Market Lab Newsletter: barrons.com/newsletters
Please visit the new Market Lab home page on barrons.com under Data.www.barrons.com/market-data/market-lab
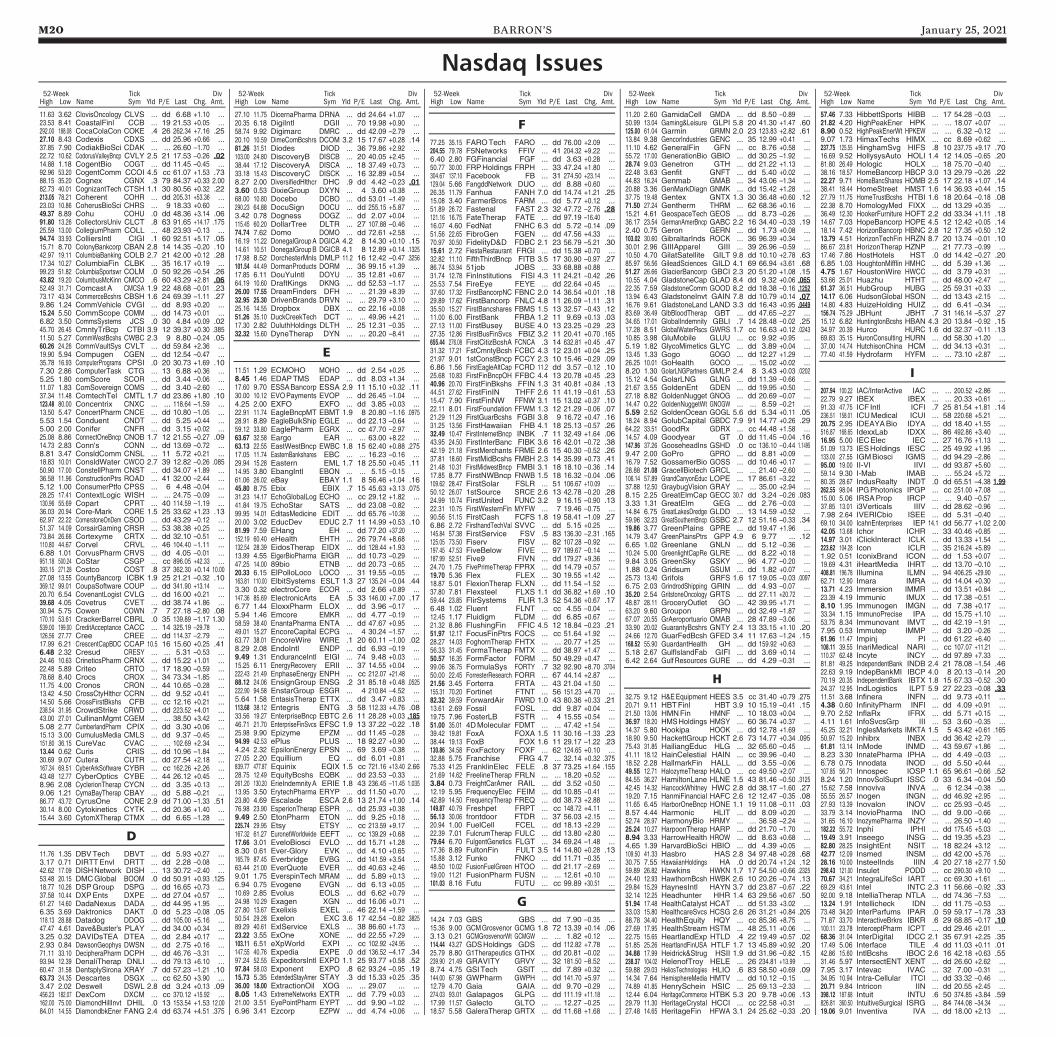
M20 BARRON’S January 25, 2021
11.63 3.62 ClovisOncology CLVS ... dd 6.68 +1.10 ...23.53 8.41 CoastalFinl CCB ... 19 21.53 +0.05 ...292.00 188.08 CocaColaCon COKE .4 26 262.34 +7.16 .2527.10 8.43 Codexis CDXS ... dd 25.96 +0.66 ...37.85 7.90 CodiakBioSci CDAK ... ... 26.60 –1.70 ...22.72 10.62 CodorusValleyBncp CVLY 2.5 21 17.53 –0.26 .0214.88 1.18 CogentBio COGT ... dd 11.45 –0.45 ...92.96 53.20 CogentComm CCOI 4.5 cc 61.07 +1.53 .7388.15 35.20 Cognex CGNX .3 79 84.37 +0.33 2.0082.73 40.01 CognizantTech CTSH 1.1 30 80.56 +0.32 .22213.05 78.21 Coherent COHR ... dd 205.31 +53.36 ...23.03 10.86 CoherusBioSci CHRS ... 9 18.33 +0.60 ...49.37 8.89 Cohu COHU .0 dd 48.36 +3.14 .0691.80 13.26 CollectorsUniv CLCT .8 63 91.65 +14.17 .17525.59 13.00 CollegiumPharm COLL ... 48 23.93 –0.13 ...94.74 33.93 ColliersIntl CIGI .1 60 92.51 +5.17 .0515.71 8.70 ColonyBankcorp CBAN 2.8 14 14.35 –0.20 .1042.97 19.11 ColumbiaBanking COLB 2.7 21 42.00 +0.12 .2817.34 10.27 ColumbiaFin CLBK ... 35 16.17 +0.19 ...99.23 51.82 ColumbiaSportswr COLM .0 50 92.26 –0.54 .2643.82 19.20 ColumbusMcKinn CMCO .6 60 43.29 +2.81 .0652.49 31.71 ComcastA CMCSA 1.9 22 48.68 –0.01 .2373.17 43.34 CommerceBcshrs CBSH 1.6 24 69.39 –1.11 .279.86 1.24 CommVehicle CVGI ... dd 8.93 +0.20 ...15.24 5.50 CommScope COMM ... dd 14.73 +0.01 ...6.82 3.50 CommsSystems JCS .0 30 4.84 +0.09 .0245.70 26.45 CmntyTrBcp CTBI 3.9 12 39.37 +0.30 .38511.50 5.27 CommWestBcshs CWBC 2.3 9 8.80 –0.24 .0560.26 24.26 CommVaultSys CVLT ... dd 59.84 +2.36 ...19.90 5.94 Compugen CGEN ... dd 12.54 –0.47 ...35.78 16.93 ComputerPrograms CPSI .0 20 30.73 +1.69 .107.30 2.86 ComputerTask CTG ... 13 6.88 +0.36 ...5.25 1.80 comScore SCOR ... dd 3.44 –0.06 ...11.07 1.83 ComSovereign COMS ... dd 3.40 –2.60 ...37.34 11.48 ComtechTel CMTL 1.7 dd 23.86 +1.80 .10123.48 80.00 Concentrix CNXC ... ... 118.64 –1.59 ...13.50 5.47 ConcertPharm CNCE ... dd 10.80 –1.05 ...5.53 1.54 Conduent CNDT ... dd 5.25 +0.44 ...5.00 2.00 Conifer CNFR ... dd 3.15 +0.02 ...25.08 8.86 ConnectOneBncp CNOB 1.7 12 21.55 –0.27 .0914.73 2.83 Conn's CONN ... dd 13.69 –0.72 ...8.81 3.47 ConsldComm CNSL ... 11 5.72 +0.21 ...18.83 10.01 ConsldWater CWCO 2.7 39 12.82 –0.26 .08550.90 17.00 ConstellPharm CNST ... dd 34.07 +1.89 ...36.58 11.96 ConstructionPtrs ROAD ... 41 32.00 –2.44 ...5.12 1.00 ConsumerPtfo CPSS ... 6 4.48 –0.04 ...28.25 17.41 ContextLogic WISH ... ... 24.75 –0.09 ...130.96 55.69 Copart CPRT ... 40 114.59 –1.19 ...36.03 20.94 Core-Mark CORE 1.5 25 33.62 +1.23 .1362.97 22.22 CornerstoneOnDem CSOD ... dd 43.29 –0.12 ...51.37 14.09 CorsairGaming CRSR ... 53 38.38 +0.25 ...73.84 26.66 Cortexyme CRTX ... dd 32.10 –0.51 ...110.80 44.67 Corvel CRVL ... 46 104.40 –1.11 ...6.88 1.01 CorvusPharm CRVS ... dd 4.05 –0.01 ...951.18 500.24 CoStar CSGP ... cc 896.05 +42.33 ...393.15 271.28 Costco COST .8 37 362.30 +0.14 10.0027.08 13.55 CountyBancorp ICBK 1.9 25 21.21 –0.32 .10369.12 99.01 CoupaSoftware COUP ... dd 341.90 +13.14 ...20.70 6.54 CovenantLogist CVLG ... dd 16.00 +0.21 ...39.68 4.05 Covetrus CVET ... dd 38.74 +1.86 ...30.94 5.75 Cowen COWN .7 7 27.18 –2.80 .08170.10 53.61 CrackerBarrel CBRL .0 35 139.89 –1.17 1.30539.00 199.00 CreditAcceptance CACC ... 14 325.19 –29.78 ...126.56 27.77 Cree CREE ... dd 114.37 –2.79 ...17.99 6.21 CrescentCapBDC CCAP 10.5 16 15.60 +0.25 .416.48 2.32 Cresud CRESY ... ... 5.31 –0.53 ...24.46 10.63 CrineticsPharm CRNX ... dd 15.22 +1.01 ...22.48 5.89 Criteo CRTO ... 17 18.90 –0.59 ...78.68 8.40 Crocs CROX ... 34 73.34 –1.85 ...11.75 4.00 Cronos CRON ... 44 10.65 –0.28 ...13.42 4.50 CrossCtyHlthcr CCRN ... dd 9.52 +0.41 ...14.50 5.66 CrossFirstBkshs CFB ... cc 12.16 +0.21 ...238.54 31.95 CrowdStrike CRWD ... dd 223.52 +4.01 ...43.00 27.01 CullinanMgmt CGEM ... ... 38.50 +3.42 ...5.08 2.77 CumberlandPharm CPIX ... dd 3.30 +0.06 ...15.13 3.00 CumulusMedia CMLS ... dd 9.37 –0.45 ...151.80 36.15 CureVac CVAC ... ... 102.69 +2.34 ...13.44 0.62 Curis CRIS ... dd 10.96 –1.84 ...30.69 9.07 Cutera CUTR ... dd 27.54 +2.18 ...167.34 69.51 CyberArkSoftware CYBR ... cc 162.26 +2.26 ...43.48 12.77 CyberOptics CYBE ... 44 26.12 +0.45 ...8.96 2.08 CyclerionTherap CYCN ... dd 3.35 +0.13 ...9.06 1.21 CymaBayTherap CBAY ... dd 5.88 –0.21 ...86.77 43.72 CyrusOne CONE 2.9 dd 71.00 –1.33 .5130.14 8.00 Cytokinetics CYTK ... dd 20.36 +1.40 ...15.44 3.60 CytomXTherap CTMX ... dd 6.65 –1.28 ...
D11.76 1.35 DBVTech DBVT ... dd 5.93 +0.27 ...3.17 0.71 DIRTTEnvl DRTT ... dd 2.28 –0.08 ...42.62 17.09 DISHNetwork DISH ... 13 30.72 –2.40 ...53.48 20.15 DMCGlobal BOOM .0 dd 50.91 +0.93 .12518.77 10.26 DSPGroup DSPG ... dd 16.65 +0.73 ...37.58 10.44 DXPEnts DXPE ... dd 27.04 +0.57 ...61.27 14.60 DadaNexus DADA ... dd 44.95 +1.95 ...6.35 3.69 Daktronics DAKT .0 dd 5.23 –0.08 .05118.13 28.88 Datadog DDOG ... dd 105.00 +5.16 ...47.47 4.61 Dave&Buster's PLAY ... dd 34.00 +0.34 ...3.25 0.32 DAVIDsTEA DTEA ... dd 2.84 +0.17 ...2.93 0.84 DawsonGeophys DWSN ... dd 2.75 +0.16 ...71.11 33.10 DecipheraPharm DCPH ... dd 46.76 –3.31 ...93.94 12.39 DenaliTherap DNLI ... dd 79.13 +6.10 ...60.47 31.58 DentsplySirona XRAY .7 dd 57.23 –1.21 .1063.73 24.35 Descartes DSGX ... cc 62.50 +3.90 ...3.47 2.02 Deswell DSWL 2.8 dd 3.24 +0.13 .09456.23 182.07 DexCom DXCM ... cc 370.12 +15.92 ...162.00 75.00 DiamondHillInvt DHIL .0 13 153.54 +1.53 12.0084.01 14.55 DiamondbkEner FANG 2.4 dd 63.74 +4.51 .375
27.10 11.75 DicernaPharma DRNA ... dd 24.64 +1.07 ...20.35 6.18 DigiIntl DGII ... 70 19.98 +0.90 ...58.74 9.92 Digimarc DMRC ... dd 42.09 –2.79 ...20.10 10.59 DimeComBcshrs DCOM 3.2 15 17.67 +0.28 .1481.26 31.51 Diodes DIOD ... 36 79.86 +2.92 ...103.00 24.80 DiscoveryB DISCB ... 20 40.05 +2.45 ...38.44 17.12 DiscoveryA DISCA ... 18 37.49 +0.73 ...33.18 15.43 DiscoveryC DISCK ... 16 32.89 +0.54 ...8.27 2.00 DiversifiedHlthcr DHC .9 dd 4.42 –0.23 .013.60 0.53 DixieGroup DXYN ... 4 3.60 +0.38 ...68.00 10.80 Docebo DCBO ... dd 53.01 –1.49 ...290.23 64.88 DocuSign DOCU ... dd 255.15 +5.87 ...3.42 0.78 Dogness DOGZ ... dd 2.07 +0.04 ...115.45 60.20 DollarTree DLTR ... 27 107.88 –0.46 ...74.74 7.62 Domo DOMO ... dd 72.61 +2.58 ...16.19 11.22 DonegalGroupA DGICA 4.2 8 14.30 +0.10 .1514.61 10.51 DonegalGroupB DGICB 4.1 8 12.89 +0.14 .132517.98 8.52 DorchesterMnls DMLP 11.2 16 12.42 –0.47 .3256101.54 44.49 DormanProducts DORM ... 36 99.15 +1.39 ...17.85 6.11 DouYuIntl DOYU ... 35 12.81 +0.67 ...64.19 10.60 DraftKings DKNG ... dd 52.53 –1.17 ...26.00 17.55 DreamFinders DFH ... ... 21.39 +8.39 ...32.95 25.30 DrivenBrands DRVN ... ... 29.79 +3.10 ...25.16 14.55 Dropbox DBX ... cc 22.16 +0.08 ...51.26 35.10 DuckCreekTech DCT ... ... 49.96 +4.21 ...17.30 2.82 DuluthHoldings DLTH ... 25 12.31 –0.35 ...32.32 15.60 DyneTherap DYN ... ... 20.20 –8.41 ...
E11.51 1.29 ECMOHO MOHO ... dd 2.54 +0.25 ...8.45 1.46 EDAPTMS EDAP ... dd 8.03 +1.34 ...17.60 9.70 ESSABancorp ESSA 2.9 11 15.10 +0.32 .1130.00 10.12 EVOPayments EVOP ... dd 26.45 –1.04 ...4.25 2.00 EXFO EXFO ... dd 3.85 +0.03 ...22.91 11.74 EagleBncpMT EBMT 1.9 8 20.80 –1.16 .097528.91 8.89 EagleBulkShip EGLE ... dd 22.13 –0.64 ...59.12 33.80 EaglePharm EGRX ... cc 47.70 –2.97 ...63.67 32.58 Eargo EAR ... ... 63.00 +8.22 ...63.13 22.55 EastWestBncp EWBC 1.8 15 62.40 +0.88 .27517.05 11.74 EasternBankshares EBC ... ... 16.23 –0.16 ...29.94 15.28 Eastern EML 1.7 18 25.50 +0.45 .1114.95 3.80 EbangIntl EBON ... ... 5.15 –0.15 ...61.06 26.02 eBay EBAY 1.1 8 56.46 +1.04 .1645.80 8.75 Ebix EBIX .7 15 45.63 +3.13 .07531.23 14.17 EchoGlobalLog ECHO ... cc 29.12 +1.82 ...41.84 19.75 EchoStar SATS ... dd 23.08 –0.82 ...99.95 14.01 EditasMedicine EDIT ... dd 65.76 –10.38 ...20.00 3.02 EducDev EDUC 2.7 11 14.99 +0.53 .1081.99 7.59 EHang EH ... dd 77.20 +37.20 ...152.19 60.40 eHealth EHTH ... 26 79.74 +8.68 ...132.54 28.39 EidosTherap EIDX ... dd 128.44 +1.93 ...13.99 4.55 EigerBioPharma EIGR ... dd 10.73 –0.29 ...47.25 14.00 89bio ETNB ... dd 20.73 –0.65 ...20.33 6.15 ElPolloLoco LOCO ... 31 19.55 –0.05 ...163.81 110.00 ElbitSystems ESLT 1.3 27 135.24 –0.04 .443.30 0.32 electroCore ECOR ... dd 2.66 +0.89 ...147.36 85.69 ElectronicArts EA .5 33 146.00 +7.00 .176.77 1.44 EloxxPharm ELOX ... dd 3.96 –0.17 ...5.94 1.46 Emcore EMKR ... dd 4.77 –0.19 ...58.59 38.40 EnantaPharma ENTA ... dd 47.67 +0.95 ...49.01 15.27 EncoreCapital ECPG ... 4 30.24 –1.57 ...63.77 38.01 EncoreWire WIRE .1 20 60.11 –1.00 .028.29 2.08 EndoIntl ENDP ... dd 6.93 –0.19 ...9.49 1.31 EnduranceIntl EIGI ... 74 9.48 +0.03 ...15.25 6.11 EnergyRecovery ERII ... 37 14.55 +0.04 ...222.43 21.49 EnphaseEnergy ENPH ... cc 212.07 +21.48 ...88.12 24.06 EnsignGroup ENSG .2 31 85.18 +0.48 .0525222.90 94.58 EnstarGroup ESGR ... 4 210.84 –4.52 ...5.64 1.58 EntasisTherap ETTX ... dd 3.47 +0.83 ...113.68 38.12 Entegris ENTG .3 58 112.33 +4.76 .0833.56 19.27 EnterpriseBncp EBTC 2.6 11 28.28 +0.03 .18546.71 21.70 EnterpriseFinSvcs EFSC 1.9 13 37.22 –0.22 .1825.98 9.90 Epizyme EPZM ... dd 11.45 –0.28 ...94.99 42.53 ePlus PLUS ... 18 92.27 +0.90 ...4.24 2.32 EpsilonEnergy EPSN ... 69 3.69 –0.38 ...27.05 2.20 Equillium EQ ... dd 6.01 +0.81 ...839.77 477.87 Equinix EQIX 1.5 cc 721.16 +13.40 2.6628.75 12.49 EquityBcshs EQBK ... dd 23.53 –0.33 ...261.20 130.20 ErieIndemnityA ERIE 1.8 43 236.45 –11.45 1.03513.95 3.50 ErytechPharma ERYP ... dd 11.50 +0.70 ...23.80 4.69 Escalade ESCA 2.6 13 21.74 +1.00 .1476.98 23.90 EsperionTherap ESPR ... dd 25.93 +0.38 ...9.49 2.50 EtonPharm ETON ... dd 9.25 +0.18 ...225.74 29.95 Etsy ETSY ... cc 213.59 +9.17 ...167.32 61.27 EuronetWorldwide EEFT ... cc 139.29 +0.68 ...17.66 3.01 EveloBiosci EVLO ... dd 15.71 +1.28 ...8.30 0.61 Ever-Glory EVK ... dd 4.10 +0.65 ...165.79 87.45 Everbridge EVBG ... dd 141.59 +3.54 ...63.44 21.00 EverQuote EVER ... dd 40.63 +2.46 ...9.01 1.75 EverspinTech MRAM ... dd 5.89 +0.13 ...6.94 0.75 Evogene EVGN ... dd 6.13 +0.05 ...10.69 2.85 Evolus EOLS ... dd 6.62 +0.79 ...24.98 10.29 Exagen XGN ... dd 16.06 +0.71 ...27.80 13.67 Exelixis EXEL ... 46 22.14 –1.59 ...50.54 29.28 Exelon EXC 3.6 17 42.54 –0.82 .382589.29 40.61 ExlService EXLS ... 38 86.60 +1.73 ...23.22 3.55 ExOne XONE ... dd 22.55 +7.29 ...103.11 6.51 eXpWorld EXPI ... cc 102.92 +24.95 ...147.55 40.76 Expedia EXPE .0 dd 136.52 –4.17 .3497.24 52.55 ExpeditorsIntl EXPD 1.1 25 93.77 +0.58 .5297.84 58.03 Exponent EXPO .8 62 93.24 –0.95 .1915.73 5.35 ExtendedStayAmer STAY .3 dd 15.33 +0.25 .3536.00 18.00 ExtractionOil XOG ... ... 29.07 ... ...8.05 1.43 ExtremeNetworks EXTR ... dd 7.79 +0.03 ...21.00 3.51 EyePointPharm EYPT ... dd 9.90 –1.02 ...6.96 3.41 Ezcorp EZPW ... dd 4.74 +0.06 ...
F77.25 35.15 FAROTech FARO ... dd 76.00 +2.09 ...204.55 79.78 F5Networks FFIV ... 41 204.32 +9.22 ...6.40 2.80 FGFinancial FGF ... dd 3.63 +0.28 ...50.77 30.00 FRPHoldings FRPH ... 33 47.24 +1.80 ...304.67 137.10 Facebook FB ... 31 274.50 +23.14 ...129.04 5.66 FangddNetwork DUO ... dd 8.88 +0.60 ...26.35 11.79 Fanhua FANH 7.0 dd 14.74 +1.21 .2515.08 3.40 FarmerBros FARM ... dd 5.77 +0.12 ...51.89 26.72 Fastenal FAST 2.3 32 47.72 –2.76 .28121.16 16.75 FateTherap FATE ... dd 97.19 –16.40 ...16.07 4.60 FedNat FNHC 6.3 dd 5.72 –0.14 .0951.56 22.65 FibroGen FGEN ... dd 47.56 +4.33 ...70.97 30.50 FidelityD&D FDBC 2.1 23 56.79 –5.21 .3015.61 2.72 FiestaRestaurant FRGI ... dd 15.38 +0.70 ...32.82 11.10 FifthThirdBncp FITB 3.5 17 30.90 –0.97 .2786.74 53.94 51job JOBS ... 33 68.88 +0.88 ...31.74 12.78 FinInstitutions FISI 4.3 11 24.21 –0.42 .2625.53 7.54 FireEye FEYE ... dd 22.64 +0.45 ...37.60 17.32 FirstBancorpNC FBNC 2.0 14 36.54 +0.01 .1829.89 17.62 FirstBancorp FNLC 4.8 11 26.09 –1.11 .3135.50 15.27 FirstBancshares FBMS 1.5 13 32.57 –0.43 .1211.00 6.00 FirstBank FRBA 1.2 11 9.69 +0.13 .0327.13 11.00 FirstBusey BUSE 4.0 13 23.25 –0.29 .2327.35 12.86 FirstBusFinSvcs FBIZ 3.2 11 20.41 +0.70 .165655.44 276.08 FirstCitizBcshA FCNCA .3 14 632.81 +0.45 .4731.32 17.21 FstCmntyBcsh FCBC 4.3 12 23.01 +0.04 .2521.97 9.01 1stConstBncp FCCY 2.3 10 15.46 –0.29 .096.86 1.56 FirstEagleAltCap FCRD 11.2 dd 3.57 –0.12 .1025.68 10.83 FirstFinBncpOH FFBC 4.4 13 20.78 +0.45 .2340.96 20.70 FirstFinBkshs FFIN 1.3 31 40.81 +0.84 .1344.51 27.62 FirstFinIN THFF 2.6 11 41.19 –0.61 .5315.47 7.90 FirstFinNW FFNW 3.1 15 13.02 +0.37 .1022.11 8.01 FirstFoundation FFWM 1.3 12 21.29 –0.06 .0721.29 11.29 FirstGuarBcshs FGBI 3.8 9 16.72 +0.47 .1631.25 13.56 FirstHawaiian FHB 4.1 18 25.13 –0.57 .2632.49 10.47 FirstInternetBncp INBK .7 11 32.49 +1.64 .0643.95 24.50 FirstInterBanc FIBK 3.6 16 42.01 –0.72 .3842.19 21.18 FirstMerchants FRME 2.6 15 40.30 –0.52 .2637.81 18.60 FirstMidBcshs FMBH 2.3 14 35.99 +0.73 .4121.48 10.31 FirstMidwestBncp FMBI 3.1 18 18.10 –0.36 .1417.85 8.77 FirstNWBncp FNWB 1.5 18 16.32 –0.04 .06109.62 28.47 FirstSolar FSLR ... 51 106.67 +10.09 ...50.12 26.07 1stSource SRCE 2.6 13 42.78 –0.20 .2824.99 10.74 FirstUnited FUNC 3.2 9 16.15 –0.90 .1322.31 10.75 FirstWesternFin MYFW ... 7 19.46 –0.75 ...90.56 51.15 FirstCash FCFS 1.8 19 58.41 –1.09 .276.86 2.72 FirsthandTechVal SVVC ... dd 5.15 +0.25 ...145.84 57.38 FirstService FSV .5 83 136.30 –2.31 .165125.05 73.50 Fiserv FISV ... 82 107.28 –0.92 ...197.45 47.53 FiveBelow FIVE ... 97 189.67 –0.14 ...187.99 52.51 Five9 FIVN ... dd 179.27 +9.36 ...24.70 1.75 FivePrimeTherap FPRX ... dd 14.79 +0.57 ...19.70 5.36 Flex FLEX ... 30 19.55 +1.42 ...18.87 5.01 FlexionTherap FLXN ... dd 11.54 –1.52 ...37.80 7.81 Flexsteel FLXS 1.1 dd 36.82 +1.69 .1059.44 23.85 FlirSystems FLIR 1.3 52 54.36 +0.67 .176.48 1.02 Fluent FLNT ... cc 4.55 –0.04 ...12.45 1.17 Fluidigm FLDM ... dd 6.85 +0.67 ...21.32 8.86 FlushingFin FFIC 4.5 12 18.84 –0.23 .2151.97 12.17 FocusFinPtrs FOCS ... cc 51.64 +1.92 ...28.27 14.03 FoghornTherap FHTX ... ... 20.77 +1.25 ...56.33 31.45 FormaTherap FMTX ... dd 38.97 +1.47 ...50.57 16.35 FormFactor FORM ... 50 49.29 +0.47 ...99.06 36.75 FormulaSys FORTY .7 32 92.90 +8.70 .370450.00 22.45 ForresterResearch FORR ... 67 44.14 +2.87 ...21.56 3.45 Forterra FRTA ... 43 21.04 +1.50 ...155.31 70.20 Fortinet FTNT ... 56 151.23 +4.70 ...82.32 39.59 ForwardAir FWRD 1.0 43 80.36 +0.33 .2113.61 2.69 Fossil FOSL ... dd 9.87 +0.04 ...19.75 7.96 FosterLB FSTR ... 4 15.55 +0.54 ...51.00 35.01 4DMolecular FDMT ... ... 47.42 +1.54 ...39.42 19.81 FoxA FOXA 1.5 11 30.16 –1.33 .2338.44 19.13 FoxB FOX 1.6 11 29.17 –1.22 .23130.86 34.58 FoxFactory FOXF ... 62 124.65 +0.10 ...32.88 5.75 Franchise FRG 4.7 ... 32.14 +0.32 .37575.33 41.25 FranklinElec FELE .8 37 73.25 +1.64 .15521.69 14.62 FreelineTherap FRLN ... ... 18.20 +0.52 ...3.84 0.73 FreightCarAmer RAIL ... dd 3.52 +0.50 ...12.19 5.95 FrequencyElec FEIM ... dd 10.85 –0.41 ...42.89 14.50 FrequencyTherap FREQ ... dd 38.73 +2.88 ...149.87 40.79 Freshpet FRPT ... cc 148.72 +4.11 ...56.13 30.06 frontdoor FTDR ... 37 56.03 +2.15 ...20.94 1.00 FuelCell FCEL ... dd 18.13 +2.29 ...22.39 7.01 FulcrumTherap FULC ... dd 13.80 +2.80 ...79.64 6.70 FulgentGenetics FLGT ... 34 69.24 –1.48 ...17.36 8.89 FultonFin FULT 3.5 14 14.80 +0.28 .1315.88 3.12 Funko FNKO ... dd 11.71 –0.35 ...48.50 10.02 FusionFuelGreen HTOO ... dd 21.17 –2.69 ...19.00 11.21 FusionPharm FUSN ... ... 12.61 +0.10 ...101.03 8.16 Futu FUTU ... cc 99.89 +30.51 ...
G14.24 7.03 GBS GBS ... dd 7.90 –0.35 ...15.36 9.00 GCMGrosvenor GCMG 1.8 72 13.39 +0.14 .063.13 0.21 GCMGrosvenorWt GCMGW ... ... 1.82 +0.12 ...114.44 43.27 GDSHoldings GDS ... dd 112.82 +7.78 ...25.79 8.80 G1Therapeutics GTHX ... dd 20.81 –0.02 ...239.90 21.49 GRAVITY GRVY ... 32 181.50 –8.52 ...8.74 4.75 GSITech GSIT ... dd 7.89 +0.32 ...144.00 67.98 GWPharm GWPH ... dd 141.70 +5.97 ...12.79 4.70 Gaia GAIA ... dd 9.70 –0.29 ...274.03 93.01 Galapagos GLPG ... dd 111.19 +11.18 ...17.99 11.57 Galecto GLTO ... ... 12.27 –0.25 ...18.57 5.58 GaleraTherap GRTX ... dd 11.68 +1.68 ...
11.20 2.60 GamidaCell GMDA ... dd 8.50 –0.89 ...50.99 13.04 Gaming&Leisure GLPI 5.8 20 41.30 +1.47 .60125.00 61.04 Garmin GRMN 2.0 23 123.83 +2.82 .6113.84 9.38 GencorIndustries GENC ... 35 12.99 +0.41 ...11.10 4.62 GeneralFin GFN ... cc 8.76 +0.58 ...55.72 17.00 GenerationBio GBIO ... dd 30.25 –1.92 ...28.74 9.03 Genetron GTH ... dd 21.22 +1.13 ...22.48 3.63 Genfit GNFT ... dd 5.40 +0.02 ...44.83 16.24 Genmab GMAB ... 34 43.06 –1.34 ...20.88 3.36 GenMarkDiagn GNMK ... dd 15.42 +1.28 ...37.75 19.48 Gentex GNTX 1.3 30 36.48 +0.60 .1271.50 27.24 Gentherm THRM ... 62 68.36 +0.16 ...15.21 4.61 GeospaceTech GEOS ... dd 8.73 –0.26 ...36.17 23.54 GermanAmerBncp GABC 2.2 16 34.40 –0.33 .192.40 0.75 Geron GERN ... dd 1.73 +0.08 ...103.02 30.60 GibraltarInds ROCK ... 36 96.39 +0.34 ...30.01 2.96 GIIIApparel GIII ... 39 26.96 –0.59 ...10.50 4.70 GilatSatellite GILT 9.8 dd 10.10 +2.78 .6385.97 56.56 GileadSciences GILD 4.1 69 66.94 +3.61 .6851.27 26.66 GlacierBancorp GBCI 2.3 20 51.20 +1.08 .1510.55 4.04 GladstoneCap GLAD 8.4 dd 9.32 +0.06 .06522.35 7.59 GladstoneComm GOOD 8.2 dd 18.38 –0.16 .125213.94 6.43 GladstoneInvt GAIN 7.8 dd 10.79 +0.14 .0716.76 9.61 GladstoneLand LAND 3.3 dd 16.43 +0.95 .044983.69 36.49 GlbBloodTherap GBT ... dd 47.65 –2.27 ...34.65 17.01 GlobalIndemnity GBLI .7 14 28.48 –0.02 .2517.28 8.51 GlobalWaterRscs GWRS 1.7 cc 16.63 +0.12 .024310.85 3.98 GluMobile GLUU ... cc 9.92 +0.95 ...5.19 1.82 GlycoMimetics GLYC ... dd 3.89 +0.04 ...13.45 1.33 Gogo GOGO ... dd 12.27 +1.29 ...26.25 10.01 GoHealth GOCO ... ... 15.02 +0.02 ...8.20 1.30 GolarLNGPartners GMLP 2.4 8 3.43 +0.03 .020215.12 4.54 GolarLNG GLNG ... dd 11.39 –0.66 ...21.67 3.55 GoldenEnt GDEN ... dd 19.95 +0.50 ...27.18 8.82 GoldenNugget GNOG ... dd 20.69 –0.07 ...14.47 0.22 GoldenNuggetWt GNOGW ... ... 8.59 –0.21 ...5.59 2.52 GoldenOcean GOGL 5.6 dd 5.34 +0.11 .0518.24 8.94 GolubCapital GBDC 7.9 91 14.77 +0.26 .2964.22 33.51 GoodRx GDRX ... cc 44.48 +1.58 ...14.57 4.09 Goodyear GT .0 dd 11.45 –0.04 .16147.96 37.26 GooseheadIns GSHD .0 cc 136.10 –0.44 1.14959.47 2.00 GoPro GPRO ... dd 8.81 +0.09 ...16.79 7.52 GossamerBio GOSS ... dd 10.46 +0.17 ...28.88 21.08 GracellBiotech GRCL ... ... 21.40 –2.60 ...106.14 57.89 GrandCanyonEduc LOPE ... 17 86.61 –3.22 ...37.88 12.50 GraybugVision GRAY ... ... 35.00 +2.94 ...8.15 2.25 GreatElmCap GECC 30.7 dd 3.24 –0.26 .0833.33 1.31 GreatElm GEG ... dd 2.76 –0.03 ...14.84 6.75 GreatLakesDredge GLDD ... 13 14.59 +0.52 ...59.96 32.23 GreatSouthernBncp GSBC 2.7 12 51.16 –0.33 .3419.86 3.77 GreenPlains GPRE ... dd 19.47 +1.96 ...14.79 3.47 GreenPlainsPtrs GPP 4.9 6 9.77 ... .126.65 1.02 Greenlane GNLN ... dd 5.12 –0.36 ...10.24 5.00 GreenlightCapRe GLRE ... dd 8.22 +0.18 ...9.84 3.05 GreenSky GSKY ... 96 4.77 –0.20 ...1.88 0.24 Gridsum GSUM ... dd 1.82 +0.07 ...25.73 13.40 Grifols GRFS 1.6 17 19.05 –0.03 .00976.75 2.03 GrindrodShipping GRIN ... dd 4.93 –0.07 ...35.20 2.54 GritstoneOncology GRTS ... dd 27.11 +20.72 ...48.87 28.11 GroceryOutlet GO ... 42 39.95 +1.71 ...63.20 9.60 Groupon GRPN ... dd 32.49 –1.87 ...67.07 20.55 GrAeroportuario OMAB ... 28 47.89 –3.06 ...33.90 20.02 GuarantyBcshrs GNTY 2.4 13 33.15 +1.10 .2024.66 12.70 GuarFedBcsh GFED 3.4 11 17.63 –1.24 .15168.52 55.90 GuardantHealth GH ... dd 159.92 +0.63 ...5.18 2.67 GulfIslandFab GIFI ... dd 3.69 +0.14 ...6.42 2.64 GulfResources GURE ... dd 4.29 –0.31 ...
H32.75 9.12 H&EEquipment HEES 3.5 cc 31.40 +0.79 .27520.71 9.11 HBTFinl HBT 3.9 10 15.19 –0.41 .1521.50 13.06 HMNFin HMNF ... 10 18.03 +0.04 ...36.97 18.20 HMSHoldings HMSY ... 60 36.74 +0.37 ...14.37 5.80 Hookipa HOOK ... dd 12.78 +1.69 ...18.90 9.50 HackettGroup HCKT 2.6 73 14.77 +0.34 .09575.43 31.85 HailiangEduc HLG ... 32 65.60 –0.45 ...41.11 18.12 HainCelestial HAIN ... cc 39.96 –0.40 ...18.52 2.28 HallmarkFin HALL ... dd 3.55 –0.06 ...49.55 12.71 HalozymeTherap HALO ... cc 49.50 +2.07 ...84.55 36.27 HamiltonLane HLNE 1.5 43 81.46 –0.50 .312542.45 14.32 HancockWhitney HWC 2.8 dd 38.17 –1.60 .2719.20 7.15 HanmiFinancial HAFC 2.6 12 12.47 –0.35 .0811.65 6.45 HarborOneBncp HONE 1.1 19 11.08 –0.11 .038.57 4.44 Harmonic HLIT ... dd 8.09 +0.20 ...52.74 28.97 HarmonyBio HRMY ... ... 36.58 –2.24 ...25.24 10.27 HarpoonTherap HARP ... dd 21.70 –1.70 ...8.94 3.33 HarrowHealth HROW ... dd 8.63 +0.68 ...4.65 1.39 HarvardBioSci HBIO ... dd 4.39 +0.05 ...109.50 41.33 Hasbro HAS 2.8 34 97.48 +0.28 .6830.75 7.55 HawaiianHoldings HA .0 dd 20.74 +1.24 .1259.89 26.82 Hawkins HWKN 1.7 17 54.50 +0.66 .232524.40 12.93 HawthornBcsh HWBK 2.6 10 20.26 –0.74 .1329.84 15.29 HaynesIntl HAYN 3.7 dd 23.87 –0.67 .2232.14 12.25 Headhunter HHR 1.4 63 29.56 +0.67 .5051.94 17.48 HealthCatalyst HCAT ... dd 51.33 +3.02 ...33.03 15.80 HealthcareSvcs HCSG 2.6 26 31.21 +0.84 .20588.78 34.40 HealthEquity HQY ... cc 85.36 +8.75 ...27.69 17.95 HealthStream HSTM ... 48 25.11 +0.06 ...22.75 15.65 HeartlandExp HTLD .4 22 19.49 +0.57 .0251.85 25.26 HeartlandFinUSA HTLF 1.7 13 45.89 +0.92 .2034.88 17.99 Heidrick&Strug HSII 1.9 dd 31.96 –0.82 .15238.37 104.02 HelenofTroy HELE ... 26 234.81 +13.99 ...59.88 29.03 HeliosTechnologies HLIO .6 83 58.50 +0.69 .0914.34 7.64 HemisphereMedia HMTV ... dd 10.12 –0.15 ...74.89 41.85 HenrySchein HSIC ... 25 69.13 –2.33 ...12.44 6.04 HeritageCommerce HTBK 5.3 20 9.78 +0.06 .1329.79 11.30 HeritageCrystal HCCI ... cc 22.58 +0.31 ...27.48 14.65 HeritageFin HFWA 3.1 24 25.62 –0.33 .20
57.46 7.33 HibbettSports HIBB ... 17 54.28 –0.03 ...21.82 4.20 HighPeakEner HPK ... ... 18.07 +0.07 ...8.90 0.52 HighPeakEnerWt HPKEW ... ... 6.32 –0.12 ...9.07 1.73 HimaxTechs HIMX ... cc 8.69 +0.62 ...237.75 125.55 HinghamSvg HIFS .8 10 237.75 +9.17 .7016.69 9.52 HollysysAuto HOLI 1.4 12 14.05 –0.65 .2081.80 26.49 Hologic HOLX ... 18 75.70 –0.40 ...38.16 18.57 HomeBancorp HBCP 3.0 13 29.79 –0.26 .2222.27 9.71 HomeBancShares HOMB 2.5 17 22.18 +1.07 .1438.41 18.44 HomeStreet HMST 1.6 14 36.93 +0.44 .1527.79 11.75 HomeTrustBcshs HTBI 1.6 18 20.64 –0.18 .0822.38 8.70 HomologyMed FIXX ... dd 13.29 +0.35 ...36.49 12.30 HookerFurniture HOFT 2.2 dd 33.34 +1.11 .1814.67 7.03 HopeBancorp HOPE 4.5 12 12.42 +0.05 .1418.14 7.42 HorizonBancorp HBNC 2.8 12 17.35 +0.50 .1213.79 4.51 HorizonTechFin HRZN 8.7 20 13.74 –0.01 .1086.67 23.81 HorizonTherap HZNP ... 21 77.73 –0.99 ...17.46 7.86 HostHotels HST .0 dd 14.42 –0.27 .206.85 1.03 HoughtonMifflin HMHC ... dd 5.39 +1.36 ...4.75 1.67 HoustonWire HWCC ... dd 3.79 +0.31 ...53.66 25.01 Huazhu HTHT ... dd 48.00 +2.47 ...61.37 36.51 HubGroup HUBG ... 25 59.31 +0.33 ...14.17 6.06 HudsonGlobal HSON ... dd 13.43 +2.15 ...14.80 4.83 HuizeHolding HUIZ ... dd 6.41 –0.34 ...156.74 75.29 JBHunt JBHT .7 31 146.14 –5.37 .2715.12 6.82 HuntingtonBcshs HBAN 4.3 20 13.84 –0.92 .1534.97 20.39 Hurco HURC 1.6 dd 32.37 –0.11 .1369.83 35.15 HuronConsulting HURN ... dd 58.30 +1.20 ...37.00 14.74 HutchisonChina HCM ... dd 34.13 +0.31 ...77.40 41.59 Hydrofarm HYFM ... ... 73.10 +2.87 ...
I207.94 100.22 IAC/InterActive IAC ... ... 200.52 +2.86 ...22.79 9.27 IBEX IBEX ... ... 20.33 +0.61 ...91.33 47.75 ICF Intl ICFI .7 25 81.54 +1.81 .14236.51 158.01 ICUMedical ICUI ... 58 220.68 +5.21 ...20.75 2.95 IDEAYABio IDYA ... dd 18.40 +1.55 ...516.87 168.65 IdexxLab IDXX ... 86 492.86 +3.40 ...16.95 5.00 IECElec IEC ... 27 16.76 +1.13 ...51.09 13.73 IESHoldings IESC ... 25 49.92 +1.95 ...133.00 27.55 IGMBiosci IGMS ... dd 94.29 –2.86 ...95.00 19.00 II-VI IIVI ... dd 93.87 +5.60 ...59.14 9.30 I-Mab IMAB ... ... 55.24 +5.72 ...80.35 28.67 IndusRealty INDT .0 dd 65.51 –4.38 1.99262.55 98.04 IPGPhotonics IPGP ... cc 251.00 +7.08 ...15.00 5.06 IRSAProp IRCP ... ... 9.40 –0.57 ...37.85 13.01 i3Verticals IIIV ... dd 28.62 –0.96 ...7.98 2.64 IVERICbio ISEE ... dd 5.31 –0.40 ...69.10 34.00 IcahnEnterprises IEP 14.1 dd 56.77 +1.02 2.0042.05 13.68 Ichor ICHR ... 33 40.46 +0.85 ...14.97 3.01 iClickInteract ICLK ... dd 13.33 +1.54 ...223.62 104.28 Icon ICLR ... 35 216.24 +5.89 ...1.92 0.51 IconixBrand ICON ... dd 1.53 +0.07 ...19.69 4.31 iHeartMedia IHRT ... dd 13.70 –0.10 ...408.81 196.78 Illumina ILMN ... 94 406.25 +29.90 ...62.71 12.90 Imara IMRA ... dd 14.04 +0.30 ...13.71 4.23 Immersion IMMR ... dd 13.51 +0.84 ...23.39 4.19 Immunic IMUX ... dd 17.38 –0.51 ...8.10 1.95 Immunogen IMGN ... dd 7.38 +0.17 ...33.34 1.15 ImmunoPrecise IPA ... dd 15.75 +1.10 ...53.75 8.34 Immunovant IMVT ... dd 42.19 –1.91 ...7.95 0.53 Immutep IMMP ... dd 3.20 –0.26 ...61.96 11.47 Impinj PI ... dd 61.22 +6.40 ...108.11 39.55 InariMedical NARI ... cc 107.07 +11.21 ...110.37 62.48 Incyte INCY ... dd 97.89 +7.33 ...81.81 49.25 IndependentBank INDB 2.4 21 78.08 –1.54 .4622.63 9.19 IndepBankMI IBCP 4.0 8 20.13 –0.14 .2070.19 20.35 IndependentBank IBTX 1.8 15 67.33 –0.52 .3024.37 12.95 IndLogistics ILPT 5.9 27 22.23 –0.08 .3311.51 3.68 Infinera INFN ... dd 9.73 +0.11 ...4.38 0.60 InfinityPharm INFI ... dd 4.09 +0.91 ...9.70 2.52 InflaRx IFRX ... dd 5.71 +0.15 ...4.11 1.61 InfoSvcsGrp III ... 53 3.60 –0.35 ...45.25 32.21 InglesMarkets IMKTA 1.5 5 43.42 +0.61 .16550.97 15.20 Inhibrx INBX ... dd 36.42 +2.79 ...61.81 13.14 InMode INMD ... 43 59.67 +1.86 ...8.23 3.30 InnatePharma IPHA ... dd 4.49 –0.03 ...6.78 0.75 Innodata INOD ... dd 5.50 +0.44 ...107.85 56.71 Innospec IOSP 1.1 65 96.61 –0.66 .528.24 1.20 InnovSolSuprt ISSC .0 33 6.34 –0.04 .5015.62 7.58 Innoviva INVA ... 6 12.34 –0.38 ...55.55 26.57 Inogen INGN ... dd 46.92 +2.95 ...27.93 13.39 Inovalon INOV ... cc 25.93 –0.45 ...33.79 3.14 InovioPharma INO ... dd 9.00 –0.66 ...31.65 16.10 InozymePharma INZY ... ... 26.50 –1.40 ...182.22 55.72 Inphi IPHI ... dd 175.45 +5.03 ...19.49 3.91 Inseego INSG ... dd 19.35 +5.23 ...82.80 28.25 InsightEnt NSIT ... 18 82.24 +3.12 ...42.77 12.09 Insmed INSM ... dd 42.00 +5.76 ...28.16 10.00 InsteelInds IIIN .4 20 27.18 +2.77 1.50298.43 121.00 Insulet PODD ... cc 290.30 +9.10 ...70.67 34.21 IntegraLifeSci IART ... cc 69.30 +1.61 ...69.29 43.61 Intel INTC 2.3 11 56.66 –0.92 .3392.00 9.18 IntelliaTherap NTLA ... dd 74.36 –7.53 ...13.24 1.91 Intellicheck IDN ... dd 11.75 –0.53 ...73.48 34.20 InterParfums IPAR .0 59 59.17 –1.78 .3371.87 33.70 InteractiveBrkrs IBKR .6 29 68.85 –0.17 .10100.11 23.78 InterceptPharm ICPT ... dd 29.46 +2.01 ...68.36 31.04 InterDigital IDCC 2.1 35 67.91 +2.25 .3517.49 5.06 Interface TILE .4 dd 11.03 +0.11 .0142.86 15.60 IntlBcshs IBOC 2.6 16 42.18 +0.63 .5531.46 5.97 IntersectENT XENT ... dd 26.60 +2.62 ...7.95 3.17 Intevac IVAC ... 32 7.00 –0.31 ...34.95 10.94 Intra-Cellular ITCI ... dd 33.32 –0.46 ...20.71 9.84 Intricon IIN ... dd 20.55 +2.45 ...398.12 187.68 Intuit INTU .6 50 374.85 +3.84 .59826.81 360.50 IntuitiveSurgical ISRG ... 84 744.08 –34.34 ...19.06 9.01 Inventiva IVA ... dd 18.00 +2.13 ...
52-Week Tick DivHigh Low Name Sym Yld P/E Last Chg. Amt.
52-Week Tick DivHigh Low Name Sym Yld P/E Last Chg. Amt.
52-Week Tick DivHigh Low Name Sym Yld P/E Last Chg. Amt.
52-Week Tick DivHigh Low Name Sym Yld P/E Last Chg. Amt.
52-Week Tick DivHigh Low Name Sym Yld P/E Last Chg. Amt.
Nasdaq Issues
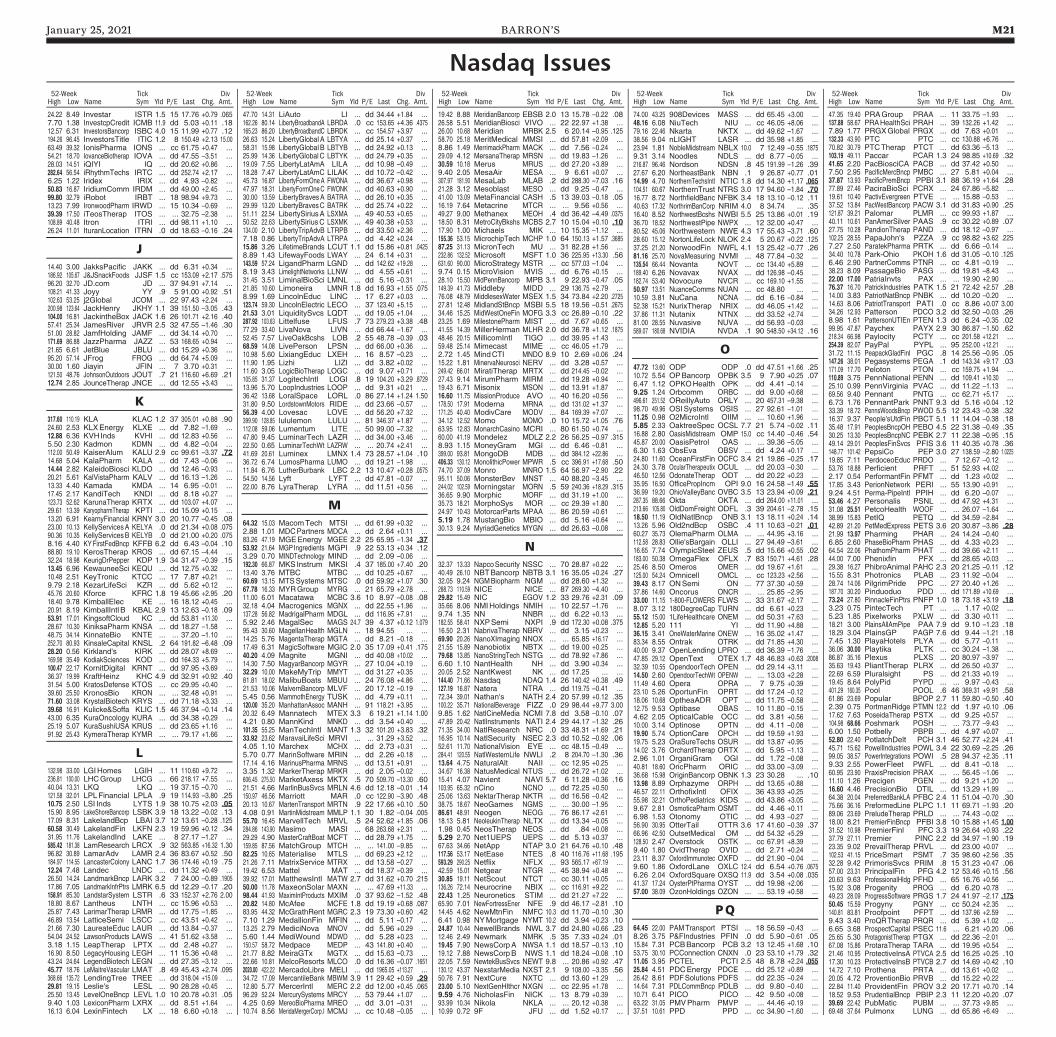
January 25, 2021 BARRON’S M21
24.22 8.49 Investar ISTR 1.5 15 17.76 +0.79 .0657.70 1.38 InvestcpCredit ICMB 11.9 dd 5.03 +0.11 .1812.57 6.31 InvestorsBancorp ISBC 4.0 15 11.99 +0.77 .12194.26 96.45 InvestorsTitle ITIC 1.2 8 150.49 +2.13 15.0063.49 39.32 IonisPharma IONS ... cc 61.75 +0.47 ...54.21 18.70 IovanceBiotherap IOVA ... dd 47.55 –3.51 ...28.03 14.51 iQIYI IQ ... dd 20.62 +0.86 ...282.64 56.54 iRhythmTechs IRTC ... dd 252.74 +2.17 ...6.25 1.22 Iridex IRIX ... dd 4.93 –0.82 ...50.83 16.87 IridiumComm IRDM ... dd 49.00 +2.45 ...99.80 32.79 iRobot IRBT ... 18 98.94 +9.73 ...13.23 7.99 IronwoodPharm IRWD ... 15 10.34 –0.69 ...39.39 17.50 iTeosTherap ITOS ... ... 32.75 –2.38 ...108.89 40.48 Itron ITRI ... dd 98.11 +1.10 ...26.24 11.01 IturanLocation ITRN .0 dd 18.63 –0.16 .24
J14.40 3.00 JakksPacific JAKK ... dd 6.31 +0.34 ...186.92 105.67 J&JSnackFoods JJSF 1.5 cc 153.09 +2.17 .57596.20 32.70 JD.com JD ... 37 94.91 +7.14 ...108.21 41.33 Joyy YY .9 5 91.00 +0.92 .51102.63 53.25 j2Global JCOM ... 22 97.43 +2.24 ...200.98 123.64 JackHenry JKHY 1.1 39 151.50 –3.05 .43104.00 16.81 JackintheBox JACK 1.6 26 101.71 +2.16 .4057.41 25.34 JamesRiver JRVR 2.5 32 47.55 –1.46 .3051.00 28.82 JamfHolding JAMF ... dd 34.14 +0.70 ...171.69 86.88 JazzPharma JAZZ ... 53 168.65 +0.94 ...21.65 6.61 JetBlue JBLU ... dd 15.29 +0.36 ...95.20 57.14 JFrog FROG ... dd 64.74 +5.09 ...30.00 1.60 Jiayin JFIN ... 7 3.70 +0.31 ...121.50 48.76 JohnsonOutdoors JOUT .7 21 116.60 +6.69 .2112.74 2.85 JounceTherap JNCE ... dd 12.55 +3.43 ...
K317.60 110.19 KLA KLAC 1.2 37 305.01 +0.88 .9024.60 2.53 KLXEnergy KLXE ... dd 7.82 –1.69 ...12.88 6.36 KVH Inds KVHI ... dd 12.83 +0.56 ...5.50 2.30 Kadmon KDMN ... dd 4.82 –0.04 ...112.00 50.49 KaiserAlum KALU 2.9 cc 99.61 –3.37 .7214.68 5.04 KalaPharm KALA ... dd 7.43 –0.06 ...14.44 2.82 KaleidoBiosci KLDO ... dd 12.46 –0.93 ...20.21 5.61 KalVistaPharm KALV ... dd 16.13 –1.26 ...13.33 4.40 Kamada KMDA ... 14 6.95 –0.01 ...17.45 2.17 KandiTech KNDI ... dd 8.18 +0.27 ...123.73 52.62 KarunaTherap KRTX ... dd 103.07 +4.07 ...29.61 13.39 KaryopharmTherap KPTI ... dd 15.09 +0.15 ...13.20 6.91 KearnyFinancial KRNY 3.0 20 10.77 –0.45 .0823.00 10.13 KellyServicesA KELYA .0 dd 21.34 +0.08 .07590.36 10.35 KellyServicesB KELYB .0 dd 21.00 +0.20 .0758.16 4.40 KYFirstFedBncp KFFB 6.2 dd 6.43 –0.04 .1088.80 19.10 KerosTherap KROS ... dd 67.15 –4.44 ...32.24 18.98 KeurigDrPepper KDP 1.9 34 31.47 –0.39 .1513.45 6.96 KewauneeSci KEQU ... dd 12.75 +0.32 ...10.48 2.51 KeyTronic KTCC ... 17 7.87 +0.21 ...9.79 2.18 KezarLifeSci KZR ... dd 5.62 +0.12 ...45.76 20.60 Kforce KFRC 1.8 19 45.66 +2.95 .2018.40 9.78 KimballElec KE ... 16 18.12 +0.45 ...20.91 8.19 KimballIntl B KBAL 2.9 13 12.63 –0.18 .0953.91 17.01 KingsoftCloud KC ... dd 53.81 +11.30 ...28.67 10.30 KiniksaPharm KNSA ... dd 18.27 –1.58 ...48.75 34.14 KinnateBio KNTE ... ... 37.20 –1.10 ...252.70 80.93 KinsaleCapital KNSL .2 64 191.82 –6.48 .0928.20 0.56 Kirkland's KIRK ... dd 28.07 +8.69 ...169.98 35.49 KodiakSciences KOD ... dd 164.33 +5.79 ...100.47 22.17 KornitDigital KRNT ... dd 97.95 +3.69 ...36.37 19.99 KraftHeinz KHC 4.9 dd 32.91 +0.92 .4031.54 5.00 KratosDefense KTOS ... cc 29.95 +0.40 ...39.60 25.50 KronosBio KRON ... ... 32.48 +0.91 ...71.60 33.08 KrystalBiotech KRYS ... dd 71.18 +3.33 ...39.68 16.91 Kulicke&Soffa KLIC 1.5 46 37.94 –0.14 .1443.00 6.35 KuraOncology KURA ... dd 34.38 +0.29 ...25.19 5.07 KuraSushiUSA KRUS ... dd 23.65 +1.16 ...91.92 25.43 KymeraTherap KYMR ... ... 79.17 +1.66 ...
L132.98 33.00 LGIHomes LGIH ... 11 110.60 +9.72 ...236.81 100.00 LHCGroup LHCG ... 66 218.17 +7.55 ...40.04 13.31 LKQ LKQ ... 19 37.15 –0.70 ...121.58 32.01 LPLFinancial LPLA .9 19 114.93 –3.80 .2510.75 2.50 LSI Inds LYTS 1.9 38 10.75 +2.03 .0515.90 8.95 LakeShoreBancorp LSBK 3.9 18 13.22 –0.02 .1317.09 8.31 LakelandBcp LBAI 3.7 12 13.61 –0.28 .12560.58 30.49 LakelandFin LKFN 2.3 19 59.96 +0.12 .3431.95 11.76 LakelandInd LAKE ... 8 27.17 –1.27 ...585.42 181.38 LamResearch LRCX .9 32 563.85 +16.32 1.3096.82 30.89 LamarAdv LAMR 2.4 36 83.67 +0.52 .50184.97 114.55 LancasterColony LANC 1.7 36 174.46 +0.19 .7512.24 7.48 Landec LNDC ... dd 11.32 +0.49 ...26.50 14.24 LandmarkBncp LARK 3.2 7 24.00 –0.89 .190517.86 7.05 LandmarkInfrPtrs LMRK 6.5 dd 12.29 –0.17 .20158.91 85.30 LandstarSystem LSTR .6 33 152.37 +2.76 2.0018.80 8.67 Lantheus LNTH ... cc 15.96 +0.53 ...25.87 7.43 LarimarTherap LRMR ... dd 17.75 –1.85 ...46.89 13.54 LatticeSemi LSCC ... cc 43.51 +0.42 ...21.66 7.30 LaureateEduc LAUR ... dd 13.84 –0.37 ...54.04 24.52 LawsonProducts LAWS ... 41 51.62 +3.58 ...3.18 1.15 LeapTherap LPTX ... dd 2.48 +0.27 ...16.90 8.50 LegacyHousing LEGH ... 11 15.36 +0.48 ...43.24 24.64 LegendBiotech LEGN ... dd 27.35 –3.12 ...45.77 18.76 LeMaitreVascular LMAT .8 49 45.43 +2.74 .095368.66 135.72 LendingTree TREE ... dd 318.04 +15.09 ...29.81 19.15 Leslie's LESL ... 90 28.28 +0.45 ...25.50 13.45 LevelOneBncp LEVL 1.0 10 20.78 +0.31 .059.40 1.03 LexiconPharm LXRX ... dd 8.51 +1.64 ...16.13 6.04 LexinFintech LX ... 18 6.60 +0.18 ...
47.70 14.31 LiAuto LI ... dd 34.44 +1.84 ...162.26 80.14 LibertyBroadbandA LBRDA .0 cc 153.65 +4.36 .4375165.23 86.20 LibertyBroadbandC LBRDK ... cc 154.57 +3.97 ...26.63 15.24 LibertyGlobalA LBTYA ... dd 25.14 +0.37 ...58.31 15.98 LibertyGlobalB LBTYB ... dd 24.92 +0.13 ...25.99 14.36 LibertyGlobalC LBTYK ... dd 24.79 +0.35 ...19.09 7.55 LibertyLatAmA LILA ... dd 10.98 –0.49 ...18.28 7.47 LibertyLatAmC LILAK ... dd 10.72 –0.42 ...45.73 16.87 LibertyFormOneA FWONA ... dd 36.67 +0.98 ...47.97 18.31 LibertyFormOneC FWONK ... dd 40.63 +0.90 ...30.00 13.59 LibertyBravesA BATRA ... dd 26.10 +0.35 ...29.99 13.20 LibertyBravesC BATRK ... dd 25.74 +0.22 ...51.11 22.54 LibertySiriusA LSXMA ... 49 40.53 +0.65 ...50.52 22.63 LibertySiriusC LSXMK ... 49 40.38 +0.53 ...134.00 2.10 LibertyTripAdvB LTRPB ... dd 33.50 +2.36 ...7.18 0.86 LibertyTripAdvA LTRPA ... dd 4.42 +0.24 ...15.86 3.26 LifetimeBrands LCUT 1.1 dd 15.86 +0.81 .04258.89 1.43 LifewayFoods LWAY ... 24 6.14 +0.31 ...143.59 57.24 LigandPharm LGND ... dd 142.62 +19.28 ...8.19 3.43 LimelightNetworks LLNW ... dd 4.55 +0.61 ...31.45 3.51 LiminalBioSci LMNL ... dd 5.16 –0.31 ...21.85 10.60 Limoneira LMNR 1.8 dd 16.93 +1.55 .0758.99 1.69 LincolnEduc LINC ... 17 6.27 +0.03 ...123.74 59.30 LincolnElectric LECO ... 37 123.40 +5.15 ...21.53 3.01 LiquiditySvcs LQDT ... dd 19.05 +1.04 ...287.92 103.63 Littelfuse LFUS .7 73 279.23 +3.38 .4877.29 33.40 LivaNova LIVN ... dd 66.44 –1.67 ...52.45 7.57 LiveOakBcshs LOB .2 55 48.78 –0.39 .0368.59 14.08 LivePerson LPSN ... dd 66.00 +0.36 ...10.98 5.60 LixiangEduc LXEH ... 16 8.57 –0.23 ...11.90 1.95 Lizhi LIZI ... dd 3.82 +0.02 ...11.60 3.05 LogicBioTherap LOGC ... dd 9.07 +0.71 ...105.85 31.37 LogitechIntl LOGI .8 19 104.20 +3.29 .872913.96 5.70 LoopIndustries LOOP ... dd 9.31 +0.21 ...36.42 13.68 LoralSpace LORL .0 86 27.14 +1.24 1.5031.80 9.50 LordstownMotors RIDE ... dd 23.66 –0.57 ...56.39 4.00 Lovesac LOVE ... dd 56.20 +7.32 ...399.90 128.85 lululemon LULU ... 81 346.37 +1.87 ...112.08 59.06 Lumentum LITE ... 50 99.00 –7.32 ...47.80 9.45 LuminarTech LAZR ... dd 34.00 +3.46 ...22.50 0.65 LuminarTechWt LAZRW ... ... 20.74 +2.41 ...41.69 20.61 Luminex LMNX 1.4 73 28.57 +1.04 .1036.72 6.74 LumosPharma LUMO ... dd 19.21 –1.98 ...11.84 6.76 LutherBurbank LBC 2.2 13 10.47 +0.28 .057554.50 14.56 Lyft LYFT ... dd 47.81 –0.07 ...22.00 8.76 LyraTherap LYRA ... dd 11.51 +0.56 ...
M64.32 15.03 MacomTech MTSI ... dd 61.99 +0.32 ...2.88 1.01 MDCPartners MDCA ... dd 2.64 +0.11 ...83.26 47.19 MGEEnergy MGEE 2.2 25 65.95 –1.34 .3753.92 21.64 MGP Ingredients MGPI .9 22 53.13 +0.34 .123.29 0.70 MINDTechnology MIND ... dd 2.09 –0.06 ...192.30 66.87 MKS Instrum MKSI .4 37 185.00 +7.40 .2013.40 3.76 MTBC MTBC ... dd 10.25 +0.67 ...60.69 13.15 MTSSystems MTSC .0 dd 59.92 +1.07 .3067.78 16.33 MYRGroup MYRG ... 21 65.79 +2.78 ...11.00 6.01 Macatawa MCBC 3.6 10 8.97 –0.08 .0832.18 4.04 Macrogenics MGNX ... dd 22.55 +1.96 ...137.28 56.82 MadrigalPharm MDGL ... dd 116.95 +7.91 ...5.92 2.46 MagalSec MAGS 24.7 39 4.37 +0.12 1.07995.43 30.60 MagellanHealth MGLN ... 18 94.55 ... ...14.25 5.76 MagentaTherap MGTA ... dd 8.21 –0.18 ...17.49 6.31 MagicSoftware MGIC 2.0 35 17.09 +0.41 .17540.20 4.09 Magnite MGNI ... dd 40.08 +10.02 ...14.30 7.50 MagyarBancorp MGYR ... 27 10.04 +0.19 ...32.29 10.00 MakeMyTrip MMYT ... dd 31.27 +0.35 ...81.81 18.02 MalibuBoats MBUU ... 24 76.08 +4.86 ...21.53 10.06 MalvernBancorp MLVF ... 20 17.12 –0.19 ...5.45 0.56 MammothEnergy TUSK ... dd 4.79 +0.11 ...120.00 35.20 ManhattanAssoc MANH ... 91 118.21 +3.95 ...20.32 6.49 Mannatech MTEX 3.3 6 19.21 +1.14 1.004.21 0.80 MannKind MNKD ... dd 3.54 +0.40 ...101.35 55.25 ManTechIntl MANT 1.3 32 101.20 +3.83 .3233.92 23.62 MaravaiLifeSci MRVI ... ... 31.29 +3.52 ...4.05 1.10 Marchex MCHX ... dd 2.73 +0.31 ...5.70 0.77 MarinSoftware MRIN ... dd 2.26 +0.18 ...17.14 4.16 MarinusPharma MRNS ... dd 13.51 +0.91 ...3.35 1.32 MarkerTherap MRKR ... dd 2.05 –0.02 ...606.45 275.50 MarketAxess MKTX .5 70 509.70 –13.30 .6021.51 4.66 MarlinBusSvcs MRLN 4.6 dd 12.18 –0.01 .14150.97 46.56 Marriott MAR .0 cc 122.90 –3.90 .4820.13 10.67 MartenTransport MRTN .9 22 17.66 +0.10 .504.08 0.91 MartinMidstream MMLP 1.1 30 1.82 –0.04 .00555.70 16.45 MarvellTech MRVL .5 24 52.62 +1.85 .06284.86 143.90 Masimo MASI ... 68 263.68 +2.31 ...29.29 4.90 MasterCraftBoat MCFT ... dd 28.79 +1.75 ...159.85 87.56 MatchGroup MTCH ... ... 141.00 –9.85 ...82.25 10.65 Materialise MTLS ... dd 69.23 +2.12 ...21.26 7.11 MatrixService MTRX ... dd 13.58 –0.27 ...19.42 6.53 Mattel MAT ... dd 18.37 –0.39 ...39.92 17.01 MatthewsIntl MATW 2.7 dd 31.62 +0.70 .21550.00 11.78 MaxeonSolar MAXN ... ... 47.69 +11.33 ...98.44 41.93 MaximIntProducts MXIM .0 37 93.62 –1.52 .4820.82 14.80 McAfee MCFE 1.8 dd 19.19 +0.68 .08783.95 44.32 McGrathRent MGRC 2.3 19 73.30 +0.60 .427.10 1.29 MedallionFin MFIN ... dd 5.11 –0.17 ...13.25 2.79 MediciNova MNOV ... dd 5.96 +0.29 ...5.60 1.44 MediWound MDWD ... dd 5.28 +0.23 ...150.57 58.72 Medpace MEDP ... 43 141.80 +0.40 ...21.77 8.82 MeiraGTx MGTX ... dd 15.63 –0.73 ...22.66 10.81 MelcoResorts MLCO .0 dd 16.36 –0.07 .16512020.00 422.22 MercadoLibre MELI ... dd 1965.05 +113.27 ...34.72 17.09 MercantileBank MBWM 3.9 11 29.42 +0.59 .2912.80 5.77 MercerIntl MERC 2.2 dd 12.00 +0.45 .06596.29 52.24 MercurySystems MRCY ... 53 79.44 +1.07 ...4.25 0.69 MereoBioPharma MREO ... dd 3.01 –0.31 ...10.74 8.56 MeridaMergerCorp.I MCMJ ... cc 10.48 –0.05 ...
19.42 8.88 MeridianBancorp EBSB 2.0 13 15.78 –0.22 .0826.58 5.51 MeridianBiosci VIVO ... 22 22.97 +1.38 ...26.00 10.68 Meridian MRBK 2.5 6 20.14 –0.95 .12558.70 25.18 MeritMedical MMSI ... dd 57.81 +2.09 ...8.86 1.49 MerrimackPharm MACK ... dd 7.56 –0.24 ...29.09 4.12 MersanaTherap MRSN ... dd 19.83 –1.26 ...30.59 10.18 Merus MRUS ... dd 27.20 +3.89 ...9.40 2.05 MesaAir MESA ... 9 6.61 +0.07 ...307.97 181.90 MesaLab MLAB .2 dd 288.30 –7.03 .1621.28 3.12 Mesoblast MESO ... dd 9.25 –0.47 ...41.00 13.09 MetaFinancial CASH .5 13 39.03 –0.18 .0516.19 7.64 Metacrine MTCR ... ... 9.56 +0.56 ...49.27 9.00 Methanex MEOH .4 dd 36.42 –4.49 .037518.50 8.31 MetroCityBkshs MCBS 2.7 10 15.04 +0.10 .1017.90 1.00 Michaels MIK ... 10 15.35 –1.12 ...155.36 53.15 MicrochipTech MCHP 1.0 64 150.13 +1.57 .368587.25 31.13 MicronTech MU ... 31 82.28 +1.56 ...232.86 132.52 Microsoft MSFT 1.0 36 225.95 +13.30 .56631.60 90.00 MicroStrategy MSTR ... cc 577.03 –1.04 ...9.74 0.15 MicroVision MVIS ... dd 6.76 +0.15 ...28.10 15.50 MidPennBancorp MPB 3.1 9 22.93 –0.47 .05149.39 41.73 Middleby MIDD ... 29 136.75 +2.79 ...76.08 48.79 MiddlesexWater MSEX 1.5 34 73.84 +2.20 .272527.81 12.48 MidlandStBncp MSBI 5.5 18 19.56 –0.51 .267534.46 15.25 MidWestOneFin MOFG 3.3 cc 26.89 –0.10 .2223.25 1.69 MilestonePharm MIST ... dd 7.67 +0.65 ...41.55 14.39 MillerHerman MLHR 2.0 dd 36.78 +1.12 .187548.46 20.15 MillicomIntl TIGO ... dd 39.95 +1.43 ...59.48 25.14 Mimecast MIME ... cc 46.05 +1.79 ...2.72 1.45 MindCTI MNDO 8.9 10 2.69 +0.06 .2415.22 1.81 MinervaNeurosci NERV ... dd 3.28 +0.57 ...249.42 66.01 MiratiTherap MRTX ... dd 214.45 –0.02 ...27.43 9.14 MirumPharm MIRM ... dd 19.28 +0.94 ...19.43 6.71 Misonix MSON ... dd 13.91 +1.87 ...16.60 11.75 MissionProduce AVO ... 40 16.20 +0.56 ...178.50 17.91 Moderna MRNA ... dd 131.02 +1.37 ...171.25 40.40 ModivCare MODV ... 84 169.39 +7.07 ...34.12 12.52 Momo MOMO .0 10 15.72 +1.05 .7663.95 12.83 MonarchCasino MCRI ... 80 61.50 +0.74 ...60.00 41.19 Mondelez MDLZ 2.2 26 56.25 –0.97 .3158.93 1.15 MoneyGram MGI ... dd 6.46 –0.81 ...399.00 93.81 MongoDB MDB ... dd 384.12 +22.86 ...406.33 130.12 MonolithicPower MPWR .5 cc 396.91 +17.68 .5074.70 37.09 Monro MNRO 1.5 64 56.97 –2.90 .2295.11 50.06 MonsterBev MNST ... 40 88.20 –3.45 ...244.02 102.59 Morningstar MORN .5 59 240.36 +18.29 .31536.65 9.90 Morphic MORF ... dd 31.19 +1.00 ...35.73 18.21 MorphoSys MOR ... cc 29.39 +1.80 ...24.97 10.43 MotorcarParts MPAA ... 86 20.59 +0.61 ...5.19 1.78 MustangBio MBIO ... dd 5.16 +0.64 ...30.13 9.24 MyriadGenetics MYGN ... dd 26.63 –0.08 ...
N32.37 13.33 NapcoSecurity NSSC ... 70 28.87 +0.22 ...40.49 26.10 NBTBancorp NBTB 3.1 16 35.05 +0.24 .2732.05 9.24 NGMBiopharm NGM ... dd 28.60 +1.32 ...288.73 110.59 NICE NICE ... 87 269.30 –4.40 ...29.82 15.49 NIC EGOV 1.2 33 29.76 +2.31 .0935.66 8.06 NMIHoldings NMIH ... 10 22.57 –1.76 ...9.74 1.35 NN NNBR ... dd 6.22 +0.13 ...182.55 58.41 NXPSemi NXPI .9 dd 172.30 +0.08 .37516.50 2.31 NabrivaTherap NBRV ... dd 3.15 +0.23 ...69.90 20.26 NanoXImaging NNOX ... ... 65.85 +16.17 ...21.55 15.89 Nanobiotix NBTX ... dd 19.00 +0.25 ...79.68 13.85 NanoStringTech NSTG ... dd 78.92 +7.86 ...6.60 1.10 NantHealth NH ... dd 3.90 +0.34 ...20.05 2.52 NantKwest NK ... dd 17.25 ... ...144.40 71.66 Nasdaq NDAQ 1.4 26 140.42 +0.38 .49127.19 16.87 Natera NTRA ... dd 119.75 –0.41 ...72.34 39.01 Nathan's NATH 2.4 20 57.99 +0.12 .35100.22 35.71 NationalBeverage FIZZ .0 29 98.44 +9.77 3.009.85 1.62 NatlCineMedia NCMI 7.8 dd 3.58 –0.10 .0747.89 20.42 NatlInstruments NATI 2.4 29 44.17 –1.32 .2671.35 34.00 NatlResearch NRC .0 33 48.31 +1.69 .2116.95 10.14 NatlSecurity NSEC 2.3 dd 10.52 –0.92 .0652.61 11.70 NationalVision EYE ... cc 48.15 –0.49 ...284.41 120.55 NatlWesternLife NWLI .2 8 204.70 –1.30 .3613.64 4.75 NaturalAlt NAII ... cc 12.95 +0.25 ...34.67 16.38 NatusMedical NTUS ... dd 26.72 +1.02 ...15.41 4.07 Navient NAVI 5.7 6 11.28 –0.36 .16103.95 65.32 nCino NCNO ... dd 72.25 +0.50 ...25.06 13.63 NektarTherap NKTR ... dd 16.56 –0.42 ...38.75 18.67 NeoGames NGMS ... ... 30.00 –1.95 ...86.61 48.91 Neogen NEOG ... 76 86.17 +2.61 ...18.13 5.81 NeoleukinTherap NLTX ... dd 13.34 –0.05 ...1.98 0.45 NeosTherap NEOS ... dd .84 +0.08 ...5.29 2.70 Net1UEPS UEPS ... dd 5.13 +0.37 ...67.63 34.66 NetApp NTAP 3.0 21 64.76 +0.10 .48117.56 53.17 NetEase NTES .8 40 116.76 +11.68 .195593.29 290.25 Netflix NFLX ... 93 565.17 +67.19 ...42.59 15.01 Netgear NTGR ... 45 38.94 +0.48 ...30.85 19.11 NetScout NTCT ... cc 30.11 +0.05 ...136.26 72.14 Neurocrine NBIX ... cc 116.91 +9.22 ...22.43 1.25 Neuronetics STIM ... dd 21.27 +7.22 ...65.90 7.01 NewFortressEner NFE .9 dd 46.17 –2.81 .1014.45 4.62 NewMtnFin NMFC 10.3 dd 11.70 –0.10 .306.41 0.98 NYMortgage NYMT 10.2 dd 3.94 +0.23 .1024.87 10.44 NewellBrands NWL 3.7 dd 24.80 +0.66 .2312.46 2.49 Newmark NMRK .5 35 7.33 +0.24 .0119.45 7.90 NewsCorpA NWSA 1.1 dd 18.57 –0.13 .1019.12 7.88 NewsCorpB NWS 1.1 dd 18.24 –0.08 .1022.05 7.59 NewtekBusSvcs NEWT 9.8 ... 20.86 +0.92 .47130.12 43.37 NexstarMedia NXST 2.1 9 108.00 –3.35 .5650.76 7.91 NextCure NXTC ... dd 13.60 +1.29 ...23.00 5.10 NextGenHlthcr NXGN ... cc 22.95 +1.78 ...9.59 4.76 NicholasFin NICK ... 13 8.79 +0.39 ...93.99 10.34 Nikola NKLA ... ... 20.12 +0.38 ...10.99 0.72 9F JFU ... dd 1.52 +0.17 ...
74.00 43.25 908Devices MASS ... dd 65.45 +3.00 ...48.16 6.08 NiuTech NIU ... cc 46.05 +8.06 ...79.16 22.46 Nkarta NKTX ... dd 49.62 –1.67 ...38.56 9.04 nLIGHT LASR ... dd 35.98 +1.85 ...23.94 1.81 NobleMidstream NBLX 10.0 7 12.49 –0.55 .18759.31 3.14 Noodles NDLS ... dd 8.77 –0.05 ...216.87 96.46 Nordson NDSN .8 45 191.99 –1.26 .3927.67 6.20 NortheastBank NBN .1 9 26.87 +0.77 .0114.99 4.70 NorthernTechsIntl NTIC 1.8 dd 14.30 +1.17 .065104.51 60.67 NorthernTrust NTRS 3.0 17 94.60 –1.84 .7016.77 8.72 NorthfieldBanc NFBK 3.4 18 13.10 –0.12 .1140.63 17.32 NorthrimBanCorp NRIM 4.0 8 34.74 ... .3516.40 8.52 NorthwestBcshs NWBI 5.5 25 13.86 +0.01 .1936.70 18.52 NorthwestPipe NWPX ... 12 32.00 +0.47 ...80.52 45.06 Northwestern NWE 4.3 17 55.43 –3.71 .6028.60 15.12 NortonLifeLock NLOK 2.4 5 20.67 +0.22 .12537.25 21.20 NorwoodFin NWFL 4.1 13 25.42 –0.77 .2681.16 25.70 NovaMeasuring NVMI ... 48 77.84 –0.32 ...135.54 66.44 Novanta NOVT ... cc 134.40 +5.89 ...189.40 6.26 Novavax NVAX ... dd 126.98 –0.45 ...182.74 53.40 Novocure NVCR ... cc 169.10 +1.55 ...50.97 13.51 NuanceComms NUAN ... cc 48.80 ... ...10.59 3.81 NuCana NCNA ... dd 6.16 –0.84 ...52.38 15.21 NurixTherap NRIX ... dd 46.05 +1.42 ...37.86 11.31 Nutanix NTNX ... dd 33.52 +2.74 ...81.00 28.55 Nuvasive NUVA ... dd 56.93 –0.03 ...589.07 180.68 NVIDIA NVDA .1 90 548.50 +34.12 .16
O47.72 13.60 ODP ODP .0 dd 47.51 +1.66 .2510.72 5.54 OPBancorp OPBK 3.5 9 7.90 +0.25 .076.47 1.12 OPKOHealth OPK ... dd 4.41 –0.14 ...9.25 1.24 Orbcomm ORBC ... dd 9.00 +0.68 ...496.61 251.52 OReillyAuto ORLY ... 20 457.31 –9.38 ...98.70 49.96 OSISystems OSIS ... 27 92.61 –1.01 ...11.25 0.98 O2MicroIntl OIIM ... ... 10.60 +1.96 ...5.85 2.33 OaktreeSpec OCSL 7.7 21 5.74 –0.02 .1116.88 2.80 OasisMidstream OMP 15.0 cc 14.40 –0.46 .5445.87 20.00 OasisPetrol OAS ... ... 39.36 –5.05 ...6.30 1.63 ObsEva OBSV ... dd 4.24 +0.17 ...24.80 11.60 OceanFirstFin OCFC 3.4 21 19.86 –0.25 .1724.30 3.78 OcularTherapeutix OCUL ... dd 20.03 –0.30 ...46.50 12.56 OdonateTherap ODT ... dd 20.22 +0.23 ...35.95 16.50 OfficePropIncm OPI 9.0 16 24.58 –1.49 .5536.99 19.20 OhioValleyBanc OVBC 3.5 13 23.94 +0.09 .21287.35 88.66 Okta OKTA ... dd 264.00 +11.01 ...213.66 105.80 OldDomFreight ODFL .3 39 204.61 –2.78 .1518.50 11.19 OldNatlBncp ONB 3.1 13 18.11 +0.24 .1413.26 5.96 Old2ndBcp OSBC .4 11 10.63 –0.21 .0160.27 35.73 OlemaPharm OLMA ... ... 44.95 +3.16 ...112.58 28.83 Ollie'sBargain OLLI ... 27 94.49 –3.61 ...16.65 7.74 OlympicSteel ZEUS .5 dd 15.66 +0.55 .02183.00 50.38 OmegaFlex OFLX .7 83 150.71 +4.61 .2825.46 8.50 Omeros OMER ... dd 19.67 +1.61 ...125.00 54.24 Omnicell OMCL ... cc 123.23 +2.56 ...39.43 8.17 ONSemi ON ... 77 37.30 +0.59 ...37.86 14.60 Oncorus ONCR ... ... 25.85 –2.95 ...33.00 11.15 1-800-FLOWERS FLWS ... 33 31.67 +2.17 ...8.07 3.12 180DegreeCap TURN ... dd 6.61 +0.23 ...55.12 15.00 1LifeHealthcare ONEM ... dd 50.31 +7.63 ...12.85 5.20 111 YI ... dd 11.90 +4.88 ...36.15 3.41 OneWaterMarine ONEW ... 16 35.02 +1.47 ...83.34 8.55 Ontrak OTRK ... dd 71.85 +4.30 ...40.00 9.37 OpenLending LPRO ... dd 36.39 –1.76 ...47.85 29.12 OpenText OTEX 1.7 48 46.83 +0.63 .200832.39 10.55 OpendoorTech OPEN ... dd 29.14 +3.11 ...14.50 2.60 OpendoorTechWt OPENW ... ... 13.03 +2.28 ...11.49 4.60 Opera OPRA ... 7 9.75 +0.39 ...23.10 5.26 OportunFin OPRT ... dd 17.24 –0.12 ...18.06 10.68 OptheaADR OPT ... dd 11.75 –0.58 ...12.75 9.53 Optibase OBAS ... 10 11.80 –0.15 ...4.62 2.05 OpticalCable OCC ... dd 3.81 +0.56 ...10.00 3.14 Optinose OPTN ... dd 4.11 –0.08 ...19.90 5.74 OptionCare OPCH ... dd 19.59 +1.93 ...19.75 5.23 OraSureTechs OSUR ... dd 13.87 +0.95 ...14.02 3.76 OrchardTherap ORTX ... dd 5.95 –1.13 ...2.96 1.01 OrganiGram OGI ... dd 1.72 –0.08 ...40.81 18.60 OricPharm ORIC ... dd 33.00 –3.09 ...36.68 15.98 OriginBancorp OBNK 1.3 23 30.28 ... .1013.98 8.89 Orphazyme ORPH ... dd 13.65 +0.88 ...46.57 22.11 OrthofixIntl OFIX ... 36 43.93 +0.25 ...55.98 32.21 OrthoPediatrics KIDS ... dd 43.86 +3.05 ...9.67 2.81 OsmoticaPharm OSMT ... dd 4.46 +0.11 ...6.98 1.53 Otonomy OTIC ... dd 4.93 –0.27 ...56.90 30.95 OtterTail OTTR 3.6 17 41.60 –0.39 .3766.96 42.50 OutsetMedical OM ... dd 54.32 +5.29 ...128.50 2.47 Overstock OSTK ... cc 67.91 +8.39 ...9.40 1.80 OvidTherap OVID ... dd 2.71 +0.24 ...23.11 8.37 OxfordImmunotec OXFD ... dd 21.90 –0.04 ...9.60 1.86 OxfordLane OXLC 12.4 dd 6.54 +0.76 .06756.26 2.04 OxfordSquare OXSQ 11.9 dd 3.54 +0.08 .03541.37 17.24 OysterPtPharma OYST ... dd 19.98 +2.06 ...57.00 38.09 OzonHoldings OZON ... ... 53.19 +0.58 ...
PQ64.45 22.00 PAMTransport PTSI ... 18 56.59 –0.43 ...8.26 3.75 P&FIndustries PFIN .0 dd 5.90 –0.61 .0515.84 7.31 PCBBancorp PCB 3.2 13 12.45 +1.68 .1053.75 30.10 PCConnection CNXN .0 23 53.10 +1.79 .3211.05 3.95 PCTEL PCTI 2.5 48 8.78 +2.24 .05525.84 4.51 PDCEnergy PDCE ... dd 25.12 +0.89 ...26.42 8.61 PDFSolutions PDFS ... dd 22.35 –0.24 ...14.64 7.31 PDLCommBncp PDLB ... dd 9.80 –0.40 ...10.71 6.41 PICO PICO ... 42 9.50 +0.08 ...63.22 31.05 PMVPharm PMVP ... ... 44.46 +0.19 ...37.51 10.61 PPD PPD ... cc 34.90 –1.60 ...
47.35 19.40 PRAGroup PRAA ... 11 33.75 –1.93 ...137.88 58.67 PRAHealthSci PRAH ... 39 132.26 +1.42 ...7.89 1.77 PRGXGlobal PRGX ... dd 7.63 +0.01 ...132.33 43.90 PTC PTC ... cc 130.88 +6.76 ...70.82 30.79 PTCTherap PTCT ... dd 63.36 –5.13 ...103.19 49.11 Paccar PCAR 1.3 24 98.85 +10.69 .3241.65 2.20 PacBiosciCA PACB ... dd 37.42 +0.50 ...7.50 2.95 PacificMercBncp PMBC ... 27 5.81 +0.04 ...37.87 13.93 PacificPremBncp PPBI 3.1 88 36.19 +1.64 .2877.89 27.46 PaciraBioSci PCRX ... 24 67.86 –5.82 ...19.61 10.40 PactivEvergreen PTVE ... ... 15.88 –0.53 ...37.52 13.84 PacWestBancorp PACW 3.1 dd 31.83 +0.90 .25121.87 39.21 Palomar PLMR ... cc 99.93 +1.87 ...40.11 10.61 PanAmerSilver PAAS .9 cc 30.22 +0.89 .0727.75 10.28 PandionTherap PAND ... dd 18.12 –0.97 ...102.25 28.55 PapaJohn's PZZA .9 cc 98.82 +3.62 .2257.27 2.50 ParatekPharma PRTK ... dd 6.66 –0.14 ...34.40 10.78 Park-Ohio PKOH 1.6 dd 31.05 –0.10 .1256.46 2.90 PartnerComms PTNR ... cc 4.81 –0.19 ...38.23 8.09 PassageBio PASG ... dd 19.81 –8.43 ...22.00 17.00 PatriaInvts PAX ... ... 19.90 +2.90 ...76.37 16.70 PatrickIndustries PATK 1.5 21 72.42 +2.57 .2814.00 3.83 PatriotNatBncp PNBK ... dd 10.20 –0.20 ...14.63 8.06 PatriotTransport PATI .0 cc 8.86 +0.07 3.0034.26 12.93 Patterson PDCO 3.2 dd 32.50 –0.03 .268.98 1.61 PattersonUTIEn PTEN 1.3 dd 6.24 –0.35 .0299.95 47.87 Paychex PAYX 2.9 30 86.87 –1.50 .62218.34 66.98 Paylocity PCTY ... cc 201.58 +12.21 ...254.39 82.07 PayPal PYPL ... 95 252.00 +12.21 ...31.72 11.15 PeapackGladFinl PGC .8 14 25.56 –0.95 .05147.26 38.01 Pegasystems PEGA .1 dd 143.34 +9.17 .03171.09 17.70 Peloton PTON ... cc 159.75 +1.94 ...110.89 3.75 PennNational PENN ... dd 109.41 +10.30 ...25.10 0.99 PennVirginia PVAC ... dd 11.22 –1.13 ...69.56 9.40 Pennant PNTG ... cc 62.71 +5.17 ...6.73 1.76 PennantPark PNNT 9.3 dd 5.16 +0.04 .1233.39 18.72 PennsWoodsBncp PWOD 5.5 12 23.43 –0.38 .3216.37 9.37 People'sUtdFin PBCT 5.1 11 14.04 –0.38 .1835.48 17.91 PeoplesBncpOH PEBO 4.5 22 31.38 –0.49 .3530.25 13.30 PeoplesBncpNC PEBK 2.7 11 22.38 –0.95 .1549.14 29.01 PeoplesFinSvcs PFIS 3.6 11 40.35 +0.78 .36148.77 101.42 PepsiCo PEP 3.0 27 138.59 –2.80 1.022519.85 7.11 PerdoceoEduc PRDO ... 7 12.67 –0.12 ...53.76 18.88 Perficient PRFT ... 51 52.93 +4.02 ...2.17 0.54 PerformantFin PFMT ... dd 1.23 +0.02 ...17.85 3.43 PerionNetwork PERI ... 55 13.90 +0.91 ...9.24 4.51 Perma-PipeIntl PPIH ... dd 6.20 –0.07 ...53.46 4.27 Personalis PSNL ... dd 47.92 +4.31 ...31.08 25.51 PetcoHealth WOOF ... ... 26.07 –1.64 ...38.99 15.83 PetIQ PETQ ... dd 34.59 –2.84 ...42.89 21.20 PetMedExpress PETS 3.6 20 30.87 –3.86 .2821.99 13.97 Pharming PHAR ... 24 14.24 –0.40 ...6.85 2.60 PhaseBioPharm PHAS ... dd 4.33 +0.23 ...64.54 22.06 PhathomPharm PHAT ... dd 39.66 +2.11 ...44.00 7.00 Phenixfin PFX ... dd 28.65 +0.03 ...29.38 16.27 PhibroAnimal PAHC 2.3 20 21.25 –0.11 .1215.55 8.31 Photronics PLAB ... 23 11.92 –0.04 ...28.74 14.06 PilgrimPride PPC ... 27 20.40 +1.26 ...187.70 30.20 Pinduoduo PDD ... dd 171.89 +10.69 ...73.24 27.80 PinnacleFinPtrs PNFP 1.0 18 73.18 +3.19 .183.23 0.75 PintecTech PT ... ... 1.17 +0.02 ...5.23 1.85 Pixelworks PXLW ... dd 3.30 +0.11 ...18.21 3.00 PlainsAllAmPipe PAA 7.9 dd 9.10 –1.23 .1818.29 3.04 PlainsGP PAGP 7.6 dd 9.44 –1.21 .187.45 1.30 PlayaHotels PLYA ... dd 5.77 –0.11 ...36.06 30.00 Playtika PLTK ... cc 30.24 –1.38 ...86.87 35.16 Plexus PLXS ... 20 80.97 –3.97 ...35.63 19.43 PliantTherap PLRX ... dd 26.50 +0.37 ...22.69 6.59 Pluralsight PS ... dd 21.33 +0.19 ...19.45 8.64 PolyPid PYPD ... ... 9.97 –0.43 ...401.29 160.35 Pool POOL .6 46 369.31 +9.91 .5861.86 23.69 Popular BPOP 2.7 11 59.80 –0.50 .402.39 0.75 PortmanRidge PTMN 12.2 dd 1.97 +0.10 .0617.62 7.63 PoseidaTherap PSTX ... dd 9.25 +0.57 ...104.98 68.66 Poshmark POSH ... ... 73.77 –9.43 ...6.00 1.50 Potbelly PBPB ... dd 4.97 +0.07 ...52.80 22.40 PotlatchDelt PCH 3.1 46 52.77 +2.24 .4145.71 15.62 PowellIndustries POWL 3.4 22 30.69 –2.25 .2699.05 38.57 PowerIntegrations POWI .5 28 94.37 +2.35 .119.33 2.55 PowerFleet PWFL ... dd 8.41 –0.18 ...60.95 23.90 PraxisPrecision PRAX ... ... 56.45 –1.06 ...11.10 1.26 Precigen PGEN ... dd 9.21 +1.20 ...16.60 4.46 PrecisionBio DTIL ... dd 13.29 +1.99 ...64.38 20.04 PreferredBankLA PFBC 2.4 11 51.04 –0.70 .3075.66 36.16 PreformedLine PLPC 1.1 11 69.71 –1.93 .2089.06 23.69 PreludeTherap PRLD ... ... 74.43 –0.02 ...18.00 8.21 PremierFinBncp PFBI 3.8 10 15.88 +1.45 1.0031.52 10.98 PremierFinl PFC 3.3 19 26.64 +0.93 .2237.79 27.11 Premier PINC 2.2 dd 34.97 –1.90 .1923.35 9.02 PrevailTherap PRVL ... dd 23.00 +0.07 ...102.53 41.15 PriceSmart PSMT .7 35 98.60 +2.56 .3532.28 9.42 PrimorisSvcs PRIM .8 15 31.23 +0.47 .0657.00 23.31 PrincipalFin PFG 4.2 12 53.46 +0.15 .5620.63 9.63 ProfessionalHldg PFHD ... 65 16.76 +0.56 ...15.92 3.08 Progenity PROG ... dd 6.20 +0.78 ...49.23 28.09 ProgressSoftware PRGS 1.7 24 41.97 –2.17 .17550.45 15.59 Progyny PGNY ... cc 50.24 +2.35 ...140.81 83.81 Proofpoint PFPT ... dd 137.96 +2.59 ...9.43 3.40 ProQRTherap PRQR ... dd 5.39 +1.02 ...6.65 3.68 ProspectCapital PSEC 11.6 ... 6.21 +0.20 .0625.65 5.30 ProtagonistTherap PTGX ... dd 22.36 –2.01 ...67.08 15.86 ProtaraTherap TARA ... dd 19.95 +0.54 ...21.46 10.95 ProtectiveInsA PTVCA 2.5 dd 16.25 +0.25 .1017.30 10.23 ProtectiveInsB PTVCB 2.7 dd 14.69 +0.42 .1014.72 7.10 Prothena PRTA ... dd 13.61 +0.02 ...20.05 4.72 ProventionBio PRVB ... dd 15.22 +0.22 ...22.84 11.40 ProvidentFin PROV 3.2 20 17.71 +0.70 .1418.52 9.53 PrudentialBncp PBIP 2.3 11 12.20 +0.20 .0739.69 22.42 PubMatic PUBM ... ... 37.73 +9.85 ...69.48 37.64 Pulmonx LUNG ... dd 65.86 +6.49 ...
52-Week Tick DivHigh Low Name Sym Yld P/E Last Chg. Amt.
52-Week Tick DivHigh Low Name Sym Yld P/E Last Chg. Amt.
52-Week Tick DivHigh Low Name Sym Yld P/E Last Chg. Amt.
52-Week Tick DivHigh Low Name Sym Yld P/E Last Chg. Amt.
52-Week Tick DivHigh Low Name Sym Yld P/E Last Chg. Amt.
Nasdaq Issues

M22 BARRON’S January 25, 2021
15.00 5.50 PumaBiotech PBYI ... dd 11.14 +0.36 ...63.95 33.00 PureTechHealth PRTC ... 3 49.78 –5.18 ...38.11 4.42 PurpleInnovation PRPL ... dd 38.03 +2.55 ...9.02 4.90 Puyi PUYI ... dd 6.02 –0.18 ...69.46 28.21 QADA QADA .4 dd 68.66 +2.34 .07251.35 20.53 QADB QADB .5 dd 48.35 –1.15 .0612.60 2.26 Q&K Intl QK ... ... 2.60 –0.05 ...43.90 22.39 QCRHoldings QCRH .6 11 40.85 ... .0621.19 8.62 QIWI QIWI 9.1 6 10.33 +0.06 .3422.00 7.52 QilianIntl QLI ... ... 8.10 –0.65 ...191.83 67.54 Qorvo QRVO ... 47 180.66 +3.37 ...167.94 58.00 Qualcomm QCOM 1.6 36 162.42 +5.33 .65128.28 63.37 Qualys QLYS ... 58 126.28 +6.30 ...84.83 10.90 Quanterix QTRX ... dd 77.68 +3.29 ...8.52 1.26 Quantum QMCO ... dd 7.16 +0.28 ...22.99 6.52 Quhuo QH ... dd 7.56 +0.03 ...306.72 72.99 Quidel QDEL ... 27 233.61 +29.12 ...22.78 5.76 QuinStreet QNST ... 38 22.07 +2.37 ...10.38 2.40 Quotient QTNT ... dd 6.14 +0.08 ...28.46 2.28 QurateRetailB QRTEB .0 7 11.75 –0.01 1.5012.51 1.73 QurateRetailA QRTEA .0 7 11.73 –0.10 1.506.55 1.53 Qutoutiao QTT ... dd 3.37 +1.24 ...
R51.21 10.52 RaptTherap RAPT ... dd 20.93 +0.02 ...20.46 10.61 RBBBancorp RBB 2.0 11 17.98 ... .09189.97 77.63 RBCBearings ROLL ... 43 184.78 –1.20 ...43.70 6.52 RCIHospitality RICK .4 dd 42.98 +4.95 .042.88 1.02 RCMTech RCMT ... dd 2.60 +0.43 ...54.97 20.03 REGENXBIO RGNX ... dd 43.28 –5.06 ...7.07 3.31 RF Industries RFIL .0 dd 5.81 +0.68 .0231.98 22.58 RGCResources RGCO 3.1 19 24.04 –0.29 .18510.20 3.00 RISEEducation REDU ... dd 5.93 –0.12 ...26.54 7.12 R1RCM RCM ... cc 26.53 +1.02 ...22.75 15.25 RackspaceTech RXT ... dd 19.08 +0.59 ...14.77 6.57 RadiusGlbInfr RADI ... ... 12.85 +0.40 ...23.30 10.15 RadiusHealth RDUS ... dd 21.69 –0.05 ...23.45 5.81 RadNet RDNT ... dd 19.60 –0.97 ...28.88 16.02 Radware RDWR ... 95 28.26 +0.44 ...3.98 1.75 RamacoRscs METC ... 70 3.01 –0.16 ...21.32 9.01 Rambus RMBS ... dd 20.64 +0.51 ...24.70 7.92 RandolphBancorp RNDB ... 7 20.20 –0.16 ...94.60 31.34 Rapid7 RPD ... dd 91.85 +4.53 ...17.14 2.90 RattlerMidstrm RTLR 8.2 12 9.73 –0.68 .2039.10 16.01 RavenIndustries RAVN .0 59 35.65 –0.92 .132.27 0.32 RealNetworks RNWK ... dd 2.14 +0.52 ...89.20 36.91 RealPage RP ... cc 87.00 –0.03 ...29.30 5.00 RealReal REAL ... dd 27.29 +0.04 ...257.96 88.17 ReataPharm RETA ... dd 113.37 +1.44 ...55.48 29.90 RedRiverBcshs RRBI .5 14 52.97 +0.76 .0637.29 4.04 RedRobin RRGB ... dd 23.90 –0.99 ...27.91 2.76 RedRockResorts RRR .0 dd 25.75 +0.72 .1083.71 9.63 Redfin RDFN ... dd 75.27 –1.50 ...11.35 3.26 RedHillBio RDHL ... dd 7.64 +0.21 ...64.65 31.80 RegencyCtrs REG 5.1 cc 46.93 –0.14 .595664.64 328.13 RegenPharm REGN ... 20 537.78 +19.85 ...64.37 32.56 RelayTherap RLAY ... dd 61.53 +16.68 ...54.00 23.25 RelmadaTherap RLMD ... dd 35.73 –1.14 ...25.65 9.91 RenalytixAI RNLX ... ... 25.65 +3.33 ...38.44 18.22 Renasant RNST 2.3 24 38.35 +0.67 .22101.05 16.05 RenewableEnergy REGI ... 7 100.53 +20.52 ...49.08 11.69 Rent-A-Center RCII 2.6 14 47.91 +0.55 .3146.44 21.45 RepareTherap RPTX ... ... 37.70 –3.80 ...226.97 78.41 Repligen RGEN ... cc 219.32 +3.85 ...54.85 8.58 Replimune REPL ... dd 44.33 +1.10 ...45.20 27.05 RepublicBcpKYA RBCAA 2.9 9 39.56 +0.47 .2863.84 1.80 RepublicFirstBncp FRBK ... dd 2.84 –0.10 ...16.21 8.66 ResourcesConnect RGP 4.4 33 12.62 –0.01 .1417.62 5.84 RetailOppor ROIC .0 51 14.39 +0.08 .2034.62 11.78 RevanceTherap RVNC ... dd 28.59 –0.05 ...47.83 17.35 RevolutionMed RVMD ... dd 43.17 +2.40 ...36.00 21.61 ReynoldsCnsmr REYN 3.0 18 29.52 +0.59 .2239.89 12.99 RhythmPharm RYTM ... dd 39.49 +5.23 ...7.49 1.95 RibbonComms RBBN ... dd 6.81 +0.02 ...6.90 3.10 RichardsonElec RELL 3.7 dd 6.52 +0.40 .065.24 1.23 RigelPharm RIGL ... dd 3.75 –0.01 ...7.56 0.77 RigNet RNET ... dd 7.42 +0.35 ...7.60 2.22 RiminiStreet RMNI ... dd 7.50 +1.00 ...7.63 3.77 RiverviewBncp RVSB 3.7 12 5.34 +0.08 .0512.75 4.00 RiverviewFinl RIVE .0 dd 10.03 –0.13 .07563.99 9.01 RocketPharm RCKT ... dd 55.00 –0.05 ...3.85 0.83 RockwellMedical RMTI ... dd 1.42 +0.22 ...33.32 14.96 RockyBrands RCKY 1.8 14 30.64 –0.76 .148.86 2.55 RockyMtnChoc RMCF .0 dd 4.45 +0.03 .12448.17 58.22 Roku ROKU ... dd 422.85 +14.55 ...29.48 13.57 Root ROOT ... ... 19.59 –0.27 ...124.16 56.30 RossStores ROST .0 cc 113.33 –3.64 .285147.64 59.78 RoyalGold RGLD 1.1 29 104.94 +0.79 .3056.50 34.80 RoyaltyPharma RPRX 1.3 15 51.16 –0.79 .1713.70 3.35 RubiusTherap RUBY ... dd 9.48 ... ...9.18 2.26 RuhnnHolding RUHN ... dd 3.08 +0.09 ...46.61 18.17 RushEntA RUSHA 1.2 20 46.20 +1.60 .1443.19 14.43 RushEntB RUSHB 1.3 19 43.19 +2.34 .1424.42 2.32 RuthsHospitality RUTH .0 dd 19.54 +0.72 .15118.17 44.44 Ryanair RYAAY ... dd 104.98 –3.16 ...
S39.62 16.98 S&TBancorp STBA 4.0 53 28.29 ... .28328.37 205.20 SBAComm SBAC .7 dd 272.71 +3.61 .46511.90 4.20 SCYNEXIS SCYX ... dd 8.11 +0.22 ...69.61 35.41 SEI Investments SEIC 1.2 20 59.40 –0.27 .3732.00 7.20 SI-BONE SIBN ... dd 31.20 +2.72 ...8.10 3.96 SIGATech SIGA ... 17 7.02 –0.25 ...45.68 26.04 Sina SINA ... dd 43.08 +1.34 ...14.15 5.60 SLM SLM .9 9 13.23 –0.55 .0341.71 16.42 SMARTGlobal SGH ... cc 40.85 +1.63 ...
5.96 1.32 SMTC SMTX ... 43 5.88 –0.01 ...12.08 6.75 SocTelemed TLMD ... ... 7.96 +1.15 ...2.40 0.60 SocTelemedWt TLMDW ... ... 1.29 –0.02 ...46.67 0.55 SPIEnergy SPI ... dd 11.23 +2.86 ...46.65 14.44 SPPlus SP ... dd 31.61 +1.11 ...118.06 31.28 SPSCommerce SPSC ... 95 108.55 +1.56 ...74.00 29.51 SS&CTech SSNC .8 31 67.51 +1.12 .1425.32 9.00 SSRMining SSRM ... 35 17.47 +0.41 ...497.85 127.39 SVBFin SIVB ... 21 480.15 +18.72 ...27.50 9.35 SVMK SVMK ... dd 26.57 +1.30 ...22.55 5.55 SabraHealthcare SBRA 6.9 25 17.28 –0.22 .3022.99 3.30 Sabre SABR .0 dd 12.02 +0.43 .1495.17 65.45 SafetyInsurance SAFT 4.7 10 77.38 –2.38 .9031.95 16.25 SagaComm SGA .0 dd 21.79 –0.12 .3298.39 25.01 SageTherap SAGE ... dd 88.55 –2.83 ...203.58 61.46 Saia SAIA ... 43 194.88 +0.58 ...2.62 0.65 SalemMedia SALM .0 dd 1.65 +0.10 .025153.15 102.13 SandersonFarms SAFM 1.2 cc 142.25 +13.00 .4436.79 18.00 SandySpringBncp SASR 3.4 17 35.40 –0.22 .3094.30 66.35 Sanfilippo JBSS ... 17 78.47 –1.17 ...19.43 4.81 SangamoTherap SGMO ... dd 14.95 –0.80 ...35.61 18.34 Sanmina SANM ... 17 34.40 +0.14 ...55.00 37.62 Sanofi SNY 2.4 10 49.69 +0.30 1.699435.85 13.55 SapiensInt SPNS ... 55 34.45 +3.44 ...181.83 78.06 SareptaTherap SRPT ... dd 98.24 +7.92 ...36.10 3.50 SatsumaPharm STSA ... dd 6.21 +0.87 ...3.39 1.00 Savara SVRA ... dd 1.79 +0.34 ...35.96 13.78 ScanSource SCSC ... dd 26.64 +0.21 ...42.19 10.09 SchnitzerSteel SCHN 2.4 53 31.59 –0.52 .187561.10 9.23 ScholarRock SRRK ... dd 57.46 +0.03 ...35.80 18.80 Scholastic SCHL 2.2 dd 26.75 +0.65 .1599.50 25.50 Schrodinger SDGR ... dd 95.70 +4.81 ...48.22 3.76 ScientificGames SGMS ... dd 45.06 +0.40 ...18.75 5.82 SciPlay SCPL ... 20 17.48 +0.44 ...47.86 5.34 ScopusBio SCPS ... ... 12.36 –0.85 ...11.99 5.00 scPharm SCPH ... dd 7.07 +0.98 ...16.58 5.36 ScrippsEW SSP 1.4 36 14.74 –0.11 .054.98 0.69 SeaChange SEAC ... dd 1.29 –0.31 ...34.08 13.30 SeacoastBkgFL SBCF ... 24 33.57 +0.27 ...66.69 39.02 Seagate STX 4.5 16 60.00 –0.51 .67213.94 90.57 Seagen SGEN ... 72 182.75 –3.00 ...18.98 4.02 SeaSpine SPNE ... dd 17.15 +0.37 ...6.95 2.11 SecooHolding SECO ... 57 2.85 –0.01 ...16.93 5.29 SecureWorks SCWX ... dd 14.94 +0.98 ...9.96 3.67 SecurityNatFin SNFCA ... 3 9.24 +0.04 ...86.55 44.00 Seer SEER ... ... 77.88 –1.60 ...11.91 5.98 SelectBancorp SLCT ... 25 10.07 +0.08 ...4.83 1.42 SelectaBiosci SELB ... dd 3.44 –0.11 ...70.89 37.05 SelectiveIns SIGI 1.5 20 66.95 –0.96 .2583.27 26.03 Semtech SMTC ... cc 82.82 +5.50 ...48.05 25.04 SenecaFoodsA SENEA ... 4 38.41 –1.69 ...38.50 2.52 SeresTherap MCRB ... dd 24.05 –0.43 ...23.38 3.59 ServiceProperties SVC .4 dd 11.08 –0.14 .012.10 0.53 ServiceSource SREV ... dd 1.88 +0.26 ...45.83 21.76 ServisFirstBcshs SFBS 1.9 15 43.23 +1.24 .201.82 0.37 SesenBio SESN ... dd 1.65 +0.11 ...23.93 10.00 17Educ&Tech YQ ... dd 16.90 +4.82 ...60.52 17.51 ShattuckLabs STTK ... ... 50.00 +4.80 ...59.93 38.35 ShenandoahTel SHEN .8 24 44.29 +1.01 .34143.79 22.01 ShockwaveMed SWAV ... dd 129.98 –6.89 ...44.21 12.56 ShoeCarnival SCVL .9 51 41.86 –0.85 .0916.79 7.63 ShoreBancshares SHBI 3.3 11 14.43 +0.12 .1232.23 9.01 Shyft SHYF .3 ... 31.89 +2.46 .0257.04 1.00 Sientra SIEN ... dd 4.72 +0.33 ...28.28 13.05 SierraBancorp BSRR 3.2 11 24.99 –0.40 .2016.92 8.55 SierraOncology SRRA ... dd 15.96 –0.09 ...22.22 4.31 SierraWireless SWIR ... dd 21.50 +3.36 ...54.32 22.00 SigilonTherap SGTX ... ... 34.86 –0.60 ...160.63 68.98 SignatureBank SBNY 1.4 16 160.27 +5.94 .5640.44 24.65 SilganHoldings SLGN 1.3 15 37.40 +1.33 .1248.01 20.93 Silicom SILC ... 45 44.70 +0.34 ...144.68 65.09 SiliconLab SLAB ... cc 142.36 +6.33 ...52.46 26.72 SiliconMotion SIMO 2.7 17 51.13 +1.71 .3575.80 20.84 SilkRoadMed SILK ... dd 60.33 +0.52 ...54.41 24.22 SilverbackTherap SBTX ... ... 45.64 –2.68 ...15.98 6.21 SilvercrestAsset SAMG 4.2 14 15.34 –0.14 .1627.19 13.75 SimmonsFirstNat SFNC 2.5 12 27.05 +0.87 .1734.57 10.58 SinclairBroadcast SBGI 2.5 dd 31.97 –1.23 .205.74 1.41 SioGeneTherap SIOX ... dd 2.80 –0.06 ...12.77 5.06 SiriusIntlIns SG ... dd 12.02 –0.08 ...7.40 4.11 SiriusXM SIRI 1.0 25 5.97 +0.17 .0146143.46 15.42 SiTime SITM ... dd 138.44 +1.94 ...64.97 10.58 SkyWest SKYW .0 20 42.48 +0.71 .14168.95 67.90 Skyworks SWKS 1.2 34 161.27 +9.27 .5099.93 15.27 SleepNumber SNBR ... 28 99.54 +4.59 ...2.28 0.55 SmartSand SND ... 2 1.85 –0.10 ...15.54 3.64 SmileDirectClub SDC ... dd 11.06 –0.36 ...23.57 4.24 Smith&Wesson SWBI 1.1 26 17.87 –3.30 .0516.95 8.03 SoYoungIntl SY ... cc 13.23 +1.80 ...25.71 5.41 Sohu.com SOHU ... dd 18.56 +2.13 ...14.00 5.00 SolGelTech SLGL ... dd 10.47 +0.04 ...21.19 7.42 SolarCapital SLRC 9.2 dd 17.85 +0.07 .4118.29 6.30 SolarSeniorCap SUNS 8.0 19 15.09 –0.45 .10377.00 67.02 SolarEdgeTech SEDG ... 96 321.12 +38.86 ...8.56 1.93 SolidBiosci SLDB ... dd 6.42 –0.06 ...28.50 6.58 Sonos SONO ... dd 28.30 +1.97 ...29.00 24.05 SoteraHealth SHC ... ... 26.80 +1.31 ...6.46 1.43 SotherlyHotels SOHO ... dd 2.69 –0.06 ...22.00 11.30 SouthPlainsFin SPFI 1.0 9 20.09 +0.49 .0586.43 40.42 SouthState SSB 2.4 52 79.58 –0.51 .4742.23 20.89 SouthernFirstBcsh SFST ... 19 40.90 +2.11 ...38.98 17.30 SoMOBancorp SMBC 1.8 10 32.92 +0.64 .1516.41 7.58 SoNtlBcpVA SONA 3.1 13 12.78 +0.08 .1037.19 23.51 SouthsideBcshs SBSI 3.8 16 33.40 +0.15 .0511.32 5.25 SparkEnergy SPKE 6.7 9 10.87 +0.02 .181323.94 9.00 SpartanNash SPTN 4.3 9 18.10 +0.11 .19255.24 1.74 SpectrumPharm SPPI ... dd 3.99 +0.40 ...23.64 5.25 SperoTherap SPRO ... dd 18.79 +2.34 ...22.35 8.96 SpiritofTexas STXB 2.0 13 18.08 +0.13 .09
225.89 93.92 Splunk SPLK ... dd 170.90 +0.93 ...12.84 8.53 SpokHoldings SPOK 4.0 dd 12.37 +0.24 .12518.46 4.08 SportsmansWrhs SPWH ... 11 17.64 +0.05 ...87.60 19.50 SpringWorks SWTX ... dd 85.29 +5.49 ...28.00 13.00 SproutsFarmersMkt SFM ... 10 21.41 +0.49 ...35.60 15.12 SpruceBio SPRB ... ... 21.72 –1.70 ...92.27 23.20 StaarSurgical STAA ... cc 91.37 +3.31 ...325.13 73.14 Stamps.com STMP ... 29 231.13 +21.91 ...12.22 3.86 StarBulkCarriers SBLK 1.2 cc 11.40 –0.09 .058.84 1.99 StarEquity STRR ... dd 3.86 +0.39 ...107.75 50.02 Starbucks SBUX 1.7 cc 103.91 +1.58 .4531.81 12.07 StateAutoFin STFC 2.2 dd 18.23 –0.38 .105.00 0.90 StealthBioTher MITO ... dd 1.79 +0.29 ...3.31 1.51 StealthGas GASS ... 8 2.77 +0.08 ...42.10 14.98 SteelDynamics STLD 2.6 17 38.70 –0.50 .2540.98 22.72 StepStone STEP ... cc 37.28 –0.18 ...79.50 38.45 Stericycle SRCL ... dd 68.96 +0.90 ...24.49 6.72 SterlingCnstr STRL ... 11 23.68 +0.56 ...42.11 16.38 StevenMadden SHOO .0 dd 34.90 –1.13 .1598.54 10.90 StitchFix SFIX ... dd 96.92 +23.05 ...44.88 22.98 StockYardsBncp SYBT 2.5 17 42.86 +0.86 .2771.58 15.82 StokeTherap STOK ... dd 67.32 +0.75 ...87.23 17.72 StoneCo STNE ... cc 79.00 +0.77 ...65.44 28.01 StoneX SNEX ... 7 57.12 –2.64 ...38.33 11.89 Stratasys SSYS ... dd 38.15 +6.30 ...187.98 81.83 StrategicEd STRA 2.7 18 88.85 –4.20 .6052.92 11.74 Strattec STRT .0 dd 47.20 +0.66 .1431.74 12.00 StratusProp STRS ... dd 24.88 –0.93 ...4.63 1.50 StrongbridgeBio SBBP ... dd 2.93 +0.07 ...26.35 13.48 SummitFin SMMF 3.0 10 22.41 –0.57 .1717.17 6.50 SummitStateBk SSBI 2.9 11 16.69 +1.69 .126.14 1.18 SummitTherap SMMT ... ... 5.59 +0.29 ...35.70 16.71 SumoLogic SUMO ... dd 34.01 +3.29 ...12.47 1.00 SundanceEnergy SNDE ... ... 2.06 +0.14 ...13.16 1.33 SunOpta STKL ... dd 13.07 +0.99 ...47.22 2.64 SunPower SPWR ... cc 47.21 +15.25 ...100.93 7.84 SunRun RUN ... cc 86.39 +2.14 ...34.34 15.76 SuperMicroComp SMCI ... 22 34.21 +1.86 ...28.58 6.10 SuperiorGroup SGC 1.6 12 25.03 +0.82 .1030.13 13.12 SupernusPharms SUPN ... 12 29.94 +0.72 ...14.40 1.38 SurfaceOncol SURF ... dd 13.31 +1.01 ...5.01 1.46 Surgalign SRGA ... dd 2.08 –0.01 ...32.18 4.00 SurgeryPartners SGRY ... dd 30.86 +0.30 ...49.00 22.06 Surmodics SRDX ... cc 45.86 +1.88 ...28.09 6.00 SutroBioph STRO ... dd 27.54 +0.51 ...43.33 22.12 SykesEnterprises SYKE ... 31 41.27 –0.06 ...1.95 0.79 Synacor SYNC ... dd 1.82 +0.22 ...14.25 3.81 Synalloy SYNL ... dd 8.85 +0.31 ...108.01 44.41 Synaptics SYNA ... 33 105.90 +4.94 ...6.02 2.17 Synchronoss SNCR ... dd 4.89 +0.52 ...27.85 6.32 SyndaxPharm SNDX ... dd 20.23 –3.50 ...78.29 30.02 SyneosHealth SYNH ... 42 76.09 +0.67 ...4.30 1.35 Synlogic SYBX ... dd 4.09 +0.57 ...280.11 104.90 Synopsys SNPS ... 63 270.14 +11.22 ...2.90 0.54 SyprisSolutions SYPR ... 22 2.02 +0.24 ...15.65 4.26 SyrosPharm SYRS ... dd 12.19 –1.91 ...
T45.42 16.96 TCFFinancial TCF 3.4 27 41.29 –2.46 .3514.37 4.30 TCGBDC CGBD 11.4 dd 11.25 ... .0435.86 5.84 TCR2Therap TCRR ... dd 29.04 –3.76 ...23.55 5.25 TelaBio TELA ... dd 14.80 +0.49 ...21.14 3.44 TFFPharm TFFP ... dd 17.82 +0.15 ...22.47 12.65 TFSFin TFSL 5.9 65 19.05 –0.15 .28135.54 63.50 T-MobileUS TMUS ... 43 130.36 +3.08 ...71.80 9.19 TPIComposites TPIC ... dd 68.52 +6.38 ...161.13 82.51 TRowePrice TROW 2.3 18 156.21 –0.21 .9084.70 26.28 TTEC TTEC .9 38 82.89 +9.11 2.1416.25 8.06 TTMTech TTMI ... dd 14.17 +0.07 ...2.31 0.24 T2Biosystems TTOO ... dd 1.87 +0.06 ...69.72 30.12 TabulaRasaHlth TRHC ... dd 51.44 –0.28 ...65.46 29.47 TactileSystems TCMD ... dd 52.62 +2.22 ...12.65 2.48 TaiwanLiposome TLC ... dd 4.40 –0.07 ...211.44 100.00 TakeTwoSoftware TTWO ... 49 204.66 +8.38 ...46.80 18.30 Talend TLND ... dd 45.08 +5.17 ...123.74 43.69 TandemDiabetes TNDM ... dd 98.62 +6.90 ...5.36 1.50 TarenaIntl TEDU ... dd 3.11 +0.13 ...63.69 15.32 TarsusPharm TARS ... ... 40.72 –2.45 ...8.34 3.00 TatTechnologies TATT ... dd 5.86 –0.32 ...33.35 18.16 TayshaGene TSHA ... ... 30.81 +1.23 ...74.45 16.82 TechTarget TTGT ... cc 72.44 +3.90 ...12.61 6.15 Ericsson ERIC .9 26 11.83 +0.07 .05466.50 3.45 TeleNav TNAV ... 38 4.79 +0.04 ...6.46 0.46 Teligent TLGT ... dd 1.18 +0.16 ...41.84 18.08 Telos TLS ... dd 39.83 +2.07 ...191.24 48.78 10xGenomics TXG ... dd 187.00 +7.33 ...58.45 16.28 Tenable TENB ... dd 53.67 –0.10 ...143.40 42.87 Teradyne TER .3 35 137.95 +0.65 .1030.43 19.23 TerritBanc TBNK 3.5 13 26.16 –0.35 .10884.49 70.10 Tesla TSLA ... cc 846.64 +20.48 ...12.26 4.12 TesscoTech TESS .0 dd 7.27 –0.11 .02142.69 63.61 TetraTech TTEK .5 45 142.42 +9.90 .1770.61 19.10 TexasCapBcshs TCBI ... 60 66.37 –2.06 ...175.47 93.09 TexasInstruments TXN 2.4 33 172.81 +3.62 1.0284.27 25.15 TexasRoadhouse TXRH .0 cc 79.71 –0.91 .3617.40 3.36 TheBancorp TBBK ... 17 17.34 +0.93 ...2.68 0.85 TherapeuticsMD TXMD ... dd 1.50 +0.12 ...31.54 14.48 TheravanceBio TBPH ... dd 18.13 +0.14 ...7.69 2.29 36Kr KRKR ... dd 5.30 +2.11 ...18.06 6.37 360DigiTech QFIN ... 6 15.99 +1.73 ...22.61 2.43 Tilray TLRY ... dd 18.02 –1.68 ...28.74 13.60 TimberlandBncp TSBK 2.9 10 27.80 +0.27 .2023.31 6.96 TitanMachinery TITN ... 26 22.48 +0.20 ...24.83 1.92 TivityHealth TVTY ... dd 21.96 +1.31 ...12.17 0.62 TizianaLifeSci TLSA ... dd 3.97 +0.93 ...2.46 0.39 TonixPharm TNXP ... dd 1.03 +0.12 ...48.86 6.34 Torm TRMD 25.6 2 7.41 –0.35 .8530.87 12.13 TowerSemi TSEM ... 41 30.23 +1.78 ...
28.20 15.03 TowneBank TOWN 2.8 14 25.73 +0.31 .18160.83 63.89 TractorSupply TSCO 1.0 24 155.62 –1.86 .40972.80 136.00 TradeDesk TTD ... cc 812.96 +27.60 ...69.06 33.23 Tradeweb TW .5 75 64.32 –0.30 .0811.33 2.87 TransActTechs TACT ... dd 10.03 +0.43 ...37.42 16.50 Transcat TRNS ... 42 37.42 +2.02 ...28.09 6.80 TranslateBio TBIO ... dd 23.03 –0.30 ...24.77 10.10 TransMedics TMDX ... dd 23.77 +4.33 ...35.99 5.51 TravelCenters TA ... 9 32.65 +0.20 ...12.40 3.04 Travelzoo TZOO ... dd 10.26 –0.02 ...29.60 8.98 TravereTherap TVTX ... dd 27.67 –0.05 ...17.90 9.90 TreanInsurance TIG ... ... 15.50 +1.15 ...6.12 1.63 TremontMortgage TRMT 1.0 4 4.05 –0.05 .538.50 1.33 TreviTherap TRVI ... dd 2.97 –0.04 ...15.84 4.91 TribunePub TPCO .0 dd 15.84 +0.81 .2539.02 3.74 Tricida TCDA ... dd 7.45 +0.42 ...41.19 23.05 TriCoBancshares TCBK 2.2 19 40.37 –0.42 .2235.06 18.05 TriMas TRS ... dd 34.22 +0.36 ...74.00 20.01 Trimble TRMB ... 36 70.76 +1.30 ...4.94 0.56 TrinityBiotech TRIB ... 17 4.62 +0.60 ...37.45 20.10 Trip.com TCOM ... dd 33.58 +0.45 ...36.17 13.73 TripAdvisor TRIP ... dd 33.19 –0.24 ...25.10 7.59 TriStateCapital TSC ... 14 19.47 –0.35 ...15.45 7.10 Triterras TRIT ... cc 7.56 –0.53 ...3.95 0.23 TriterrasWt TRITW ... ... 1.70 +0.01 ...60.85 19.03 TriumphBancorp TBK ... 24 59.68 +0.81 ...3.00 1.25 trivago TRVG ... dd 2.19 +0.03 ...6.47 1.98 TrueCar TRUE ... dd 5.07 +0.48 ...125.57 22.48 Trupanion TRUP ... dd 118.07 +0.62 ...8.22 4.30 TrustcoBank TRST 3.8 13 7.08 –0.14 .068133.98 20.08 Trustmark TRMK 3.0 14 30.52 –0.03 .234.51 0.73 Tuniu TOUR ... dd 2.16 +0.09 ...139.81 31.30 TurningPtTherap TPTX ... dd 131.96 +0.36 ...26.48 4.05 TurtleBeach HEAR ... 10 25.23 +3.57 ...41.98 9.12 21Vianet VNET ... dd 41.17 +1.51 ...10.53 4.66 TwinDisc TWIN ... dd 8.95 –0.16 ...214.07 18.52 TwistBiosci TWST ... dd 190.64 +9.29 ...49.46 11.51 2U TWOU ... dd 43.97 +1.32 ...
U64.20 29.17 UFP Inds UFPI .4 17 60.26 +3.59 .12577.00 39.47 UMBFin UMBF 1.7 19 75.18 +0.94 .3211.84 3.80 USATech USAT ... dd 10.54 +0.18 ...12.85 2.36 USATruck USAK ... dd 11.05 +1.52 ...57.97 6.75 USConcrete USCR ... 26 47.80 –3.93 ...55.34 24.94 USEcology ECOL ... dd 36.65 +0.20 ...135.20 60.99 USLime&Min USLM .5 28 128.36 +1.59 .1624.77 8.56 uCloudlink UCL ... dd 10.38 +0.08 ...310.49 124.05 UltaBeauty ULTA ... 76 299.92 –1.93 ...43.88 11.79 UltraClean UCTT ... 40 43.36 +3.33 ...179.65 31.99 UltragenyxPharm RARE ... dd 140.47 +2.50 ...8.85 4.85 Ultralife ULBI ... 23 6.80 +0.02 ...18.28 8.88 Umpqua UMPQ 5.2 dd 16.04 –0.64 .216.92 3.95 UnicoAmerican UNAM ... dd 5.46 +0.66 ...35.72 16.50 UnionBankshares UNB 5.0 10 26.51 +0.87 .3371.45 34.38 uniQure QURE ... dd 39.26 +1.73 ...84.73 17.80 UnitedAirlines UAL ... dd 42.14 –1.75 ...25.98 12.60 UnitedBancshares UBOH 2.6 5 24.65 –0.07 .1637.23 19.67 UnitedBkshrsWV UBSI 3.9 16 35.68 +0.11 .3532.52 14.95 UtdCmtyBks UCBI 2.3 17 31.77 +0.24 .1847.52 18.83 UnitedFire UFCS 1.9 dd 30.85 –0.29 .1518.30 10.65 UnitedGuardian UG 5.1 16 14.23 +0.06 .3610.27 5.04 UnitedSecBcshrs UBFO 5.8 13 7.62 +0.01 .11176.31 75.58 UnitedTherap UTHR ... 16 167.71 –5.11 ...13.28 4.86 Uniti UNIT 4.7 dd 12.70 +0.15 .1523.75 8.76 UnityBancorp UNTY 1.7 9 19.38 –0.34 .0815.44 2.72 UnityBiotech UBX ... dd 6.81 –0.11 ...262.77 105.11 UnivDisplay OLED .2 cc 247.86 –2.74 .1560.44 29.50 UnivElectro UEIC ... 26 60.16 +3.39 ...23.97 11.02 UnivLogistics ULH 1.8 16 23.26 +0.56 .10513.89 5.12 UnivStainless USAP ... dd 7.87 –0.33 ...26.00 13.20 UnivestFin UVSP 3.4 19 23.39 –0.31 .2018.88 2.03 UpFintech TIGR ... cc 17.76 +3.85 ...51.48 20.75 UplandSoftware UPLD ... dd 49.86 +4.30 ...69.48 22.61 Upstart UPST ... ... 64.47 +8.47 ...44.05 5.14 Upwork UPWK ... dd 41.35 +2.55 ...32.86 12.28 UrbanOutfitters URBN ... dd 26.76 –1.37 ...31.70 13.12 UroGenPharma URGN ... dd 21.00 +0.97 ...16.25 6.55 UrovantSci UROV ... dd 16.24 +0.08 ...109.00 75.33 UtahMedProducts UTMD 1.3 28 87.23 –1.56 .2852.88 0.82 UTStarcom UTSI ... ... 1.86 +0.03 ...2.79 0.72 Uxin UXIN ... dd 1.27 +0.22 ...
V2.78 1.20 VEON VEON 19.9 dd 1.80 –0.09 .1523.97 1.82 VOXX Intl VOXX ... dd 21.33 –0.21 ...42.43 13.83 VSE VSEC .9 dd 41.39 +0.54 .096.15 1.00 VyneTherap VYNE ... dd 1.88 +0.21 ...11.34 6.00 ValleyNatlBncp VLY 4.0 14 10.99 +0.33 .1115.01 7.12 VandaPharm VNDA ... 40 14.20 +0.47 ...30.93 10.37 VarexImaging VREX ... dd 20.27 +1.81 ...185.77 48.95 VaronisSystems VRNS ... dd 184.02 +11.19 ...3.09 0.90 VascularBiogenics VBLT ... dd 2.69 +0.19 ...22.35 10.94 VastaPlatform VSTA ... ... 13.70 –0.74 ...58.48 17.80 Vaxcyte PCVX ... dd 25.14 –0.56 ...21.00 7.42 VeecoInstr VECO ... dd 20.68 +0.75 ...32.50 9.87 VelodyneLidar VLDR ... dd 23.15 +0.20 ...14.41 0.05 VelodyneLidarWt VLDRW ... ... 8.65 +0.12 ...9.00 1.60 VenusConcept VERO ... dd 2.37 +0.10 ...10.92 3.12 VeraBradley VRA ... 22 8.47 +0.43 ...63.55 13.90 Veracyte VCYT ... dd 55.24 +4.45 ...4.67 1.08 Verastem VSTM ... dd 2.20 –0.25 ...74.98 32.44 VerintSystems VRNT ... cc 72.18 +0.33 ...221.30 148.77 VeriSign VRSN ... 28 194.75 –0.52 ...210.66 116.61 VeriskAnalytics VRSK .6 48 192.76 +2.74 .2729.51 10.02 Veritex VBTX 2.4 18 28.38 –0.37 .17
43.47 1.22 Veritone VERI ... dd 41.65 +2.96 ...15.71 2.01 VeronaPharma VRNA ... dd 7.80 +0.30 ...17.60 6.02 VerricaPharm VRCA ... dd 12.64 +1.75 ...37.68 21.11 Vertex VERX ... dd 33.32 –1.62 ...306.08 197.47 VertxPharm VRTX ... 23 237.59 +12.04 ...47.06 13.12 ViacomCBSA VIACA 2.1 21 46.00 +0.15 .2446.86 10.10 ViacomCBSB VIAC 2.1 21 45.58 +0.28 .2469.92 25.10 ViaSat VSAT ... dd 40.75 +2.06 ...23.11 12.75 Viatris VTRS ... 34 17.43 +0.38 ...16.41 8.08 ViaviSolutions VIAV ... cc 16.06 +0.23 ...103.59 30.42 Vicor VICR ... cc 98.57 +1.10 ...26.04 10.18 VictoryCapital VCTR 1.0 9 23.39 –1.04 .0770.66 25.02 VielaBio VIE ... dd 34.87 –1.22 ...7.36 1.11 ViewRay VRAY ... dd 4.48 –0.70 ...8.36 3.26 VikingTherap VKTX ... dd 6.82 +0.34 ...27.88 16.48 VillageSuperA VLGEA 4.6 12 21.82 –1.35 .258.39 4.20 ViomiTech VIOT ... 25 7.40 +1.02 ...23.82 4.98 ViperEnergyPtrs VNOM 2.7 dd 14.60 +0.19 .1075.00 16.09 VirBiotech VIR ... dd 40.53 +1.22 ...4.40 1.82 VircoMfg VIRC ... dd 2.74 +0.07 ...28.59 15.13 VirtuFinancial VIRT 3.9 6 24.84 +0.38 .24239.99 55.37 VirtusInvtPtrs VRTS 1.5 31 223.03 –3.94 .8252.81 19.48 Virtusa VRTU ... 41 51.16 +0.02 ...147.55 38.69 Visteon VC ... dd 140.07 –1.04 ...43.30 23.78 VitalFarms VITL ... 97 26.34 +0.66 ...17.00 11.32 Vitru VTRU ... ... 15.24 –0.33 ...20.42 11.46 Vodafone VOD 5.9 18 17.58 +0.22 .532514.40 4.18 Vonage VG ... dd 13.47 +0.08 ...14.62 6.26 VoyagerTherap VYGR ... 9 9.04 +0.54 ...75.49 32.00 Vroom VRM ... ... 36.55 –0.29 ...
W19.98 6.61 WaveLifeSci WVE ... dd 9.97 +0.84 ...320.00 151.16 WD-40 WDFC .9 55 288.93 +10.53 .6747.78 17.84 WSFSFinancial WSFS 1.0 24 46.54 –0.11 .1217.06 13.00 WVSFinancial WVFC 2.7 12 15.00 –0.46 .1039.75 9.75 WWIntl WW ... 19 24.35 –1.63 ...5.85 0.26 Waitr WTRH ... dd 3.38 +0.32 ...54.53 33.36 WalgreensBoots WBA 3.9 dd 47.45 –1.47 .46754.85 1.36 WandaSports WSG ... dd 2.50 ... ...39.38 25.61 WarnerMusic WMG 1.2 dd 38.74 +3.77 .1235.68 20.01 WashingtonFederal WAFD 3.1 15 28.57 +0.26 .2251.82 25.86 WashTrBcp WASH 4.5 12 46.65 –0.51 .5219.98 12.10 WaterstoneFinl WSBF 4.2 8 19.27 +0.05 .2036.79 10.86 Watford WTRE ... dd 34.75 +0.01 ...26.50 9.52 WaysideTech WSTG 3.6 21 18.78 –0.28 .1748.16 28.93 Weibo WB ... 26 42.96 +1.86 ...24.91 6.82 Wendy's WEN 1.4 45 20.85 –0.80 .0747.43 28.99 WernerEnterprises WERN .8 19 42.96 +1.01 .0936.88 17.46 WesBanco WSBC 4.0 19 31.65 –0.03 .3224.49 13.74 WestBancorp WTBA 4.0 11 21.01 +0.02 .2167.26 46.94 WestamericaBncp WABC 2.7 21 61.52 +2.09 .4171.76 27.40 WesternDigital WDC .0 dd 50.71 –0.50 .509.53 4.45 WestNewEngBncp WNEB 3.0 18 6.66 –0.06 .058.87 0.70 WestportFuelSys WPRT ... dd 8.20 +1.37 ...24.59 15.13 WeycoGroup WEYS 5.7 dd 16.98 –0.64 .2450.73 17.92 Willdan WLDN ... dd 50.36 +1.49 ...61.66 14.11 WillisLease WLFC ... 13 30.50 –5.55 ...220.97 143.34 WillisTowers WLTW 1.4 25 206.50 –0.15 .7129.50 3.20 WiMiHologram WIMI ... ... 8.57 +2.24 ...170.00 44.27 Wingstop WING .4 cc 155.44 +10.49 5.00215.00 115.00 Winmark WINA .5 24 183.99 +0.99 3.0069.88 22.02 WintrustFin WTFC 1.7 14 65.88 –1.89 .285.82 1.87 WisdomTreeInvs WETF 2.2 dd 5.43 +0.16 .0318.49 3.90 WISeKey WKEY ... dd 6.68 –0.11 ...319.34 76.81 Wix.com WIX ... dd 249.49 +8.21 ...127.91 46.51 Woodward WWD .3 33 122.02 –0.75 .0813259.01 107.75 Workday WDAY ... dd 235.53 +12.97 ...151.38 43.16 WorldAcceptance WRLD ... 12 112.19 –28.86 ...138.44 35.84 WynnResorts WYNN .0 dd 107.45 +1.22 1.00
XYZ46.32 14.14 XOMA XOMA ... dd 39.31 –0.62 ...52.94 15.50 XP XP ... 61 42.11 +2.32 ...23.87 8.72 XBiotech XBIT ... 1 16.85 +0.49 ...1.86 0.40 XcelBrands XELB ... dd 1.39 +0.01 ...76.44 46.58 XcelEnergy XEL 2.7 23 64.76 –0.20 .4350.57 19.35 Xencor XNCR ... dd 48.50 +0.04 ...18.45 7.00 XenonPharms XENE ... dd 15.97 –0.09 ...7.16 1.42 XerisPharm XERS ... dd 5.34 –0.03 ...7.44 0.76 XiaobaiMaimai HX ... ... 2.67 +0.27 ...154.93 67.68 Xilinx XLNX 1.1 58 142.94 +6.34 .3822.09 9.01 Xperi XPER .9 dd 21.83 +0.36 .056.04 2.38 Xunlei XNET ... dd 4.32 +0.47 ...55.22 14.16 Y-mAbsTherap YMAB ... dd 44.90 –2.65 ...6.56 1.29 YRCWorldwide YRCW ... dd 5.45 +0.26 ...72.95 27.93 Yandex YNDX ... 67 66.44 –0.88 ...51.27 34.56 YorkWater YORW 1.6 37 45.71 –0.41 .18746.05 1.67 Yunji YJ ... dd 2.56 +0.28 ...9.01 2.06 ZAGG ZAGG ... dd 4.24 +0.07 ...4.54 1.80 Ziopharm ZIOP ... dd 3.63 +0.12 ...193.54 43.06 ZaiLab ZLAB ... ... 181.76 +10.86 ...44.60 22.00 ZealandPharma ZEAL ... dd 37.19 –0.43 ...419.21 150.06 ZebraTech ZBRA ... 47 408.84 –0.38 ...61.29 22.00 ZentalisPharm ZNTL ... dd 43.22 –5.91 ...158.80 18.65 ZillowA ZG ... dd 152.05 +8.15 ...151.97 20.04 ZillowC Z ... dd 145.82 +8.32 ...51.22 23.58 ZionsBancorp ZION 2.8 16 48.12 –1.02 .349.46 2.84 Zix ZIXI ... dd 8.49 –0.30 ...54.45 16.65 Zogenix ZGNX ... dd 19.30 +0.66 ...588.84 70.26 ZoomVideo ZM ... cc 383.40 –1.13 ...64.40 30.83 ZoomInfoTech ZI ... dd 46.27 +0.93 ...7.24 1.08 Zovio ZVO ... dd 5.50 +0.09 ...218.00 35.00 Zscaler ZS ... dd 217.36 +6.30 ...45.87 13.13 Zumiez ZUMZ ... 16 44.04 –0.96 ...7.45 2.55 ZynerbaPharma ZYNE ... dd 3.58 –0.01 ...11.09 5.65 Zynga ZNGA ... dd 10.71 +1.04 ...
52-Week Tick DivHigh Low Name Sym Yld P/E Last Chg. Amt.
52-Week Tick DivHigh Low Name Sym Yld P/E Last Chg. Amt.
52-Week Tick DivHigh Low Name Sym Yld P/E Last Chg. Amt.
52-Week Tick DivHigh Low Name Sym Yld P/E Last Chg. Amt.
52-Week Tick DivHigh Low Name Sym Yld P/E Last Chg. Amt.
Nasdaq Issues
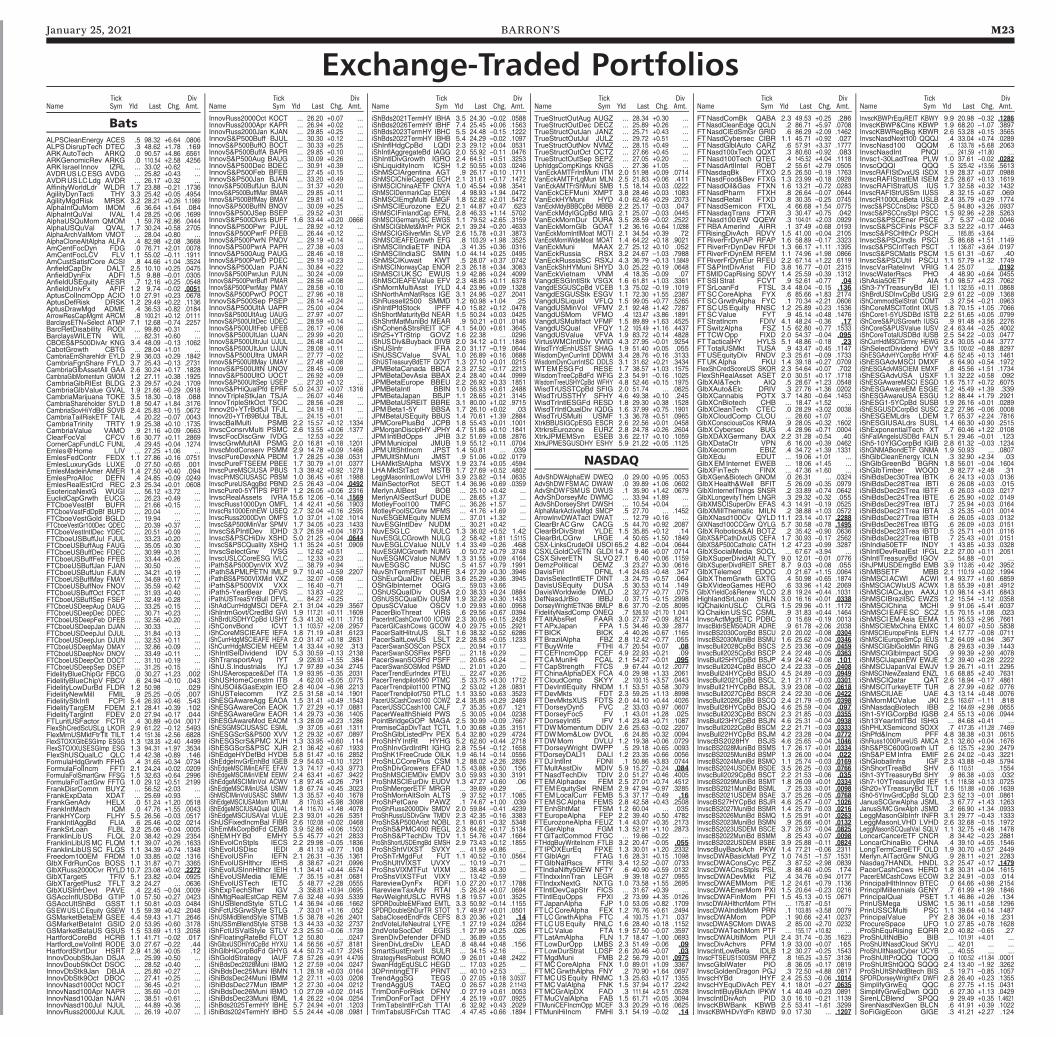
January 25, 2021 BARRON’S M23
Exchange-Traded Portfolios
BatsALPSCleanEnergy ACES .5 98.32 +6.64 .0806ALPSDisrupTech DTEC .3 48.62 +1.78 .169ARKAutoTech ARKQ .0 90.57 +4.86 .6561ARKGenomicRev ARKG .0 110.54 +2.58 .4256ARK Israel Innov IZRL ... 33.02 +0.62 ...AVDRUSLCESG AVDG ... 25.82 +0.43 ...AVDRUSLCLdg AVDR ... 26.17 +0.32 ...AffinityWorldLdr WLDR 1.7 23.88 –0.21 .1736AgilityDynTacti THY 3.3 25.42 +0.05 .4954AgilityMgdRisk MRSK 3.2 28.21 +0.26 1.1989AlphaIntQuMom IMOM .6 36.64 +1.64 .084AlphaIntQuVal IVAL 1.4 28.25 +0.06 .1699AlphaUSQuMom QMOM .1 59.78 +2.86 .0444AlphaUSQuVal QVAL 1.7 30.24 +0.58 .2705AlphaArchValMom VMOT ... 28.04 +0.80 ...AlphaCloneAltAlpha ALFA .4 82.98 +2.08 .3668AmCentFocDyn FDG .0 76.71 +2.01 .0078AmCentFocLCV FLV 1.1 55.02 –0.11 .1911AmCustSatisfCore ACSI .8 44.66 +1.04 .3524AnfieldCapDiv DALT 2.5 10.10 +0.25 .0475AnfieldDynFix ADFI 1.5 9.88 –0.01 .0305AnfieldUSEquity AESR .7 12.16 +0.25 .0548AnfieldUnivFx AFIF 1.2 9.74 –0.02 .0051AptusColIncmOpp ACIO 1.0 27.91 +0.23 .0678AptusDefRisk DRSK 1.2 29.49 +0.22 .1136AptusDrawMgd ADME .4 36.53 +0.82 .0184ArrowResCapMgmt ARCM .8 100.21 +0.12 .0111BarclaysETN+Select ATMP 7.1 12.68 –0.74 .2257BarcRetDisability RODI ... 99.80 +0.31 ...BarclaysWILETN WIL ... 82.31 +0.60 ...CBOES&P500DivAr KNG 3.4 48.09 –0.13 .1062CabotGrowth CBTG ... 28.04 +1.01 ...CambriaEmSharehldr EYLD 2.9 36.03 +0.29 .1842CambriaFgnShare FYLD 3.7 25.43 –0.13 .2731CambriaGlbAssetAll GAA 2.6 30.24 +0.17 .1828CambriaGlbMomentum GMOM 1.2 27.11 +0.38 .1925CambriaGlbRlEst BLDG 2.3 29.57 +0.24 .1709CambriaGlbValue GVAL 1.9 21.66 –0.29 .0918CambriaMarijuana TOKE 3.5 18.30 –0.18 .088CambriaShareholder SYLD 1.8 50.47 +1.84 .3176CambriaSovHiYdBd SOVB 2.4 25.83 –0.15 .0672CambriaTailRiskETF TAIL .4 20.22 –0.07 .0043CambriaTrinity TRTY 1.9 25.38 +0.10 .1735CambriaValue VAMO .9 21.16 +0.09 .0663ClearFocVal CFCV 1.6 30.77 +0.11 .2869CornerCapFundLC FUNL .4 29.45 +0.04 .1274Emles@Home LIV ... 27.25 +1.06 ...EmlesFedContr FEDX 1.1 27.86 +0.16 .0751EmlesLuxuryGds LUXE .0 27.50 +0.65 .001EmlesMadeinAmer AMER 1.4 27.50 +0.40 .094EmlesProAlloc DEFN .4 24.85 +0.09 .0249EmlesRealEstCrd REC 2.3 25.34 +0.01 .0608EsotericaNextG WUGI ... 56.12 +3.72 ...EuclidCapGrwth EUCG ... 26.23 +0.49 ...FTCboeVestBf BUFR ... 21.66 +0.15 ...FTCboeVestFdDpBf BUFD ... 20.04 ... ...FTCboeVestGold BGLD ... 19.94 ... ...FTCboeVestGr100Dec QDEC ... 20.39 +0.37 ...FTCboeVestIntlDec YDEC ... 20.51 +0.09 ...FTCboeUSBuffJul FJUL ... 33.23 +0.20 ...FTCboeUSBuffAug FAUG ... 35.05 +0.30 ...FTCboeUSBuffDec FDEC ... 30.99 +0.31 ...FTCboeUSBuffFeb FFEB ... 33.44 +0.26 ...FTCboeUSBuffJan FJAN ... 30.50 ... ...FTCboeUSBuffJun FJUN ... 34.21 +0.19 ...FTCboeUSBuffMay FMAY ... 34.69 +0.17 ...FTCboeUSBuffNov FNOV ... 35.59 +0.42 ...FTCboeUSBuffOct FOCT ... 31.93 +0.40 ...FTCboeUSBuffSep FSEP ... 32.49 +0.28 ...FTCboeUSDeepAug DAUG ... 33.25 +0.15 ...FTCboeUSDeepDec DDEC ... 30.71 +0.23 ...FTCboeUSDeepFeb DFEB ... 32.56 +0.20 ...FTCboeUSDeepJan DJAN ... 30.33 ... ...FTCboeUSDeepJul DJUL ... 31.84 +0.13 ...FTCboeUSDeepJun DJUN ... 32.53 +0.11 ...FTCboeUSDeepMay DMAY ... 32.86 +0.09 ...FTCboeUSDeepNov DNOV ... 33.49 +0.11 ...FTCboeUSDeepOct DOCT ... 31.10 +0.19 ...FTCboeUSDeepSep DSEP ... 31.25 +0.15 ...FidelityBlueChipGr FBCG .0 30.27 +1.23 .002FidelityBlueChipV FBCV .6 24.94 –0.10 .043FidelityLowDurBd FLDR 1.2 50.98 ... .029FidelityNewMill FMIL .9 25.25 –0.05 .007FidelityStkInfl FCPI 5.4 26.93 +0.46 .543FidelityTargEM FDEM 2.1 28.41 +0.39 .102FidelityTargIntl FDEV 2.0 27.94 +0.17 .044FTLuntUSFactor FCTR .4 30.89 +0.04 .0017FlexShCredScUSLg LKOR 2.9 61.22 –0.12 .5493FlexMrnUSMktFtrTlt TILT 1.4 151.36 +2.56 .6828FlexSTOXXGlbESGImp ESGG 1.3 128.35 +2.40 .4499FlexSTOXXUSESGImp ESG 1.3 94.31 +1.97 .3534FlexShUSQualLC QLC 1.4 42.38 +0.89 .146FormulaHdgGrwth FFHG .4 31.65 +0.34 .0734FormulaFolIncm FFTI 2.1 24.24 +0.02 .0209FormulaFolSmartGrw FFSG 1.5 32.63 +0.64 .2996FormulaFolTactGrw FFTG 1.0 29.12 +0.51 .2199FrankDisrComm BUYZ ... 56.52 +2.03 ...FrankExpData XDAT ... 25.69 +0.93 ...FrankGenAdv HELX .0 51.24 +1.20 .0518FrankIntMach IQM .0 47.76 +1.55 .0043FrankHYCorp FLHY 5.5 26.56 –0.03 .0517FrankIntlAggBd FLIA .6 25.46 +0.02 .0214FrankSrLoan FLBL 3.2 25.06 –0.04 .0005FranklinLibUS FLQL 2.0 38.42 +0.29 .2354FranklinLibUSMC FLQM 1.1 39.07 +0.26 .1633FranklinLibUSSC FLQS 1.1 34.39 +0.74 .1348Freedom100EM FRDM 1.0 33.85 +0.02 .1316GlbXFdrRunCos BOSS 1.1 31.87 +0.71 .3365GlbXRuss2000Cvr RYLD 10.7 23.08 +0.02 .2272GlbXTarget5 TFIV 5.1 23.82 +0.04 .0925GlbXTargetPlus2 TFLT 3.2 24.27 ... .0636GlbXUSInfrDevt PAVE .4 22.45 –0.04 .0009GSAccInflUSDBd GTIP 1.0 57.50 +0.27 .0423GSAccUltShBd GSST 1.1 50.81 +0.03 .0484GSEWUSLCEquity GSEW 1.5 59.39 +0.42 .2048GSMarketBetaEM GSEE 4.4 59.43 +1.71 .2646GSMarketBetaInt GSID 2.0 53.95 +0.60 .3178GSMarketBetaUS GSUS 1.5 53.69 +1.13 .2058HartfordCoreBd HCRB 1.1 41.71 –0.02 .017HartfordLowVolIntl RODE 3.0 27.67 –0.22 .44HartfordShrtDur HSRT 2.9 41.36 +0.05 .12InnovDoubStkJan DSJA ... 25.99 +0.50 ...InnovDoubStkOct DSOC ... 28.52 +0.40 ...InnovDbStk9Jan DBJA ... 25.80 +0.27 ...InnovDbStk9Oct DBOC ... 27.41 +0.25 ...InnovNasd100Oct NOCT ... 36.45 +0.21 ...InnovNasd100Apr NAPR ... 35.60 –0.01 ...InnovNasd100Jan NJAN ... 38.51 +0.61 ...InnovNasd100Jul NJUL ... 44.89 +0.36 ...InnovRuss2000Jul KJUL ... 26.19 +0.07 ...
InnovRuss2000Oct KOCT ... 26.20 +0.07 ...InnovRuss2000Apr KAPR ... 26.94 +0.02 ...InnovRuss2000Jan KJAN ... 29.85 +0.25 ...InnovS&P500Buff BJUL ... 30.30 +0.12 ...InnovS&P500BuffO BOCT ... 30.33 +0.25 ...InnovS&P500BuffA BAPR ... 29.85 +0.10 ...InnovS&P500Aug BAUG ... 30.09 +0.26 ...InnovS&P500Dec BDEC ... 30.91 +0.39 ...InnovS&P500Feb BFEB ... 27.45 +0.15 ...InnovS&P500Jan BJAN ... 33.20 +0.49 ...InnovS&P500BuffJun BJUN ... 31.37 +0.20 ...InnovS&P500BuffMar BMAR ... 29.85 +0.11 ...InnovS&P500BffMay BMAY ... 29.81 +0.14 ...InnovS&P500BuffN BNOV ... 30.09 +0.25 ...InnovS&P500JSep BSEP ... 29.52 +0.31 ...InnovS&P500Divrs BUFF 1.6 33.44 +0.20 .0666InnovS&P500Pwr PJUL ... 28.92 +0.12 ...InnovS&P500PwrF PFEB ... 26.44 +0.12 ...InnovS&P500PwrN PNOV ... 29.19 +0.14 ...InnovS&P500PwrA PAPR ... 27.38 +0.03 ...InnovS&P500Aug PAUG ... 28.46 +0.18 ...InnovS&P500PwrD PDEC ... 29.19 +0.23 ...InnovS&P500Jan PJAN ... 30.84 +0.22 ...InnovS&P500PwrJun PJUN ... 30.24 +0.09 ...InnovS&P500PwrBuff PMAR ... 28.56 +0.08 ...InnovS&P500PwrMay PMAY ... 28.58 +0.10 ...InnovS&P500PwrO POCT ... 27.96 +0.18 ...InnovS&P500Sep PSEP ... 28.14 +0.24 ...InnovS&P500UltA UAPR ... 25.00 +0.04 ...InnovS&P500UltAug UAUG ... 27.97 +0.07 ...InnovS&P500UltDec UDEC ... 28.59 +0.14 ...InnovS&P500UltFeb UFEB ... 26.17 +0.08 ...InnovS&P500UltJan UJAN ... 29.99 +0.20 ...InnovS&P500UltrJul UJUL ... 26.48 +0.04 ...InnovS&P500UltJun UJUN ... 28.08 +0.11 ...InnovS&P500Ultra UMAR ... 27.77 –0.02 ...InnovS&P500UltMay UMAY ... 27.48 +0.08 ...InnovS&P500UltN UNOV ... 28.45 +0.09 ...InnovS&P500UltO UOCT ... 26.92 +0.09 ...InnovS&P500UltSep USEP ... 27.20 +0.12 ...InnovS&PHiQualPfd EPRF 5.0 24.37 +0.07 .1316InnovTripleStkJan TSJA ... 26.07 +0.46 ...InnovTripleStkOct TSOC ... 28.56 +0.28 ...Innov20+YTrBd5Jl TFJL ... 24.18 –0.11 ...Innov20+YTrB9BfJul TBJL ... 24.15 +0.01 ...InvscBalMulti PSMB 2.2 15.57 +0.12 .1334InvscConsrvMulti PSMC 2.6 13.55 +0.06 .1377InvscFocDiscGrw IVDG ... 12.53 +0.22 ...InvscGrwMultAll PSMG 2.0 16.81 +0.18 .1201InvscModConserv PSMM 2.9 14.78 +0.09 .1466InvscPureDevxNA PBDM 1.7 28.25 +0.38 .0531InvscPureFTSEEM PBEE 1.7 30.79 +1.01 .0377InvscPureMSCIUSA PBUS 1.3 39.42 +0.92 .1278InvscPrMSCIUSASC PBSM 1.0 36.45 +0.61 .1988InvscPureUSAggBd PBND 2.5 26.43 –0.04 .0492InvscPure0-5YTIPS PBTP 1.2 26.05 +0.06 .2316InvscRealAssets IVRA 15.6 12.06 –0.14 .1569InvscRuss1000Dyn OMFL 1.4 42.41 +0.56 .1903InvscRs1000EnhEW USEQ 2.7 32.04 +0.16 .2595InvscRuss2000Dyn OMFS 1.0 37.01 +1.02 .1014InvscS&P500MinVar SPMV 1.7 34.05 +0.23 .1433InvscS&PIntlDev IDHD 3.7 26.59 +0.04 .1873InvscS&PSCHiDiv XSHD 5.0 21.25 +0.04 .0644InvscS&PSCQuality XSHQ 1.1 35.24 +0.51 .0909InvscSelectGrw IVSG ... 12.62 +0.51 ...InvscUSLCCoreESG IVLC ... 12.33 +0.23 ...iPathS&P500DynVIX XVZ ... 38.79 +0.94 ...iPathS&PMLPETN IMLP 9.7 10.40 –0.59 .2207iPathBS&P500VIXMid VXZ ... 32.07 +0.08 ...iPathS&P500VIX VXX ... 16.40 –0.71 ...iPath5-YearBear DFVS ... 13.83 –0.22 ...iPathUSTrea5YrBull DFVL ... 84.27 +0.25 ...iShAdCurrHdgMSCI DEFA 2.1 31.04 +0.29 .3567iShIntmGovt/CredBd GVI 1.9 117.21 +0.11 .1609iShBrdUSDHYCpBd USHY 5.3 41.30 +0.11 .1716iShConvBond ICVT 1.1 103.57 +2.08 .2957iShCoreMSCIEAFE IEFA 1.8 71.19 +0.81 .6123iShCurrHdgMSCIEAFE HEFA 2.0 31.47 +0.18 .2631iShCurrHdgMSCIEM HEEM 1.4 33.44 +0.92 .313iShIntlSelDividend IDV 5.3 30.59 –0.13 .2138iShTransportAvg IYT .9 226.93 –1.55 .384iShU.S.Industrials IYJ 1.7 97.89 +0.34 .2745iShUSAerospace&Def ITA 1.9 93.95 –0.35 .2031iShUSHomeConstrn ITB .4 62.00 +5.05 .0775iShUSOil&GasExpln IEO 2.8 40.04 –0.98 .2213iShUSTelecomm IYZ 2.5 31.58 +0.14 .1901iShESGAwareAgg EAOA 1.5 31.41 +0.49 .1543iShESGAwareCon EAOK 1.7 27.29 +0.17 .0881iShESGAwareGrw EAOR 1.4 29.73 +0.36 .1405iShESGAwareMod EAOM 1.3 28.09 +0.23 .1286iShESGMSCIUSASC ESML .9 37.05 +0.61 .1311iShESGScrS&P500 XVV 1.2 29.32 +0.67 .0897iShESGScrS&PMC XJH 1.3 33.95 +0.60 .114iShESGScrS&PSC XJR 2.1 36.42 +0.67 .1933iShEdgeHYDefBd HYDB 5.8 51.47 +0.16 .2852iShEdgeInvGrEnhBd IGEB 2.9 54.63 –0.10 .1221iShEdgeMSCIMinEAFE EFAV 1.3 74.17 +0.43 .9773iShEdgeMSCIMinVlEM EEMV 2.4 63.41 +0.67 .9422iShEdgeMSCIMinVol ACWV 1.8 97.45 +0.26 .791iShEdgeMSCIMinUSA USMV 1.8 67.74 +0.45 .3023iShMSCIMinVolUSASC SMMV 1.3 35.57 +0.40 .1678iShEdgeMSCIUSAMom MTUM .8 170.63 +5.98 .3098iShEdgeMSCIUSAQual QUAL 1.4 116.70 +1.48 .4078iShEdgeMSCIUSAVal VLUE 2.3 93.01 +0.26 .5351iShUSFixedIncmBal FIBR 2.6 102.08 +0.02 .0468iShEmMkCorpBdFd CEMB 3.9 52.86 +0.06 .1503iShEMHYBd EMHY 5.5 45.77 +0.21 .2833iShEvolCnStpls IECS 2.2 29.98 –0.05 .1836iShEvolUSDisc IEDI .8 41.13 +0.77 .108iShEvolUSFin IEFN 2.1 26.31 –0.35 .1361iShEvolUSHlthcr IEHS .8 38.67 +0.21 .0996iShEvolUSInnHlthcr IEIH 1.1 34.41 +0.44 .6574iShEvoUSMedia IEME .7 35.15 +0.81 .0681iShEvolUSTech IETC .5 48.77 +2.28 .0555iShExpTechSftwr IGV .3 358.83 +10.94 .0695iShMtgRealEstCap REM 7.6 32.48 +0.93 .5339iShUSBlendStyle STLC 1.4 36.94 +0.66 .1662iShFctUSGrwStyle STLG .7 33.01 +1.16 .052iShUSMidBlendStyle STMB 1.5 38.78 +0.26 .2401iShUSSmBlendStyle STSB 1.3 44.33 +0.32 .2737iShFctUSValStyle STLV 2.3 25.50 –0.06 .1739iShFloatingRateBd FLOT 1.2 50.80 ... .0247iShGlbxUSDHiYdCpBd HYXU 1.4 56.56 +0.57 .8181iShGlbHiCorpBdFd GHYG 4.4 50.73 +0.17 .2245iShGoldStrategy IAUF 7.8 57.26 +0.91 4.4706iShiBdsDec2028Muni IBMQ 1.2 27.59 +0.04 .0247iShiBdsDec25Muni IBMN 1.1 28.18 +0.03 .0164iShiBdsDec24Muni IBMM 1.2 27.11 +0.03 .0208iShiBdsDec27Mun IBMP 1.2 27.30 +0.04 .0212iShiBdsDec26Muni IBMO 1.0 27.09 +0.02 .0145iShiBdsDec23Muni IBML 1.4 26.22 +0.04 .0254iShBds2025TermHY IBHE 5.7 24.94 +0.01 .1203iShiBds2024TermHY IBHD 5.5 24.44 +0.08 .0981
iShBds2021TermHY IBHA 3.5 24.30 –0.02 .0588iShBds2026TermHY IBHF 7.4 25.45 +0.06 .1563iShBds2023TermHY IBHC 5.5 24.48 –0.15 .1222iShBds2022TermHY IBHB 5.4 24.29 –0.02 .1097iShInflHdgCpBd LQDI 2.3 29.12 +0.04 .0531iShIntlAggregateBd IAGG 2.0 55.92 –0.11 .0476iShIntlDivGrowth IGRO 2.4 64.51 +0.51 .3253iShLiquidityIncm ICSH 1.2 50.55 +0.03 .0246iShMSCIArgentina AGT .9 26.17 +0.10 .1711iShMSCIChileCapped ECH 2.1 31.61 –0.17 .1472iShMSCIChinaAETF CNYA 1.0 45.54 +0.98 .3541iShMSCIDenmarkCap EDEN .4 98.93 +1.94 .0472iShMSCIEmgMulti EMGF 1.8 52.82 +2.01 .5472iShMSCIEurozone EZU 2.1 44.87 +0.47 .623iShMSCIFinlandCap EFNL 2.8 46.33 +1.14 .5702iShMSCIGermanySC EWGS 1.1 79.52 +2.65 .3159iShMSCIGlbMet&MnPr PICK 2.1 39.24 –0.20 .4633iShMSCIGlSilverMin SLVP 2.6 15.78 +0.31 .3873iShMSCIEAFEGrowth EFG .8 103.29 +1.98 .3525iShMSCIIndiaETF INDA .3 41.35 +0.36 .0316iShMSCIIndiaSC SMIN 1.0 44.14 +0.25 .0495iShMSCIKuwait KWT .5 28.07 +0.37 .0742iShMSCINorwayCap ENOR 2.3 26.18 +0.34 .3083iShMSCIUKSC EWUS 1.9 42.86 +0.24 .4099iShMSCIEAFEValue EFV 2.3 48.85 +0.11 .6378iShMornMultiAsst IYLD 4.4 23.96 +0.09 .1328iShNorthAmNatRscs IGE 3.1 24.96 –0.27 .2041iShRussell2500 SMMD 1.2 60.98 +1.04 .25iShIntlPfdStock IPFF 4.0 15.82 +0.12 .0478iShShortMaturityBd NEAR 1.5 50.24 +0.03 .0425iShShrtMatMuniBd MEAR .9 50.21 +0.01 .0146iShCohen&StrsREIT ICF 4.1 54.00 +0.61 .3645iSh25+YTrStrip GOVZ 1.6 22.38 ... .0296iShUSDiv&Buyback DIVB 2.0 34.12 +0.11 .1846iShUSInfr IFRA 2.0 31.17 –0.19 .0644iShUSSCValue SVAL 1.0 26.89 +0.16 .0688iShUSTreasuryBdETF GOVT 1.3 27.10 +0.01 .0215JPMBetaCanada BBCA 2.3 27.52 –0.17 .2213JPMBetaDevAsia BBAX 2.4 28.40 +0.44 .0999JPMBetaEurope BBEU 2.2 26.92 +0.33 .1851JPMBetaIntl BBIN 1.0 56.93 +0.61 .2488JPMBetaJapan BBJP 1.1 28.65 +0.21 .3145JPMBetaUSREIT BBRE 3.1 80.00 +1.02 .9715JPMBeta1-5Y BBSA 1.7 26.10 +0.02 .03JPMBetaUSEquity BBUS 1.4 70.61 +1.39 .2884JPMCorePlusBd JCPB 1.8 55.43 +0.01 .1001JPMorganDisciplHY JPHY 4.7 51.86 +0.10 .1841JPM IntlBdOpps JPIB 3.2 51.69 +0.08 .2876JPMMunicipal JMUB 1.9 55.12 +0.11 .0704JPMUltShtIncm JPST 1.4 50.81 ... .039JPMUltShMuni JMST .9 51.06 +0.02 .0179LHAMktStAlpha MSVX 1.9 23.74 +0.05 .4594LHAMktStTact MSTB 1.7 27.69 +0.52 .4802LeggMasonIntLowVol LVHI 3.9 23.82 –0.14 .0635MainSectorRot SECT 1.4 36.96 +0.69 .0359Merlyn.AIBest BOB ... 25.10 +0.42 ...MerlynAISectSurf DUDE ... 28.65 +1.37 ...MotleyFool100 TMFC ... 36.26 +1.57 ...MotleyFoolSCGrw MFMS ... 41.76 +1.69 ...NuvESGEMEquity NUEM ... 37.01 +1.32 ...NuvESGIntlDev NUDM ... 30.21 +0.42 ...NuvESGLC NULC 1.3 36.02 +0.52 1.42NuvESGLCGrowth NULG .2 58.42 +1.81 1.5115NuvESGLCValue NULV 1.4 33.49 –0.26 .468NuvESGMCGrowth NUMG .0 50.72 +0.79 .3748NuvESGMCValue NUMV 1.3 31.55 +0.09 .4164NuvESGSC NUSC .5 41.57 +0.79 .1991NuvShTermREIT NURE 3.4 27.39 +0.30 .3946OShEurQualDiv OEUR 3.6 25.29 +0.36 .3945OShGlbInternet OGIG ... 59.03 +3.66 ...OShUSQualDiv OUSA 2.0 38.33 +0.24 .0884OShUSSCQualDiv OUSM 1.9 32.29 +0.30 .1433OpusSCValue OSCV 1.0 29.93 +0.60 .0958PacerBioThreat VIRS .6 29.56 +0.67 .0394PacerIntCashCow100 ICOW 2.3 30.06 +0.15 .2428PacerGlCashCows GCOW 4.0 29.75 +0.05 .2921PacerSaltHitruUS SLT 1.6 38.32 +0.52 .6286PacerSaltLowUS LSLT 2.2 28.58 –0.05 .1233PacerSwanSOSCon PSCX ... 20.94 +0.17 ...PacerSwanSOSFlex PSFD ... 21.18 +0.29 ...PacerSwanSOSFd PSFF ... 20.65 +0.24 ...PacerSwanSOSMod PSMD ... 21.01 +0.20 ...PacerTrendEurIndex PTEU ... 22.47 +0.26 ...PacerTrendpilot450 PTMC .5 33.75 +0.30 .1712PacerTrendpilot100 PTNQ .2 53.02 +1.28 .0831PacerTrendpilot750 PTLC 1.1 33.50 +0.63 .3523PacerUSCashCows100 COWZ 2.4 35.85 +0.29 .2469PacerUSSCCash100 CALF .7 35.35 +0.67 .121PacerWealthShield PWS .5 30.05 +0.04 .0238PointBridgeGOP MAGA 2.5 30.99 –0.09 .7667PremiseCapDivTact TCTL 1.0 30.68 +0.35 .3151ProShGlbListedPrv PEX 5.4 32.80 +0.29 .4724ProShHY IntRt HYHG 5.2 62.60 +0.44 .2718ProShInvGrdIntRt IGHG 2.8 75.54 –0.12 .1658ProShK1FreeCrude OILK 1.9 46.14 –0.14 .0556ProShLCCorePlus CSM 1.2 88.02 +2.26 .2826ProShDivGrowers EFAD 1.5 43.88 +0.50 .156ProShMSCIEMDiv EMDV 3.0 59.93 +0.30 .3191ProShMSCIEurDiv EUDV 1.3 47.27 +0.60 .06ProShMergerETF MRGR ... 39.69 +0.29 ...ProShMornAltSoln ALTS .9 37.52 +0.17 .1085ProShPetCare PAWZ .1 74.67 +1.00 .039ProShRuss2000Div SMDV 2.0 59.84 –0.41 .4239ProShRussUSDivGrw TMDV 2.3 42.35 –0.16 .3383ProShS&P500Arist NOBL 2.1 80.61 –0.32 .5348ProShS&PMC400 REGL 2.3 64.82 +0.17 .5134ProShS&PTechDiv TDV 1.1 54.76 +0.47 .1664ProShShortUSDEmgBd EMSH 2.9 73.43 +0.12 .1855ProShShtVIXST SVXY ... 41.59 +0.86 ...ProShTrMgdFut FUT 1.1 40.52 –0.10 .0564ProShUltVIXST UVXY ... 10.19 –0.71 ...ProShsVIXMTFut VIXM ... 38.48 +0.30 ...ProShsVIXSTFut VIXY ... 13.42 –0.59 ...RareviewDynFx RDFI 1.0 27.20 +0.17 .1788RareviewTaxAdv RTAI .5 26.24 +0.07 .0694RevWeightUSLC RVRS 1.8 19.57 +0.01 .3525SPDRDoubleEMFixed EMTL 3.3 50.92 –0.14 .1155SPDRDoubleShDurTR STOT 1.7 49.97 +0.01 .0501SabaClosedEndFds CEFS 8.3 20.36 +0.21 .142ndVoteLifeNeutral LYFE .1 27.19 +0.24 .02642ndVoteSocDef EGIS .1 27.99 +0.25 .026SirenDivDefender DFND ... 36.89 +0.55 ...SirenDivLdrsDiv LEAD .8 48.44 +0.48 .156SmartSustEnerII SULR ... 34.15 +2.16 ...StrategyResRobust ROMO .9 26.01 +0.48 .2422SwanHdgEqUSLC HEGD ... 17.03 +0.25 ...3DPrintingETF PRNT ... 40.10 +2.53 ...TrendAggSG TEGS .0 27.05 +0.18 3.0537TrendAggUS TAEQ .0 26.57 +0.28 2.1143TrimDonForRisk DFNV .0 27.19 +0.61 .0053TrimDonForTact DFHY .4 25.19 +0.07 .0925TrimTabsIntlFrCsh TTAI .6 32.92 +0.43 .2029TrimTabsUSFrCsh TTAC .4 47.45 +0.66 .1894
TrueStructOutAug AUGZ ... 28.34 +0.30 ...TrueStructOutDec DECZ ... 25.89 +0.26 ...TrueStructOutJan JANZ ... 25.71 +0.43 ...TrueStructOutJul JULZ ... 29.72 +0.51 ...TrueStructOutNov NVMZ ... 28.15 +0.49 ...TrueStructOutOct OCTZ ... 27.66 +0.45 ...TrueStructOutSep SEPZ ... 27.05 +0.20 ...UphldgsCompKings KNGS ... 27.36 +1.05 ...VanEckAMTFrIntMuni ITM 2.0 51.98 +0.09 .0714VanEckAMTFrLgMun MLN 2.5 21.83 +0.06 .411VanEckAMTFrShMuni SMB 1.5 18.14 +0.03 .0222VanEckCEFMuni XMPT 3.8 28.46 +0.03 .1083VanEckHYMuni HYD 4.0 62.46 +0.29 .2073VanEckMdyBBBCpBd MBBB 2.2 25.17 –0.03 .047VanEckMdyIGCpBd MIG 2.1 25.07 –0.03 .0445VanEckMornDur DURA 3.5 28.59 –0.02 .2522VanEckMornGlb GOAT 1.2 36.16 +0.64 1.0288VanEckMornIntlMoat MOTI 2.1 34.54 +0.39 .72VanEckMornWideMoat MOAT 1.4 64.22 +0.18 .9021VanEckMuni MAAX 2.7 25.12 +0.10 .052VanEckRussia RSX 3.2 24.67 –1.03 .7988VanEckRussiaSC RSXJ 4.3 36.79 –0.13 1.5849VanEckShHYMuni SHYD 3.0 25.22 +0.19 .0648VanEckVietnam VNM .4 18.35 –0.09 .07VangdESGIntlStk VSGX 1.6 61.81 +1.03 .3361VangdESGUSCpBd VCEB 1.3 75.02 –0.19 .1019VangdESGUSStk ESGV 1.1 72.30 +1.55 .2387VangdUSLiquid VFLQ 1.5 99.05 +0.77 .5265VangdUSMinVol VFMV 2.1 92.48 +1.42 .7287VangdUSMom VFMO .4 123.47 +3.86 .1891VangdUSMultifact VFMF 1.5 89.89 +1.63 .4525VangdUSQual VFQY 1.2 105.49 +1.16 .4437VangdUSValue VFVA 1.9 83.72 +0.14 .4828VirtusWMCIntlDiv VWID 4.3 27.95 –0.01 .9254WisdTrYdEnhUSST SHAG 1.9 51.40 +0.05 .055WisdomDynCurrIntl DDWM 3.4 28.76 +0.16 .3133WisdomDynCurrIntSC DDLS 3.1 31.62 +0.21 .3434WTEMESGFd RESE 1.7 38.57 +1.03 .1575WisdomTreeCpBdFd WFIG 2.3 54.91 –0.16 .1025WisdomTreeUSHYCpBd WFHY 4.8 52.46 +0.15 .1975WisdTrUSSTCpBd SFIG 2.0 51.74 ... .0625WisdTrUSSTHY SFHY 4.6 49.38 +0.10 .245WisdTrIntlESGFd RESD 1.8 29.30 +0.38 .1528WisdTrIntlQualDiv IQDG 1.6 37.99 +0.75 .1901WisdTrUSMulti USMF 1.3 36.78 +0.51 .0965XtrkBBUSIGCpESG ESCR 2.6 22.56 +0.01 .0458XtrkrsEurozone EURZ 2.8 24.78 +0.26 .2604XtrkJPMEMSvn ESEB 3.6 22.17 +0.10 .1059XtrkJPMESGUSDHY ESHY 5.9 21.22 +0.05 .1125
NASDAQAdvShDWAlphaEW DWEQ .0 29.00 +0.95 .0053AdvShDWFSMAC DWAW .0 39.89 +1.06 .0602AdvShDWFSMUS DWUS .1 35.90 +1.42 .0679AdvShDorseyMc DWMC ... 33.94 +1.89 ...AdvShDorseyShrt DWSH ... 10.54 +0.04 ...AlphaMarkActiveMgd SMCP .5 27.70 ... .1452ArrowInvDWATact DWAT ... 12.79 +0.16 ...ClearBrACGrw CACG .5 44.70 +0.92 .2087ClearBrDivStrat YLDE 1.5 35.85 +0.12 .14ClearBrLCGrw LRGE .4 50.65 +1.50 .1849CSX-LinksCrudeOil USOI 65.2 4.82 –0.04 .0644CSXLGoldCvETN GLDI 14.7 9.46 +0.07 .0714CSXSilverETN SLVO 27.1 6.40 +0.06 .1159DemzPolitical DEMZ .3 23.27 +0.30 .0616DavisFinl DFNL 1.4 24.63 –0.48 .347DavisSelectIntlETF DINT .3 24.75 +0.57 .064DavisUSEquity DUSA .5 30.53 +0.14 .149DavisWorldwide DWLD .2 32.77 +0.77 .075DefNasdJrBio IBBJ .0 37.15 –0.15 .2998DorseyWrightETN36 BMLP 8.6 37.70 –2.05 .8095FidelityNasdComp ONEQ .7 526.50 +21.70 1.041FTAltAbsRet FAAR 3.0 27.37 –0.09 .8214FTAPxJapan FPA 1.5 34.46 +0.39 .2877FTBICK BICK .4 40.26 +0.67 .1165FTBrazilAlpha FBZ 2.8 12.42 –0.77 .055FTBuyWrite FTHI 4.7 20.54 +0.07 .08FTCEFIncmOpp FCEF 4.9 22.93 +0.21 .09FTCAMuniHi FCAL 2.1 54.27 –0.01 .095FTCapStrength FTCS .9 67.44 +0.12 .2077FTChinaAlphaDEX FCA 4.0 29.98 +1.33 .2061FTCloudComp SKYY .2 100.15 +3.57 .0443FTDevIntlEquity RNDM 1.1 53.51 +0.58 .3079FTDevMkts FDT 2.3 59.25 +1.13 .8998FTDevMktsXUS FDTS 2.0 44.10 +0.44 .4026FTDorseyDyn5 FVC .2 33.03 +0.97 .0607FTDorseyFoc5 FV .1 43.01 +1.28 .025FTDorseyIntl5 IFV 1.4 23.48 +0.71 .1087FTDWMomentum DDIV 2.6 25.63 –0.02 .2207FTDWMom&Low DVOL .6 24.85 +0.32 .0094FTDWMom DVLU 1.2 19.38 +0.06 .0729FTDorseyWright DWPP .5 29.18 +0.65 .0093FTDorseyDALI1 DALI 1.2 23.35 +0.66 .0056FTDJ IntlInt FDNI .1 50.86 +3.83 .0744FTMultAsstDiv MDIV 5.9 15.27 –0.24 .084FTNasdTechDiv TDIV 2.0 51.27 +0.46 .4005FTEMAlphadex FEM 2.5 27.01 +0.74 .4512FTEMEquitySel RNEM 2.9 47.94 –0.97 .3285FTEMLocalCurr FEMB 5.3 37.17 –0.49 .16FTEMSCAlpha FEMS 2.8 42.58 +0.43 .2508FTEnhShtMat FTSM 1.2 60.04 ... .035FTEuropeAlpha FEP 2.2 39.40 +0.50 .4782FTEurozoneAlpha FEUZ 1.4 43.07 +0.35 .2173FTGerAlpha FGM 1.3 52.91 +1.10 .2873FTGlTactCommod FTGC ... 19.66 –0.22 ...FTHdgBuyWriteIncm FTLB 3.2 20.47 –0.05 .055FT IPOXEurEq FPXE 1.3 30.01 +1.20 .2332FTGlblAgri FTAG 1.6 28.31 +0.15 .1098FTGlbNatRscs FTRI 3.4 12.52 –0.07 .0733FTIndiaNifty50EW NFTY .6 40.90 +0.59 .0132FTIndxxInnTran LEGR .9 39.18 +0.27 .0955FTIndxxNextG NXTG 1.0 73.58 +1.55 .2695FTIntlDevCapStr FICS ... 31.67 +0.39 ...FTIntlEquOpps FPXI .2 73.99 +4.35 .0126FTJapanAlpha FJP 1.0 53.05 +0.82 .1709FTLCCoreAlpha FEX 1.2 76.76 +0.61 .2494FTLCGrwthAlpha FTC .4 100.75 +1.71 .037FTLCUSEquity RNLC 1.6 28.40 +0.18 .1152FTLCValue FTA 1.9 57.50 –0.07 .3597FTLatAmAlpha FLN 1.7 18.47 –1.00 .0693FTLowDurOpp LMBS 2.3 51.49 –0.06 .09FTLowDurStrat LDSF 2.6 20.46 –0.07 .03FTMgdMuni FMB 2.2 56.79 +0.01 .0975FTMCCoreAlpha FNX 1.0 89.01 +1.09 .3367FTMCGrwthAlpha FNY .2 70.90 +1.64 .0697FTMCUSEquity RNMC 1.3 25.63 +0.17 .1355FTMCValAlpha FNK 1.5 37.94 +0.17 .2242FTMCGrAlpDX FAD .3 111.64 +2.51 .0528FTMuCValAlpha FAB 1.5 61.71 +0.05 .3094FTMuniCEFIncmOpp MCEF 3.3 20.29 +0.16 .0625FTMuniHiIncm FMHI 3.1 54.19 –0.02 .14
FTNasdComBk QABA 2.3 49.53 +0.25 .286FTNasdCleanEdge QCLN .2 86.71 +5.97 .0708FTNasdClEdSmGr GRID .6 86.29 +2.09 .1462FTNasdCybersec CIBR 1.1 45.71 +0.92 .027FTNasdGlblAuto CARZ .6 57.91 +3.37 .1777FTNasd100xTech QQXT .3 80.60 +0.92 .083FTNasd100Tech QTEC .4 145.52 +4.04 .1118FTNasdArtlIntel ROBT .2 55.61 +2.79 .0505FTNasdaqBk FTXO 2.5 26.50 –0.19 .1763FTNasdFood&Bev FTXG 1.3 23.99 +0.18 .0928FTNasdOil&Gas FTXN 1.6 13.21 –0.72 .0283FTNasdPharm FTXH .8 26.64 –0.07 .0644FTNasdRetail FTXD .8 30.35 –0.25 .0745FTNasdSemicon FTXL .4 66.68 +1.54 .0775FTNasdaqTrans FTXR .3 30.47 +0.75 .042FTNasd100EW QQEW .3 104.01 +2.03 .0929FTRBAAmerInd AIRR .1 37.49 +0.68 .0193FTRisingDivAch RDVY 1.5 41.00 +0.04 .2105FTRiverFrDynAP RFAP 1.6 58.89 –0.17 .3323FTRiverFrDynDev RFDI 1.3 66.17 +1.11 .1395FTRiverFrDynEM RFEM 1.1 74.96 +1.98 .0866FTRiverFrDynEur RFEU 2.2 67.14 +1.22 .6119FTS&PIntDivArist FID 3.8 16.77 –0.01 .2315FTSMIDCapRising SDVY 1.4 25.59 +0.39 .1312FTSSIStrat FCVT .9 52.61 +0.77 .04FTSrLoanFd FTSL 3.4 48.04 –0.15 .136FTSCCoreAlpha FYX .6 85.66 +1.83 .2174FTSCGrwthAlpha FYC .1 70.34 +2.21 .0606FTSCUSEquity RNSC 1.2 25.89 +0.23 .1536FTSCValue FYT .9 45.14 +0.48 .1476FTStratIncm FDIV 4.1 48.24 –0.36 .17FTSwitzAlpha FSZ 1.5 62.80 +0.77 .1533FTTCWOpp FIXD 2.0 54.37 –0.04 .095FTTacticalHY HYLS 5.1 48.86 –0.18 .23FTTotalUSMkt TUSA .9 43.47 +0.45 .1147FTUSEquityDiv RNDV 2.3 25.61 –0.09 .1733FTUKAlpha FKU 1.4 39.18 +0.27 .0709FlexShCredScoreUS SKOR 2.3 54.64 +0.07 .702FlexShRealAsset ASET 2.0 30.51 +0.17 .1718GlbXAI&Tech AIQ .5 28.67 +1.23 .0548GlbXAuto&Elc DRIV .3 27.76 +1.36 .0202GlbXCannabis POTX 3.7 14.80 –0.64 .1453GlbXCnBiotech CHB ... 18.47 +1.52 ...GlbXCleanTech CTEC .0 28.29 +3.02 .0038GlbXCloudComp CLOU ... 28.60 +1.07 ...GlbXConsciousCos KRMA .9 28.05 +0.32 .1602GlbXCybersec BUG .4 28.96 +0.71 .0004GlbXDAXGermany DAX 2.2 31.28 +0.54 .40GlbXDataCtr VPN .6 16.00 +0.39 .0462GlbXecomm EBIZ .4 34.72 +1.39 .1331GlbXEdu EDUT ... 19.06 +1.01 ...GlbXEMInternet EWEB ... 18.06 +1.45 ...GlbXFinTech FINX ... 47.36 +1.60 ...GlbXGen&Biotech GNOM .0 26.31 ... .0324GlbXHealth&Well BFIT .5 26.09 +0.35 .0979GlbXInternetThings SNSR .2 33.89 +0.74 .0642GlbXLongevityThem LNGR .3 29.32 +0.32 .055GlbXMSCISuperDiv EFAS 4.3 14.91 –0.19 .0525GlbXMillThematic MILN .2 38.88 +1.03 .0572GlbXNasd100Cv QYLD 11.1 23.14 +0.17 .2288GlXNasd100CCGrw QYLG 5.7 30.58 +0.78 .1495GlbXRobotics&AI BOTZ .2 35.42 +0.90 .0636GlbXS&PCathDvxUS CEFA 1.7 30.93 –0.17 .2562GlbXS&P500Catholic CATH 1.2 47.23 +0.99 .3287GlbXSocialMedia SOCL ... 67.67 +3.94 ...GlbXSuperDividAlt ALTY 9.0 12.01 –0.01 .0776GlbXSuperDivdREIT SRET 8.7 9.03 +0.08 .055GlbXTelemed EDOC .0 21.67 +1.15 .0064GlbXThemGrwth GXTG .4 50.98 +0.65 .1874GlbXVideoGames HERO .6 33.96 +1.42 .2069GlbXYieldCo&Renew YLCO 2.8 19.24 +0.44 .1031HighlandSrLoan SNLN 3.0 16.16 +0.01 .0338IQChaikinUSLC CLRG 1.5 29.96 +0.11 .1172IQChaikinUSSC CSML .9 31.83 +0.44 .1464InvscActMgdETC PDBC .0 15.69 –0.19 .0013InvscBldrSEM50ADR ADRE .9 61.78 +2.06 .2038InvscBS2030CorpBd BSCU 2.0 20.02 –0.08 .0304InvscBS2030MuniBd BSMU 1.6 25.62 +0.04 .0346InvscBull2028CpBd BSCS 2.5 23.36 –0.09 .0459InvscBull2025CpBd BSCP 2.4 22.48 –0.05 .0363InvsBull25HYCpBd BSJP 4.9 24.42 –0.08 .101InvscBull2024CpBd BSCO 2.4 22.33 –0.05 .0408InvsBull24HYCpBd BSJO 4.5 24.89 –0.03 .0949InvscBull2021CpBd BSCL 2.1 21.17 –0.03 .0301InvsBull21HYCpBd BSJL 3.9 23.08 –0.02 .0618InvscBull2027CpBd BSCR 2.4 22.30 –0.06 .0422InvscBull2026CpBd BSCQ 2.4 21.79 –0.05 .0398InvsBull26HYCpBd BSJQ 4.6 25.59 –0.04 .097InvscBull2023CpBd BSCN 2.3 21.85 –0.03 .0355InvsBull23HYCpBd BSJN 4.6 25.31 –0.04 .0938InvscBull2022CpBd BSCM 2.2 21.71 –0.03 .0333InvsBull22HYCpBd BSJM 4.2 23.28 –0.04 .0772InvscBS2028HY BSJS 4.6 25.65 –0.04 .1046InvscBS2028MuniBd BSMS 1.7 26.17 +0.01 .0334InvscBS2025MuniBd BSMP 1.3 26.00 +0.04 .022InvscBS2024MuniBd BSMO 1.1 25.74 –0.03 .0169InvscBS2024USDEM BSDE 3.5 26.25 –0.03 .0766InvscBull2029CpBd BSCT 2.2 21.53 –0.06 .035InvscBS2029MuniBd BSMT 1.8 26.09 +0.01 .0334InvscBS2021MuniBd BSML .7 25.33 +0.01 .0098InvscBS2021USDEM BSAE 3.7 25.26 –0.05 .0768InvscBS27HYCpBd BSJR 4.6 25.47 –0.07 .1026InvscBS2027MuniBd BSMR 1.4 25.79 –0.03 .0216InvscBS2026MuniBd BSMQ 1.5 25.91 +0.01 .0263InvscBS2023MuniBd BSMN .9 25.66 +0.01 .0132InvscBS2023USDEM BSCE 3.7 26.37 –0.04 .0825InvscBS2022MuniBd BSMM .8 25.43 +0.07 .0098InvscBS2022USDEM BSBE 3.9 25.88 –0.11 .0824InvscBuyBackAch PKW 1.4 77.21 –0.06 .2311InvscDWABasicMatl PYZ 1.0 74.51 –1.57 .1531InvscDWAConsCyc PEZ .3 87.52 +2.98 .0839InvscDWACnsStpls PSL .8 88.40 +0.05 .174InvscDWADevMkt PIZ .4 34.76 +0.94 .0177InvscDWAEMMom PIE 1.2 24.61 +0.79 .1136InvscDWAEnerMom PXI 1.5 20.64 –0.23 .0216InvscDWAFinMom PFI 1.5 45.13 +0.15 .0671InvscDWAHlthcrMom PTH ... 175.87 –0.51 ...InvscDWAIndlsMom PRN .1 103.85 +3.58 .0079InvscDWAMom PDP .1 90.66 +2.41 .0237InvscDWASCMom DWAS .2 85.00 +2.70 .0232InvscDWATechMom PTF ... 155.17 +10.82 ...InvscDWAUtilMom PUI 2.4 31.74 –0.35 .1623InvscDivAchvrs PFM 1.9 33.00 +0.07 .165InvscIntLowBeta IDLB 1.2 30.27 +0.25 .1543InvscFTSEUS1500SM PRFZ .8 165.25 +3.57 .3136InvscGlblWater PIO .8 36.05 +0.17 .0819InvscGoldenDragon PGJ .3 72.50 +4.88 .0817InvscHYBd IHYF 2.4 25.53 –0.06 .1014InvscHYEquDivAch PEY 4.1 18.01 –0.27 .0635InvscIntlBuyBkAch IPKW 1.4 40.49 +0.23 .0891InvscIntlDivAch PID 3.0 16.10 –0.21 .1139InvscKBWBank KBWB 2.5 53.41 –1.61 .3299InvscKBWHiDvYdFn KBWD 9.0 17.30 ... .1207
InvscKBWPrEquREIT KBWY 9.9 20.98 –0.32 .1286InvscKBWP&CIns KBWP 1.9 68.20 –1.07 .3897InvscKBWRegBkg KBWR 2.6 53.28 +0.15 .3565InvscNasdNext100 QQQJ .4 33.04 +0.74 .0289InvscNasd100 QQQM .6 133.78 +5.68 .2063InvscNasdInt PNQI ... 241.59 +11.80 ...Invsc1-30LadTrea PLW 1.0 37.61 –0.02 .0282InvscQQQI QQQ .5 325.42 +13.56 .5613InvscRAFIStDvxUS ISDX 1.9 28.37 +0.07 .0988InvscRAFIStratEM ISEM 2.5 28.67 +0.13 .1619InvscRAFIStratUS IUS 1.7 32.58 +0.32 .1432InvscRAFIStrUSSm IUSS .8 32.15 +0.67 .069InvscR1000LoBeta USLB 2.4 35.79 +0.29 .1774InvscS&PSCCnsDisc PSCD .5 94.80 +3.26 .0937InvscS&PSCCnsStpl PSCC 1.5 92.96 +2.28 .5263InvscS&PSCEner PSCE .7 5.37 –0.02 .0046InvscS&PSCFinls PSCF 3.3 52.22 +0.17 .4463InvscS&PSCHlthCr PSCH ... 185.85 +3.64 ...InvscS&PSCIndls PSCI .5 86.68 +1.51 .1149InvscS&PSCInfTech PSCT .1 136.87 +3.64 .0197InvscS&PSCMatls PSCM 1.5 61.31 –0.67 .40InvscS&PSCUtil PSCU 1.1 57.79 +1.32 .1749InvscVarRateInvt VRIG 1.4 25.07 ... .0192InvscWaterRscs PHO .4 48.90 +0.64 .0455iShAsia50ETF AIA 1.0 98.57 +4.23 .7062iSh3-7YTreasuryBd IEI 1.1 132.55 +0.11 .0868iShBrdUSDInvCpBd USIG 2.9 61.22 –0.09 .1368iShCommodSelStrat COMT .3 27.54 –0.21 .0963iShCoreMSCITotInt IXUS 1.8 70.15 +1.05 .7066iShCore1-5YUSDBd ISTB 2.2 51.65 +0.05 .0799iShCoreS&PUSGrowth IUSG .9 91.48 +3.56 .2276iShCoreS&PUSValue IUSV 2.4 63.44 –0.25 .4002iShCoreTotalUSDBd IUSB 2.5 54.22 –0.03 .0477iShCurrHdMSCIGrmny HEWG 2.4 30.05 +0.44 .3777iShSelectDividend DVY 3.5 100.02 –0.88 .8297iShESGAdvHYCorpBd HYXF 4.6 52.45 +0.13 .1461iShESGAdvMSCI DMXF .6 64.90 +0.54 .1972iShESGAdvMSCIEM EMXF .8 45.56 +1.51 .1734iShESGAdvUSA USXF 1.1 32.22 +0.58 .092iShESGAwareMSCI ESGD 1.6 75.17 +0.72 .6075iShESGAwareEM ESGE 1.2 45.49 +1.39 .339iShESGAwareUSA ESGU 1.2 88.44 +1.79 .2921iShESG1-5YCpBd SUSB 1.9 26.16 +0.01 .0289iShESGUSDCorpBd SUSC 2.2 27.96 –0.06 .0008iShESGEMLdrs LDEM 1.7 65.37 +2.24 .7816iShESGIUSALdrs SUSL 1.4 66.30 +0.90 .2515iShExponentialTech XT .7 60.46 +1.22 .0108iShFallAngelsUSDBd FALN 5.1 29.46 –0.01 .123iSh5-10YIGCorpBd IGIB 2.8 61.32 –0.03 .1234iShGNMABondETF GNMA 1.9 50.93 ... .0807iShGlbCleanEnergy ICLN .3 32.90 +2.34 .03iShGlbGreenBd BGRN 1.8 56.01 –0.04 .1604iShGlbTimber WOOD .9 82.77 +2.48 .31iShiBdsDec30Trea IBTK .6 24.13 +0.03 .0136iShiBdsDec28Trea IBTI .6 26.08 +0.03 .015iShiBdsDec25Trea IBTF .6 26.03 +0.03 .0217iShiBdsDec24Trea IBTE .6 25.90 +0.02 .0149iShiBdsDec29Trea IBTJ .7 25.94 +0.03 .0164iShiBdsDec21Trea IBTA .3 25.35 –0.01 .0014iShiBdsDec27Trea IBTH .6 26.05 +0.03 .0132iShiBdsDec26Trea IBTG .6 26.09 +0.03 .0151iShiBdsDec23Trea IBTD .5 25.71 +0.01 .0116iShiBdsDec22Trea IBTB .7 25.43 +0.01 .0151iShIndia50ETF INDY .1 43.85 +0.33 .0328iShIntlDevRealEst IFGL 2.2 27.00 +0.11 .2051iShIntlTreasuryBd IGOV ... 54.88 –0.01 ...iShJPMUSDEmgBd EMB 3.9 113.85 +0.42 .3952iShMBSETF MBB 2.1 110.19 +0.02 .1994iShMSCIACWI ACWI 1.4 93.77 +1.60 .6859iShMSCIACWIxUS ACWX 1.8 55.39 +0.81 .4912iShMSCIACxJpn AAXJ 1.0 98.14 +3.41 .6843iShMSCIBrazilSC EWZS 1.2 15.54 –1.12 .0358iShMSCIChina MCHI .9 91.06 +5.41 .6037iShMSCIEAFESC SCZ 1.5 70.15 +1.08 .023iShMSCIEMAsia EEMA 1.1 95.53 +2.96 .7661iShMSCIEMxChina EMXC 1.4 60.07 +0.50 .5838iShMSCIEuropeFinls EUFN 1.4 17.77 –0.08 .0711iShMSCIEuropeSmCp IEUS 1.2 64.09 +0.94 .367iShMSCIGlblGoldMin RING .8 29.63 +0.39 .1443iShMSCIGlbImpact SDG .9 99.39 +2.90 .4078iShMSCIJapanEW EWJE 1.2 39.40 +0.28 .2222iShMSCIJapanVal EWJV 1.9 26.71 +0.11 .2295iShMSCINewZealand ENZL 1.6 68.85 +2.40 .7631iShMSCIQatar QAT 2.6 18.94 –0.17 .4861iShMSCITurkeyETF TUR .8 27.99 +0.62 .0776iShMSCIUAE UAE 4.3 13.14 +0.48 .0076iShMornMCValue JKI 2.5 163.67 –1.11 .818iShNasdaqBiotech IBB .2 164.69 +2.98 .0655iSh1-5YIGCorpBd IGSB 2.4 55.13 +0.06 .0944iSh13YearIntlTBd ISHG ... 84.68 +0.41 ...iShPHLXSemicond SOXX .7 417.35 +11.28 .7469iShPfd&Incm PFF 4.8 38.38 +0.31 .0615iShRuss1000PureUS AMCA 2.1 32.60 +0.04 .1676iShS&PSC600Growth IJT .6 125.75 +2.90 .2479iShS&PEMInfra EMIF 2.6 24.02 –0.43 .3221iShGlobalInfra IGF 2.3 43.88 –0.49 .5794iShShortTreaBd SHV .6 110.51 ... .1554iSh1-3YTreasuryBd SHY .9 86.38 +0.03 .032iSh7-10YTreasuryBd IEF 1.1 118.58 +0.13 .0725iSh20+YTreasuryBd TLT 1.6 151.88 +0.06 .1639iSh0-5YInvGrdCpBd SLQD 2.3 52.13 –0.01 .0861JanusSCGrwAlpha JSML .3 67.77 +1.43 .1263JanusS/MCGrwAlph JSMD .2 66.90 +1.34 .0933LeggMasonGlbInfr INFR 3.1 29.77 –0.43 .1333LeggMasonLVHD LVHD 2.6 32.68 –0.15 .1972LeggMasonSCQualVal SQLV 1.1 32.75 +0.48 .1478LoncarCancerETF CNCR .8 34.42 –0.23 .2881LoncarChinaBio CHNA .4 39.10 +4.05 .1546LongTermCareETF OLD 1.9 30.70 +0.57 .2449Merlyn.AITactGrw SNUG .9 28.11 +0.21 .2283Nasdaq7HANDL HNDL 3.2 25.47 +0.17 .1479PacerCashCows HERD 1.8 30.31 +0.04 .1615PacerEMCashCows ECOW 3.2 24.91 –0.03 .014PrincipalHlthInnov BTEC .0 64.66 +0.98 .2154PrincplMillennials GENY .7 61.99 +1.99 .1846PrincipalQual PSET 1.1 46.86 +0.26 .134PrinUSMega USMC 1.5 36.11 +0.58 .1296PrinUSSCMulti PSC 1.1 39.64 +0.14 .1487PrincipalValue PY 2.8 36.04 +0.18 .231ProcureSpace UFO 1.0 27.85 +0.78 .1628ProShEquRising EQRR 2.0 40.82 –0.65 .27ProShUltNdBio BIB ... 101.91 +4.01 ...ProShUltNasdCloud SKYU ... 42.01 ... ...ProShUltNasdCyber UCYB ... 40.55 ... ...ProShUltPrQQQ TQQQ .0 100.52 +11.84 .0001ProShUltShtQQQ SQQQ 2.4 13.40 –1.92 .3262ProShUltShNdBtech BIS .5 19.71 –0.85 .1057SPDRDorseyWrightFx DWFI 2.8 26.40 +0.23 .1355SimplifyGrwEq QQC .6 27.75 +1.15 .0431SimplifyGrwEqDwn QQD .6 27.30 +1.13 .0429SirenLCBlend SPQQ .9 29.49 +0.35 1.4621SirenNasdNexGen BLCN .6 41.91 +0.39 .1022SoFiGigEcon GIGE .3 41.21 +2.27 .124
Tick DivName Sym Yld Last Chg. Amt.
Tick DivName Sym Yld Last Chg. Amt.
Tick DivName Sym Yld Last Chg. Amt.
Tick DivName Sym Yld Last Chg. Amt.
Tick DivName Sym Yld Last Chg. Amt.
Tick DivName Sym Yld Last Chg. Amt.

M24 BARRON’S January 25, 2021
VanEckBiotech BBH .3 187.27 +6.30 .6079VanEckFallAnglHYBd ANGL 4.7 32.13 –0.04 .1267VanEckGaming BJK .5 47.59 +0.63 .2222VanEckPharm PPH 1.6 70.65 +0.93 .2662VanEckRetail RTH .6 162.93 +2.42 1.0027VanEckSemiconduc SMH ... 240.93 +6.17 ...VanEckVideoGam ESPO .1 76.22 +3.59 .0849VangdEMGovBd VWOB 4.2 80.90 +0.22 .2618VangdGlblxUSRE VNQI .9 53.91 +0.26 .5053VangdIntrCorpBd VCIT 2.6 96.32 –0.12 .0569VangdIntermTrmTrea VGIT 1.5 69.08 +0.07 .1364VangdIntlDivApp VIGI 1.2 83.95 +1.63 .3836VangdIntlHiDiv VYMI 3.1 63.70 +0.18 .5876VangdLTCorpBd VCLT 3.2 108.01 –0.49 .2789VangdLong-TermTrea VGLT 1.9 92.39 –0.03 .1336VangdMBS VMBS 1.8 54.05 +0.02 .0985VangdRuss1000 VONE 1.4 180.00 +3.38 .8011VangdRuss1000Grw VONG .7 254.50 +9.52 .6246VangdRuss1000Val VONV 2.2 123.00 –0.33 .7726VangdRuss3000 VTHR 1.3 179.65 +3.36 .7498VangdRuss2000 VTWO .8 173.61 +3.63 .6796VangdRuss2000Grw VTWG .4 230.10 +6.53 .3871VangdRuss2000Val VTWV 1.4 125.91 +1.60 .8044VangdSTCpBd VCSH 2.3 83.13 +0.02 .1309VangdShtTmInfltn VTIP 1.2 51.35 +0.12 .333VangdShortTermTrea VGSH 1.1 61.62 +0.02 .2195VangdTotalBd BND 2.2 87.38 +0.03 .0372VangdTotalCpBd VTC 2.7 92.86 –0.19 .19VangdTotIntlBd BNDX 1.0 58.22 –0.12 .0894VangdTotIntlStk VXUS 2.0 62.80 +0.95 .5903VangdTotWorldBd BNDW 1.6 81.60 –0.10 .0987VicShDevEnhVol CIZ 1.5 32.19 +0.30 .1136VicShDivAccel VSDA 1.5 39.42 –0.03 .1807VicShEMHiDivVol CEY 3.7 22.64 –0.33 .0453VicShEMVolWtd CEZ 1.8 27.78 +0.02 .0104VicShIntlHiDivVol CID 3.2 30.55 –0.04 .017VicShIntlVolWtd CIL 1.7 42.67 +0.05 .1251VicShNasdNext50 QQQN .3 33.70 +0.74 .0367VicShProtectAmer SHLD .6 29.88 +0.14 .0473VicShTopVetEmp VTRN .8 28.97 –0.12 .0584VicShUSDiscEnhVol CSF 1.0 54.13 +0.55 .0207VicShUSEQIncmEnh CDC 2.4 55.31 –0.50 .0068VicShUS500EnhVol CFO .9 64.01 +0.36 .0011VicShUS500Vol CFA 1.2 64.04 +0.45 .0027VicShUSLCHiDivVol CDL 3.2 48.51 –0.43 .0061VicShUSMultMin VSMV 1.9 34.64 +0.32 .1408VicShUSSCHiDiv CSB 3.5 52.94 –0.15 .0265VicShUSSCVolWtd CSA 1.2 57.54 –0.73 .016VirtusTerraUSQual JOET .1 26.50 +0.35 .021WahedFTSEUSAShar HLAL .9 35.47 +0.79 .0962WstAstShrtDur WINC 3.9 26.25 –0.02 .1133WstAstTR WBND 3.0 27.91 –0.04 .717WisdTrChinaxSOE CXSE .5 74.79 +5.31 .0491WisdTrEMCpBd EMCB 3.9 76.61 +0.11 .205WisdTrEMQualDivGrw DGRE 2.0 30.42 +0.73 .1135WisdTrGermanyHdg DXGE 3.2 32.22 +0.03 .2537WisdTrIntRtHYBd HYZD 5.1 22.02 +0.14 .09WisdTrIntUSAgg AGZD 2.3 47.25 +0.14 .085WisdTrJapanHdgSC DXJS 3.0 40.41 +0.04 .5436WisdTrUSQltyDiv DGRW 1.9 54.61 +0.46 .0177WisdTrUSSCQltyDiv DGRS 1.9 41.94 +0.21 .1274
NYSEARCAAAFFirstCLOBd AAA 1.0 25.16 +0.04 .0232AAMLowDurPfd PFLD 4.8 25.16 +0.10 .096AAMS&PDevMk DMDV 3.0 23.33 +0.04 .0851AAMS&PEMHiDivVal EEMD 3.7 22.43 ... .0584AAMS&P500HiDivV SPDV 3.7 25.79 –0.09 .088AIPoweredEquity AIEQ .4 39.49 +1.41 .02AIPwrdIntlEqu AIIQ 1.3 32.46 +0.79 .4136ALPSEmgDivDogs EDOG 2.6 23.01 –0.49 .0775ALPSEqSecWgh EQL 2.2 88.49 +0.77 .5454ALPSIntlDivDogs IDOG 2.9 26.93 +0.01 .1328ALPSMedBreak SBIO ... 55.96 –0.27 ...ALPSREITDivDogs RDOG 5.0 41.55 +0.09 .6401ALPSSectorDivDogs SDOG 3.5 46.09 –0.48 .3912ARKInnovationETF ARKK .0 146.08 +4.17 1.6277ARKNextGen ARKW .0 164.81 +8.14 1.8945AtacUSRotation RORO ... 22.84 +0.05 ...AberdStdBlAllCm BCD 1.3 25.63 –0.41 .3274AberdStdBlACStr BCI .7 22.07 –0.36 .1496AberdStdPhysGold SGOL ... 17.83 +0.28 ...AberdStdPhysPall PALL ... 220.55 –2.49 ...AberdStdPhysPlat PPLT ... 103.27 +3.00 ...AberdStdPhyPrMt GLTR ... 96.23 +1.59 ...AberdStdPhySilv SIVR ... 24.61 +0.73 ...AbsoluteCrStrat ABEQ .6 25.77 –0.12 .0893AcquirersFund ZIG .2 24.42 +0.27 .0414AdasinaSocJust JSTC ... 15.83 +0.19 ...AdvShDorseyADR AADR .1 63.94 +1.64 .0667AdvShDbLineVal DBLV 1.2 82.91 –0.67 1.0248AdvShFocusedEqu CWS .3 43.89 +0.30 .1195AdvShFolioBey FWDB 1.8 26.17 +0.02 .1516AdvShNewfleet MINC 2.3 49.11 +0.04 .1104AdvShPureCannab YOLO 1.6 21.89 +0.03 .0373AdvShPureUSCan MSOS ... 45.89 +0.71 ...AdvShQDynGrw QPX ... 26.03 +0.91 ...AdvShQPtfBlend QPT ... 25.16 +0.60 ...AdvShRangerEqBear HDGE ... 2.84 –0.06 ...AdvShStrGlbBW VEGA .3 37.54 +0.73 .1047AdvShSageCore HOLD 1.4 98.78 ... .0882AdvShViceETF VICE 1.1 32.34 +1.22 .3669AGFiQDynHdgUS USHG 1.1 31.30 +0.43 .3014AGFiQGlbInfr GLIF 2.7 24.44 +0.13 .292AGFiQHdgDivIncm DIVA 3.1 22.12 –0.19 .04AGFiQUSNeutAB BTAL ... 18.72 +0.16 ...AGFiQUSNeutrMom MOM ... 25.28 +0.51 ...AlerianEnergyInfr ENFR 6.9 15.97 –0.56 .0315AlerianMLPETF AMLP 11.4 27.71 –1.80 .71AllianzUSLCBf10A AZAA .0 26.33 +0.06 1.2217AllianzUSLCBf10J AZAJ ... 25.29 +0.26 ...AllianzUSLCBf10J AZAL .0 26.91 +0.16 1.0329AllianzUSLCB10O AZAO ... 27.03 +0.23 ...AllianzUSLCBf20A AZBA .0 25.68 +0.05 .6989AllianzUSLCBf20J AZBJ ... 25.15 +0.18 ...AllianzUSLCBf20J AZBL .0 26.05 +0.08 .584AllianzUSLCB10 AZBO ... 26.09 +0.04 ...AltMergerArb ARB .0 25.40 +0.19 .726AmCentDivrsCpBd KORP 2.8 52.91 +0.06 .1764AmCentDivrsMuni TAXF 2.1 54.91 +0.12 .1023AmCentLowVol LVOL ... 40.20 +0.75 ...AmCentMCGrw MID ... 54.86 +0.81 ...AmCentQulDivIn QINT 1.6 49.74 +0.66 .4369AmCentStoxxUSQ QGRO .2 65.04 +1.46 .0367AmCentSTOXXUSQual VALQ 2.0 43.89 +0.35 .2242AmCentSustEq ESGA .8 48.41 +1.01 .1267AmConsValues ACVF .9 28.42 +0.52 .0627AmplifyBlackSwan SWAN .4 32.80 +0.30 .1192AmpCWPEnhDiv DIVO 4.8 33.30 +0.10 .1488AmplifyCrowdBur LEND ... 14.96 +0.39 ...AmplifyHiIncm YYY 9.5 16.35 +0.14 .13AmplifyOnlRetail XBUY ... 55.18 +2.70 ...
AmplifyLithium BATT .2 18.49 +0.91 .0336AmplifyOnlineRet IBUY .5 127.36 +4.75 .6164AmpPureJrGold JGLD ... 27.12 +0.26 ...AmpSeymCannabis CNBS .4 23.71 +0.07 .101AmplifyTransData BLOK 1.7 38.79 –0.73 .658ArkFinInnov ARKF .0 54.58 +2.88 .0281ArmorUSEquity ARMR 1.1 22.38 +0.48 .2509ArrowDJGlobalYd GYLD 6.4 13.57 –0.21 .0259AvantisCoreFixIncm AVIG 1.3 50.00 ... .045AvantisCrMuniFx AVMU ... 50.19 +0.04 ...AvantisEM AVEM 1.5 66.36 +1.59 .6411AvantisIntlEquity AVDE 1.6 58.73 +0.50 .5418AvantisIntlSCValue AVDV 1.6 58.70 +0.40 .6557AvantisShortTrmFix AVSF .6 50.18 +0.02 .0188AvantisUSEquityETF AVUS 1.1 65.90 +1.04 .2241AvantisUSSCValue AVUV 1.1 63.06 +0.55 .2885AwareUltShDur AWTM 1.5 49.97 +0.02 .03BNYMellonCoreBd BKAG 1.8 50.33 –0.01 .0705BNYMellonEM BKEM 2.2 78.90 +2.27 .5258BNYMellonHYBeta BKHY 5.9 56.27 –0.08 .2719BNYMellonIntl BKIE 1.9 69.14 +0.67 .3028BNYMShDurCpBd BKSB 1.7 51.65 –0.02 .2022BNYMLCCore BKLC 1.1 72.85 +1.64 .1782BNYMUSMCCore BKMC 1.1 80.76 +0.77 .2034BNYMUSSCCore BKSE 1.0 90.58 +1.27 .2262BallastSmMid MGMT ... 29.42 +0.61 ...BarclyiPathBCarbon GRN ... 67.96 +5.13 ...Barrons400ETF BFOR .9 53.10 +0.94 .4875BlkRkFutureHlth BMED ... 31.67 +0.67 ...BlkRkFutInnov BFTR ... 52.44 +1.64 ...BlkRkFutureTech BTEK ... 38.91 +2.24 ...BlkRkUSEqRotat DYNF 1.5 32.80 +0.48 .1309BlueHorizBNE BNE .0 33.33 +2.47 .0044BlueStarIsrael ITEQ .5 73.20 +2.62 .39BreakwDryBulk BDRY ... 11.00 –0.04 ...CPHYTrend HYTR 3.0 24.07 +0.05 .1701CabanaTargetDraw5 TDSA .6 24.48 +0.17 .1468CabanaTargetDrawdown7 TDSB .5 24.43 +0.09 .1126CabanaTargetDraw16 TDSE .7 25.57 +0.50 .1698CabanaTargetDraw10 TDSC .5 24.90 +0.21 .1335CabanaTargetDraw13 TDSD .6 25.34 +0.45 .1451CannabisETF THCX 3.4 17.32 –0.62 .0478CapLinkNextGen KOIN .4 38.96 +0.67 .1534CapNextVehicles EKAR .4 40.54 +1.71 .1659ChgFinUSLCFoss CHGX .6 29.39 +0.43 .1678ChangeCapL/S CBLS ... 25.26 +0.99 ...ChangeCapSust CBSE ... 26.13 +0.92 ...ClearSharesOCIO OCIO 2.1 30.67 +0.32 .2427ClearPitonInt PIFI ... 99.83 +0.11 ...ClearUltShMat OPER .6 100.10 ... .0533ColumbiaDivFixed DIAL 2.6 21.90 +0.01 .0422ColumbiaEMCoreXCh XCEM 1.5 31.94 +0.14 .49ColumbiaEMConsumer ECON .6 30.33 +1.21 .1786ColumbiaIndiaCnsmr INCO .3 51.73 +1.43 .1646ColumbiaMultMun MUST 2.2 22.46 +0.04 .0769ColumbiaResEnhCore RECS 1.0 25.40 +0.45 .2678ColumbiaResEnhVal REVS 23.9 17.41 +0.01 .0115ColumbiaSustIntl ESGN 2.6 26.14 –0.08 .2031ColumbiaSustUSEqu ESGS 2.4 31.07 –0.08 .1858CommSvsSPDR XLC .7 68.84 +3.55 .107CnsmrDiscSelSector XLY .8 170.10 +4.30 .2961CnsStapleSelSector XLP 2.6 65.07 –0.56 .5644CoreAlternative CCOR 1.5 28.03 –0.65 .0911CSFIEnhEur50ETN FEUL ... 92.64 +1.92 ...CSFI LCGrwth FLGE ... 579.23 +43.14 ...CSS&PMLP MLPO 10.8 7.52 –1.23 .1723CSXMthly2xLvMtg REML 16.5 5.68 +0.28 .1928DBGoldDoubleLg DGP ... 42.14 +1.26 ...DBGoldDoubleShrt DZZ ... 2.73 –0.06 ...DBGoldShortETN DGZ ... 10.07 –0.14 ...DayHaganNedRes SSUS .5 29.93 +0.68 .1449DefianceNextGen FIVG .9 35.59 +0.83 .1004DefNextGenSpac SPAK ... 30.66 +0.56 ...DefianceQuantum QTUM .4 46.70 +1.74 .0165DeltaShS&P500Mgd DMRL .8 65.26 +1.09 .1452DeltaShS&P400Mgd DMRM .4 54.95 +0.70 .0585DeltaShS&PIntMgd DMRI .6 50.32 +0.38 .0304DeltaShS&P600Mgd DMRS .3 54.65 +0.53 .032DimenEmgCore DFAE .0 28.72 +0.71 .0031DimenIntlCore DFAI .4 27.32 +0.30 .0245DimenUSCore DFAU .5 27.18 +0.47 .0333DirexAuspiceBroad COM .4 25.79 –0.51 .0323DirexConCnsmr CCON .1 63.99 +3.40 .0478DirexAeroBl3 DFEN .5 16.28 –0.19 .0012DirexBrazilBull2X BRZU .9 102.94 –11.53 .3222DirexCSIChinaInt CWEB ... 82.83 +16.25 ...DirexCSI300CnA CHAD .6 16.42 –0.28 .0633DirexCSI300CnABl2 CHAU .2 47.81 +1.55 .0088DirexCloudBr2 CLDS ... 23.75 –1.16 ...DirexCloudBl2 CLDL ... 26.20 +1.15 ...DirexCnsDiscBl3 WANT .1 60.05 +4.37 .0355DirexDJBear3X WEBS 2.4 23.83 –3.83 .315DirexDJBull3X WEBL ... 74.79 +9.75 ...DirexEMBear3 EDZ 2.1 8.19 –0.70 .086DirexEMBull3 EDC .4 116.82 +8.85 .3919DirexEnergyBr2 ERY .8 27.25 +0.67 .1496DirexEnergyBl2 ERX 2.6 17.55 –0.57 .0743DirexChinaBr3 YANG 1.8 11.30 –2.55 .1087DirexChinaBl3 YINN .6 27.45 +4.37 .0917DirexFTSEEurBull3x EURL .4 28.00 +0.92 .051DirexFinlBear3 FAZ 1.8 6.51 +0.32 .0446DirexFinlBull3 FAS .4 65.68 –3.64 .0792DirexGoldMinBr2 DUST 5.2 20.10 –0.98 .717DirexGoldMinBl2 NUGT ... 65.58 +2.38 ...DirexHlthcrBull3 CURE .2 85.77 +1.39 .0061DirexHmbldrBull3 NAIL .0 62.42 +13.62 .0049DirexIndlsBl3 DUSL .3 28.83 –0.32 .0191DirexJrGoldMinBr2 JDST 16.9 10.79 –0.55 1.1458DirexJrGoldMinBl2 JNUG .1 102.26 +3.55 .1217DirexLatAmBl2X LBJ .7 74.61 –6.62 .105DirexIndiaBull2 INDL ... 45.97 +0.75 ...DirexMexicoBl3 MEXX .2 63.00 –6.86 .0472DirexMcBull3 MIDU .0 48.62 +2.22 .0119DirexPharmBl3X PILL ... 27.60 –0.20 ...DirexRealEstBr3 DRV .9 9.84 –0.47 .06DirexRealEstBl3 DRN 1.9 12.86 +0.46 .0397DirexRgBanksBull3X DPST .7 162.49 –4.16 .2801DirexRetailBull3 RETL .1 140.64 +15.09 .1739DirexRobAI2X UBOT 6.0 46.45 +2.34 3.6172DirexRussiaBl2 RUSL .5 22.42 –1.92 .1174DirexS&P500Br3 SPXS .6 36.27 –2.17 .1998DirexS&P500Bl3 SPXL .2 77.23 +4.21 .1155DirexS&P500Bull2X SPUU .8 78.29 +3.13 .3605DirexS&PBiotechBr3 LABD 6.6 19.26 –0.47 .9952DirexS&PBiotechBl3 LABU ... 126.23 +1.85 ...DirexS&P500Br1 SPDN .5 17.97 –0.37 .0176DirexHiBetaBear3X HIBS 1.1 26.92 +0.67 .307DirexHiBetaBull3X HIBL .4 270.74 –8.12 .4282DirexS&POil&GasBr2 DRIP .0 18.74 +0.57 .0028DirexS&POil&GasBl2 GUSH .2 50.89 –2.01 .0657DirexSemiBear3 SOXS 10.8 13.09 –1.25 .6415DirexSemiBl3 SOXL .0 611.85 +44.49 .0512Direx7-10TreaBr3 TYO .5 8.41 +0.04 .0287Direx7-10TreaBull TYD .3 57.32 +0.44 5.7353
DirexScBear3 TZA 3.4 5.09 –0.33 .0832DirexSCBull3 TNA .0 86.29 +4.85 .0103DirexKRBull3 KORU .0 49.03 +2.32 .0031DirexTechBear3 TECS 4.6 8.05 –1.12 .1304DirexTechBull3 TECL .1 428.14 +48.69 1.8997DirexTransportBl3 TPOR .1 27.42 –0.62 .009Direx20+TreaBr3 TMV .7 60.18 ... .202Direx20+YrTrBull TMF .5 31.20 –0.03 .6861DirexUtilBl3X UTSL 1.4 27.21 –0.19 .0985DirexDynHedge DYHG 1.1 52.72 +0.73 .267DirexFallKnives NIFE .6 68.26 –0.74 .1741DirexFlight FLYT 3.4 50.25 +0.15 1.2325DirexHiGrowth HIPR .2 61.41 +2.44 .0481DirexMSCILvL ESNG 1.3 58.46 +1.21 .1843DirexMoonInnov MOON ... 39.01 +2.86 ...DirexNasd100EW QQQE .5 77.41 +1.43 .1132DirexRs1000GrOvVal RWGV .3 107.79 +6.36 .158DirexRs1000ValOvGr RWVG 1.2 50.36 –1.08 .2734DirexS&P500HiMin QMJ 1.2 59.63 +1.06 .2117DirexWorkFrHome WFH .5 70.78 +2.27 .1367DirexWrldWithout WWOW ... 28.14 +1.60 ...DistillateIntlFund DSTX .3 26.91 +0.46 .0187DistillUSFundSt DSTL .8 37.30 +0.16 .303EmgqEMInternet EMQQ .2 72.78 +6.12 .1135ETFMGAltHarvest MJ 3.4 19.42 –0.40 .10ETFMGPrimeCyber HACK 1.0 61.76 +2.14 .04ETFMGPrmJrSilv SILJ 1.4 14.59 +0.44 .20ETFMGPrimeMob IPAY ... 66.12 +1.51 ...ETFMGSitUltra VALT 1.5 49.79 +0.02 .0334ETFMGTravelTech AWAY .0 26.40 +0.40 .01ETFMGTreat GERM 1.6 36.68 +0.86 .285ETRACSAlerianMLP AMUB 10.1 9.44 –0.59 .212ETRACSAlernMLPInfr MLPB 10.2 12.64 –0.74 .278EtracsAlerianMid AMND 8.9 28.67 –1.13 .611EtracsAlerMidstr AMNA 7.4 27.14 –0.61 .4736EtracsAlerMid AMTR ... 31.17 –1.29 ...ETRACSBloomETN DJCB ... 14.81 –0.28 ...EtracsM1.5XLevCEF CEFD 11.3 29.28 +0.41 .3626EtracsM1.5XLevMtg MVRL 13.7 40.47 +1.65 .9769ETRACSMonthPay2x SMHB 11.9 9.35 –0.08 .119ETRACS2xLvHiDiv HDLB 12.0 12.52 –0.14 .0814ETRACSNYSEPick PYPE 10.0 14.82 –0.83 .3324EtracsQ1.5XLevWf BDCX 12.7 30.52 +0.41 1.0209EtracsQ1.5XLevAl MLPR 9.4 24.25 –1.92 .9332ETRACS2xM092548 PFFL 9.5 18.74 +0.08 .1083ETRACSUBSBloomberg UCIB ... 15.67 –0.24 ...ETRACSWFBusDev BDCZ 9.4 16.53 +0.15 .3707EcofinDigPay TPAY .2 45.16 +0.88 .1021EcofinGlbWater EBLU 1.4 41.45 +0.16 .2242ElemntsRogrAgri RJA ... 6.55 –0.20 ...ElemntsRogrEngy RJN ... 1.73 –0.03 ...ElemntsRogrMtls RJZ ... 10.17 +0.15 ...ElemntsRogrTr RJI ... 5.08 –0.06 ...ElemntsSpectrmLC EEH ... 27.79 ... ...ElemntsBiofuels FUE ... 8.51 +0.30 ...ElemntsGrain GRU ... 4.07 –0.07 ...EnSelectSectorSPDR XLE 5.1 42.07 –0.68 .5201EREntrepreneur30 ENTR .0 28.92 +0.89 1.6517ERNonUSSC ERSX .4 26.15 +1.22 .1146EthoClimateLeader ETHO .7 55.94 +0.96 .17FIEnhEurope50ETN FIEE ... 164.35 +3.67 ...FidelityCorpBd FCOR 2.6 56.47 –0.08 .11FidelityDivRising FDRR 3.3 37.94 +0.45 .185FidelityHiDiv FDVV 3.8 33.08 +0.17 .227FidelityHYFactor FDHY 4.3 55.64 +0.22 .198FidelityIntlHiDiv FIDI 3.7 18.95 –0.01 .088FidelityIntlValue FIVA 2.9 22.90 +0.12 .12FidelityLtdTermBd FLTB 1.6 52.84 +0.04 .045FidelityLowVol FDLO 1.7 42.72 +0.34 .136FidelityCommSvs FCOM .8 46.78 +2.25 .068FidelityMSCICnDisc FDIS .7 76.21 +2.12 .102FidelityMSCICnStpl FSTA 3.3 39.52 –0.23 .289FidelityMSCIEn FENY 5.0 11.34 –0.21 .103FidelityMSCIFinls FNCL 2.7 43.63 –0.75 .219FidelityMSCIHlthCr FHLC 1.8 60.54 +0.58 .234FidelityMSCIIndls FIDU 1.3 47.94 +0.18 .138FidelityMSCIIT FTEC 1.0 107.53 +4.25 .20FidelityMSCIMatls FMAT 2.1 41.27 –0.47 .173FidelityRealEst FREL 5.0 25.61 +0.33 .318FidelityMSCIUtils FUTY 3.8 40.73 –0.17 .288FidelityMomFactor FDMO .9 46.51 +1.53 .056FidelityQualFactor FQAL 1.8 43.90 +0.79 .155FidelitySmallMid FSMD 1.7 30.77 +0.51 .159FidelityTotalBdETF FBND 2.4 53.85 +0.01 .084FidelityUSMulti FLRG 5.7 21.93 +0.49 .314FidelityValFactor FVAL 1.9 41.91 +0.57 .136FieldUVAUnconMed FFIU 2.5 26.66 ... .1337FinSelSectorSPDR XLF ... 30.34 –0.60 ...FTActiveFactorLC AFLG 1.2 23.11 +0.46 .085FTActiveFactorMC AFMC 1.0 22.93 +0.20 .10FTActiveFactorSC AFSM .5 24.42 +0.38 .06FTConsDscAlpDx FXD .4 54.63 +1.23 .0481FTConsStaples FXG 1.4 52.57 +0.22 .1822FTDJGlbSelDiv FGD 5.9 23.03 –0.24 .3481FTDJ Internet FDN ... 223.27 +10.32 ...FTDow30EW EDOW 1.8 27.68 +0.09 .078FTEIPCarbonImpact ECLN 1.6 23.24 +0.19 .0808FTEnergyAlpDx FXN 4.2 8.86 –0.13 .0646FTEqCompRiskMgr ERM 1.3 21.81 +0.16 .1036FTEqCompTactical TERM 1.3 19.04 +0.06 .0937FTDJSelMicro FDM 1.5 52.41 +1.18 .3536FTFTSEDevRE FFR .8 43.83 +0.29 .321FTFinlsAlpDx FXO 2.4 36.45 –0.57 .2141FTGlbEngg FLM 2.7 51.97 –0.01 .2507FTGlbWindEner FAN .8 25.48 +1.40 .0272FTHlthCareAlpha FXH ... 111.98 +0.68 ...FTHorizonMgdVolDev HDMV 1.4 31.09 +0.18 .2219FTHorizonMgdVolDom HUSV 1.3 28.58 –0.01 .1404FTHorizMgdVolSM HSMV 1.0 29.29 +0.26 .1394FTChindia FNI .3 66.16 +3.56 .1182FT IndlsAlpDx FXR 1.0 52.24 +0.66 .1356FTInstPfdSecs FPEI 4.9 20.37 ... .0802FTLgDurOpps LGOV 3.0 28.43 –0.14 .08FTLong/Short FTLS .4 45.64 +0.60 .1252FTMgdFutures FMF .0 46.14 +0.24 .0074FTMatAlpDX FXZ 1.4 50.63 –0.37 .19FTMergerArbitrage MARB ... 19.54 –0.05 ...FTMngstrDiv FDL 4.4 30.05 –0.30 .3677FTMulti-MgrLG MMLG .5 24.55 +0.72 .0606FTNaturalGas FCG 3.2 10.37 –0.50 .1495FTNAEnergy Infra EMLP 4.5 22.03 –0.27 .2291FTNYSEArcaBiotch FBT ... 180.58 +4.29 ...FTPfdSecs FPE 4.8 20.24 –0.02 .0707FTSTOXXEurSelDiv FDD 3.9 13.23 –0.08 .076FTShDurMgMun FSMB 1.7 20.84 –0.02 .0265FTS&PREIT FRI 3.0 23.45 +0.33 .2669FTTCWSecPlus DEED 1.1 25.85 +0.07 .023FTTCWUnPlBd UCON 3.0 26.70 ... .054FTTechAlphaDEX FXL .0 117.20 +2.71 .0196FTUSEquityOpp FPX .3 127.51 +3.28 .0683FTUltShDurMuni FUMB .9 20.18 +0.03 .011FTUtilAlpha FXU 4.0 28.22 –0.20 .242FTValDivFd FVD 2.3 35.47 –0.14 .2112FTWater FIW .5 75.98 +0.88 .1228
FlexShSelBdFd BNDC 2.2 26.75 +0.10 .2032FlexShDevMkxUSQu QLVD 1.8 26.97 +0.13 .1234FlexShDiscDurMBS MBSD 2.8 24.03 +0.05 .0567FlexShEMQualLo QLVE 1.6 28.22 +0.56 .0273FlexGlbQualRealEst GQRE 2.0 57.96 +0.79 .3285FlexGlbUpstmNatRsc GUNR 2.6 34.61 –0.12 .1893FSHiYdValScored HYGV 6.1 49.47 +0.22 .2752FlexShiBoxx5YTIPS TDTF 1.1 27.93 +0.14 .022FlexiBx3YDurTIPS TDTT 1.1 26.26 +0.10 .0123FlexShIntQualDiv IQDE 3.0 23.65 +0.25 .1368FlexShIntQuDivDyn IQDY 2.5 29.59 +0.28 .0886FlexShIntlQualDiv IQDF 3.0 25.09 +0.16 .1144FlexShMDevMktxUS TLTD 2.0 67.68 +0.52 .2709FlexShEMFactTilt TLTE 1.8 61.45 +0.92 .1983FlexShQualDivDef QDEF 2.4 49.15 +0.67 .3501FlexShQualDivDyn QDYN 3.1 53.34 +0.72 .3361FlexShQualityDiv QDF 2.3 50.95 +0.62 .3111FlexShReadyAcc RAVI 1.3 76.31 +0.04 .0684FlexShSTOXXGlb NFRA 2.2 54.29 –0.28 .3348FlexShUSQualLo QLV 1.2 46.37 +0.97 .1953FrankFTSEAsiaxJpn FLAX 1.4 30.35 +1.07 .3588FrankFTSEAustralia FLAU 2.1 29.25 +0.49 .2942FrankFTSEBrazil FLBR 2.5 21.58 –1.22 .268FrankFTSECanada FLCA 2.4 28.01 –0.18 .4241FrankFTSEChina FLCH .8 35.78 +2.09 .2488FrankFTSEEurope FLEE 1.8 26.78 +0.27 .2917FrankFTSEEurHdg FLEH 1.9 24.71 +0.14 .3192FrankFTSEFrance FLFR 1.5 27.35 ... .2332FrankFTSEGermany FLGR 2.6 25.35 +0.54 .4064FrankFTSEHK FLHK 2.9 27.66 +0.42 .5597FrankFTSEIndia FLIN .7 27.29 +0.20 .0575FrankFTSEItaly FLIY 2.3 24.65 ... .1759FrankFTSEJapan FLJP 1.5 30.42 +0.18 .2396FrankFTSEJapanHdg FLJH ... 29.09 +0.20 ...FrankFTSELatAm FLLA 2.2 22.89 –1.03 .3379FrankFTSEMexico FLMX 1.5 21.69 –0.75 .1897FrankFTSERussia FLRU 6.6 25.50 –1.20 1.6797FrankFTSESaudiAr FLSA 2.1 26.99 –0.09 .1748FrankFTSESAfrica FLZA 4.0 24.02 +0.76 .5605FrankFTSESKorea FLKR .9 33.34 +0.72 .304FrankFTSESwitz FLSW 2.2 31.36 +0.39 .058FrankFTSETaiwan FLTW 1.9 40.57 +0.91 .7677FrankFTSEUK FLGB 2.6 23.31 +0.06 .2767FrankFedIntTxFr FLMI 2.1 26.58 +0.10 .0428FrankFedTxFrBd FLMB 2.1 27.40 +0.03 .0224FrankInvGradeCp FLCO 3.2 26.74 –0.03 .0831FrankShtDurUSGovt FTSD 1.5 95.83 +0.13 .1163FrankSysStyle FLSP .3 19.81 ... 1.5369FrankUSCoreBd FLCB 2.5 26.01 +0.03 .1689FrankUSLowVol FLLV 1.4 42.45 +0.20 .2183FrankUSTreaBd FLGV 1.7 24.66 –0.01 .0418FrankUltraShBd FLUD 1.7 25.00 +0.02 .0156FranklinLibEM FLQE 2.6 30.54 +0.09 .7622FranklinLibQGlbDiv FLQD 2.9 31.96 –0.10 .2541FranklinGlbEquity FLQG 2.4 36.96 +0.34 .4733FranklinIntlEquity FLQH 3.5 26.09 +0.03 .5747GadsdenDynMult GDMA 1.6 31.85 +0.46 .1273GlblBetaLowBeta GBLO 1.5 22.10 +0.09 .1125GlbBetaRisingStars GBGR .6 24.70 +0.74 .054GlbBetaSmartIncm GBDV 4.3 18.43 –0.10 .1872GlbXAdaptiveUS AUSF 2.8 26.57 +0.01 .0615GlbXAdaptUSRisk ONOF ... 25.29 +0.54 ...GlbXCopperMiners COPX 1.2 32.40 +0.38 .3226GlbXEMBd EMBD 3.5 27.36 +0.08 .375GlbXFTSENordReg GXF 1.1 28.43 +0.71 .1822GlbXFTSESEAsia ASEA 2.2 14.83 –0.15 .0979GlbXGoldExplorers GOEX 2.8 32.82 +0.30 .8955GlbXGuruIndex GURU 2.6 46.25 +0.83 .9019GlbXLithium&Batt LIT .3 71.83 +3.54 .0879GlbXMLP&Energy MLPX 7.7 29.30 –1.18 .5654GlbXMLP MLPA 12.9 29.50 –1.81 .90GlbXMSCIArgentina ARGT .3 30.62 +0.14 .0854GlbXMSCIChinaCm CHIC 1.3 30.29 +1.66 .3097GlXMSCIChinaCnsDisc CHIQ .1 39.77 +3.14 .0224GlbXMSCIChCS CHIS .6 36.15 +1.17 .1214GlbXMSCIChinaEner CHIE 3.7 8.97 +0.07 .2018GlbXMSCIChinaFinl CHIX 2.1 16.27 –0.13 .3032GlbXMSCIChinaHC CHIH .1 31.26 +3.16 .0171GlbXMSCIChinaIndls CHII 1.4 16.74 +0.83 .1807GlbXMSCIChinaIT CHIK .3 37.40 +2.82 .0133GlbXMSCIChLC50 CHIL .8 43.56 +2.00 .2426GlbXMSCIChinaMatls CHIM 1.6 24.28 +0.82 .2116GlbXMSCIChRlEst CHIR 4.4 16.75 +0.99 .4816GlbXMSCIChUtil CHIU 2.4 16.18 +0.30 .2499GlbXMSCIColombia GXG 3.4 30.67 –1.99 .5848GlbXMSCIGreece GREK 2.7 24.44 –0.36 .5346GlbXMSCINextEm EMFM 2.6 19.38 –0.19 .2584GlbXMSCINigeria NGE 6.1 12.69 +0.14 .7676GlbXMSCINorway NORW 2.0 13.08 +0.18 .1339GlbXMSCIPakistan PAK 2.4 29.95 –0.32 .4759GlbXMSCIPortugal PGAL 2.4 11.23 +0.14 .0653GlbXISuperDivEM SDEM 6.2 11.79 –0.04 .0575GlXS&P500CCGrw XYLG 5.6 27.99 +0.26 .1375GlbXS&P500Cv XYLD 8.3 46.92 +0.05 .4763GlbXS&P500QualDiv QDIV 3.0 27.06 +0.02 .064GlbXSilverMiners SIL 2.1 42.62 +0.99 .7347GlblXSuperDividend SDIV 7.7 13.27 +0.07 .075GlbXSuperDivUS DIV 7.6 17.80 +0.10 .0995GlbXSuperIncPfd SPFF 5.7 11.88 +0.09 .0565GlbXUSPfd PFFD 5.2 25.72 +0.22 .109GlbXUranium URA 1.7 15.11 –0.49 .1032GlbXVarPfd PFFV 5.2 27.52 +0.22 .1225GSAccessHYCorpBd GHYB 4.8 50.34 +0.18 .1823GSAccessIGCpBd GIGB 2.7 55.40 –0.17 .1104GS IGCorp1-5YBd GSIG .9 50.45 +0.02 .0418GSTreasury0-1Y GBIL .8 100.12 –0.01 .3097GSAccUSAggBd GCOR .7 49.74 +0.04 .0372GSActiveBetaEM GEM 1.5 40.75 +0.93 .2245GSActiveBetaEurope GSEU 1.8 33.84 +0.45 .0615GSActiveBetaIntlEq GSIE 1.6 32.79 +0.38 .1078GSActiveBetaJapan GSJY 1.2 38.23 +0.28 .2917GSActiveBetaUSLC GSLC 1.3 77.69 +1.57 .2518GSActiveUSSC GSSC .8 59.61 +1.12 .1448GSHedgeIndVIP GVIP .1 93.57 +1.96 .0006GS Innovate GINN .3 59.39 +2.31 .0401GSJUSTUSLC JUST 1.3 55.74 +1.18 .191GSPhysGold AAAU ... 18.47 +0.29 ...GothamEnh500 GSPY ... 20.53 +0.46 ...GraniteBloomComm COMB .1 23.67 –0.41 .0163GraniteGold BAR ... 18.44 +0.30 ...GraniteHIPSUSHiInc HIPS 9.3 13.82 –0.01 .1075GranitePlatinum PLTM ... 10.90 +0.35 ...GraniteXOUTUSLC XOUT .5 37.01 +1.10 .0473HCMDef500 LGH .2 33.97 +0.89 .0768HCMDef100 QQH ... 42.87 +2.39 ...HartfordMultiDvxUS RODM 2.8 28.98 +0.16 .3894HartfordMultiEM ROAM 2.9 24.07 +0.25 .4173HartfrdMultifctrSC ROSC 2.1 34.52 +0.60 .272HartfordMultiUSEqu ROUS 1.9 36.26 +0.35 .2573HartfordMuniOpps HMOP 2.4 41.98 +0.10 .0688HartfordSchTax HTAB 1.3 21.82 +0.06 .035HartfordTRBd HTRB 2.5 41.60 +0.02 .0593HealthCareSelSect XLV 1.4 117.59 +0.62 .4643HighYield HYLD 7.4 32.36 +0.21 .20
HorizonKinInfltn INFL ... 24.98 +0.15 ...HoyaCapHousing HOMZ 2.9 34.66 +1.15 .02HullTacticalUS HTUS .0 29.07 +0.16 1.099IQCandESGIntl IQSI 1.6 28.11 +0.35 .1502IQCandESGUS IQSU 1.0 33.17 +0.75 .0848IQEnhCorePlusBdUS AGGP .0 19.89 –0.01 .0443IQ50%HdgFTSEIntl HFXI 1.9 23.45 +0.22 .1221IQ500IntlETF IQIN 2.2 30.24 +0.16 .3181IQGlobalResources GRES 9.6 26.63 +0.11 2.5521IQHealthyHearts HART ... 25.47 +0.46 ...IQHedgeEventDriven QED 4.4 23.94 +0.12 1.0495IQHedgeL/STracker QLS 2.0 26.05 +0.20 .5173IQHedMacrTrac MCRO 2.5 28.82 +0.22 .7123IQHedgeMktNeut QMN 2.1 27.45 +0.13 .5692IQHedMultStra QAI 2.0 32.39 +0.26 .6331IQMacKayMuniIns MMIN 2.2 27.64 +0.05 .0366IQMacKayMuniInter MMIT 2.5 26.79 +0.05 .071IQMergerArbitrage MNA 2.3 33.35 +0.15 .766IQRealReturn CPI 1.0 27.22 ... .2693IQS&PHYLowVolBd HYLV 4.0 25.35 +0.05 .0841IQUSRealEstSC ROOF 3.9 22.19 +0.10 .2912IQUltShrtDur ULTR 1.4 49.66 +0.02 .0201iMDBiHedgeStrat DBEH .1 32.52 +0.58 .0183iMDBiMgdFut DBMF .1 26.21 +0.50 .0174ImpactNAACPMinrty NACP 1.1 29.59 +0.58 .2606ImpactSustain SDGA .7 26.00 +0.44 .0478ImpactShsYWCAWomen WOMN 1.6 30.17 +1.17 1.6109IndSelSectorSPDR XLI 1.6 88.51 –0.32 .3659InfraCapMLP AMZA 15.6 20.74 –1.79 .22InfraCapREITPfd PFFR 6.1 23.60 +0.01 .12InfusiveComp JOYY .3 33.64 +1.38 .1092InnovIBDBreakout BOUT ... 35.26 +1.63 ...InnovIBDLdrs LDRS .7 28.95 –0.05 .0185InnovatorIBD50 FFTY ... 46.21 +2.03 ...InnovLoupFrontier LOUP ... 57.39 +2.89 ...InnovEAFEPwrJan IJAN ... 25.87 +0.14 ...InnovEAFEPwrJul IJUL ... 24.03 +0.04 ...InnovEMPwrJan EJAN ... 30.28 ... ...InnovEMPwrJuly EJUL ... 26.42 +0.03 ...InspireCpBdImp IBD 1.6 26.50 –0.01 .0329InspireFaithLC FEVR ... 27.31 +0.71 ...InspireFaithMC GLRY ... 31.03 +2.19 ...InspireGlblHope BLES 1.6 34.66 +0.20 .0697InspireIntlESGETF WWJD 1.2 31.88 +0.26 .0984Inspire100ETF BIBL 1.1 37.50 +0.34 .3413InspireS/MC Impact ISMD .9 32.82 +0.42 .0287InspireTactBal RISN .8 26.14 +0.15 .0149InvscActvUSRlEst PSR 3.1 87.11 +0.91 .6996InvscAero&Def PPA .9 68.35 +0.06 .0934InvscCAAMT-Fr PWZ 2.3 27.95 +0.02 .0552InvscCEFIncmComp PCEF 7.5 22.50 +0.05 .139InvscChinaTech CQQQ .4 97.36 +8.64 .3859InvscCleantech PZD .2 81.80 +2.90 .0798InvscCurrShAUD FXA .0 76.88 +0.11 .0058InvscCurrShGBP FXB ... 132.15 +0.94 ...InvscCurrShCAD FXC .1 77.28 +0.05 .0559InvscCurrShEuro FXE ... 114.20 +0.82 ...InvscCurrShJPY FXY ... 90.89 –0.01 ...InvscCurrShCHF FXF ... 102.81 +0.59 ...InvscDBComm DBC ... 15.09 –0.21 ...InvscDBAgriFd DBA ... 16.21 –0.35 ...InvscDBBaseMet DBB ... 17.36 +0.13 ...InvscDBEnerFd DBE ... 11.46 –0.06 ...InvscDBG10Curr DBV ... 24.34 +0.11 ...InvscDBGoldFd DGL ... 53.76 +0.77 ...InvscDBOilFund DBO ... 9.07 –0.01 ...InvscDBPrecMetls DBP ... 51.12 +0.87 ...InvscDBSilverFd DBS ... 35.88 +1.05 ...InvscDBUSDBear UDN ... 21.70 +0.14 ...InvscDBUSDBull UUP ... 24.34 –0.14 ...InvscDefEquity DEF 1.3 59.53 +0.35 .794InvscDJIADiv DJD 3.4 39.41 –0.42 .3025InvscDynBiotech PBE .0 76.36 +0.22 .029InvscDynBuilding PKB .3 45.47 +1.83 .0193InvscDynEnerExpl PXE 3.6 11.68 –0.29 .1624InvscDynFood&Bev PBJ 1.1 36.98 +0.33 .1163InvscDynLCGrw PWB .2 70.12 +2.17 .0183InvscDynLCValue PWV 2.6 39.56 –0.21 .244InvscDynLeisure PEJ .9 42.87 +0.86 .2817InvscDynMarket PWC 1.0 114.69 +1.99 .2234InvscDynMedia PBS .3 48.24 +1.48 .0926InvscDynNetwkg PXQ .2 88.89 +2.45 .0039InvscDynOil&GasSv PXJ 4.2 3.25 –0.13 .0249InvscDynPharm PJP .7 77.22 +1.10 .1305InvscDynSemicon PSI .2 120.49 +4.78 .0184InvscDynSoftware PSJ .0 166.84 +5.97 .0559InvscEMSovDebt PCY 4.5 28.24 +0.07 .1037InvscFinlPfd PGF 5.0 18.93 +0.03 .0764InvscFTSEDvMktxUS PXF 2.0 44.30 +0.31 .1624InvscDevMktxUSSM PDN 1.7 35.64 +0.56 .1855InvscFTSERAFIEM PXH 2.7 22.20 –0.05 .071InvscFTSEUS1000 PRF 1.9 139.07 +1.18 .6025InvscFundHYCpBd PHB 3.9 19.38 –0.03 .0613InvscFundInvCpBd PFIG 2.4 27.26 –0.07 .0521InvscGlbClnEner PBD .4 40.71 +3.06 .0204InvscGlblPrvEqu PSP 4.6 13.77 +0.21 .1823InvscGlbShrtHYBd PGHY 5.5 22.16 –0.01 .102InvscIndia PIN .7 24.10 +0.18 .1667InvscIntlCpBd PICB 1.1 29.98 +0.15 .0266InvscInvGradeDef IIGD 1.6 26.91 –0.04 .0287InvscInvGradeValue IIGV 2.4 27.94 –0.10 .0471InvscMSCIGlbTimb CUT 1.6 34.61 +0.56 .5533InvscNatAMTFrMuni PZA 2.4 27.12 +0.02 .0546InvscNYAMTFrMuni PZT 2.5 26.16 –0.02 .0545InvscPreferred PGX 5.5 15.03 +0.03 .0618InvscRayJamesSB1 RYJ .3 54.71 +0.77 .1427InvscRuss1000EW EQAL 1.6 40.50 +0.05 .1748InvscS&PEMLowVol EELV 2.8 22.59 –0.23 .067InvscS&PEMMom EEMO 1.4 21.35 +1.47 .0125InvscS&P500BuyWr PBP 1.4 20.79 +0.19 .0898InvscS&P500Down PHDG .6 34.05 +0.44 .0454InvscS&P500EnhVal SPVU 2.5 35.75 –0.05 .2144InvscS&P500EWCm EWCO 1.0 32.47 +0.67 .0925InvsS&P500EWCD RCD .8 129.00 +2.56 .1027InvscS&P500CnStp RHS 2.2 149.24 –0.34 .9743InvscS&P500EWEner RYE 2.8 34.76 –0.82 .2235InvscS&P500EW RSP 1.6 131.44 +0.22 .442InvscS&P500EWFin RYF 2.1 49.96 –0.77 .2424InvscS&P500EWHC RYH .5 271.60 +2.21 .3193InvscS&P500Ind RGI .9 159.62 +0.58 .3249InvscS&P500EWMat RTM 1.5 146.02 –1.39 .4986InvscS&P500RlEst EWRE 3.8 29.55 +0.30 .2517InvscS&P500EWTech RYT 1.3 259.88 +3.19 .9086InvscS&P500EWUtil RYU 3.0 99.36 –0.82 .643InvscS&P500xRt XRLV 1.6 42.12 +0.16 .0463InvscS&P500GARP SPGP 1.0 75.66 +0.81 .1341InvscS&P500HiBeta SPHB 1.8 60.43 –0.52 .2451InvscS&P500HiDiv SPHD 4.8 38.52 –0.46 .1494InvscS&P500LowVol SPLV 2.1 56.34 +0.19 .0775InvscS&P500Mom SPMO 1.2 54.71 +2.30 .1655InvscS&P500PrGrw RPG .4 169.98 +4.45 .1608InvscS&P500PrVal RPV 2.0 65.35 –0.35 .2224InvscS&P500Qual SPHQ 1.5 42.95 +0.57 .1757InvscS&P500Rev RWL 1.7 64.65 +0.42 .273
InvscS&P500Top50 XLG 1.2 291.47 +9.98 .9511InvscS&P500ValMom SPVM 2.0 42.61 +0.41 .2024InvscS&PGlbWater CGW 1.3 49.03 +0.35 .6603InvscS&PIntDvLoVl IDLV 2.3 30.37 +0.05 .0623InvscS&PIntlDev IDMO 1.6 34.82 +0.89 .1439InvscS&PIntlDevQu IDHQ 1.6 30.17 +0.48 .0555InvscS&PMC400EW EWMC 1.1 81.90 +0.88 .1937InvscS&P400PrGrw RFG .2 225.24 +7.54 .1206InvscS&P400PrVal RFV 1.4 79.28 +1.02 .1538InvscS&PMC400Rev RWK .9 76.34 +1.23 .153InvscS&PMCLowVol XMLV 1.9 49.65 +0.73 .0902InvscS&PMCMom XMMO .6 85.43 +3.57 .0394InvscS&PMCQual XMHQ 1.0 71.84 +1.57 .3143InvscS&PMCValMom XMVM 1.3 39.62 +0.83 .1418InvscS&P100EW EQWL 1.9 70.75 +0.49 .3614InvscS&PSCLowVol XSLV 2.4 43.00 +0.30 .1944InvscS&PSCMom XSMO .7 52.95 +1.96 .0301InvscS&PSC600EW EWSC .7 72.02 +1.32 .0556InvscS&P600PrGrw RZG .4 155.53 +5.42 .1201InvscS&P600PrVal RZV .6 74.46 +0.43 .0942InvscS&P600Rev RWJ .8 94.22 +3.12 .1418InvscS&PSCValMom XSVM 1.0 40.12 +1.33 .0868InvscS&PSpin-Off CSD .9 59.33 +0.03 .5489InvscS&PUltDiv RDIV 4.7 35.34 –0.32 .8497InvscSrLoan BKLN 3.5 22.36 –0.06 .065InvscSolar TAN .1 121.11 +14.22 .0922InvscTaxMuniBd BAB 2.9 33.50 +0.10 .0714InvscTotalRetBd GTO 2.1 57.41 +0.01 .0751InvscTreaCollat CLTL .6 105.69 +0.01 .0077InvscUltShtDur GSY 1.3 50.57 –0.02 .0341InvscVRDOTaxFrWk PVI .3 24.92 +0.01 ...InvscVarRtPfd VRP 4.2 25.94 –0.06 .0934InvscWildClnEngy PBW .3 131.30 +12.27 .2782InvscZacksMC CZA 1.4 78.80 +0.63 1.0837InvscZacksMltIncm CVY 3.2 21.13 –0.03 .1853iPathBloomCocoaTR NIB ... 30.18 –0.22 ...iPathBloomCommTR DJP ... 22.19 –0.46 ...iPathBloomLeadTR LD ... 42.47 +1.32 ...iPathGSCInts GSP ... 11.58 –0.15 ...iPathPBBroadCmod BCM ... 30.55 –0.20 ...iPathPBCrudeOil OIL ... 15.07 –0.01 ...iPathBlmAgricult JJA ... 53.06 –2.78 ...iPathBlmAlum JJU ... 42.80 +0.65 ...iPathBlmCoffee JO ... 36.18 –1.24 ...iPathBlmCopper JJC ... 54.73 +0.21 ...iPathBlmCotton BAL ... 46.99 +0.58 ...iPathBlmEnergy JJE ... 27.64 –0.68 ...iPathBlmGrains JJG ... 55.48 –3.68 ...iPathBlmIndMet JJM ... 52.08 +0.38 ...iPathBlmLivestk COW ... 35.23 +1.06 ...iPathBBloomNatGas GAZ ... 14.28 –1.49 ...iPathBlmNickel JJN ... 72.13 +0.42 ...iPathBlmPlatinum PGM ... 53.44 +1.76 ...iPathBlmPrecMet JJP ... 66.36 +1.37 ...iPathBlmSofts JJS ... 43.58 –1.14 ...iPathBlmSugar SGG ... 47.59 –1.81 ...iPathBlmTin JJT ... 57.79 +2.37 ...iPathShillerCape CAPE ... 180.00 +4.52 ...iPathSilverETN SBUG ... 35.35 +1.02 ...iShAAA-ARtdCorpBd QLTA 2.3 57.62 –0.12 .0996iShA/PDividend DVYA 3.5 39.75 +0.20 .1209iShBBCpBd HYBB 4.6 52.04 +0.06 .1728iShAgencyBond AGZ 1.2 119.46 +0.19 .0502iShCMBSETF CMBS 2.5 55.21 +0.20 .1013iShGovt/CreditBond GBF 1.7 124.38 +0.03 .1394iSh10-20YTreasBd TLH 1.4 154.44 –0.02 .139iSh0-5YTIPSBd STIP 1.4 104.98 +0.21 .0377iShBloomRollSel CMDY .1 45.94 –0.86 .0662iShCalifMuniBd CMF 1.8 62.91 +0.15 .0873iShCmdCurve CCRV ... 21.63 –0.31 ...iShAggrAllocation AOA 1.7 65.92 +0.90 .4205iShConsAllocat AOK 2.1 39.01 +0.19 .1523iShCoreDivGrowth DGRO 2.3 45.54 –0.02 .2727iShCore5-10YUSDBd IMTB 2.6 52.22 +0.04 .2324iShGrwthAllocation AOR 1.9 53.21 +0.54 .3343iShCoreHiDividend HDV 4.0 89.20 –0.48 .9232iShCoreMSCIEM IEMG 1.7 66.85 +1.72 .7235iShCoreMSCIEurope IEUR 2.1 52.80 +0.62 .4967iShMSCIIntlDev IDEV 1.9 63.46 +0.66 .6618iShCoreMSCIPacific IPAC 1.6 66.38 +0.60 .5006iShModAllocation AOM 2.0 43.70 +0.33 .2661iShCoreS&P500 IVV 1.5 384.31 +7.21 1.6102iShCoreS&PMC IJH 1.2 245.50 +3.90 .6596iShCoreS&PSC IJR 1.0 101.16 +1.60 .2477iShS&PTotlUSStkMkt ITOT 1.4 89.05 +1.65 .3421iShCore10+YUSDBd ILTB 3.0 74.25 –0.09 .1796iShCoreUSAggBd AGG 2.2 117.25 ... .1253iShCoreUSREIT USRT 3.1 48.88 +0.52 .4004iShCurrHdgNikk400 HJPX 1.2 33.55 +0.21 .2122iShCurHdgMSCIUS HAWX 1.9 30.90 +0.42 .2741iShCurrHdgMSCICda HEWC 5.1 27.71 –0.23 .3409iShCurHdgMSCIEAFE HSCZ 1.4 33.13 +0.34 .2058iShCurHdMSCIEurozn HEZU 2.3 31.93 +0.14 .473iShCurrHdMSCIJapan HEWJ 1.2 36.94 +0.24 .1236iShCurHdgMSCIMex HEWW 1.2 16.11 –0.50 .1332iShCurrHdgMSCIUK HEWU 2.7 21.39 –0.09 .2362iShCybersecurity IHAK .4 42.43 +1.35 .0105iShUSBasicMaterial IYM 1.3 117.19 –1.93 .4193iShUSConsumerSvcs IYC .6 71.60 +1.05 .1406iShUSConsumerGoods IYK 1.4 178.08 +1.65 .6477iShUSFinlServices IYG 1.7 152.60 –2.53 .069iShUSHealthcare IYH 1.1 256.33 +2.11 .757iShUSRealEstate IYR 2.6 85.97 +1.38 .6014iShUSUtilities IDU 2.9 77.74 –0.32 .5872iShUSEnergy IYE 4.3 22.47 –0.35 .2106iShUSFinls IYF 1.7 67.67 –0.59 .2592iShUSHealthcarePrv IHF .5 248.19 +1.81 .2752iShUSInsurance IAK 2.0 68.54 –0.68 .3089iShUSOilEquip&Svcs IEZ 1.9 12.47 –0.50 .0255iShUSPharmaceuticl IHE 1.2 184.73 +0.91 .5261iShUSRegionalBanks IAT 2.7 49.06 –0.80 .3823iShUSMedDevices IHI .2 337.01 +3.11 .4053iShAdvTotUSDBd EUSB 1.1 50.31 +0.02 .0279iShESGUSAggBd EAGG 1.6 56.10 –0.01 .0266iShEMDividend DVYE 5.2 37.93 –0.36 .076iShEuropeETF IEV 1.7 49.19 +0.45 .3478iShExpTech IGM .3 359.92 +15.27 .1728iShFocusedValue FOVL 2.7 45.98 –0.36 .3011iShGenomicsImm IDNA .2 51.47 +0.15 .0362iShGlblComm IXP .9 77.79 +4.04 .4087iShGlobal100 IOO 1.5 64.79 +1.78 .4328iShGlobalREITETF REET 2.6 24.03 +0.22 .1913iShGoldTr IAU ... 17.69 +0.29 ...iShiBoxx$InvGrCpBd LQD 2.7 135.70 –0.44 .28iShiBdsDec2030Cp IBDV 1.8 25.91 –0.08 .0347iShiBdsDec2028Cp IBDT 2.8 29.32 –0.02 .0658iShiBondsDec2025Cp IBDQ 2.5 27.25 +0.01 .0462iShiBondsDec2024Cp IBDP 2.5 26.57 ... .0471iShiBdsDec2029Cp IBDU 2.4 27.20 –0.02 .0517iShiBondsDec2021Cp IBDM 2.3 24.90 ... .0397iShiBdsDec2021Muni IBMJ 1.4 25.76 ... .0267iShiBondsDec2027Cp IBDS 2.7 27.54 +0.03 .0517iShiBondsDec2026Cp IBDR 2.6 26.98 –0.01 .0515iShiBondsDec2023Cp IBDO 2.5 26.24 ... .046
Tick DivName Sym Yld Last Chg. Amt.
Tick DivName Sym Yld Last Chg. Amt.
Tick DivName Sym Yld Last Chg. Amt.
Tick DivName Sym Yld Last Chg. Amt.
Tick DivName Sym Yld Last Chg. Amt.
Tick DivName Sym Yld Last Chg. Amt.
Exchange-Traded Portfolios
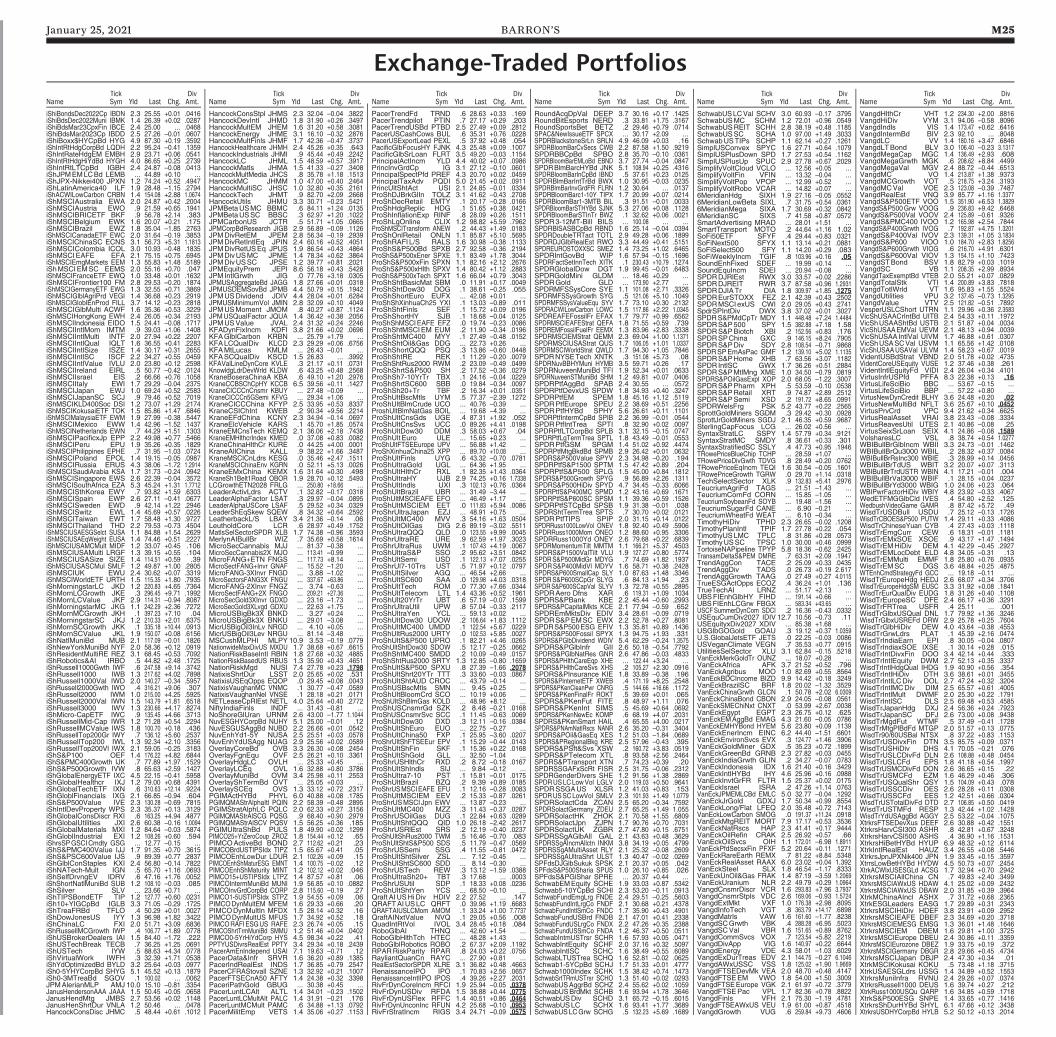
January 25, 2021 BARRON’S M25
iShiBondsDec2022Cp IBDN 2.3 25.55 +0.01 .0416iShiBdsDec2022Muni IBMK 1.4 26.39 +0.02 .0287iShiBdsMar23CpxFin IBCE 2.4 25.00 ... .0468iShiBdsMar2023Cp IBDD 2.5 27.26 –0.01 .0607iShiBoxx$HYCpBd HYG 4.9 87.30 +0.19 .3592iShIntRtHdgCorpBd LQDH 2.2 95.24 –0.41 .1359iShIntRateHdgEM EMBH 2.9 23.71 +0.06 .0541iShIntRtHdgHiYdBd HYGH 4.0 86.65 +0.25 .2739iShIntRtLTCpBd IGBH 2.4 24.87 –0.08 .0413iShJPMEMLCBd LEMB ... 44.89 +0.10 ...iShJPX-Nikkei400 JPXN 1.2 74.24 +0.52 .4947iShLatinAmerica40 ILF 1.9 28.48 –1.15 .2794iShACWILowCarbon CRBN 1.4 154.08 +2.88 1.0674iShMSCIAustralia EWA 2.0 24.87 +0.42 .2004iShMSCIAustria EWO .9 21.59 +0.65 .1941iShMSCIBRICETF BKF .9 56.78 +2.14 .383iShMSCIBelgium EWK 1.6 20.07 +0.21 .175iShMSCIBrazil EWZ 1.8 35.04 –1.85 .2763iShMSCICanadaETF EWC 2.0 31.64 –0.19 .3853iShMSCIChinaSC ECNS 3.1 56.73 +5.31 1.1813iShMSCIColombia ICOL 3.0 10.93 –0.48 .1835iShMSCIEAFE EFA 2.1 75.15 +0.75 .6945iShMSCIEmgMarkets EEM 1.3 55.83 +1.48 .5189iShMSCIEMSC EEMS 2.0 55.16 +0.70 .047iShMSCIFranceETF EWQ 1.0 33.48 +0.01 .1632iShMSCIFrontier100 FM 2.8 29.53 –0.20 .1874iShMSCIGermanyETF EWG 1.3 32.55 +0.71 .3869iShMSCIGlblAgriPrd VEGI 1.4 36.68 +0.23 .2919iShMSCIGloblEnProd FILL 3.7 14.12 –0.23 .2818iShMSCIGlbMulti ACWF 1.6 35.36 +0.53 .3229iShMSCIHongKong EWH 2.4 26.05 +0.34 .2193iShMSCIIndonesia EIDO 1.5 24.41 –0.08 .1717iShMSCIIntlMom IMTM .9 39.03 +1.06 .1408iShMSCIIntlMulti INTF 2.0 27.94 +0.22 .2207iShMSCIIntlQual IQLT 1.6 36.55 +0.41 .2283iShMSCIIntlSize ISZE 1.4 30.17 +0.31 .2655iShMSCIIntlSC ISCF 2.2 34.27 +0.55 .0459iShMSCIIntlValue IVLU 2.0 23.80 +0.12 .2598iShMSCIIreland EIRL .5 50.77 –0.42 .0124iShMSCIIsrael EIS .2 66.66 +0.76 .1058iShMSCIItaly EWI 1.7 29.29 –0.04 .2375iShMSCIJapan EWJ 1.0 69.24 +0.52 .2583iShMSCIJapanSC SCJ .9 79.46 +0.52 .7019iShMSCIKLD400Soc DSI 1.2 73.07 +1.29 .2174iShMSCIKokusaiETF TOK 1.5 85.86 +1.47 .6846iShMSCIMalaysiaETF EWM 1.9 27.99 –0.38 .5447iShMSCIMexico EWW 1.4 42.96 –1.52 .1437iShMSCINetherlands EWN .7 44.29 +1.51 .1303iShMSCIPacificxJp EPP 2.2 49.98 +0.77 .5466iShMSCIPeru EPU 1.9 35.26 +0.35 .1829iShMSCIPhilippines EPHE .7 31.95 –1.03 .0724iShMSCIPoland EPOL 1.4 19.15 –0.05 .0987iShMSCIRussia ERUS 4.3 38.06 –1.72 1.2914iShMSCISaudiArabia KSA 1.7 31.73 –0.24 .0942iShMSCISingapore EWS 2.6 22.39 –0.04 .3572iShMSCISouthAfrica EZA 5.3 45.24 +1.31 1.7712iShMSCISthKorea EWY .7 93.82 +1.59 .6303iShMSCISpain EWP 2.6 27.11 –0.41 .0677iShMSCISweden EWD .9 42.14 +1.22 .2946iShMSCISwitz EWL 1.4 45.69 +0.57 .0226iShMSCITaiwan EWT 1.7 58.48 +1.30 .9727iShMSCIThailand THD 2.2 79.53 –0.73 .4504iShMSCIUSAESGSelct SUSA 1.1 84.88 +1.54 .2629iShMSCIUSAEqWeight EUSA 1.4 74.46 +0.51 .2227iShMSCIUSAMCMult MIDF 1.2 33.07 +0.45 .106iShMSCIUSAMulti LRGF 1.3 39.15 +0.55 .104iShMSCIUSASize SIZE 1.4 114.51 +0.59 .39iShMSCIUSASCMul SMLF 1.2 49.87 +1.00 .2805iShMSCIUK EWU 2.4 30.62 +0.07 .3319iShMSCIWorldETF URTH 1.5 115.35 +1.80 .7935iShMorningstarLC JKD 1.2 220.83 +4.65 .7364iShMornLCGrowth JKE .3 296.45 +9.71 .1992iShMornLCValue JKF 2.9 114.31 –0.94 .8087iShMorningstarMC JKG 1.1 242.29 +2.36 .7272iShMornMCGrowth JKH .1 397.23 +7.10 .04iShMorningstarSC JKJ 1.2 210.33 +2.01 .6375iShMornSCGrowth JKK .1 335.18 +10.44 .0913iShMornSCValue JKL 1.9 150.07 +0.08 .6156iShNatlMuniBd MUB 2.1 117.09 –0.01 .1826iShNewYorkMuniBd NYF 2.0 58.36 +0.12 .0919iShResidentMultiRE REZ 3.1 68.45 +0.53 .7092iShRobotics&AI IRBO .5 44.82 +2.48 .1725iShRussell1000Gwth IWF .6 247.58 +9.14 .3742iShRussell1000 IWB 1.3 217.62 +4.02 .7898iShRussell1000Val IWD 2.0 140.27 –0.34 .5957iShRussell2000Gwth IWO .4 316.21 +9.06 .307iShRussell2000 IWM 1.0 215.00 +4.25 .5925iShRussell2000Val IWN 1.5 143.79 +1.81 .6518iShRussell3000 IWV 1.3 230.66 +4.17 .8274iShMicro-CapETF IWC .9 135.45 +4.66 .3713iShRussellMid-Cap IWR 1.2 71.28 +0.54 .2294iShRussellMCValue IWS 1.8 100.70 +0.18 .436iShRussellTop200Gr IWY .7 136.12 +5.60 .2537iShRussellTop200 IWL 1.3 92.34 +2.10 .3356iShRussellTop200Vl IWX 2.1 59.05 –0.25 .3183iShS&P100 OEF 1.4 176.22 +4.82 .6844iShS&PMC400Growth IJK .7 77.89 +1.97 .1529iShS&P500Growth IVW .8 65.63 +2.59 .1427iShGlobalEnergyETF IXC 4.5 22.15 –0.41 .5958iShGlobalHealthcr IXJ 1.2 79.00 +0.68 .4391iShGlobalTechETF IXN .6 310.63 +12.14 .9224iShGloblFinancials IXG 2.1 66.85 –0.94 .604iShS&P500Value IVE 2.3 130.28 –0.69 .7815iShIntlDevProperty WPS 2.3 35.37 +0.13 .3129iShGlobalConsDiscr RXI .6 163.25 +4.94 .4877iShGlobalUtilities JXI 2.6 60.38 –0.16 1.0094iShGlobalMaterials MXI 1.2 84.64 –0.03 .5874iShGloblIndustrial EXI 1.2 108.26 +0.60 .594iShrsSPGSCICmdty GSG ... 12.77 –0.15 ...iShS&PMC400Value IJJ 1.7 91.35 +0.70 .3615iShS&PSC600Value IJS .9 89.39 +0.77 .2837iShGlblConStaples KXI 2.4 56.80 –0.14 .7822iShNATech-Mult IGN .5 65.70 +1.16 .0693iShSelfDrvngEV IDRV .6 47.16 +1.76 .0052iShShortNatlMuniBd SUB 1.2 108.10 –0.03 .085iShSilver SLV ... 23.66 +0.71 ...iShTIPSBondETF TIP 1.2 127.77 +0.60 .0231iSh10+YIGCpBd IGLB 3.3 71.05 –0.29 .1725iShTreaFRBd TFLO .4 50.29 +0.01 .0027iShDowJonesUS IYY 1.3 96.98 +1.82 .3422iShChinaLC FXI 2.0 51.71 +3.09 .6836iShRussellMCGrowth IWP .4 106.77 +1.89 .0778iShUSBrokerDealers IAI 1.5 84.40 –1.72 .222iShUSTechBreak TECB .7 36.25 +1.25 .0691iShUSTech IYW .5 88.63 +4.34 .0778iShVirtualWork IWFH .3 32.39 +1.71 .0538iShYdOptimizedBd BYLD 3.2 25.64 +0.03 .0977iSh0-5YHYCorpBd SHYG 5.1 45.52 +0.13 .1879iSh0-3MTreaBd SGOV .1 100.02 ... .0062JPMAlerianMLP AMJ 10.0 15.10 –0.81 .3354JanusHendersonAAA JAAA 1.5 50.45 +0.05 .0658JanusHendMtg JMBS 2.7 53.56 +0.02 .1148JanusHenShrtDur VNLA 1.2 50.46 ... .0478HancockConsDisc JHMC .5 48.44 +0.61 .1012
HancockConsStpl JHMS 2.3 32.04 –0.04 .3822HancockDevIntl JHMD 1.8 31.90 +0.26 .3497HancockMultEM JHEM 1.6 31.20 +0.58 .3081HancockEnergy JHME 3.1 16.10 –0.32 .2876HancockMultFinls JHMF 1.7 42.36 –0.47 .3737HancockHealthcare JHMH 2.4 45.26 +0.35 .643HancockIndustrials JHMI .9 45.44 +0.49 .2242HancockLC JHML 1.5 48.59 +0.57 .3917HancockMatls JHMA 1.5 41.33 –0.27 .3408HancockMultMedia JHCS .8 35.78 +1.18 .1513HancockMC JHMM 1.0 47.00 +0.40 .2464HancockMultiSC JHSC 1.0 32.80 +0.35 .2161HancockTech JHMT .9 82.70 +2.09 .2668HancockUtils JHMU 3.3 30.71 –0.23 .5421JPMBetaUSMC BBMC .6 84.11 +1.24 .0135JPMBetaUSSC BBSC .3 62.97 +1.20 .1022JPMCarbonUS JCTR .5 51.71 +1.05 .0665JPMCorpBdResearch JIGB 2.9 56.89 –0.09 .1126JPMDivRetEM JPEM 2.8 56.34 –0.19 .2939JPMDivRetIntlEq JPIN 2.4 60.16 +0.52 .4051JPMDivRetUSEq JPUS 1.9 86.54 +0.43 .4864JPMDivUSMC JPME 1.4 78.34 +0.62 .3864JPMDivUSSC JPSE 1.2 39.77 +0.81 .2021JPMEquityPrem JEPI 8.6 56.18 +0.43 .5428JPM IntlGrwth JIG .0 77.76 +3.18 .0305JPMUSAggregateBd JAGG 1.8 27.66 +0.01 .0318JPMUSDEMSovBd JPMB 4.4 50.79 +0.15 .1942JPMUSDividend JDIV 4.4 28.04 +0.01 .6284JPMUSMinimumVol JMIN 2.8 32.09 +0.10 .4049JPMUSMoment JMOM .8 40.27 +0.87 .1124JPMUSQualFactor JQUA 1.4 36.42 +0.38 .2056JPMUSValue JVAL 2.4 31.32 +0.24 .2246KFADynFixIncm KDFI 3.8 21.66 +0.02 .0696KFAGlblCarbon KRBN ... 25.79 +1.79 ...KFALCQualDiv KLCD 2.3 29.29 +0.06 .6756KFAMtLucas KMLM ... 26.43 –0.01 ...KFASCQualDiv KSCD 1.5 26.83 ... .3992KFAValLineDynCore KVLE .3 21.17 +0.11 .0731KnowldgLdrDevWrld KLDW .6 43.25 +0.48 .2568KraneBoseraChinaA KBA .6 49.10 +1.20 .2976KraneCCBSChCpHY KCCB 6.5 39.56 +0.11 .1427KraneCICCCnCnsmr KBUY ... 27.48 –0.09 ...KraneCICCCn5GSemi KFVG ... 29.34 +1.06 ...KraneCICCChina KFYP 2.5 33.95 +0.53 .8337KraneCSIChInt KWEB .2 90.34 +9.56 .2214KraneEFdChina KCNY 2.3 34.94 –0.14 .0697KraneElcVehicle KARS .1 45.70 +1.85 .0574KraneEMCnsTech KEMQ 2.1 36.06 +2.18 .7438KraneEMHlthcrIndex KMED .0 37.08 +0.83 .0082KraneChinaHlthCr KURE .0 44.25 +4.00 .0001KraneAllChina KALL .9 38.22 +1.66 .3487KraneMSCICnLdrs KESG .0 35.46 +2.47 .1511KraneMSCIChinaEnv KGRN .0 52.11 +5.13 .0026KraneEMxChina KEMX 1.6 31.64 +0.30 .498KraneSh1Belt1Road OBOR 1.9 28.70 +0.12 .5493LCGrowthETN2028 FRLG ... 250.80 +18.66 ...LeaderActivLdrs ACTV .1 32.82 –0.17 .0318LeaderAlphaFactor LSAT .3 29.97 –0.04 .0895LeaderAlphaUSCore LSAF .5 29.52 +0.34 .0329LeaderShEqSkew SQEW .8 34.32 +0.64 .2592LeatherbackL/S LBAY 3.4 21.36 –0.14 .06LeutholdCore LCR .6 28.97 +0.49 .1752MatlsSelSectorSPDR XLB 1.7 74.38 –0.96 .3593MerlynAIBullBr WIZ .7 35.69 +0.58 .1614MicroSecCannabis MJJ ... 81.37 –0.38 ...MicroSecCannabis2X MJO ... 113.41 –0.99 ...MicroFANG+ETN FNGS ... 117.73 +8.14 ...MicroSectFANG+Invr GNAF ... 15.52 –1.20 ...MicroFANG-3XInvr FNGD ... 3.88 –1.02 ...MicroSectorsFANG3X FNGU ... 337.67 +63.86 ...MicroFANG-2XInvr FNGZ ... 3.74 –0.63 ...MicroSectFANG+2X FNGO ... 209.21 +27.36 ...MicroSecGold3XInvr GDXD ... 23.16 –1.73 ...MicroSecGold3XLvgd GDXU ... 22.63 +1.75 ...MicroUSBigBk3X BNKD ... 3.27 +0.24 ...MicroUSBigBk3X BNKU ... 29.01 –3.08 ...MicrUSBigOil3InLv NRGD ... 4.10 +0.05 ...MicrUSBigOil3Lev NRGU ... 81.14 –3.48 ...MSCushMLPHI MLPY 10.9 3.53 –0.19 .0779NationwideMaxDivUS MXDU 1.7 38.68 +0.67 .6615NationRiskBaseIntl RBIN 1.8 27.68 +0.32 .4885NationRiskBasedUS RBUS 1.3 35.90 +0.43 .4651NationRiskMgd NUSI 7.4 27.78 +0.23 .1798NatixisShrtDur LSST 2.0 25.65 +0.02 .531NatixisUSEqOpps EQOP .0 29.45 +0.08 .0043NatixisVaughanMC VNMC .1 30.77 –0.47 .0589NatixisVaughanNel VNSE .1 28.18 +0.21 .0171NETLeaseCpRlEst NETL 4.0 25.64 +0.40 .2772NiftyIndiaFinls INDF ... 31.43 –0.81 ...NoShoreGlUran URNM 2.6 43.00 –1.77 1.1044NuvESGHYCorpBd NUHY 5.1 25.00 –0.01 .12NuvESGUSAggBd NUBD 2.2 26.66 +0.01 .0542NuvEnhYd1-5Y NUSA 2.5 25.51 +0.03 .0578NuvEnhYdUSAgg NUAG 2.9 25.56 +0.02 .0589OverlayCoreBd OVB 3.3 26.30 +0.08 .2454OverlayFgnEqu OVF 2.5 26.21 +0.10 .3361OverlayHdgLC OVLH ... 25.33 +0.45 ...OverlayLCEq OVL 1.6 32.88 +0.80 .3786OverlayMuniBd OVM 3.4 25.98 +0.11 .2553OverlayShTermBd OVT ... 25.05 +0.03 ...OverlaySCEq OVS 1.3 33.12 +0.72 .2317PGIMActHYBd PHYL 6.0 40.88 +0.08 .1785PGIMQMAStrAlphaItl PQIN 2.2 58.39 –0.48 .2895PGIMStratAlphLC PQLC 2.0 62.33 +0.27 .3156PGIMQMAStrAlSCG PQSG .9 68.40 +0.90 .2979PGIMQMAStrAlSCV PQSV 1.5 56.25 +0.36 .185PGIMUltraShBd PULS 1.8 49.90 +0.02 .1299PIMCO25+YrZeroCoup ZROZ 1.8 154.44 +0.12 .65PIMCOActiveBd BOND 2.7 112.62 +0.21 .23PIMCOBrdUSTIPSIdx TIPZ 1.5 65.67 +0.41 .05PIMCOEnhLowDur LDUR 2.1 102.26 +0.09 .15PIMCOEnhShMaturESG EMNT 1.4 100.75 –0.02 .12PIMCOEnhShMaturity MINT 1.2 102.12 +0.02 .046PIMCO15+USTIPSIdx LTPZ 1.4 87.57 +0.81 .06PIMCOIntermMuniBd MUNI 1.9 56.85 +0.10 .0882PIMCOInvGrdCorpBd CORP 2.8 115.60 –0.19 .27PIMCO1-5USTIPSIdx STPZ 1.9 54.55 +0.09 .06PIMCODynMultEM MFEM 1.6 29.33 +0.66 .20PIMCODynMultIn MFDX 1.5 28.14 +0.32 .16PIMCODynMultUS MFUS 1.7 34.92 +0.52 .18PIMCORAFIESGUS RAFE 2.3 26.74 +0.05 .15PIMCOShrtTrmMuniBd SMMU 1.2 51.46 +0.04 .0402PIMCO0-5YrHiYdCorp HYS 4.5 98.34 +0.22 .41PPTYUSDivrsRealEst PPTY 3.4 29.34 +0.18 .2439PacerAmEnIndepend USAI 7.1 19.63 –0.71 .12PacerData&Infr SRVR 1.6 36.20 +0.89 .1385PacerIndRealEst INDS 1.7 36.85 +0.79 .2547PacerCFRAStovall SZNE 1.3 32.92 +0.21 .1007PacerFTSECnA50 AFTY 1.4 24.38 +0.32 .3398PaceriPathGold GBUG ... 30.38 +0.45 ...PacerLuntLCAlt ALTL 1.4 34.01 –0.23 .1502PacerLuntLCMultAlt PALC 1.4 31.91 –0.21 .176PacerLuntMCMult PAMC .6 34.88 +1.13 .0792PacerMilitEmp VETS 1.4 35.06 +0.27 .1153
PacerTrendFd TRND .6 28.63 +0.33 .169PacerTrendpilot PTIN .7 27.17 +0.29 .203PacerTrendUSBd PTBD 2.5 27.49 +0.09 .2812PacerUSCashCows BUL .6 35.31 +0.76 .0228PacerUSExportLead PEXL .5 37.92 +0.48 .054PacificGlbFocusHY FJNK 4.3 25.48 +0.09 .1007PacificGlbSrLoan FLRT 3.5 49.20 –0.03 .1154PrincipalActIncm YLD 4.4 40.02 +0.07 .0986PrincInvGrdCp IG 3.1 27.12 –0.10 .0601PrincipalSpectPfd PREF 4.3 20.70 +0.02 .0459PrincipalTaxAdv PQDI 5.0 21.45 +0.02 .0911PrincUltShtAct USI 2.1 24.85 –0.01 .0334ProShDJBrkGlIn TOLZ 3.1 41.62 –0.43 .2708ProShDecRetail EMTY .1 20.17 –0.28 .0166ProShHdgReplic HDG .1 51.65 +0.38 .0421ProShInflationExp RINF .8 28.09 +0.26 .1511ProShLgOnline CLIX 1.2 98.82 +5.59 .7962ProShMSCITransform ANEW .2 44.43 +1.49 .0183ProShOnlRetail ONLN 1.1 85.87 +5.10 .5695ProShRAFIL/S RALS 1.6 30.98 –0.38 .1133ProShS&P500Bd SPXB 2.7 92.58 –0.36 .2194ProShS&P500xEner SPXE 1.1 83.49 +1.78 .3044ProShS&P500xFin SPXN 1.1 82.16 +2.12 .2676ProShS&P500xHlth SPXV 1.4 80.42 +1.12 .2883ProShS&P500xTech SPXT 1.6 66.04 +0.79 .3043ProShShtBasicMat SBM .0 11.91 +0.17 .0049ProShShtDow30 DOG .1 38.61 –0.25 .055ProShShortEuro EUFX ... 42.08 +0.01 ...ProShShXinhuaCh25 YXI .1 13.03 –0.89 .011ProShShtFinls SEF .1 15.72 +0.09 .0196ProShShortHY SJB .1 18.68 –0.04 .0125ProShShMSCIEAFE EFZ .0 19.74 –0.23 .0086ProShShtMSCIEM EUM .2 11.90 –0.34 .0196ProShShtMC400 MYY .1 27.49 –0.48 .0152ProShShtOil&Gas DDG ... 22.73 +0.26 ...ProShShortQQQ PSQ .3 13.86 –0.60 .0448ProShShtRE REK .1 11.29 –0.20 .0079ProShShtRus2000 RWM .2 23.09 –0.49 .0499ProShShrtS&P500 SH .2 17.52 –0.36 .0279ProShSh7-10YrTr TBX .1 24.16 –0.04 .0229ProShShrtSC600 SBB .0 19.84 –0.34 .0097ProShSh20+Tr TBF .2 16.34 +0.01 .0351ProShUltBscMtls UYM .5 77.37 –2.39 .1272ProShUltBlmCrude UCO ... 40.76 –0.39 ...ProshUltBlmNatGas BOIL ... 19.68 –4.39 ...ProShUltCnsGds UGE .4 87.31 +1.92 .052ProShUltCnsSvs UCC .0 89.26 +4.41 .0198ProShUltDow30 DDM .3 58.03 +0.67 .04ProShUltEuro ULE ... 15.65 +0.23 ...ProShUltFTSEEurope UPV ... 56.88 +1.42 ...ProShXinhuaChina25 XPP ... 89.70 +10.08 ...ProShUltFinls UYG .6 43.32 –0.70 .0781ProShUltraGold UGL ... 64.36 +1.95 ...ProShUltHlthCr RXL .1 82.35 +1.43 .0364ProShUltraHY UJB 2.9 74.25 +0.16 1.7338ProShUltIndls UXI .3 102.13 +0.76 .0364ProShUltBrazil UBR ... 31.49 –3.44 ...ProShUltMSCIEAFE EFO ... 46.49 +1.17 ...ProShUltMSCIEM EET .0 111.83 +5.94 .0086ProShrUltraJapan EZJ ... 48.91 +0.75 ...ProShUltMC400 MVV .3 54.16 +1.63 .0504ProShUltOilGas DIG 2.6 89.19 –3.02 .5511ProShUltraQQQ QLD .0 123.55 +9.99 .0045ProShrUltraRE URE .9 62.59 +1.97 .3023ProShrUltraRus UWM .1 107.43 +4.19 .0067ProShUltraS&P SSO .2 95.62 +3.51 .0842ProShUltSemi USD .1 122.13 +7.07 .0255ProShrUl7-10Trs UST .5 71.97 +0.12 .0797ProShUltSilver AGQ ... 46.54 +2.66 ...ProShUltSC600 SAA .0 129.98 +4.03 .0318ProShUltTech ROM .0 77.30 +7.66 .0344ProShUltTelecom LTL 1.4 43.36 +0.52 .1961ProShUlt20YrTr UBT .6 57.19 –0.07 .1599ProShrUltraUtil UPW .8 57.04 –0.33 .2117ProShUltraYen YCL ... 59.13 +0.02 ...ProShUltDow30 UDOW .2 106.64 +1.83 .1112ProShUltMC400 UMDD .1 122.54 +5.67 .0229ProShUltRus2000 URTY .0 102.53 +5.85 .0027ProShUltS&P500 UPRO .1 82.21 +4.46 .0265ProShUltShtDow30 SDOW .5 12.17 –0.25 .0662ProShShtMC400 SMDD .2 10.09 –0.49 .0157ProShShtRus2000 SRTY 1.3 12.85 –0.80 .1659ProShUltS&P500 SPXU .8 27.39 –1.66 .2078ProShUltShrt20YTr TTT .3 33.60 –0.03 .0867ProShUltShtAUD CROC ... 43.79 –0.14 ...ProShUSBscMtls SMN ... 9.45 +0.25 ...ProShUltBloomCrd SCO ... 10.19 +0.06 ...ProShUltShBlmGas KOLD ... 48.96 +8.12 ...ProShUSCnsmrGd SZK .2 8.48 –0.21 .0168ProShUSCnsmrSvc SCC .1 11.45 –0.63 .0069ProShUltDow30 DXD .3 12.11 –0.16 .0384ProShUltShEuro EUO ... 22.75 –0.27 ...ProShUltChina50 FXP .1 25.95 –3.60 .0207ProShrUltShFTSEEur EPV .1 15.29 –0.44 .0143ProShUltShFin SKF .1 15.36 +0.22 .0168ProShUltShGold GLL ... 32.50 –1.04 ...ProShrUSHlthCr RXD .2 8.72 –0.18 .0167ProShUltShIndls SIJ ... 9.84 –0.12 ...ProShUltra7-10 PST .1 15.81 –0.01 .0175ProShUltBrazil BZQ .2 9.39 +0.89 .0185ProShrUSMSCIEAFE EFU .1 12.16 –0.28 .0083ProShUltMSCIEM EEV .2 15.33 –0.87 .0261ProShrUSMSCI Jpn EWV ... 13.87 –0.23 ...ProShUltMC400 MZZ .3 11.43 –0.37 .0287ProShrUSOilGas DUG .1 22.84 +0.63 .0289ProShUltShtQQQ QID 1.0 26.18 –2.42 .2617ProShrUSRlEst SRS .2 12.19 –0.40 .0237ProShUltShRus2000 TWM .5 16.46 –0.70 .083ProShUltShtS&P500 SDS .5 11.79 –0.47 .0569ProShrUSSemi SSG .4 11.55 –0.81 .0472ProShUltShtSilver ZSL ... 7.12 –0.45 ...ProShUlShtSC600 SDD ... 8.14 –0.30 ...ProShrUSTech REW .3 13.12 –1.59 .0388ProShUltraSh20+ TBT .3 17.68 ... .0003ProShrUSUtil SDP .1 18.33 +0.08 .0236ProShUltShtYen YCS ... 68.50 –0.10 ...Qraft AIUSHiDiv HDIV 2.2 27.52 ... .147QRAFTAIUSLC QRFT .0 39.96 +1.19 .6683QRAFTAIUSLCMom AMOM .1 33.24 +1.00 7.7737QraftAINxtValue NVQ .1 29.05 +0.56 .008QuadIntRtVol IVOL 3.4 28.45 +0.18 .084RoboGlbAI THNQ ... 42.60 +1.54 ...RoboGlbHlthTch HTEC ... 48.28 +1.43 ...RoboGlblRobotics ROBO .2 67.37 +2.09 .1192RPARRiskParity RPAR .8 24.03 +0.22 .0756RayliantQuanCn RAYC ... 27.90 +0.81 ...RealEstSectorSPDR XLRE 3.1 36.82 +0.48 .4663RenaissanceIPO IPO .1 70.83 +2.56 .0657RenaissanceIntlIPO IPOS .4 39.26 +2.27 .2031RivFrDynCoreIncm RFCI 1.9 25.94 –0.05 .0378RivFrDynUSDiv RFDA 1.5 38.88 +0.44 .0775RivFrDynUSFlex RFFC 1.4 40.51 +0.86 .0464RivFrDynUnconInc RFUN 4.2 25.68 –0.10 .0953RivFrStratIncm RIGS 3.4 24.71 –0.09 .0575
RoundAcqDpVal DEEP 3.7 30.16 +0.17 .1425RoundBitEsports NERD .3 33.81 +1.75 .3167RoundSportsBet BETZ .2 29.46 +0.79 .0714SPAC&NewIssueETF SPCX ... 30.17 +2.09 ...SPDRBlackstoneSrLn SRLN 4.9 46.09 +0.03 .16SPDRBloomBarCvSecs CWB 2.2 87.58 +1.50 .9219SPDRBBCpBd SPBO 2.8 35.70 –0.10 .0361SPDRBloomBarEMLoBd EBND 3.7 27.74 –0.04 .0847SPDRBlmBarcHYBd JNK 5.1 108.94 +0.25 .4316SPDRBloomBarInCpBd IBND .5 37.61 +0.23 .0125SPDRBlmBarIntTrBd BWX 1.0 30.95 –0.03 .0235SPDRBlmBarInvGrdFR FLRN 1.2 30.64 ... .0137SPDRBloomBarc1-10Y TIPX 1.7 20.99 +0.07 .0214SPDRBloomBar1-3MTB BIL .3 91.51 –0.01 .0033SPDRBloomBarSTHYBd SJNK 5.3 27.06 +0.08 .1128SPDRBloomBarSTInTr BWZ .1 32.62 +0.06 .0021SPDR3-12MT-Bill BILS ... 100.08 ... ...SPDRBlSASBCpBd RBND 1.6 25.14 –0.04 .0394SPDRDoubleTRTact TOTL 2.9 49.28 +0.06 .1899SPDRDJGlbRealEst RWO 3.3 44.49 +0.41 .5151SPDREUROSTOXXSC SMEZ 1.4 73.25 +1.02 .6465SPDRIntGovBd WIP 1.6 57.94 –0.15 .1696SPDRFactSetInnTech XITK .1 230.43 +10.79 .1274SPDRGlobalDow DGT 1.9 99.45 –0.01 .6483SPDRGoldMini GLDM ... 18.46 +0.29 ...SPDRGold GLD ... 173.90 +2.77 ...SPDRMFSSysCore SYE 1.1 101.08 +2.71 .3326SPDRMFSSysGrowth SYG .5 121.06 +5.10 .1049SPDRMFSSysValueEqu SYV 1.7 73.10 +0.30 .2132SPDRACWILowCarbon LOWC 1.5 117.86 +2.22 1.0345SPDREAFEFossilFr EFAX 1.7 79.77 +0.99 .6562SPDRMSCIEAFEStrat QEFA 1.8 71.55 +0.59 .739SPDREMFossilFuelFr EEMX 1.3 83.96 +2.83 .3338SPDRMSCIEMStrat QEMM 2.3 69.04 +1.00 1.1371SPDRMSCIUSAStrat QUS 1.7 106.05 +1.01 1.0337SPDRMSCIWorldStrat QWLD 1.7 94.30 +1.05 .7846SPDRNYSETech XNTK .3 151.08 +5.73 .08SPDRNuvBBHYMuni HYMB 3.5 59.71 +0.26 .17SPDRNuveenMuniBd TFI 1.9 52.34 +0.01 .0633SPDRNuveenSTMuniBd SHM 1.2 49.81 +0.07 .0406SPDRPtfAggBd SPAB 2.4 30.55 ... .0572SPDRPtfDevxUS SPDW 1.8 34.93 +0.40 .3247SPDRPtfEM SPEM 1.8 45.16 +1.12 .5119SPDRPtfEurope SPEU 2.2 38.69 +0.51 .2256SPDRPtfHYBd SPHY 5.6 26.61 +0.11 .1101SPDRPtfIntermCpBd SPIB 2.2 36.99 –0.01 .0544SPDRPtfIntTrea SPTI .8 32.90 +0.02 .0097SPDRPtfLTCorpBd SPLB 3.1 32.15 –0.15 .0747SPDRPtfLgTermTrea SPTL 1.8 43.49 –0.01 .0553SPDRPtfGSM SPGM 1.4 51.02 +0.92 .4474SPDRPtfMtgBkdBd SPMB 2.9 26.42 +0.01 .0632SPDRS&P500Value SPYV 2.3 34.98 –0.20 .194SPDRPtfS&P1500 SPTM 1.5 47.42 +0.89 .204SPDRPtfS&P500 SPLG 1.5 45.00 +0.84 .1812SPDRS&P500Growth SPYG .9 56.89 +2.26 .1311SPDRS&P500HiDiv SPYD 4.7 34.45 –0.33 .6066SPDRPtfS&P400MC SPMD 1.2 43.16 +0.69 .1671SPDRPtfS&P600SC SPSM 1.1 39.36 +0.59 .1526SPDRPtfSTCpBd SPSB 1.9 31.38 –0.01 .038SPDRShtTermTrea SPTS .7 30.70 +0.02 .0121SPDRPtfTIPS SPIP 2.0 31.15 +0.14 .0122SPDRRuss1000LowVol ONEV 1.8 92.40 +0.49 .5906SPDRRuss1000Mom ONEO 1.2 88.60 +0.95 .3306SPDRRuss1000Yd ONEY 2.6 79.68 +0.22 .6839SPDRMomentumTilt MMTM 1.1 166.21 +5.37 .4503SPDRS&P1500ValTilt VLU 1.9 127.27 +0.80 .5774SPDRS&P500MidGr MDYG .7 74.69 +1.82 .1937SPDRS&P400MidVl MDYV 1.6 58.71 +0.38 .2428SPDRS&P600SmallCap SLY 1.0 87.63 +1.48 .3346SPDRS&P600SCpGr SLYG .6 84.13 +1.94 .23SPDRS&P600SCapVal SLYV 1.3 72.78 +0.55 .2895SPDRAero Dfns XAR .6 119.31 +1.09 .1034SPDRS&PBank KBE 2.2 45.44 –0.60 .2993SPDRS&PCapitalMkts KCE 2.1 77.94 –0.59 .652SPDREmMktsDiv EDIV 3.4 28.61 –0.09 .0719SPDRS&PEMSC EWX 2.2 52.78 +0.27 .8081SPDRS&P500ESG EFIV 1.3 35.81 +0.89 .1436SPDRS&P500Fossil SPYX 1.3 94.75 +1.93 .331SPDRS&PGlbDividend WDIV 5.4 62.29 –0.24 1.3575SPDRS&PGlbInfr GII 2.6 50.18 –0.54 .7792SPDRS&PGlbNatRes GNR 2.6 47.86 –0.03 .4833SPDRS&PHlthCareEqp XHE ... 122.44 +3.24 ...SPDRS&PHlthCareSvs XHS .2 105.27 +2.30 .0916SPDRS&PInsurance KIE 1.8 33.89 –0.38 .196SPDRS&PInternetETF XWEB .4 171.19 +8.25 .2548SPDRS&PKenCleanPwr CNRG .5 144.66 +16.66 .1172SPDRS&PKenFinalFr ROKT .5 39.69 +0.01 .065SPDRS&PKenFut FITE .8 48.97 +1.11 .076SPDRS&PKenInt SIMS .5 45.69 +0.64 .0692SPDRS&PKenNewEc KOMP .6 68.19 +4.07 .2031SPDRS&PKenSmart HAIL .4 65.55 +4.00 .0217SPDRS&PNAmNatlRscs NANR 2.6 35.20 –0.31 .3404SPDRS&POil&GasEq XES 1.2 51.03 –1.84 .0689SPDRS&PRegionalBkg KRE 2.5 57.96 –0.43 .395SPDRS&PSft&Svs XSW .2 160.72 +3.83 .0519SPDRS&PTelecom XTL .8 93.58 +2.56 .2464SPDRS&PTransport XTN .7 74.23 +0.39 .20SPDRSSGAFxScRt FISR 2.5 31.75 –0.06 .2312SPDRGenderDivers SHE 1.2 91.56 +1.38 .2869SPDRUSLCLowVol LGLV 2.0 119.03 +0.50 .9641SPDRSSGAUS XLSR 1.2 41.03 +0.83 .153SPDRUSSCLowVol SMLV 2.3 101.93 +1.49 1.0779SPDRSolactCda ZCAN 2.5 65.20 –0.34 .7592SPDRSolactGermany ZDEU 2.7 65.25 +1.49 1.055SPDRSolactHK ZHOK 2.1 70.58 +1.55 .6809SPDRSolactJpn ZJPN 1.7 90.76 +0.70 .7031SPDRSolactUK ZGBR 2.7 47.80 +0.15 .6751SPDRSSgAGlbAll GAL 2.1 43.63 +0.48 .3629SPDRSSgAIncmAllctn INKM 3.8 34.19 +0.05 .4799SPDRSSgAMultiAsset RLY 2.1 25.32 –0.08 .2609SPDRSSgAUltraShrt ULST 1.3 40.47 –0.02 .0269SPFdsDJGlbSukuk SPSK 2.1 20.37 +0.05 .042SPFdsS&P500Sharia SPUS 1.0 26.10 +0.85 .026SPFdsS&PGlShar SPRE ... 20.37 +0.44 ...SchwabEMEquity SCHE 1.9 33.03 +0.87 .5342Schwab5-10YCpBd SCHI 2.3 53.20 –0.11 .0913SchwabFundEmgLrg FNDE 2.4 29.51 –0.25 .5603SchwabFundIntLrgCo FNDF 2.1 30.68 +0.21 .4378SchwabFundIntlSmCo FNDC 1.7 35.90 +0.43 .4901SchwabFundUSBrd FNDB 2.1 47.01 +0.41 .2338SchwabFundUSLrgCo FNDX 2.2 47.26 +0.35 .2388SchwabFundUSSmCo FNDA 1.2 46.37 +0.50 .0511SchwabIntmUSTrsr SCHR 1.6 57.93 +0.05 .0471SchwabIntEquity SCHF 2.0 37.16 +0.32 .5097SchwabIntlSC SCHC 1.6 38.49 +0.55 .6089SchwabLTUSTrea SCHQ 1.6 52.81 –0.02 .0625Schwab1-5YCpBd SCHJ 1.7 51.33 +0.01 .4777Schwab1000Index SCHK 1.5 38.42 +0.74 .1473SchwabSrtTRmUSTrsr SCHO 1.3 51.40 +0.02 .0293SchwabUSAggrBd SCHZ 2.4 55.62 +0.02 .1059SchwabUSBrdMkt SCHB 1.6 93.94 +1.78 .3646SchwabUSDiv SCHD 3.1 65.72 –0.15 .6015SchwabUSLC SCHX 1.6 93.41 +1.77 .3689SchwabUSLCGrw SCHG .5 132.23 +5.69 .1689
SchwabUSLCVal SCHV 3.0 60.93 –0.17 .3795SchwabUSMC SCHM 1.2 72.01 +0.96 .0549SchwabUSREIT SCHH 2.8 38.19 +0.48 .1185SchwabUSSC SCHA 1.0 97.00 +1.49 .3033SchwabUSTIPs SCHP 1.1 62.14 +0.27 .1261SimplUSConvex SPYC 1.6 27.71 +0.64 .1079SimplUSPlusDown SPD 1.7 27.53 +0.54 .1162SimplUSPlusUp SPUC 2.9 27.78 +0.67 .2029SimplifyVoltCloud VCLO ... 12.56 +0.05 ...SimplifyVoltFin VFIN ... 13.32 –0.04 ...SimplifyVoltPop VPOP ... 12.99 +0.52 ...SimplifyVoltRobo VCAR ... 14.82 +0.07 ...6MeridianHdg SIXH 1.9 27.16 –0.05 .05526MeridianLowBeta SIXL .7 31.75 +0.54 .03616MeridianMega SIXA 1.7 30.69 +0.32 .08426MeridianSC SIXS .7 41.58 +0.87 .0572SmartAdvertising MRAD ... 28.01 +1.51 ...SmartTransport MOTO .2 44.64 +1.16 1.02SoFi50ETF SFYF .4 29.44 +0.83 .0321SoFiNext500 SFYX 1.1 13.14 +0.21 .0881SoFiSelect500 SFY 1.1 14.20 +0.29 .083SoFiWeeklyIncm TGIF .8 103.96 +0.16 .05SoundEnhFixed SDEF ... 19.99 +0.14 ...SoundEquIncm SDEI ... 20.94 –0.08 ...SPDRDJRlEst RWX 3.0 33.57 +0.02 .2286SPDRDJREIT RWR 3.7 87.58 +0.96 1.2931SPDRDJIATr DIA 1.8 309.97 +1.85 .1275SPDREurSTOXX FEZ 2.1 42.39 +0.43 .2502SPDRMSCIexUS CWI 2.0 29.05 +0.43 .2741SpdrSPIntDiv DWX 3.8 37.02 +0.01 .3027SPDRS&PMdCpTr MDY 1.1 448.48 +7.24 1.4484SPDRS&P500 SPY 1.5 382.88 +7.18 1.58SPDRS&PBiotch XBI .2 152.56 +0.83 .176SPDRSPChina GXC .9 146.15 +8.24 .7905SPDRS&PDiv SDY 2.8 108.54 –0.71 .9868SPDRSPEmAsPac GMF 1.2 139.10 +5.02 1.1135SPDRS&PHome XHB .7 63.56 +3.07 .1182SPDR IntlSC GWX 1.7 36.26 +0.51 .2884SPDRS&PMtlMng XME 1.0 34.50 –0.79 .0819SPDRS&POilGasExpl XOP 2.0 68.05 –1.22 .3007SPDRS&PPharm XPH .5 53.59 –0.10 .0538SPDRS&PRetail XRT .9 74.87 +2.89 .2512SPDRS&PSemi XSD .2 191.72 +8.65 .0991SPDRWelsFrg PSK 5.2 43.77 +0.22 .2565SprottGoldMiners SGDM .3 29.42 +0.30 .0928SprottJrGoldMiners SGDJ 2.1 46.35 +0.59 .9687SterlingCapFocus LCG ... 26.02 +0.56 ...SyntaxStratLC SSPY 1.4 57.79 +0.34 .9121SyntaxStratMC SMDY .8 36.61 +0.33 .301SyntaxStratifiedSC SSLY .4 47.73 +0.95 .1946TRowePriceBlueChip TCHP ... 28.59 +1.07 ...TRowePriceDivGwth TDVG .8 28.49 +0.20 .0762TRowePriceEqIncm TEQI 1.6 30.54 –0.05 .1601TRowePriceGrowth TGRW .0 29.70 +1.14 .0318TechSelectSector XLK .9 132.83 +5.41 .2976TeucriumAgriFd TAGS ... 21.51 –1.43 ...TeucriumCornFd CORN ... 15.85 –1.05 ...TeucriumSoybeanFd SOYB ... 19.48 –1.56 ...TeucriumSugarFd CANE ... 6.90 –0.21 ...TeucriumWheatFd WEAT ... 6.10 –0.34 ...TimothyHiDiv TPHD 2.3 26.65 –0.02 .1208TimothyPlanIntl TPIF 1.7 27.78 +0.22 .054TimothyUSLMC TPLC .8 31.86 +0.28 .0573TimothyUSSC TPSC 1.0 30.00 +0.46 .0999TortoiseNAPipeline TPYP 5.8 18.36 –0.62 .2425TransamDeltaS&PEM DMRE .7 63.31 +2.09 .1947TrendAggCon TACE .2 25.09 +0.33 .0435TrendAggDiv TADS .0 26.73 +0.19 2.617TrendAggGrowth TAAG .0 27.49 +0.27 4.0115TrueESGActOpps ECOZ .4 36.24 +1.01 .136TrueTechAI LRNZ ... 51.17 +2.13 ...UBSFIEnhGlbHY FIHD ... 191.14 +0.66 ...UBSFIEnhLCGrw FBGX ... 583.34 +43.65 ...USCFSummerDynCom SDCI .2 16.36 –0.43 .0332USEquCumDiv2027 IDIV 12.7 10.56 –0.73 .11USEquityxDiv2027 XDIV ... 85.38 +1.68 ...USGlbGOGold GOAU .3 19.12 +0.37 1.0359U.S.GlobalJetsETF JETS .0 22.25 –0.03 .0086USVeganClimate VEGN .7 35.53 +0.77 .0915UtilitiesSelSector XLU 3.1 62.84 –0.15 .5218VanEckMerkGoldTr OUNZ ... 18.07 +0.28 ...VanEckAfrica AFK 3.7 21.52 +0.52 .796VanEckAgribus MOO 1.0 82.69 +0.55 .8564VanEckBDCIncome BIZD 9.9 14.42 +0.18 .3249VanEckBrazilSC BRF 1.8 20.02 –1.32 .3529VanEckChinaGrwth GLCN .1 50.78 +2.02 6.0309VanEckChinaBond CBON 2.9 24.05 –0.08 .0561VanEckSMEChiNxt CNXT .0 53.99 +2.67 .0038VanEckEgypt EGPT 2.3 26.75 +0.12 .625VanEckEMAggBd EMAG 4.3 21.60 –0.05 .0786VanEckEMHYBond HYEM 5.6 23.80 +0.09 .1139VanEckEnerIncm EINC 6.2 44.40 –1.51 .6601VanEckEnvironSvcs EVX .3 124.77 +1.46 .3906VanEckGoldMiner GDX .5 35.23 +0.72 .1899VanEckGreenBd GRNB 2.3 27.82 +0.03 .0455VanEckIndiaGrwth GLIN .2 34.27 –0.07 .0783VanEckIndonesia IDX 1.6 21.40 +0.16 .3429VanEckIntlHYBd IHY 4.6 25.96 +0.16 .0988VanEckInvtGrFR FLTR 1.5 25.37 +0.02 .0175VanEckIsrael ISRA .2 47.26 +1.14 .0763VanEckJPMEMLCBd EMLC 5.0 32.77 –0.04 .1292VanEckJrGold GDXJ 1.7 50.34 +0.99 .8554VanEckLong/Flat LFEQ 2.0 35.48 +0.72 .7143VanEckLowCarbon SMOG .0 191.37 +11.24 .0918VanEckMtgREIT MORT 7.9 17.17 +0.53 .3536VanEckNatRscs HAP 2.3 41.41 +0.17 .9444VanEckOilRefin CRAK 2.5 26.92 +0.57 .66VanEckOilSvcs OIH 1.1 172.01 –6.98 1.8911VanEckPfdSecsxFin PFXF 5.2 20.64 +0.11 .1271VanEckRareEarth REMX .7 81.22 +8.84 .5348VanEckRealAsset RAAX 6.0 23.02 +0.04 1.392VanEckSteel SLX 1.8 46.54 –1.17 .8333VanEckUnOil&Gas FRAK 1.4 87.19 –3.59 1.2069VanEckUranium NLR 2.2 49.79 +0.29 1.0964VangdCnsmrDiscr VCR 1.6 293.83 +7.96 3.7937VangdCnsmrStpls VDC 2.6 169.06 –0.93 1.5724VangdExtMkt VXF 1.0 176.38 +2.98 .8095VangdInfoTech VGT .8 363.79 +14.17 .6898VangdMatrls VAW 1.6 161.60 –1.77 .8238VangdSCGrwth VBK .4 288.28 +6.95 .5023VangdSCVal VBR 1.6 151.65 +0.89 .8762VangdCommSvcs VOX .7 123.54 +5.82 .2219VangdDivApp VIG 1.6 140.97 +0.22 .6644VangdEnergy VDE 4.3 58.01 –1.03 .6029VangdExDurTreas EDV 2.1 144.75 –0.27 6.1046VangdAWxUSSC VSS 1.8 125.02 +1.90 1.9669VangdFTSEDevMk VEA 2.0 48.70 +0.48 .4147VangdFTSEEM VWO 1.8 54.00 +1.50 .3009VangdFTSEEurope VGK 2.1 61.97 +0.72 .3779VangdFTSEPac VPL 1.7 82.36 +0.78 .8822VangdFinls VFH 2.1 75.30 –1.19 .4781VangdFTSEAWxUS VEU 1.9 61.00 +0.87 .4518VangdGrowth VUG .6 259.84 +9.73 .4606
VangdHlthCr VHT 1.2 234.30 +2.00 .8816VangdHiDiv VYM 3.1 94.06 –0.58 .8096VangdIndls VIS 1.4 173.47 +0.62 .6416VangdIntermBd BIV 2.3 92.10 ... .8048VangdLC VV 1.4 180.16 +3.47 .6846VangdLTBond BLV 3.0 106.40 –0.23 3.1317VangdMegaCap MGC 1.4 136.49 +2.93 .608VangdMegaGrwth MGK .6 208.62 +8.84 .4499VangdMegaVal MGV 2.4 88.72 –0.44 .6513VangdMC VO 1.4 213.87 +1.38 .9373VangdMCGrowth VOT .5 218.75 +3.24 .3193VangdMCVal VOE 2.3 123.08 –0.39 .7487VangdRealEst VNQ 3.9 85.77 +1.16 1.3377VangdS&P500ETF VOO 1.5 351.90 +6.53 1.3829VangdS&P500Grw VOOG .9 236.83 +9.42 .6468VangdS&P500Val VOOV 2.4 125.89 –0.61 .9326VangdS&PMC400 IVOO 1.2 165.98 +2.54 .7844VangdS&P400Grwth IVOG .7 192.87 +4.75 1.3201VangdS&P400Val IVOV 2.3 139.31 +1.05 3.1834VangdS&P600 VIOO 1.0 184.70 +2.83 1.8256VangdS&P600Grwth VIOG .6 216.70 +4.91 .6301VangdS&P600Val VIOV 1.3 154.15 +1.10 .7423VangdSTBond BSV 1.8 82.79 +0.03 .1019VangdSC VB 1.1 208.35 +2.99 .8934VangdTaxExemptBd VTEB 2.0 55.21 +0.07 .0829VangdTotalStk VTI 1.4 200.89 +3.83 .7818VangdTotlWrld VT 1.6 95.83 +1.55 .5524VangdUtilities VPU 3.2 137.45 –0.73 1.3295VangdValue VTV 2.5 121.82 –0.51 .7892VesperUSLCShort UTRN 1.1 29.96 +0.36 2.3583VicShUSAACrIntBd UITB 2.4 54.33 +0.11 .1972VicShUSAAShtBd USTB 2.1 51.87 +0.04 .0034VicShUSAAEMVal UEVM 2.1 48.13 +0.94 .0039VicShUSAA IntlVal UIVM 1.7 46.88 +0.61 .0307VicShUSASCVal USVM 1.1 65.56 +1.42 .0108VicShUSAAUSAVal ULVM 1.4 58.23 +0.67 .0019VidentUSBdStrat VBND 2.0 51.78 +0.02 .4735VidentCoreUSEquity VUSE 1.2 37.46 +0.38 .261VidentIntlEquityFd VIDI 2.4 26.04 +0.34 .4101VirtusInfrUSPfd PFFA 8.3 22.38 +0.13 .16VirtusLifeSciBio BBC ... 53.67 –0.15 ...VirtusLifeSciBio BBP ... 57.22 +0.80 ...VirtusNewDynCredit BLHY 3.6 24.48 +0.20 .02VirtusNewMultiBd NFLT 3.6 25.67 +0.10 .0452VirtusPrvCrd VPC 9.4 21.62 +0.34 .6625VirtusRealAsset VRAI 3.8 23.43 –0.08 .3334VirtusReavesUtil UTES 2.1 40.86 –0.08 .25VirtusSeixSrLoan SEIX 4.1 24.86 –0.08 .1589VolsharesLC VSL .8 38.74 +0.54 1.0277WBIBullBrGlbIncm WBII 3.3 24.73 –0.01 .1462WBIBullBrQu3000 WBIL .2 28.32 +0.37 .0084WBIBullBrRsInc300 WBIE .3 28.99 +0.14 .0456WBIBullBrTdUS WBIT 3.2 20.07 +0.07 .3113WBIBullBrTrdUSTR WBIN 4.1 17.21 –0.01 .004WBIBullBrVal3000 WBIF .1 28.15 +0.04 .0237WBIBullBrYd3000 WBIG 1.0 24.06 +0.23 .064WBIPwrFactorHiDiv WBIY 4.8 23.92 –0.33 .4067WedETFMGGlbCld IVES .4 54.80 +2.52 .125WedbushVideoGame GAMR .8 87.42 +5.72 .49WisdTrUSDBull USDU .7 25.12 –0.13 .1726WisdTrCBOES&P500 PUTW 1.4 29.11 +0.33 .4086WisdTrChineseYuan CYB .4 27.43 +0.03 .1118WisdTrEmgCurr CEW .6 18.31 –0.01 .1181WisdTrEMxSOE XSOE .9 43.17 +1.47 .1494WisdTrEMHiDiv DEM 4.1 42.29 –0.45 .2927WisdTrEMLocDebt ELD 4.8 34.05 –0.31 .13WisdTrEMMulti EMMF 1.8 25.80 +0.76 .0935WisdTrEMSC DGS 3.6 48.84 +0.25 .4875WTEnhCmdStrategyFd GCC ... 19.18 –0.11 ...WisdTrEuropeHdg HEDJ 2.6 68.07 +0.34 .3706WisdTrEuropeHdgSM EUSC 3.3 31.92 +0.08 .1841WisdTrEurQualDiv EUDG 1.8 31.26 +0.40 .1108WisdTrEuropeSC DFE 2.4 66.17 +0.36 .3291WisdTrFRTrea USFR .4 25.11 ... .001WisdTrGlbxUSQual DNL 1.7 79.92 +1.36 .3246WisdTrGlbxUSREFd DRW 2.9 25.78 +0.25 .7604WisdTrGlbHiDiv DEW 4.0 43.64 –0.38 .4553WisdTrGrwLdrs PLAT .1 45.39 +2.16 .0474WisdTrIndiaEarn EPI .8 30.05 –0.04 .0807WisdTrIndiaxSOE IXSE .1 30.14 +0.28 .015WisdTrIntDivxFin DOO 3.4 42.14 +0.44 .333WisdTrIntlEquity DWM 2.7 52.13 +0.35 .3337WisdTrIntlHdgQual IHDG 1.9 40.90 +0.56 .354WisdTrIntlHiDiv DTH 3.6 38.61 +0.01 .3455WisdTrIntlLCDiv DOL 2.7 47.24 +0.32 .3204WisdTrIntlMCDiv DIM 2.5 65.57 +0.61 .4005WisdTrIntlMult DWMF 2.0 25.30 +0.22 .1791WisdTrIntlSC DLS 2.5 69.48 +0.53 .4585WisdTrJapanHdg DXJ 2.4 56.36 +0.24 .7923WisdTrJapanSC DFJ 2.6 73.00 +0.08 .9438WisdTrMgdFut WTMF .5 37.49 –0.41 .1728WisdTrMtgPlBdFd MTGP 2.0 51.57 +0.13 .0775WisdTr90/60USBal NTSX .8 37.22 +0.83 .1153WisdTrUSDivxFin DTN 3.5 85.75 +0.09 .0371WisdTrUSHiDiv DHS 4.1 70.05 –0.21 .076WisdTrUSLCDivFd DLN 2.6 108.88 +0.48 .0454WisdTrUSLCFd EPS 1.8 41.18 +0.54 .1997WisdTrUSMCDivFd DON 2.6 36.65 +0.15 .22WisdTrUSMCFd EZM 1.6 46.29 +0.46 .306WisdTrUSQualShr QSY 1.5 104.09 +0.43 .078WisdTrUSSCDiv DES 2.6 28.28 +0.11 .0308WisdTrUSSCFd EES 1.2 42.51 +0.66 .0304WisdTrUSTotalDivFd DTD 2.7 106.85 +0.50 .0419WisdTrUSTMFd RESP 1.3 42.44 +1.02 .1428WisdTrYdUSAggBd AGGY 2.5 53.22 –0.04 .1075XtrkrsFTSEDevXus DEEF 2.6 30.88 +0.42 .1551XtrkrsHarvCSI300 ASHR .8 42.81 +0.67 .3248XtrkrsHarvCSI500 ASHS .4 36.90 +1.16 .1531XtrkrsHiBetHYBd HYUP 6.9 48.32 +0.12 .6114XtrkIntlRealEst HAUZ 3.4 26.55 +0.08 .5446XtrkrsJpnJPXNik400 JPN 1.9 33.45 +0.15 .3597XtrrsLowBetHYBd HYDW 4.5 50.73 +0.07 .2454XtrkACWIxUSESGLd ACSG 1.7 32.94 +0.70 .2942XtrkrsMSCIAllChina CN .7 49.83 +2.40 .3499XtrkrsMSCIAWxUS HDAW 4.1 25.02 +0.09 .2432XtrkrsMSCIAWxUS DBAW 2.0 31.85 +0.39 .3964XtrkMChinaAIncl ASHX .7 31.72 +0.68 .2365XtrkESGLeaders EASG 1.7 29.89 +0.31 .2343XtrkrsMSCIHiDiv HDEF 3.8 23.91 +0.09 .2952XtrkrsMSCIEAFE DBEF 2.3 34.69 +0.20 .3718XtrkrsMSCIEMESG EMSG 1.3 36.01 +1.48 .1646XtrkrsMSCIEM DBEM 1.6 29.81 +1.00 .3725XtrkrsMSCIEurope DBEU 2.4 30.86 +0.11 .3359XtrkrsMSCIEurozone DBEZ 1.9 33.75 +0.19 .372XtrkrsMSCIGermany DBGR 2.8 29.66 +0.45 .4734XtrkrsMSCIJapan DBJP 2.4 47.30 +0.34 .01XtrkMSCIKokusai KOKU .5 73.48 +1.18 .3715XtrkUSAESGLdrs USSG 1.4 34.89 +0.52 .1553XtrkrsMuniInfra RVNU 2.4 29.26 +0.07 .0374XtrkrsRussell1000 DEUS 1.6 39.74 +0.27 .212XtrkRuss1000USQu QARP 1.6 34.85 +0.59 .1718XtrkS&P500ESG SNPE 1.4 33.65 +0.77 .1416XtrkrsShDurHYBd SHYL 6.1 47.66 +0.12 .3438XtrkrsUSDHYCorpBd HYLB 5.2 50.12 +0.13 .2014
Tick DivName Sym Yld Last Chg. Amt.
Tick DivName Sym Yld Last Chg. Amt.
Tick DivName Sym Yld Last Chg. Amt.
Tick DivName Sym Yld Last Chg. Amt.
Tick DivName Sym Yld Last Chg. Amt.
Tick DivName Sym Yld Last Chg. Amt.
Exchange-Traded Portfolios
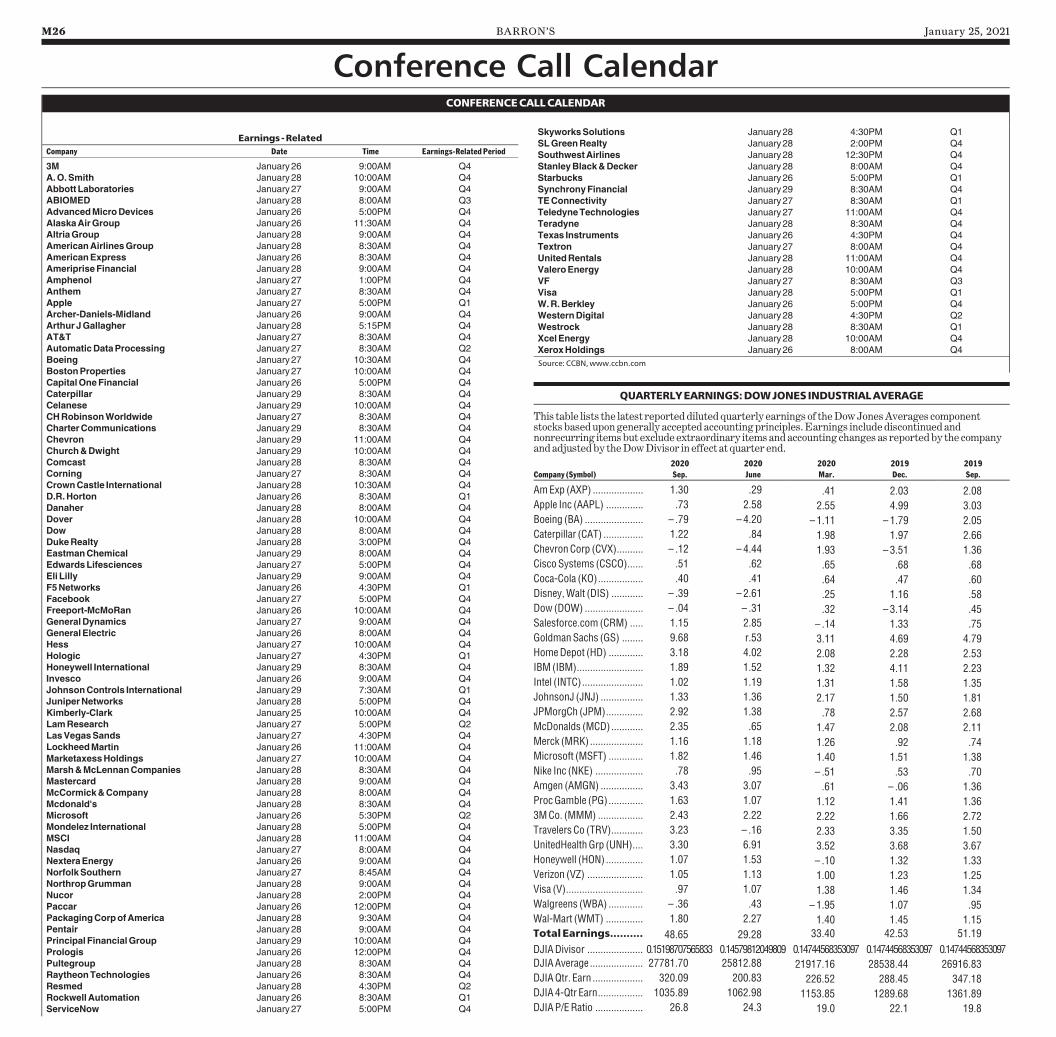
M26 BARRON’S January 25, 2021
Conference Call CalendarCONFERENCECALLCALENDAR
Earnings -RelatedCompany Date Time Earnings-RelatedPeriod
3M January26 9:00AM Q4
A.O.Smith January28 10:00AM Q4
AbbottLaboratories January27 9:00AM Q4
ABIOMED January28 8:00AM Q3
AdvancedMicroDevices January26 5:00PM Q4
AlaskaAirGroup January26 11:30AM Q4
AltriaGroup January28 9:00AM Q4
AmericanAirlinesGroup January28 8:30AM Q4
AmericanExpress January26 8:30AM Q4
AmeripriseFinancial January28 9:00AM Q4
Amphenol January27 1:00PM Q4
Anthem January27 8:30AM Q4
Apple January27 5:00PM Q1
Archer-Daniels-Midland January26 9:00AM Q4
ArthurJGallagher January28 5:15PM Q4
AT&T January27 8:30AM Q4
AutomaticDataProcessing January27 8:30AM Q2
Boeing January27 10:30AM Q4
BostonProperties January27 10:00AM Q4
CapitalOneFinancial January26 5:00PM Q4
Caterpillar January29 8:30AM Q4
Celanese January29 10:00AM Q4
CHRobinsonWorldwide January27 8:30AM Q4
CharterCommunications January29 8:30AM Q4
Chevron January29 11:00AM Q4
Church&Dwight January29 10:00AM Q4
Comcast January28 8:30AM Q4
Corning January27 8:30AM Q4
CrownCastle International January28 10:30AM Q4
D.R.Horton January26 8:30AM Q1
Danaher January28 8:00AM Q4
Dover January28 10:00AM Q4
Dow January28 8:00AM Q4
DukeRealty January28 3:00PM Q4
EastmanChemical January29 8:00AM Q4
EdwardsLifesciences January27 5:00PM Q4
Eli Lilly January29 9:00AM Q4
F5Networks January26 4:30PM Q1
Facebook January27 5:00PM Q4
Freeport-McMoRan January26 10:00AM Q4
GeneralDynamics January27 9:00AM Q4
GeneralElectric January26 8:00AM Q4
Hess January27 10:00AM Q4
Hologic January27 4:30PM Q1
Honeywell International January29 8:30AM Q4
Invesco January26 9:00AM Q4
JohnsonControls International January29 7:30AM Q1
JuniperNetworks January28 5:00PM Q4
Kimberly-Clark January25 10:00AM Q4
LamResearch January27 5:00PM Q2
LasVegasSands January27 4:30PM Q4
LockheedMartin January26 11:00AM Q4
MarketaxessHoldings January27 10:00AM Q4
Marsh&McLennanCompanies January28 8:30AM Q4
Mastercard January28 9:00AM Q4
McCormick&Company January28 8:00AM Q4
Mcdonald's January28 8:30AM Q4
Microsoft January26 5:30PM Q2
Mondelez International January28 5:00PM Q4
MSCI January28 11:00AM Q4
Nasdaq January27 8:00AM Q4
NexteraEnergy January26 9:00AM Q4
NorfolkSouthern January27 8:45AM Q4
NorthropGrumman January28 9:00AM Q4
Nucor January28 2:00PM Q4
Paccar January26 12:00PM Q4
PackagingCorpofAmerica January28 9:30AM Q4
Pentair January28 9:00AM Q4
PrincipalFinancialGroup January29 10:00AM Q4
Prologis January26 12:00PM Q4
Pultegroup January28 8:30AM Q4
RaytheonTechnologies January26 8:30AM Q4
Resmed January28 4:30PM Q2
RockwellAutomation January26 8:30AM Q1
ServiceNow January27 5:00PM Q4
SkyworksSolutions January28 4:30PM Q1
SLGreenRealty January28 2:00PM Q4
SouthwestAirlines January28 12:30PM Q4
StanleyBlack&Decker January28 8:00AM Q4
Starbucks January26 5:00PM Q1
SynchronyFinancial January29 8:30AM Q4
TEConnectivity January27 8:30AM Q1
TeledyneTechnologies January27 11:00AM Q4
Teradyne January28 8:30AM Q4
Texas Instruments January26 4:30PM Q4
Textron January27 8:00AM Q4
UnitedRentals January28 11:00AM Q4
ValeroEnergy January28 10:00AM Q4
VF January27 8:30AM Q3
Visa January28 5:00PM Q1
W.R.Berkley January26 5:00PM Q4
WesternDigital January28 4:30PM Q2
Westrock January28 8:30AM Q1
XcelEnergy January28 10:00AM Q4
XeroxHoldings January26 8:00AM Q4
Source:CCBN,www.ccbn.com
QUARTERLYEARNINGS:DOWJONES INDUSTRIALAVERAGE
This table lists the latest reporteddilutedquarterly earnings of theDowJonesAverages componentstocksbasedupongenerally accepted accountingprinciples.Earnings includediscontinuedandnonrecurring itemsbut exclude extraordinary itemsandaccounting changes as reportedby the companyandadjustedby theDowDivisor in effect at quarter end.
2020 2020 2020 2019 2019
Company (Symbol) Sep. June Mar. Dec. Sep.
AmExp (AXP) ................... 1.30 .29 .41 2.03 2.08Apple Inc (AAPL) .............. .73 2.58 2.55 4.99 3.03Boeing (BA) ...................... – .79 – 4.20 – 1.11 – 1.79 2.05Caterpillar (CAT) ............... 1.22 .84 1.98 1.97 2.66ChevronCorp (CVX).......... – .12 – 4.44 1.93 – 3.51 1.36CiscoSystems (CSCO)...... .51 .62 .65 .68 .68Coca-Cola (KO)................. .40 .41 .64 .47 .60Disney,Walt (DIS) ............ – .39 – 2.61 .25 1.16 .58Dow (DOW) ...................... – .04 – .31 .32 – 3.14 .45Salesforce.com (CRM) ..... 1.15 2.85 – .14 1.33 .75GoldmanSachs (GS) ........ 9.68 r.53 3.11 4.69 4.79HomeDepot (HD) ............. 3.18 4.02 2.08 2.28 2.53IBM (IBM)......................... 1.89 1.52 1.32 4.11 2.23Intel (INTC)....................... 1.02 1.19 1.31 1.58 1.35JohnsonJ (JNJ) ................ 1.33 1.36 2.17 1.50 1.81JPMorgCh (JPM).............. 2.92 1.38 .78 2.57 2.68McDonalds (MCD)............ 2.35 .65 1.47 2.08 2.11Merck (MRK).................... 1.16 1.18 1.26 .92 .74Microsoft (MSFT) ............. 1.82 1.46 1.40 1.51 1.38Nike Inc (NKE) .................. .78 .95 – .51 .53 .70Amgen (AMGN) ................ 3.43 3.07 .61 – .06 1.36ProcGamble (PG)............. 1.63 1.07 1.12 1.41 1.363MCo. (MMM) ................. 2.43 2.22 2.22 1.66 2.72Travelers Co (TRV)............ 3.23 – .16 2.33 3.35 1.50UnitedHealthGrp (UNH).... 3.30 6.91 3.52 3.68 3.67Honeywell (HON).............. 1.07 1.53 – .10 1.32 1.33Verizon (VZ) ..................... 1.05 1.13 1.00 1.23 1.25Visa (V)............................. .97 1.07 1.38 1.46 1.34Walgreens (WBA) ............. – .36 .43 – 1.95 1.07 .95Wal-Mart (WMT) .............. 1.80 2.27 1.40 1.45 1.15TotalEarnings.......... 48.65 29.28 33.40 42.53 51.19
DJIADivisor ..................... 0.15198707565833 0.14579812049809 0.14744568353097 0.14744568353097 0.14744568353097DJIAAverage.................... 27781.70 25812.88 21917.16 28538.44 26916.83DJIAQtr. Earn ................... 320.09 200.83 226.52 288.45 347.18DJIA 4-Qtr Earn................. 1035.89 1062.98 1153.85 1289.68 1361.89DJIAP/ERatio .................. 26.8 24.3 19.0 22.1 19.8
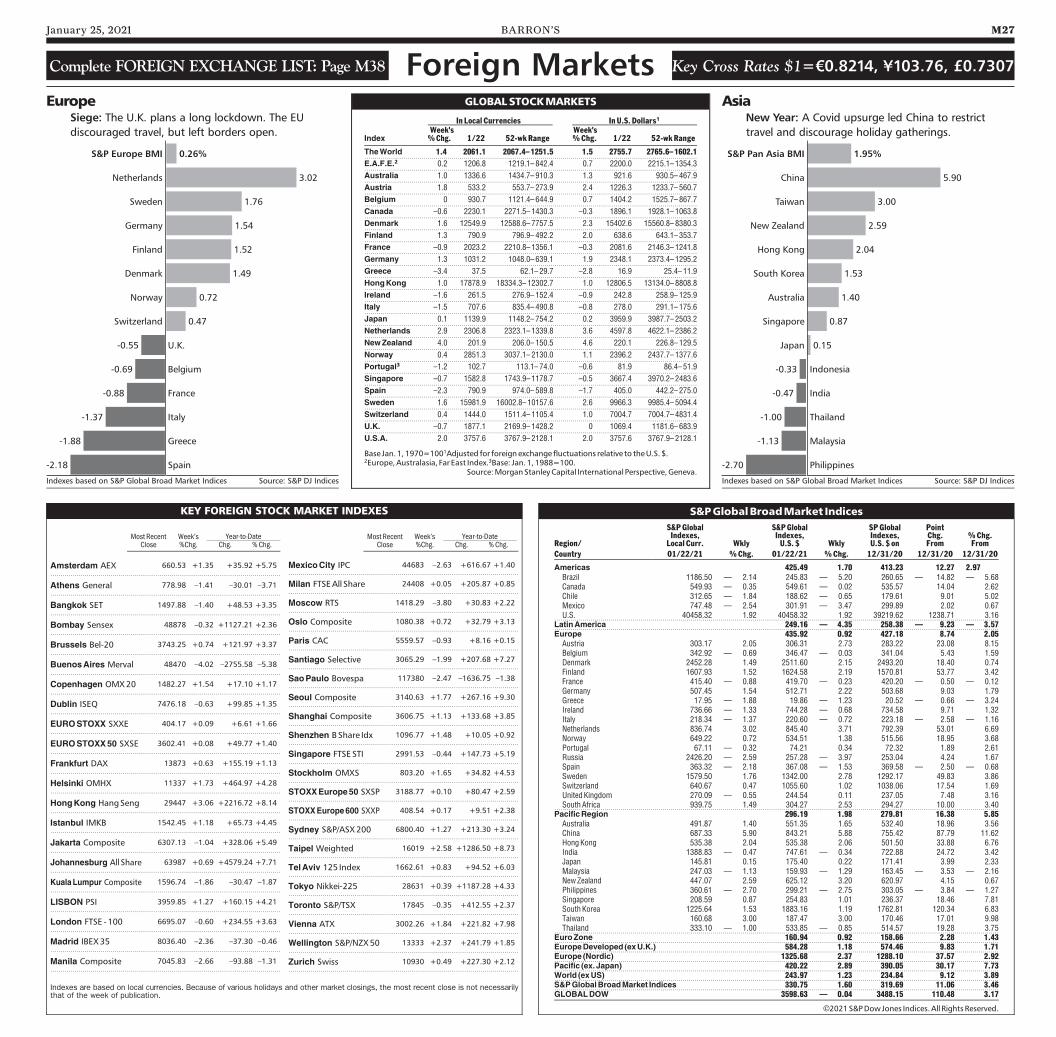
January 25, 2021 BARRON’S M27
Foreign MarketsComplete FOREIGN EXCHANGE LIST: Page M38 Key Cross Rates $1=€0.8214, ¥103.76, £0.7307
GLOBALSTOCKMARKETS
In Local Currencies InU.S.Dollars1Week's Week's
Index %Chg. 1/22 52-wkRange %Chg. 1/22 52-wkRangeTheWorld 1.4 2061.1 2067.4– 1251.5 1.5 2755.7 2765.6– 1602.1E.A.F.E.2 0.2 1206.8 1219.1– 842.4 0.7 2200.0 2215.1– 1354.3
Australia 1.0 1336.6 1434.7– 910.3 1.3 921.6 930.5– 467.9
Austria 1.8 533.2 553.7– 273.9 2.4 1226.3 1233.7– 560.7
Belgium 0 930.7 1121.4– 644.9 0.7 1404.2 1525.7– 867.7
Canada –0.6 2230.1 2271.5– 1430.3 –0.3 1896.1 1928.1– 1063.8
Denmark 1.6 12549.9 12588.6– 7757.5 2.3 15402.6 15560.8– 8380.3
Finland 1.3 790.9 796.9– 492.2 2.0 638.6 643.1– 353.7
France –0.9 2023.2 2210.8– 1356.1 –0.3 2081.6 2146.3– 1241.8
Germany 1.3 1031.2 1048.0– 639.1 1.9 2348.1 2373.4– 1295.2
Greece –3.4 37.5 62.1– 29.7 –2.8 16.9 25.4– 11.9
HongKong 1.0 17878.9 18334.3– 12302.7 1.0 12806.5 13134.0– 8808.8
Ireland –1.6 261.5 276.9– 152.4 –0.9 242.8 258.9– 125.9
Italy –1.5 707.6 835.4– 490.8 –0.8 278.0 291.1– 175.6
Japan 0.1 1139.9 1148.2– 754.2 0.2 3959.9 3987.7– 2503.2
Netherlands 2.9 2306.8 2323.1– 1339.8 3.6 4597.8 4622.1– 2386.2
NewZealand 4.0 201.9 206.0– 150.5 4.6 220.1 226.8– 129.5
Norway 0.4 2851.3 3037.1– 2130.0 1.1 2396.2 2437.7– 1377.6
Portugal3 –1.2 102.7 113.1– 74.0 –0.6 81.9 86.4– 51.9
Singapore –0.7 1582.8 1743.9– 1178.7 –0.5 3667.4 3970.2– 2483.6
Spain –2.3 790.9 974.0– 589.8 –1.7 405.0 442.2– 275.0
Sweden 1.6 15981.9 16002.8– 10157.6 2.6 9966.3 9985.4– 5094.4
Switzerland 0.4 1444.0 1511.4– 1105.4 1.0 7004.7 7004.7– 4831.4
U.K. –0.7 1877.1 2169.9– 1428.2 0 1069.4 1181.6– 683.9
U.S.A. 2.0 3757.6 3767.9– 2128.1 2.0 3757.6 3767.9– 2128.1
Base Jan. 1, 1970=1001Adjusted for foreignexchange fluctuations relative to theU.S. $.2Europe,Australasia, Far East Index.3Base: Jan. 1, 1988=100.
Source:MorganStanleyCapital International Perspective,Geneva.
KEY FOREIGN STOCK MARKET INDEXES
Amsterdam AEX 660.53 +1.35 +35.92 +5.75
Athens General 778.98 –1.41 –30.01 –3.71
Bangkok SET 1497.88 –1.40 +48.53 +3.35
Bombay Sensex 48878 –0.32 +1127.21 +2.36
Brussels Bel-20 3743.25 +0.74 +121.97 +3.37
BuenosAires Merval 48470 –4.02 –2755.58 –5.38
Copenhagen OMX20 1482.27 +1.54 +17.10 +1.17
Dublin ISEQ 7476.18 –0.63 +99.85 +1.35
EUROSTOXX SXXE 404.17 +0.09 +6.61 +1.66
EUROSTOXX50 SXSE 3602.41 +0.08 +49.77 +1.40
Frankfurt DAX 13873 +0.63 +155.19 +1.13
Helsinki OMHX 11337 +1.73 +464.97 +4.28
HongKong HangSeng 29447 +3.06 +2216.72 +8.14
Istanbul IMKB 1542.45 +1.18 +65.73 +4.45
Jakarta Composite 6307.13 –1.04 +328.06 +5.49
Johannesburg All Share 63987 +0.69 +4579.24 +7.71
KualaLumpur Composite 1596.74 –1.86 –30.47 –1.87
LISBON PSI 3959.85 +1.27 +160.15 +4.21
London FTSE -100 6695.07 –0.60 +234.55 +3.63
Madrid IBEX35 8036.40 –2.36 –37.30 –0.46
Manila Composite 7045.83 –2.66 –93.88 –1.31
MexicoCity IPC 44683 –2.63 +616.67 +1.40
Milan FTSEAll Share 24408 +0.05 +205.87 +0.85
Moscow RTS 1418.29 –3.80 +30.83 +2.22
Oslo Composite 1080.38 +0.72 +32.79 +3.13
Paris CAC 5559.57 –0.93 +8.16 +0.15
Santiago Selective 3065.29 –1.99 +207.68 +7.27
SaoPaulo Bovespa 117380 –2.47 –1636.75 –1.38
Seoul Composite 3140.63 +1.77 +267.16 +9.30
Shanghai Composite 3606.75 +1.13 +133.68 +3.85
Shenzhen BShare Idx 1096.77 +1.48 +10.05 +0.92
Singapore FTSESTI 2991.53 –0.44 +147.73 +5.19
Stockholm OMXS 803.20 +1.65 +34.82 +4.53
STOXXEurope50 SXSP 3188.77 +0.10 +80.47 +2.59
STOXXEurope600 SXXP 408.54 +0.17 +9.51 +2.38
Sydney S&P/ASX200 6800.40 +1.27 +213.30 +3.24
Taipel Weighted 16019 +2.58 +1286.50 +8.73
TelAviv 125 Index 1662.61 +0.83 +94.52 +6.03
Tokyo Nikkei-225 28631 +0.39 +1187.28 +4.33
Toronto S&P/TSX 17845 –0.35 +412.55 +2.37
Vienna ATX 3002.26 +1.84 +221.82 +7.98
Wellington S&P/NZX50 13333 +2.37 +241.79 +1.85
Zurich Swiss 10930 +0.49 +227.30 +2.12
Most Recent Week’s Year-to-DateClose %Chg. Chg. %Chg.
Most Recent Week’s Year-to-DateClose %Chg. Chg. %Chg.
Indexes are based on local currencies. Because of various holidays and other market closings, the most recent close is not necessarilythat of the week of publication.
S&PGlobalBroadMarket IndicesS&PGlobal S&PGlobal SPGlobal PointIndexes, Indexes, Indexes, Chg. %Chg.
Region/ Local Curr. Wkly U.S. $ Wkly U.S. $ on From FromCountry 01/22/21 %Chg. 01/22/21 %Chg. 12/31/20 12/31/20 12/31/20Americas 425.49 1.70 413.23 12.27 2.97Brazil 1186.50 — 2.14 245.83 — 5.20 260.65 — 14.82 — 5.68Canada 549.93 — 0.35 549.61 — 0.02 535.57 14.04 2.62Chile 312.65 — 1.84 188.62 — 0.65 179.61 9.01 5.02Mexico 747.48 — 2.54 301.91 — 3.47 299.89 2.02 0.67U.S. 40458.32 1.92 40458.32 1.92 39219.62 1238.71 3.16LatinAmerica 249.16 — 4.35 258.38 — 9.23 — 3.57Europe 435.92 0.92 427.18 8.74 2.05Austria 303.17 2.05 306.31 2.73 283.22 23.08 8.15Belgium 342.92 — 0.69 346.47 — 0.03 341.04 5.43 1.59Denmark 2452.28 1.49 2511.60 2.15 2493.20 18.40 0.74Finland 1607.93 1.52 1624.58 2.19 1570.81 53.77 3.42France 415.40 — 0.88 419.70 — 0.23 420.20 — 0.50 — 0.12Germany 507.45 1.54 512.71 2.22 503.68 9.03 1.79Greece 17.95 — 1.88 19.86 — 1.23 20.52 — 0.66 — 3.24Ireland 736.66 — 1.33 744.28 — 0.68 734.58 9.71 1.32Italy 218.34 — 1.37 220.60 — 0.72 223.18 — 2.58 — 1.16Netherlands 836.74 3.02 845.40 3.71 792.39 53.01 6.69Norway 649.22 0.72 534.51 1.38 515.56 18.95 3.68Portugal 67.11 — 0.32 74.21 0.34 72.32 1.89 2.61Russia 2426.20 — 2.59 257.28 — 3.97 253.04 4.24 1.67Spain 363.32 — 2.18 367.08 — 1.53 369.58 — 2.50 — 0.68Sweden 1579.50 1.76 1342.00 2.78 1292.17 49.83 3.86Switzerland 640.67 0.47 1055.60 1.02 1038.06 17.54 1.69United Kingdom 270.09 — 0.55 244.54 0.11 237.05 7.48 3.16SouthAfrica 939.75 1.49 304.27 2.53 294.27 10.00 3.40PacificRegion 296.19 1.98 279.81 16.38 5.85Australia 491.87 1.40 551.35 1.65 532.40 18.96 3.56China 687.33 5.90 843.21 5.88 755.42 87.79 11.62HongKong 535.38 2.04 535.38 2.06 501.50 33.88 6.76India 1388.83 — 0.47 747.61 — 0.34 722.88 24.72 3.42Japan 145.81 0.15 175.40 0.22 171.41 3.99 2.33Malaysia 247.03 — 1.13 159.93 — 1.29 163.45 — 3.53 — 2.16NewZealand 447.07 2.59 625.12 3.20 620.97 4.15 0.67Philippines 360.61 — 2.70 299.21 — 2.75 303.05 — 3.84 — 1.27Singapore 208.59 0.87 254.83 1.01 236.37 18.46 7.81SouthKorea 1225.64 1.53 1883.16 1.19 1762.81 120.34 6.83Taiwan 160.68 3.00 187.47 3.00 170.46 17.01 9.98Thailand 333.10 — 1.00 533.85 — 0.85 514.57 19.28 3.75EuroZone 160.94 0.92 158.66 2.28 1.43EuropeDeveloped (exU.K.) 584.28 1.18 574.46 9.83 1.71Europe (Nordic) 1325.68 2.37 1288.10 37.57 2.92Pacific (ex. Japan) 420.22 2.89 390.05 30.17 7.73World (exUS) 243.97 1.23 234.84 9.12 3.89S&PGlobalBroadMarket Indices 330.75 1.60 319.69 11.06 3.46GLOBALDOW 3598.63 — 0.04 3488.15 110.48 3.17
s2021S&PDowJones Indices.All RightsReserved.
Europe
S&P Europe BMI 0.26%
Netherlands 3.02
Sweden 1.76
Germany 1.54
Finland 1.52
Denmark 1.49
Norway 0.72
Switzerland 0.47
U.K.-0.55
Belgium-0.69
France-0.88
Italy-1.37
Greece-1.88
Spain-2.18
Indexes based on S&P Global Broad Market Indices Source: S&P DJ Indices
Siege: The U.K. plans a long lockdown. The EUdiscouraged travel, but left borders open.
Asia
S&P Pan Asia BMI 1.95%
China 5.90
Taiwan 3.00
New Zealand 2.59
Hong Kong 2.04
South Korea 1.53
Australia 1.40
Singapore 0.87
Japan 0.15
Indonesia-0.33
India-0.47
Thailand-1.00
Malaysia-1.13
Philippines-2.70
Indexes based on S&P Global Broad Market Indices Source: S&P DJ Indices
New Year: A Covid upsurge led China to restricttravel and discourage holiday gatherings.
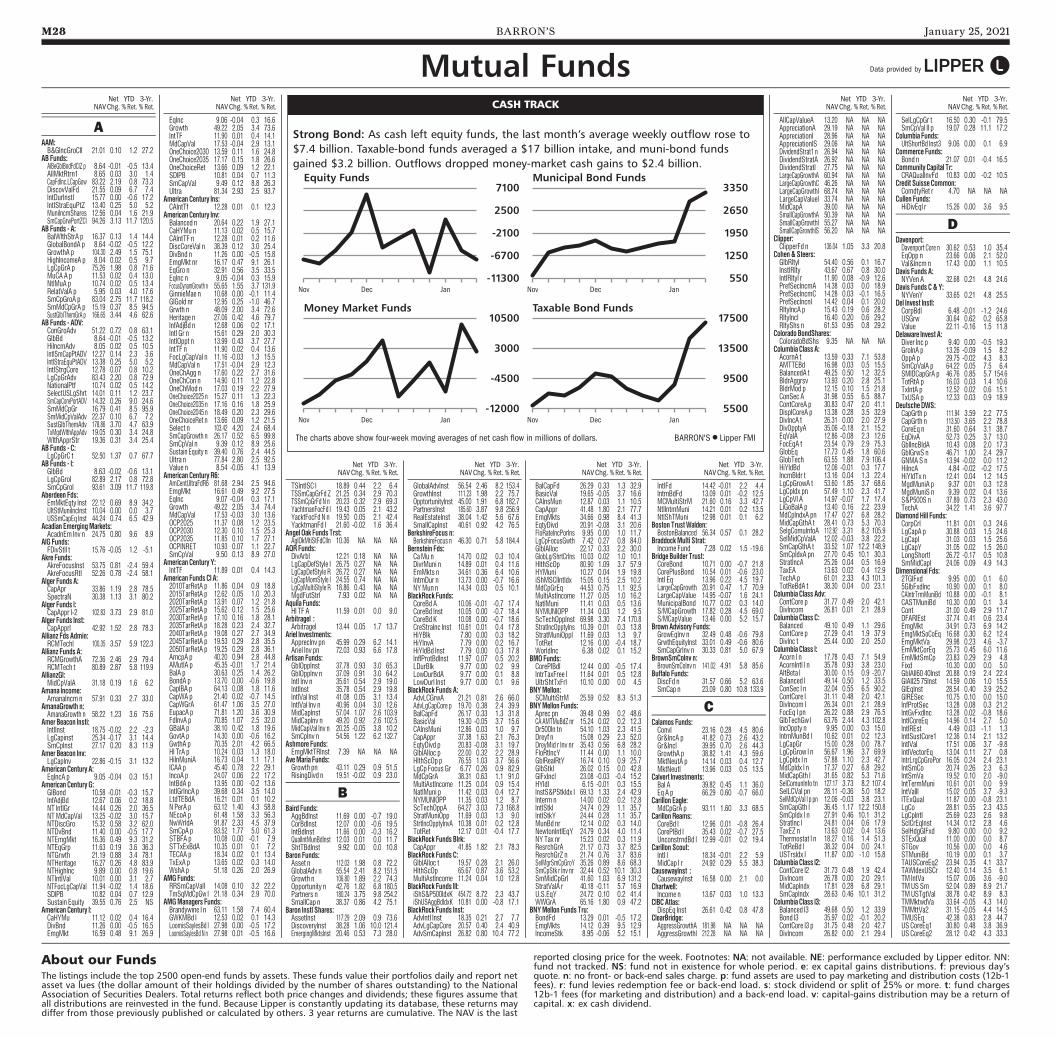
M28 BARRON’S January 25, 2021
AAAM:B&GIncGroClI 21.01 0.10 1.2 27.2AB Funds:AlBeGblBndFdClZ p 8.64 -0.01 -0.5 13.4AllMktRtrn1 8.65 0.03 3.0 1.4CapFdInc.LCapGow 83.22 2.19 0.8 73.3DiscovValFd 21.55 0.09 6.7 7.4IntDurInstl 15.77 0.00 -0.6 17.2IntlStraEquPtZ 13.40 0.25 5.0 5.2MuniIncmShares 12.56 0.04 1.6 21.9SmCapGrwPortZCl 94.26 3.13 11.7 120.5AB Funds - A:BalWlthStrA p 16.37 0.13 1.4 14.4GlobalBondA p 8.64 -0.02 -0.5 12.2GrowthA p 104.30 2.49 1.5 75.1HighIncomeA p 8.04 0.02 0.5 9.7LgCpGrA p 75.26 1.98 0.8 71.6MuCA A p 11.53 0.02 0.4 13.0NtlMuA p 10.74 0.02 0.5 13.4RelatValA p 5.95 0.03 4.0 17.6SmCpGroA p 83.04 2.75 11.7 118.2SmMdCpGrA p 15.19 0.37 8.5 94.5SustGlblThemGrA p 166.65 3.44 4.6 62.6AB Funds - ADV:ConGroAdv 51.22 0.72 0.8 63.1GlbBd 8.64 -0.01 -0.5 13.2HiIncmAdv 8.05 0.02 0.5 10.5IntlSmCapPtADV 12.27 0.14 2.3 3.6IntlStraEquPtADV 13.38 0.25 5.0 5.2IntlStrgCore 12.78 0.07 0.8 10.2LgCpGrAdv 83.43 2.20 0.8 72.9NationalPtf 10.74 0.02 0.5 14.2SelectUSLgShrt 14.01 0.11 1.2 23.7SmCapCorePortADV 14.32 0.26 9.0 24.6SmMdCpGr 16.79 0.41 8.5 95.9SmMidCpValAdv 22.37 0.10 6.7 7.2SustGlbThemAdv 178.86 3.70 4.7 63.9TxMgdWlthAppAdv 19.05 0.30 3.4 24.8WlthApprStr 19.36 0.31 3.4 25.4AB Funds - C:LgCpGrC t 52.50 1.37 0.7 67.7AB Funds - I:GlbBd 8.63 -0.02 -0.6 13.1LgCpGroI 82.89 2.17 0.8 72.8SmCpGroI 93.61 3.09 11.7 119.8Aberdeen Fds:EmMktEqty Inst 22.12 0.69 8.9 34.2UltStMuniIncInst 10.04 0.00 0.0 3.7USSmCapEq Inst 44.24 0.74 6.5 42.9Acadian EmergingMarkets:AcadnEm Inv n 24.75 0.80 9.6 8.9AIG Funds:FDivStII t 15.76 -0.05 1.2 -5.1Akre Funds:AkreFocusInst 53.75 0.81 -2.4 59.4AkreFocusRtl 52.26 0.78 -2.4 58.1Alger Funds A:CapApr 33.86 1.19 2.8 78.5SpectraN 30.38 1.13 3.1 80.2Alger Funds I:CapAppr I-2 102.83 3.73 2.9 81.0Alger Funds Inst:CapApprI 42.92 1.52 2.8 78.3Allianz Fds Admin:RCMTechI 100.35 3.57 5.9 122.3Allianz Funds A:RCMGrowthA 72.36 2.46 2.9 79.4RCMTech t 80.89 2.87 5.8 119.9AllianzGI:MidCpValA 31.18 0.19 1.6 6.2Amana Income:AmanaIncm n 57.91 0.33 2.7 33.0AmanaGrowth n:AmanaGrowth n 58.22 1.23 3.6 75.6Amer Beacon Insti:IntlInst 18.75 -0.02 2.2 -2.3LgCapinst 25.34 -0.17 3.1 14.4SmCpInst 27.17 0.20 8.3 11.9Amer Beacon Inv:LgCapInv 22.86 -0.15 3.1 13.2American Century A:EqIncA p 9.05 -0.04 0.3 15.1American Century G:GlBond 10.58 -0.01 -0.3 15.7InfAdjBd 12.67 0.06 0.2 18.8NT IntlGr 14.44 0.26 2.0 36.5NTMdCapVal 13.25 -0.02 3.0 15.7NTDiscGro 15.32 0.58 3.2 62.0NTDvBnd 11.40 0.00 -0.5 17.7NTEmgMkt 16.36 0.49 9.3 31.2NTEqGrp 11.63 0.19 3.6 36.3NTGrwth 21.19 0.88 3.4 78.1NTHeritage 16.27 0.26 4.8 83.9NTHighInc 9.89 0.00 0.8 19.6NTIntlVal 10.01 0.00 3.1 2.7NTFocLgCapVal 11.94 -0.02 1.4 18.6SDIPB 10.82 0.04 0.7 12.9Sustain Equity 39.55 0.76 2.5 NSAmerican Century I:CaHYMu 11.12 0.02 0.4 16.4DivBnd 11.26 0.00 -0.5 16.5EmgMkt 16.59 0.48 9.1 26.9
EqInc 9.06 -0.04 0.3 16.6Growth 49.22 2.05 3.4 73.6IntTF 11.90 0.01 0.4 14.1MdCapVal 17.53 -0.04 2.9 13.1OneChoice2030 13.59 0.11 1.6 24.8OneChoice2035 17.17 0.15 1.8 26.6OneChoiceRet 13.66 0.09 1.2 22.1SDIPB 10.81 0.04 0.7 11.3SmCapVal 9.49 0.12 8.8 26.3Ultra 81.34 2.93 2.5 93.7American Century Ins:CAIntTf 12.28 0.01 0.1 12.3American Century Inv:Balanced n 20.64 0.22 1.9 27.1CaHYMu n 11.13 0.02 0.5 15.7CAIntTF n 12.28 0.01 0.2 11.6DiscCoreVal n 38.39 0.12 3.0 25.4DivBnd n 11.26 0.00 -0.5 15.8EmgMkt nr 16.17 0.47 9.1 26.1EqGro n 32.91 0.56 3.5 33.5EqInc n 9.05 -0.04 0.3 15.9FocusDynamGrowth n 55.65 1.55 3.7 131.9GinnieMae n 10.68 0.00 -0.1 11.4GlGold nr 12.95 0.25 -1.0 46.7Grwth n 48.09 2.00 3.4 72.6Heritage n 27.06 0.42 4.6 79.7InfAdjBd n 12.68 0.06 0.2 17.1Intl Gr n 15.61 0.29 2.0 30.3IntlOppt n 13.99 0.43 3.7 27.7IntTF n 11.90 0.02 0.4 13.6FocLgCapVal n 11.16 -0.03 1.3 15.5MdCapVal n 17.51 -0.04 2.9 12.3OneChAgg n 17.60 0.22 2.7 31.6OneChCon n 14.90 0.11 1.2 22.8OneChMod n 17.03 0.19 2.2 27.9OneChoice2025 n 15.27 0.11 1.3 22.3OneChoice2035 n 17.16 0.16 1.8 25.9OneChoice2045 n 18.49 0.20 2.3 29.6OneChoiceRet n 13.66 0.09 1.2 21.5Select n 103.42 4.20 2.4 68.4SmCapGrowth n 26.17 0.52 6.5 99.8SmCpVal n 9.39 0.12 8.9 25.6Sustain Equity n 39.40 0.76 2.4 44.5Ultra n 77.84 2.80 2.5 92.5Value n 8.54 -0.05 4.1 13.9American Century R6:AmCentUltraFdR6 81.68 2.94 2.5 94.6EmgMkt 16.61 0.49 9.2 27.5EqInc 9.07 -0.04 0.3 17.1Growth 49.22 2.05 3.4 74.4MdCapVal 17.53 -0.03 3.0 13.6OCP2025 11.37 0.08 1.2 23.5OCP2030 12.30 0.10 1.5 25.3OCP2035 11.85 0.10 1.7 27.1OCPINRET 10.93 0.07 1.1 22.7SmCpVal 9.50 0.13 8.9 27.0American Century Y:IntTF 11.89 0.01 0.4 14.3American Funds Cl A:2010TarRetA p 11.86 0.04 0.9 18.82015TarRetA p 12.62 0.05 1.0 20.32020TarRetA p 13.91 0.07 1.2 21.82025TarRetA p 15.62 0.12 1.5 25.62030TarRetA p 17.10 0.16 1.8 28.12035TarRetA p 18.28 0.23 2.4 32.72040TarRetA p 19.08 0.27 2.7 34.92045TarRetA p 19.53 0.29 2.8 35.52050TarRetA p 19.25 0.29 2.8 36.1AmcpA p 40.20 0.94 2.8 44.8AMutlA p 45.35 -0.01 1.7 21.4BalA p 30.63 0.25 1.4 26.2BondA p 13.70 0.00 -0.6 19.8CapIBA p 64.13 0.08 1.8 11.6CapWA p 21.40 0.02 -0.7 14.5CapWGrA 61.47 1.06 3.5 27.0EupacA p 71.81 1.20 3.6 30.9FdInvA p 70.85 1.07 2.5 32.0GBalA p 38.10 0.42 1.8 19.6GovtA p 14.30 0.00 -0.6 16.2GwthA p 70.35 2.01 4.2 66.5HI TrA p 10.24 0.03 1.3 18.0HiInMuniA 16.73 0.04 1.1 17.1ICAA p 45.40 0.78 2.2 29.1IncoA p 24.07 0.06 2.2 17.2IntBdA p 13.95 0.00 -0.2 13.6IntlGrIncA p 39.68 0.34 3.5 14.0LtdTEBdA 16.21 0.01 0.1 10.2N PerA p 63.12 1.40 4.3 58.8NEcoA p 61.48 1.58 3.3 56.3NwWrldA 91.87 2.33 4.5 37.9SmCpA p 83.52 1.77 5.0 61.3STBFA p 10.08 0.00 -0.1 7.9STTxExBdA 10.35 0.01 0.1 7.2TECAA p 18.34 0.02 0.1 13.4TxExA p 13.65 0.02 0.3 14.0WshA p 51.18 0.26 2.0 26.9AMG Funds:RRSmCapValI 14.08 0.10 3.2 22.2TmSqMdCpGw I 21.18 0.34 2.9 70.0AMGManagers Funds:Brandywine I n 63.11 1.58 7.4 60.4GWKMBd I 12.53 0.02 0.1 14.3LoomisSaylesBd I 27.98 0.00 -0.5 17.2LoomisSaylesBd N n 27.98 0.01 -0.5 16.6
TSIntlSC I 18.89 0.44 2.2 6.4TSSmCapGrFd Z 21.25 0.34 2.9 70.3TSSmCpGrFd N n 20.23 0.32 2.9 69.3YachtmanFocFd I 19.43 0.05 2.1 43.2YacktFocFd N n 19.50 0.05 2.1 42.4YacktmanFd I 21.60 -0.02 1.6 36.4Angel Oak Funds Trst:AglOkMtiStFdClIn 10.36 NA NA NAAQR Funds:DivArbI 12.21 0.18 NA NALgCapDefStyle I 26.75 0.27 NA NALgCapDefStyle R 26.72 0.27 NA NALgCapMomStyle I 24.55 0.74 NA NALgCpMultiStyle R 18.86 0.43 NA NAMgdFutStrI 7.93 0.02 NA NAAquila Funds:HI TF A 11.59 0.01 0.0 9.0ArbitrageI :ArbitrageI 13.44 0.05 1.7 13.7Ariel Investments:ApprecInv pn 45.99 0.29 6.2 14.1Ariel Inv pn 72.03 0.93 6.6 17.8Artisan Funds:GblOppInst 37.78 0.93 3.0 65.3GblOppInv n 37.09 0.91 3.0 64.2Intl Inv n 35.61 0.54 2.9 19.0IntlInst 35.78 0.54 2.9 19.8IntlVal Inst 41.08 0.05 3.1 13.4IntlVal Inv n 40.96 0.04 3.0 12.6MidCapInst 57.04 1.07 2.6 103.9MidCapInv n 49.20 0.92 2.6 102.5MidCapVal Inv n 20.25 -0.05 3.8 10.2SmCpInv n 54.56 1.22 6.2 132.7Ashmore Funds:EmgMktTRInst 7.39 NA NA NAAveMaria Funds:Growth pn 43.11 0.29 0.9 51.5RisingDivd n 19.51 -0.02 0.9 23.0
BBaird Funds:AggBdInst 11.69 0.00 -0.7 19.0CorBdInst 12.07 0.00 -0.6 19.5IntBdInst 11.66 0.00 -0.3 16.2QualIntMunBdInst 12.03 0.01 0.0 11.7ShtTBdInst 9.92 0.00 0.0 10.8Baron Funds:Asset n 112.03 1.98 0.8 72.2GlobalAdv n 55.54 2.41 8.2 151.5Growth n 106.80 1.89 2.2 74.3Opportunity n 42.76 1.82 6.8 180.5Partners n 180.24 3.75 9.8 254.2SmallCap n 38.37 0.86 4.2 75.1Baron Instl Shares:AssetInst 117.29 2.09 0.9 73.6DiscoveryInst 38.28 1.06 10.0 121.4EmergingMktsInst 20.46 0.53 7.3 28.0
GlobalAdvInst 56.54 2.46 8.2 153.4GrowthInst 111.23 1.98 2.2 75.7OpptortunityInst 45.00 1.91 6.8 182.7PartnersInst 185.60 3.87 9.8 256.9RealEstateInst 38.04 1.42 5.6 67.6SmallCapInst 40.61 0.92 4.2 76.5BerkshireFocus n:BerkshireFocus n 46.30 0.71 5.8 184.4Bernstein Fds:CaMu n 14.70 0.02 0.3 10.4DivrMuni n 14.89 0.01 0.4 11.6EmMkts n 34.61 0.36 6.4 10.6IntmDur n 13.73 0.00 -0.7 16.6NYMun n 14.34 0.03 0.5 10.1BlackRock Funds:CoreBd A 10.06 -0.01 -0.7 17.4CoreBd Inst 10.05 0.00 -0.7 18.4CoreBd K 10.08 0.00 -0.7 18.6CreStraInc Inst 10.61 0.01 0.4 17.8HiYBlk 7.80 0.00 0.3 18.2HiYInvA 7.79 0.00 0.2 16.7HiYldBd Inst 7.79 0.00 0.3 17.8InflProtBdInst 11.97 0.07 0.5 20.2LDurBlk 9.77 0.00 0.2 9.9LowDurBdA 9.77 0.00 0.1 8.8LowDurI Inst 9.77 0.00 0.1 9.6BlackRock Funds A:AdvLCGrwA 21.21 0.81 2.6 66.0AdvLgCapCore p 19.70 0.38 2.4 39.9BalCapFd 26.17 0.33 1.3 31.8BasicVal 19.30 -0.05 3.7 15.6CAInsMuni 12.86 0.03 1.0 9.7CapAppr 37.38 1.63 2.1 76.3EqtyDivd p 20.83 -0.08 3.1 19.7GlblAlloc p 22.00 0.32 2.2 28.9HlthScOp p 76.55 1.03 3.7 56.6LgCp Focus Gr 6.77 0.26 0.9 82.9MdCpGrA 38.31 0.63 1.1 91.0MultiAstIncome 11.25 0.04 0.9 15.4NatlMuni p 11.42 0.03 0.4 12.7NYMUNIOPP 11.35 0.03 1.2 8.7ScTechOppA 64.27 3.03 7.3 168.8StratMuniOpp 11.69 0.03 1.3 9.0StrtIncOpptyInvA 10.38 0.01 0.2 12.8TotRet 12.17 0.01 -0.4 17.7BlackRock Funds Blrk:CapAppr 41.85 1.82 2.1 78.3BlackRock Funds C:GlblAlloc t 19.57 0.28 2.1 26.0HlthScOp 65.67 0.87 3.6 53.2MultiAstIncome 11.24 0.04 1.0 12.8BlackRock Funds III:iShS&P500IdxK 454.72 8.72 2.3 43.7iShUSAggBdIdxK 10.81 0.00 -0.8 17.1BlackRock Funds Inst:AdvIntl Inst 18.35 0.21 2.7 7.7AdvLgCapCore 20.57 0.40 2.4 40.9AdvSmCapInst 26.82 0.80 10.4 77.2
BalCapFd 26.29 0.33 1.3 32.9BasicVal 19.65 -0.05 3.7 16.6CAInsMun 12.87 0.03 1.1 10.5CapAppr 41.48 1.80 2.1 77.7EmgMkts 34.66 0.98 8.4 41.3EqtyDivd 20.91 -0.08 3.1 20.6FloRateIncPorIns 9.95 0.00 1.0 11.7LgCpFocusGwth 7.42 0.27 0.8 84.0GlblAlloc 22.17 0.33 2.2 30.0GlobLg/ShrtCrIns 10.03 0.02 1.0 10.1HlthScOp 80.90 1.09 3.7 57.9HYMuni 10.27 0.04 1.9 19.8iShMSCIIntldx 15.05 0.15 2.5 10.2MdCpGrEq 44.53 0.75 1.1 92.5MultiAstIncome 11.27 0.05 1.0 16.2NatlMuni 11.41 0.03 0.5 13.6NYMUNIOPP 11.34 0.03 1.2 9.5ScTechOppInst 69.98 3.30 7.4 170.8StratIncOpptyIns 10.39 0.01 0.3 13.8StratMuniOppI 11.69 0.03 1.3 9.7TotRet 12.16 0.00 -0.4 18.7WorldInc 6.38 0.02 0.1 15.2BMO Funds:CorePlBdI 12.44 0.00 -0.5 17.4IntrTaxFree I 11.64 0.01 0.5 12.8UltrShtTxFrI 10.10 0.00 0.0 4.5BNYMellon:SCMultiStrM 25.59 0.52 8.3 51.3BNYMellon Funds:Aprec pn 39.48 0.99 0.2 48.6CA AMTMuBdZ nr 15.24 0.02 0.2 12.3Dr500In tn 54.10 1.03 2.3 41.5Dreyf n 15.08 0.29 2.3 52.0DreyMid r Inv nr 35.43 0.56 6.8 28.2FloRtIncY 11.44 0.00 1.1 10.0GblRealRtY 16.74 0.10 0.9 25.7GlbStkI 26.02 0.15 0.0 42.8GlFxIncI 23.08 -0.03 -0.4 15.2HYldI 6.15 -0.01 0.3 15.5InstS&PStkIdx I 69.13 1.33 2.4 42.9Interm n 14.00 0.02 0.2 12.8IntlStkI 24.74 0.29 1.1 35.7IntlStkY 24.44 0.28 1.1 35.7MunBd nr 12.14 0.02 0.3 14.0NewtonIntlEqY 24.79 0.34 4.0 11.4NY Tax nr 15.23 0.02 0.3 11.9ResrchGrA 21.17 0.73 3.7 82.5ResrchGrZ n 21.74 0.76 3.7 83.6SelMgrSmCpGroY 35.26 0.89 8.6 68.3SmCpStk r Inv nr 32.44 0.52 10.1 30.3SmMidCpGrI 41.60 1.03 6.9 131.2StratValA r 40.18 -0.11 5.7 16.9U.S.EqY 24.72 0.10 0.2 41.4WWGrA 65.16 1.80 0.9 47.2BNYMellon Funds Tru:BondFd 13.29 0.01 -0.5 17.2EmgMkts 14.12 0.39 9.5 12.9IncomeStk 8.95 -0.06 5.2 15.1
IntlFd 14.42 -0.01 2.2 4.4IntmBdFd 13.09 0.01 -0.2 12.5MCMultiStrM 21.60 0.16 3.3 42.7NtlIntmMuni 14.21 0.01 0.2 13.5NtlShTMuni 12.98 0.01 0.1 6.2Boston Trust Walden:BostonBalanced 56.34 0.57 0.1 28.2BraddockMulti Strat:Income Fund 7.28 0.02 1.5 -19.6Bridge Builder Trust:CoreBond 10.71 0.00 -0.7 21.8CorePlusBond 10.54 0.01 -0.6 23.0Intl Eq 13.96 0.22 4.5 19.7LargeCapGrowth 20.91 0.47 1.7 70.9LargeCapValue 14.95 -0.07 1.6 24.1MunicipalBond 10.77 0.02 0.3 14.0S/MCapGrowth 17.82 0.28 4.5 69.0S/MCapValue 13.46 0.00 5.2 15.7Brown Advisory Funds:GrowEqInv n 32.49 0.48 -0.6 79.8GrwthEquityInst 33.01 0.49 -0.6 80.6SmCapGrInv n 30.33 0.81 5.0 67.9BrownSmCoInv n:BrownSmCoInv n 141.02 4.91 5.8 85.6Buffalo Funds:DiscFd n 31.57 0.66 5.2 63.6SmCap n 23.09 0.80 10.8 133.9
CCalamos Funds:ConvI 23.16 0.28 4.5 80.6Gr&IncA p 41.82 0.73 2.6 43.2Gr&IncI 39.95 0.70 2.6 44.3GrowthA p 38.82 1.41 4.3 59.6MktNeutA p 14.14 0.03 0.4 12.7MktNeutI 13.96 0.03 0.5 13.5Calvert Investments:Bal A 39.82 0.45 1.1 36.0Eq A p 66.29 0.60 -0.7 66.0Carillon Eagle:MdCpGrA p 93.11 1.60 3.3 68.5Carillon Reams:CoreBd I 12.96 0.01 -0.8 26.4CorePlBd I 35.43 0.02 -0.7 27.5UnconstrndBd I 12.99 -0.01 0.2 19.4Carillon Scout:Intl I 18.34 -0.01 2.2 5.9MidCap I r 24.92 0.29 5.5 38.3CausewayInst :CausewayInst 16.58 0.00 2.1 0.0Chartwell:Income n 13.67 0.03 1.0 13.3CIBC Atlas:DispEq Inst 26.61 0.42 0.8 47.8ClearBridge:AggressGrowthA 181.98 NA NA NAAggressGrowthI 212.28 NA NA NA
AllCapValueA 13.20 NA NA NAAppreciationA 29.19 NA NA NAAppreciationI 28.96 NA NA NAAppreciationIS 29.06 NA NA NADividendStrat1 n 26.94 NA NA NADividendStratA 26.92 NA NA NADividendStratI 27.75 NA NA NALargeCapGrowthA 60.94 NA NA NALargeCapGrowthC 46.26 NA NA NALargeCapGrowthI 68.74 NA NA NALargeCapValueI 33.74 NA NA NAMidCapA 39.00 NA NA NASmallCapGrowthA 50.39 NA NA NASmallCapGrowthI 55.27 NA NA NASmallCapGrowthIS 56.20 NA NA NAClipper:ClipperFd n 136.04 1.05 3.3 20.8Cohen & Steers:GlbRltyI 54.40 0.56 0.1 16.7InstlRlty 43.67 0.67 0.8 30.0IntlRltyI r 11.90 0.08 -0.9 12.6PrefSecIncmA 14.38 0.03 0.0 18.9PrefSecIncmC 14.28 0.03 -0.1 16.5PrefSecIncnI 14.42 0.04 0.1 20.0RltyIncA p 15.43 0.19 0.6 28.2RltyIncI 16.40 0.20 0.6 29.2RltyShs n 61.53 0.95 0.8 29.2Colorado BondShares:ColoradoBdShs 9.35 NA NA NAColumbia Class A:AcornA t 13.59 0.33 7.1 53.8AMTTEBd 16.98 0.03 0.5 15.5BalancedA t 49.25 0.50 1.2 32.5BldrAggrsv 13.93 0.20 2.8 25.1BldrMod p 12.15 0.10 1.5 21.8ConSec A 31.98 0.55 6.5 88.7ContCoreA p 30.83 0.47 2.0 41.1DisplCoreA p 13.38 0.28 3.5 32.9DivIncA t 26.31 0.00 2.0 27.9DivOpptyA 35.06 -0.18 2.1 15.2EqValA 12.86 -0.08 2.3 12.6FocEqA t 23.54 0.79 2.9 75.3GlobEq 17.73 0.45 1.8 60.6GlobTech 63.55 1.88 7.9 106.4HiYldBd 12.06 -0.01 0.3 17.7IncmBldr t 13.16 0.04 1.3 22.4LgCpGrowA t 53.60 1.85 3.7 68.6LgCpIdx pn 57.49 1.10 2.3 41.7LgCpVl A 14.97 -0.07 1.7 17.4LiGoBalA p 13.40 0.16 2.2 23.9MdCpIndxA pn 17.47 0.27 6.8 28.2MidCapGthA t 28.41 0.73 5.3 70.3SelgComuInfoA 112.92 3.31 8.2 105.9SelMidCpValA 12.02 -0.03 3.8 22.2SmCapGthA t 33.52 1.07 12.2 148.9SmCpIdxA pn 27.70 0.45 10.1 30.3StratIncA 25.26 0.04 0.5 16.9TaxEA 13.63 0.02 0.4 12.9TechA p 61.01 2.33 4.3 101.3TotReBdA t 38.30 0.04 0.0 23.1Columbia Class Adv:ContCore p 31.77 0.49 2.0 42.1DivIncom 26.81 0.01 2.1 28.9Columbia Class C:Balanced 49.10 0.49 1.1 29.6ContCore p 27.29 0.41 1.9 37.9DivInc t 25.44 0.00 2.0 25.0Columbia Class I:Acorn I n 17.78 0.43 7.1 54.9AcornIntl I n 35.78 0.93 3.8 23.0AltBeta I 30.00 0.15 0.9 -20.7Balanced I 49.14 0.50 1.2 33.5ConSec I n 32.04 0.55 6.5 90.2ContCore I 31.11 0.48 2.0 42.1DivIncom I 26.34 0.01 2.1 28.9FocEq I pn 26.22 0.88 2.9 76.5GlbTechGw I 63.76 2.44 4.3 102.8IncOppty n 9.95 0.00 0.3 15.0IntmMunBd I 10.62 0.01 0.2 12.3LgCapGr 15.00 0.28 0.0 78.7LgCpGrow I n 56.67 1.96 3.7 69.9LgCpIdx I n 57.88 1.10 2.3 42.7MdCpIdx I n 17.37 0.27 6.8 29.2MidCapGth I 31.65 0.82 5.3 71.6SelComunInfo tn 127.17 3.73 8.2 107.4SelLCVal pn 28.11 -0.36 5.0 18.2SelMdCpVal I p pn 12.06 -0.03 3.8 23.1SmCapGth I 36.45 1.17 12.2 150.8SmCpIdx I n 27.91 0.46 10.1 31.2StratInc I 24.81 0.04 0.6 17.9TaxEZ n 13.63 0.02 0.4 13.6Thermostat I n 18.27 0.16 1.4 51.3TotReBd I 38.32 0.04 0.0 24.1USTrsIdx I 11.87 0.00 -1.0 15.8Columbia Class I2:ContCore I2 31.73 0.48 1.9 42.4DivIncom 26.78 0.00 2.0 29.1MidCapIndx 17.81 0.28 6.8 29.1SmCapIndx 28.63 0.46 10.1 31.2Columbia Class I3:Balanced I3 49.68 0.50 1.2 33.9Bond I3 35.97 0.02 -0.1 20.2ContCore I3 p 31.75 0.48 2.0 42.7DivIncom 26.82 0.00 2.1 29.4
SelLgCpGr t 16.50 0.30 -0.1 79.5SmCpVal II p 19.07 0.28 11.1 17.2Columbia Funds:UltShortBd Inst3 9.06 0.00 0.1 6.9Commerce Funds:Bond n 21.07 0.01 -0.4 16.5Community Capital Tr:CRAQualInvFd 10.83 0.00 -0.2 10.5Credit Suisse Common:ComdtyRet r 4.70 NA NA NACullen Funds:HiDivEqI r 15.26 0.00 3.6 9.5
DDavenport:Davenport Core n 30.62 0.53 1.0 35.4EqOpp n 23.66 0.06 2.1 52.0Val&Incm n 17.43 0.00 1.1 10.5Davis Funds A:NYVen A 32.68 0.21 4.8 24.6Davis Funds C & Y:NYVenY 33.65 0.21 4.8 25.5Del Invest Instl:CorpBdI 6.48 -0.01 -1.2 24.6USGrw 30.64 0.62 0.2 65.8Value 22.11 -0.16 1.5 11.8Delaware Invest A:Diver Inc p 9.40 0.00 -0.5 19.3GroInA p 13.26 -0.09 1.5 8.2OppA p 29.75 -0.02 4.3 8.3SmCpValA p 64.22 0.05 7.5 6.4SMIDCapGrA p 46.76 0.85 5.7 154.6TotRtA p 16.03 0.03 1.4 10.6TxIntA p 12.52 0.02 0.6 15.1TxUSA p 12.33 0.03 0.9 18.9Deutsche DWS:CapGrth p 111.94 3.59 2.2 77.5CapGrth n 113.50 3.65 2.2 78.8CoreEq n 31.60 0.64 3.1 38.7EqDivA 52.73 0.25 3.7 13.0GblIncBldA 10.43 0.08 2.0 17.3GblGrwS n 46.71 1.00 2.4 29.7GNMA S n 13.94 -0.02 0.0 11.2HiIncA 4.84 -0.02 -0.2 17.5HiYldTx n 12.41 0.04 1.2 14.5MgdMuniA p 9.37 0.01 0.3 12.8MgdMuniS n 9.39 0.02 0.4 13.6S&P500S n 37.89 0.73 2.3 43.0TechA 34.22 1.41 3.6 97.7Diamond Hill Funds:CorpCrI 11.81 0.01 0.3 24.6LgCapA p 30.88 0.03 1.5 24.6LgCapI 31.03 0.03 1.5 25.6LgCapY 31.05 0.02 1.5 26.0LongShortI 26.72 -0.17 0.5 10.8SmMidCapI 24.06 0.09 4.9 14.3Dimensional Fds:2TGlFxd 9.95 0.00 0.1 6.05GlbFxdInc 10.90 0.00 0.1 8.0CAIntrTrmMuniBd 10.88 0.00 -0.1 8.1CASTMuniBd 10.30 0.00 0.1 3.4Cont 31.00 0.49 2.9 11.7DFARlEst 37.74 0.41 0.6 23.4EmgMkt 34.91 0.73 6.9 14.2EmgMktSoCoEq 16.68 0.30 6.2 12.4EmgMktVa 29.98 0.23 4.6 -3.7EmMktCorEq 25.73 0.45 6.0 11.6EmMktSmCp 23.83 0.29 2.9 4.8Fixd 10.30 0.00 0.0 5.0GblAll60 40Inst 20.88 0.19 2.4 22.4GlAll25 75Inst 14.59 0.06 1.0 15.5GlEqInst 28.54 0.40 3.9 25.2GlRESec 10.75 0.10 0.0 15.0InfProtSec 13.28 0.08 0.3 21.2IntGvFxdInc 13.28 0.02 -0.8 18.6IntlCoreEq 14.96 0.14 2.7 5.0IntlREst 4.49 0.03 -1.1 1.3IntlSustCore1 12.36 0.14 2.1 13.2IntlVal 17.51 0.06 3.7 -9.8IntlVectorEq 13.04 0.11 2.7 0.8IntrLrgCpGroPor 16.05 0.24 2.4 23.1IntSmCo 20.74 0.26 2.3 6.3IntSmVa 19.52 0.10 2.0 -9.0IntTermMuni 10.61 0.01 0.0 9.9IntVaIII 15.02 0.05 3.7 -9.3ITExQual 11.87 0.00 -0.8 23.1LgCo 28.81 0.55 2.3 43.5LgCpIntl 25.69 0.23 2.6 9.8SclCrEqInst 14.34 0.12 2.8 4.6SelHdgGlFxd 9.80 0.00 0.0 9.2STExQual 11.00 0.00 0.0 8.7STGov 10.56 0.00 0.0 4.6STMuniBd 10.19 0.00 0.1 3.7TAUSCoreEq2 23.94 0.35 4.1 33.7TAWldexUSCr 12.40 0.14 3.5 6.1TM IntVa 15.07 0.06 3.6 -9.0TM US Sm 52.04 0.89 8.9 21.7TM USTgtVal 38.78 0.42 8.9 8.3TMMktwdVa 33.64 -0.05 4.3 14.0TMMttVa2 31.15 -0.05 4.4 14.5TMUSEq 42.38 0.83 2.8 44.7US CoreEq1 30.80 0.48 3.8 36.9US CoreEq2 28.12 0.42 4.3 33.3
Net YTD 3-Yr.NAVChg. %Ret. %Ret.
Net YTD 3-Yr.NAVChg. %Ret. %Ret.
Net YTD 3-Yr.NAVChg. %Ret. %Ret.
Net YTD 3-Yr.NAVChg. %Ret. %Ret.
Net YTD 3-Yr.NAVChg. %Ret. %Ret.
Net YTD 3-Yr.NAVChg. %Ret. %Ret.
Net YTD 3-Yr.NAVChg. %Ret. %Ret.
Net YTD 3-Yr.NAVChg. %Ret. %Ret.CASH TRACK
The charts above show four-week moving averages of net cash flow in millions of dollars. BARRON'S • Lipper FMI
7100
2500
-2100
-6700
-11300Nov Dec Jan
Equity Funds3350
2650
1950
1250
550Nov Dec Jan
Municipal Bond Funds
10500
3000
-4500
-12000Nov Dec Jan
Money Market Funds17500
13500
9500
5500Nov Dec Jan
Taxable Bond Funds
Strong Bond: As cash left equity funds, the last month’s average weekly outflow rose to$7.4 billion. Taxable-bond funds averaged a $17 billion intake, and muni-bond fundsgained $3.2 billion. Outflows dropped money-market cash gains to $2.4 billion.
About our FundsThe listings include the top 2500 open-end funds by assets. These funds value their portfolios daily and report netasset va lues (the dollar amount of their holdings divided by the number of shares outstanding) to the NationalAssociation of Securities Dealers. Total returns reflect both price changes and dividends; these figures assume thatall distributions are reinvested in the fund. Because Lipper is constantly updating its database, these returns maydiffer from those previously published or calculated by others. 3 year returns are cumulative. The NAV is the last
reported closing price for the week. Footnotes: NA: not available. NE: performance excluded by Lipper editor. NN:fund not tracked. NS: fund not in existence for whole period. e: ex capital gains distributions. f: previous day’squote. n: no front- or back-end sales charge. p: fund assets are used to pay marketing and distribution costs (12b-1fees). r: fund levies redemption fee or back-end load. s: stock dividend or split of 25% or more. t: fund charges12b-1 fees (for marketing and distribution) and a back-end load. v: capital-gains distribution may be a return ofcapital. x: ex cash dividend. All data supplied by Lipper.
Mutual Funds Data provided by
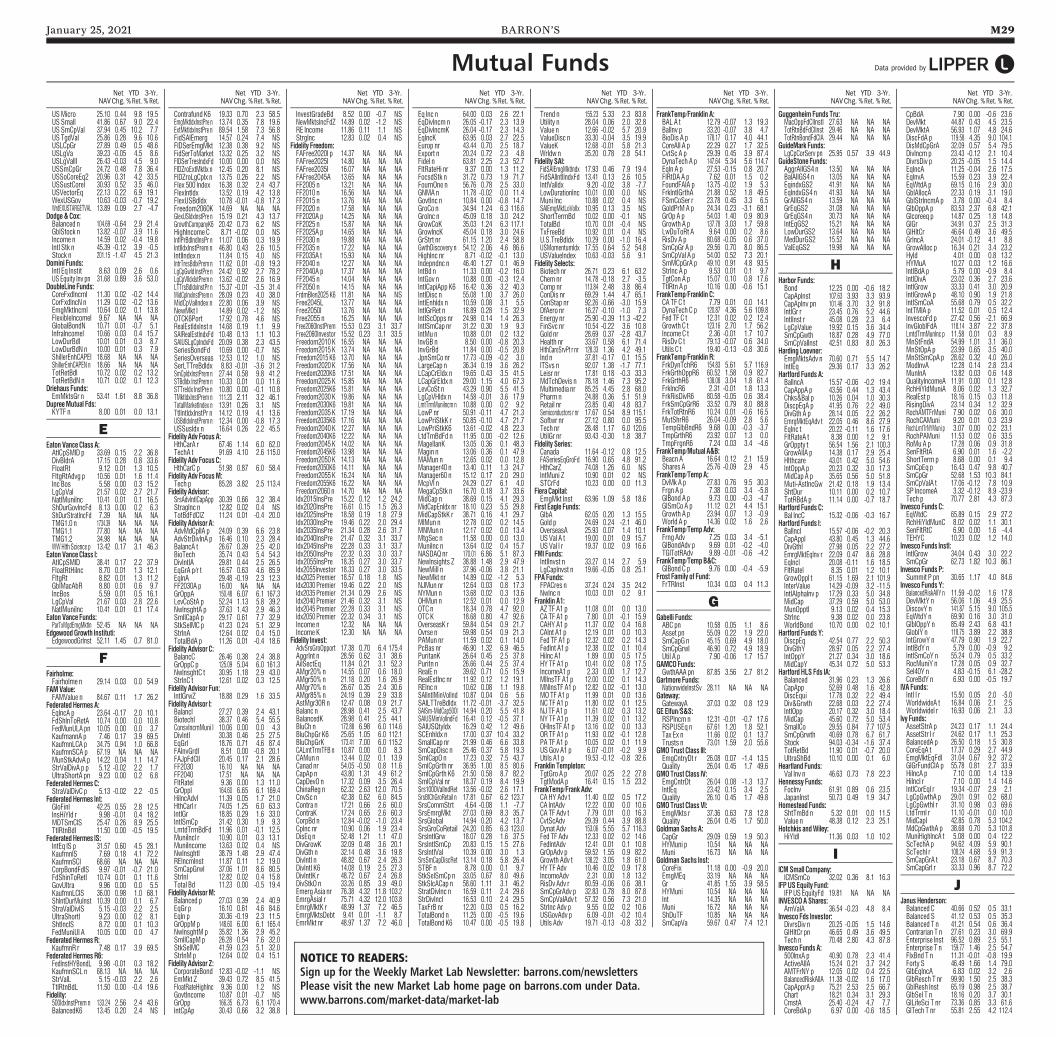
January 25, 2021 BARRON’S M29
Net YTD 3-Yr.NAVChg. %Ret. %Ret.
Net YTD 3-Yr.NAVChg. %Ret. %Ret.
Net YTD 3-Yr.NAVChg. %Ret. %Ret.
Net YTD 3-Yr.NAVChg. %Ret. %Ret.
Net YTD 3-Yr.NAVChg. %Ret. %Ret.
Net YTD 3-Yr.NAVChg. %Ret. %Ret.
Net YTD 3-Yr.NAVChg. %Ret. %Ret.
Net YTD 3-Yr.NAVChg. %Ret. %Ret.
USMicro 25.10 0.44 9.8 19.5US Small 41.86 0.67 9.0 22.4US SmCpVal 37.94 0.45 10.2 7.7US TgdVal 25.86 0.28 9.6 10.6USLCpGr 27.89 0.49 0.5 48.6USLgVa 39.23 -0.05 4.5 8.6USLgVaIII 26.43 -0.03 4.5 9.0USSmCpGr 24.72 0.48 7.8 36.4USSoCoreEq2 20.96 0.31 4.2 33.5USSustCoreI 30.93 0.52 3.5 46.0USVectorEq 22.13 0.22 6.9 19.1WexUSGov 10.63 -0.03 -0.7 19.2WrdEXUSTARGETVAL 13.89 0.09 2.7 -4.7Dodge & Cox:Balanced n 104.69 -0.64 2.9 21.4GblStock n 13.82 -0.07 3.9 11.6Income n 14.59 0.02 -0.4 19.8Intl Stk n 45.39 -0.12 3.9 -0.5Stock n 201.15 -1.47 4.5 21.3Domini Funds:Intl Eq Instit 8.63 0.09 2.6 0.6US Equity Inv pn 31.68 0.89 3.6 53.0DoubleLine Funds:CoreFxdIncmI 11.30 0.02 -0.2 14.4CorFxdIncN n 11.29 0.02 -0.2 13.6EmgMktIncmI 10.64 0.02 0.1 13.8FlexibleIncomeI 9.67 NA NA NAGlobalBondN 10.71 0.01 -0.7 5.1InfraIncomeI 10.66 0.03 0.4 15.7LowDurBdI 10.01 0.01 0.3 8.7LowDurBdN n 10.00 0.01 0.3 7.9ShillerEnhCAPEI 18.68 NA NA NAShillerEnhCAPEN n 18.66 NA NA NATotRetBdI 10.72 0.02 0.2 13.2TotRetBdN n 10.71 0.02 0.1 12.3Driehaus Funds:EmMktsGr n 53.41 1.61 8.8 36.8Dupree Mutual Fds:KYTF n 8.00 0.01 0.0 13.1
EEaton Vance Class A:AtlCpSMID p 33.69 0.15 2.2 36.8DivBldrA 17.15 0.28 0.8 33.6FloatRt 9.12 0.01 1.3 10.5FltgRtAdvg p 10.56 0.01 1.6 11.4Inc Bos 5.58 0.00 0.3 15.2LgCpVal 21.57 0.02 2.7 21.7NatlMuniInc 10.41 0.01 0.1 16.5ShDurGovIncFd 8.13 0.00 0.2 6.3ShDurStratIncFd 7.39 NA NA NATMG1.0 n 1734.39 NA NA NATMG1.1 77.80 NA NA NATMG1.2 34.98 NA NA NAWWHlth Science p 13.42 0.17 3.1 46.3Eaton Vance Class I:AtlCpSMID 38.41 0.17 2.2 37.9FloatRtHiInc 8.70 0.01 1.3 12.1FltgRt 8.82 0.01 1.3 11.2GblMacAbR 8.80 0.01 0.6 9.7IncBos 5.59 0.01 0.5 16.1LgCpVal 21.67 0.03 2.8 22.6NatlMuniInc 10.41 0.01 0.1 17.4Eaton Vance Funds:ParTxMgdEmgMktIn 52.45 NA NA NAEdgewood Growth Instituti:EdgewoodGrInst 52.11 1.45 0.7 81.0
FFairholme:Fairholme n 29.14 0.03 0.0 54.9FAM Value:FAMValue n 84.67 0.11 1.7 26.2Federated Hermes A:EqIncA p 23.64 -0.17 2.0 10.1FdShInToRetA 10.74 0.00 0.0 10.8FedMunULA pn 10.05 0.00 0.0 3.7KaufmannA p 7.46 0.17 3.9 69.5KaufmnLCA p 34.75 0.94 1.0 66.8KaufmnSCA p 67.19 NA NA NAMunStkAdvA p 14.22 0.04 1.1 14.7StrValDivA p p 5.12 -0.02 2.2 1.7UltraShortA pn 9.23 0.00 0.2 6.8Federated Hermes C:StraValDivC p 5.13 -0.02 2.2 -0.5Federated Hermes Int:GloFinI 42.25 0.55 2.8 12.5InsHiYld r 9.98 -0.01 0.4 18.2MDTSmCIS 25.47 0.26 8.9 25.5TtlRtnBdI 11.50 0.00 -0.5 19.5Federated Hermes IS:IntEq IS p 31.57 0.60 4.5 28.1KaufmnIS 7.69 0.18 4.1 72.2KaufmnSCI 68.66 NA NA NACorpBondFdIS 9.97 -0.01 -0.7 21.0FdShinToRetI 10.74 0.01 0.1 11.6GovUltra 9.96 0.00 0.0 5.5KaufmnLCIS 36.00 0.98 1.0 68.1ShIntDurMuInst 10.39 0.00 0.1 6.7StraValDivIS 5.15 -0.03 2.2 2.5UltraShortI 9.23 0.00 0.2 8.1ShtlncIS 8.72 0.00 0.1 10.3FedMuniUl A 10.05 0.00 0.0 4.7Federated Hermes R:KaufmnR r 7.48 0.17 3.9 69.5Federated Hermes R6:FedInstHYBondL 9.98 -0.01 0.3 18.2KaufmnSCL n 68.13 NA NA NAStrValL 5.15 -0.03 2.2 2.6TtlRtnBdL 11.50 0.00 -0.4 19.6Fidelity:500IdxInstPrem n 133.24 2.56 2.4 43.6BalancedK6 13.45 0.20 2.4 NS
Contrafund K6 19.33 0.70 2.3 58.5EmgMktIdxInstPre n 13.74 0.35 7.8 19.6ExtMktIdxInstPre n 89.54 1.58 7.3 56.8FidSAIEmerg 14.57 0.24 7.4 NSFIDSerEmgMkt 12.38 0.38 9.2 NSFidSerToMarket 13.32 0.25 3.2 NSFIDSerTresIndxFd 10.00 0.00 0.0 NSFIDZroExtMktIx n 12.45 0.20 8.1 NSFIDZroLgCpIx n 13.75 0.26 2.2 NSFlex 500 Index 16.38 0.32 2.4 43.7FlexIntIdx 13.52 0.19 4.2 13.8FlexUSBdIdx 10.78 -0.01 -0.8 17.3Freedom2060K 14.69 NA NA NAGlexUSIdxInstPre n 15.19 0.21 4.3 13.7GrowthCompanyK6 20.42 0.73 6.2 NSHighIncome C 8.71 -0.02 0.0 NSInflPrBdIndInsPr n 11.07 0.06 0.3 19.9IntlIdxInstPrem n 46.80 0.43 2.6 10.5IntlIndex n 11.84 0.15 4.0 NSIntrTresBdIxPrem n 11.62 0.01 -0.8 19.3LgCpGwId InstPre n 24.42 0.92 2.7 78.2LgCpVlIdxIstPrem n 13.62 -0.02 2.6 16.9LTTrsBdIdxInstPr n 15.37 -0.01 -3.5 31.4MidCpInxInstPrem n 28.09 0.23 4.0 38.0MidCpValIndex n 22.80 0.06 3.9 NSNewMkt I 14.89 0.02 -1.2 NSOTCK6Port 17.92 0.78 4.6 NSRealEstIdxInst n 14.68 0.19 1.1 9.9SAIRealEstIndxFd 10.48 0.13 1.1 10.3SAIUSLgCpIndxFd 20.09 0.38 2.3 43.5SeriesBondFd 10.69 0.00 -0.7 NSSeriesOverseas 12.53 0.12 1.0 NSSerLTTreBdIdx 8.83 -0.01 -3.6 31.2SmCpIdxInstPrem n 27.44 0.58 9.8 41.2STBdIdx InstPrem n 10.33 0.01 0.0 11.6STTreIdx InstPre n 10.80 0.00 -0.1 10.8TMktIdxInstPrem n 111.20 2.11 3.2 46.1TotalMarketIndex n 13.91 0.26 3.1 NSTtlIntIdxInstPr n 14.12 0.19 4.1 13.6USBdIdxInstPrem n 12.34 0.00 -0.8 17.3USSusIdx n 16.64 0.26 2.2 45.5Fidelity Adv Focus A:HthCarA r 67.46 1.14 6.0 62.0TechA t 91.69 4.10 2.6 115.0Fidelity Adv Focus C:HthCarC p 51.98 0.87 6.0 58.4Fidelity Adv FocusM:Tech p 85.28 3.82 2.5 113.4Fidelity Advisor:SrsAdvIntlCapApp 30.39 0.66 3.2 38.4StragInc n 12.82 0.02 0.4 NSTotBdFdClZ 11.24 0.01 -0.4 20.0Fidelity Advisor A:AdvMdCpIIA p 24.09 0.39 6.6 23.8AdvStrDivInA p 16.46 0.10 2.3 28.4BalancA t 26.67 0.39 2.5 42.0BioTech 35.74 0.43 5.4 54.3DivIntlA 29.81 0.44 2.5 26.5EqGrA p/r t 16.57 0.63 4.6 85.9EqInA 29.48 -0.19 2.3 12.3FF2030A p 16.00 NA NA NAGrOppA 150.48 6.07 6.1 167.3LevCoStA p 52.24 1.13 5.8 39.2NwInsghtA p 37.63 1.43 2.9 46.3SmllCapA p 29.17 0.61 7.7 32.9StkSelMC p 41.23 0.24 5.1 32.9StrInA 12.64 0.02 0.4 15.0TotalBdA p 11.26 0.01 -0.4 18.6Fidelity Advisor C:BalancC 26.46 0.38 2.4 38.8GrOppC p 125.09 5.04 6.0 161.3NwInsghtC t 30.95 1.18 2.9 43.0StrInC t 12.61 0.02 0.3 12.5Fidelity Advisor Fun:IntlGrwZ 18.88 0.29 1.6 33.5Fidelity Advisor I:BalancI 27.27 0.39 2.4 43.1BiotechI 38.37 0.46 5.4 55.5ConsvIncmMuni I 10.06 0.00 0.0 4.3DivIntl 30.38 0.46 2.5 27.5EqGrI 18.76 0.71 4.6 87.4FAInvGrdI 8.51 0.00 -0.8 20.1FAJpFdClI 20.45 0.17 2.1 28.6FF2030 16.10 NA NA NAFF2040 17.51 NA NA NAFltRatel 9.36 0.00 1.3 11.0GrOppI 164.60 6.65 6.1 169.4HiIncAdvI 11.39 0.05 1.7 21.0HthCarI r 74.05 1.25 6.0 63.3IntlGr 18.85 0.29 1.6 33.0IntlSmCp 31.42 0.30 1.9 9.3LmtdTrmBdFd 11.96 0.01 -0.1 12.5MuniIncI r 10.90 0.01 0.3 13.1MuniIncome 13.63 0.02 0.4 NSNwInsghtI 38.79 1.48 2.9 47.4REIncmInst 11.87 0.11 1.2 19.0SmCapGrwI 37.06 1.01 8.6 80.5StrInI 12.82 0.02 0.4 15.8Total Bd 11.23 0.00 -0.5 19.4Fidelity Advisor M:Balanced p 27.03 0.39 2.4 40.9EqGr p 16.10 0.61 4.6 84.6EqIn p 30.36 -0.19 2.3 11.5GrOppM p 148.60 6.00 6.1 165.4NwInsghtM p 35.82 1.36 2.9 45.2SmllCapM p 26.28 0.54 7.6 32.0StkSelMC 41.59 0.23 5.1 32.0StrInM p 12.64 0.02 0.4 15.1Fidelity Advisor Z:CorporateBond 12.83 -0.02 -1.1 NSEmMkt Z 39.43 0.72 8.5 41.5FloatRateHighInc 9.36 0.00 1.2 NSGovtIncome 10.87 0.01 -0.7 NSGrOpp 166.35 6.73 6.1 170.4IntCpAp 30.43 0.66 3.2 38.8
InvestGradeBd 8.52 0.00 -0.7 NSNewMktsIncFdZ 14.89 0.02 -1.2 NSRE Income 11.86 0.11 1.1 NSStrgInc 12.83 0.02 0.4 NSFidelity Freedom:FAFree2020I p 14.37 NA NA NAFAFree2025I 14.80 NA NA NAFAFree2035I 16.07 NA NA NAFAFree2045A 13.65 NA NA NAFF2005 n 13.21 NA NA NAFF2010 n 16.56 NA NA NAFF2015 n 13.76 NA NA NAFF2020 n 17.58 NA NA NAFF2020A p 14.25 NA NA NAFF2025 n 15.87 NA NA NAFF2025A p 14.65 NA NA NAFF2030 n 19.88 NA NA NAFF2035 n 17.22 NA NA NAFF2035A t 15.93 NA NA NAFF2040 n 12.27 NA NA NAFF2040A p 17.37 NA NA NAFF2045 n 14.04 NA NA NAFF2050 n 14.15 NA NA NAFrdmBlen2025 K6 11.81 NA NA NSFree2045L 13.77 NA NA NAFree2050I 13.76 NA NA NAFree2055 n 16.25 NA NA NAFree2060InstPrem 15.53 0.23 3.1 33.7Free2060Investor 15.52 0.23 3.1 33.5Freedom2010 K 16.55 NA NA NAFreedom2015 K 13.74 NA NA NAFreedom2015 K6 13.70 NA NA NAFreedom2020 K 17.56 NA NA NAFreedom2020K6 17.51 NA NA NAFreedom2025 K 15.85 NA NA NAFreedom2025K6 15.81 NA NA NAFreedom2030 K 19.86 NA NA NAFreedom2030K6 19.81 NA NA NAFreedom2035 K 17.19 NA NA NAFreedom2035K6 17.16 NA NA NAFreedom2040 K 12.27 NA NA NAFreedom2040K6 12.22 NA NA NAFreedom2045 K 14.02 NA NA NAFreedom2045K6 13.98 NA NA NAFreedom2050 K 14.13 NA NA NAFreedom2050K6 14.11 NA NA NAFreedom2055 K 16.24 NA NA NAFreedom2055K6 16.22 NA NA NAFreedom2060 n 14.70 NA NA NAIdx2015InsPre 15.22 0.12 1.2 24.2Idx2020InsPre 16.61 0.15 1.5 26.3Idx2025InsPre 18.58 0.19 1.8 27.9Idx2030InsPre 19.46 0.22 2.0 29.4Idx2035InsPre 21.34 0.28 2.6 31.7Idx2040InsPre 21.47 0.32 3.1 33.7Idx2045InsPre 22.28 0.33 3.1 33.7Idx2050InsPre 22.32 0.33 3.0 33.7Idx2055InsPre 18.35 0.27 3.0 33.7Idx2055Investor 18.33 0.27 3.0 33.5Idx2025 Premier 18.57 0.18 1.8 NSIdx2030 Premier 19.46 0.22 2.0 NSIdx2035 Premier 21.34 0.29 2.6 NSIdx2040 Premier 21.46 0.32 3.1 NSIdx2045 Premier 22.28 0.33 3.1 NSIdx2050 Premier 22.32 0.34 3.1 NSIncome n 12.32 NA NA NAIncome K 12.30 NA NA NAFidelity Invest:AdvSrsGroOpport 17.38 0.70 6.4 175.4AggrInt n 28.56 0.62 3.1 38.6AilSectEq 11.84 0.21 3.1 52.3AMgr20% n 14.55 0.07 0.6 18.0AMgr50% n 21.18 0.20 1.6 26.9AMgr70% n 26.67 0.35 2.4 30.6AMgr85% n 24.19 0.39 2.9 33.8AstMgr30R n 12.47 0.08 0.9 21.7Balanc n 28.98 0.41 2.5 43.7BalancedK 28.98 0.41 2.5 44.1BluCh n 172.88 6.98 6.0 114.6BluChpGr K6 25.65 1.05 6.0 112.1BluChpGrK 173.41 7.00 6.0 115.2CALmtTrmTFB n 10.87 0.00 0.0 8.3CAMun n 13.44 0.02 0.1 13.9Canad nr 54.05 -0.50 0.8 11.6CapAp n 43.80 1.31 4.9 61.2CapDevO n 17.32 0.09 3.5 26.4ChinaReg n 62.32 2.63 12.0 70.5CnvSc n 42.38 0.62 6.0 84.5Contra n 17.21 0.66 2.6 60.0ContraK 17.24 0.65 2.6 60.3CorpBd n 12.84 -0.02 -1.0 23.4CpInc nr 10.90 0.06 1.9 23.4DisEq n 52.48 1.21 1.1 47.0DivGrowK 32.09 0.48 3.6 20.1DivGth n 32.14 0.48 3.6 19.8DivIntl n 48.82 0.67 2.4 26.3DivIntl K6 14.08 0.19 2.5 27.3DivIntlK r 48.72 0.67 2.4 26.8DivStkO n 33.26 0.85 3.9 49.0Emerg Asia nr 76.38 4.32 11.8 103.2EmrgAsiaI r 75.71 4.32 12.0 103.8EmrgMktK r 48.99 1.37 7.2 46.5EmrgMktsDebt 9.41 0.01 -1.1 8.7EmrMkt nr 48.97 1.37 7.2 46.0
Eq Inc n 64.00 0.03 2.6 22.1EqDivIncm n 26.05 -0.17 2.3 13.9EqDivIncmK 26.04 -0.17 2.3 14.3EqIncK 63.95 0.03 2.7 22.5Europ nr 43.44 0.70 2.5 18.7Export n 20.24 0.72 2.3 4.8Fidel n 63.81 2.25 2.3 52.7FltRateHi nr 9.37 0.00 1.3 11.2FocsdStk n 31.72 0.73 1.9 71.7FournOne n 56.76 0.78 2.5 33.0GNMA n 11.78 -0.02 0.0 11.4GovtInc n 10.84 0.00 -0.8 14.7GroCo n 34.94 1.24 6.3 116.6GroInc n 45.09 0.18 3.0 24.2GrowCoK 35.03 1.24 6.3 117.1GrowIncK 45.04 0.18 3.0 24.6GrStrt nr 61.15 1.20 2.4 58.8GwthDiscovery n 54.12 2.06 4.6 86.6HighInc nr 8.71 -0.02 -0.1 13.0Indepndnc n 46.40 1.27 0.1 46.9IntBd n 11.33 0.00 -0.2 16.0IntGov n 10.88 0.00 -0.3 12.4IntlCapiApp K6 16.42 0.36 3.2 40.3IntlDisc n 55.08 1.00 3.7 26.0IntlEnhIdx n 10.59 0.08 3.1 5.5IntlGrRet n 18.89 0.28 1.5 32.9IntlScOpps nr 24.98 0.14 1.4 26.3IntlSmCap nr 31.22 0.30 1.9 9.3IntMu n 10.88 0.01 0.2 13.2InvGB n 8.50 0.00 -0.8 20.3InvGrBd 11.84 0.00 -0.5 20.8JpnSmCo nr 17.73 -0.09 -0.2 3.0LargeCap n 36.34 0.19 3.6 26.2LCapCrEIdx n 19.65 0.43 3.5 41.5LCapGrEIdx n 29.00 1.15 4.0 67.3LevCoSt n 43.29 0.90 5.5 41.5LgCpVHIdx n 14.58 -0.01 3.6 17.9LmtTrmMuniIncm n 10.88 0.00 0.2 9.2LowP nr 50.91 -0.11 4.7 21.3LowPriStkK r 50.85 -0.10 4.7 21.7LowPriStkK6 13.61 -0.02 4.8 22.3LtdTmBdFd n 11.95 0.00 -0.2 12.6MagellanK 13.05 0.36 0.1 48.3Magin n 13.06 0.36 0.1 47.9MAMun n 12.65 0.02 0.0 12.8Manager40 n 13.40 0.11 1.3 24.7Manager60 n 15.12 0.17 2.0 29.0McpVl n 24.29 0.27 6.1 4.0MegaCpStk n 16.70 0.18 3.7 33.6MidCap n 38.69 0.15 4.1 29.3MidCapEnIdx nr 18.10 0.23 5.5 29.8MidCapStkK r 38.71 0.16 4.1 29.7MIMun n 12.78 0.02 0.2 14.5MNMun n 12.17 0.02 0.0 13.4MtgSec n 11.58 0.00 0.0 13.0MuniInc n 13.64 0.02 0.4 15.7NASDAQ nr 170.01 6.86 5.1 87.3NewInsights Z 38.88 1.48 2.9 47.9NewMill n 37.96 -0.06 3.8 21.1NewMkt nr 14.89 0.02 -1.2 5.3NJMun nr 12.64 0.03 0.8 17.3NYMun n 13.68 0.02 0.3 13.6OHMun n 12.52 0.01 0.0 12.9OTC n 18.34 0.78 4.7 92.0OTC K 18.68 0.80 4.7 92.6OverseasK r 59.84 0.54 0.9 21.7Ovrse n 59.98 0.54 0.9 21.3PAMun nr 11.59 0.02 0.1 14.0PcBas nr 46.90 1.32 6.9 46.5PuritanK 26.64 0.45 2.5 37.8Puritn n 26.66 0.44 2.5 37.4RealE n 39.62 0.71 0.5 15.9RealEstInc nr 11.92 0.12 1.2 19.1REInc n 10.62 0.08 1.1 19.8SAIIntlMinVolInd 10.87 0.04 0.6 5.6SAILTTreBdIdx 11.72 -0.01 -3.7 32.5SAISm-MidCap500I 14.94 0.20 5.5 41.8SAIUSMinVolIndFd 16.41 0.12 -0.5 37.1SAIUSQtyIdx 16.29 0.42 1.2 49.6SCEnhIdx n 17.00 0.37 10.4 33.2SmallCap nr 21.99 0.46 6.6 33.8SmCapDisc n 25.46 0.37 5.8 19.3SmlCapO n 17.23 0.32 7.5 43.7SmlCpGrth nr 36.95 1.00 8.5 80.6SmlCpGrth K6 21.50 0.58 8.7 82.2SmlCpVal nr 18.37 0.19 8.4 19.9Srs1000ValIndRet 13.56 -0.02 2.6 17.1SrsBlChGroRetail n 17.81 0.67 6.2 123.7SrsCommStrt 4.64 -0.08 1.1 -7.7SrsEmrgMkt 27.03 0.69 8.3 35.7SrsGlobal 14.94 0.20 4.2 13.7SrsGroCoRetail 24.20 0.85 6.3 123.0SrsIntlGrw 18.07 0.28 1.6 37.5SrsIntlSmCp 20.83 0.15 1.5 27.6SrsIntlVal 10.39 0.00 3.0 1.3SrsSmCapDiscRet 13.14 0.18 5.8 26.4STBF n 8.78 0.00 0.1 9.7StkSelSmCp n 33.05 0.67 8.0 49.6StkSlcACap n 58.60 1.11 3.1 46.2StratDivInc n 16.59 0.11 2.4 29.6StrDivIncI 16.53 0.10 2.4 29.5TaxFrB nr 12.20 0.03 0.5 16.2TotalBond n 11.25 0.00 -0.5 19.6TotalBond K6 10.47 0.00 -0.5 19.8
Trend n 155.23 5.33 2.3 83.8Utility n 28.04 0.06 2.0 32.8Value n 12.66 -0.02 5.7 20.9ValueDisc n 33.30 -0.04 3.5 19.9ValueK 12.68 -0.01 5.8 21.3Wrldw n 35.20 0.78 2.8 54.1Fidelity SAI:FidSAIEmgMktIndx 17.93 0.46 7.9 19.4FidSAIIntlIndxFd 13.41 0.13 2.6 10.5IntlValIdx 9.20 -0.02 3.8 -7.7LowDurationInc 10.01 0.00 0.0 NSMuni Inc 10.88 0.02 0.4 NSSAIEmgMktLoVolIx 10.95 0.13 3.5 NSShortTermBd 10.02 0.00 -0.1 NSTotalBd 10.70 0.01 -0.4 NSTxFreeBd 10.92 0.01 0.4 NSU.S.TreBdIdx 10.29 0.00 -1.0 16.4USMomentumIdx 17.55 0.64 5.2 54.8USValueIndex 10.63 -0.03 5.6 9.1Fidelity Selects:Biotech nr 26.71 0.23 6.1 63.2Chem nr 14.78 -0.18 2.7 -3.5Comp nr 113.84 2.48 3.8 86.4ConDis nr 69.29 1.44 4.7 65.1ConStap nr 92.26 -0.66 -3.0 15.9DfAero nr 16.27 -0.10 -1.0 7.3Energy nr 25.90 -0.39 11.3 -42.2FinSvc nr 10.54 -0.22 3.6 10.8Gold nr 28.69 0.37 -2.8 43.7Health nr 33.67 0.58 6.1 71.4HlthCareSrvPt r nr 128.33 1.36 4.2 49.1Ind n 37.81 -0.17 0.1 15.5ITSvs n 92.07 1.38 -1.7 77.1Leisr nr 17.81 0.18 -0.3 33.3MdTchDevis n 78.18 1.46 7.3 95.2Multimedia nr 85.25 4.45 2.8 68.0Pharm n 24.88 0.36 5.1 51.9Retail nr 23.85 0.40 4.8 83.7Semiconductors r nr 17.67 0.54 8.9 115.1Softwr nr 27.12 0.80 0.0 95.5Tech nr 28.48 1.17 6.0 120.6UtilGr nr 93.43 -0.30 1.8 38.7Fidelity Series:Canada 11.64 -0.12 0.8 12.5FASeriesEqGroFd 16.90 0.65 4.8 91.2HthCarZ 74.08 1.26 6.0 NSIntMuni Z 10.90 0.01 0.2 NSSTCrFd 10.23 0.00 0.0 11.3Fiera Capital:EmgMkt Inst 63.96 1.09 5.8 18.6First Eagle Funds:GlbA 62.05 0.20 1.3 15.5Gold p 24.69 0.24 -2.1 46.0OverseasA 25.93 0.07 1.4 10.1US Val A t 19.00 0.01 0.9 15.7US Val I r 19.37 0.02 0.9 16.6FMI Funds:IntlInvst n 33.27 0.14 2.7 5.9LgCapInvst n 19.66 -0.05 0.8 25.1FPA Funds:FPACres n 37.24 0.24 3.5 24.2NwInc n 10.03 0.01 0.2 9.1Franklin A1:AZ TF A1 p 11.08 0.01 0.0 13.0CA TF A1 p 7.80 0.01 -0.1 15.9CAHY A1 p 11.37 0.02 0.4 16.8CAInt A1 p 12.19 0.01 0.0 10.3Fed TF A1 p 12.32 0.02 0.2 14.3FedInt A1 p 12.38 0.02 0.1 10.4HiInc A1 1.89 0.00 0.5 17.5HY TF A1 p 10.41 0.02 0.8 17.5IncomeA1 p 2.33 0.00 1.7 12.7MIInsTF A1 p 12.00 0.02 0.1 14.3MNInsTF A1 p 12.82 0.02 -0.1 13.0MO TF A1 p 11.99 0.01 0.0 13.6NC TF A1 p 11.80 0.02 0.1 12.5NJ TF A1 p 11.61 0.02 0.3 13.2NY TF A1 p 11.39 0.02 0.1 13.2OHInsTF A1 p 13.16 0.02 0.0 13.3OR TF A1 p 11.93 0.02 -0.1 12.8PA TF A1 p 10.05 0.02 0.1 11.9US Gov A1 p 6.07 -0.01 -0.2 9.9Utils A1 p 19.53 -0.12 -0.8 32.6Franklin Templeton:TgtGro A p 20.07 0.25 2.2 27.8TgtModA p 16.41 0.15 1.5 23.2FrankTemp/Frank Adv:CA HY Adv t 11.40 0.02 0.5 17.2CA IntAdv 12.22 0.00 0.0 10.6CA TF Adv t 7.79 0.01 0.0 16.3CvtScAdv 29.39 0.44 3.9 88.8Dynat Adv 153.06 5.55 5.7 116.3Fed TF Adv 12.33 0.02 0.2 14.6FedIntAdv 12.41 0.01 0.1 10.8GrOpAdv p 59.52 1.55 0.9 82.2Growth Adv t 138.22 3.05 1.8 61.0HY TF Adv 10.46 0.02 0.9 17.8IncomeAdv 2.31 0.00 1.8 13.2RisDv Adv r 80.59 -0.06 0.6 38.1SmCpGrAdv p 32.83 0.78 8.0 87.8SmCpValAdv t 57.32 0.56 7.3 21.0StrInc Adv p 9.55 0.02 0.2 10.6USGovAdv p 6.09 -0.01 -0.2 10.4Utils Adv 19.71 -0.13 -0.8 33.2
FrankTemp/Franklin A:BAL A t 12.79 -0.07 1.3 19.3BalInv p 33.20 -0.07 3.8 4.7BioDis A p 178.17 0.17 4.0 44.1CoreAll A p 22.29 0.27 1.7 32.5CvtSc A p 29.39 0.45 3.9 87.4DynaTech A p 147.64 5.34 5.6 114.7EqIn A p 27.53 -0.15 0.8 20.7FlRtDA A p 7.62 0.01 1.5 0.2FoundFAlA p 13.75 -0.02 1.9 5.3FrkIntlGrthA 21.88 0.52 1.8 49.5FSmCoSer r 23.78 0.45 3.3 6.5GoldPrM A p 24.34 0.23 -3.1 68.1GrOp A p 54.03 1.40 0.9 80.9Growth A p 137.78 3.03 1.7 59.8LwDuToRt A 9.64 0.00 0.2 8.6RisDv A p 80.68 -0.05 0.6 37.0SmCpGr A p 29.56 0.70 8.0 86.5SmCpVal A p 54.00 0.52 7.3 20.1SmMCpGrA p 49.10 0.91 4.8 93.5StrInc A p 9.53 0.01 0.1 9.7TgtCon A p 15.07 0.10 0.8 17.6TtlRtn A p 10.16 0.00 -0.6 15.1FrankTemp/Franklin C:CA TF C t 7.79 0.01 0.0 14.1DynaTech C p 120.87 4.36 5.6 109.8Fed TF C t 12.31 0.02 0.2 12.4Growth C t 123.16 2.70 1.7 56.2Income C t 2.36 -0.01 1.7 10.7RisDv C t 79.13 -0.07 0.6 34.0Utils C t 19.40 -0.13 -0.8 30.6FrankTemp/Franklin R:FrkDynTchR6 154.83 5.61 5.7 116.9FrkGrthOppR6 60.52 1.58 0.9 82.7FrkGrthR6 138.08 3.04 1.8 61.4FrkIncR6 2.31 -0.01 1.8 13.3FrkRisDivR6 80.58 -0.05 0.6 38.4FrkSmCpGrR6 33.52 0.79 8.0 88.8FrkTotRtnR6 10.24 0.01 -0.6 16.5MutShrR6 26.04 -0.09 2.8 5.6TempGlbBndR6 9.68 0.00 -0.3 -3.7TmpGrthR6 23.92 0.07 1.3 0.0TmpFrgnR6 7.24 0.03 3.4 -4.6FrankTemp/Mutual A&B:Beacn A 16.64 0.12 2.1 15.9Shares A 25.76 -0.09 2.9 4.5FrankTemp/Temp A:DvMk A p 27.83 0.76 9.5 30.3Frgn A p 7.38 0.03 3.4 -5.8GlBond A p 9.73 0.00 -0.3 -4.7GlSmCo A p 11.12 0.21 4.4 15.1Growth A p 23.94 0.07 1.3 -0.9World A p 14.36 0.02 1.6 2.6FrankTemp/Temp Adv:Frng Adv 7.25 0.03 3.4 -5.1GlBondAdv p 9.69 0.01 -0.2 -4.0TGlTotRAdv 9.89 -0.01 -0.6 -4.2FrankTemp/Temp B&C:GlBond C p 9.76 0.00 -0.4 -5.9Frost Family of Fund:FrTRInst 10.34 0.03 0.4 11.3
GGabelli Funds:ABC pn 10.58 0.05 1.1 8.6Asset pn 55.09 0.22 1.9 22.0SmCapG n 45.15 0.69 4.9 18.0SmCpGrwI 46.90 0.72 4.9 18.9Util A p 7.90 -0.06 1.7 15.7GAMCO Funds:GwthAAA pn 87.85 3.56 2.7 81.2Gartmore Funds:NationwideInstSv 28.11 NA NA NAGateway:GatewayA 37.03 0.32 0.8 12.9GE Elfun/S&S:RSPIncm n 12.31 -0.01 -0.7 17.6RSPUSEq n 67.61 1.20 1.8 52.1Tax Ex n 11.66 0.02 0.1 13.7Trusts n 73.01 1.59 2.0 55.6GMO Trust Class III:EmgCntryDt r 26.08 0.07 -1.4 13.5Quality 26.04 0.45 1.7 49.6GMO Trust Class IV:EmgCntrDt 26.04 0.08 -1.3 13.7IntlEq 23.42 0.15 3.4 2.5Quality 26.10 0.45 1.7 49.8GMO Trust Class VI:EmgMkts r 37.36 0.63 7.8 12.8Quality 26.04 0.45 1.7 50.0Goldman Sachs A:CapGr 29.09 0.59 1.9 50.3HYMuni p 10.54 NA NA NAMuni 16.73 NA NA NAGoldman Sachs Inst:CoreFix 11.18 0.00 -0.9 20.0EmgMEq 33.19 NA NA NAGr 41.85 1.55 3.9 58.5HYMuni 10.54 NA NA NAInt 14.35 NA NA NAMuni 16.72 NA NA NAShDuTF 10.85 NA NA NASmCapVa 59.67 0.47 7.4 12.1
Guggenheim Funds Tru:MacOppFdClInstl 27.63 NA NA NATotRtnBdFdClInst 29.46 NA NA NATotRtnBondFdClA 29.44 NA NA NAGuideMark Funds:LgCpCorServ pn 25.95 0.57 3.9 44.9GuideStone Funds:AggrAllGS4 n 13.50 NA NA NABalAllGS4 n 13.05 NA NA NAEqindxGS2 41.91 NA NA NAEqIndxGS4 n 41.93 NA NA NAGrAllGS4 n 13.59 NA NA NAGrEqGS2 31.08 NA NA NAGrEqGS4 n 30.73 NA NA NAIntEqGS2 15.21 NA NA NALowDurGS2 13.64 NA NA NAMedDurGS2 15.52 NA NA NAValEqGS2 19.98 NA NA NA
HHarbor Funds:Bond 12.25 0.00 -0.6 18.2CapApInst 107.63 3.93 3.3 93.9CapApInv pn 101.46 3.70 3.2 91.8IntlGr r 23.45 0.76 5.2 44.6IntlInst r 45.08 0.28 2.3 6.4LgCpValue 19.92 0.15 3.6 34.4SmCpGwth 18.87 0.28 4.9 77.0SmCpValInst 42.51 0.83 8.0 26.3Harding Loevner:EmgMktsAdv n 70.60 0.71 5.5 14.7IntlEq 29.36 0.17 3.3 26.2Hartford Funds A:BalIncA 15.57 -0.06 -0.2 19.4CapAppA p 43.56 0.44 1.3 43.4Chks&Bal p 10.26 0.04 1.0 30.3DiscpEqA p 41.95 0.76 2.2 49.0DivGth A p 28.14 0.05 2.2 26.2EmrgMktEqAdv t 22.05 0.46 8.6 27.9EqInc t 20.22 -0.11 1.6 17.6FltRateA t 8.38 0.00 1.2 9.1GrOppty t 56.54 1.56 2.1 100.3GrowAllA p 14.38 0.17 2.9 25.4Hlthcare 43.01 0.42 5.0 54.6IntOppA p 20.23 0.32 3.0 17.3MidCap A p 35.65 0.56 5.0 51.8Muti-AstIncGw 21.42 0.18 1.9 13.4ShtDur 10.11 0.00 0.2 10.7TotRBdA p 11.14 0.00 -0.7 18.7Hartford Funds C:Bal IncC 15.32 -0.06 -0.3 16.7Hartford Funds I:BalIncI 15.57 -0.06 -0.2 20.3CapAppI 43.80 0.45 1.3 44.6DivGthI 27.98 0.05 2.2 27.2EmrgMktEqInv r 22.09 0.47 8.6 28.8EqIncI 20.08 -0.11 1.6 18.5FltRateI 8.35 0.01 1.2 10.1GrowOppI t 61.15 1.69 2.1 101.9InterValue 14.29 -0.09 3.2 -11.5IntlAlphaInv p 17.29 0.33 5.0 34.8MidCap 37.29 0.59 5.0 53.0MunOpptI 9.13 0.02 0.4 15.3StrInc 9.38 0.02 0.0 23.8WorldBond 10.70 0.00 0.2 10.1Hartford Funds Y:DiscpEq 42.54 0.77 2.2 50.3DivGthY 28.97 0.05 2.2 27.4IntOppY 21.27 0.34 3.0 18.6MidCapY 45.34 0.72 5.0 53.3Hartford HLS Fds IA:Balanced 31.96 0.23 1.3 26.6CapApp 52.69 0.48 1.6 42.8DiscEqui 17.78 0.32 2.2 49.4Div&Grwth 22.68 0.03 2.2 27.4IntlOpp 20.17 0.32 3.0 18.4MidCap 45.60 0.72 5.0 53.4SmallCo 29.55 0.84 7.7 107.5SmCpGrwth 40.69 0.78 6.7 61.7Stock 94.03 -0.34 -1.6 37.4TotRetBd 11.90 0.01 -0.7 20.0UltraShBd 10.10 0.00 0.1 6.0Heartland Funds:Val Inv n 46.63 0.73 7.8 22.3Hennessy Funds:FocInv 61.91 0.89 0.6 23.5JapanInst 50.73 0.49 1.9 34.7Homestead Funds:ShtTmBd n 5.32 0.01 0.0 11.5Value n 48.38 0.12 2.3 25.1Hotchkis andWiley:HiYldI 11.36 0.03 1.0 10.2
IICM Small Company:ICMSmCo 32.02 0.36 8.1 16.3IFP US Equity Fund:IFP US EquityFd 19.81 NA NA NAINVESCO A Shares:AmValA 36.54 -0.23 4.8 8.4Invesco Fds Investor:DivrsDiv n 20.25 -0.05 1.5 14.6GlHltCr pn 46.65 0.49 3.6 49.5Tech n 70.48 2.80 4.3 87.8Invesco Funds A:500InxA p 40.90 0.78 2.3 41.4ActiveAllA 15.24 0.21 3.7 24.2AMTFrNY p 12.05 0.02 0.4 22.5BalancedRiskAllA 11.38 -0.02 1.6 17.0CapApprA p 75.21 2.53 2.5 66.7Chart 18.21 0.34 3.1 29.3CmstA 25.40 -0.24 4.7 7.7CoreBdA p 6.97 0.00 -0.6 18.5
CpBdA 7.90 0.00 -0.6 23.6DevMkt 44.87 0.43 4.5 23.5DevMktA 56.93 1.07 4.8 24.6DiscFdA p 119.58 4.35 9.0 104.1DisMdCpGrA 32.09 0.57 5.4 79.5DivIncm p 23.43 -0.12 2.1 10.4DivrsDiv p 20.25 -0.05 1.5 14.4EqIncA 11.25 -0.04 2.6 17.5EqInvA 15.59 0.23 3.9 22.4EqWtdA p 69.15 0.16 2.9 30.0GblAllocA 22.33 0.19 3.1 19.0GblStrIncmA p 3.78 0.00 -0.4 8.4GlbOppA p 83.53 2.37 6.8 42.1Glcoreeq p 14.87 0.25 1.8 14.8GlGr 34.91 0.37 2.5 31.3GlHltCr 46.64 0.49 3.6 49.5GrIncA 24.01 -0.12 4.1 8.8GrowAlloc p 16.34 0.21 3.4 23.2Hyld 4.01 0.00 0.8 13.2HYMuA 10.27 0.03 1.2 16.6IntlBdA p 5.79 0.00 -0.9 8.4IntlDivA 23.02 0.36 2.7 23.6IntlGrow 33.33 0.41 3.0 20.9IntlGrowA p 48.10 0.90 1.9 21.8IntlSmCoA 55.68 0.79 0.5 32.2IntTMIA p 11.52 0.01 0.5 12.4InvescoFd p 27.42 0.56 -2.1 66.9InvGloblFdA 118.14 3.87 2.2 37.8LmtdTrmMunInc p 11.58 0.01 0.3 8.9MnStFndA 54.99 1.01 3.1 36.0MnStOpA p 23.99 0.65 3.5 40.0MnStSmCpA p 28.62 0.32 4.0 26.0ModInvA 12.28 0.14 2.8 23.4MunInA 13.82 0.03 0.6 14.8QualityIncomeA 11.91 0.00 0.1 12.8RchHiYldMuniA 8.06 0.02 1.3 32.7RealEst p 18.16 0.15 0.3 11.8RisingDivA 23.14 0.34 1.2 32.9RochAMTFrMuni 7.90 0.02 0.6 30.0RochCAMuni 9.20 0.01 0.3 23.9RochLmtTrNYMuni p 3.07 0.00 0.2 23.1RochPAMuni 11.53 0.02 0.6 33.5RoMu A p 17.28 0.06 0.9 31.8SenFltRtA 6.90 0.01 1.6 -2.2ShortTerm p 8.68 0.00 0.1 9.4SmCpEq p 16.43 0.47 9.8 40.7SmCpGr 52.68 1.53 10.3 84.1SmCpValA t 17.06 -0.12 7.8 10.9SP IncomeA 3.32 -0.12 8.9 -23.9Tech p 70.77 2.81 4.3 87.3Invesco Funds C:EqWtdC 65.89 0.15 2.9 27.2RchHiYldMunC 8.02 0.02 1.1 30.1SenFltRtC 6.90 0.00 1.6 -4.4TEHYC 10.23 0.02 1.2 14.0Invesco Funds Instl:IntlGrow 34.04 0.43 3.0 22.2SmCpGr 62.73 1.82 10.3 86.1Invesco Funds P:Summit P pn 30.65 1.17 4.0 84.6Invesco Funds Y:BalancedRiskAllY n 11.59 -0.02 1.6 17.8DevMktY n 56.06 1.06 4.9 25.5DiscovY n 141.87 5.15 9.0 105.5EqWtdY n 69.90 0.16 3.0 31.0GlblOppY n 85.49 2.43 6.8 43.1GloblY n 118.75 3.89 2.2 38.8IntGrowY n 47.79 0.90 1.9 22.7IntlBdY n 5.79 0.00 -0.9 9.2IntlSmCoY n 55.24 0.79 0.5 33.2RocMuniY n 17.28 0.05 0.9 32.7Sel40Y n 4.83 -0.15 6.1 -28.2CoreBdY n 6.93 0.00 -0.5 19.7IVA Funds:Intl I r 15.50 0.05 2.0 -5.0WorldwideA t 16.84 0.06 2.1 2.5WorldwideI r 16.93 0.06 2.1 3.3Ivy Funds:AssetStrA p 24.23 0.17 1.1 24.4AssetStr I r 24.62 0.17 1.1 25.3BalancedA p 26.50 0.18 1.5 30.8CoreEqA t 17.37 0.29 2.7 44.9EmgMktEqFdI 31.04 0.67 9.2 37.2GlGrFundClA p 55.78 0.81 2.7 33.9HiIncA p 7.10 0.00 1.4 13.9HiIncI r 7.10 0.00 1.4 14.6IntlCorEqI r 19.34 -0.07 2.9 2.1LgCpGwthA p 29.01 0.91 0.2 68.0LgCpGwthl r 31.10 0.98 0.3 69.6LtdTrmI r 11.10 -0.01 0.0 10.0MidCapI 42.85 0.78 5.3 104.2MdCpGwthA p 38.68 0.70 5.3 101.8MuniHighIncA t 5.08 0.00 0.4 12.2ScTechA p 94.62 4.09 5.9 90.1ScTechI r 108.24 4.68 5.9 91.3SmCapGrA t 23.18 0.67 8.7 70.3SmCapGrI r 33.33 0.96 8.7 72.2
JJanus Henderson:Balanced C 40.66 0.52 0.5 33.1Balanced S 41.12 0.53 0.5 35.3Balanced T n 41.21 0.54 0.6 36.4Contrarian T n 27.61 0.23 3.0 69.9Enterprise Inst 96.52 0.89 2.5 55.1Enterprise T n 159.77 1.46 2.5 54.7FlxBnd T n 11.31 -0.01 -0.8 19.9Forty S 46.49 1.66 1.4 79.0GlbEqIncA 6.83 0.02 3.2 2.6GlbResch T nr 99.90 1.50 2.5 38.3GblResh Inst 65.19 0.98 2.5 38.7GlbSel T n 18.16 0.20 3.7 30.1GlLifeSci T nr 73.36 0.85 3.3 61.6GlTech T nr 55.81 2.55 4.2 112.4
Data provided byMutual Funds
NOTICE TO READERS:Sign up for the Weekly Market Lab Newsletter: barrons.com/newslettersPlease visit the new Market Lab home page on barrons.com under Data.www.barrons.com/market-data/market-lab
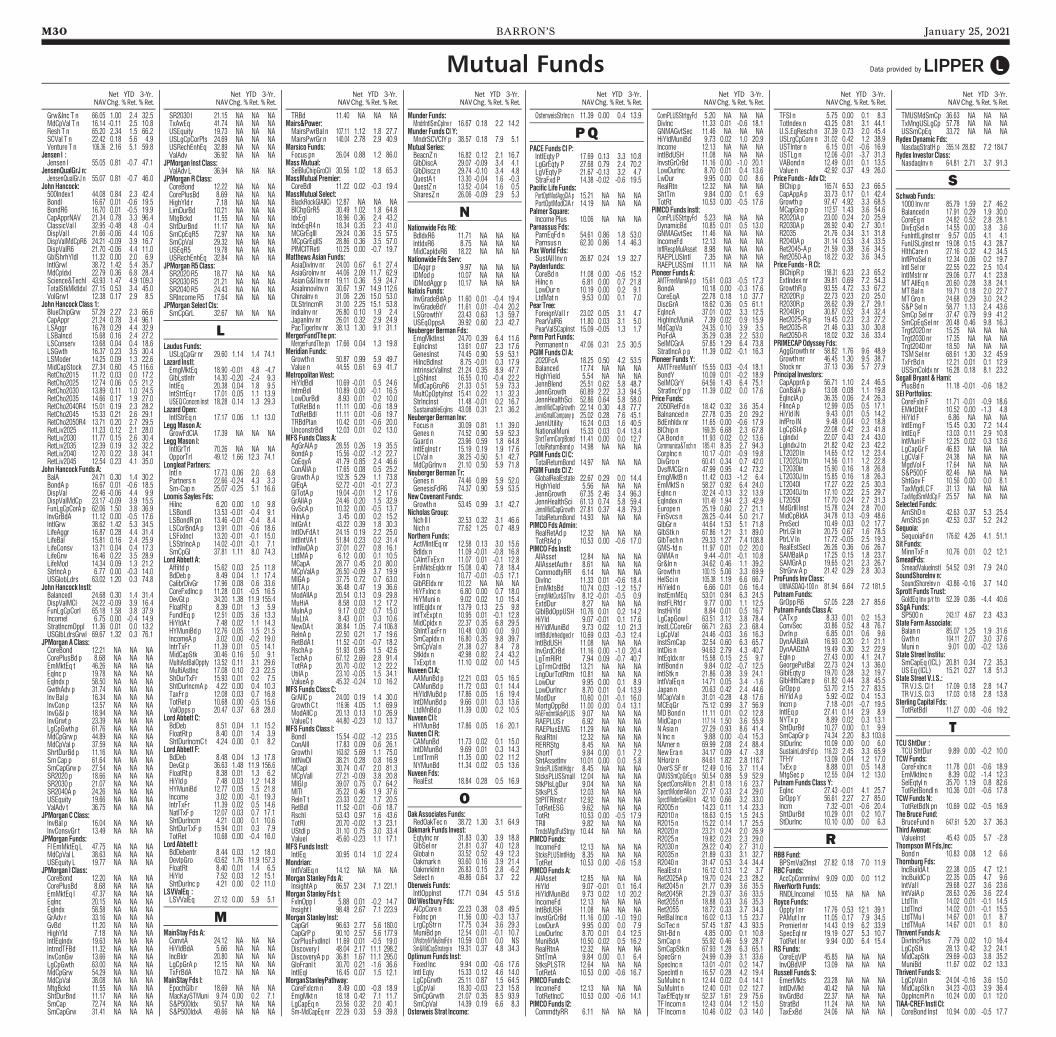
M30 BARRON’S January 25, 2021
Net YTD 3-Yr.NAVChg. %Ret. %Ret.
Net YTD 3-Yr.NAVChg. %Ret. %Ret.
Net YTD 3-Yr.NAVChg. %Ret. %Ret.
Net YTD 3-Yr.NAVChg. %Ret. %Ret.
Net YTD 3-Yr.NAVChg. %Ret. %Ret.
Net YTD 3-Yr.NAVChg. %Ret. %Ret.
Net YTD 3-Yr.NAVChg. %Ret. %Ret.
Net YTD 3-Yr.NAVChg. %Ret. %Ret.
Grw&Inc T n 66.05 1.00 2.4 32.5MdCpVal T n 16.14 -0.11 2.5 10.8Resh T n 65.20 2.34 1.5 66.2SCVal T n 22.42 0.18 5.6 4.9Venture T n 106.36 2.16 5.1 59.8Jensen I :Jensen I 55.05 0.81 -0.7 47.1JensenQualGrJ n:JensenQualGrJ n 55.07 0.81 -0.7 46.0John Hancock:500Index1 44.08 0.84 2.3 42.4BondI 16.67 0.01 -0.6 19.5BondR6 16.70 0.01 -0.5 19.9CapApprNAV 21.34 0.78 3.3 96.4ClassicVal I 32.95 -0.48 4.8 -0.4DispVal I 21.66 -0.06 4.4 10.6DispValMdCpR6 24.21 -0.09 3.9 16.7DispValR6 21.70 -0.06 4.4 11.0GblShrhYldI 11.32 0.00 2.0 6.9IntlGrwI 38.72 1.42 5.4 35.7MdCpIdxI 22.79 0.36 6.8 28.4Science&TechI 43.93 1.47 4.9 109.3TotalStkMktIdxI 27.15 0.53 3.4 45.0VolGrw1 12.38 0.17 2.9 8.5John Hancock Class 1:BlueChipGrw 57.29 2.27 2.3 66.6CapAppr 21.24 0.78 3.4 96.1LSAggr 16.78 0.29 4.4 32.9LSBalncd 15.68 0.16 2.4 27.2LSConserv 13.68 0.04 0.4 18.6LSGwth 16.37 0.23 3.5 30.4LSModer 14.25 0.09 1.3 22.6MidCapStock 27.34 0.60 4.5 116.6RetCho2015 11.72 0.03 0.0 17.2RetCho2025 12.74 0.06 0.5 21.2RetCho2030 13.89 0.11 1.0 24.5RetCho2035 14.66 0.17 1.9 27.0RetCho2040R4 15.01 0.19 2.3 28.2RetCho2045 15.33 0.21 2.6 29.1RetCho2050R4 13.71 0.20 2.7 29.5RetLiv2025 11.23 0.12 2.1 28.0RetLiv2030 11.77 0.15 2.6 30.4RetLiv2035 12.39 0.19 3.2 32.2RetLiv2040 12.70 0.22 3.8 34.1RetLiv2045 12.54 0.23 4.1 35.0John Hancock Funds A:BalA 24.71 0.30 1.4 30.2BondA p 16.67 0.01 -0.6 18.5DispVal 22.46 -0.06 4.4 9.9DispValMdCp 23.17 -0.09 3.9 15.5FunLgCpCorA p 62.06 1.50 3.8 36.9InvGrBdA 11.12 0.00 -0.5 17.6IntlGrw 38.62 1.42 5.3 34.5LifeAggr 16.87 0.28 4.4 31.4LifeBal 15.81 0.16 2.4 25.9LifeConsv 13.71 0.04 0.4 17.3LifeGrw 16.46 0.22 3.5 28.9LifeMod 14.34 0.09 1.3 21.2StrIncA p 6.77 0.00 -0.3 14.0USGlobLdrs 63.02 1.20 0.3 74.8John Hancock Instl:BalancedI 24.68 0.30 1.4 31.4DispValMCI 24.22 -0.09 3.9 16.4FunLgCpCorI 65.18 1.58 3.8 37.9IncomeI 6.75 0.00 -0.4 14.9StratIncmOppI 11.36 0.01 0.0 13.2USGlbLdrsGrwI 69.67 1.32 0.3 76.1JPMorgan A Class:CoreBond 12.21 NA NA NACorePlusBd p 8.68 NA NA NAEmMktEq t 46.26 NA NA NAEqInc p 19.78 NA NA NAEqIndx p 58.50 NA NA NAGwthAdv p 31.74 NA NA NAInv Bal p 16.34 NA NA NAInvCon p 13.57 NA NA NAInvG&I p 18.94 NA NA NAInvGrwt p 23.39 NA NA NALgCpGwth p 61.76 NA NA NAMdCpGrw p 44.89 NA NA NAMdCpVal p 37.59 NA NA NAShrtDurBd p 11.16 NA NA NASmCap p 61.64 NA NA NASmCapGrw p 27.54 NA NA NASR2020 p 18.66 NA NA NASR2030 p 21.07 NA NA NASR2040A p 24.26 NA NA NAUSEquity 19.66 NA NA NAValAdv t 36.75 NA NA NAJPMorgan C Class:InvBal p 16.04 NA NA NAInvConsvGr t 13.49 NA NA NAJPMorgan Funds:Fl EmMktEq L 47.75 NA NA NAMdCpVal L 38.63 NA NA NAUSEquity L 19.77 NA NA NAJPMorgan I Class:CoreBond 12.20 NA NA NACorePlusBd 8.68 NA NA NAEmMktEq I 47.37 NA NA NAEqInc 20.15 NA NA NAEqIndx 58.58 NA NA NAGrAdv r 33.16 NA NA NAGvBd 11.20 NA NA NAHighYld 7.18 NA NA NAIntlEqIndx 19.63 NA NA NAIntmdTFBd 11.32 NA NA NAInvConGw 13.66 NA NA NALgCpGwth 63.00 NA NA NAMdCpGrw 54.29 NA NA NAMdCpVal 38.08 NA NA NAMtgBckd 11.55 NA NA NAShtDurBnd 11.17 NA NA NASmCap 72.74 NA NA NASmCapGrw 31.41 NA NA NA
SR2030 I 21.15 NA NA NATxAwEq 41.74 NA NA NAUSEquity 19.73 NA NA NAUSLgCpCorPls 24.69 NA NA NAUSRechEnhEq 32.89 NA NA NAValAdv 36.92 NA NA NAJPMorgan Inst Class:ValAdv L 36.94 NA NA NAJPMorgan R Class:CoreBond 12.22 NA NA NACorePlusBd 8.69 NA NA NAHighYld r 7.18 NA NA NALimDurBd 10.21 NA NA NAMtgBckd 11.55 NA NA NAShtDurBnd 11.17 NA NA NASmCpEqR5 72.97 NA NA NASmCpVal 29.32 NA NA NAUSEqR5 19.78 NA NA NAUSRechEnhEq 32.84 NA NA NAJPMorgan R5 Class:SR2020 R5 18.77 NA NA NASR2030 R5 21.21 NA NA NASR2040 R5 24.43 NA NA NASRIncome R5 17.64 NA NA NAJPMorgan Select Cls:SmCpGrL 32.67 NA NA NA
LLaudus Funds:USLgCpGr nr 29.60 1.14 1.4 74.1Lazard Instl:EmgMktEq 18.90 -0.01 4.8 -4.7GlbLstInfr 14.30 -0.20 -2.4 9.3IntlEq 20.38 0.04 1.8 9.5IntStrtEq r 17.01 0.05 1.1 13.9USEQ Concen Inst 18.28 0.14 1.3 29.3Lazard Open:IntlStrEq n 17.17 0.06 1.1 13.0LeggMason A:GrowFdClA 17.39 NA NA NALeggMason I:IntlGrTrI 70.26 NA NA NAOpporTrI 49.12 1.66 12.3 74.1Longleaf Partners:Intl n 17.73 0.06 2.0 6.8Partners n 22.66 -0.24 4.3 3.3Sm-Cap n 25.07 -0.25 5.1 16.6Loomis Sayles Fds:HiInc 6.20 0.00 1.0 9.8LSBondI 13.53 -0.01 -0.4 9.1LSBondR pn 13.46 -0.01 -0.4 8.4LSCorBndA p 13.91 0.01 -0.6 18.6LSFixIncl 13.20 -0.01 -0.1 15.0LSStrIncA p 14.02 -0.01 -0.1 7.1SmCpGI 37.81 1.11 8.0 74.3Lord Abbett A:Affiltd p 15.62 0.03 2.5 11.8BdDeb p 8.49 0.04 1.1 17.4CalibrDivGr 17.96 0.08 0.6 33.6CoreFxdInc p 11.28 0.01 -0.5 16.5DevGt p 34.20 1.38 11.9 155.4FloatRt p 8.39 0.01 1.3 5.9FundlEq p 12.51 0.05 3.6 13.3HiYldA t 7.48 0.02 1.1 14.3HYMuniBd p 12.76 0.05 1.5 21.5IncomeA p 3.02 0.00 -0.2 19.0IntrTxFr 11.39 0.01 0.5 14.1MidCapStk 30.46 0.16 5.0 9.1MultiAstBalOppty 13.52 0.11 3.1 29.6MultiAstInc 17.08 0.10 2.3 22.5ShDurTxFr 15.93 0.01 0.2 7.5ShtDurIncmA p 4.22 0.00 0.4 10.3TaxFr p 12.08 0.03 0.7 16.8TotRet p 10.68 0.00 -0.5 15.6ValOpps p 20.47 0.37 6.8 28.0Lord Abbett C:BdDeb 8.51 0.04 1.1 15.2FloatRt p 8.40 0.01 1.4 3.9ShtDurIncmC t 4.24 0.00 0.1 8.2Lord Abbett F:BdDeb 8.48 0.04 1.3 17.8DevGt p 36.63 1.48 11.9 156.6FloatRt p 8.38 0.01 1.3 6.2HiYld p 7.48 0.03 1.2 14.8HYMuniBd 12.77 0.05 1.5 21.8Income 3.02 0.00 -0.1 19.3IntrTxFr 11.39 0.02 0.5 14.6NatlTxF p 12.07 0.03 0.7 17.1ShtDurIncm 4.21 0.00 0.1 10.6ShtDurTxF p 15.94 0.01 0.3 7.9TotRet 10.68 0.00 -0.4 16.0Lord Abbett I:BdDebentr 8.44 0.03 1.2 18.0DevlpGro 43.62 1.76 11.9 157.3FloatRt 8.40 0.01 1.4 6.5HiYld 7.52 0.03 1.2 15.1ShtDurInc p 4.21 0.00 0.2 11.0LSVValEq :LSVValEq 27.12 0.00 5.9 5.1
MMainStay Fds A:ConvtA 24.12 NA NA NAHiYldBdA 5.66 NA NA NAIncBldr 20.80 NA NA NALgCpGrA p 12.15 NA NA NATxFrBdA 10.72 NA NA NAMainStay Fds I:EpochGlb r 18.69 NA NA NAMacKaySTMuni 9.74 0.00 0.2 7.1S&P500Idx 50.57 NA NA NAS&P500IdxA 49.66 NA NA NA
TRBd 11.40 NA NA NAMairs&Power:MairsPwrBal n 107.11 1.12 1.8 27.7MairsPwrGr n 140.04 2.78 2.9 40.9Marsico Funds:Focus pn 26.04 0.88 1.2 86.0MassMutual:SelBluChipGroClI 30.56 1.02 1.8 65.3MassMutual Premier:CoreBdI 11.22 0.02 -0.3 19.4MassMutual Select:BlackRockGlAllCi 12.87 NA NA NABlChpGrR5 30.49 1.02 1.8 64.8IdxEqI 18.96 0.36 2.4 43.2IndxEqR4 n 18.34 0.35 2.3 41.0MCGrEqIII 29.24 0.36 3.5 57.5MCpGrEqIIS 28.86 0.36 3.5 57.0PIMCITRetI 10.25 0.00 -0.7 19.7Matthews Asian Funds:AsiaDivInv nr 24.00 0.67 6.1 27.4AsiaGroInv nr 44.06 2.09 11.7 62.9Asian G&I Inv nr 19.11 0.36 5.9 24.7AsiaInnovInv n 30.67 1.97 14.9 112.6ChinaInv n 31.06 2.26 15.0 53.0DLStrIncmR 31.00 2.25 15.1 53.8IndiaInv nr 26.80 0.10 1.9 2.4JapanInv nr 26.01 0.32 2.9 24.9PacTigerInv nr 38.13 1.30 9.1 31.1MergerFundThe pn:MergerFundThe pn 17.66 0.04 1.3 19.8Meridian Funds:Growth n 50.87 0.99 5.9 49.7Value n 44.55 0.61 6.9 41.7MetropolitanWest:HiYldBdI 10.69 -0.01 0.5 24.6IntmBdI 10.89 0.00 -0.1 16.5LowDurBdI 8.93 0.01 0.2 10.0TotRetBd n 11.11 0.00 -0.6 18.9TotRetBdI 11.11 0.01 -0.6 19.7TRBdPlan 10.42 0.01 -0.6 20.0UnconstrBdI 12.03 0.01 0.2 13.0MFS Funds Class A:AgGrAlA p 28.55 0.26 1.9 35.5BondA p 15.56 -0.02 -1.2 22.7CoEqyA 41.79 0.85 2.4 46.6ConAllA p 17.65 0.08 0.5 25.2Growth A p 152.26 5.29 1.1 73.8GlEqA 52.72 -0.01 -0.1 27.3GlTotA p 19.04 -0.01 1.2 17.6GrAllA p 24.46 0.20 1.5 32.9GvScA p 10.32 0.00 -0.5 13.7HiInA p 3.45 0.00 0.2 15.2IntGrA t 43.22 0.39 1.8 30.3IntlDvFdA t 24.15 0.19 2.2 25.0IntlIntVA t 51.84 0.23 0.2 31.4IntNwDA p 37.01 0.27 0.8 16.1LtdMA p 6.12 0.00 0.1 10.5MCapA 28.77 0.45 2.0 80.0MCpValA p 26.50 -0.09 3.7 19.9MIGA p 37.75 0.72 0.7 63.0MITA p 36.48 0.47 1.9 36.6ModAllA p 20.54 0.13 0.9 29.8MuHiA 8.58 0.03 1.2 17.2MuInA p 9.17 0.02 0.7 15.0MuLtA 8.43 0.01 0.3 10.6NewDA t 38.84 1.05 7.4 106.8ReInA p 22.50 0.21 1.7 19.6RetBdA t 11.52 -0.01 -0.7 18.2RschA p 51.93 0.95 1.5 42.6TechA p 67.12 2.69 2.8 91.4TotRA p 20.70 -0.02 1.2 22.2UtilA p 23.10 -0.05 1.5 34.1ValueA p 45.32 -0.24 1.0 16.2MFS Funds Class C:GrAllC p 24.00 0.19 1.4 30.0Growth C t 116.96 4.05 1.1 69.9ModAllC p 20.13 0.13 1.0 26.9ValueC t 44.80 -0.23 1.0 13.7MFS Funds Class I:BondI 15.54 -0.02 -1.2 23.5ConAllI 17.83 0.09 0.6 26.1Growth I 163.62 5.69 1.1 75.0IntNwDI 38.21 0.28 0.8 16.9MCapI 30.74 0.47 2.0 81.3MCpValI 27.21 -0.09 3.8 20.8MIGI p 39.07 0.75 0.7 64.2MITI 35.22 0.46 1.9 37.6ReInT t 23.33 0.22 1.7 20.5RetBdI 11.52 -0.01 -0.6 18.7RschI 53.43 0.97 1.6 43.6TotRI 20.70 -0.02 1.3 23.1UStdI p 31.10 0.75 3.0 33.4ValueI 45.60 -0.23 1.1 17.1MFS Funds Instl:IntlEq 30.95 0.14 1.0 22.4Mondrian:IntlValEq n 14.12 NA NA NAMorgan Stanley Fds A:InsightA p 86.57 2.34 7.1 221.1Morgan Stanley Fds I:FxInOpp I 5.88 0.01 -0.2 14.7Insight I 98.48 2.67 7.1 223.9Morgan Stanley Inst:CapGrI 96.63 2.77 5.6 180.0CapGrP p 90.10 2.57 5.6 177.9CorPlusFxdIncI 11.69 0.01 -0.5 19.0Discovery I 48.04 2.17 11.1 298.2DiscoveryA p p 36.81 1.67 11.1 295.0GloFranI t 30.70 0.21 -1.6 36.6IntlEqI 16.45 0.07 1.5 12.1MorganStanleyPathway:CoreFxIcm n 8.49 0.00 -0.8 18.9EmgMkt n 18.18 0.42 7.1 11.7LgCapEq n 23.56 0.32 2.0 40.1Sm-MdCapEq nr 22.29 0.33 5.9 39.8
Munder Funds:MndrIntlSmCpInv r 16.67 0.18 2.2 14.2Munder Funds Cl Y:MndrSCVClY p 38.57 0.18 7.9 5.1Mutual Series:BeacnZ n 16.82 0.12 2.1 16.7GlbDiscA 29.07 -0.09 3.4 4.1GlbDiscz n 29.74 -0.10 3.4 4.8QuestA t 13.30 -0.04 1.6 -0.3QuestZ n 13.52 -0.04 1.6 0.5SharesZ n 26.06 -0.09 2.9 5.3
NNationwide Fds R6:BdIdxR6 11.71 NA NA NAIntIdxR6 8.75 NA NA NAMidCapIdxR6 18.22 NA NA NANationwide Fds Serv:IDAggr p 9.97 NA NA NAIDMod p 10.07 NA NA NAIDModAggr p 10.17 NA NA NANatixis Funds:InvGradeBdA p 11.60 0.01 -0.4 19.4InvGradeBdY 11.61 0.01 -0.4 20.2LSGrowthY 23.43 0.63 1.3 59.7USEqOppsA 39.92 0.60 2.3 42.7Neuberger Berman Fds:EmgMktInst 24.70 0.39 6.4 11.6EqIncInst 13.61 0.07 2.3 17.6GenesInst 74.45 0.90 5.9 53.1HiIncBdInst 8.75 -0.01 0.3 17.9IntrinsicValInst 21.24 0.35 8.9 47.7LgShInst 16.55 0.10 -0.4 22.2MidCapGroR6 21.33 0.51 5.9 73.3MultCpOptyInst 15.41 0.22 1.1 32.3StrIncInst 11.48 -0.01 0.2 16.7SustainableEqIns 43.08 0.31 2.1 36.2Neuberger Berman Inv:Focus n 30.09 0.81 1.1 39.0Genes n 74.52 0.90 5.9 52.3Guard n 23.96 0.59 1.8 64.8IntlEqInst r 15.19 0.19 1.9 17.6LCVal n 38.25 -0.50 5.1 42.7MdCpGrInv n 21.10 0.50 5.9 71.8Neuberger Berman Tr:Genes n 74.46 0.89 5.9 52.0GenesisFdR6 74.37 0.90 5.9 53.5New Covenant Funds:Growth n 53.45 0.99 3.1 42.7Nicholas Group:Nch II I 32.53 0.32 3.1 46.6Nich n 77.62 1.25 0.7 48.9Northern Funds:ActMIntlEq nr 12.58 0.13 3.0 15.6BdIdx n 11.09 -0.01 -0.8 16.8CAIntTxEx n 11.07 0.01 -0.1 12.8EmMktsEqIdx nr 15.08 0.40 7.8 18.4FixIn n 10.77 -0.01 -0.5 17.1GlbREIdx nr 10.22 NA NA NAHiYFxInc n 6.80 0.00 0.7 18.0HiYMuni n 9.02 0.02 1.0 15.4IntlEqIdx nr 13.79 0.13 2.5 9.8IntTxExpt n 10.95 0.01 -0.1 12.8MidCpIdx n 22.37 0.35 6.8 29.5ShIntTaxFr n 10.48 0.00 0.0 9.0SmCapIdx n 16.80 0.35 9.8 39.7SmCpVal n 21.38 0.27 8.4 7.8StkIdx n 42.98 0.82 2.4 43.2TxExpt n 11.10 0.02 0.0 14.5Nuveen Cl A:AAMunBd p 12.21 0.03 0.5 16.5CAMunBd p 11.72 0.03 0.1 14.4HiYldMuBd p 17.86 0.05 1.6 19.4IntDMunBd p 9.66 0.01 0.3 13.6LtdMnBd p 11.39 0.00 0.2 10.5Nuveen Cl I:HYMunBd 17.86 0.05 1.6 20.1Nuveen Cl R:CAMunBd 11.73 0.02 0.1 15.0IntDMunBd 9.69 0.01 0.3 14.3LmtTrmR 11.35 0.00 0.2 11.2NYMunBd 11.34 0.02 0.5 13.6Nuveen Fds:RealEst 18.84 0.28 0.5 16.9
OOak Associates Funds:RedOakTec n 38.72 1.30 3.1 64.9Oakmark Funds Invest:EqtyInc nr 31.83 0.30 3.9 18.8GlbSel nr 21.81 0.37 4.0 12.8Global n 33.52 0.52 4.9 12.3Oakmark n 93.60 0.16 3.9 21.4OakmrkInt n 26.83 0.15 2.8 -6.2Select n 49.86 0.64 3.7 2.2Oberweis Funds:IntlOppInst 17.71 0.94 4.5 51.6OldWestbury Fds:AlCpCore n 22.23 0.38 0.8 49.5FixInc pn 11.56 0.00 -0.3 13.7LrgCpStr n 17.75 0.34 3.6 29.3MuniBd pn 12.54 0.01 -0.1 10.7OWstbryNYMuBndFd n 10.59 0.01 0.0 NSSm&MdCapStrategi n 19.31 0.37 4.8 34.3Optimum Funds Inst:Fixed Inc 9.94 0.00 -0.6 17.6Intl Eqty 15.33 0.12 4.6 14.0LgCpGrwth 25.11 0.87 1.5 64.5LgCpVal 18.30 -0.03 2.3 15.8SmCpGrwth 21.07 0.35 8.5 93.9SmCpVal 14.39 0.19 6.6 8.3Osterweis Strat Income:
OsterweisStrInc n 11.39 0.00 0.4 13.9
PQPACE Funds Cl P:IntlEqty P 17.69 0.13 3.3 10.8LgGrEqty P 27.68 0.79 2.4 70.2LgVEqty P 21.67 -0.13 3.2 4.7StraFxd P 14.38 -0.02 -0.6 19.5Pacific Life Funds:PortOptModAggClA p 15.21 NA NA NAPortOptModClA r 14.19 NA NA NAPalmer Square:Income Plus 10.06 NA NA NAParnassus Fds:ParnEqFd n 54.61 0.86 1.8 53.0Parnsus n 62.30 0.86 1.4 46.3PaxWorld Fds:SustAll Inv n 26.87 0.24 1.9 32.7Paydenfunds:CoreBd n 11.08 0.00 -0.6 15.2HiInc n 6.81 0.00 0.7 21.8LowDur n 10.19 0.00 0.2 9.1LtdMat n 9.53 0.00 0.1 7.0Pear Tree:ForeignVal I r 23.02 0.05 3.1 4.7PearValR6 11.80 0.03 3.1 5.0PearValSCapInst 15.09 -0.05 1.3 1.7Perm Port Funds:Permanent n 47.06 0.31 2.5 30.5PGIM Funds Cl A:2020FcA 18.25 0.50 4.2 53.5Balanced 17.74 NA NA NAHighYield 5.54 NA NA NAJennBlend 25.51 0.62 5.8 48.7JennGrowth 60.89 2.22 3.3 94.5JennHealthSci 52.86 0.64 5.8 58.0JennMidCapGrowth 22.14 0.30 4.8 77.7JennSmallCompany p 25.02 0.28 7.6 45.1JennUtility 16.24 0.03 1.6 40.5NationalMuni 15.33 0.03 0.4 13.4ShrtTermCorpBond 11.41 0.00 0.0 12.7TotalReturnBond p 14.98 NA NA NAPGIM Funds Cl C:TotalReturnBond 14.97 NA NA NAPGIM Funds Cl Z:GlobalRealEstate 22.67 0.29 0.0 14.4HighYield 5.56 NA NA NAJennGrowth 67.35 2.46 3.4 96.3JennHealthSci 61.13 0.74 5.8 59.4JennMidCapGrowth 27.81 0.37 4.8 79.3TotalReturnBond 14.93 NA NA NAPIMCO Fds Admin:RealRetAd p 12.32 NA NA NATotRtAd p 10.53 0.00 -0.6 17.0PIMCO Fds Instl:AllAsset 12.84 NA NA NAAllAssetAuth r 8.61 NA NA NACommodtyRR 6.14 NA NA NADivInc 11.33 0.01 -0.6 18.4EmMktsBd 10.74 0.03 -1.2 15.7EmrgMktCur&STInv 8.12 -0.01 -0.5 0.9ExtdDur 8.27 NA NA NAGlblBdOppUSH 10.76 0.01 0.2 14.2HiYld 9.07 -0.01 0.1 17.6HiYldMuniBd 9.73 0.02 1.0 21.3IntlBdUnhedged r 10.69 0.03 -0.3 12.4IntlBdUSH 11.08 NA NA NAInvGrdCrBd 11.16 0.00 -1.0 20.4LgTmRlRt 7.94 0.09 -0.7 40.7LgTrmCrdtBd 13.21 NA NA NALngDurTotRtrn 10.81 NA NA NALowDur 9.95 0.00 0.1 8.9LowDurInc r 8.70 0.01 0.4 13.9ModDur 10.60 0.01 -0.1 16.0MortgOppBd 11.00 0.00 0.4 13.1RAEFndmtlAdvPLUS 9.07 NA NA NARAEPLUS r 6.92 NA NA NARAEPlusEMG 11.29 NA NA NARealRtnI 12.32 NA NA NARERRStg 8.45 NA NA NAShortT 9.84 0.00 0.1 7.2ShtAssetInv 10.01 0.00 0.0 5.8StcksPLUSIntlHdg r 8.45 NA NA NAStcksPLUSSmall 12.04 NA NA NAStkPlsLgDur 9.04 NA NA NAStksPLS 12.03 NA NA NAStPlTRInst r 12.92 NA NA NATotRetESG 9.62 NA NA NATotRt 10.53 0.00 -0.5 17.9TRII 9.82 NA NA NATrndsMgdFutStrgy 10.44 NA NA NAPIMCO Funds:IncomeFd 12.13 NA NA NAStcksPLUSIntlHdg 8.35 NA NA NATotRet 10.53 0.00 -0.6 15.8PIMCO Funds A:AllAsset 12.85 NA NA NAHiYld 9.07 -0.01 0.1 16.4HiYldMuniBd 9.73 0.02 1.0 20.2IncomeFd 12.13 NA NA NAIntlBdUSH 11.08 NA NA NAInvstGrCrBd 11.16 0.00 -1.0 19.0LowDurA 9.95 0.00 0.0 7.9LowDurInc 8.70 0.01 0.4 12.5MuniBdA 10.50 0.02 0.5 16.2RealRtnA 12.32 NA NA NAShtTmA 9.84 0.00 0.1 6.4StksPLSTR 12.64 NA NA NATotRetA 10.53 0.00 -0.6 16.7PIMCO Funds C:IncomeFd 12.13 NA NA NATotRetIncC 10.53 0.00 -0.6 14.1PIMCO Funds I2:CommdtyRR 6.11 NA NA NA
ComPLUSStrtgyFd 5.20 NA NA NADivInc 11.33 0.01 -0.6 18.1GNMAGvtSec 11.46 NA NA NAHiYldMuniBd 9.73 0.02 1.0 20.9Income 12.13 NA NA NAIntlBdUSH 11.08 NA NA NAInvstGrCrBd 11.16 0.00 -1.0 20.1LowDurInc 8.70 0.01 0.4 13.6LwDur 9.95 0.00 0.0 8.6RealRtn 12.32 NA NA NAShtTm 9.84 0.00 0.1 6.9TotRt 10.53 0.00 -0.5 17.6PIMCO Funds Instl:ComPLUSStrtgyFd 5.23 NA NA NADynamicBd 10.85 0.01 0.5 13.0GNMAGvtSec 11.46 NA NA NAIncomeFd 12.13 NA NA NAInflRespMulAsset 8.98 NA NA NARAEPLUSIntl 7.35 NA NA NARAEPLUSSml 11.11 NA NA NAPioneer Funds A:AMTFreeMuniA p p 15.61 0.03 -0.5 17.3BondA 10.18 0.00 -0.3 17.6CoreEqA 22.78 0.18 1.0 37.7DiscGrA 18.62 0.36 0.5 61.1EqIncA 37.01 0.02 3.3 12.5HighIncMuniA 7.39 0.02 0.9 15.9MdCapVa 24.35 0.10 3.9 3.5PioFdA 35.29 0.38 2.2 53.0SelMCGrA 57.85 1.29 6.4 73.8StratIncA p p 11.39 0.02 -0.1 16.3Pioneer Funds Y:AMTFreeMuniY 15.55 0.03 -0.4 18.1BondY 10.09 0.01 -0.2 18.9SelMCGrY 64.56 1.43 6.4 75.1StratIncY p p 11.39 0.02 0.0 17.6Price Funds:2050RetFd n 18.42 0.32 3.6 35.4Balnanced n 27.78 0.35 2.0 29.2BdEnhIdx nr 11.65 0.00 -0.6 17.9BlChip n 169.35 6.68 2.3 67.8CA Bond n 11.93 0.02 0.2 13.6Communica&Tech n 185.41 8.35 2.7 94.3CorpInc n 10.17 -0.01 -0.9 19.8DivGro n 60.41 0.34 0.7 42.0DvsfMCGr n 47.99 0.95 4.2 73.2EmgMktB n 11.42 0.03 -1.2 6.4EmMktS n 58.27 0.92 6.4 24.0EqInc n 32.24 -0.13 3.2 13.9EqIndex n 101.49 1.94 2.3 42.9Europe n 25.19 0.60 2.7 21.1FinSvcs n 28.25 -0.44 5.0 21.7GlbGr n 44.64 1.53 5.1 71.8GlbStk n 67.86 1.21 3.1 89.0GlbTech n 29.33 1.27 7.4 108.8GMS-fd n 11.97 0.01 0.2 20.0GNMA n 9.44 -0.01 -0.1 10.8Gr&In n 34.62 0.46 1.1 39.2Growth n 100.15 5.06 3.3 69.9HelSci n 105.38 1.19 6.6 66.7HiYield n 6.66 0.01 0.6 16.4InstEmMEq 53.01 0.84 6.3 24.5InstFLRfd r 9.77 0.00 1.1 12.5InstHiYld 8.84 0.01 0.5 16.7LgCapGow I 63.51 3.12 3.8 78.4InstLCCoreGr 66.71 2.63 2.3 68.4LgCpVal 24.46 -0.03 3.6 16.3InstSmCap 32.54 0.60 6.3 65.7IntDis n 94.63 2.79 4.3 40.7IntEqIdx nr 15.58 0.15 2.5 9.7IntlBond n 9.84 0.02 -0.7 12.5IntlStk n 21.86 0.38 3.9 24.1IntlValEq n 14.71 0.05 3.4 -1.6Japan n 20.63 0.42 2.4 44.6MCapVal n 31.01 -0.28 4.8 17.6MCEqGr 75.12 0.99 3.7 56.9MD Bond n 11.11 0.01 0.2 12.8MidCap n 117.14 1.50 3.6 55.9N Asia n 27.29 0.93 8.6 41.4N Inc n 9.88 0.00 -0.4 15.3NAmer n 69.99 2.08 2.4 88.4New Era n 34.17 0.09 4.7 -3.8NHoriz n 84.61 1.82 2.8 118.7OverS SF nr 12.49 0.16 3.7 11.4QMUSSmCpGrEq n 50.54 0.88 5.9 52.9SpectConsAllo n 21.81 0.18 1.6 23.7SpectModerAllo n 27.17 0.33 2.4 29.0SpectModerGwAllo n 42.10 0.66 3.2 33.0R2005 n 14.23 0.11 1.4 23.3R2010 n 18.63 0.15 1.5 24.5R2015 n 15.22 0.14 1.7 25.5R2020 n 23.21 0.24 2.0 26.9R2025 n 19.82 0.23 2.3 29.0R2030 n 29.22 0.40 2.7 31.0R2035 n 21.89 0.33 3.1 32.7R2040 n 31.47 0.53 3.4 34.4RealEst n 16.12 0.13 1.2 3.7Ret2025A p 19.70 0.24 2.3 28.2Ret2045 n 21.77 0.39 3.6 35.5Ret2045R 21.29 0.37 3.6 33.5Ret2055 n 18.88 0.33 3.6 35.3Ret2055 18.72 0.33 3.7 34.3RetBal Inc n 16.02 0.13 1.5 23.7SciTec n 57.45 1.87 4.3 93.5Sht-Bd n 4.85 0.00 0.1 10.8SmCap n 55.92 0.46 5.9 28.7SmCapStk n 67.93 1.28 6.3 65.1SpecGr n 24.99 0.39 3.1 33.6SpecInc n 13.01 -0.01 0.2 14.7SpecIntl n 16.57 0.28 4.2 19.4SuMuInc n 12.44 0.02 0.4 14.1SuMuInt n 12.40 0.01 0.2 12.7TaxEfEqty nr 52.37 1.61 2.9 75.6TF Incom n 12.43 0.04 1.2 15.0TF Incom n 10.46 0.02 0.3 14.0
TFSI n 5.75 0.00 0.1 8.3TotIndex n 43.25 0.81 3.1 44.1U.S.EqResch n 37.39 0.73 2.0 45.4USLrgCpCore n 31.02 0.42 1.2 38.9USTInter n 6.15 0.01 -0.6 16.9USTLg n 12.06 -0.01 -3.7 31.3VABond n 12.49 0.01 0.1 13.5Value n 42.92 0.37 4.9 26.0Price Funds - Adv Cl:BlChip p 165.74 6.53 2.3 66.5CapAppA p 33.73 0.17 0.1 42.4Growth p 97.47 4.92 3.3 68.5MCapGro p 112.57 1.43 3.6 54.6R2020A p 23.00 0.24 2.0 25.9R2030A p 28.92 0.40 2.7 30.1R2035 21.76 0.34 3.1 31.8R2040A p 31.14 0.53 3.4 33.5Ret2045-A p 21.59 0.38 3.6 34.5Ret2050-A p 18.22 0.32 3.6 34.5Price Funds - R Cl:BlChipR p 158.31 6.23 2.3 65.2ExtIndex nr 39.81 0.69 7.2 54.3GrowthR p 93.55 4.72 3.3 67.2R2020R p 22.73 0.23 2.0 25.0R2030R p 28.62 0.39 2.7 29.1R2040R p 30.87 0.52 3.4 32.4Ret2025-R p 19.45 0.23 2.3 27.2Ret2035-R 21.46 0.33 3.0 30.8Ret2050-R 18.02 0.32 3.6 33.4PRIMECAP Odyssey Fds:AggGrowth nr 58.82 1.76 9.6 48.9Growth nr 46.45 1.30 9.5 38.7Stock nr 37.13 0.36 5.7 27.9Principal Investors:CapApprA p 56.71 1.10 2.4 46.5ConBalA p 13.08 0.08 1.1 19.8EqIncIA p 36.35 0.06 2.4 26.3FlIncA p 12.99 0.05 0.5 17.1HiYld IN 9.43 0.01 0.5 14.2InfPro IN 9.48 0.04 0.2 18.8LgCpStA p 22.08 0.42 2.3 41.8LgIndxI 22.07 0.43 2.4 43.0LgIndxJ tn 21.82 0.42 2.3 42.2LT2020 In 14.65 0.12 1.2 23.4LT2020J tn 14.56 0.11 1.2 22.8LT2030In 15.90 0.16 1.8 26.8LT2030J tn 15.85 0.16 1.8 26.3LT2040I 17.27 0.22 2.5 30.3LT2040J tn 17.10 0.22 2.5 29.7LT2050I 17.70 0.24 2.7 31.3MdGrIII Inst 15.78 0.24 2.8 70.0MidCpBldA 34.78 0.13 -0.9 48.6PreSecI 10.49 0.03 0.2 17.7PtrLGI In 20.75 0.67 1.6 78.5PtrLV In 17.72 -0.05 2.5 19.3RealEstSecI 26.26 0.36 0.6 26.7SAMBalA p 17.25 0.15 1.8 23.7SAMGrA p 19.65 0.21 2.3 26.7StrGrw A p 21.42 0.29 2.8 30.3ProFunds Inv Class:UltNASDAQ-100 n 81.94 6.64 7.2 181.5Putnam Funds:GrOpp R6 57.05 2.28 2.7 85.6Putnam Funds Class A:CATx p 8.33 0.01 0.2 15.3ConvSec 33.86 0.52 4.8 76.7DvrIn p 6.85 0.01 0.6 9.6DynAABalA 16.93 0.20 2.1 21.1DynAAGthA 19.49 0.30 3.2 22.9EqIn p 27.43 0.00 4.1 24.7GeorgePutBal 22.73 0.24 1.3 36.0GlblEqty p 19.70 0.28 3.2 19.7GlbHlthCare p 61.82 0.44 3.8 45.5GrOpp p 53.70 2.15 2.7 83.5HiYld A p 5.92 -0.02 0.4 15.3Incm p 7.18 -0.01 -0.7 19.5IntlEq p 27.41 0.14 2.9 8.9NYTx p 8.89 0.02 0.3 13.1ShtDurBd 10.27 0.00 0.1 9.9SmCapGr p 74.34 2.20 8.3 103.6StDurInc 10.09 0.00 0.0 6.0SustainLdrsFd p 116.23 2.45 3.3 65.9TFHY 13.09 0.04 1.2 17.0TxEx p 8.88 0.01 0.5 14.8MtgSec p 12.55 0.04 1.2 13.0Putnam Funds Class Y:EqInc 27.43 -0.01 4.1 25.7GrOpp Y 56.61 2.27 2.7 85.0Incm 7.32 -0.01 -0.6 20.4ShtDurBd 10.29 0.01 0.2 10.7StDurInc 10.10 0.00 0.0 6.3
RRBB Fund:BPSmVal2Inst 27.82 0.18 7.0 11.9RBC Funds:AccCpCommInvI 9.09 0.00 0.0 11.2RiverNorth Funds:RNDLIncomeI 10.55 NA NA NARoyce Funds:Oppty I nr 17.76 0.53 12.1 39.1PAMut I nr 11.05 0.17 7.9 34.5PremierI nr 14.43 0.19 6.2 33.9SpecEqI nr 19.19 0.27 5.3 10.7TotRet I nr 9.94 0.00 6.4 15.4RS Funds:CoreEqVIP 45.85 NA NA NAInvQBdVIP 13.09 NA NA NARussell Funds S:EmerMkts 23.28 NA NA NAIntlDvMkt 40.42 NA NA NAInvGrdBd 22.37 NA NA NAStratBd 11.24 NA NA NATaxExBd 24.06 NA NA NA
TMUSMdSmCp 36.63 NA NA NATxMngUSLgCp 57.78 NA NA NAUSSmCpEq 33.72 NA NA NARydex Dynamic Fds:NasdaqStratH p 355.14 28.82 7.2 184.7Rydex Investor Class:NasdaqInv n 64.81 2.71 3.7 91.3
SSchwab Funds:1000 Inv nr 85.79 1.59 2.7 46.2Balanced n 17.91 0.29 1.9 30.0CoreEq n 24.82 0.52 2.8 28.1DivEqSel n 14.55 0.00 3.8 3.6FunIntlLgInst nr 9.57 0.05 4.1 4.1FunUSLgInst nr 19.08 0.15 4.3 28.7HlthCare n 27.16 0.32 4.2 34.5InflProSel n 12.34 0.06 0.2 19.7IntI Sel nr 22.55 0.22 2.5 10.4IntlMstr nr 29.06 0.77 4.1 23.8MT AllEq n 20.60 0.28 3.8 24.1MT Bal n 19.71 0.18 2.0 22.7MT Gro n 24.68 0.29 3.0 24.2S&P Sel n 58.77 1.13 2.4 43.6SmCp Sel nr 37.47 0.79 9.9 41.2SmCpEqSel nr 20.48 0.46 9.8 16.3Trgt2020 nr 15.25 NA NA NATrgt2030 nr 17.35 NA NA NATrgt2040 nr 18.50 NA NA NATSMSel nr 68.61 1.30 3.2 45.9TxFrBd n 12.21 0.01 0.1 12.9USSmCoIdx nr 16.28 0.18 8.1 23.2Segall Bryant & Hami:PlusBd n 11.18 -0.01 -0.6 18.2SEI Portfolios:CoreFxIn F 11.71 -0.01 -0.9 18.6EMktDbt F 10.52 0.00 -1.3 4.8HiYld F 6.86 NA NA NAIntlEmg F 15.45 0.30 7.2 14.4IntlEq F 13.03 0.11 2.9 10.8IntMuni F 12.25 0.02 0.3 13.6LgCapGr F 46.83 NA NA NALgCVal F 24.38 NA NA NAMgdVol F 17.64 NA NA NAS&P500 F 82.46 NA NA NAShtGov F 10.56 0.00 0.0 8.1TaxMgdLC F 31.13 NA NA NATaxMgdSmMdCp F 25.57 NA NA NASelected Funds:AmShD n 42.63 0.37 5.3 25.4AmShS pn 42.53 0.37 5.2 24.2Sequoia:SequoiaFd n 176.62 4.26 4.1 51.1Sit Funds:MinnTxF n 10.76 0.01 0.2 12.1SmeadFds:SmeadValueInstl 54.52 0.91 7.9 24.0SoundShoreInv n:SoundShoreInv n 43.86 -0.16 3.7 14.0Sprott Funds Trust:GoldEq Inv p/r tn 52.39 0.86 -4.4 40.6SSgA Funds:SP500 n 243.17 4.67 2.3 43.3State Farm Associate:Balan n 85.07 1.25 1.9 31.6Gwth n 104.11 2.07 3.0 37.6Muni n 9.01 0.00 -0.2 13.6State Street Institu:SmCapEq (ICL) 20.81 0.34 7.2 35.3US Eq (ICL) 15.21 0.27 1.8 51.3State Street V.I.S.:TR V.I.S. Cl 1 17.09 0.18 2.8 14.7TR V.I.S. Cl 3 17.03 0.18 2.8 13.8Sterling Capital Fds:TotRetBdI 11.27 0.00 -0.6 19.2
TTCU ShtDur :TCU ShtDur 9.89 0.00 -0.2 10.0TCW Funds:CoreFxInc n 11.78 0.01 -0.6 18.9EmMktInc n 8.39 0.02 -1.4 12.3SelEqtyI n 35.70 1.19 0.8 82.6TotRetBondI n 10.36 0.01 -0.6 17.8TCW Funds N:TotRetBdN pn 10.69 0.02 -0.5 16.9The Bruce Fund:BruceFund n 647.61 5.20 3.7 36.3Third Avenue:ValueInst 45.43 0.05 5.7 -2.8Thompson IM Fds,Inc:Bond n 10.83 0.08 1.2 6.6Thornburg Fds:IncBuildA t 22.38 0.05 4.7 12.1IncBuildC p 22.35 0.05 4.7 9.6IntVal I 29.68 0.27 3.6 23.6IntValA p 28.63 0.26 3.6 22.4LtdTIn 14.02 0.01 -0.1 14.5LtdTIncI 14.02 0.01 -0.1 15.5LtdTMu I 14.67 0.01 0.1 8.7LtdTMuA 14.67 0.01 0.1 8.0Thrivent Funds A:DivrIncPlus 7.79 0.02 1.0 16.4LgCpStk 28.13 0.42 3.2 24.1MidCapStk 29.69 -0.03 3.8 35.2MuniBd 11.67 0.02 0.2 13.3Thrivent Funds S:LgCpVal n 24.04 -0.16 3.6 15.0MidCapStk n 34.23 -0.03 3.9 36.4OppIncmPl n 10.24 0.00 0.1 12.0TIAA-CREF/Instl Cl:CoreBond Inst 10.94 0.00 -0.5 17.7
Data provided byMutual Funds
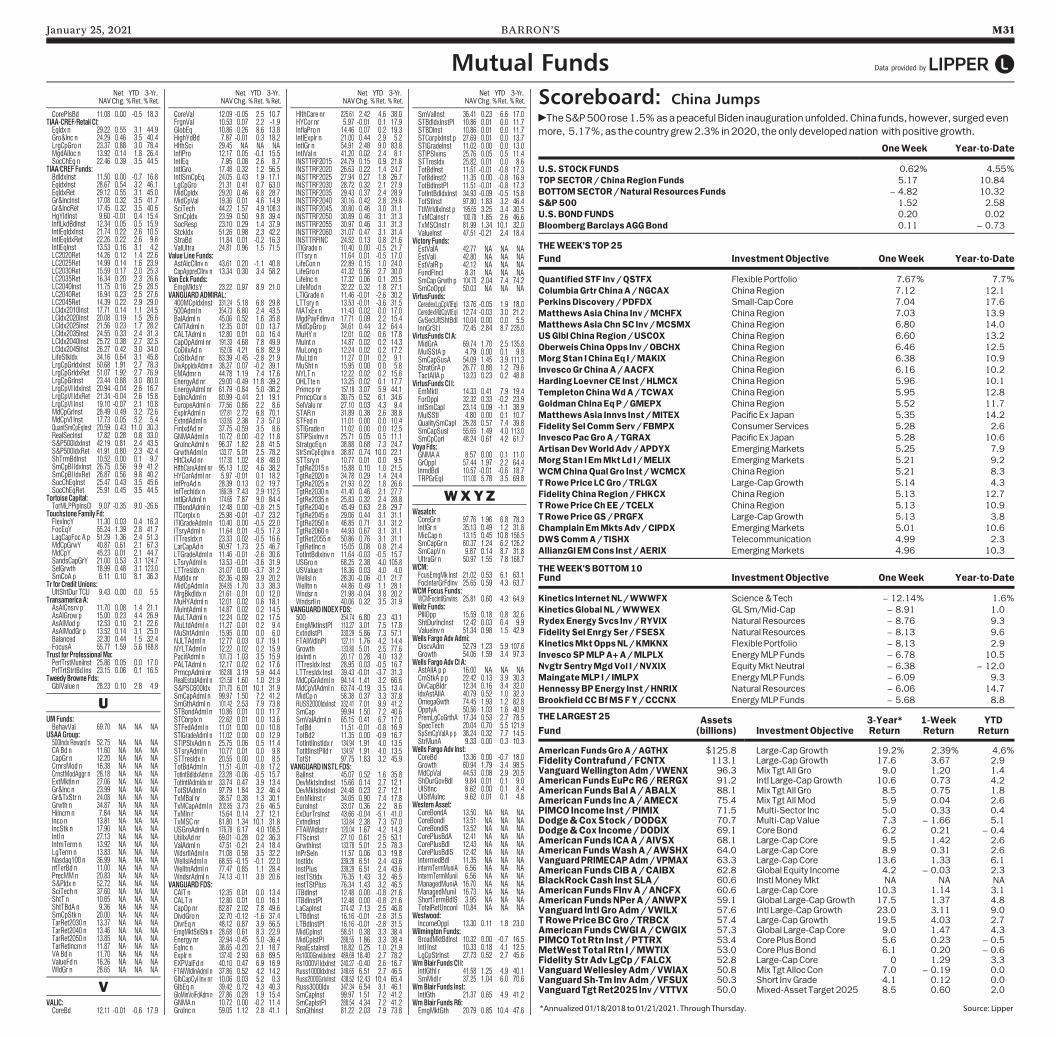
January 25, 2021 BARRON’S M31
Net YTD 3-Yr.NAVChg. %Ret. %Ret.
Net YTD 3-Yr.NAVChg. %Ret. %Ret.
Net YTD 3-Yr.NAVChg. %Ret. %Ret.
Net YTD 3-Yr.NAVChg. %Ret. %Ret.
CorePlsBd 11.08 0.00 -0.5 18.3TIAA-CREF/Retail Cl:EqIdx n 29.22 0.55 3.1 44.9Gro&Inc n 24.29 0.46 3.5 40.4LrgCpGro n 23.37 0.88 3.0 78.4MgdAlloc n 13.92 0.14 1.8 26.4SocChEq n 22.46 0.39 3.5 44.5TIAA/CREF Funds:BdIdxInst 11.50 0.00 -0.7 16.8EqIdxInst 28.67 0.54 3.2 46.1EqIdxRet 29.12 0.55 3.1 45.0Gr&IncInst 17.08 0.32 3.5 41.7Gr&IncRet 17.45 0.32 3.5 40.6HgYldInst 9.60 -0.01 0.4 15.4InflLkdBdInst 12.34 0.05 0.5 15.9IntlEqIdxInst 21.74 0.22 2.6 10.5IntlEqIdxRet 22.26 0.22 2.6 9.6IntlEqInst 13.53 0.16 3.1 4.2LC2020Ret 14.26 0.12 1.4 22.6LC2025Ret 14.99 0.14 1.6 23.9LC2030Ret 15.59 0.17 2.0 25.3LC2035Ret 16.34 0.20 2.3 26.6LC2040Inst 11.75 0.16 2.5 28.5LC2040Ret 16.94 0.23 2.5 27.6LC2045Ret 14.39 0.22 2.9 29.0LCIdx2010Inst 17.71 0.14 1.1 24.5LCIdx2020Inst 20.08 0.19 1.5 26.6LCIdx2025Inst 21.56 0.23 1.7 28.2LCIdx2035Inst 24.55 0.33 2.4 31.3LCIdx2040Inst 25.72 0.38 2.7 32.5LCIdx2045Inst 26.27 0.42 3.0 34.0LifeStkIdx 34.16 0.64 3.1 45.8LrgCpGrIdxInst 50.68 1.91 2.7 78.3LrgCpGrIdxRet 51.07 1.92 2.7 76.9LrgCpGrInst 23.44 0.88 3.0 80.0LrgCpVl IdxInst 20.94 -0.04 2.6 16.7LrgCpVl IdxRet 21.34 -0.04 2.6 15.8LrgCpVl Inst 19.10 -0.07 2.1 10.8MdCpGrInst 28.49 0.49 3.2 72.6MdCpVl Inst 17.73 0.05 5.2 5.4QuantSmCpEqInst 20.59 0.43 11.0 30.3RealSecInst 17.82 0.28 0.8 33.0S&P500IdxInst 42.19 0.81 2.4 43.5S&P500IdxRet 41.91 0.80 2.3 42.4ShTrmBdInst 10.52 0.00 0.1 9.7SmCpBl IdxInst 26.75 0.56 9.9 41.2SmCpBl IdxRet 26.87 0.56 9.8 40.2SocChEqInst 25.47 0.43 3.5 45.6SocChEqRet 25.91 0.45 3.5 44.5Tortoise Capital:TorMLPPipInsCl 9.07 -0.35 9.0 -26.6Touchstone Family Fd:FlexIncY 11.30 0.03 0.4 16.3FocEqY 55.24 1.39 2.8 41.7LagCapFoc A p 51.29 1.36 2.4 51.3MdCpGrwY 40.87 0.61 2.1 67.3MdCpY 45.23 0.01 2.1 44.7SandsCapGrY 21.00 0.53 3.1 124.7SelGrwth 18.99 0.48 3.1 123.0SmCoA p 6.11 0.10 8.1 36.3Tr for Credit Unions:UltShtDur TCU 9.43 0.00 0.0 5.5Transamerica A:AsAlCnsrv p 11.70 0.08 1.4 21.1AsAIGrow p 15.00 0.23 4.4 26.9AsAlMod p 12.53 0.10 2.1 22.6AsAlModGr p 13.52 0.14 3.1 25.0Balanced 32.30 0.44 1.5 32.4FocusA 55.77 1.59 5.6 168.8Trust for Professional Ma:PerfTrstMuniInst 25.86 0.05 0.0 17.0PrfTrtStrtBd Ins 23.15 0.06 0.1 16.5Tweedy Browne Fds:GblValue n 28.23 0.10 2.8 4.9
UUM Funds:BehavVal 69.70 NA NA NAUSAA Group:500Indx Reward n 52.75 NA NA NACA Bd n 11.60 NA NA NACapGr n 12.20 NA NA NACrnrsMod n 16.38 NA NA NACrnstModAggr n 28.18 NA NA NAExtMktIn n 27.06 NA NA NAGr&Inc n 23.99 NA NA NAGr&TxStr n 24.08 NA NA NAGrwth n 34.87 NA NA NAHiIncm n 7.84 NA NA NAInco n 13.81 NA NA NAIncStk n 17.90 NA NA NAIntl n 27.13 NA NA NAIntmTerm n 13.92 NA NA NALgTerm n 13.83 NA NA NANasdaq100 n 36.99 NA NA NAntTerBd n 11.00 NA NA NAPrecMM n 20.83 NA NA NAS&PIdx n 52.72 NA NA NASciTech n 37.60 NA NA NAShtT n 10.65 NA NA NAShtTBdA n 9.36 NA NA NASmCpStk n 20.00 NA NA NATarRet2030 n 13.37 NA NA NATarRet2040 n 13.46 NA NA NATarRet2050 n 13.85 NA NA NATarRetIncm n 11.87 NA NA NAVA Bd n 11.70 NA NA NAValueFd n 16.26 NA NA NAWldGr n 28.65 NA NA NA
VVALIC:CoreBd 12.11 -0.01 -0.6 17.9
CoreVal 12.09 -0.05 2.5 10.7FrgnVal 10.53 0.07 2.2 -1.9GlobEq 10.86 0.26 8.6 13.8HighYdBd 7.87 -0.01 0.3 18.2HlthSci 29.45 NA NA NAInflPro 12.17 0.05 -0.1 15.5IntlEq 7.95 0.08 2.6 8.7IntlGro 17.48 0.32 1.2 56.5IntlSmCpEq 24.05 0.43 1.9 17.1LgCpGro 21.31 0.41 0.7 63.0MidCpIdx 29.20 0.46 6.8 28.7MidCpVal 19.36 0.01 4.6 14.9SciTech 44.22 1.57 4.9 108.3SmCpIdx 23.59 0.50 9.8 39.4SocResp 23.10 0.29 1.4 37.9StckIdx 51.26 0.98 2.3 42.2StraBd 11.84 0.01 -0.2 16.3ValUltra 24.81 0.96 1.5 71.5Value Line Funds:AstAlcClInv n 43.61 0.20 -1.1 40.8CapAppreClInv n 13.34 0.30 3.4 58.2Van Eck Funds:EmgMktsY 23.22 0.97 8.9 21.0VANGUARD ADMIRAL:400MCpIdxInst 331.24 5.18 6.8 29.8500Adml n 354.73 6.80 2.4 43.5BalAdml n 45.06 0.52 1.6 35.8CAITAdml n 12.35 0.01 0.0 13.7CALTAdml n 12.80 0.01 0.0 16.4CapOpAdml nr 191.33 4.68 7.8 49.9CoDilxAd n 152.06 4.21 6.8 82.9CoStIxAd nr 83.39 -0.45 -2.8 21.9DivAppIdxAdm n 38.27 0.07 -0.2 39.1EMAdmr n 44.78 1.19 7.4 17.6EnergyAd nr 29.00 -0.49 11.8 -39.2EnergyAdml nr 61.79 -0.84 5.0 -36.2EqIncAdml n 80.99 -0.44 2.1 19.1EuropeAdml n 77.56 0.86 2.2 8.6ExplrAdml n 127.81 2.72 6.8 70.1ExtndAdml n 133.85 2.38 7.3 57.0FinIxdAd nr 37.75 -0.59 3.5 8.6GNMAAdml n 10.72 0.00 -0.2 11.8GroIncAdml n 96.37 1.82 2.8 41.5GrwthAdml n 133.77 5.01 2.5 78.2HltClxAd nr 117.30 1.02 4.8 48.0HlthCareAdml nr 95.13 1.02 4.6 38.2HYCorAdml nr 5.97 -0.01 0.1 18.2InfProAd n 28.39 0.13 0.2 19.7InfTechIdx n 186.39 7.43 2.9 112.5IntlGrAdml n 174.65 7.87 9.0 84.4ITBondAdml n 12.48 0.00 -0.8 21.5ITCorpIx n 25.98 -0.01 -0.7 23.2ITIGradeAdml n 10.40 0.00 -0.5 22.0ITsryAdml n 11.64 0.01 -0.5 17.3ITTresIdx n 23.33 0.02 -0.5 16.6LarCapAd n 90.97 1.73 2.5 46.7LTGradeAdml n 11.46 -0.01 -2.6 30.6LTsryAdml n 13.53 -0.01 -3.6 31.9LTTresIdx n 31.07 0.00 -3.7 31.2MatIdx nr 82.36 -0.89 2.9 20.2MidCpAdml n 264.85 1.70 3.3 38.3MrgBkdIdx n 21.61 0.01 0.0 12.0MuHYAdml n 12.01 0.02 0.6 18.1MuIntAdml n 14.87 0.02 0.2 14.5MuLTAdml n 12.24 0.02 0.2 17.5MuLtdAdml n 11.27 0.01 0.2 9.4MuShtAdml n 15.95 0.00 0.0 6.0NJLTAdml n 12.77 0.03 0.7 19.1NYLTAdml n 12.22 0.02 0.2 15.9PacifAdml n 101.73 1.03 3.5 15.9PALTAdml n 12.17 0.02 0.2 17.6PrmcpAdml nr 162.88 3.19 5.9 44.4RealEstatAdml n 121.58 1.60 1.0 21.9S&PSC600Idx 371.70 6.01 10.1 31.9SmCapAdml n 99.97 1.50 7.2 41.2SmGthAdml n 101.42 2.53 7.9 73.8STBondAdml n 10.86 0.01 0.0 11.7STCorpIx n 22.62 0.01 0.0 13.6STFedAdml n 11.01 0.00 0.0 10.8STIGradeAdml n 11.02 0.00 0.0 12.9STIPSIxAdm n 25.75 0.06 0.5 11.4STsryAdml n 10.77 0.01 0.0 9.8STTresIdx n 20.55 0.00 0.0 8.5TotBdAdml n 11.51 -0.01 -0.8 17.2TotIntBdIdxAdm n 23.28 -0.06 -0.5 15.7TotIntlAdmIdx nr 33.74 0.47 3.9 13.4TotStAdml n 97.79 1.84 3.2 46.4TxMBal nr 38.57 0.38 1.3 30.1TxMCapAdml n 202.85 3.73 2.6 46.5TxMIn r 15.64 0.14 2.7 12.1TxMSC nr 81.80 1.34 10.1 31.8USGroAdml n 176.78 6.17 4.0 106.5UtilIxAd nr 69.01 -0.28 0.2 36.3ValAdml n 47.51 -0.21 2.4 18.4WdsrllAdml n 71.08 0.58 3.5 32.2WellsIAdml n 68.55 -0.15 -0.1 22.0WelltnAdml n 77.47 0.85 1.1 28.4WndsrAdml n 74.13 -0.11 3.8 20.6VANGUARD FDS:CAIT n 12.35 0.01 0.0 13.4CALT n 12.80 0.01 0.0 16.1CapOp nr 82.87 2.02 7.8 49.6DivdGro n 32.70 -0.12 -1.6 37.4DivrEq n 48.12 0.87 3.9 56.5EmgMktSelStk n 28.68 0.61 8.3 22.9Energy nr 32.94 -0.45 5.0 -36.4EqInc n 38.65 -0.20 2.1 18.7Explr n 137.40 2.93 6.8 69.5EXPValFd n 40.10 0.47 6.9 16.9FTAlWldInAdml n 37.86 0.52 4.2 14.2GlbCapCyl Inv nr 10.06 0.03 5.2 0.3GlbEq n 39.42 0.72 4.3 40.3GloMinVolFdAdm n 27.86 0.28 1.9 15.4GNMA n 10.72 0.00 -0.2 11.4GroInc n 59.05 1.12 2.8 41.1
HlthCare nr 225.61 2.42 4.6 38.0HYCor nr 5.97 -0.01 0.1 17.9InflaPro n 14.46 0.07 0.2 19.3IntlExplr n 21.00 0.44 2.9 5.2IntlGr n 54.91 2.48 9.0 83.8IntlVal n 41.20 0.02 2.4 8.1INSTTRF2015 24.79 0.15 0.9 21.8INSTTRF2020 26.63 0.22 1.4 24.7INSTTRF2025 27.94 0.27 1.8 26.7INSTTRF2030 28.72 0.32 2.1 27.9INSTTRF2035 29.43 0.37 2.4 28.9INSTTRF2040 30.16 0.42 2.8 29.8INSTTRF2045 30.80 0.46 3.0 31.1INSTTRF2050 30.89 0.46 3.1 31.3INSTTRF2055 30.97 0.46 3.1 31.3INSTTRF2060 31.07 0.47 3.1 31.4INSTTRFINC 24.52 0.13 0.8 21.6ITIGrade n 10.40 0.00 -0.5 21.7ITTsry n 11.64 0.01 -0.5 17.0LifeCon n 22.89 0.15 1.0 24.0LifeGro n 41.32 0.56 2.7 30.0LifeInc n 17.32 0.06 0.1 20.5LifeMod n 32.22 0.32 1.8 27.1LTIGrade n 11.46 -0.01 -2.6 30.2LTTsry n 13.53 -0.01 -3.6 31.5MATxEx n 11.43 0.02 0.0 17.0MgdPayFdInv n 17.71 0.09 2.2 15.4MidCpGro p 34.61 0.44 3.2 64.4MuHY n 12.01 0.02 0.6 17.8MuInt n 14.87 0.02 0.2 14.3MuLong n 12.24 0.02 0.2 17.2MuLtd n 11.27 0.01 0.2 9.1MuSht n 15.95 0.00 0.0 5.8NYLT n 12.22 0.02 0.2 15.6OHLTte n 13.25 0.02 0.1 17.7Primcp nr 157.18 3.07 5.9 44.1PrmcpCor n 30.75 0.52 6.1 34.6SelValu nr 27.10 0.03 4.3 9.4STAR n 31.89 0.38 2.6 38.8STFed n 11.01 0.00 0.0 10.4STIGrade n 11.02 0.00 0.0 12.5STIPSixInv n 25.71 0.05 0.5 11.1StratgcEq n 38.88 0.68 7.3 24.7StrSmCpEqInv n 38.87 0.74 10.0 22.1STTsry n 10.77 0.01 0.0 9.5TgtRe2015 n 15.88 0.10 1.0 21.5TgtRe2020 n 34.78 0.29 1.4 24.4TgtRe2025 n 21.93 0.22 1.8 26.6TgtRe2030 n 41.40 0.46 2.1 27.7TgtRe2035 n 25.83 0.32 2.4 28.8TgtRe2040 n 45.49 0.63 2.8 29.7TgtRe2045 n 29.06 0.44 3.1 31.1TgtRe2050 n 46.85 0.71 3.1 31.2TgtRe2060 n 44.93 0.67 3.1 31.1TgtRet2055 n 50.86 0.76 3.1 31.1TgtRetInc n 15.05 0.08 0.8 21.4TotIntBdIxInv n 11.64 -0.03 -0.5 15.7USGro n 68.25 2.38 4.0 105.8USValue n 18.36 0.03 4.0 4.0WellsI n 28.30 -0.06 -0.1 21.7Welltn n 44.86 0.49 1.1 28.1Wndsr n 21.98 -0.04 3.8 20.2WndsrII n 40.06 0.32 3.5 31.9VANGUARD INDEX FDS:500 354.74 6.80 2.3 43.1EmgMktInstPl 113.27 3.01 7.5 17.8ExtndIstPl 330.29 5.86 7.3 57.1FTAIWdInPl 127.11 1.76 4.2 14.4Growth 133.80 5.01 2.5 77.6IdxIntl n 20.17 0.28 4.0 13.2ITTresIdx Inst 28.95 0.03 -0.5 16.7LTTresIdx Inst 39.43 -0.01 -3.7 31.3MdCpGrAdml n 94.14 1.41 3.2 66.6MdCpVlAdml n 63.74 -0.19 3.5 13.4MidCp n 58.38 0.37 3.3 37.8RUSS2000IdxInst 332.41 7.01 9.9 41.2SmCap 99.94 1.50 7.2 40.6SmValAdml n 65.15 0.41 6.7 17.0TotBd 11.51 -0.01 -0.8 16.9TotBd2 11.35 0.00 -0.9 16.7TotIntlInstIdx r 134.94 1.91 4.0 13.5TotItlInstPlId r 134.97 1.91 4.0 13.5TotSt 97.75 1.83 3.2 45.9VANGUARD INSTL FDS:BalInst 45.07 0.52 1.6 35.8DevMktsIndInst 15.66 0.14 2.7 12.1DevMktsInxInst 24.48 0.23 2.7 12.1EmMkInst r 34.05 0.90 7.4 17.8EuroInst 33.07 0.36 2.2 8.6ExDurTrsInst 43.66 -0.04 -5.1 41.0ExtndInst 133.84 2.38 7.3 57.0FTAlWldIst r 120.04 1.67 4.2 14.3FTScinst 27.10 0.61 2.5 53.1GrwthInst 133.78 5.01 2.5 78.3InPrSeIn 11.57 0.06 0.3 19.8InstIdx 339.28 6.51 2.4 43.6InstPlus 339.29 6.51 2.4 43.6InstTStIdx 76.35 1.43 3.2 46.5InstTStPlus 76.34 1.43 3.2 46.5ITBdInst 12.48 0.00 -0.8 21.6ITBdInstPI 12.48 0.00 -0.8 21.6LaCapInst 374.42 7.13 2.5 46.8LTBdInst 16.16 -0.01 -2.8 31.5LTBdInstPl 16.16 -0.01 -2.8 31.5MidCpInst 58.51 0.38 3.3 38.4MidCpIstPl 288.55 1.86 3.3 38.4RealEstaInstl 18.82 0.25 1.0 21.9Rs1000GrwIdxInst 489.69 18.40 2.7 78.2Rs1000Vl IdxInst 240.27 -0.40 2.6 16.7Russ1000IdxInst 348.65 6.51 2.7 46.5Russ2000GrIxInst 438.52 12.43 10.4 65.4Russ3000Idx 347.34 6.54 3.1 46.1SmCapInst 99.97 1.51 7.2 41.2SmCapIstPl 288.54 4.34 7.2 41.2SmGthInst 81.22 2.03 7.9 73.8
SmValInst 36.41 0.23 6.6 17.0STBdIdxInstPl 10.86 0.01 0.0 11.7STBDInst 10.86 0.01 0.0 11.7STCorpIxInst p 27.69 0.01 0.0 13.7STIGradeInst 11.02 0.00 0.0 13.0STIPSIxins 25.76 0.05 0.5 11.4STTresIdx 25.82 0.01 0.0 8.6TotBdInst 11.51 -0.01 -0.8 17.3TotBdInst2 11.35 0.00 -0.8 16.9TotBdInstPl 11.51 -0.01 -0.8 17.3TotIntBdIdxInst 34.93 -0.09 -0.5 15.8TotStInst 97.80 1.83 3.2 46.4TtlWrldIxInst p 195.65 3.25 3.4 30.5TxMCaInst r 100.78 1.85 2.6 46.6TxMSCInst r 81.99 1.34 10.1 32.0ValueInst 47.51 -0.21 2.4 18.4Victory Funds:EstValA 42.77 NA NA NAEstValI 42.80 NA NA NAEstValR p 42.12 NA NA NAFundFIncI 8.31 NA NA NASmCap Grwth p 104.70 2.04 7.4 74.2SmCoOppI 50.03 NA NA NAVirtusFunds:CeredexLgCpVlEqI 13.76 -0.05 1.9 18.0CeredexMdCpVlEqI 12.74 -0.03 3.0 21.2GvSecUltShtBdI 10.04 0.00 0.0 5.5InnGrSt I 72.45 2.84 8.7 235.0VirtusFunds Cl A:MidGrA 69.74 1.70 2.5 135.8MulSStA p 4.79 0.00 0.1 9.8SmCapSusA 54.09 1.45 3.9 111.3StratGrA p 26.77 0.88 1.2 79.6TactAllA p 13.23 0.23 0.2 48.8VirtusFunds Cl I:EmMktI 14.33 0.41 7.9 19.4ForOppI 32.32 0.33 -0.2 23.9IntSmCapI 23.14 0.09 -1.1 38.9MulSStI 4.80 0.00 0.1 10.7QualitySmCapI 26.28 0.57 7.4 39.8SmCapSusI 55.65 1.49 4.0 113.0SmCpCorI 48.24 0.61 4.2 61.7Voya Fds:GNMA A 8.57 0.00 0.1 11.0GrOppI 57.44 1.97 2.2 64.4InmdBdI 10.57 -0.01 -0.6 18.7TRPGrEqI 111.00 5.78 3.5 69.8
WXYZWasatch:CoreGr n 97.76 1.96 6.8 78.3IntlGr n 35.13 0.49 1.2 31.8MicCap n 13.15 0.45 10.8 156.5SmCapGr n 60.37 1.24 6.2 126.2SmCapV n 9.87 0.14 8.7 31.8UltraGr n 50.97 1.55 7.8 168.7WCM:FcusEmgMk Inst 21.02 0.53 6.1 63.1FocInterGrFdInv 25.65 0.59 4.3 63.7WCM Focus Funds:WCMFocIntlGrwIns 25.81 0.60 4.3 64.9Weitz Funds:PIIIOpp 15.59 0.18 0.8 32.6ShtDurIncInst 12.42 0.03 0.4 9.9ValueInv n 51.34 0.98 1.5 42.9Wells Fargo Adv Admi:DiscvAdm 52.79 1.23 5.9 107.6Growth 54.06 1.59 3.4 97.3Wells Fargo Adv Cl A:AstAllA p p 16.00 NA NA NACmStkA p p 22.42 0.13 3.9 30.3DivCapBldr 12.34 0.16 3.4 32.0IdxAstAllA 40.79 0.52 1.0 32.3OmegaGwth 74.45 1.93 1.2 82.8OpptyA 50.56 1.03 1.6 40.9PremLgCoGrthA 17.34 0.53 2.7 78.5SpecTech 20.04 0.70 5.5 121.9SpSmCpValA p p 38.24 0.32 7.7 14.5StrMunA 9.33 0.00 0.3 10.3Wells Fargo Adv Inst:CoreBd 13.36 0.00 -0.7 18.0Growth 60.94 1.79 3.4 98.5MdCpVal 44.53 0.08 2.9 20.5ShDurGovBdI 9.84 0.01 0.1 9.0UlStInc 8.62 0.00 0.1 8.4UlStMuInc 9.62 0.01 0.1 4.8Western Asset:CoreBondA 13.50 NA NA NACoreBondI 13.51 NA NA NACoreBondIS 13.52 NA NA NACorePlusBdA 12.41 NA NA NACorePlusBdI 12.43 NA NA NACorePlusBdIS 12.42 NA NA NAIntermedBdI 11.35 NA NA NAIntermTermMuniA 6.56 NA NA NAIntermTermMuniI 6.56 NA NA NAManagedMuniA 16.70 NA NA NAManagedMuniI 16.73 NA NA NAShortTermBdIS 3.95 NA NA NATotalRetUnconI 10.84 NA NA NAWestwood:IncomeOppI 13.30 0.11 1.8 23.0Wilmington Funds:BroadMktBdInst 10.32 0.00 -0.7 16.5Intl Inst 10.33 0.18 4.1 12.5LgCpStrInst 27.73 0.52 2.7 45.6WmBlair Funds Cl I:IntlGthI r 41.58 1.25 4.9 40.1SmMidI r 37.25 1.04 6.0 70.6WmBlair Funds Inst:IntlGth 21.37 0.65 4.9 41.2WmBlair Funds R6:EmgMktGth 20.79 0.85 10.4 47.6
Scoreboard: China Jumps(TheS&P500 rose1.5%asapeaceful Biden inaugurationunfolded.China funds, however, surgedeven
more, 5.17%,as the country grew2.3% in2020, theonly developednation withpositive growth.
OneWeek Year-to-Date
U.S.STOCKFUNDS 0.62% 4.55%
TOPSECTOR/ChinaRegionFunds 5.17 10.84
BOTTOMSECTOR/NaturalResourcesFunds – 4.82 10.32
S&P500 1.52 2.58
U.S.BONDFUNDS 0.20 0.02
BloombergBarclaysAGGBond 0.11 – 0.73
THEWEEK'STOP25Fund InvestmentObjective OneWeek Year-to-Date
QuantifiedSTF Inv/QSTFX FlexiblePortfolio 7.67% 7.7%
ColumbiaGrtrChinaA/NGCAX ChinaRegion 7.12 12.1
PerkinsDiscovery/PDFDX Small-CapCore 7.04 17.6
MatthewsAsiaChina Inv/MCHFX ChinaRegion 7.03 13.9
MatthewsAsiaChnSC Inv/MCSMX ChinaRegion 6.80 14.0
USGlblChinaRegion/USCOX ChinaRegion 6.60 13.2
OberweisChinaOpps Inv/OBCHX ChinaRegion 6.46 12.5
MorgStan IChinaEq I /MAKIX ChinaRegion 6.38 10.9
InvescoGrChinaA/AACFX ChinaRegion 6.16 10.2
HardingLoevnerCE Inst /HLMCX ChinaRegion 5.96 10.1
TempletonChinaWdA/TCWAX ChinaRegion 5.95 12.8
GoldmanChinaEqP/GMEPX ChinaRegion 5.52 11.7
MatthewsAsia Innvs Inst /MITEX Pacific Ex Japan 5.35 14.2
FidelitySelCommServ/FBMPX ConsumerServices 5.28 2.6
InvescoPacGroA/TGRAX Pacific Ex Japan 5.28 10.6
ArtisanDevWorldAdv/APDYX EmergingMarkets 5.25 7.9
MorgStan IEmMktLd I /MELIX EmergingMarkets 5.21 9.2
WCMChinaQualGro Inst /WCMCX ChinaRegion 5.21 8.3
TRowePriceLCGro/TRLGX Large-CapGrowth 5.14 4.3
FidelityChinaRegion/FHKCX ChinaRegion 5.13 12.7
TRowePriceChEE/TCELX ChinaRegion 5.13 10.9
TRowePriceGS/PRGFX Large-CapGrowth 5.13 3.8
ChamplainEmMktsAdv/CIPDX EmergingMarkets 5.01 10.6
DWSCommA/TISHX Telecommunication 4.99 2.3
AllianzGIEMCons Inst /AERIX EmergingMarkets 4.96 10.3
THEWEEK'SBOTTOM10Fund InvestmentObjective OneWeek Year-to-Date
Kinetics InternetNL/WWWFX Science&Tech – 12.14% 1.6%
KineticsGlobalNL/WWWEX GLSm/Mid-Cap – 8.91 1.0
RydexEnergySvcs Inv/RYVIX Natural Resources – 8.76 9.3
FidelitySelEnrgySer/FSESX Natural Resources – 8.13 9.6
KineticsMktOppsNL/KMKNX FlexiblePortfolio – 8.13 2.9
InvescoSPMLPA+A/MLPLX EnergyMLPFunds – 6.78 10.5
NvgtrSentryMgdVol I /NVXIX EquityMktNeutral – 6.38 – 12.0
MaingateMLP I / IMLPX EnergyMLPFunds – 6.09 9.3
HennessyBPEnergy Inst /HNRIX Natural Resources – 6.06 14.7
BrookfieldCCBfMSFY/CCCNX EnergyMLPFunds – 5.68 8.8
THELARGEST25 Assets 3-Year* 1-Week YTDFund (billions) InvestmentObjective Return Return Return
AmericanFundsGroA/AGTHX $125.8 Large-CapGrowth 19.2% 2.39% 4.6%FidelityContrafund/FCNTX 113.1 Large-CapGrowth 17.6 3.67 2.9VanguardWellingtonAdm/VWENX 96.3 Mix TgtAll Gro 9.0 1.20 1.4AmericanFundsEuPcR6/RERGX 91.2 Intl Large-CapGrowth 10.6 0.73 4.2AmericanFundsBalA/ABALX 88.1 Mix TgtAll Gro 8.5 0.75 1.8AmericanFunds IncA/AMECX 75.4 Mix TgtAllMod 5.9 0.04 2.6PIMCO Income Inst/PIMIX 71.5 Multi-Sector Inc 5.0 0.33 0.4Dodge&CoxStock/DODGX 70.7 Multi-CapValue 7.3 – 1.66 5.1Dodge&Cox Income/DODIX 69.1 CoreBond 6.2 0.21 – 0.4AmericanFunds ICAA/AIVSX 68.1 Large-CapCore 9.5 1.42 2.6AmericanFundsWashA/AWSHX 64.0 Large-CapCore 8.9 0.31 2.6VanguardPRIMECAPAdm/VPMAX 63.3 Large-CapCore 13.6 1.33 6.1AmericanFundsCIBA/CAIBX 62.8 Global Equity Income 4.2 – 0.03 2.3BlackRockCash InstSLA/ 60.6 InstlMoneyMkt NA NA NAAmericanFundsFInvA/ANCFX 60.6 Large-CapCore 10.3 1.14 3.1AmericanFundsNPerA/ANWPX 59.1 Global Large-CapGrowth 17.5 1.37 4.8Vanguard IntlGroAdm/VWILX 57.6 Intl Large-CapGrowth 23.0 3.11 9.0TRowePriceBCGro/TRBCX 57.4 Large-CapGrowth 19.5 4.03 2.7AmericanFundsCWGIA/CWGIX 57.3 Global Large-CapCore 9.0 1.47 4.3PIMCOTotRtn Inst /PTTRX 53.4 CorePlusBond 5.6 0.23 – 0.5MetWestTotalRtn I /MWTIX 53.0 CorePlusBond 6.1 0.20 – 0.6FidelityStrAdvLgCp/FALCX 52.8 Large-CapCore 0 1.29 3.3VanguardWellesleyAdm/VWIAX 50.8 Mix TgtAllocCon 7.0 – 0.19 0.0VanguardSh-Tm InvAdm/VFSUX 50.3 Short InvGrade 4.1 0.12 0.0VanguardTgtRet2025 Inv/VTTVX 50.0 Mixed-Asset Target2025 8.5 0.60 2.0
*Annualized01/18/2018 to01/21/2021. ThroughThursday. Source: Lipper
Data provided byMutual Funds
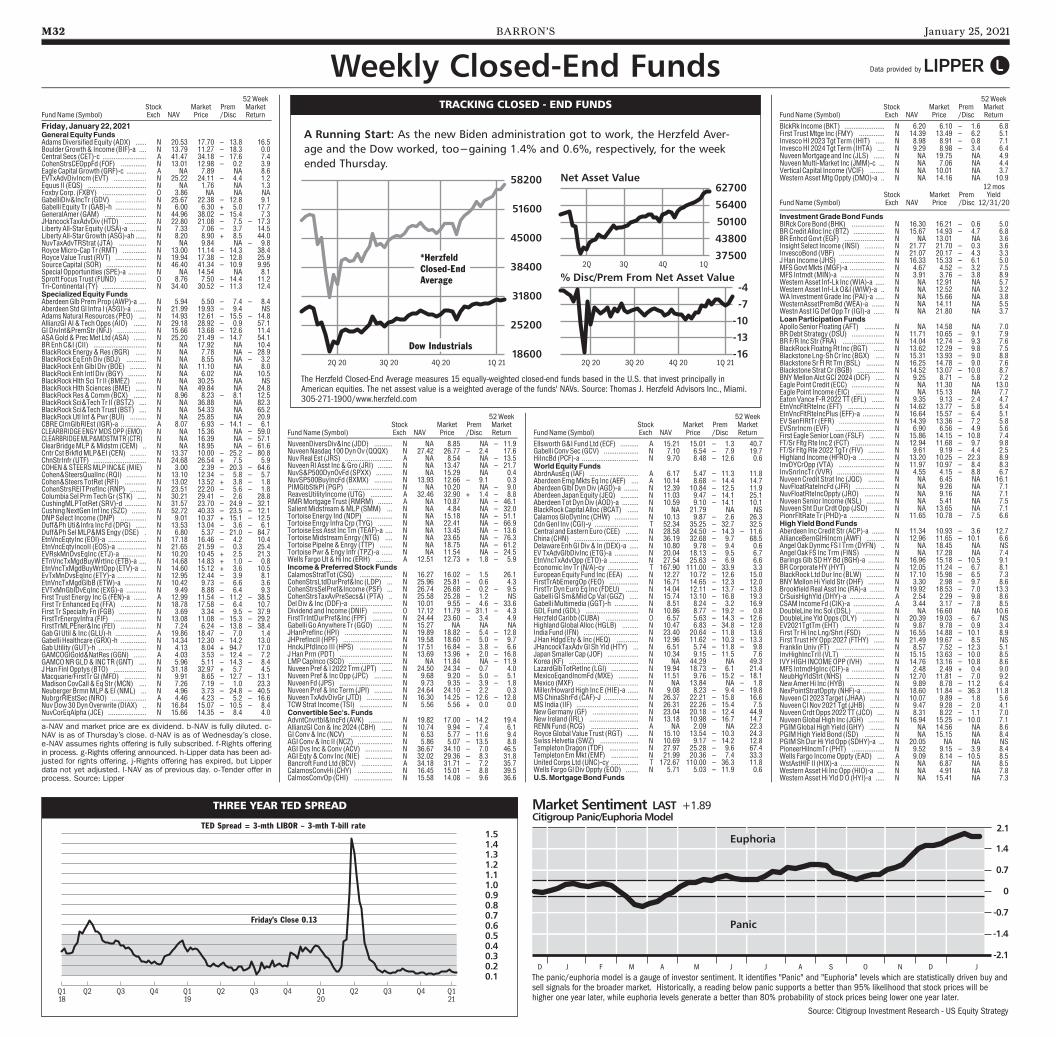
M32 BARRON’S January 25, 2021
NuveenDiversDiv&Inc (JDD) .......... N NA 8.85 NA – 11.9NuveenNasdaq 100DynOv (QQQX) N 27.42 26.77 – 2.4 17.6NuvReal Est (JRS) .......................... A NA 8.54 NA – 13.5NuveenRl Asst Inc&Gro (JRI) ........ N NA 13.47 NA – 21.7NuvS&P500DynOvFd (SPXX) ......... N NA 15.29 NA 0.4NuvSP500BuyIncFd (BXMX) .......... N 13.93 12.66 – 9.1 0.3PIMGlbStkPI (PGP) ........................ N NA 10.20 NA – 9.0ReavesUtilityIncome (UTG) ............ A 32.46 32.90 + 1.4 – 8.8RMRMortgage Trust (RMRM) ........ A NA 10.87 NA – 46.1SalientMidstream&MLP (SMM) ... N NA 4.84 NA – 32.0Tortoise Energy Ind (NDP) .............. N NA 15.18 NA – 51.1Tortoise Enrgy Infra Crp (TYG) ........ N NA 22.41 NA – 66.9Tortoise EssAsst Inc Tm (TEAF)-a .... N NA 13.45 NA – 13.6TortoiseMidstreamEnrgy (NTG) .... N NA 23.65 NA – 76.3Tortoise Pipelne&Enrgy (TTP) ....... N NA 18.75 NA – 61.2Tortoise Pwr&Engy Infr (TPZ)-a ...... N NA 11.54 NA – 24.5Wells FargoUt&Hi Inc (ERH) ......... A 12.51 12.73 + 1.8 – 5.9Income&PreferredStockFundsCalamosStratTot (CSQ) .................. N 16.27 16.02 – 1.5 26.1CohenStrsLtdDurPref&Inc (LDP) ... N 25.96 25.81 – 0.6 4.3CohenStrsSelPref&Income (PSF) ... N 26.74 26.68 – 0.2 – 9.5CohenStrsTaxAvPreSecs&I (PTA) .. N 25.58 25.28 – 1.2 NSDel Div& Inc (DDF)-a ....................... N 10.01 9.55 – 4.6 – 33.6Dividend and Income (DNIF) ........... O 17.12 11.79 – 31.1 – 4.3FirstTrIntDurPref&Inc (FPF) ........... N 24.44 23.60 – 3.4 4.9Gabelli GoAnywhere Tr (GGO) ........ N 15.27 NA NA NAJHanPrefInc (HPI) .......................... N 19.89 18.82 – 5.4 – 12.8JHPrefIncII (HPF) ........................... N 19.58 18.60 – 5.0 – 9.7HnckJPfdInco III (HPS) .................. N 17.51 16.84 – 3.8 – 6.6JHanPrm (PDT) ............................. N 13.69 13.96 + 2.0 – 16.8LMPCapInco (SCD) ........................ N NA 11.84 NA – 11.9NuveenPref& I 2022 Trm (JPT) ...... N 24.50 24.34 – 0.7 4.0NuveenPref& IncOpp (JPC) .......... N 9.68 9.20 – 5.0 – 5.1Nuveen Fd (JPS) ............................. N 9.73 9.35 – 3.9 – 1.8NuveenPref& Inc Term (JPI) .......... N 24.64 24.10 – 2.2 0.3Nuveen TxAdvDivGr (JTD) .............. N 16.30 14.25 – 12.6 – 12.8TCWStrat Income (TSI) .................. N 5.56 5.56 + 0.0 0.0ConvertibleSec's. FundsAdvntCnvrtbl&IncFd (AVK) ............. N 19.82 17.00 – 14.2 19.4AllianzGI Con& Inc 2024 (CBH) ...... N 10.74 9.94 – 7.4 6.1GI Conv& Inc (NCV) ....................... N 6.53 5.77 – 11.6 9.4AGI Conv& Inc II (NCZ) ................... N 5.86 5.07 – 13.5 8.8AGIDvs Inc&Conv (ACV) ............... N 36.67 34.10 – 7.0 46.5AGI Eqty&Conv Inc (NIE) ............... N 32.02 29.36 – 8.3 31.8Bancroft Fund Ltd (BCV) ................. A 34.18 31.71 – 7.2 35.7CalamosConvHi (CHY) ................... N 16.45 15.01 – 8.8 39.5CalmosConvOp (CHI) ..................... N 15.58 14.08 – 9.6 36.6
52WeekStock Market Prem Market
FundName (Symbol) Exch NAV Price /Disc Return
EllsworthG&I Fund Ltd (ECF) .......... A 15.21 15.01 – 1.3 40.7Gabelli ConvSec (GCV) ................... N 7.10 6.54 – 7.9 19.7HiIncBd (PCF)-a ............................... N 9.70 8.48 – 12.6 0.6WorldEquityFundsAbrdnAusEq (IAF) ........................... A 6.17 5.47 – 11.3 11.8Aberdeen EmgMkts Eq Inc (AEF) .... A 10.14 8.68 – 14.4 14.7AberdeenGlbl DynDiv (AGD)-a ........ N 12.39 10.84 – 12.5 11.9Aberdeen Japan Equity (JEQ) .......... N 11.03 9.47 – 14.1 25.1Aberdeen Tot DynDiv (AOD)-a ......... N 10.59 9.10 – 14.1 10.1BlackRockCapital Alloc (BCAT) ...... N NA 21.79 NA NSCalamosGloDynInc (CHW) ............. N 10.13 9.87 – 2.6 26.3CdnGenl Inv (CGI)-y ........................ T 52.34 35.25 – 32.7 32.5Central and Eastern Euro (CEE) ....... N 28.58 24.50 – 14.3 – 11.6China (CHN) ................................... N 36.19 32.68 – 9.7 68.5Delaware EnhGl Div& In (DEX)-a ..... N 10.80 9.78 – 9.4 0.6EVTxAdvGlbDivInc (ETG)-a ............. N 20.04 18.13 – 9.5 6.7EtnVncTxAdvOpp (ETO)-a ................ N 27.54 25.63 – 6.9 6.6Economic Inv Tr (N/A)-cy ................. T 167.90 111.00 – 33.9 3.3European Equity Fund Inc (EEA) ...... N 12.27 10.72 – 12.6 15.0FirstTrAbEmergOp (FEO) ................ N 16.71 14.65 – 12.3 12.0FirstTr Dyn Euro Eq Inc (FDEU) ....... N 14.04 12.11 – 13.7 – 13.8Gabelli Gl Sm&MidCpVal (GGZ) ..... N 15.74 13.10 – 16.8 19.3GabelliMultimedia (GGT)-h ............. N 8.51 8.24 – 3.2 16.9GDL Fund (GDL) ............................. N 10.86 8.77 – 19.2 – 0.8Herzfeld Caribb (CUBA) .................. O 6.57 5.63 – 14.3 – 12.6HighlandGlobal Alloc (HGLB) ......... N 10.47 6.83 – 34.8 – 12.8India Fund (IFN) .............................. N 23.40 20.64 – 11.8 13.6JHanHdgdEty& Inc (HEQ) ............ N 12.96 11.62 – 10.3 – 13.3JHancockTaxAdvGl ShYld (HTY) ... N 6.51 5.74 – 11.8 – 9.8JapanSmaller Cap (JOF) ................. N 10.34 9.15 – 11.5 7.6Korea (KF) ...................................... N NA 44.29 NA 49.3LazardGlbTotRetInc (LGI) ............... N 19.94 18.73 – 6.1 21.4MexicoEqandIncmFd (MXE) ........... N 11.51 9.76 – 15.2 – 18.1Mexico (MXF) ................................. N NA 13.84 NA – 1.8Miller/HowardHigh Inc E (HIE)-a ...... N 9.08 8.23 – 9.4 – 19.8MSChinaShrFd (CAF)-J ................... N 26.37 22.21 – 15.8 16.6MS India (IIF) .................................. N 26.31 22.26 – 15.4 7.5NewGermany (GF) ......................... N 23.04 20.18 – 12.4 44.9New Ireland (IRL) ........................... N 13.18 10.98 – 16.7 14.7RENNFund (RCG) .......................... A NA 2.09 NA 22.3RoyceGlobal Value Trust (RGT) ...... N 15.10 13.54 – 10.3 24.3SwissHelvetia (SWZ) ..................... N 10.69 9.17 – 14.2 12.8TempletonDragon (TDF) ................ N 27.97 25.28 – 9.6 67.4Templeton EmMkt (EMF) ............... N 21.99 20.36 – 7.4 33.3United Corps Ltd (UNC)-cy ............... T 172.67 110.00 – 36.3 11.8Wells FargoGl DivOppty (EOD) ....... N 5.71 5.03 – 11.9 0.6U.S.MortgageBondFunds
52WeekStock Market Prem Market
FundName (Symbol) Exch NAV Price /Disc Return
BlckRk Income (BKT) ...................... N 6.20 6.10 – 1.6 6.8First TrustMtge Inc (FMY) .............. N 14.39 13.49 – 6.2 5.1InvescoHI 2023 Tgt Term (IHIT) ..... N 8.98 8.91 – 0.8 7.1InvescoHI 2024 Tgt Term (IHTA) .... N 9.29 8.98 – 3.4 6.4NuveenMortgage and Inc (JLS) ...... N NA 19.75 NA 4.9NuveenMulti-Market Inc (JMM)-c ... N NA 7.06 NA 4.4Vertical Capital Income (VCIF) ........ N NA 10.01 NA 3.7Western AssetMtgOppty (DMO)-a .. N NA 14.16 NA 10.9
InvestmentGradeBondFundsBlRckCore Bond (BHK) .................. N 16.30 16.21 – 0.6 5.0BRCredit Alloc Inc (BTZ) ................. N 15.67 14.93 – 4.7 6.8BREnhcdGovt (EGF) ...................... N NA 13.01 NA 3.6Insight Select Income (INSI) ........... N 21.77 21.70 – 0.3 3.6InvescoBond (VBF) ......................... N 21.07 20.17 – 4.3 3.3JHan Income (JHS) ........................ N 16.33 15.33 – 6.1 5.0MFSGovtMkts (MGF)-a ................... N 4.67 4.52 – 3.2 7.5MFS Intmdt (MIN)-a ........................ N 3.91 3.76 – 3.8 8.9Western Asset Inf-Lk Inc (WIA)-a ..... N NA 12.91 NA 5.7Western Asset Inf-LkO&I (WIW)-a .. N NA 12.52 NA 3.2WA InvestmentGrade Inc (PAI)-a ..... N NA 15.66 NA 3.8WesternAssetPremBd (WEA)-a ....... N NA 14.11 NA 5.5Westn Asst IGDef OppTr (IGI)-a ...... N NA 21.80 NA 3.7LoanParticipationFundsApollo Senior Floating (AFT) ........... N NA 14.58 NA 7.0BRDebt Strategy (DSU) .................. N 11.71 10.65 – 9.1 7.9BR F/R IncStr (FRA) ....................... N 14.04 12.74 – 9.3 7.6BlackRock FloatngRt Inc (BGT) ...... N 13.62 12.29 – 9.8 7.5Blackstone Lng-ShCr Inc (BGX) ..... N 15.31 13.93 – 9.0 8.8BlackstoneSr Fl Rt Tm (BSL) .......... N 16.25 14.78 – 9.0 7.6BlackstoneStrat Cr (BGB) ............... N 14.52 13.07 – 10.0 8.7BNYMellonAlct GCI 2024 (DCF) ..... N 9.25 8.71 – 5.8 7.2Eagle Point Credit (ECC) .................. N NA 11.30 NA 13.0Eagle Point Income (EIC) ................ N NA 15.13 NA 7.7EatonVance F-R2022TT (EFL) ....... N 9.35 9.13 – 2.4 4.7EtnVncFltRteInc (EFT) .................... N 14.62 13.77 – 5.8 5.4EtnVncFltRteIncPlus (EFF)-a ............ N 16.64 15.57 – 6.4 5.1EVSenFlRtTr (EFR) ......................... N 14.39 13.36 – 7.2 5.8EVSnrIncm (EVF) ........................... N 6.90 6.56 – 4.9 5.6First Eagle Senior Loan (FSLF) ........ N 15.86 14.15 – 10.8 7.4FT/Sr FltgRte Inc 2 (FCT) ................ N 12.94 11.68 – 9.7 9.8FT/Sr FltgRte 2022 TgTr (FIV) ......... N 9.61 9.19 – 4.4 2.5Highland Income (HFRO)-a .............. N 13.20 10.25 – 22.3 8.9InvDYCrOpp (VTA) ......................... N 11.97 10.97 – 8.4 8.3InvSnrIncTr (VVR) .......................... N 4.55 4.15 – 8.8 6.7NuveenCredit Strat Inc (JQC) ......... N NA 6.45 NA 16.1NuvFloatRateIncFd (JFR) ................ N NA 9.26 NA 7.1NuvFloatRteIncOppty (JRO) ........... N NA 9.16 NA 7.1NuveenSenior Income (NSL) .......... N NA 5.41 NA 7.5NuveenShtDur Crdt Opp (JSD) ...... N NA 13.65 NA 7.1PionrFltRate Tr (PHD)-a ................... N 11.65 10.78 – 7.5 6.6HighYieldBondFundsAberdeen Inc Credit Str (ACP)-a ....... N 11.34 10.93 – 3.6 12.7AllianceBernGlHiIncm (AWF) .......... N 12.96 11.65 – 10.1 6.6Angel OakDynmc FS I Trm (DYFN) .. N NA 18.45 NA NSAngel Oak FS Inc Trm (FINS) ........... N NA 17.28 NA 7.4BaringsGlb SDHYBd (BGH)-a ......... N 16.96 15.18 – 10.5 9.1BRCorporateHY (HYT) .................. N 12.05 11.24 – 6.7 8.1BlackRock LtdDur Inc (BLW) .......... N 17.10 15.98 – 6.5 7.3BNYMellonHi Yield Str (DHF) ......... N 3.30 2.98 – 9.7 8.6BrookfieldReal Asst Inc (RA)-a ........ N 19.92 18.53 – 7.0 13.3CrSuisHighYld (DHY)-a ................... A 2.54 2.29 – 9.8 8.6CSAM Income Fd (CIK)-a ................. A 3.44 3.17 – 7.8 8.5DoubleLine Inc Sol (DSL) ................ N NA 16.60 NA 10.6DoubleLine YldOpps (DLY) ............ N 20.39 19.03 – 6.7 NSEV2021TgtTm (EHT) ...................... N 9.87 9.78 – 0.9 3.4First Tr Hi Inc Lng/Shrt (FSD) .......... N 16.55 14.88 – 10.1 8.9First Trust HYOpp:2027 (FTHY) ...... N 21.49 19.67 – 8.5 NSFranklinUniv (FT) ........................... N 8.57 7.52 – 12.3 5.1InvHighIncTrII (VLT) ...................... N 15.15 13.63 – 10.0 8.5IVYHIGH INCOMEOPP (IVH) ......... N 14.76 13.16 – 10.8 8.6MFS IntmdHgInc (CIF)-a .................. N 2.48 2.49 + 0.4 9.0NeubHgYldStrt (NHS) ..................... N 12.70 11.81 – 7.0 9.2NewAmerHi Inc (HYB) ................... N 9.89 8.78 – 11.2 6.4NexPointStratOppty (NHF)-a ............ N 18.60 11.84 – 36.3 11.8NuveenCI 2023 Target (JHAA) ........ N 10.07 9.89 – 1.8 5.6NuveenCINov 2021 Tgt (JHB) ........ N 9.47 9.28 – 2.0 4.1NuveenCrdt Opps 2022 TT (JCO) .... N 8.31 8.22 – 1.1 7.0NuveenGlobal High Inc (JGH) ......... N 16.94 15.25 – 10.0 7.1PGIMGlobal HighYield (GHY) ........ N NA 14.56 NA 8.6PGIMHighYield Bond (ISD) ........... N NA 15.15 NA 8.4PGIMShDurHi YldOpp (SDHY)-a ... N 20.05 NA NA NSPioneerHilncmTr (PHT) .................. N 9.52 9.15 – 3.9 8.4Wells Fargo IncomeOppty (EAD) .... A 9.09 8.14 – 10.5 8.5WstAstHIF II (HIX)-a ........................ N NA 6.87 NA 8.5Western Asset Hi IncOpp (HIO)-a .... N NA 4.91 NA 7.8Western Asset Hi YldDO (HYI)-a ..... N NA 15.41 NA 7.3
Friday, January22, 2021GeneralEquityFundsAdamsDiversified Equity (ADX) ...... N 20.53 17.70 – 13.8 16.5Boulder Growth& Income (BIF)-a .... N 13.79 11.27 – 18.3 0.0Central Secs (CET)-c ........................ A 41.47 34.18 – 17.6 7.4CohenStrsCEOppFd (FOF) .............. N 13.01 12.98 – 0.2 3.9Eagle Capital Growth (GRF)-c ........... A NA 7.89 NA 8.6EVTxAdvDivIncm (EVT) .................. N 25.22 24.11 – 4.4 1.2Equus II (EQS) ................................ N NA 1.76 NA 1.3FoxbyCorp. (FXBY) ........................ O 3.86 NA NA NAGabelliDiv&IncTr (GDV) ................. N 25.67 22.38 – 12.8 9.1Gabelli Equity Tr (GAB)-h ................. N 6.00 6.30 + 5.0 17.7GeneralAmer (GAM) ....................... N 44.96 38.02 – 15.4 7.3JHancockTaxAdvDiv (HTD) ............ N 22.80 21.08 – 7.5 – 17.3Liberty All-Star Equity (USA)-a ......... N 7.33 7.06 – 3.7 14.5Liberty All-Star Growth (ASG)-ah ...... N 8.20 8.90 + 8.5 44.0NuvTaxAdvTRStrat (JTA) ............... N NA 9.84 NA – 9.8RoyceMicro-Cap Tr (RMT) ............. N 13.00 11.14 – 14.3 38.4RoyceValue Trust (RVT) ................. N 19.94 17.38 – 12.8 25.9Source Capital (SOR) ...................... N 46.40 41.34 – 10.9 9.95Special Opportunities (SPE)-a .......... N NA 14.54 NA 8.1Sprott Focus Trust (FUND) .............. O 8.76 7.50 – 14.4 11.2Tri-Continental (TY) ........................ N 34.40 30.52 – 11.3 12.4SpecializedEquityFundsAberdeenGlb PremProp (AWP)-a .... N 5.94 5.50 – 7.4 – 8.4AberdeenStdGl Infra I (ASGI)-a ....... N 21.99 19.93 – 9.4 NSAdamsNatural Resources (PEO) .... N 14.93 12.61 – 15.5 – 14.8AllianzGI AI&TechOpps (AIO) ....... N 29.18 28.92 – 0.9 57.1GIDivInt&PremStr (NFJ) ................ N 15.66 13.68 – 12.6 11.4ASAGold&PrecMet Ltd (ASA) ....... N 25.20 21.49 – 14.7 54.1BREnhC&I (CII) ............................. N NA 17.92 NA 10.4BlackRock Energy&Res (BGR) ...... N NA 7.78 NA – 28.9BlackRock Eq EnhDiv (BDJ) ........... N NA 8.55 NA – 3.2BlackRock EnhGlbl Div (BOE) ......... N NA 11.10 NA 8.0BlackRock Enh Intl Div (BGY) .......... N NA 6.02 NA 10.5BlackRockHlth Sci Tr II (BMEZ) ...... N NA 30.25 NA NSBlackRockHlth Sciences (BME) ...... N NA 49.84 NA 24.8BlackRockRes&Comm(BCX) ....... N 8.96 8.23 – 8.1 12.5BlackRockSci&Tech Tr II (BSTZ) .... N NA 36.88 NA 82.3BlackRockSci&Tech Trust (BST) .... N NA 54.33 NA 65.2BlackRockUtl Inf&Pwr (BUI) ......... N NA 25.85 NA 20.9CBREClrnGlbRlEst (IGR)-a .............. A 8.07 6.93 – 14.1 – 6.1CLEARBRIDGEENGYMDSOPP (EMO) N NA 15.36 NA – 59.0CLEARBRIDGEMLP&MDSTMTR (CTR) N NA 16.39 NA – 57.1ClearBridgeMLP&Midstm (CEM) .. N NA 18.95 NA – 61.6Cntr Cst BrkfldMLP&EI (CEN) ......... N 13.37 10.00 – 25.2 – 80.8ChnStrInfr (UTF) ............................. N 24.68 26.54 + 7.5 5.9COHEN&STEERSMLP INC&E (MIE) N 3.00 2.39 – 20.3 – 64.6Cohen&SteersQualInc (RQI) ........... N 13.10 12.34 – 5.8 – 5.7Cohen&Steers TotRet (RFI) ............ N 13.02 13.52 + 3.8 – 1.8CohenStrsREITPrefInc (RNP) ......... N 23.51 22.20 – 5.6 – 1.8Columbia Sel PrmTechGr (STK) ..... N 30.21 29.41 – 2.6 28.8CushingMLPTotRet (SRV)-d ............ N 31.57 23.70 – 24.9 – 32.1CushingNextGen Inf Inc (SZC) ........ N 52.72 40.33 – 23.5 – 12.1DNPSelect Income (DNP) .............. N 9.01 10.37 + 15.1 – 12.5Duff&PhUti&Infra Inc Fd (DPG) ...... N 13.53 13.04 – 3.6 – 6.1Duff&PhSelMLP&MSEngy (DSE) . N 6.80 5.37 – 21.0 – 84.7EtnVncEqtyInc (EOI)-a ..................... N 17.18 16.46 – 4.2 10.4EtnVncEqtyIncoII (EOS)-a ................ N 21.65 21.59 – 0.3 25.4EVRskMnDvsEqInc (ETJ)-a ............. N 10.20 10.45 + 2.5 21.3ETnVncTxMgdBuyWrtInc (ETB)-a .... N 14.68 14.83 + 1.0 – 0.8EtnVncTxMgdBuyWrtOpp (ETV)-a ... N 14.60 15.12 + 3.6 10.5EvTxMnDvsEqInc (ETY)-a ................ N 12.95 12.44 – 3.9 8.1EtnVncTxMgdGlbB (ETW)-a ............ N 10.42 9.73 – 6.6 3.6EVTxMnGblDvEqInc (EXG)-a ........... N 9.49 8.88 – 6.4 9.3First Trust Energy IncG (FEN)-a ....... A 12.99 11.54 – 11.2 – 38.5First Tr Enhanced Eq (FFA) .............. N 18.78 17.58 – 6.4 10.7First Tr Specialty Fn (FGB) ............... N 3.69 3.34 – 9.5 – 37.9FirstTrEnergyInfra (FIF) .................. N 13.08 11.08 – 15.3 – 29.2FirstTrMLPEner&Inc (FEI) .............. N 7.24 6.24 – 13.8 – 38.4GabGl Util & Inc (GLU)-h ................. A 19.86 18.47 – 7.0 1.4Gabelli Healthcare (GRX)-h .............. N 14.34 12.30 – 14.2 13.0GabUtility (GUT)-h .......................... N 4.13 8.04 + 94.7 17.0GAMCOGlGold&NatRes (GGN) ....... A 4.03 3.53 – 12.4 – 7.2GAMCONRGLD& INCTR (GNT) .... N 5.96 5.11 – 14.3 – 8.4JHan Finl Opptys (BTO) .................. N 31.18 32.97 + 5.7 4.5Macquarie/FirstTr Gl (MFD) ............ N 9.91 8.65 – 12.7 – 13.1MadisonCovCall & EqStr (MCN) .... N 7.26 7.19 – 1.0 23.3Neuberger BrmnMLP&EI (NML) ... N 4.96 3.73 – 24.8 – 40.5NubrgrRlEstSec (NRO) ................... A 4.46 4.23 – 5.2 – 16.6NuvDow30DynOverwrite (DIAX) .. N 16.84 15.07 – 10.5 – 8.4NuvCorEqAlpha (JCE) ..................... N 15.66 14.35 – 8.4 4.0
Weekly Closed-End FundsTRACKING CLOSED - END FUNDS
The Herzfeld Closed-End Average measures 15 equally-weighted closed-end funds based in the U.S. that invest principally inAmerican equities. The net assest value is a weighted average of the funds' NAVs. Source: Thomas J. Herzfeld Advisors Inc., Miami.305-271-1900/www.herzfeld.com
58200
51600
45000
38400
31800
25200
186002Q 20 3Q 20 4Q 20 1Q 21
*HerzfeldClosed-EndAverage
Dow Industrials
62700
56400
50100
43800
375002Q 3Q 4Q 1Q
Net Asset Value
-4
-7
-10
-13
-162Q 20 3Q 20 4Q 20 1Q 21
% Disc/Prem From Net Asset Value
52WeekStock Market Prem Market
FundName (Symbol) Exch NAV Price /Disc Return
52WeekStock Market Prem Market
FundName (Symbol) Exch NAV Price /Disc Return
12mosStock Market Prem Yield
FundName (Symbol) Exch NAV Price /Disc 12/31/20
A Running Start: As the new Biden administration got to work, the Herzfeld Aver-age and the Dow worked, too—gaining 1.4% and 0.6%, respectively, for the weekended Thursday.
Data provided by
a-NAV and market price are ex dividend. b-NAV is fully diluted. c-NAV is as of Thursday’s close. d-NAV is as of Wednesday’s close.e-NAV assumes rights offering is fully subscribed. f-Rights offeringin process. g-Rights offering announced. h-Lipper data has been ad-justed for rights offering. j-Rights offering has expired, but Lipperdata not yet adjusted. l-NAV as of previous day. o-Tender offer inprocess. Source: Lipper
Market Sentiment LAST +1.89Citigroup Panic/EuphoriaModel
-2.1
-1.4
-0.7
0
0.7
1.4
D J F M A M J J A S O N D J
Euphoria
Panic
The panic/euphoria model is a gauge of investor sentiment. It identifies "Panic" and "Euphoria" levels which are statistically driven buy andsell signals for the broader market. Historically, a reading below panic supports a better than 95% likelihood that stock prices will behigher one year later, while euphoria levels generate a better than 80% probability of stock prices being lower one year later.
Source: Citigroup Investment Research - US Equity Strategy
2.11.51.41.31.21.11.00.90.80.70.60.50.40.30.20.1
Q118
Q2 Q3 Q4 Q119
Q2 Q3 Q4 Q120
Q2 Q3 Q4 Q121
THREE YEAR TED SPREAD
Friday's Close 0.13
TED Spread = 3-mth LIBOR – 3-mth T-bill rate
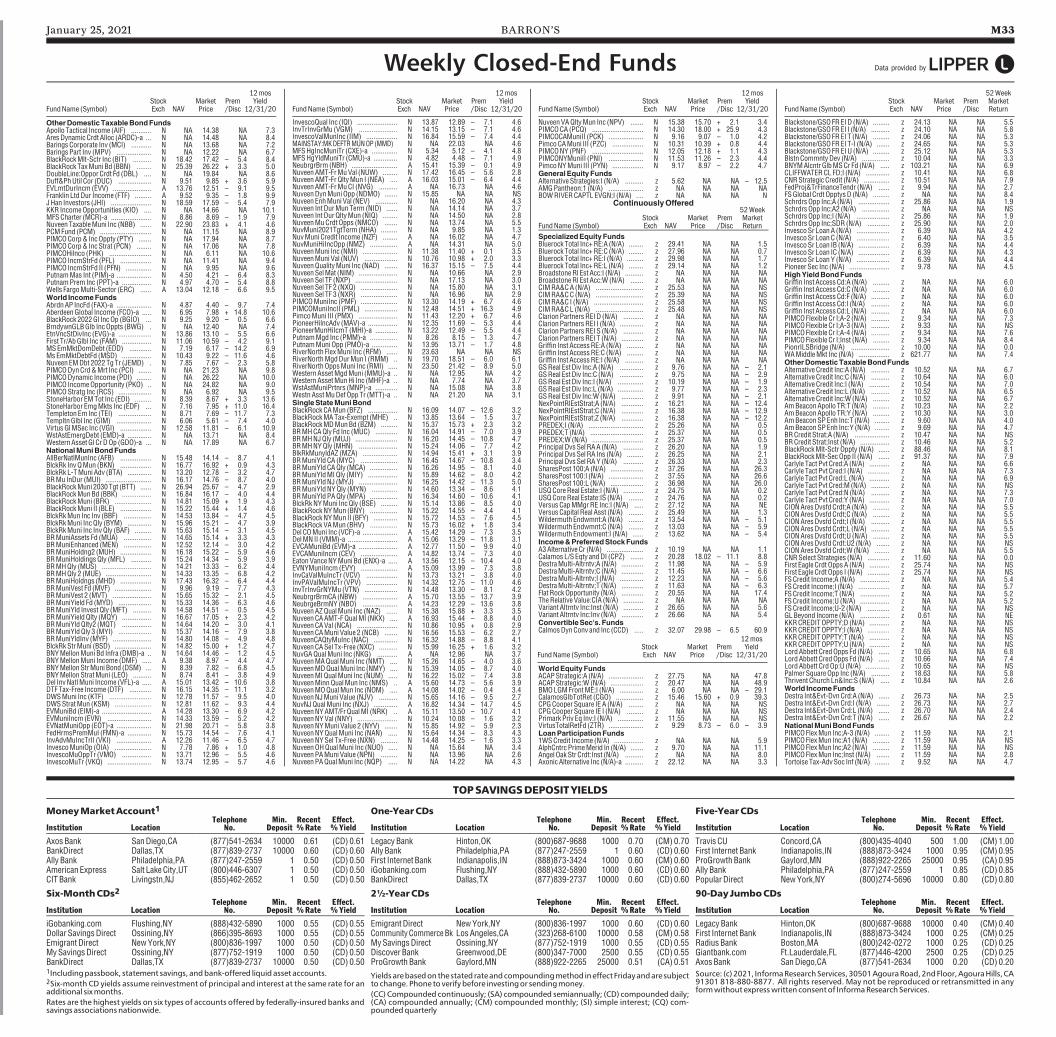
why how
January 25, 2021 BARRON’S M33
12mosStock Market Prem Yield
FundName (Symbol) Exch NAV Price /Disc 12/31/20
InvescoQual Inc (IQI) ...................... N 13.87 12.89 – 7.1 4.6InvTrInvGrMu (VGM) ..................... N 14.15 13.15 – 7.1 4.6InvescoValMunInc (IIM) ................. N 16.84 15.59 – 7.4 4.4MAINSTAY:MKDEFTRMUNOP (MMD) N NA 22.03 NA 4.6MFSHgIncMuniTr (CXE)-a .............. N 5.34 5.12 – 4.1 4.8MFSHgYldMuniTr (CMU)-a ............. N 4.82 4.48 – 7.1 4.9NeubrgrBrm (NBH) ......................... A 15.41 15.39 – 0.1 4.9NuveenAMT-FrMuVal (NUW) ........ N 17.42 16.45 – 5.6 2.8NuveenAMT-FrQltyMun I (NEA) .... A 16.03 15.01 – 6.4 4.4NuveenAMT-FrMuCI (NVG) .......... A NA 16.73 NA 4.6NuveenDynMuni Opp (NDMO) ....... N 15.85 NA NA NSNuveen EnhMuni Val (NEV) ............ N NA 16.20 NA 4.3Nuveen Int DurMunTerm (NID) ...... N NA 14.14 NA 3.7Nuveen Int DurQltyMun (NIQ) ........ N NA 14.50 NA 2.8NuveenMuCrdt Opps (NMCO) ....... N NA 13.74 NA 5.5NuvMuni2021TgtTerm (NHA) ......... N NA 9.85 NA 1.3NuvMuni Credit Income (NZF) ........ A NA 16.02 NA 4.7NuvMuniHiIncOpp (NMZ) ............... A NA 14.31 NA 5.0NuveenMuni Inc (NMI) ................... N 11.38 11.40 + 0.1 3.5NuveenMuni Val (NUV) .................. N 10.76 10.98 + 2.0 3.3NuveenQualityMuni Inc (NAD) ....... N 16.37 15.15 – 7.5 4.4NuveenSelMat (NIM) ..................... N NA 10.66 NA 2.9NuveenSel TF (NXP) ....................... N NA 17.13 NA 3.0NuveenSel TF 2 (NXQ) .................... N NA 15.80 NA 3.1NuveenSel TF 3 (NXR) .................... N NA 16.96 NA 2.9PIMCOMuniInc (PMF) .................... N 13.30 14.19 + 6.7 4.6PIMCOMuniIncII (PML) .................. N 12.48 14.51 + 16.3 4.9PimcoMuni III (PMX) ..................... N 11.43 12.20 + 6.7 4.6PioneerHilncAdv (MAV)-a ................ N 12.35 11.69 – 5.3 4.4PioneerMunHiIcmT (MHI)-a ............ N 13.22 12.49 – 5.5 4.4PutnamMgd Inc (PMM)-a ............... N 8.26 8.15 – 1.3 4.7PutnamMuni Opp (PMO)-a .............. N 13.95 13.71 – 1.7 4.8RiverNorth FlexMuni Inc (RFM) ...... N 23.63 NA NA NSRiverNorthMgdDurMun I (RMM) .. N 19.70 18.51 – 6.0 6.1RiverNorthOppsMuni Inc (RMI) ..... N 23.50 21.42 – 8.9 5.0Western AssetMgdMuni (MMU)-a .. N NA 12.95 NA 4.2Western AssetMunHi Inc (MHF)-a .. N NA 7.74 NA 3.7WstAstMuniPrtnrs (MNP)-a ............ N NA 15.08 NA 3.8Westn AsstMuDefOpp Tr (MTT)-a .. N NA 21.20 NA 3.1SingleStateMuniBondBlackRockCAMun (BFZ) ................ N 16.09 14.07 – 12.6 3.2BlackRockMATax-Exempt (MHE) .. N 13.85 13.64 – 1.5 3.7BlackRockMDMunBd (BZM) ......... N 15.37 15.73 + 2.3 3.2BRMHCAQly Fd Inc (MUC) ............ N 16.04 14.91 – 7.0 3.9BRMHNJQly (MUJ) ....................... N 16.20 14.45 – 10.8 4.7BRMHNYQly (MHN) ..................... N 15.24 14.06 – 7.7 4.2BlkRkMunyldAZ (MZA) ................... N 14.94 15.41 + 3.1 3.9BRMuniYld CA (MYC) .................... N 16.45 14.67 – 10.8 3.4BRMuniYld CAQly (MCA) ............... N 16.26 14.95 – 8.1 4.0BRMuniYldMIQly (MIY) ................ N 15.89 14.62 – 8.0 4.2BRMuniYldNJ (MYJ) ..................... N 16.25 14.42 – 11.3 5.0BRMuniYldNYQly (MYN) .............. N 14.60 13.34 – 8.6 4.1BRMuniYld PAQly (MPA) ............... N 16.34 14.60 – 10.6 4.1BlckRkNYMuni IncQly (BSE) ......... N 15.14 13.86 – 8.5 4.0BlackRockNYMun (BNY) ............... N 15.22 14.55 – 4.4 4.1BlackRockNYMun II (BFY) ............. N 15.72 14.53 – 7.6 4.5BlackRockVAMun (BHV) ............... N 15.73 16.02 + 1.8 3.4Del COMuni Inc (VCF)-a ................... A 15.42 14.29 – 7.3 3.5DelMN II (VMM)-a ........................... A 15.06 13.29 – 11.8 3.1EVCAMuniBd (EVM)-a ..................... A 12.77 11.50 – 9.9 4.0EVCAMuniIncm (CEV) .................... A 14.82 13.74 – 7.3 4.0EatonVanceNYMuni Bd (ENX)-a ..... A 13.56 12.15 – 10.4 4.0EVNYMuniIncm (EVY) .................... A 15.09 13.99 – 7.3 3.8InvCaValMuIncTr (VCV) ................. N 13.73 13.21 – 3.8 4.0InvPAValMuIncTr (VPV) ................. N 14.32 12.75 – 11.0 4.6InvTrInvGrNYMu (VTN) .................. N 14.48 13.30 – 8.1 4.2NeubrgrBrmCA (NBW) ................... A 15.70 13.55 – 13.7 3.9NeubrgeBrmNY (NBO) ................... A 14.23 12.29 – 13.6 3.8NuveenAZQualMuni Inc (NAZ) ...... N 15.38 15.88 + 3.3 3.5NuveenCAAMT-FQualMI (NKX) .... A 16.93 15.44 – 8.8 4.0NuveenCAVal (NCA) ...................... N 10.86 10.95 + 0.8 2.9NuveenCAMuni Value 2 (NCB) ....... N 16.56 15.53 – 6.2 2.7NuveenCAQtyMuInc (NAC) ............. N 16.32 14.88 – 8.8 4.1NuveenCASel Tx-Free (NXC) .......... N 15.99 16.25 + 1.6 3.2NuvGAQualMuni Inc (NKG) ........... A NA 12.96 NA 3.7NuveenMAQualMuni Inc (NMT) .... N 15.26 14.65 – 4.0 3.6NuveenMDQualMuni Inc (NMY) .... N 15.39 14.05 – 8.7 4.0NuveenMIQualMuni Inc (NUM) ..... N 16.22 15.02 – 7.4 3.8NuveenMinnQualMun Inc (NMS) .. A 15.60 14.73 – 5.6 3.9NuveenMOQualMun Inc (NOM) .... A 14.08 14.02 – 0.4 3.4NuveenNJMuni Value (NJV) .......... N 15.65 14.16 – 9.5 2.7NuvNJQualMuni Inc (NXJ) ............. A 16.82 14.34 – 14.7 4.5NuveenNYAMT/Fr QualMI (NRK) .. A 15.11 13.50 – 10.7 4.1NuveenNYVal (NNY) ...................... N 10.24 10.08 – 1.6 3.2NuveenNYMuni Value 2 (NYV) ....... N 15.85 14.92 – 5.9 2.3NuveenNYQualMuni Inc (NAN) ..... N 15.64 14.34 – 8.3 4.3NuveenNYSel Tx-Free (NXN) ......... N 14.48 14.25 – 1.6 3.3NuveenOHQualMuni Inc (NUO) ..... N NA 15.64 NA 3.4NuveenPAMuni Value (NPN) ......... N NA 13.96 NA 2.6NuveenPAQualMuni Inc (NQP) ..... N NA 14.22 NA 4.3
TOPSAVINGSDEPOSITYIELDS
MoneyMarketAccount1Telephone Min. Recent Effect.
Institution Location No. Deposit %Rate %Yield
AxosBank SanDiego,CA (877)541-2634 10000 0.61 (CD) 0.61BankDirect Dallas,TX (877)839-2737 10000 0.60 (CD) 0.60Ally Bank Philadelphia,PA (877)247-2559 1 0.50 (CD) 0.50American Express Salt Lake City,UT (800)446-6307 1 0.50 (CD) 0.50CITBank Livingstn,NJ (855)462-2652 1 0.50 (CD) 0.50
Six-MonthCDs2Telephone Min. Recent Effect.
Institution Location No. Deposit %Rate %Yield
iGobanking.com Flushing,NY (888)432-5890 1000 0.55 (CD) 0.55Dollar SavingsDirect Ossining,NY (866)395-8693 1000 0.55 (CD) 0.55Emigrant Direct NewYork,NY (800)836-1997 1000 0.50 (CD) 0.50MySavingsDirect Ossining,NY (877)752-1919 1000 0.50 (CD) 0.50BankDirect Dallas,TX (877)839-2737 10000 0.50 (CD) 0.501Includingpassbook, statement savings, andbank-offered liquidasset accounts.2Six-month CD yields assume reinvestment of principal and interest at the same rate for anadditional sixmonths.Rates are the highest yields on six types of accounts offered by federally-insured banks andsavingsassociationsnationwide.
One-YearCDsTelephone Min. Recent Effect.
Institution Location No. Deposit %Rate %Yield
LegacyBank Hinton,OK (800)687-9688 1000 0.70 (CM) 0.70Ally Bank Philadelphia,PA (877)247-2559 1 0.60 (CD) 0.60First Internet Bank Indianapolis,IN (888)873-3424 1000 0.60 (CM) 0.60iGobanking.com Flushing,NY (888)432-5890 1000 0.60 (CD) 0.60BankDirect Dallas,TX (877)839-2737 10000 0.60 (CD) 0.60
2½-YearCDsTelephone Min. Recent Effect.
Institution Location No. Deposit %Rate %Yield
Emigrant Direct NewYork,NY (800)836-1997 1000 0.60 (CD) 0.60Community CommerceBk LosAngeles,CA (323)268-6100 10000 0.58 (CM) 0.58MySavingsDirect Ossining,NY (877)752-1919 1000 0.55 (CD) 0.55Discover Bank Greenwood,DE (800)347-7000 2500 0.55 (CD) 0.55ProGrowthBank Gaylord,MN (888)922-2265 25000 0.51 (CA) 0.51
Yieldsarebasedonthestatedrateandcompoundingmethod ineffectFridayandaresubjectto change. Phone toverifybefore investingor sendingmoney.(CC) Compounded continuously; (SA) compounded semiannually; (CD) compoundeddaily;(CA) compounded annually; (CM) compounded monthly; (SI) simple interest; (CQ) com-poundedquarterly
Five-YearCDsTelephone Min. Recent Effect.
Institution Location No. Deposit %Rate %Yield
Travis CU Concord,CA (800)435-4040 500 1.00 (CM) 1.00First Internet Bank Indianapolis,IN (888)873-3424 1000 0.95 (CM) 0.95ProGrowthBank Gaylord,MN (888)922-2265 25000 0.95 (CA) 0.95Ally Bank Philadelphia,PA (877)247-2559 1 0.85 (CD) 0.85Popular Direct NewYork,NY (800)274-5696 10000 0.80 (CD) 0.80
90-DayJumboCDsTelephone Min. Recent Effect.
Institution Location No. Deposit %Rate %Yield
LegacyBank Hinton,OK (800)687-9688 10000 0.40 (CM) 0.40First Internet Bank Indianapolis,IN (888)873-3424 1000 0.25 (CM) 0.25Radius Bank Boston,MA (800)242-0272 1000 0.25 (CD) 0.25Giantbank.com Ft.Lauderdale,FL (877)446-4200 2500 0.25 (CD) 0.25AxosBank SanDiego,CA (877)541-2634 1000 0.20 (CD) 0.20Source: (c)2021, InformaResearchServices,30501AgouraRoad,2ndFloor,AgouraHills,CA91301 818-880-8877. All rights reserved. May not be reproduced or retransmitted in anyformwithout expresswritten consentof InformaResearchServices.
Blackstone/GSOFREID (N/A) ......... z 24.13 NA NA 5.5Blackstone/GSOFREI I (N/A) .......... z 24.10 NA NA 5.8Blackstone/GSOFREI T (N/A) ......... z 24.06 NA NA 5.3Blackstone/GSOFREI T-I (N/A) ....... z 24.65 NA NA 5.3Blackstone/GSOFREIU (N/A) ......... z 25.12 NA NA 5.3Blstn CommntyDev (N/A) ............... z 10.04 NA NA 3.3BNYMAlcntr GlbMSCr Fd (N/A) ..... z 103.21 NA NA 6.9CLIFFWATERCL FD;I (N/A) ............. z 10.41 NA NA 6.8CNRStrategic Credit (N/A) .............. z 10.51 NA NA 7.9FedProj&TrFinanceTendr (N/A) ...... z 9.94 NA NA 2.7FSGlobal Crdt OpptysD (N/A) ......... z NA NA NA 8.4SchrdrsOpp Inc;A (N/A) ................. z 25.86 NA NA 1.9SchrdrsOpp Inc;A2 (N/A) ............... z NA NA NA NSSchrdrsOpp Inc;I (N/A) .................. z 25.86 NA NA 1.9SchrdrsOpp Inc;SDR (N/A) ............ z 25.90 NA NA 2.0InvescoSr LoanA (N/A) .................. z 6.39 NA NA 4.2InvescoSr LoanC (N/A) .................. z 6.40 NA NA 3.5InvescoSr Loan IB (N/A) ................. z 6.39 NA NA 4.4InvescoSr Loan IC (N/A) ................. z 6.39 NA NA 4.3InvescoSr LoanY (N/A) .................. z 6.39 NA NA 4.4Pioneer Sec Inc (N/A) ...................... z 9.78 NA NA 4.5HighYieldBondFundsGriffin Inst AccessCd:A (N/A) ......... z NA NA NA 6.0Griffin Inst AccessCd:C (N/A) ......... z NA NA NA 6.0Griffin Inst AccessCd:F (N/A) .......... z NA NA NA 6.0Griffin Inst AccessCd:I (N/A) .......... z NA NA NA 6.0Griffin Inst AccessCd:L (N/A) .......... z NA NA NA 6.0PIMCOFlexible Cr I;A-2 (N/A) .......... z 9.34 NA NA 7.3PIMCOFlexible Cr I;A-3 (N/A) .......... z 9.33 NA NA NSPIMCOFlexible Cr I;A-4 (N/A) .......... z 9.34 NA NA 7.6PIMCOFlexible Cr I;Inst (N/A) ......... z 9.34 NA NA 8.4PionrILSBridge (N/A) ..................... z 10.00 NA NA 0.0WAMiddleMkt Inc (N/A) ................. z 621.77 NA NA 7.4OtherDomesticTaxableBondFundsAlternative Credit Inc:A (N/A) .......... z 10.52 NA NA 6.7Alternative Credit Inc:C (N/A) .......... z 10.64 NA NA 6.0Alternative Credit Inc:I (N/A) ........... z 10.54 NA NA 7.0Alternative Credit Inc:L (N/A) .......... z 10.52 NA NA 6.5Alternative Credit Inc:W (N/A) ......... z 10.52 NA NA 6.7AmBeaconApollo TR:T (N/A) ......... z 10.23 NA NA 2.2AmBeaconApollo TR:Y (N/A) ......... z 10.30 NA NA 3.0AmBeaconSPEnh Inc:T (N/A) ........ z 9.60 NA NA 4.0AmBeaconSPEnh Inc:Y (N/A) ........ z 9.69 NA NA 4.7BRCredit Strat;A (N/A) ................... z 10.47 NA NA NSBRCredit Strat;Inst (N/A) ................ z 10.46 NA NA 5.2BlackRockMlt-Sctr Oppty (N/A) ...... z 88.46 NA NA 8.1BlackRockMlt-SecOpp II (N/A) ...... z 91.37 NA NA 7.9Carlyle Tact Pvt Cred:A (N/A) ........... z NA NA NA 6.6Carlyle Tact Pvt Cred:I (N/A) ............ z NA NA NA 7.3Carlyle Tact Pvt Cred:L (N/A) ........... z NA NA NA 6.9Carlyle Tact Pvt Cred:M (N/A) .......... z NA NA NA NSCarlyle Tact Pvt Cred:N (N/A) .......... z NA NA NA 7.3Carlyle Tact Pvt Cred:Y (N/A) ........... z NA NA NA 7.0CIONAresDvsfd Crdt;A (N/A) ......... z NA NA NA 5.5CIONAresDvsfd Crdt;C (N/A) ......... z NA NA NA 5.5CIONAresDvsfd Crdt;I (N/A) .......... z NA NA NA 5.5CIONAresDvsfd Crdt;L (N/A) .......... z NA NA NA 5.5CIONAresDvsfd Crdt;U (N/A) ......... z NA NA NA 5.5CIONAresDvsfd Crdt:U2 (N/A) ....... z NA NA NA NSCIONAresDvsfd Crdt;W (N/A) ........ z NA NA NA 5.5CNRSelect Strategies (N/A) ............ z 11.60 NA NA 0.0First Eagle Crdt OppsA (N/A) ........... z 25.74 NA NA NSFirst Eagle Crdt Opps I (N/A) ............ z 25.74 NA NA NSFSCredit Income;A (N/A) ................ z NA NA NA 5.4FSCredit Income;I (N/A) ................. z NA NA NA 5.7FSCredit Income;T (N/A) ................ z NA NA NA 5.2FSCredit Income;U (N/A) ................ z NA NA NA 5.2FSCredit Income;U-2 (N/A) ............ z NA NA NA NSGLBeyond Income (N/A) ................ z 0.61 NA NA NEKKRCREDITOPPTY;D (N/A) ........... z NA NA NA NSKKRCREDITOPPTY;I (N/A) ............ z NA NA NA NSKKRCREDITOPPTY;T (N/A) ........... z NA NA NA NSKKRCREDITOPPTY;U (N/A) ........... z NA NA NA NSLordAbbett CredOpps Fd (N/A) ...... z 10.65 NA NA 6.8LordAbbett CredOpps Fd (N/A) ...... z 10.66 NA NA 7.4LordAbbett CrdOp:U (N/A) ............. z 10.65 NA NA NSPalmer SquareOpp Inc (N/A) .......... z 18.63 NA NA 5.8Thrivent Church Ln&Inc:S (N/A) ..... z 10.84 NA NA 2.6World IncomeFundsDestra Int&Evt-DvnCrd:A (N/A) ...... z 26.73 NA NA 2.5Destra Int&Evt-DvnCrd:I (N/A) ....... z 26.73 NA NA 2.7Destra Int&Evt-DvnCrd:L (N/A) ...... z 26.70 NA NA 2.4Destra Int&Evt-DvnCrd:T (N/A) ...... z 26.67 NA NA 2.2NationalMuniBondFundsPIMCOFlexMun Inc;A-3 (N/A) ........ z 11.59 NA NA 2.1PIMCOFlexMun Inc:A1 (N/A) ......... z 11.59 NA NA NSPIMCOFlexMun Inc;A2 (N/A) ......... z 11.59 NA NA NSPIMCOFlexMun Inc;Inst (N/A) ....... z 11.59 NA NA 2.8Tortoise Tax-AdvSoc Inf (N/A) ........ z 9.52 NA NA 4.7
OtherDomesticTaxableBondFundsApollo Tactical Income (AIF) ........... N NA 14.38 NA 7.3AresDynamic Crdt Alloc (ARDC)-a ... N NA 14.48 NA 8.4BaringsCorporate Inv (MCI) ........... N NA 13.68 NA 7.2BaringsPart Inv (MPV) ................... N NA 12.22 NA 6.7BlackRockMlt-Sctr Inc (BIT) .......... N 18.42 17.42 – 5.4 8.4BlackRock TaxMuni Bd (BBN) ........ N 25.39 26.22 + 3.3 5.0DoubleLine:Oppor Crdt Fd (DBL) .... N NA 19.84 NA 8.6Duff&PhUtil Cor (DUC) .................. N 9.51 9.85 + 3.6 5.9EVLmtDurIncm (EVV) ..................... A 13.76 12.51 – 9.1 9.5Franklin LtdDur Income (FTF) ......... A 9.52 9.35 – 1.8 9.9JHan Investors (JHI) ...................... N 18.59 17.59 – 5.4 7.9KKR IncomeOpportunities (KIO) .... N NA 14.66 NA 10.1MFSCharter (MCR)-a ...................... N 8.86 8.69 – 1.9 7.9Nuveen TaxableMuni Inc (NBB) ...... N 22.90 23.83 + 4.1 4.6PCMFund (PCM) ............................ N NA 11.15 NA 8.9PIMCOCorp& IncOppty (PTY) ....... N NA 17.94 NA 8.7PIMCOCorp& IncStrat (PCN) ........ N NA 17.06 NA 7.8PIMCOHilnco (PHK) ....................... N NA 6.11 NA 10.6PIMCO IncmStrFd (PFL) ................. N NA 11.41 NA 9.4PIMCO IncmStrFd II (PFN) .............. N NA 9.95 NA 9.6PutnamMas Int (PIM)-a ................... N 4.50 4.21 – 6.4 8.3PutnamPrem Inc (PPT)-a ................ N 4.97 4.70 – 5.4 8.8Wells FargoMulti-Sector (ERC) ...... A 13.04 12.18 – 6.6 9.5World IncomeFundsAbrdnAP IncFd (FAX)-a ................... N 4.87 4.40 – 9.7 7.4AberdeenGlobal Income (FCO)-a ..... N 6.95 7.98 + 14.8 10.6BlackRock 2022Gl IncOp (BGIO) ... N 9.25 9.20 – 0.5 6.6BrndywnGLBGlb IncOppts (BWG) . N NA 12.40 NA 7.4EtnVncStDivInc (EVG)-a .................. N 13.86 13.10 – 5.5 6.6First Tr/AbGlbl Inc (FAM) ................ N 11.06 10.59 – 4.2 9.1MSEmMktDomDebt (EDD) ............ N 7.19 6.17 – 14.2 6.9MsEmMktDebtFd (MSD) ................ N 10.43 9.22 – 11.6 4.6Nuveen EMDbt 2022 Tg Tr (JEMD) . N 7.85 7.67 – 2.3 5.8PIMCODynCrd&Mrt Inc (PCI) ....... N NA 21.23 NA 9.8PIMCODynamic Income (PDI) ........ N NA 26.22 NA 10.0PIMCO IncomeOpportunity (PKO) .. N NA 24.82 NA 9.0PIMCOStratg Inc (RCS) .................. N NA 6.92 NA 9.5StoneHarbor EMTot Inc (EDI) ......... N 8.39 8.67 + 3.3 13.6StoneHarbor EmgMkts Inc (EDF) ... N 7.16 7.95 + 11.0 16.4Templeton Em Inc (TEI) .................. N 8.71 7.69 – 11.7 7.3TempltnGlbl Inc (GIM) ................... N 6.06 5.61 – 7.4 4.0VirtusGlMSec Inc (VGI) ................. N 12.58 11.81 – 6.1 10.9WstAstEmergDebt (EMD)-a ............. N NA 13.71 NA 8.4Western Asset Gl CrDOp (GDO)-a ... N NA 17.89 NA 6.7NationalMuniBondFundsAllBerNatlMunInc (AFB) ................. N 15.48 14.14 – 8.7 4.1BlckRk InvQMun (BKN) ................. N 16.77 16.92 + 0.9 4.3BlckRk L-TMuni Adv (BTA) ............. N 13.20 12.78 – 3.2 4.7BRMu InDur (MUI) ......................... N 16.17 14.76 – 8.7 4.0BlackRockMuni 2030 Tgt (BTT) ...... N 26.94 25.67 – 4.7 2.9BlackRockMunBd (BBK) ................ N 16.84 16.17 – 4.0 4.4BlackRockMuni (BFK) .................... N 14.81 15.09 + 1.9 4.3BlackRockMuni II (BLE) ................. N 15.22 15.44 + 1.4 4.6BlckRkMun Inc Inv (BBF) ............... N 14.53 13.84 – 4.7 4.5BlckRkMuni IncQly (BYM) ............. N 15.96 15.21 – 4.7 3.9BlckRkMuni Inc InvQly (BAF) ......... N 15.63 15.14 – 3.1 4.5BRMuniAssets Fd (MUA) ............... N 14.65 15.14 + 3.3 4.3BRMuniEnhanced (MEN) ............... N 12.52 12.14 – 3.0 4.2BRMuniHoldng2 (MUH) ................. N 16.18 15.22 – 5.9 4.6BRMuniHoldingsQly (MFL) ........... N 15.24 14.34 – 5.9 3.9BRMHQly (MUS) ........................... N 14.21 13.33 – 6.2 4.4BRMHQly 2 (MUE) ......................... N 14.33 13.35 – 6.8 4.2BRMuniHoldngs (MHD) ................. N 17.43 16.32 – 6.4 4.4BRMuniVest Fd (MVF) .................... N 9.96 9.19 – 7.7 4.3BRMuniVest 2 (MVT) ..................... N 15.65 15.32 – 2.1 4.5BRMuniYield Fd (MYD) .................. N 15.33 14.36 – 6.3 4.6BRMuniYld Invest Qly (MFT) .......... N 14.58 14.51 – 0.5 4.5BRMuniYieldQlty (MQY) ................ N 16.67 17.05 + 2.3 4.2BRMuniYldQlty2 (MQT) ................ N 14.64 14.20 – 3.0 4.1BRMuniYldQly 3 (MYI) .................. N 15.37 14.16 – 7.9 3.8BRMuniYldInv (MYF) ..................... N 14.80 14.08 – 4.9 4.8BlckRkStrMuni (BSD) .................... N 14.82 15.00 + 1.2 4.7BNYMellonMuni Bd Infra (DMB)-a .. N 14.64 14.46 – 1.2 4.5BNYMellonMuni Income (DMF) ..... A 9.38 8.97 – 4.4 4.7BNYMellonStrMuni Bond (DSM) ... N 8.39 7.82 – 6.8 4.5BNYMellonStratMuni (LEO) .......... N 8.74 8.41 – 3.8 4.9Del InvNatlMuni Income (VFL)-a ..... A 15.01 13.42 – 10.6 3.8DTF Tax-Free Income (DTF) ............ N 16.15 14.35 – 11.1 3.2DWSMuni Inc (KTF) ....................... N 12.78 11.57 – 9.5 4.0DWSStratMun (KSM) .................... N 12.81 11.62 – 9.3 4.4EVMuniBd (EIM)-a ........................... A 14.28 13.30 – 6.9 4.2EVMuniIncm (EVN) ........................ N 14.33 13.59 – 5.2 4.2EVNatMuniOpp (EOT)-a ................... N 21.98 20.71 – 5.8 3.8FedHrmsPremMuI (FMN)-a ............. N 15.73 14.54 – 7.6 4.1InvAdvMuIncTrII (VKI) ................... A 12.26 11.46 – 6.5 4.7InvescoMuniOp (OIA) .................... N 7.78 7.86 + 1.0 4.8InvescoMuOppTr (VMO) ................ N 13.71 12.96 – 5.5 4.6InvescoMuTr (VKQ) ........................ N 13.74 12.95 – 5.7 4.6
12mosStock Market Prem Yield
FundName (Symbol) Exch NAV Price /Disc 12/31/20
Data provided byWeekly Closed-End Funds52Week
Stock Market Prem MarketFundName (Symbol) Exch NAV Price /Disc Return
NuveenVAQltyMun Inc (NPV) ....... N 15.38 15.70 + 2.1 3.4PIMCOCA (PCQ) ............................ N 14.30 18.00 + 25.9 4.3PIMCOCAMuniII (PCK) ................... N 9.16 9.07 – 1.0 4.2PimcoCAMuni III (PZC) ................. N 10.31 10.39 + 0.8 4.4PIMCONY (PNF) ............................ N 12.05 12.18 + 1.1 4.3PIMCONYMuniII (PNI) ................... N 11.53 11.26 – 2.3 4.4PimcoNYMuni III (PYN) ................. N 9.17 8.97 – 2.2 4.7GeneralEquityFundsAlternative Strategies:I (N/A) .......... z 5.62 NA NA – 12.5AMGPantheon:1 (N/A) ................... z NA NA NA NABOWRIVERCAPTLEVGN;I (N/A) .... z NA NA NA N
SpecializedEquityFundsBluerock Total Inc+RE:A (N/A) ........ z 29.41 NA NA 1.5Bluerock Total Inc+RE:C (N/A) ........ z 27.96 NA NA 0.7Bluerock Total Inc+RE:I (N/A) ......... z 29.98 NA NA 1.7Bluerock Total Inc+RE:L (N/A) ........ z 29.14 NA NA 1.2BroadstoneRl Est Acc:I (N/A) .......... z NA NA NA NABroadstoneRl Est Acc:W (N/A) ....... z NA NA NA NACIMRA&CA (N/A) .......................... z 25.53 NA NA NSCIMRA&CC (N/A) .......................... z 25.39 NA NA NSCIMRA&C I (N/A) ........................... z 25.58 NA NA NSCIMRA&CL (N/A) .......................... z 25.48 NA NA NSClarionPartnersREID (N/A) ........... z NA NA NA NAClarionPartnersREI I (N/A) ............. z NA NA NA NAClarionPartnersREI S (N/A) ........... z NA NA NA NAClarionPartnersREI T (N/A) ............ z NA NA NA NAGriffin Inst AccessRE:A (N/A) ......... z NA NA NA NAGriffin Inst AccessRE:C (N/A) ......... z NA NA NA NAGriffin Inst AccessRE:I (N/A) .......... z NA NA NA NAGSReal Est Div Inc:A (N/A) ............. z 9.76 NA NA – 2.1GSReal Est Div Inc:C (N/A) ............. z 9.75 NA NA – 2.9GSReal Est Div Inc:I (N/A) .............. z 10.19 NA NA – 1.9GSReal Est Div Inc:L (N/A) .............. z 9.77 NA NA – 2.3GSReal Est Div Inc:W (N/A) ............ z 9.91 NA NA – 2.1NexPointRlEstStrat;A (N/A) ............ z 16.21 NA NA – 12.4NexPointRlEstStrat;C (N/A) ............ z 16.38 NA NA – 12.9NexPointRlEstStrat;Z (N/A) ............ z 16.38 NA NA – 12.2PREDEX;I (N/A) .............................. z 25.26 NA NA 0.5PREDEX;T (N/A) ............................. z 25.37 NA NA 0.5PREDEX;W (N/A) ............................ z 25.37 NA NA 0.5Principal DvsSel RAA (N/A) ........... z 26.20 NA NA 1.9Principal DvsSel RA Ins (N/A) ......... z 26.25 NA NA 2.1Principal DvsSel RAY (N/A) ........... z 26.33 NA NA 2.3SharesPost 100;A (N/A) .................. z 37.26 NA NA 26.3SharesPost 100:I (N/A) ................... z 37.55 NA NA 26.6SharesPost 100:L (N/A) .................. z 36.98 NA NA 26.0USQCoreReal Estate:I (N/A) ........... z 24.75 NA NA 0.2USQCoreReal Estate:IS (N/A) ........ z 24.76 NA NA 0.2VersusCapMMgrRE Inc:I (N/A) ..... z 27.12 NA NA NEVersusCapital Real Asst (N/A) ........ z 25.49 NA NA 1.3Wildermuth Endwmnt:A (N/A) ........ z 13.54 NA NA – 5.1Wildermuth Endwmnt:C (N/A) ........ z 13.03 NA NA – 5.9Wildermuth Endowment:I (N/A) ...... z 13.62 NA NA – 5.4Income&PreferredStockFundsA3Alternative Cr (N/A) .................... z 10.19 NA NA 1.1Calamos L/S Eqty andDI (CPZ) ....... z 20.28 18.02 – 11.1 8.8DestraMulti-Altrntv;A (N/A) ............ z 11.98 NA NA – 5.9DestraMulti-Altrntv;C (N/A) ............ z 11.45 NA NA – 6.6DestraMulti-Altrntv;I (N/A) ............. z 12.23 NA NA – 5.6DestraMulti-Altrntv;T (N/A) ............ z 11.63 NA NA – 6.3Flat RockOpportunity (N/A) ............ z 20.55 NA NA 17.4TheRelative Value:CIA (N/A) ........... z NA NA NA NAVariant Altrntv Inc:Inst (N/A) ........... z 26.65 NA NA 5.6Variant Altrntv Inc:Inv (N/A) ............ z 26.66 NA NA 5.4ConvertibleSec's. FundsCalmosDynConv and Inc (CCD) ..... z 32.07 29.98 – 6.5 60.9
WorldEquityFundsACAPStrategic:A (N/A) ................... z 27.75 NA NA 47.8ACAPStrategic:W (N/A) .................. z 20.47 NA NA 48.9BMOLGMFrontME;I (N/A) ............. z 6.00 NA NA – 29.1CalamosGlbTotRet (CGO) ............... z 15.46 15.60 + 0.9 39.3CPGCooper Square IE A (N/A) ........ z NA NA NA NSCPGCooper Square IE I (N/A) ......... z NA NA NA NSPrimark Priv Eq Inv:I (N/A) .............. z 11.55 NA NA NSVirtusTotalRetFd (ZTR) ................... z 9.29 8.73 – 6.0 – 3.9LoanParticipationFunds1WSCredit Income (N/A) ................ z NA NA NA 5.9AlphCntrc PrimeMerid In (N/A) ....... z 9.70 NA NA 11.1Angel OakStr Crdt:Inst (N/A) .......... z NA NA NA 8.0Axonic Alternative Inc (N/A)-a .......... z 22.12 NA NA 3.3
12mosStock Market Prem Yield
FundName (Symbol) Exch NAV Price /Disc 12/31/20
12mosStock Market Prem Yield
FundName (Symbol) Exch NAV Price /Disc 12/31/20
ContinuouslyOffered52Week
Stock Market Prem MarketFundName (Symbol) Exch NAV Price /Disc Return
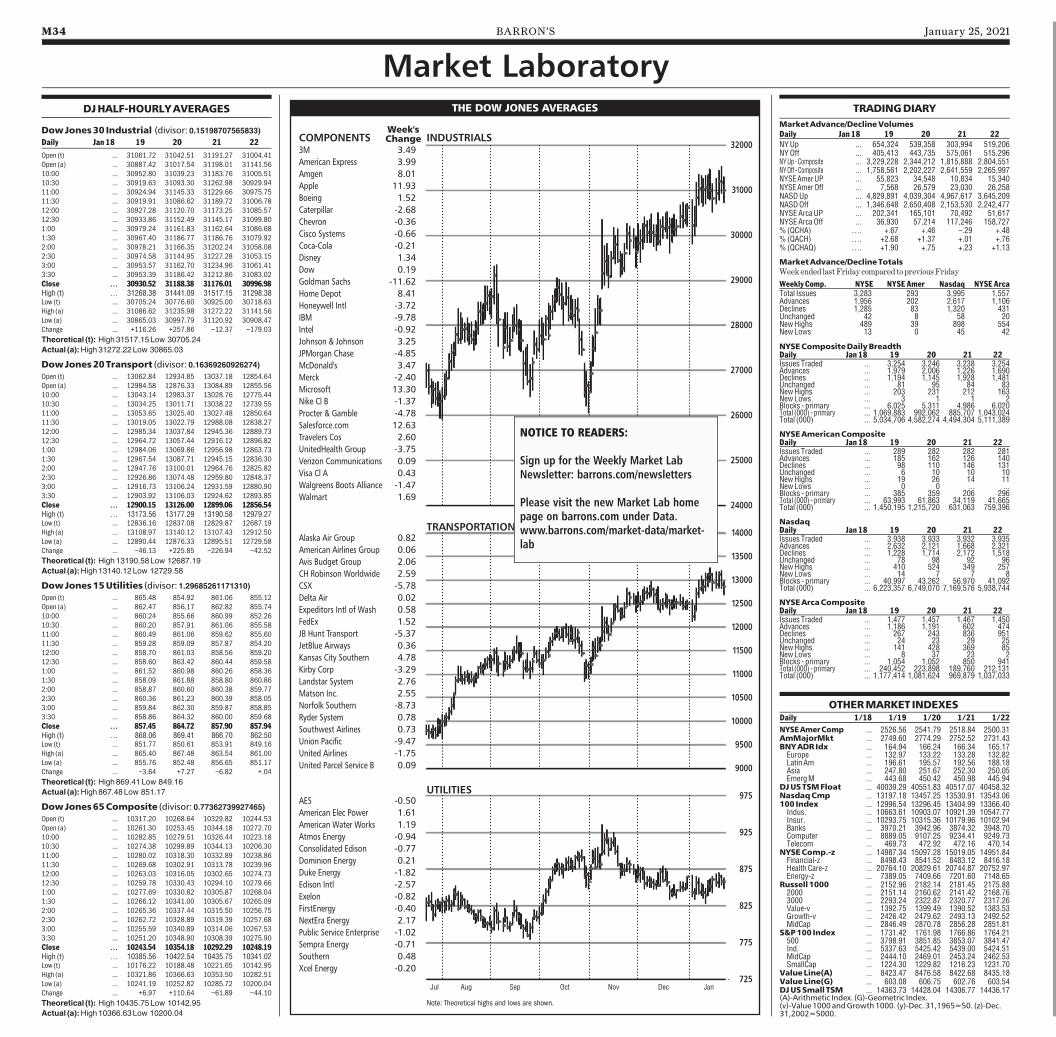
M34 BARRON’S January 25, 2021
DJHALF-HOURLYAVERAGES
DowJones30 Industrial (divisor: 0.15198707565833)Daily Jan18 19 20 21 22Open (t) … 31061.72 31042.51 31191.27 31004.41Open (a) … 30887.42 31017.54 31198.01 31141.5610:00 … 30952.80 31039.23 31183.76 31005.5110:30 … 30919.63 31093.30 31262.98 30929.9411:00 … 30924.94 31145.33 31229.66 30975.7511:30 … 30919.91 31086.62 31189.72 31006.7812:00 … 30927.28 31120.70 31173.25 31085.5712:30 … 30933.86 31152.49 31145.17 31099.801:00 … 30979.24 31161.83 31162.64 31086.681:30 … 30967.40 31186.77 31186.76 31079.922:00 … 30978.21 31166.35 31202.24 31058.082:30 … 30974.58 31144.95 31227.28 31053.153:00 … 30953.57 31162.70 31234.96 31061.413:30 … 30953.39 31186.42 31212.86 31083.02
Close … 30930.52 31188.38 31176.01 30996.98High (t) … 31268.38 31441.09 31517.15 31298.38Low (t) … 30705.24 30776.60 30925.00 30718.63High (a) … 31086.62 31235.98 31272.22 31141.56Low (a) … 30865.03 30997.79 31120.92 30908.47Change … +116.26 +257.86 –12.37 –179.03
Theoretical (t): High31517.15Low 30705.24Actual (a):High31272.22Low 30865.03
DowJones20Transport (divisor: 0.16369260926274)Open (t) … 13062.84 12934.85 13037.18 12854.64Open (a) … 12984.58 12876.33 13084.89 12855.5610:00 … 13043.14 12983.37 13028.76 12775.4410:30 … 13034.25 13011.71 13038.22 12739.5511:00 … 13053.65 13025.40 13027.48 12850.6411:30 … 13019.05 13022.79 12988.08 12838.2712:00 … 12985.34 13037.84 12945.36 12889.7312:30 … 12964.72 13057.44 12916.12 12896.821:00 … 12984.06 13069.86 12956.98 12863.731:30 … 12967.54 13087.71 12945.15 12836.302:00 … 12947.76 13100.01 12964.76 12825.822:30 … 12926.86 13074.48 12959.80 12848.373:00 … 12916.73 13106.24 12931.59 12880.903:30 … 12903.92 13106.03 12924.62 12893.85
Close … 12900.15 13126.00 12899.06 12856.54High (t) … 13173.56 13177.29 13190.58 12979.27Low (t) … 12836.16 12837.08 12829.87 12687.19High (a) … 13108.97 13140.12 13107.43 12912.50Low (a) … 12890.44 12876.33 12895.51 12729.58Change … –46.13 +225.85 –226.94 –42.52
Theoretical (t): High13190.58Low 12687.19Actual (a):High13140.12Low 12729.58
DowJones15Utilities (divisor: 1.29685261171310)Open (t) … 865.48 854.92 861.06 855.12Open (a) … 862.47 856.17 862.82 855.7410:00 … 860.24 855.66 860.99 852.2610:30 … 860.20 857.91 861.06 855.5811:00 … 860.49 861.06 859.62 855.6011:30 … 859.28 859.09 857.87 854.2012:00 … 858.70 861.03 858.56 859.2012:30 … 858.60 863.42 860.44 859.581:00 … 861.52 860.98 860.26 858.361:30 … 858.09 861.88 858.80 860.862:00 … 858.87 860.60 860.38 859.772:30 … 860.36 861.23 860.39 858.053:00 … 859.84 862.30 859.87 858.853:30 … 858.86 864.32 860.00 859.68
Close … 857.45 864.72 857.90 857.94High (t) … 868.06 869.41 866.70 862.50Low (t) … 851.77 850.61 853.91 849.16High (a) … 865.40 867.48 863.54 861.00Low (a) … 855.76 852.48 856.65 851.17Change … –3.64 +7.27 –6.82 +.04
Theoretical (t): High869.41Low 849.16Actual (a):High867.48Low 851.17
DowJones65Composite (divisor: 0.77362739927465)Open (t) … 10317.20 10268.64 10329.82 10244.53Open (a) … 10261.30 10253.45 10344.18 10272.7010:00 … 10282.85 10279.51 10326.44 10223.1810:30 … 10274.38 10299.89 10344.13 10206.3011:00 … 10280.02 10318.30 10332.89 10238.8611:30 … 10269.68 10302.91 10313.78 10239.9612:00 … 10263.03 10316.05 10302.65 10274.7312:30 … 10259.78 10330.43 10294.10 10279.661:00 … 10277.69 10330.82 10305.87 10268.041:30 … 10266.12 10341.00 10305.67 10265.092:00 … 10265.36 10337.44 10315.50 10256.752:30 … 10262.72 10328.89 10319.39 10257.683:00 … 10255.59 10340.89 10314.06 10267.533:30 … 10251.20 10348.90 10308.39 10275.90
Close … 10243.54 10354.18 10292.29 10248.19High (t) … 10385.56 10422.54 10435.75 10341.02Low (t) … 10176.22 10188.48 10221.65 10142.95High (a) … 10321.86 10366.63 10353.50 10282.51Low (a) … 10241.19 10252.82 10285.72 10200.04Change … +6.97 +110.64 –61.89 –44.10
Theoretical (t): High10435.75Low 10142.95Actual (a):High10366.63Low 10200.04
TRADINGDIARYMarketAdvance/DeclineVolumesDaily Jan18 19 20 21 22NYUp ... 654,324 539,358 303,994 519,206NYOff ... 405,413 443,735 575,061 515,296NYUp - Composite ... 3,229,228 2,344,212 1,815,888 2,804,551NYOff - Composite ... 1,758,561 2,202,227 2,641,559 2,265,997NYSEAmerUP ... 55,823 34,548 10,834 15,340NYSEAmerOff ... 7,568 26,579 23,030 26,258NASDUp ... 4,829,891 4,039,304 4,967,617 3,645,209NASDOff ... 1,346,648 2,650,408 2,153,530 2,242,477NYSEArcaUP ... 202,341 165,101 70,492 51,617NYSEArcaOff ... 36,930 57,214 117,246 158,727% (QCHA) …. +.67 +.46 –.29 +.48% (QACH) …. +2.68 +1.37 +.01 +.76% (QCHAQ) …. +1.90 +.75 +.23 +1.13
MarketAdvance/DeclineTotalsWeekended lastFriday compared topreviousFriday
WeeklyComp. NYSE NYSEAmer Nasdaq NYSEArcaTotal Issues 3,283 293 3,995 1,557Advances 1,956 202 2,617 1,106Declines 1,285 83 1,320 431Unchanged 42 8 58 20NewHighs 489 39 898 554NewLows 13 0 45 42
NYSECompositeDailyBreadthDaily Jan18 19 20 21 22Issues Traded ... 3,254 3,246 3,238 3,254Advances ... 1,979 2,006 1,226 1,690Declines ... 1,194 1,145 1,928 1,481Unchanged ... 81 95 84 83NewHighs ... 203 231 212 163NewLows ... 3 1 1 2Blocks - primary ... 6,025 5,311 4,986 6,020Total (000) - primary ... 1,069,883 992,062 885,707 1,043,024Total (000) ... 5,034,706 4,582,274 4,494,304 5,111,389
NYSEAmericanCompositeDaily Jan18 19 20 21 22Issues Traded ... 289 282 282 281Advances ... 185 162 126 140Declines ... 98 110 146 131Unchanged ... 6 10 10 10NewHighs ... 19 26 14 11NewLows ... 0 0 ... ...Blocks - primary ... 385 359 206 296Total (000) - primary ... 63,993 61,863 34,119 41,665Total (000) ... 1,450,195 1,215,720 631,063 759,396
NasdaqDaily Jan18 19 20 21 22Issues Traded ... 3,938 3,933 3,932 3,935Advances ... 2,632 2,121 1,668 2,321Declines ... 1,228 1,714 2,172 1,518Unchanged ... 78 98 92 96NewHighs ... 410 524 349 257NewLows ... 14 7 7 8Blocks - primary ... 40,997 43,262 56,970 41,092Total (000) ... 6,223,357 6,749,070 7,169,576 5,938,744
NYSEArcaCompositeDaily Jan18 19 20 21 22Issues Traded ... 1,477 1,457 1,467 1,450Advances ... 1,186 1,191 602 474Declines ... 267 243 836 951Unchanged ... 24 23 29 25NewHighs ... 141 428 369 85NewLows ... 8 37 23 2Blocks - primary ... 1,054 1,052 850 941Total (000) - primary ... 240,452 223,898 189,760 212,131Total (000) ... 1,177,414 1,081,624 969,879 1,037,033
Market Laboratory
OTHERMARKET INDEXESDaily 1/18 1/19 1/20 1/21 1/22NYSEAmerComp ... 2526.56 2541.79 2518.84 2500.31AmMajorMkt ... 2749.60 2774.29 2752.52 2731.43BNYADRIdx ... 164.94 166.24 166.34 165.17Europe ... 132.97 133.22 133.28 132.82Latin Am ... 196.61 195.57 192.56 188.18Asia ... 247.80 251.67 252.30 250.05EmergM ... 443.68 450.42 450.98 445.94DJUSTSMFloat ... 40039.29 40551.83 40517.07 40458.32NasdaqCmp ... 13197.18 13457.25 13530.91 13543.06100 Index ... 12996.54 13296.45 13404.99 13366.40Indus. ... 10663.61 10903.07 10921.39 10547.77Insur. ... 10293.75 10315.36 10179.96 10102.94Banks ... 3970.21 3942.96 3874.32 3948.70Computer ... 8889.05 9107.25 9234.41 9249.73Telecom ... 469.73 472.92 472.16 470.14NYSEComp.-z ... 14987.34 15097.28 15019.05 14951.84Financial-z ... 8498.43 8541.52 8483.12 8416.18Health Care-z ... 20764.10 20829.61 20744.87 20752.97Energy-z ... 7389.05 7409.66 7201.60 7148.65Russell 1000 ... 2152.96 2182.14 2181.45 2175.882000 ... 2151.14 2160.62 2141.42 2168.763000 ... 2293.24 2322.87 2320.77 2317.26Value-v ... 1392.75 1399.49 1390.52 1383.53Growth-v ... 2426.42 2479.62 2493.13 2492.52MidCap ... 2846.49 2870.78 2856.28 2851.81S&P100 Index ... 1731.42 1761.98 1766.86 1764.21500 ... 3798.91 3851.85 3853.07 3841.47Ind. ... 5337.63 5425.42 5439.00 5424.51MidCap ... 2444.10 2469.01 2453.24 2462.53SmallCap ... 1224.30 1229.82 1216.23 1231.70ValueLine(A) ... 8423.47 8476.58 8422.68 8435.18ValueLine(G) ... 603.08 606.75 602.76 603.54DJUSSmall TSM ... 14363.73 14428.04 14306.77 14436.17(A)-Arithmetic Index. (G)-Geometric Index.(v)-Value1000andGrowth1000. (y)-Dec. 31,1965=50. (z)-Dec.31,2002=5000.
THE DOW JONES AVERAGES
INDUSTRIALS
24000
25000
26000
27000
28000
29000
30000
31000
32000
TRANSPORTATION
9000
9500
10000
10500
11000
11500
12000
12500
13000
13500
14000
UTILITIES
725
775
825
875
925
975
Jul Aug Sep Oct Nov Dec Jan
COMPONENTSWeek'sChange
3M 3.49American Express 3.99Amgen 8.01Apple 11.93Boeing 1.52Caterpillar -2.68Chevron -0.36Cisco Systems -0.66Coca-Cola -0.21Disney 1.34Dow 0.19Goldman Sachs -11.62Home Depot 8.41Honeywell Intl -3.72IBM -9.78Intel -0.92Johnson & Johnson 3.25JPMorgan Chase -4.85McDonald's 3.47Merck -2.40Microsoft 13.30Nike Cl B -1.37Procter & Gamble -4.78Salesforce.com 12.63Travelers Cos 2.60UnitedHealth Group -3.75Verizon Communications 0.09Visa Cl A 0.43Walgreens Boots Alliance -1.47Walmart 1.69
Alaska Air Group 0.82American Airlines Group 0.06Avis Budget Group 2.06CH Robinson Worldwide 2.59CSX -5.78Delta Air 0.02Expeditors Intl of Wash 0.58FedEx 1.52JB Hunt Transport -5.37JetBlue Airways 0.36Kansas City Southern 4.78Kirby Corp -3.29Landstar System 2.76Matson Inc. 2.55Norfolk Southern -8.73Ryder System 0.78Southwest Airlines 0.73Union Pacific -9.47United Airlines -1.75United Parcel Service B 0.09
AES -0.50American Elec Power 1.61American Water Works 1.19Atmos Energy -0.94Consolidated Edison -0.77Dominion Energy 0.21Duke Energy -1.82Edison Intl -2.57Exelon -0.82FirstEnergy -0.40NextEra Energy 2.17Public Service Enterprise -1.02Sempra Energy -0.71Southern 0.48Xcel Energy -0.20
Note: Theoretical highs and lows are shown.
NOTICE TO READERS:
Sign up for the Weekly Market LabNewsletter: barrons.com/newsletters
Please visit the new Market Lab homepage on barrons.com under Data.www.barrons.com/market-data/market-lab
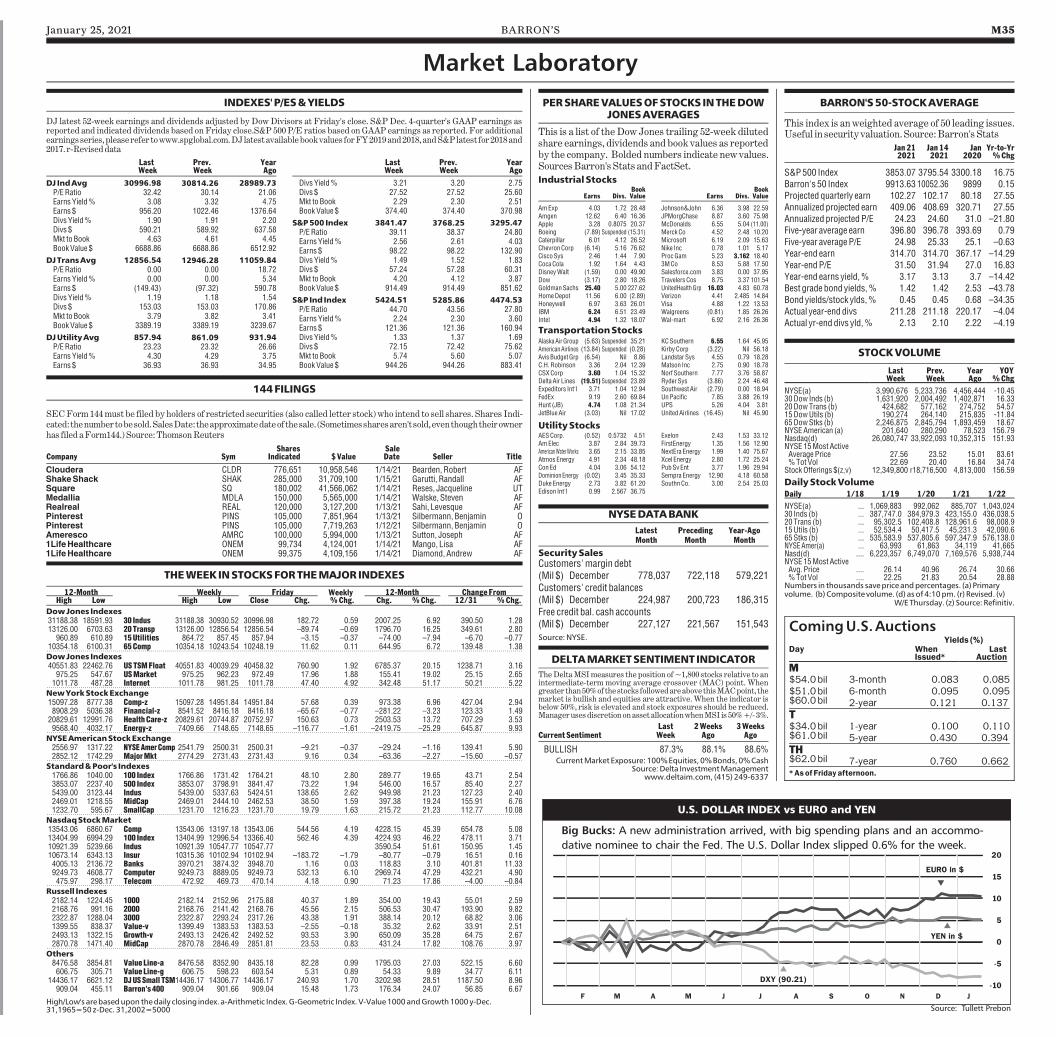
January 25, 2021 BARRON’S M35
Last Prev. YearWeek Week Ago
DJ IndAvg 30996.98 30814.26 28989.73P/ERatio 32.42 30.14 21.06EarnsYield% 3.08 3.32 4.75Earns $ 956.20 1022.46 1376.64Divs Yield% 1.90 1.91 2.20Divs $ 590.21 589.92 637.58Mkt to Book 4.63 4.61 4.45BookValue $ 6688.86 6688.86 6512.92
DJTransAvg 12856.54 12946.28 11059.84P/ERatio 0.00 0.00 18.72EarnsYield% 0.00 0.00 5.34Earns $ (149.43) (97.32) 590.78Divs Yield% 1.19 1.18 1.54Divs $ 153.03 153.03 170.86Mkt to Book 3.79 3.82 3.41BookValue $ 3389.19 3389.19 3239.67
DJUtilityAvg 857.94 861.09 931.94P/ERatio 23.23 23.32 26.66EarnsYield% 4.30 4.29 3.75Earns $ 36.93 36.93 34.95
INDEXES'P/ES&YIELDS
DJ latest 52-week earnings and dividends adjusted by Dow Divisors at Friday's close. S&P Dec. 4-quarter's GAAP earnings asreported and indicated dividends based on Friday close.S&P 500 P/E ratios based on GAAP earnings as reported. For additionalearnings series, please refer towww.spglobal.com.DJ latest availablebookvalues forFY2019and2018, andS&Platest for 2018and2017. r-Reviseddata
Market Laboratory
THEWEEK INSTOCKSFORTHEMAJOR INDEXES12-Month Weekly Friday Weekly 12-Month ChangeFrom
High Low High Low Close Chg. %Chg. Chg. %Chg. 12/31 %Chg.
DowJones Indexes31188.38 18591.93 30 Indus 31188.38 30930.52 30996.98 182.72 0.59 2007.25 6.92 390.50 1.2813126.00 6703.63 20Transp 13126.00 12856.54 12856.54 –89.74 –0.69 1796.70 16.25 349.61 2.80960.89 610.89 15Utilities 864.72 857.45 857.94 –3.15 –0.37 –74.00 –7.94 –6.70 –0.7710354.18 6100.31 65Comp 10354.18 10243.54 10248.19 11.62 0.11 644.95 6.72 139.48 1.38DowJones Indexes40551.83 22462.76 USTSMFloat 40551.83 40039.29 40458.32 760.90 1.92 6785.37 20.15 1238.71 3.16975.25 547.67 USMarket 975.25 962.23 972.49 17.96 1.88 155.41 19.02 25.15 2.651011.78 487.28 Internet 1011.78 981.25 1011.78 47.40 4.92 342.48 51.17 50.21 5.22NewYorkStockExchange15097.28 8777.38 Comp-z 15097.28 14951.84 14951.84 57.68 0.39 973.38 6.96 427.04 2.948908.29 5036.38 Financial-z 8541.52 8416.18 8416.18 –65.67 –0.77 –281.22 –3.23 123.33 1.4920829.61 12991.76 Health Care-z 20829.61 20744.87 20752.97 150.63 0.73 2503.53 13.72 707.29 3.539568.40 4032.17 Energy-z 7409.66 7148.65 7148.65 –116.77 –1.61 –2419.75 –25.29 645.87 9.93NYSEAmericanStockExchange2556.97 1317.22 NYSEAmerComp 2541.79 2500.31 2500.31 –9.21 –0.37 –29.24 –1.16 139.41 5.902852.12 1742.29 MajorMkt 2774.29 2731.43 2731.43 9.16 0.34 –63.36 –2.27 –15.60 –0.57Standard&Poor's Indexes1766.86 1040.00 100 Index 1766.86 1731.42 1764.21 48.10 2.80 289.77 19.65 43.71 2.543853.07 2237.40 500 Index 3853.07 3798.91 3841.47 73.22 1.94 546.00 16.57 85.40 2.275439.00 3123.44 Indus 5439.00 5337.63 5424.51 138.65 2.62 949.98 21.23 127.23 2.402469.01 1218.55 MidCap 2469.01 2444.10 2462.53 38.50 1.59 397.38 19.24 155.91 6.761232.70 595.67 SmallCap 1231.70 1216.23 1231.70 19.79 1.63 215.72 21.23 112.77 10.08NasdaqStockMarket13543.06 6860.67 Comp 13543.06 13197.18 13543.06 544.56 4.19 4228.15 45.39 654.78 5.0813404.99 6994.29 100 Index 13404.99 12996.54 13366.40 562.46 4.39 4224.93 46.22 478.11 3.7110921.39 5239.66 Indus 10921.39 10547.77 10547.77 3590.54 51.61 150.95 1.4510673.14 6343.13 Insur 10315.36 10102.94 10102.94 –183.72 –1.79 –80.77 –0.79 16.51 0.164005.13 2136.72 Banks 3970.21 3874.32 3948.70 1.16 0.03 118.83 3.10 401.81 11.339249.73 4608.77 Computer 9249.73 8889.05 9249.73 532.13 6.10 2969.74 47.29 432.21 4.90475.97 298.17 Telecom 472.92 469.73 470.14 4.18 0.90 71.23 17.86 –4.00 –0.84
Russell Indexes2182.14 1224.45 1000 2182.14 2152.96 2175.88 40.37 1.89 354.00 19.43 55.01 2.592168.76 991.16 2000 2168.76 2141.42 2168.76 45.56 2.15 506.53 30.47 193.90 9.822322.87 1288.04 3000 2322.87 2293.24 2317.26 43.38 1.91 388.14 20.12 68.82 3.061399.55 838.37 Value-v 1399.49 1383.53 1383.53 –2.55 –0.18 35.32 2.62 33.91 2.512493.13 1322.15 Growth-v 2493.13 2426.42 2492.52 93.53 3.90 650.09 35.28 64.75 2.672870.78 1471.40 MidCap 2870.78 2846.49 2851.81 23.53 0.83 431.24 17.82 108.76 3.97Others8476.58 3854.81 Value Line-a 8476.58 8352.90 8435.18 82.28 0.99 1795.03 27.03 522.15 6.60606.75 305.71 Value Line-g 606.75 598.23 603.54 5.31 0.89 54.33 9.89 34.77 6.1114436.17 6621.12 DJUSSmall TSM14436.17 14306.77 14436.17 240.93 1.70 3202.98 28.51 1187.50 8.96909.04 455.11 Barron's 400 909.04 901.66 909.04 15.48 1.73 176.34 24.07 56.85 6.67
High/Low's arebasedupon thedaily closing index. a-Arithmetic Index.G-Geometric Index.V-Value1000andGrowth1000y-Dec.31,1965=50z-Dec. 31,2002=5000
144FILINGS
SECForm 144must be filed by holders of restricted securities (also called letter stock) who intend to sell shares. Shares Indi-cated: thenumbertobesold.SalesDate: theapproximatedateof thesale. (Sometimessharesaren'tsold,eventhoughtheirownerhas filed aForm144.) Source:ThomsonReuters
Shares SaleCompany Sym Indicated $Value Date Seller Title
Cloudera CLDR 776,651 10,958,546 1/14/21 Bearden, Robert AFShakeShack SHAK 285,000 31,709,100 1/15/21 Garutti, Randall AFSquare SQ 180,002 41,566,062 1/14/21 Reses, Jacqueline UTMedallia MDLA 150,000 5,565,000 1/14/21 Walske, Steven AFRealreal REAL 120,000 3,127,200 1/13/21 Sahi, Levesque AFPinterest PINS 105,000 7,851,964 1/13/21 Silbermann, Benjamin OPinterest PINS 105,000 7,719,263 1/12/21 Silbermann, Benjamin OAmeresco AMRC 100,000 5,994,000 1/13/21 Sutton, Joseph AF1LifeHealthcare ONEM 99,734 4,124,001 1/14/21 Mango, Lisa AF1LifeHealthcare ONEM 99,375 4,109,156 1/14/21 Diamond, Andrew AF
STOCKVOLUME
Last Prev. Year YOYWeek Week Ago %Chg
NYSE(a) 3,990,676 5,233,736 4,456,444 -10.4530Dow Inds (b) 1,631,920 2,004,492 1,402,871 16.3320DowTrans (b) 424,682 577,162 274,752 54.5715DowUtils (b) 190,274 264,140 215,835 -11.8465DowStks (b) 2,246,875 2,845,794 1,893,459 18.67NYSEAmerican (a) 201,640 280,290 78,523 156.79Nasdaq(d) 26,080,747 33,922,093 10,352,315 151.93NYSE15Most ActiveAveragePrice 27.56 23.52 15.01 83.61%Tot Vol 22.69 20.40 16.84 34.74StockOfferings $(z,v) 12,349,800 r18,716,500 4,813,000 156.59
DailyStockVolumeDaily 1/18 1/19 1/20 1/21 1/22
NYSE(a) ... 1,069,883 992,062 885,707 1,043,02430 Inds (b) ... 387,747.0 384,979.3 423,155.0 436,038.520 Trans (b) ... 95,302.5 102,408.8 128,961.6 98,008.915Utils (b) ... 52,534.4 50,417.5 45,231.3 42,090.665Stks (b) ... 535,583.9 537,805.6 597,347.9 576,138.0NYSEAmer(a) ... 63,993 61,863 34,119 41,665Nasd(d) .... 6,223,357 6,749,070 7,169,576 5,938,744NYSE15Most ActiveAvg. Price .... 26.14 40.96 26.74 30.66%Tot Vol .... 22.25 21.83 20.54 28.88Numbers in thousands saveprice andpercentages. (a) Primaryvolume. (b)Composite volume. (d) asof4:10pm. (r) Revised. (v)
W/EThursday. (z) Source: Refinitiv.
Divs Yield% 3.21 3.20 2.75Divs $ 27.52 27.52 25.60Mkt to Book 2.29 2.30 2.51BookValue $ 374.40 374.40 370.98
S&P500 Index 3841.47 3768.25 3295.47P/ERatio 39.11 38.37 24.80EarnsYield% 2.56 2.61 4.03Earns $ 98.22 98.22 132.90Divs Yield% 1.49 1.52 1.83Divs $ 57.24 57.28 60.31Mkt to Book 4.20 4.12 3.87BookValue $ 914.49 914.49 851.62
S&P Ind Index 5424.51 5285.86 4474.53P/ERatio 44.70 43.56 27.80EarnsYield% 2.24 2.30 3.60Earns $ 121.36 121.36 160.94Divs Yield% 1.33 1.37 1.69Divs $ 72.15 72.42 75.62Mkt to Book 5.74 5.60 5.07BookValue $ 944.26 944.26 883.41
Last Prev. YearWeek Week Ago
U.S. DOLLAR INDEX vs EURO and YEN
-10
-5
0
5
10
15
20
F M A M J J A S O N D J
EURO in $
s
YEN in $s
DXY (90.21)s
Source: Tullett Prebon
Big Bucks: A new administration arrived, with big spending plans and an accommo-dative nominee to chair the Fed. The U.S. Dollar Index slipped 0.6% for the week.
BARRON'S50-STOCKAVERAGE
This index is anweighted average of 50 leading issues.Useful in security valuation. Source:Barron's Stats
Jan21 Jan14 Jan Yr-to-Yr2021 2021 2020 %Chg
S&P500 Index 3853.07 3795.54 3300.18 16.75Barron's 50 Index 9913.63 10052.36 9899 0.15Projected quarterly earn 102.27 102.17 80.18 27.55Annualized projected earn 409.06 408.69 320.71 27.55Annualized projectedP/E 24.23 24.60 31.0 –21.80Five-year average earn 396.80 396.78 393.69 0.79Five-year averageP/E 24.98 25.33 25.1 –0.63Year-end earn 314.70 314.70 367.17 –14.29Year-endP/E 31.50 31.94 27.0 16.83Year-end earns yield,% 3.17 3.13 3.7 –14.42Best grade bond yields,% 1.42 1.42 2.53 –43.78Bond yields/stock ylds,% 0.45 0.45 0.68 –34.35Actual year-end divs 211.28 211.18 220.17 –4.04Actual yr-end divs yld,% 2.13 2.10 2.22 –4.19
NYSEDATABANKLatest Preceding Year-AgoMonth Month Month
SecuritySalesCustomers'margin debt(Mil $) December 778,037 722,118 579,221Customers' credit balances(Mil $) December 224,987 200,723 186,315Free credit bal. cash accounts(Mil $) December 227,127 221,567 151,543Source:NYSE.
PERSHAREVALUESOFSTOCKS INTHEDOWJONESAVERAGES
This is a list of the Dow Jones trailing 52-week dilutedshare earnings, dividends and book values as reportedby the company. Bolded numbers indicate new values.SourcesBarron's Stats andFactSet.IndustrialStocks
BookEarns Divs. Value
AmExp 4.03 1.72 28.48Amgen 12.62 6.40 16.36Apple 3.28 0.8075 20.37Boeing (7.89) Suspended (15.31)Caterpillar 6.01 4.12 26.52ChevronCorp (6.14) 5.16 76.62CiscoSys 2.46 1.44 7.90CocaCola 1.92 1.64 4.43DisneyWalt (1.59) 0.00 49.90Dow (3.17) 2.80 18.26GoldmanSachs 25.40 5.00 227.62HomeDepot 11.56 6.00 (2.89)Honeywell 6.97 3.63 26.01IBM 6.24 6.51 23.49Intel 4.94 1.32 18.07
BookEarns Divs. Value
Johnson&John 6.36 3.98 22.59JPMorgChase 8.87 3.60 75.98McDonalds 6.55 5.04 (11.00)Merck Co 4.52 2.48 10.20Microsoft 6.19 2.09 15.63Nike Inc 0.78 1.01 5.17ProcGam 5.23 3.162 18.403MCo 8.53 5.88 17.50Salesforce.com 3.83 0.00 37.95Travelers Cos 8.75 3.37 101.54UnitedHealthGrp 16.03 4.83 60.78Verizon 4.41 2.485 14.84Visa 4.88 1.22 13.53Walgreens (0.81) 1.85 26.26Wal-mart 6.92 2.16 26.36
TransportationStocksAlaska Air Group (5.63) Suspended 35.21AmericanAirlines (13.84) Suspended (0.28)Avis Budget Grp (6.54) Nil 8.86C.H. Robinson 3.36 2.04 12.39CSXCorp 3.60 1.04 15.32Delta Air Lines (19.51) Suspended 23.89Expeditors Int'l 3.71 1.04 12.94FedEx 9.19 2.60 69.84Hunt (JB) 4.74 1.08 21.34JetBlue Air (3.03) Nil 17.02
KCSouthern 6.55 1.64 45.95Kirby Corp (3.22) Nil 56.18Landstar Sys 4.55 0.79 18.28Matson Inc 2.75 0.90 18.78Norf Southern 7.77 3.76 58.87Ryder Sys (3.86) 2.24 46.48Southwest Air (2.79) 0.00 18.94UnPacific 7.85 3.88 26.19UPS 5.26 4.04 3.81United Airlines (16.45) Nil 45.90
UtilityStocksAESCorp. (0.52) 0.5732 4.51AmElec 3.87 2.84 39.73AmericanWaterWorks 3.65 2.15 33.85Atmos Energy 4.91 2.34 48.18ConEd 4.04 3.06 54.12Dominion Energy (0.02) 3.45 35.33Duke Energy 2.73 3.82 61.20Edison Int'l 0.99 2.567 36.75
Exelon 2.43 1.53 33.12FirstEnergy 1.35 1.56 12.90NextEra Energy 1.99 1.40 75.67Xcel Energy 2.80 1.72 25.24PubSv Ent 3.77 1.96 29.94Sempra Energy 12.90 4.18 60.58SouthnCo. 3.00 2.54 25.03
ComingU.S.AuctionsYields (%)
Day When LastIssued* Auction
M$54.0bil 3-month 0.083 0.085$51.0bil 6-month 0.095 0.095$60.0bil 2-year 0.121 0.137T$34.0bil 1-year 0.100 0.110$61.0bil 5-year 0.430 0.394TH$62.0bil 7-year 0.760 0.662*AsofFridayafternoon.
DELTAMARKETSENTIMENT INDICATORTheDeltaMSImeasures the position of~1,800 stocks relative to anintermediate-term moving average crossover (MAC) point. Whengreater than50%of thestocks followedareabovethisMACpoint, themarket is bullish and equities are attractive. When the indicator isbelow 50%, risk is elevated and stock exposures should be reduced.Managerusesdiscretiononasset allocationwhenMSI is 50%+/- 3%.
Last 2Weeks 3WeeksCurrent Sentiment Week Ago Ago
BULLISH 87.3% 88.1% 88.6%CurrentMarket Exposure: 100%Equities, 0%Bonds, 0%Cash
Source:Delta InvestmentManagementwww.deltaim.com, (415)249-6337
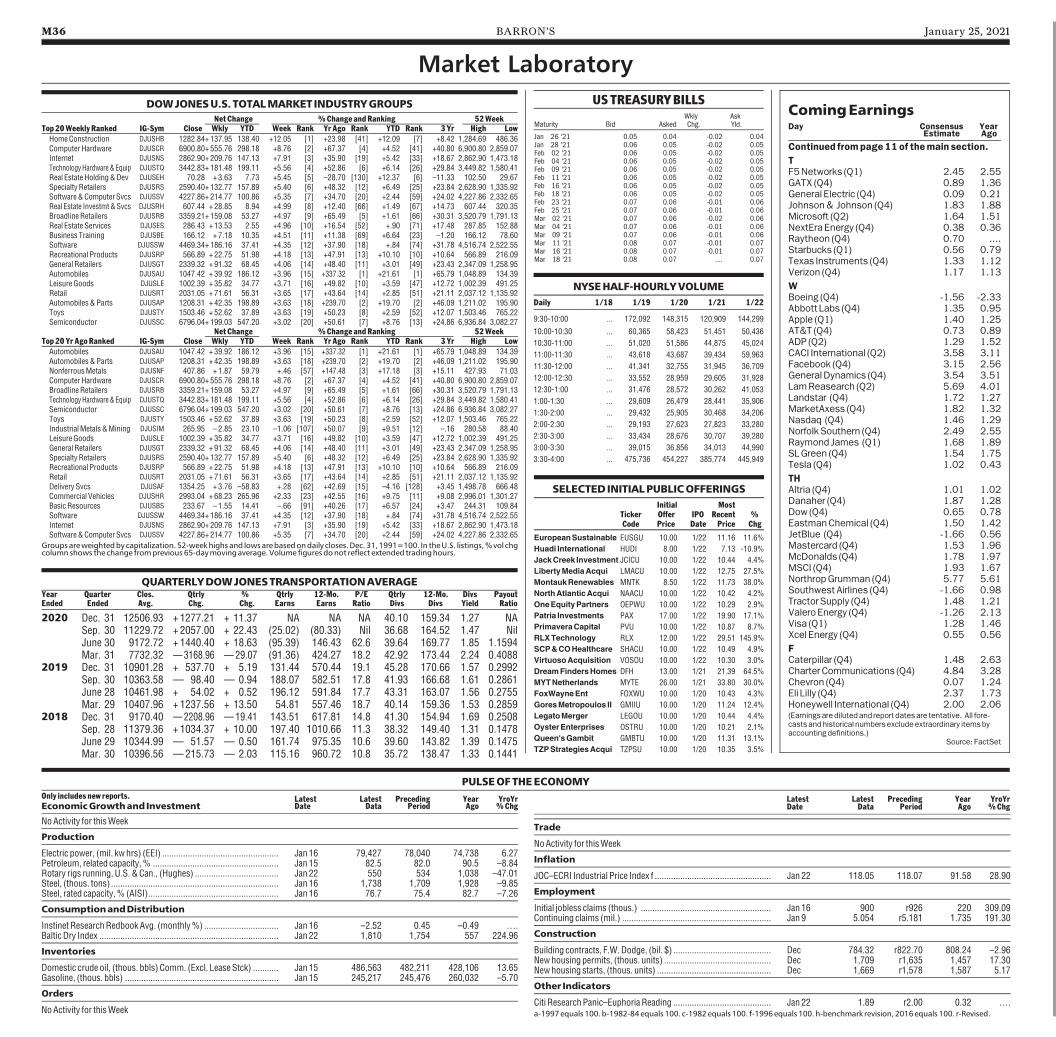
M36 BARRON’S January 25, 2021
SELECTEDINITIALPUBLICOFFERINGSInitial Most
Ticker Offer IPO Recent %Code Price Date Price Chg
EuropeanSustainable EUSGU 10.00 1/22 11.16 11.6%
Huadi International HUDI 8.00 1/22 7.13 -10.9%
JackCreek Investment JCICU 10.00 1/22 10.44 4.4%
LibertyMediaAcqui LMACU 10.00 1/22 12.75 27.5%
MontaukRenewables MNTK 8.50 1/22 11.73 38.0%
NorthAtlanticAcqui NAACU 10.00 1/22 10.42 4.2%
OneEquityPartners OEPWU 10.00 1/22 10.29 2.9%
Patria Investments PAX 17.00 1/22 19.90 17.1%
PrimaveraCapital PVU 10.00 1/22 10.87 8.7%
RLXTechnology RLX 12.00 1/22 29.51 145.9%
SCP&COHealthcare SHACU 10.00 1/22 10.49 4.9%
VirtuosoAcquisition VOSOU 10.00 1/22 10.30 3.0%
DreamFindersHomes DFH 13.00 1/21 21.39 64.5%
MYTNetherlands MYTE 26.00 1/21 33.80 30.0%
FoxWayneEnt FOXWU 10.00 1/20 10.43 4.3%
GoresMetropoulos II GMIIU 10.00 1/20 11.24 12.4%
LegatoMerger LEGOU 10.00 1/20 10.44 4.4%
OysterEnterprises OSTRU 10.00 1/20 10.21 2.1%
Queen'sGambit GMBTU 10.00 1/20 11.31 13.1%
TZPStrategiesAcqui TZPSU 10.00 1/20 10.35 3.5%
Latest Latest Preceding Year YroYrDate Data Period Ago %Chg
PULSEOFTHEECONOMYOnly includesnew reports. Latest Latest Preceding Year YroYrEconomicGrowthand Investment Date Data Period Ago %Chg
NoActivity for thisWeek
Production
Electric power, (mil. kwhrs) (EEI) .................................................. Jan 16 79,427 78,040 74,738 6.27Petroleum, related capacity,% ...................................................... Jan 15 82.5 82.0 90.5 –8.84Rotary rigs running, U.S.&Can., (Hughes) .................................... Jan 22 550 534 1,038 –47.01Steel, (thous. tons) ........................................................................ Jan 16 1,738 1,709 1,928 –9.85Steel, rated capacity,% (AISI)........................................................ Jan 16 76.7 75.4 82.7 –7.26
ConsumptionandDistribution
Instinet ResearchRedbookAvg. (monthly%) ................................ Jan 16 –2.52 0.45 –0.49 ….Baltic Dry Index ............................................................................. Jan 22 1,810 1,754 557 224.96
Inventories
Domestic crude oil, (thous. bbls) Comm. (Excl. Lease Stck) ........... Jan 15 486,563 482,211 428,106 13.65Gasoline, (thous. bbls) .................................................................. Jan 15 245,217 245,476 260,032 –5.70
Orders
NoActivity for thisWeek
Trade
NoActivity for thisWeek
Inflation
JOC–ECRI Industrial Price Index f .................................................. Jan 22 118.05 118.07 91.58 28.90
Employment
Initial jobless claims (thous.) ........................................................ Jan 16 900 r926 220 309.09Continuing claims (mil.) ................................................................ Jan 9 5.054 r5.181 1.735 191.30
Construction
Building contracts, F.W.Dodge, (bil. $) .......................................... Dec 784.32 r822.70 808.24 –2.96Newhousing permits, (thous. units) .............................................. Dec 1,709 r1,635 1,457 17.30Newhousing starts, (thous. units) ................................................. Dec 1,669 r1,578 1,587 5.17
Other Indicators
Citi ResearchPanic–Euphoria Reading .......................................... Jan 22 1.89 r2.00 0.32 ….a-1997equals 100.b-1982-84equals 100. c-1982equals 100. f-1996equals 100.h-benchmark revision, 2016equals 100. r-Revised.
Market LaboratoryDOWJONESU.S. TOTALMARKET INDUSTRYGROUPS
NetChange %ChangeandRanking 52WeekTop20WeeklyRanked IG-Sym Close Wkly YTD Week Rank YrAgo Rank YTD Rank 3Yr High LowHomeConstruction DJUSHB 1282.84+ 137.95 138.40 +12.05 [1] +23.98 [41] +12.09 [7] +8.42 1,284.69 486.36Computer Hardware DJUSCR 6900.80+ 555.76 298.18 +8.76 [2] +67.37 [4] +4.52 [41] +40.80 6,900.80 2,859.07Internet DJUSNS 2862.90+ 209.76 147.13 +7.91 [3] +35.90 [19] +5.42 [33] +18.67 2,862.90 1,473.18TechnologyHardware&Equip DJUSTQ 3442.83+ 181.48 199.11 +5.56 [4] +52.86 [6] +6.14 [26] +29.84 3,449.82 1,580.41Real EstateHolding&Dev DJUSEH 70.28 + 3.63 7.73 +5.45 [5] –28.70 [130] +12.37 [6] –11.33 102.50 29.67Specialty Retailers DJUSRS 2590.40+ 132.77 157.89 +5.40 [6] +48.32 [12] +6.49 [25] +23.84 2,628.90 1,335.92Software&Computer Svcs DJUSSV 4227.86+ 214.77 100.86 +5.35 [7] +34.70 [20] +2.44 [59] +24.02 4,227.86 2,332.65Real Estate Investmt&Svcs DJUSRH 607.44 + 28.85 8.94 +4.99 [8] +12.40 [66] +1.49 [67] +14.73 607.44 320.35BroadlineRetailers DJUSRB 3359.21+ 159.08 53.27 +4.97 [9] +65.49 [5] +1.61 [66] +30.31 3,520.79 1,791.13Real Estate Services DJUSES 286.43 + 13.53 2.55 +4.96 [10] +16.54 [52] +.90 [71] +17.48 287.85 152.88Business Training DJUSBE 166.12 + 7.18 10.35 +4.51 [11] +11.38 [69] +6.64 [23] –1.20 166.12 78.60Software DJUSSW 4469.34+ 186.16 37.41 +4.35 [12] +37.90 [18] +.84 [74] +31.78 4,516.74 2,522.55Recreational Products DJUSRP 566.89 + 22.75 51.98 +4.18 [13] +47.91 [13] +10.10 [10] +10.64 566.89 216.09General Retailers DJUSGT 2339.32 + 91.32 68.45 +4.06 [14] +48.40 [11] +3.01 [49] +23.43 2,347.09 1,258.95Automobiles DJUSAU 1047.42 + 39.92 186.12 +3.96 [15] +337.32 [1] +21.61 [1] +65.79 1,048.89 134.39LeisureGoods DJUSLE 1002.39 + 35.82 34.77 +3.71 [16] +49.82 [10] +3.59 [47] +12.72 1,002.39 491.25Retail DJUSRT 2031.05 + 71.61 56.31 +3.65 [17] +43.64 [14] +2.85 [51] +21.11 2,037.12 1,135.92Automobiles&Parts DJUSAP 1208.31 + 42.35 198.89 +3.63 [18] +239.70 [2] +19.70 [2] +46.09 1,211.02 195.90Toys DJUSTY 1503.46 + 52.62 37.89 +3.63 [19] +50.23 [8] +2.59 [52] +12.07 1,503.46 765.22Semiconductor DJUSSC 6796.04+ 199.03 547.20 +3.02 [20] +50.61 [7] +8.76 [13] +24.86 6,936.84 3,082.27
NetChange %ChangeandRanking 52WeekTop20YrAgoRanked IG-Sym Close Wkly YTD Week Rank YrAgo Rank YTD Rank 3Yr High LowAutomobiles DJUSAU 1047.42 + 39.92 186.12 +3.96 [15] +337.32 [1] +21.61 [1] +65.79 1,048.89 134.39Automobiles&Parts DJUSAP 1208.31 + 42.35 198.89 +3.63 [18] +239.70 [2] +19.70 [2] +46.09 1,211.02 195.90NonferrousMetals DJUSNF 407.86 + 1.87 59.79 +.46 [57] +147.48 [3] +17.18 [3] +15.11 427.93 71.03Computer Hardware DJUSCR 6900.80+ 555.76 298.18 +8.76 [2] +67.37 [4] +4.52 [41] +40.80 6,900.80 2,859.07BroadlineRetailers DJUSRB 3359.21+ 159.08 53.27 +4.97 [9] +65.49 [5] +1.61 [66] +30.31 3,520.79 1,791.13TechnologyHardware&Equip DJUSTQ 3442.83+ 181.48 199.11 +5.56 [4] +52.86 [6] +6.14 [26] +29.84 3,449.82 1,580.41Semiconductor DJUSSC 6796.04+ 199.03 547.20 +3.02 [20] +50.61 [7] +8.76 [13] +24.86 6,936.84 3,082.27Toys DJUSTY 1503.46 + 52.62 37.89 +3.63 [19] +50.23 [8] +2.59 [52] +12.07 1,503.46 765.22IndustrialMetals&Mining DJUSIM 265.95 – 2.85 23.10 –1.06 [107] +50.07 [9] +9.51 [12] –.16 280.58 88.40LeisureGoods DJUSLE 1002.39 + 35.82 34.77 +3.71 [16] +49.82 [10] +3.59 [47] +12.72 1,002.39 491.25General Retailers DJUSGT 2339.32 + 91.32 68.45 +4.06 [14] +48.40 [11] +3.01 [49] +23.43 2,347.09 1,258.95Specialty Retailers DJUSRS 2590.40+ 132.77 157.89 +5.40 [6] +48.32 [12] +6.49 [25] +23.84 2,628.90 1,335.92Recreational Products DJUSRP 566.89 + 22.75 51.98 +4.18 [13] +47.91 [13] +10.10 [10] +10.64 566.89 216.09Retail DJUSRT 2031.05 + 71.61 56.31 +3.65 [17] +43.64 [14] +2.85 [51] +21.11 2,037.12 1,135.92Delivery Svcs DJUSAF 1354.25 + 3.76 –58.83 +.28 [62] +42.69 [15] –4.16 [128] +3.45 1,498.78 666.48Commercial Vehicles DJUSHR 2993.04 + 68.23 265.96 +2.33 [23] +42.55 [16] +9.75 [11] +9.08 2,996.01 1,301.27BasicResources DJUSBS 233.67 – 1.55 14.41 –.66 [91] +40.26 [17] +6.57 [24] +3.47 244.31 109.84Software DJUSSW 4469.34+ 186.16 37.41 +4.35 [12] +37.90 [18] +.84 [74] +31.78 4,516.74 2,522.55Internet DJUSNS 2862.90+ 209.76 147.13 +7.91 [3] +35.90 [19] +5.42 [33] +18.67 2,862.90 1,473.18Software&Computer Svcs DJUSSV 4227.86+ 214.77 100.86 +5.35 [7] +34.70 [20] +2.44 [59] +24.02 4,227.86 2,332.65Groupsareweightedbycapitalization.52-weekhighsand lowsarebasedondaily closes.Dec. 31,1991=100. In theU.S. listings,%vol chgcolumnshows the change fromprevious65-daymovingaverage.Volume figuresdonot reflect extended tradinghours.
ComingEarningsDay Consensus Year
Estimate Ago
Continued frompage11of themainsection.TF5Networks (Q1) 2.45 2.55GATX (Q4) 0.89 1.36General Electric (Q4) 0.09 0.21Johnson& Johnson (Q4) 1.83 1.88Microsoft (Q2) 1.64 1.51NextEraEnergy (Q4) 0.38 0.36Raytheon (Q4) 0.70 ....Starbucks (Q1) 0.56 0.79Texas Instruments (Q4) 1.33 1.12Verizon (Q4) 1.17 1.13
WBoeing (Q4) -1.56 -2.33Abbott Labs (Q4) 1.35 0.95Apple (Q1) 1.40 1.25AT&T (Q4) 0.73 0.89ADP (Q2) 1.29 1.52CACI International (Q2) 3.58 3.11Facebook (Q4) 3.15 2.56GeneralDynamics (Q4) 3.54 3.51LamReasearch (Q2) 5.69 4.01Landstar (Q4) 1.72 1.27MarketAxess (Q4) 1.82 1.32Nasdaq (Q4) 1.46 1.29NorfolkSouthern (Q4) 2.49 2.55Raymond James (Q1) 1.68 1.89SLGreen (Q4) 1.54 1.75Tesla (Q4) 1.02 0.43
THAltria (Q4) 1.01 1.02Danaher (Q4) 1.87 1.28Dow (Q4) 0.65 0.78EastmanChemical (Q4) 1.50 1.42JetBlue (Q4) -1.66 0.56Mastercard (Q4) 1.53 1.96McDonalds (Q4) 1.78 1.97MSCI (Q4) 1.93 1.67NorthropGrumman (Q4) 5.77 5.61SouthwestAirlines (Q4) -1.66 0.98TractorSupply (Q4) 1.48 1.21ValeroEnergy (Q4) -1.26 2.13Visa (Q1) 1.28 1.46Xcel Energy (Q4) 0.55 0.56
FCaterpillar (Q4) 1.48 2.63CharterCommunications (Q4) 4.84 3.28Chevron (Q4) 0.07 1.24Eli Lilly (Q4) 2.37 1.73Honeywell International (Q4) 2.00 2.06(Earningsaredilutedand report datesare tentative. All fore-casts andhistorical numbersexcludeextraordinary itemsbyaccountingdefinitions.)
Source: FactSet
USTREASURYBILLSWkly Ask
Maturity Bid Asked Chg. Yld.
Jan 26 '21 0.05 0.04 -0.02 0.04Jan 28 '21 0.06 0.05 -0.02 0.05Feb 02 '21 0.06 0.05 -0.02 0.05Feb 04 '21 0.06 0.05 -0.02 0.05Feb 09 '21 0.06 0.05 -0.02 0.05Feb 11 '21 0.06 0.05 -0.02 0.05Feb 16 '21 0.06 0.05 -0.02 0.05Feb 18 '21 0.06 0.05 -0.02 0.05Feb 23 '21 0.07 0.06 -0.01 0.06Feb 25 '21 0.07 0.06 -0.01 0.06Mar 02 '21 0.07 0.06 -0.02 0.06Mar 04 '21 0.07 0.06 -0.01 0.06Mar 09 '21 0.07 0.06 -0.01 0.06Mar 11 '21 0.08 0.07 -0.01 0.07Mar 16 '21 0.08 0.07 -0.01 0.07Mar 18 '21 0.08 0.07 .... 0.07
NYSEHALF-HOURLYVOLUMEDaily 1/18 1/19 1/20 1/21 1/22
9:30-10:00 ... 172,092 148,315 120,909 144,299
10:00-10:30 ... 60,365 58,423 51,451 50,436
10:30-11:00 ... 51,020 51,586 44,875 45,024
11:00-11:30 ... 43,618 43,687 39,434 59,963
11:30-12:00 ... 41,341 32,755 31,945 36,709
12:00-12:30 ... 33,552 28,959 29,605 31,928
12:30-1:00 ... 31,476 28,572 30,262 41,053
1:00-1:30 ... 29,609 26,479 28,441 35,906
1:30-2:00 ... 29,432 25,905 30,468 34,206
2:00-2:30 ... 29,193 27,623 27,823 33,280
2:30-3:00 ... 33,434 28,676 30,707 39,280
3:00-3:30 ... 39,015 36,856 34,013 44,990
3:30-4:00 ... 475,736 454,227 385,774 445,949
QUARTERLYDOWJONESTRANSPORTATIONAVERAGEYear Quarter Clos. Qtrly % Qtrly 12-Mo. P/E Qtrly 12-Mo. Divs PayoutEnded Ended Avg. Chg. Chg. Earns Earns Ratio Divs Divs Yield Ratio
2020 Dec. 31 12506.93 + 1277.21 + 11.37 NA NA NA 40.10 159.34 1.27 NASep. 30 11229.72 + 2057.00 + 22.43 (25.02) (80.33) Nil 36.68 164.52 1.47 NilJune 30 9172.72 + 1440.40 + 18.63 (95.39) 146.43 62.6 39.64 169.77 1.85 1.1594Mar. 31 7732.32 —3168.96 —29.07 (91.36) 424.27 18.2 42.92 173.44 2.24 0.4088
2019 Dec. 31 10901.28 + 537.70 + 5.19 131.44 570.44 19.1 45.28 170.66 1.57 0.2992Sep. 30 10363.58 — 98.40 — 0.94 188.07 582.51 17.8 41.93 166.68 1.61 0.2861June 28 10461.98 + 54.02 + 0.52 196.12 591.84 17.7 43.31 163.07 1.56 0.2755Mar. 29 10407.96 + 1237.56 + 13.50 54.81 557.46 18.7 40.14 159.36 1.53 0.2859
2018 Dec. 31 9170.40 —2208.96 —19.41 143.51 617.81 14.8 41.30 154.94 1.69 0.2508Sep. 28 11379.36 + 1034.37 + 10.00 197.40 1010.66 11.3 38.32 149.40 1.31 0.1478June 29 10344.99 — 51.57 — 0.50 161.74 975.35 10.6 39.60 143.82 1.39 0.1475Mar. 30 10396.56 —215.73 — 2.03 115.16 960.72 10.8 35.72 138.47 1.33 0.1441
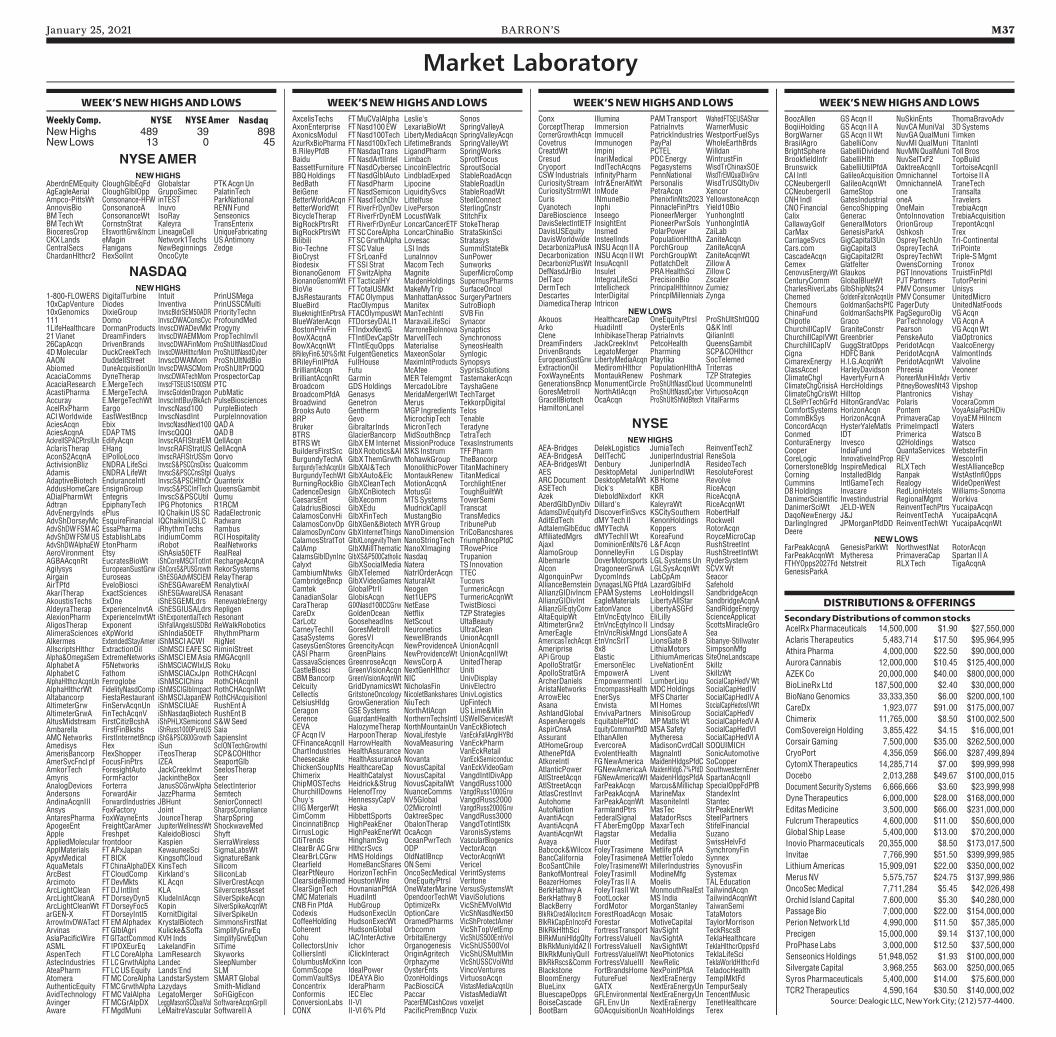
January 25, 2021 BARRON’S M37
Market LaboratoryWEEK’SNEWHIGHSANDLOWS WEEK’SNEWHIGHSANDLOWS WEEK’SNEWHIGHSANDLOWS WEEK’SNEWHIGHSANDLOWS
NewHighs 489 39 898NewLows 13 0 45
WeeklyComp. NYSE NYSEAmer Nasdaq
NYSEAMERNEWHIGHS
AberdnEMEquity CloughGlbEqFd Globalstar PTKAcqnUnAgEagleAerial CloughGlblOpp GrupoSimec PalatinTechAmpco-PittsWt Consonance-HFW inTEST ParkNationalAnnovisBio ConsonanceA Inuvo RENNFundBMTech ConsonanceWt IsoRay SenseonicsBMTechWt CornstnStrat Kaleyra TransEnterixBioceresCrop EllsworthGrw&Incm LineageCell UniqueFabricatingCKXLands eMagin Network1Techs USAntimonyCentralSecs Flanigans NewBeginnings ZedgeChardanHlthcr2 FlexSolInt OncoCyte
NASDAQNEWHIGHS
1-800-FLOWERS DigitalTurbine Intuit PrinUSMega10xCapVenture Diodes Inventiva PrinUSSCMulti10xGenomics DixieGroup InvscBldrSEM50ADR PriorityTechn111 Domo InvscDWAConsCyc ProfoundMed1LifeHealthcare DormanProducts InvscDWADevMkt Progyny21Vianet DreamFinders InvscDWAEMMom PropTechInvII26CapAcqn DrivenBrands InvscDWAFinMom ProShUltNasdCloud4DMolecular DuckCreekTech InvscDWAHlthcrMom ProShUltNasdCyberAAON DuddellStreet InvscDWAMom ProShUltNdBioAbiomed DuneAcquisitionUn InvscDWASCMom ProShUltPrQQQAcaciaComms DyneTherap InvscDWATechMom ProspectorCapAcaciaResearch E.MergeTech InvscFTSEUS1500SM PTCAcastiPharma E.MergeTechA InvscGoldenDragon PubMaticAccuray E.MergeTechWt InvscIntlBuyBkAch PulseBiosciencesAcelRxPharm Eargo InvscNasd100 PurpleBiotechACIWorldwide EastWestBncp InvscNasdInt PurpleInnovationAciesAcqn Ebix InvscNasdNext100 QADAAciesAcqnA EDAPTMS InvscQQQI QADBAckrellSPACPtrsIUn EdifyAcqn InvscRAFIStratEM QellAcqnAclarisTherap EHang InvscRAFIStratUS QellAcqnAAconS2AcqnA ElPolloLoco InvscRAFIStrUSSm QorvoActivisionBliz ENDRALifeSci InvscS&PSCCnsDisc QualcommAdamis ENDRALifeWt InvscS&PSCCnsStpl QualysAdaptiveBiotech EnduranceIntl InvscS&PSCHlthCr QuanterixAddusHomeCare EnsignGroup InvscS&PSCInfTech QueensGambitADialPharmWt Entegris InvscS&PSCUtil QumuAdtran EpiphanyTech IPGPhotonics R1RCMAdvEnergyInds ePlus IQChaikinUSSC RadaElectronicAdvShDorseyMc EsquireFinancial IQChaikinUSLC RadwareAdvShDWFSMAC EssaPharma iRhythmTechs RambusAdvShDWFSMUS EstablishLabs IridiumComm RCIHospitalityAdvShDWAlphaEW EtonPharm iRobot RealNetworksAeroVironment Etsy iShAsia50ETF RealRealAGBAAcqnRt EucratesBioWt iShCoreMSCITotInt RechargeAcqnAAgilysys EuropeanSustGrw iShCoreS&PUSGrowth RekorSystemsAirgain Euroseas iShESGAdvMSCIEM RelayTherapAirTPfd EveloBiosci iShESGAwareEM RenalytixAIAkariTherap ExactSciences iShESGAwareUSA RenasantAkoustisTechs ExOne iShESGEMLdrs RenewableEnergyAldeyraTherap ExperienceInvtA iShESGIUSALdrs RepligenAlexionPharm ExperienceInvtWt iShExponentialTech ResonantAligosTherap Exponent iShFallAngelsUSDBd ReWalkRoboticsAlimeraSciences eXpWorld iShIndia50ETF RhythmPharmAlkermes ExtendedStayAmer iShMSCI ACWI RigNetAllscriptsHlthcr ExtractionOil iShMSCI EAFESC RiminiStreetAlpha&OmegaSem ExtremeNetworks iShMSCI EMAsia RMGAcqnIIAlphabet A F5Networks iShMSCIACWIxUS RokuAlphabet C Fathom iShMSCIACxJpn RothCHAcqnIAlphaHlthcrAcqnUn Ferroglobe iShMSCIChina RothCHAcqnIIAlphaHlthcrWt FidelityNasdComp iShMSCIGlbImpact RothCHAcqnIWtAltabancorp FiestaRestaurant iShMSCIJapanEW RothCHAcquisitionIAltimeterGrw FinServAcqnUn iShMSCIUAE RushEnt AAltimeterGrwA FinTechAcqnV iShNasdaqBiotech RushEnt BAltusMidstream FirstCitizBcshA iShPHLXSemicond S&WSeedAmbarella FirstFinBkshs iShRuss1000PureUS SaiaAMCNetworks FirstInternetBncp iShS&PSC600Growth SapiensIntAmedisys Flex iSun ScIONTechGrowthIAmerisBancorp FlexShopper iTeosTherap SCP&COHlthcrAmerSvcFncl pf FocusFinPtrs IZEA SeaportGlbAmkorTech ForesightAuto JackCreekInvt SeelosTherapAmyris FormFactor JackintheBox SeerAnalogDevices Forterra JanusSCGrwAlpha SelectInteriorAndersons ForwardAir JazzPharma SemtechAndinaAcqnIII ForwardIndustries JBHunt SeniorConnectIAnsys FoxFactory Joint SharpsComplianceAntaresPharma FoxWayneEnts JounceTherap SharpSpringApogeeEnt FreightCarAmer JupiterWellnessWt ShockwaveMedApple Freshpet KaleidoBiosci ShyftAppliedMolecular frontdoor Kaspien SierraWirelessApplMaterials FTAPxJapan KewauneeSci SigmaLabsWtApyxMedical FT BICK KingsoftCloud SignatureBankAquaMetals FTChinaAlphaDEX KinsTech SilicomArcBest FTCloudComp Kirkland's SiliconLabArcimoto FTDevMkts KLAcqn SilverCrestAcqnArcLightClean FTDJ IntlInt KLA SilvercrestAssetArcLightCleanA FTDorseyDyn5 KludeInIAcqn SilverSpikeAcqnArcLightCleanWt FTDorseyFoc5 Kopin SilverSpikeAcqnWtarGEN-X FTDorseyIntl5 KornitDigital SilverSpikeUnArrowInvDWATact FT EMAlphadex KrystalBiotech SimmonsFirstNatArvinas FTGlblAgri Kulicke&Soffa SimplifyGrwEqAsiaPacificWire FTGlTactCommod KVH Inds SimplifyGrwEqDwnASML FT IPOXEurEq LakelandFin SiTimeAspenTech FT LCCoreAlpha LamResearch SkyworksAstecIndustries FT LCGrwthAlpha Landec SleepNumberAteaPharm FTLCUSEquity Lands'End SLMAtomera FTMCCoreAlpha LandstarSystem SMARTGlobalAuthenticEquity FTMCGrwthAlpha Lazydays Smith-MidlandAvidTechnology FTMCValAlpha LegatoMerger SoFiGigEconAvinger FTMCGrAlpDX LeggMasonSCQualVal SoftwareAcqnGrpIIAware FTMgdMuni LeMaitreVascular SoftwareII A
AxcelisTechs FTMuCValAlpha Leslie's SonosAxonEnterprise FTNasd100 EW LexariaBioWt SpringValleyAAxonicsModul FTNasd100Tech LibertyMediaAcqn SpringValleyAcqnAzurRxBioPharma FTNasd100xTech LifetimeBrands SpringValleyWtB.RileyPfdB FTNasdaqTrans LigandPharm SpringWorksBaidu FTNasdArtlIntel Limbach SprottFocusBassettFurniture FTNasdCybersec LincolnElectric SproutSocialBBQHoldings FTNasdGlblAuto LindbladExped StableRoadAcqnBedBath FTNasdPharm Lipocine StableRoadUnBeiGene FTNasdSemicon LiquiditySvcs StableRoadWtBetterWorldAcqn FTNasdTechDiv Littelfuse SteelConnectBetterWorldWt FTRiverFrDynDev LivePerson SterlingCnstrBicycleTherap FTRiverFrDynEM LocustWalk StitchFixBigRockPtrsRt FTRiverFrDynEur LoncarCancerETF StokeTherapBigRockPtrsWt FTSCCoreAlpha LoncarChinaBio StrataSkinSciBilibili FT SCGrwthAlpha Lovesac StratasysBio-Techne FTSCValue LSI Inds SummitStateBkBioCryst FTSrLoanFd LunaInnov SunPowerBiodesix FTSSI Strat MacomTech SunworksBionanoGenom FTSwitzAlpha Magnite SuperMicroCompBionanoGenomWt FT TacticalHY MaidenHoldings SupernusPharmsBioVie FT TotalUSMkt MakeMyTrip SurfaceOncolBJsRestaurants FTACOlympus ManhattanAssoc SurgeryPartnersBlueBird FtacOlympus Manitex SutroBiophBlueknightEnPtrsA FTACOlympusWt ManTechIntl SVB FinBlueWaterAcqn FTDorseyDALI1 MaravaiLifeSci SynacorBostonPrivFin FTIndxxNextG MarroneBioInnova SynapticsBowXAcqnA FTIntlDevCapStr MarvellTech SynchronossBowXAcqnWt FTIntlEquOpps Materialise SyneosHealthBRileyFin6.50%SrNt FulgentGenetics MaxeonSolar SynlogicBRileyFinlPfdA FullHouse MaximIntProducts SynopsysBrilliantAcqn Futu McAfee SyprisSolutionsBrilliantAcqnRt Garmin MERTelemgmt TastemakerAcqnBroadcom GDSHoldings MercadoLibre TayshaGeneBroadcomPfdA Genasys MeridaMergerIWt TechTargetBroadwind Genetron Merus TekkorpDigitalBrooksAuto Gentherm MGP Ingredients TelosBRP Gevo MicrochipTech TenableBruker GibraltarInds MicronTech TeradyneBTRS GlacierBancorp MidSouthBncp TetraTechBTRSWt GlbX EM Internet MissionProduce TexasInstrumentsBuildersFirstSrc GlbXRobotics&AI MKS Instrum TFFPharmBurgundyTechA GlbXThemGrwth MohawkGroup TheBancorpBurgundyTechAcqnUn GlbXAI&Tech MonolithicPower TitanMachineryBurgundyTechWt GlbXAuto&Elc MontaukRenew TitanMedicalBurningRockBio GlbXCleanTech MotionAcqnA TorchlightEnerCadenceDesign GlbXCnBiotech MotusGI ToughBuiltWtCaesarsEnt GlbXecomm MTSSystems TowerSemiCaladriusBiosci GlbXEdu MudrickCapII TranscatCalamosConvHi GlbXFinTech MustangBio TransMedicsCalamosConvOp GlbXGen&Biotech MYRGroup TribunePubCalamosDynConv GlbXInternetThings NanoDimension TriCoBancsharesCalamosStratTot GlbXLongevityThem NanoStringTech TriumphBncpPfdCCalAmp GlbXMillThematic NanoXImaging TRowePriceCalamsGlblDynInc GlbXS&P500Catholic Nasdaq TrupanionCalyxt GlbXSocialMedia Natera TS InnovationCambiumNtwks GlbXTelemed NatrlOrderAcqn TTECCambridgeBncp GlbXVideoGames NaturalAlt TucowsCamtek GlobalPtrII Neogen TurmericAcqnCanadianSolar GlobisAcqn Net1UEPS TurmericAcqnWtCaraTherap GlXNasd100CCGrw NetEase TwistBiosciCareDx GoldenOcean Netflix TZPStrategiesCarLotz GooseheadIns NetScout UltaBeautyCarneyTechII GoresMetroII Neuronetics UltraCleanCasaSystems GoresVI NewellBrands UnionAcqnIICaseysGenStores GreencityAcqn NewProvidenceA UnionAcqnIICASI Pharm GreenPlains NewProvidenceWt UnionAcqnIIWtCassavaSciences GreenroseAcqn NewsCorpA UnitedTherapCastleBiosci GreenVisionAcqn NextGenHlthcr UnitiCBMBancorp GreenVisionAcqnWt NIC UnivDisplayCelcuity GridDynamicsWt NicholasFin UnivElectroCellectis GritstoneOncology NicoletBankshares UnivLogisticsCelsiusHldg GrowGeneration NiuTech UpFintechCeragon GSESystems NorthAtlAcqn USLime&MinCerence GuardantHealth NorthernTechsIntl USWellServicesWtCEVA HalozymeTherap NorthMountainUn VanEckBiotechCFAcqn IV HarpoonTherap NovaLifestyle VanEckFallAnglHYBdCFFinanceAcqnII HarrowHealth NovaMeasuring VanEckPharmChartIndustries HealthAssurance Novan VanEckRetailCheesecake HealthAssuranceA Novanta VanEckSemiconducChickenSoupNts HealthcareCap NovusCapital VanEckVideoGamChimerix HealthCatalyst NovusCapital VangdIntlDivAppChipMOSTechs Heidrick&Strug NovusCapitalWt VangdRuss1000ChurchillDowns HelenofTroy NuanceComms VangdRuss1000GrwChuy's HennessyCapV NV5Global VangdRuss2000CIIGMergerWt Heska O2MicroIntl VangdRuss2000GrwCimComm HibbettSports OaktreeSpec VangdRuss3000CincinnatiBncp HighPeakEner ObalonTherap VangdTotIntlStkCirrusLogic HighPeakEnerWt OcaAcqn VaronisSystemsCitiTrends HinghamSvg OceanPwrTech VascularBiogenicsClearBr ACGrw HlthcrSvcs ODP VectorAcqnClearBrLCGrw HMSHoldings OldNatlBncp VectorAcqnWtClearfield HomeBancShares ONSemi VericelClearPtNeuro HorizonTechFin OncoSecMedical VerintSystemsClearsideBiomed HoustonWire OneEquityPtrsI VeritoneClearSignTech HovnanianPfdA OneWaterMarine VersusSystemsWtCMCMaterials HuadiIntl OpendoorTechWt ViaviSolutionsCNB Fin PfdA HubGroup OptimizeRx VicShEMVolWtdCodexis HudsonExecUn OptionCare VicShNasdNext50CoffeeHolding HudsonExecWt OramedPharms VicShProtectAmerCoherent HudsonGlobal Orbcomm VicShTopVetEmpCohu IAC/InterActive OrbitalEnergy VicShUS500EnhVolCollectorsUniv Ichor Organogenesis VicShUS500VolColliersIntl iClickInteract OriginAgritech VicShUSMultMinColumbusMcKinn Icon Orphazyme VicShUSSCVolWtdCommScope IdealPower OysterEnts VincoVenturesCommVaultSys IDEAYABio OzonHoldings VirtuosoAcqnConcentrix IderaPharm PacBiosciCA VistasMediaAcqnUnConformis IEC Elec Paccar VistasMediaWtConversionLabs II-VI PacerEMCashCows voxeljetCONX II-VI 6%Pfd PacificPremBncp Vuzix
Conx Illumina PAMTransport WahedFTSEUSASharCorceptTherap Immersion PatriaInvts WarnerMusicCornerGrowthAcqn Immucell PatrickIndustries WestportFuelSysCovetrus Immunogen PayPal WholeEarthBrdsCreatdWt Impinj PCTEL WilldanCresud InariMedical PDCEnergy WintrustFinCryoport IndlTechAcqns Pegasystems WisdTrChinaxSOECSW Industrials InfinityPharm PennNational WisdTrEMQualDivGrwCuriosityStream Infr&EnerAltWt Personalis WisdTrUSQltyDivCuriosityStrmWt InMode PetraAcqn XencorCuris INmuneBio PhenixfinNts2023 YellowstoneAcqnCyanotech Inphi PinnacleFinPtrs Yield10BioDareBioscience Inseego PioneerMerger YunhongIntlDavisSelectIntlETF InsightEnt PioneerPwrSols YunhongIntlADavisUSEquity Insmed PolarPower ZaiLabDavisWorldwide InsteelInds PopulationHlthA ZaniteAcqnDecarbonizaPlusA INSUAcqn II A PorchGroup ZaniteAcqnADecarbonization INSUAcqn IIWt PorchGroupWt ZaniteAcqnWtDecarbonizPlusWt InsuAcqnII PotlatchDelt ZillowADefNasdJrBio Insulet PRAHealthSci ZillowCDelTaco IntegraLifeSci PrecisionBio ZscalerDermTech Intellicheck PrincipalHlthInnov ZumiezDescartes InterDigital PrincplMillennials ZyngaDiamedicaTherap Intricon
NEWLOWSAkouos HealthcareCap OneEquityPtrsI ProShUltShtQQQArko HuadiIntl OysterEnts Q&K IntlClene InhibikaseTherap PatriaInvts QilianIntlDreamFinders JackCreekInvt PetcoHealth QueensGambitDrivenBrands LegatoMerger Pharming SCP&COHlthcrEuropeanSustGrw LibertyMediaAcqn Playtika SocTelemedExtractionOil MediromHlthcr PopulationHlthA TriterrasFoxWayneEnts MontaukRenew Poshmark TZPStrategiesGenerationsBncp MonumentCircle ProShUltNasdCloud UcommuneIntlGoresMetroII NorthAtlAcqn ProShUltNasdCyber VirtuosoAcqnGracellBiotech OcaAcqn ProShUltShNdBtech VitalFarmsHamiltonLaneI
NYSENEWHIGHS
AEA-Bridges DelekLogistics JumiaTech ReinventTechZAEA-BridgesA DellTechC JuniperIndustrial ReneSolaAEA-BridgesWt Denbury JuniperIndlA ResideoTechAES DesktopMetal JuniperIndlWt ResoluteForestARCDocument DesktopMetalWt KBHome RevolveASETech Dick's KBR RiceAcqnAzek DieboldNixdorf KKR RiceAcqnAAberdGlbDynDiv Dillard's KaleyraWt RiceAcqnWtAdamsDivEquityFd DiscoverFinSvcs KSCitySouthern RobertHalfAditEdTech dMYTech II KenonHoldings RockwellAdtalemGlbEduc dMYTechA Koppers RotorAcqnAffiliatedMgrs dMYTechIIWt KoreaFund RoyceMicroCapAjaxI DominionEnNts76 L&FAcqn RushStreetIntAlamoGroup DonnelleyFin LGDisplay RushStreetIntWtAlbemarle DoverMotorsports LGLSystemsUn RyderSystemAlcon DragoneerGrwA LGLSysAcqnWt SCVXWtAlgonquinPwr DycomInds LabCpAm SeacorAllianceBernstein DynagasLNGPfdA LazardGlblFd SafeholdAllianzGIDivIncm EPAMSystems LeoHoldingsII SandbridgeAcqnAllianzGIDivInt EagleMaterials LibertyAllStar SandbridgeAcqnAAllianzGIEqtyConv EatonVance LibertyASGFd SandRidgeEnergyAltaEquipWt EtnVncEqtyInco EliLilly ScienceApplicatAltimeterGrw2 EtnVncEqtyInco II Lindsay ScottsMiracleGroAmerEagle EtnVncRiskMngd LionsGate A SeaAmericasTechAcqn EtnVncSrIT LionsGate B Sibanye-StillwaterAmeriprise 8x8 LithiaMotors SimpsonMfgAPi Group Elastic LithiumAmericas SiteOneLandscapeApolloStratGr EmersonElec LiveNationEnt SkillzApolloStratGrA EmpowerA Livent SkillzWtArcherDaniels EmpowermentI LumberLiqu SocialCapHedVWtAristaNetworks EncompassHealth MDCHoldings SocialCapHedIVArrowElec EnerSys MFSCharter SocialCapHedIVAAsana Envista MIHomes SocialCapHedosIVWtAshlandGlobal EnvivaPartners MinisoGroup SocialCapHedVAspenAerogels EquitablePfdC MPMatlsWt SocialCapHedVAAspirCnsA EquityCommonPfdD MSASafety SocialCapHedVIAssurant EthanAllen Mytheresa SocialCapHedVI AAtHomeGroup EvercoreA MadisonCvrdCall SOQUIMICHAthenePfdA EvolentHealth MagnaIntl SonicAutomotiveAtkoreIntl FGNewAmerica MaidenHldgsPfdC SoCopperAtlanticPower FGNewAmericaA MaidenHldg6.7%PfdD SouthwesternEnerAtlStreetAcqn FGNewAmericaWt MaidenHldgsPfdA SpartanAcqnIIAtlStreetAcqn FarPeakAcqn Marcus&Millichap SpecialOppFdPfBAtlasCrestInvt FarPeakAcqnA MarineMax StandexIntAutohome FarPeakAcqnWt MasoniteIntl StantecAutoNation FarmlandPtrs MasTec StrPeakEnerWtAvantiAcqn FederalSignal MatadorRscs SteelPartnersAvantiAcqnA FTAberEmgOpp MaxarTech StifelFinancialAvantiAcqnWt Flagstar Medallia SuzanoAvaya Fluor Medifast SwissHelvFdBabcock&Wilcox FoleyTrasimene Metlife pfA SynchronyFinBancCalifornia FoleyTrasimeneA MettlerToledo SynnexBcoSantChile FoleyTrasimeneWt MillerIndustries SynovusFinBankofMontreal FoleyTrasimII ModineMfg SystemaxBeazerHomes FoleyTras II A Moelis TAL EducationBerkHathwyA FoleyTrasIIWt MonmouthRealEst TailwindAcqnBerkHathwyB FootLocker MS India TailwindAcqnWtBlackBerry FordMotor MorganStanley TaiwanSemiBlkRkCredAllocIncm ForestRoadAcqn Mosaic TataMotorsBlkRkCapEnIncoFd Forestar MotiveCapital TaylorMorrisonBlkRkHlthSci FortressTransport NavSight TeckRscsBBlRkMuniHldgQlty FortressValueII NavSightA TeklaHealthcareBlkRkMuniyldAZ II FortressValueII NavSightWt TeklaHlthcrOppsFdBlkRkMuniyQuII FortressValueIIWt NeoPhotonics TeklaLifeSciBlkRkRscs&Comm FortressValueIII NewRelic TeklaWorldHlthcrFdBlackstone FortBrandsHome NexPointPfdA TeladocHealthBloomEnergy FutureFuel NextEraEnergy TemplMktFdBlueLinx GATX NextEraEnergyUn TempurSealyBluescapeOpps GFLEnvironmental NextEraEnergyUn TencentMusicBoiseCascade GFL EnvUn NextEraEnergy TenetHealthcareBootBarn GOAcquisitionUn NoahHoldings Terex
BoozAllen GSAcqn II NuSkinEnts ThomaBravoAdvBoqiiHolding GSAcqn II A NuvCAMuniVal 3DSystemsBorgWarner GSAcqn IIWt NuvGAQualMuni TimkenBrasilAgro GabelliConv NuvMIQualMuni TItanIntlBrightSphere GabelliDividend NuvMNQualMuni Toll BrosBrookfieldInfr GabelliHlth NuvSelTxF2 TopBuildBrunswick GabelliUtilPfdA OaktreeAcqnII TortoiseAcqnIICAI Intl GalileoAcquisition Omnichannel Tortoise II ACCNeubergerII GalileoAcqnWt OmnichannelA TraneTechCCNeubergerII GameStop one TransaltaCNH Indl GatesIndustrial oneA TravelersCNOFinancial GencoShipping OneMain TrebiaAcqnCalix Generac OntoInnovation TrebiaAcquisitionCallawayGolf GeneralMotors OrionGroup TrepontAcqnICarMax GenesisParkA Oshkosh TrexCarriageSvcs GigCapital3Un OspreyTechUn Tri-ContinentalCars.com GigCapital3 OspreyTechA TriPointeCascadeAcqn GigCapital2Rt OspreyTechWt Triple-SMgmtCemex Glatfelter OwensCorning TronoxCenovusEnergyWt Glaukos PGT Innovations TruistFinPfdICenturyComm GlobalBlueWt PJTPartners TutorPeriniCharlesRiverLabs GlbShipNts24 PMVConsumer UnisysChemed GoldenFalconAcqnUn PMVConsumer UnitedMicroChemours GoldmanSachsPfC PagerDuty UnitedNatFoodsChinaFund GoldmanSachsPfK PagSeguroDig VGAcqnChipotle Graco ParTechnology VGAcqnAChurchillCapIV GraniteConstr Pearson VGAcqnWtChurchillCapIVWt Greenbrier PenskeAuto ViaOptronicsChurchillCapIV GuggStratOpps PeridotAcqn VaalcoEnergyCigna HDFCBank PeridotAcqnA ValmontIndsCimarexEnergy H.I.G.AcqnWt PeridotAcqnWt ValvolineClassAccel HarleyDavidson Phreesia VeoneerClimateChgI HavertyFurnA PioneerMuniHiInAdv VertivClimateChgCrisisA HercHoldings PitneyBowesNt43 VipshopClimateChgCrisWt Hilltop Plantronics VishayCLSelPrTechGrFd HiltonGrandVac Polaris VoceraCommComfortSystems HorizonAcqn Pontem VoyaAsiaPacHiDivCommBkSys HorizonAcqnA PrimaveraCap VoyaEMHiIncmConcordAcqn HysterYaleMatls PrimeImpactI WatersConmed IDT Primerica WatscoBConturaEnergy Invesco Q2Holdings WatscoCooper IndiaFund QuantaServices WebsterFinCoreLogic InnovativeIndProp REV WescoIntlCornerstoneBldg InspireMedical RLXTech WestAllianceBcpCorning InstalledBldg Ranpak WstAstInflOppsCummins IntlGameTech Realogy WideOpenWestD8Holdings Invacare RedLionHotels Williams-SonomaDanimerScientific Investindustrial RegionalMgmt WorkivaDanimerSciWt JELD-WEN ReinventTechPtrs YucaipaAcqnDaqoNewEnergy J&J ReinventTechA YucaipaAcqnADarlingIngred JPMorganPfdDD ReinventTechWt YucaipaAcqnWtDeere
NEWLOWSFarPeakAcqnA GenesisParkWt NorthwestNat RotorAcqnFarPeakAcqnWt Mytheresa PrimaveraCap Spartan II AFTHYOpps2027Fd Netstreit RLXTech TigaAcqnAGenesisParkA
DISTRIBUTIONS&OFFERINGSSecondaryDistributionsofcommonstocksAcelRxPharmaceuticals 14,500,000 $1.90 $27,550,000Aclaris Therapeutics 5,483,714 $17.50 $95,964,995Athira Pharma 4,000,000 $22.50 $90,000,000Aurora Cannabis 12,000,000 $10.45 $125,400,000AZEKCo 20,000,000 $40.00 $800,000,000BioLineRx Ltd 187,500,000 $2.40 $30,000,000BioNanoGenomics 33,333,350 $6.00 $200,000,100CareDx 1,923,077 $91.00 $175,000,007Chimerix 11,765,000 $8.50 $100,002,500ComSovereignHolding 3,855,422 $4.15 $16,000,001Corsair Gaming 7,500,000 $35.00 $262,500,000CryoPort 4,356,059 $66.00 $287,499,894CytomXTherapeutics 14,285,714 $7.00 $99,999,998Docebo 2,013,288 $49.67 $100,000,015Document Security Systems 6,666,666 $3.60 $23,999,998Dyne Therapeutics 6,000,000 $28.00 $168,000,000EditasMedicine 3,500,000 $66.00 $231,000,000FulcrumTherapeutics 4,600,000 $11.00 $50,600,000Global Ship Lease 5,400,000 $13.00 $70,200,000Inovio Pharmaceuticals 20,355,000 $8.50 $173,017,500Invitae 7,766,990 $51.50 $399,999,985LithiumAmericas 15,909,091 $22.00 $350,000,002MerusNV 5,575,757 $24.75 $137,999,986OncoSecMedical 7,711,284 $5.45 $42,026,498Orchid IslandCapital 7,600,000 $5.30 $40,280,000PassageBio 7,000,000 $22.00 $154,000,000PerionNetwork Ltd 4,990,000 $11.50 $57,385,000Precigen 15,000,000 $9.14 $137,100,000ProPhase Labs 3,000,000 $12.50 $37,500,000SenseonicsHoldings 51,948,052 $1.93 $100,000,000Silvergate Capital 3,968,255 $63.00 $250,000,065SyrosPharmaceuticals 5,400,000 $14.00 $75,600,000TCR2Therapeutics 4,590,164 $30.50 $140,000,002
Source:Dealogic LLC,NewYorkCity; (212)577-4400.
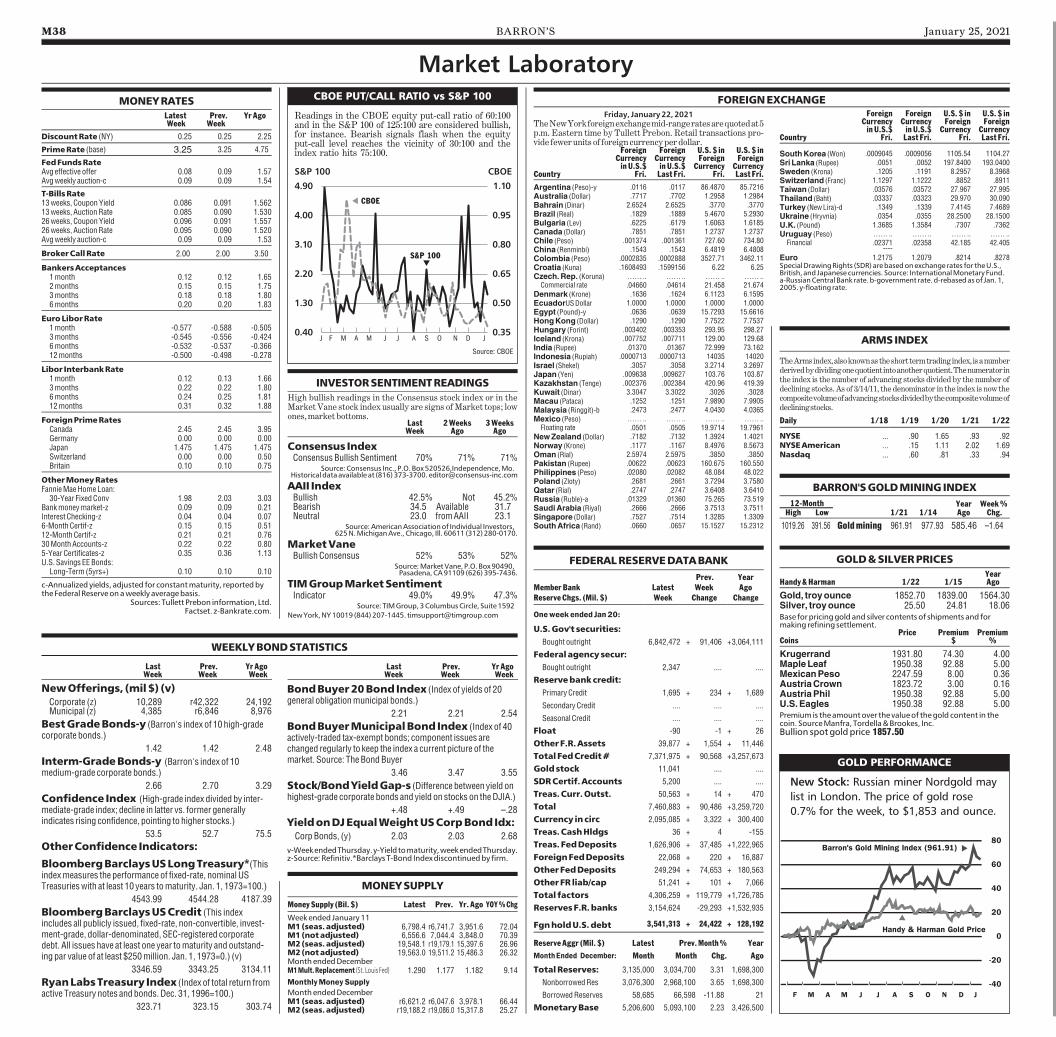
M38 BARRON’S January 25, 2021
FEDERALRESERVEDATABANKPrev. Year
MemberBank Latest Week AgoReserveChgs. (Mil. $) Week Change Change
Oneweekended Jan20:
U.S.Gov't securities:Bought outright 6,842,472 + 91,406 +3,064,111
Federalagencysecur:Bought outright 2,347 .... ....
Reservebankcredit:Primary Credit 1,695 + 234 + 1,689
Secondary Credit .... .... ....
Seasonal Credit .... .... ....
Float -90 -1 + 26
OtherF.R.Assets 39,877 + 1,554 + 11,446
TotalFedCredit# 7,371,975 + 90,568 +3,257,673
Goldstock 11,041 .... ....
SDRCertif.Accounts 5,200 .... ....
Treas.Curr.Outst. 50,563 + 14 + 470
Total 7,460,883 + 90,486 +3,259,720
Currency incirc 2,095,085 + 3,322 + 300,400
Treas.CashHldgs 36 + 4 -155
Treas. FedDeposits 1,626,906 + 37,485 +1,222,965
ForeignFedDeposits 22,068 + 220 + 16,887
OtherFedDeposits 249,294 + 74,653 + 180,563
OtherFR liab/cap 51,241 + 101 + 7,066
Total factors 4,306,259 + 119,779 +1,726,785
ReservesF.R.banks 3,154,624 -29,293 +1,532,935
FgnholdU.S.debt 3,541,313 + 24,422 + 128,192
ReserveAggr (Mil. $) Latest Prev.Month% YearMonthEnded December: Month Month Chg. Ago
TotalReserves: 3,135,000 3,034,700 3.31 1,698,300
NonborrowedRes 3,076,300 2,968,100 3.65 1,698,300
BorrowedReserves 58,685 66,598 -11.88 21
MonetaryBase 5,206,600 5,093,100 2.23 3,426,500
GOLD&SILVERPRICESYear
Handy&Harman 1/22 1/15 Ago
Gold, troyounce 1852.70 1839.00 1564.30Silver, troyounce 25.50 24.81 18.06Base forpricinggoldandsilver contentsof shipments and formaking refining settlement.
Price Premium PremiumCoins $ %
Krugerrand 1931.80 74.30 4.00MapleLeaf 1950.38 92.88 5.00MexicanPeso 2247.59 8.00 0.36AustriaCrown 1823.72 3.00 0.16AustriaPhil 1950.38 92.88 5.00U.S.Eagles 1950.38 92.88 5.00Premium is theamountover the valueof thegold content in thecoin. SourceManfra, Tordella&Brookes, Inc.Bullion spotgoldprice 1857.50
BARRON'SGOLDMININGINDEX12-Month Year Week%High Low 1/21 1/14 Ago Chg.
1019.26 391.56 Goldmining 961.91 977.93 585.46 –1.64
INVESTORSENTIMENTREADINGSHigh bullish readings in the Consensus stock index or in theMarket Vane stock index usually are signs ofMarket tops; lowones,market bottoms.
Last 2Weeks 3WeeksWeek Ago Ago
Consensus IndexConsensusBullish Sentiment 70% 71% 71%
Source:Consensus Inc., P.O. Box520526,Independence,Mo.Historical dataavailable at (816)373-3700. [email protected]
AAII IndexBullish 42.5% Not 45.2%Bearish 34.5 Available 31.7Neutral 23.0 fromAAII 23.1
Source:AmericanAssociationof Individual Investors,625N.MichiganAve., Chicago, Ill. 60611 (312)280-0170.
MarketVaneBullish Consensus 52% 53% 52%
Source:MarketVane, P.O. Box90490,Pasadena,CA91109 (626)395-7436.
TIMGroupMarketSentimentIndicator 49.0% 49.9% 47.3%
Source: TIMGroup,3ColumbusCircle, Suite1592NewYork,NY10019 (844)207-1445. [email protected]
WEEKLYBONDSTATISTICS
Last Prev. YrAgoWeek Week Week
NewOfferings, (mil$) (v)Corporate (z) 10,289 r42,322 24,192Municipal (z) 4,385 r6,846 8,976
BestGradeBonds-y (Barron's index of 10 high-gradecorporate bonds.)
1.42 1.42 2.48
Interm-GradeBonds-y (Barron's index of 10medium-grade corporate bonds.)
2.66 2.70 3.29
Confidence Index (High-grade index divided by inter-mediate-grade index; decline in latter vs. former generallyindicates rising confidence, pointing to higher stocks.)
53.5 52.7 75.5
OtherConfidence Indicators:
BloombergBarclaysUSLongTreasury*(Thisindexmeasures the performance of fixed-rate, nominal USTreasurieswith at least 10 years tomaturity. Jan. 1, 1973=100.)
4543.99 4544.28 4187.39
BloombergBarclaysUSCredit (This indexincludes all publicly issued, fixed-rate, non-convertible, invest-ment-grade, dollar-denominated, SEC-registered corporatedebt. All issues have at least one year tomaturity and outstand-ing par value of at least $250million. Jan. 1, 1973=0.) (v)
3346.59 3343.25 3134.11
RyanLabsTreasury Index (Index of total return fromactive Treasury notes and bonds. Dec. 31, 1996=100.)
323.71 323.15 303.74
Last Prev. YrAgoWeek Week Week
BondBuyer20Bond Index (Index of yields of 20general obligationmunicipal bonds.)
2.21 2.21 2.54
BondBuyerMunicipalBond Index (Index of 40actively-traded tax-exempt bonds; component issues arechanged regularly to keep the index a current picture of themarket. Source: TheBondBuyer
3.46 3.47 3.55
Stock/BondYieldGap-s (Difference between yield onhighest-grade corporate bonds and yield on stocks on theDJIA.)
+.48 +.49 –.28
YieldonDJEqualWeightUSCorpBond Idx:CorpBonds, (y) 2.03 2.03 2.68
v-WeekendedThursday.y-Yieldtomaturity,weekendedThursday.z-Source: Refinitiv.*Barclays T-Bond Indexdiscontinuedby firm.
MONEYSUPPLY
MoneySupply (Bil. $) Latest Prev. Yr. Ago YOY%ChgWeekended January11M1(seas.adjusted) 6,798.4 r6,741.7 3,951.6 72.04M1(notadjusted) 6,556.6 7,044.4 3,848.0 70.39M2(seas.adjusted) 19,548.1 r19,179.1 15,397.6 26.96M2(notadjusted) 19,563.0 19,511.2 15,486.3 26.32MonthendedDecemberM1Mult.Replacement (St. Louis Fed) 1.290 1.177 1.182 9.14
MonthlyMoneySupplyMonthendedDecemberM1(seas.adjusted) r6,621.2 r6,047.6 3,978.1 66.44M2(seas.adjusted) r19,188.2 r19,086.0 15,317.8 25.27
GOLD PERFORMANCE
-40
-20
0
20
40
60
80
F M A M J J A S O N D J
Barron's Gold Mining Index (961.91)
s
Handy & Harman Gold Prices
New Stock: Russian miner Nordgold maylist in London. The price of gold rose0.7% for the week, to $1,853 and ounce.
ARMSINDEX
TheArmsindex,alsoknownastheshorttermtradingindex, isanumberderivedbydividingonequotientintoanotherquotient.Thenumeratorinthe index is the number of advancing stocks divided by the number ofdeclining stocks. As of 3/14/11, the denominator in the index is now thecompositevolumeofadvancingstocksdividedbythecompositevolumeofdecliningstocks.
Daily 1/18 1/19 1/20 1/21 1/22
NYSE ... .90 1.65 .93 .92NYSEAmerican ... .15 1.11 2.02 1.69Nasdaq ... .60 .81 .33 .94
SouthKorea (Won) .0009045 .0009056 1105.54 1104.27SriLanka (Rupee) .0051 .0052 197.8400 193.0400Sweden (Krona) .1205 .1191 8.2957 8.3968Switzerland (Franc) 1.1297 1.1222 .8852 .8911Taiwan (Dollar) .03576 .03572 27.967 27.995Thailand (Baht) .03337 .03323 29.970 30.090Turkey (NewLira)-d .1349 .1339 7.4145 7.4689Ukraine (Hryvnia) .0354 .0355 28.2500 28.1500U.K. (Pound) 1.3685 1.3584 .7307 .7362Uruguay (Peso) …….. …….. …….. ……..Financial .02371 .02358 42.185 42.405
----Euro 1.2175 1.2079 .8214 .8278SpecialDrawingRights (SDR) arebasedonexchange rates for theU.S.,British, and Japanese currencies. Source: InternationalMonetary Fund.a-RussianCentral Bank rate. b-government rate. d-rebasedasof Jan. 1,2005. y-floating rate.
Market LaboratoryMONEYRATES
Latest Prev. YrAgoWeek Week
DiscountRate (NY) 0.25 0.25 2.25
PrimeRate (base) 3.25 3.25 4.75
FedFundsRateAvg effective offer 0.08 0.09 1.57Avgweekly auction-c 0.09 0.09 1.54
T-BillsRate13weeks, CouponYield 0.086 0.091 1.56213weeks, AuctionRate 0.085 0.090 1.53026weeks, CouponYield 0.096 0.091 1.55726weeks, AuctionRate 0.095 0.090 1.520Avgweekly auction-c 0.09 0.09 1.53
BrokerCallRate 2.00 2.00 3.50
BankersAcceptances1month 0.12 0.12 1.652months 0.15 0.15 1.753months 0.18 0.18 1.806months 0.20 0.20 1.83
EuroLiborRate1month -0.577 -0.588 -0.5053months -0.545 -0.556 -0.4246months -0.532 -0.537 -0.36612months -0.500 -0.498 -0.278
Libor InterbankRate1month 0.12 0.13 1.663months 0.22 0.22 1.806months 0.24 0.25 1.8112months 0.31 0.32 1.88
ForeignPrimeRatesCanada 2.45 2.45 3.95Germany 0.00 0.00 0.00Japan 1.475 1.475 1.475Switzerland 0.00 0.00 0.50Britain 0.10 0.10 0.75
OtherMoneyRatesFannieMaeHomeLoan:30-Year FixedConv 1.98 2.03 3.03Bankmoneymarket-z 0.09 0.09 0.21Interest Checking-z 0.04 0.04 0.076-MonthCertif-z 0.15 0.15 0.5112-MonthCertif-z 0.21 0.21 0.7630MonthAccounts-z 0.22 0.22 0.805-Year Certificates-z 0.35 0.36 1.13U.S. Savings EEBonds:Long-Term (5yrs+) 0.10 0.10 0.10
c-Annualizedyields, adjusted for constantmaturity, reportedbythe Federal Reserveonaweekly averagebasis.
Sources: Tullett Prebon information, Ltd.Factset. z-Bankrate.com.
1.10
0.95
0.80
0.65
0.50
0.35
4.90
4.00
3.10
2.20
1.30
0.40
S&P 100 CBOE
J F M A M J J A S O N D J
CBOE PUT/CALL RATIO vs S&P 100
Source: CBOE
Readings in the CBOE equity put-call ratio of 60:100and in the S&P 100 of 125:100 are considered bullish,for instance. Bearish signals flash when the equityput-call level reaches the vicinity of 30:100 and theindex ratio hits 75:100.
S&P 100s
CBOEs
FOREIGNEXCHANGEFriday, January22,2021
TheNewYorkforeignexchangemid-rangeratesarequotedat5p.m. Eastern time by Tullett Prebon. Retail transactions pro-vide fewerunits of foreign currencyperdollar.
Foreign Foreign U.S. $ in U.S. $ inCurrency Currency Foreign ForeigninU.S.$ inU.S.$ Currency Currency
Country Fri. Last Fri. Fri. Last Fri.Argentina (Peso)-y .0116 .0117 86.4870 85.7216Australia (Dollar) .7717 .7702 1.2958 1.2984Bahrain (Dinar) 2.6524 2.6525 .3770 .3770Brazil (Real) .1829 .1889 5.4670 5.2930Bulgaria (Lev) .6225 .6179 1.6063 1.6185Canada (Dollar) .7851 .7851 1.2737 1.2737Chile (Peso) .001374 .001361 727.60 734.80China (Renminbi) .1543 .1543 6.4819 6.4808Colombia (Peso) .0002835 .0002888 3527.71 3462.11Croatia (Kuna) .1608493 .1599156 6.22 6.25Czech.Rep. (Koruna) …….. …….. …….. ……..Commercial rate .04660 .04614 21.458 21.674Denmark (Krone) .1636 .1624 6.1123 6.1595EcuadorUSDollar 1.0000 1.0000 1.0000 1.0000Egypt (Pound)-y .0636 .0639 15.7293 15.6616HongKong (Dollar) .1290 .1290 7.7522 7.7537Hungary (Forint) .003402 .003353 293.95 298.27Iceland (Krona) .007752 .007711 129.00 129.68India (Rupee) .01370 .01367 72.999 73.162Indonesia (Rupiah) .0000713 .0000713 14035 14020Israel (Shekel) .3057 .3058 3.2714 3.2697Japan (Yen) .009638 .009627 103.76 103.87Kazakhstan (Tenge) .002376 .002384 420.96 419.39Kuwait (Dinar) 3.3047 3.3022 .3026 .3028Macau (Pataca) .1252 .1251 7.9890 7.9905Malaysia (Ringgit)-b .2473 .2477 4.0430 4.0365Mexico (Peso) …….. …….. …….. ……..Floating rate .0501 .0505 19.9714 19.7961NewZealand (Dollar) .7182 .7132 1.3924 1.4021Norway (Krone) .1177 .1167 8.4976 8.5673Oman (Rial) 2.5974 2.5975 .3850 .3850Pakistan (Rupee) .00622 .00623 160.675 160.550Philippines (Peso) .02080 .02082 48.084 48.022Poland (Zloty) .2681 .2661 3.7294 3.7580Qatar (Rial) .2747 .2747 3.6408 3.6410Russia (Ruble)-a .01329 .01360 75.265 73.519SaudiArabia (Riyal) .2666 .2666 3.7513 3.7511Singapore (Dollar) .7527 .7514 1.3285 1.3309SouthAfrica (Rand) .0660 .0657 15.1527 15.2312
Foreign Foreign U.S. $ in U.S. $ inCurrency Currency Foreign ForeigninU.S.$ inU.S.$ Currency Currency
Country Fri. Last Fri. Fri. Last Fri.
January 25, 2021 BARRON’S M39
DIVIDENDPAYMENTBOOSTSAdjusted % Record Ex-Div Payment
CompanyName-TickerSymbol (Exchange) Yield Period To From Increase Date Date Date
AbsoluteSoftware-ABST (Nasdaq)........................ 1.9 Q .0633 .06015 5.2% 2-12 2-11 2-26AgreeRealty-ADC (NYSE) ....................................... 3.9 M .207 .206667 0.2 1-29 1-28 2-12AlliantEnergy-LNT (Nasdaq) .................................. 3.2 Q .4025 .38 5.9 1-29 1-28 2-16CenturyBancorpClA-CNBKA (Nasdaq)................ 0.9 Q .18 .16 12.5 2-01 1-29 2-16Cintas-CTAS (Nasdaq) .............................................. 0.9 Q .75 .7025 6.8 2-15 2-11 3-15CitrixSystems-CTXS (Nasdaq) ............................... 1.2 Q .37 .35 5.7 3-12 3-11 3-26Enerplus-ERF (NYSE)............................................... 2.8 M .0079 .007812 1.1 1-29 1-28 2-16EnterpriseBancorp-EBTC (Nasdaq) ...................... 2.7 Q .185 .175 5.7 2-08 2-05 3-01EquinorADR-EQNR (NYSE) .................................... 2.3 Q .11 .09 22.2 2-12 2-11 2-26FastenalCo-FAST (Nasdaq)..................................... 2.4 Q .28 .25 12.0 2-03 2-02 3-03FlagstarBancorp-FBC (NYSE) ............................... 0.5 Q .06 .05 20.0 3-01 2-26 3-15FranklinLtdDuration IT-FTF (NYSEAMER ).......... 9.9 M .0786 .0776 1.3 1-29 1-28 2-12GraniteREIT-GRP.U (NYSE).................................... 3.9 M .1966 .195305 0.7 1-29 1-28 2-16IHSMarkit-INFO (NYSE) ........................................... 0.9 Q .20 .17 17.6 1-29 1-28 2-12KaiserAluminum-KALU (Nasdaq).......................... 2.9 Q .72 .67 7.5 1-25 1-22 2-12MercantileBank-MBWM(Nasdaq) ......................... 4.0 Q .29 .28 3.6 3-05 3-04 3-17MetroCityBankshares-MCBS (Nasdaq)................ 2.7 Q .10 .09 11.1 2-03 2-02 2-12MonmouthRealEs InvClA-MNR (NYSE)............. 4.1 Q .18 .17 5.9 2-16 2-12 3-15NRGEnergy-NRG (NYSE)........................................ 3.1 Q .325 .30 8.3 2-01 1-29 2-16ONEGas-OGS (NYSE) .............................................. 3.3 Q .58 .54 7.4 2-19 2-18 3-05OrrstownFinancial-ORRF (NCM ).......................... 4.0 Q .18 .17 5.9 2-01 1-29 2-08PermRockRoyaltyTrust-PRT (NYSE) .................. 4.4 M .01593 .014914 6.8 1-29 1-28 2-12PinnacleFinlPartners-PNFP (Nasdaq) ................. 1.0 Q .18 .16 12.5 2-05 2-04 2-26PlumasBancorp-PLBC (NCM )............................... 2.2 Q .14 .12 16.7 2-01 1-29 2-15UnionBankshares-UNB (Nasdaq) ......................... 5.0 Q .33 .32 3.1 2-01 1-29 2-05
NYSEMonday(January 25)American Financial Grp .50CanadianPacific Rail .725CanadianPacific Rail .742Ellington Financial .10General Electric .01
Tuesday(January 26)MSC Industrial Direct .75
Wednesday(January 27)Agilent Technologies .194BankOfNovaScotia .706Winnebago .12
Thursday(January 28)Cdn Imperial Bank 1.134
Ingredion .64ShawCommunications .074SimpsonManufacturing .23WabashNational .08
Friday(January 29)AlamoGroup .14Arcosa .05BankUnited .23BradyCl A .22Danaher .18EMCORGroup .13EOGResources .375Foot Locker .15GFL Environmental .01Humana Inc .625IDEXCorp .50Methode Electronics .11OGEEnergy .403Oxford Industries .25
Quaker Chemical .395RPM Intl .38ScienceApplications Intl .37Stellantis 2.238Stryker Corp .63SYNNEX .20Sysco .45TCEnergy .633TimADR .24Trinity Industries .21Watsco 1.775WatscoB 1.775XeroxHoldings .25ZimmerBiometHoldings .24
Saturday(January 30) NONE
Sunday(January 31)Edison Intl .663JPMorganChase .90
NYSETuesday(January 26)Aptargroup .36Clorox 1.11
Wednesday(January 27)First Republic Bank .20
Thursday(January 28)AES .15AOSmith .26ARCDocument Sol .01Conagra Brands .275EatonVance .375Ellington Financial .10
Enterprise Pdts Partners .45Genesis Energy .15GrupoAval Acciones .026IHSMarkit .20KnotOffshore Partners .52Lennar Cl A .25Lennar Cl B .25MorganStanley .35Northwest Natural .48PermRockRoyalty .016Pfizer .39TCPipeLines .65UnumGroup .285
Friday(January 29)Ally Financial .19
Aon .46Bank ofMontreal .82Bk of NYMellon .31PinnacleWest Capital .83TargaResources .10WesternMidstream .311
Saturday(January 30)NONE
Sunday(January 31)NONE
Monday(February 1)ItauUnibancoHolding .003
NASDAQ
Tuesday(January 26)
Entegris .08
VSE .09
Wednesday(January 27)
NONE
Thursday(January 28)
Alliant Energy .403
CSW Industrials .135
Kentucky First FedBncp .10
LifetimeBrands .043
Ohio Valley Banc .21
Old SecondBancorp .01
Plains All Amer Pipeline .18
PlainsGPHoldings .18
Scholastic .15
Virtus Invt Partners .82
Friday(January 29)
Apogee Enterprises .20
Casey'sGeneral Stores .34
Century BancorpCl A .18
PetMedExpress .28
UnionBankshares .33
Saturday(January 30)
NONE
Sunday(January 31)
NONE
Monday(February 1)
Donegal GroupCl A .15
Donegal GroupCl B .132
Hasbro .68
NYSEAmericanTuesday(January 26)NONE
Wednesday(January 27)NONE
Thursday(January 28)NONE
Friday(January 29)NONE
Saturday(January 30) NONE
Sunday(January 31) NONE
Monday(February 1) NONE
STOCKSPLITS/DIVIDENDSRecord Ex-Dividend Payment
CompanyName-TickerSymbol (Exchange) Amount Date Date Date
eXpWorldHoldings-EXPI (Nasdaq).................................................... 2-for-1 1-29 2-16 2-12
NEWLISTINGS
NYSEMYTNetherlandsParent (MYTE)Primavera Capital Acquisition (PVU)RLXTechnology (RLX)
NYSEAmericanNone
NasdaqComSovereignHolding (COMS)DreamFindersHomes (DFH)EuropeanSustainableGrowthAcquisition (EUSGU)ExtractionOil &Gas (XOG)FoxWayne Enterprises Acquisition (FOXWU)GoresMetropoulos II (GMIIU)Huadi International Group (HUDI)Jack Creek Investment (JCICU)LegatoMerger (LEGOU)LibertyMedia Acquisition (LMACU)MontaukRenewables (MNTK)North Atlantic Acquisition (NAACU)One Equity PartnersOpenWater I (OEPWU)Oyster Enterprises Acquisition (OSTRU)Patria Investments (PAX)Queen'sGambit GrowthCapital (GMBTU)SCP&COHealthcare Acquisition (SHACU)TZPStrategies Acquisition (TZPSU)VirtuosoAcquisition (VOSOU)
NAMECHANGES
NYSEHims&HersHealth (HIMS), formerly Oaktree Acquisition(OAC)Stellantis (STLA), formerly Fiat Chrysler Automobiles(FCAU)Tri PointeHomes (TPH), formerly TRI PointeGroupUWMHoldings (UWMC), formerly GoresHoldings IV(GHIV)
NYSEAmericanAult Global Holdings (DPW), formerly DPWHoldings
NasdaqAffinity Bancshares (AFBI), formerly Community FirstBancshares (CFBI)CarLotz (LOTZ), formerly Acamar Partners Acquisition(ACAM)iSun (ISUN), formerly PeckCoHoldings (PECK)Viridian Therapeutics (VRDN), formerlyMiragenTherapeutics (MGEN)
Top5 InsiderSalesbyCompany in2021Number of Number of Avg.
Company Symbol Insiders Shares $Value Price
Mongodb ........................................................ MDB 8 72,293 25,045,900 $ 346.45Ncino ............................................................... NCNO 8 232,261 16,420,085 $ 70.70Bandwidth ...................................................... BAND 7 84,042 13,173,489 $ 156.75Carvana .......................................................... CVNA 7 520,000 136,237,780 $ 262.001LifeHealthcare ............................................. ONEM 6 1,244,616 52,517,238 $ 42.20
TRADINGSUSPENDED
NYSEConchoResources (CXO)
NYSEAmericanNone
NasdaqMid-Con EnergyPartners (MCEP)
NASDAQMonday(January 25)First BancorpNC .18MidPennBancorp .05ShoeCarnival .09
Tuesday(January 26)NONE
Wednesday(January 27)Comcast Cl A .23InterDigital .35
NetApp .48
Thursday(January 28)
JohnsonOutdoors Cl A .21
Friday(January 29)
America FirstMultifamily .06
CamdenNational .33
City HoldingCo. .58
CMCMaterials .44
First Busey .23
GlobalWater Res .024
McGrathRentCorp .42
Morningstar .315
PattersonCos .26
PCConnection .32
WD-40 .67
Saturday(January 30)
NONE
Sunday(January 31)
EnsignGroup .052
Investar Holding .065
NYSEAmericanMonday(January 25)GoldResource .003
Tuesday(January 26) NONE
Wednesday(January 27) NONE
Thursday(January 28)
NONE
Friday(January 29)
AcmeUnited .13
BlueRidgeBankshares .142
CaledoniaMining .11InnSuitesHospitality .01
Saturday(January 30)NONE
Sunday(January 31)NONE
Market LaboratoryTop5 InsiderPurchasesbyCompany in2021
Number of Number of Avg.Company Symbol Insiders Shares $Value Price
YorkWater ...................................................... YORW 15 877 39,030 $ 44.52CompassDiversified ..................................... CODI 7 36,570 717,326 $ 19.62FirstFinancialBancorp .................................. FFBC 7 3,385 59,339 $ 17.53AltimeterGrowth2 ......................................... AGCB 4 526,000 6,653,900 $ 12.65BankOfSouthCarolina .................................. BKSC 4 6,000 97,500 $ 16.25
WEEK'SDIVIDENDPAYMENT
This list includespayouts on commonstocks.
WEEK'SEX-DIVIDENDDATES
This list includespayouts on commonstocks.
SPECIALDIVIDENDSRecord Ex-Dividend Payment
CompanyName-TickerSymbol (Exchange) Amount Date Date Date
PremierFinancialBancorp-PFBI (Nasdaq) ....................................... 1.00 2-01 1-29 2-05
DIVIDENDPAYMENTREDUCTIONSAdjusted % Record Ex-Div Payment
CompanyName-TickerSymbol (Exchange) Yield Period To From Decrease Date Date Date
CrossTimbersRoyaltyTr-CRT (NYSE)............... 8.7 M .049268 .062137 -20.7% 1-29 1-28 2-12GEOGroup-GEO (NYSE) ..................................... 12.0 Q .25 .34 -26.5% 1-25 1-22 2-01PermianBasinRoyaltyTr-PBT (NYSE) ............... 6.9 M .011453 .013413 -14.6% 1-29 1-28 2-12SLGreenRealty-SLG (NYSE) .............................. 6.0 M .3033 .31215 -2.8% 1-29 1-28 2-16VOCEnergyTrust-VOC (NYSE)........................... 5.4 Q .03 .085 -64.7% 2-01 1-29 2-12
HIGH-YIELDBONDSFriday, January22, 2021Tenmost active fixed-couponhigh-yield, or "junk", corporatebonds
LAST LAST **EST ESTVOLCOMPANY (TICKER) COUPON MATURITY PRICE YIELD SPREAD UST (000's)
WellsFargo (WFC) 3.900 Mar 15, 2049 100.950 3.713 186 30 1,333,119UnitiGroupLp (UNIT) 6.500 Feb 15, 2029 101.125 6.235 515 10 830,545TargaResourcesPartnersLp (NGLS) 4.000 Jan 15, 2032 99.630 4.042 295 10 672,337HiltonDomesticOperating Inc (HLT) 3.625 Feb 15, 2032 100.375 3.573 248 10 669,389CommunityHealthSystems (CYH) 6.875 Apr 15, 2029 102.250 6.354 527 10 500,727BnpParibasSa (BNP) 2.824 Jan 26, 2041 98.643 2.914 126 30 467,086MegEnergy (MEGCN) 5.875 Feb 01, 2029 99.250 5.994 523 10 366,384IndigoNaturalResourcesLLC (INDNAT) 5.375 Feb 01, 2029 99.729 5.417 433 10 346,104CommercialMetalsCo (CMC) 3.875 Feb 15, 2031 102.250 3.551 246 10 340,696ParkRiverHoldings (PRIMBP) 5.625 Feb 01, 2029 100.000 5.624 453 10 332,664
Volume represents total volume for themarket; price/yield data are for trades of $100,000 and greater.* Denotes a security whose last roundlot trade did not take place on the last business day prior to publication. ** Estimated spreads, in basis points (100 basis points is one percent-age point), over the 2, 5, 10 or 30-year hot run Treasury note/bond. 2-year: 0.125 12/22; 5-year: 0.375 12/25; 10-year: 0.875 11/30;30-year: 1.375 08/50.†Comparable U.S. Treasury issue.
Source:MarketAxess Corporate BondTicker - www.bondticker.com
ADJUSTABLEMORTGAGEBASERATES
YOY
Jan22 Jan15 Yr. Ago %Chg
1YearTreasBills 0.11 0.10 1.54 -92.86
2YearTreasNotes 0.14 0.13 1.58 -91.14
3YearTreasNotes 0.22 0.20 1.58 -86.08
5YearTreasNotes 0.49 0.42 1.63 -69.94
10YearTreasNotes 1.13 1.03 1.82 -37.91
20YearTreasBds 1.67 1.57 2.13 -21.60
11thDistrict%Nov 0.466 0.466 1.035 -54.98
FHFAPMMS+ 2.80 2.80 3.56 -21.35
Fed annualized yields adjusted for constant maturity. FHFAPMMS+ is the Federal Housing Finance Agency's adjusted versionof FreddieMac's 30-yr FRMPrimaryMortgageMarket Survey. ThisIndex replaces thediscontinuedFHFAContract Rate.

M40 X W L C 10 11 12 H G R P BARRON’S 4 8 3 F A D 6 7 9 0 I January 25, 2021
Wewould like to welcome and thank the following sponsors andschools for participating in Barron’s in Education to improve financial
proficiency for the next generation.
Helping develop the next generationof business leaders.If you are interested in partnering with Barron’s in Educationand to learn more contact: [email protected]
©2021 Dow Jones & Company, Inc. All rights reserved. 4E5157
Peter A. RohrManaging Director
PrivateWealth AdvisorThe Rohr Group
Merrill LynchWealthManagement
Will GoodsonSeniorVice President - InvestmentsGoodson & Nichols FinancialGroup ofWells Fargo Advisors
William F. Medico IIICo-Founder & Senior PartnerJacobiWealth Advisors
Carol AndersonSeniorWealth Planner
Michael J. HirthlerChief InvestmentOfficer&FounderJacobi Capital Management, LLC
TommyMcBrideManagingDirector
WealthManagementAdvisorMcBride&Associates
Merrill LynchWealthManagement
Related Documents