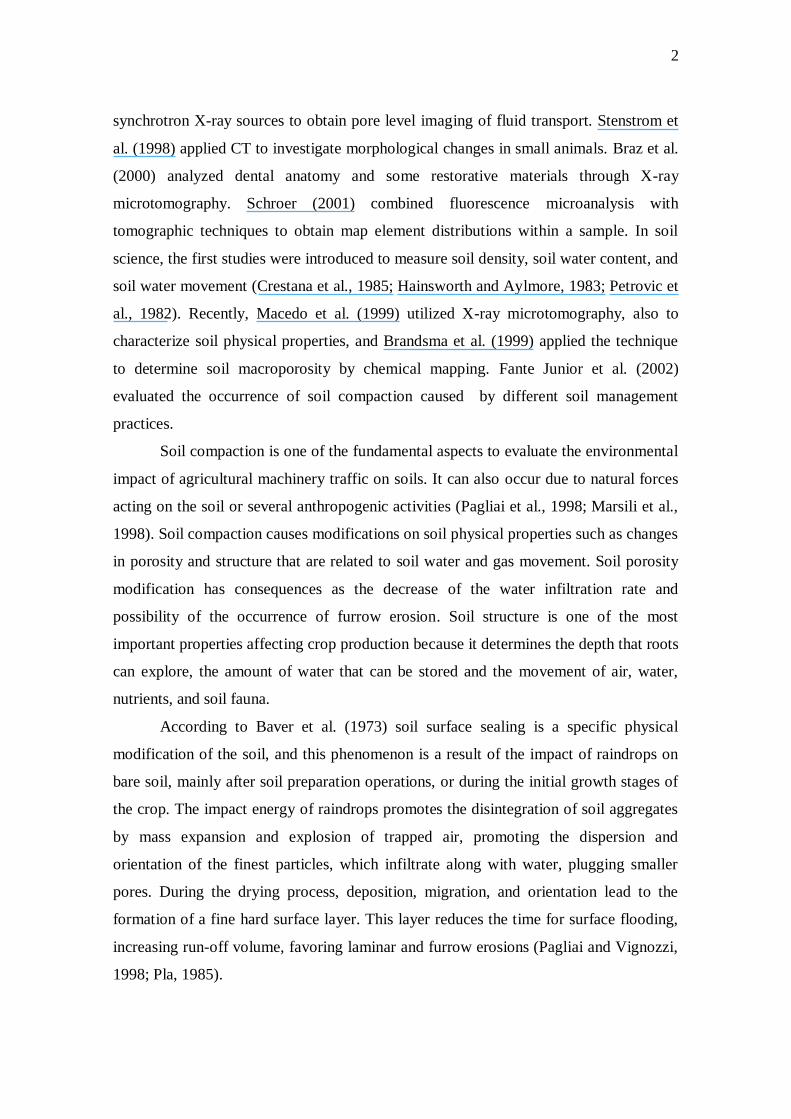
Abstract Soil compaction is one of the fundamental parameters to evaluate the environmental impact of agricultural machinery traffic on soils. Compaction causes modifications on soil physical properties such as changes in porosity and structure that are related to soil water movement and gas exchange. The objective of this work was to evaluate soil surface sealing after sewage sludge application, and the influence of agricultural machinery traffic, through Computed Tomography (CT). A first generation tomograph was used having a 137 Cs source and a 3 in x 3 in NaI(Tl) scintillation crystal detector coupled to a photomultiplier tube. Image analysis and tomographic unit profiles could successfully be used for the detection of soil surface sealing and soil compaction due to machinery traffic associated to sewage-sludge application. Keywords: Gamma-ray computed tomography; Soil compaction; Soil surface sealing 1. Introduction Gamma ray computed tomography (CT) is a non-destructive technique suitable to investigate different phenomena. The first studies were performed in medical science, and lately with the success of the technique, the computed tomography began to be used in other areas. Coles et al. (1998) developed the computed microtomography employing

Welcome message from author
This document is posted to help you gain knowledge. Please leave a comment to let me know what you think about it! Share it to your friends and learn new things together.
Transcript
Abstract
Soil compaction is one of the fundamental parameters to evaluate the environmental
impact of agricultural machinery traffic on soils. Compaction causes modifications on
soil physical properties such as changes in porosity and structure that are related to soil
water movement and gas exchange. The objective of this work was to evaluate soil
surface sealing after sewage sludge application, and the influence of agricultural
machinery traffic, through Computed Tomography (CT). A first generation tomograph
was used having a 137
Cs source and a 3 in x 3 in NaI(Tl) scintillation crystal detector
coupled to a photomultiplier tube. Image analysis and tomographic unit profiles could
successfully be used for the detection of soil surface sealing and soil compaction due to
machinery traffic associated to sewage-sludge application.
Keywords: Gamma-ray computed tomography; Soil compaction; Soil surface sealing
1. Introduction
Gamma ray computed tomography (CT) is a non-destructive technique suitable
to investigate different phenomena. The first studies were performed in medical science,
and lately with the success of the technique, the computed tomography began to be used
in other areas. Coles et al. (1998) developed the computed microtomography employing
2
synchrotron X-ray sources to obtain pore level imaging of fluid transport. Stenstrom et
al. (1998) applied CT to investigate morphological changes in small animals. Braz et al.
(2000) analyzed dental anatomy and some restorative materials through X-ray
microtomography. Schroer (2001) combined fluorescence microanalysis with
tomographic techniques to obtain map element distributions within a sample. In soil
science, the first studies were introduced to measure soil density, soil water content, and
soil water movement (Crestana et al., 1985; Hainsworth and Aylmore, 1983; Petrovic et
al., 1982). Recently, Macedo et al. (1999) utilized X-ray microtomography, also to
characterize soil physical properties, and Brandsma et al. (1999) applied the technique
to determine soil macroporosity by chemical mapping. Fante Junior et al. (2002)
evaluated the occurrence of soil compaction caused by different soil management
practices.
Soil compaction is one of the fundamental aspects to evaluate the environmental
impact of agricultural machinery traffic on soils. It can also occur due to natural forces
acting on the soil or several anthropogenic activities (Pagliai et al., 1998; Marsili et al.,
1998). Soil compaction causes modifications on soil physical properties such as changes
in porosity and structure that are related to soil water and gas movement. Soil porosity
modification has consequences as the decrease of the water infiltration rate and
possibility of the occurrence of furrow erosion. Soil structure is one of the most
important properties affecting crop production because it determines the depth that roots
can explore, the amount of water that can be stored and the movement of air, water,
nutrients, and soil fauna.
According to Baver et al. (1973) soil surface sealing is a specific physical
modification of the soil, and this phenomenon is a result of the impact of raindrops on
bare soil, mainly after soil preparation operations, or during the initial growth stages of
the crop. The impact energy of raindrops promotes the disintegration of soil aggregates
by mass expansion and explosion of trapped air, promoting the dispersion and
orientation of the finest particles, which infiltrate along with water, plugging smaller
pores. During the drying process, deposition, migration, and orientation lead to the
formation of a fine hard surface layer. This layer reduces the time for surface flooding,
increasing run-off volume, favoring laminar and furrow erosions (Pagliai and Vignozzi,
1998; Pla, 1985).
3
During the last decade, many studies have been carried out on the application of
sewage sludge as fertilizer and a soil conditioner (Tsutiya, 2001). Several results have
shown that the application of sewage sludge promotes a significant change on the soil
surface, causing an additional surface sealing (Pires et al., 2002; Macedo, 2002), and
modifications on soil physical properties (Macedo et al., 2001; Marciano, 1999; Logan
et al., 1996; Bernardes, 1982).
The objective of this work was to evaluate soil surface sealing through CT after
sewage sludge application, and the influence of agricultural machinery traffic on sewage
sludge treated soil.
2. Theory
When a gamma ray beam passes through an homogeneous material of thickness
x (cm) several electromagnetic interaction processes occur (Wang et al., 1975), and the
transmitted photons follow the Beer-Lambert law:
S
0 dsx..exp.NN (1)
where N and N0 (number of photons.m-2
.s-1
) are, respectively, the emerging and incident
monoenergetic photon flux densities of energy E (keV), (cm-1
) and / (cm2.g
-1) are
the linear and mass attenuation coefficients, and (g.cm-3
) is the physical density of the
material.
The mass attenuation coefficient can be obtained from Eq. (1), since N, N0,
and x, can be measured:
N
Nln.
x.
1 0 (2)
It measures the photon absorption or scatter probability per unit length while
interacting within the sample, and is proportional to the cross-section per electron e
(cm2/electron), therefore:
4
A
N.Z. adve
(3)
where Z is the atomic number, Nadv the Avogadro´s number, and A the atomic mass of
the material.
Values of the attenuation coefficient of the soil in the CT image can be
associated with numbers called tomographic units (TU) that are numerical values
assigned to gray levels (Naime et al., 2000; Crestana and Vaz, 1998). TU takes the air as
the media with the minimum possible value. It is related to the Hounsfield Unit (HU)
that takes the water as a reference media for which HU=0. The relation between the TU
and the of the sample it is given by:
.)E(
.)E(
.)E(.)E(TUw
w
s
s
s (4)
where represents the correlation between the linear attenuation coefficient and TU,
(s/s) and (w/w) (cm2.g
-1) are the mass attenuation coefficients of soil and water,
respectively, and (cm3.cm
-3) is the volumetric soil water content.
The variations in TU values correspond to differences in soil density and water
content. When the soil sample is dry or its water content is uniformly distributed, the
TU distribution reflects only the soil bulk density distribution and consequently the soil
image obtained through the CT can be used to determine soil compaction (Macedo et
al., 2000):
..
TU
w
w
s
s
s (5)
where (g.g-1
) represents the gravimetric soil water content.
5
3. Material and methods
3.1 Soil samples and preparation
The sewage sludge field experiment was established in 1998 at the National
Center for Environment Research (CNPMA – Embrapa) [22°41’ S, 47°00’ W, 570 m
above mean sea], Jaguariúna, SP, Brazil, on a medium-clayey soil, a Dark-Red Latosol
according to the Brazilian Soil Science Society classification. The experiment consists
of 4 treatments [3 sludge rates + 1 control (absolute control)], using split-plot blocks
with three replicates. The term absolute control refers to the control plots that did not
receive neither sewage sludge nor inorganic fertilizer. The rates of sludge application
were calculated on the basis of dry weight of mineral nitrogen, corresponding to: 10, 40
and 80 kg.m-2
of N and here identified as 1N, 4N and 8N, respectively.
The vehicle utilized for soil preparation practices and sewage sludge application
was a tractor (MF 275 – 2x4) of 2.553 kg. The vehicle passed none and twice on the
same track while performing soil preparation and sewage sludge application.
For CT analysis, 12 soil samples were collected at the soil surface using
cylinders of 5 cm high and 5 cm diameter, 9 of which from areas receiving different
rates of sewage sludge, in order to obtain tomographic images. Average dry bulk
density was measured by the volumetric ring method (Embrapa, 1998) and CT methods
by taking samples of soil below tractor tracks after none and two passages.
3.2 Tomographic system
A first generation gamma ray CT system was used in this experiment, having a
fixed source-detector arrangement in which soil samples are translated and rotated.
Translation and rotation movements were controlled by a microcomputer through
coupling interfaces. The radioactive source is 137
Cs with an activity of 7.4 GBq that
emits monoenergetic photons (661.6 keV). The detector is a 3 in x 3 in NaI(Tl)
scintillation crystal coupled to a photomultiplier tube. Circular lead collimators with
diameter of 1 mm were utilized for both source and detector. The acquired data for soil
6
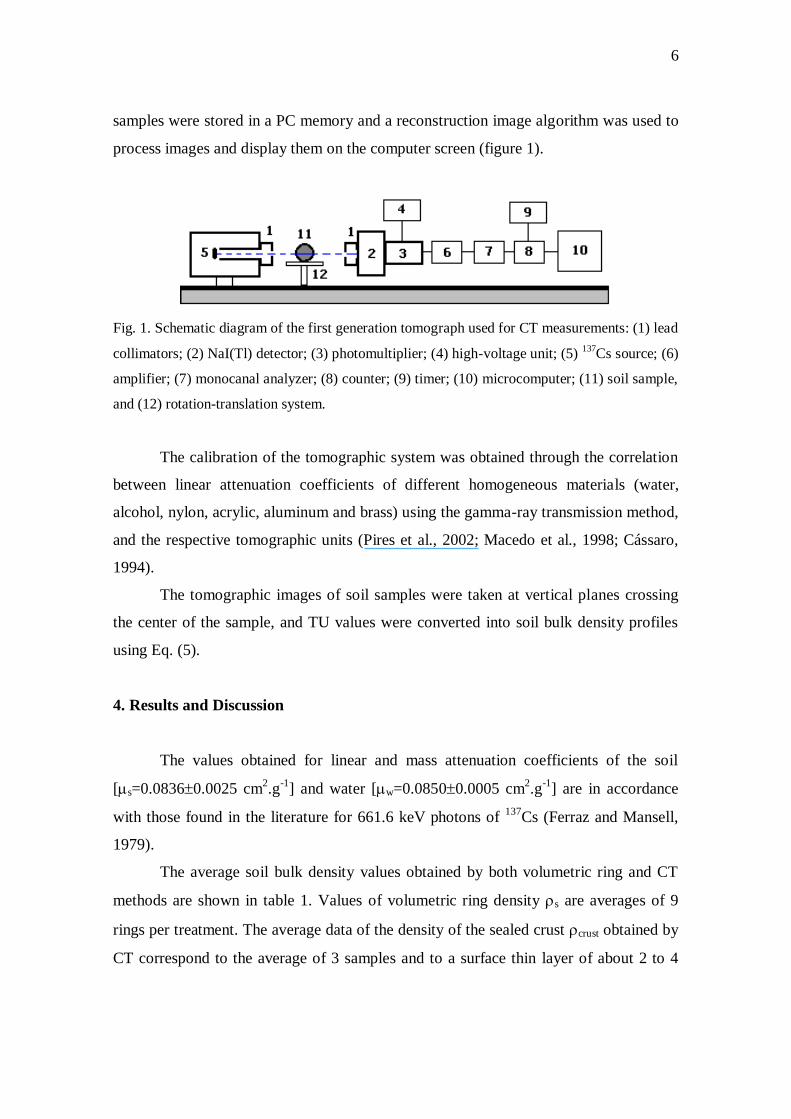
samples were stored in a PC memory and a reconstruction image algorithm was used to
process images and display them on the computer screen (figure 1).
Fig. 1. Schematic diagram of the first generation tomograph used for CT measurements: (1) lead
collimators; (2) NaI(Tl) detector; (3) photomultiplier; (4) high-voltage unit; (5) 137
Cs source; (6)
amplifier; (7) monocanal analyzer; (8) counter; (9) timer; (10) microcomputer; (11) soil sample,
and (12) rotation-translation system.
The calibration of the tomographic system was obtained through the correlation
between linear attenuation coefficients of different homogeneous materials (water,
alcohol, nylon, acrylic, aluminum and brass) using the gamma-ray transmission method,
and the respective tomographic units (Pires et al., 2002; Macedo et al., 1998; Cássaro,
1994).
The tomographic images of soil samples were taken at vertical planes crossing
the center of the sample, and TU values were converted into soil bulk density profiles
using Eq. (5).
4. Results and Discussion
The values obtained for linear and mass attenuation coefficients of the soil
[s=0.08360.0025 cm2.g
-1] and water [w=0.08500.0005 cm
2.g
-1] are in accordance
with those found in the literature for 661.6 keV photons of 137
Cs (Ferraz and Mansell,
1979).
The average soil bulk density values obtained by both volumetric ring and CT
methods are shown in table 1. Values of volumetric ring density s are averages of 9
rings per treatment. The average data of the density of the sealed crust crust obtained by
CT correspond to the average of 3 samples and to a surface thin layer of about 2 to 4
7
mm. Column 4 shows the average density values of cc, which correspond to compacted
soil samples that were exposed to two wheel tractor passages.
Table 1. Average values of soil bulk density (s), density of the layer presenting soil
surface sealing (crust) and density of the compacted soil layer (cc) for samples of
treatments: Tabs – absolute control, 1N, 4N and 8N – rates of sewage sludge.
Treatment s (g.cm-3
)* crust (g.cm-3
)** cc (g.cm-3
)**
Tabs 1.08 0.07 1.12 0.08 1.11 0.08
1N 1.05 0.08 1.15 0.02 1.15 0.06
4N 1.02 0.12 1.20 0.04 1.19 0.11
8N 1.09 0.11 1.22 0.03 1.24 0.12
*Measured by the volumetric ring method. **Measured by the CT method.
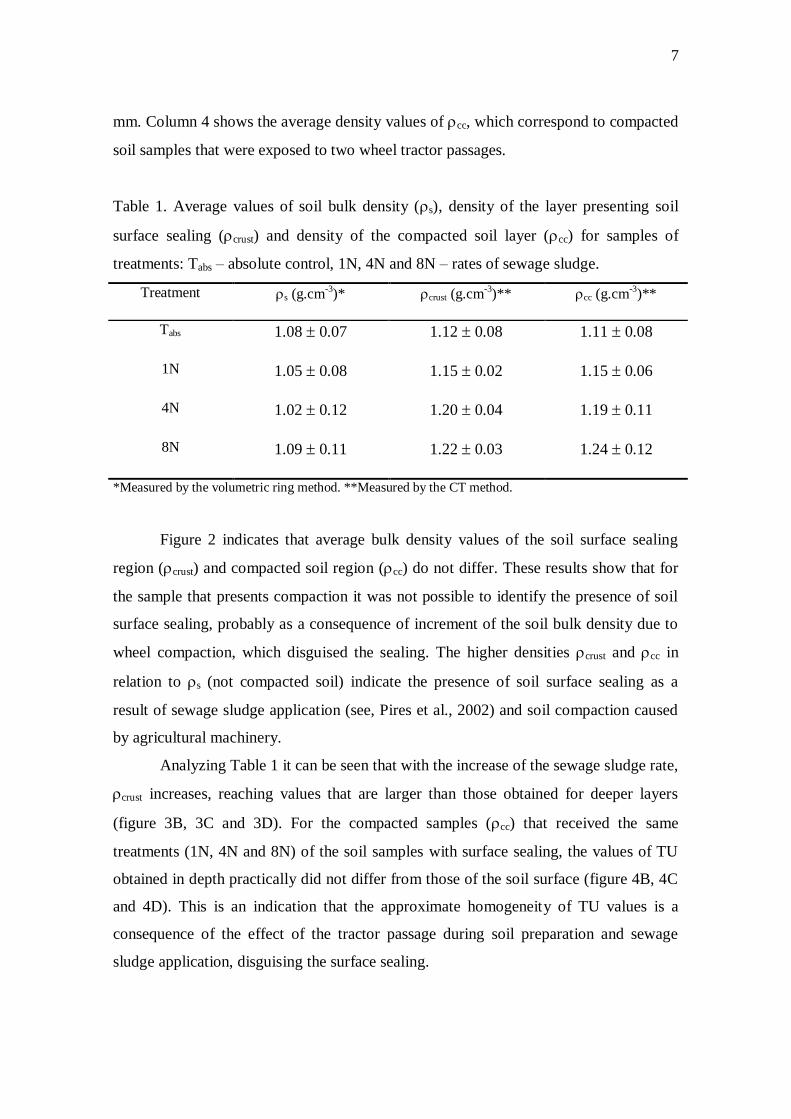
Figure 2 indicates that average bulk density values of the soil surface sealing
region (crust) and compacted soil region (cc) do not differ. These results show that for
the sample that presents compaction it was not possible to identify the presence of soil
surface sealing, probably as a consequence of increment of the soil bulk density due to
wheel compaction, which disguised the sealing. The higher densities crust and cc in
relation to s (not compacted soil) indicate the presence of soil surface sealing as a
result of sewage sludge application (see, Pires et al., 2002) and soil compaction caused
by agricultural machinery.
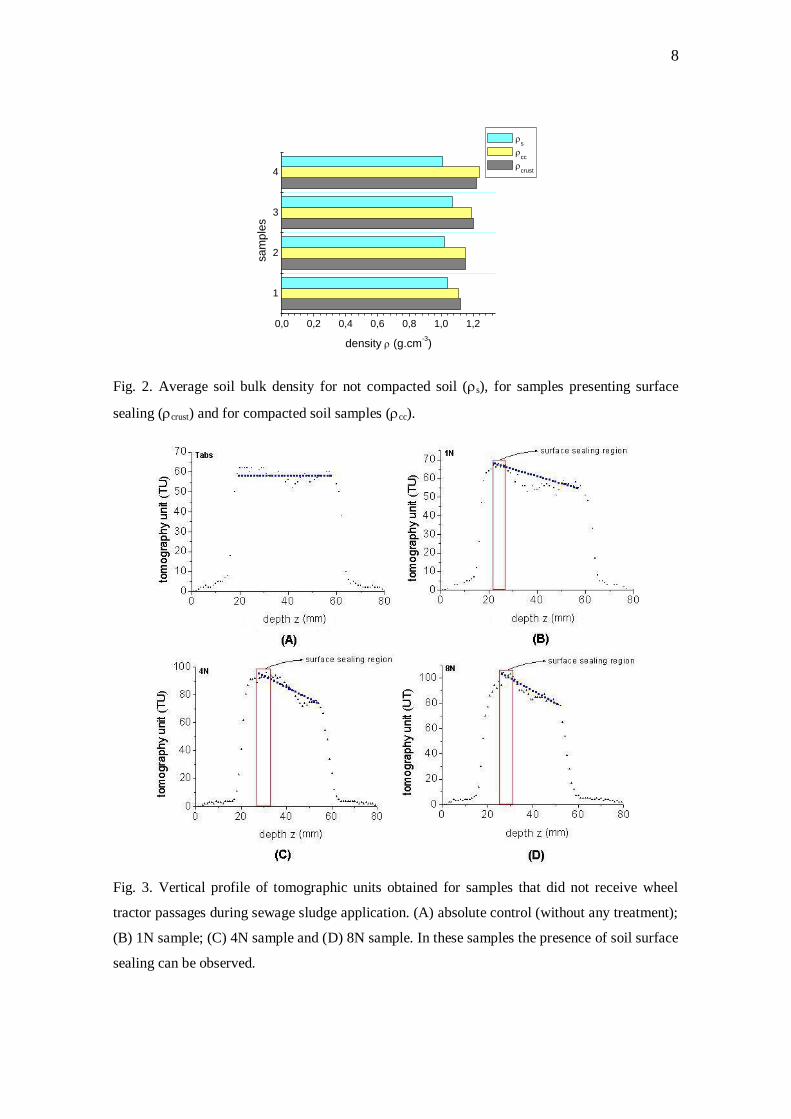
Analyzing Table 1 it can be seen that with the increase of the sewage sludge rate,
crust increases, reaching values that are larger than those obtained for deeper layers
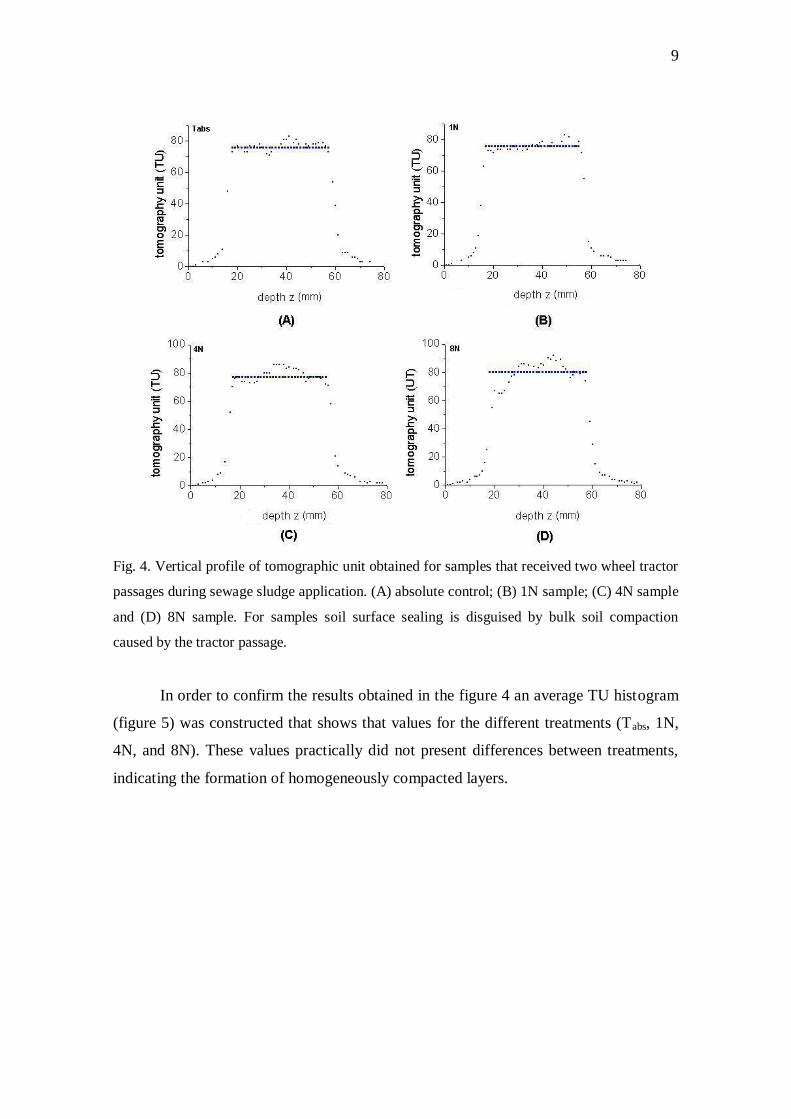
(figure 3B, 3C and 3D). For the compacted samples (cc) that received the same
treatments (1N, 4N and 8N) of the soil samples with surface sealing, the values of TU
obtained in depth practically did not differ from those of the soil surface (figure 4B, 4C
and 4D). This is an indication that the approximate homogeneity of TU values is a
consequence of the effect of the tractor passage during soil preparation and sewage
sludge application, disguising the surface sealing.
8
1
2
3
4
0,0 0,2 0,4 0,6 0,8 1,0 1,2
density (g.cm-3)
sa
mp
les
s
cc
crust
Fig. 2. Average soil bulk density for not compacted soil (s), for samples presenting surface
sealing (crust) and for compacted soil samples (cc).
Fig. 3. Vertical profile of tomographic units obtained for samples that did not receive wheel
tractor passages during sewage sludge application. (A) absolute control (without any treatment);
(B) 1N sample; (C) 4N sample and (D) 8N sample. In these samples the presence of soil surface
sealing can be observed.
9
Fig. 4. Vertical profile of tomographic unit obtained for samples that received two wheel tractor
passages during sewage sludge application. (A) absolute control; (B) 1N sample; (C) 4N sample
and (D) 8N sample. For samples soil surface sealing is disguised by bulk soil compaction
caused by the tractor passage.
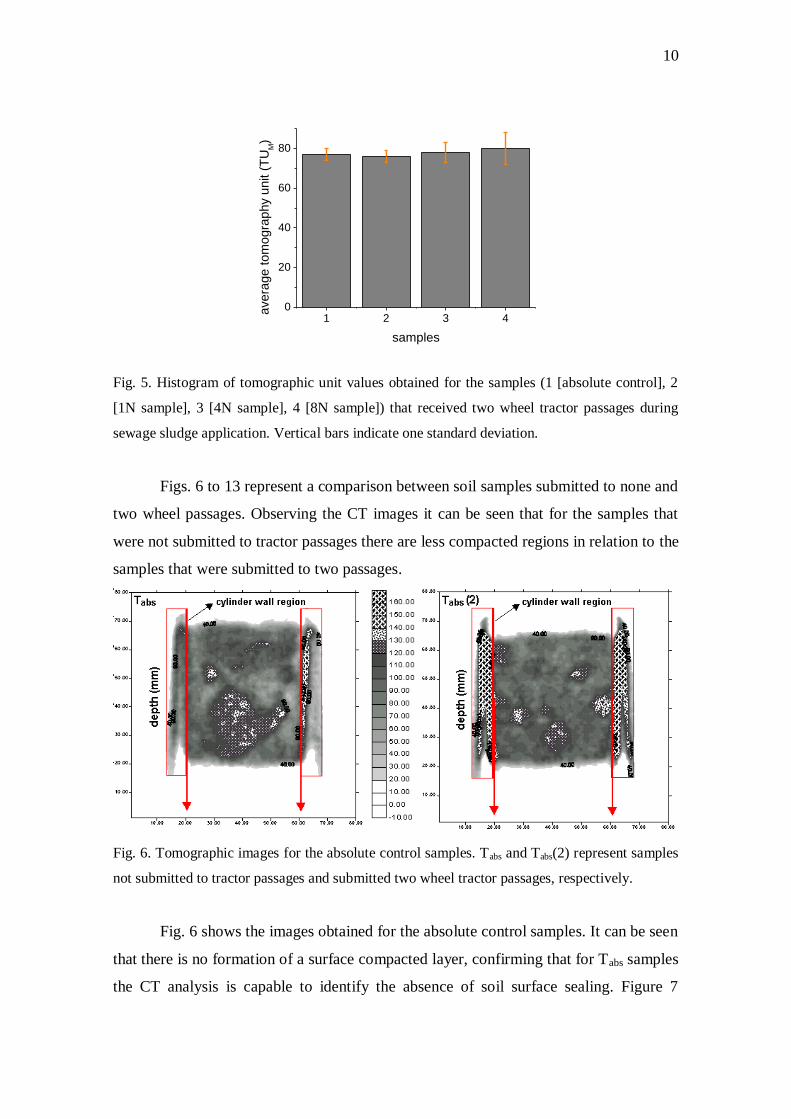
In order to confirm the results obtained in the figure 4 an average TU histogram
(figure 5) was constructed that shows that values for the different treatments (Tabs, 1N,
4N, and 8N). These values practically did not present differences between treatments,
indicating the formation of homogeneously compacted layers.
10
1 2 3 40
20
40
60
80
avera
ge tom
ogra
phy u
nit (
TU
M)
samples
Fig. 5. Histogram of tomographic unit values obtained for the samples (1 [absolute control], 2
[1N sample], 3 [4N sample], 4 [8N sample]) that received two wheel tractor passages during
sewage sludge application. Vertical bars indicate one standard deviation.
Figs. 6 to 13 represent a comparison between soil samples submitted to none and
two wheel passages. Observing the CT images it can be seen that for the samples that
were not submitted to tractor passages there are less compacted regions in relation to the
samples that were submitted to two passages.
Fig. 6. Tomographic images for the absolute control samples. Tabs and Tabs(2) represent samples
not submitted to tractor passages and submitted two wheel tractor passages, respectively.
Fig. 6 shows the images obtained for the absolute control samples. It can be seen
that there is no formation of a surface compacted layer, confirming that for Tabs samples
the CT analysis is capable to identify the absence of soil surface sealing. Figure 7
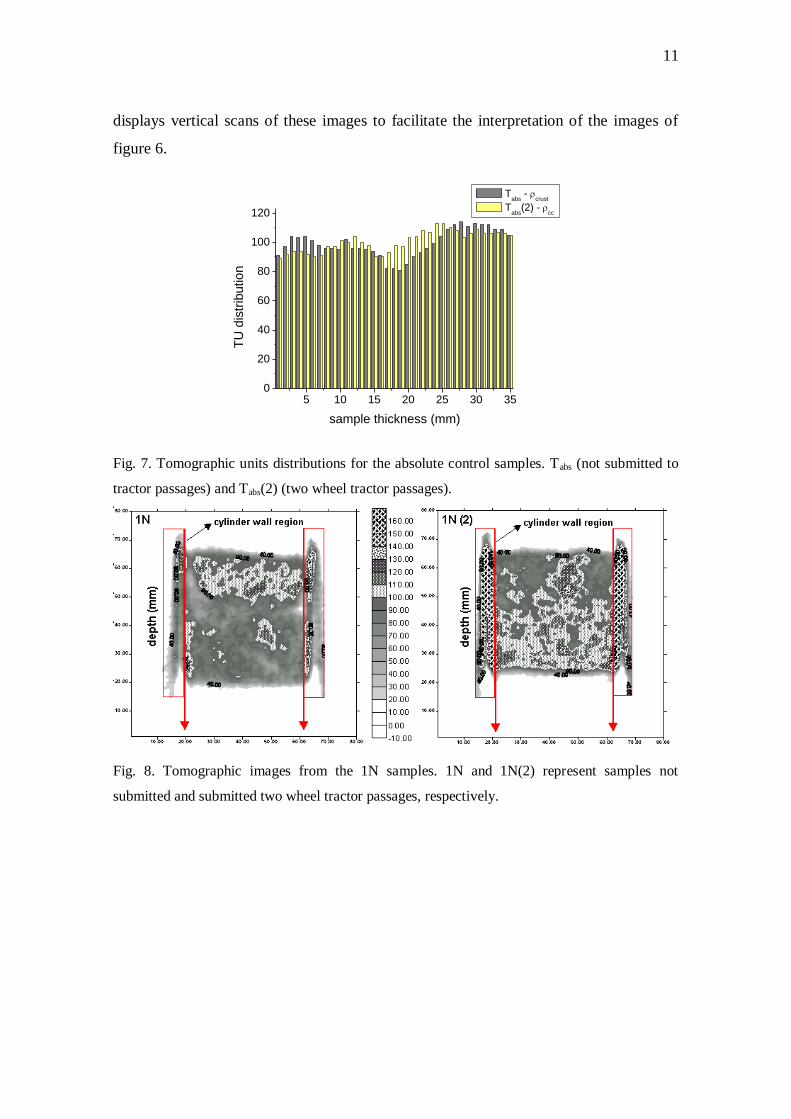
11
displays vertical scans of these images to facilitate the interpretation of the images of
figure 6.
5 10 15 20 25 30 350
20
40
60
80
100
120
TU
dis
trib
ution
sample thickness (mm)
Tabs
- crust
Tabs
(2) - cc
Fig. 7. Tomographic units distributions for the absolute control samples. Tabs (not submitted to
tractor passages) and Tabs(2) (two wheel tractor passages).
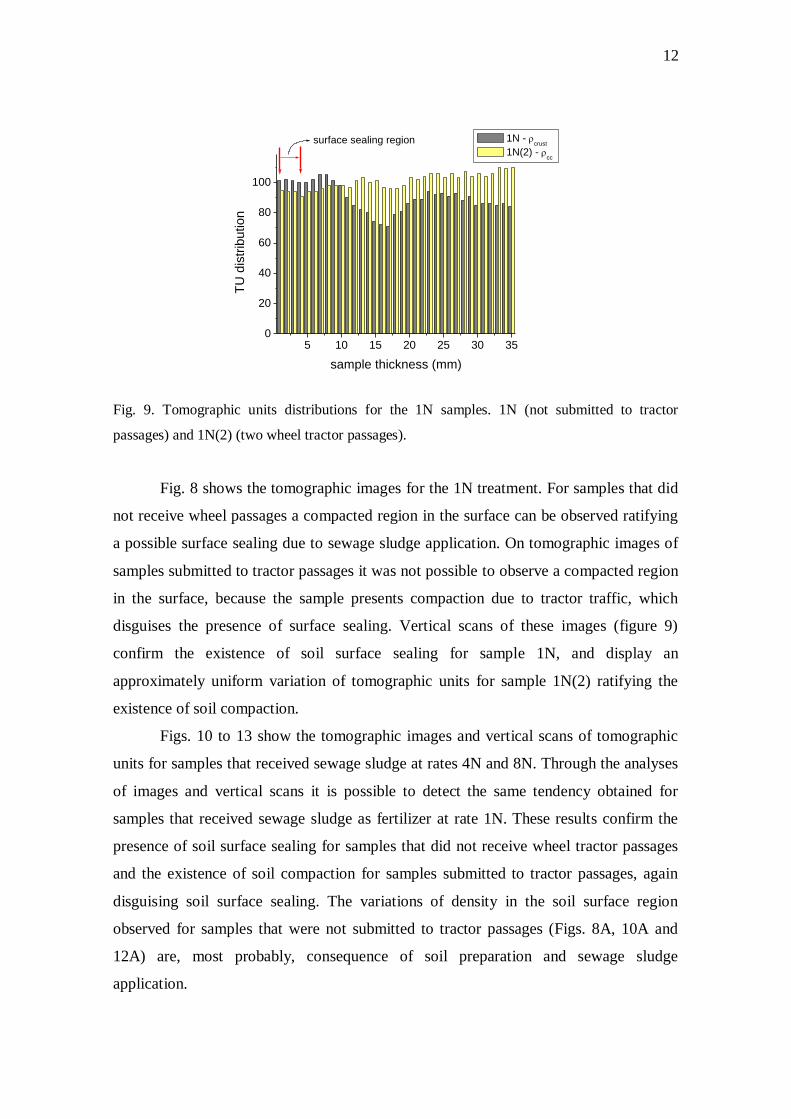
Fig. 8. Tomographic images from the 1N samples. 1N and 1N(2) represent samples not
submitted and submitted two wheel tractor passages, respectively.
12
5 10 15 20 25 30 350
20
40
60
80
100
surface sealing region
TU
dis
trib
ution
sample thickness (mm)
1N - crust
1N(2) - cc
Fig. 9. Tomographic units distributions for the 1N samples. 1N (not submitted to tractor
passages) and 1N(2) (two wheel tractor passages).
Fig. 8 shows the tomographic images for the 1N treatment. For samples that did
not receive wheel passages a compacted region in the surface can be observed ratifying
a possible surface sealing due to sewage sludge application. On tomographic images of
samples submitted to tractor passages it was not possible to observe a compacted region
in the surface, because the sample presents compaction due to tractor traffic, which
disguises the presence of surface sealing. Vertical scans of these images (figure 9)
confirm the existence of soil surface sealing for sample 1N, and display an
approximately uniform variation of tomographic units for sample 1N(2) ratifying the
existence of soil compaction.
Figs. 10 to 13 show the tomographic images and vertical scans of tomographic
units for samples that received sewage sludge at rates 4N and 8N. Through the analyses
of images and vertical scans it is possible to detect the same tendency obtained for
samples that received sewage sludge as fertilizer at rate 1N. These results confirm the
presence of soil surface sealing for samples that did not receive wheel tractor passages
and the existence of soil compaction for samples submitted to tractor passages, again
disguising soil surface sealing. The variations of density in the soil surface region
observed for samples that were not submitted to tractor passages (Figs. 8A, 10A and
12A) are, most probably, consequence of soil preparation and sewage sludge
application.
13
Fig. 10. Tomographic images from the 4N samples. 4N and 4N(2) represent samples not
submitted and submitted two wheel tractor passages, respectively.
5 10 15 20 25 30 350
20
40
60
80
100
surface sealing region
TU
dis
trib
ution
sample thickness (mm)
4N - crust
4N(2) - cc
Fig. 11. Tomographic units distributions for the 4N samples. 4N (not submitted to tractor
passages) and 4N(2) (two wheel tractor passages).
14
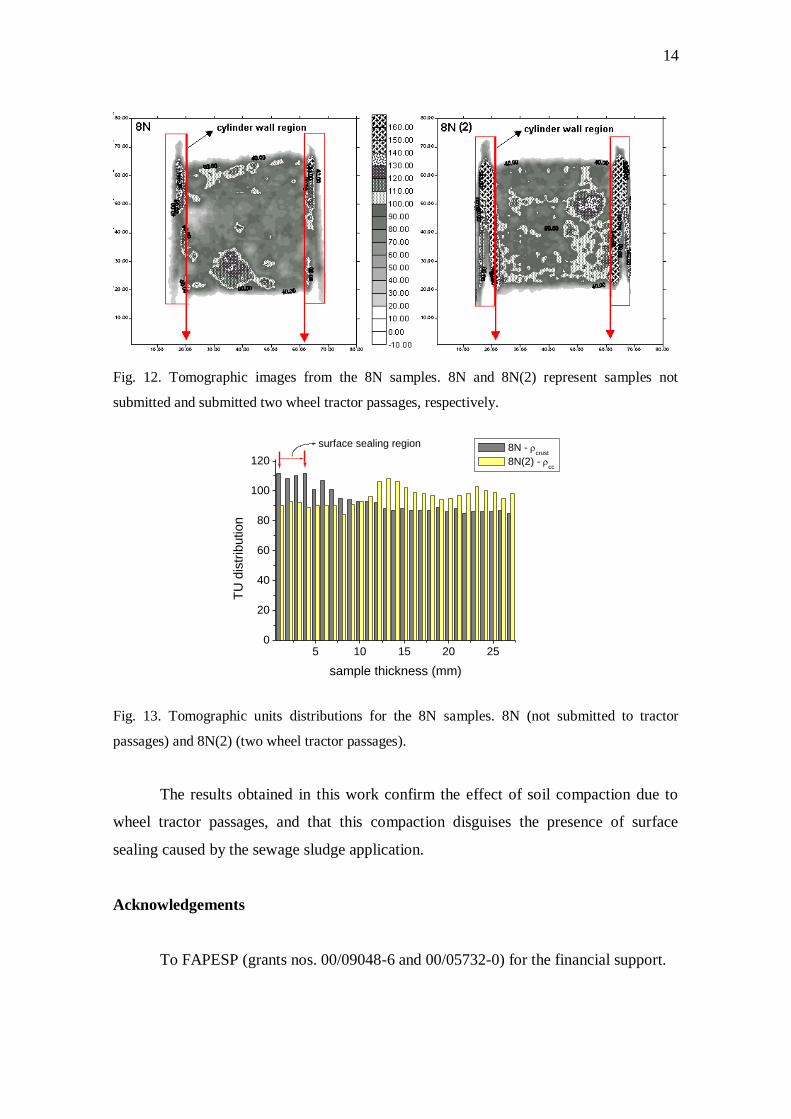
Fig. 12. Tomographic images from the 8N samples. 8N and 8N(2) represent samples not
submitted and submitted two wheel tractor passages, respectively.
5 10 15 20 250
20
40
60
80
100
120
surface sealing region
TU
dis
trib
ution
sample thickness (mm)
8N - crust
8N(2) - cc
Fig. 13. Tomographic units distributions for the 8N samples. 8N (not submitted to tractor
passages) and 8N(2) (two wheel tractor passages).
The results obtained in this work confirm the effect of soil compaction due to
wheel tractor passages, and that this compaction disguises the presence of surface
sealing caused by the sewage sludge application.
Acknowledgements
To FAPESP (grants nos. 00/09048-6 and 00/05732-0) for the financial support.
15
References
Baver, L.D., Gardner, W.J., Gardner, W.R., 1973. Física de suelos. Union Tipográfica
Editorial Hispano Americana, Mexico, 529p.
Bernardes, L.F., 1982. Efeitos da aplicação do lodo de esgoto nas propriedades físicas
do solo. Dissertação de mestrado, UNESP/FCAV, Jaboticabal, Brasil, 50p.
Brandsma, R.T., Fullen, M.A., Hocking, T.J., Allen, J.R., 1999. An X-ray scanning
technique to determine soil macroporosity by chemical mapping. Soil Tillage Res.
50, 95-98.
Braz, D., De Oliveira, L.F., Morhy, O.N., Lopes, R.T., 2000. Dental restorative
materials analysis using 3D Ray microfocus tomography system. In: VII SARX –
Seminario Latino-americano de Análises por Técnicas de Raios-X. Resumos
expandidos, São Pedro, Brasil, CD-ROM.
Cássaro, F.A.M., 1994. Tomografia de dupla energia simultânea para caracterização
física de um meio poroso deformável. Dissertação de mestrado, EESC/USP, São
Carlos, Brasil, 119p.
Crestana, S., Mascarenhas, S., Pozzi-mucelli, R.S., 1985. Static and dynamic three-
dimensional studies of water in soil using computerized tomography scanning. Soil
Science 140, 326-331.
Crestana, S., Vaz, C.M.P., 1998. Non-invasive instrumentation opportunities for
characterizing soil porous systems. Soil Tillage Res. 47, 19-26.
Embrapa, 1998. Manual de análise de solos. Centro Nacional de Pesquisa de Solos. Rio
de Janeiro, Brasil, 156p.
Fante Júnior, L., Oliveira, J.C.M., Bassoi, L.H., Vaz, C.M.P., Macedo, A., Bacchi,
O.O.S., Reichardt, K., 2002. Tomografia computadorizada na avaliação da
densidade de um solo do semi-árido brasileiro. Brazilian Journal of Soil Science 26,
835-842.
Ferraz, E.S.B., Mansell, R.S., 1979. Determining water content and bulk density of soil
by gamma ray attenuation methods. Technical Bulletin, n° 807. IFAS, Flórida, 51p.
Hainsworth, J.M., Aylmore, L.A.G., 1983. The use of computer-assisted tomography to
determine spatial distribution of soil water content. Aust. J. Soil. Res. 21, 435-440.
16
Logan, T.J., Harrison, B.J., McAvoy, D.C., Greff, J.A., 1996. Effects of olestra in
sewage sludge on soil physical properties. J. Env. Quality 25, 153-161.
Macedo, A., Crestana, S., Vaz, C.M.P., 1998. X-ray microtomography to investigate
thin layers of soil clod. Soil Tillage Res. 49, 249-253.
Macedo, A., Vaz, C.M.P., Naime, J.M., Cruvinel, P.E., Crestana, S., 1999. X-ray
microtomography to characterize the physical properties of soil and particulate
systems. Powder Technology 101, 178-182.
Macedo, A., Vaz, C.M.P., Naime, J.M., Cruvinel, P.E., Bassoi, L.H., Bacchi, O.O.S., Fante
Júnior, L., Oliveira, J.C.M., 2000. The use of tomography to evaluate soil compaction in a
red yellow podzolic area of the Brazilian northeast. In: Cruvinel, P.E., Colnago, L.A.
(Eds.) Agricultural Tomography. Embrapa – CNPDIA, São Carlos, Brasil, pp. 105-
109.
Macedo, J.R., Pires, L.F., Reichardt, K., De Souza, M.D., Bacchi, O.O.S., Meneguelli,
N.A., 2001. Utilização de biossólido (lodo de esgoto) e sua influência nas
propriedades físicas do solo. In: Delgado, R.V. (Ed.), CONGRESO
LATINOAMERICANO DE LA CIENCIA DEL SUELO, 15. Resumenes
expandidos, SLCS, Havana, Cuba, CD-ROM.
Macedo, J.R., 2002. Selamento superficial e atributos físicos e hídricos em solo tratado
com lodo de esgoto. Tese de doutorado, CENA/USP, Piracicaba, Brasil, 87p.
Marciano, C.R., 1999. Incorporação de resíduos urbanos e as propriedades físico-
hídricas de um Latossolo Vermelho Amarelo. Tese de doutorado, ESALQ/USP,
Piracicaba, Brasil, 93p.
Marsili, A., Servadio, P., Pagliai, M., Vignozzi, N., 1998. Changes of some physical
properties of a clay soil following passage of ruber- and metal-tracked tractors. Soil
Tillage Res. 49, 185-199.
Naime, J.M., Cruvinel, P.E., Silva, A.M., Crestana, S., Vaz, C.M.P., 2000. Applications
of X and -Rays dedicated computerized tomography scanner in agriculture. In:
Cruvinel, P.E., Colnago, L.A. (Eds.) Agricultural Tomography. Embrapa –
CNPDIA, São Carlos, Brasil, pp. 96-104.
Pagliai, M., Rousseva, S., Vignozzi, N., Piovanelli, C., Pellegrini, S., Miclaus, N., 1998.
Tillage impact on soil quality I: Soil porosity and related physical properties. Ital. J.
Agron. 2, 11-20.
17
Pagliai, M., Vignozzi, N., 1998. Use of manure for soil improvement. In: Handbook of
Soil Conditiones. Substances that enhance the physical properties of soil. Edited by
Arthur Wallace and Richard E. Terry. Marcel Dekker, Inc. New York.
Petrovic, A.M., Siebert, J.E., Rieke, P.E., 1982. Soil bulk density analysis in three
dimensions by computed tomographic scanning. Soil Sci. Soc. Am. J. 46, 445-450.
Pires, L.F., Macedo, J.R., Souza, M.D., Bacchi, O.O.S., Reichardt, K., 2002. Gamma-
ray computed tomography to characterize soil surface sealing. Appl. Rad. Isot. 57,
375-380.
Pla, I., 1985. A routine laboratory index to predict the effects of soil sealin on soil and
water conservation. In. International Symposium on the assessment of soil surface
sealing and crusting. Ghent, Belgium. ISSS. AISS. IBG, pp.154-162.
Robert-Coutant, C., Moulin, V., Sauze, R., Rizo, P., Casagrande, J.M., 1999. Estimation
of the matrix attenuation in heterogeneous radioactive waste drums using dual-
energy computed tomography. Nucl. Inst. Phy. Res. 422, 949-956.
Schroer, C.G., 2001. Reconstructing X-ray fluorescence microtomograms. Appl.
Physics Letters 79, 1912-1914.
Stenstrom, M., Olander, B., Carlsson, C.A., Alm Carlsson, G., Lehto-Axtelius, D.,
Hakanson, R., 1998. The use of computed microtomography to monitor
morphological changes in small animals. Appl. Radiat. Isot. 49, 565-570.
Tsutiya, M.T., 2001. Características de biossólidos gerados em estações de tratamento
de esgoto. In: Bettiol, W., Camargo, O.A. (Eds.), Biossólidos na Agricutura.
Jaboticabal, Brasil, pp. 89-131.
Wang, C.H., Willis, D.L., Loveland, W.D., 1975. Characteristics of ionizing radiation.
In. Wang, C.H., Willis, D.L., Loveland, W.D. Radiotracer methodology in the
biological environmental, and physical sciences. Englewood Cliffs, Prentice Hall,
pp. 39-74.
Related Documents