y’ FORMATION IN A NICKEL-BASE DISK SUPERALLOY Timothy P. Gabb*, Daniel G. Backman **, Daniel Y. Wei**, David P. Mourer**, David Furrer***, Anita Garg*, and David L. Ellis**** *NASA Glenn Research Center **General Electric Aircraft Engines ***Ladish Co., Inc. ****Case WesternReserve University Abstract A streamlined,physics-based kinetic model was formulated, calibrated, and validated on a nickel-base superalloy. It was designed to be simplified and streamlined,to speed up calculations and facilitate linkage to finite elementmodeling thermal codes. The model describes and predicts the formation of y’ precipitates during the heat treatmentprocess. Standardized experimental methodswere employed to calibrate and initially validate the microstructure model. The model was then validated on an oil-quenched generic disk. Predictions of primary cooling y’ size and areafraction agreed well with experimental measurements over a large range of values and cooling rates. Introduction Many mechanical properties of nickel-base superalloys are strongly influenced by the morphology of the strengtheningy’ precipitates (I,2 ). Both the sizes and areafractions of different populations of precipitates are influential and therefore needto be quantified and modeled. Thesemicrostructural characteristics are strongly affected by the heat treatments a componentundergoes (3-5). Previous work has often modeled precipitate size through heat treatments using cubic coarsening equations(5). For physically accurate treatments, it is necessary to describethe kinetics of nucleation and subsequent growth and coarsening of y’ precipitates as theseprocesses occur within a given heat treatment. This requires tracking multiple populations of precipitates through heat treatments containing multiple steps. The NASA-industry Integrated Design and Process Analysis Technologies (IDPAT) program had the objective of developing computational tools that could be applied togetherto improve the product and process developmentcycle for aircraft engine components. It was recognizedthat this required a “fast-acting” y’ precipitation model for superalloy components, which could rapidly perform the necessary computationswhile integrated with material processingand mechanicalproperty models. This would enableprediction of y’ precipitate microstructure and resulting mechanical properties from the processing. This paper describes the work performed in developmentof this fast-acting y’ precipitation model. The objective of this work was to model y’ precipitation for the case of a powder metallurgy disk superalloy. A physics-based kinetic model was formulated, calibrated, and validated on an 405 advanced disk superalloy. The model describes and predicts the nucleation, growth, and coarseningof y’ precipitates during the heat treatmentprocess. However, it was designed to be simple and streamlined,in order to speed up calculations and facilitate linkage to finite elementthermal and structural codes. Standardized experimental methodswere employed to calibrate and initially validate the microstructure model. The model was then further validated using an oil quenched disk. y’ precipitate morphologies were extensively quantified as functions of thermal histories and compared to model predictions. Model calibration and validation efforts described here were focussed on the primary cooling y’ precipitates,which form during the first (primary) burst of nucleation during the solution quench. Model Formulation During the quench of a nickel-base superalloy from solution temperatures, supersaturation of y’ phasesolutesbuilds up in the y phase. When the supersaturation builds up to a sufficient degree, a burst of nucleation of new y’ precipitates occurs. This greatly reduces the supersaturation of y’ solutes. Both the new and prior precipitates continually grow by interface-diffusion controlled growth. The precipitates also undergo coarsening, where smaller precipitates dissolve to provide solute for larger precipitatesto grow. A precipitation model of the y’ phasein nickel-basesuperalloys had beenpreviously developedby GeneralElectric Aircraft Engines (6) using classical nucleation and diffusion controlled growth. That model encompasses the full considerationof thermodynamic excess free energy, supersaturation buildup, nucleation, growth and coarsening. In contrast,the presentwork was focused on a precipitation model that is fast-acting such that it can be integrated with finite elementmodel thermal analyses. However, this precipitation model must still encompass the entire precipitate physics including supersaturation buildup, nucleation, growth and coarsening, to ensure the streamlined model is capableof predicting the y’ structure under the full spectrumof heat treatmentconditions. The fast-acting y’ precipitation model has two basic requirements:i) to generate high-fidelity predictions and provide explanations for subtle but important relationships betweeny’ size distribution and the heat treat schedule,and ii) to provide a computationally efficient algorithm that can be easily matedto FEM thermal codeswithout burdening the overall computational effort. Superalloys 2ooo Fdk-d by T.M. Pollock, R.D. Kissinger, R.R. Bowman, K.A. Gmn, M. McLean, S. Olson, aadJ.J.Schima TMs CrheMinerals, Metals &Materials Society), 2000

Welcome message from author
This document is posted to help you gain knowledge. Please leave a comment to let me know what you think about it! Share it to your friends and learn new things together.
Transcript

y’ FORMATION IN A NICKEL-BASE DISK SUPERALLOY
Timothy P. Gabb*, Daniel G. Backman **, Daniel Y. Wei**, David P. Mourer **, David Furrer***, Anita Garg*, and David L. Ellis****
*NASA Glenn Research Center **General Electric Aircraft Engines
***Ladish Co., Inc. ****Case Western Reserve University
Abstract
A streamlined,physics-based kinetic model was formulated, calibrated, and validated on a nickel-base superalloy. It was designed to be simplified and streamlined, to speed up calculations and facilitate linkage to finite element modeling thermal codes. The model describes and predicts the formation of y’ precipitates during the heat treatment process. Standardized experimental methods were employed to calibrate and initially validate the microstructure model. The model was then validated on an oil-quenched generic disk. Predictions of primary cooling y’ size and area fraction agreed well with experimental measurements over a large range of values and cooling rates.
Introduction
Many mechanical properties of nickel-base superalloys are strongly influenced by the morphology of the strengthening y’ precipitates (I,2 ). Both the sizes and area fractions of different populations of precipitates are influential and therefore need to be quantified and modeled. These microstructural characteristics are strongly affected by the heat treatments a component undergoes (3-5). Previous work has often modeled precipitate size through heat treatments using cubic coarsening equations (5). For physically accurate treatments, it is necessary to describe the kinetics of nucleation and subsequent growth and coarsening of y’ precipitates as these processes occur within a given heat treatment. This requires tracking multiple populations of precipitates through heat treatments containing multiple steps.
The NASA-industry Integrated Design and Process Analysis Technologies (IDPAT) program had the objective of developing computational tools that could be applied together to improve the product and process development cycle for aircraft engine components. It was recognized that this required a “fast-acting” y’ precipitation model for superalloy components, which could rapidly perform the necessary computations while integrated with material processing and mechanical property models. This would enable prediction of y’ precipitate microstructure and resulting mechanical properties from the processing. This paper describes the work performed in development of this fast-acting y’ precipitation model.
The objective of this work was to model y’ precipitation for the case of a powder metallurgy disk superalloy. A physics-based kinetic model was formulated, calibrated, and validated on an
405
advanced disk superalloy. The model describes and predicts the nucleation, growth, and coarsening of y’ precipitates during the heat treatment process. However, it was designed to be simple and streamlined, in order to speed up calculations and facilitate linkage to finite element thermal and structural codes. Standardized experimental methods were employed to calibrate and initially validate the microstructure model. The model was then further validated using an oil quenched disk. y’ precipitate morphologies were extensively quantified as functions of thermal histories and compared to model predictions. Model calibration and validation efforts described here were focussed on the primary cooling y’ precipitates, which form during the first (primary) burst of nucleation during the solution quench.
Model Formulation
During the quench of a nickel-base superalloy from solution temperatures, supersaturation of y’ phase solutes builds up in the y phase. When the supersaturation builds up to a sufficient degree, a burst of nucleation of new y’ precipitates occurs. This greatly reduces the supersaturation of y’ solutes. Both the new and prior precipitates continually grow by interface-diffusion controlled growth. The precipitates also undergo coarsening, where smaller precipitates dissolve to provide solute for larger precipitates to grow. A precipitation model of the y’ phase in nickel-base superalloys had been previously developed by General Electric Aircraft Engines (6) using classical nucleation and diffusion controlled growth. That model encompasses the full consideration of thermodynamic excess free energy, supersaturation buildup, nucleation, growth and coarsening. In contrast, the present work was focused on a precipitation model that is fast-acting such that it can be integrated with finite element model thermal analyses. However, this precipitation model must still encompass the entire precipitate physics including supersaturation buildup, nucleation, growth and coarsening, to ensure the streamlined model is capable of predicting the y’ structure under the full spectrum of heat treatment conditions.
The fast-acting y’ precipitation model has two basic requirements: i) to generate high-fidelity predictions and provide explanations for subtle but important relationships between y’ size distribution and the heat treat schedule, and ii) to provide a computationally efficient algorithm that can be easily mated to FEM thermal codes without burdening the overall computational effort.
Superalloys 2ooo Fdk-d by T.M. Pollock, R.D. Kissinger, R.R. Bowman,
K.A. Gmn, M. McLean, S. Olson, aad J.J. Schima TMs Crhe Minerals, Metals &Materials Society), 2000
The fast-acting precipitation model includes the following elements to meet these requirements: a A pseudo-binary solvus formulation that describes the
solvus curve for the y’ formers. b. A kinetic model that predicts the minimum size of nuclei
as a function of supersaturation. This model employs a simple kinetic criterion to determine the onset of nucleation in lieu of a sophisticated thermodynamic model to compute the free energy and strain energy for nucleation.
C. Classical nucleation expressions that predict nucleation rate as a function of supersaturation and time.
d. A precipitate growth relationship based on an asymptotic solution that accounts for diffusive transport driven by the interfacial concentration gradient. These gradients form because of the concentration difference between the supersaturated matrix and the precipitate.
e. Particle coarsening relationships that predict changes in the average particle size of a size distribution based on the functional dependency of particle solubility upon particle radius.
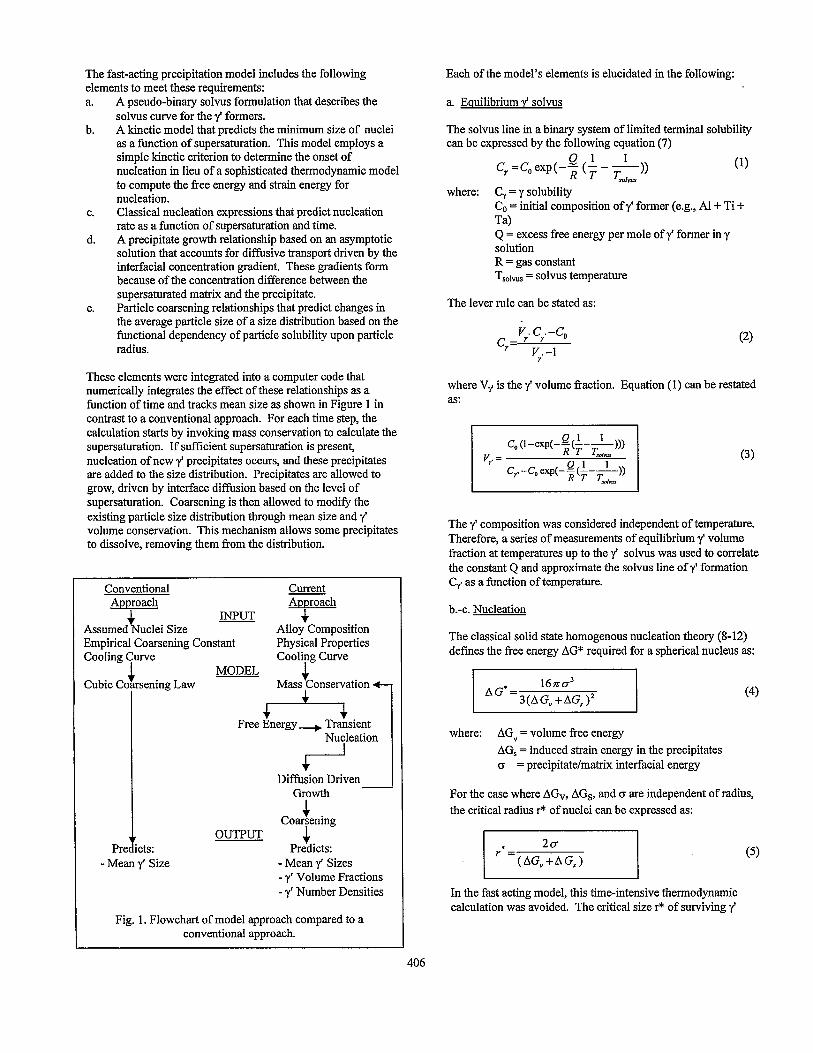
These elements were integrated into a computer code that numerically integrates the effect of these relationships as a function of time and tracks mean size as shown in Figure 1 in contrast to a conventional approach. For each time step, the calculation starts by invoking maSs conservation to calculate the supersaturation. If sufficient supersaturation is present, nucleation of new y’ precipitates occurs, and these precipitates are added to the size distribution. Precipitates are allowed to grow, driven by interface diffusion based on the level of supersaturation. Coarsening is then allowed to modify the existing particle size distribution through mean size and y’ volume conservation. This mechanism allows some precipitates to dissolve, removing them from the distribution.
Conventional Approach
uclei Size
Current Approach
INPUT + Allov Comuosition
Empirical Coarsening Constant Physical Properties Cooling Curve
4
Cooling Curve MODEL
Cubic Coarsening Law -c Mass Conservation ~1
Pre ;t i
+ 4 4
Free Energy + Transient Nucleation
i+ Diffusion Driven
Growth I
Coartening OUTPUT 4
Predicts: - Mean y’ Sizes - y’ Volume Fractions - y’ Number Densities
cts: - Mean y’ Size
Fig. 1. Flowchart of model approach compared to a conventional approach.
Each of the model’s elements is elucidated in the following:
a. Equilibrium y’ solvus
The solvus line in a binary system of limited terminal solubility can be expressed by the following equation (7)
C =C exp(-e(L- ’ Y 0 R T iii’ (1)
where: C, = y solubility Co = initial composition of y’ former (e.g., Al + Ti + Ta) Q = excess free energy per mole of y’ former in y solution R = gas constant T solvus = solvus temperature
The lever rule can be stated as:
c,= v,. c; -c,
Y.-l (2)
where V, is they’ volume fraction. Equation (1) can be restated Ci.5:
c (I-exp(-@&,, 0 v,. = R T Lw (3)
c -c q&l-1,) 7’ 0 R T I;nhur
The y’ composition was considered independent of temperature. Therefore, a series of measurements of equilibrium 7’ volume fraction at temperatures up to the y’ solvus was used to correlate the constant Q and approximate the solvus line of y’ formation C, as a function of temperature.
b.-c. Nucleation
The classical solid state homogenous nucleation theory (8-12) defines the free energy AG* required for a spherical nucleus as:
I 1
(4)
where: AG, = volume free energy AG, = induced strain energy in the precipitates CJ = precipitate/matrix interfacial energy
For the case where AG,, AG,, and o are independent of radius, the critical radius r* of nuclei can be expressed as:
I I
20 ‘*=(AG,+AG,)
I I In the fast acting model, this time-intensive thermodynamic calculation was avoided. The critical size r* of surviving y’
(5)
406
nuclei was defined to satisfy the following stability criterion employing an adjustable nucleation scaling factor S:
The number of nuclei AN, at time interval At and available volume V(t) is then:
2ov s r* =m RT ln(CY< /C,) (6)
where C, is the saturated solute concentration in the y matrix, Ce is the equilibrium solute concentration in they matrix and V,,, = a3/4 is the average atomic volume in the y’ precipitate using a, the lattice parameter. The interfacial energy cr and nucleation scaling factor S in equation 6 are determined through iterative estimation of these constants, followed by comparison to measurements from calibration heat treatments. For each time step in the precipitation model algorithm, r* is first calculated using equation 6. r* is then used in equation 5 to obtain (AG”+AG,). AG* is then obtained from equation 4.
Formally, the isothermal nucleation rate J* is given by nucleation theory as (11):
J*=NZ$ exp(-AG* I kT)exp(-rl t) (7)
in which N is the density of active nucleation sites per unit volume, Z is the Zeldovich non-equilibrium factor which corrects the equilibrium concentration of critical nuclei for the loss of nuclei to growth and thus to the concentration present at steady state, S* is the rate of atomic attachment to the critical nuclei, AG* is the activation energy for the formation of a critical nucleus as defined above, k and T have their usual meaning, and ‘c is the incubation time to form embryos before nucleation. However, to keep the entire calculation manageable in the fast-acting model, the latter incubation effect was instead related to r*. For an f.c.c. or LIZ lattice, the frequency factor S* was defined as:
/3* = (C, D /n4) 4 zY2 (8)
where h = a& is the atomic spacing, D the diffusion coefficient of the rate limiting species in the matrix, and r* was determined before. The Zeldovich factor was calculated using:
Z=[AG*/(3nkT)l”2 (9)
where AG* was determined as previously described from equation 4. A volume-related time dependent nucleation rate was derived, given that as nucleation proceeds, a portion of the volume will have been transformed into y’ precipitates. Within this volume and its neighborhood further nucleation is not possible. Therefore, it was assumed that the stationary nucleation rate can proceed only in the remaining (non-depleted) volume, using the expression:
V(t)=V,-~4/3an,(r,+Br,)3 i=I
where V0 is the total volume considered, k is the number of nucleation bursts, and V(t) the remaining non-depleted volume.
AN,,=f AtV(5) I
(11)
d. Growth
Once a precipitate nucleates, its rate of growth in a supersaturated matrix is determined by [13-171:
dr z= (C,, - Crlrrr )
(12)
where the varying concentration field in the matrix is determined by solving the diffusion equation with above moving boundary:
D V2C= E/c%
Now total solute mass conservation requires:
(13)
cs @) = c,v-c,,v,,v, (V-v,q,> (14)
at any instant, where C, (t) is the solute composition in the matrix, V is the total volume considered in the simulation, q is the solute composition in the precipitates, V.,+ is the total volume of precipitates at any instant, Vr is molar volume ratio between matrix and precipitate, and Co is the total solute composition in the alloy.
The solute concentration C!.), at the r/y’ interface for a precipitate with radius r can be determined using the equation:
C 20 v
yIyIIo =C, exp(*) (15)
where R is the gas constant and Vm is precipitate molar volume per atomic site.
The interface kinetics are likely to be rate limiting during the very early stage of growth, since the diffusion distance tends to be negligible. However, diffusion is likely to become dominant, as the precipitates grow larger. For the growth of spherical precipitates, an invariant size approximation solution can be stated as:
where h is a non-dimensional parameter related to growth rate and Q is a saturation index factor. The saturation index factor R
407
describes the level of supersaturation of y’ formers in the matrix, driving both nucleation and growth:
2(C, -G) sz = (C/-C,)
The resulting growth rate relationship is then defined as:
(17)
I Ar = 2 h (D At)“’
where D is estimated as described before, R and h are determined through equations 16 and 17.
e. Coarsening
Particle coarsening is driven by the higher solubility of small particles, which tend to dissolve as solute diffuses to larger particles. The driving potential is provided by the reduction of total interfacial energy while conserving the total volume fraction of precipitates. From coarsening theory (18-23), the general form of precipitate coarsening can be written as:
I I dr 2DC, oV,
(&i)(l+6r) dt=RTr(C,,, -C,) r r (19)
where C, is the equilibrium solute content, and b is correction factor for the case where volume fraction of precipitates is high (19,20). The correction factor b tends to broaden the precipitate size distribution, which is not tracked by the current mean size approximation. So this correction factor was neglected during the coarsening calculation. All other terms in this equation had previously been estimated.
Summarizing, these elements and associated equations were integrated into a computer code that numerically integrates the effect of these relationships as a function of time and tracks mean size as shown in Figure 1. For each time step, the calculation starts by invoking mass conservation (eq. 14) to calculate the supersaturation. Nucleated particles (eq. 6) are then added to the size distribution if sufficient driving force (eq. 4) is present. Precipitates are allowed to grow based on the level of supersaturation (eq. 17) using the growth relationship (eq. 18). The coarsening law (eq. 19) is finally applied to modify the existing particle size distribution through mean size and y’ volume conservation. This did allow small precipitates to dissolve, removing them from the distribution.
Experimental Procedure
The powder metallurgy nickel-base disk superalloy CH98 (24) was selected for evaluation. This alloy has a nominal composition in weight percent of 4A1-0.03B-0.03C-18Co-l2Cr- 4Mo-3.8Ta-4Ti-O.O3Zr-bal. Ni. Alloy powder was atomized, then hot compacted, extruded, and isothermally forged. A variety of heat treatment experiments were first performed on the alloy to help formulate, calibrate, and initially validate the y’ model. Small cube specimens were heated to a variety of temperatures and soaked for a sufficient period of time to
408
determine the equilibrium area fraction of y’ as a function of temperature, in order to calibrate the solvus formulation. Other small specimens were supersolvus solution heat treated, cooled to temperatures below the solvus for short dwells of up to 20 minutes, and then rapid quenched in water to determine the kinetics of y’ formation near the solvus, for the kinetic model. These rapid quenches were accomplished via a drop quench furnace, where a specimen was directly dropped from the hot zone of the furnace into a chamber of water for a transfer time of less than 1 second. Standardized Jominy bar end quench tests and sampling techniques were adapted to establish a uniform and reliable test for the kinetics of y’ formation in rapid quenching conditions. One end of thermocoupled bars 25.4 mm in diameter and 63 mm in length was quenched with water. Sections of the bars were extracted using precision numerical controlled electro-discharge machining and prepared from three locations selected to span the range of cooling rates expected in oil quenched disks. Other small specimens with attached thermocouples were cooled in a programmed furnace to assess slower cooling rates than that achieved in the Jominy bars.
The model was further validated on a generic disk via measuring gamma prime sizes at specific locations where cooling rates were measured by thermocouples. Disks were subsolvus solution heat treated at 1149W2h, and then quenched in oil. Thermocouples were embedded within one disk to gather accurate temperature-time data at selected disk locations during the oil quenching process. Another disk was then heat treated in the same process with no thermocouples attached. Microstructural specimens were excised from bore and rim locations of the second disk.
Specimens evaluated in the SEM were first metallographically polished and then electrolytically etched to leach away the y matrix to expose y’ particles. Specimens evaluated in the TEM were electrochemically thinned. At least two TEM foils were examined from each selected specimen. Multiple weak beam dark field images were consistently taken from near the [OOl] zone axis, selecting grains which required tilting of less than 30”. Precipitate size measurements included major and minor axis widths, equivalent circle (feret) diameter, and several shape parameters. Size-frequency histograms were then generated for primary cooling and tertiary y’ precipitates. Over 100 precipitates were measured to estimate each distribution. Precipitates were then grouped into 3 classes for area fraction measurements by point counting: remnant y’ particles > 1.0 pm in diameter that were not solutioned during subsolvus solution heat treatments, cooling y’ precipitates between 0.05 and 1.0 pm, and tertiary y’ precipitates less than 0.05 urn in diameter.
Results and Discussion
Model Calibration
After formulation, the model had to be initially calibrated with heat treatment experiments. Equilibrium y matrix solubility was determined as part of the kinetic model calibration. Specifically, the solubility curve for the y/y’ pseudo binary system was correlated against values of y’ volume fraction measured at several temperatures up to the solvus temperature. This solubility relationship was used to model y’ solubility for temperatures that ranged from the solvus temperature down to
870 OC. The empirically derived solubility curves were then used to compute the solute supersaturation levels in they matrix. These experiments indicated a y’ solvus of approximately a 12OO’C for CH98.
The objective of the rapid quench coupon tests was to determine the time to onset and resulting fraction of y’ precipitation within the temperature range between the alloy solvus temperature and 80 ‘C below the solvus. All samples water quenched in these tests had a ‘cbackground)) quantity of y’ precipitates less than 0.015 pm in size. These were present even in specimens directly water quenched in less than 1 sec. This indicated that nucleation could not be fully suppressed here in this alloy. Samples quenched before nucleation took place in the near- solvus dwell periods exhibited no coarse y’, whereas samples quenched following nucleation near the solvus had coarse primary y’. Coarse y’ precipitates were observed after 1200 s dwells at 1160°C or lower temperatures, and after 180 s dwells at 1150 “C or lower. The morphology of y’ precipitates formed near these temperatures had a roughly cuboidal morphology, with some dendritic growth of the cube comers. Precipitates aged at lower temperature exhibited a more cuboidal morphology. These observations are consistent with y’ morphological transitions reported in the literature (13). The results of these experiments were then mapped on to a y’ time- temperature-transformation diagram shown in Figure 2 for CH98. These observations are essential to calibrate the nucleation portion of the kinetic model.
The fast acting model contains four additional adjustable kinetic parameters that also required calibration: 9 the nucleation scaling factor S which is assumed to be
temperature independent, ii) the value of the y/y’ interfacial energy cr. iii) the diffusion activation energy Q of y’ former% iv) the diffusivity D for the y’ formers.
1220
1 1 -Model Curve
c - -Solvus
-m-m--
1160
1140 1 10 100 1000 10000
Time (set)
Fig. 2. Time-temperature-transformation data and model curve near the y’ solvus temperature, open symbols indicate no coarse y’was present, solid symbols indicate the presence of coarse y’.
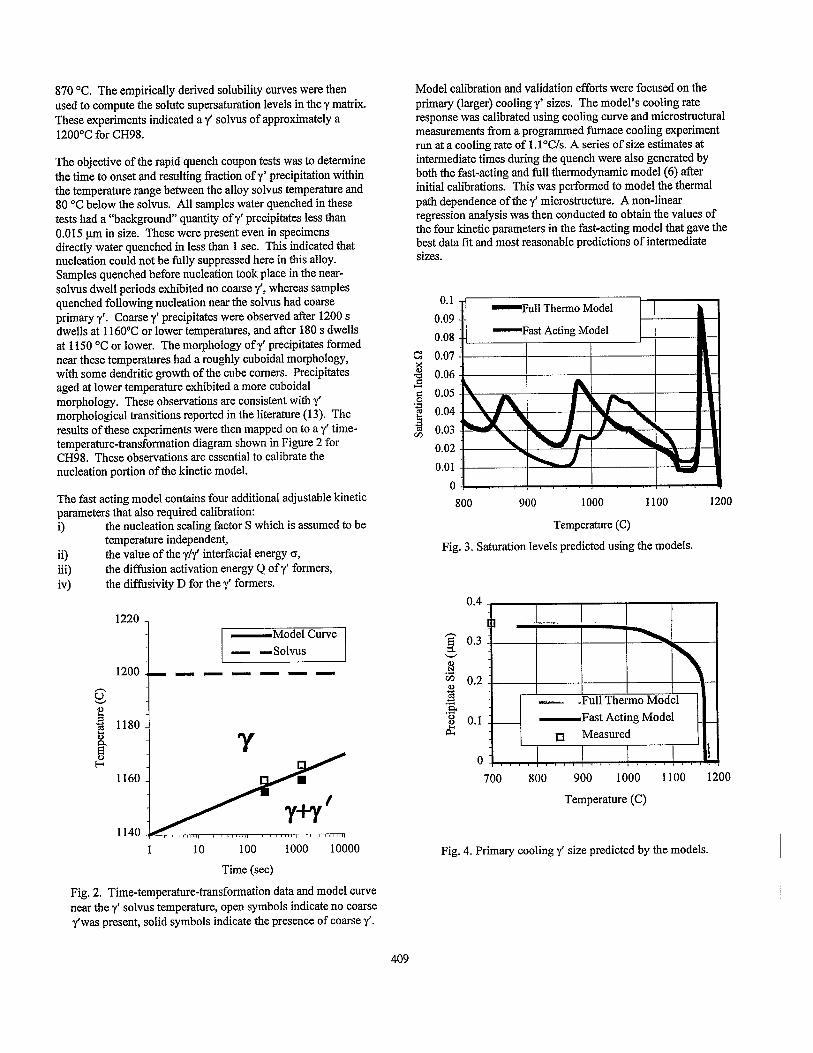
Model calibration and validation efforts were focused on the primary (larger) cooling y’ sizes. The model’s cooling rate response was calibrated using cooling curve and microstructural measurements from a programmed furnace cooling experiment run at a cooling rate of 1 . l”C/s. A series of size estimates at intermediate times during the quench were also generated by both the fast-acting and full thermodynamic model (6) after initial calibrations. This was performed to model the thermal path dependence of they’ microstructure. A non-linear regression analysis was then conducted to obtain the values of the four kinetic parameters in the fast-acting model that gave the best data fit and most reasonable predictions of intermediate sizes.
0.1 0.09 0.08
c 0.07 3 0.06 i 0.05 .g 0.04 j 0.03
Wull Therm0 Model
,I,.
800 900 1000 1100 1200
Temperature (C)
Fig. 3. Saturation levels predicted using the models.
800 900 1000 1100 1200
Temperature (C)
Fig. 4. Primary cooling y’ size predicted by the models.
409
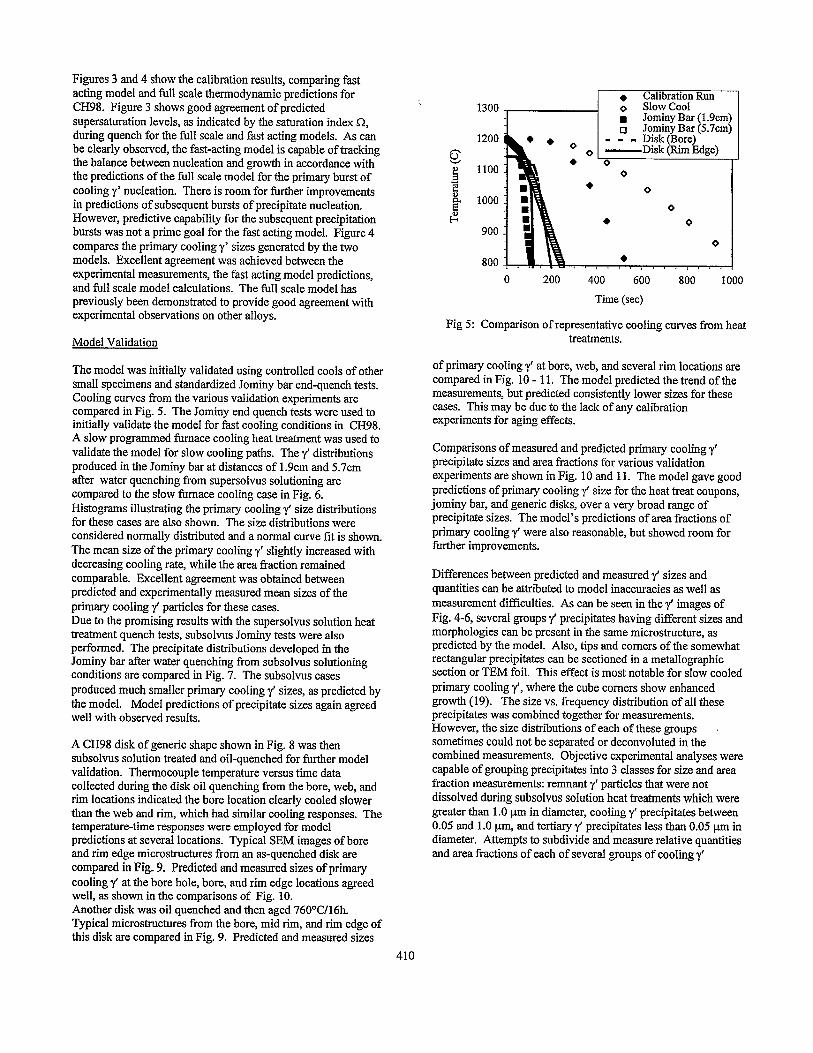
Figures 3 and 4 show the calibration results, comparing fast acting model and full scale thermodynamic predictions for CH98. Figure 3 shows good agreement of predicted supersaturation levels, as indicated by the saturation index Sz, during quench for the full scale and fast acting models. As can be clearly observed, the fast-acting model is capable of tracking the balance between nucleation and growth in accordance with the predictions of the full scale model for the primary burst of cooling y’ nucleation. There is room for further improvements in predictions of subsequent bursts of precipitate nucleation. However, predictive capability for the subsequent precipitation bursts was not a prime goal for the fast acting model. Figure 4 compares the primary cooling y’ sizes generated by the two models. Excellent agreement was achieved between the experimental measurements, the fast acting model predictions, and full scale model calculations. The full scale model has previously been demonstrated to provide good agreement with experimental observations on other alloys.
Model Validation
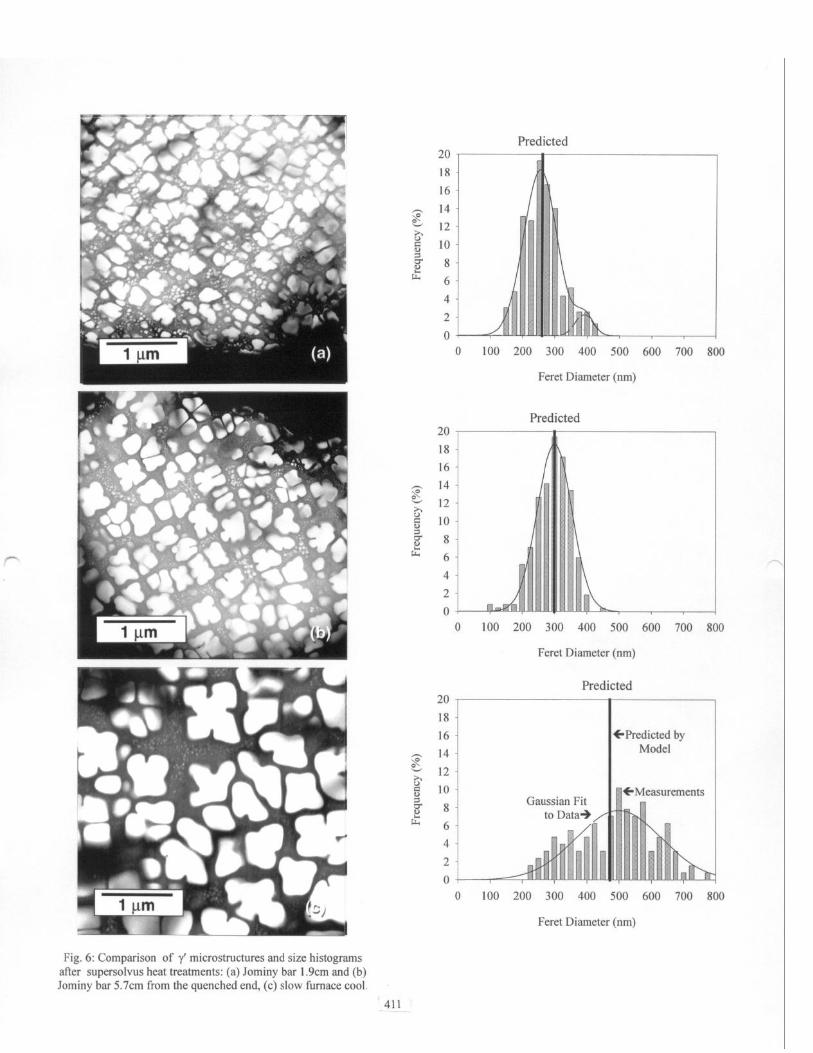
The model was initially validated using controlled cools of other small specimens and standardized Jominy bar end-quench tests. Cooling curves from the various validation experiments are compared in Fig. 5. The Jominy end quench tests were used to initially validate the model for fast cooling conditions in CH98. A slow programmed furnace cooling heat treatment was used to validate the model for slow cooling paths. They’ distributions produced in the Jominy bar at distances of 1.9cm and 5.7cm after water quenching from supersolvus solutioning are compared to the slow furnace cooling case in Fig. 6. Histograms illustrating the primary cooling y’ size distributions for these cases are also shown. The size distributions were considered normally distributed and a normal curve fit is shown. The mean size of the primary cooling y’ slightly increased with decreasing cooling rate, while the area fraction remained comparable. Excellent agreement was obtained between predicted and experimentally measured mean sizes of the primary cooling y’ particles for these cases. Due to the promising results with the supersolvus solution heat treatment quench tests, subsolvus Jominy tests were also performed. The precipitate distributions developed in the Jominy bar after water quenching from subsolvus solutioning conditions are compared in Fig. 7. The subsolvus cases produced much smaller primary cooling y’ sizes, as predicted by the model. Model predictions of precipitate sizes again agreed well with observed results.
A CH98 disk of generic shape shown in Fig. 8 was then subsolvus solution treated and oil-quenched for further model validation. Thermocouple temperature versus time data collected during the disk oil quenching from the bore, web, and rim locations indicated the bore location clearly cooled slower than the web and rim, which had similar cooling responses. The temperature-time responses were employed for model predictions at several locations. Typical SEM images of bore and rim edge microstructures from an as-quenched disk are compared in Fig 9. Predicted and measured sizes of primary cooling y’ at the bore hole, bore, and rim edge locations agreed well, as shown in the comparisons of Fig. 10. Another disk was oil quenched and then aged 760W16h. Typical microstructures from the bore, mid rim, and rim edge of this disk are compared in Fig. 9. Predicted and measured sizes
r l Calibration Run 0 Slow Cool . Jominy Bar (1.9cm) 0 Jominy Bar (5.7cm)
m w - Disk (Bore) -Disk (Rim Edge)
0 200 400 600 800 1000 Time (set)
Fig 5: Comparison of representative cooling curves from heat treatments.
of primary cooling y’ at bore, web, and several rim locations are compared in Fig. 10 - 11. The model predicted the trend of the measurements, but predicted consistently lower sizes for these cases. This may be due to the lack of any calibration experiments for aging effects.
Comparisons of measured and predicted primary cooling y’ precipitate sizes and area fractions for various validation experiments are shown in Fig. 10 and 11. The model gave good predictions of primary cooling y’ size for the heat treat coupons, jominy bar, and generic disks, over a very broad range of precipitate sizes. The model’s predictions of area fractions of primary cooling y’ were also reasonable, but showed room for further improvements.
Differences between predicted and measured y’ sizes and quantities can be attributed to model inaccuracies as well as measurement difficulties. As can be seen in they’ images of Fig. 4-6, several groups y’ precipitates having different sizes and morphologies can be present in the same microstructure, as predicted by the model. Also, tips and comers of the somewhat rectangular precipitates can be sectioned in a metallographic section or TEM foil. This effect is most notable for slow cooled primary cooling y’, where the cube corners show enhanced growth (19). The size vs. frequency distribution of all these precipitates was combined together for measurements. However, the size distributions of each of these groups sometimes could not be separated or deconvoluted in the combined measurements. Objective experimental analyses were capable of grouping precipitates into 3 classes for size and area fraction measurements: remnant y’ particles that were not dissolved during subsolvus solution heat treatments which were greater than 1 .O pm in diameter, cooling y’ precipitates between 0.05 and 1.0 pm, and tertiary y’ precipitates less than 0.05 pm in diameter. Attempts to subdivide and measure relative quantities and area fractions of each of several groups of cooling y’
410
20
18
16
4
2
0
Predicted
J 0 100 200 300 400 500 600 700 800
Feret Diameter (nm)
Predicted
0 100 200 300 400 500 600 700 800
Feret Diameter (nm)
Predicted
I 18
16 *Predicted by Model
In CMeasurements Gaussian Fit R
4 0 100 200 300 400 500 600 700 800
Feret Diameter (nm)
Fig. 6: Comparison of f microstructures and size histograms after supersolvus heat treatments: (a) Jominy bar 1.9cm and (b) Jominy bar 5.7cm from the quenched end, (c) slow furnace cool.
411
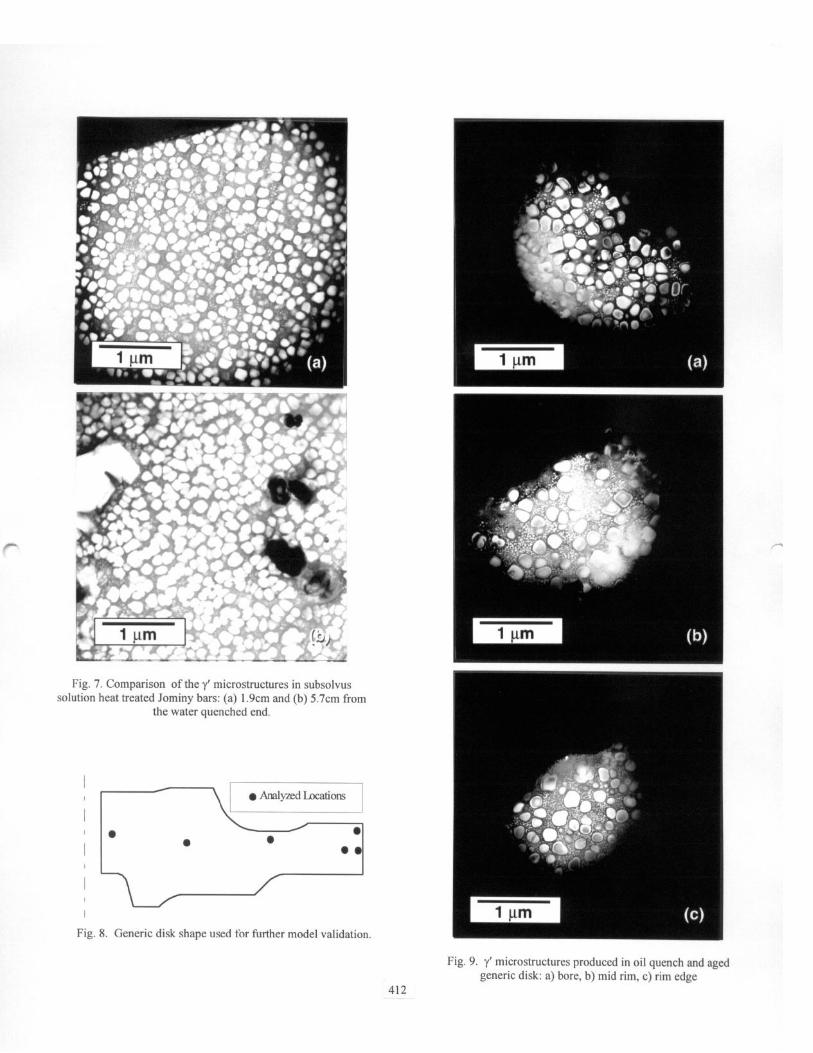
Fig. 7. Comparison of the y’ microstructures in subsolvus solution heat treated Jominy bars: (a) 1.9cm and (b) 5.7cm from
the water quenched end.
Fig. 8. Generic disk shape used for further model validation.
\I .AnalyizdLocations /
412
Fig. 9. y’ microstructures produced in oil quench and aged generic disk: a) bore, b) mid rim, c) rim edge
0 500 300
Predicted Y’ Size (nm)
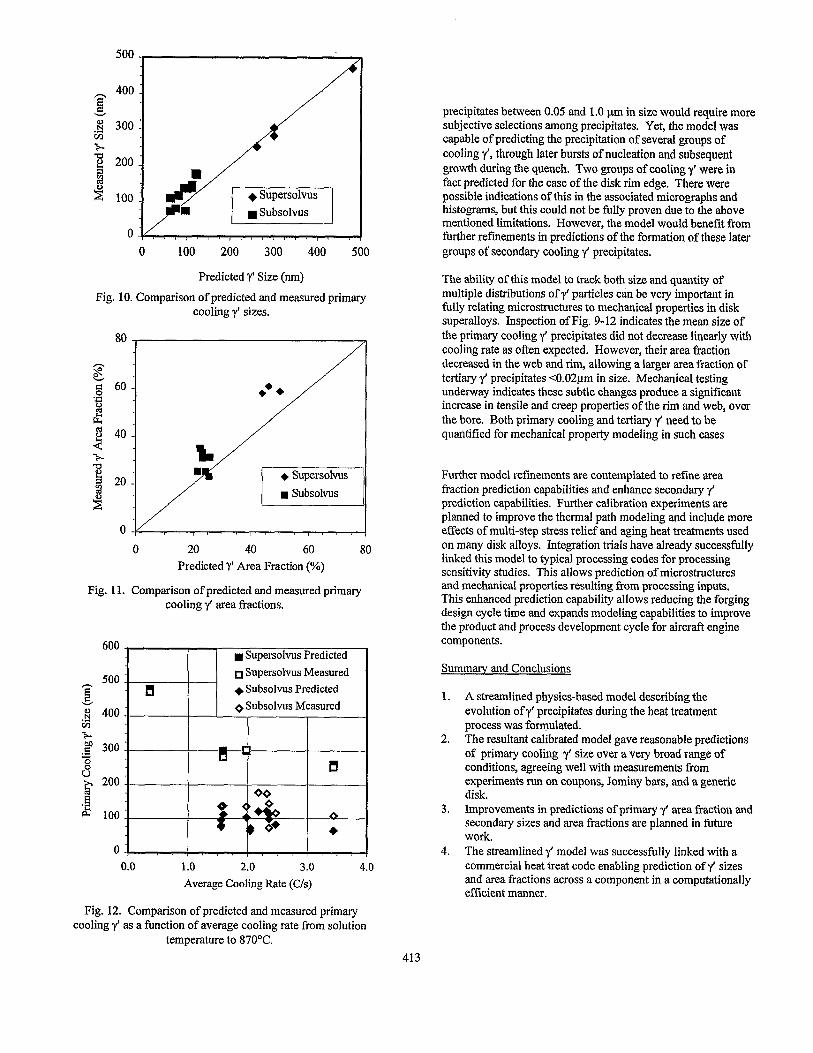
Fig. 10. Comparison of predicted and measured primary cooling y’ sizes.
80 ,
80 Predicted +r Area Fraction (%)
Fig. 11. Comparison of predicted and measured primary cooling y’ area fractions.
600 ( n Supersolvus Predicted
1.0 2.0 3.0 Average Cooling Rate (C/s)
4.0
Fig. 12. Comparison of predicted and measured primary cooling f as a function of average cooling rate from solution
temperature to 870°C.
precipitates between 0.05 and 1 .O pm in size would require more subjective selections among precipitates. Yet, the model was capable of predicting the precipitation of several groups of cooling f, through later bursts of nucleation and subsequent growth during the quench. Two groups of cooling y’ were in fact predicted for the case of the disk rim edge. There were possible indications of this in the associated micrographs and histograms, but this could not be fully proven due to the above mentioned limitations. However, the model would benefit from further refinements in predictions of the formation of these later groups of secondary cooling y’ precipitates.
The ability of this model to track both size and quantity of multiple distributions of y’ particles can be very important in fully relating microstructures to mechanical properties in disk superalloys. Inspection of Fig. 9- 12 indicates the mean size of the primary cooling y’ precipitates did not decrease linearly with cooling rate as often expected. However, their area fraction decreased in the web and rim, allowing a larger area fraction of tertiary y’ precipitates <O.O2ym in size. Mechanical testing underway indicates these subtle changes produce a significant increase in tensile and creep properties of the rim and web, over the bore. Both primary cooling and tertiary y’ need to be quantified for mechanical property modeling in such cases
Further model refinements are contemplated to refine area fraction prediction capabilities and enhance secondary y’ prediction capabilities. Further calibration experiments are planned to improve the thermal path modeling and include more effects of multi-step stress relief and aging heat treatments used on many disk alloys. Integration trials have already successfully linked this model to typical processing codes for processing sensitivity studies. This allows prediction of microstructures and mechanical properties resulting from processing inputs, This enhanced prediction capability allows reducing the forging design cycle time and expands modeling capabilities to improve the product and process development cycle for aircraft engine components.
Summary and Conclusions
1.
2.
3.
4.
413
A streamlined physics-based model describing the evolution of y’ precipitates during the heat treatment process was formulated. The resultant calibrated model gave reasonable predictions of primary cooling y’ size over a very broad range of conditions, agreeing well with measurements from experiments run on coupons, Jominy bars, and a generic disk. Improvements in predictions of primary y’ area fraction and secondary sizes and area fractions are planned in future work. The streamlined y’ model was successfully linked with a commercial heat treat code enabling prediction of y’ sizes and area fractions across a component in a computationally efficient manner.
Acknowledgements This work was sunoorted bv the NASA IDPAT Program,
I.
managed by Douglas Rohn-and John Gayda The authors also wish to acknowledge the work of Howard Merrick, Honeywell Engines and Technologies (Allied-Signal Engine Co.) and Timothy Howson, Wyman-Gordon Forgings Co.
References 1. R. F. Decker, “Strengthening Mechanisms in Nickel-Base
Superalloys”, Steel Strengthening Mechanisms Symposium May 5-6, 1969, Zurich, Switzerland, Climax Molybdenum Co., 1969.
2. N. S. Stoloff, “Fundamentals of Strengthening”, in Superalloys II, ed. C. T. Sims, N. S. Stoloff, W. C. Hagel, John Wiley & Sons, New York, NY, (1987), 61-96.
3. R. A. Wallis, P. R Bhowal, “Property Optimization in Superalloys Through the Use of Heat Treat Process Modeling”, in Superalloys 1988, Proceedings of the International Symposium at Seven Springs Mountain Resort, PA, TMS-AIME, ed. D. N. Duhl, G. Maurer, S. Antolovich, C. Lund, S. Reichman, 1988, 525-534.
4. J. R. Groh, “Effect of Cooling Rate From Solution Heat Treatment on Waspaloy Microstructure and Properties”, in Suuerallovs 1992, Proceedings of the International Symposium at Seven Springs Mountain Resort, PA, TMS- AIMB, ed. R. D. Kissinger, D. .I. Deye, D. L. Anton, A. D. Cetel, M. V. Nathal, T. M. Pollock, D. A. Woodford (1992), 621-626.
5. Schirra, J., in Superallovs 1992, Proceedings of the International Symposium at Seven Springs Mountain Resort, PA, TMS-AIME, ed. R. D. Kissinger, D. J. Deye, D. L. Anton, A. D. Cetel, M. V. Nathal, T. M. Pollock, D. A. Woodford, 1992.
6. D. G. Backman, D. Y. Wei, unpublished research, 1998.
7. P. Gordon, “ Principles of Phase Diagrams in Materials Systems”, in Materials Science and Engineering Series, Published by McGraw-Hill, Inc. (1968), 142-145.
8. P. Haasen and R. Wagner, “High-Resolution Microscopy and Early-Stage Precipitation Kinetics”, Met. Trans. A, 23 (1992), 1901-1914.
9. S. Q. Xiao and P. Hansen, “HREM Investigation of Homogenous Decomposition in a Ni -12 at. % Al Alloy”, Acta Met., 39(4) (1991), 651-659.
10. H. Wendt, and P. Haasen, “Nucleation and Growth of r’- Precipitates in Ni-14 at. % Al”, Acta Met., 3 l(l0) (1983), 1649-1659.
11. H. I. Aaronson and F. K. LeGoues, ” An Assessment of Studies on Homogeneous Diffusional Nucleation Kinetics in Binary Metallic Alloys”, Met. Trans. A, 23 (1992), 1915-1945.
12. W. F. Lange, III. M. Enomoto, and H. I. Aaronson, “Precipitate Nucleation Kinetics at Grain Boundaries”, && Mat. Rev., 34(3) (1989), 125-150.
13. R. ‘A. Ricks, A. J. Porter and R. C. Ecob. “The Growth of-r’ Precipitates in Nickel-Base Superalloy”, Acta Met. , 31 (1983), 43-53.
14. H. I. Aaronson, “Atomic Mechanisms of Diffosional Nucleation and Growth and Comparisons with Their Counterparts in Shear Transformations”, Met. Trans. A, 24 (1993), 241-276.
15. H. I. Aaronson, C. Laird and K. R. Kinsman, in & Transformation, A. S. M. Metals Park, Ohio, and Chapman & Hall, London, p. 3 13.
16. R. D. Doherty, in Physical Metallurgy, edited by R. W. Cahn and P. Haasen, 3rd edition, North Holland, Amsterdam, 1983,934.
17. M. F. Henry, Y. S. Yoo, D. Y. Yoon, and J. Choi, “The Dendrite Growth of y’ Precipitates and Grain Boundary Serration in a Model Nickel-Base Superalloy”, &. Trans. A, 24 (1993), 1733-1743.
18. G. W. Greenwood, “Particle Coarsening”, Acta Met., 4 (1956), 243.
19. C. S. Jayanth and P. Nash, “Review Factors Affecting Particle-Coarsening Kinetics and Size Distribution”, J- Mater. Sci. Engng., 24 (1989), 3041-3052.
20. R. A. MacKay and M. V. Nathal, ” y’ Coarsening in High Volume Fraction Nickel Base Alloys”, Acta Met., 38(6) (1990), 993-1005.
21. E. H. Van Der Molen, J. M. Oblak, and 0. H. Kriege, “Control ofy Particle Size and Volume Fraction in the High Temperature Superalloy Udimet 700”, Met. Trans. A, 2 (1971), 1627-1633.
22. G. I. Rosen, S. F. Direnfeld, M. Barnberger andB. Prinz, “Computer Aided X- Ray Analysis for Determining Growth Kinetics of r’ Phase in Nickel-based Wrought Superalloy?, High Temp. Mater. and Proc., 12(4) (1993), 183-191.
23. P. W. Voorees, “Ostward Ripening of Two-Phase Mixture”, Annu. Rev. Mater. Sci., 1992, 197-215.
24. K.-M. Chang, U.S. Patent 5,662,749
25. M. L. Macia, T. H. Sanders, Jr., “A Study on the Dendritic Growth of Gamma Prime in Astroloy”, Proc. of the 2nd Int. Conf. On Heat-Resistant Materisls, Gatlingberg, TN, Sept. 11-14, 1995, 163-170.
414
Related Documents