GAMBLING AND PROBLEM GAMBLING IN SWEDEN Report No. 2 of the National Institute of Public Health Series on Gambling Sten Rönnberg Rachel A. Volberg Max W. Abbott W. Lamar Moore Anders Andrén Ingrid Munck Jakob Jonsson Thomas Nilsson Ove Svensson Members of the International Gambling Research Team of Sweden May 25, 1999

Welcome message from author
This document is posted to help you gain knowledge. Please leave a comment to let me know what you think about it! Share it to your friends and learn new things together.
Transcript
GAMBLING AND PROBLEM GAMBLING IN SWEDEN
Report No. 2 of the National Institute of Public Health
Series on Gambling
Sten Rönnberg Rachel A. Volberg
Max W. Abbott W. Lamar Moore Anders Andrén Ingrid Munck
Jakob Jonsson Thomas Nilsson Ove Svensson
Members of the
International Gambling Research Team of Sweden
May 25, 1999

Gambling and Problem Gambling in Sweden
i
PREFACE
Gambling and Problem Gambling in Sweden
ii
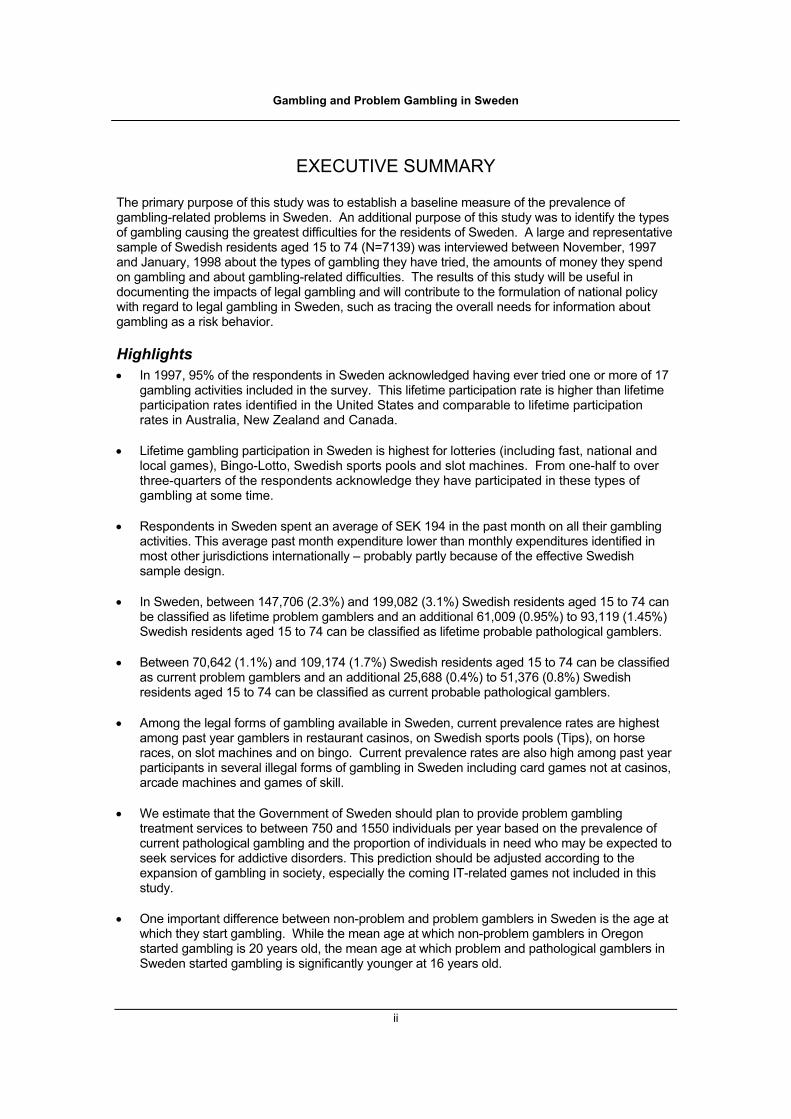
EXECUTIVE SUMMARY The primary purpose of this study was to establish a baseline measure of the prevalence of gambling-related problems in Sweden. An additional purpose of this study was to identify the types of gambling causing the greatest difficulties for the residents of Sweden. A large and representative sample of Swedish residents aged 15 to 74 (N=7139) was interviewed between November, 1997 and January, 1998 about the types of gambling they have tried, the amounts of money they spend on gambling and about gambling-related difficulties. The results of this study will be useful in documenting the impacts of legal gambling and will contribute to the formulation of national policy with regard to legal gambling in Sweden, such as tracing the overall needs for information about gambling as a risk behavior.
Highlights • In 1997, 95% of the respondents in Sweden acknowledged having ever tried one or more of 17
gambling activities included in the survey. This lifetime participation rate is higher than lifetime participation rates identified in the United States and comparable to lifetime participation rates in Australia, New Zealand and Canada.
• Lifetime gambling participation in Sweden is highest for lotteries (including fast, national and
local games), Bingo-Lotto, Swedish sports pools and slot machines. From one-half to over three-quarters of the respondents acknowledge they have participated in these types of gambling at some time.
• Respondents in Sweden spent an average of SEK 194 in the past month on all their gambling
activities. This average past month expenditure lower than monthly expenditures identified in most other jurisdictions internationally – probably partly because of the effective Swedish sample design.
• In Sweden, between 147,706 (2.3%) and 199,082 (3.1%) Swedish residents aged 15 to 74 can
be classified as lifetime problem gamblers and an additional 61,009 (0.95%) to 93,119 (1.45%) Swedish residents aged 15 to 74 can be classified as lifetime probable pathological gamblers.
• Between 70,642 (1.1%) and 109,174 (1.7%) Swedish residents aged 15 to 74 can be classified
as current problem gamblers and an additional 25,688 (0.4%) to 51,376 (0.8%) Swedish residents aged 15 to 74 can be classified as current probable pathological gamblers.
• Among the legal forms of gambling available in Sweden, current prevalence rates are highest
among past year gamblers in restaurant casinos, on Swedish sports pools (Tips), on horse races, on slot machines and on bingo. Current prevalence rates are also high among past year participants in several illegal forms of gambling in Sweden including card games not at casinos, arcade machines and games of skill.
• We estimate that the Government of Sweden should plan to provide problem gambling
treatment services to between 750 and 1550 individuals per year based on the prevalence of current pathological gambling and the proportion of individuals in need who may be expected to seek services for addictive disorders. This prediction should be adjusted according to the expansion of gambling in society, especially the coming IT-related games not included in this study.
• One important difference between non-problem and problem gamblers in Sweden is the age at
which they start gambling. While the mean age at which non-problem gamblers in Oregon started gambling is 20 years old, the mean age at which problem and pathological gamblers in Sweden started gambling is significantly younger at 16 years old.
Gambling and Problem Gambling in Sweden
iii
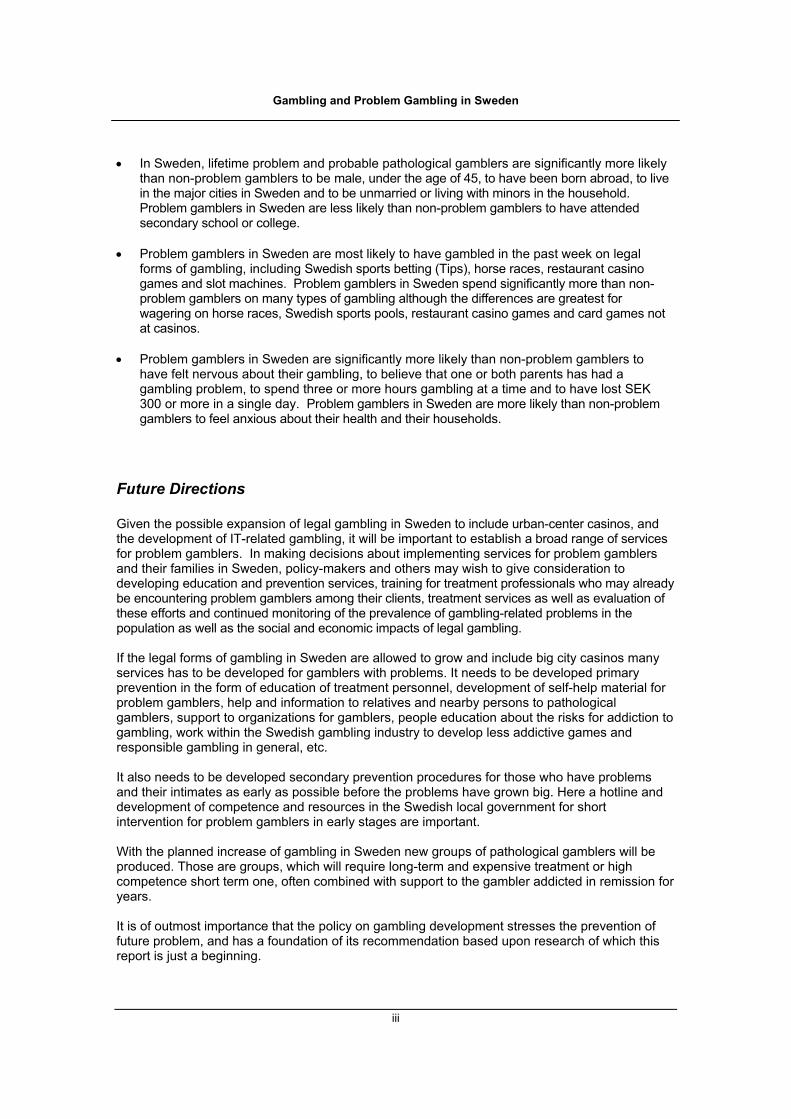
• In Sweden, lifetime problem and probable pathological gamblers are significantly more likely
than non-problem gamblers to be male, under the age of 45, to have been born abroad, to live in the major cities in Sweden and to be unmarried or living with minors in the household. Problem gamblers in Sweden are less likely than non-problem gamblers to have attended secondary school or college.
• Problem gamblers in Sweden are most likely to have gambled in the past week on legal
forms of gambling, including Swedish sports betting (Tips), horse races, restaurant casino games and slot machines. Problem gamblers in Sweden spend significantly more than non-problem gamblers on many types of gambling although the differences are greatest for wagering on horse races, Swedish sports pools, restaurant casino games and card games not at casinos.
• Problem gamblers in Sweden are significantly more likely than non-problem gamblers to
have felt nervous about their gambling, to believe that one or both parents has had a gambling problem, to spend three or more hours gambling at a time and to have lost SEK 300 or more in a single day. Problem gamblers in Sweden are more likely than non-problem gamblers to feel anxious about their health and their households.
Future Directions Given the possible expansion of legal gambling in Sweden to include urban-center casinos, and the development of IT-related gambling, it will be important to establish a broad range of services for problem gamblers. In making decisions about implementing services for problem gamblers and their families in Sweden, policy-makers and others may wish to give consideration to developing education and prevention services, training for treatment professionals who may already be encountering problem gamblers among their clients, treatment services as well as evaluation of these efforts and continued monitoring of the prevalence of gambling-related problems in the population as well as the social and economic impacts of legal gambling. If the legal forms of gambling in Sweden are allowed to grow and include big city casinos many services has to be developed for gamblers with problems. It needs to be developed primary prevention in the form of education of treatment personnel, development of self-help material for problem gamblers, help and information to relatives and nearby persons to pathological gamblers, support to organizations for gamblers, people education about the risks for addiction to gambling, work within the Swedish gambling industry to develop less addictive games and responsible gambling in general, etc. It also needs to be developed secondary prevention procedures for those who have problems and their intimates as early as possible before the problems have grown big. Here a hotline and development of competence and resources in the Swedish local government for short intervention for problem gamblers in early stages are important. With the planned increase of gambling in Sweden new groups of pathological gamblers will be produced. Those are groups, which will require long-term and expensive treatment or high competence short term one, often combined with support to the gambler addicted in remission for years. It is of outmost importance that the policy on gambling development stresses the prevention of future problem, and has a foundation of its recommendation based upon research of which this report is just a beginning.

Gambling and Problem Gambling in Sweden
iv
Sammanfattning på svenska Det viktigaste syftet med den här studien var att ta reda på omfattningen av spelrelaterade problem i Sverige och därmed ge en grund för fortsatta undersökningar om utvecklingen av problemen i framtiden i vårt land. Ett annat mål var att identifiera de slags spel som medför de största problemen. Ett slumpmässigt urval av personer boende i Sverige och i åldern 15-74 år (urvalet var 9 917 personer, 7139 personer, dvs. 72%, svarade), intervjuades mellan november 1997 och februari 1998 om vilka slags spel de hade spelat, de pengar de hade gett ut på spel och vilka spelrelaterade problem de hade upplevt. Resultaten av studien är viktiga för att dokumentera de effekter spelandet i Sverige medför och studien utgör ett viktigt underlag för framtida undersökningar liksom politik på spelområdet i Sverige. Den nu pågående andra delen av studien som består av djupintervjuer med ett stort urval spelare med problem och en lika stor slumpmässigt uttagen grupp från de allmänna befolkningen kan väntas ytterligare belysa de i denna undersökning resta frågorna. Denna del av undersökningen beräknas kunna presenteras under senare delen av detta år. Några huvudresultat • 95% av befolkningen uppgav sig någon gång ha satsat pengar på spel. Det här höga
deltagandet i någon form av spel är högre än det man funnit i motsvarande studier i USA, men är jämförbart med de höga tal för att någon gång har prövat att spela som kommit fram i undersökningar från Australien, Nya Zealand och Kanada. Vi är alltså pigga på att pröva spela i Sverige
. • Mest har man prövat på att köpa. De spel flest svenskar någon gång spelat är lotter av olika
slag (skraplotter, penninglotter, lokala lotteriers, bingo-lotto, etc.), tips eller att spela på spelautomater (varuspelsautomater, värdeautomatspel, t. ex. Jack Vegas, förströelsespel). Från hälften till över tre fjärdedelar av befolkningen har prövat på något av den sortens spel någon gång i sitt liv.
• I medeltal uppgav de svarande att de satsat 194 kronor under den senaste månaden på sitt
spelande. Detta medeltal av satsade pengar under en månad är lägre än det som man funnit i de flesta liknande undersökningar i de andra länder där sådana undersökningar har gjorts. Vi är alltså pigga på att pröva, men vi är också försiktiga med våra utlägg, skulle man kanske kunna sammanfatta resultaten om hur vi spenderar pengar på spel.
• Mellan 147.706 (2,3%) och 199.082 (3,1%) personer 15-74 år boende i Sverige 1997 kan
klassificeras som ha varit problemspelare någon gång i sitt liv. Ytterligare mellan 61.009 (0,95%) och 93.119 (1,45%) av personer 15-74 år kan klassificeras som att ha varit sannolika patologiska spelare någon gång i sitt liv.
• Mellan 70.642 (1,1%) och 109.174 (1,7%) personer 15-74 år som bodde i Sverige 1997 kan
klassificeras som akuta problemspelare och ytterligare mellan 25.688 (0,4%) och 51.376 (0,8%) kan klassas som troliga patologiska spelare.
• I de lagliga fomerna av spel så är den akutuella prevalensen av spelproblem högst bland
dem som spelat under det senaste året på restaurangkasinon, tips, hästar, automatspel eller bingo. Spelproblem är också vanliga i flera slag av illegala spel, däribland kortspel (utanför restaurangkasinon), förströelsespel och olika skicklighetsspel.
Gambling and Problem Gambling in Sweden
v
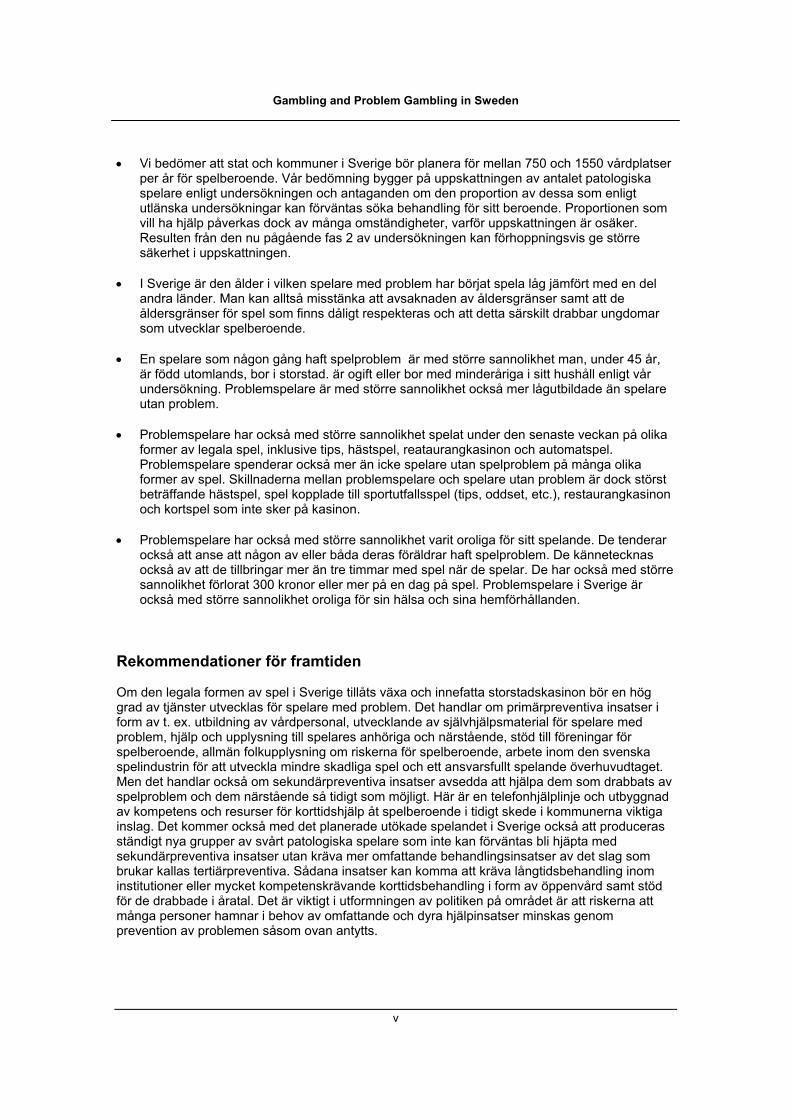
• Vi bedömer att stat och kommuner i Sverige bör planera för mellan 750 och 1550 vårdplatser
per år för spelberoende. Vår bedömning bygger på uppskattningen av antalet patologiska spelare enligt undersökningen och antaganden om den proportion av dessa som enligt utlänska undersökningar kan förväntas söka behandling för sitt beroende. Proportionen som vill ha hjälp påverkas dock av många omständigheter, varför uppskattningen är osäker. Resulten från den nu pågående fas 2 av undersökningen kan förhoppningsvis ge större säkerhet i uppskattningen.
• I Sverige är den ålder i vilken spelare med problem har börjat spela låg jämfört med en del
andra länder. Man kan alltså misstänka att avsaknaden av åldersgränser samt att de åldersgränser för spel som finns dåligt respekteras och att detta särskilt drabbar ungdomar som utvecklar spelberoende.
• En spelare som någon gång haft spelproblem är med större sannolikhet man, under 45 år,
är född utomlands, bor i storstad. är ogift eller bor med minderåriga i sitt hushåll enligt vår undersökning. Problemspelare är med större sannolikhet också mer lågutbildade än spelare utan problem.
• Problemspelare har också med större sannolikhet spelat under den senaste veckan på olika
former av legala spel, inklusive tips, hästspel, reataurangkasinon och automatspel. Problemspelare spenderar också mer än icke spelare utan spelproblem på många olika former av spel. Skillnaderna mellan problemspelare och spelare utan problem är dock störst beträffande hästspel, spel kopplade till sportutfallsspel (tips, oddset, etc.), restaurangkasinon och kortspel som inte sker på kasinon.
• Problemspelare har också med större sannolikhet varit oroliga för sitt spelande. De tenderar
också att anse att någon av eller båda deras föräldrar haft spelproblem. De kännetecknas också av att de tillbringar mer än tre timmar med spel när de spelar. De har också med större sannolikhet förlorat 300 kronor eller mer på en dag på spel. Problemspelare i Sverige är också med större sannolikhet oroliga för sin hälsa och sina hemförhållanden.
Rekommendationer för framtiden Om den legala formen av spel i Sverige tillåts växa och innefatta storstadskasinon bör en hög grad av tjänster utvecklas för spelare med problem. Det handlar om primärpreventiva insatser i form av t. ex. utbildning av vårdpersonal, utvecklande av självhjälpsmaterial för spelare med problem, hjälp och upplysning till spelares anhöriga och närstående, stöd till föreningar för spelberoende, allmän folkupplysning om riskerna för spelberoende, arbete inom den svenska spelindustrin för att utveckla mindre skadliga spel och ett ansvarsfullt spelande överhuvudtaget. Men det handlar också om sekundärpreventiva insatser avsedda att hjälpa dem som drabbats av spelproblem och dem närstående så tidigt som möjligt. Här är en telefonhjälplinje och utbyggnad av kompetens och resurser för korttidshjälp åt spelberoende i tidigt skede i kommunerna viktiga inslag. Det kommer också med det planerade utökade spelandet i Sverige också att produceras ständigt nya grupper av svårt patologiska spelare som inte kan förväntas bli hjäpta med sekundärpreventiva insatser utan kräva mer omfattande behandlingsinsatser av det slag som brukar kallas tertiärpreventiva. Sådana insatser kan komma att kräva långtidsbehandling inom institutioner eller mycket kompetenskrävande korttidsbehandling i form av öppenvård samt stöd för de drabbade i åratal. Det är viktigt i utformningen av politiken på området är att riskerna att många personer hamnar i behov av omfattande och dyra hjälpinsatser minskas genom prevention av problemen såsom ovan antytts.
Gambling and Problem Gambling in Sweden
vi
TABLE OF CONTENTS
PREFACE.......................................................................................................................................... i EXECUTIVE SUMMARY ............................................................................................................... ..ii SAMMANFATTNING PÅ SVENSKA .............................................................................................iv TABLE OF CONTENTS...................................................................................................................vi ACKNOWLEDGEMENTS................................................................................................................ ix PROJECT ORGANIZATION AND MANAGEMENT.........................................................................x INTRODUCTION ..............................................................................................................................1
Background...................................................................................................................................1 The International Context...............................................................................................................3 The Evolution of Gambling in Sweden...........................................................................................5 Emerging Trends and Technologies..............................................................................................7
Defining Our Terms.....................................................................................................................10 Measuring Gambling problems...................................................................................................12 METHODS......................................................................................................................................15
Pilot Study ...................................................................................................................................15 Questionnaire..............................................................................................................................16 Sample Design............................................................................................................................17 Response Rate and Non-Response...........................................................................................17 Balancing the Sample vs. the Population ..................................................................................18 Preparation for Analysis and Reporting.......................................................................................19
GAMBLING IN SWEDEN ...............................................................................................................21
Gambling in the General Population...........................................................................................22 Patterns of Gambling Participation .............................................................................................24 Expenditures on Gambling .........................................................................................................24 Gambling Preferences ................................................................................................................27
PROBLEM AND PATHOLOGICAL GAMBLING IN SWEDEN.......................................................29
Prevalence Rates........................................................................................................................29 Statistical Characteristics of the SOGS-R ..................................................................................32 Natural Recovery ........................................................................................................................35 Comparing Problem Gambling Prevalence Across Jurisdictions ...............................................35
COMPARING NON-PROBLEM AND PROBLEM GAMBLERS IN SWEDEN ...............................38
Demographics.............................................................................................................................38 Past Week Gambling ..................................................................................................................39 Expenditures ...............................................................................................................................41 Prevalence and Types of Gambling............................................................................................41 Other Significant Differences ......................................................................................................42
GENDER, GAMBLING AND PROBLEM GAMBLING IN SWEDEN ..............................................45
Demographics.............................................................................................................................45

Gambling and Problem Gambling in Sweden
vii
Gambling and Gender.................................................................................................................45 Gambling Problems and Gender ................................................................................................47
YOUTH GAMBLING AND PROBLEM GAMBLING IN SWEDEN..................................................49
Gambling Among Youth..............................................................................................................50 Gambling Problems Among Youth .............................................................................................51 Comparing Non-Problem and Problem Gamblers Among Youth...............................................52

Gambling and Problem Gambling in Sweden
viii
GAMBLING AND PROBLEM GAMBLING AMONG NON-SWEDISH BORN RESPONDENTS ...54 Gambling Involvement ................................................................................................................55 Gambling Problems Among Non-Swedish-born Respondents ..................................................56 Comparing Non-Swedish-born Non-Problem and Problem Gamblers.......................................57
COMPARING THE SOGS-R AND THE DSM-IV IN SWEDEN......................................................59
The Swedish Survey ...................................................................................................................60 The Fisher DSM-IV Screen.........................................................................................................60 Statistical Characteristics of the Fisher DSM-IV Screen ............................................................62 Comparing the SOGS-R and DSM-IV Problem Gamblers .........................................................66
RISK ANALYSIS FOR PROBLEM OR PATHOLOGICAL GAMBLING BEHAVIOR.......................68 Statistical modeling......................................................................................................................68 Results from Logit-modeling....................................................................................................... 71 Further Analysis and Design for Follow-up .................................................................................73 Conclusions.................................................................................................................................74 SUMMARY AND CONCLUSION ...................................................................................................77
Summary.....................................................................................................................................75 Directions for the Future .............................................................................................................79
REFERENCES ..............................................................................................................................81
APPENDIX A: List of Tables and Figures...................................................................................A-1
APPENDIX B. Methods to Assess Problem Gambling in the General Population........................A-
4
APPENDIX C: Questionnaire for the Swedish Pathological Gambling Prevalence Study.............A-8
Gambling and Problem Gambling in Sweden
ix
ACKNOWLEDGEMENTS This project is the product of the joint efforts of many individuals concerned with gambling and problem gambling in Sweden and internationally. While the names of the members of the research team appear on the title page, we would like to extend our appreciation and gratitude to a number of other individuals and organizations. The overall scheme for this project was first outlined in 1996 in a proposal by Sten Rönnberg, Max Abbott and Rachel Volberg. Due to the foresight of Henrik Berggren and others at the Ministry of Finance and then Sören Kindlund and his colleagues at the Ministry of Health and Social Affairs, the project received financial support beginning in 1997. We are grateful that their concern for Swedish citizens led these individuals to give us the opportunity to investigate the issues of gambling and problem gambling in Sweden. The moral and practical support of the National Gaming Board (Lotteriinspektionen) through Lars Högdahl, Gunnar Lundström and Camilla Petterson has been of great help to the project. The National Institute of Public Health (Folkhälsoinstitutet) has been very supportive from the beginning of this project through Anneli Kastrup, Marie Montin and Agneta Dreber. As a Member of Parliament, Barbro Westerholm has helped and supported the project many times over its course. Data collection was carried out by Statistics Sweden (SCB) at Örebro. Alf Asplund, our contact person, was helpful every step of the way. Employees at Statistics Sweden, including Gunnar Ehrenborg, Sixten Lundström, Håkan Lööv and Lars Jonsson, worked hard on the project at different times. Without their help, this report and those that follow would not have been possible. All of the interviewers at Statistics Sweden deserve our deepest thanks as well. Finally, we have had the good fortune to enjoy a long honeymoon and supportive interest from the mass media in Sweden for this project. We are grateful for their patience as we worked to produce this report and those that follow. Above all, we want to thank the people who answered all of our questions on the telephone or in our postal questionnaires. Your willingness to share this information with us is, of course, the most important debt that we owe. We hope you will appreciate our presentation of the data that you helped us gather.
Gambling and Problem Gambling in Sweden
x
PROJECT ORGANIZATION AND MANAGEMENT The inspiration for this study came from the New Zealand Gambling Prevalence Study of 1991-1992 (Abbott & Volberg 1991, 1992, 1996, Volberg & Abbott 1994). As a guest professor at the Department of Social Work, University of Canterbury at Christchurch, in New Zealand in 1995, Sten Rönnberg came in contact with Dr. Max Abbott and learned about this effort. Working with Dr. Abbott and Dr. Rachel Volberg in the United States, Dr. Rönnberg developed a proposal for a similar project to be carried out in Sweden. This proposal was submitted to the Ministry of Finance in 1996. In April, 1997, the Ministry of Health and Social Affairs provided funds for a pilot study to test whether the approach used in New Zealand was feasible in Sweden. The pilot study was successfully completed in the fall of 1997 and funds were provided for the main study which began in November, 1997. Support and administrative help were provided from the beginning by the National Institute of Public Health. Epidemiological surveys of gambling and problem gambling have become an essential component in the establishment and monitoring of gaming initiatives in Australia, Canada, New Zealand and the United States (Volberg & Dickerson 1996). The Swedish Pathological Gambling Prevalence Study, carried out by the International Gambling Research Team of Sweden in cooperation with Statistics Sweden, maintained continuity with international studies by using a similar questionnaire and data collection methods in the first phase of the project. This project also moves the field of problem gambling research forward. The use of a two-phase design will provide new information on the validity and reliability of the most widely-used screen for problem gambling and permit the testing of hypotheses about the relationship between problem gambling and other addictive disorders. The unique opportunity in Sweden to match data collected in interviews with “registerdata” permits the research team to examine the relationship between problem gambling careers, work history and health status.
International Gambling Research Team of Sweden The group of people working on this project organized itself under the title “International Gambling Research Team of Sweden.” This group consists of a primary team of three senior researchers and a secondary team of clinical psychologists and social workers. The team includes several other members with responsibilities for limited elements in the project. The primary team includes Dr. Sten Rönnberg, Dr. Max Abbott and Dr. Rachel Volberg. The primary team is responsible for the management of the project, for analysis of the data and for dissemination of the results to a variety of audiences. The secondary team includes Anders Andrén, Jakob Jonsson, Thomas Nilsson and Ove Svensson. The secondary team is responsible for conducting interviews with the Phase Two respondents, for assisting with data analysis and for assisting with preparation of the Phase Two report. Partners in the project include Statistics Sweden (SCB) as well as the consulting statistician, Dr. Ingrid Munck. Statistics Sweden was responsible for data collection for Phase One of the study as well as the statistical quality of the survey process. Dr. Munck worked to prepare data for analysis and to carry out multivariate analyses of the Phase One data. W. Lamar Moore, Director of Research at Gemini Research, Ltd., worked with Dr. Volberg to analyze data from Phase One of the project and to draft this report.
The Swedish Pathological Gambling Prevalence Study Although earlier American surveys established a solid foundation for prevalence research on problem gambling, there are now improved methods that promise more reliable identification of problem and pathological gamblers in the general population as well as more detailed information
Gambling and Problem Gambling in Sweden
xi
about the development of gambling-related difficulties. While the two-stage design adopted for the Swedish Pathological Gambling Prevalence Study was originally proposed by Dickerson and his colleagues in Australia (Dickerson 1993), the only other jurisdiction where this approach has been fully implemented is New Zealand (Abbott & Volberg 1996). In Sweden, we had the unique opportunity to include a plethora of external data (“registerdata”) that can be used to make up an effective sample design and to validate and triangulate the data gathered in interviews. The first phase of this two-stage approach consisted of a survey in the general population to obtain information about gambling activities, gambling-related problems and the demographic characteristics of individuals experiencing gambling-related difficulties. The primary goal of Phase One of this project was to examine the extent of gambling and gambling-related problems among adolescents and adults in Sweden. Specific aims of this phase of the project included:
• comparing the current participation of the general population in various types of gambling; • providing a baseline measure of problem gambling prevalence to enable assessments of
future changes in gambling involvement and gambling-related difficulties; • determining the prevalence of problem and pathological gambling in major
sociodemographic categories in Sweden;
• comparing the prevalence of problem and pathological gambling in Sweden with similar studies conducted internationally; and
• identifying sociodemographic and other factors that discriminate between pathological
gamblers and the general population. The second phase of the project consists of in-depth interviews with a subset of respondents from the first phase. Specific aims of the second phase of this project included:
• validation of the two problem gambling screens used in general population surveys internationally;
• testing hypotheses about differences between non-problem and problem gamblers in the
community; • assessing the degree of co-morbidity between pathological gambling and other forms of
psychopathology; • describing the developmental history of gambling problems; • examining the impacts of pathological gambling on family relationships, financial status and
workforce participation; • providing a baseline to assess future changes in help-seeking and treatment participation
by problem and pathological gamblers; and • providing information to assist public policy decisions about the legalization and promotion
of new forms of gambling as well as the provision of services for problem and pathological gamblers.
If the Swedish Pathological Gambling Prevalence Study continues as planned, it will be possible to conduct for the first time internationally a third phase. Phase Three would include an assessment of the effectiveness of a minimal treatment intervention. The major aim of Phase Three would be to determine whether a brief intervention including the provision of information on gambling and self-
Gambling and Problem Gambling in Sweden
xii
help manuals to people identified as problem gamblers is effective in reducing gambling and gambling-related problems. Research in a number of countries indicates that although teenagers generally gamble less frequently and have lower levels of expenditure than adults, they usually have higher problem gambling prevalence rates (Abbott, Volberg, Baines & Taylor 1999). However, very little is known about why rates are higher in this group, to what extent youth gambling problems persist into adult life, or whether they are linked to alcohol and drug misuse and other risk taking behavior common during adolescence. Many countries are ethnically diverse. This diversity is increasing in many parts of the world as a consequence of escalating flows of migrants, refugees and asylum seekers. With respect to mental disorders, relationships between morbidity and migrant or refugee status are complex (Abbott 1997). Neither status can be considered to be unitary. While there are often subgroups within refugee or migrant groups that are at very high risk for particular disorders, overall, prevalence rates may be similar to those of the general population. There are anecdotal accounts of high levels of gambling problems among some migrant and refugee communities but very little empirical information on the topic. Very high prevalence rates have also been found among some indigenous ethnic minority groups (Abbott, Volberg, Baines & Taylor 1999; Volberg & Abbott 1997). It is unclear what the major determinants of problem gambling are among some these groups. It is likely that cultural differences, patterns of gambling participation and various sociodemographic risk factors all play a part. The sample sizes of most national or regional problem and pathological gambling prevalence surveys have been too small to allow meaningful analysis of youth, migrant and ethnic minority groups. The present study includes boosted samples of youth and immigrants to facilitate examination of gambling participation and problem gambling within these high-risk groups.
Gambling and Problem Gambling in Sweden
1
INTRODUCTION Until recently, throughout the world, the legalization of gambling has proceeded apace with little consideration of the potentially negative impacts that gambling can have on individuals, families and communities (Volberg & Dickerson 1996). With the rapid expansion of legal gambling in the 1980s and 1990s, governments began to establish services for individuals with gambling problems. In establishing these services, policy makers and program planners quickly sought answers to questions about the number of “pathological gamblers” in the general population who might seek help for their difficulties. These questions required epidemiological research to identify the number (or “cases”) of pathological gamblers, ascertain the demographic characteristics of these individuals, and determine the likelihood that they would utilize treatment services if these became available. In the late 1990s, the issues surrounding legal gambling have become far more complex. Policy makers, gambling regulators and gaming operators are concerned about the likely impacts of changing mixes of legal gambling on the gambling behavior of broad segments of the population as well as on the prevalence of gambling-related difficulties. Public health researchers and social scientists are concerned with minimizing the risks of legal gambling to particular subgroups in the population. Economists, financial institutions and law enforcement professionals are concerned about the relationship between legal gambling and bankruptcies, gambling and crime, and the reliance of the gaming industries on problem gamblers for revenues. Treatment professionals, government agencies and not-for-profit organizations are concerned about how to allocate scarce resources for the prevention and treatment of gambling problems (Volberg 1998). This report describes the results of Phase One of the Swedish Pathological Gambling Prevalence Study. This report is organized into several sections for clarity of presentation. The Introduction includes a definition of the terms used in the report while the Methods section addresses some of the details of conducting the survey. The next sections detail findings from the survey in the following areas:
• gambling in Sweden
• prevalence of problem gambling in Sweden
• comparing non-problem and problem gamblers in Sweden
• gambling, problem gambling and gender in Sweden
• gambling and problem gambling among youth in Sweden
• gambling and problem gambling among the non-Swedish-born
• comparing two measures of problem gambling
The report concludes with a summary and a review of the activities that governments have undertaken in response to the issue of problem gambling elsewhere in the world.
Background Historical Background
Gambling and Problem Gambling in Sweden
2
Gambling is an ancient form of recreation. There is archaeological and historical evidence of gambling activities in many ancient civilizations throughout the world. It would appear from these accounts that gambling practices arose independently in a number of different societies. There are also documentation and indications of gambling practices and having spread widely across cultural and geographic boundaries (Abbott, Volberg, Baines & Taylor 1999). Attitudes towards gambling and the degree of control exercised by state and other authorities over it have varied markedly throughout history. Many countries appear to have passed through alternating phases of liberalization and restriction. There is an interesting example provided by Carpenter (1988) of state regulation of gambling in Spain during the Thirteenth Century. The intent of this regulation was to reduce disruption to the social order and ensure that the crown secured a portion of gambling revenue. Other than in most Islamic states, during the past two decades gambling has rapidly proliferated globally. As in earlier historical periods of expansion, there are indications of growing public and political concern regarding perceived and actual adverse social impacts and calls for tighter regulation. Although the first mention of problem gambling did not appear in the professional mental health literature until early this century, there are many references from earlier times to personal and social problems associated with excessive gambling (Wildman 1998). As implied above, recognition that gambling was associated with a variety of adverse impacts appears to have played a significant part in past attempts to prohibit or regulate gambling activities. Until relatively recently, problematic gambling was widely perceived as a character flaw or moral vice rather than a mental disorder. There are parallels with the excessive use of alcohol and other substances that have also come to be regarded as forms of mental disorder. Again, as with alcohol misuse and dependence, serious attention to problem gambling by health professionals was preceded by that of lay people. Specifically, Gamblers Anonymous (GA), modeled closely on Alcoholics Anonymous (AA), was founded in 1957 (Gamblers Anonymous 1985). Like the AA conceptualization of alcoholism, 'compulsive gambling' was regarded as a progressive illness that can be arrested by abstention but never cured. GA and its self-help program similar to AA's '12 steps' spread to many countries during the 1960s and 1970s. Some consideration was given to problem gambling by the early psychoanalysts, for example Van Hattenberg 1914), Simmel (1920) and Freud (1928). However, prior to the 1970s, mainstream mental health professionals and formal mental health services gave very little attention to this topic. In 1977 'pathological gambling' was included in the ninth edition of the International Classification of Diseases. Shortly after, in 1980, it was also included in the Diagnostic and Statistical Manual of American Psychiatric Association (DSM-III) (American Psychiatric Association 1980). Although the criteria for pathological gambling were very similar to those for alcohol and drug dependence, it was classified as a disorder or impulse control. At each revision of the DSM, namely the DSM-III-R (1987) and DSM-IV (1994), the diagnostic criteria for pathological gambling have changed somewhat. As with other mental disorders, it is likely that the conceptualization of serious problem gambling will continue to be refined and modified in light of future research. Although now widely recognized as a mental disorder, some behaviorally oriented academics and clinicians, as well as practitioners from some other schools of psychotherapy, have questioned the validity and utility of conventional psychiatric diagnosis and treatment, including mental disorder conceptualizations of problem gambling (Allcock 1998; Orford 1984; Wakefield 1997). It is the opinion of the authors of this report that psychiatric diagnostic approaches to pathological gambling and some of the alternative approaches to the assessment and treatment of problem gambling have merit. In some situations we consider it desirable to augment DSM-IV and ICD diagnoses with measures that assess the various dimensions of gambling and problem gambling with greater precision and facilitate linkage with theory and bodies of knowledge from general and clinical psychology. In other words, we favor both diagnostic and multiple continua models of problem gambling.
Gambling and Problem Gambling in Sweden
3
The International Context Phase One is a national prevalence survey of gambling participation and problem gambling. It the third study of its type to be conducted internationally. Previous national surveys have been completed in New Zealand (Abbott & Volberg 1991; 1992; 1996: Volberg & Abbott 1994) and the United States (National Opinion Research Center 1999). Data collection for a second national survey in New Zealand has recently been completed. An earlier national survey was undertaken in the United States during the mid 1970s, prior to the introduction of pathological gambling as a formal psychiatric diagnostic entity and the advent of validated measures of this disorder (Kallick et al 1979). Although few nation-wide surveys of gambling and problem gambling have been conducted, since the mid-1980s a significant number of sub-national studies have been undertaken. The great majority of these surveys were conducted in the United States, Canada and Australia. A recent review of the relevant literature found that, other than adult surveys in Spain and adolescent studies in England and Wales, very little prevalence research has been completed in Europe (Abbott, Volberg, Baines & Taylor 1999). Given the substantial growth of legalized gambling throughout Europe in recent years and its potentially important economic, social and health impacts, the reviewers were surprised that European research of this type is so sparse. Recent reviewers of problem gambling prevalence studies have commented on the poor quality of most of them (Abbott, Volberg, Baines & Taylor 1999; Shaffer, Hall & Vander Bilt 1997). The majority of the relevant reports have not been peer reviewed prior to publication, sample size is generally inadequate and response rates, when reported, are generally low. Most have used telephone interviews. Almost all prevalence surveys have involved complex sample designs yet failed to use appropriate statistical procedures to take account of this complexity. The great majority of these surveys have assessed problem gambling with screening tests based on DSM diagnostic criteria - predominantly the South Oaks Gambling Screen (SOGS) (Lesieur & Blume 1987) or versions of the SOGS-R (Abbott & Volberg 1991; 1992; 1996) which was adapted from the original scale. In contrast the SOGS, which provides a lifetime measure, the SOGS-R yields both current and lifetime measures. Although having high internal consistency and reliability when used in a wide variety of settings, with the partial exception of the 1991 New Zealand national survey, the diagnostic efficiency of the SOGS and SOGS-R have not been established for use in community surveys. This is an important shortcoming in that without this form of validation, it is not known to what extent prevalence estimates correspond to estimates that would be obtained from diagnostic interviews using DSM or ICD criteria. Despite these and other deficiencies in prevalence studies to date, a recent reviewer (Shaffer, Hall & Vander Bilt 1997) concluded that problem gambling is a "robust phenomenon" in that broadly consistent findings have emerged from studies undertaken by a variety of investigators using different measures and methodologies of varying quality. Apart from one very high estimate from an Australian study, current probable pathological gambling prevalence estimates have ranged from 0.5 to 2.8 percent (Abbott, Volberg, Baines & Taylor 1999). Risk factors consistently associated with higher prevalence in the North American surveys include being male, young, in college, having a history of antisocial behavior and experiencing psychiatric co-morbidity. In some studies, including those conducted in Australia and New Zealand, the following have been identified as additional risk factors:
regular participation in 'continuous' forms of gambling such as gaming machines and track betting unemployed status lower educational level membership of a marginalized ethnic group (e.g. Maori in New Zealand; Native American in the United States) parental gambling problems commencing gambling at a younger age.
Gambling and Problem Gambling in Sweden
4
Given that many of these predictor variables are inter-related, it would be helpful if future research employed multivariate analysis to examine their relative predictive and explanatory capacity. It would also be helpful if gambling prevalence research used procedures that are customary within mainstream epidemiology. This could include expressing predictor variables as relative likelihood ratios and attributable risk factors. Research in a number of countries indicates that although teenagers generally gamble less frequently and have lower levels of expenditure than adults, they usually have higher problem gambling prevalence rates (Abbott, Volberg, Baines & Taylor 1999). However, very little is known about why rates are higher in this group, to what extent youth gambling problems persist into adult life, or whether they are linked to alcohol and drug misuse and other risk taking behavior common during adolescence. Many countries are ethnically diverse. This diversity is increasing in many parts of the world as a consequence of escalating flows of migrants, refugees and asylum seekers. With respect to mental disorders, relationships between morbidity and migrant or refugee status are complex (Abbott 1997). Neither status can be considered to be unitary. While there are often subgroups within refugee or migrant groups that are at very high risk for particular disorders, overall, prevalence rates may be similar to those of the general population. There are anecdotal accounts of high levels of gambling problems among some migrant and refugee communities but very little empirical information on the topic. Very high prevalence rates have also been found among some indigenous ethnic minority groups (Abbott, Volberg, Baines & Taylor 1999; Volberg & Abbott 1997). It is unclear what the major determinants of problem gambling are among some these groups. It is likely that cultural differences, patterns of gambling participation and various sociodemographic risk factors all play a part. The sample sizes of most national or regional problem and pathological gambling prevalence surveys have been too small to allow meaningful analysis of youth, migrant and ethnic minority groups. The present study includes boosted samples of youth and immigrants to facilitate examination of gambling participation and problem gambling within these high-risk groups. As indicated, there has been a substantial increase in gambling participation in many parts of the world during the past two decades. There are two general approaches taken to assess gambling participation within populations. The first method uses aggregate gambling expenditure data (both turnover or total expenditure and consumer losses or net expenditure) from industry or government sources. This type of information is often available at regional and national levels for at least the major types of legal gambling. It is of variable and often unknown accuracy. The second method involves general population surveys, frequently as a part of a study of problem gambling as is the case with the present Swedish study. These surveys usually ask people which forms of gambling they have participated in (ever and/or during shorter time periods such as the last month or year), how frequently they participate in each form and how much they spend. Information from surveys is subject to errors of measurement and sampling. The two methods of assessing gambling participation and expenditure usually provide broadly similar and complementary pictures of gambling within a particular jurisdiction. In most instances the former yields higher expenditure estimates than the latter, although the level of agreement between the two varies considerably from one form of gambling to another (Abbott, Volberg, Baines & Taylor 1999). The phrasing of questions can also have a considerable influence on survey expenditure estimates (Blaszcznski, Dumlao & Lange 1997). Although gambling participation and expenditure have increased globally, there are considerable differences between countries in this regard. In some countries there are also significant differences between different regions or between large cities and rural/small town areas. There are often differences between sociodemographic groupings, including age, gender, employment status, ethnicity, marital status and religion. Illustrative findings from a number of countries provide an international context and facilitate comparison with Sweden. Further detail on this topic and relevant references are contained in Abbott, Volberg, Baines & Taylor 1999).

Gambling and Problem Gambling in Sweden
5
United States Gambling turnover totaled US$639 billion in 1997. This was an increase of just over six percent on the previous year's turnover. Gambling came second after technology in national rankings of leisure spending, ahead of both durable goods and non-durable goods. Casino turnover exceeded that of all other forms of gambling combined. The other major categories, in declining rank order, were Indian gaming, lotteries, horses, video lotteries, charitable games and greyhounds. The recent National Commission survey of gambling and problem gambling in the United States found that 85 percent of the adult population reported having gambled at some stage in their lives, 63 percent in the past 12 months (National Opinion Research Center 1999). State level surveys show that there is considerable variation across states. Lifetime participation rates from surveys conducted during the 1980s and 1990s range from 64 to 96 percent. Past year rates range from 49 to 89 percent. Rates are generally higher in the North Eastern parts of America. Australia Total Australian national gambling turnover was A$80 billion in 1997, a ten percent increase on that of the previous year. Total 1997 net expenditure was approximately A$10 billion. This represents a mean of A$736 gambling expenditure for each adult during that year - probably higher than that of any other country. This compares with annual household expenditure of approximately A$9 billion on household appliances and A$6 billion on electricity, gas and fuel. Almost half of total gambling expenditure was on gaming machines (49%) followed by casinos (19%), track betting (17%), lotteries (12%), bingo (3%) and charity raffles (3%). In three jurisdictions (New South Wales, Northern Territory and Victoria), per capita adult expenditure exceeded A$800. In Tasmania it was less than A$500. There appear to have been no national surveys of gambling participation and expenditure in Australia. However, a number of statewide surveys were conducted during the 1990s. From these surveys, it appears that over 90 percent of Australian adults have gambled at some time. The most recent past year participation rates for surveys from five states varied from 65 to 89 percent. Four of the five surveys had rates that exceeded 78 percent. New Zealand In 1997, total gambling turnover totaled approximately NZ$6.5 billion and net expenditure was NZ$966 million. The adult per capita expenditure was approximately NZ$358ess than half that of Australia. In New Zealand lotteries, including instant lotteries accounted for nearly 30 percent of gambling expenditure, followed by casinos (25%), gaming machines (23%) and track betting (22%). Two national surveys conducted during the 1990s both found that 90 percent of New Zealanders reported having gambled in the past 12 months. A third survey, conducted in 1991, found that the same percentage reported having gambled in the past six months and that 95 percent indicated that they had gambled at some stage in their lives. There were not large differences between regions with respect to reported participation and expenditure in these surveys. However, a recent survey of two major cities suggests that following the introduction of casinos in 1994 and 1996, more marked geographical differences may have developed.
The Evolution of Gambling in Sweden Gambling seems to have been part of old North living, although a tiny part. Different kinds of dice games were part of the life of the Vikings. During the Middle Ages the reputation of gambling went down. In Swedish provincial laws from the 14th Century there are many examples of statements, which restricts gambling activities. However, gambling was still there after the middle ages. Card games came to
Gambling and Problem Gambling in Sweden
6
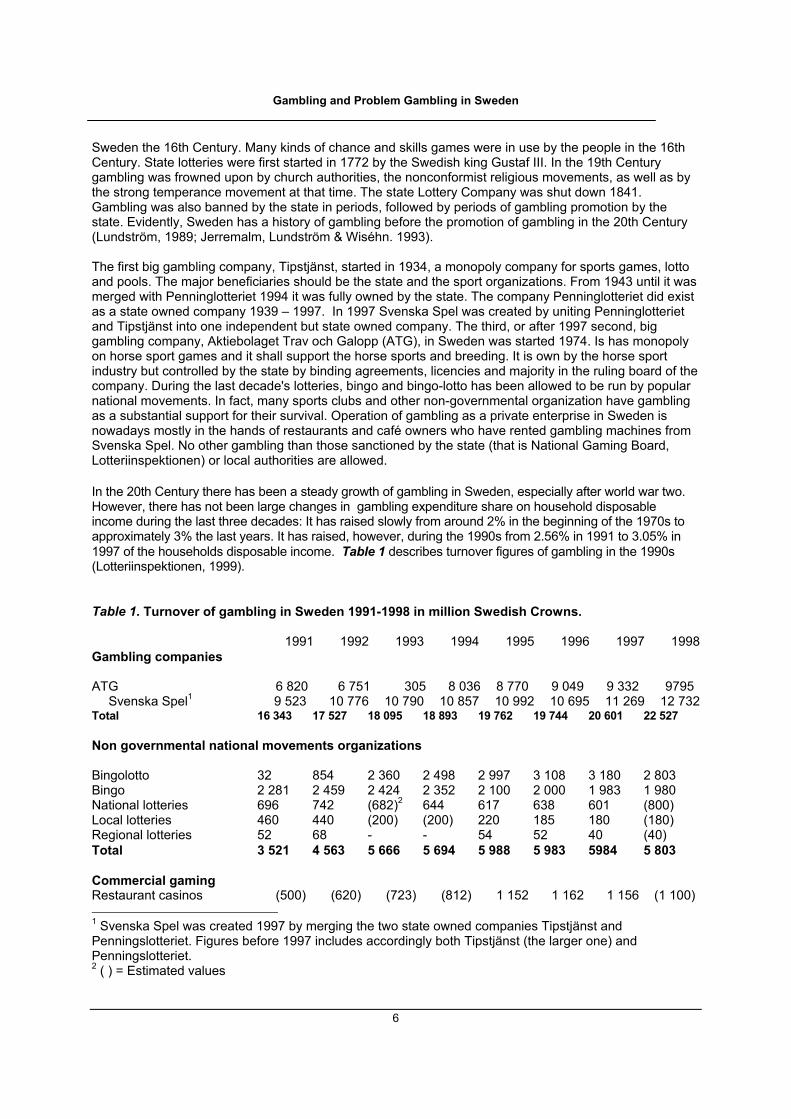
Sweden the 16th Century. Many kinds of chance and skills games were in use by the people in the 16th Century. State lotteries were first started in 1772 by the Swedish king Gustaf III. In the 19th Century gambling was frowned upon by church authorities, the nonconformist religious movements, as well as by the strong temperance movement at that time. The state Lottery Company was shut down 1841. Gambling was also banned by the state in periods, followed by periods of gambling promotion by the state. Evidently, Sweden has a history of gambling before the promotion of gambling in the 20th Century (Lundström, 1989; Jerremalm, Lundström & Wiséhn. 1993). The first big gambling company, Tipstjänst, started in 1934, a monopoly company for sports games, lotto and pools. The major beneficiaries should be the state and the sport organizations. From 1943 until it was merged with Penninglotteriet 1994 it was fully owned by the state. The company Penninglotteriet did exist as a state owned company 1939 – 1997. In 1997 Svenska Spel was created by uniting Penninglotteriet and Tipstjänst into one independent but state owned company. The third, or after 1997 second, big gambling company, Aktiebolaget Trav och Galopp (ATG), in Sweden was started 1974. Is has monopoly on horse sport games and it shall support the horse sports and breeding. It is own by the horse sport industry but controlled by the state by binding agreements, licencies and majority in the ruling board of the company. During the last decade's lotteries, bingo and bingo-lotto has been allowed to be run by popular national movements. In fact, many sports clubs and other non-governmental organization have gambling as a substantial support for their survival. Operation of gambling as a private enterprise in Sweden is nowadays mostly in the hands of restaurants and café owners who have rented gambling machines from Svenska Spel. No other gambling than those sanctioned by the state (that is National Gaming Board, Lotteriinspektionen) or local authorities are allowed. In the 20th Century there has been a steady growth of gambling in Sweden, especially after world war two. However, there has not been large changes in gambling expenditure share on household disposable income during the last three decades: It has raised slowly from around 2% in the beginning of the 1970s to approximately 3% the last years. It has raised, however, during the 1990s from 2.56% in 1991 to 3.05% in 1997 of the households disposable income. Table 1 describes turnover figures of gambling in the 1990s (Lotteriinspektionen, 1999). Table 1. Turnover of gambling in Sweden 1991-1998 in million Swedish Crowns.
1991 1992 1993 1994 1995 1996 1997 1998 Gambling companies
ATG 6 820 6 751 305 8 036 8 770 9 049 9 332 9795
Svenska Spel1 9 523 10 776 10 790 10 857 10 992 10 695 11 269 12 732 Total 16 343 17 527 18 095 18 893 19 762 19 744 20 601 22 527 Non governmental national movements organizations Bingolotto 32 854 2 360 2 498 2 997 3 108 3 180 2 803 Bingo 2 281 2 459 2 424 2 352 2 100 2 000 1 983 1 980 National lotteries 696 742 (682)2 644 617 638 601 (800) Local lotteries 460 440 (200) (200) 220 185 180 (180) Regional lotteries 52 68 - - 54 52 40 (40) Total 3 521 4 563 5 666 5 694 5 988 5 983 5984 5 803 Commercial gaming Restaurant casinos (500) (620) (723) (812) 1 152 1 162 1 156 (1 100) 1 Svenska Spel was created 1997 by merging the two state owned companies Tipstjänst and Penningslotteriet. Figures before 1997 includes accordingly both Tipstjänst (the larger one) and Penningslotteriet. 2 ( ) = Estimated values
Gambling and Problem Gambling in Sweden
7
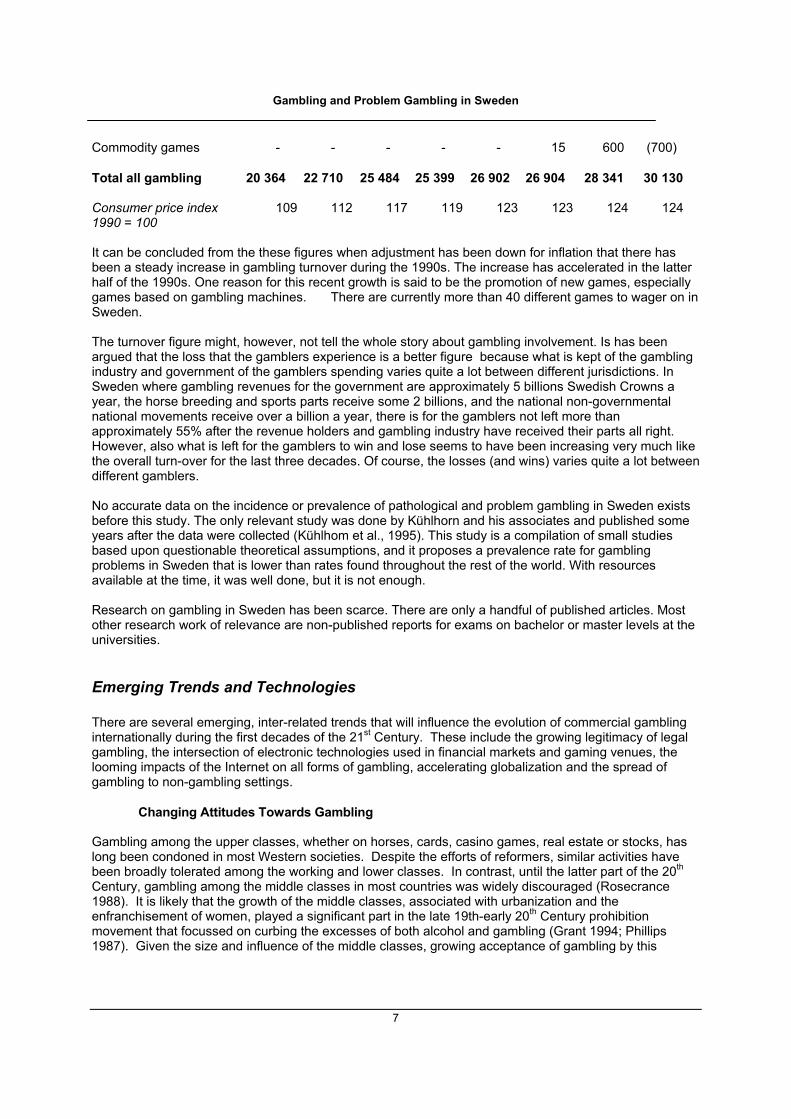
Commodity games - - - - - 15 600 (700)
Total all gambling 20 364 22 710 25 484 25 399 26 902 26 904 28 341 30 130
Consumer price index 109 112 117 119 123 123 124 124 1990 = 100
It can be concluded from the these figures when adjustment has been down for inflation that there has been a steady increase in gambling turnover during the 1990s. The increase has accelerated in the latter half of the 1990s. One reason for this recent growth is said to be the promotion of new games, especially games based on gambling machines. There are currently more than 40 different games to wager on in Sweden. The turnover figure might, however, not tell the whole story about gambling involvement. Is has been argued that the loss that the gamblers experience is a better figure because what is kept of the gambling industry and government of the gamblers spending varies quite a lot between different jurisdictions. In Sweden where gambling revenues for the government are approximately 5 billions Swedish Crowns a year, the horse breeding and sports parts receive some 2 billions, and the national non-governmental national movements receive over a billion a year, there is for the gamblers not left more than approximately 55% after the revenue holders and gambling industry have received their parts all right. However, also what is left for the gamblers to win and lose seems to have been increasing very much like the overall turn-over for the last three decades. Of course, the losses (and wins) varies quite a lot between different gamblers. No accurate data on the incidence or prevalence of pathological and problem gambling in Sweden exists before this study. The only relevant study was done by Kühlhorn and his associates and published some years after the data were collected (Kühlhom et al., 1995). This study is a compilation of small studies based upon questionable theoretical assumptions, and it proposes a prevalence rate for gambling problems in Sweden that is lower than rates found throughout the rest of the world. With resources available at the time, it was well done, but it is not enough. Research on gambling in Sweden has been scarce. There are only a handful of published articles. Most other research work of relevance are non-published reports for exams on bachelor or master levels at the universities.
Emerging Trends and Technologies There are several emerging, inter-related trends that will influence the evolution of commercial gambling internationally during the first decades of the 21st Century. These include the growing legitimacy of legal gambling, the intersection of electronic technologies used in financial markets and gaming venues, the looming impacts of the Internet on all forms of gambling, accelerating globalization and the spread of gambling to non-gambling settings.
Changing Attitudes Towards Gambling Gambling among the upper classes, whether on horses, cards, casino games, real estate or stocks, has long been condoned in most Western societies. Despite the efforts of reformers, similar activities have been broadly tolerated among the working and lower classes. In contrast, until the latter part of the 20th Century, gambling among the middle classes in most countries was widely discouraged (Rosecrance 1988). It is likely that the growth of the middle classes, associated with urbanization and the enfranchisement of women, played a significant part in the late 19th-early 20th Century prohibition movement that focussed on curbing the excesses of both alcohol and gambling (Grant 1994; Phillips 1987). Given the size and influence of the middle classes, growing acceptance of gambling by this
Gambling and Problem Gambling in Sweden
8
socioeconomic group has undoubtedly been a particularly salient factor in the legitimation of gambling worldwide (Rosecrance 1988). There are numerous ways that legal gambling now reaches into many cultures and societies and increases the legitimacy of these activities. When gambling is legalized, the operation and oversight of gambling activities become part of the routine processes of government. Gambling commissions are established, gambling revenues are distributed, constituencies of customers, workers and organizations develop. Governments become dependent on revenues from legal gambling to fund essential services. So do churches, voluntary organizations, the mass media and, more recently, researchers and gambling treatment providers – sectors that traditionally served as critics of government and society. Many non-gambling occupations and businesses also become dependent on legal gambling. Lawyers, accountants, architects, public relations and advertising, security services and financial services expand their activities to provide for the gambling industry. Convenience stores, retail operators, restaurants, hotels and social clubs become dependent on revenues from legal gambling to continue to operate profitably. Although there has been growing public acceptance of gambling and increased participation across all sectors of society, there has also been an increase in awareness of and concern about problem gambling and associated social costs, both real and perceived. This has been associated with growing opposition to gambling, particularly focussed on preventing the further expansion of gambling machines and casinos. While public acceptance appears to prevail in most parts of the world, it remains to be seen what influence the growing anti-gambling movement will have in the future.
The Intersection of Gambling and Financial Technologies Electronic technologies, while not highly visible, are already having a profound effect on the conduct of commercial gambling internationally. The intersection of financial institutions and legal gambling is leading to developments such as “cashless” gambling, in which wagering on casino games as well as the purchase of lottery tickets is done with credit or debit cards. Both the casino and lottery industries are spending considerable resources on technologies that improve management systems, allow player tracking, speed financial transactions and enhance the games themselves (Bivins & Hahnke 1998). These developments have already fostered the growth of ‘spread betting’ where people can bet on events over the phone, even while the events are actually taking place, using through pre-arranged debit accounts or credit (Griffiths 1998a). On the horizon is the prospect of sports wagering, casino gambling and lottery games on the Internet. Just a few years ago, hardly a single wager was placed online. Today, there are dozens of sites where anyone with a computer, a modem and access to the Internet can wager on blackjack, slot machines, bingo, keno, craps, horse and dog races, sports events and lotteries. Internet gambling is particularly appealing to a new group of gamblers – youth and young adults who are computer literate and can take advantage of the fact that age restrictions are difficult to enforce in cyberspace (Griffiths 1998b). The potential market for Internet gambling is enormous. According to one analyst, the number of sites offering wagers on casino games has grown from 10 in 1996 to 40 in 1997. Online wagering internationally could reach USD 8 billion annually by the turn of the century if these operations were made legal. There are two major issues that could affect the projected growth of Internet gambling. These include concerns among users about the security of sending financial information over the network and pending legislation in the United States Congress that would criminalize Internet wagering in one of the largest potential markets for at-home casino games (Sinclair 1997, 1998). These issues are now being addressed internationally. As Internet users become more comfortable with encryption technology that secures financial transactions, it is likely that Internet gambling will increase. Further, in contrast to the United States, a number of governments internationally are taking steps to regulate and license Internet gambling operations. The governments of Finland and Liechtenstein have established state-regulated lotteries available on the Internet (McQueen 1998). In Australia, the State of Victoria is planning to license gambling sites within the year and the Australian Capital Territory (ACT) just announced approval of its first bookmaking license (Kelly 1998).
Gambling and Problem Gambling in Sweden
9
Globalization
The developments above can be viewed as part of inter-related globalization processes that have gathered momentum since the early 1980s and now constitute the major force in economic and social change world-wide. Other aspects of globalization include international financial markets, transnational corporations, transnational technology, international non-governmental organizations and an emerging global cultural homogenization. The globalization of gambling has shifted the terms of the policy debate from social to economic imperatives and has led to the emergence of a highly competitive multinational industry (McMillen 1996). Some likely impacts of globalization on commercial gambling include the merging of gambling with popular culture and entertainment, major reorganization of the gambling industries and further blurring of the boundaries between traditionally separate enterprises (Austrin 1998).
Gambling in Non-Gambling Settings One notable change in recent years has been the shift of gambling from gambling-specific venues to a much wider range of social settings. In addition, in many countries, multiple forms of gambling are now available in venues such as pubs, taverns and restaurants that previously offered a more limited range of activities. In effect, some have become mini-casinos and sometimes are promoted as such. This development has been referred to as the growth of "convenience gambling" (Goodman 1995). The consequences of this permeation of gambling throughout society have yet to be examined. However, it is likely that children and adolescents will observe and engage in gambling activities at younger ages than was the case when gambling was predominantly located in age segregated premises. To adequately understand the multiplicity of changes that may flow from these new gambling developments, it will be necessary to significantly widen the scope of investigation and methodologies used in gambling research.
Regulating a Moving Target Rapid changes in legal gambling, including technological change and intense competitive pressures, have blurred the lines between gambling activities and have made them difficult to regulate. The primary legislative and regulatory response, to attempt to provide a “level playing field” for all the sectors of the gambling industry, has generally been adopted on behalf of the least successful sectors of the gambling industry (i.e. charitable gambling and pari-mutuel wagering) (Rose 1999). Examples of providing a level playing field include tax relief provisions for by racetracks throughout the United States as well as the expansion of pari-mutuel wagering in many states to include off-track and telephone betting and the introduction of slot machines and card rooms at racetracks. In response to the rapid expansion of casino-style gambling on American Indian reservations, charitable gambling operations have been permitted to conduct linked, progressive bingo games and licensed card rooms have been allowed to conduct “house banked” games. Another difficulty in regulating legal gambling is that many of the laws that presently govern lottery, pari-mutuel and casino gambling were promulgated in the early part of the 20th Century. For example, some elements of the United States Wire Communications Act were originally written to prevent the transmission of horse racing information by telegraph from one state to another. However, the Wire Communications Act is wholly inadequate to deal with Internet gambling. There are further issues to consider in relation to Internet gambling. In addition to the dangers of consumer fraud associated with the use of credit cards, there are jurisdictional issues – where is a bet placed in cyberspace? Is the activity legal in the jurisdiction where it was placed, in the jurisdiction where it was registered, in the jurisdiction where the funds are deposited? What happens in the United States
Gambling and Problem Gambling in Sweden
10
and other countries that wish to limit access to Internet gambling when the Australian government licenses and regulates Internet gambling operators? What are the challenges for intergovernmental relations and foreign policy? What are the consequences of legislation in the United States, such as the Internet Gambling Prohibition Act of 1997, for legal gambling operators, for gamblers and for citizens?
Defining Our Terms
Gambling Gambling is a popular pastime throughout the world although the development of legal, commercial gambling enterprises in the last quarter of the 20th Century has led to dramatic changes in attitudes toward and participation in such activities. Internationally, legal gambling now includes lotteries, casinos, pari-mutuel wagering on horses, dogs and sports, charitable gambling, and wagering on electronic gambling machines in bars, restaurants and taverns. The common thread is that all of these activities involve risking the loss of something of value in exchange for the opportunity to gain something of greater value (Thompson 1997). Gambling is a broad concept that includes a diversity of activities, conducted in a wide range of settings, appealing to different sorts of people and perceived in a variety of ways by participants and observers. Failure to appreciate this diversity limits scientific understanding of gambling. Another reason to take note of this diversity stems from the accumulating evidence that some forms of gambling are more strongly associated with the development of gambling problems than others. Gambling activities can be classified in numerous ways on the basis of many different characteristics. One important dimension in classifying gambling activities is the “skill-luck” dimension (Volberg & Banks 1994; Walker 1992). Games of pure chance include most lottery and bingo games as well as some traditional casino games such as roulette. Games of mixed chance and skill include card games such as poker, blackjack and baccarat. Chess is an example of a game near the pure skill end of the luck-skill continuum. Some types of gambling require players to construct subjective probabilities of the outcome of some event, such as horse racing or a football game. It has been argued that activities involving an intermediate mix of skill and luck are most likely to lead to gambling problems among regular participants than other forms of gambling (Walker 1992). These forms of gambling involve sufficient skill to allow slight modifications to the outcome but insufficient to overcome the odds in favor of the “house.” With regard to problem gambling, they provide opportunities for escalating the size of bets, chasing losses and both betting and losing more than intended. Several casino table games and track betting fall into the intermediate skill category. Some gambling machine games such as video poker also involve an element of “perceived” skill, although most are games of pure chance. The number of opportunities to gamble in a specified period of time, or “event frequency,” is another of important feature differentiating gambling activities (Griffiths 1998a). Some types of gambling feature particularly rapid cycles of stake, play and determination and offer participants intense action whereas others are much slower and passive (Dickerson 1993). Those in the former category are often referred to as continuous forms of gambling; those in the latter as discontinuous or non-continuous (Abbott & Volberg 1992). Gambling activities can be ranked on a scale that ranges from very rapid to infrequent. This constitutes an ordinal scale, a form of measurement that allows quantitative analysis. Research in several countries suggests that event frequency is particularly relevant to considerations of problem gambling development (Abbott, Volberg & Taylor 1999). With the rapid evolution of legal gambling, many traditional assumptions about gambling are losing their salience. One example is the distinction, often made in the 1980s, between “soft” forms of gambling (e.g. lotteries) and “hard” forms of gambling (e.g. casino games). This boundary has become blurred as
Gambling and Problem Gambling in Sweden
11
lotteries offer electronic games such as video poker and video keno as well as instant tickets using casino game themes, as racetracks add slot machine and card club operations, and as casinos market their products as “family entertainment.” Every type of legal gambling now offers faster cycling games with increasing levels of play and future technological developments are expected to accentuate these trends (Griffiths 1998b).
Gambling-Related Problems Some patterns of gambling participation may contribute to personal wellbeing and mental health, although this has been little investigated. However, like most “good” things in life, gambling is Janus-faced. For the large majority, their gambling experience appears to be generally positive and non-problematic. For a minority, gambling is associated with difficulties of varying severity and duration. Some people develop significant, debilitating problems that also result in harm to people close to them and to the wider community (Abbott, Volberg & Taylor 1999). There are numerous historical and literary references to problem gambling and associated personal and social costs (Wildman 1998). Public recognition of the problems that can be associated with gambling probably played a role in the genesis of measures taken at various times in the past to prohibit or regulate gambling activities. In these earlier times, gambling problems were generally perceived as a moral vice or character flaw rather than as an illness or mental disorder. This was also the case with problematic alcohol consumption and a number of other troubled and/or troublesome patterns of human experience and behavior that are today regarded as forms of mental disorder. The term problem gambling has been used in different ways. The term is sometimes used to refer to individuals who fall short of the diagnostic criteria for pathological gambling but are assumed to be in a preliminary stage of this progressive disorder (Lesieur & Rosenthal 1991). The term has also been used to refer to individuals who lose excessive amounts of money through gambling, relative to their income, although without reference to specific difficulties that they may experience (Rosecrance 1988). The National Council on Problem Gambling in the United States uses this term to indicate all of the patterns of gambling behavior that compromise, disrupt or damage personal, family or vocational pursuits (Cox, Lesieur, Rosenthal & Volberg 1998). Although gambling problems received some prior attention from mental health researchers and clinicians, it was not until 1980 that it was formally recognized as a psychiatric disorder (American Psychiatric Association 1980). Pathological gambling was classified as a disorder of impulse control, along with pyromania and kleptomania. In subsequent editions of this manual, the diagnostic criteria for pathological gambling were modified to incorporate empirical research that links pathological gambling to other addictive disorders like alcohol and drug dependence. The essential features of pathological gambling are a continuous or periodic loss of control over gambling; a progression, in gambling frequency and amounts wagered, in the preoccupation with gambling and in obtaining monies with which to gamble; and a continuation of gambling involvement despite adverse consequences (American Psychiatric Association 1994). A number of academics from different disciplines and perspectives have challenged psychiatric diagnostic systems generally for various reasons. Behaviorally oriented academic and clinical psychologists, as well as some practitioners, continue to challenge the value of psychiatric diagnostic approaches to the understanding of mental health problems (Schachter & Nathan 1977; Wakefield 1997). While these challenges are undoubtedly driven by philosophical, scientific and pragmatic clinical considerations, they also appear to reflect an ideological schism arising from “turf wars” between groups of mental health professionals and other interest groups in the highly competitive North American mental disorder market place (Abbott, Volberg & Taylor 1999).
Gambling and Problem Gambling in Sweden
12
Measuring Gambling Problems Scientific concepts are derived constructs that undergo constant revision and evolution. They are not right or wrong in any absolute sense. They are best judged by their utility, including their capacity to organize existing information, generate useful predictions including response to treatment, and direct research along new lines. Scientific concepts often contain an ideological component, relating to the aspirations of professional groups and prevailing cultural beliefs and understandings. Furthermore, science and professional practice themselves are part of the social systems in which they operate. In the 20th Century, psychiatric and psychological diagnostic frameworks have embraced an expanding array of dysfunctional and distressing varieties of human experience. They have played a significant role in the medicalization of spheres of distressing, “mad” and/or “bad” human behaviors that in earlier times were construed differently (Abbott, Volberg & Taylor 1999). With the rapid expansion of legal gambling in the United States in the 1980s, state governments began to establish services for individuals with gambling problems. In establishing these services, policy makers quickly sought answers to questions about the number of “pathological gamblers” in the general population who might seek help for their difficulties. These questions required epidemiological research to identify the number (or “cases”) of pathological gamblers, ascertain the demographic characteristics of these individuals, and determine the likelihood that they would utilize treatment services if these became available. In the same period, following the adoption of the diagnosis of pathological gambling in the DSM-III in 1980, a few researchers began to investigate gambling-related difficulties using methods from psychiatric epidemiology. At this time, few tools existed to measure gambling-related difficulties. The only tool that had been rigorously developed and tested for its performance was the South Oaks Gambling Screen (SOGS). The SOGS, closely based on the new diagnostic criteria, was originally developed to screen for gambling problems in clinical populations (Lesieur & Blume 1987).
Adopting the SOGS in Population Research Like other tools in psychiatric research, the SOGS was quickly adopted for use in epidemiological research. The SOGS was first used in a prevalence survey in New York State (Volberg & Steadman 1988). By 1998, the original SOGS as well as several modified versions had been used in population-based research in more than 45 jurisdictions in the United States, Canada, Asia and Europe (Shaffer, Hall & Vander Bilt 1997; Volberg & Dickerson 1996). This widespread use of the SOGS came at least partly from the great advantage of comparability within and across jurisdictions that came with use of a standard tool (Walker & Dickerson 1996). Although there were increasingly well-focussed grounds for concern about the performance of the SOGS in non-clinical environments, this tool remained the de facto standard in the field until the mid-1990s, when the new DSM-IV criteria were published (Volberg & Banks 1990). Like all tools to detect physical and psychological maladies, screens to detect gambling problems are expected to make some mistakes. However, such mistakes have different consequences in different settings. Misclassification can occur when an individual without the malady in question is misdiagnosed as having the malady. This type of classification error is called a false positive. Misclassification can also occur when an individual with the malady is misdiagnosed as not having the malady. This type of classification error is called a false negative. While most screens to detect psychiatric disorders work well in clinical settings where the prevalence of the disorders under investigation is predictably high, the accuracy of many psychiatric screens declines when they are used among populations where prevalence is much lower, such as the general population (Dohrenwend 1995). Clinicians are most concerned with the issue of false positives since this type of error affects their work in diagnosis and treatment and because treating someone who does not need treatment is so expensive. In population research, where the primary concern is accurately identifying the number of people with and without the disorder, both types of classification error are important since each has an independent impact on the overall efficiency of the screen. Indeed, the rate of false negatives may be of principal concern in
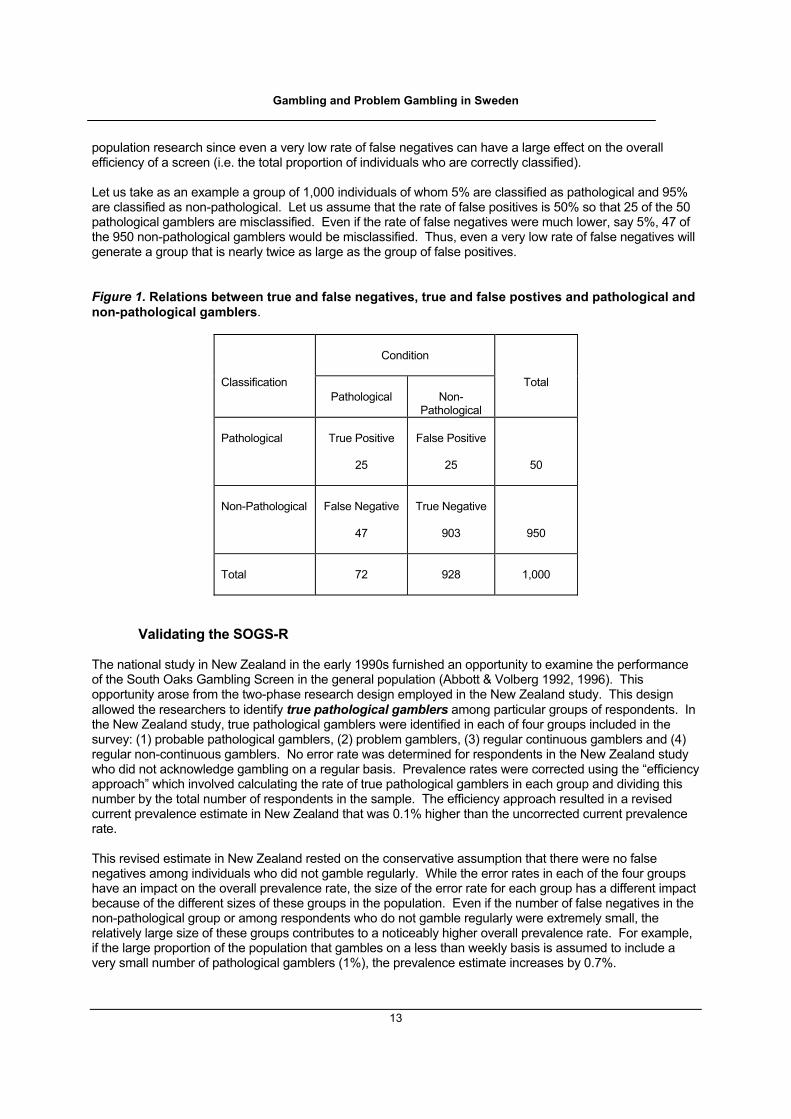
Gambling and Problem Gambling in Sweden
13
population research since even a very low rate of false negatives can have a large effect on the overall efficiency of a screen (i.e. the total proportion of individuals who are correctly classified). Let us take as an example a group of 1,000 individuals of whom 5% are classified as pathological and 95% are classified as non-pathological. Let us assume that the rate of false positives is 50% so that 25 of the 50 pathological gamblers are misclassified. Even if the rate of false negatives were much lower, say 5%, 47 of the 950 non-pathological gamblers would be misclassified. Thus, even a very low rate of false negatives will generate a group that is nearly twice as large as the group of false positives. Figure 1. Relations between true and false negatives, true and false postives and pathological and non-pathological gamblers.
Condition
Classification
Pathological
Non-
Pathological
Total
Pathological
True Positive
25
False Positive
25
50
Non-Pathological
False Negative
47
True Negative
903
950
Total
72
928
1,000
Validating the SOGS-R The national study in New Zealand in the early 1990s furnished an opportunity to examine the performance of the South Oaks Gambling Screen in the general population (Abbott & Volberg 1992, 1996). This opportunity arose from the two-phase research design employed in the New Zealand study. This design allowed the researchers to identify true pathological gamblers among particular groups of respondents. In the New Zealand study, true pathological gamblers were identified in each of four groups included in the survey: (1) probable pathological gamblers, (2) problem gamblers, (3) regular continuous gamblers and (4) regular non-continuous gamblers. No error rate was determined for respondents in the New Zealand study who did not acknowledge gambling on a regular basis. Prevalence rates were corrected using the “efficiency approach” which involved calculating the rate of true pathological gamblers in each group and dividing this number by the total number of respondents in the sample. The efficiency approach resulted in a revised current prevalence estimate in New Zealand that was 0.1% higher than the uncorrected current prevalence rate. This revised estimate in New Zealand rested on the conservative assumption that there were no false negatives among individuals who did not gamble regularly. While the error rates in each of the four groups have an impact on the overall prevalence rate, the size of the error rate for each group has a different impact because of the different sizes of these groups in the population. Even if the number of false negatives in the non-pathological group or among respondents who do not gamble regularly were extremely small, the relatively large size of these groups contributes to a noticeably higher overall prevalence rate. For example, if the large proportion of the population that gambles on a less than weekly basis is assumed to include a very small number of pathological gamblers (1%), the prevalence estimate increases by 0.7%.
Gambling and Problem Gambling in Sweden
14
The New Zealand researchers concluded that the lifetime South Oaks Gambling Screen is very good at detecting pathological gambling among those who currently experience the disorder. However, as expected, the screen identifies at-risk individuals at the expense of generating a substantial number of false positives. The current South Oaks Gambling Screen produces fewer false positives than the lifetime measure but more false negatives and thus provides a weaker screen for identifying pathological gamblers in the clinical sense. However, the greater efficiency of the current South Oaks Gambling Screen makes it a more useful tool for detecting rates of change in the prevalence of problem and pathological gambling over time (Abbott & Volberg 1996).
The Eclipse of the SOGS
Beginning in the early 1990s, a variety of methodological questions were raised about SOGS-based research in the general population (Culleton 1989; Dickerson 1993; Lesieur 1994; Volberg 1994; Walker 1992). Some of these issues, such as respondent denial and rising refusal rates, were common to all survey research. Other questions were related to the issue of how to best study gambling-related difficulties. These included reservations about the reliability and validity of the SOGS in different cultures and subgroups as well as challenges to assumptions about the nature of gambling problems that were built into the original version of this instrument. What led to the growing dissatisfaction with the SOGS? One important change was the rapid expansion of legal gambling itself. This expansion led many people who had never before gambled to try these activities. As legal gambling expanded into new markets and as new types of gambling were marketed to new groups, the individuals seeking help for gambling difficulties became increasingly heterogeneous. Prevalence surveys in the early 1990s suggested that growing numbers of women and middle-class individuals were developing gambling problems (Volberg 1992, 1996; Volberg & Silver 1993). Several of the specific items included in the SOGS made little sense to these new groups or to the treatment professionals working with them. Questions about borrowing from loansharks, for example, or cashing in stocks and bonds to get money to gamble or pay gambling debts were more relevant to the middle-aged, middle-class men most likely to seek help for gambling problems in the 1970s and early 1980s than to the young adults and middle-aged women who began to experience gambling problems in the 1990s. Questions about others criticizing one’s gambling and feeling guilty about one’s gambling were more likely to receive a positive response from low-income and minority respondents than others in the population (Volberg & Steadman 1992). Questions about borrowing from the “household” to get money to gamble would be interpreted differently by individuals from ethnic groups where “household” may be defined as the entire extended family. At the end of the 1990s, there is a growing community of researchers and treatment professionals active in the gambling field and a growing number of tools to measure gambling problems for different purposes. Until 1990, only three screens existed to identify individuals with gambling problems, including the SOGS and its modified versions (Abbott & Volberg 1996; Lesieur & Blume 1987). Since 1990, in contrast, nine screens for adults and three screens for adolescents have been developed, including two based on the SOGS and at least five based on the DSM-IV criteria. Despite this proliferation, the psychometric properties of most of these new tools remain unexamined. Even more significantly, few of these new screens have been tested for their differential performance in clinical settings, population research, and program evaluation. Another concern is how to calibrate the performance of these new screens with the results of more than a decade of SOGS-based research.
Gambling and Problem Gambling in Sweden
15
METHODS The majority of surveys of gambling and problem gambling completed to date internationally have been baseline surveys, assessing these behaviors in the general population for the first time. The present survey of gambling and problem gambling in Sweden is a baseline survey and was completed in several stages. In the first stage, members of the primary and secondary research teams met in Strängnäs to discuss and finalize the English version of the questionnaire. In the second stage, the English questionnaire was translated into Swedish and its performance tested before it was translated back into English. In the third stage, Statistics Sweden selected three random samples of potential respondents, including a rselected group of 8,500 individuals aged 15 to 74, a group of 1,000 individuals aged 15 to 17 and a group of 500 non-Swedish born individuals. In the fourth stage, Statistics Sweden attempted to complete interviews with these 10,000 potential respondents. In the fifth stage, the data were checked for quality both by statisticians at Statistics Sweden and members of the research team. Finally, the data for this report were analyzed by Dr. Volberg and her staff before a draft report was delivered for review and supplementing by the research team.
Pilot Study In April, 1997, funding was provided by the Ministry of Social Affairs and Health for a pilot study to determine the feasibility of carrying out the main study. The pilot study sample included 2,998 respondents, representative of the Swedish population aged 15 to 74. Half of the respondents were interviewed by telephone and half were interviewed via a postal questionnaire. Although the questionnaire included 45 items dealing with different aspects of gambling, only 432 respondents who had gambled in the past year and spent more than 50 SEK in a typical week were asked questions about their gambling difficulties. The data for the pilot study were collected by Statistics Sweden at Örebro between May and June, 1997. The response rate for the postal questionnaire was 70% and the response rate for the telephone interview was even higher at 80%. These response rates were at least partly due to the exclusion of individuals who wagered less than SEK 50 per week. Based on the results of the pilot study, the research team estimated that the lifetime prevalence rate of problem and pathological gambling in Sweden was between 1.2% and 2.0% based on the South Oaks Gambling Screen. The current, or past year, prevalence rate of problem and pathological gambling based on an alternate screen based on the DSM-IV criteria for pathological gambling was estimated between 0.3% and 0.5%. The pilot study in Sweden did not identify any significant differences in the prevalence rates among the samples interviewed using the postal questionnaire and telephone interview modalities. This suggested that it was possible to use either a postal questionnaire or a telephone survey to assess the prevalence of problem and pathological gambling in the general population. After consideration, however, the research team concluded that the benefits of a telephone survey greatly outweighed the greater costs of this approach. These benefits include the likelihood of a higher response rate, comparability with other jurisdictions where prevalence surveys have generally been conducted by telephone, the opportunity to administer the questionnaire to individuals with literacy or language problems and the possibility of administering a more sophisticated questionnaire by telephone. Other advantages to a telephone survey included avoiding issues of proving the validity and reliability of a postal questionnaire, avoiding the potential errors associated with coding data from a postal survey, the potential impact of a postal questionnaire on other household members, and the possibility of negative publicity if a potential respondent released the postal questionnaire to the media. Due to the low prevalence rates of problem and pathological gambling, the research team concluded that a much larger sample was needed to estimate the prevalence of problem and pathological gambling in Sweden with precision. A larger sample was also needed to estimate prevalence rates among different
Gambling and Problem Gambling in Sweden
16
sub-groups of particular interest, including youth and immigrants as well as individuals living in different regions of Sweden, unemployed and retired persons and those with low income.
Questionnaire In developing the questionnaire for the first phase of the Swedish study, the research team recognized the importance of maintaining comparability with international research on gambling and problem gambling. The research team agreed that it was essential to use the revised South Oaks Gambling Screen (SOGS-R) in order to obtain prevalence estimates comparable to results from Canada, New Zealand and the United States. The research team further agreed that it would be important to include a second problem gambling screen based on the most recent diagnostic criteria for pathological gambling. The research team elected to include the Fisher DSM-IV Screen in the questionnaire for the survey (Fisher 1996). While several other screens based on the DSM-IV were available, the Fisher Screen was the only one that had been examined for its performance in general population samples (Volberg & Moore 1999 WA). A draft questionnaire that included the revised South Oaks Gambling Screen (SOGS-R) and the Fisher DSM-IV Screen was provided to the research team by Dr. Volberg. This draft questionnaire was composed of four major sections. The first section included questions about 17 different types of gambling available to Swedish residents. In finalizing the questionnaire for the Swedish survey, similar types of gambling (e.g. fast lotteries, casino games and slot machines in different venues) were grouped together. This approach was based on experience with gambling surveys in other jurisdictions where it was found that limiting the number of gambling activities included in the survey is important to avoid respondent fatigue. For each type of gambling in the Swedish survey, respondents were asked whether they had ever tried this type of gambling, whether they had tried it in the past year, and, if so, how often they had done so in the past month. Respondents were also asked to estimate their typical past month expenditures on the types of gambling that they had tried in the past year. The second section of the questionnaire was composed of the revised South Oaks Gambling Screen (SOGS-R) which includes both lifetime and past year items. The third section of the questionnaire consisted of the Fisher DSM-IV Screen. These two sections of the questionnaire were rotated so that half of the respondents answered the SOGS-R questions first and half of the respondents answered the DSM-IV questions first. The final section of the questionnaire included a few questions about each respondent that could not be easily obtained using the SCB registers.
Adapting the Questionnaire to the Swedish Context Adapting a questionnaire developed in English for English-speaking respondents to the Swedish context was not a simple process. There are cultural differences in how words and context are used and accepted even when a formally correct translation is done. Great care was taken in translating the questionnaire for the Swedish survey to address these cultural and linguistic complexities. The secondary research team constructed the questionnaire in Swedish according to a plethora of e-mail instructions and master copies in English received by mail. Every member of the secondary research team took great care in considering the wording of every item. The final result needed to be true to the original English version while at the same time fitted to a Swedish audience. The primary and secondary research teams met at Strängnäs in August, 1997 where all translation problems and concerns were discussed and the questionnaire was accordingly adapted. Once the primary and secondary research teams had agreed on the items and scales to be included in the questionnaire, the Measurement and Evaluation Laboratory of Statistics Sweden at Örebro analyzed the questionnaire and conducted a small trial to assess the performance of the questionnaire with Swedish respondents. Based on this trial, several changes were recommended and adopted by the research team.
Gambling and Problem Gambling in Sweden
17
Once the Swedish version of the questionnaire was finalized, the last step was to complete a back-translation of the entire questionnaire. The back-translation of the Swedish questionnaire was carried out by Anne Berman, an American academic fluent in Swedish. While Ms. Berman is well-eduated, she has no acquaintance with the details of the Swedish Pathological Gambling Study or special knowledge about gambling problems and was therefore “blind” about the goals of the research. Although it is customary to have translations and back-translations done many times in converting standard scales from one language to another, this is a time-consuming and expensive process. Given the constraints of time and resources in the present context, only one back-translation was completed as the final step in the process of constructing the questionnaire.
Registerbased Survey – A Swedish Option In this study the long tradition of official registers of the Swedish population and how it can be used in practice in order to get more information out of surveys is clearly demonstrated. The methodology is recently developed within survey research and some technical details relevant for this study are reported in (1) including references to the literature. Two official registers has been used: (1) RTB – The Register of Total Population mainly as the so called sampling frame, including stratifying variables (sex, age, education and born abroad) and (2) LOUISE – The Longitudinal Official Register of Income, Social Welfare and Education including auxiliary information (metropolitan resident, receiving social security funds or not, student or not) used for balancing the achieved sample to take non-response into account. All respondents were informed about the use of register data and which variables that were picked as the Swedish Data Law require. This information were of cause also included as background information together with the survey data and used in the analysis of the study especially useful as explanatory factors of gambling behavior.
Sample design The population consists of all individuals age 15-74 years living in Sweden by November 1, 1997. They were listed in the register of the total population of Sweden mentioned above RTB. There were at that time 6,422,008 person in the register, defining our target population. Very few people do live in Sweden not accounted for by this register (less than .001%). Three separate random samples were drawn from the register. The first consists of a proportional stratified random sample of 8,500 persons, where strata are decided by gender, five classes of age and three of education. This means a 2 x 5 x 3 stratified random sample. The stratification were done to secure the population proportions of sex, age and education in the sample, as these were known from studies abroad to be related to gambling habits. As mentioned earlier in this text, there were reasons to expect gambling problems to be more prevalent among youths and non-Swedish born. To secure enough persons in those categories for in-dept analysis, additional samples were drawn. One random sample of 1,000 age 15-17 and one random sample of 500 non-Swedish born were added to the main sample of 8,500 persons. We were accordingly aiming for a sample of 10,000. However, even a near perfect register as the Swedish RTB register does have some flaws much because of timing, the difference between the time when the samples were drawn and the time when the datacollection took place. Of the total sample of 10,000 persons 83 had died or emigrated since the register was done, so the final total sample consisted of 9,917 persons to interview.
Response Rate and Non-Response Data were gathered from 7,139 persons during the data-gathering period November 17, 1997 through February 6, 1998. That gives a response rate of 72% of the total sample of 9,917 persons.
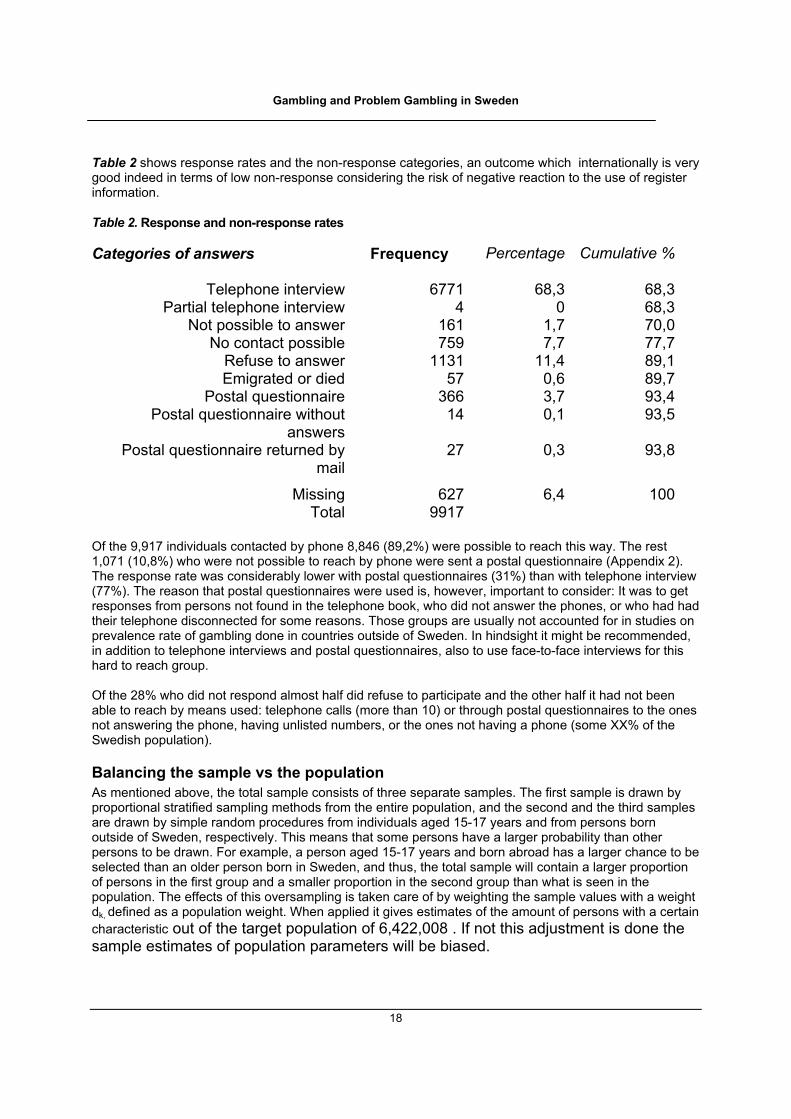
Gambling and Problem Gambling in Sweden
18
Table 2 shows response rates and the non-response categories, an outcome which internationally is very good indeed in terms of low non-response considering the risk of negative reaction to the use of register information. Table 2. Response and non-response rates
Categories of answers Frequency Percentage Cumulative %
Telephone interview 6771 68,3 68,3Partial telephone interview 4 0 68,3
Not possible to answer 161 1,7 70,0No contact possible 759 7,7 77,7
Refuse to answer 1131 11,4 89,1Emigrated or died 57 0,6 89,7
Postal questionnaire 366 3,7 93,4Postal questionnaire without
answers14 0,1 93,5
Postal questionnaire returned by mail
27 0,3 93,8
Missing 627 6,4 100Total 9917
Of the 9,917 individuals contacted by phone 8,846 (89,2%) were possible to reach this way. The rest 1,071 (10,8%) who were not possible to reach by phone were sent a postal questionnaire (Appendix 2). The response rate was considerably lower with postal questionnaires (31%) than with telephone interview (77%). The reason that postal questionnaires were used is, however, important to consider: It was to get responses from persons not found in the telephone book, who did not answer the phones, or who had had their telephone disconnected for some reasons. Those groups are usually not accounted for in studies on prevalence rate of gambling done in countries outside of Sweden. In hindsight it might be recommended, in addition to telephone interviews and postal questionnaires, also to use face-to-face interviews for this hard to reach group. Of the 28% who did not respond almost half did refuse to participate and the other half it had not been able to reach by means used: telephone calls (more than 10) or through postal questionnaires to the ones not answering the phone, having unlisted numbers, or the ones not having a phone (some XX% of the Swedish population).
Balancing the sample vs the population As mentioned above, the total sample consists of three separate samples. The first sample is drawn by proportional stratified sampling methods from the entire population, and the second and the third samples are drawn by simple random procedures from individuals aged 15-17 years and from persons born outside of Sweden, respectively. This means that some persons have a larger probability than other persons to be drawn. For example, a person aged 15-17 years and born abroad has a larger chance to be selected than an older person born in Sweden, and thus, the total sample will contain a larger proportion of persons in the first group and a smaller proportion in the second group than what is seen in the population. The effects of this oversampling is taken care of by weighting the sample values with a weight dk, defined as a population weight. When applied it gives estimates of the amount of persons with a certain characteristic out of the target population of 6,422,008 . If not this adjustment is done the sample estimates of population parameters will be biased.
Gambling and Problem Gambling in Sweden
19
However, the weightings could be made even better than the dk weight referred to above by using auxiliary register information. This procedure, so called calibration, reproduces the known totals of the seven auxiliary variables. This means that adding up these weights for the different categories of these variables should give us exactly the right number of men and woman as compared with the population totals, the right age distribution and so on. The new weight, gk, is therefore balancing the marginal distributions to become equal to the distributions of the whole population. If the auxiliary variables correlate with the reasons of non-response, non-contacts and refusals, then this set of weights achieve an effective correction for non-response sampling error and bias. In surveys where calibration of weights are not present to adjust for non-response it is customary to show, for example, that the nonsresponse rate is larger for metropolitan residents than for non-response residents. If the two groups have different gambling behaviors the study has to report that as a result our sample gives biased estimates of the population values. When we are calibrating the weight dk we take the analysis a step further and will be able to actually reduce the bias caused by non-response. This is done by the weight gk, which will be adjusted for the correct numbers of metropolitan residents and of non-metropolitan residents. It should be noted that in this first report the statistical software SPSS is used which permit weights but doesn’t consider complex design when standard errors, t-values and confidence intervals are calculated. As a consequence for example the figures giving us the confidence bounds are approximations but good enough to show the magnitude of uncertainty around the estimated means, percentages, and totals. In some analysis it is more convenient to work with relative weights instead of population weights, weights that are adding up to the number of cases in the response sample; n(respondents)= 7139. As the gk is given in populations terms, adding up to N=6.422.008 individuals, we define the relative weight as: rgk = gk * 7.139 / 6.422.008. When the analysis concerns only part of the sample, a domain, we have to be aware of that standard errors and confidence intervals are not correctly calculated in SPSS for this kind of complex design and also that optimum correction for non-response need domain-specific weights. For the first reporting it is not feasible to use anything else but the above defined registerbased weights, gk and rgk calculated on the full sample, all through the analysis. But for the further analyses the available complex survey programs would be preferable at least to explore the magnitude of the approximation in standard errors and confidence bounds.
Preparation for Analysis and Reporting For easier comparisons of data from the survey with results of similar surveys in other states, detailed demographic data were collapsed to have fewer values for purposes of analysis and comparison. Age collapsed from a continuous variable to five categories (15 to 17, 18 to 24, 25 to 44, 45 to 64 and 65 to 74). Marital or Civil Status collapsed from (8?) values to 5 values (Unmarried, Married, Separated/Divorced, Widowed and Living with Minors). Partial missing consists of left out answers or not logical answers (in mail questionnaires especially when respondents are not making the proper jumps) has been imputed by a random value from answers given by respondents belonging to the same strata (se above under sample design). Don't know answers has in most cases been given the mode value also conditioned by strata.

Gambling and Problem Gambling in Sweden
20
All data analysis, like tables, chi-square analysis, analysis of variance and logit analysis, are weighted, and standard errors, confidence intervals and test of significance are approximations without taking the complex design into account. Chi-square analysis and analyses of variance were used to test for statistical significance.
Gambling and Problem Gambling in Sweden
21
GAMBLING IN SWEDEN While there are approximately 30 different gambling activities available to Swedish residents, the questionnaire for the survey collected information about 17 different types of gambling. Reasons for reducing the number of gambling activities in the survey included concerns about respondent fatigue and the importance of maintaining comparability with international research on gambling. In the Swedish survey, respondents were asked if they had ever played or bet money on the following activities:
• fast lotteries (Lotto-express, Keno,
scratch tickets)
• national lotteries
• local lotteries
• bingo
• televised bingo (Bingo-Lotto)
• sports betting in Sweden (daily and
weekly) (Tips)
• horse race wagering (daily and weekly)
• casino games in restaurants (blackjack,
poker, dice, roulette)
• slot machines (in restaurants, bingo halls,
hotels)
• card games for money (illegal)
• dice games for money (illegal)
• amusement and arcade games
• games of skill (illegal)
• sports betting outside Sweden (illegal)
• stock and financial markets
• other types of gambling in Sweden
• gambling outside Sweden (including
Internet)
Gambling in the General Population In every recent survey of gambling and problem gambling, the majority of respondents acknowledge participating in one or more of the gambling activities included in the questionnaire. In Sweden, 95% of the respondents acknowledged participating in one or more of the 17 gambling activities included in the survey. This lifetime participation rate is comparable to lifetime participation rates in Australia, New Zealand and Canada. Participation rates in the United States tend to be lower than the participation rates in these countries. Figure 1 on the following page shows lifetime and past-year participation rates for different types of gambling included in the survey. When interpreting the diagram it should be kept in mind that lifetime rates include also the past-year participation rate. Lifetime participation among the Swedish respondents is highest for fast lotteries and Bingo-Lotto. Lifetime participation rates are also high for the Joker lottery, local lotteries and sports betting in Sweden. Between 61% and 73% of the respondents acknowledge that they have tried these types of gambling at some time. From one-quarter to one-half of the respondents have wagered on gambling machines, horse races, restaurant casinos and card games for money. Lifetime participation rates are below 15% for all of the other types of gambling included in the survey and past year participation rates are even lower.
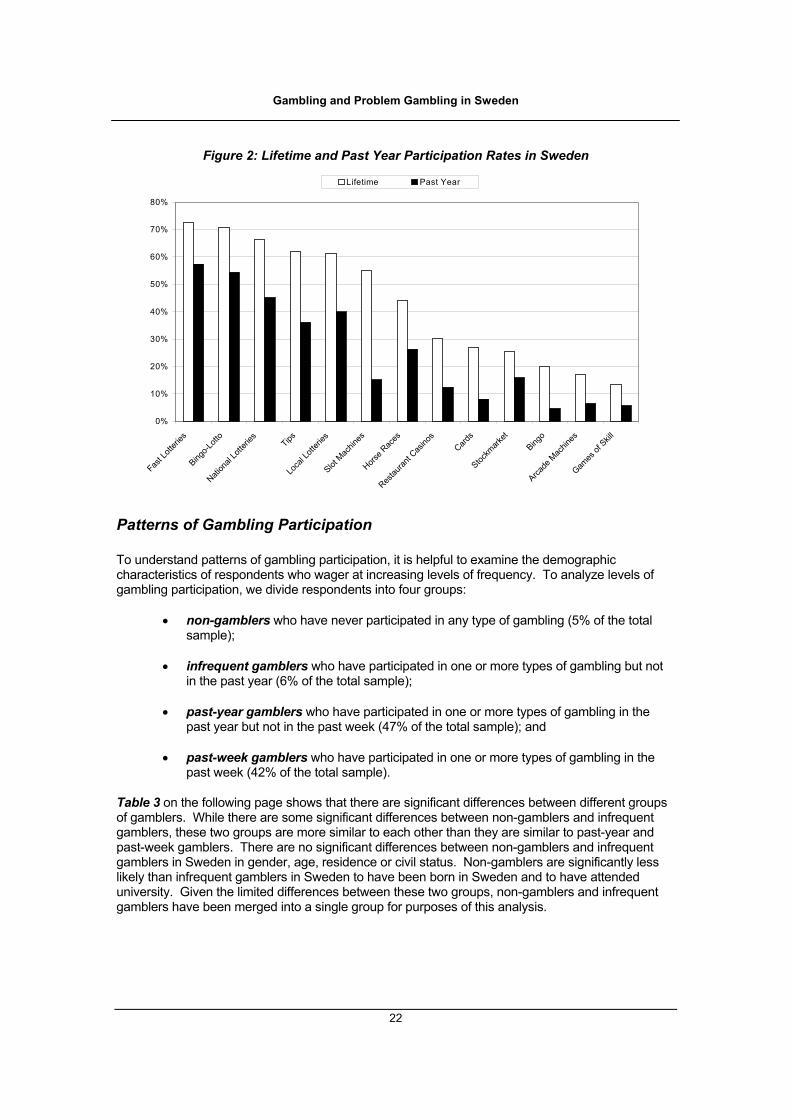
Gambling and Problem Gambling in Sweden
22
Figure 2: Lifetime and Past Year Participation Rates in Sweden
0%
10%
20%
30%
40%
50%
60%
70%
80%
Fast L
otteri
es
Bingo-L
otto
Nation
al Lo
tterie
sTips
Loca
l Lott
eries
Slot M
achin
es
Horse R
aces
Restau
rant C
asino
sCard
s
Stockm
arket
Bingo
Arcade
Mac
hines
Games
of Skill
Lifetime Past Year
Patterns of Gambling Participation To understand patterns of gambling participation, it is helpful to examine the demographic characteristics of respondents who wager at increasing levels of frequency. To analyze levels of gambling participation, we divide respondents into four groups:
• non-gamblers who have never participated in any type of gambling (5% of the total sample);
• infrequent gamblers who have participated in one or more types of gambling but not
in the past year (6% of the total sample); • past-year gamblers who have participated in one or more types of gambling in the
past year but not in the past week (47% of the total sample); and • past-week gamblers who have participated in one or more types of gambling in the
past week (42% of the total sample). Table 3 on the following page shows that there are significant differences between different groups of gamblers. While there are some significant differences between non-gamblers and infrequent gamblers, these two groups are more similar to each other than they are similar to past-year and past-week gamblers. There are no significant differences between non-gamblers and infrequent gamblers in Sweden in gender, age, residence or civil status. Non-gamblers are significantly less likely than infrequent gamblers in Sweden to have been born in Sweden and to have attended university. Given the limited differences between these two groups, non-gamblers and infrequent gamblers have been merged into a single group for purposes of this analysis.
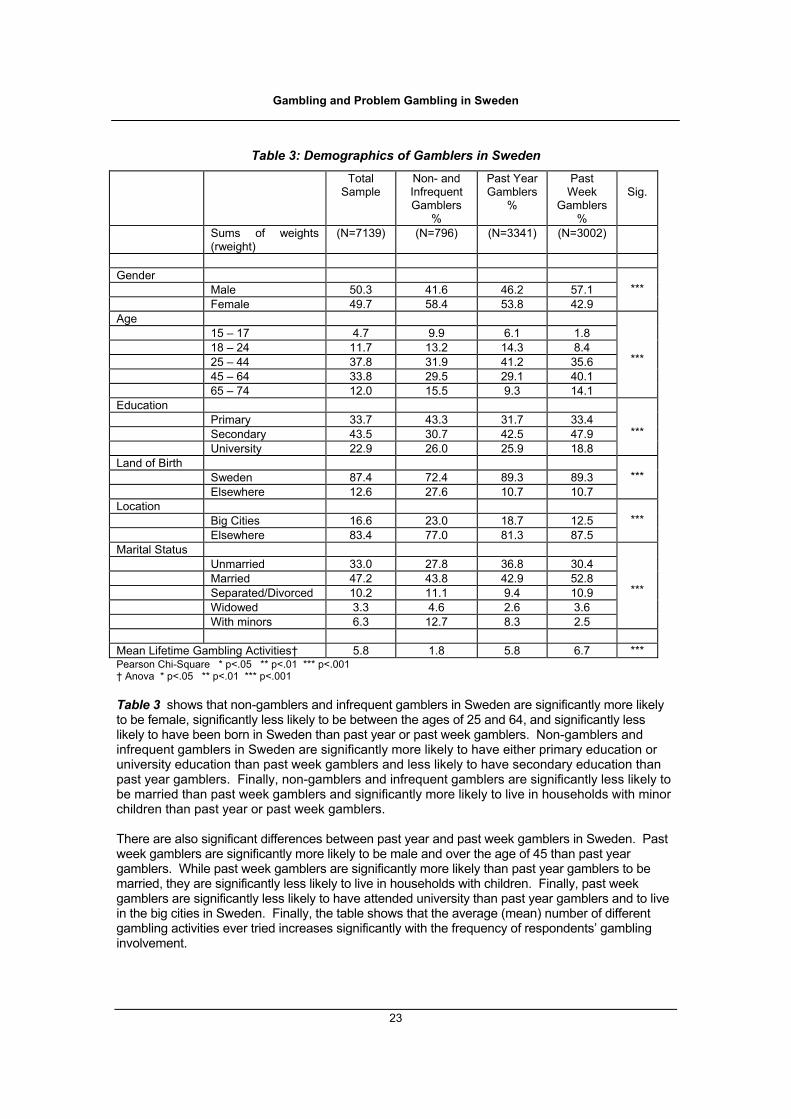
Gambling and Problem Gambling in Sweden
23
Table 3: Demographics of Gamblers in Sweden Total
Sample Non- and Infrequent Gamblers
%
Past Year Gamblers
%
Past Week
Gamblers %
Sig.
Sums of weights (rweight)
(N=7139) (N=796) (N=3341) (N=3002)
Gender Male 50.3 41.6 46.2 57.1 Female 49.7 58.4 53.8 42.9
***
Age 15 – 17 4.7 9.9 6.1 1.8 18 – 24 11.7 13.2 14.3 8.4 25 – 44 37.8 31.9 41.2 35.6 45 – 64 33.8 29.5 29.1 40.1 65 – 74 12.0 15.5 9.3 14.1
***
Education Primary 33.7 43.3 31.7 33.4 Secondary 43.5 30.7 42.5 47.9 University 22.9 26.0 25.9 18.8
***
Land of Birth Sweden 87.4 72.4 89.3 89.3 Elsewhere 12.6 27.6 10.7 10.7
***
Location Big Cities 16.6 23.0 18.7 12.5 Elsewhere 83.4 77.0 81.3 87.5
***
Marital Status Unmarried 33.0 27.8 36.8 30.4 Married 47.2 43.8 42.9 52.8 Separated/Divorced 10.2 11.1 9.4 10.9 Widowed 3.3 4.6 2.6 3.6 With minors 6.3 12.7 8.3 2.5
***
Mean Lifetime Gambling Activities† 5.8 1.8 5.8 6.7 *** Pearson Chi-Square * p<.05 ** p<.01 *** p<.001 † Anova * p<.05 ** p<.01 *** p<.001 Table 3 shows that non-gamblers and infrequent gamblers in Sweden are significantly more likely to be female, significantly less likely to be between the ages of 25 and 64, and significantly less likely to have been born in Sweden than past year or past week gamblers. Non-gamblers and infrequent gamblers in Sweden are significantly more likely to have either primary education or university education than past week gamblers and less likely to have secondary education than past year gamblers. Finally, non-gamblers and infrequent gamblers are significantly less likely to be married than past week gamblers and significantly more likely to live in households with minor children than past year or past week gamblers. There are also significant differences between past year and past week gamblers in Sweden. Past week gamblers are significantly more likely to be male and over the age of 45 than past year gamblers. While past week gamblers are significantly more likely than past year gamblers to be married, they are significantly less likely to live in households with children. Finally, past week gamblers are significantly less likely to have attended university than past year gamblers and to live in the big cities in Sweden. Finally, the table shows that the average (mean) number of different gambling activities ever tried increases significantly with the frequency of respondents’ gambling involvement.

Gambling and Problem Gambling in Sweden
24
In considering differences among gamblers, it is also helpful to examine the demographic characteristics and patterns of gambling participation among respondents whose gambling involvement is limited to only a few types. For example, there is a substantial group of respondents (N=1382 or 19% of the sample) who have ever participated in only one, two or three types of gambling. These lifetime low-frequency gamblers are significantly more likely than the total sample to be female, over the age of 65 and to have been born abroad. These respondents are significantly less likely than the total sample to be unmarried and to have attended secondary school or college. Low-frequency gamblers are most likely to have ever wagered on Bingo-Lotto, fast lotteries, local lotteries, national lotteries, Tips and slot machines in restaurants and bingo halls. These respondents are most likely to identify lottery games, and particularly fast lottery games and Bingo-Lotto, as their favorite type of gambling. Over one-quarter of the low-frequency gamblers (29%) acknowledged gambling in the past week. Similarly, there is a substantial group of respondents (N=1711 or 24% of the sample) who acknowledge participating regularly in only one type of gambling. These past week low-frequency gamblers are significantly more likely than other past week gamblers to be female, under the age of 25, and to have attended university. These respondents are also significantly more likely than other past week gamblers to be living with minors in the household. Past week low-frequency gamblers are most likely to have ever wagered on Bingo-Lotto or fast lottery games followed by national lottery games and Tips. Lifetime participation rates among these respondents are also substantial for local lotteries, slot machines in restaurants and horse race wagering. Past week low-frequency gamblers are most likely to identify Bingo-Lotto, fast lotteries and Tips as their favorite type of gambling.
Expenditures on Gambling Reported estimates of expenditures obtained in this and similar surveys are based on recollection and self-report. There are fundamental uncertainties about the tacit definitions that people use when they are asked to estimate “spending” on different types of gambling (Blaszczynski, Dumlao & Lange 1997). There are also questions about the impact that the social acceptability of different types of gambling may have on reports of expenditures. Finally, there are methodological issues related to sampling small groups of heavy users in general population surveys. These challenges are common to a variety of disciplines, including market research as well as research on alcohol misuse and sexual behavior (Baldridge, Moore, Sylvester & Volberg 1999; Volberg, Moore, Christiansen, Cummings & Banks 1998). For these reasons, data on reported expenditures are best suited for analyzing the relative importance of different types of gambling among a jurisdiction's residents rather than for ascertaining absolute spending levels on different types of wagering. To determine expenditures on gambling in the Swedish sample, the total past month expenditure for each gambling activity is calculated by summing the amount of money reported spent in the past month by each respondent on each gambling activity. The total amount spent in the past month by all respondents on all gambling activities is then calculated. The proportion of the total past month expenditure spent on each gambling activity is calculated by dividing the amount spent on each activity in the past month by the total past month expenditure. The total past month expenditure on all gambling activities is divided by the total number of respondents in the survey to obtain an average amount spent in the past month per respondent.
Adjustments to Expenditures Trading on stocks and the financial markets is not universally regarded as a gambling activity. However, there are people who experience difficulties due to their involvement in these activities. For this reason, stocks and commodities are routinely included in questionnaires for gambling surveys. However, in calculating total past month expenditures on gambling, expenditures on stocks and commodities are typically excluded.
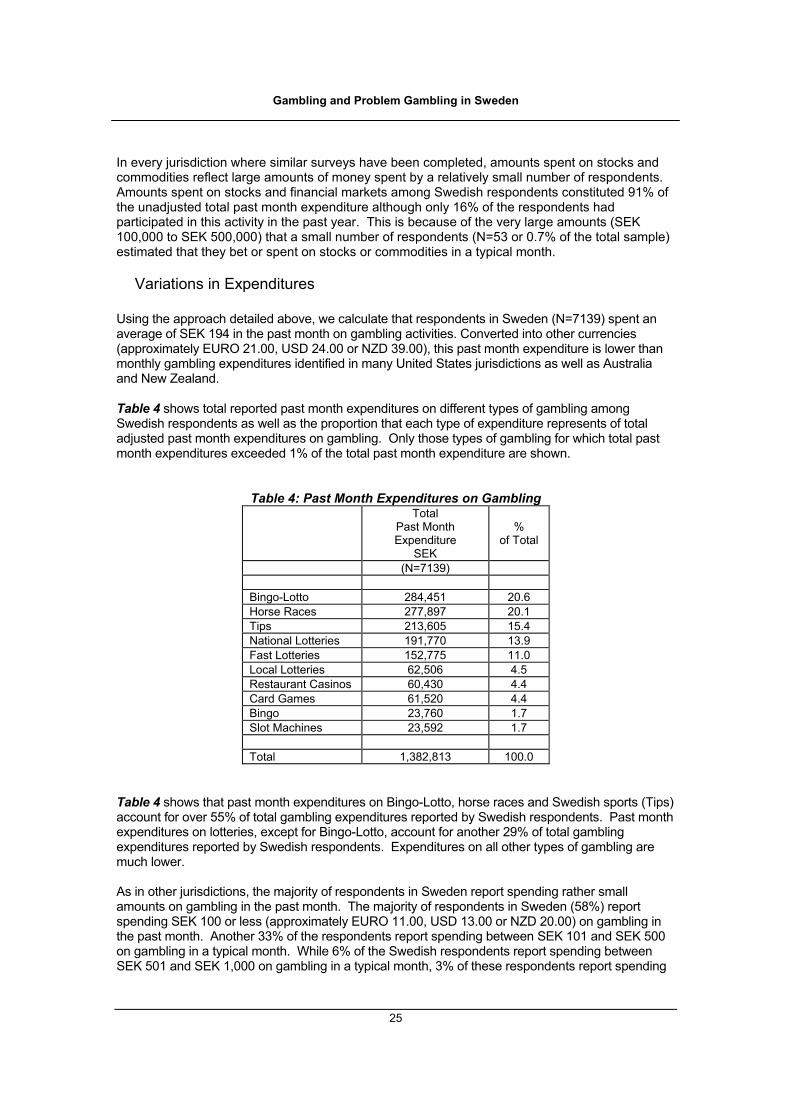
Gambling and Problem Gambling in Sweden
25
In every jurisdiction where similar surveys have been completed, amounts spent on stocks and commodities reflect large amounts of money spent by a relatively small number of respondents. Amounts spent on stocks and financial markets among Swedish respondents constituted 91% of the unadjusted total past month expenditure although only 16% of the respondents had participated in this activity in the past year. This is because of the very large amounts (SEK 100,000 to SEK 500,000) that a small number of respondents (N=53 or 0.7% of the total sample) estimated that they bet or spent on stocks or commodities in a typical month.
Variations in Expenditures Using the approach detailed above, we calculate that respondents in Sweden (N=7139) spent an average of SEK 194 in the past month on gambling activities. Converted into other currencies (approximately EURO 21.00, USD 24.00 or NZD 39.00), this past month expenditure is lower than monthly gambling expenditures identified in many United States jurisdictions as well as Australia and New Zealand. Table 4 shows total reported past month expenditures on different types of gambling among Swedish respondents as well as the proportion that each type of expenditure represents of total adjusted past month expenditures on gambling. Only those types of gambling for which total past month expenditures exceeded 1% of the total past month expenditure are shown.
Table 4: Past Month Expenditures on Gambling Total
Past Month Expenditure
SEK
%
of Total
(N=7139) Bingo-Lotto 284,451 20.6 Horse Races 277,897 20.1 Tips 213,605 15.4 National Lotteries 191,770 13.9 Fast Lotteries 152,775 11.0 Local Lotteries 62,506 4.5 Restaurant Casinos 60,430 4.4 Card Games 61,520 4.4 Bingo 23,760 1.7 Slot Machines 23,592 1.7 Total 1,382,813 100.0
Table 4 shows that past month expenditures on Bingo-Lotto, horse races and Swedish sports (Tips) account for over 55% of total gambling expenditures reported by Swedish respondents. Past month expenditures on lotteries, except for Bingo-Lotto, account for another 29% of total gambling expenditures reported by Swedish respondents. Expenditures on all other types of gambling are much lower. As in other jurisdictions, the majority of respondents in Sweden report spending rather small amounts on gambling in the past month. The majority of respondents in Sweden (58%) report spending SEK 100 or less (approximately EURO 11.00, USD 13.00 or NZD 20.00) on gambling in the past month. Another 33% of the respondents report spending between SEK 101 and SEK 500 on gambling in a typical month. While 6% of the Swedish respondents report spending between SEK 501 and SEK 1,000 on gambling in a typical month, 3% of these respondents report spending

Gambling and Problem Gambling in Sweden
26
SEK 1,000 or more on gambling in a typical month. The small group of respondents who spend SEK 1,000 or more accounts for 30% of reported past month expenditures on gambling in Sweden while the larger group of respondents who spend SEK 501 or more accounts for 52% of the total reported past month expenditures on gambling. Respondents who spend SEK 501 (approximately EURO 56.00, USD 63.00 or NZD 100.00) or more on gambling in the past month in Sweden are significantly more likely than respondents who spend less to be male, between the ages of 25 and 64 and unmarried or living without minors in the household. These respondents are significantly less likely than those who spent less on gambling in the past month to have attended university. As in other jurisdictions, there are statistically significant differences in past month expenditures on gambling across demographic groups. Table 5 shows significant differences in the mean reported expenditures on gambling in the past month by different demographic groups.
Table 5: Past Month Expenditures by Different Groups in Sweden Mean Past Month
Expenditure SEK
Sig.
(N=7139) Gender Male 274 Female 112
***
Age 15 – 17 58 18 – 24 207 25 – 44 201 45 – 64 208 65 – 74 169
***
Education Primary 193 Secondary 229 University 128
***
Land of Birth Sweden 193 Elsewhere 199
NS
Location Big Cities 214 Elsewhere 190
NS
Marital Status Unmarried 234 Married 176 Separated/Divorced 231 Widowed 176 With minors 63
***
Anova * p<.05 ** p<.01 *** p<.001
Table 5 shows that men in Sweden estimate that they spent more than twice as much on gambling in the past month as women. Respondents aged 15 to 17 estimate that they spent about one-third as much on gambling in the past month as respondents aged 18 to 74. Respondents who have attended university estimate that they spent significantly less on gambling in the past month than respondents with lower levels of education. Finally, respondents who are unmarried, separated or divorced estimate that they spent significantly more on gambling in the past month than respondents who are married, widowed or who live with minors. There are no statistically significant differences in estimated past month expenditures among

Gambling and Problem Gambling in Sweden
27
Swedish-born and non-Swedish born respondents or among respondents who live in big cities in contrast to the rest of Sweden.
Gambling Preferences For several types of gambling, respondents who acknowledged participation in the past year were asked about their preferences for particular products or places. These types of gambling included fast lotteries, national lotteries, local lotteries, Tips and restaurant casinos.
Fast Lotteries Respondents who acknowledged playing fast lottery games in the past year were asked which games they preferred. Among respondents who played fast lottery games in the past year (N=4095), 82% indicated that Skraplotter (including Tia, Triss and Triss-Bingo) was their preferred game. Other types of fast lottery games, including Keno and Lotto-Express were far less popular with only 3% and 2%, respectively, of past year players indicating that these were their preferred fast lottery games. A substantial proportion of respondents who had played fast lottery games in the past year (13%) indicated that they did not have a strong preference for a single game. There are large differences in average gambling expenditures among fast lottery players based on their preferred game. Respondents who indicated that Keno or Lotto-Express was their preferred game estimate that they spent significantly more on all types of gambling in the past month than respondents whose preference is for other fast lottery games. Keno players estimate that they spend an average of SEK 758 and Lotto-Express players estimate that they spent an average of SEK 444 on all types of gambling in the past month compared to the average of SEK 264 among past year fast lottery players as a whole.
National Lotteries Respondents who acknowledged playing national lottery games in the past year were asked which games they preferred. Among respondents who played national lottery games in the past year (N=3223), 49% indicated that Lotto was their preferred game and 17% indicated that Joker was their preferred game. Other national lottery games, including Penninglotter (11%), Tipsbingo (7%), and Viking Lotto (2%) were much less popular. Again, a substantial proportion of respondents who had played national lottery games in the past year (20%) indicated that they did not have a strong preference for a single game. Differences in average gambling expenditures among national lottery players based on their preferred game are smaller than among fast lottery players. Respondents who indicated that Viking Lotto or Tipsbingo was their preferred game estimate that they spent significantly more on gambling in the past month than respondents whose preference is for other national lottery games. Viking Lotto players estimate that they spent an average of SEK 490 and Tipsbingo players estimate that they spent an average of SEK 383 on all types of gambling in the past month compared to the average of SEK 292 among past year national lottery players as a whole.
Local Lotteries Respondents who acknowledged playing local lottery games in the past year were asked which games they preferred. Among respondents who played local lottery games in the past year (N=2851), 36% indicated that they preferred to play lotteries run by non-profit organizations (Ideella ändamål), 31% indicated that Föreningslotter was their preferred game and 11% indicated that Tombolalotter was their preferred game. As with fast and national lotteries, there

Gambling and Problem Gambling in Sweden
28
was a substantial proportion of respondents who had played local lottery games in the past year (26%) who did not have a preference for a single game. In contrast to the fast and national lotteries, there were no significant differences in average gambling expenditures among local lottery players based on their preferred game. The average estimated expenditure on all types of gambling in the past month among local lottery players was SEK 238.
Tips (Swedish Sports Pools) Respondents who acknowledged wagering on Swedish sports pools in the past year were asked which game they preferred. Among respondents who wagered on Swedish sports pools in the past year (N=2575), 44% indicated that Stryktipset (all types) was their preferred game, 25% indicated that Måltipset was their preferred game, 13% preferred Oddset and 16% had no preference for one game or another. Average gambling expenditures among respondents who wager on Swedish sports pools are SEK 357 in the past month. This is significantly higher than average gambling expenditures among the Swedish respondents as a whole (SEK 194) as well as among Swedish respondents who have not wagered on Swedish sports pools in the past year (SEK 101) (p=.000).
Restaurant Casinos Respondents who acknowledged wagering at restaurant casinos in the past year were asked which casino game they preferred. Among respondents who wagered at restaurant casinos in the past year (N=884), 69% indicated that their preferred game was Black-Jack and 31% indicated that their preferred game was Roulette. There are substantial differences in average gambling expenditures among respondents who prefer different restaurant casino games. Respondents who indicated that Black-Jack was their preferred game estimate that they spent significantly less in the past month than respondents whose preference is for Roulette. Black-Jack players estimate that they spent an average of SEK 385 on all types of gambling in the past month compared to the average of SEK 449 among past year restaurant casino gamblers as a whole. In contrast, Roulette players estimate that they spent an average of SEK 631 on all types of gambling in the past month.
Gambling and Problem Gambling in Sweden
29
PROBLEM AND PATHOLOGICAL GAMBLING IN SWEDEN Pathological gambling is viewed by the psychiatric profession as a chronic disorder, like alcoholism or manic depression. Individuals who suffer from chronic disorders may have periods where they are relatively symptom-free. However, this does not necessarily mean that the person is free of the disorder. While a psychiatric diagnosis does not require that specific symptoms be clustered tightly together in time, prevalence studies of chronic disorders often obtain information about past year symptoms to determine whether an individual has experienced a cluster of symptoms in the past year. In general, prevalence studies of problem and pathological gambling follow this practice (National Opinion Research Center 1999; Volberg 1998 – NRC). In prevalence surveys, individuals are generally categorized as problem gamblers or probable pathological gamblers on the basis of their responses to the questions included in the South Oaks Gambling Screen or one of the other screens developed to identify individuals with gambling-related difficulties. In discussing the results of surveys based on the South Oaks Gambling Screen, the term probable distinguishes the results of prevalence surveys, where classification is based on responses to questions in a telephone interview, from a clinical diagnosis. Respondents scoring three or four out of a possible 20 points on the South Oaks Gambling Screen items are classified as "problem gamblers" while those scoring five or more points are classified as "probable pathological gamblers." In prevalence surveys based on the revised South Oaks Gambling Screen (SOGS-R) developed by Abbott and Volberg in New Zealand in 1991, a distinction is also made between "lifetime" and "current" problem and probable pathological gamblers. Lifetime problem and probable pathological gamblers are individuals who have, at some time in their lives, met the South Oaks Gambling Screen criteria for problem or pathological gambling. Current problem and probable pathological gamblers are individuals who have met these criteria in the past year. Not all lifetime problem and probable pathological gamblers meet sufficient criteria to be classified as current problem and probable pathological gamblers. For example, a middle-aged individual who reported experiencing significant gambling-related difficulties in youth but no longer reports such difficulties would be referred to as a lifetime problem gambler. As noted in the section Validating the SOGS-R on Page 13, research on the performance of the South Oaks Gambling Screen has shown that the lifetime screen is very good at detecting pathological gambling among those who currently experience the disorder. However, as expected, the screen identifies at-risk individuals at the expense of generating a substantial number of false positives. The current SOGS produces fewer false positives than the lifetime measure but more false negatives and thus provides a weaker screen for identifying pathological gamblers in the clinical sense. However, the greater efficiency of the current SOGS makes it a more useful tool for detecting rates of change in the prevalence of problem and pathological gambling over time, which will be useful of this baseline study of 1997-98 will be repeted at a later stage.
Prevalence Rates Prevalence rates are based on the proportion of respondents who score on increasing numbers of items that make up the lifetime and current (or past year) scale of the revised South Oaks Gambling Screen. Table 6 on the following page presents information about the proportion of respondents who score on an increasing number of items on the lifetime and current SOGS-R. For the lifetime SOGS-R, individuals scoring 12 points or higher have been grouped together. For the current SOGS-R, individuals scoring 8 points or higher have been grouped together. Table 6 also presents the prevalence of lifetime problem and probable pathological gambling based on established criteria for discriminating between respondents without gambling-related difficulties
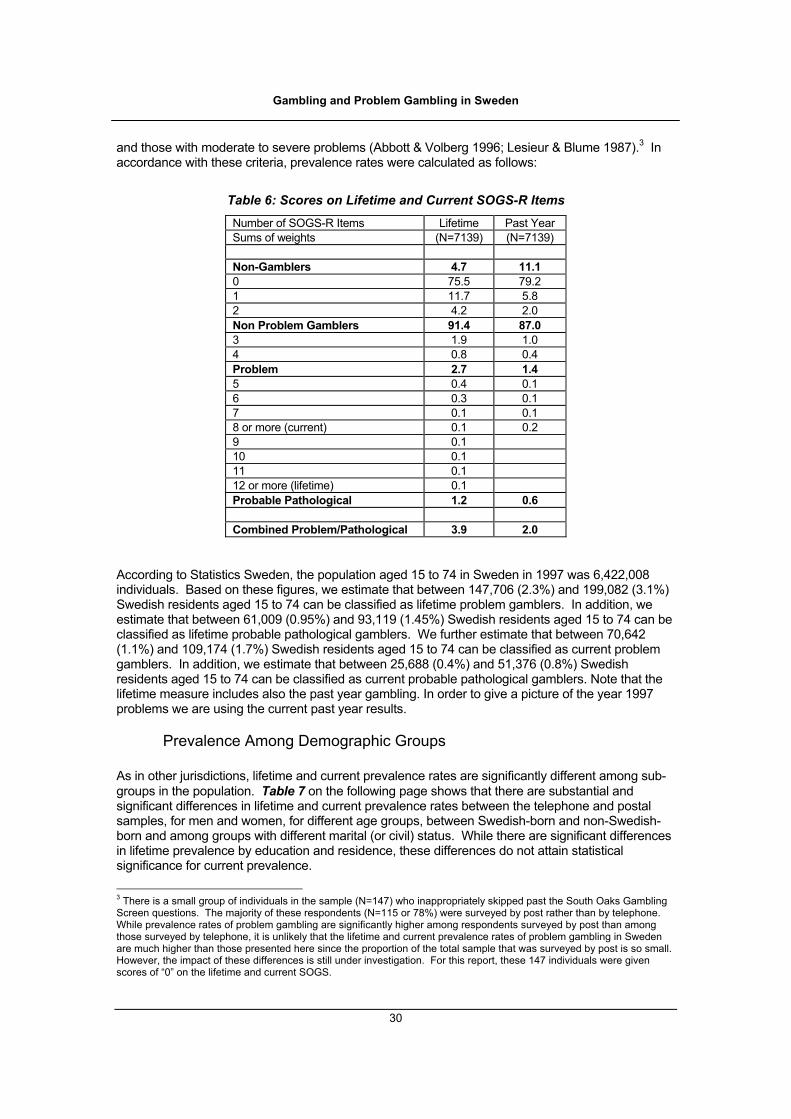
Gambling and Problem Gambling in Sweden
30
and those with moderate to severe problems (Abbott & Volberg 1996; Lesieur & Blume 1987).3 In accordance with these criteria, prevalence rates were calculated as follows:
Table 6: Scores on Lifetime and Current SOGS-R Items Number of SOGS-R Items Lifetime Past Year Sums of weights (N=7139) (N=7139) Non-Gamblers 4.7 11.1 0 75.5 79.2 1 11.7 5.8 2 4.2 2.0 Non Problem Gamblers 91.4 87.0 3 1.9 1.0 4 0.8 0.4 Problem 2.7 1.4 5 0.4 0.1 6 0.3 0.1 7 0.1 0.1 8 or more (current) 0.1 0.2 9 0.1 10 0.1 11 0.1 12 or more (lifetime) 0.1 Probable Pathological 1.2 0.6 Combined Problem/Pathological 3.9 2.0
According to Statistics Sweden, the population aged 15 to 74 in Sweden in 1997 was 6,422,008 individuals. Based on these figures, we estimate that between 147,706 (2.3%) and 199,082 (3.1%) Swedish residents aged 15 to 74 can be classified as lifetime problem gamblers. In addition, we estimate that between 61,009 (0.95%) and 93,119 (1.45%) Swedish residents aged 15 to 74 can be classified as lifetime probable pathological gamblers. We further estimate that between 70,642 (1.1%) and 109,174 (1.7%) Swedish residents aged 15 to 74 can be classified as current problem gamblers. In addition, we estimate that between 25,688 (0.4%) and 51,376 (0.8%) Swedish residents aged 15 to 74 can be classified as current probable pathological gamblers. Note that the lifetime measure includes also the past year gambling. In order to give a picture of the year 1997 problems we are using the current past year results.
Prevalence Among Demographic Groups As in other jurisdictions, lifetime and current prevalence rates are significantly different among sub-groups in the population. Table 7 on the following page shows that there are substantial and significant differences in lifetime and current prevalence rates between the telephone and postal samples, for men and women, for different age groups, between Swedish-born and non-Swedish-born and among groups with different marital (or civil) status. While there are significant differences in lifetime prevalence by education and residence, these differences do not attain statistical significance for current prevalence.
3 There is a small group of individuals in the sample (N=147) who inappropriately skipped past the South Oaks Gambling Screen questions. The majority of these respondents (N=115 or 78%) were surveyed by post rather than by telephone. While prevalence rates of problem gambling are significantly higher among respondents surveyed by post than among those surveyed by telephone, it is unlikely that the lifetime and current prevalence rates of problem gambling in Sweden are much higher than those presented here since the proportion of the total sample that was surveyed by post is so small. However, the impact of these differences is still under investigation. For this report, these 147 individuals were given scores of “0” on the lifetime and current SOGS.
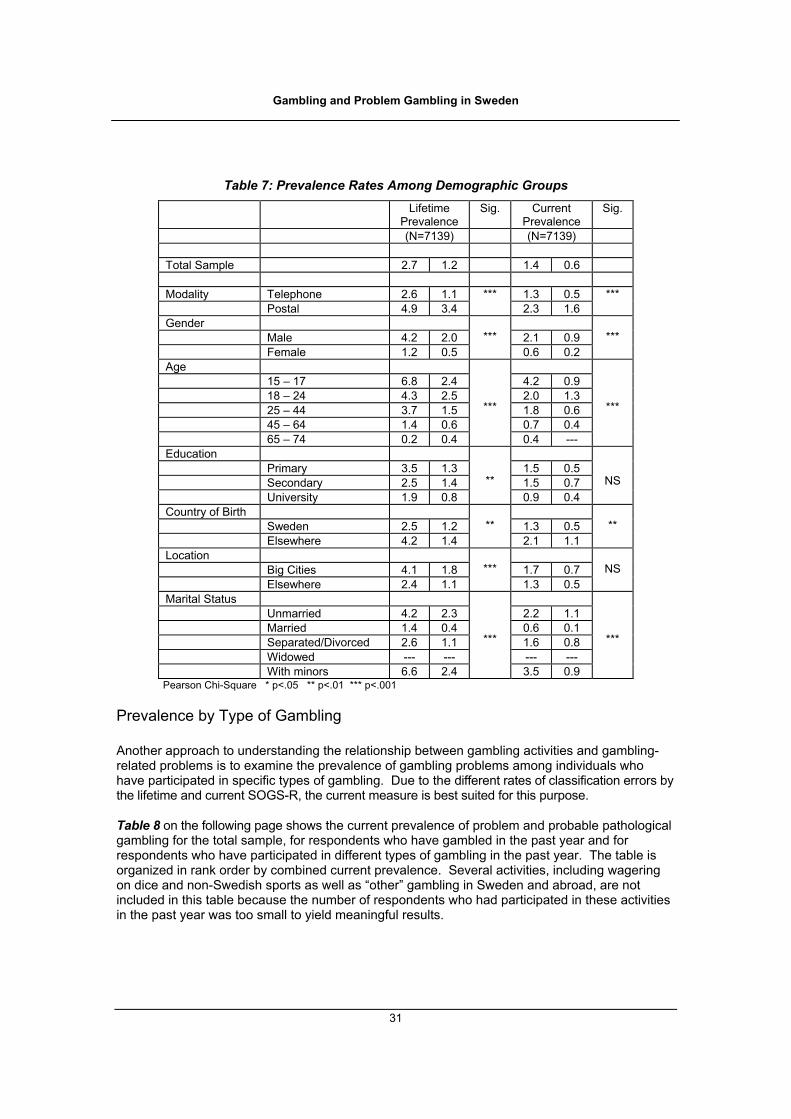
Gambling and Problem Gambling in Sweden
31
Table 7: Prevalence Rates Among Demographic Groups Lifetime
Prevalence Sig. Current
Prevalence Sig.
(N=7139) (N=7139) Total Sample 2.7 1.2 1.4 0.6 Modality Telephone 2.6 1.1 1.3 0.5 Postal 4.9 3.4
*** 2.3 1.6
***
Gender Male 4.2 2.0 2.1 0.9 Female 1.2 0.5
***
0.6 0.2
***
Age 15 – 17 6.8 2.4 4.2 0.9 18 – 24 4.3 2.5 2.0 1.3 25 – 44 3.7 1.5 1.8 0.6 45 – 64 1.4 0.6 0.7 0.4 65 – 74 0.2 0.4
***
0.4 ---
***
Education Primary 3.5 1.3 1.5 0.5 Secondary 2.5 1.4 1.5 0.7 University 1.9 0.8
** 0.9 0.4
NS
Country of Birth Sweden 2.5 1.2 1.3 0.5 Elsewhere 4.2 1.4
**
2.1 1.1
**
Location Big Cities 4.1 1.8 1.7 0.7 Elsewhere 2.4 1.1
***
1.3 0.5
NS
Marital Status Unmarried 4.2 2.3 2.2 1.1 Married 1.4 0.4 0.6 0.1 Separated/Divorced 2.6 1.1 1.6 0.8 Widowed --- --- --- --- With minors 6.6 2.4
***
3.5 0.9
***
Pearson Chi-Square * p<.05 ** p<.01 *** p<.001
Prevalence by Type of Gambling Another approach to understanding the relationship between gambling activities and gambling-related problems is to examine the prevalence of gambling problems among individuals who have participated in specific types of gambling. Due to the different rates of classification errors by the lifetime and current SOGS-R, the current measure is best suited for this purpose. Table 8 on the following page shows the current prevalence of problem and probable pathological gambling for the total sample, for respondents who have gambled in the past year and for respondents who have participated in different types of gambling in the past year. The table is organized in rank order by combined current prevalence. Several activities, including wagering on dice and non-Swedish sports as well as “other” gambling in Sweden and abroad, are not included in this table because the number of respondents who had participated in these activities in the past year was too small to yield meaningful results.

Gambling and Problem Gambling in Sweden
32
Table 8: Prevalence by Type of Gambling Past Year Activities
Group Size
Current Problem
%
Current Probable
Pathological %
Current Total
%
Conf.
Interval
Total Sample 7139 1.4 0.6 2.0 ±0.3 Past Year Gamblers 6343 1.5 0.6 2.1 ±.03 Local Lotteries 2851 1.5 0.5 2.0 ±0.5 Stockmarket 1134 1.7 0.5 2.2 ±0.9 Bingo-Lotto 3883 1.6 0.7 2.3 ±0.5 National Lotteries 3223 1.8 0.8 2.6 ±0.5 Fast Lotteries 4095 1.9 0.8 2.7 ±0.5 Tips 2575 2.8 1.2 4.0 ±0.8 Horse Races 1875 2.7 1.3 4.0 ±0.9 Slot Machines 1080 3.6 1.7 5.3 ±1.3 Bingo 327 2.5 2.8 5.3 ±2.4 Restaurant Casinos 884 5.9 2.6 8.5 ±1.8 Cards 582 5.9 3.0 8.9 ±2.3 Arcade Machines 461 6.3 2.8 9.1 ±2.6 Games of Skill 410 6.4 2.8 9.2 ±2.8
Table 8 shows that the current prevalence of problem and probable pathological gambling among past year lottery players, including local lotteries, Bingo-Lotto, national lotteries and fast lotteries, is equal to or slightly higher than the prevalence rate among all past year gamblers. Current prevalence rates among past year gamblers on Swedish sports pools (Tips), horse races, slot machines and bingo are approximately double the current prevalence rate among past year gamblers in general. Current prevalence rates among past year gamblers in restaurant casinos, on card games not at casinos, on arcade machines and on games of skill are approximately four times the current prevalence rate among past year gamblers in general. While the small size of some of these groups of past year players suggests caution in interpreting these numbers, this analysis points to the importance of focusing public education and prevention efforts on particular gambling venues and outlets, including sports betting outlets, racetracks and off-track betting outlets, bingo halls, restaurant casinos and video arcades.
Statistical Characteristics of the SOGS-R The psychometric properties of the SOGS-R are important in assessing the accuracy of the primary method used to identify problem and pathological gamblers in the general population in Sweden. There are different kinds of error inherent in any set of data. While sampling error is addressed by using statistical techniques to calculate standard errors, to reject the “null hypothesis”, to calculate the probability that a particular result is significant, measurement error, a so called non-sampling error, is more difficult to assess. The accuracy of any instrument is determined by looking at the reliability and validity of the instrument (Litwin 1995). The reliability of an instrument refers to the ability to reproduce the results of the application of the test. The validity of an instrument refers to the ability of the instrument to measure what it is intended to measure. In examining the psychometric properties of the SOGS-R, we assess its reliability by examining the internal consistency of the screen and
Gambling and Problem Gambling in Sweden
33
we assess its validity by examining behaviors that are associated with problem gambling but are not included in the measurement scale.
Reliability of the SOGS-R There are three common tests of the reliability of a survey instrument. These include the test-retest approach, in which the same respondents complete the survey at two different points in time, the alternate-form approach, in which differently worded questions are used to measure the same attribute, and the internal consistency approach, in which groups of items are tested to see how well they measure the same phenomenon. In Sweden, only the internal consistency approach could be tested. The reliability of the SOGS-R in the Swedish sample is excellent with Cronbach’s alpha at .90 for both the lifetime and current measures, substantially higher than the .70 that is generally accepted as representing good reliability.
Item Analysis In considering the prevalence of problem gambling among the Swedish respondents, it is helpful to consider the proportion of respondents who answer each question. The South Oaks Gambling Screen can be divided into two relatively distinct sections. The first section of 11 questions assesses cognitions and behaviors related to the individual’s attitudes towards their gambling. The second section of nine questions assesses behaviors related to an individual’s efforts to obtain resources with which to gamble or to pay gambling-related debts. Table 9 shows the proportion of the Swedish sample that responded positively (i.e. at a level that would cause the respondent to score on that item) for each of the items included in the South Oaks Gambling Screen. Positive responses to these items are substantially lower among Swedish respondents than among respondents in other jurisdictions. Endorsement of individual items from the SOGS-R among Swedish respondents ranged from a high of 13% for the lifetime measure “Do you ever spend more time or money gambling than you intended?” to a low of 0.1% for two of the lifetime borrowing items, including borrowing from a loanshark and borrowing by bouncing a check.
Table 9: Positive Responses on SOGS-R Items in percent
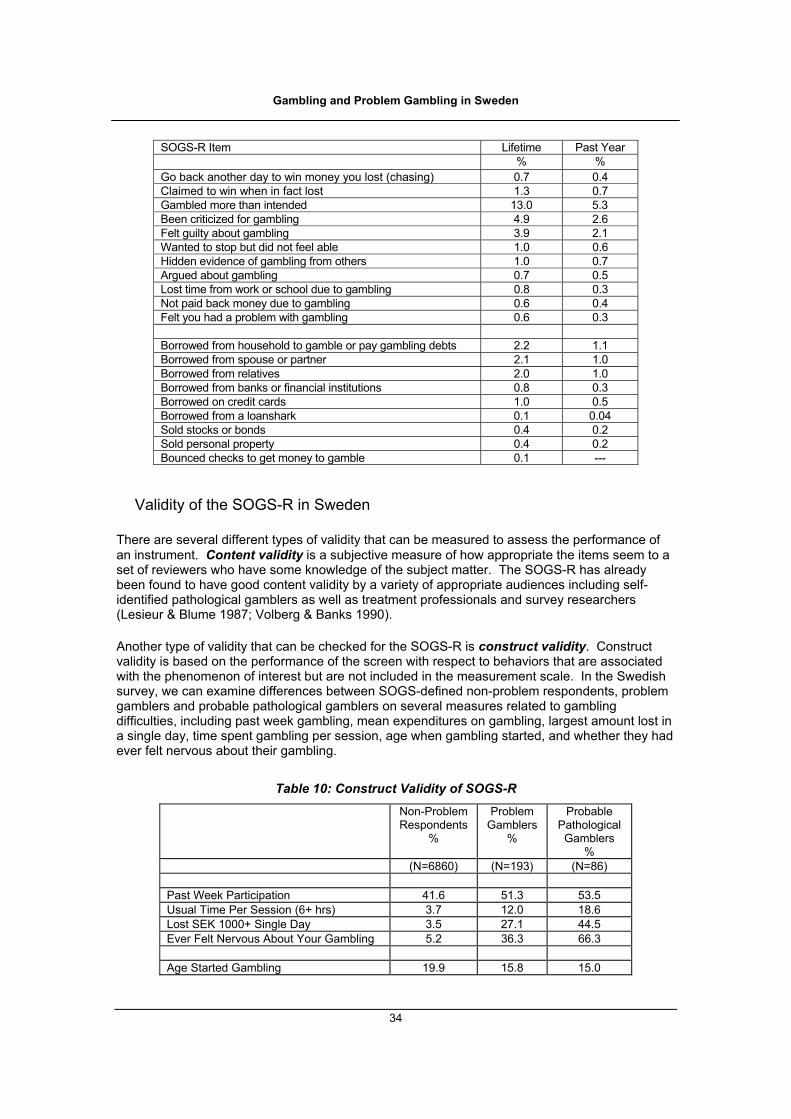
Gambling and Problem Gambling in Sweden
34
SOGS-R Item Lifetime Past Year % % Go back another day to win money you lost (chasing) 0.7 0.4 Claimed to win when in fact lost 1.3 0.7 Gambled more than intended 13.0 5.3 Been criticized for gambling 4.9 2.6 Felt guilty about gambling 3.9 2.1 Wanted to stop but did not feel able 1.0 0.6 Hidden evidence of gambling from others 1.0 0.7 Argued about gambling 0.7 0.5 Lost time from work or school due to gambling 0.8 0.3 Not paid back money due to gambling 0.6 0.4 Felt you had a problem with gambling 0.6 0.3 Borrowed from household to gamble or pay gambling debts 2.2 1.1 Borrowed from spouse or partner 2.1 1.0 Borrowed from relatives 2.0 1.0 Borrowed from banks or financial institutions 0.8 0.3 Borrowed on credit cards 1.0 0.5 Borrowed from a loanshark 0.1 0.04 Sold stocks or bonds 0.4 0.2 Sold personal property 0.4 0.2 Bounced checks to get money to gamble 0.1 ---
Validity of the SOGS-R in Sweden There are several different types of validity that can be measured to assess the performance of an instrument. Content validity is a subjective measure of how appropriate the items seem to a set of reviewers who have some knowledge of the subject matter. The SOGS-R has already been found to have good content validity by a variety of appropriate audiences including self-identified pathological gamblers as well as treatment professionals and survey researchers (Lesieur & Blume 1987; Volberg & Banks 1990). Another type of validity that can be checked for the SOGS-R is construct validity. Construct validity is based on the performance of the screen with respect to behaviors that are associated with the phenomenon of interest but are not included in the measurement scale. In the Swedish survey, we can examine differences between SOGS-defined non-problem respondents, problem gamblers and probable pathological gamblers on several measures related to gambling difficulties, including past week gambling, mean expenditures on gambling, largest amount lost in a single day, time spent gambling per session, age when gambling started, and whether they had ever felt nervous about their gambling.
Table 10: Construct Validity of SOGS-R Non-Problem
Respondents %
Problem Gamblers
%
Probable Pathological Gamblers
% (N=6860) (N=193) (N=86) Past Week Participation 41.6 51.3 53.5 Usual Time Per Session (6+ hrs) 3.7 12.0 18.6 Lost SEK 1000+ Single Day 3.5 27.1 44.5 Ever Felt Nervous About Your Gambling 5.2 36.3 66.3 Age Started Gambling 19.9 15.8 15.0
Gambling and Problem Gambling in Sweden
35
Median Total Expenditures SEK 60 SEK 225 SEK 356 As Table 10 shows (also see Comparing Non-Problem and Problem Gamblers on Page 38), all of these behaviors provide support for the construct validity of the South Oaks Gambling Screen. Problem and probable pathological gamblers are significantly more likely than non-problem respondents to have gambled in the past week on one or more activities and to spend six or more hours gambling in a single session. Problem and probable pathological gamblers spend significantly more on gambling than non-problem respondents and are significantly more likely to have lost SEK 1,000 or more in a single day. Finally, problem and probable pathological gamblers acknowledge starting to gamble at a significantly younger age than non-problem respondents and are significantly more likely to have felt nervous about their gambling at some time.
Natural Recovery Most gambling surveys conducted since 1990 have collected information on current as well as lifetime prevalence rates of problem and probable pathological gambling. The difference between lifetime and current prevalence rates represents individuals who have experienced a gambling problem at some time in their lives but do not score as having a gambling problem currently. Since there are few available treatment services for problem and pathological gamblers in most states, researchers have called these problem and pathological gamblers in natural recovery (Abbott & Volberg 1991; Wynne, Smith & Volberg 1994). As in other jurisdictions, a proportion of the Swedish respondents who score as lifetime problem or probable pathological gamblers do not score as having a current problem or pathology. In Sweden, 50% of lifetime problem and probable pathological gamblers do not score as having a current problem or pathology. Another explanation of this number is that one out of every two individuals who have ever experienced gambling problems in Sweden are currently experiencing such difficulties. Further analysis and longitudinal research is needed to investigate the phenomenon of natural recovery among problem and pathological gamblers. Preliminary results from the first longitudinal research on problem gamblers, presently underway in New Zealand, suggests that the lifetime items from the South Oaks Gambling Screen are quite labile over time (Abbott, personal communication). It is possible that the lifetime measure identifies “binge” or periodic problem and pathological gamblers better than the current measure. It is also possible that respondents in surveys are more comfortable acknowledging a behavior as having “ever” occurred than they are acknowledging that this behavior has occurred recently.
Comparing Problem Gambling Prevalence Across Jurisdictions Until the publication of the DSM-IV (American Psychiatric Association 1994), the original South Oaks Gambling Screen, along with modified and revised versions of the screen, was the tool most often used to identify individuals with gambling-related difficulties in clinical settings as well as in survey samples (Volberg 1998 – NRC; Volberg & Banks 1990). The original SOGS was used in six state surveys in the United States between 1986 and 1990 (Volberg 1994; Volberg & Steadman 1988). Since 1990, modified or revised versions of the SOGS have been used in numerous state and provincial surveys in North America as well as in New Zealand, Spain and Australia. Our comparison in this section is limited to studies in North America conducted since 1996 because prevalence rates of problem gambling among adults have increased significantly over time (Shaffer, Hall & Vander Bilt 1997). In analyzing 120 surveys carried out in North America between 1977 and 1997, this meta-analysis found that half of the studies had been carried out in 1993 or before while half had been carried out since 1993. The lifetime prevalence of problem

Gambling and Problem Gambling in Sweden
36
gambling in studies carried out since 1993 is two-thirds higher than the lifetime prevalence of problem gambling in studies carried out earlier. The current prevalence of probable pathological gambling in studies carried out since 1993 is 54% higher than the current prevalence of probable pathological gambling in studies carried out earlier. Figure 3 on the following page shows prevalence rates of lifetime problem and probable pathological gambling in North American jurisdictions where surveys based on the South Oaks Gambling Screen have been completed since 1996. Prevalence rates from the baseline survey in New Zealand in 1991 are included for comparative purposes. Figure 3 shows that the lifetime prevalence rates of problem and probable pathological gambling are lower in Sweden than in North American states and provinces surveyed in recent years as well as in New Zealand in 1991. Jurisdictions with the highest lifetime prevalence rates tend to be ethnically heterogeneous while jurisdictions with lower lifetime prevalence rates tend to be ethnically homogeneous.
Figure 3: Lifetime Prevalence Rates in Selected Jurisdictions
0 .0%
2.0%
4.0%
6.0%
8.0%
10 .0%
12 .0%
SW 1998
QE 1996
OR 1997
NB 1996
MI 199
7
CT 1996
MT 1998
CO 1997
MS 1996
NZ 1991
NY 1996
AL 199
8
BC 1996
L ife tim e P rob lem L ife tim e P robab le P a tho log ica l
Figure 4 shows prevalence rates of current problem and probable pathological gambling in North American jurisdictions where surveys based on the South Oaks Gambling Screen have been completed since 1996. Prevalence rates from the prevalence survey in New Zealand in 1991 are included for comparative purposes.
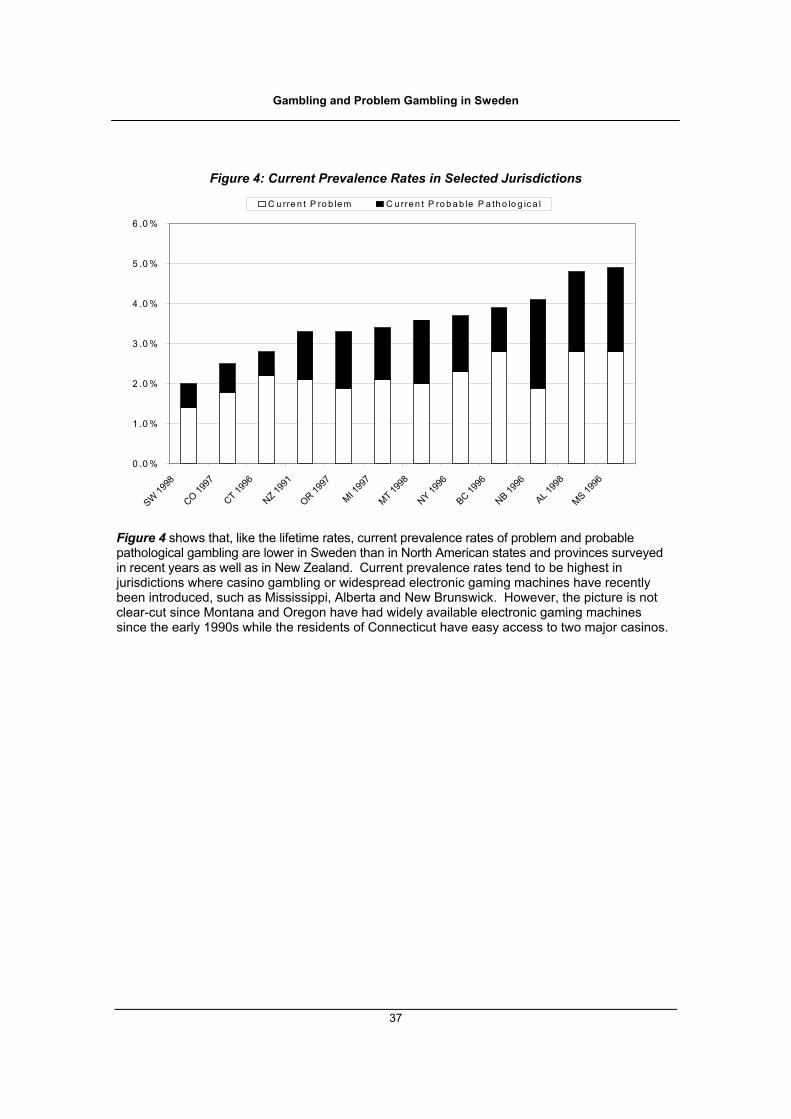
Gambling and Problem Gambling in Sweden
37
Figure 4: Current Prevalence Rates in Selected Jurisdictions
0 .0 %
1 .0 %
2 .0 %
3 .0 %
4 .0 %
5 .0 %
6 .0 %
SW 1998
CO 1997
CT 1996
NZ 1991
OR 1997
MI 199
7
MT 1998
NY 1996
BC 1996
NB 1996
AL 199
8
MS 1996
C u rre n t P ro b le m C u rre n t P ro b a b le P a th o lo g ic a l
Figure 4 shows that, like the lifetime rates, current prevalence rates of problem and probable pathological gambling are lower in Sweden than in North American states and provinces surveyed in recent years as well as in New Zealand. Current prevalence rates tend to be highest in jurisdictions where casino gambling or widespread electronic gaming machines have recently been introduced, such as Mississippi, Alberta and New Brunswick. However, the picture is not clear-cut since Montana and Oregon have had widely available electronic gaming machines since the early 1990s while the residents of Connecticut have easy access to two major casinos.
Gambling and Problem Gambling in Sweden
38
COMPARING NON-PROBLEM AND PROBLEM GAMBLERS IN SWEDEN
In considering the development of policies and programs for problem gamblers, it is important to direct these efforts in an effective and efficient way. The most effective efforts at prevention, outreach and treatment are targeted at individuals who are at greatest risk of experiencing gambling-related difficulties. Since the purpose of this section is to examine individuals at risk, our focus will be on differences between individuals who gamble, with and without problems, rather than on the entire sample. In addition to looking only at respondents who gamble, our analysis in this section is limited to differences between non-problem gamblers and lifetime problem and probable pathological gamblers. Both the lifetime and current South Oaks Gambling Screen measures are important tools but they have rather different uses. For reasons related to different rates of classification errors by the lifetime and current SOGS-R, the lifetime measure is better than the current measure at detecting pathological gambling among those who currently experience the disorder. Since the lifetime South Oaks Gambling Screen is the more accurate method for identifying at-risk individuals in the general population, we use information about the characteristics of respondents who score as lifetime problem and pathological gamblers when considering the characteristics of individuals most in need of help with their gambling-related difficulties. Further, respondents who score as lifetime problem gamblers and those who score as lifetime probable pathological gamblers are treated as a single group and are referred to as problem gamblers in this section. This approach is based on discriminant analysis that has established a strong and significant separation between non-problem gamblers and those who score as problem and probable pathological gamblers (Volberg & Abbott 1994).4 Although only comparisons of lifetime non-problem and problem gamblers are presented below, analyses to compare current non-problem and problem gamblers were completed. In general, the findings are similar to the results for lifetime non-problem and problem gamblers. Current problem gamblers are slightly less likely to live in big cities than lifetime problem gamblers and slightly more likely to be separated or divorced. Past week gambling involvement is higher among current problem gamblers than among lifetime problem gamblers for most activities and mean past month expenditures on all types of gambling are higher. There are no other substantial differences between lifetime and current problem gamblers in Sweden. Demographics Table 11 on the following page shows that, as in other jurisdictions, problem gamblers in Sweden are demographically distinct from non-problem gamblers in the sample. Problem gamblers in Sweden are significantly more likely than non-problem gamblers to be male, under the age of 45, to have been born abroad, to live in the major cities in Sweden (Stockholm, Gothenburg and Malmoe) and to be unmarried or living with minors in the household. Problem gamblers in Sweden are significantly less likely than non-problem gamblers to have attended secondary school or college. This demographic profile is very similar to the profile of problem gamblers in many other jurisdictions although the Swedish problem gamblers seem to be somewhat older than problem gamblers elsewhere.
4 Although discriminant analysis will be carried out with the Swedish sample to determine if these relationships apply in the Swedish sample, this report employs the existing convention for purposes of comparison with other jurisdictions.
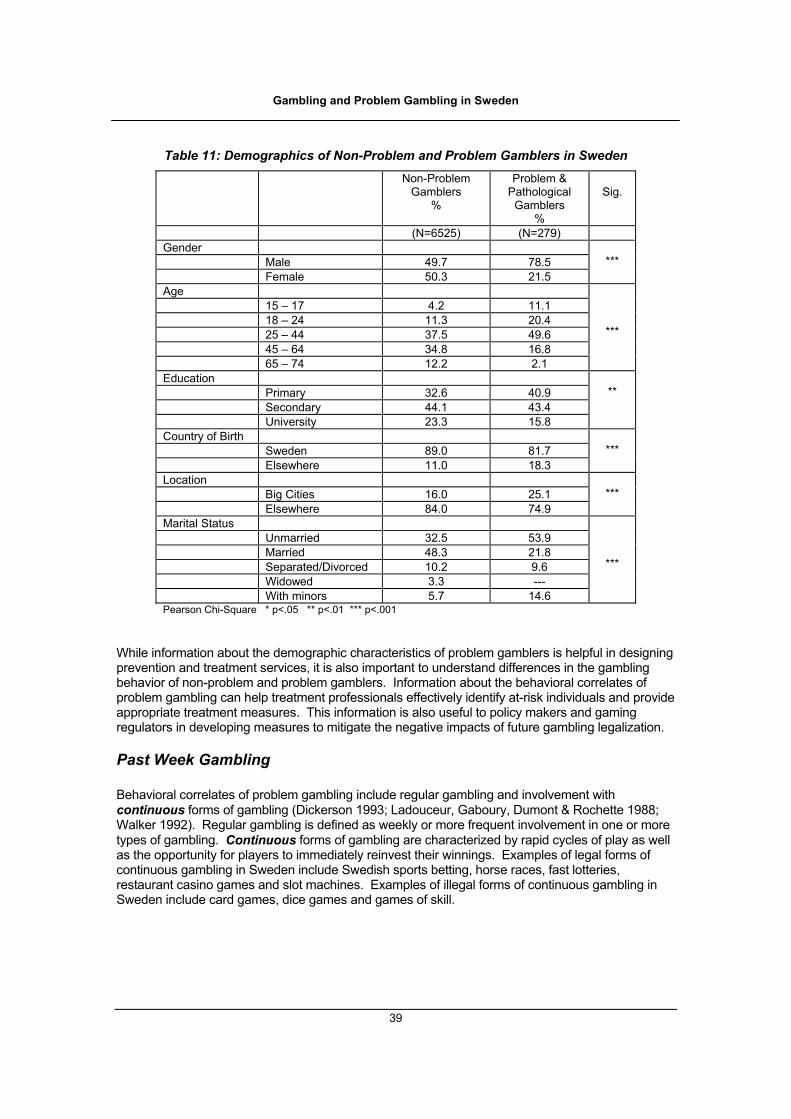
Gambling and Problem Gambling in Sweden
39
Table 11: Demographics of Non-Problem and Problem Gamblers in Sweden Non-Problem
Gamblers %
Problem & Pathological Gamblers
%
Sig.
(N=6525) (N=279) Gender Male 49.7 78.5 Female 50.3 21.5
***
Age 15 – 17 4.2 11.1 18 – 24 11.3 20.4 25 – 44 37.5 49.6 45 – 64 34.8 16.8 65 – 74 12.2 2.1
***
Education Primary 32.6 40.9 Secondary 44.1 43.4 University 23.3 15.8
**
Country of Birth Sweden 89.0 81.7 Elsewhere 11.0 18.3
***
Location Big Cities 16.0 25.1 Elsewhere 84.0 74.9
***
Marital Status Unmarried 32.5 53.9 Married 48.3 21.8 Separated/Divorced 10.2 9.6 Widowed 3.3 --- With minors 5.7 14.6
***
Pearson Chi-Square * p<.05 ** p<.01 *** p<.001 While information about the demographic characteristics of problem gamblers is helpful in designing prevention and treatment services, it is also important to understand differences in the gambling behavior of non-problem and problem gamblers. Information about the behavioral correlates of problem gambling can help treatment professionals effectively identify at-risk individuals and provide appropriate treatment measures. This information is also useful to policy makers and gaming regulators in developing measures to mitigate the negative impacts of future gambling legalization.
Past Week Gambling Behavioral correlates of problem gambling include regular gambling and involvement with continuous forms of gambling (Dickerson 1993; Ladouceur, Gaboury, Dumont & Rochette 1988; Walker 1992). Regular gambling is defined as weekly or more frequent involvement in one or more types of gambling. Continuous forms of gambling are characterized by rapid cycles of play as well as the opportunity for players to immediately reinvest their winnings. Examples of legal forms of continuous gambling in Sweden include Swedish sports betting, horse races, fast lotteries, restaurant casino games and slot machines. Examples of illegal forms of continuous gambling in Sweden include card games, dice games and games of skill.

Gambling and Problem Gambling in Sweden
40
Problem gamblers in Sweden are significantly more likely than non-problem gamblers to have ever tried every type of gambling included in the survey except the national and local lottery games and Bingo-Lotto. Differences in lifetime participation rates between non-problem and problem gamblers are greatest for card games, restaurant casino games, games of skill and amusement and arcade games. There are fewer differences in the past week gambling participation of non-problem and problem gamblers in Sweden. As with lifetime participation, there are no significant differences in past week participation by non-problem and problem gamblers for national and local lotteries or Bingo-Lotto. In fact, non-problem gamblers are more likely than problem gamblers to have wagering in the past week on Bingo-Lotto. Table 12 shows significant differences in past week involvement in different types of gambling by non-problem and problem gamblers in Sweden.
Table 12: Past Week Gambling of Non-Problem and Problem Gamblers Games Played Weekly
Non-Problem Gamblers
%
Problem Gamblers
%
Sig.
(N=6525) (N=279) Tips 13.3 32.1 *** Horse Races 9.2 19.4 *** Fast Lotteries 10.2 14.3 * Restaurant Casinos 0.8 8.6 *** Slot Machines 0.8 6.1 *** Card Games 1.0 5.0 *** Arcade Games 0.8 4.7 *** Bingo 0.8 3.2 *** Games of Skill 0.6 2.5 *** Non-SW Sports 0.3 1.8 *** Past Week Activities (1+ ) .79 1.42 ***
Pearson Chi-Square * p<.05 ** p<.01 *** p<.001 Table 12 shows that problem gamblers in Sweden are significantly more likely than non-problem gamblers to have gambled in the past week on continuous types of gambling including Swedish sports betting, horse races, restaurant casino games and slot machines. Although differences in participation rates are smaller, problem gamblers in Sweden are also significantly more likely than non-problem gamblers to have played fast lottery games in the past week. In addition to these legal types of gambling, problem gamblers in Sweden are significantly more likely than non-problem gamblers to have wagered on card games and games of skill in the past week. Table 12 also shows that problem gamblers in Sweden acknowledge wagering in the past week on nearly twice as many activities as non-problem gamblers. In addition to gambling involvement, respondents were asked about their preferred type of gambling. One-half (50%) of non-problem gamblers in Sweden identified lottery games, including Bingo-Lotto, as their favorite type of gambling in contrast to only 23% of the problem gamblers. Nearly one-quarter of the problem gamblers (22%) identified Swedish sports betting as their favorite type of gambling compared to 15% of the non-problem gamblers. Similarly, 18% of the problem gamblers and 10% of the non-problem gamblers identified horse races as their favorite type of gambling. Finally, 15% of the problem gamblers compared to 4% of the non-problem gamblers identified restaurant casino games or slot machines as their favorite type of gambling.
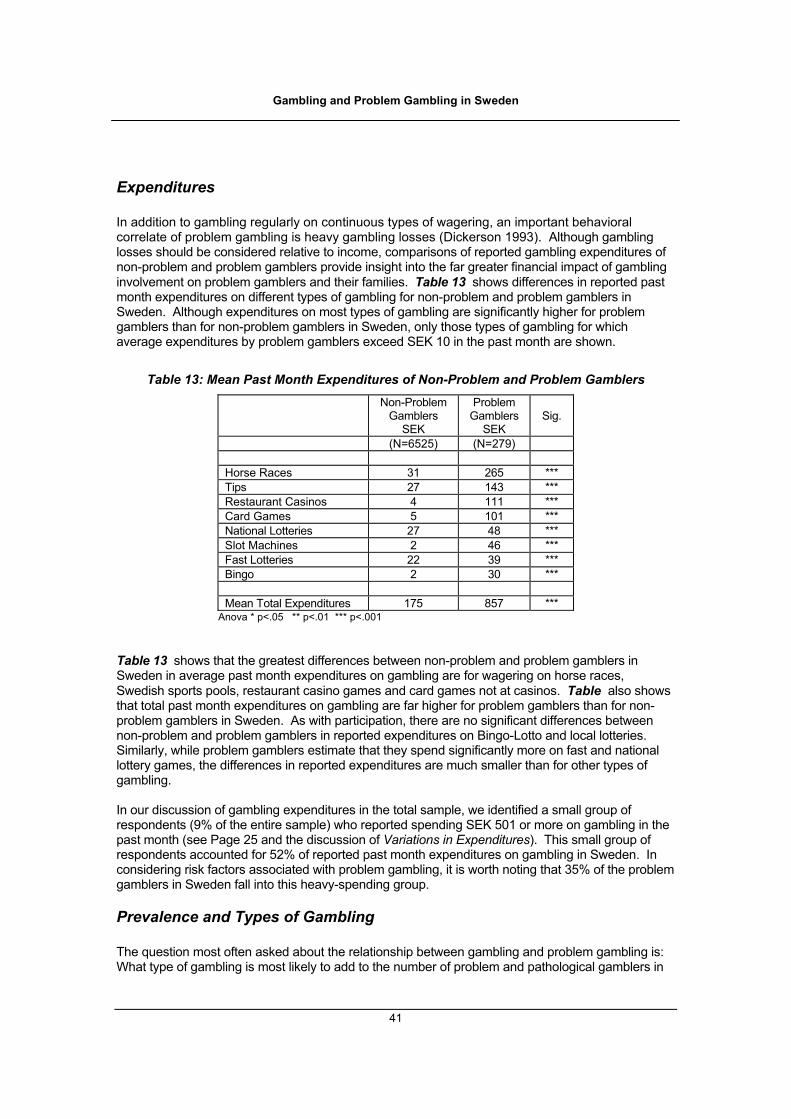
Gambling and Problem Gambling in Sweden
41
Expenditures In addition to gambling regularly on continuous types of wagering, an important behavioral correlate of problem gambling is heavy gambling losses (Dickerson 1993). Although gambling losses should be considered relative to income, comparisons of reported gambling expenditures of non-problem and problem gamblers provide insight into the far greater financial impact of gambling involvement on problem gamblers and their families. Table 13 shows differences in reported past month expenditures on different types of gambling for non-problem and problem gamblers in Sweden. Although expenditures on most types of gambling are significantly higher for problem gamblers than for non-problem gamblers in Sweden, only those types of gambling for which average expenditures by problem gamblers exceed SEK 10 in the past month are shown.
Table 13: Mean Past Month Expenditures of Non-Problem and Problem Gamblers
Non-Problem Gamblers
SEK
Problem Gamblers
SEK
Sig.
(N=6525) (N=279) Horse Races 31 265 *** Tips 27 143 *** Restaurant Casinos 4 111 *** Card Games 5 101 *** National Lotteries 27 48 *** Slot Machines 2 46 *** Fast Lotteries 22 39 *** Bingo 2 30 *** Mean Total Expenditures 175 857 ***
Anova * p<.05 ** p<.01 *** p<.001 Table 13 shows that the greatest differences between non-problem and problem gamblers in Sweden in average past month expenditures on gambling are for wagering on horse races, Swedish sports pools, restaurant casino games and card games not at casinos. Table also shows that total past month expenditures on gambling are far higher for problem gamblers than for non-problem gamblers in Sweden. As with participation, there are no significant differences between non-problem and problem gamblers in reported expenditures on Bingo-Lotto and local lotteries. Similarly, while problem gamblers estimate that they spend significantly more on fast and national lottery games, the differences in reported expenditures are much smaller than for other types of gambling. In our discussion of gambling expenditures in the total sample, we identified a small group of respondents (9% of the entire sample) who reported spending SEK 501 or more on gambling in the past month (see Page 25 and the discussion of Variations in Expenditures). This small group of respondents accounted for 52% of reported past month expenditures on gambling in Sweden. In considering risk factors associated with problem gambling, it is worth noting that 35% of the problem gamblers in Sweden fall into this heavy-spending group.
Prevalence and Types of Gambling The question most often asked about the relationship between gambling and problem gambling is: What type of gambling is most likely to add to the number of problem and pathological gamblers in
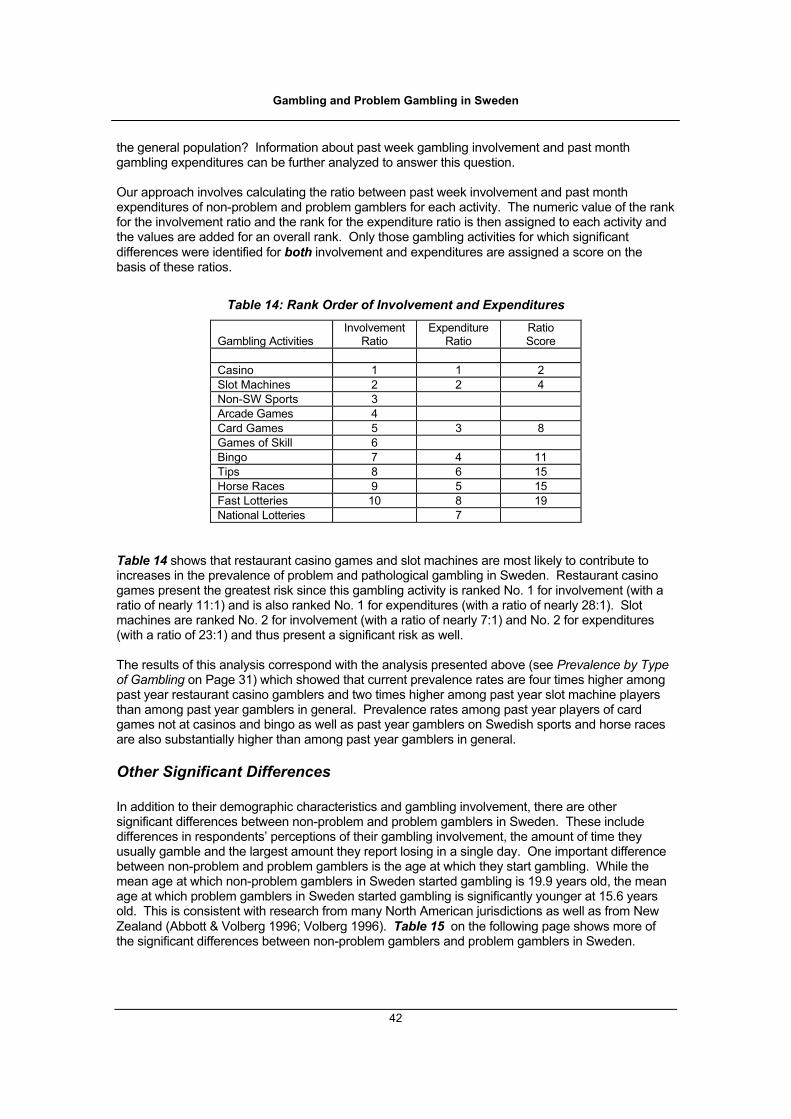
Gambling and Problem Gambling in Sweden
42
the general population? Information about past week gambling involvement and past month gambling expenditures can be further analyzed to answer this question. Our approach involves calculating the ratio between past week involvement and past month expenditures of non-problem and problem gamblers for each activity. The numeric value of the rank for the involvement ratio and the rank for the expenditure ratio is then assigned to each activity and the values are added for an overall rank. Only those gambling activities for which significant differences were identified for both involvement and expenditures are assigned a score on the basis of these ratios.
Table 14: Rank Order of Involvement and Expenditures Gambling Activities
Involvement Ratio
Expenditure Ratio
Ratio Score
Casino 1 1 2 Slot Machines 2 2 4 Non-SW Sports 3 Arcade Games 4 Card Games 5 3 8 Games of Skill 6 Bingo 7 4 11 Tips 8 6 15 Horse Races 9 5 15 Fast Lotteries 10 8 19 National Lotteries 7
Table 14 shows that restaurant casino games and slot machines are most likely to contribute to increases in the prevalence of problem and pathological gambling in Sweden. Restaurant casino games present the greatest risk since this gambling activity is ranked No. 1 for involvement (with a ratio of nearly 11:1) and is also ranked No. 1 for expenditures (with a ratio of nearly 28:1). Slot machines are ranked No. 2 for involvement (with a ratio of nearly 7:1) and No. 2 for expenditures (with a ratio of 23:1) and thus present a significant risk as well. The results of this analysis correspond with the analysis presented above (see Prevalence by Type of Gambling on Page 31) which showed that current prevalence rates are four times higher among past year restaurant casino gamblers and two times higher among past year slot machine players than among past year gamblers in general. Prevalence rates among past year players of card games not at casinos and bingo as well as past year gamblers on Swedish sports and horse races are also substantially higher than among past year gamblers in general.
Other Significant Differences In addition to their demographic characteristics and gambling involvement, there are other significant differences between non-problem and problem gamblers in Sweden. These include differences in respondents’ perceptions of their gambling involvement, the amount of time they usually gamble and the largest amount they report losing in a single day. One important difference between non-problem and problem gamblers is the age at which they start gambling. While the mean age at which non-problem gamblers in Sweden started gambling is 19.9 years old, the mean age at which problem gamblers in Sweden started gambling is significantly younger at 15.6 years old. This is consistent with research from many North American jurisdictions as well as from New Zealand (Abbott & Volberg 1996; Volberg 1996). Table 15 on the following page shows more of the significant differences between non-problem gamblers and problem gamblers in Sweden.
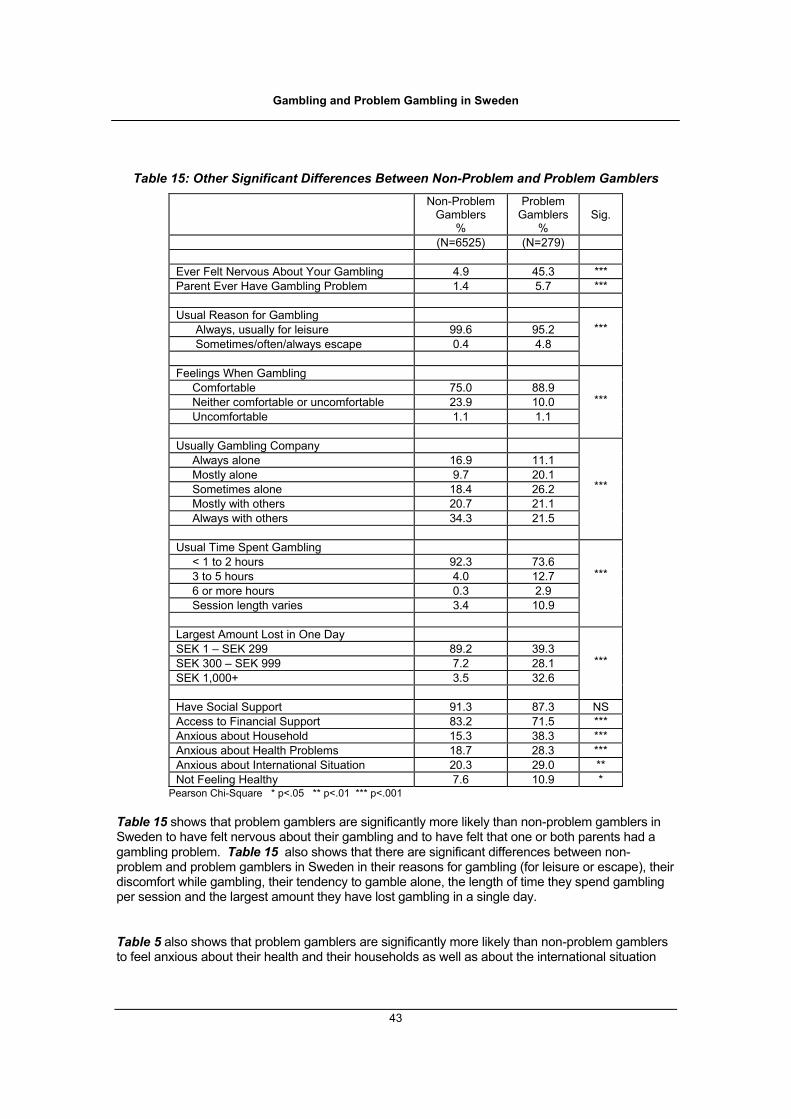
Gambling and Problem Gambling in Sweden
43
Table 15: Other Significant Differences Between Non-Problem and Problem Gamblers Non-Problem
Gamblers %
Problem Gamblers
%
Sig.
(N=6525) (N=279) Ever Felt Nervous About Your Gambling 4.9 45.3 *** Parent Ever Have Gambling Problem 1.4 5.7 *** Usual Reason for Gambling Always, usually for leisure 99.6 95.2 Sometimes/often/always escape 0.4 4.8
***
Feelings When Gambling Comfortable 75.0 88.9 Neither comfortable or uncomfortable 23.9 10.0 Uncomfortable 1.1 1.1
***
Usually Gambling Company Always alone 16.9 11.1 Mostly alone 9.7 20.1 Sometimes alone 18.4 26.2 Mostly with others 20.7 21.1 Always with others 34.3 21.5
***
Usual Time Spent Gambling < 1 to 2 hours 92.3 73.6 3 to 5 hours 4.0 12.7 6 or more hours 0.3 2.9 Session length varies 3.4 10.9
***
Largest Amount Lost in One Day SEK 1 – SEK 299 89.2 39.3 SEK 300 – SEK 999 7.2 28.1 SEK 1,000+ 3.5 32.6
***
Have Social Support 91.3 87.3 NS Access to Financial Support 83.2 71.5 *** Anxious about Household 15.3 38.3 *** Anxious about Health Problems 18.7 28.3 *** Anxious about International Situation 20.3 29.0 ** Not Feeling Healthy 7.6 10.9 *
Pearson Chi-Square * p<.05 ** p<.01 *** p<.001 Table 15 shows that problem gamblers are significantly more likely than non-problem gamblers in Sweden to have felt nervous about their gambling and to have felt that one or both parents had a gambling problem. Table 15 also shows that there are significant differences between non-problem and problem gamblers in Sweden in their reasons for gambling (for leisure or escape), their discomfort while gambling, their tendency to gamble alone, the length of time they spend gambling per session and the largest amount they have lost gambling in a single day. Table 5 also shows that problem gamblers are significantly more likely than non-problem gamblers to feel anxious about their health and their households as well as about the international situation

Gambling and Problem Gambling in Sweden
44
and to feel that they suffer from ill-health. Problem gamblers are less likely than non-problem gamblers to feel that they have a close friend although the difference is not statistically significant at the usual level. It is worth noting that not many individuals who score as problem gamblers acknowledge that they have a gambling-related problem. Only 14% of the lifetime problem gamblers gave a positive response to this question, which is one of the items from the South Oaks Gambling Screen. The majority of the respondents who did indicate that they had ever had a problem with their gambling scored in the more severe “probable pathological” range of this problem gambling scale.

Gambling and Problem Gambling in Sweden
45
GENDER, GAMBLING AND PROBLEM GAMBLING IN SWEDEN There is a great deal of research pointing to differences between men and women in gambling involvement, gambling expenditures, attitudes toward gambling and gambling-related problems. For example, in the United States in the 1970s, women were significantly less likely to gamble at casinos or on lotteries but more likely than men to participate in charitable gambling, such as bingo and raffles (Kallick et al 1979). In the United States in the 1990s, women are just as likely as men to gamble at casinos and on lotteries although men are still more likely than women to wager on games of skill and on horse races, (Volberg & Banks 1994). Other recent research suggests that while there are few differences between men and women in gambling frequency and wagering levels, the scope of women’s gambling, that is the number of different types of gambling in which women participate, is significantly narrower than the scope of men’s gambling (Hraba & Lee 1996). In this section, we present information about gambling involvement, gambling expenditures and problem gambling among men and women in the Swedish sample. Our purpose is to identify whether there are distinct patterns of gambling involvement and gambling expenditures in Sweden that are based on gender.
Demographics The following table compares the demographic characteristics of men and women in the Swedish sample (N=7139). There are no significant differences between men and women in the Swedish sample in age distribution, in educational level, in country of birth, or residence in big cities. Women in the Swedish sample are less likely than men to be unmarried and more likely to be separated, divorced or widowed.
Table 16. Comparing Men and Women Men
% Women
% Sig.
(3588) (3551) Age 15 – 17 4.8 4.6 18 – 24 11.8 11.5 25 – 44 38.3 37.3 45 – 64 33.8 33.7 65 – 74 11.2 12.8
NS
Education Primary 34.3 33.1 Secondary 43.3 43.6 University 22.4 23.4
NS
Country of Birth Sweden 87.3 87.5 Elsewhere 12.7 12.5
NS
Location Big Cities 15.8 17.3 Elsewhere 84.2 82.7
NS
Marital Status Unmarried 36.6 29.4 Married 46.7 47.6 Separated/Divorced 8.8 11.7 Widowed 1.4 5.1 With minors 6.5 6.2
***
Pearson Chi-Square * p<.05 ** p<.01 *** p<.001
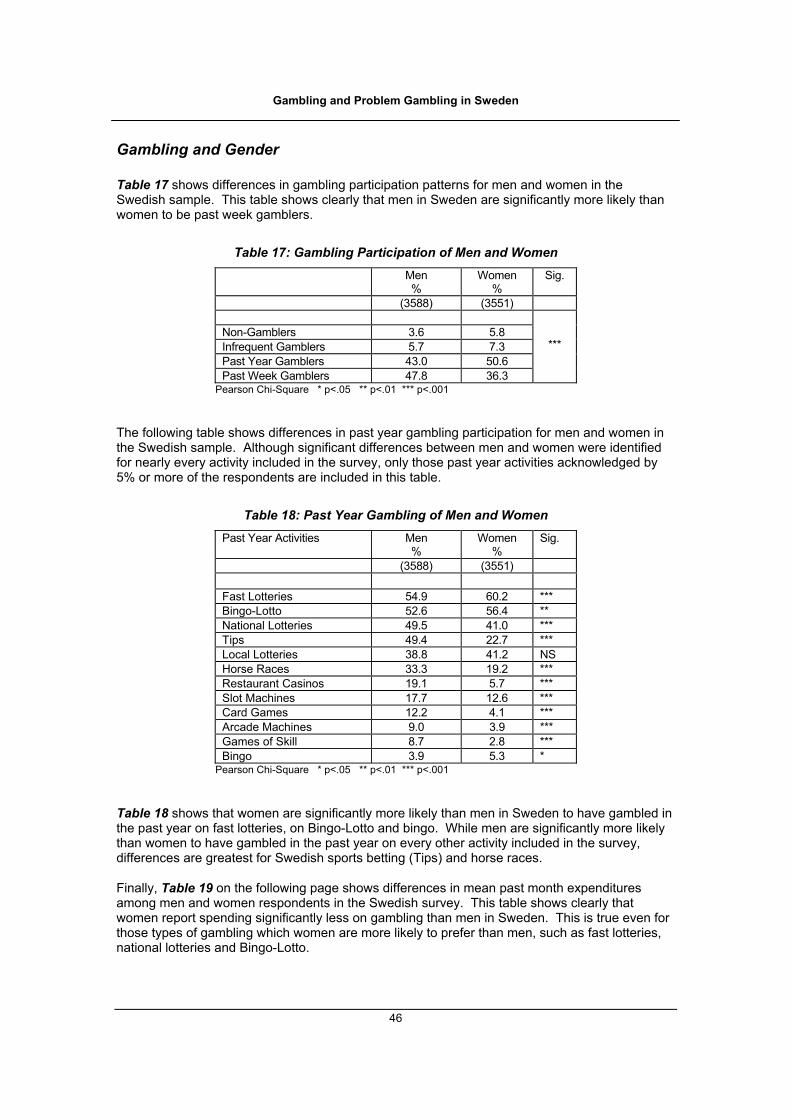
Gambling and Problem Gambling in Sweden
46
Gambling and Gender Table 17 shows differences in gambling participation patterns for men and women in the Swedish sample. This table shows clearly that men in Sweden are significantly more likely than women to be past week gamblers.
Table 17: Gambling Participation of Men and Women Men
% Women
% Sig.
(3588) (3551) Non-Gamblers 3.6 5.8 Infrequent Gamblers 5.7 7.3 Past Year Gamblers 43.0 50.6 Past Week Gamblers 47.8 36.3
***
Pearson Chi-Square * p<.05 ** p<.01 *** p<.001 The following table shows differences in past year gambling participation for men and women in the Swedish sample. Although significant differences between men and women were identified for nearly every activity included in the survey, only those past year activities acknowledged by 5% or more of the respondents are included in this table.
Table 18: Past Year Gambling of Men and Women Past Year Activities Men
% Women
% Sig.
(3588) (3551)
Fast Lotteries 54.9 60.2 *** Bingo-Lotto 52.6 56.4 ** National Lotteries 49.5 41.0 *** Tips 49.4 22.7 *** Local Lotteries 38.8 41.2 NS Horse Races 33.3 19.2 *** Restaurant Casinos 19.1 5.7 *** Slot Machines 17.7 12.6 *** Card Games 12.2 4.1 *** Arcade Machines 9.0 3.9 *** Games of Skill 8.7 2.8 *** Bingo 3.9 5.3 *
Pearson Chi-Square * p<.05 ** p<.01 *** p<.001 Table 18 shows that women are significantly more likely than men in Sweden to have gambled in the past year on fast lotteries, on Bingo-Lotto and bingo. While men are significantly more likely than women to have gambled in the past year on every other activity included in the survey, differences are greatest for Swedish sports betting (Tips) and horse races. Finally, Table 19 on the following page shows differences in mean past month expenditures among men and women respondents in the Swedish survey. This table shows clearly that women report spending significantly less on gambling than men in Sweden. This is true even for those types of gambling which women are more likely to prefer than men, such as fast lotteries, national lotteries and Bingo-Lotto.
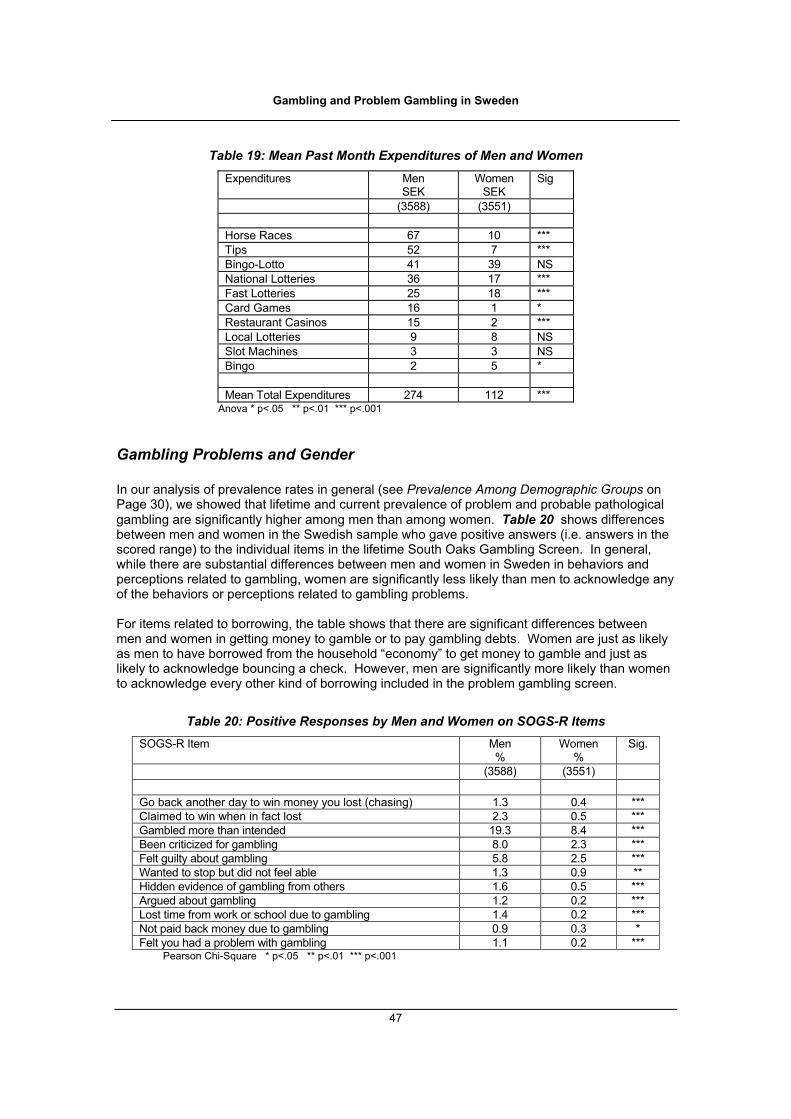
Gambling and Problem Gambling in Sweden
47
Table 19: Mean Past Month Expenditures of Men and Women Expenditures Men
SEK Women
SEK Sig
(3588) (3551) Horse Races 67 10 *** Tips 52 7 *** Bingo-Lotto 41 39 NS National Lotteries 36 17 *** Fast Lotteries 25 18 *** Card Games 16 1 * Restaurant Casinos 15 2 *** Local Lotteries 9 8 NS Slot Machines 3 3 NS Bingo 2 5 * Mean Total Expenditures 274 112 ***
Anova * p<.05 ** p<.01 *** p<.001
Gambling Problems and Gender In our analysis of prevalence rates in general (see Prevalence Among Demographic Groups on Page 30), we showed that lifetime and current prevalence of problem and probable pathological gambling are significantly higher among men than among women. Table 20 shows differences between men and women in the Swedish sample who gave positive answers (i.e. answers in the scored range) to the individual items in the lifetime South Oaks Gambling Screen. In general, while there are substantial differences between men and women in Sweden in behaviors and perceptions related to gambling, women are significantly less likely than men to acknowledge any of the behaviors or perceptions related to gambling problems. For items related to borrowing, the table shows that there are significant differences between men and women in getting money to gamble or to pay gambling debts. Women are just as likely as men to have borrowed from the household “economy” to get money to gamble and just as likely to acknowledge bouncing a check. However, men are significantly more likely than women to acknowledge every other kind of borrowing included in the problem gambling screen.
Table 20: Positive Responses by Men and Women on SOGS-R Items SOGS-R Item Men
% Women
% Sig.
(3588) (3551) Go back another day to win money you lost (chasing) 1.3 0.4 *** Claimed to win when in fact lost 2.3 0.5 *** Gambled more than intended 19.3 8.4 *** Been criticized for gambling 8.0 2.3 *** Felt guilty about gambling 5.8 2.5 *** Wanted to stop but did not feel able 1.3 0.9 ** Hidden evidence of gambling from others 1.6 0.5 *** Argued about gambling 1.2 0.2 *** Lost time from work or school due to gambling 1.4 0.2 *** Not paid back money due to gambling 0.9 0.3 * Felt you had a problem with gambling 1.1 0.2 ***
Pearson Chi-Square * p<.05 ** p<.01 *** p<.001
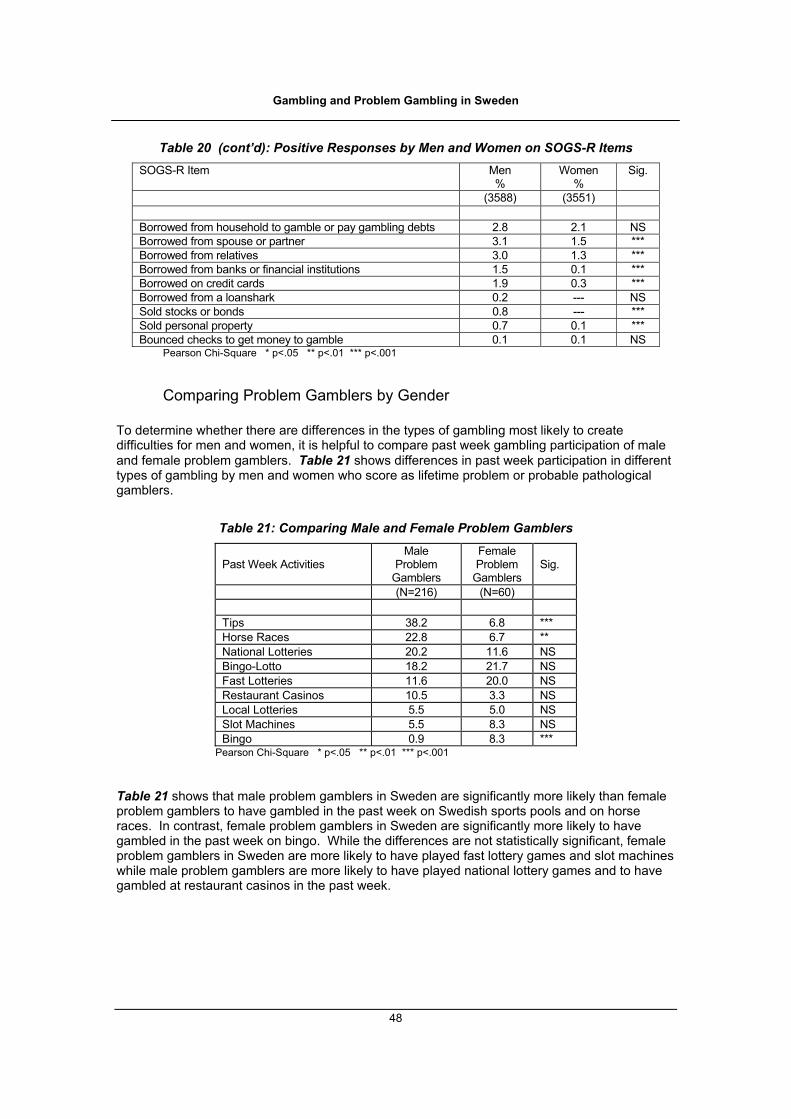
Gambling and Problem Gambling in Sweden
48
Table 20 (cont’d): Positive Responses by Men and Women on SOGS-R Items SOGS-R Item Men
% Women
% Sig.
(3588) (3551) Borrowed from household to gamble or pay gambling debts 2.8 2.1 NS Borrowed from spouse or partner 3.1 1.5 *** Borrowed from relatives 3.0 1.3 *** Borrowed from banks or financial institutions 1.5 0.1 *** Borrowed on credit cards 1.9 0.3 *** Borrowed from a loanshark 0.2 --- NS Sold stocks or bonds 0.8 --- *** Sold personal property 0.7 0.1 *** Bounced checks to get money to gamble 0.1 0.1 NS
Pearson Chi-Square * p<.05 ** p<.01 *** p<.001
Comparing Problem Gamblers by Gender To determine whether there are differences in the types of gambling most likely to create difficulties for men and women, it is helpful to compare past week gambling participation of male and female problem gamblers. Table 21 shows differences in past week participation in different types of gambling by men and women who score as lifetime problem or probable pathological gamblers.
Table 21: Comparing Male and Female Problem Gamblers Past Week Activities
Male Problem
Gamblers
Female Problem
Gamblers
Sig.
(N=216) (N=60)
Tips 38.2 6.8 *** Horse Races 22.8 6.7 ** National Lotteries 20.2 11.6 NS Bingo-Lotto 18.2 21.7 NS Fast Lotteries 11.6 20.0 NS Restaurant Casinos 10.5 3.3 NS Local Lotteries 5.5 5.0 NS Slot Machines 5.5 8.3 NS Bingo 0.9 8.3 ***
Pearson Chi-Square * p<.05 ** p<.01 *** p<.001 Table 21 shows that male problem gamblers in Sweden are significantly more likely than female problem gamblers to have gambled in the past week on Swedish sports pools and on horse races. In contrast, female problem gamblers in Sweden are significantly more likely to have gambled in the past week on bingo. While the differences are not statistically significant, female problem gamblers in Sweden are more likely to have played fast lottery games and slot machines while male problem gamblers are more likely to have played national lottery games and to have gambled at restaurant casinos in the past week.
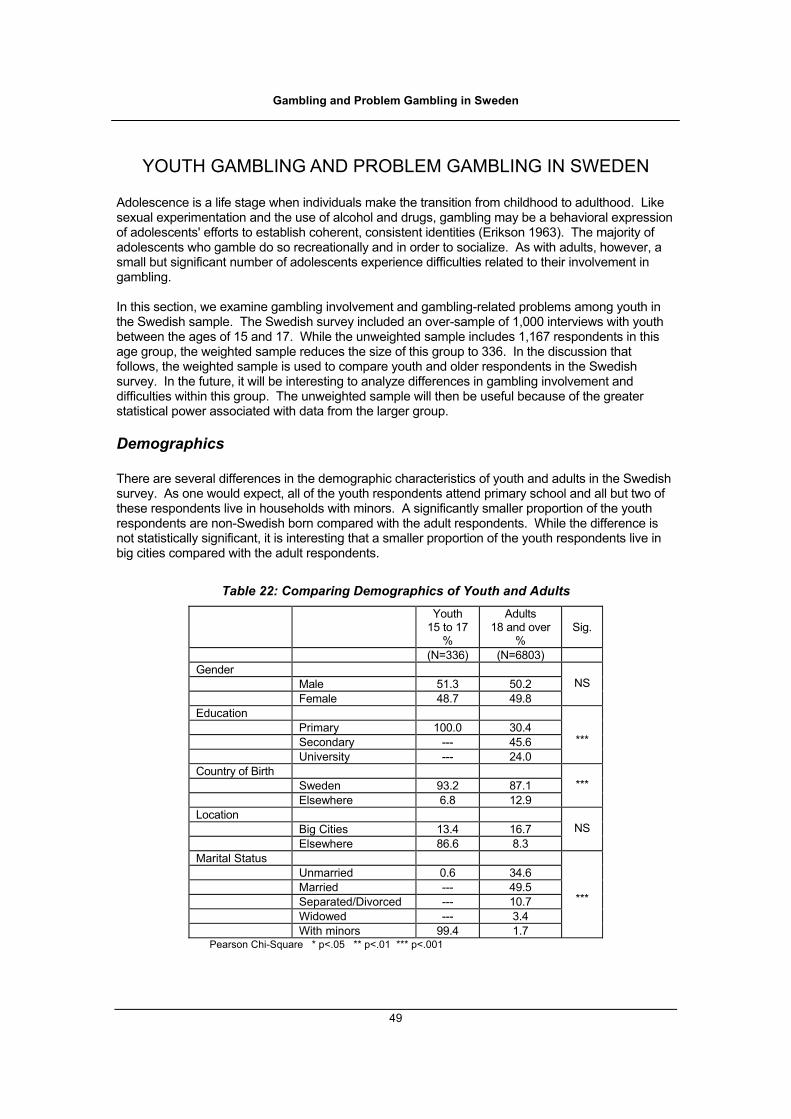
Gambling and Problem Gambling in Sweden
49
YOUTH GAMBLING AND PROBLEM GAMBLING IN SWEDEN Adolescence is a life stage when individuals make the transition from childhood to adulthood. Like sexual experimentation and the use of alcohol and drugs, gambling may be a behavioral expression of adolescents' efforts to establish coherent, consistent identities (Erikson 1963). The majority of adolescents who gamble do so recreationally and in order to socialize. As with adults, however, a small but significant number of adolescents experience difficulties related to their involvement in gambling. In this section, we examine gambling involvement and gambling-related problems among youth in the Swedish sample. The Swedish survey included an over-sample of 1,000 interviews with youth between the ages of 15 and 17. While the unweighted sample includes 1,167 respondents in this age group, the weighted sample reduces the size of this group to 336. In the discussion that follows, the weighted sample is used to compare youth and older respondents in the Swedish survey. In the future, it will be interesting to analyze differences in gambling involvement and difficulties within this group. The unweighted sample will then be useful because of the greater statistical power associated with data from the larger group.
Demographics There are several differences in the demographic characteristics of youth and adults in the Swedish survey. As one would expect, all of the youth respondents attend primary school and all but two of these respondents live in households with minors. A significantly smaller proportion of the youth respondents are non-Swedish born compared with the adult respondents. While the difference is not statistically significant, it is interesting that a smaller proportion of the youth respondents live in big cities compared with the adult respondents.
Table 22: Comparing Demographics of Youth and Adults Youth
15 to 17 %
Adults 18 and over
%
Sig.
(N=336) (N=6803) Gender Male 51.3 50.2 Female 48.7 49.8
NS
Education Primary 100.0 30.4 Secondary --- 45.6 University --- 24.0
***
Country of Birth Sweden 93.2 87.1 Elsewhere 6.8 12.9
***
Location Big Cities 13.4 16.7 Elsewhere 86.6 8.3
NS
Marital Status Unmarried 0.6 34.6 Married --- 49.5 Separated/Divorced --- 10.7 Widowed --- 3.4 With minors 99.4 1.7
***
Pearson Chi-Square * p<.05 ** p<.01 *** p<.001

Gambling and Problem Gambling in Sweden
50
Gambling Among Youth In general, youth in Sweden are less likely to gamble than adults. The following table shows that nearly one-quarter of the youth respondents have never gambled or have not gambled in the past year compared to 11% of the adult respondents. While 43% of the adult respondents acknowledge gambling on one or more activities in the past week, only 16% of the youth respondents have gambled in the past week. As in other jurisdictions, youth in Sweden who have gambled in the past year and past week are significantly more likely than other respondents to be male.
Table 23: Gambling Participation of Youth and Adults
Youth 15 to 17
%
Adults 18 and over
%
Sig.
(N=336) (N=6803) Non-Gamblers 9.5 4.5 Infrequent Gamblers 14.0 6.1 Past Year Gamblers 60.4 46.1 Past Week Gamblers 16.1 43.3
***
Pearson Chi-Square * p<.05 ** p<.01 *** p<.001 Table 24 shows differences in past year involvement in different types of gambling by youth and adult respondents. Youth respondents are most likely to have gambled in the past year on fast lottery games, slot machines and local lottery games. There are several gambling activities that youth respondents are significantly more likely than adult respondents to have tried in the past year, including wagering on slot machines, arcade machine games, card games and games of skill.
Table 14. Past Year Gambling of Youth and Adults Past Year Activities
Youth 15 to 17
%
Adults 18 and over
%
Sig.
(N=336) (N=6803)
Fast Lotteries 38.1 58.7 *** Slot Machines 33.7 14.2 *** Local Lotteries 30.1 40.8 *** Arcade Machines 27.8 5.4 *** Bingo-Lotto 26.6 56.0 *** Tips 24.2 36.8 *** Card Games 24.2 7.4 *** Games of Skill 23.3 4.9 *** National Lotteries 10.4 47.1 *** Horse Races 9.0 27.2 *** Restaurant Casinos 6.3 12.7 *** Bingo 4.8 4.6 NS
Pearson Chi-Square * p<.05 ** p<.01 *** p<.001 There are also significant differences between youth and adults in preferences for different types of gambling. While 28% of the adult respondents identify Bingo-Lotto or national and local lotteries as their favorite type of gambling, only 12% of the youth respondents identify these as
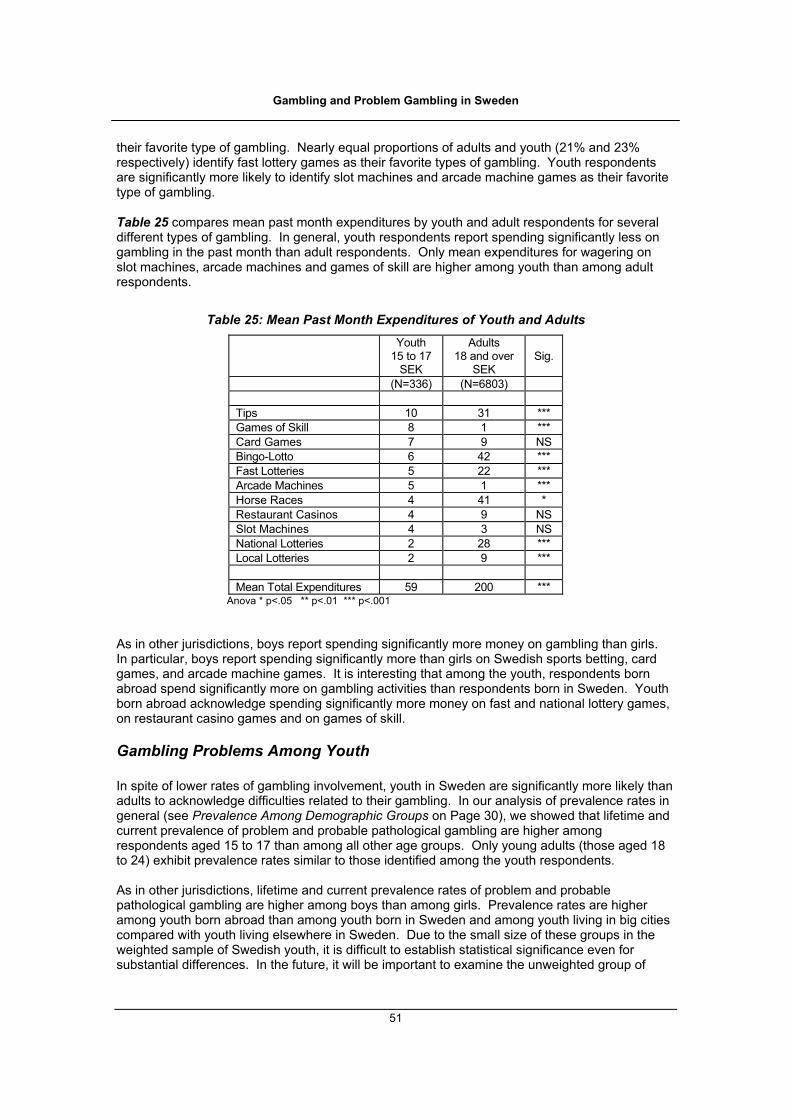
Gambling and Problem Gambling in Sweden
51
their favorite type of gambling. Nearly equal proportions of adults and youth (21% and 23% respectively) identify fast lottery games as their favorite types of gambling. Youth respondents are significantly more likely to identify slot machines and arcade machine games as their favorite type of gambling. Table 25 compares mean past month expenditures by youth and adult respondents for several different types of gambling. In general, youth respondents report spending significantly less on gambling in the past month than adult respondents. Only mean expenditures for wagering on slot machines, arcade machines and games of skill are higher among youth than among adult respondents.
Table 25: Mean Past Month Expenditures of Youth and Adults
Youth 15 to 17
SEK
Adults 18 and over
SEK
Sig.
(N=336) (N=6803) Tips 10 31 *** Games of Skill 8 1 *** Card Games 7 9 NS Bingo-Lotto 6 42 *** Fast Lotteries 5 22 *** Arcade Machines 5 1 *** Horse Races 4 41 * Restaurant Casinos 4 9 NS Slot Machines 4 3 NS National Lotteries 2 28 *** Local Lotteries 2 9 *** Mean Total Expenditures 59 200 ***
Anova * p<.05 ** p<.01 *** p<.001 As in other jurisdictions, boys report spending significantly more money on gambling than girls. In particular, boys report spending significantly more than girls on Swedish sports betting, card games, and arcade machine games. It is interesting that among the youth, respondents born abroad spend significantly more on gambling activities than respondents born in Sweden. Youth born abroad acknowledge spending significantly more money on fast and national lottery games, on restaurant casino games and on games of skill.
Gambling Problems Among Youth In spite of lower rates of gambling involvement, youth in Sweden are significantly more likely than adults to acknowledge difficulties related to their gambling. In our analysis of prevalence rates in general (see Prevalence Among Demographic Groups on Page 30), we showed that lifetime and current prevalence of problem and probable pathological gambling are higher among respondents aged 15 to 17 than among all other age groups. Only young adults (those aged 18 to 24) exhibit prevalence rates similar to those identified among the youth respondents. As in other jurisdictions, lifetime and current prevalence rates of problem and probable pathological gambling are higher among boys than among girls. Prevalence rates are higher among youth born abroad than among youth born in Sweden and among youth living in big cities compared with youth living elsewhere in Sweden. Due to the small size of these groups in the weighted sample of Swedish youth, it is difficult to establish statistical significance even for substantial differences. In the future, it will be important to examine the unweighted group of
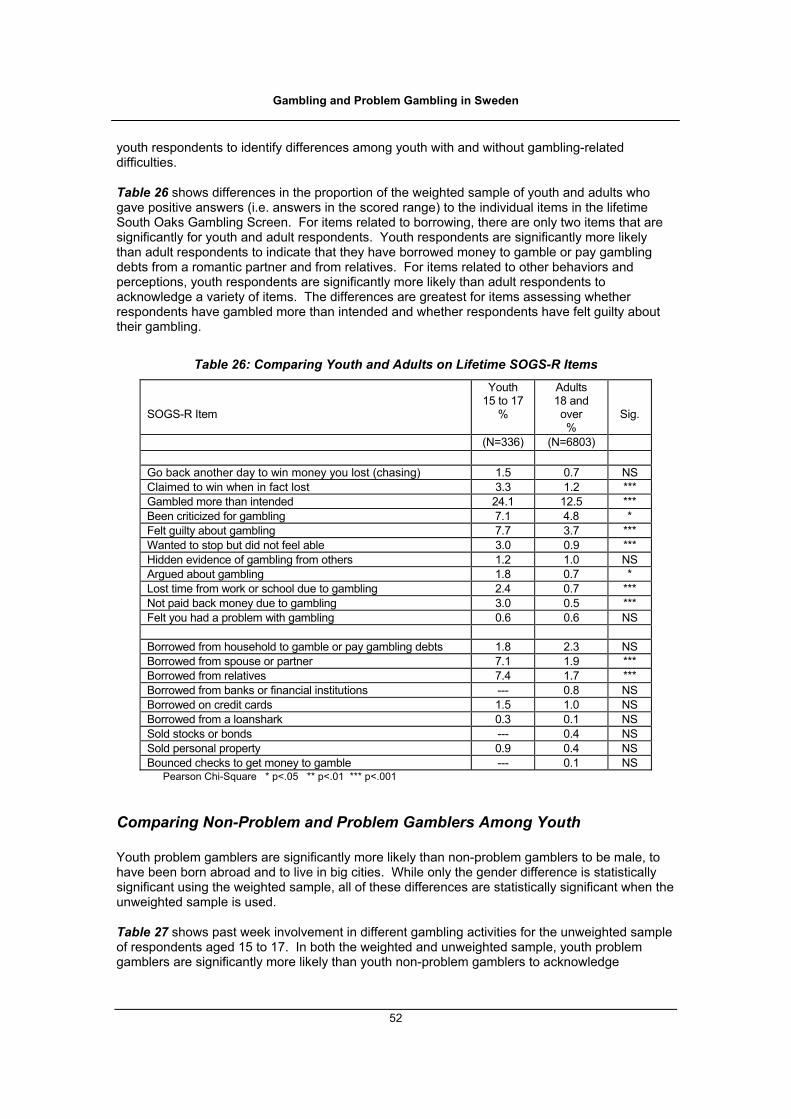
Gambling and Problem Gambling in Sweden
52
youth respondents to identify differences among youth with and without gambling-related difficulties. Table 26 shows differences in the proportion of the weighted sample of youth and adults who gave positive answers (i.e. answers in the scored range) to the individual items in the lifetime South Oaks Gambling Screen. For items related to borrowing, there are only two items that are significantly for youth and adult respondents. Youth respondents are significantly more likely than adult respondents to indicate that they have borrowed money to gamble or pay gambling debts from a romantic partner and from relatives. For items related to other behaviors and perceptions, youth respondents are significantly more likely than adult respondents to acknowledge a variety of items. The differences are greatest for items assessing whether respondents have gambled more than intended and whether respondents have felt guilty about their gambling.
Table 26: Comparing Youth and Adults on Lifetime SOGS-R Items SOGS-R Item
Youth 15 to 17
%
Adults 18 and over %
Sig.
(N=336) (N=6803) Go back another day to win money you lost (chasing) 1.5 0.7 NS Claimed to win when in fact lost 3.3 1.2 *** Gambled more than intended 24.1 12.5 *** Been criticized for gambling 7.1 4.8 * Felt guilty about gambling 7.7 3.7 *** Wanted to stop but did not feel able 3.0 0.9 *** Hidden evidence of gambling from others 1.2 1.0 NS Argued about gambling 1.8 0.7 * Lost time from work or school due to gambling 2.4 0.7 *** Not paid back money due to gambling 3.0 0.5 *** Felt you had a problem with gambling 0.6 0.6 NS Borrowed from household to gamble or pay gambling debts 1.8 2.3 NS Borrowed from spouse or partner 7.1 1.9 *** Borrowed from relatives 7.4 1.7 *** Borrowed from banks or financial institutions --- 0.8 NS Borrowed on credit cards 1.5 1.0 NS Borrowed from a loanshark 0.3 0.1 NS Sold stocks or bonds --- 0.4 NS Sold personal property 0.9 0.4 NS Bounced checks to get money to gamble --- 0.1 NS
Pearson Chi-Square * p<.05 ** p<.01 *** p<.001
Comparing Non-Problem and Problem Gamblers Among Youth Youth problem gamblers are significantly more likely than non-problem gamblers to be male, to have been born abroad and to live in big cities. While only the gender difference is statistically significant using the weighted sample, all of these differences are statistically significant when the unweighted sample is used. Table 27 shows past week involvement in different gambling activities for the unweighted sample of respondents aged 15 to 17. In both the weighted and unweighted sample, youth problem gamblers are significantly more likely than youth non-problem gamblers to acknowledge

Gambling and Problem Gambling in Sweden
53
wagering in the past week on Swedish sports pools, card games, fast lottery games and arcade games. As with the entire sample, youth problem gamblers are significantly more likely to have participated in one or more gambling activities in the past week than youth non-problem gamblers.
Table 27: Past Week Gambling of Youth Non-Problem and Problem Gamblers Games Played Weekly
Youth Non-Problem
Gamblers %
Youth Problem Gamblers
%
Sig.
(N=949) (N=106) Tips 5.1 13.5 *** Card Games 2.0 14.2 *** Fast Lotteries 2.2 11.4 *** Arcade Machines 3.3 12.3 *** Bingo 0.1 2.8 *** Bingo-Lotto 3.7 8.5 * Horse Races 0.9 5.7 *** Restaurant Casinos 0.6 3.8 ** Slot Machines 1.5 7.6 *** Games of Skill 1.9 5.7 * Past Week Activities (1+ ) 15.6 34.9 ***
Pearson Chi-Square * p<.05 ** p<.01 *** p<.001 In contrast to differences between non-problem and problem gamblers among Swedish youth and adults, there are few differences between youth and adult problem gamblers. Due to their age, youth problem gamblers are significantly more likely than adult problem gamblers to live in households with minors. For the same reason, youth problem gamblers are significantly less likely than adult problem gamblers to have attended secondary school or university. Youth problem gamblers are just as likely as adult problem gamblers to have been born in Sweden and to live in big cities.
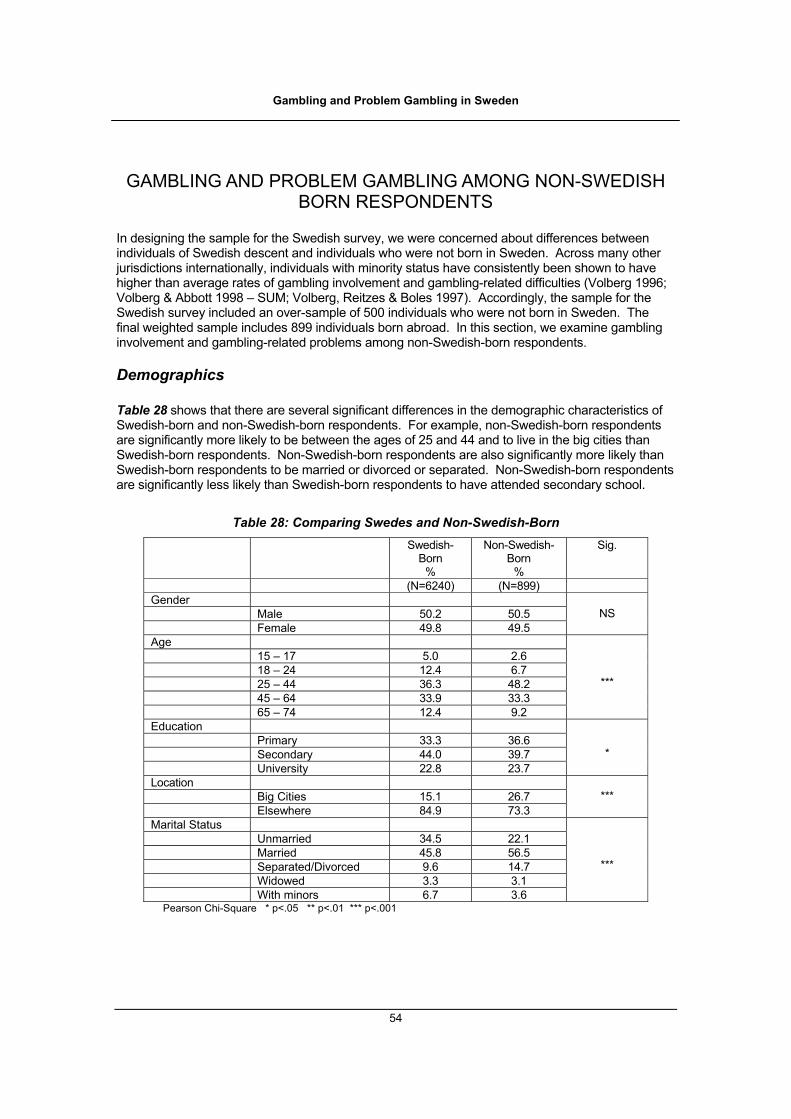
Gambling and Problem Gambling in Sweden
54
GAMBLING AND PROBLEM GAMBLING AMONG NON-SWEDISH BORN RESPONDENTS
In designing the sample for the Swedish survey, we were concerned about differences between individuals of Swedish descent and individuals who were not born in Sweden. Across many other jurisdictions internationally, individuals with minority status have consistently been shown to have higher than average rates of gambling involvement and gambling-related difficulties (Volberg 1996; Volberg & Abbott 1998 – SUM; Volberg, Reitzes & Boles 1997). Accordingly, the sample for the Swedish survey included an over-sample of 500 individuals who were not born in Sweden. The final weighted sample includes 899 individuals born abroad. In this section, we examine gambling involvement and gambling-related problems among non-Swedish-born respondents.
Demographics Table 28 shows that there are several significant differences in the demographic characteristics of Swedish-born and non-Swedish-born respondents. For example, non-Swedish-born respondents are significantly more likely to be between the ages of 25 and 44 and to live in the big cities than Swedish-born respondents. Non-Swedish-born respondents are also significantly more likely than Swedish-born respondents to be married or divorced or separated. Non-Swedish-born respondents are significantly less likely than Swedish-born respondents to have attended secondary school.
Table 28: Comparing Swedes and Non-Swedish-Born Swedish-
Born %
Non-Swedish-Born
%
Sig.
(N=6240) (N=899) Gender Male 50.2 50.5 Female 49.8 49.5
NS
Age 15 – 17 5.0 2.6 18 – 24 12.4 6.7 25 – 44 36.3 48.2 45 – 64 33.9 33.3 65 – 74 12.4 9.2
***
Education Primary 33.3 36.6 Secondary 44.0 39.7 University 22.8 23.7
*
Location Big Cities 15.1 26.7 Elsewhere 84.9 73.3
***
Marital Status Unmarried 34.5 22.1 Married 45.8 56.5 Separated/Divorced 9.6 14.7 Widowed 3.3 3.1 With minors 6.7 3.6
***
Pearson Chi-Square * p<.05 ** p<.01 *** p<.001

Gambling and Problem Gambling in Sweden
55
Gambling Involvement Table 29 shows differences in gambling participation for Swedish-born and non-Swedish-born respondents. Non-Swedish-born respondents are significantly more likely than Swedish-born respondents to have never gambled and significantly less likely to have gambled in the past year or past week.
Table 29: Gambling Participation of Swedes and Non-Swedish-Born
Swedish- Born
%
Non-Swedish-
Born %
Sig.
(N=6240) (N=899) Non-Gamblers 3.2 14.7 Infrequent Gamblers 6.0 9.7 Past Year Gamblers 47.8 39.8 Past Week Gamblers 42.9 35.9
***
Pearson Chi-Square * p<.05 ** p<.01 *** p<.001 Table 29 shows differences in past year involvement in different types of gambling by Swedish-born and non-Swedish-born respondents. Non-Swedish-born respondents are significantly less likely than Swedish-born respondents to have wagered in the past year on fast, national and local lottery games and Bingo-Lotto. Non-Swedish-born respondents are also significantly less likely than Swedish-born respondents to have gambled in the past year on Swedish sports pools, horse races, slot machines, restaurant casino games, bingo, card games and games of skill. Although participation rates are very low, non-Swedish-born respondents are significantly more likely than Swedish-born respondents to have gambled in the past year on activities outside of Sweden.
Table 30: Past Year Gambling of Swedes and Non-Swedish-Born Past Year Activities
Swedish- Born
%
Non- Swedish-
Born %
Sig.
(N=6240) (N=899)
Bingo-Lotto 56.1 44.0 *** Fast Lotteries 59.8 43.3 *** National Lotteries 46.5 37.2 *** Tips 37.0 30.5 *** Local Lotteries 43.2 20.1 *** Horse Races 27.5 18.4 *** Slot Machines 15.5 12.8 * Restaurant Casinos 12.8 9.6 ** Bingo 4.4 6.0 * Arcade Machines 6.7 5.1 NS Card Games 8.8 3.9 *** Games of Skill 6.1 3.1 *** Other Abroad 0.5 1.6 *** Pearson Chi-Square * p<.05 ** p<.01 *** p<.001
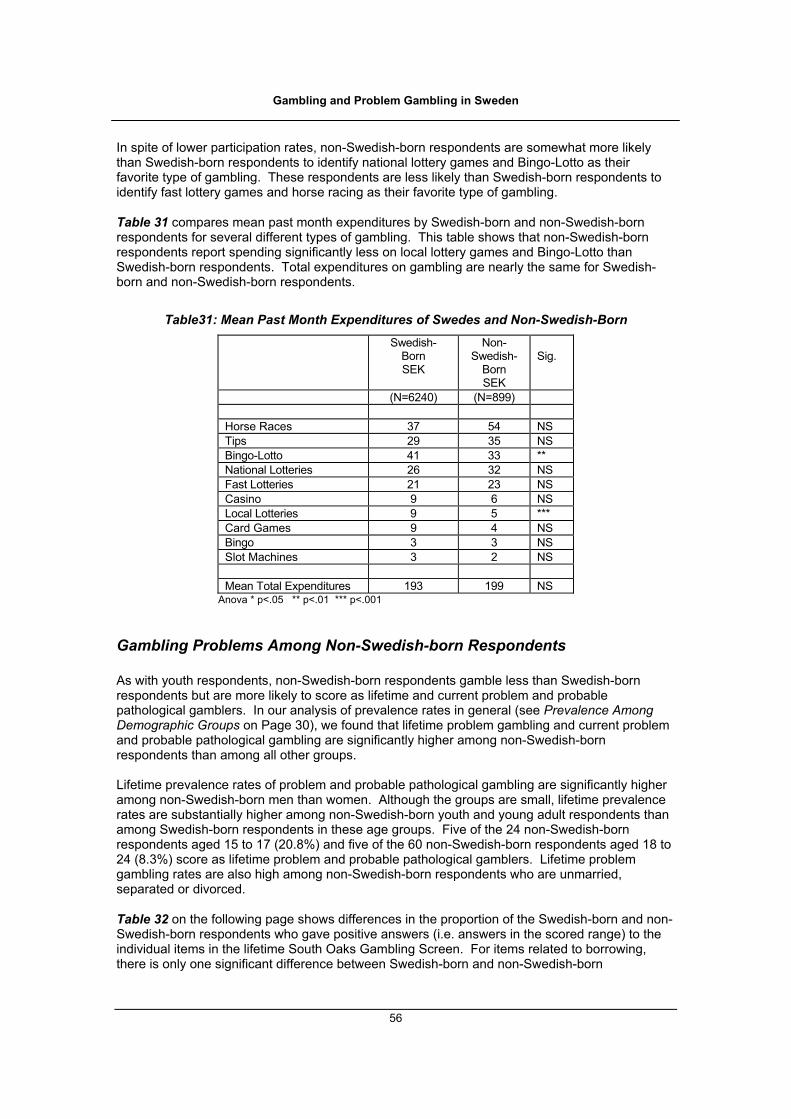
Gambling and Problem Gambling in Sweden
56
In spite of lower participation rates, non-Swedish-born respondents are somewhat more likely than Swedish-born respondents to identify national lottery games and Bingo-Lotto as their favorite type of gambling. These respondents are less likely than Swedish-born respondents to identify fast lottery games and horse racing as their favorite type of gambling. Table 31 compares mean past month expenditures by Swedish-born and non-Swedish-born respondents for several different types of gambling. This table shows that non-Swedish-born respondents report spending significantly less on local lottery games and Bingo-Lotto than Swedish-born respondents. Total expenditures on gambling are nearly the same for Swedish-born and non-Swedish-born respondents.
Table31: Mean Past Month Expenditures of Swedes and Non-Swedish-Born
Swedish- Born SEK
Non- Swedish-
Born SEK
Sig.
(N=6240) (N=899) Horse Races 37 54 NS Tips 29 35 NS Bingo-Lotto 41 33 ** National Lotteries 26 32 NS Fast Lotteries 21 23 NS Casino 9 6 NS Local Lotteries 9 5 *** Card Games 9 4 NS Bingo 3 3 NS Slot Machines 3 2 NS Mean Total Expenditures 193 199 NS
Anova * p<.05 ** p<.01 *** p<.001
Gambling Problems Among Non-Swedish-born Respondents As with youth respondents, non-Swedish-born respondents gamble less than Swedish-born respondents but are more likely to score as lifetime and current problem and probable pathological gamblers. In our analysis of prevalence rates in general (see Prevalence Among Demographic Groups on Page 30), we found that lifetime problem gambling and current problem and probable pathological gambling are significantly higher among non-Swedish-born respondents than among all other groups. Lifetime prevalence rates of problem and probable pathological gambling are significantly higher among non-Swedish-born men than women. Although the groups are small, lifetime prevalence rates are substantially higher among non-Swedish-born youth and young adult respondents than among Swedish-born respondents in these age groups. Five of the 24 non-Swedish-born respondents aged 15 to 17 (20.8%) and five of the 60 non-Swedish-born respondents aged 18 to 24 (8.3%) score as lifetime problem and probable pathological gamblers. Lifetime problem gambling rates are also high among non-Swedish-born respondents who are unmarried, separated or divorced. Table 32 on the following page shows differences in the proportion of the Swedish-born and non-Swedish-born respondents who gave positive answers (i.e. answers in the scored range) to the individual items in the lifetime South Oaks Gambling Screen. For items related to borrowing, there is only one significant difference between Swedish-born and non-Swedish-born
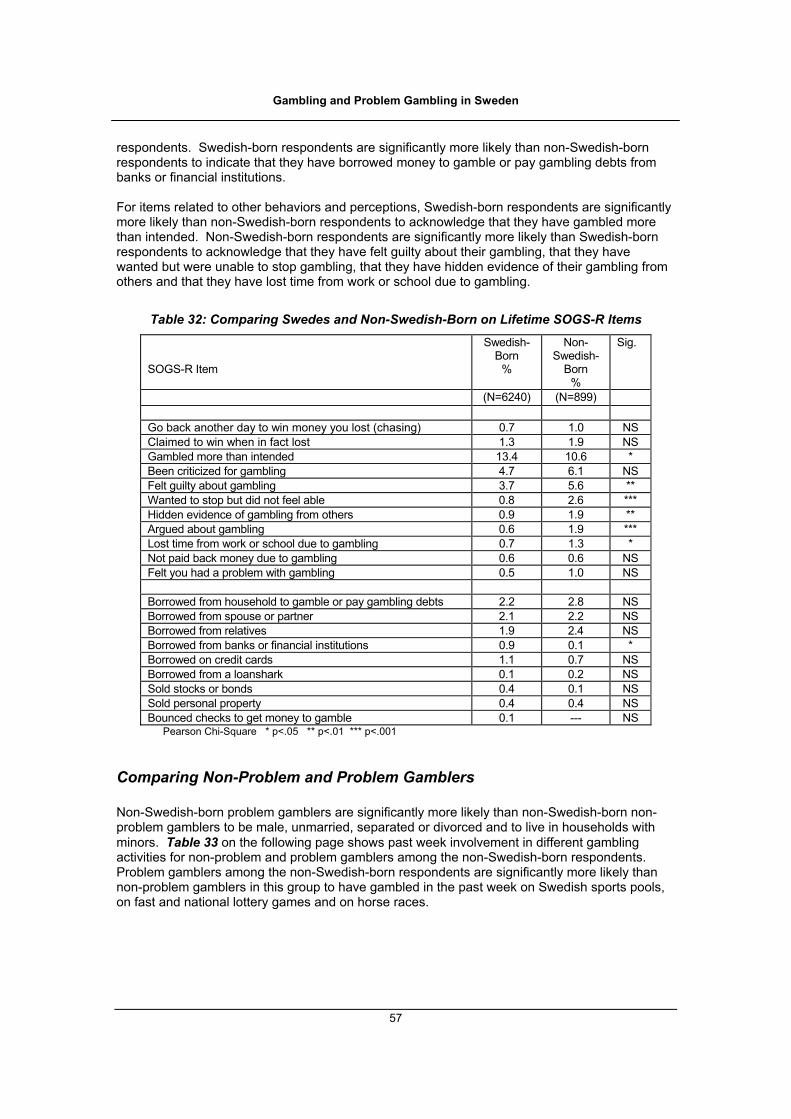
Gambling and Problem Gambling in Sweden
57
respondents. Swedish-born respondents are significantly more likely than non-Swedish-born respondents to indicate that they have borrowed money to gamble or pay gambling debts from banks or financial institutions. For items related to other behaviors and perceptions, Swedish-born respondents are significantly more likely than non-Swedish-born respondents to acknowledge that they have gambled more than intended. Non-Swedish-born respondents are significantly more likely than Swedish-born respondents to acknowledge that they have felt guilty about their gambling, that they have wanted but were unable to stop gambling, that they have hidden evidence of their gambling from others and that they have lost time from work or school due to gambling.
Table 32: Comparing Swedes and Non-Swedish-Born on Lifetime SOGS-R Items SOGS-R Item
Swedish- Born
%
Non- Swedish-
Born %
Sig.
(N=6240) (N=899) Go back another day to win money you lost (chasing) 0.7 1.0 NS Claimed to win when in fact lost 1.3 1.9 NS Gambled more than intended 13.4 10.6 * Been criticized for gambling 4.7 6.1 NS Felt guilty about gambling 3.7 5.6 ** Wanted to stop but did not feel able 0.8 2.6 *** Hidden evidence of gambling from others 0.9 1.9 ** Argued about gambling 0.6 1.9 *** Lost time from work or school due to gambling 0.7 1.3 * Not paid back money due to gambling 0.6 0.6 NS Felt you had a problem with gambling 0.5 1.0 NS Borrowed from household to gamble or pay gambling debts 2.2 2.8 NS Borrowed from spouse or partner 2.1 2.2 NS Borrowed from relatives 1.9 2.4 NS Borrowed from banks or financial institutions 0.9 0.1 * Borrowed on credit cards 1.1 0.7 NS Borrowed from a loanshark 0.1 0.2 NS Sold stocks or bonds 0.4 0.1 NS Sold personal property 0.4 0.4 NS Bounced checks to get money to gamble 0.1 --- NS
Pearson Chi-Square * p<.05 ** p<.01 *** p<.001
Comparing Non-Problem and Problem Gamblers Non-Swedish-born problem gamblers are significantly more likely than non-Swedish-born non-problem gamblers to be male, unmarried, separated or divorced and to live in households with minors. Table 33 on the following page shows past week involvement in different gambling activities for non-problem and problem gamblers among the non-Swedish-born respondents. Problem gamblers among the non-Swedish-born respondents are significantly more likely than non-problem gamblers in this group to have gambled in the past week on Swedish sports pools, on fast and national lottery games and on horse races.
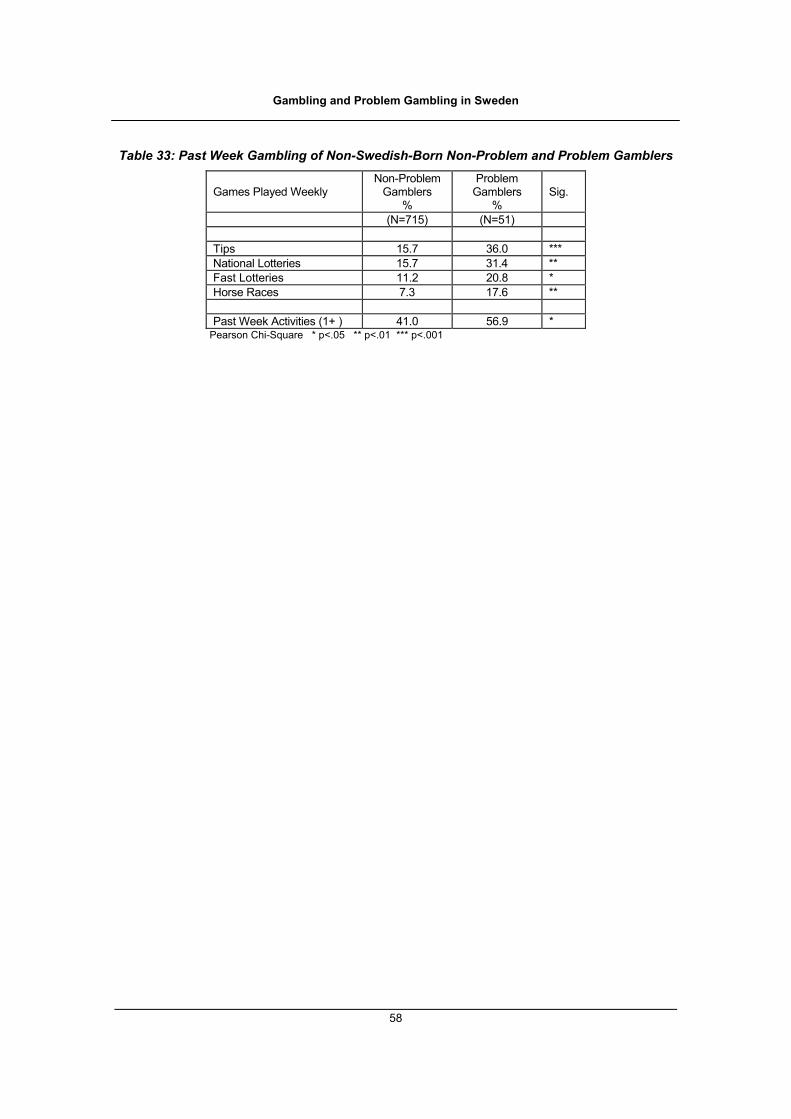
Gambling and Problem Gambling in Sweden
58
Table 33: Past Week Gambling of Non-Swedish-Born Non-Problem and Problem Gamblers Games Played Weekly
Non-Problem Gamblers
%
Problem Gamblers
%
Sig.
(N=715) (N=51) Tips 15.7 36.0 *** National Lotteries 15.7 31.4 ** Fast Lotteries 11.2 20.8 * Horse Races 7.3 17.6 ** Past Week Activities (1+ ) 41.0 56.9 *
Pearson Chi-Square * p<.05 ** p<.01 *** p<.001
Gambling and Problem Gambling in Sweden
59
COMPARING THE SOGS-R AND THE DSM-IV IN SWEDEN A variety of methodological questions have been raised in recent years about research on gambling and problem gambling in the general population (Dickerson 1993; Lesieur 1994; Walker 1992). One serious concern has to do with changes in the criteria for identifying pathological gamblers that have been adopted by the American Psychiatric Association. The South Oaks Gambling Screen was based on the original DSM-III criteria published in 1980 and was tested in clinical trials against the DSM-III-R criteria published in 1987. In the DSM-III, a diagnosis of pathological gambling required an individual to meet four of seven criteria with an exclusion of Anti-Social Personality Disorder. In the DSM-III-R, the same diagnosis required an individual to meet four of nine criteria and the exclusion of Anti-Social Personality Disorder was dropped. In the DSM-IV, a diagnosis of pathological gambling requires an individual to meet five of ten criteria with the reservation that the behavior is not better accounted for by manic episodes. This reservation was added somewhat as an afterthought, as it was not part of the underlying research on which the DSM-IV criteria were based (Lesieur & Rosenthal 1991, 1998). Since so many surveys have been carried out using the South Oaks Gambling Screen,5 use of this instrument allows comparisons of gambling problems across jurisdictions as well as over time (Walker & Dickerson 1996). With the recent changes in the psychiatric criteria for pathological gambling, however, researchers have become concerned about whether the South Oaks Gambling Screen will remain the best tool for measuring the prevalence of pathological gambling in the community in the 21st Century. Several new problem gambling screens based on the DSM-IV criteria are now under development. Only one of these screens, the Diagnostic Interview for Gambling Severity (DIGS) has been tested for its performance with non-clinical groups (Stinchfield 1997; Winters, Specker & Stinchfield 1997). The Minnesota researchers administered a 19-item version of the DIGS and the SOGS-R (with a six-month window for the current items) to three samples, including a general population sample, a sample of callers to a gambling hotline and a sample of individuals entering treatment for a gambling problem. As in New Zealand, Stinchfield found that the accuracy of the SOGS-R was high among individuals who called a gambling hotline or were entering treatment but that the instrument did not perform as well in the general population. Stinchfield concluded that the SOGS is best suited for identifying individuals at risk for developing a gambling pathology while the DIGS is most useful in prevalence surveys in the general population. While there are some problems with Stinchfield’s analysis,6 his work supports our view that the SOGS-R is a useful tool for measuring problem and pathological gambling in clinical and population research. His investigation further supports our belief that, as new tools emerge for identifying problem and pathological gamblers, work is needed to understand their performance in relation to the SOGS-R. The purpose of such comparisons is to calibrate findings based on these new tools with findings based on the South Oaks Gambling Screen. This approach will move the field of gambling research forward in an evolutionary, rather than revolutionary, manner.
5 Baseline studies based on the South Oaks Gambling Screen have been carried out in more than 30 United States and Canadian jurisdictions, as well as in Australia, New Zealand and Spain. Replication surveys based on the South Oaks Gambling Screen have been carried out in 14 jurisdictions. 6 For example, it is not clear whether the analysis of the performance of the SOGS is based on the lifetime items or on items that assessed behaviors in the past six months. Nor is it apparent why the four individuals in the general population sample who scored five or more points on the SOGS were judged not to be pathological gamblers. Further, it is not evident whether the DSM-IV criteria used to classify respondents were assessed separately or whether responses to the 19-item DIGS questions were used. If the latter approach was used, how were respondents scored in relation to the criteria? Did they only have to acknowledge one of the two questions that assessed most of the criteria or did they have to acknowledge both items in order to meet the criterion? Finally, the individual items that make up the DIGS employ varying timeframes and the splitting of some of the DSM-IV criteria into two items seems forced.
Gambling and Problem Gambling in Sweden
60
The Swedish Survey In the Swedish survey, the Fisher DSM-IV Screen was used in addition to the revised South Oaks Gambling Screen. The SOGS-R was used to obtain prevalence data comparable to data from many other jurisdictions internationally. The Fisher DSM-IV Screen was used in order to assess pathological gambling using the most current criteria and to contribute to the development of problem gambling research. In administering the questionnaire for the Swedish survey, the two problem gambling screens were rotated so that half of the sample answered the items from the South Oaks Gambling Screen first and the other half of the sample answered the items from the Fisher DSM-IV Screen first. This study and similar studies in other jurisdictions cannot answer questions about the validity and reliability of the Fisher DSM-IV Screen in relation to clinical assessments. Use of the Fisher DSM-IV Screen does provide an important opportunity to understand how the two most widely-used methods to identify problem and pathological gamblers operate in relation to one another and to extend the construct validation of both.
The Fisher DSM-IV Screen The South Oaks Gambling Screen is a 20-item scale based on the diagnostic criteria for pathological gambling (American Psychiatric Association 1980). Weighted items on the South Oaks Gambling Screen include hiding evidence of gambling, spending more time or money gambling than intended, arguing with family members over gambling and borrowing money to gamble or to pay gambling debts. In developing the South Oaks Gambling Screen, specific items as well as the entire screen were tested for reliability and validity with a variety of groups. These include hospital workers, university students, prison inmates and inpatients in alcohol and substance abuse treatment programs (Lesieur & Blume 1987; Lesieur, Blume & Zoppa 1986; Lesieur & Klein 1985). The revised South Oaks Gambling Screen added an additional question for each of the original weighted items, assessing that behavior in the past six months or in the past year (Abbott & Volberg 1991; Volberg 1996; Volberg & Stuefen 1991). The Fisher DSM-IV Screen is a 10-item scale based on the most recent diagnostic criteria for pathological gambling (American Psychiatric Association 1994). In developing the DSM-IV criteria, 222 self-identified pathological gamblers and 104 substance abusers who gambled socially tested the individual items (Lesieur & Rosenthal 1991, 1998). Discriminant analysis was used to identify the items that best differentiated between pathological and non-pathological gamblers. While the results from this sample indicated that a cutoff of 4 points was appropriate, the American Psychiatric Association (1994) subsequently established a diagnostic cutoff of 5 points. The individual DSM-IV criteria include the following behaviors:
PREOCCUPATION Preoccupied with gambling (e.g. preoccupied with reliving past gambling experiences, handicapping or planning the next venture, or thinking of ways to get money with which to gamble)
TOLERANCE Needs to gamble with increasing amounts of money in order to achieve the desired
excitement WITHDRAWAL Restlessness or irritability when attempting to cut down or stop gambling ESCAPE Gambling as a way of escaping from problems or relieving dysphoric mood (e.g. feelings
of helplessness, guilt, anxiety or depression) CHASING After losing money gambling, often return another day in order to get even (“chasing
one’s losses”) LYING Lies to family members, therapists or others to conceal the extent of involvement with
gambling
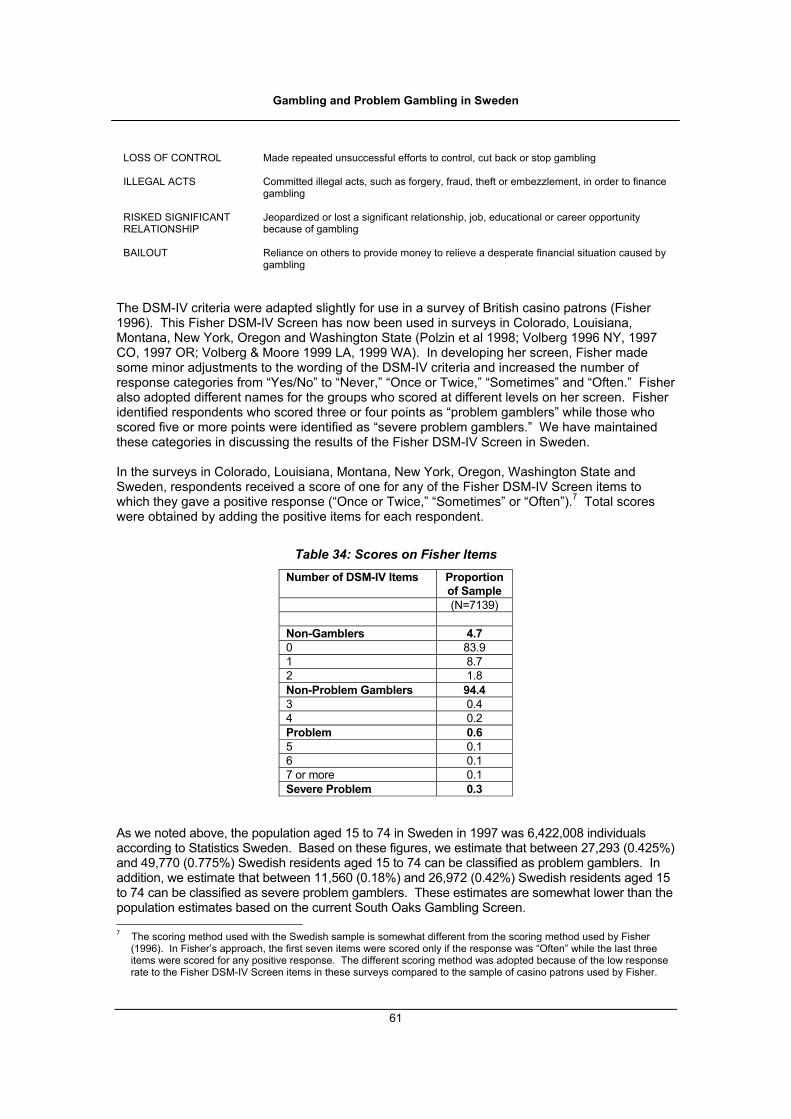
Gambling and Problem Gambling in Sweden
61
LOSS OF CONTROL Made repeated unsuccessful efforts to control, cut back or stop gambling ILLEGAL ACTS Committed illegal acts, such as forgery, fraud, theft or embezzlement, in order to finance
gambling RISKED SIGNIFICANT RELATIONSHIP
Jeopardized or lost a significant relationship, job, educational or career opportunity because of gambling
BAILOUT Reliance on others to provide money to relieve a desperate financial situation caused by
gambling The DSM-IV criteria were adapted slightly for use in a survey of British casino patrons (Fisher 1996). This Fisher DSM-IV Screen has now been used in surveys in Colorado, Louisiana, Montana, New York, Oregon and Washington State (Polzin et al 1998; Volberg 1996 NY, 1997 CO, 1997 OR; Volberg & Moore 1999 LA, 1999 WA). In developing her screen, Fisher made some minor adjustments to the wording of the DSM-IV criteria and increased the number of response categories from “Yes/No” to “Never,” “Once or Twice,” “Sometimes” and “Often.” Fisher also adopted different names for the groups who scored at different levels on her screen. Fisher identified respondents who scored three or four points as “problem gamblers” while those who scored five or more points were identified as “severe problem gamblers.” We have maintained these categories in discussing the results of the Fisher DSM-IV Screen in Sweden. In the surveys in Colorado, Louisiana, Montana, New York, Oregon, Washington State and Sweden, respondents received a score of one for any of the Fisher DSM-IV Screen items to which they gave a positive response (“Once or Twice,” “Sometimes” or “Often”).7 Total scores were obtained by adding the positive items for each respondent.
Table 34: Scores on Fisher Items Number of DSM-IV Items Proportion
of Sample (N=7139) Non-Gamblers 4.7 0 83.9 1 8.7 2 1.8 Non-Problem Gamblers 94.4 3 0.4 4 0.2 Problem 0.6 5 0.1 6 0.1 7 or more 0.1 Severe Problem 0.3
As we noted above, the population aged 15 to 74 in Sweden in 1997 was 6,422,008 individuals according to Statistics Sweden. Based on these figures, we estimate that between 27,293 (0.425%) and 49,770 (0.775%) Swedish residents aged 15 to 74 can be classified as problem gamblers. In addition, we estimate that between 11,560 (0.18%) and 26,972 (0.42%) Swedish residents aged 15 to 74 can be classified as severe problem gamblers. These estimates are somewhat lower than the population estimates based on the current South Oaks Gambling Screen. 7 The scoring method used with the Swedish sample is somewhat different from the scoring method used by Fisher (1996). In Fisher’s approach, the first seven items were scored only if the response was “Often” while the last three items were scored for any positive response. The different scoring method was adopted because of the low response rate to the Fisher DSM-IV Screen items in these surveys compared to the sample of casino patrons used by Fisher.

Gambling and Problem Gambling in Sweden
62
Statistical Characteristics of the Fisher DSM-IV Screen In this section, we examine the psychometric properties of the Fisher DSM-IV Screen among the Swedish respondents. These psychometric properties are important in assessing the performance of the two different methods used to identify problem and pathological gamblers in the general population. As in our discussion of the psychometric properties of the South Oaks Gambling Screen in Sweden (see Statistical Characteristics of the South Oaks Gambling Screen on Page 31), we can assess the reliability of the Fisher DSM-IV Screen only by examining the internal consistency of the screen. In contrast to the South Oaks Gambling Screen, the validity of the Fisher DSM-IV Screen to discriminate effectively between non-problem and problem gamblers in Sweden can be assessed by using the South Oaks Gambling Screen as the “gold standard” to which we can compare the Fisher Screen.
Reliability As noted above, the most widely accepted test of reliability is a measure of the internal consistency of a screen or scale. Like the South Oaks Gambling Screen, the reliability of the Fisher DSM-IV Screen in the Swedish sample is excellent with Cronbach’s alpha at .89, substantially higher than the .70 that is generally accepted as representing good reliability.
Item Analysis Endorsement of the DSM-IV items among Swedish gamblers ranged from a high of 6.3% (Preoccupation) to a low of 0.1% (Beyond the Legal and Bailout). Table 35 shows that the rank order of endorsement for the DSM-IV items in Sweden is similar to the rank order in other jurisdictions although endorsement rates for nearly every item are substantially lower in Sweden than in other jurisdictions.
Table 35: Comparing Endorsement of Fisher Items Sweden
% Oregon
% Colorado
% New York
% (N=7139) (N=1502) (N=1810) (N=1829) Preoccupation 6.3 12.4 17.3 15.7 Tolerance 1.3 2.8 2.5 2.1 Withdrawal 0.9 1.8 1.6 1.5 Escape 1.1 3.7 3.2 3.2 Chasing 4.4 7.8 6.5 5.7 Lying 0.6 1.0 0.9 1.1 Efforts to Stop 1.2 2.0 1.4 1.7 Beyond the Legal 0.1 0.5 0.6 0.1 Risked Significant Relationship 0.2 0.7 0.2 0.3 Bailout 0.1 0.9 0.4 0.3
It is also instructive to compare positive responses to specific items among gamblers. Comparing endorsement of the DSM-IV items by non-problem gamblers and problem gamblers allows us to examine how well the different items discriminate between these groups. For this analysis, we have used the SOGS-R classification of non-problem gamblers and problem gamblers in order to prevent confusion between the method of classifying respondents and the items by which they were classified. Since all of the Fisher DSM-IV Screen items are framed in the past year, the current problem and probable pathological gamblers in Sweden were used in this analysis.
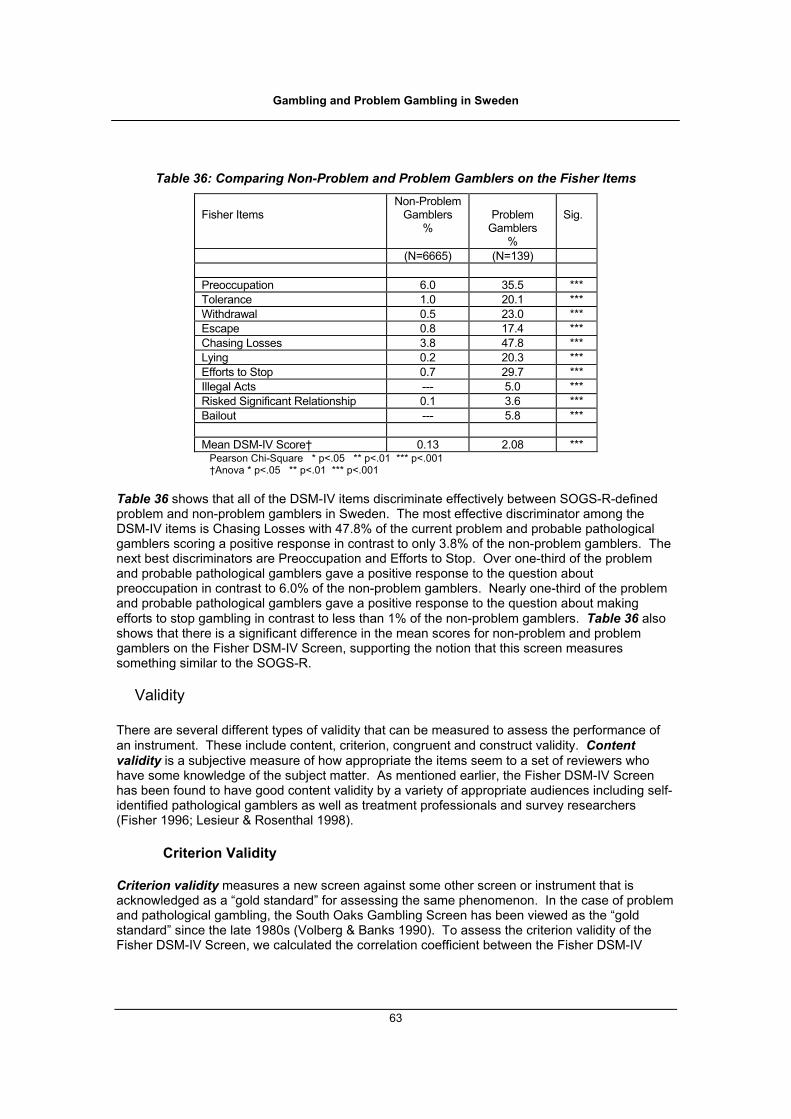
Gambling and Problem Gambling in Sweden
63
Table 36: Comparing Non-Problem and Problem Gamblers on the Fisher Items Fisher Items
Non-Problem Gamblers
%
Problem
Gamblers %
Sig.
(N=6665) (N=139) Preoccupation 6.0 35.5 *** Tolerance 1.0 20.1 *** Withdrawal 0.5 23.0 *** Escape 0.8 17.4 *** Chasing Losses 3.8 47.8 *** Lying 0.2 20.3 *** Efforts to Stop 0.7 29.7 *** Illegal Acts --- 5.0 *** Risked Significant Relationship 0.1 3.6 *** Bailout --- 5.8 *** Mean DSM-IV Score† 0.13 2.08 ***
Pearson Chi-Square * p<.05 ** p<.01 *** p<.001 †Anova * p<.05 ** p<.01 *** p<.001
Table 36 shows that all of the DSM-IV items discriminate effectively between SOGS-R-defined problem and non-problem gamblers in Sweden. The most effective discriminator among the DSM-IV items is Chasing Losses with 47.8% of the current problem and probable pathological gamblers scoring a positive response in contrast to only 3.8% of the non-problem gamblers. The next best discriminators are Preoccupation and Efforts to Stop. Over one-third of the problem and probable pathological gamblers gave a positive response to the question about preoccupation in contrast to 6.0% of the non-problem gamblers. Nearly one-third of the problem and probable pathological gamblers gave a positive response to the question about making efforts to stop gambling in contrast to less than 1% of the non-problem gamblers. Table 36 also shows that there is a significant difference in the mean scores for non-problem and problem gamblers on the Fisher DSM-IV Screen, supporting the notion that this screen measures something similar to the SOGS-R.
Validity There are several different types of validity that can be measured to assess the performance of an instrument. These include content, criterion, congruent and construct validity. Content validity is a subjective measure of how appropriate the items seem to a set of reviewers who have some knowledge of the subject matter. As mentioned earlier, the Fisher DSM-IV Screen has been found to have good content validity by a variety of appropriate audiences including self-identified pathological gamblers as well as treatment professionals and survey researchers (Fisher 1996; Lesieur & Rosenthal 1998).
Criterion Validity
Criterion validity measures a new screen against some other screen or instrument that is acknowledged as a “gold standard” for assessing the same phenomenon. In the case of problem and pathological gambling, the South Oaks Gambling Screen has been viewed as the “gold standard” since the late 1980s (Volberg & Banks 1990). To assess the criterion validity of the Fisher DSM-IV Screen, we calculated the correlation coefficient between the Fisher DSM-IV

Gambling and Problem Gambling in Sweden
64
Screen and the current South Oaks Gambling Screen. The result of this analysis was statistically significant (correlation coefficient = .592, sig = .000). To better understand how the SOGS-R and the Fisher DSM-IV Screen operate in relation to one another, it is useful to examine how respondents scored on each of these screens in more detail. As shown above, the prevalence of the less severe DSM-IV category (3 or 4 points) is 0.6% while the prevalence of the more severe DSM-IV category (5 or more points) is 0.3% for the total sample. These figures compare to 1.4% and 0.6% for the current SOGS-R. Table 37 shows the number of respondents who scored at different levels on the SOGS-R and the Fisher DSM-IV Screen in the Swedish sample.
Table 37: Comparing Scores on the SOGS-R and the Fisher Screen Fisher DSM-IV SOGS-R 0 - 2 3 - 4 5+
Total
0 - 2 6968 28 4 7000 3 - 4 88 8 2 98 5+ 15 10 16 41 Total 7071 46 22 7139
Table 37 shows that the Fisher DSM-IV Screen operates quite well in relation to the SOGS-R. On the one hand, respondents who score low on the Fisher DSM-IV Screen also tend to score low on the SOGS-R. On the other hand, 82% of the small group of respondents who score high on the Fisher DSM-IV Screen (5 or more, N=22) score 3 or more points on the SOGS-R. Table 38 shows differences in the performance of the SOGS-R vis-à-vis the Fisher DSM-IV Screen in the four jurisdictions where both screens have now been used. For clarity, respondents who score 3 or 4 points on the current SOGS-R and those who score 3 or 4 points on the Fisher DSM-IV Screen were dropped from the analysis. “Low SOGS-R” and “Low DSM-IV” refers to respondents who score 0, 1 or 2 on these screens. “High SOGS-R” and “High DSM-IV” refers to respondents who score 5 or more points on these screens.
Table 38: Comparing the Performance of the SOGS-R and Fisher Screen Across Jurisdictions
Sweden %
(N=7139)
Oregon %
(N=1502)
Colorado %
(N=1810)
New York %
(N=1829) DSM-IV as Gold Standard Low SOGS-R – Low DSM-IV (TN) 98.5 98.4 98.2 97.7 High SOGS-R – Low DSM-IV (FN) 0.2 0.1 0.2 0.5 Low SOGS-R – High DSM-IV (FP) 18.2 30.0 11.1 33.3 High SOGS-R – High DSM-IV (TP) 72.7 55.0 66.7 40.0 SOGS-R as Gold Standard Low DSM-IV – Low SOGS-R (TN) 99.5 98.3 98.6 98.7 High DSM-IV – Low SOGS-R (FN) 0.06 0.4 0.06 0.3 Low DSM-IV – High SOGS-R (FP) 36.6 10.0 30.8 43.5 High DSM-IV – High SOGS-R (TP) 39.0 55.0 46.1 26.1
In classification terms, both the SOGS-R and the Fisher DSM-IV Screen perform well in identifying individuals who do not have gambling-related problems although the rate of “False
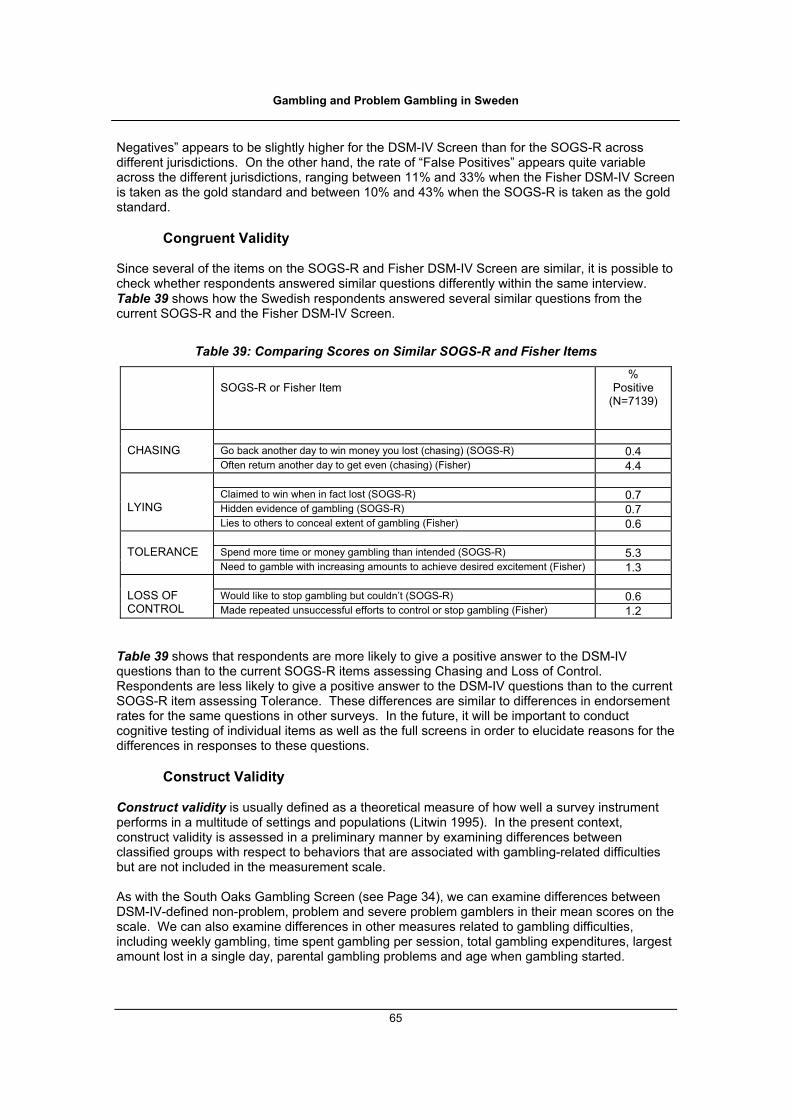
Gambling and Problem Gambling in Sweden
65
Negatives” appears to be slightly higher for the DSM-IV Screen than for the SOGS-R across different jurisdictions. On the other hand, the rate of “False Positives” appears quite variable across the different jurisdictions, ranging between 11% and 33% when the Fisher DSM-IV Screen is taken as the gold standard and between 10% and 43% when the SOGS-R is taken as the gold standard.
Congruent Validity Since several of the items on the SOGS-R and Fisher DSM-IV Screen are similar, it is possible to check whether respondents answered similar questions differently within the same interview. Table 39 shows how the Swedish respondents answered several similar questions from the current SOGS-R and the Fisher DSM-IV Screen.
Table 39: Comparing Scores on Similar SOGS-R and Fisher Items
SOGS-R or Fisher Item %
Positive (N=7139)
Go back another day to win money you lost (chasing) (SOGS-R) 0.4
CHASING
Often return another day to get even (chasing) (Fisher) 4.4 Claimed to win when in fact lost (SOGS-R) 0.7 Hidden evidence of gambling (SOGS-R) 0.7
LYING
Lies to others to conceal extent of gambling (Fisher) 0.6 Spend more time or money gambling than intended (SOGS-R) 5.3
TOLERANCE
Need to gamble with increasing amounts to achieve desired excitement (Fisher) 1.3 Would like to stop gambling but couldn’t (SOGS-R) 0.6
LOSS OF CONTROL Made repeated unsuccessful efforts to control or stop gambling (Fisher) 1.2
Table 39 shows that respondents are more likely to give a positive answer to the DSM-IV questions than to the current SOGS-R items assessing Chasing and Loss of Control. Respondents are less likely to give a positive answer to the DSM-IV questions than to the current SOGS-R item assessing Tolerance. These differences are similar to differences in endorsement rates for the same questions in other surveys. In the future, it will be important to conduct cognitive testing of individual items as well as the full screens in order to elucidate reasons for the differences in responses to these questions.
Construct Validity Construct validity is usually defined as a theoretical measure of how well a survey instrument performs in a multitude of settings and populations (Litwin 1995). In the present context, construct validity is assessed in a preliminary manner by examining differences between classified groups with respect to behaviors that are associated with gambling-related difficulties but are not included in the measurement scale. As with the South Oaks Gambling Screen (see Page 34), we can examine differences between DSM-IV-defined non-problem, problem and severe problem gamblers in their mean scores on the scale. We can also examine differences in other measures related to gambling difficulties, including weekly gambling, time spent gambling per session, total gambling expenditures, largest amount lost in a single day, parental gambling problems and age when gambling started.
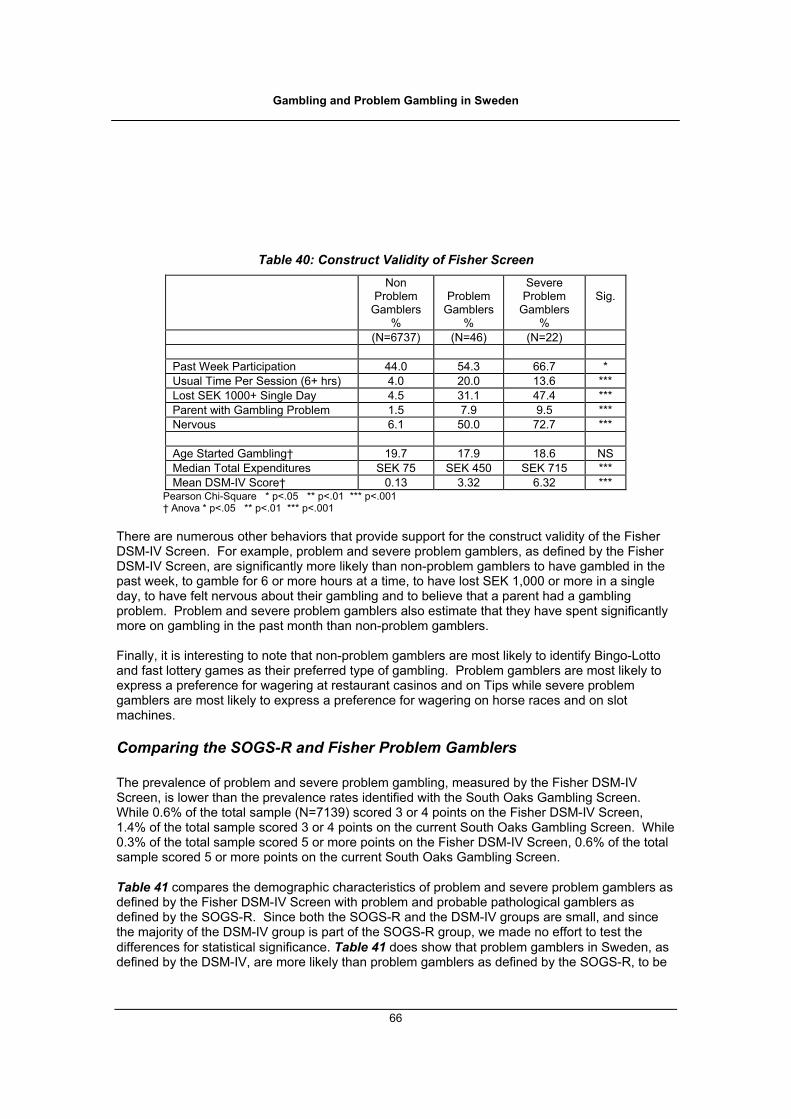
Gambling and Problem Gambling in Sweden
66
Table 40: Construct Validity of Fisher Screen Non
Problem Gamblers
%
Problem
Gamblers %
Severe Problem
Gamblers %
Sig.
(N=6737) (N=46) (N=22) Past Week Participation 44.0 54.3 66.7 * Usual Time Per Session (6+ hrs) 4.0 20.0 13.6 *** Lost SEK 1000+ Single Day 4.5 31.1 47.4 *** Parent with Gambling Problem 1.5 7.9 9.5 *** Nervous 6.1 50.0 72.7 *** Age Started Gambling† 19.7 17.9 18.6 NS Median Total Expenditures SEK 75 SEK 450 SEK 715 *** Mean DSM-IV Score† 0.13 3.32 6.32 ***
Pearson Chi-Square * p<.05 ** p<.01 *** p<.001 † Anova * p<.05 ** p<.01 *** p<.001
There are numerous other behaviors that provide support for the construct validity of the Fisher DSM-IV Screen. For example, problem and severe problem gamblers, as defined by the Fisher DSM-IV Screen, are significantly more likely than non-problem gamblers to have gambled in the past week, to gamble for 6 or more hours at a time, to have lost SEK 1,000 or more in a single day, to have felt nervous about their gambling and to believe that a parent had a gambling problem. Problem and severe problem gamblers also estimate that they have spent significantly more on gambling in the past month than non-problem gamblers. Finally, it is interesting to note that non-problem gamblers are most likely to identify Bingo-Lotto and fast lottery games as their preferred type of gambling. Problem gamblers are most likely to express a preference for wagering at restaurant casinos and on Tips while severe problem gamblers are most likely to express a preference for wagering on horse races and on slot machines.
Comparing the SOGS-R and Fisher Problem Gamblers The prevalence of problem and severe problem gambling, measured by the Fisher DSM-IV Screen, is lower than the prevalence rates identified with the South Oaks Gambling Screen. While 0.6% of the total sample (N=7139) scored 3 or 4 points on the Fisher DSM-IV Screen, 1.4% of the total sample scored 3 or 4 points on the current South Oaks Gambling Screen. While 0.3% of the total sample scored 5 or more points on the Fisher DSM-IV Screen, 0.6% of the total sample scored 5 or more points on the current South Oaks Gambling Screen. Table 41 compares the demographic characteristics of problem and severe problem gamblers as defined by the Fisher DSM-IV Screen with problem and probable pathological gamblers as defined by the SOGS-R. Since both the SOGS-R and the DSM-IV groups are small, and since the majority of the DSM-IV group is part of the SOGS-R group, we made no effort to test the differences for statistical significance. Table 41 does show that problem gamblers in Sweden, as defined by the DSM-IV, are more likely than problem gamblers as defined by the SOGS-R, to be
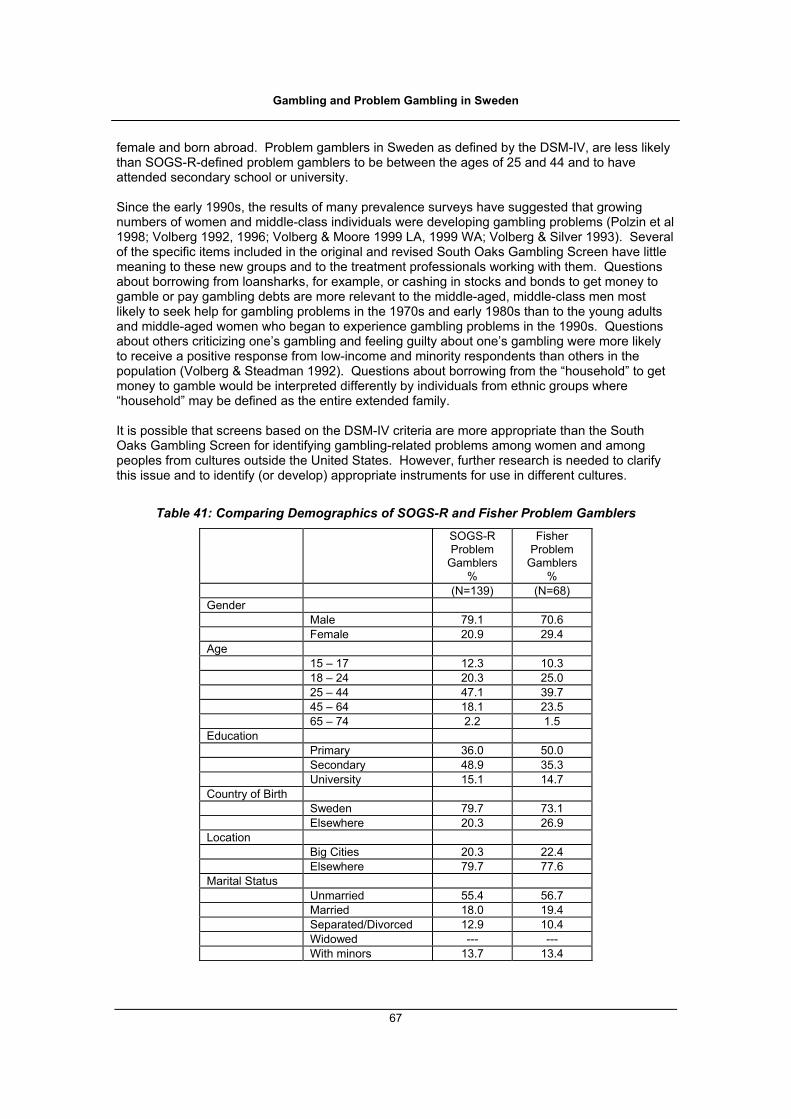
Gambling and Problem Gambling in Sweden
67
female and born abroad. Problem gamblers in Sweden as defined by the DSM-IV, are less likely than SOGS-R-defined problem gamblers to be between the ages of 25 and 44 and to have attended secondary school or university. Since the early 1990s, the results of many prevalence surveys have suggested that growing numbers of women and middle-class individuals were developing gambling problems (Polzin et al 1998; Volberg 1992, 1996; Volberg & Moore 1999 LA, 1999 WA; Volberg & Silver 1993). Several of the specific items included in the original and revised South Oaks Gambling Screen have little meaning to these new groups and to the treatment professionals working with them. Questions about borrowing from loansharks, for example, or cashing in stocks and bonds to get money to gamble or pay gambling debts are more relevant to the middle-aged, middle-class men most likely to seek help for gambling problems in the 1970s and early 1980s than to the young adults and middle-aged women who began to experience gambling problems in the 1990s. Questions about others criticizing one’s gambling and feeling guilty about one’s gambling were more likely to receive a positive response from low-income and minority respondents than others in the population (Volberg & Steadman 1992). Questions about borrowing from the “household” to get money to gamble would be interpreted differently by individuals from ethnic groups where “household” may be defined as the entire extended family. It is possible that screens based on the DSM-IV criteria are more appropriate than the South Oaks Gambling Screen for identifying gambling-related problems among women and among peoples from cultures outside the United States. However, further research is needed to clarify this issue and to identify (or develop) appropriate instruments for use in different cultures.
Table 41: Comparing Demographics of SOGS-R and Fisher Problem Gamblers SOGS-R
Problem Gamblers
%
Fisher Problem
Gamblers %
(N=139) (N=68) Gender Male 79.1 70.6 Female 20.9 29.4 Age 15 – 17 12.3 10.3 18 – 24 20.3 25.0 25 – 44 47.1 39.7 45 – 64 18.1 23.5 65 – 74 2.2 1.5 Education Primary 36.0 50.0 Secondary 48.9 35.3 University 15.1 14.7 Country of Birth Sweden 79.7 73.1 Elsewhere 20.3 26.9 Location Big Cities 20.3 22.4 Elsewhere 79.7 77.6 Marital Status Unmarried 55.4 56.7 Married 18.0 19.4 Separated/Divorced 12.9 10.4 Widowed --- --- With minors 13.7 13.4

Gambling and Problem Gambling in Sweden
68
Use of the Fisher DSM-IV Screen in the Sweden survey provided a valuable opportunity to improve our understanding of the Fisher DSM-IV Screen in relation to the South Oaks Gambling Screen. In addition, use of this screen provides a basis for comparison in future surveys of gambling and problem gambling in Sweden if the Fisher DSM-IV Screen, or any other instrument based on the DSM-IV criteria, becomes the instrument of choice for identifying problem gamblers in the general population.
Gambling and Problem Gambling in Sweden
69
Risk Analysis for Problem or Pathological Gambling Behavior We have seen from the earlier reporting in this study that most Swedes try gambling like they continue to search for happiness in different ways. Looking at the Swedish population aged 15-74 as a whole, What is the risk of adapting a problematic gambling behavior for different groups in the society? This report has up to this point answered this question by scrutinizing some risk factors associated with higher prevalence in other surveys like gender, youth and education. By exploring the relationship between problem gambling activities of different kinds and one factor at a time we have been able to trace certain demographic groups being more risky than others. Given that many of these predictor variables of gambling behavior are inter-related it is interesting to employ multivariate analysis to examine their relative predictive and explanatory capacity. A first approach is reported below.
Statistical Modeling The advantage of statistical models like regression models is the ability to summarize data and test hypotheses. Our task is to examine the relationship between the dependent variable measuring problem or pathological gambling behavior and a set of independent, predictor variables. The kind of statistical modeling used for these multivariate analysis, loglinear analysis, is useful when the outcome, dependent, variable has two states only, Problematic gambling behavior or not, in combination with the situation that probability for Problematic behavior always being very small. These models are useful for uncovering the relationships among variables in a multiway crosstabulation especially when there are many categories making tabulation methods impossible as the number of observations per cell goes down or result in empty cells. Loglinear models are similar to multiple regression models. In loglinear models, all variables that are used for classification are independent variables, and the dependent variable is the number of cases in a cell of the crosstabulation. (Norusis, Marija J.: SPSS Advanced Statistics 6.1, SPSS Inc, Chicago, l994).
Data preparation Variables selected for the multivariate analysis were recoded for the logit analysis performed in SPSS Logit Loglinear Analysis. General principles are that the dependent variables are 1/2-variables, the interesting group coded 1 and 2 stands for “else”. The independent variables are all categorical variables and in the analysis the last group, highest code value, constitute the reference group.
Part of the imputation work was isolating the persons that had not answered the SOGS questions at all. In order to strengthen the multivariate analysis these missing cases are taken out to get more accurate estimates of gambling habits compared with making the assumption that the non-response values are all non-problematic as is done in the rest of the report. The number of persons in the analyzed sample is reduced from 7139 to 6624. All analyses are using rweight, the relative weight with mean weight equal to 1 when calculated on the full received sample. The sum of weights in the sample analyzed with multivariate models is 6656.
Dependent variables The way the variable ’current SOGS’ is defined in the study is that it singles out the last year behavior which shows that among the 87 persons rated on ‘SOGS life’ 5 or more’ it is 24 that has left this status and belong to the ‘SOS current’ 0-2 category, see Table xx. The chronic gamblers are 40 and the rest seems to have moved away from the pathological status they reported in the life time scale.
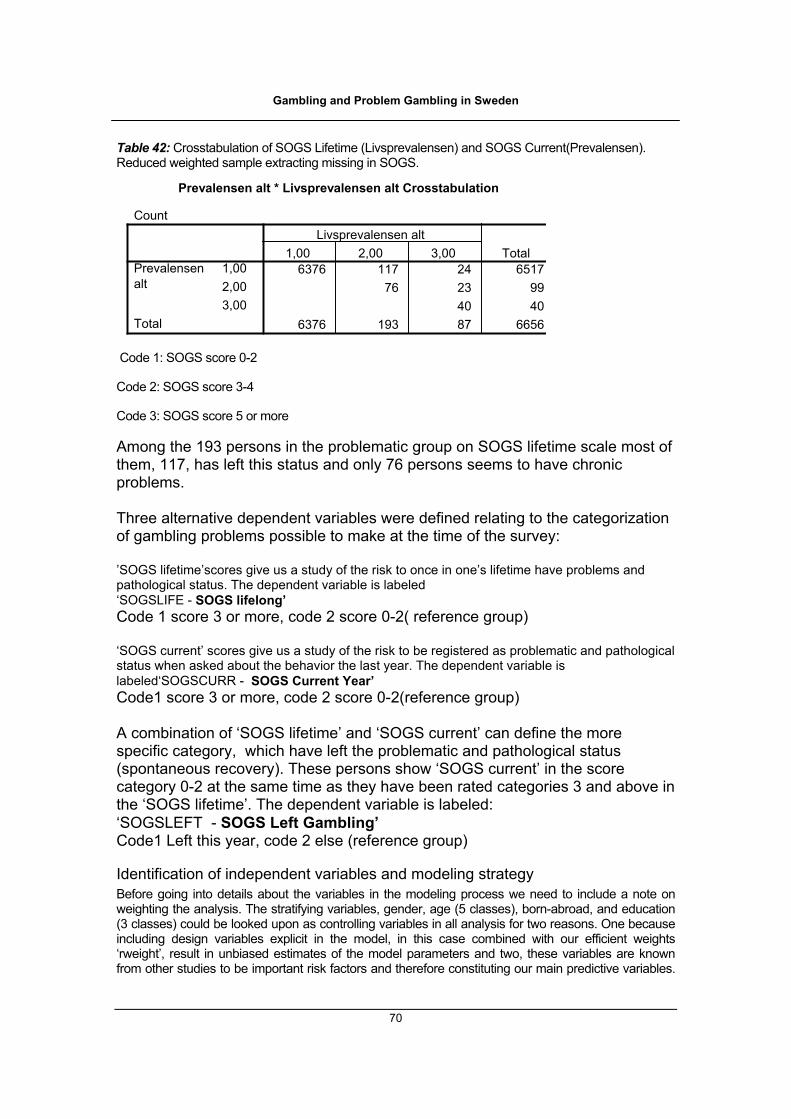
Gambling and Problem Gambling in Sweden
70
Table 42: Crosstabulation of SOGS Lifetime (Livsprevalensen) and SOGS Current(Prevalensen). Reduced weighted sample extracting missing in SOGS.
Prevalensen alt * Livsprevalensen alt Crosstabulation
Count
6376 117 24 651776 23 99
40 406376 193 87 6656
1,002,003,00
Prevalensenalt
Total
1,00 2,00 3,00Livsprevalensen alt
Total
Code 1: SOGS score 0-2
Code 2: SOGS score 3-4
Code 3: SOGS score 5 or more
Among the 193 persons in the problematic group on SOGS lifetime scale most of them, 117, has left this status and only 76 persons seems to have chronic problems. Three alternative dependent variables were defined relating to the categorization of gambling problems possible to make at the time of the survey: ’SOGS lifetime’scores give us a study of the risk to once in one’s lifetime have problems and pathological status. The dependent variable is labeled ‘SOGSLIFE - SOGS lifelong’ Code 1 score 3 or more, code 2 score 0-2( reference group) ‘SOGS current’ scores give us a study of the risk to be registered as problematic and pathological status when asked about the behavior the last year. The dependent variable is labeled‘SOGSCURR - SOGS Current Year’ Code1 score 3 or more, code 2 score 0-2(reference group) A combination of ‘SOGS lifetime’ and ‘SOGS current’ can define the more specific category, which have left the problematic and pathological status (spontaneous recovery). These persons show ‘SOGS current’ in the score category 0-2 at the same time as they have been rated categories 3 and above in the ‘SOGS lifetime’. The dependent variable is labeled: ‘SOGSLEFT - SOGS Left Gambling’ Code1 Left this year, code 2 else (reference group)
Identification of independent variables and modeling strategy Before going into details about the variables in the modeling process we need to include a note on weighting the analysis. The stratifying variables, gender, age (5 classes), born-abroad, and education (3 classes) could be looked upon as controlling variables in all analysis for two reasons. One because including design variables explicit in the model, in this case combined with our efficient weights ‘rweight’, result in unbiased estimates of the model parameters and two, these variables are known from other studies to be important risk factors and therefore constituting our main predictive variables.

Gambling and Problem Gambling in Sweden
71
In order to get approximate standard errors for the parameter estimates the same model is re-run without weights, a recommended procedure in the statistical literature. This procedure may later be validated by using the technical program WesVar Complex Samples 3.0.
The first step for logit multivariate analysis has been to make up a basic model including the stratifying independent variables defined as follows: GENDER Gender reference group ‘women’
Code 1 men, code 2 else
YOUTH Youth reference group ‘age 25 or older’
Code 1 age 15-24, code 2 else
NONSWE Born abroad reference group ‘Born in Sweden’
Code 1 born abroad, code 2 else
EDUC Educational level reference group ‘College and more’
Primary Code1 primary, code 2 else
Secondary Code 1 secondary, code 2 else
Next step in the modeling procedure has been to include a second block of variables one by one keeping the independent variables from the basic model as controlling variables including also the five age-categories. This approach answer the question if an additional predictor has any significant explanatory capacity over and above the main predictor variables gender, youth and age, born-abroad and education.
SINGLE Single civil status reference group ‘Not single’ Code 1 Single, code 2 else
CIVILS Civil status reference group ‘Family with children’ Single Code 1 Single, code 2 else Couple without children Code 1 Couple without children Code 2 else
CITY Big city living reference group ‘Non-big city residence’ Code 1 Big city residence, code 2,00 Else UNEMP Unemployed reference group ‘Employed’ Code1 Unemployed, code 2 else SOCWEL Social welfare reference group ‘Not on Social Welfare’
Code 1 Social Welfare, code 2 else
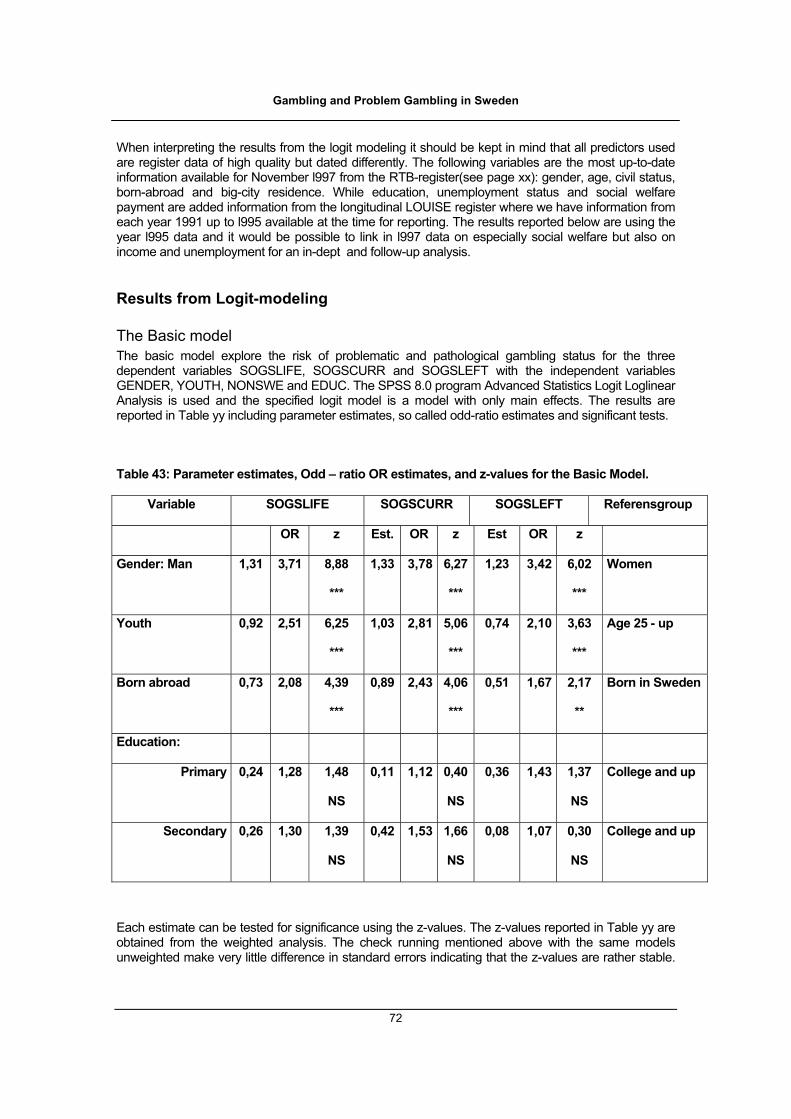
Gambling and Problem Gambling in Sweden
72
When interpreting the results from the logit modeling it should be kept in mind that all predictors used are register data of high quality but dated differently. The following variables are the most up-to-date information available for November l997 from the RTB-register(see page xx): gender, age, civil status, born-abroad and big-city residence. While education, unemployment status and social welfare payment are added information from the longitudinal LOUISE register where we have information from each year 1991 up to l995 available at the time for reporting. The results reported below are using the year l995 data and it would be possible to link in l997 data on especially social welfare but also on income and unemployment for an in-dept and follow-up analysis.
Results from Logit-modeling
The Basic model The basic model explore the risk of problematic and pathological gambling status for the three dependent variables SOGSLIFE, SOGSCURR and SOGSLEFT with the independent variables GENDER, YOUTH, NONSWE and EDUC. The SPSS 8.0 program Advanced Statistics Logit Loglinear Analysis is used and the specified logit model is a model with only main effects. The results are reported in Table yy including parameter estimates, so called odd-ratio estimates and significant tests.
Table 43: Parameter estimates, Odd – ratio OR estimates, and z-values for the Basic Model.
Variable SOGSLIFE SOGSCURR SOGSLEFT Referensgroup
OR z Est. OR z Est OR z
Gender: Man 1,31 3,71 8,88
***
1,33 3,78 6,27
***
1,23 3,42 6,02
***
Women
Youth 0,92 2,51 6,25
***
1,03 2,81 5,06
***
0,74 2,10 3,63
***
Age 25 - up
Born abroad 0,73 2,08 4,39
***
0,89 2,43 4,06
***
0,51 1,67 2,17
**
Born in Sweden
Education:
Primary 0,24 1,28 1,48
NS
0,11 1,12 0,40
NS
0,36 1,43 1,37
NS
College and up
Secondary 0,26 1,30 1,39
NS
0,42 1,53 1,66
NS
0,08 1,07 0,30
NS
College and up
Each estimate can be tested for significance using the z-values. The z-values reported in Table yy are obtained from the weighted analysis. The check running mentioned above with the same models unweighted make very little difference in standard errors indicating that the z-values are rather stable.
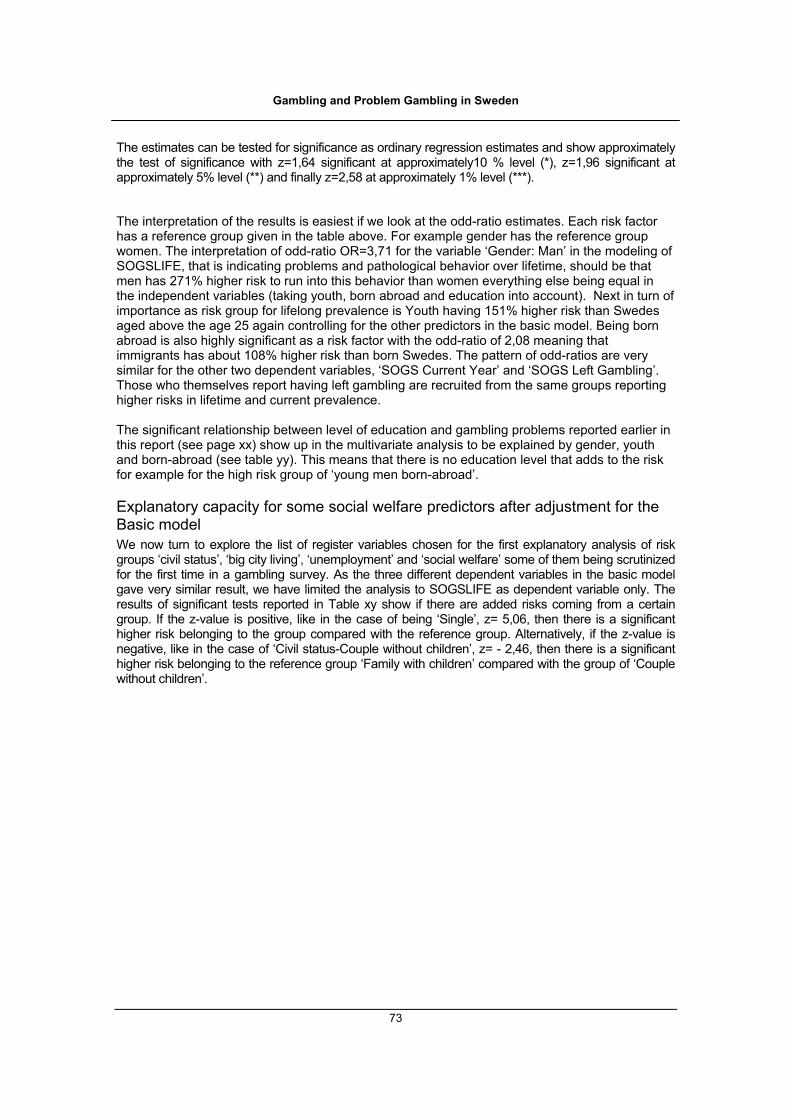
Gambling and Problem Gambling in Sweden
73
The estimates can be tested for significance as ordinary regression estimates and show approximately the test of significance with z=1,64 significant at approximately10 % level (*), z=1,96 significant at approximately 5% level (**) and finally z=2,58 at approximately 1% level (***).
The interpretation of the results is easiest if we look at the odd-ratio estimates. Each risk factor has a reference group given in the table above. For example gender has the reference group women. The interpretation of odd-ratio OR=3,71 for the variable ‘Gender: Man’ in the modeling of SOGSLIFE, that is indicating problems and pathological behavior over lifetime, should be that men has 271% higher risk to run into this behavior than women everything else being equal in the independent variables (taking youth, born abroad and education into account). Next in turn of importance as risk group for lifelong prevalence is Youth having 151% higher risk than Swedes aged above the age 25 again controlling for the other predictors in the basic model. Being born abroad is also highly significant as a risk factor with the odd-ratio of 2,08 meaning that immigrants has about 108% higher risk than born Swedes. The pattern of odd-ratios are very similar for the other two dependent variables, ‘SOGS Current Year’ and ‘SOGS Left Gambling’. Those who themselves report having left gambling are recruited from the same groups reporting higher risks in lifetime and current prevalence. The significant relationship between level of education and gambling problems reported earlier in this report (see page xx) show up in the multivariate analysis to be explained by gender, youth and born-abroad (see table yy). This means that there is no education level that adds to the risk for example for the high risk group of ‘young men born-abroad’.
Explanatory capacity for some social welfare predictors after adjustment for the Basic model We now turn to explore the list of register variables chosen for the first explanatory analysis of risk groups ‘civil status’, ‘big city living’, ‘unemployment’ and ‘social welfare’ some of them being scrutinized for the first time in a gambling survey. As the three different dependent variables in the basic model gave very similar result, we have limited the analysis to SOGSLIFE as dependent variable only. The results of significant tests reported in Table xy show if there are added risks coming from a certain group. If the z-value is positive, like in the case of being ‘Single’, z= 5,06, then there is a significant higher risk belonging to the group compared with the reference group. Alternatively, if the z-value is negative, like in the case of ‘Civil status-Couple without children’, z= - 2,46, then there is a significant higher risk belonging to the reference group ‘Family with children’ compared with the group of ‘Couple without children’.

Gambling and Problem Gambling in Sweden
74
Table 44: Explanatory capacity of SOGS Life time for some social welfare predictors added one at a time to the Basic model
Variable
added
SOGSLIFE
Significant test
Reference group
Single vs non-single z = 5,06 *** Non-single
Civil status:
Single z = -.31 NS Family with children
Couple without children z = -2,46 ** Family with children
Big city living z = 4,00 *** Non-big city residence
Unemployed z = -,23 NS Not unemployed
Social welfare z = 2,41 ** Not on Social welfare
Findings related to the non-significant relationships in Table xy are firstly being single compared with family with children doesn’t make a difference and secondly being unemployed compared with not being unemployed doesn’t either make a significant difference for the risk probability. Again we have to be reminded about the model behind these results which include main effects only and which contain the controlling variables gender, age, born-abroad and education. Another point is that, as mentioned above, the unemployment status is about two years back in time and that it would be much more relevant if the actual employment status at the time of survey could be inserted into the analysis, something for the future analysis to do.
The two highly significant risk groups are being ‘single’ compared with ‘non-single’ and also living in big cities compared with ‘non-big city residence’ everything else being equal in the basic model. Finally, the results show that getting social welfare payment two years before data collection seems to be risk factor, z= 2,41 **, probably underestimated because of the time-lag. For the interpretation of this result it should be added that during the period l995-l998 Sweden had high unemployment rates and also that those entering the social welfare payment system to a large extent stayed for quite long periods. The marginal groups supported by the social welfare payment system are characterized by multi-problem situations and the significant results for the group of social welfare persons compared with those not-on-social welfare give evidence that also gambling adds to the drop-out process from society.
Further analysis and design for follow-up This Swedish survey is one of the first of its kind in linking in information from different sources, a strategy which we have demonstrated raises the quality of the results but also adds considerably to the understanding of the roots of problematic gambling behavior, demonstrated in the multivariate analysis.
Gambling and Problem Gambling in Sweden
75
By this study design, a combination of survey and register data, where the register data can be added on as time goes, the researcher has an unique opportunity to trace the social and economic career of Swedes related to their gambling habits. The dropout process from society can be followed and personal as well as societal costs for problematic and pathological gambling can be estimated using for example the wide range of LOUISE-register data.
Suggestions for the future is that the rich data set should be analyzed further systematically exploring all the risk factors, the SOGS-R instrument should be validated and improved and new data collections should be planned in order to watch over the field of gambling and its consequences. A powerful follow-up design uses both the possibility of merging register data into the baseline study database and adds new cohorts of Swedish adults in repeated gambling surveys especially youth and ages with active family formation persons that should be followed over the crucial stages of adulthood like we recommend for the baseline study sample.
Conclusions
Overall the analysis of risks for gambling problems shown in this chapter gave the results that sex, age, big city living, and being born outside of Sweden are riskfactors. These are results, which we expected and which also were detected by simple relationship analysis as shown previously in the text. However, this analysis also shows that there is no correlation between education and gambling problems when sex, age and being born outside of Sweden is partialed out. This means that gambling problems are as prevalent among the three educational groups: primary, secondary, and university education when sex, age and born outside of Sweden is accounted for.
An interesting results of this analysis of risks for gambling problems is the correlation found between gambling problems and social welfare payment. This correlation needs further investigation. Is it so that welfare payment for a small but significant group is used to support pathological gambling? Or is it a spurious correlation where problems with alcohol and the accompanying contact with the social welfare and its relationship with gambling problems are better explanations? Whatever the best explanation is, this also illustrates how register data could be used for analysis of a social welfare problems as gambling behavior.
Another result that this kind of analysis gives in addition to simple cross-tabulation is illustrated by the results that both single and individuals and couples who have children have higher rates of gambling problems. It could be interpreted as meaning that there are two major groups of people having gambling problems: The ones living alone, and the ones being in child rearing age living in families with a children.
As in most research this investigation gave the results: the more you investigate the more questions your rise. You will detect problems and complications that you haven't seen before at the same as you are in a better position to decide what can be done to remedy the situation. To be in a better position to decide upon this growing social, psychological and economic problem in our society we strongly recommend further analysis and research of this topic of gambling problems in Sweden, first of all further analysis of the data from this study using register data and a follow-up study. This follow-up study should use this study as a baseline, and include a continued register up-date as well as a new cohort (panel) survey including improved SOGS or other DSM-based questionnaires, and focus on special risky ages of the population.

Gambling and Problem Gambling in Sweden
76
Gambling and Problem Gambling in Sweden
77
SUMMARY AND CONCLUSION The main purpose of this report was to establish a baseline measure of the prevalence of gambling and gambling-related problems among the population aged 15 to 74 in Sweden. An additional purpose of this report was to identify the types of gambling causing the greatest difficulties for the residents of Sweden. The results of this study will be useful in documenting the impact of legal gambling on the residents of Sweden. The results may also be valuable in formulating national policy with regard to legal gambling in Sweden. The results of this study show that significant numbers of Swedish residents participate in legal gambling, that these activities are widely accepted, and that most Swedes spend small to moderate amounts on gambling. However, the study also shows that there is a significant number of Swedish residents who are currently experiencing severe difficulties related to their gambling involvement.
Summary In 1997, more than nine out of ten respondents in Sweden acknowledged participating in one or more types of gambling at some time in their lives. This lifetime participation rate is comparable to lifetime participation rates in Australia, New Zealand and Canada and is higher than participation rates identified in the United States. Lifetime gambling participation in Sweden is highest for lotteries (including fast, national and local games), Bingo-Lotto, Swedish sports pools and slot machines. Non-gamblers and infrequent gamblers in Sweden are most likely to be female and less likely to have been born in Sweden than past year or past week gamblers. Non-gamblers and infrequent gamblers in Sweden are less likely to be married than regular gamblers and more likely to live in households with minor children. Non-gamblers and infrequent gamblers in Sweden tend to be either better educated or not as well educated as more regular gamblers. Past week gamblers in Sweden are most likely to be male and over the age of 45. While past week gamblers are likely to be married, they are less likely to live in households with children than other respondents. Past week gamblers are less likely than other respondents to have attended university and to live in the big cities in Sweden. Swedish respondents spent an average of SEK 194 in the past month on gambling activities. Converted into other currencies (approximately EURO 21.00, USD 24.00 or NZD 39.00), this amount is smaller than monthly gambling expenditures identified in the United States, Australia and New Zealand. Past month expenditures on Bingo-Lotto, horse races and Swedish sports (Tips) account for over half of the total gambling expenditures reported by Swedish respondents. Another third of past month expenditures are accounted for by lotteries besides Bingo-Lotto. As in other jurisdictions, the majority of respondents in Sweden report spending rather small amounts on gambling in the past month. The small group of respondents (6% of the sample) who report spending more than SEK 500 on gambling the past month account for 52% of the total reported monthly expenditures on gambling. These respondents are more likely than other respondents to be male, between the ages of 25 and 64 and unmarried or living without minors in the household. These respondents are less likely than other respondents to have attended university. Men in Sweden spend more on gambling than women and respondents aged 15 to 17 spend about one-third as much on gambling as older respondents. Respondents who have attended university spend less on gambling than respondents with lower levels of education and respondents who are unmarried, separated or divorced spend more on gambling than those who are married, widowed or who live with minors.
Gambling and Problem Gambling in Sweden
78
Between 147,706 (2.3%) and 199,082 (3.1%) Swedish residents aged 15 to 74 can be classified as lifetime problem gamblers. In addition, we estimate that between 61,009 (0.95%) and 93,119 (1.45%) Swedish residents aged 15 to 74 can be classified as lifetime probable pathological gamblers. Between 70,642 (1.1%) and 109,174 (1.7%) Swedish residents aged 15 to 74 can be classified as current problem gamblers. In addition, we estimate that between 25,688 (0.4%) and 51,376 (0.8%) Swedish residents aged 15 to 74 can be classified as current probable pathological gamblers. Lifetime and current prevalence rates are higher among respondents who participated in the survey by mail rather than telephone, among men, among respondents aged 15 to 24, among non-Swedish-born respondents and among respondents who are unmarried, separated or divorced or living with minors in the household. The current prevalence of problem and probable pathological gambling is highest among past year gamblers in restaurant casinos, on card games not at casinos, on arcade machines and on games of skill. Current prevalence rates among past year gamblers on Swedish sports pools (Tips), horse races, slot machines and bingo are approximately double the prevalence rate among past year gamblers in general. Jurisdictions with the highest lifetime prevalence rates of problem and pathological gambling tend to be ethnically heterogeneous while jurisdictions with lower lifetime prevalence rates tend to be ethnically homogeneous. The lifetime prevalence rates of problem and probable pathological gambling in Sweden are lower than in North American states and provinces surveyed in recent years as well as in New Zealand in 1991. Like the lifetime rates, current prevalence rates of problem and probable pathological gambling in Sweden are lower than in North American states and provinces surveyed in recent years as well as in New Zealand. The demographic profile of problem gamblers in Sweden is similar to the profile of problem gamblers in many other jurisdictions. Problem gamblers in Sweden are more likely than non-problem gamblers to be male, under the age of 45, to have been born abroad, to live in the major cities in Sweden and to be unmarried or living with minors in the household. Problem gamblers in Sweden are less likely than non-problem gamblers to have attended secondary school or college. Problem gamblers in Sweden are more likely than non-problem gamblers to have gambled in the past week on Swedish sports betting (Tips), horse races, restaurant casino games and slot machines. Nearly one-quarter of the problem gamblers (22%) identified Swedish sports betting as their favorite type of gambling, 18% identified horse races as their favorite type of gambling and 15% identified restaurant casino games or slot machines as their favorite type of gambling. The greatest differences between non-problem and problem gamblers in Sweden in average past month expenditures on gambling are for wagering on horse races, Swedish sports pools, restaurant casino games and card games not at casinos. Analysis of the ratio between past week involvement and past month expenditures of non-problem and problem gamblers suggests that increases in restaurant casino games and slot machines are most likely to contribute to increases in the prevalence of problem and pathological gambling in Sweden. This corresponds to prior analysis showing that current prevalence rates are four times higher among past year restaurant casino gamblers and two times higher among past year slot machine players than among past year gamblers in general. Increases in other types of gambling in Sweden may also contribute to increases in prevalence rates. These include Swedish sports betting (Tips) and horse race wagering as well as bingo.
Gambling and Problem Gambling in Sweden
79
Problem gamblers in Sweden begin gambling at a significantly younger age (15.6 years) than non-problem gamblers (19.9 years). This is consistent with research from many other jurisdictions internationally. Problem gamblers in Sweden are more likely than non-problem gamblers to have felt nervous about their gambling and to have felt that one or both parents had a gambling problem. Problem gamblers in Sweden are more likely than non-problem gamblers to gamble for leisure or escape, to be uncomfortable while gambling, to gamble alone, to gamble longer and to have lost more in a single day of gambling. Problem gamblers in Sweden are more likely than non-problem gamblers to feel anxious about their health and their households as well as about the international situation. Examining differences in gambling by gender, we find that men in Sweden are more likely than women to be past year and past week gamblers. The differences in past year involvement for men and women are greatest for Swedish sports betting (Tips) and horse races although women are more likely than men to have gambled in the past year on fast lotteries, on Bingo-Lotto and bingo. Male problem gamblers in Sweden are most likely to have gambled in the past week on Swedish sports pools and on horse races while female problem gamblers are more likely to have gambled in the past week on bingo. Considering differences in gambling by age, we find that youth in Sweden (15 to 17 years) are less likely to gamble than adults and that those youths who have gambled in the past year are most likely to be male. Youth respondents are most likely to have gambled in the past year on fast lottery games, slot machines and local lottery games. Youth respondents are more likely than adults to have gambled in the past year on slot machines, arcade machines, card games and games of skill. Youth respondents report spending less on gambling in the past month than adult respondents and boys report spending more money on gambling than girls. Prevalence rates of problem and probable pathological gambling are higher among boys than among girls, among youth born abroad than among youth born in Sweden and among youth living in big cities compared with youth living elsewhere in Sweden. With reference to nationality, we find that while non-Swedish-born respondents are less likely than Swedish-born respondents to have ever gambled, these respondents are more likely to experience gambling problems. Prevalence rates are higher among non-Swedish-born men than women. Prevalence rates are also high among non-Swedish-born respondents who are unmarried, separated or divorced.
Directions for the Future The costs of gambling problems can be high, not only for individuals but for families and communities. Pathological gamblers experience physical and psychological stress and exhibit substantial rates of depression, alcohol and drug dependence and suicidal ideation. The families of pathological gamblers experience physical and psychological abuse as well as harassment and threats from bill collectors and creditors. Other significant impacts include costs to employers, creditors, insurance companies, social service agencies and the civil and criminal justice systems. The first step usually taken by governments in response to an emerging social problem is to determine the number of individuals who may be in need of assistance as a result of a specific government policy or activity. The next step is to develop a range of services for affected individuals and their families. In the wake of widespread gambling legalization, governments have moved forward in implementing measures to educate the public as well as treatment professionals and gaming operators about problem gambling.
What Have Other Countries Done?

Gambling and Problem Gambling in Sweden
80
While there has been an increase in gambling policy development in both the public and private sectors, the level of interest and the funds available for education, prevention and treatment programs have not kept pace with increases in legal gambling revenues or in the availability of gambling. In North America, problem gambling has received attention at the state and provincial level rather than at the federal or local level. As of 1998, 32 North American governments had initiated and funded programs for problem gambling. Except in Canada, these programs are largely limited to prevention, education, and referral activities. Furthermore, the level of funding for these programs is minuscule compared to similar programs for mental health, substance abuse, and other human services. The provincial governments in Canada have been quite aggressive in addressing the issue of problem gambling. While the structure of services throughout the provinces is similar to most United States jurisdictions, provincial per capita funding for these programs far surpasses that of the states. There are also more links between provincial lotteries and problem gambling programs, which can partly be attributed to the wider scope of responsibility that Canadian lottery commissions have in both regulating and promoting traditional lottery products, electronic gambling devices, limited sports wagering and even casinos. Since 1990, the gaming industries have begun to develop initiatives to address the issues of underage and problem gambling. The most proactive has been the casino industry. A growing number of casino companies are adopting the franchised prevention programs developed by Harrah’s Casinos, Bet Smart® and Project 21®. The American Gaming Association has promoted the efforts of casinos to develop responsible gambling practices through a variety of measures. Their Responsible Gaming Task Force has developed a resource guide for establishing responsible gambling policies and programs. The American Gaming Association recently declared a week in early August “Responsible Gaming Education Week” with the goal of educating employers, employees and customers about “disordered” gambling (American Gaming Association 1998). The recently established National Center for Responsible Gaming, funded by the American Gaming Association, channels resources for research on underage and problem gambling to academic institutions. Other casino company activities include financial support for the National Council on Problem Gambling helpline as well as for problem gambling councils in at least five states. Perhaps because lotteries are still viewed as more benign than casinos, pressures to respond to the issues of underage and problem gambling have been less intense for the lottery industry than for the casino industry. However, public policy mandates are beginning to link lotteries to problem gambling funds or programs. Keno and video lottery or video poker organizations, whether part of a state lottery system or an independent function, have also shown some support for problem gambling programs. Interest in and responses to underage and problem gambling issues have been lowest among the pari-mutuel and charitable gambling sectors. A small number of pari-mutuel operators have shown an interest in addressing these issues and there is work underway to develop responsible gambling policies and programs for this sector of the gambling industry. In the United States, charitable gambling operators have shown almost no interest in the issue of problem gambling; this may be due to the widespread perception that charitable wagering is not “real” gambling. There is a multitude of challenges ahead in formulating good public policy in the area of legal gambling. Like the alcohol and tobacco industries, the gaming industries are linked to an externality that is both peculiar to their customers and highly controversial: problem gambling. In addressing this issue, governments must first measure the size of the problem, then allocate public funds to address the problem, and finally, because these services must be funded by someone, assess the size of the bill and attempt to find ways to pay for it.
Gambling and Problem Gambling in Sweden
81
How Many To Plan For? The first step in developing rational policy with regard to legal gambling has now been taken in Sweden by funding the prevalence study reported here. One important purpose of a prevalence survey is to identify the number of individuals in a jurisdiction who may need treatment services for gambling-related difficulties. Experience in many jurisdictions suggests that not all of the individuals in need of treatment for a physical or psychological problem will seek out such treatment. From a policy perspective, the question is: How many individuals should we plan to provide for? Recently, researchers in Australia have successfully used an approach adopted from the alcoholism treatment field to predict the proportion of individuals in need of problem gambling treatment services who would access such services. Research suggesting that approximately 3% of individuals with severe alcohol-related difficulties actually seek treatment was replicated in predicting the number of problem gamblers who would seek treatment in two Australian states (Dickerson 1997). This approach was tested in Oregon where treatment services for problem gamblers are widely available. The results of the prevalence survey in Oregon suggested that between 600 and 1400 individuals would seek treatment per year. In fact, the problem gambling treatment programs in Oregon have an average annual enrollment of 610 problem gamblers and family members per year. In calculating the number of problem and pathological gamblers who might seek treatment in Sweden, we focus on the group of individuals who score as current probable pathological gamblers (e.g. the 25,688 to 51,376 individuals represented by the confidence interval for current probable pathological gambling in Sweden). Based on this approach, we estimate that the Swedish Government should plan to provide problem gambling treatment services to between 750 and 1550 individuals per year.
Recommendations Given the possible expansion of legal gambling in Sweden to include urban-center casinos, it will be important to establish a broad range of services for problem gamblers and their families. These include education and prevention services, training for treatment professionals who may already be encountering problem gamblers among their clients and treatment services as well as evaluation of these efforts and continued monitoring of the prevalence of gambling-related problems in the population. In making decisions about implementing services for problem gamblers and their families in Sweden, policy-makers may wish to give particular consideration to developing the following services and activities: • development of innovative treatment alternatives to provide a variety of options for individuals
seeking help for gambling problems; • establishment of training opportunities to educate mental health, alcohol and substance
abuse treatment professionals in how to screen for gambling problems and pathology as well as when and where to refer such individuals for appropriate treatment;
• establishment of a gambling counselor certification program to ensure that individuals
seeking help for gambling-related difficulties receive appropriate and effective services; • development of public education and prevention services targeted toward at-risk and under-
served groups in the population, including young males and women problem gamblers, as well as toward specific types of gambling, including video poker and lottery outlets and casinos within the state;

Gambling and Problem Gambling in Sweden
82
• development of responsible gaming policies and programs by all of the different gaming operators in Sweden for staff, retailers and customers;
• ongoing evaluation of program services that are established for problem gamblers and their
families; and • continued monitoring of gambling and problem gambling prevalence to assess the impacts of
the introduction of new types of legal gambling on the residents of Sweden and to refine existing efforts to minimize the negative impacts of gambling.
This report represents the first assessment of the prevalence of gambling and problem gambling in Sweden. The data from this survey provide insights that will be valuable in ongoing policy and planning efforts in Sweden. In the future, it will be important for everyone involved with legal gambling in Sweden to continue to work together to develop ways to help the residents of Sweden who experience difficulties related to their gambling and to prevent any future increases in the prevalence of problem gambling.

Gambling and Problem Gambling in Sweden
83
REFERENCES
REFERENCES Abbott, M. W. & R. A. Volberg. 1991. Gambling and Problem Gambling in New Zealand: Report on
Phase One of the National Survey. Research Series No. 12. Wellington: New Zealand Department of Internal Affairs.
Abbott, M. W. & R. A. Volberg. 1992. Frequent Gamblers and Problem Gamblers in New Zealand:
Report on Phase Two of the National Survey. Research Series No. 14. Wellington: New Zealand Department of Internal Affairs.
Abbott, M. W. & R. A. Volberg. 1996. "The New Zealand National Survey of Problem and
Pathological Gambling," Journal of Gambling Studies 12 (2): 143-160. Abbott, M. W., R. A. Volberg, J. Baines & N. Taylor. 1999. Gambling Participation, Problems
and Social and Economic Impacts: A Critical Review. Report No. 2 of the 1998/1999 New Zealand Gaming Survey. Wellington: New Zealand Department of Internal Affairs.
Algotsdotter, B. & Granlund-Öhman, M. (1997). Utprövning av Swedish Gambling Screen.
Örebro: Mättekniska Laboratoriet, Statistiska Centralbyrån. American Gaming Association. 1998. “Update: An Industry-wide Effort to Combat Problem
Gambling," International Gaming & Wagering Business 19 (6): 10. American Psychiatric Association. 1980. Diagnostic and Statistical Manual of Mental Disorders,
Third Edition. Washington, DC: American Psychiatric Association. American Psychiatric Association. 1994. Diagnostic and Statistical Manual of Mental Disorders,
Fourth Edition. Washington, DC: American Psychiatric Association. Asplund, A., & Lundström, S. (1998). Statistics Sweden Report from the Survey of Pathological
Gambling Prevalence. Örebor: Statistics Sweden. Austrin, T. 1998. “Retailing Leisure: Local and Global Developments in Gambling.” In C.C.
Perkins & G. Cushman (eds.), Time Out? Leisure, Recreation and Tourism in New Zealand and Australia. Auckland: Longman. Pp. 167-181.
Baldridge, J., J. T. Sylvester, R. A. Volberg & W. L. Moore. 1999. Error in Respondent Estimates of
Gambling Expenditures. Working Paper, Gemini Research, Ltd. Bivins, J. & J. Hahnke. 1998. The New Path to Profits: Technology Strategies for the Gaming
Industry. Special supplement to International Gaming & Wagering Business (June 1998). Björklund, L.-G., Cronqvist, A.-E., Frigren, R., Glimme, D., Holmqvist, I., Jonshult, B. G., Swahn,
J.-Ö., Thorén, A., Unge, I. & Wessberg, G. Spel om pengar idag och förr i tiden. Tipstjänst/Bra Böcker.
Blaszczynski, A., V. Dumlao & M. Lange. 1997. “’How Much Do You Spend Gambling?’
Ambiguities in Survey Questionnaire Items,” Journal of Gambling Studies 13 (3): 237-252.
Gambling and Problem Gambling in Sweden
84
Cox, S., H. R. Lesieur, R. J. Rosenthal & R. A. Volberg. 1997. Problem and Pathological Gambling in America: The National Picture. Columbia, MD: National Council on Problem Gambling.
Culleton, R. P. 1989. "The Prevalence Rates of Pathological Gambling: A Look at Methods,"
Journal of Gambling Behavior 5: 22-41. Dickerson, M. G. 1993. "A Preliminary Exploration of a Two-Stage Methodology in the Assessment
of the Extent and Degree of Gambling-Related Problems in the Australian Population." In Eadington, W. R. & J. A. Cornelius (eds), Gambling Behavior and Problem Gambling. Reno: University of Nevada Press. Pp. 347-363.
Dickerson, M.G. 1993. “Internal and External Determinants of Persistent Gambling: Problems in
Generalizing from One Form of Gambling to Another,” Journal of Gambling Studies 9 (3): 225-245.
Dickerson, M. G. 1997. The Australian Experience of the Development of Strategies to Address
Gambling Related Problems in the Community: Implications for Other Jurisdictions. Paper presented at the 10th International Conference on Gambling and Risk Taking. Montreal, CANADA.
Dohrenwend, B. P. 1995. “The Problem of Validity in Field Studies of Psychological Disorders,
Revisited.” In Ming, T. Tsuang, Mauricio Tohen & Gwendolyn E. P. Zahner (eds), Textbook in Psychiatric Epidemiology. New York: Wiley-Liss. Pp. 3-20.
Erikson, E. 1963. Childhood and Society. New York: Norton. Fisher, S. E. 1996. Gambling and Problem Gambling Among Casino Patrons. Report to the British
Casino Industry Consortium. Goodman, R. 1995. The Luck Business: The Devastating Consequences and Broken Promises of
America's Gambling Explosion. New York: Free Press. Grant, D. 1994. On a Roll: A History of Gambling and Lotteries in New Zealand. Wellington:
Victoria University Press. Griffiths, M.D. 1998a. Gambling into the Millennium: Issues of Concern and Potential Concern.
Paper presented at the National GamCare Conference. Adelaide, 6 May, 1998. Griffiths, M.D. 1998b. The Way Ahead: Internet, Technology and Problems - What Can We
Expect? Paper presented at the National GamCare Conference. Adelaide, 6 May, 1998. Hraba, J., & Lee, G. 1996. “Gender, Gambling and Problem Gambling,” Journal of Gambling
Studies 12 (1): 83-101. Jerremalm, A., Lundström, I. & Wiséhn, I. (1993). Trumf på hand. En historia om svenska
spelkort. Stockholm:Kungl. Myntkabinettet och Chartophilia Suecia. Kallick, M., Suits, D. Dielman, T. & J. Hybels. 1979. A Survey of American Gambling Attitudes and
Behavior. Research Report Series, Survey Research Center, Institute for Social Research. Ann Arbor: University of Michigan Press.
Kelly, J. 1998. “Australia: Two States Tackle Internet Games,” International Gaming & Wagering
Business 19 (4): 11. Kühlhorn, E., Ahren, U.-B., Berg, C., Björ, J., Helenius, K., Leifman, H. & Lundegård, Å. 1995. Spelandet i Sverige. Brå-rapport 1995:1.

Gambling and Problem Gambling in Sweden
85
Stockholm: Brottsförebyggande rådet. Ladouceur, R., A. Gaboury, M. Dumont & P. Rochette. 1988. "Gambling: Relationship Between the
Frequency of Wins and Irrational Thinking," Journal of Psychology 122: 409-414. Lesieur, H. R. 1994. "Epidemiological Surveys of Pathological Gambling: Critique and Suggestions
for Modification," Journal of Gambling Studies 10 (4): 385-398. Lesieur, H. R. & S. B. Blume. 1987. "The South Oaks Gambling Screen (SOGS): A New
Instrument for the Identification of Pathological Gamblers," American Journal of Psychiatry 144: 1184-1188.
Lesieur, H. R. & R. Klein. 1985. Prisoners, Gambling and Crime. Paper presented at the Meetings
of the Academy of Criminal Justice Scientists. Lesieur, H. R. & R. J. Rosenthal. 1991. "Pathological Gambling: A Review of the Literature
(prepared for the American Psychiatric Association Task Force on DSM-IV Committee on Disorders of Impulse Control Not Elsewhere Classified)," Journal of Gambling Studies 7 (1): 5-40.
Lesieur, H. R. & R. J. Rosenthal. 1998. “Analysis of Pathological Gambling.” In Widiger, T. A.,
A. J. Francis, H. A. Pincus, R. Ross, M. B. First, W. Davis & M. Kline (eds), DSM-IV Sourcebook, Volume 4. Washington, D.C.: American Psychiatric Association. Pp. 393-401.
Lesieur, H. R., S. Blume & R. M. Zoppa. 1986. "Alcoholism, Drug Abuse, and Gambling,"
Alcoholism: Clinical and Experimental Research 10: 33-38. Lindquist, M., Lundström, I. & Maechel, I. (1994). Hasard: Spela är silver, vinna är guld. Hasard
genom tiderna. Stockholm: Statens historiska museum. Litwin, M. S. 1995. How to Measure Survey Reliability and Validity. Thousand Oaks: Sage
Publications. Lotteriinspektionen (1998). Rapport till regeringen om utvecklingen på spel- och lotterimarknaden i
Sverige. Strängnäs: Lotteriinspektionen. Lotteriinspektionen (1999). Lotteriinspektionen informerar, nr 1, mars 1999. Lundström, I. (Red.) (1989). Tärningen är kastad: Spel genom tiderna. Börstorps slott sommaren
1989. Börstorps slott. McMillen, J. 1996. “The State of the Play: Policy Issues in Australian Gambling.” In Tolchard, B.
(ed), Towards 2000: The Future of Gambling. Adelaide: National Association for Gambling Studies.
McQueen, P. A. 1998. "North American Gaming at a Glance," International Gaming & Wagering
Business 19 (9): 20-22, 109. National Opinion Research Center. 1999. Gambling Impact and Behavior Study. Report to the
National Gambling Impact Study Commission. (April 1, 1999). Norusis, Marija J. 1994. SPSS Advanced Statistics 6.1, Chicago: SPSS Inc. Phillips, J. 1987. A Man's Country? The Image of the Pakeha Male: A History. Auckland:
Penguin Books.
Gambling and Problem Gambling in Sweden
86
Polzin, P. E., J. Baldridge, D. Doyle, J. T. Sylvester, R. A. Volberg & W. L. Moore. 1998. “From
Convenience Stores to Casinos: Gambling – Montana Style,” Montana Business Quarterly 36 (4): 2-14.
Rose, I. N. 1999. “The Myth of the Level Playing Field,” Casino Executive 49. (Accessed April
26, 1999). Rosecrance, J. 1988. Gambling Without Guilt: The Legitimation of an American Pastime. Belmont,
CA: Wadsworth. Rönnberg, S., Abbott, M. & Volberg, R. (1998). Swedish pathological gambling prevalence study
proposals. Report No. 1 of the National Institute of Public Health Series on Gambling. Stockholm: Folkhälsoinstitutet.
Schachter, T., & Nathan, P.E. 1977. “But Is It Good for the Psychologists? Appraisal and Status
of DSM-III,” American Psychologist 32: 1017-1025. Shaffer, H. J., M. N. Hall & J. Vander Bilt. 1997. Estimating the Prevalence of Disordered Gambling
Behavior in the United States and Canada: A Meta-analysis. Boston, MA: Harvard Medical School Division on Addictions.
Sinclair, S. 1997. “By the Numbers: Internet Casino Growth Predicted,” International Gaming &
Wagering Business 18 (3): 17. Sinclair, S. 1998. “By the Numbers: Cybergaming's Limited Market,” International Gaming &
Wagering Business 19 (3): 12. Stinchfield, R. 1997. Reliability, Validity and Classification Accuracy of the South Oaks Gambling
Screen (SOGS). Paper presented at the 10th International Conference on Gambling and Risk Taking. Montreal, CANADA.
Thompson, W. N. 1997. Legalized Gambling: A Reference Handbook. Santa Barbara, CA:
ABC-CLIO. Volberg, R. A. 1992. Gambling Involvement and Problem Gambling in Montana. Report to the
Montana Department of Corrections and Human Services. Volberg, R. A. 1994a. "Assessing Problem and Pathological Gambling in the General Population:
A Methodological Review." In Campbell, C. (ed), Gambling in Canada: The Bottom Line. Vancouver: Simon Fraser University Press.
Volberg, R. A. 1994b. "The Prevalence and Demographics of Pathological Gamblers: Implications
for Public Health," American Journal of Public Health 84 (2): 237-241. Volberg, R. A. 1996a. Gambling and Problem Gambling in New York: A 10-Year Replication
Survey, 1986 to 1996. Report to the New York Council on Problem Gambling. Volberg, R. A. 1996b. "Prevalence Studies of Problem Gambling in the United States," Journal of
Gambling Studies 12 (2): 111-128. Volberg, R. A. 1997a. Gambling and Problem Gambling in Colorado. Report to the Colorado
Department of Revenue. Volberg, R. A. 1997b. Gambling and Problem Gambling in Oregon. Report to the Oregon
Gambling Addiction Treatment Foundation.
Gambling and Problem Gambling in Sweden
87
Volberg, R. A. 1998a. Testimony: Research on Problem Gambling. Testimony before the National
Gambling Impact Study Commission. Expert Panel on Pathological Gambling, Atlantic City, NJ. (January 22, 1998).
Volberg, R. A. 1998b. Methodological Issues in Research on Problem Gambling. Report to the
National Research Council, National Academy of Sciences. Volberg, R. A. & M. W. Abbott. 1994. "Lifetime Prevalence Estimates of Pathological Gambling in
New Zealand," International Journal of Epidemiology 23 (5): 976-983. Volberg, R. A. & M. W. Abbott. 1997. “Gambling and Problem Gambling Among Indigenous
Peoples.” Substance Use and Misuse 32 (11): 1525-1538. Volberg, R. A. & S. M. Banks. 1990. "A Review of Two Measures of Pathological Gambling in the
United States," Journal of Gambling Behavior 6(2): 153-163. Volberg, R. A. & S. M. Banks. 1994. A New Approach to Understanding Gambling and Problem
Gambling in the General Population. Paper presented at the Ninth International Conference on Gambling and Risk Taking. Las Vegas, NV.
Volberg, R. A. and M. G. Dickerson (eds). 1996. Journal of Gambling Studies, Special Issue on
Prevalence Studies of Problem and Pathological Gambling. Vol. 12, No. 2. Volberg, R. A. & W. L. Moore. 1999a. “Appendix D: Gambling and Problem Gambling in
Louisiana: A Replication Study, 1995 to 1998.” In Ryan, T. P. & J. F. Speyrer, Gambling in Louisiana: A Benefit/Cost Analysis. Report to the Louisiana Gaming Control Board.
Volberg, R. A. & W. L. Moore. 1999b. Gambling and Problem Gambling in Washington State: A
Replication Study, 1992 to 1998. Report to the Washington State Lottery. Volberg, R. A. & E. Silver. 1993. Gambling and Problem Gambling in North Dakota. Report to the
North Dakota Department of Human Services, Division of Mental Health. Volberg, R. A. & H. J. Steadman. 1988. "Refining Prevalence Estimates of Pathological Gambling,"
American Journal of Psychiatry 145: 502-505. Volberg, R. A. & H. J. Steadman. 1992. "Accurately Depicting Pathological Gamblers: Policy and
Treatment Implications." Journal of Gambling Studies 8 (4): 401-412. Volberg, R. A. & R. M. Stuefen. 1991. Gambling and Problem Gambling in South Dakota. Report
to the Governor's Office of South Dakota. Volberg, R. A., D. C. Reitzes & J. Boles. 1997. “Exploring the Links Between Gambling, Problem
Gambling and Self-Esteem.” Deviant Behavior 18: 321-342. Volberg, R. A., W. L. Moore, E. M. Christiansen, W. Cummings & S. M. Banks. 1998.
“Unaffordable Losses: Estimating the Proportion of Gambling Revenues Derived from Problem Gamblers,” Gaming Law Review 2 (4): 349-360.
Wakefield, J. C. 1997. “Diagnosing DSM-IV: Part 1 DSM-IV and the Concept of Disorder,”
Behavior, Research and Therapy. Walker, M. B. 1992. The Psychology of Gambling. Oxford: Pergamon Press.

Gambling and Problem Gambling in Sweden
88
Walker, M. B. & M. G. Dickerson. 1996. “The Prevalence of Problem and Pathological Gambling: A Critical Analysis,” Journal of Gambling Studies 12 (2): 233-249.
Wicklin, B. (1994). Facts and figures on gambling and lotteries in Sweden 1970-1993. Stockholm:
Statistiska Centralbyrån. Wildman, R. W. 1998. Gambling: An Attempt at an Integration. Edmonton: Wynne Resources. Winters, K. C., S. Specker & R. Stinchfield. 1997. Brief Manual for Use of the Diagnostic Interview
for Gambling Severity. Minneapolis, MN: University of Minnesota Medical School. Wynne, H. J., G. J. Smith & R. A. Volberg. 1994. Gambling and Problem Gambling in Alberta.
Report to the Alberta Lotteries and Gaming Commission.

Gambling and Problem Gambling in Sweden
APPENDIX A: List of Tables and Figures

Gambling and Problem Gambling in Sweden
A-1
LIST OF TABLES
Table 1: Turnover of Gambling in Sweden.......................................................................................9 Table 2: Response and Non-Response Rates...............................................................................18 Table 3: Demographics of Gamblers in Sweden............................................................................23 Table 4: Past Month Expenditure on Gambling.............................................................................25 Table 5: Past Month Expenditures by Different Groups in Sweden...............................................26 Table 6: Scores on Lifetime and Current SOGS-R Items ..............................................................30 Table 7: Prevalence Rates Among Demographic Groups .............................................................31 Table 8: Prevalence by Type of Gambling .....................................................................................32 Table 9: Positive Responses on SOGS-R Items............................................................................33 Table 10: Construct Validity of SOGS-R ........................................................................................34 Table 11: Demographics of Non-Problem and Problem Gamblers in Sweden..............................39 Table 12: Weekly Gambling of Non-Problem and Problem Gamblers...........................................40 Table 13: Mean Monthly Expenditures of Non-Problem and Problem Gamblers ..........................41 Table 14: Rank Order of Involvement and Expenditures ...............................................................42 Table 15: Other Significant Differences Between Non-Problem and Problem Gamblers..............43 Table 16: Comparing Men and Women .........................................................................................45 Table 17: Lifetime Gambling of Men and Women..........................................................................46 Table 18: Past Year Gambling of Men and Women.......................................................................46 Table 19: Mean Monthly Expenditures of Men and Women ..........................................................47 Table 20: Positive Responses by Men and Women on SOGS-R Items ........................................47 Table 21: Comparing Male and Female Problem Gamblers..........................................................48 Table 22: Comparing Demographics of Youth and Adults.............................................................49 Table 23: Gambling Participation of Youth and Adults...................................................................50 Table 24: Past year Gambling of Youth and Adults.......................................................................50 Table 25: Mean Monthly Expenditures of Youth and Adults .........................................................51 Table 26: Comparing Youth and Adults on Lifetime SOGS-R Items .............................................52
Gambling and Problem Gambling in Sweden
A-2
Table 27: Past Week Gambling of Youth Non-Problem and Problem Gamblers ..........................53 Table 28: Comparing Swedes and Non-Swedish-Born.................................................................54 Table 29. Gambling Participation of Swedes and Non-Swedish-
born...........................................55 Table 30: Past Year Gambling of Swedish and Non-Swedish-Born..............................................55 Table 31: Mean Monthly Expenditures of Swedish and non-Swedish Born .................................56 Table 32: Comparing Swedes and Non-Swedish-Born on Lifetime SOGS-R Items.....................57 Table 33: Past Week Gambling of Non-Swedish-Born Non-Problem and Problem Gamblers.....58 Table 34: Scores on DSM-IV Items...............................................................................................61 Table 35: Comparing Endorsement of Fisher Items......................................................................62 Table 36: Comparing Non-Problem and Problem Gamblers on the Fisher Items ........................63 Table 37: Comparing Scores on the SOGS-R and the Fisher Screen..........................................64 Table 38: Comparing the Performance of the SOGS-R and Fisher Screen Across Jurisdictions.64 Table 38: Comparing Scores on Similar SOGS-R and Fisher Items.............................................65 Table 40: Construct Validity of Fisher Screen................................................................................66 Table 41: Comparing Demographics of SOGS-R and Fisher Problem Gamblers........................67 Table 42: Crosstabulation of SOGS Lifetime and SOGS Current.............................................................69
Table 43: Odd-ratios Estimates..................................................................................................................71
Table 44: Explanatory Capacity of SOGS Lifetime for Social Welfare Predictors...................................72
Gambling and Problem Gambling in Sweden
A-3
LIST OF FIGURES
Figure 1: Relations between True and False Negatives and True and False Positives, and Pathological and Non-Pathological Gambling ........................................................................13
Figure 2: Lifetime and Past Year Participation Rates in Sweden ..................................................22 Figure 3: Lifetime Prevalence Rates in Selected Jurisdictions ......................................................36 Figure 4: Current Prevalence Rates in Selected Jurisdictions.......................................................37

Gambling and Problem Gambling in Sweden
A-4

Gambling and Problem Gambling in Sweden
APPENDIX B: Questionnaire for the
Swedish Pathological Gambling Prevalence Study

Gambling and Problem Gambling in Sweden
B-1
Related Documents