ARTICLE doi:10.1038/nature10835 Gain control by layer six in cortical circuits of vision Shawn R. Olsen 1 *, Dante S. Bortone 1 *, Hillel Adesnik 1 & Massimo Scanziani 1 After entering the cerebral cortex, sensory information spreads through six different horizontal neuronal layers that are interconnected by vertical axonal projections. It is believed that through these projections layers can influence each other’s response to sensory stimuli, but the specific role that each layer has in cortical processing is still poorly understood. Here we show that layer six in the primary visual cortex of the mouse has a crucial role in controlling the gain of visually evoked activity in neurons of the upper layers without changing their tuning to orientation. This gain modulation results from the coordinated action of layer six intracortical projections to superficial layers and deep projections to the thalamus, with a substantial role of the intracortical circuit. This study establishes layer six as a major mediator of cortical gain modulation and suggests that it could be a node through which convergent inputs from several brain areas can regulate the earliest steps of cortical visual processing. Primary sensory areas in the cerebral cortex are composed of a stack of six neuronal layers 1 . Anatomical and physiological data indicate that these layers are interconnected through vertical excitatory axons 2–6 , suggesting that sensory processing in any given layer may be modu- lated by activity in several other layers. However, so far the exact contribution of each layer to cortical processing is unclear. Here we address the role of layer six (L6) in mouse visual cortex, whose excitatory neurons not only project to more superficial layers but also to the primary sensory thalamic nuclei 3,7–11 , the main source of sensory input to the cortex (Fig. 1a). L6 may thus influence cortical sensory responses directly through intracortical projections and indirectly through corticothalamic projections. Corticothalamic pro- jections were reported to be both suppressive and facilitatory on thalamic activity, depending on the precise alignment between L6 and thalamic neurons (for reviews see refs 12–16). By contrast, how sensory responses in cortex are affected by L6 activity has remained largely unexplored 17,18 . Furthermore, the relative contribution of intracortical versus corticothalamic projections in modulating cor- tical responses is currently unknown. The paucity of information is due to the lack of experimental tools for selectively manipulating activity in L6 without directly perturbing other cortical layers. L6 neurons of the Ntrs1-Cre GN220 line To control the activity of L6 we took advantage of a Cre-recombinase Bac transgenic mouse line that is reported to selectively label L6 neurons (NTSR1-Cre GN220) 19 . In the forebrain of these mice Cre expression was restricted to excitatory L6 neurons of the cerebral cortex (Fig. 1b and Supplementary Fig. 1). In primary visual cortex (V1) these neurons represented ,65% of the L6 excitatory neuronal population and, con- sistent with classification of L6 neurons in this region 1 , could be sub- divided into two morphologically distinct categories: those whose apical dendrites ended in L4 and those that extended to L1 (Fig. 1b and Supplementary Fig. 1g, h). Furthermore, consistent with the cor- ticothalamic projections originating from L6 in V1 (ref. 8), Cre- expresssing neurons projected to the dorsolateral geniculate nucleus (dLGN; the primary thalamic visual nucleus) and the nucleus reticularis thalami (NRT; the main thalamic inhibitory nucleus) (Fig. 1b and Supplementary Fig. 1d, e). Thirty-five percent of L6 excitatory neurons in V1 did not express Cre and these were morphologically distinct from the Cre-expressing population (Supplementary Fig. 1g). To manipulate the activity of L6 neurons we conditionally expressed the light-sensitive cation channel channelrhodopsin 2 (ChR2) 20,21 in V1 using viral injection into NTSR1-Cre mice (Sup- plementary Fig. 2a). A linear multichannel probe recorded the spiking activity of neuorns located across the vertical depth of cortex. Light- emitting diode (LED) illumination of the cortical surface for 500 ms with blue light (470 nm) increased the activity of L6 neurons in V1 of anaesthetized animals (Fig. 1c–e and Supplementary Fig. 2b). This increase was not due to direct stimulation of the retina by the LED as it was absent in uninjected animals (Supplementary Fig. 2g). L6 activity suppresses other layers To determine how L6 activation affects visual responses in other layers, we presented drifting gratings, and alternated control trials (visual stimulus only) with trials in which L6 was photostimulated (Fig. 1c). Notably, photostimulation of L6 rapidly and reversibly suppressed visually evoked multi-unit activity throughout the depth of the cortex (Fig. 1d). L6 photostimulation also reduced spontaneous activity (Supplementary Fig. 3d, e). This effect was absent in uninjected animals (Supplementary Fig. 2g). The suppressive action of L6 was similar across L2/3, L4 and L5 and was monotonic (Fig. 1e,f): that is, increasing L6 activity by increasing illumination intensity progres- sively suppressed visual responses, eventually abolishing nearly all evoked activity (strongest illumination reduced activity by 81 6 5%, 84 6 3%, and 84 6 3% for L2/3, L4 and L5, respectively; P , 10 25 ). Because multi-unit activity is dominated by neurons with high firing frequencies, we determined the effect of L6 photostimulation on iso- lated single units whose average visually evoked firing rate varied over a 20-fold range. Isolated units were suppressed by L6 photostimulation (Fig. 1g), irrespective of their firing rates (Fig. 1h; 91.1% of units were suppressed and 7.8% were facilitated, and all facilitated units were fast-spiking, putative inhibitory cells (Supplementary Fig. 4a–d). Furthermore, in the same way as for multi-unit activity, L6 photosti- mulation monotonically suppressed single units (Fig. 1i, j; strongest *These authors contributed equally to this work. 1 Howard Hughes Medical Institute, Center for Neural Circuits and Behavior, Neurobiology Section and Department of Neuroscience, University of California San Diego, La Jolla, California 92093-0634, USA. 00 MONTH 2012 | VOL 000 | NATURE | 1 Macmillan Publishers Limited. All rights reserved ©2012

Welcome message from author
This document is posted to help you gain knowledge. Please leave a comment to let me know what you think about it! Share it to your friends and learn new things together.
Transcript

ARTICLEdoi:10.1038/nature10835
Gain control by layer six in corticalcircuits of visionShawn R. Olsen1*, Dante S. Bortone1*, Hillel Adesnik1 & Massimo Scanziani1
After entering the cerebral cortex, sensory information spreads through six different horizontal neuronal layers that areinterconnected by vertical axonal projections. It is believed that through these projections layers can influence eachother’s response to sensory stimuli, but the specific role that each layer has in cortical processing is still poorlyunderstood. Here we show that layer six in the primary visual cortex of the mouse has a crucial role in controlling thegain of visually evoked activity in neurons of the upper layers without changing their tuning to orientation. This gainmodulation results from the coordinated action of layer six intracortical projections to superficial layers and deepprojections to the thalamus, with a substantial role of the intracortical circuit. This study establishes layer six as amajor mediator of cortical gain modulation and suggests that it could be a node through which convergent inputsfrom several brain areas can regulate the earliest steps of cortical visual processing.
Primary sensory areas in the cerebral cortex are composed of a stack ofsix neuronal layers1. Anatomical and physiological data indicate thatthese layers are interconnected through vertical excitatory axons2–6,suggesting that sensory processing in any given layer may be modu-lated by activity in several other layers. However, so far the exactcontribution of each layer to cortical processing is unclear.
Here we address the role of layer six (L6) in mouse visual cortex,whose excitatory neurons not only project to more superficial layersbut also to the primary sensory thalamic nuclei3,7–11, the main sourceof sensory input to the cortex (Fig. 1a). L6 may thus influence corticalsensory responses directly through intracortical projections andindirectly through corticothalamic projections. Corticothalamic pro-jections were reported to be both suppressive and facilitatory onthalamic activity, depending on the precise alignment between L6and thalamic neurons (for reviews see refs 12–16). By contrast, howsensory responses in cortex are affected by L6 activity has remainedlargely unexplored17,18. Furthermore, the relative contribution ofintracortical versus corticothalamic projections in modulating cor-tical responses is currently unknown. The paucity of information isdue to the lack of experimental tools for selectively manipulatingactivity in L6 without directly perturbing other cortical layers.
L6 neurons of the Ntrs1-Cre GN220 lineTo control the activity of L6 we took advantage of a Cre-recombinaseBac transgenic mouse line that is reported to selectively label L6 neurons(NTSR1-Cre GN220)19. In the forebrain of these mice Cre expressionwas restricted to excitatory L6 neurons of the cerebral cortex (Fig. 1band Supplementary Fig. 1). In primary visual cortex (V1) these neuronsrepresented ,65% of the L6 excitatory neuronal population and, con-sistent with classification of L6 neurons in this region1, could be sub-divided into two morphologically distinct categories: those whoseapical dendrites ended in L4 and those that extended to L1 (Fig. 1band Supplementary Fig. 1g, h). Furthermore, consistent with the cor-ticothalamic projections originating from L6 in V1 (ref. 8), Cre-expresssing neurons projected to the dorsolateral geniculate nucleus(dLGN; the primary thalamic visual nucleus) and the nucleus reticularisthalami (NRT; the main thalamic inhibitory nucleus) (Fig. 1b and
Supplementary Fig. 1d, e). Thirty-five percent of L6 excitatory neuronsin V1 did not express Cre and these were morphologically distinct fromthe Cre-expressing population (Supplementary Fig. 1g).
To manipulate the activity of L6 neurons we conditionallyexpressed the light-sensitive cation channel channelrhodopsin 2(ChR2)20,21 in V1 using viral injection into NTSR1-Cre mice (Sup-plementary Fig. 2a). A linear multichannel probe recorded the spikingactivity of neuorns located across the vertical depth of cortex. Light-emitting diode (LED) illumination of the cortical surface for 500 mswith blue light (470 nm) increased the activity of L6 neurons in V1 ofanaesthetized animals (Fig. 1c–e and Supplementary Fig. 2b). Thisincrease was not due to direct stimulation of the retina by the LED as itwas absent in uninjected animals (Supplementary Fig. 2g).
L6 activity suppresses other layersTo determine how L6 activation affects visual responses in otherlayers, we presented drifting gratings, and alternated control trials(visual stimulus only) with trials in which L6 was photostimulated(Fig. 1c). Notably, photostimulation of L6 rapidly and reversiblysuppressed visually evoked multi-unit activity throughout the depthof the cortex (Fig. 1d). L6 photostimulation also reduced spontaneousactivity (Supplementary Fig. 3d, e). This effect was absent in uninjectedanimals (Supplementary Fig. 2g). The suppressive action of L6 wassimilar across L2/3, L4 and L5 and was monotonic (Fig. 1e,f): that is,increasing L6 activity by increasing illumination intensity progres-sively suppressed visual responses, eventually abolishing nearly allevoked activity (strongest illumination reduced activity by 81 6 5%,84 6 3%, and 84 6 3% for L2/3, L4 and L5, respectively; P , 1025).Because multi-unit activity is dominated by neurons with high firingfrequencies, we determined the effect of L6 photostimulation on iso-lated single units whose average visually evoked firing rate varied over a20-fold range. Isolated units were suppressed by L6 photostimulation(Fig. 1g), irrespective of their firing rates (Fig. 1h; 91.1% of units weresuppressed and 7.8% were facilitated, and all facilitated units werefast-spiking, putative inhibitory cells (Supplementary Fig. 4a–d).Furthermore, in the same way as for multi-unit activity, L6 photosti-mulation monotonically suppressed single units (Fig. 1i, j; strongest
*These authors contributed equally to this work.
1Howard HughesMedical Institute, Center for Neural Circuits and Behavior, Neurobiology Section and Departmentof Neuroscience, University of California San Diego, La Jolla, California 92093-0634, USA.
0 0 M O N T H 2 0 1 2 | V O L 0 0 0 | N A T U R E | 1
Macmillan Publishers Limited. All rights reserved©2012

illumination reduced activity by 91 6 4%, 93 6 2%, and 92 6 2% forL2/3, L4 and L5, respectively; P , 1029). Thus, these data show thatstimulation of L6 excitatory neurons suppresses visually evoked res-ponses in L2/3, L4 and L5 of V1.
L6 activity does not affect tuningLike in other mammals, neurons in mouse V1 differentially respond togratings of different orientations22,23. We determined whether L6stimulation affects the orientation tuning of V1 neurons. We generatedtuning curves by presenting gratings drifting in 8–12 different direc-tions and alternated control trials with trials in which L6 was photo-stimulated (Fig. 2a, b). We used a low LED intensity to suppress corticalvisual responses partially, and considered units that were suppressedby between 10% and 75% (average suppression 42 6 3%, n 5 55).Tuning curves of individual, isolated units were averaged into a popu-lation tuning curve (Fig. 2b, d; see methods). Remarkably, photo-stimulation of L6 resulted in the precise scaling of the tuning curve;that is, it reduced visually evoked responses by a similar fractionirrespective of presented orientation. This is clearly illustrated byplotting the normalized firing rates of the population tuning curveunder control versus L6 photostimulation conditions (Fig. 2e). Thedata points fit well with a line whose slope is 0.56 and intercepts they axis close to the origin. Thus, photostimulation of L6 did not affectpreferred orientation, tuning width or the orientation selectivity index(OSI) of cortical neurons throughout L2/3, L4 and L5 (Fig. 2c; for L2/3,L4 and L5, respectively, the mean change in preferred orientation was 36 3u (P 5 0.22), 0 6 5u (P 5 0.9) and 24 6 5u (P 5 0.48), mean changein tuning width was 21 6 4u (P 5 0.8), 6 6 4u (P 5 0.15) and 26 6 6u(P 5 0.3), and mean change in OSI was 20.09 6 0.07 (P 5 0.23),
0.7 6 0.04 (P 5 0.14), 20.06 6 0.05 (P 5 0.22)). L6 photostimulationalso resulted in a scaling of V1 responses to stimuli of increasingcontrast (the contrast response function; Supplementary Fig. 5b).These data demonstrate that in primary visual cortex L6 selectivelycontrols the gain of cortical responses to visual stimuli.
A potential concern in stimulating L6 with ChR2 is that thespatially uniform activation and the temporal pattern generated inL6 neurons may differ from visually evoked activity patterns, and thusthe physiological activity of L6 neurons and L6 photostimulation mayaffect cortical activity in different ways. Furthermore, anaesthesia maychange the impact of L6 on cortical responses to sensory stimuli. Toaddress these issues, we optogenetically suppressed visually evokedactivity in L6 in awake animals and determined the resulting effect onmore superficial layers (Supplementary Fig. 6). Animals were headfixed but otherwise kept unrestrained on a passive circular treadmill(see Methods). L6 activity was suppressed using conditionallyexpressed light-sensitive hyperpolarizing opsins archeaerhodopsin24
and halorhodopsin 3.0 (NpHR3.0) (ref. 25). LED illumination withamber light (590 nm), although reducing visually evoked L6 activityby ,30% (Supplementary Fig. 6e), significantly facilitated visual res-ponses of isolated units throughout the other layers (Fig. 2f, g andSupplementary Fig. 6). The facilitation was not due to direct LEDillumination of the retina, as it was absent in uninjected animals(Supplementary Fig. 6f). Thus, suppression of L6 facilitates visuallyevoked activity in L2/3, L4 and L5, indicating that even physiologicallygenerated L6 activity exerts a suppressive action onto these layers.Furthermore, suppression of L6 resulted in the precise scaling of thetuning curve (for the tuning curve analysis we considered units thatwere facilitated by at least 10% (average facilitation 41 6 7%, n 5 52)).
0 1 2Time (s)
Single unit (L4) Single-unit summary
L1
L2/3
L5
L6
L4
0 1 2Time (s)
0
1
Nor
m.
NTSR1-Cre neuronsNTSR1-Cre,!oxed-tdTomato,GAD67–GFP
L2/3L4
L5L6
Thalamus
Cortex
Multi-unit summary
0 1 2Time (s)
2
0
Nor
m.
0 1 2Time (s)
0
1Nor
m.
0
1
Nor
m.
0 1 2Time (s)
23
01N
orm
.
~2/3
~6~5~4
<350
>650450–650350–450
1 3 5Fold increase in L6 activity
0
0.5
1
Nor
mal
ized
rat
e
~L2/3~L4~L5
~L2/3~L4~L5
1 3 5Fold increase in L6 activity
0
0.5
1
Nor
mal
ized
rat
e
0 2 4 6 8 10
0
2
4
6
8
10 ~L2/3 (n = 14)~L4 (26)~L5 (31)
LED
on
(spi
kes
per s
)
LED off (spikes per s)
Rec.LED
dLGN
NRT
Depth(μm) Layer
~L2–5
~L6
~L2–5
~L6
L2/3L4
L5L6
Rec.
1
Cortex
dLGN
a b c
d f
g h i j
e
Figure 1 | Photostimulation of L6 suppresses visual responses in the otherlayers. a, Schematic of L6 projections. Red triangle represents an L6 pyramidalneuron. b, Left, coronal section of V1 from an NTSR1-Cre, floxed-tdTomato,GAD67–GFP mouse. Inset, L6 projection to dLGN (V1 of NTSR1-Cre mousewas injected with floxed-tdTomato virus). Scale bar, 250mm (125 mm for inset).Right, the two types of L6 neurons that are labelled by the NTSR1-Cre line.Black, dendrites; grey, axons. c, Schematic of experimental setup. Rec.,recording probe. d, Cortical visual responses with (blue) and without (black) L6photostimulation. Left, raster plot of multi-unit activity grouped by depth.Control and photostimulation trials were interleaved but are separated here for
clarity. Black bar, visual stimulus (1.5 s); blue bar, LED illumination (0.5 s).Right, normalized (Norm.) peristimulus time histogram (PSTH); top, upperlayers; bottom, L6. e, Summary (n 5 6 experiments). The control is shown inblack and increasing LED intensities in darker blues. f, Suppression of multi-unit activity with increasing L6 activity. g, Visual response of a single L4 unitwith (blue) and without (black) L6 photostimulation. Scale bar, 20 spikes per s.h, Response of each regular spiking unit with and without strongphotostimulation of L6. i, Average normalized PSTH (n 5 47 units tested with5 LED intensities). Colours are the same as in e. j, Suppression of single-unitactivity. Error bars, mean 6 s.e.m.
RESEARCH ARTICLE
2 | N A T U R E | V O L 0 0 0 | 0 0 M O N T H 2 0 1 2
Macmillan Publishers Limited. All rights reserved©2012

The plot of normalized firing rates under control versus L6 photo-suppression conditions was well fit by a line whose slope is 1.4 andintercepts the y axis very close to the origin (Fig. 2j). Consistent withthis, suppressing L6 did not affect preferred orientation, tuning widthor orientation selectivity (Fig. 2h; for L2/3, L4 and L5, respectively, themean change in preferred orientation was 2 6 3u (P 5 0.41), 0 6 2u(P 5 0.95) and 24 6 4u (P 5 0.35) degrees, mean change in tuningwidth was 22 6 4u (P 5 0.68), 0 6 3u (P 5 0.94) and 21 6 4u(P 5 0.77) degrees, and mean change in OSI was 20.01 6 0.03(P 5 0.22), 0.02 6 0.02 (P 5 0.50) and 20.03 6 0.03 (P 5 0.22)).Taken together, these results demonstrate that visually driven L6activity in awake animals controls the gain of cortical responses tovisual stimuli.
L6 intracortical and subcortical pathwaysTwo pathways could potentially mediate the suppression exerted byL6 on cortical activity. On one hand, L6 neurons project to thethalamus, where they can influence visually generated activity beforeit even reaches the cortex. On the other hand, L6 neurons also projectto more superficial layers where they could directly modulate corticalactivity. We addressed the impact of both projections. We performedextracellular recordings from the dLGN while photostimulating L6 inV1 (Fig. 3a). dLGN relay neurons were identified based on their visualresponse properties and characteristic firing pattern (Supplemen-tary Fig. 7d). Photostimulation of L6 led to a rapid, reversible andmonotonic reduction of visually evoked activity in dLGN relayneurons (Fig. 3b, c; strongest illumination: 76 6 4% reduction;P , 10210, n 5 32), without, however, markedly modifying theirfiring mode (burst prevalence: 12 6 6% in control; 6 6 3% afterreducing dLGN activity by 30% with L6 photostimulation, P 5 0.08;Supplementary Fig. 7e, f). This indicates that L6 stimulation suppresses
dLGN activity. To test whether visually evoked activity in L6 alsosuppresses dLGN activity we silenced the cortex optogenetically (byphotostimulating parvalbumin-expressing inhibitory neurons in V1with ChR2; see Methods and Supplementary Fig. 8). Consistent withthe suppressive action of L6 stimulation on dLGN, silencing the cortexstrongly facilitated dLGN activity (Fig. 3d–f; average facilitation87 6 25% (P 5 0.002, n 5 18)). In vitro recordings demonstrated thatthe suppressive action of L6 was due to the generation of disynapticinhibition onto dLGN relay neurons, at least in part through therecruitment of NRT inhibitory neurons (and possibly through therecruitment of local inhibitory neurons in dLGN26) (SupplementaryFig. 9). Thus, these results reveal that L6 can effectively suppress visualresponses in the dLGN.
If L6 suppresses cortical visual responses indirectly, by suppressingthe dLGN, this suppression should precede V1 suppression by a fewmilliseconds. We tested this prediction by performing simultaneousrecordings from both dLGN and V1 and compared the onset of sup-pression in these two structures upon L6 photostimulation (Fig. 3g).Surprisingly, cortical suppression preceded dLGN suppression by afew milliseconds (Fig. 3h). This result suggests that L6 activity maysuppress cortical visual responses through an alternative circuit.Because L6 neurons send axons to the upper layers of cortex we testedwhether these projections can suppress cortical activity independentlyof the corticothalamic projections. For this, we performed in vitrowhole-cell recordings from neurons in L2/3, L4, L5 and L6 in coronalslices of V1 (Fig. 4a); this slicing plane disconnects V1 from dLGN.
Photostimulation of L6 in vitro generated both excitatory andinhibitory postsynaptic currents (EPSCs and IPSCs, respectively)onto L2/3, L4, L5 and L6 pyramidal cells (L6 recordings included onlythose pyramidal cells not expressing ChR2) (Fig. 4b). IPSCs were ofdisynaptic (or polysynapyic) origin as they were entirely blocked by
0 1 2Time (s)
0 1 1.50.5Time (s)
L5 cell L4 cellPhotostimulation of L6 Photosuppression of L6
0 180 3600
20
40
Direction (deg)
Spi
kes
per s
L5 cell
0
0.2
0.4
0.6
0.8
1Population average Population average
Nor
mal
ized
ron = 0.56 × roff + 0.02 ron = 1.4 × roff + 0.040
1
Nor
m. r
ate
LED
on
Norm. rate LED off0 1
0 0.2 0.4 0.6 0.8 1OSI LED off
0
0.2
0.4
0.6
0.8
1
OS
I LED
on
0 180 3600
5
10
15
Direction (deg)
L4 cell
Spi
kes
per s
0
0.5
1
1.5
Nor
mal
ized
−90 0 270Direction (deg)
90 1800
1
Nor
m. r
ate
LED
on
Norm. rate LED off0
0 0.2 0.4 0.6 0.8 1OSI LED off
0
0.2
0.4
0.6
0.8
1
OS
I LED
on
1−90 0 270Direction (deg)
90 180
a
b c
d
f
i
hg
je
Figure 2 | L6 bidirectionally modulates the gain of visual responses withoutaltering tuning. a, Visual responses of an L5 neuron with (blue) and without(black) L6 photostimulation. Raster plots and peristimulus time histograms fortwo out of eight tested visual stimulus directions. Scale bar, 40 spikes per s.b, Tuning curves for the neuron in (a). c, The OSI for each neuron with andwithout photostimulation of L6. d, Population tuning curve with (blue) andwithout (black) L6 photostimulation (n 5 55). Black curve, fit using the sum oftwo Gaussians; blue curve, black curve scaled by the slope of linear fit ine. e, Control response plotted against response with L6 photostimulation (datafrom c). Blue, linear fit (r2 5 0.98). Black bar, visual stimulus (1.5 s); blue bar,
LED illumination (0.5 s). f, Visual response of an L4 neuron with (orange) andwithout (black) L6 photosuppression. Scale bar, 50 spikes per s. Orange bars,illumination with an amber-coloured LED (1.95 s); black bar, visual stimulation(1.5 s). g, Tuning curves for neuron in (f). h, OSI for each isolated unit with andwithout photosuppression of L6. i, Population tuning curves with and withoutL6 photosuppression (n 5 52). Black curve, fit using sum of two Gaussians;orange curve, black curve scaled by slope of linear fit in j. j, Control responseplotted against response with L6 photostimulation (data from i). Orange, linearfit (r2 5 0.92). Error bars, mean 6 s.e.m.
ARTICLE RESEARCH
0 0 M O N T H 2 0 1 2 | V O L 0 0 0 | N A T U R E | 3
Macmillan Publishers Limited. All rights reserved©2012
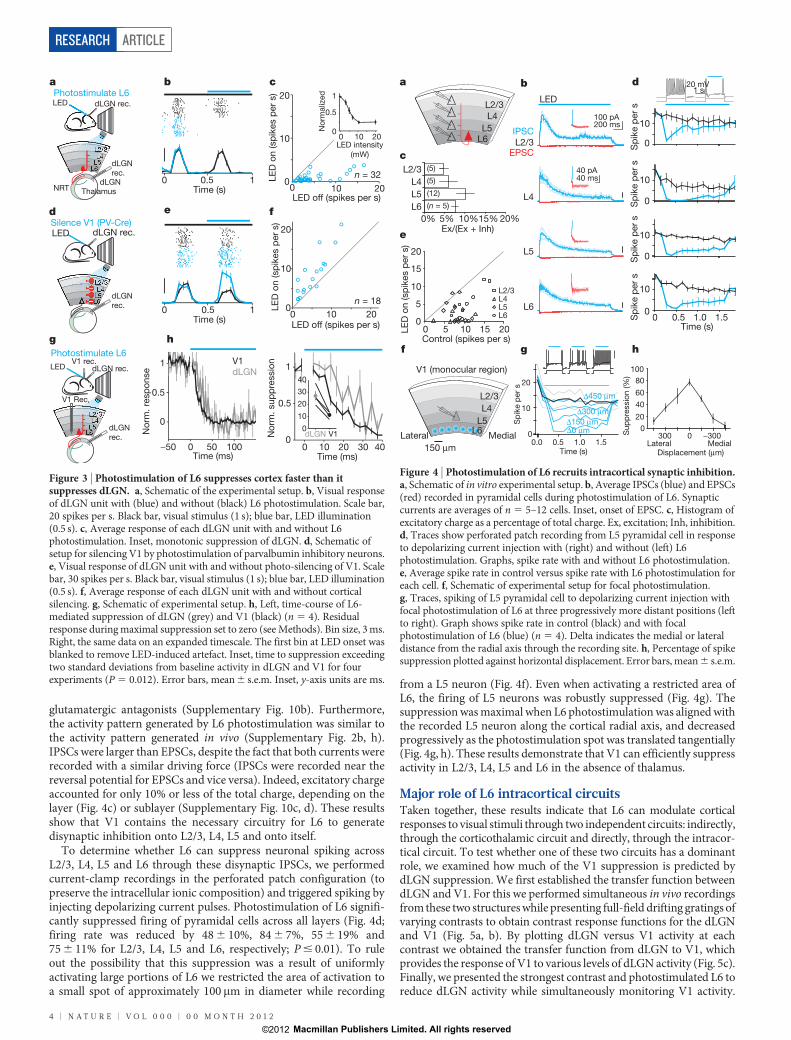
glutamatergic antagonists (Supplementary Fig. 10b). Furthermore,the activity pattern generated by L6 photostimulation was similar tothe activity pattern generated in vivo (Supplementary Fig. 2b, h).IPSCs were larger than EPSCs, despite the fact that both currents wererecorded with a similar driving force (IPSCs were recorded near thereversal potential for EPSCs and vice versa). Indeed, excitatory chargeaccounted for only 10% or less of the total charge, depending on thelayer (Fig. 4c) or sublayer (Supplementary Fig. 10c, d). These resultsshow that V1 contains the necessary circuitry for L6 to generatedisynaptic inhibition onto L2/3, L4, L5 and onto itself.
To determine whether L6 can suppress neuronal spiking acrossL2/3, L4, L5 and L6 through these disynaptic IPSCs, we performedcurrent-clamp recordings in the perforated patch configuration (topreserve the intracellular ionic composition) and triggered spiking byinjecting depolarizing current pulses. Photostimulation of L6 signifi-cantly suppressed firing of pyramidal cells across all layers (Fig. 4d;firing rate was reduced by 48 6 10%, 84 6 7%, 55 6 19% and75 6 11% for L2/3, L4, L5 and L6, respectively; P # 0.01). To ruleout the possibility that this suppression was a result of uniformlyactivating large portions of L6 we restricted the area of activation toa small spot of approximately 100 mm in diameter while recording
from a L5 neuron (Fig. 4f). Even when activating a restricted area ofL6, the firing of L5 neurons was robustly suppressed (Fig. 4g). Thesuppression was maximal when L6 photostimulation was aligned withthe recorded L5 neuron along the cortical radial axis, and decreasedprogressively as the photostimulation spot was translated tangentially(Fig. 4g, h). These results demonstrate that V1 can efficiently suppressactivity in L2/3, L4, L5 and L6 in the absence of thalamus.
Major role of L6 intracortical circuitsTaken together, these results indicate that L6 can modulate corticalresponses to visual stimuli through two independent circuits: indirectly,through the corticothalamic circuit and directly, through the intracor-tical circuit. To test whether one of these two circuits has a dominantrole, we examined how much of the V1 suppression is predicted bydLGN suppression. We first established the transfer function betweendLGN and V1. For this we performed simultaneous in vivo recordingsfrom these two structures while presenting full-field drifting gratings ofvarying contrasts to obtain contrast response functions for the dLGNand V1 (Fig. 5a, b). By plotting dLGN versus V1 activity at eachcontrast we obtained the transfer function from dLGN to V1, whichprovides the response of V1 to various levels of dLGN activity (Fig. 5c).Finally, we presented the strongest contrast and photostimulated L6 toreduce dLGN activity while simultaneously monitoring V1 activity.
0 0.5 1Time (s)
0.5
0 50 100
0
1
Nor
m. r
espo
nse
Nor
m. s
uppr
essi
on
Time (ms)
0.5
V1dLGN
−50
dLGN rec.LEDV1 rec.
dLGN rec.LED
0 10 20 30 400
1
Time (ms)
dLGN V10
10
203040
0 10 20LED off (spikes per s)
LED
on
(spi
kes
per s
)
0
10
20
dLGN rec.
L2/3L4
L5L6
V1 Rec.
dLGN rec.
L2/3L4
L5L6
ThalamusNRTdLGN
0 0.5 1Time (s)
Silence V1 (PV-Cre)dLGN rec.LED
0 10 200
10
20
LED off (spikes per s)
LED
on
(spi
kes
per s
)
Photostimulate L6
Photostimulate L6
L4L5L6
L2/3
dLGN rec.
____
0 10 200
0.5
1
LED intensity(mW)
Nor
mal
ized
n = 32
n = 18
a b
hg
d
c
e f
Figure 3 | Photostimulation of L6 suppresses cortex faster than itsuppresses dLGN. a, Schematic of the experimental setup. b, Visual responseof dLGN unit with (blue) and without (black) L6 photostimulation. Scale bar,20 spikes per s. Black bar, visual stimulus (1 s); blue bar, LED illumination(0.5 s). c, Average response of each dLGN unit with and without L6photostimulation. Inset, monotonic suppression of dLGN. d, Schematic ofsetup for silencing V1 by photostimulation of parvalbumin inhibitory neurons.e, Visual response of dLGN unit with and without photo-silencing of V1. Scalebar, 30 spikes per s. Black bar, visual stimulus (1 s); blue bar, LED illumination(0.5 s). f, Average response of each dLGN unit with and without corticalsilencing. g, Schematic of experimental setup. h, Left, time-course of L6-mediated suppression of dLGN (grey) and V1 (black) (n 5 4). Residualresponse during maximal suppression set to zero (see Methods). Bin size, 3 ms.Right, the same data on an expanded timescale. The first bin at LED onset wasblanked to remove LED-induced artefact. Inset, time to suppression exceedingtwo standard deviations from baseline activity in dLGN and V1 for fourexperiments (P 5 0.012). Error bars, mean 6 s.e.m. Inset, y-axis units are ms.
L2/3L4L5L6
0
5
10
15
20
0 5 10 15 20
Time (s)
0% 5% 10%15% 20%
L5L4
L2/3
Ex/(Ex + Inh)
Control (spikes per s)
20
10
01.51.00.50.0
020406080
100
Lateral 300 0 −300
Medial
Sup
pres
sion
(%)
Δ150 μm
LED
on
(spi
kes
per s
) L2/3L4
L5
150 μm
V1 (monocular region)
L6
L6
10
0
10
0
1.51.00.50
10
0
Time (s)
L2/3
10
0Spi
ke p
er s
Spi
ke p
er s
Spi
ke p
er s
Spi
ke p
er s
EPSC
IPSC
100 pA200 ms
40 pA40 ms
L4
L5
L6
L2/3L4
L5L6
LED
Spi
ke p
er s
Lateral Medial
(5)
(5)
(12)
(n = 5)
Δ300 μm
Δ450 μm
Δ0 μm
Displacement (μm)
20 mV1 s
a b
c
d
f hg
e
Figure 4 | Photostimulation of L6 recruits intracortical synaptic inhibition.a, Schematic of in vitro experimental setup. b, Average IPSCs (blue) and EPSCs(red) recorded in pyramidal cells during photostimulation of L6. Synapticcurrents are averages of n 5 5–12 cells. Inset, onset of EPSC. c, Histogram ofexcitatory charge as a percentage of total charge. Ex, excitation; Inh, inhibition.d, Traces show perforated patch recording from L5 pyramidal cell in responseto depolarizing current injection with (right) and without (left) L6photostimulation. Graphs, spike rate with and without L6 photostimulation.e, Average spike rate in control versus spike rate with L6 photostimulation foreach cell. f, Schematic of experimental setup for focal photostimulation.g, Traces, spiking of L5 pyramidal cell to depolarizing current injection withfocal photostimulation of L6 at three progressively more distant positions (leftto right). Graph shows spike rate in control (black) and with focalphotostimulation of L6 (blue) (n 5 4). Delta indicates the medial or lateraldistance from the radial axis through the recording site. h, Percentage of spikesuppression plotted against horizontal displacement. Error bars, mean 6 s.e.m.
RESEARCH ARTICLE
4 | N A T U R E | V O L 0 0 0 | 0 0 M O N T H 2 0 1 2
Macmillan Publishers Limited. All rights reserved©2012
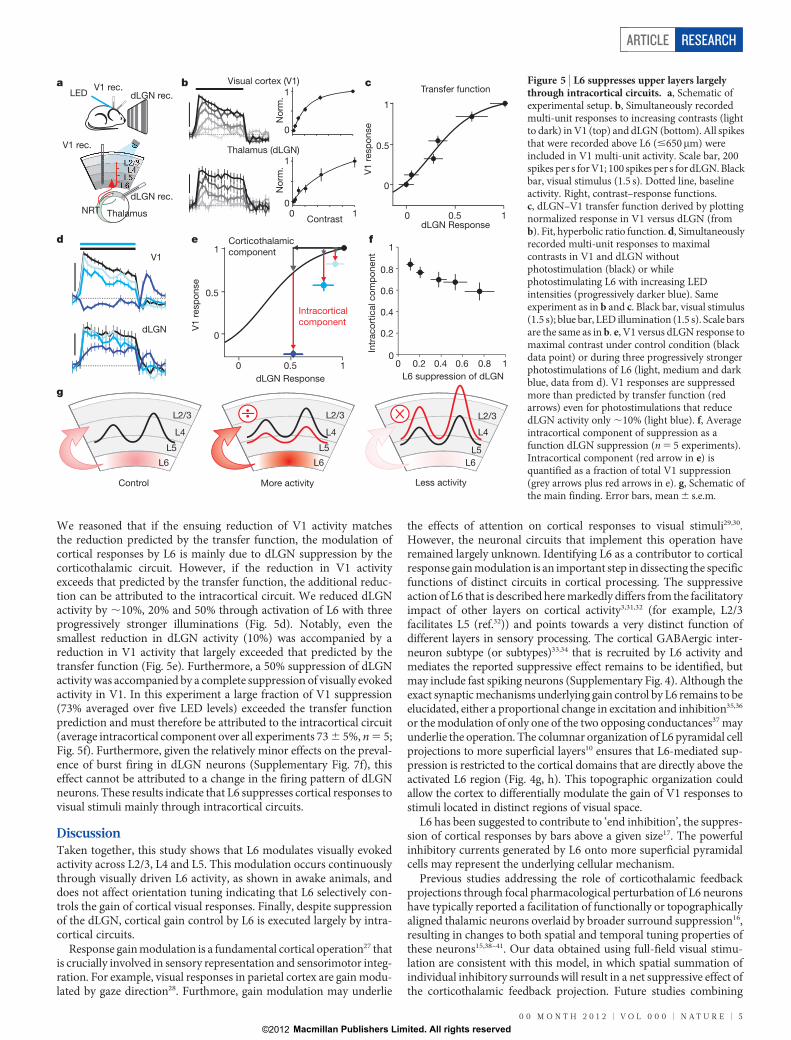
We reasoned that if the ensuing reduction of V1 activity matchesthe reduction predicted by the transfer function, the modulation ofcortical responses by L6 is mainly due to dLGN suppression by thecorticothalamic circuit. However, if the reduction in V1 activityexceeds that predicted by the transfer function, the additional reduc-tion can be attributed to the intracortical circuit. We reduced dLGNactivity by ,10%, 20% and 50% through activation of L6 with threeprogressively stronger illuminations (Fig. 5d). Notably, even thesmallest reduction in dLGN activity (10%) was accompanied by areduction in V1 activity that largely exceeded that predicted by thetransfer function (Fig. 5e). Furthermore, a 50% suppression of dLGNactivity was accompanied by a complete suppression of visually evokedactivity in V1. In this experiment a large fraction of V1 suppression(73% averaged over five LED levels) exceeded the transfer functionprediction and must therefore be attributed to the intracortical circuit(average intracortical component over all experiments 73 6 5%, n 5 5;Fig. 5f). Furthermore, given the relatively minor effects on the preval-ence of burst firing in dLGN neurons (Supplementary Fig. 7f), thiseffect cannot be attributed to a change in the firing pattern of dLGNneurons. These results indicate that L6 suppresses cortical responses tovisual stimuli mainly through intracortical circuits.
DiscussionTaken together, this study shows that L6 modulates visually evokedactivity across L2/3, L4 and L5. This modulation occurs continuouslythrough visually driven L6 activity, as shown in awake animals, anddoes not affect orientation tuning indicating that L6 selectively con-trols the gain of cortical visual responses. Finally, despite suppressionof the dLGN, cortical gain control by L6 is executed largely by intra-cortical circuits.
Response gain modulation is a fundamental cortical operation27 thatis crucially involved in sensory representation and sensorimotor integ-ration. For example, visual responses in parietal cortex are gain modu-lated by gaze direction28. Furthmore, gain modulation may underlie
the effects of attention on cortical responses to visual stimuli29,30.However, the neuronal circuits that implement this operation haveremained largely unknown. Identifying L6 as a contributor to corticalresponse gain modulation is an important step in dissecting the specificfunctions of distinct circuits in cortical processing. The suppressiveaction of L6 that is described here markedly differs from the facilitatoryimpact of other layers on cortical activity3,31,32 (for example, L2/3facilitates L5 (ref.32)) and points towards a very distinct function ofdifferent layers in sensory processing. The cortical GABAergic inter-neuron subtype (or subtypes)33,34 that is recruited by L6 activity andmediates the reported suppressive effect remains to be identified, butmay include fast spiking neurons (Supplementary Fig. 4). Although theexact synaptic mechanisms underlying gain control by L6 remains to beelucidated, either a proportional change in excitation and inhibition35,36
or the modulation of only one of the two opposing conductances37 mayunderlie the operation. The columnar organization of L6 pyramidal cellprojections to more superficial layers10 ensures that L6-mediated sup-pression is restricted to the cortical domains that are directly above theactivated L6 region (Fig. 4g, h). This topographic organization couldallow the cortex to differentially modulate the gain of V1 responses tostimuli located in distinct regions of visual space.
L6 has been suggested to contribute to ‘end inhibition’, the suppres-sion of cortical responses by bars above a given size17. The powerfulinhibitory currents generated by L6 onto more superficial pyramidalcells may represent the underlying cellular mechanism.
Previous studies addressing the role of corticothalamic feedbackprojections through focal pharmacological perturbation of L6 neuronshave typically reported a facilitation of functionally or topographicallyaligned thalamic neurons overlaid by broader surround suppression16,resulting in changes to both spatial and temporal tuning properties ofthese neurons15,38–41. Our data obtained using full-field visual stimu-lation are consistent with this model, in which spatial summation ofindividual inhibitory surrounds will result in a net suppressive effect ofthe corticothalamic feedback projection. Future studies combining
Visual cortex (V1)Transfer function
0 10.5
0
1
0.5
dLGN Response
V1 re
spon
se
Intracorticalcomponent
Corticothalamiccomponent
0 10.5
0
1
0.5
dLGN Response
V1 re
spon
se
V1
dLGN
Intr
acor
tical
com
pone
ntL6 suppression of dLGN
0 0.2 0.4 0.6 0.8 10
0.2
0.4
0.6
0.8
1
0
1
Nor
m.
0
1
Nor
m.
0 1Contrast
Thalamus (dLGN)
L2/3
L4
L5
L6
Control
L2/3
L4
L5
L6
More activity
L2/3
L4
L5L6
Less activity
dLGN rec.LEDV1 rec.
dLGN rec.
L2/3L4
L5L6
ThalamusNRT
V1 rec.
a b c
e fd
g
Figure 5 | L6 suppresses upper layers largelythrough intracortical circuits. a, Schematic ofexperimental setup. b, Simultaneously recordedmulti-unit responses to increasing contrasts (lightto dark) in V1 (top) and dLGN (bottom). All spikesthat were recorded above L6 (#650mm) wereincluded in V1 multi-unit activity. Scale bar, 200spikes per s for V1; 100 spikes per s for dLGN. Blackbar, visual stimulus (1.5 s). Dotted line, baselineactivity. Right, contrast–response functions.c, dLGN–V1 transfer function derived by plottingnormalized response in V1 versus dLGN (fromb). Fit, hyperbolic ratio function. d, Simultaneouslyrecorded multi-unit responses to maximalcontrasts in V1 and dLGN withoutphotostimulation (black) or whilephotostimulating L6 with increasing LEDintensities (progressively darker blue). Sameexperiment as in b and c. Black bar, visual stimulus(1.5 s); blue bar, LED illumination (1.5 s). Scale barsare the same as in b. e, V1 versus dLGN response tomaximal contrast under control condition (blackdata point) or during three progressively strongerphotostimulations of L6 (light, medium and darkblue, data from d). V1 responses are suppressedmore than predicted by transfer function (redarrows) even for photostimulations that reducedLGN activity only ,10% (light blue). f, Averageintracortical component of suppression as afunction dLGN suppression (n 5 5 experiments).Intracortical component (red arrow in e) isquantified as a fraction of total V1 suppression(grey arrows plus red arrows in e). g, Schematic ofthe main finding. Error bars, mean 6 s.e.m.
ARTICLE RESEARCH
0 0 M O N T H 2 0 1 2 | V O L 0 0 0 | N A T U R E | 5
Macmillan Publishers Limited. All rights reserved©2012

optogenetic approaches with focal stimulation of visual space willreveal how fine-scale corticothalamic circuits39,42 interact with intra-cortical L6 circuits to influence visual processing in the cortex.
L6 in V1 receives convergent inputs from a variety of brain regions,including higher cortical areas43 as well as thalamus11. These variousbrain regions could thus influence, through L6, the gain of visualresponses during the very initial steps of visual cortical processing.
METHODS SUMMARYChR2, archaerhodopsin and NpHR3.0 were conditionally expressed in mouse V1via stereotactic injection of adenoassociated viruses into NTSR1-Cre mice19. Forrecordings under anaesthesia, mice were injected with 5 mg kg21 chlorprothixeneand 1.2 g kg21 urethane. For awake experiments, a craniotomy was performedunder isoflurane anaesthesia (1–1.5%), and then a previously implanted head-plate was used to fix the mouse on a circular treadmill and the anaesthetic wasremoved. In vivo extracellular recordings were made from V1 and dLGN usingmultichannel silicon probes. Visual stimuli were displayed on an LCD screen.Microbial opsins were photoactivated using a blue (470-nm) or amber (590-nm)LED placed above the thinned skull. In vitro whole-cell recordings were per-formed as previously described32.
Full Methods and any associated references are available in the online version ofthe paper at www.nature.com/nature.
Received 29 August 2011; accepted 4 January 2012.Published online 22 February 2012.
1. Lorente de No, R. in Physiology of the Nervous System (ed. Fulton, J.F.) 274–301(Oxford Univ. Press, 1943).
2. Douglas, R. J.& Martin, K.A. Neuronal circuits of theneocortex.Annu. Rev.Neurosci.27, 419–451 (2004).
3. Lefort, S., Tomm, C., Floyd Sarria, J. C. & Petersen, C. C. The excitatory neuronalnetwork of the C2 barrel column in mouse primary somatosensory cortex. Neuron61, 301–316 (2009).
4. Thomson, A.M.& Bannister, A. P. Interlaminarconnections in the neocortex.Cereb.Cortex 13, 5–14 (2003).
5. Callaway, E. M. Local circuits in primary visual cortex of the macaque monkey.Annu. Rev. Neurosci. 21, 47–74 (1998).
6. Dantzker, J. L. & Callaway, E. M. Laminar sources of synaptic input to corticalinhibitory interneurons and pyramidal neurons. Nature Neurosci. 3, 701–707(2000).
7. Thomson, A. M. Neocortical layer 6, a review. Front. Neuroanat. 4, 13 (2010).8. Bourassa, J. & Deschenes, M. Corticothalamic projections from the primary visual
cortex in rats: a single fiber study using biocytin as an anterograde tracer.Neuroscience 66, 253–263 (1995).
9. Binzegger, T., Douglas, R. J. & Martin, K. A. Stereotypical bouton clustering ofindividual neurons in cat primary visual cortex. J. Neurosci. 27, 12242–12254(2007).
10. Zhang, Z. W. & Deschenes, M. Intracortical axonal projections of lamina VI cells ofthe primary somatosensory cortex in the rat: a single-cell labeling study.J. Neurosci. 17, 6365–6379 (1997).
11. Jones, E. G. The Thalamus (Cambridge Univ. Press, 2007).12. Guillery, R. W. & Sherman, S. M. Thalamic relay functions and their role in
corticocortical communication: generalizations from the visual system. Neuron33, 163–175 (2002).
13. Sillito, A. M. & Jones, H. E. Corticothalamic interactions in the transfer of visualinformation. Phil. Trans. R. Soc. Lond. B 357, 1739–1752 (2002).
14. Briggs, F. & Usrey, W. M. Emerging views of corticothalamic function. Curr. Opin.Neurobiol. 18, 403–407 (2008).
15. Cudeiro, J. & Sillito, A. M. Looking back: corticothalamic feedback and early visualprocessing. Trends Neurosci. 29, 298–306 (2006).
16. Sillito, A. M., Cudeiro, J. & Jones, H. E. Always returning: feedback and sensoryprocessing in visual cortex and thalamus. Trends Neurosci. 29, 307–316 (2006).
17. Bolz, J. & Gilbert, C. D. Generation of end-inhibition in the visual cortex viainterlaminar connections. Nature 320, 362–365 (1986).
18. Grieve, K. L. & Sillito, A. M. A re-appraisal of the role of layer VI of the visual cortex inthe generation of cortical end inhibition. Exp. Brain Res. 87, 521–529 (1991).
19. Gong, S. et al. Targeting Cre recombinase to specific neuron populations withbacterial artificial chromosome constructs. J. Neurosci. 27, 9817–9823 (2007).
20. Nagel, G. et al. Channelrhodopsin-2, a directly light-gated cation-selectivemembrane channel. Proc. Natl Acad. Sci. USA 100, 13940–13945 (2003).
21. Boyden, E. S., Zhang, F., Bamberg, E., Nagel, G. & Deisseroth, K. Millisecond-timescale, genetically targeted optical control of neural activity. Nature Neurosci. 8,1263–1268 (2005).
22. Niell, C. M. & Stryker, M. P. Highly selective receptive fields in mouse visual cortex.J. Neurosci. 28, 7520–7536 (2008).
23. Hubel, D. H. & Wiesel, T. N. Receptive fields, binocular interaction and functionalarchitecture in the cat’s visual cortex. J. Physiol. 160, 106–154 (1962).
24. Chow, B. Y. et al. High-performance genetically targetable optical neural silencingby light-driven proton pumps. Nature 463, 98–102 (2010).
25. Gradinaru, V. et al. Molecular and cellular approaches for diversifying andextending optogenetics. Cell 141, 154–165 (2010).
26. Rafols, J. A. & Valverde, F. The structure of the dorsal lateral geniculate nucleus inthemouse.AGolgi andelectron microscopic study. J. Comp.Neurol.150,303–331(1973).
27. Salinas, E. & Thier, P. Gain modulation: a major computational principle of thecentral nervous system. Neuron 27, 15–21 (2000).
28. Brotchie, P. R., Andersen,R. A., Snyder, L. H.& Goodman, S. J.Head position signalsused by parietal neurons to encode locations of visual stimuli. Nature 375,232–235 (1995).
29. Treue, S. & Martinez Trujillo, J. C. Feature-based attention influences motionprocessing gain in macaque visual cortex. Nature 399, 575–579 (1999).
30. McAdams, C. J.& Maunsell, J. H. Effects of attention on orientation-tuning functionsof single neurons in macaque cortical area V4. J. Neurosci. 19, 431–441 (1999).
31. Silver, R. A., Lubke, J., Sakmann, B. & Feldmeyer, D. High-probability uniquantaltransmission at excitatory synapses in barrel cortex. Science 302, 1981–1984(2003).
32. Adesnik, H. & Scanziani, M. Lateral competition for cortical space by layer-specifichorizontal circuits. Nature 464, 1155–1160 (2010).
33. Markram, H. et al. Interneurons of the neocortical inhibitory system. Nature Rev.Neurosci. 5, 793–807 (2004).
34. Ascoli, G. A. et al. Petilla terminology: nomenclature of features of GABAergicinterneurons of the cerebral cortex. Nature Rev. Neurosci. 9, 557–568 (2008).
35. Chance, F. S., Abbott, L. F. & Reyes, A. D. Gain modulation from backgroundsynaptic input. Neuron 35, 773–782 (2002).
36. Shadlen, M. N. & Newsome, W. T. The variable discharge of cortical neurons:implications for connectivity, computation, and information coding. J. Neurosci.18, 3870–3896 (1998).
37. Murphy, B. K. & Miller, K. D. Multiplicative gain changes are induced by excitationor inhibition alone. J. Neurosci. 23, 10040–10051 (2003).
38. Andolina, I. M., Jones, H. E., Wang, W. & Sillito, A. M. Corticothalamic feedbackenhances stimulus response precision in the visual system. Proc. Natl Acad. Sci.USA 104, 1685–1690 (2007).
39. Wang, W., Jones, H. E., Andolina, I. M., Salt, T. E. & Sillito, A. M. Functional alignmentof feedback effects from visual cortex to thalamus. Nature Neurosci. 9, 1330–1336(2006).
40. Worgotter, F., Nelle, E., Li, B. & Funke, K. The influence of corticofugal feedback onthe temporal structure of visual responses of cat thalamic relay cells. J. Physiol.509, 797–815 (1998).
41. McClurkin, J. W. & Marrocco, R. T. Visual cortical input alters spatial tuning inmonkey lateral geniculate nucleus cells. J. Physiol. 348, 135–152 (1984).
42. Murphy, P. C., Duckett, S. G. & Sillito, A. M. Feedback connections to the lateralgeniculate nucleus and cortical response properties. Science 286, 1552–1554(1999).
43. Casagrande, V. A. & Kaas, J. H. The Afferent, Iintrinsic and Efferent Connections ofPrimary Visual Cortex in Primates (eds Peters, A. & Rockland, P.) (Plenum, 1994).
Supplementary Information is linked to the online version of the paper atwww.nature.com/nature.
Acknowledgements We are grateful to M. Carandini, J. Isaacson and the members ofthe Scanziani and Isaacson laboratories for helpful discussions of this project, toJ. Isaacson, R. Malinow and T. Komiyama for providing feedback on the manuscript, toP. Abelkop for histological help and neonatal viral injections, to J. Evora for mousecolony support and genotyping, to B. Atallah for sharing the technique for silencing thecortex by photostimulation of parvalbumin neurons and for help with the in vivorecording setup and to W. Bruns for help coding analysis software. We thank the UCSDNeuroscience Microscopy Facility (P30 NS047101) for the use of their imagingequipment. S.R.O. and H.A. were supported by postdoctoral fellowships from the HelenHay Whitney Foundation. D.S.Bwas supportedbya UCSDNeurobiology TrainingGrant(NINDS: 5T32NS007220-28). M.S. is an investigator of the Howard Hughes MedicalInstitute. This work was also supported National Institutes of Health grant RO1NS069010 and by the Gatsby Charitable Foundation.
Author Contributions H.A. performed the initial physiological characterization of theNTSR1-Cre expression system with optogenetic tools. H.A. also developed the in vivoawake recording preparation on the treadmill. S.R.O. performed all in vivo recordings.D.S.B. performed all in vitro recordings and anatomical reconstructions. S.R.O. and M.S.designed the study. M.S. wrote the paper.
Author Information Reprints and permissions information is available atwww.nature.com/reprints. The authors declare no competing financial interests.Readers are welcome to comment on the online version of this article atwww.nature.com/nature. Correspondence and requests for materials should beaddressed to M.S. ([email protected]) or S.R.O. ([email protected]).
RESEARCH ARTICLE
6 | N A T U R E | V O L 0 0 0 | 0 0 M O N T H 2 0 1 2
Macmillan Publishers Limited. All rights reserved©2012

METHODSAll procedures were conducted in accordance with the National Institutes ofHealth guidelines and with the approval of the Committee on Animal Care atthe University of California, San Diego.Animals. We used the following mouse lines: NTSR1-Cre (strain B6.FVB(Cg)-Tg(Ntsr1-cre)GN220Gsat/Mmcd, stock number 030648-UCD), which wasgenerated by the GENSAT project19 and acquired from the Mutant MouseRegional Resource Centers; tdTomato reporter (Jax number 007908); GAD67-GFP (Dneo); and PV-Cre (Silvia Arber).Viral injections. Adeno-associated viruses (AAVs) for ChR2 and archaerhodopsinwere acquired from the University of Pennsylvania Viral Vector Core: AAV2/1.CAGGS.flex.ChR2.tdTomato.SV40 (Addgene 18917) and AAV2/9.flex.CBA.Archaerhodopsin-GFP.W.SV40 (Addgene 22222). An AAV virus (AAV2/9) forNpHR3.0 was produced at the Salk Viral Vector Core. The NpHR3.0 plasmid(pAAV-Ef1a-DIO-eNpHR 3.0-EYFP) was provided by K. Diesseroth.
Viruses were loaded in a bevelled sharp micropipette mounted on a Nanoject II(Drumond) or a micropump injector (UMP-3 WPI) attached to a micromanipulator.ChR2 virus was injected into newborn pups (between postnatal days 0 and 2) thatwere anaesthestized on ice and secured into a moulded platform. Three 20-nl boliof virus was injected at each of three medial–lateral locations in V1 and two depths(500mm and 650mm) within V1.
Archaerhodopsin was injected in combination with NpHR3.0 in juvenile(1–2-month-old) mice anaethestized with 2.5% isoflurane and placed into astereotactic frame (Knopf). The exposed skull overlying V1 was thinned in threelocations with a dental drill (Foredom) with a 300-mm bur (Gesswein), and a holewas made with a (25-gauge) needle at each location to permit insertion of theinjection pipette. A volume of 150 nl of virus was injected at a rate of 20 nl min21
at each of the three locations and at two depths (900 mm and 700mm). Thescalp was then sutured and the mouse injected subcutaneously with 0.1 mg kg21
buprenorphine. In vivo recordings were made 1–2 months after viral injection.Slice preparation. Mice were anaesthetized with ketamine and xylazine (100 mgkg21 and 10 mg kg21, respectively), perfused transcardially with cold sucrosesolution (in mM: NaCl, 83; KCl, 2.5; MgSO4, 3.3; NaH2PO4, 1; NaHCO3, 26.2;D-glucose, 22; sucrose, 72; and CaCl2, 0.5, bubbled with 95% O2 and 5% CO2) anddecapitated, and the visual cortex was cut into 300–400-mm coronal sections incold sucrose solution. Thalamic slices were cut 45u off the coronal plane tomaintain connections between NRT and dLGN. Slices were incubated in sucrosesolution in a submerged chamber at 34 uC for 30 min and then at room temper-ature (21 uC) until used for recordings.In vitro recordings. Whole-cell recordings were done at 32 uC in artificialcerebrospinal fluid (in mM: NaCl, 119; KCl, 2.5; NaH2PO4, 1.3; NaHCO3, 26;D-glucose, 20; MgCl2, 1.3; CaCl2, 2.5; and mOsm, 305, bubbled with 95% O2 and5% CO2). Excitatory and inhibitory synaptic currents were recorded using acaesium-based internal solution (in mM: CsMeSO4, 115; NaCl, 4; HEPES, 10;Na3GTP, 0.3; MgATP, 4; EGTA, 0.3; QX-314-Cl, 2.5; BAPTA(5Cs), 10;adjusted to pH 7.4 with CsOH; mOsm 295; 3–5 MOhm pipette resistance).Voltage-clamp recordings were not considered if the series resistance exceeded20 MOhm or varied by more than 10%. Typically, 2–4 neurons were recordedfrom simultaneously. Cell-attached recordings and biocytin fills were carried outwith a potassium-based internal solution (in mM: K-gluconate, 150; MgCl2, 1.5;HEPES, 5; EGTA, 1.1; phosphocreatine, 10; adjusted to pH 7.4 with KOH; mOsm295). Perforated-patch recordings were carried out using potassium-basedinternal and 10 mg ml21 Gramicidin D (Sigma G5002). Tight seals were held untilsufficient access allowed injection of current and resolution of action potentials(typically 10–20 min). Ruptures of the perforated patch were apparent by a rapiddrop in series resistance at which point the recordings were discontinued.Photostimulation of L6 in vitro consisted of either single 2-ms pulses or a 40-Hztrain of 2-ms pulses, or of 1-s ramps of light of increasing intensity as previouslydescribed32. Data were recorded with Multiclamp 700B amplifiers (Axon instru-ments) filtered at 2 kHz and digitized with a Digidata1440A (Axon instruments) at10 kHz. Recordings were analysed using custom-made routines in Igor Pro(Wavemetrics). Charges represent the time integral of the synaptic current recordedduring the first second of photostimulation. The stage was moved using a custommade plugin for ImageJ(NIH) to interface with ESP300 (Newport) via SerialPort(SerialIO). Drugs used were NBQX (Tocris 1044) and CPP (Ascent Asc-159).In vivo recordings in anaesthetized mice. Recordings were performed similarlyto those previously described22. Animals were anaesthetized with 5 mg kg21 ofchlorporthixene (intraperitoneal) and then (5–10 min later) with 1.2 g kg21
urethane (intraperitoneal). During surgery, animals were given 0.5–1.0% isoflurane.Animals were placed onto a custom platform and their temperature was maintainedat 37 uC using a feedback-controlled heating pad (FHC). Whiskers and eyelashesthat were contralateral to the recording side were trimmed and eyes covered with a
thin, uniform layer of silcone oil to prevent drying. Protein expression was verifiedby transcranial epifluorescence of the exposed and PBS-moistened skull using aLeica MZ10F microscope. Only animals showing expression over the entire extentof V1 were used for subsequent experiments. The entire dried skull was coveredwith black dental cement (Ortho-Jet powder (Lang Dental) mixed with black ironoxide) but for the previously outlined boundaries of V1 (,1.5–3.5 mm lateral tomidline and 20.5 to 2.5 mm anterior to lambda suture). A head-plate with a hole of,2 mm in diameter was mounted over V1 and a small region of skull (,300 3750mm) was thinned using a dental drill. Next, we used sharpened fine forceps(Dumont number 55) to make a craniotomy just sufficiently large for inserting theprobe. A drop of PBS placed in the well at the centre of the head-plate kept theexposed skull and craniotomy moist. A multichannel silicon probe mounted on amicromanipulator (Luigs–Neumann) was slowly advanced into the brain to a depthof 800–1000mm for linear probes and 200–700mm for tetrode probes (see later),and recordings were started 20 min or more after inserting the probe.
For dLGN recordings we made a circular craniotomy (,1.5 mm in diamater)2.6 mm posterior and 2 mm lateral to the bregma suture. Robust visual responses andbursting activity that was characteristic of dLGN relay neurons were encountered at adepth between 2,400 and 3,100mm44 (Supplementary Fig. 7). For dual recordingexperiments (Fig. 3g, h and Fig. 5), we used a larger head-plate so that a craniotomycould be made both over the dLGN and V1.
Recordings were made with NeuroNexus 16-channel linear (a1x16-3mm-50-177) or tetrode (a2x2-tet-3mm-150-121) silicon probes. For recordings acrosscortical depth and in dLGN we used the linear configuration. The tetrode con-figuration was used to isolate a subset of cells in Fig. 2. Signals were amplified31000, band-pass filtered between 0.3 Hz and 5 kHz using an AM Systems 3500amplifier and acquired at 32 kHz using a NIDAQ board (PCIe-6239) controlledwith custom-written software in Matlab (Mathworks). For dual recording experi-ments we used two separate data-acquisition setups (amplifier, NIDAQ boardand computer). Raw data were stored on a computer hard drive for offlineanalysis.
At the end of the recording session, animals were killed by administering 4%isoflorane and the brain was quickly removed and fixed in 4% paraformaldehydefor histological analysis.In vivo awake recordings. 1–2 weeks before recording, mice were implanted witha head-plate for head fixation. Mice were anaesthetized with 2.5% isoflurane, thescalp was removed and a head-plate was fixed over V1 with black dental cement.The skull directly overlying V1 was covered with Kwik-Cast (WPI). Animals wereinjected subcutaneously with 0.1 mg kg21 buprenorphine and allowed to recoverin their home cage for at least 1 week before recording.
Several days before recording, mice were familiarized to head fixation withinthe recording setup. They were briefly anaesthetized with isoflurane and the head-plate was clamped to a metal post, but otherwise the mice were unrestrained andallowed to run in this position on a plastic circular treadmill or track (Fast-Tracfrom Bio-Serv; see Supplementary Fig. 6). The same circular track was present inthe cages of the mice, where they were familiarized with its use. Mice grewaccustomed to head fixation over the course of 1–3 15-min sessions and rannaturally on the track, occasionally stopping to rest or groom.
On the day of recording, mice were anaesthetized with 1.5–2% isoflurane, asmall craniotomy was made over V1, a drop of PBS was placed in the well of ahead-plate that was clamped to a metal post, and the multichannel probe insertedinto the craniotomy. After removal of isoflurane the mice regained consciousnessand typically began running. Recordings did not start before 30 min after the endof anaesthesia. Awake recording sessions lasted between 1 and 2 h. Mice typicallyspent ,60–80% of their time running, and the rest of the time was spent resting orgrooming. Data were not separated according to behaviour. Every 30–60 minmice were given a few drops of a 5% glucose solution through a disposable pipette.For two mice we performed 2–3 recording sessions, which were made at least aday apart. Between sessions the craniotomy was covered with Kwik-Cast. A newcraniotomy was made for each session.Visual stimulation. Visual stimuli were generated in Matlab using thePsychophysics Toolbox45 and were displayed on a gamma-corrected LCD monitor(Dell 52 3 32.5 cm, 60-Hz refresh rate, mean luminance 50 cd m22) positioned25 cm from the contralateral eye. The monitor was positioned for each experimentso that the multi-unit receptive field was located approximately in the centre of thescreen (the multi-unit receptive field was determined by moving a localized drift-ing grating patch (,10u) around the screen). During the recording session full-field sinusoidal drifting gratings were used. All stimuli had a temporal frequency of2 Hz and a spatial frequency of 0.04 cycles per degree. Gratings were randomlypresented at 8–12 equally spaced directions, except for the experiments in Fig. 5 inwhich we used only two orthogonal grating directions (0u and 90u). The contrast ofthe stimulus was 100%, except for Fig. 5 in which we used six contrast levels (2, 4.4,
ARTICLE RESEARCH
Macmillan Publishers Limited. All rights reserved©2012
9.6, 21, 46 and 100%). A grey screen trial was interleaved with the drifting gratings.The duration of the visual stimulus was 1.5 s and the inter-trial interval was 3–6 s.In vivo photostimulation. To photo-stimulate ChR2 we used a blue (470-nm)fibre-coupled LED (1 mm diameter, Doric Lenses) placed ,5–10 mm away fromthe skull. Light from the LED spanned the entire area of V1. An opaque shield ofblack aluminium foil (Thor Labs) prevented LED light from reaching the contra-lateral eye. The LED was driven by the analogue output from the NIDAQ board.The blue LED was presented at five intensities (approximately 3, 5, 7, 10.5 and 20mW measured at the tip of the fibre), but for a minority of experiments wepresented only the highest LED intensity. Trials were alternated between visualstimulus only and visual stimulus plus LED. The strongest LED intensity alsogenerated oscillations at gamma frequency, consistent with previous observa-tions32 (Supplementary Fig. 2). The preferred-orientation of photostimulatedL6 cells remained unchanged but their tuning curves became broader(Supplementary Fig. 2).
To photostimulate archaerhodopsin and NpHR3.0 we used an amber (590-nm)fibre-coupled LED (1 mm in diameter, Doric Lenses) placed ,0.5 mm from theskull. Because photosuppression of L6 produced a transient decrease in spontaneousmulti-unit activity in L2–5 at the onset of LED illumination (see SupplementaryFig. 6) we turned on the amber LED 1.4 s before the visual stimulus began.Experiments were performed at the highest LED intensity (,20 mW measured atthe tip of the fibre). As long as the suppresssion was not complete, the preferredorientation of photosuppressed L6 cells remained unchanged (Supplementary Fig. 6).In vivo data analysis. All in vivo data analysis was performed with customsoftware written in Matlab.
Multi-unit spiking activity was defined as all events (spikes) exceeding athreshold of 4 s.d. above the noise of the high-pass filtered (500-Hz) signal.Spikes were assigned a depth corresponding to the depth of the channel theywere recorded from. Spikes that were recorded simultaneously on multiplechannels were considered as a single event and attributed to the channel in whichthey showed the largest amplitude. We determined the depth of each channel byconsidering the depth and the angle of the probe relative to the vertical axis ofcortex. We assigned spikes to different layers according to the following depths(in mm): L2/3, 100–350; L4, 350–450; L5, 450–650; L6, .650. PSTHs werecomposed of 50-ms bins. PSTHs of individual experiments were normalized tothe first 500 ms of the visual stimulus (for ChR2 experiments) or to the entirevisual stimulus (for archaerhodopsin and NpHR3.0 experiments) to generateaverage PSTHs. PSTHs for kinetic analysis (Fig. 3h) were composed of 3-ms binsand report the normalized difference in firing rates between control (averagefiring over a 50-ms window prior to LED onset) and during LED illumination(average firing rate over a 100-ms window, 50 ms after LED onset). For eachexperiment the onset of suppression was determined as the time point at whichthe normalized response fell below 2 s.d. of the baseline.
The contrast response functions in dLGN and V1 report the normalized,baseline-subtracted firing rates and were fitted with a hyperbolic ratio function:
r~rmaxcn
cnzcn50
where r is the response, c is the contrast of the visual stimulus, rmax is a fittedconstant representing the response saturation level, n is fitting exponent thataffects the shape of the curve and c50 is the semi-saturation constant. The transferfunction between the dLGN and V1 was fitted with a hyperbolic ratio function:
rV1~rV1, maxrn
dLGN
rndLGNzrn
dLGN,50
where rV1 is the V1 response, rV1,max is a constant representing the V1 saturationlevel, rdLGN is the dLGN response, n is a fitting exponent and rdLGN,50 is the semi-saturation constant. The ‘corticothalamic component’ (CT) was defined as thefraction of the total V1 suppression accounted for by this predicted response. The‘intracortical component’ was then defined as 12CT component. We performedthis analysis for five LED levels and averaged across experiments to produce theplot in Fig. 5f.
We isolated single units using spike-sorting software provided by D. N. Hill,S. B. Mehta, and D. Kleinfeld46. For both the linear and tetrode probes we analysedwaveforms extracted from groups of four adjacent electrode sites. We high-passfiltered the raw signal at 500 Hz and then detected spiking events exceeding 4–5s.d. of the noise. Spike waveforms were clustered using a k-means algorithm. Afterinitial automated clustering, we used a graphical user interface to manually merge
and split clusters. Unit isolation quality was assessed by considering refractoryperiod violations and Fisher linear discriminant analysis. In agreement withprevious studies we could classify waveforms as regular-spiking or fast-spikingputative inhibitory neurons. In our data set there was a clear bimodal distributionof trough-to-peak times (a threshold of 0.4 ms was used to divide fast-spikingfrom regular-spiking units). All units were assigned a depth according to thechannel that they were detected on, and units were assigned to layers based onthe depth divisions given above for the multi-unit activity.
For each unit we computed the visual response as the mean spike-rate occur-ring over the time window in which both the LED and visual stimulus werepresent. Thus, for the L6 photostimulation experiments this typically corre-sponded to a 500-ms window placed in the centre of the visual response, andfor the L6 photosuppression experiments this window encompassed the entire1.5-s visual stimulus. For all analysis except the orientation tuning analyis inFig. 2, we averaged responses over all stimulus conditions. Following recentstudies47,48 of orientation tuning we computed an OSI as:
OSI~
!!!!!!!!!!!!!!!!!!!!!!!!!!!!!!!!!!!!!!!!!!!!!!!!!!!!!!!!!!!!!!!!!!!!!!Prk sin 2hk! "! "2z
Prk cos 2hk! "! "2
q
Prk
where rk is the response to the kth direction given by hk. We determined an OSIfor each unit with and without photostimulation or suppression of L6. We estab-lished the preferred orientation and tuning width by first fitting the averageresponses of each unit with a sum of two Gaussians:
r~r0zrpe{(h{hp)2=(2s2)zrpz180e{(h{hp{180)2=(2s2)
where r0 is a constant offset, rp is the response at the preferred orientation, rp1180
is a response 180u away from the preferred direction, h is the stimulus direction,hp is the preferred orientation and s is the tuning width. The two Gaussians wereforced to peak 180u apart and to have the same width but could have differentamplitudes. Control and photostimulation or photosuppression conditions werefit separately. To generate the average population tuning curve we first circularlyshifted the stimulus direction of each unit so that the maximal response occurredat 0u. We then normalized the responses to this peak response and averaged allnormalized tuning curves together. We fit the control population average tuningcurve with a sum of two Gaussians. The curve for the photostimulation or photo-suppression population average was produced by scaling the control curve by theslope (gain factor) of the linear fit shown in Fig. 2e, j.
All error bars are presented as mean 6 s.e.m. unless otherwise noted. We usedpaired t-tests to assess statistical significance unless otherwise noted.Histology. Triple transgenic mice (Ntsr1-Cre, floxed-tdTomato and Gad67–GFP)were anaesthetized with ketamine and xylazine (100 mg kg21 and 10 mg kg21,respectively) and perfused with cold sucrose (see above) and then perfluoroalkoxy(4% in PBS). After 24 h incubation in perfluoroalkoxy, slices were cut into 50-mmsections and immunostained as described previously49. Antibodies that were usedwere mouse anti-NeuN (1:400; Millipore MAB377), chicken anti-GFP (1:1000;Aves Labs GFP-1020), goat anti-chicken AF488 (1:1,000; Invitrogen A11039) andgoat anti-mouse AF633 (1:1,000; Invitrogen A21050). Slices were mounted inVectashield with Dapi (Vector Labs, H1500). Images were single confocal sectionstaken on an Olympus FV1000. Layer borders were identified by changes in celldensity. Cell counts were carried out using standard stereological techniques.Biocytin fills and neural reconstructions were done as previously described50.
44. Grubb, M. S. & Thompson, I. D. Quantitative characterization of visual responseproperties in the mouse dorsal lateral geniculate nucleus. J. Neurophysiol. 90,3594–3607 (2003).
45. Brainard, D. H. The psychophysics toolbox. Spat. Vis. 10, 433–436 (1997).46. Fee, M. S., Mitra, P. P. & Kleinfeld, D. Automatic sorting of multiple unit neuronal
signals in the presence of anisotropic and non-Gaussian variability. J. Neurosci.Methods 69, 175–188 (1996).
47. Kerlin, A. M., Andermann, M. L., Berezovskii, V. K. & Reid, R. C. Broadly tunedresponse properties of diverse inhibitory neuron subtypes in mouse visual cortex.Neuron 67, 858–871 (2010).
48. Ringach,D. L., Shapley,R.M.&Hawken,M. J.Orientationselectivity inmacaqueV1:diversity and laminar dependence. J. Neurosci. 22, 5639–5651 (2002).
49. Bortone, D. & Polleux, F. KCC2 expression promotes the termination of corticalinterneuron migration in a voltage-sensitive calcium-dependent manner. Neuron62, 53–71 (2009).
50. Bagnall, M. W., Hull, C., Bushong, E. A., Ellisman, M. H. & Scanziani, M. Multipleclusters of release sites formed by individual thalamic afferents onto corticalinterneurons ensure reliable transmission. Neuron 71, 180–194 (2011).
RESEARCH ARTICLE
Macmillan Publishers Limited. All rights reserved©2012
Related Documents