RESULTS REVIEW 1QFY15 13 AUG 2014 GAIL NEUTRAL Tough times GAIL reported all round weak results and adj EBITDA was at Rs 14.8bn (-27% YoY). Lower adj gas transmission tariff (Rs 0.9/scm, -41%), drop in adj gas trading margins (Rs 0.2/scm, -42%), oil UR sharing (Rs 5bn, -27%) and higher LNG usage led to dismal performance. APAT was Rs 9.2bn (-29% YoY). There are multiple negative triggers lined up for GAIL (1) Spot LNG prices are trading below LT prices, hence trading margins will remain weak (2) Tariff revision for Vadodara pipelines is due, we believe that there will be further retrospective hit (3) GAIL will be made to share oil UR of ~Rs 5bn in Q2, we believe the same will stop only after the gas price hike (4) Increase in gas prices from H2 will impact petchem/LPG margins (5) Capitalisation of petchem Pata-II (~Rs 81bn 4QFY15) will increase depreciation/interest cost, whereas returns will be muted due to higher gas cost. Our SOTP target for GAIL is Rs 418/sh (~6.4x FY16E EV/EBITDA and Rs 106/sh from investments). Maintain NEUTRAL. 1QFY15 highlights Natural gas transmission : Volumes 97mmscmd (-2% YoY), reported tariff Rs 0.66/scm (-58%) due to non recognised revenues of Rs 2.4bn on account of tariff revision for five pipelines, adjusted tariff Rs 0.94/scm (- 41%), reported EBIT Rs 2.2bn (-79%). Gas Trading : Volumes 77mmscmd (-6% YoY), margins - Rs 0.04/scm (vs 0.4) due to (1) Rs 1.9bn imbalance on the sale of gas from different sources, will be recovered in Q2 (2) Rs 1bn hit due to fall in spot LNG prices, reported EBIT -Rs 0.4bn. Petrochemicals : Volumes 87kt (-28% YoY) due to maintenance shutdown and power supply interruption, EBITDA margin Rs 16.9/kg (-58% YoY, 70-75% of LNG in gas mix). LPG and LHC : Oil under recovery sharing was Rs 5bn (flat QoQ, -29% YoY), volumes 324 kT (-7% YoY, +12% QoQ) due to higher domestic gas allocation, EBIT at Rs 5bn (flat QoQ). FINANCIAL SUMMARY (STANDALONE) Year Ending March (Rs bn) 1QFY15 1QFY14 YoY (%) 4QFY14 QoQ (%) FY13 FY14 FY15E FY16E Net Sales 138.04 134.00 3.0 145.67 (5.2) 475.23 575.08 736.06 931.62 EBITDA 14.77 20.08 (26.5) 14.40 2.6 64.69 67.01 63.39 73.02 PAT 9.24 13.08 (29.4) 9.72 (5.0) 40.22 40.99 38.54 44.20 Diluted EPS (Rs) 7.3 10.3 (29.4) 7.7 (5.0) 31.7 32.3 30.4 34.8 P/E (x) 13.1 12.8 13.6 11.9 EV / EBITDA (x) 7.6 7.4 7.8 6.8 RoE (%) 17.5 16.0 13.7 14.4 Source: Company, HDFC sec Inst Research INDUSTRY OIL & GAS CMP (as on 12 Aug 2014) Rs 413 Target Price Rs 418 Nifty 7,727 Sensex 25,881 KEY STOCK DATA Bloomberg/Reuters GAIL IN/GAIL.BO No. of Shares (mn) 1,268 MCap (Rs bn) / ($ mn) 524/8,579 6m avg traded value (Rs mn) 709 STOCK PERFORMANCE (%) 52 Week high / low Rs 475/272 3M 6M 12M Absolute (%) 7.7 15.9 37.7 Relative (%) (2.2) (10.7) 1.2 SHAREHOLDING PATTERN (%) Promoters 56.11 FIs & Local MFs 21.29 FIIs 18.77 Public & Others 3.83 Source : BSE Satish Mishra [email protected] +91-22-6171-7334 HDFC securities Institutional Research is also avail able on Bloomberg HSLB <GO> & Thomson Reuters

Welcome message from author
This document is posted to help you gain knowledge. Please leave a comment to let me know what you think about it! Share it to your friends and learn new things together.
Transcript

8/11/2019 Gail - 1qfy15 - Hdfc Sec
http://slidepdf.com/reader/full/gail-1qfy15-hdfc-sec 1/9
RESULTS REVIEW 1QFY15 13 AUG 2014
GAIL
NEUTRAL
Tough timesGAIL reported all round weak results and adj EBITDA
was at Rs 14.8bn (-27% YoY). Lower adj gas
transmission tariff (Rs 0.9/scm, -41%), drop in adj gas
trading margins (Rs 0.2/scm, -42%), oil UR sharing (Rs
5bn, -27%) and higher LNG usage led to dismal
performance. APAT was Rs 9.2bn (-29% YoY).
There are multiple negative triggers lined up for GAIL
(1) Spot LNG prices are trading below LT prices, hence
trading margins will remain weak (2) Tariff revision
for Vadodara pipelines is due, we believe that there
will be further retrospective hit (3) GAIL will be made
to share oil UR of ~Rs 5bn in Q2, we believe the same
will stop only after the gas price hike (4) Increase in
gas prices from H2 will impact petchem/LPG margins
(5) Capitalisation of petchem Pata-II (~Rs 81bn
4QFY15) will increase depreciation/interest cost,
whereas returns will be muted due to higher gas cost.
Our SOTP target for GAIL is Rs 418/sh (~6.4x FY16E
EV/EBITDA and Rs 106/sh from investments).
Maintain NEUTRAL.
1QFY15 highlights
Natural gas transmission : Volumes 97mmscmd (-2%
YoY), reported tariff Rs 0.66/scm (-58%) due to non
recognised revenues of Rs 2.4bn on account of tariff
revision for five pipelines, adjusted tariff Rs 0.94/scm (-
41%), reported EBIT Rs 2.2bn (-79%).
Gas Trading : Volumes 77mmscmd (-6% YoY), margins -
Rs 0.04/scm (vs 0.4) due to (1) Rs 1.9bn imbalance on
the sale of gas from different sources, will be recoveredin Q2 (2) Rs 1bn hit due to fall in spot LNG prices,
reported EBIT -Rs 0.4bn.
Petrochemicals : Volumes 87kt (-28% YoY) due to
maintenance shutdown and power supply interruption,
EBITDA margin Rs 16.9/kg (-58% YoY, 70-75% of LNG in
gas mix).
LPG and LHC : Oil under recovery sharing was Rs 5bn
(flat QoQ, -29% YoY), volumes 324 kT (-7% YoY, +12%
QoQ) due to higher domestic gas allocation, EBIT at Rs
5bn (flat QoQ).
FINANCIAL SUMMARY (STANDALONE)
Year Ending March (Rs bn) 1QFY15 1QFY14 YoY (%) 4QFY14 QoQ (%) FY13 FY14 FY15E FY16E
Net Sales 138.04 134.00 3.0 145.67 (5.2) 475.23 575.08 736.06 931.62
EBITDA 14.77 20.08 (26.5) 14.40 2.6 64.69 67.01 63.39 73.02
PAT 9.24 13.08 (29.4) 9.72 (5.0) 40.22 40.99 38.54 44.20
Diluted EPS (Rs) 7.3 10.3 (29.4) 7.7 (5.0) 31.7 32.3 30.4 34.8
P/E (x) 13.1 12.8 13.6 11.9
EV / EBITDA (x) 7.6 7.4 7.8 6.8
RoE (%) 17.5 16.0 13.7 14.4
Source: Company, HDFC sec Inst Research
INDUSTRY OIL & GAS
CMP (as on 12 Aug 2014) Rs 413
Target Price Rs 418
Nifty 7,727
Sensex 25,881
KEY STOCK DATA
Bloomberg/Reuters GAIL IN/GAIL.BO
No. of Shares (mn) 1,268
MCap (Rs bn) / ($ mn) 524/8,579
6m avg traded value (Rs mn) 709
STOCK PERFORMANCE (%)
52 Week high / low Rs 475/272
3M 6M 12M
Absolute (%) 7.7 15.9 37.7
Relative (%) (2.2) (10.7) 1.2
SHAREHOLDING PATTERN (%)
Promoters 56.11
FIs & Local MFs 21.29FIIs 18.77
Public & Others 3.83
Source : BSE
Satish Mishra
[email protected]+91-22-6171-7334
HDFC securities Institutional Research is also available on Bloomberg HSLB <GO> & Thomson Reuters
8/11/2019 Gail - 1qfy15 - Hdfc Sec
http://slidepdf.com/reader/full/gail-1qfy15-hdfc-sec 2/9
GAIL : RESULTS REVIEW 1QFY15
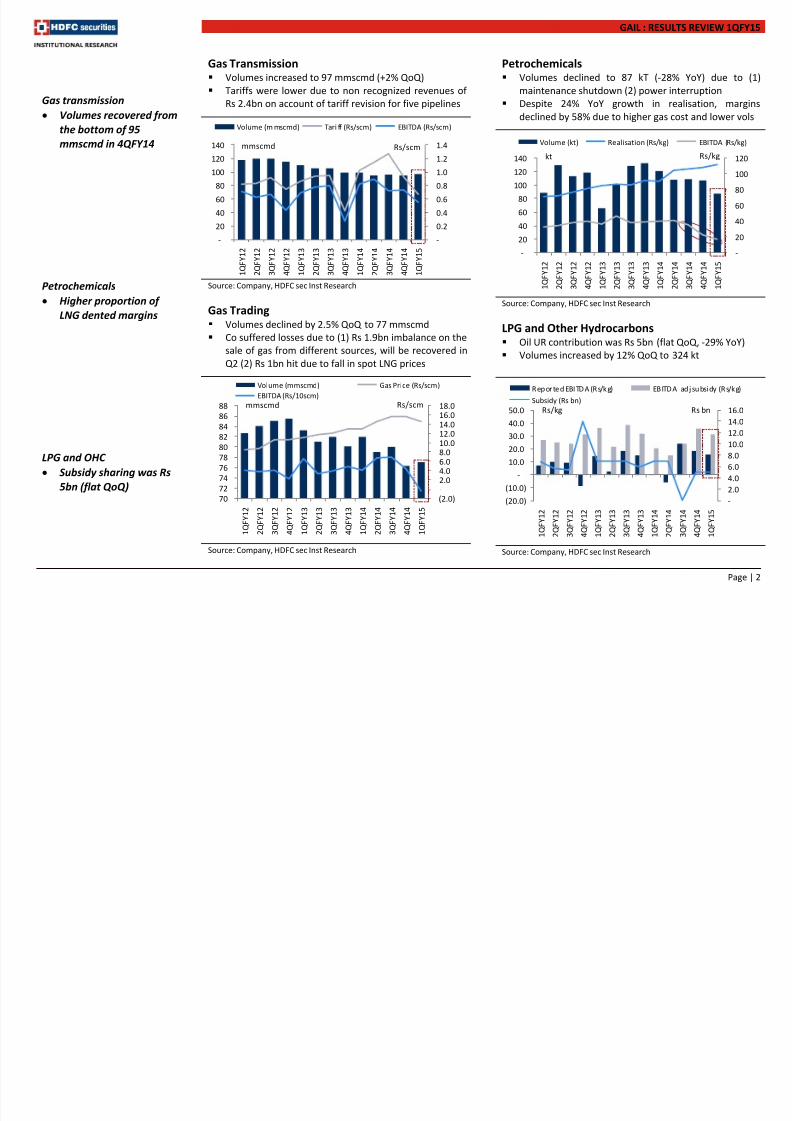
Gas Transmission Volumes increased to 97 mmscmd (+2% QoQ)
Tariffs were lower due to non recognized revenues of
Rs 2.4bn on account of tariff revision for five pipelines
Source: Company, HDFC sec Inst Research
Gas Trading Volumes declined by 2.5% QoQ to 77 mmscmd
Co suffered losses due to (1) Rs 1.9bn imbalance on the
sale of gas from different sources, will be recovered in
Q2 (2) Rs 1bn hit due to fall in spot LNG prices
Source: Company, HDFC sec Inst Research
Petrochemicals Volumes declined to 87 kT (-28% YoY) due to (1)
maintenance shutdown (2) power interruption
Despite 24% YoY growth in realisation, margins
declined by 58% due to higher gas cost and lower vols
Source: Company, HDFC sec Inst Research
LPG and Other Hydrocarbons Oil UR contribution was Rs 5bn (flat QoQ, -29% YoY)
Volumes increased by 12% QoQ to 324 kt
Source: Company, HDFC sec Inst Research
-
0.2
0.4
0.6
0.8
1.0
1.2
1.4
-
20
40
60
80
100
120
140
1 Q
F Y 1 2
2 Q
F Y 1 2
3 Q
F Y 1 2
4 Q
F Y 1 2
1 Q
F Y 1 3
2 Q
F Y 1 3
3 Q
F Y 1 3
4 Q
F Y 1 3
1 Q
F Y 1 4
2 Q
F Y 1 4
3 Q
F Y 1 4
4 Q
F Y 1 4
1 Q
F Y 1 5
Volume (m mscmd) Tari ff (Rs/scm) EBITDA (Rs/scm)
mmscmd Rs/scm
-
2.0
4.0
6.0
8.0
10.0
12.0
14.0
16.0
(20.0)
(10.0)
-
10.0
20.0
30.0
40.0
50.0
1 Q F Y 1 2
2 Q F Y 1 2
3 Q F Y 1 2
4 Q F Y 1 2
1 Q F Y 1 3
2 Q F Y 1 3
3 Q F Y 1 3
4 Q F Y 1 3
1 Q F Y 1 4
2 Q F Y 1 4
3 Q F Y 1 4
4 Q F Y 1 4
1 Q F Y 1 5
Rep orted EBITDA (Rs/kg) EB ITDA ad j su bsidy (Rs/kg)
Subsidy (Rs bn)
Rs/kg Rs bn
Gas transmission
• Volumes recovered from
the bottom of 95mmscmd in 4QFY14
Petrochemicals
• Higher proportion of
LNG dented margins
LPG and OHC
• Subsidy sharing was Rs
5bn (flat QoQ)
-
20
40
60
80
100
120
-
20
40
60
80
100
120
140
1 Q F Y 1
2
2 Q F Y 1
2
3 Q F Y 1
2
4 Q F Y 1
2
1 Q F Y 1
3
2 Q F Y 1
3
3 Q F Y 1
3
4 Q F Y 1
3
1 Q F Y 1
4
2 Q F Y 1
4
3 Q F Y 1
4
4 Q F Y 1
4
1 Q F Y 1
5
Volume (kt) Realisation (Rs/kg) EBITDA (Rs/kg)
kt Rs/kg
(2.0)-2.04.06.08.010.012.014.016.018.0
70
72
74
76
78
80
82
84
8688
1 Q F Y 1 2
2 Q F Y 1 2
3 Q F Y 1 2
4 Q F Y 1 2
1 Q F Y 1 3
2 Q F Y 1 3
3 Q F Y 1 3
4 Q F Y 1 3
1 Q F Y 1 4
2 Q F Y 1 4
3 Q F Y 1 4
4 Q F Y 1 4
1 Q F Y 1 5
Volume (mmscmd) Gas Price (Rs/scm)
EBITDA (Rs/10scm)
mmscmd Rs/scm
Page | 2

8/11/2019 Gail - 1qfy15 - Hdfc Sec
http://slidepdf.com/reader/full/gail-1qfy15-hdfc-sec 3/9
GAIL : RESULTS REVIEW 1QFY15
QUARTERLY FINANCIALS SNAPSHOT (STANDALONE)
(Rs bn) 1QFY15 1QFY14 YoY (%) 4QFY14 QoQ (%)
Revenues 138.04 134.00 3.0 145.67 (5.2)
Raw Material Expenses 4.51 6.72 (32.8) 7.09 (36.3)
Trading Expenses 106.65 96.47 10.5 109.90 (3.0)Employee Expenses 2.27 2.00 13.4 2.26 0.7
Other Operating Expenses 9.84 8.72 12.8 12.02 (18.1)
EBITDA 14.77 20.08 (26.5) 14.40 2.6
Depreciation 2.34 2.81 (16.8) 3.06 (23.6)
Other Income 1.72 0.58 198.9 4.11 (58.0)
PBIT 14.16 17.85 (20.7) 15.45 (8.4)
Interest Cost 0.93 0.61 52.3 1.06 (11.7)
PBT 13.22 17.24 (23.3) 14.39 (8.1)
Tax 3.99 4.16 (4.2) 4.67 (14.7)
APAT 9.24 13.08 (29.4) 9.72 (5.0)
Exceptional 2.89 - - - -
RPAT 6.34 13.08 (51.5) 9.72 (34.7)
AEPS (Rs/sh) 7.3 10.3 (29.4) 7.7 (5.0)
Source: Company, HDFC sec Inst Research
MARGIN ANALYSIS
1QFY15 1QFY14 YoY (bps) 4QFY14 QoQ (bps)
Material Expenses as % of Net Sales 3.3 5.0 (174) 4.9 (160)
Trading Expenses as % of Net Sales 77.3 72.0 526 75.4 181
Employee Expenses as % of Net Sales 1.6 1.5 15 1.6 10
Other Expenses as % of Net Sales 7.1 6.5 62 8.3 (112)
EBITDA Margin (%) 10.7 15.0 (429) 9.9 81
Net Profit Margin (%) 6.7 9.8 (307) 6.7 2
Tax Rate (%) 30.1 24.1 602 32.5 (233)
Source: Company, HDFC sec Inst Research
Profitability declined in all
the major segments (gas
transmission, gas trading,
petchem)
Page | 3

8/11/2019 Gail - 1qfy15 - Hdfc Sec
http://slidepdf.com/reader/full/gail-1qfy15-hdfc-sec 4/9
GAIL : RESULTS REVIEW 1QFY15
SEGMENTAL PERFORMANCE
(Rs bn) 1QFY15 1QFY14 YoY (%) 4QFY14 QoQ (%) FY14
Revenues
Natural Gas Transmission 5.87 14.27 (58.9) 7.87 (25.4) 38.29
LPG Transmission 1.11 0.94 18.1 1.15 (3.5) 4.18
Gas Trading 102.45 96.82 5.8 107.76 (4.9) 426.22
Petrochemicals 9.74 10.97 (11.2) 11.60 (16.0) 45.37
LPG & Other Liquid Hydro Carbons 12.60 10.04 25.5 14.86 (15.2) 54.63
Total 133.37 133.56 (0.1) 144.64 (7.8) 572.45
PBIT
Natural gas transmission 2.23 10.54 (78.8) 2.60 (14.2) 18.02
LPG transmission 0.69 0.55 25.4 0.58 19.2 2.15
Gas trading (0.35) 3.03 (111.7) 2.85 (112.4) 15.80
Petrochemicals 1.25 4.38 (71.5) 1.96 (36.4) 13.61
LPG & Other hydrocarbons 4.96 (0.11) (4,633.9) 4.98 (0.5) 10.21
Total 9.39 18.13 (48.2) 12.98 (27.7) 59.85
SEGMENTAL KEY DATA
Physical performance 1QFY15 1QFY14 YoY (%) 4QFY14 QoQ (%) FY14
TRANSMISSION
Natural Gas (mmscmd) 97 99 (2.4) 95 2.0 96
Tariff (Rs/kscm) 664 1,575 (57.8) 1,149 (42.2) 1,090
LPG (kT) 832 699 19.0 729 14.1 3,146
Tariff (Rs/kg) 1.3 1.3 (0.8) 1.3 0.1 1.3
SALES
Natural Gas (mmscmd) 77 82 (6.1) 79 (2.5) 79
Realisation (Rs/scm) 14.6 12.9 12.7 15.5 (5.8) 14.7
Margin (Rs/scm) (0.04) 0.40 (109.1) 0.43 (108.7) 0.55
Petrochemicals (kT) 87 121 (28.1) 108 (19.4) 445
Realisation (Rs/kg) 112 91 23.5 104 7.2 102
EBITDA (Rs/kg) 16.9 40.0 (57.8) 40.5 (58.2) 34.6
LPG + LHC (kT) 324 350 (7.4) 289 12.1 1,308
Subsidy Contribution (Rs mn) 5,000 7,000 (28.6) 5,000 - 19,000
Source: Company, HDFC sec Inst Research
Gas transmission revenues
were lower due to nonrecognition of revenues
worth Rs 2.4bn on account
of tariff revision for five
pipelines
GAIL accounted for under
recovery of Rs 1.9bn due to
imbalance on account of
the sale of gas fromdifferent sources in the
trading segment, will be
recovered in 2QFY15
QoQ increase in gas
transmission volumes is
encouraging
We expect ~Rs 5bn/qtr oil
UR sharing to continue until
there is an increase in gas
price
Page | 4

8/11/2019 Gail - 1qfy15 - Hdfc Sec
http://slidepdf.com/reader/full/gail-1qfy15-hdfc-sec 5/9
GAIL : RESULTS REVIEW 1QFY15
ASSUMPTIONS
FY12 FY13 FY14 FY15E FY16E FY17E
TRANSMISSION
Gas Volumes (mmscmd) 118 105 96 101 110 129
Tariff (Rs/scm) 0.8 0.9 1.1 0.9 1.0 1.0
LPG Volumes (kT) 3,362 3,136 3,145 3,161 3,177 3,177
Tariff (Rs/kg) 1.4 1.3 1.3 1.3 1.3 1.3
SALES
Natural Gas (mmscmd) 84 82 79 81 88 103
Realisation (US$/mmbtu) 5.1 5.5 6.4 8.2 9.5 10.0
EBITDA Margin (Rs/scm) 0.35 0.47 0.55 0.41 0.37 0.34
Petrochemicals (kT) 448 427 445 540 810 855
Realisation (US$/t) 1,573 1,611 1,685 1,685 1,685 1,685
Feed Gas Cost (US$/mmbtu) 5.4 5.5 8.1 9.0 10.5 10.7
LPG (kT) 1,124 1,075 1,030 1,030 1,030 1,030
Other LHC (kT) 315 296 277 298 298 298
OTHERS
INR-US$ 48.0 54.4 60.5 60.0 60.0 60.0
Subsidy Contribution (Rs bn) 31.8 26.9 19.0 10.0 - -
Source: Company, HDFC sec Inst Research
SOTP VALUATION (BASED ON FY16E)
EBITDA (Rs bn) Multiple EV (Rs bn) Value/sh Basis
Gas Transmission 25.7 8.0 206 162 x FY16E EBITDA
LPG Transmission 2.6 7.0 18 15 x FY16E EBITDA
Gas Trading 12.0 4.0 48 38 x FY16E EBITDA
Petchem 17.6 4.5 79 62 x FY16E EBITDA
LPG & Other Hydrocarbons 22.4 5.0 112 88 x FY16E EBITDA
Standalone wt avg 6.4
Less : Net Debt (Mar-14) 68.8 69 54
Standalone Value 311
Investments
ONGC 0.8 77 61 20% disc. to our TP
Petronet LNG 0.8 14 11 20% disc. to our TP
IGL 0.8 10 8 20% disc. to our TP
Others 1.0 34 27 1x BV
Value per share 418
Source : HDFC sec Inst Research
Key events for GAIL
(1)
Increase in gas
transmission volumes
(2) Increase in gas cost
(3) No subsidy sharing post
gas price hike
Lower multiple to petchem,
LPG and trading biz due to
rising gas cost andregulatory risk
Page | 5
8/11/2019 Gail - 1qfy15 - Hdfc Sec
http://slidepdf.com/reader/full/gail-1qfy15-hdfc-sec 6/9
GAIL : RESULTS REVIEW 1QFY15
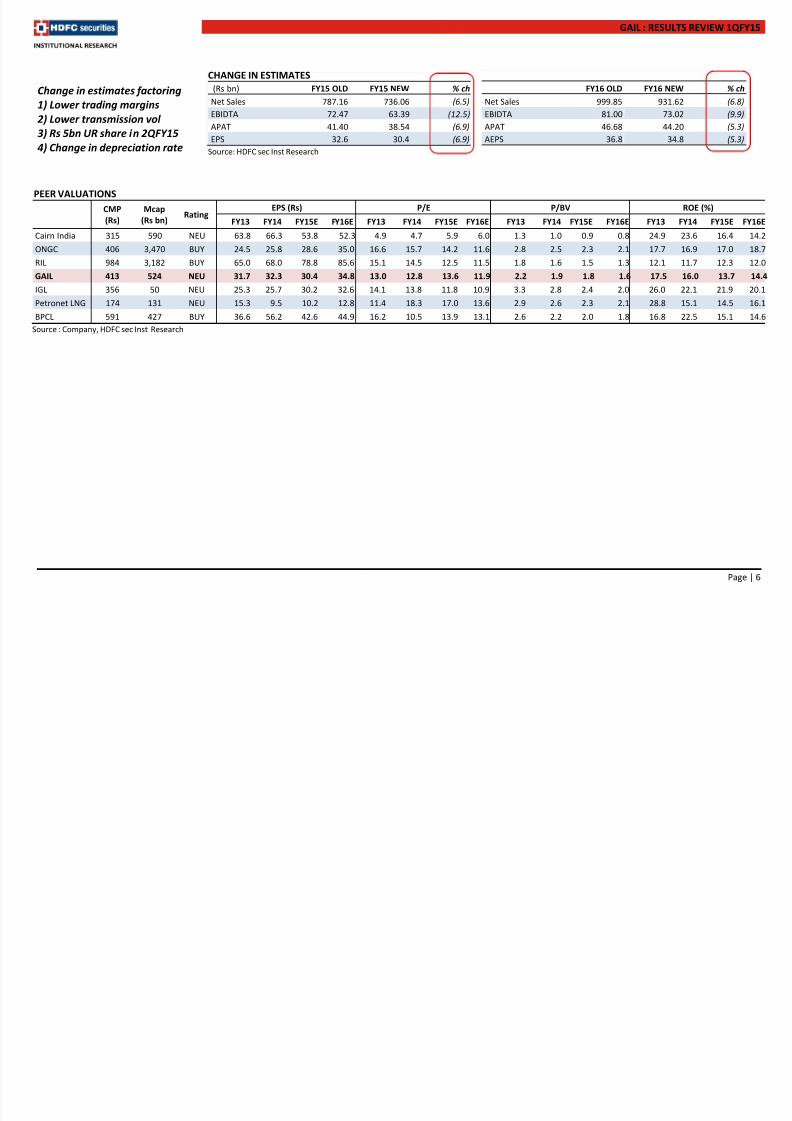
CHANGE IN ESTIMATES
(Rs bn) FY15 OLD FY15 NEW % ch
Net Sales 787.16 736.06 (6.5)
EBIDTA 72.47 63.39 (12.5)
APAT 41.40 38.54 (6.9)
EPS 32.6 30.4 (6.9)
FY16 OLD FY16 NEW % ch
Net Sales 999.85 931.62 (6.8)
EBIDTA 81.00 73.02 (9.9)
APAT 46.68 44.20 (5.3)
AEPS 36.8 34.8 (5.3)
Source: HDFC sec Inst Research
PEER VALUATIONS
CMP
(Rs)
Mcap
(Rs bn) Rating
EPS (Rs) P/E P/BV ROE (%)
FY13 FY14 FY15E FY16E FY13 FY14 FY15E FY16E FY13 FY14 FY15E FY16E FY13 FY14 FY15E FY16E
Cairn India 315 590 NEU 63.8 66.3 53.8 52.3 4.9 4.7 5.9 6.0 1.3 1.0 0.9 0.8 24.9 23.6 16.4 14.2
ONGC 406 3,470 BUY 24.5 25.8 28.6 35.0 16.6 15.7 14.2 11.6 2.8 2.5 2.3 2.1 17.7 16.9 17.0 18.7
RIL 984 3,182 BUY 65.0 68.0 78.8 85.6 15.1 14.5 12.5 11.5 1.8 1.6 1.5 1.3 12.1 11.7 12.3 12.0
GAIL 413 524 NEU 31.7 32.3 30.4 34.8 13.0 12.8 13.6 11.9 2.2 1.9 1.8 1.6 17.5 16.0 13.7 14.4
IGL 356 50 NEU 25.3 25.7 30.2 32.6 14.1 13.8 11.8 10.9 3.3 2.8 2.4 2.0 26.0 22.1 21.9 20.1
Petronet LNG 174 131 NEU 15.3 9.5 10.2 12.8 11.4 18.3 17.0 13.6 2.9 2.6 2.3 2.1 28.8 15.1 14.5 16.1
BPCL 591 427 BUY 36.6 56.2 42.6 44.9 16.2 10.5 13.9 13.1 2.6 2.2 2.0 1.8 16.8 22.5 15.1 14.6
Source : Company, HDFC sec Inst Research
Change in estimates factoring
1) Lower trading margins
2) Lower transmission vol
3) Rs 5bn UR share in 2QFY154) Change in depreciation rate
Page | 6

8/11/2019 Gail - 1qfy15 - Hdfc Sec
http://slidepdf.com/reader/full/gail-1qfy15-hdfc-sec 7/9
GAIL : RESULTS REVIEW 1QFY15
STANDALONE INCOME STATEMENT
(Rs bn) FY12 FY13 FY14 FY15E FY16E
Revenues 404.41 475.23 575.08 736.06 931.62
Growth % 24.6 17.5 21.0 28.0 26.6
Raw Material 25.86 36.47 42.17 55.54 83.38
Gas Trading 284.40 333.97 412.34 559.88 712.79
Employee Cost 6.50 7.85 8.48 9.16 9.89
Other expenses 31.65 32.24 45.08 48.09 52.53
EBITDA 55.99 64.69 67.01 63.39 73.02
EBITDA growth % 2.3 15.5 3.6 (5.4) 15.2
EBITDA Margin % 13.8 13.6 11.7 8.6 7.8
Depreciation 7.91 9.81 11.76 10.90 12.54
Other income 6.48 7.65 8.99 8.67 9.02
EBIT 54.56 62.53 64.24 61.16 69.50
Interest Cost 1.16 1.95 3.66 4.06 4.01
Exceptional items - - 3.45 - -
PBT 53.40 60.58 64.02 57.10 65.49
Taxes 16.86 20.36 20.27 18.56 21.28
RPAT 36.54 40.22 43.75 38.54 44.20
APAT 36.54 40.22 40.99 38.54 44.20
APAT Growth % 2.6 10.1 1.9 (6.0) 14.7
AEPS 28.8 31.7 32.3 30.4 34.8
EPS Growth % 2.6 10.1 1.9 (6.0) 14.7
Source: Company, HDFC sec Inst Research
STANDALONE BALANCE SHEET
(Rs bn) FY12 FY13 FY14 FY15E FY16E
SOURCES OF FUNDS
Share capital 12.68 12.68 12.68 12.68 12.68
Reserves and surplus 203.57 229.59 258.04 281.04 308.96
Net Worth 216.26 242.28 270.72 293.72 321.65
LT Loans 48.89 81.41 95.26 85.26 75.26
ST Loans - 2.24 - - -
Total Debt 48.89 83.65 95.26 85.26 75.26
Deferred tax liability 17.69 23.00 25.66 27.95 27.95
Other LT Liabilities 2.77 6.85 7.71 7.71 7.71
Long term provisions 3.38 3.60 4.04 4.04 4.04
Total liabilities 288.98 359.37 403.40 418.68 436.61
APPLICATION OF FUNDS
Net fixed assets 158.58 197.07 205.29 282.94 295.10
Capital WIP 79.42 89.78 106.75 53.64 58.94
LT Investments 26.72 36.80 41.03 41.03 41.03
LT Loans and Advances 31.75 25.91 25.35 25.35 25.35
Other non current assets 2.72 6.73 7.18 7.18 7.18
Inventory 14.20 15.35 22.55 27.62 34.98
Debtors 19.04 25.51 28.12 35.23 44.62
Cash and Cash Equivalent 9.41 23.97 26.51 24.61 21.53
Loans and advances 19.66 25.56 35.14 26.07 26.33
Other current assets 0.01 0.15 0.18 0.18 0.18
Total current assets 62.33 90.54 112.50 113.72 127.65Trade Payables 25.10 31.04 39.75 50.18 63.55
Other Current Liabiliites 36.55 42.08 40.48 40.48 40.48
Provisions 10.88 14.35 14.49 14.53 14.62
Total current Liabilities 72.53 87.47 94.71 105.18 118.65
Net current assets (10.20) 3.07 17.79 8.54 9.00
Total Assets 288.98 359.37 403.40 418.68 436.61
Source: Company, HDFC sec Inst Research
Page | 7

8/11/2019 Gail - 1qfy15 - Hdfc Sec
http://slidepdf.com/reader/full/gail-1qfy15-hdfc-sec 8/9

8/11/2019 Gail - 1qfy15 - Hdfc Sec
http://slidepdf.com/reader/full/gail-1qfy15-hdfc-sec 9/9
Related Documents