“A STUDY ON THE CUSTOMER PREFERENCE OF CHOOSING D-MART OVER BIG BAZAAR IN BANGALORE” Project submitted in partial fulfillment of the requirement for the Award of the Degree BACHELOR OF BUSINESS ADMINSTRATION OF BANGALORE UNIVERSITY Submitted by, GAGAN KUMAR C (Reg.No.17MFC17) Under the guidance of Prof. M. MALARVELZE ASSISTANT PROFESSOR SOUNDARYA INSTITUTE OF MANAGEMENT AND SCIENCE Soundarya Nagar, Sidedahalli, Nagasandra post, Bangalore-560073 2019-20

Welcome message from author
This document is posted to help you gain knowledge. Please leave a comment to let me know what you think about it! Share it to your friends and learn new things together.
Transcript

“A STUDY ON THE CUSTOMER PREFERENCE OF CHOOSING
D-MART OVER BIG BAZAAR IN BANGALORE”
Project submitted in partial fulfillment of the
requirement for the Award of the Degree
BACHELOR OF BUSINESS ADMINSTRATION
OF
BANGALORE UNIVERSITY
Submitted by,
GAGAN KUMAR C
(Reg.No.17MFC17)
Under the guidance of
Prof. M. MALARVELZE
ASSISTANT PROFESSOR
SOUNDARYA INSTITUTE OF MANAGEMENT AND SCIENCE
Soundarya Nagar, Sidedahalli, Nagasandra post, Bangalore-560073
2019-20

STUDENT DECLARATION
I GAGAN KUMAR C Reg. No. 17MFC26017 of 6th semester BBA hereby declare
that the project titled a study on “A STUDY ON THE CUSTOMER
PREFERENCE IN CHOOSING D-MART OVER BIG BAZAAR IN
BANGALORE” has been prepared by me during the year 2019-2020, under the
guidance of Prof. M. MALARVELZE, Department of Management, SOUNDARYA
INSTITUTE OF MANAGEMENT AND SCIENCE. This is my original work and
has not been submitted earlier to Bangalore University or to any other institution.
The matter in this report is based on data collected by me at D-MART Under the
guidance of Dr.KARUNAKARAN. The data shall be kept confidential & that I shall
not misuse it for any other purpose.
Date:
Place: Bangalore
GAGAN KUMAR C
17MFC26017

ACKNOWLEDGEMENT
The satisfaction and euphoria that accompany the successful completion of any task
would be incomplete without the mention of people who made it possible, with
constant guidance and encouragement.
I am deeply indebted to D-MART, for providing me an opportunity and also providing
all the necessary facilities to carry out the study.
My sincere thanks to Dr. KARUNAKARAN Manager, D-MART for the help, co-
operation, guidance and assistance during this study.
I express my deep gratitude to our beloved Principal Dr. SURESH C HEGADI, Prof.
Girish S our respected Head of the Department, Department of Business
Administration, and our Project Coordinator Prof. M.MALARVELZE, Soundarya
Institute of Management & Science for giving me an opportunity to do this project.
I am extremely thankful to my internal guide Prof. M. MALARVELZE, faculty, for
providing me excellent guidance, co-operation and encouragement during my project.
Finally, I thank my parents, family, friends and those who gave their co-operation and
help in completing this project work.
Date:
Place: Bangalore
GAGAN KUMAR C
17MFC26017

TABLE OF CONTENTS
TITLE Page No.
CHAPTER 1 – INTRODUCTION
1.1 Introduction
1.2 Various Retail Formats
1.3 Future group
1.4 Avenue Super marts limited
1.5 Histories and Evolution of Retail Industry
1.6 Retail in India: Historical Perspective
1.7 Evolution of Retail in India
1.8 Traditional Retail Format in India
1.9 History of Hypermarket
1.10 Company Profile Of D-mart
1.10.1 Major events and milestones
1.11 Company Profile of Big Bazaar
1.11.1 Major events and milestones
1-17
CHAPTER 2 - RESEARCH DESIGN AND
METHODOLOGY.
18-22
CHAPTER 3 – COMPANY PROFILE.
3.1 Statement of the problem
3.2 Need and Importance of the study
3.3 Objective of the study
3.4 Scope of the study
3.5 Research methodology
3.6 Limitation of the study
3.7 Chapter scheme
23-30
CHAPTER 4 – ANALYSIS AND INERPRETATION. 31-70
CHAPTER 5 – FINDINGS, SUGGESTIONS AND
CONCLUSION.
71-73
BIBLIOGRAPHY 74
ANNEXURE 75-76

LIST OF TABLES
SL.
NO.
TABLE
NO.
TITLES PAGE NO.
1 4.1 Showing the Gender of Respondents. 31
2 4.2 Showing the Age of Respondents 33
3 4.3 Showing the Occupation of Respondents. 35
4 4.4 Showing the marital status of the Respondents 37
5 4.5 Showing the monthly income of Respondents 39
6 4.6 Showing the visit to Big Bazaar 41
7 4.7 Showing the visit to D-Mart 43
8 4.8 Showing what people purchase at Big Bazaar. 45
9 4.9 Showing what people purchase at D-Mart. 47
10 4.10 Showing the source how people came to know about Big-
Bazaar and D-Mart?
49
11 4.11 Showing the responses why people purchase at Big Bazaar. 51
12 4.12 Showing the responses why people purchase at D-Mart. 53
13 4.13 Showing the responses why people choose D-Mart over Big
Bazaar.
55
14 4.14 Showing the responses if big bazaar is intimating the
customers of the discounts and prices.
57
15 4.15 Showing the responses if D-Mart is intimating the customers
of the discounts and prices.
59
16 4.16 Showing the responses of how effective the customer
service department at big bazaar.
61
17 4.17 Showing the responses of how effective the customer
service department at D-Mart.
63
18 4.18 Showing the responses of how fast the billing section is at
big bazaar.
65
19 4.19 Showing the responses of how fast the billing section is at
D-Mart.
67

20 4.20 Showing the responses of the quality and quantity is
maintained at Big Bazaar.
69
LIST OF CHARTS
SL.
NO.
TABLE
NO.
TITLES PAGE NO.
1 4.1 Showing the Gender of Respondents. 32
2 4.2 Showing the Age of Respondents 34
3 4.3 Showing the Occupation of Respondents. 36
4 4.4 Showing the marital status of the Respondents 38
5 4.5 Showing the monthly income of Respondents 40
6 4.6 Showing the visit to Big Bazaar 42
7 4.7 Showing the visit to D-Mart 44
8 4.8 Showing what people purchase at Big Bazaar. 46
9 4.9 Showing what people purchase at D-Mart. 48
10 4.10 Showing the source how people came to know about Big-
Bazaar and D-Mart?
50
11 4.11 Showing the responses why people purchase at Big Bazaar. 52
12 4.12 Showing the responses why people purchase at D-Mart. 54
13 4.13 Showing the responses why people choose D-Mart over Big
Bazaar.
56
14 4.14 Showing the responses if big bazaar is intimating the
customers of the discounts and prices.
58
15 4.15 Showing the responses if D-Mart is intimating the customers
of the discounts and prices.
60
16 4.16 Showing the responses of how effective the customer
service department at big bazaar.
62
17 4.17 Showing the responses of how effective the customer
service department at D-Mart.
64
18 4.18 Showing the responses of how fast the billing section is at
big bazaar.
66

19 4.19 Showing the responses of how fast the billing section is at
D-Mart.
68
20 4.20 Showing the responses of the quality and quantity is
maintained at Big Bazaar.
70

CHAPTER-1
INTRODUCTION

“A Study on the Customer preference in Choosing D-mart over Big Bazaar in Bangalore”
1 | P a g e
SOUNDARYA INSTITUTE OF MANAGEMENT AND SCIENCE
1.1 INTRODUCTION
Retail markets and shops have a very ancient history, dating back to antiquity. Retailing involves
the process of selling consumer goods or services to customers through multiple channels of
distribution to earn a profit. Retails satisfy demand identified through a supply chain. Some of
the earliest retailers were itinerant peddlers. Modern retailers typically make a variety of strategic
level decisions including the type of store, optimal product assortment, customer service,
supporting services and the stores overall market positioning. Once the strategic retail plan is in
place, retailers devise the retail mix which includes product, price, place, promotion, personnel
and presentation.
In the digital age, an increase number of retailers are seeking to reach broader markets by selling
through multiple channels, including both bricks and mortar and online retailing. Digital
technologies are also changing the way that consumers pay for goods and services. Retailing
support services may also include the provision of credit, delivery services, advisory services,
stylist services and a range of other supporting services. The term “retailer” is typically applied
where a service provider fills the small orders of many individuals, who are end- users, rather
than large orders of a small number of wholesales, corporate or government clientele. Shopping
generally refers to the act of buying products. Sometimes this is done to obtain final goods,
including necessities such as food and clothing; sometimes it takes place as a recreational
activity. Recreational shopping often involves window shopping (just looking, not buying) and
browsing: it does not always result in a purchase.
Future Group understands the soul of Indian consumers. As one of Indians retail pioneers with
multiple retail formats, Future Group connects a diverse and passionate community of Indian
buyers, sellers and businesses. The collective impact on business is staggering. Around 300
million customers walk into the stores each year and choose products and services supplied by
Future Groups 30,000 small, medium and large entrepreneurs and manufacturers from across
India. And this number is set to grow.

“A Study on the Customer preference in Choosing D-mart over Big Bazaar in Bangalore”
2 | P a g e
SOUNDARYA INSTITUTE OF MANAGEMENT AND SCIENCE
Future Group employs 30,000 people directly from every section of our society. They source
their supplies from enterprises across the country, creating fresh employment, impacting
livelihoods, empowering local communities and fostering mutual growth.
Future Group believes in the ‘Indian dream’ and have aligned our business practices to their
larger objective of being a premier catalyst in India’s consumption-led growth story. Working
towards this end, Future Group are ushering positive socio-economic changes in communities to
help the Indian dream fly high and the ‘Sone Ki Chidiya’ soar once again. This approach remains
embedded in Future Group’s ethos even as they rapidly expand their footprints deeper into India.
Future Group makes every effort to delight its customers, tailoring store formats to changing
Indian lifestyles and adapting products and services to their desires. Future Group operate some
of Indians most popular retail formats. Across value and lifestyle segments, Future Group’s
multi-format retail strategy caters to the complete consumption needs of a wide cross-section of
Indian consumers.
As modern retail drives fresh demand and consumption in new categories, Future Group’s
strategy is based on a deep understanding of Indian consumers, the products they want, and
making these products available in every city, in every store format.
“A Study on the Customer preference in Choosing D-mart over Big Bazaar in Bangalore”
3 | P a g e
SOUNDARYA INSTITUTE OF MANAGEMENT AND SCIENCE
VALUE
Helping India save
HOME
Building dreams in a new India
DIGITAL
Connecting the youth of India
LIFESTYLE
Style for every occasion
“A Study on the Customer preference in Choosing D-mart over Big Bazaar in Bangalore”
4 | P a g e
SOUNDARYA INSTITUTE OF MANAGEMENT AND SCIENCE
3 B MODEL MANAGEMENT
STANDARD OPERATING
PROCESS (SOP)
FUTURE GROUP
VALUES/FUTURE GROUP GENE
LEARNING METHOLOGY
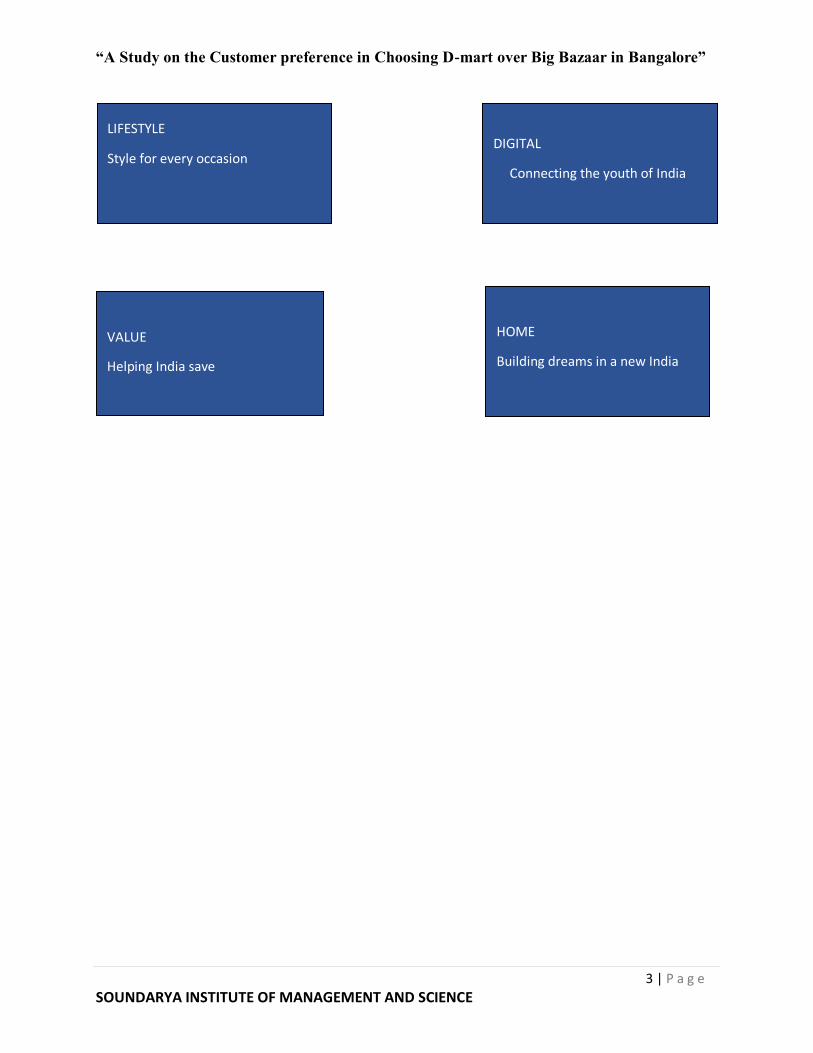
1.2 Various Retail Formats
Future group offers innovation offerings at affordable prices tailored to the needs of every Indian
household.
• Pioneer in the India’s retail space, Future Groups formats are household names in more
than 93 cities and 60 rural location across the country
• Future Groups store cover around 17 million square feet of retail space and attract around
300 million customers each year.
• Pantaloons Retail (India) Limited focuses on the lifestyle retail segment led by the
pantaloons and central formats.
• Future value Retail focuses on the value retail segment through the Big Bazaar, Food
Bazaar and KB fair price formats.

“A Study on the Customer preference in Choosing D-mart over Big Bazaar in Bangalore”
5 | P a g e
SOUNDARYA INSTITUTE OF MANAGEMENT AND SCIENCE
Future Group has divided 4 types:
• 3 B MODEL MANAGEMENT
• VALUES/FUTURE GROUP GENE
• LEARNING METHOLOGY
• STANDARD OPERATING PROCESS (SOP)

“A Study on the Customer preference in Choosing D-mart over Big Bazaar in Bangalore”
6 | P a g e
SOUNDARYA INSTITUTE OF MANAGEMENT AND SCIENCE
Website http://www.futuregroup.in/
..
Future Consumer Enterprise Ltd., Future University Ltd., Future Supply Chains Ltd.,
Future Brands Ltd., Future Capital Holdings Ltd.
Future Retail Ltd, Future Lifestyle Fashion Ltd., Divisions
Annual turnover 30000 crore as of May 2018
Supermarkets, hypermarkets, discount stores, insurance, logistics, media Services
Integrated foods and other FMCGs Products
Industry Retailing, insurance, logistics, media
Founder Kishore Biyani (CEO)
Headquarters Mumbai, Maharashtra, India
Private Type
FUTURE GROUP
1.3 FUTURE GROUP

“A Study on the Customer preference in Choosing D-mart over Big Bazaar in Bangalore”
7 | P a g e
SOUNDARYA INSTITUTE OF MANAGEMENT AND SCIENCE
VISION
“Future group shall deliver everything, everywhere and every time for every customer in the
most profitable manner”.
Mission
• We share the vision & believe that our customers & stakeholders shall be served
only by creating & executing the future scenarios in the consumption space
leading to economic development.
• We will be the trendsetters in evolving
✓ Delivery formats
✓ Creating retail reality
✓ Making consumption affordable for all customers segments for class & for
masses
• We shall infuse Indian brands with Confidence & renewed ambition
• We shall be
✓ Efficient
✓ Cost conscious
✓ Committed to quality in whatever we do.
• We shall ensure that our positive attitude, sincerely, humility & united
determination shall be the driving force to make us successful.

“A Study on the Customer preference in Choosing D-mart over Big Bazaar in Bangalore”
8 | P a g e
SOUNDARYA INSTITUTE OF MANAGEMENT AND SCIENCE
1.4 AVENUE SUPERMARTS LIMITED
AVENUE SUPERMARTS LIMITED
Type Private
Industry Retailing
Founded 2000
Headquarters Mumbai
Products Integrated foods and other FMCGs
Services Supermarkets
Revenue INR 54,509.4 Million as on 31st December 2018
Division D-Mart
Website www.dmartindia.com

“A Study on the Customer preference in Choosing D-mart over Big Bazaar in Bangalore”
9 | P a g e
SOUNDARYA INSTITUTE OF MANAGEMENT AND SCIENCE
Avenue Super marts Limited
Company History:
The company was incorporated as Avenue super marts private limited on May 12, 2000 at
Mumbai, Maharashtra as a private limited company under the Companies Act, 1956.
Subsequently, the name of the Company was changed to Avenue Super marts Limited due to
conversion of private to a public company pursuant to a special resolution passed by the
shareholders at an extraordinary general meeting held on February 1, 2001. Pursuant to the
change of the name, a fresh certificate of incorporation was issued to the Company by the ROC
on May 3, 2011. The Company has 2176 shareholders.
Major events and milestones in relation to the company are:
2001- The Company was incorporated as Avenue Super marts Private Limited
2003- The Company opened its first store in Powai, Mumbai.
2005- The Company entered a scheme of amalgamation for transfer of undertakings of Koop
Consumer Service Private Limited, Amodini Real Estates Private Limited and Shoppers Delight
Private Limited to the Company
2011- The Company opened stores in Andhra Pradesh and Karnataka
2017- The Company opened stores in the National Capital Region and Daman.

“A Study on the Customer preference in Choosing D-mart over Big Bazaar in Bangalore”
10 | P a g e
SOUNDARYA INSTITUTE OF MANAGEMENT AND SCIENCE
1.5 Histories and Evolution of Retail Industry:
India retail industry is the largest industry in India, with an employment of around 8%
contributing to over 10% of the country’s GDP. Retail industry in India is expected to rise 25%
yearly being driven by strong income growth, changing lifestyles, and favorable demographic
patterns. It is expected that by 2016 modern retail industry in India will be worth US$ 175-200
billion. India retail industry is one of the fastest growing industries with revenue expected in
2007 to amount US$ 320 billion and is increasing at a rate of 5% yearly.
A further increase of 7-8% is expected in the industry of retail in India by growth in
consumerism in urban areas, rising incomes, and a steep rise in rural consumption. It has further
been predicted that the retailing industry in India will amount to US$ 22.5 billion by 2017 from
the current size of US$ 18.5 billion. Shopping in India has witnessed revolution with the change
in the consumer buying behavior and the whole format of shopping also altering. Industry of
retailing in India which has become modern can be seen from the fact that there are multi stored
malls, huge shopping centers, and sprawling complexes which offer food, shopping and
entertainment all under the same roof.
India retail industry is expanding itself most aggressively; as a result, a great demand for
real estate is being created. India retailers preferred means of expansion is to expand to other
region and to increase the number of their outlets in a city. It is expected that by 2017, India may
have 600 new shopping centers. In the Indian retailing industry, food is the most dominating
sector and is growing at the rate of 9% annually. The branded food industry is trying to enter the
Indian retail industry and convert Indian consumers to branded food. Since at present 60% of the
Indian grocery basket consist of non-branded items. Indian retail industry is progressing well and
for this to continue retailers as well as the Indian Government.

“A Study on the Customer preference in Choosing D-mart over Big Bazaar in Bangalore”
11 | P a g e
SOUNDARYA INSTITUTE OF MANAGEMENT AND SCIENCE
1.6 RETAIL IN INDIA: HISTORICAL PERSPECTIVE:
Retailing provides a crucial link between producers and consumers in a modern market
economy. The performance of this sector has a string influence on consumer welfare. Retailers
not only provide consumers with a wide variety of products, but also a wide range of
complementary services (such as assurance of product delivery), which can lead to more
informed choice and greater convenience in shopping. They also provide producers with much
needed information on consumers demand pattern. Productivity and efficiency in retail
operations lowers price level and reduce distortions in the price structure. Through backward and
forward linkage, performance of retailing services affects the performance of interlinked sectors
such as tourism, recreational and cultural services, manufacturing of consumer’s goods ago-
good producing industries etc.
Retailing is the largest private industry in India and second largest employer after agriculture.
The sector contributes to around 10 per cent of GDP and 6-7 per cent of employment. With over
15million retail outlets, India has the highest retail outlet density in the world. This sector
witnessed significant development in the past 15 years- from small-unorganized family-owned
retail formats to organized retailing. Liberalization of the economy rise in per capita income and
growing consumerism has encourage larger business houses and manufactures to set up retail
formats; real estate companies and venture capitalists are investing in retail infrastructure.
Many foreign retailers have also entered the market through different routes such as
wholesale cash-and-carry, local manufacturing, franchising, test marketing, etc. With the growth
in organized retailing, unorganized retailers are fast changing their business models and
implementing new technologies and modern accounting practices to face competition. The
retailing sector in India has undergone significant transformation in the past 10 years.
Traditionally, Indian retail sector has been characterized by the presence of a large number of
small-unorganized retailers. However, in the past decade there has been development of
organized retailing, which has encouraged large private sector player to invest in this sector.
Many foreign players have also entered India through different routes such has test marketing,
franchising, and wholesale cash-and-carry operation. With high GDP growth, increased
consumerism and liberalization of the manufacturing sector, India is being portrayed as an

“A Study on the Customer preference in Choosing D-mart over Big Bazaar in Bangalore”
12 | P a g e
SOUNDARYA INSTITUTE OF MANAGEMENT AND SCIENCE
attractive destination for foreign direct investment (FDI) in retailing. At present this is one of the
few sectors, which has 51% of FDI in multi-brand retail sector & 100% FDI in single brand. On
one hand farmers will benefit from it but on the other hand small traders feel they will not be able
to withstand the competition. In India, the retail sector is the 2nd largest employer’s after
agriculture. In fact, due to wide network of retailing in India it is known as nation of shopkeepers.
There are about 12 million retail outlets spread across India and the country has the highest
density of shops in the world i.e. one shop for every 20 to 25 families or 11 retail shop for every
1000 persons. While, it is only four shops per 1000 in USA. Retailing in India provides
employment to about 7% of total work force in the country and contributes about14% to GDP of
India.
The Global Retail Development Index developed by A.T Kearney has ranked India first among
the top 30 emerging markets in the world. A look at the landscape of most of the cities in India
shoes the rapid phase of change. This changes in reflection of the4 changes in the Indian
consumer’s lifestyle and habits. Goldman Sachs has estimated that the Indian economic growth
could exceed that of chine by year 2017. It is believed that the country had the potential to
deliver the fast growth over the next 50 years. It took 10 years for the first 2500 organized retail
stores to emerge in India; the next 2500 could easily get added in the next 5 years.
1.7 EVOLUTION OF RETAIL IN INDIA
The origins of retail are old as trade itself. Barter was the oldest form of trade. For
centuries, most merchandise was sold in market place or by peddlers. Medieval markets were
dependent on local sources for supplies of perishable food because Journey was far too slow to
allow for long distance transportation. However, customer did travel considerable distance for
specially items. The peddler, who provided people with the basic goods and necessities that they
could not be self-sufficient in, followed one of the earliest forms of retail trade. Even in
prehistoric time, the peddler travelled long distances to bring products to locations, which were in
short supply. They could be termed as early entrepreneurs who saw the opportunity in serving the
needs of the consumers at a profit. Later retailers opened small shops, stocking them with such
produce.
“A Study on the Customer preference in Choosing D-mart over Big Bazaar in Bangalore”
13 | P a g e
SOUNDARYA INSTITUTE OF MANAGEMENT AND SCIENCE
1.8 TRADITIONAL RETAIL FORMAT IN INDIA:
It is important that for centuries now, India has been operating within her unique concept of
retailing. Retailing in its initial period was witnessed at the weekly Hats or Gathering in a market
place where vendors put on displays their produce. Off course this practice is still prevalent in
many towns and cities in India: then the market saw the emergence of the local bandies and his
neighborhood Kirani shop. In fact, these were the common local mummy-daddy or multipurpose
departmental store located in the residential areas such shops stocked goods and multipurpose
utility and were with the vision of providing convenience at the doorstep of the consumer.
1.9 HISTORY OF HYPERMARKET:
At the end of 1950’s and at the beginning of 1960’s, many French retailers came to United
States to listen to Bernardo Trujillo, director of the International Management Systems Seminars.
One of his arguments during his seminars on modern retailing was: “No parking, no business”.
Most of these French retailers came back to France very enthusiastic. A new concept then was
launched in the French market: the hypermarket.
The hypermarket was defined as a retail concept with a floor space over 2,500m2. Every
kind of products was supposed to be sold through self-service techniques even though there are
today exceptions. Despite several bank support refusals, the families Fournier, Badin, and
Deforce, native from Switzerland, decided to open the first hypermarket. It was in the Southern
Paris in 1963 under the name Carrefour. Its size was exactly 2,500m2. This first hypermarket was
immediately a big success.
Ten years after, there were more than 250 hypermarkets in France. Today, there are more
than 1,300 hypermarkets in this country. And the group Carrefour, composed of several chains,
is now the second world largest retailer after Wal-Mart. This public company has more than
10,000 stores in the world toady located in more than 30 countries. Carrefour began its
internationalization process very early in the 1970’s. The group is present of course in Europe but
also in South and Central America, and in North Africa. In Asia, Carrefour is very successful in
China and Thailand but not in Japan where they located only four hypermarkets.

“A Study on the Customer preference in Choosing D-mart over Big Bazaar in Bangalore”
14 | P a g e
SOUNDARYA INSTITUTE OF MANAGEMENT AND SCIENCE
Websitewww.dmartindia.com
Public
Retailing
2002
Mumbai, Maharashtra, India
Supermarket
Avenue Super marts
Type
Industry
Founded
Headquarters
Products
Parent
DMART
1.10 COMPANY PROFILE
COMPANY PROFILE OF DMART
D-Mart is a one-stop supermarket chain that aims to offer customers a wide range of basic home
and personal products under one roof. Each D-Mart store stocks home utility products - including
food, toiletries, beauty products, garments, kitchenware, bed and bath linen, home appliances and
more - available at competitive prices that our customers appreciate. Our core objective is to
offer customers good products at great value.
D-Mart was started by Mr. Radhakrishnan Damani and his family to address the growing needs
of the Indian family. From the launch of its first store in Poway in 2002, D-Mart today has a
well- established presence in 163 locations across Maharashtra, Gujarat, Andhra Pradesh,

“A Study on the Customer preference in Choosing D-mart over Big Bazaar in Bangalore”
15 | P a g e
SOUNDARYA INSTITUTE OF MANAGEMENT AND SCIENCE
Madhya Pradesh, Karnataka, Telangana, Chhattisgarh, NCR, Tamil Nadu, Punjab and Rajasthan.
With our mission to be the lowest priced retailer in the regions we operate, our business
continues to grow with new locations planned in more cities.
The supermarket chain of D-Mart stores is owned and operated by Avenue Super marts Ltd.
(ASL). The company has its headquarters in Mumbai.
The brands D Mart, D Mart Minim ax, D Mart Premier, D Homes, Dutch Harbor, etc. are brands
owned by ASL.
FOUNDERS
D-Mart is owned and operated by Avenue Super marts Ltd. (ASL) – a company founded by Mr.
Radha kishan Damani. Mr. Radhakrishnan Damani is respected in the business world as an astute
investor in the Indian equity market, he has built a company that constantly strives towards
developing a deep understanding of customer needs and satisfying them with the right products.
A firm believer in core business fundamentals and strong ethical values, Mr. Damani has built D-
Mart into an efficient, large and profitable retail chain that is highly respected by customers,
partners and employees alike.
1.10.1 Major events and milestones in relation to the company are:
2001- The Company was incorporated as Avenue Super marts Private Limited
2003- The Company opened its first store in Powai, Mumbai.
2005- The Company entered a scheme of amalgamation for transfer of undertakings of Koop
Consumer Service Private Limited, Amodini Real Estates Private Limited and Shoppers Delight
Private Limited to the Company
2007- The Company opened its first store in Gujarat
2010-The store count of the Company crossed 25 stores the audited consolidated revenue
exceeded Rs. 10,000 million.
2011- The Company opened stores in Andhra Pradesh and Karnataka
2015- The Company opened stores in Madhya Pradesh and Chhattisgarh. The audited
consolidated revenues of the Company exceeded Rs. 50,000 million.
2017- The Company opened stores in the National Capital Region and Daman.
“A Study on the Customer preference in Choosing D-mart over Big Bazaar in Bangalore”
16 | P a g e
SOUNDARYA INSTITUTE OF MANAGEMENT AND SCIENCE
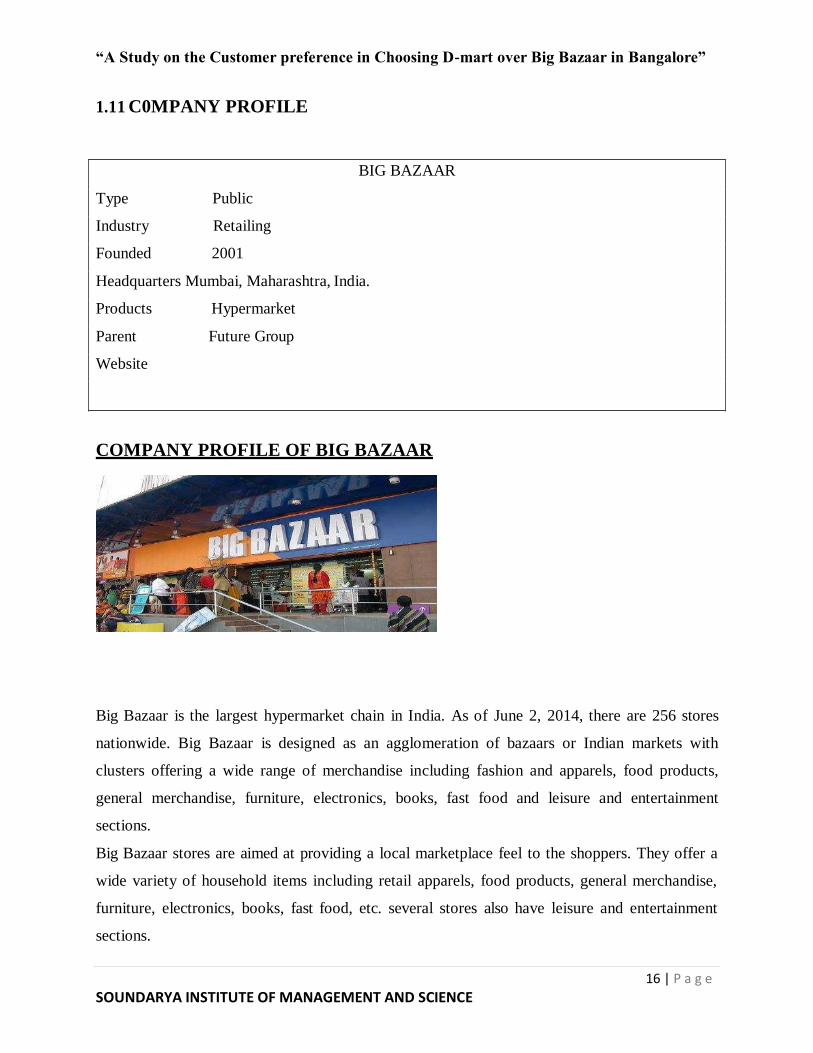
1.11 C0MPANY PROFILE
BIG BAZAAR
Type Public
Industry Retailing
Founded 2001
Headquarters Mumbai, Maharashtra, India.
Products Hypermarket
Parent Future Group
Website
COMPANY PROFILE OF BIG BAZAAR
Big Bazaar is the largest hypermarket chain in India. As of June 2, 2014, there are 256 stores
nationwide. Big Bazaar is designed as an agglomeration of bazaars or Indian markets with
clusters offering a wide range of merchandise including fashion and apparels, food products,
general merchandise, furniture, electronics, books, fast food and leisure and entertainment
sections.
Big Bazaar stores are aimed at providing a local marketplace feel to the shoppers. They offer a
wide variety of household items including retail apparels, food products, general merchandise,
furniture, electronics, books, fast food, etc. several stores also have leisure and entertainment
sections.

“A Study on the Customer preference in Choosing D-mart over Big Bazaar in Bangalore”
17 | P a g e
SOUNDARYA INSTITUTE OF MANAGEMENT AND SCIENCE
Future Bazaar is an online business venture of Future Group, which sells an assortment of
products such as fashion, which includes merchandise for men and women, mobile handsets and
electronics like home theatres, video cameras, digital camera, LCD TVs, kitchen appliances and
many more.
1.11.1Major events and milestones in relation to the company are:
2001- The Company opened its first four stores in Kolkata, Indore, Bangalore, and Hyderabad
within a period of 22 days
2003- The Company made its foray into small towns and cities.
2004- The Company consolidated its position in the Indian retail landscape and registered a
record Rs. 10 million turnovers in a single day on Diwali-eve.
2005- The first Big Bazaar Exchange Offer was launched, which quickly gained popularity
among customers.
2011- Big Bazaar came up with a new logo and a new tag line: “Nayef India Ka Bazaar”.
2012- The Company signed a multi-million-dollar deal with Cognizant Technology Solutions for
the development of an IT infrastructure, encompassing Future Group’s entire network of stores,
warehousing and data centers.

CHAPTER-2
RESEARCH DESIGN AND
METHODOLOGY

“A Study on the Customer preference in Choosing D-mart over Big Bazaar in Bangalore”
18 | P a g e
SOUNDARYA INSTITUTE OF MANAGEMENT AND SCIENCE
RESEARCH DESIGN
A research Design is the document of the study. The Design of a study defines the study
type and sub-type, research question, independent and dependent variables, experimental
design and data collection methods and statistical analysis plan. Research design is the
framework that has been created to seek answers to research questions.
2.1 STATEMENT OF THE PROBLEM
The study is being conducted for the survey of customer preference in D-Mart over Big
Bazaar store based in BENGALURU city. It is required to find out the preferences based
on certain aspects (price, Income, levels selection of products satisfaction level of
customers).
2.2NEED AND IMPORTANCE OF THE STUDY
Now-a-day’s retail stores facing more competition in retailing business. Good store
design increases the visiting of more customers in to the store and increase the store
goodwill, and price also plays major factor to use the customer giving preference and
selection of the store. And as industry research has shown, there is much need to know
the customer expectations, customer preferences and their store choice’s(features) and we
will find out solutions of how D-Mart is getting more customers and getting more profits
and it is also to do more research and hence the study is been done.
2.3OBJECTIVES OF THE STUDY
• To study the customer preferences in choosing D-Mart or Big Bazaar.
• To study the factors that is affecting the choice of customers in choosing a retail store.
• To study the factors that retain the customers who visit D-Mart and Big Bazaar.

“A Study on the Customer preference in Choosing D-mart over Big Bazaar in Bangalore”
19 | P a g e
SOUNDARYA INSTITUTE OF MANAGEMENT AND SCIENCE
2.4SCOPE OF THE STUDY
The research is applicable in customer decision making process for purchasing of
products at D-Martand Big Bazaar. The scope of research also helps in understanding the
preferences of the customers. It would help D-Mart and Big Bazaar in designing their
marketing promoting sales.
2.5RESEARCH METHODOLOGY
TYPEOFRESEARCH
This research is an exploratory research to understand customer preference in choosing
D- Mart or Big Bazaar.
TYPE OF DATA:
The data used in this study involves both primary and secondary data through a structure
questionnaire.
SOURCES OF DATA COLLECTION:
The study is primarily based on primary sources of data.
• Primary Data: It is known as the first-hand information. For a study of this
nature primary data is collected through interviews directly from people involved.
Questionnaires were given to customers and necessary feedback will be collected.
• Secondary Data: The secondary data are the data which collected from
different sources that provides the information. It can be through any media,
statistical information from market research reports internet and reference of few
books etc. for this study secondary data has also been used.
DATA COLLECTION INSTRUMENTS:
A structured questionnaire was used to collect the necessary data. It serves as primary
data to answer the research question and objectives pertaining customers choosing a retail
store according to their expenses and investments. The survey questionnaire consists of
29 questions to the study.

“A Study on the Customer preference in Choosing D-mart over Big Bazaar in Bangalore”
20 | P a g e
SOUNDARYA INSTITUTE OF MANAGEMENT AND SCIENCE
SAMPLE SIZE AND SAMPLING TECHNIQUES:
The target respondents of the study are the customer preference in choosing D-Mart or
Big Bazaar. The conveniences sampling is the sampling used in this study.
STATISTICAL TOOL FOR THE DATA:
For a comparative study between different sets of data tool would be frequency
distribution.
2.6 LIMITATIONS OF THE STUDY:
• The study is only for D-Mart and Big Bazaar confined to a location very small
sample of respondents. Hence the finding cannot be treated as respective of the
entire industry.
• Respondents may give biased answers for the required data. Some of the
respondents did not like to respond.
• In our study we have faced important difficulty by coming to the right conclusion.
2.7 CHAPTER SCHEME:
✓ Introduction
This chapter consists of introduction to customer’s preference in choosing a retail store,
recent development in the industry, industry background and major players in the market.
✓ Review of Literature
This chapter attempts to study the different dimensions of choosing D-mart and
performances satisfaction with the help of reviewing different journals/ articles of
researches. It provides an overview and references on some of the conceptual and
practical undertaken in the areas of customer’s preference in choosing D-mart according
to their financial performance and satisfaction.
✓ Research Design

“A Study on the Customer preference in Choosing D-mart over Big Bazaar in Bangalore”
21 | P a g e
SOUNDARYA INSTITUTE OF MANAGEMENT AND SCIENCE
This chapter deals with Statement of the problems, Need and importance, Objectives,
Scope, Research Methodology, Source, Sample Size and Sampling techniques,
Limitations and the chapter scheme.
✓ Data Analysis and Interpretation
This chapter deals with the various information received from the performance and from
different sources related to the topic is been analyzed, data analysis tools used for the
tabulation analysis and the data so analyzed will be interpreted and conclusion have been
made.
✓ Findings, Suggestion and Conclusion
This chapter deals with the information received and found regarding the topics been
summarized out of the data that has been collected, suggestions for the improvement
have made and conclusion have been drawn.
✓ Bibliography
CHAPTER-3
COMPANY PROFILE

“A Study on the Customer preference in Choosing D-mart over Big Bazaar in Bangalore”
22 | P a g e
SOUNDARYA INSTITUTE OF MANAGEMENT AND SCIENCE
Websitewww.dmartindia.com
Public
Retailing
2002
Mumbai, Maharashtra, India
Supermarket
Avenue Super marts
Type
Industry
Founded
Headquarters
Products
Parent
DMART
3.1 COMPANY PROFILE
COMPANY PROFILE OF DMART
D-Mart is a one-stop supermarket chain that aims to offer customers a wide range of basic home
and personal products under one roof. Each D-Mart store stocks home utility products - including
food, toiletries, beauty products, garments, kitchenware, bed and bath linen, home appliances and
more - available at competitive prices that our customers appreciate. Our core objective is to
offer customers good products at great value.
D-Mart was started by Mr. Radhakrishnan Damani and his family to address the growing needs
of the Indian family. From the launch of its first store in Poway in 2002, D-Mart today has a
well- established presence in 163 locations across Maharashtra, Gujarat, Andhra Pradesh,

“A Study on the Customer preference in Choosing D-mart over Big Bazaar in Bangalore”
23 | P a g e
SOUNDARYA INSTITUTE OF MANAGEMENT AND SCIENCE
Madhya Pradesh, Karnataka, Telangana, Chhattisgarh, NCR, Tamil Nadu, Punjab and Rajasthan.
With our mission to be the lowest priced retailer in the regions we operate, our business
continues to grow with new locations planned in more cities.
The supermarket chain of D-Mart stores is owned and operated by Avenue Super marts Ltd.
(ASL). The company has its headquarters in Mumbai.
The brands D Mart, D Mart Minim ax, D Mart Premier, D Homes, Dutch Harbor, etc. are brands
owned by ASL.
FOUNDERS
D-Mart is owned and operated by Avenue Super marts Ltd. (ASL) – a company founded by Mr.
Radha kishan Damani. Mr. Radhakrishnan Domani is respected in the business world as an
astute investor in the Indian equity market, he has built a company that constantly strives towards
developing a deep understanding of customer needs and satisfying them with the right products.
A firm believer in core business fundamentals and strong ethical values, Mr. Damani has built D-
Mart into an efficient, large and profitable retail chain that is highly respected by customers,
partners and employees alike.
1.1.1 Major events and milestones in relation to the company are:
2001- The Company was incorporated as Avenue Super marts Private Limited
2003- The Company opened its first store in Powai, Mumbai.
2005- The Company entered a scheme of amalgamation for transfer of undertakings of Koop
Consumer Service Private Limited, Amodini Real Estates Private Limited and Shoppers Delight
Private Limited to the Company
2007- The Company opened its first store in Gujarat
2010-The store count of the Company crossed 25 stores the audited consolidated revenue
exceeded Rs. 10,000 million.
2011- The Company opened stores in Andhra Pradesh and Karnataka
2015- The Company opened stores in Madhya Pradesh and Chhattisgarh. The audited
consolidated revenues of the Company exceeded Rs. 50,000 million.
2017- The Company opened stores in the National Capital Region and Daman.

“A Study on the Customer preference in Choosing D-mart over Big Bazaar in Bangalore”
24 | P a g e
SOUNDARYA INSTITUTE OF MANAGEMENT AND SCIENCE
3.2 C0MPANY PROFILE
BIG BAZAAR
Type Public
Industry Retailing
Founded 2001
Headquarters Mumbai, Maharashtra, India.
Products Hypermarket
Parent Future Group
Website
COMPANY PROFILE OF BIG BAZAAR
Big Bazaar is the largest hypermarket chain in India. As of June 2, 2014, there are 256 stores
nationwide. Big Bazaar is designed as an agglomeration of bazaars or Indian markets with
clusters offering a wide range of merchandise including fashion and apparels, food products,
general merchandise, furniture, electronics, books, fast food and leisure and entertainment
sections.
Big Bazaar stores are aimed at providing a local marketplace feel to the shoppers. They offer a
wide variety of household items including retail apparels, food products, general merchandise,
furniture, electronics, books, fast food, etc. several stores also have leisure and entertainment
sections.

“A Study on the Customer preference in Choosing D-mart over Big Bazaar in Bangalore”
25 | P a g e
SOUNDARYA INSTITUTE OF MANAGEMENT AND SCIENCE
Future Bazaar is an online business venture of Future Group, which sells an assortment of
products such as fashion, which includes merchandise for men and women, mobile handsets and
electronics like home theatres, video cameras, digital camera, LCD TVs, kitchen appliances and
many more.
1.2.1Major events and milestones in relation to the company are:
2001- The Company opened its first four stores in Kolkata, Indore, Bangalore, and Hyderabad
within a period of 22 days
2003- The Company made its foray into small towns and cities.
2004- The Company consolidated its position in the Indian retail landscape and registered a
record Rs. 10 million turnovers in a single day on Diwali-eve.
2005- The first Big Bazaar Exchange Offer was launched, which quickly gained popularity
among customers.
2011- Big Bazaar came up with a new logo and a new tag line: “Naye India Ka Bazaar”.
2012- The Company signed a multi-million-dollar deal with Cognizant Technology Solutions for
the development of an IT infrastructure, encompassing Future Group’s entire network of stores,
warehousing and data centers.
REVIEW OF LITERATURE
FDI in Retail Sector, India - Academic Foundation, New Delhi
Arpita Mukherjee, Nitish Patel (2005) This study analyses the current retail
marketplace in India, investigating current and projected growth across different
segments of retail and evaluating the impact of allowing foreign-direct investment (FDI),
currently not allowed in India. India's retail sector is positioned to transform from mostly
small, family-owned businesses to large-scale chain retail, and man international brands
are investigating how to enter India's retail market. The study of the structural, regulatory,
fiscal and other barriers affecting the performance of retail trade suggests reforms for the
removal of such barriers and provides a timeframe in which of the Indian government can
open its retail segment to FDI and the conditions that might be forced on outside retailers
if FDI is permitted.

“A Study on the Customer preference in Choosing D-mart over Big Bazaar in Bangalore”
26 | P a g e
SOUNDARYA INSTITUTE OF MANAGEMENT AND SCIENCE
Research, JULY (2013) S. Pugalanthi an essential part of the current financial situation
in India is the development of sorted out retail. There has been significant development in
sorted out retailing business lately and it is balanced for substantially quicker
development later. Major mechanical houses have entered this territory and have reported
exceptionally driven future extension designs. Transnational enterprises are additionally
trying to come to India and set up retail chains as a team with huge Indian organizations.
Be that as it may, suppositions are separated on the effect of the development of
composed retail in the nation. This paper endeavors at giving a retailing situation in India
and degree for future research around there.
Customer Service with Reference to Big Bazaar - International Journal of Social
and Economic Research, Shirkhanloo Shima (2013) the study is based on a survey
conducted on customers of a hyper market named Big Bazaar. It is a type of market where
various kinds of product are available under one roof. The study was conducted for
determining the customers buying behavior and their satisfaction level at Big Bazaar. The
study finds out the status of Big Bazaar and determines where its and since the current
market. It will help in estimating the customer’s future needs, wants and demands.
Youth Customer Perception of Brand Big Bazaar: An Empirical Investigation –
Research Analysis and Evaluation. Ankita Srivastava and Sanjay Shankar Mishra
(2013) Big Bazaar of India needs to focus more on its responsiveness attribute to improve
the satisfaction level of youth customers, whereas the gap is minimum least for the
tangibility shows better emphasis on this factor as compared to the. Big Bazaar should
emphasize on improving its rating as this is a very important parameter for performance.
RATER dimensions. It shows that Big Bazaar is not focusing equal on every factor which
is important for customers as suggested by the high difference in scores on certain
dimensions. It shows that Big Bazaar needs to make substantial effort like training,
motivation etc. to improve their score on responsiveness dimension as it is an important
criterion for customer service.
Retail Industry Indian – Its Growth, Challenges and Opportunities M.
Dhanabhakyam and. Shanthi (2014) - This investigation gives data about the

“A Study on the Customer preference in Choosing D-mart over Big Bazaar in Bangalore”
27 | P a g e
SOUNDARYA INSTITUTE OF MANAGEMENT AND SCIENCE
development of retailing industry in India. It inspects the developing mindfulness and
brand cognizance among individuals crosswise over various financial classes in India and
how the urban and semi-urban retail showcases are seeing critical development. It
explores the role of the Government of Indian the industries growth and the need for
further reforms. In India the huge white-collar class and its relatively undiscovered retail
industry are the key appealing powers for worldwide retail man months needing to go
into more up to date advertise, which thus will enable the India. To retail Industry to
become speeder. The investigation incorporates development of retail part in India,
methodologies, quality and chances of retail locations, retail design in India, late patterns,
and openings and difficulties. It likewise finishes up with the reasonable effect of the
section of worldwide players into the Indian retailing industry. It additionally features the
difficulties Looked by the business in close future.
A study on customer relationship management (CRM) with reference to Big Bazaar
in Bilaspur City - International Journal of Management, IT and Engineering,
Pandey Sanjaya Nd Henry Amit Sieve (2013) This study entails the strategy that Big
Bazaar follows in context with CRM practices. The Big Bazaar first tries to determine
likely prospects i.e. the people who have a strong potential interest in the product and
ability to pay for it. The Big Bazaar hopes to convert many of its qualified prospect into
first time customers and then to convert those first-time customers into repeat customers.
Then the Big Bazaar tries to convert these repeat customers into clients – they are those
people who buy only from the Big Bazaar in the relevant product categories. The next
challenge for the Big Bazaar is to convert these clients into advocates. Advocates are
those clients who praise the Big Bazaar and encourage others to buy from it. The ultimate
challenge is to convert these advocates into partners where the customers and the clients
work actively together to discover ways of getting mutual benefit. Thus, in CRM the key
performance figure is not just current market share but share of life time value by
converting customers into partners. In CRM the Big Bazaar identified that small
percentage of key account holders whose contribution to the Big Bazaar revenues is high.
So, from this point of view, CRM is also known as key account management.
A Study on Consumer’s Behavior Towards Retail Outlet with Reference to Big
Bazaar- Excel International Journal of Multidisciplinary Management Studies,

“A Study on the Customer preference in Choosing D-mart over Big Bazaar in Bangalore”
28 | P a g e
SOUNDARYA INSTITUTE OF MANAGEMENT AND SCIENCE
S. Poongavanam, V. Chandrasegarn, Sundar Arumugham and Siva Sankar (2013)
In meeting client’s necessities and estimating consumer loyalty's records, client
observation ought to be unquestionably a key thought. Qualified services in the operation
execution, technical management and business development are necessary. It is more
important to understand customer expectations and make efforts to exceed their
expectations. In customer satisfaction management, the biggest challenge is customer
perception management, or customer perception satisfaction. The major characteristics of
service is intangible; hence the core value of services is not like a physical product but the
spiritual experience and perception of customers. The final aim and ideal effect of the
service provisioning is to have customers perceive and enjoy the service. Such perception
is both at psychological and behavior levels, and it is the contents of high quality in the
modern society. Customers are seeking for materials deliverables as well as perceptive
enjoyment when purchasing a service product. Since perceptive enjoyment is a vital
service objective, one of the key service management objectives shall be meeting
customer’s perceptive enjoyment.
An Analysis of Consumer Perception towards Retail Brands in Big Bazaar, Chennai
-
Indian Journal of Applied Research M. Raja and M. I. Saifil Ali (2014) Retailing
Occupies a pre – eminent position in all economies. Retailing incorporates each one of
those exercises that include the offer of products and enterprises to extreme customers for
individual, family and family utilize. Changes in Indian retailing have been constant, but
the pace of development is fast over past few years. One such change is the emergence of
private labels on the shelves of retailers which becomes the integral part of retailing.
Organized retail is a big revolution to Indian economy, which not only contribute national
brands and private label brands. So, it is necessary to understand the customer perception
towards private label brands in a retail store. This paper throws lights on the factors
which influence the customer perception towards private labels and to analyze the
customer expectation towards private labels using Big Bazaar as a platform.
Perception of Consumers towards Shopping Mall -A Case Study with Reference to
Aligarh and Mathura City – VSRD International Journal of Business and
Management Research Satendra Bhardwaj, Rajeev Sharma and Jyoti Agarwal
“A Study on the Customer preference in Choosing D-mart over Big Bazaar in Bangalore”
29 | P a g e
SOUNDARYA INSTITUTE OF MANAGEMENT AND SCIENCE
(2011) In India there have been a great successful brand both national as well as foreign
brands and again it has been realized that brands are sustaining power to stay in the
competitions. If we defined the customer satisfaction we can say “a qualitative measure
of performance as defined by customer, which meet their basic requirements and
standard.” Customer satisfaction is defined as “measure or determination that a product or
services meet a customer’s expectation, considering requirement of both quality and
service.”
“Profile and Perception of Retail Consumers – An Empirical Study in Palakkad
District” G. Haritharan (2008) According to are port compiled, there are 5million retail
outlets all sizes and styles. The retail market is likely to increase by 200 per cent
annually. This means that India per capita retailing space is about 5 square feet compared
to 16 square feet in 1999 in Mumbai. Next a structural questionnaire was used to collect
primary data. Convenient random sample of 120 respondents (40 from Big Bazaar, 40
from Spencer’s and 40 from Reliance Fresh) were asked to fill the questionnaire
consisting of both open ended and closed questions. Respondents were randomly
intercepted in the shopping malls and information elicited from the co-operative one’s
five point likes scale was used to record and measure the satisfaction level.
“A Study on the Challenges and Opportunities Faced by Organized Retail Players
in Bangalore”, Mihirdasha, has discussed that even though Indian retailing is hailed as
a In developed and other India only in the late 1990’s, and there are a number of
challenge factors huge sector in India, in reality, it is not so rosy when compared to the
retail scenario in developing countries. Indian retail is still in the infancy stage, with the
retail revolution gaining momentum which needs to be overcome 43 and several
opportunity factors which need to be leverage dup on, if organized retailing is to flourish
the way it ideally should. This investigation spins around the chances and difficulties
looked by sorted out retail players in Bangalore.
“A Study on the Changing Consumer Perceptions and Preferences towards
Organized Retailing from Unorganized Retailing”. M. Guruswamy and N. Prabha
has revealed the facts regarding the most prioritized attributes of the retail stores which
attract the consumers towards them. The research has revealed that the consumers had
opined that traditional stores are good on the parameters of quality and convenience only

“A Study on the Customer preference in Choosing D-mart over Big Bazaar in Bangalore”
30 | P a g e
SOUNDARYA INSTITUTE OF MANAGEMENT AND SCIENCE
where organized formats like upper markets, Departmental Stores and so on are seen to
be great as far as quality, assortment, consistency, comfort, administration and
cleanliness. Cost is the main factor where client see sorted out retailers as expensive. The
investigation demonstrates that clients are especially on edge towards sorted out retailing
and they expect assortment as an essential trait from retailers. It likewise demonstrates
that clients anticipate that quality next will assortment as the essential components to
shop in the sorted-out arrangements.
The consumption pattern of Indian consumers: Choice between traditional and
organized retail Mridula Mishra in her study tried to explore the way organized retail
has dramatically changed not only the Indian traditional retailing structure but also the
consumption behavior. The results of the study showed that for consumers, the shopping
mall or variant of organized retail format is the preferred type of retail store, due to
convenience and variety.
Models of Consumer Behavior in Mall Culture – Indian Journal of Marketing
Panandikar and Rajiv Gupta asserted that the malls have revolutionized the concept of
Retailing and they pose a serious competition to their conventional counterparts in terms
of service, ambience, price, access to the brands, etc. and have created a niche in the
minds of consumers through a perception of innovation, style and status.
Lumpkin (1984) and Schiff Man et al (2001): They hovel so studied purchase behavior
reached the conclusion that store are patronized. Further the outcome of their studies
reflects that regarding activities, interests and opinions (Ala) in the context of various
products. They respondents were very conscious about price and quality/guarantee of the
products Kai Kristensen, Hans JornJhul & OstergaardPeder (2001): Customer
satisfaction and customer loyalty were becoming increasingly important factors in
modern retailing a market characterized by slow growth and intense competition. In this
paper researcher have explained that European retailing was changing rapidly, developers
were concentrating on increase in store size and ownership. Store chains were
increasingly being branded to increase differentiation between chains, subsequently
increasing store loyalty. Private labels have obtained a more dominant role within the last
few years

CHAPTER-4
DATA ANALYSIS AND
INTERPRETATION

“A Study on the Customer preference in Choosing D-mart over Big Bazaar in Bangalore”
31 | P a g e
SOUNDARYA INSTITUTE OF MANAGEMENT AND SCIENCE
Table 4.1: Showing the Gender of Respondents.
Particulars No of Respondents Percentage (%)
Male 56 37.3
Female 94 62.7
Total 150 100
Analysis: The above table shows that 37.3% (56) of the respondents were males while 62.7%
(94) of them were females.

“A Study on the Customer preference in Choosing D-mart over Big Bazaar in Bangalore”
32 | P a g e
SOUNDARYA INSTITUTE OF MANAGEMENT AND SCIENCE
Male Female
50
40
30
20
10
0
56 60
100 94
90
80
70
Chart 4.1: Representing the Gender of respondents
Interpretation: The above chart shows the gender of the respondents and female respondents
are more interested in filling the questionnaire and shopping.
“A Study on the Customer preference in Choosing D-mart over Big Bazaar in Bangalore”
33 | P a g e
SOUNDARYA INSTITUTE OF MANAGEMENT AND SCIENCE
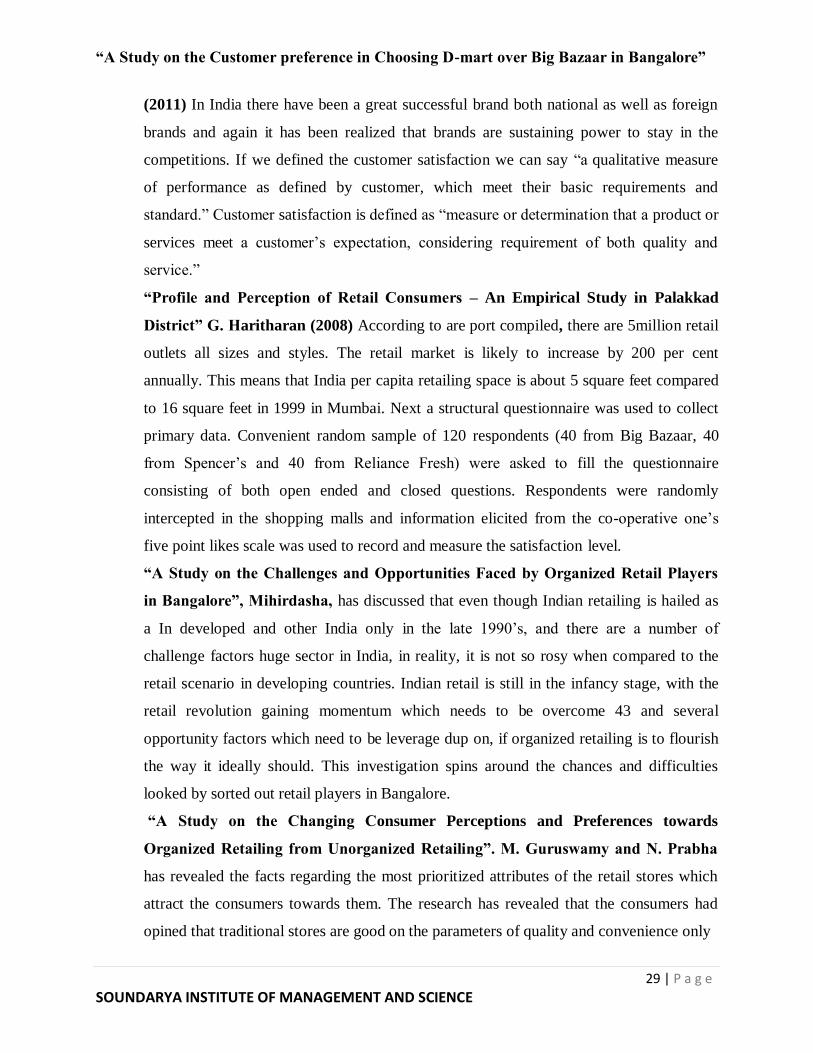
Table 4.2: Showing the Age of Respondents
Particulars Respondents Percentages
under25 132 88
25-35 16 10.7
35-45 2 1.3
TOTAL 150 100
Analysis: The above table shows that 88% (132) of the respondents belonged to the age group
of less than 25 years, 10.7% (16) of the respondents belonged to the age group of 25-35 years
and 1.3% (2) belonged to the age group of 35-45 years and above.

“A Study on the Customer preference in Choosing D-mart over Big Bazaar in Bangalore”
34 | P a g e
SOUNDARYA INSTITUTE OF MANAGEMENT AND SCIENCE
Count of Age
140 132 120 100
80
60
40
20 16
2
0
25-35 35-45 under 25
Chart 4.2: Representing Age group of respondents
Interpretation: It is interpreted that majority of the respondents are aged under 25, which tells
that they are more willing to purchase.

“A Study on the Customer preference in Choosing D-mart over Big Bazaar in Bangalore”
35 | P a g e
SOUNDARYA INSTITUTE OF MANAGEMENT AND SCIENCE
Table 4.3 Showing the Occupation of Respondents.
Particulars No of Respondents Percentage (%)
Student 112 74.7
Self-employed 9 6
Professional 20 13.3
Service 3 2
Housewife 6 4
Total 150 100
Analysis: The above table shows that74.7% (112) respondents are students and 6% (9) of them
are self-employed and 13.3% (20) of the respondents are professional and 2% (3) of them are in
service and 4% (6) of the respondents are housewife.

“A Study on the Customer preference in Choosing D-mart over Big Bazaar in Bangalore”
36 | P a g e
SOUNDARYA INSTITUTE OF MANAGEMENT AND SCIENCE
Student Service Professional Self-employed Housewife
0
3 9 6
Count of Occupation
120 112
100
80
60
40
20 20
Chart 4.3: Chart showing the occupation of respondents
Interpretation: It is interpreted that most of the respondents are students and they are willing to
purchase.
“A Study on the Customer preference in Choosing D-mart over Big Bazaar in Bangalore”
37 | P a g e
SOUNDARYA INSTITUTE OF MANAGEMENT AND SCIENCE
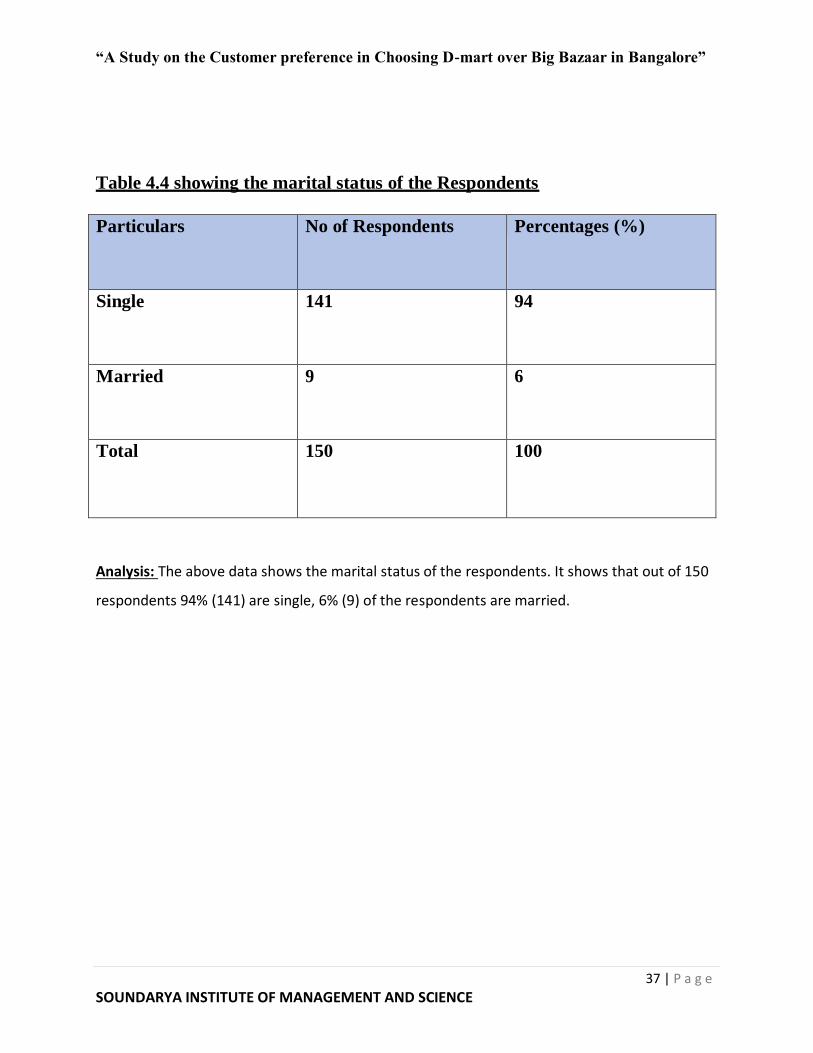
Table 4.4 showing the marital status of the Respondents
Particulars No of Respondents Percentages (%)
Single 141 94
Married 9 6
Total 150 100
Analysis: The above data shows the marital status of the respondents. It shows that out of 150
respondents 94% (141) are single, 6% (9) of the respondents are married.

“A Study on the Customer preference in Choosing D-mart over Big Bazaar in Bangalore”
38 | P a g e
SOUNDARYA INSTITUTE OF MANAGEMENT AND SCIENCE
160
141 140
120
100
80
60
40
20
0
Married Single
Chart No. 4.4: Chart showing the marital status of the respondents
9
Interpretation: It is interpreted that most of the respondents are single and are interested in
purchasing the products.

“A Study on the Customer preference in Choosing D-mart over Big Bazaar in Bangalore”
39 | P a g e
SOUNDARYA INSTITUTE OF MANAGEMENT AND SCIENCE
Table 4. 5 Showing the monthly income of Respondents
Particulars Respondents Percentage (%)
Below 10000 97 64.7
Rs. 10000-20000 26 17.3
Rs. 20000-40000 20 13.3
Rs. 40000 and above 7 4.7
Total 150 100
Analysis: The above data shows the monthly income of the respondents. 64.7% (97) earn less
than Rs 10000 per month, 17.3% (26) of them earn Rs 10000-20000 per month and 13.3% (20)
of the respondents earn Rs 20000-40000 per month and rest of them earn more than 40000 a
month.

“A Study on the Customer preference in Choosing D-mart over Big Bazaar in Bangalore”
40 | P a g e
SOUNDARYA INSTITUTE OF MANAGEMENT AND SCIENCE
120 100 80 60 40 20 0
97 Below 10000
26 Rs 10000-20000
20 Rs 20000-40000
7 Rs 40000 and above
Count of Monthly income
Chart 4.5: Chart showing the monthly income of the respondents.
Interpretation: The above chart shows that most of the the respondent’s income is below 10000
and 7 respondents income level is 40000 and above.

“A Study on the Customer preference in Choosing D-mart over Big Bazaar in Bangalore”
41 | P a g e
SOUNDARYA INSTITUTE OF MANAGEMENT AND SCIENCE
Table 4.6 Showing the visit to Big Bazaar
Particulars Respondents Percentage (%)
Once in a week 10 6.7
Once in 15 days 17 11.3
Once in a month 37 24.7
Once in 2-3 months 86 57.3
Total 150 100
Analysis: The above data shows the respondents visit towards big bazaar. 6.7% (10) of the
respondents visit once in a week and 11.3% (17) of them visit once in 15 days and 24.7% (37) of
the respondents visit once in a month and 57.3% (86) of the respondents visit once in 2-3 months
to the store.

“A Study on the Customer preference in Choosing D-mart over Big Bazaar in Bangalore”
42 | P a g e
SOUNDARYA INSTITUTE OF MANAGEMENT AND SCIENCE
Count of How frequently do you visit Big Bazaar?
Once in a week 10
Once in a month 37
Once in 2-3 months 86
Once in 15 days 17
0 20 40 60 80 100
Chart 4.6: Chart showing the visit to big bazaar.
Interpretation: From the above analysis, it is interpreted that majority of the respondents visit
Big Bazaar once in 2-3 months and 10 respondents visit once in a week.
“A Study on the Customer preference in Choosing D-mart over Big Bazaar in Bangalore”
43 | P a g e
SOUNDARYA INSTITUTE OF MANAGEMENT AND SCIENCE
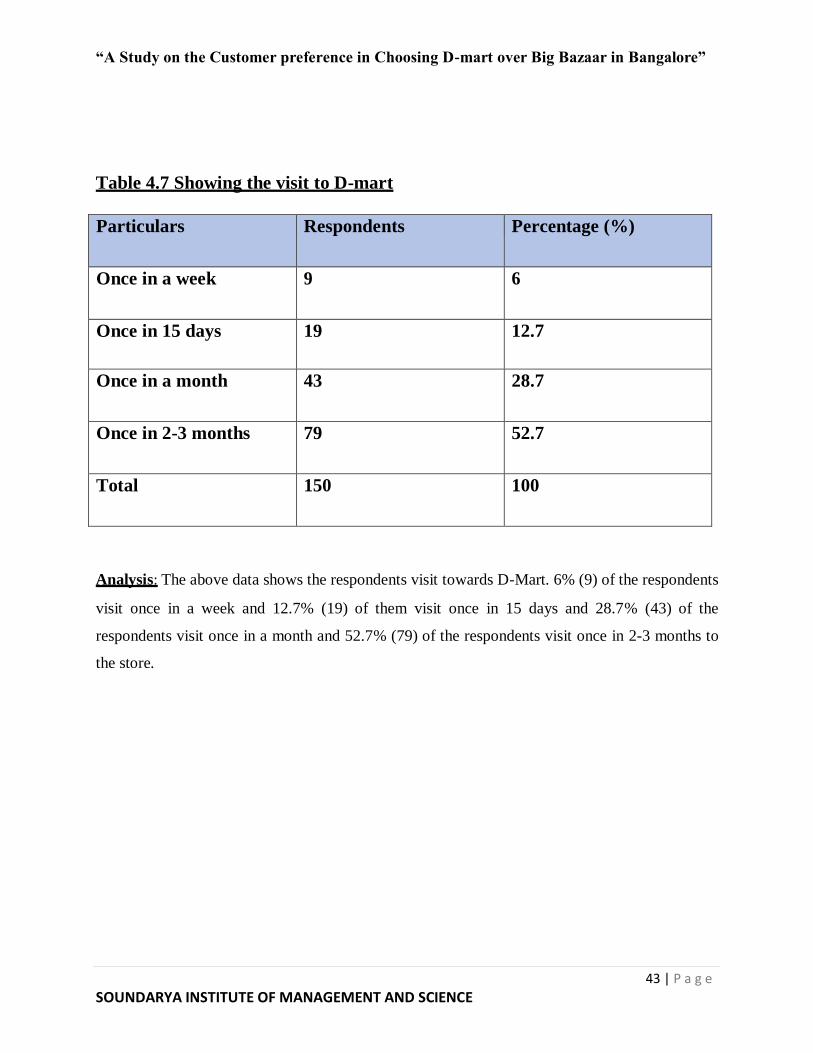
Table 4.7 Showing the visit to D-mart
Particulars Respondents Percentage (%)
Once in a week 9 6
Once in 15 days 19 12.7
Once in a month 43 28.7
Once in 2-3 months 79 52.7
Total 150 100
Analysis: The above data shows the respondents visit towards D-Mart. 6% (9) of the respondents
visit once in a week and 12.7% (19) of them visit once in 15 days and 28.7% (43) of the
respondents visit once in a month and 52.7% (79) of the respondents visit once in 2-3 months to
the store.
“A Study on the Customer preference in Choosing D-mart over Big Bazaar in Bangalore”
44 | P a g e
SOUNDARYA INSTITUTE OF MANAGEMENT AND SCIENCE
Count of How frequently do you visit D-Mart?
Once in a week 9
Once in a month 43
Once in 2-3 months 79
Once in 15 days 19
0 10 20 30 40 50 60 70 80 90
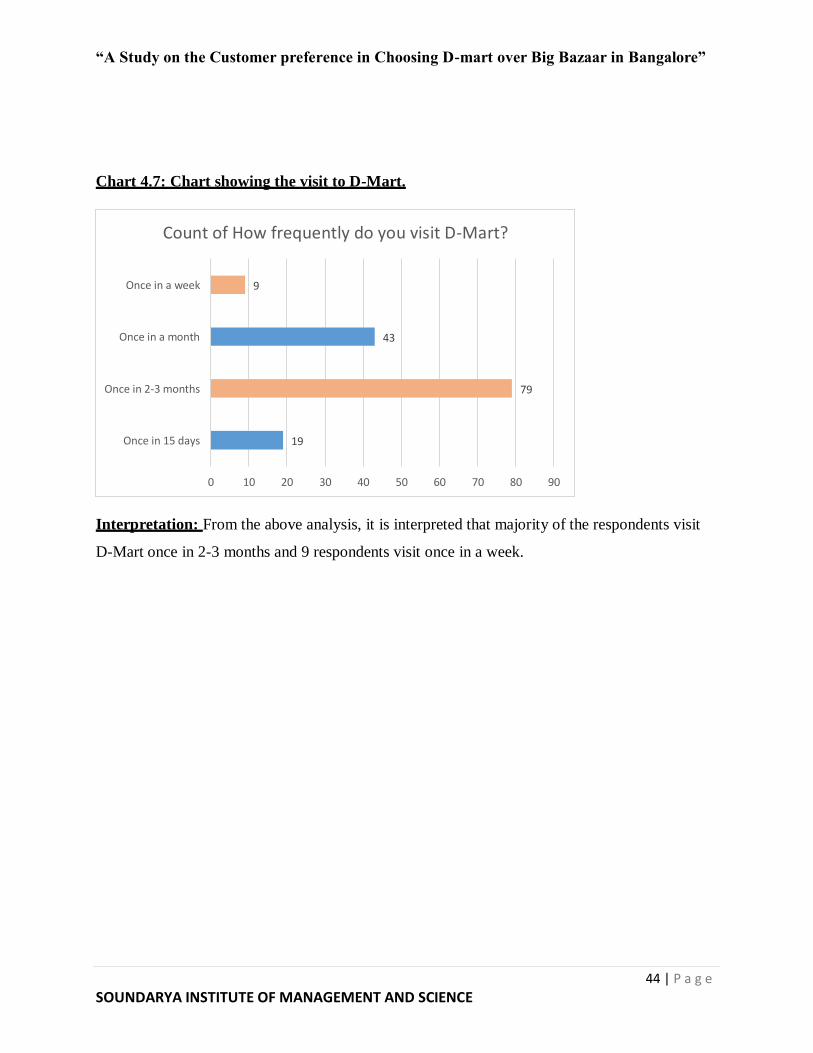
Chart 4.7: Chart showing the visit to D-Mart.
Interpretation: From the above analysis, it is interpreted that majority of the respondents visit
D-Mart once in 2-3 months and 9 respondents visit once in a week.

“A Study on the Customer preference in Choosing D-mart over Big Bazaar in Bangalore”
45 | P a g e
SOUNDARYA INSTITUTE OF MANAGEMENT AND SCIENCE
Table4.8 Showing what people purchase at Big Bazaar.
Particulars Respondents Percentage (%)
Groceries 80 53.3
Electronic Goods 9 6
Apparels 45 30
Others 16 10.7
Total 150 100
Analysis: The above data shows what the respondents purchase at big bazaar. 53.3% (80) of the
respondents purchase groceries, 6% (9) of them purchase electronic goods and 30% (45) of the
respondents purchase apparels and the rest of them 10.7% (16) purchase other needs.

“A Study on the Customer preference in Choosing D-mart over Big Bazaar in Bangalore”
46 | P a g e
SOUNDARYA INSTITUTE OF MANAGEMENT AND SCIENCE
Respondents
16
45 80
9
Groceries Electronic Goods Apparels Others
Chart 4.8: Chart showing the goods purchased at big bazaar.
Interpretation: From the above analysis it is interpreted that majority of the respondents
purchase groceries more than electronics goods and apparels in Big Bazaar.

“A Study on the Customer preference in Choosing D-mart over Big Bazaar in Bangalore”
47 | P a g e
SOUNDARYA INSTITUTE OF MANAGEMENT AND SCIENCE
Table 4.9Showing what people purchase at D-Mart?
Particulars Respondents Percentage (%)
Groceries 99 66
Electronic Goods 15 10
Apparels 24 16
Others 12 8
Total 150 100
Analysis: The above data shows what the respondents purchase at big bazaar. 66% (99) of the
respondents purchase groceries, 10% (15) of them purchase electronic goods and 16% (24) of the
respondents purchase apparels and the rest of them 8% (12) purchase other needs.

“A Study on the Customer preference in Choosing D-mart over Big Bazaar in Bangalore”
48 | P a g e
SOUNDARYA INSTITUTE OF MANAGEMENT AND SCIENCE
Respondents
12
24
15
99
Groceries Electronic Goods Apparels Others
Chart 4.9: Chart showing the goods purchased at D-Mart.
Interpretation: From the above analysis it is interpreted that majority of the respondents
purchase groceries more than electronics goods and apparels in D-Mart.

“A Study on the Customer preference in Choosing D-mart over Big Bazaar in Bangalore”
49 | P a g e
SOUNDARYA INSTITUTE OF MANAGEMENT AND SCIENCE
Table 4.10 showing the source how people came to know about Big-Bazaar
and D-Mart?
Particulars Respondents Percentage (%)
Newspaper 24 16
F.M radio 5 3.3
Social Media 26 17.3
Friends/others 95 63.3
Total 150 100
Analysis: The above table shows the source of how people came to know about D-Mart and big
bazaar. Out of 150 respondents 16% (24) of them knew it by newspapers, 3.3% (5) of them
knew by F.M Radio and 17.3% (26) of the respondents found in social media and 63.3% (95) of
the respondents were aware by friends and others.

“A Study on the Customer preference in Choosing D-mart over Big Bazaar in Bangalore”
50 | P a g e
SOUNDARYA INSTITUTE OF MANAGEMENT AND SCIENCE
100
80
60
40
20
0
Count of Which source made you to buy product from Big-Bazaar and D-Mart?
95
24 26
5
F.M radio Friends/others News paper Social media
Chart 4.10: Chart showing the source of people know the stores.
Interpretation: From the above analysis it is interpreted that, majority of the respondents knew
Big Bazaar and D-Mart by Friends/others were as 5 respondents knew by F.M radio and 26
respondents by Social media.

“A Study on the Customer preference in Choosing D-mart over Big Bazaar in Bangalore”
51 | P a g e
SOUNDARYA INSTITUTE OF MANAGEMENT AND SCIENCE
Table 4.11Showing the responses why people purchase at Big Bazaar.
Particulars Respondents Percentage (%)
Low price 36 24
Better quality 51 34
Variety of products 34 22.7
Various brands 29 19.3
Total 150 100
Analysis: The above data shows why people purchase in big bazaar. 24% (36) of the respondents
purchase for its low price, 34% (51) of the respondents purchase for the availability of better
quality and 22.7% (34) of them purchase for the variety of products and 19.3% (29) of the
respondents purchase for the availability of variety of brands.

“A Study on the Customer preference in Choosing D-mart over Big Bazaar in Bangalore”
52 | P a g e
SOUNDARYA INSTITUTE OF MANAGEMENT AND SCIENCE
60 50 40 30 20 10 0
51 Better Quality
36 Low price
34 Variety of products
29 Various Brands
Count of Why do you make purchase of products from Big Bazaar?
Chart No. 4.11: Chart showing the responses of why people purchase at big bazaar.
Interpretation: From the above analysis it is interpreted that majority of the respondents
purchase for better quality products in Big Bazaar.

“A Study on the Customer preference in Choosing D-mart over Big Bazaar in Bangalore”
53 | P a g e
SOUNDARYA INSTITUTE OF MANAGEMENT AND SCIENCE
Table 4.12Showing the responses why people purchase at D-Mart.
Particulars Respondents Percentage (%)
Low price 63 42
Better quality 39 26
Variety of products 33 22
Various brands 15 10
Total 150 100
Analysis: The above data shows why people purchase in big bazaar. 42% (63) of the respondents
purchase for its low price, 26% (39) of the respondents purchase for the availability of better
quality and 22% (33) of them purchase for the variety of products and 10% (15) of the
respondents purchase for the availability of variety of brands.

“A Study on the Customer preference in Choosing D-mart over Big Bazaar in Bangalore”
54 | P a g e
SOUNDARYA INSTITUTE OF MANAGEMENT AND SCIENCE
Respondents
Various brands 15
Variety of products 33
Better quality 39
Low price 63
0 10 20 30 40 50 60 70
Chart 4.12: Chart showing the responses of why people purchase at D-Mart.
Interpretation: From the above analysis it is interpreted that majority of the respondents
purchase for the low price of the products at D-Mart.
“A Study on the Customer preference in Choosing D-mart over Big Bazaar in Bangalore”
55 | P a g e
SOUNDARYA INSTITUTE OF MANAGEMENT AND SCIENCE
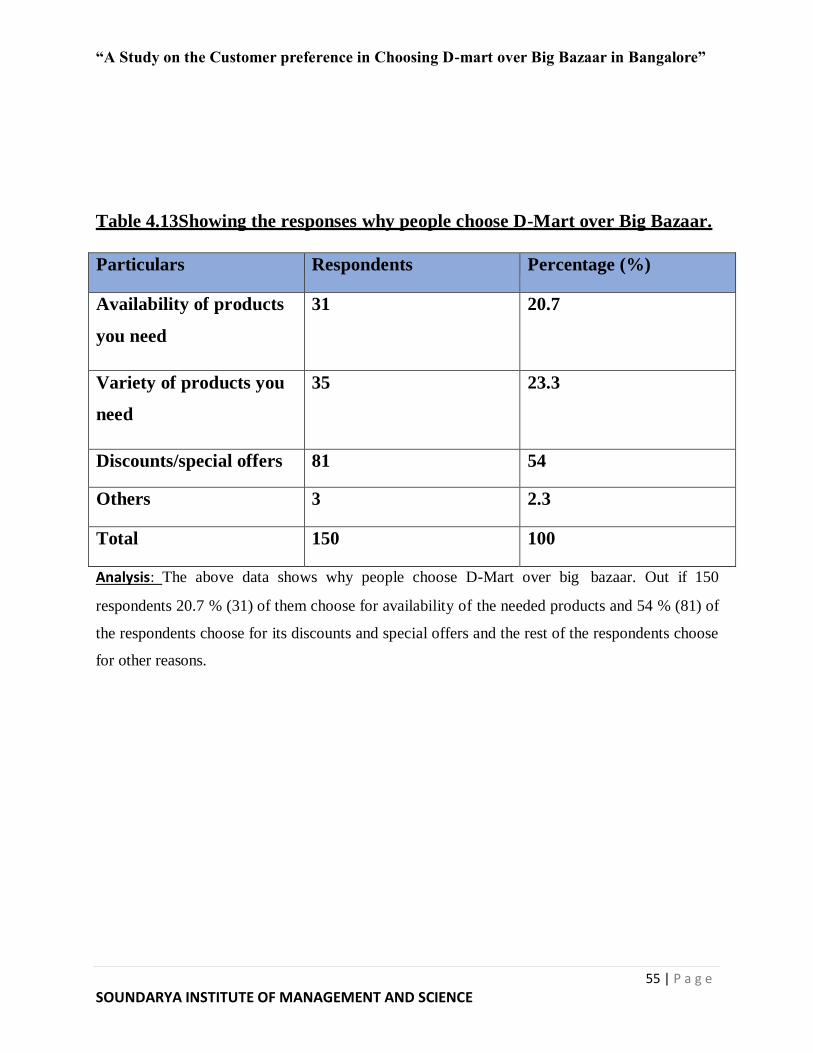
Table 4.13Showing the responses why people choose D-Mart over Big Bazaar.
Particulars Respondents Percentage (%)
Availability of products
you need
31 20.7
Variety of products you
need
35 23.3
Discounts/special offers 81 54
Others 3 2.3
Total 150 100
Analysis: The above data shows why people choose D-Mart over big bazaar. Out if 150
respondents 20.7 % (31) of them choose for availability of the needed products and 54 % (81) of
the respondents choose for its discounts and special offers and the rest of the respondents choose
for other reasons.

“A Study on the Customer preference in Choosing D-mart over Big Bazaar in Bangalore”
56 | P a g e
SOUNDARYA INSTITUTE OF MANAGEMENT AND SCIENCE
Availability of products you need Variety of products you need
Discounts/special offers Others
35 81
31 3
Respondents
Chart 4.13: Chart showing why people choose D-Mart over Big Bazaar.
Interpretation: From the above analysis it is interpreted that majority of the respondents choose
D-Mart for the discounts/ special offers which are offered, and 35 respondents purchase for
variety of products which they need.

“A Study on the Customer preference in Choosing D-mart over Big Bazaar in Bangalore”
57 | P a g e
SOUNDARYA INSTITUTE OF MANAGEMENT AND SCIENCE
Table 4.14Showing the responses if big bazaar is intimating the customers of
the discounts and prices.
Particulars Respondents Percentage (%)
YES, cleanly intimating 79 52.7
NO clarity intimating 62 41.3
NO intimation at all 9 6
Total 150 100
Analysis: The above data shows the responses of the store are intimating the customers of the
discounts and prices in big bazaar. 52.7 % (79) of the respondents said YES, its cleanly
intimating, 41.3 % (62) of the respondents said there is NO clarity intimation and 6% (9) of them
said there is NO intimation at ll.

“A Study on the Customer preference in Choosing D-mart over Big Bazaar in Bangalore”
58 | P a g e
SOUNDARYA INSTITUTE OF MANAGEMENT AND SCIENCE
NO intimation at all NO clarity intimating YES, cleanly intimating
79 62
9
Chart 4.14: Chart showing if big bazaar is intimating the customers.
Interpretation: From the above analysis it is interpreted that majority of the respondents (79)
agree that Big Bazaar intimates cleanly about discounts and prices and (9) respondents responded
that there is no intimation at all.

“A Study on the Customer preference in Choosing D-mart over Big Bazaar in Bangalore”
59 | P a g e
SOUNDARYA INSTITUTE OF MANAGEMENT AND SCIENCE
Table 4.15Showing the responses if D-Mart is intimating the customers of the
discounts and prices.
Particulars Respondents Percentage (%)
YES, cleanly intimating 90 60
NO clarity intimating 46 30.7
NO intimation at all 14 9.3
Total 150 100
Analysis The above data shows the response of the store is intimating the customers of the
discounts and prices in big bazaar. 60% (90) of the respondents said YES, its cleanly intimating,
30.7% (46) of the respondents said there is NO clarity intimation and 9.3% (14) of them said
there is NO intimation at ll.

“A Study on the Customer preference in Choosing D-mart over Big Bazaar in Bangalore”
60 | P a g e
SOUNDARYA INSTITUTE OF MANAGEMENT AND SCIENCE
NO intimation at all NO clarity intimating YES, cleanly intimating
90
46
14
Respondents
Chart 4.15: Chart showing if D-Mart is intimating the customers.
Interpretation: From the above analysis it is interpreted that majority of the respondents (90)
agree that D-Mart intimates cleanly about discounts and prices and (14) respondents responded
that there is no intimation at all.

“A Study on the Customer preference in Choosing D-mart over Big Bazaar in Bangalore”
61 | P a g e
SOUNDARYA INSTITUTE OF MANAGEMENT AND SCIENCE
Table4.16Showing the responses of how effective the customer service
department at big bazaar.
Particulars Respondents Percentage (%)
Fast service 73 48.7
Slow service 40 26.7
Not enough service 28 18.7
Not good service 8 5.3
Moderate service 1 0.7
Total 150 100
Analysis: The above data shows how effective the customer service department at big bazaar.
48.7% (73) of the respondents said that there is fast service and 26.7% (40) of them said it is
slow service and 18.7% (28) of them said that the service is not enough and 5.3% (8) of them
said the service is not good and 0.7% (1) person responded of moderate service.
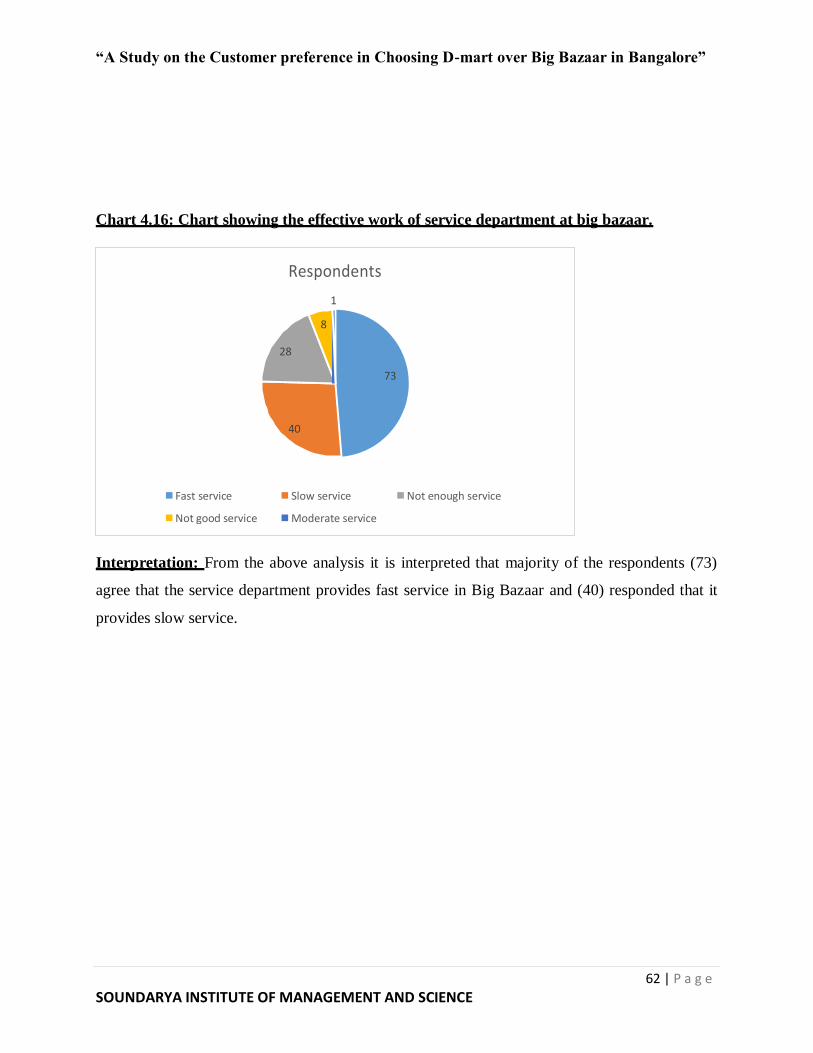
“A Study on the Customer preference in Choosing D-mart over Big Bazaar in Bangalore”
62 | P a g e
SOUNDARYA INSTITUTE OF MANAGEMENT AND SCIENCE
Not good service Moderate service
Not enough service Slow service Fast service
40
73
Respondents
1
8
28
Chart 4.16: Chart showing the effective work of service department at big bazaar.
Interpretation: From the above analysis it is interpreted that majority of the respondents (73)
agree that the service department provides fast service in Big Bazaar and (40) responded that it
provides slow service.

“A Study on the Customer preference in Choosing D-mart over Big Bazaar in Bangalore”
63 | P a g e
SOUNDARYA INSTITUTE OF MANAGEMENT AND SCIENCE
Table 4.17Showing the responses of how effective the customer service
department at D-Mart.
Particulars Respondents Percentage (%)
Fast service 89 59.3
Slow service 36 24
Not enough service 15 10
Not good service 10 6.7
Total 150 100
Analysis: The above data shows how effective the customer service department at big bazaar.
59.3 % (89) of the respondents said that there is fast service and 24 % (36) of them said it is slow
service and 10 % (15) of them said that the service is not enough and 6.7 % (10) of them said the
service is not good.

“A Study on the Customer preference in Choosing D-mart over Big Bazaar in Bangalore”
64 | P a g e
SOUNDARYA INSTITUTE OF MANAGEMENT AND SCIENCE
Not good service Not enough service Slow service Fast service
89 36
15
10
Respondents
Chart 4.17: Chart showing the effective work in service department at D-Mart.
Interpretation: From the above analysis it is interpreted that majority of the respondents (89)
agree that the service department provides fast service in D-Mart and (36) responded that it
provides slow service.

“A Study on the Customer preference in Choosing D-mart over Big Bazaar in Bangalore”
65 | P a g e
SOUNDARYA INSTITUTE OF MANAGEMENT AND SCIENCE
Table 4.18Showing the responses of how fast the billing section is at big
bazaar.
Particulars Respondents Percentage (%)
Fast 42 28
Not fast 108 72
Total 150 100
Analysis: The above data shows the responses of how fast the billing section is at big bazaar.
Out of 150 respondents 28 % (42) said it is fast and 72% (108) said it is not fast.

“A Study on the Customer preference in Choosing D-mart over Big Bazaar in Bangalore”
66 | P a g e
SOUNDARYA INSTITUTE OF MANAGEMENT AND SCIENCE
Respondents
120 108
100
80
60
42
40
20
0
Fast Not fast
Chart 4.18: Chart showing the effective work in the billing section at big bazaar.
Interpretation: From the above analysis it is interpreted that most of the respondents
(108) agree that the billing section is not fast in Big Bazaar and (42) responded it is fast.

“A Study on the Customer preference in Choosing D-mart over Big Bazaar in Bangalore”
67 | P a g e
SOUNDARYA INSTITUTE OF MANAGEMENT AND SCIENCE
Table 4.19 Showing the responses of how fast the billing section is at D-Mart.
Particulars Respondents Percentage (%)
Fast 55 36.7
Not fast 95 63.3
Total 150 100
Analysis: The above data shows the responses of how fast the billing section is at big bazaar.
Out of 150 respondents 36.7 % (55) said it is fast and 63.3% (95) said it is not fast.

“A Study on the Customer preference in Choosing D-mart over Big Bazaar in Bangalore”
68 | P a g e
SOUNDARYA INSTITUTE OF MANAGEMENT AND SCIENCE
100
90
80
70
60
50
40
30
20
10
0
Respondents 95
55
Fast Not fast
Chart 4.19: Chart showing the effective work in the billing section at D-Mart.
Interpretation: From the above analysis it is interpreted that most of the respondents (95) agree
that the billing section is not fast in D-Mart and (55) responded it is fast.

“A Study on the Customer preference in Choosing D-mart over Big Bazaar in Bangalore”
69 | P a g e
SOUNDARYA INSTITUTE OF MANAGEMENT AND SCIENCE
Table 4.20 Showing the responses of the quality and quantity is maintained at
Big Bazaar.
Particulars Respondents Percentage (%)
Good 81 54
Normal 64 42.7
Not good 4 2.6
Poor 1 0.7
Total 150 100
Analysis: The above data shows the responses of the quality and quantity maintained at big
bazaar. 54 % (81) of them said it is good, 42.7 % (64) it is normal, 2.6% (4) of them said it is not
good and 0.7% (1) respondent said it is poor.

“A Study on the Customer preference in Choosing D-mart over Big Bazaar in Bangalore”
70 | P a g e
SOUNDARYA INSTITUTE OF MANAGEMENT AND SCIENCE
Respondents
90 81
80
70
60
64
50
40
30
20
10
0
4 1
Good Normal Not good Poor
Chart 4.20: Chart showing the quality and quantity maintained at big bazaar.
Interpretation: From the above analysis it is interpreted that majority of the respondents (81)
agree that the product quality and quantity is maintained good at Big Bazaar and (4) respondents
responded it is not good.

CHAPTER-5
FINDINGS, SUGGESTIONS
AND CONCLUSIONS

“A Study on the Customer preference in Choosing D-mart over Big Bazaar in Bangalore”
71 | P a g e
SOUNDARYA INSTITUTE OF MANAGEMENT AND SCIENCE
FINDINGS:
The following are my findings on “A STUDY ON THE CUSTOMER PREFERENCE
IN CHOOSING D-MART OVER BIG BAZAAR IN BENGALURU”.
• The study shows that customers from all age group go to Big Bazaar and D-Mart,
but majority of them are of the age group under 25 and most of them are students
and salaried persons.
• From the survey it is evident that most of the people visit D-Mart and Big Bazaar
once in 2-3 months to the store.
• The study shows that most of the customers are influenced by discounts, offers
and a wide range of products offered at D-Mart
• The survey reflects that most of the customers purchase groceries more in D-Mart
and Big Bazaar.
• The survey shows that most of the customers make purchases in Big Bazaar of its
better-quality products.
• From the survey it is evident that customers purchase products in D-Mart because
of the low price and offers of the products.
• It is evident that D-Mart cleanly intimates the customers about the discounts and
offers.
• The study shows that the customer service department provides fast service in D-
Mart and Big Bazaar.
• From the survey it is evident that the quality and the quantity of the product is
maintained highly in D-Mart and Big Bazaar.
• The survey shows that the store space is free while moving around in the store in
D-Mart and Big Bazaar.
• It is evident from the survey that the availability of different types of products are
high in D-Mart.
“A Study on the Customer preference in Choosing D-mart over Big Bazaar in Bangalore”
72 | P a g e
SOUNDARYA INSTITUTE OF MANAGEMENT AND SCIENCE
SUGGESTIONS:
The main objective of the study is to know why customers choose D-Mart over Big Bazaar for
purchasing their needs. Following are some of the suggestions gives to both the retail sectors
improving the services provided by them.
• Big Bazaar should offer more promotional schemes to attract shoppers from different
categories.
• They should offer more qualitative and branded products which will help them to have
standard customers.
• They should improve their promotion tactics to initiate more customers to the stores,
advertisement is the basic and most prominent tool to increase the awareness about
product.
• Majority of the customers visit D-Mart and Big Bazaar once in 2-3 months. It can be
increased by providing more discounts and good services so that customers wish to visit
again.
• Retail business is successful only when they have a good customer’s service. Customer’s
loyalty can be gained by providing good services to the customers.
• It is advisable that D-Mart must improve its customer relations and staffing by hiring
good and qualified staffs comparing to Big Bazaar.
• They should also do their promotional activities on social media to know about the stores
in their locality.
“A Study on the Customer preference in Choosing D-mart over Big Bazaar in Bangalore”
73 | P a g e
SOUNDARYA INSTITUTE OF MANAGEMENT AND SCIENCE
CONCLUSION:
This project is conducted with finding out customer preference in choosing D-Mart and Big
Bazaar
This study has basically helped us to know the performance in D-Mart and Big Bazaar, most of
the performance are done by the discounts, offers and wide range of products offered at D-Mart.
Most of the customers are satisfied with D-Mart. This shows the customer satisfaction towards
the prices provided in D-Mart.
The customers are very loyal for both Big Bazaar and D-Mart, hence they want to visit Big
Bazaar and D-Mart again and say that they are better than other retail stores. This shows that
customers are well serviced while shopping at D-Mart and Big Bazaar.

BIBLIOGRAPHY

“A Study on the Customer preference in Choosing D-mart over Big Bazaar in Bangalore”
74 | P a g e
SOUNDARYA INSTITUTE OF MANAGEMENT AND SCIENCE
BIBLIOGRAPHY
Ali, M. R. (2014). An Analysis of Consumer Perception towards Retail Brands in
Big Bazaar, Chennai.
Arpita Mukherjee, N. P. (2005). FDI in Retail Sector, India - Academic
Foundation, New Delhi.
Gupte, P. a. Models of Consumer Behavior in Mall Culture – Indian Journal of
Marketing.
Haritharan, G. (2008). “Profile and Perception of Retail Consumers. Palakad
District.
WEBSITES:
✓ http://www.bigbazaar.com
✓ http://www.futuregroup.com
✓ www.indianretailing.com
✓ www.dmartindia.com
✓ www.retailstores.com

ANNEXURE

“A Study on the Customer preference in Choosing D-mart over Big Bazaar in Bangalore”
75 | P a g e
SOUNDARYA INSTITUTE OF MANAGEMENT AND SCIENCE
QUESTIONNAIRE
The survey will be done for finding the data for the topic: “A study on the customer preference in
choosing d-mart over big bazaar in Bengaluru”. I would be thankful if you spare a little of your
precious time to fill this questionnaire. Responses provided would be strictly used for academic
purpose.
1. Gender:
Male () Female ()
2. Age group:
Under 25 () 25-35 () 35-45 ()
3. Occupation:
Students () Self-employed () Professional () Service () Housewife ()
4. Marital Status:
Single () Married ()
5. Monthly Income:
Below Rs 10000 () Rs 10000-20000 () Rs 20000-40000 () Rs 40000 and above ()
6. How frequently do you visit Big Bazaar?
Once in a week () Once in 15 days () Once in a month () Once in 2-3 months ()
7. How frequently do you visit D-Mart?
Once in a week () Once in 15 days () Once in a month () Once in 2-3 months ()
8. Which products do you purchase more often in Big Bazaar?
Groceries () Electronic Goods () Apparels () Clothes ()
9. Which products do you purchase more often in D-Mart?
Groceries () Electronic Goods () Apparels () Clothes ()
10. Which source made you to buy product from Big-Bazaar and D-Mart?
Newspaper () F.M radio () Social media () Friends/others ()
11. Why do you make purchase of products from Big Bazaar?
Low price () Better Quality () Variety of products () various brands

“A Study on the Customer preference in Choosing D-mart over Big Bazaar in Bangalore”
76 | P a g e
SOUNDARYA INSTITUTE OF MANAGEMENT AND SCIENCE
12. Why do you make purchase of products from D-Mart?
Low price () Better Quality () Variety of products () various brands
13. Do you feel shopping at D-Mart is a good place to buy clothes/household items than Big
Bazaar? Yes/No if yes, then is it because of.
Availability of products you need () Variety of the products you need ()
Discount/Special offer () others ()
14. Is big bazaar reminding and intimating their store discounts and prices to all Customers
in store.
YES, cleanly intimating () NO clarity intimating () NO intimation at all ()
15. Is D-Mart reminding and intimating their store discounts and prices to all customers in
store.
YES, cleanly intimating () NO clarity intimating () NO intimation at all ()
16. How the customer service department in store is, is it effective in providing Service in
big bazaar?
Fast service () Slow service () Not enough service () Not good service ()
17. How the customer service department in store is, is it effective in providing Service in D-
Mart?
Fast service () Slow service () Not enough service () Not good service ()
18. Are you waiting for a long time at the billing section at big bazaar?
Yes () No ()
19. Are you waiting for a long time at the billing section at D-Mart?
Yes () No ()
20. How is BIG BAZAAR maintaining product QUALITY, QUANTITY compare to other
retail stores?
Good () normal () Not good () poor ()
Related Documents