1 An investigation into the prediction and promotion of specific self-esteem domains in adolescents By: Gabrielle Friese-Greene Pitfield A thesis submitted in partial fulfilment of the requirements for the degree of Doctor of Philosophy The University of Sheffield Faculty of Science Department of Psychology November 2019

Welcome message from author
This document is posted to help you gain knowledge. Please leave a comment to let me know what you think about it! Share it to your friends and learn new things together.
Transcript
1
An investigation into the prediction and promotion of
specific self-esteem domains in adolescents
By:
Gabrielle Friese-Greene Pitfield
A thesis submitted in partial fulfilment of the requirements for the degree of
Doctor of Philosophy
The University of Sheffield
Faculty of Science
Department of Psychology
November 2019
2
Acknowledgments
This research would not have been possible without Professor Rod Nicolson.
I am especially indebted to him for giving me the opportunity to follow my passion
and pursue researching for a PhD. I will always feel the deepest and heartfelt
gratefulness for his guidance and inspiration.
My sincerest gratitude to the dynamic and enlightening Professors Liz Milne
and Paul Norman for their continuous support, motivation and immense knowledge.
Their insightful comments and encouragement allowed me to broaden my research
perspective and understand (to a small degree!) working with large datasets. Thank
you both for your kindness and patience. In addition, I am extremely grateful for the
invaluable help of Dr Jilly Martin. Without the precious support of these
extraordinary academics and mentors, this PhD would not have transpired. I could
not have imagined having better supervisors. I feel astonishingly privileged to have
had three Professors guiding me through the emotional rollercoaster that is a PhD. It
has been a very special time. I am also very grateful to University staff especially
Josie, Jayne, James and the postgraduate team for their unfailing support and
assistance. I would also like to thank the Heads and teachers at the schools which
allowed me to spend time with their wonderful pupils – it was a pleasure and a
privilege to be allowed into the worlds of these young people.
In its totality, I dedicate this thesis to my family, past and present. My
everlasting gratitude to my wonderful late parents who instilled in me the desire to
learn and belief that through perseverance and determination your dreams can
materialise. I know you have been beside me every step of my journey. To my
fantastic husband, Spencer, and wonderful children, Francesca, Sebastian and
Theodore I thank you for the love, interest and constant encouragement that has
3
nourished and sustained me through the writing of this thesis. To my fabulous sister,
Kirsten, for her enduring support and for always believing in me and to my mother-
in-law, Doreen, for her guidance. Thank you, I feel extremely blessed to have had
such unending moral and emotional support in my life.
It has been an honour to study at the University of Sheffield and I hope, that
in some small way, that my research makes some positive impact on the lives of
adolescents.
4
Abstract
Self-esteem is a protective factor in both physical and mental health. Low
self-esteem in adolescence is correlated with a wide spectrum of mental disorders
both through internalising (e.g., anxiety, depression) and externalising problems
(e.g., aggression). This thesis adopted a positive psychology mixed methods
approach and reports three studies investigating domain-specific self-esteem. The
first study investigated the self-esteem of two samples of vulnerable adolescents
through assessment and Life Story Interviews. Results demonstrated spiky domain
specific profiles for both adolescents with dyslexia and adolescents disengaged in
school and at risk for becoming ‘NEETS’ - Not in Education, Employment or
Training. Narratives exposed shared themes that may potentially underpin
discrepancies in self-esteem. The second study explored the promotion of self-
esteem through a school-based intervention focussing on ‘positive emotions’ in the
past (gratitude), present (recognition and use of character strengths) and future
(hope). There was little evidence to suggest reliable improvement in academic,
general, parental and social self-esteem domains, however some benefit was
demonstrated in personal and global self-esteem, especially for females and those
with low-level baseline scores. The third study identified predictors of self-esteem
domains from an online questionnaire circulated to a large sample of typically
developing adolescents. Regression analyses indicated strengths (behavioural,
emotional, personal, contextual and character) variables in the final regression
equation explained 61.0% of the variation in general self-esteem, 54.0% in personal
self-esteem, 58.9% in academic self-esteem, 56.0% in parental self-esteem and
49.0% in social self-esteem. After controlling for demographics, a constellation of
18 strengths were identified with the strengths of “knowing yourself” and
5
“creativity” as universal predictors. This research highlights the importance of
context, creativity and identity formation in self-esteem development and extends
the literature on strengths predictors identified for potential inclusion in
interventions targeting adolescents vulnerable for being at risk of low esteem.
6
Table of contents
Acknowledgments ................................................................................................... 2
Abstract .................................................................................................................... 4
Table of contents ..................................................................................................... 6
List of Tables ......................................................................................................... 10
List of Figures ........................................................................................................ 11
Declaration ............................................................................................................ 13
Chapter 1............................................................................................ 14
An exploration of self-esteem in adolescence from a mixed methods
positive psychology perspective ........................................................ 14
1.1 Self-esteem in adolescence ......................................................................... 15
1.2 Cognitive advances in adolescence ............................................................ 16
1.3 Identity formation in adolescence and associations with self-esteem ........ 18
1.4 Trajectory of global self-esteem across the lifespan .................................. 21
1.5 Domain specific self-esteem ....................................................................... 25
1.6 Low self-esteem in adolescence ................................................................. 30
1.6.1 Adolescents with dyslexia ................................................................... 33
1.6.2 Adolescents at risk of becoming NEET .............................................. 41
1.7 Rationale underlying adoption of a mixed methodology ........................... 49
1.7.1 A quantitative approach ...................................................................... 52
1.7.2 A qualitative approach ........................................................................ 54
1.8 Overview of thesis ...................................................................................... 60
1.9 Summary ..................................................................................................... 62
2 Chapter 2 ..................................................................................... 64
Study 1 – A mixed methods exploration into the self-esteem of
vulnerable adolescents ....................................................................... 64
2.1 Overview .................................................................................................... 64
2.2 Qualitative studies with adolescents with dyslexia .................................... 64
2.3 Qualitative studies with adolescents at risk of becoming NEET ............... 67
2.4 Research Question ...................................................................................... 71
7
2.5 Method ........................................................................................................ 72
2.5.1 Participants .......................................................................................... 72
2.5.2 Materials .............................................................................................. 76
2.5.3 Procedure ........................................................................................... 108
2.6 Results for Sample 1- Adolescents with dyslexia .................................... 110
2.6.1 Participant characteristics of Sample 1 from self-esteem and strengths
scores ……………………………………………………………………...110
2.6.2 Results of the IPA of the Life Story Interviews with Sample 1 ........ 111
2.7 Results for Sample 2 - Adolescents at risk of becoming NEET ............... 127
2.7.1 Sample characteristics of Sample 2 ................................................... 127
2.7.2 Results of the IPA of the Life Story Interviews with Sample 2 ........ 128
2.8 Overall discussion of themes generated and links between self-esteem
profiles and narratives ......................................................................................... 153
2.8.1 Academic self-esteem ....................................................................... 155
2.8.2 General self-esteem ........................................................................... 160
2.8.3 Parental self-esteem .......................................................................... 161
2.8.4 Social self-esteem .............................................................................. 161
2.8.5 Personal self-esteem .......................................................................... 162
2.8.6 Identification of emergent themes from Life Story Interviews ......... 163
2.9 Strengths and Limitations ......................................................................... 166
2.10 Conclusion ................................................................................................ 168
3 Chapter 3 ................................................................................... 174
Study 2 – An investigation into the impact of a positive emotion
intervention on the self-esteem of vulnerable adolescents ............. 174
3.1 The importance of positive emotions in school-based interventions ....... 176
3.1.1 The effect of gratitude ....................................................................... 180
3.1.2 The effect of recognition and use of character strengths .................. 183
3.1.3 The effect of hope ............................................................................. 189
3.2 Rationale underlying adoption and adaptation of the tripartite intervention
………………………………………………………………………….. 193
3.3 Research Question .................................................................................... 196
3.4 Method ...................................................................................................... 196
3.4.1 Participants ........................................................................................ 196
3.4.2 Design ............................................................................................... 196
8
3.4.3 Materials ............................................................................................ 197
3.4.4 Procedure ........................................................................................... 198
3.4.5 Development and details of the Positive Emotion Intervention ....... 199
3.4.6 Data Analysis .................................................................................... 206
3.5 Results for Sample 1 ................................................................................. 209
3.5.1 Visual analysis .................................................................................. 209
3.5.2 Statistical analysis ............................................................................. 213
3.6 Results for Sample 2 ................................................................................. 223
3.6.1 Visual analysis .................................................................................. 223
3.6.2 Statistical analysis ............................................................................. 229
3.7 Summary of results ................................................................................... 240
3.8 Discussion ................................................................................................. 242
3.9 Strengths and Limitations ......................................................................... 247
3.10 Conclusion ................................................................................................ 248
4 Chapter 4 ................................................................................... 251
Study 3 – An exploration into the predictors of self-esteem domains
in adolescents ................................................................................... 251
4.1 Introduction .............................................................................................. 251
4.2 Self-esteem predictors .............................................................................. 251
4.3 Identification of potential predictors for further investigation ................. 254
4.4 Research Questions .................................................................................. 257
4.5 Method ...................................................................................................... 257
4.5.1 Participants ........................................................................................ 257
4.5.2 Materials ............................................................................................ 258
4.5.3 Procedure ........................................................................................... 271
4.6 Results ...................................................................................................... 272
4.6.1 Factor Analysis .................................................................................. 274
4.6.2 Factor structure of the self-esteem items .......................................... 276
4.6.3 Associations between self-esteem domains ...................................... 281
4.6.4 Associations between demographic variables and self-esteem ......... 282
4.6.5 Correlations between strengths and self-esteem ............................... 285
4.6.6 Inter-correlations between strengths ............................................... 2877
4.6.7 Regression Analyses ......................................................................... 289
4.6.8 Additional analyses ........................................................................... 296
9
4.7 Discussion ................................................................................................. 299
4.8 Strengths and limitations .......................................................................... 303
4.9 Conclusions .............................................................................................. 307
5 Chapter 5 ................................................................................... 309
General Discussion .......................................................................... 309
5.1 Research questions ................................................................................... 310
5.2 Main Findings ........................................................................................... 310
5.2.1 Study 1 .............................................................................................. 310
5.2.2 Study 2 .............................................................................................. 312
5.2.3 Study 3 .............................................................................................. 317
5.3 Overall findings ........................................................................................ 320
5.4 Strengths and Limitations ......................................................................... 322
5.5 Future Implications ................................................................................... 327
5.6 Conclusion ................................................................................................ 333
References ........................................................................................ 334
Appendices ....................................................................................... 416
10
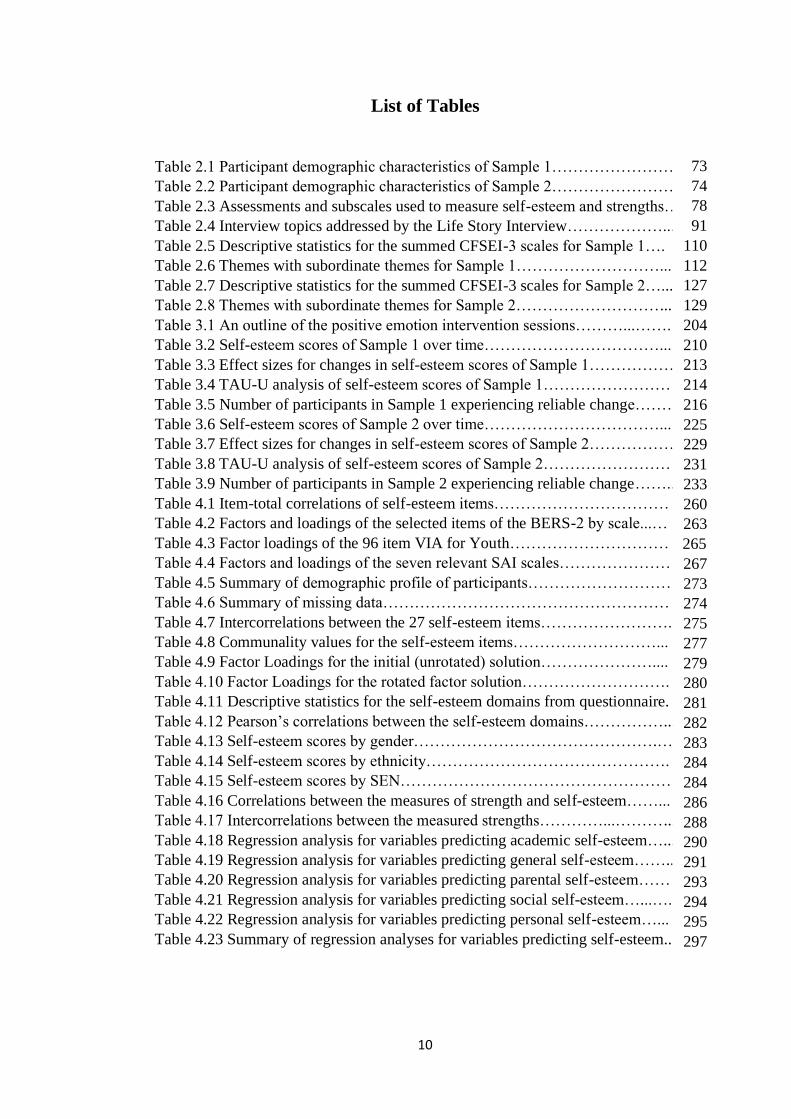
List of Tables
Table 2.1 Participant demographic characteristics of Sample 1……………………
Table 2.2 Participant demographic characteristics of Sample 2……………………
Table 2.3 Assessments and subscales used to measure self-esteem and strengths…
Table 2.4 Interview topics addressed by the Life Story Interview………………....
Table 2.5 Descriptive statistics for the summed CFSEI-3 scales for Sample 1….
Table 2.6 Themes with subordinate themes for Sample 1………………………...
Table 2.7 Descriptive statistics for the summed CFSEI-3 scales for Sample 2…...
Table 2.8 Themes with subordinate themes for Sample 2………………………...
Table 3.1 An outline of the positive emotion intervention sessions………...…….
Table 3.2 Self-esteem scores of Sample 1 over time……………………………...
Table 3.3 Effect sizes for changes in self-esteem scores of Sample 1………………
Table 3.4 TAU-U analysis of self-esteem scores of Sample 1……………………
Table 3.5 Number of participants in Sample 1 experiencing reliable change……….
Table 3.6 Self-esteem scores of Sample 2 over time……………………………...
Table 3.7 Effect sizes for changes in self-esteem scores of Sample 2………………
Table 3.8 TAU-U analysis of self-esteem scores of Sample 2……………………
Table 3.9 Number of participants in Sample 2 experiencing reliable change……..
Table 4.1 Item-total correlations of self-esteem items……………………………
Table 4.2 Factors and loadings of the selected items of the BERS-2 by scale...…
Table 4.3 Factor loadings of the 96 item VIA for Youth…………………………
Table 4.4 Factors and loadings of the seven relevant SAI scales…………………
Table 4.5 Summary of demographic profile of participants………………………
Table 4.6 Summary of missing data………………………………………………
Table 4.7 Intercorrelations between the 27 self-esteem items…………………….
Table 4.8 Communality values for the self-esteem items………………………...
Table 4.9 Factor Loadings for the initial (unrotated) solution…………………....
Table 4.10 Factor Loadings for the rotated factor solution……………………….
Table 4.11 Descriptive statistics for the self-esteem domains from questionnaire.
Table 4.12 Pearson’s correlations between the self-esteem domains……………...
Table 4.13 Self-esteem scores by gender……………………………………….…
Table 4.14 Self-esteem scores by ethnicity……………………………………….
Table 4.15 Self-esteem scores by SEN……………………………………………
Table 4.16 Correlations between the measures of strength and self-esteem……...
Table 4.17 Intercorrelations between the measured strengths…………...………...
Table 4.18 Regression analysis for variables predicting academic self-esteem…...
Table 4.19 Regression analysis for variables predicting general self-esteem……...
Table 4.20 Regression analysis for variables predicting parental self-esteem……
Table 4.21 Regression analysis for variables predicting social self-esteem…...….
Table 4.22 Regression analysis for variables predicting personal self-esteem…...
Table 4.23 Summary of regression analyses for variables predicting self-esteem...
73
74
78
91
110
112
127
129
204
210
213
214
216
225
229
231
233
260
263
265
267
273
274
275
277
279
280
281
282
283
284
284
286
288
290
291
293
294
295
297
11
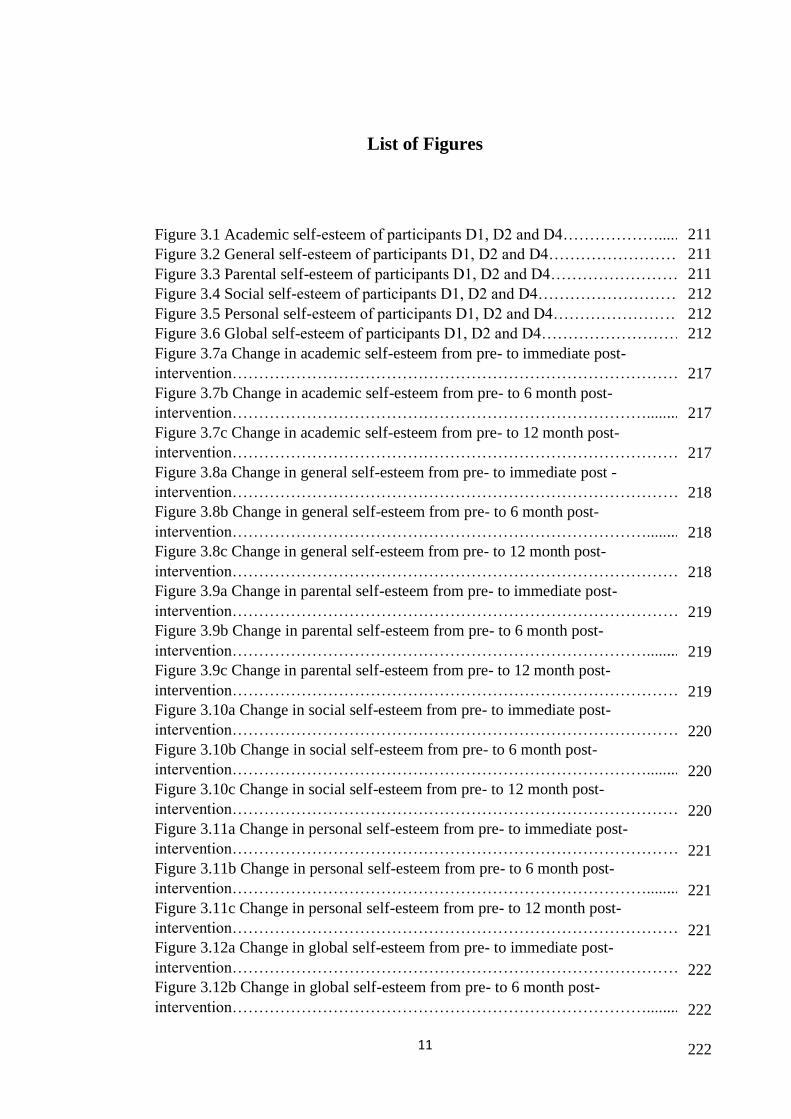
List of Figures
Figure 3.1 Academic self-esteem of participants D1, D2 and D4………………......
Figure 3.2 General self-esteem of participants D1, D2 and D4……………………
Figure 3.3 Parental self-esteem of participants D1, D2 and D4……………………
Figure 3.4 Social self-esteem of participants D1, D2 and D4………………………
Figure 3.5 Personal self-esteem of participants D1, D2 and D4……………………
Figure 3.6 Global self-esteem of participants D1, D2 and D4………………………
Figure 3.7a Change in academic self-esteem from pre- to immediate post-
intervention…………………………………………………………………………...
Figure 3.7b Change in academic self-esteem from pre- to 6 month post-
intervention…………………………………………………………………….........
Figure 3.7c Change in academic self-esteem from pre- to 12 month post-
intervention……………………………………………………………………………
Figure 3.8a Change in general self-esteem from pre- to immediate post -
intervention………………………………………………………………………….
Figure 3.8b Change in general self-esteem from pre- to 6 month post-
intervention……………………………………………………………………..........
Figure 3.8c Change in general self-esteem from pre- to 12 month post-
intervention……………………………………………………………………………
Figure 3.9a Change in parental self-esteem from pre- to immediate post-
intervention………………………………………………………………………….
Figure 3.9b Change in parental self-esteem from pre- to 6 month post-
intervention……………………………………………………………………........
Figure 3.9c Change in parental self-esteem from pre- to 12 month post-
intervention……………………………………………………………………………
Figure 3.10a Change in social self-esteem from pre- to immediate post-
intervention…………………………………………………………………………
Figure 3.10b Change in social self-esteem from pre- to 6 month post-
intervention…………………………………………………………………….........
Figure 3.10c Change in social self-esteem from pre- to 12 month post-
intervention……………………………………………………………………………
Figure 3.11a Change in personal self-esteem from pre- to immediate post-
intervention………………………………………………………………………….
Figure 3.11b Change in personal self-esteem from pre- to 6 month post-
intervention…………………………………………………………………….........
Figure 3.11c Change in personal self-esteem from pre- to 12 month post-
intervention……………………………………………………………………………
Figure 3.12a Change in global self-esteem from pre- to immediate post-
intervention………………………………………………………………………….
Figure 3.12b Change in global self-esteem from pre- to 6 month post-
intervention…………………………………………………………………….........
211
211
211
212
212
212
217
217
217
218
218
218
219
219
219
220
220
220
221
221
221
222
222
222
12
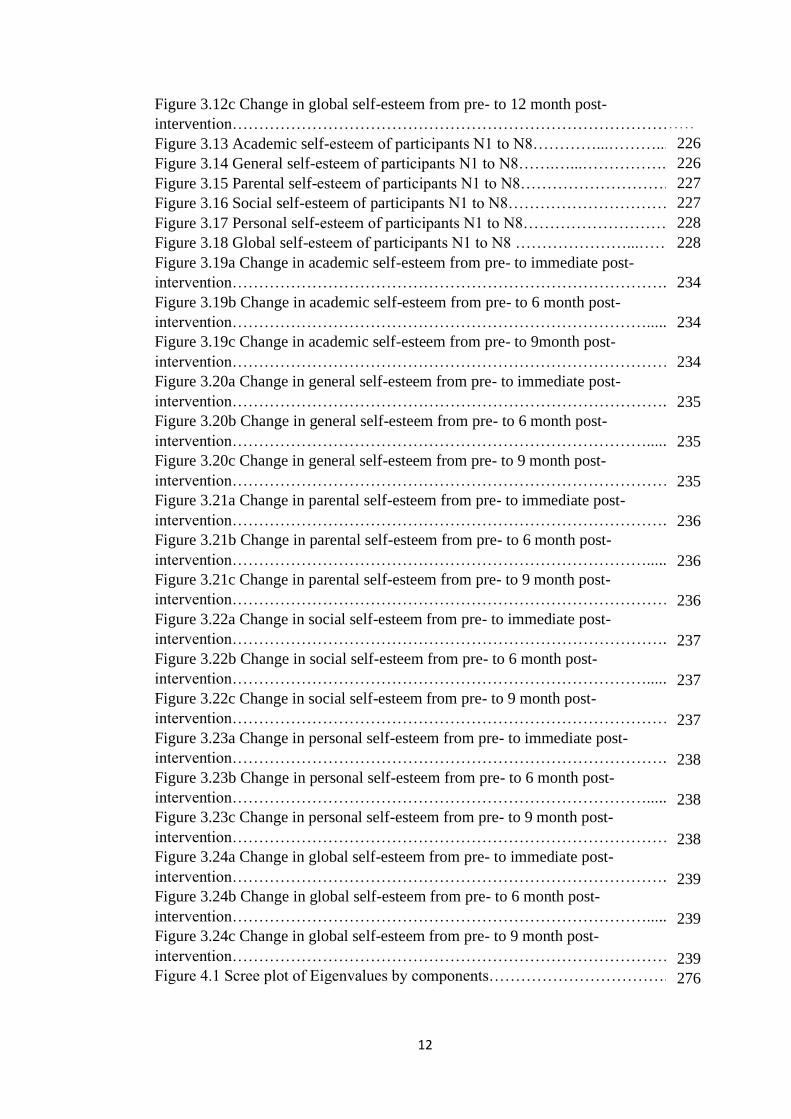
Figure 3.12c Change in global self-esteem from pre- to 12 month post-
intervention……………………………………………………………………………
Figure 3.13 Academic self-esteem of participants N1 to N8…………...………...
Figure 3.14 General self-esteem of participants N1 to N8…….…...……………...
Figure 3.15 Parental self-esteem of participants N1 to N8………………………...
Figure 3.16 Social self-esteem of participants N1 to N8………………………….
Figure 3.17 Personal self-esteem of participants N1 to N8…………………………
Figure 3.18 Global self-esteem of participants N1 to N8 …………………...……
Figure 3.19a Change in academic self-esteem from pre- to immediate post-
intervention………………………………………………………………………...
Figure 3.19b Change in academic self-esteem from pre- to 6 month post-
intervention……………………………………………………………………......
Figure 3.19c Change in academic self-esteem from pre- to 9month post-
intervention……………………………………………………………………………
Figure 3.20a Change in general self-esteem from pre- to immediate post-
intervention………………………………………………………………………...
Figure 3.20b Change in general self-esteem from pre- to 6 month post-
intervention……………………………………………………………………......
Figure 3.20c Change in general self-esteem from pre- to 9 month post-
intervention……………………………………………………………………………
Figure 3.21a Change in parental self-esteem from pre- to immediate post-
intervention………………………………………………………………………...
Figure 3.21b Change in parental self-esteem from pre- to 6 month post-
intervention……………………………………………………………………......
Figure 3.21c Change in parental self-esteem from pre- to 9 month post-
intervention……………………………………………………………………………
Figure 3.22a Change in social self-esteem from pre- to immediate post-
intervention………………………………………………………………………...
Figure 3.22b Change in social self-esteem from pre- to 6 month post-
intervention……………………………………………………………………......
Figure 3.22c Change in social self-esteem from pre- to 9 month post-
intervention……………………………………………………………………………
Figure 3.23a Change in personal self-esteem from pre- to immediate post-
intervention………………………………………………………………………...
Figure 3.23b Change in personal self-esteem from pre- to 6 month post-
intervention……………………………………………………………………......
Figure 3.23c Change in personal self-esteem from pre- to 9 month post-
intervention……………………………………………………………………………
Figure 3.24a Change in global self-esteem from pre- to immediate post-
intervention………………………………………………………………………...
Figure 3.24b Change in global self-esteem from pre- to 6 month post-
intervention……………………………………………………………………......
Figure 3.24c Change in global self-esteem from pre- to 9 month post-
intervention……………………………………………………………………………
Figure 4.1 Scree plot of Eigenvalues by components…………………………….
226
226
227
227
228
228
234
234
234
235
235
235
236
236
236
237
237
237
238
238
238
239
239
239
276

13
Declaration
I, Gabrielle Friese-Greene Pitfield, confirm that the Thesis is my own work. I am
aware of the University’s Guidance on the Use of Unfair Means
(www.sheffield.ac.uk/ssid/unfair-means). This work has not been previously been
presented for an award at this, or any other, university.
14
Chapter 1
An exploration of self-esteem in adolescence from a mixed
methods positive psychology perspective
This chapter introduces the construct of self-esteem, its association with
cognitive advances and identity formation and the developmental trajectory of
global self-esteem. The five different domains of self-esteem that form the focus of
this thesis are discussed before investigating the ramifications of low self-esteem.
Specific reference is given to the impact of low self-esteem on the ‘vulnerable
adolescents’ that comprise the participants for Studies 1 and 2, i.e., adolescents with
dyslexia and disengaged adolescents at risk of becoming NEET – Not in Education,
Employment or Training.
This chapter also discusses the rationale underlying the adoption of a mixed
methods approach throughout this thesis in line with the research questions. A
combination of quantitative and qualitative research methods were used to explore
the level and promotion of self-esteem domains in a small sample of vulnerable
adolescents in Studies 1 and 2, whilst behavioural, emotional, personal, contextual
and character strengths predictors of self-esteem domains within a larger adolescent
sample are investigated through an online questionnaire in Study 3. The construct of
epistemology is addressed and the theory underpinning synthesising quantitative and
qualitative research paradigms within a pragmatist framework is outlined.
Furthermore, the reasoning underlying the use of the qualitative life story
methodology is discussed.
15
1.1 Self-esteem in adolescence
Although self-esteem is a core construct in psychological theory, existing
literature highlights a lack of consensus on the definition of self-esteem and its
overlap with other self-definitions such as self-concept, self-perception, self-worth,
self-competence etc. Serpe, Long-Yarrison, Stets and Stryker (2019) consider self-
esteem a significant component of self-concept, viewing self-concept as a mental
image that individuals possess of themselves based on self-view and assimilating the
responses of others (Owens, & Samblanet, 2013). Indeed, Morawiak, Mrozinski,
Gutral, Cypryańska, & Nezlek, (2018) consider self-esteem as the evaluative
component of self-concept whilst self-concept clarity is the knowledge or structural
component. Furthermore, Stets and Burke (2014) consider self-esteem to be three-
dimensional comprising self-worth (the level of value and acceptance felt by the
individual), self-efficacy (levels of competency felt) and authenticity (trueness to
self). With a plethora of self-constructs evident in the literature it is critical to define
clearly the definition of self-esteem which is operationalised within this thesis.
Battle (2002) uses self-esteem and self-concept interchangeably as both are
reflective processes underpinned by advancement in cognitive and social
development. Such an approach is adopted in this thesis, based on the premise that
self-esteem and self-concept are influenced by not only observing one’s own self
and behaviour objectively, but by observing or imagining how others react to you
and your behaviour. Therefore, throughout this thesis, self-esteem is defined as “an
attitude towards oneself based on one’s recognition of abilities and limitations”
(Battle, 2002, p.3). This definition was derived from Battle (2002) whose self-
esteem assessment tool, the Culture-Free Self-Esteem Inventory (CFSEI-3), was the
instrument of choice throughout the three studies.
16
1.2 Cognitive advances in adolescence
Using a neo-Piagetian framework, Harter (1998) profiles major
developmental stages in self-esteem based on cognitive advances and defines the
adolescent years as early (12-14 years old), middle (15-16 years old) and late (17-18
years old) adolescence. Early adolescence is marked by significant cognitive
progress in terms of abstract thinking in relation to the world, self and others.
Cognitive advances allow young adolescents to utilise more self-descriptive labels
(i.e., intelligent, funny), formulate multiple yet contradictory descriptions dependent
on how these different aspects are revealed dependent on context (with parents,
friends, teachers) (Harter, 2006b; Harter, 2012). Acknowledging this situational
variability in feelings, behaviours and attitudes, adolescents tend to utilise qualifiers
in the descriptions of themselves (I’m kind of intelligent). Behaviour is influenced
by adolescents’ views of themselves; indeed, Preckel, Niepel, Schneider and
Brunner (2013) indicate that early adolescents’ perceptions of academic
competences is predictive of academic achievement in middle adolescence. Within
adolescence, the ability to manipulate both real and imagined objects in different
temporal circumstances is consolidated. An individual’s perception of self develops
progressively, becoming more differentiated as he or she matures and with
interactions with others (Harter, 1998).
According to Fischer and Bidell (2006), the newly found ability to ‘abstract
map’, that is the ability to map constructs about the self onto one another and
directly compare them, forces the mid-adolescent to view their different attributes in
terms of contradictory abstractions (e.g., extrovert and introvert). This emergent
ability of abstract mapping is accompanied by a lack of cognitive control (Dawson,
Fischer & Stein, 2006), in part because earlier strategies are rejected but not yet
17
replaced by new solutions. Although the mid-adolescent acknowledges multiple
selves within different contexts and relationships, this may result in conflict between
selves (James, 1892) which destabilises this growing intense self-awareness and can
lead to a kaleidoscopic self. These struggles within the normative cognitive
developmental processes may explain the trademark unpredictable behaviours,
mood swings and oscillating self-evaluations (Harter & Monsour, 1992).
Differences between males and females are evident, with females detecting
more contradictory attributes than males. Carter (2014) proposes that the
socialisation of girls entails more immersion within the family and highlights the
importance of connectedness; in contrast, males driven by autonomy are more
influenced by the reasoning of social and moral decisions over affect responsiveness
to significant others.
According to Elkind (1967), two egocentric processes also emerge in
adolescence – personal fable and imaginary audience which stem from the Piagetian
concept of egocentrism which emanates from the failure to distinguish one’s
perspective and that of others. Personal fable comprises invulnerability,
omnipotence and a feeling of personal uniqueness. Imaginary audience reflects the
belief that others, especially peers, are as obsessed with the adolescent’s appearance
and behaviour as the adolescent is themselves (Elkind & Bowen, 1979). This results
in constant scrutiny and critical evaluation. However, recent studies underscore
discrepancies when attempting to determine how gender and age impact
egocentrism (Galanaki, 2012). Indeed, Schwatz, Maynard and Uzelac’s (2008)
research with adolescents (N = 2390) highlighted significant interactions between
age and sex for both personal fable and imaginary audience. Furthermore, findings
from adolescent research show negative associations between formal operations
18
(e.g. complex logical reasoning measured with analogy tasks) and egocentrism (e.g.
Lapsley, Milstead, Quintana, Flannery, & Buss, 1986) and, therefore, contradicts
Elkind’s (1967) supposition that both formal operations and egocentrism increase in
adolescence. Overall, such findings deviate from Elkind’s original conceptualisation
and question the temporal validity of the original theory.
A significant developmental function of adolescence is to construct a more
differentiated, complex and organised stratification of self-esteem influenced by
cognitive advances.
1.3 Identity formation in adolescence and associations with self-
esteem
As adolescents’ self-evaluations become more rich, descriptive,
comprehensive, and organized, the seeds of identity and a coherent sense of self are
planted. In the light that identity is a multifaceted construct, Schwartz, Luyckx and
Vignoles (2011, p. 4) suggested an operational definition of identity consisting of
the individual’s "chosen commitments, personal characteristics, beliefs about
oneself, roles and position in relation to others, membership in social groups and
categories, treasured material possessions and where one belongs in a geographical
space".
Growing psychosocial developmental theories, both in terms of discrete
stages or as a continuum, focus upon adolescence as a pivotal era in identity
formation. Drawing upon Erikson’s (1968) seminal research on identity, this
psychosocial developmental life stage (12-18 years old), is epitomised by the
identity versus role confusion epoch. According to this ideology, individuals must
experience a psychosocial transition crisis which must be resolved prior to
successful development and advancement to the intimacy versus isolation stage of
19
young adulthood. Erikson (1968) argues the failure to construct a coherent and
continuous sense of one’s personal identity is pivotal in coping with developmental
challenges in the face of discontinuities (cognitive, biological and social). In
formulating an identity, adolescents integrate all the knowledge about themselves,
their self-conceptions, combined with evaluations of themselves, to create a sense of
self-unity that is consistent and coherent over time (Erikson, 1950). Erikson
proposed that at the end of this identity versus role confusion epoch, adolescents
comprehend 'Who am I?', 'Where do I come from?' and 'Where am I going?'
According to Marcia (1966), who refined and extended Erikson’s work,
identity achievement constitutes the successful resolution of a four-stage non-linear
process (comprising foreclosure, diffusion, moratorium and achievement)
constructing a coherent sense of self after exploring various options. In creating a
sense of identity, adolescents examine their past and future and view their values,
beliefs, and goals in relation to their politics, vocation, religion, and sexuality.
Marcia proposed that a well-developed identity allows an individual to define their
strengths and weaknesses as well as a belief in their individual uniqueness. In the
foreclosure stage, commitments have been made prematurely to an occupational
future, conforming to others’ expectations without fully exploring and evaluating
alternative avenues. An identity crisis has not been experienced. In the diffusion
stage, the adolescent has not explored or committed to a clear sense of identity. It is
questionable whether an identity crisis has or has not been faced. In the moratorium
stage adolescents remain indecisive although they are actively exploring alternative
commitments. Although perceived to be experiencing an identity crisis, they are
moving towards identity formation. The achievement stage follows where the
20
adolescent has successfully navigated identity crisis and made commitments critical
for forming a sense of identity.
Identity is a dynamic psychological structure and these identity statuses
should not be perceived as substages in a linear or sequential journey. Indeed,
individuals normally waiver over identity statuses over the adolescent years
displaying different patterns of identity development (Meeus, 2011). Individual
differences are displayed in that some adolescents stay in one identity status, for
example, identity moratorium for a longer period while others demonstrate
transitions through a multitude of identity status. The most prevalent transitions in
identity status are from identity diffusion and identity foreclosure in early
adolescence, and to moratorium and identity achievement later in adolescence (Al-
Owidha, Green, & Kroger, 2009; Yip, 2014).
Each of these stages have ramifications for the self-esteem of the adolescent.
While foreclosure is common in early adolescence, the least developed form of
identity is the diffused status where there is little evidence of exploration or
commitment. Identity diffusion is atypical in late adolescents and considered by
Kroger, Martinussen and Marcia (2010) to be characteristic of maladjustment.
Foreclosure and diffusion are linked to passivity and in late adolescence associated
with maladaptive long-term consequences (Archer & Waterman, 1990; Berzonsky
& Kuk, 2000), whilst the moratorium status is linked to anxiety (Lillevoll, Kroger,
& Martinussen, 2013). Luyckx et al. (2008) propose adolescents feel confusion
when faced with a myriad of choices and utilise an active information style
approach when forced to make decisions and problem solve. Higher self-esteem is
correlated with identity achievement as well as feelings of control, positivity at
school and work and advanced high moral reasoning (Adams & Marshall, 1996;
21
Kroger, 2000). Conversely, some adolescents experience paralysing feelings of
anxiety and being overwhelmed, which curtails identity exploration (Crocetti,
Klimstra, Keijsers, Hale, & Meeus, 2009).
Adolescents experience severe pressure to create a sense of self, especially
in relation to their future vocation. Researchers consider decision making relating to
future careers as a significant issue for adolescents and potentially a pivotal part of
identity formation (Alberts, Mbalo, & Ackerman, 2003; Erikson, 1968). Moreover,
Faircloth underscores the importance of context in identity believing context is a
"site of identity work" (Faircloth, 2012, p. 187). Indeed, Lannegrand-Willems and
Bosma (2006) reveal that the students’ school self-image (influenced by school
feedback) has a direct effect on their attitude towards learning which in turn is
associated with motivation. Conversely, Kaplan and Flum (2009) suggest that
motivation directly impacts the moulding identity within the school environment.
Researchers from different viewpoints highlight the perceived importance of the
school context as the foundation stones in identity formation (Gee, 2000).
1.4 Trajectory of global self-esteem across the lifespan
Although self-esteem is a crucial need of humans and represents one of the
most significant variables influencing an individual along their developmental
timeline, affecting achievement, abilities, social interactions and mental well-being,
research indicates that self-esteem does not have a linear developmental trajectory
with a tangible endpoint.
Much of the literature exploring the developmental timeline of self-esteem
concentrates on global self-esteem. Global self-esteem can be defined as “an overall
estimate of general self-worth: a level of self-acceptance or respect for oneself: a
22
trait or tendency relatively stable and enduring, composed of all subordinate traits
and characteristics within the self” (Guidon, 2002, p.207). In other words, global
self-esteem refers to the “overall aggregated opinion of oneself at any one time, on a
scale between negative and positive” (Harter, 1993, p.88).
Assessed across cultures (Schmitt & Allik, 2005), global self-esteem is
correlated with well-being and positive life consequences (Steiger, Allemand,
Robins, & Fend, 2014) with low self-esteem being a potential risk factor in the
development of anxiety and depression (Sowislo & Orth, 2013; von Soest,
Wichstrøm, & Kvalem, 2016).
Although there is convergence in the literature about the lifespan profile of
global self-esteem through adulthood, there is conjecture over its trajectory during
adolescence. Robins, Trzesniewski, Tracy, Gosling and Potter (2002) found that
global self-esteem was high in childhood before declining in adolescence, rising
gradually throughout adulthood before a steep decline in old age (after accounting
for gender, socio-economic status, ethnicity and nationality). However, it has also
been suggested that global self-esteem declines around 11 years of age, plummeting
to its lowest point around 12 or 13 before increasing in adolescence (Harter, 2006a;
Orth & Robins, 2014). Indeed, school transitions are often linked with temporary
decreases in self-esteem, although, the literature reveals that most adolescents
perceive themselves more positively as they transcend through their high school
years (Orth & Robins, 2014; Zeiders, Umaña-Taylor, & Derlan, 2013) and this
manifests in increasing self-esteem (Bachman, O’Malley, Freedman-Doan,
Trzesniewski, & Donnellan, 2011; Orth, Robins, & Widaman, 2012).
Decreases in global self-esteem mostly mirror transitional changes in
adolescents, such as the emotional struggles accompanying bodily changes in
23
conjunction with comparisons to their peers. Introspection – an increased
concentration on one’s negative attributes – has also been considered partially
responsible for any decline in global self-esteem between early and mid-adolescence
(Robins, Trzesniewski, Tracy, Gosling, & Potter, 2002). Introspection also reveals
differences between one’s ‘real’ and ‘ideal’ self-concepts – the larger the differential
the lower the self-esteem. Discrepancies between ideal and actual selves are
correlated with low self-esteem, depression and low school grades (Ferguson,
Hafen, & Laursen, 2010; Stevens, Lovejoy, & Pittman, 2014).
Individual differences in self-enhancement and self-protective strategies also
have a part to play; a decrease in self-enhancing tendencies during adolescence
impacts negatively upon self-esteem (Sedikides, Horton & Gregg, 2007).
Individuals are driven to attain a positive view of themselves (self-enhance) and
self-enhancing strategies operate routinely to focus on achieving, maximising and
regulating positive self-views. In contrast, self-protecting strategies are brought into
situations where the self-concept is under threat (Alicke & Sedikides, 2009) and
centre on the avoidance, minimisation and repair of negative self-views (Hepper,
Gramzow & Sedikides, 2010). The failure to form a cohesive and coherent sense of
self during adolescence impacts negatively upon global self-esteem.
Girls exhibit lower levels of self-esteem than boys across all adolescent
years (Robins, Trzesniewski, Tracy, Gosling, & Potter, 2002), with this gender gap
increasing between 12-16 years (Heaven & Ciarrochi, 2008). It is suggested
biological, cognitive developmental (Robins & Trzesniewski, 2005) and
environmental changes combined with confusion over societal roles may be
instrumental in this difference. In addition, Clay, Vignoles and Dittmar (2005) argue
body image plays a critical role in the girls decline in self-esteem and may be
24
responsible for the large gender differentials in middle adolescence. Moreover, the
pervasive impact of social media use and its negative ramifications on body image
(Holland & Tiggemann, 2016) may also play a detrimental part. Birkeland,
Melkevik, Holsen and Wold, (2012) indicate that from 13 years old onwards body
image is one of the significant predictors of global self-esteem. Physical appearance,
namely the dissatisfaction with physical appearance, becomes a salient component
of global self-esteem. Indeed, there is evidence to suggest that body dissatisfaction
is manifested in lower self-esteem in both girls and boys in adolescence (Paxton,
Neumark-Sztainer, Hannan, & Eisenberg, 2006).
Recently, robust evidence from longitudinal studies highlights systematic
changes in self-esteem over the lifespan (Orth & Robins, 2019). Orth, Erol and
Luciano’s (2018) recent synthesis meta-analysis of longitudinal data of over
164,000 participants gave a precise image of the life-span trajectory, charting an
improvement in self-esteem from age 4 to 11 years, stability from age 11 to 15, an
increase until age 30, peaking at 60, constancy until 70 years of age, a slight decline
until 90, before a steeper decrease at 94 years. The mean-level change pattern held
true across gender, sample type, ethnicity, country, and birth cohort. This contrasts
with earlier findings by Orth, Trzesniewski and Robins (2010) where differences
were noted in terms of gender, ethnicity and educational levels. Females revealed
lower self-esteem than males in young adulthood yet shared a trajectory in old age,
whilst white and non-white participants shared comparable trajectories in young and
middle adulthood although the decline in self-esteem was much more pronounced in
the non-white participants. A similar trajectory was revealed between higher and
lower educated individuals, although the former exhibited increased self-esteem.
25
Cohort (generational) differences have recently been revealed by Twenge,
Carter and Campbell (2017) indicating individuals born in later years (e.g., 1960)
revealed higher self-esteem and a higher probability of experiencing increasing self-
esteem as they grow older compared to participants born earlier (e.g., 1920). This
suggests cultural change in the form of cohort and time epoch may influence
longitudinal and cross-sectional self-esteem findings.
Overall, evidence indicates that self-esteem is a relatively stable, yet
changeable trait, across the life trajectory – low in childhood, increased throughout
adolescence and reduced in middle and old age (Trzesniewski, Donnellan, &
Robins, 2003; Orth & Robins, 2014).
1.5 Domain specific self-esteem
Adolescents reveal complex differentials in self-esteem across relationships
(significant others such as family and peers) and context which leads to the
formulation of the ‘kaleidoscopic self’ (Cooley, 1902, Harter, 2015). Differing
opinions communicated by others are often role and context specific and since
feedback can be contradictory this can lead to confusion and distress. This dis-
equilibrium leads to self-volatility to what Rosenburg (1979) termed the ‘barometric
self’ where varying approval across roles leads to different levels of role specific
self-esteem in each context. Harter, Waters and Whitesell (1997) labelled this as
‘relational self-esteem’. Such volatility influences the overall level of global self-
esteem.
It is therefore important to study the underlying domains of self-esteem
which relate to relationships and context. Accordingly, Harter (1998) proposes that
the self is multidimensional and hierarchal with global self-esteem as the
26
overarching construct at the apex of the hierarchy, underpinned by specific domains
relating to one’s self-esteem in discrete areas. Battle (2002) proposes that global
self-esteem differentiates in middle to late childhood into general, academic, social
and parental (home-related) self-esteem. In early adolescence personal self-esteem
emerges and gauges an individual’s most intimate perceptions of anxiety and self-
worth.
Evidence suggests that global self-esteem differs in terms of stability,
composition and correlations. Harter (1998) argues that domains of self-esteem
expand and change with age, whereas Rentzsch and Schröder-Abé’s (2018), two
year adult (average age 47 years) study suggests that, in terms of mean levels and
rank order, specific domains of self-esteem are relatively stable over time mirroring
global self-esteem. However, idiosyncratic changes in self-esteem were noted more
markedly in younger participants due to susceptibility to personal and
environmental fluctuations.
Rosenberg, Schooler, Schoenbach and Rosenberg (1995) suggest global self-
esteem to be predominately affective in nature and linked to general psychological
well-being, whereas domain-specific self-esteem is predominately evaluative and
judgemental, comprising a more cognitive element with a tendency to be highly
correlated with behaviour or behavioural outcomes.
Numerous self-esteem domains have been explored in the literature
including athletic, appearance, same sex-peer and opposite-sex peer relationships.
However, within this thesis five domains (academic, general, parental, social and
personal) are explored under the overarching global self-esteem. These five domains
comprehensively assess significant contexts in adolescence and are the domains
measured by the instrument of choice, the Culture Free Self-Esteem Inventory
27
assessment, (Battle, CFSEI-3, 2002). These domains are now defined according to
the CFSEI-3 and discussed with reference to existent research.
Academic self-esteem is defined as “an individual’s self-esteem in academic
and intellectual situations and pursuits” (Battle, 2002, p. 4). There is evidence to
suggest that adolescents with high academic self-esteem achieve increased
education levels and higher income levels, although covariates such as parent socio-
economic class and school grades account for most of the relationship (von Soest,
Wichstrøm & Kvalem, 2016). Evidence suggests that low academic performance,
adverse school adjustment and hostile behaviour within the school environment are
linked to low self-esteem (Marsh Parada, Yeung, & Healey, 2001; Marsh,
Trautwein, Lüdtke, Köller, & Baumert, 2006). Moreover, it has been revealed that
bullying or antisocial classroom behaviour is linked to low academic self-esteem
(Hay, 2000; Salmivalli, 1998).
General self-esteem is defined as “an individual’s perceptions about himself
or herself as a person” (Battle, 2002, p. 4). There is scarce reference to general self-
esteem in the literature as by definition it could sit as a subcomponent of the
umbrella term global self-esteem defined as an ‘overall aggregated opinion of
oneself at any one time’ (Battle, 2002, p. 4). However, in accordance with Battle’s
(2002) definition, general self-esteem is investigated as a singular construct in this
thesis as it, with personal self-esteem, the only two domain that encompasses
intrapersonal perceptions.
Parental self-esteem is defined “an individual’s self-esteem within the family
unit” (Battle, 2002, p. 4) and relationships with parents have a significant impact on
adolescents’ views of themselves in that higher levels of self-esteem are associated
with good-quality relationships with parents. Cross-cultural research has highlighted
28
that the overall quality of the parent-adolescent relationship predicts self-esteem
(Harris et al., 2015; Wang & Sheikh-Khalil, 2014; Wissink, Dekovic, & Meijer,
2006). The type of parenting style is crucial – adolescents who exhibit high self-
esteem are more likely to have been raised by warm, encouraging but firm parents
(Milevsky, Schlechter, Netter, & Keehn, 2007; Wouters, Doumen, Germeijs,
Colpin, & Verschueren, 2013). Conversely, if parental feedback is inconsistent,
critical, insulting and not contingent on behaviour, with high parental-adolescent
conflict, there is a propensity for the adolescents to experience poor self-esteem, to
seek self-affirmation from peers, and exhibit problems in coping with adjustment
(Milevsky et al., 2007; Wang & Sheikh-Khalil, 2014).
Social self-esteem is defined as “an individual’s self-esteem in social
situations and interpersonal relationships with peers” (Battle, 2002, p.4), and
evidence suggests adolescents who feel popular and well supported by peers exhibit
high self-esteem (Litwack, Aikins, & Cillessen, 2012). This acceptance by peers
has a positive impact on self-esteem and can also buffer negative ramifications of a
distant relationship with parents (Birkeland, Breivik, & Wold, 2014). In contrast,
adolescents with low self-esteem tend to report weak peer relationships (Vanhalst,
Luyckx, Scholte, Engels, & Goossens, 2013).
According to Battle (2002), the personal self-esteem domain emerges in
adolescence and relates to the individual’s most intimate perceptions of anxiety and
self-worth. Unless the literature specifically utilises Battle’s instrument (e.g.,
Kounenou, 2010), the assessment of personal self-esteem appears relatively diverse.
Kounenou’s (2010) used the CFSEI (Battle, 1992) to demonstrate that personal,
general and social self-esteem domains significantly correlated with physical
exercise; however, no significant correlation was found between self-esteem and
29
substance abuse. In contrast, Du, Bernardo and Yeung (2015) assessed personal
self-esteem with the 10-item Rosenberg Self-Esteem Scale (Rosenberg, 1965). This
measures a sense of self-worth through personal attributes (e.g., ‘‘I am able to do
things as well as most other people’’). Du et al. argued that high scores on this scale
reflects represented higher personal self-esteem. However, such a definition is
incongruent with Battle’s definition in the Culture Free Self-Esteem Inventory
(CFSEI-3, 2002) as it does not reference anxiety; consequently, the heterogeneity of
the operationalisation of personal self-esteem leads to challenges when making
comparisons across studies.
It is apparent that while adolescents evaluate themselves on multiple
dimensions and relationships (Harter, 2012, 2015), they view their abilities more
positively in some domains than others. Positive self-esteem is nurtured when
adolescents evaluate themselves favourably in domains that they consider
significant: this is revealed in the field of athleticism (Findlay & Bowker, 2009;
Wagnsson, Lindwall, & Gustafsson, 2014). In addition, those adolescents with
higher academic self-esteem are more likely to work harder and excel in that domain
achieving higher marks (Preckel, Niepel, Schneider, & Brunner, 2013). The
ramifications of excelling in one domain (i.e., athleticism) spillover into other
domains in terms of positive self-evaluations. There is evidence to suggest that
social, physical and appearance domains (Marsh, Trautwein, Lüdtke, Gerlach, &
Brettschneider, 2007; Stein, Fisher, Berkey, & Colditz, 2007) feed into global self-
esteem.
Divergent evidence exists regarding the interplay between the specific self-
esteem domains and global self-esteem. Von Soest, Wichstrøm and Kvalem (2016)
reported increasing age (from 13 to 31 years) to be associated with improvements in
30
both global and most domain specific categories (social, academic, athletic and
appearance). Appearance self-esteem showed high and consistent correlation with
global self-esteem whereas the link between social self-esteem and global self-
esteem increased with age. However, Harris, Wetzel, Robins, Donnellan, and
Trzesniewski (2018) suggested that, in terms of mean level change, global self-
esteem and specific self-esteem domains (physical, academic, same-sex peer
relationship) decreased during adolescence (10-16 years). Only opposite-sex peer
relationship self-esteem increased. Although most specific self-esteem domains
were concurrently related to global self-esteem, with academic self-esteem
displaying the strongest associations, they failed to predict fluctuations in global
self-esteem over time.
In recognition that domains of self-esteem feed into the overarching global
self-esteem, it is of importance that the domains themselves are investigated in
adolescents to give a richer perspective to self-esteem. Indeed, deficiencies in one
domain could then be targeted for enhancement and consequently increase global
self-esteem.
1.6 Low self-esteem in adolescence
Self-esteem is a crucial need of humans and represents one of the most
significant variables influencing an individual along their developmental timeline,
affecting achievement, abilities, social interactions and mental well-being (Orth &
Robins, 2019). Empirical evidence indicates that adolescents experiencing low-self-
esteem may also experience a wide spectrum of mental health difficulties and social
problems. These include internalising problems, for example, anxiety, (In-Albon,
Meyer, Metzke, & Steinhausen, 2017), depression (Orth, Robins, & Roberts, 2008;
31
Keane & Loades, 2017) and eating disorders (Courtney, Gamboz, & Johnson,
2008). Indeed, during adolescence, Orth and Robins (2014) suggest that low self-
esteem is associated with depression and is predictive of depression in adulthood. A
longitudinal study of over 1,500 12-16 year old adolescents by Steiger, Allemand,
Robins, and Fend (2014) measured self-esteem annually and discovered both level
and change in self-esteem was predictive of depression at 16 and 35 years old. If
adolescents began with low self-esteem and this decreased further during the
adolescent years, the adolescent was more likely to exhibit depression as an adult 20
years later: such a pattern was also found in global and domain-specific self-esteem
(physical appearance and academic competence).
As well as internalising problems, low self-esteem manifests in externalising
problems such as violence and substance abuse (Donnellan, Trzesniewski, Robins,
Moffitt & Caspi, 2005; Mann, Hosman, Schaalma, & De Vries, 2004), bullying
(O'Moore & Kirkham, 2001), and disparaging others (Collange, Fiske, & Sanitioso,
2009). Longitudinal research following New Zealand adolescents over a twenty year
period revealed that those with low self-esteem exhibited poor physical and
psychological health with a higher risk of engaging in criminal behaviour at age 20
(Trzesniewski, Donnellan, Moffitt, Robins, Poulton, & Caspi, 2006). In this context,
low self-esteem can be regarded as a risk factor.
Indeed, Paradise and Kernis (2002) investigated fragile self-esteem and the
extent to which the level and stability of self-esteem predicted scores on a
multidimensional measure of psychological well-being (self-acceptance, autonomy,
purpose in life, positive relations with others, environmental mastery, and personal
growth) (Ryff, 1989). High self-esteem was more correlated with increased well-
being than was low self-esteem. Indeed, there is evidence that self-esteem can
32
function as a protective factor, moderator, mediator, and an outcome of emotional
well-being (Lee & Hankin, 2009; Tambelli, Laghi, Odorisio, & Notari, 2012; Laghi,
Pallini, D'Alessio, & Baiocco, 2011).
As positive self-evaluations are correlated with the ability to cope well with
transition and good sociability levels in adolescents of all ethnic and socio-economic
groups, low self-esteem is linked to poor coping to adjustments and depression
(Burwell & Shirk, 2006; McCarty, Stoep, Vander, & McCauley, 2007). Low self-
esteem is also implicated in educational outcomes (Trautwein & Lüdtke, 2006;
Alesi, Rappo & Pepi, 2012). The relationship between how individuals feel about
themselves and their level of achievement was originally considered to be bi-
directional; however, most recent findings illuminate that self-esteem is an outcome
of achievement rather than a resource (Trautwein, Lüdtke, Marsh, Köller, &
Baumert, 2006; Tetzner, Becker & Maaz, 2017). In other words, increased academic
achievement predicted increased self-esteem, but not vice versa. In addition, within
the school environment, low self-esteem is frequently seen to predict the use of
maladaptive strategies which manifest in self-handicapping and learned
helplessness. Those adolescents with low self-esteem exhibit a high use of
maladaptive strategies. In contrast, more adaptive achievement strategies are
utilised by adolescents with high self-esteem (Aunola, Stattin, & Nurmi, 2000).
Since it is well documented that the self-esteem of vulnerable adolescents is
compromised compared to their typically achieving peers, the literature will now be
discussed with reference to two ‘at risk groups’, i.e., early adolescents with dyslexia
and disengaged adolescents at risk of becoming long term NEETs.
33
1.6.1 Adolescents with dyslexia
Dyslexia is a Specific Learning Difficulty (SpLD) which presents in varying
forms and whose symptoms are assessed by standardised tests to measure whether
achievement in reading (i.e., reading accuracy, speed or comprehension) “falls
substantially below that expected given the individual’s chronological age,
measured intelligence, and age appropriate education” (DSM-IV, 1994).
Extensively studied since its first identification by Morgan (1896), Kirk
(1963) defined dyslexia as a type of learning disability which was characterised by
“an unexpected difficulty in learning one or more of one instrumental school
abilities” (Kirk, 1963). This “unexpected difficulty” led to the “principle of
discrepancy” criteria which historically underpinned the definition of dyslexia.
Discrepancy had been classified as a twofold construct: through the “discrepancy
criterion” (Bateman, 1965) referring to the discrepancy between general abilities
levels (e.g., reasoning) and specific learning abilities; and secondly the “low
achievement criterion” which referenced the discrepancy between the level of
achievement in specific instrumental school abilities and school level.
Dyslexia often gives rise to inconsistent academic achievement profiles
which can impact on individual learning, social and emotional well-being (Long,
MacBlain & MacBlain, 2007). This spiky uneven development profile highlights the
discrepancy between reading age and cognitive potential; however, the newly
diagnostic criteria for the DSM-V (2013) omits this ‘discrepancy criterion’ (Petretto
& Masala, 2017). Furthermore, the removal of ‘dyslexia’ as a discrete entity with
the ‘Specific Learning Disorder’ category of the DSM-V (2013) and its subsequent
inclusion in the ‘Neurodevelopmental disorders’ has provoked much debate.
Colker, Shaywitz, Shaywitz and Simon (2012) argued for a discrete category for
34
dyslexia due to the vast scientific and clinical knowledge base underpinning the
diagnosis compared to less well documented ‘Other Learning Disorders’. At odds
with these comments, the inclusion of dyslexia in the ‘Neurodevelopmental
disorders’ group was decided upon under the single overarching terminology of
“Specific Learning disorder with impairment (….in a specific academic ability)”
(American Psychiatric Association, 2013).
Developmental dyslexia effects approximately 5-15% of the population and
is typically identified and diagnosed in childhood during the years of formal
education (Peterson & Pennington, 2012). Dyslexia is reported to affect more boys
than girls (Rutter et al., 2004, Quinn & Wagner, 2015); however, this gender
differential is increasingly debatable, with some researchers claiming dyslexia in
girls is reported less due to masking strategies, whilst boys’ tendency to externalise
brings more attention to their struggles (Hawke, Wadsworth, Olson, DeFries, 2007).
Furthermore, Haywood, Máirtín Mac an Ghaill and Allan (2015) suggest that the
feminisation of pedagogical strategies combined with the restless nature of boys,
boys’ pre-disposition to kinaesthetic and experiential learning, and the lack of male
role models have had a damaging effect on typically developing boys’ experience of
education.
For individuals with dyslexia, learning difficulties manifest in inaccurate,
non-fluent word recognition and spelling, even when adequate instruction and
sensory ability are present (Lyon, Shaywitz & Shaywitz, 2003). It is important to
note that the constellation of difficulties can include poor handwriting, reduced
reading experience, stunted vocabulary growth and background knowledge and
difficulties with reading comprehension or maths reasoning (Lowell, Fenton, &
Hook, 2014). For competent readers, acquiring meaning from print speedily is an
35
efficient, effortless and enjoyable process. However, for children with dyslexia,
difficulties transform reading into a frustrating, disenabling, time-consuming and
disempowering experience (Lyon, Shaywitz, & Shaywitz, 2003).
The ‘Automisation Deficit Hypothesis’ proposed by Nicolson and Fawcett
(1990) suggests that deficits in automaticity (controlled by the procedural system)
are present particularly in literacy and numeracy skills which result in individuals
with dyslexia experiencing processing overload when instructed to perform novel or
complex tasks. Motor skills are also affected, specifically balance. These lower
automatic skills, weaker phonology and orthography, and delayed executive
function (e.g. cognitive flexibility and attention control which impacts developing
resilience and coping with stress) are the three difficulties faced by adolescents with
dyslexia in the school environment. Nicolson (2015) argues an inability to
‘consciously compensate’ for all these three difficulties leads to failure to learn and
‘mental scratches’. If there is a continuation of formal teaching strategies, these
‘mental scratches’ exacerbate into deeper ‘mental abscesses’ with the resultant
disturbance to literacy learning. Such negative effects on reading result in anxiety,
anger and frustration which alone are documented to decrease working memory
(Morey, Dolcos, Petty, Cooper, Pannu Hayes, LaBar, and McCarthy, 2009).
Furthermore, as a result of this stress the brain switches state from the flexible mind-
based ‘declarative’ learning system to the brain-based ‘fight, flight or freeze’
defensive procedural system (Nicolson, 2015). In other words, chronic stress
impairs the learning of adolescents with dyslexia by forcing them from their
preferred declarative processing path to the weaker procedural processing route.
At risk of life-long illiteracy and social exclusion (Alexander-Passe, 2008,
2012; Kirk & Reid, 2001; Morgan & Klein, 2003) dyslexia has ramifications for
36
academic success but also for self-esteem and social-emotional development.
Retrospective adult narratives have profiled negativities, developmental delays and
lack of opportunity stemming from the inability to read, write and spell proficiently
in childhood (Gibson & Kendall, 2010; Glazzard, 2010, 2012; Long, MacBlain &
MacBlain, 2007; Nalavany, Carawan, & Brown, 2011). Convergent literature has
revealed that adolescents with dyslexia burdened by low self-esteem are subjected to
low expectations and are diminished in their ability to pursue their dreams
(Humphrey, 2002; Alexander-Passe, 2006). Adolescents with dyslexia are also
reported to experience anxiety, depression and feelings of inferiority which impact
on educational progress (Anderson & Meier-Hedde, 2017). Research has also
revealed correlations between heightened anxiety and depression and low self-
esteem. Mammarella, Ghisi, Bomba, Bottesi, Caviola, Broggi, and Nacinovich
(2016) found that children (8-11 years old) with reading deficits reported
experiencing more generalised and social anxiety as well as more depressive
symptoms. The role of emotion in reading-writing performance has been shown to
result in a higher level of anxiety in children with dyslexia (Nelson & Harwood,
2011). Moreover, Mugnaini, Lassi, La Malfa, and Albertini’s (2009) comprehensive
review found dyslexia to be a specific risk factor for anxiety and depression.
Individuals with dyslexia in the school environment may experience low
self-esteem and this affects learning and performance. Low self-esteem may stem
from a plethora of reasons. Negative experiences at school may result in feelings of
failing to achieve academically (Humphrey, 2002). Most studies reveal the impact
of dyslexia on low academic self-esteem and highlight the effect of context (Burden
& Burdett, 2005) or gender (Alexander-Passe, 2006). Individuals with dyslexia may
also compare themselves to their peers who are not struggling academically, which
37
may then have an impact on their self-esteem (Gurney, 2018). Indeed, children with
dyslexia are also at greater risk of being bullied by their peers (Mishna, 2003),
which results in lowered self-esteem (Singer, 2005). Within the classroom, the
consequences of low self-esteem may lead to a lack of confidence in taking
responsibility for learning needs (Reid, 2011), resulting in reduced motivation to
succeed (Pintrich, 2003). Furthermore, Nicolson (2015) purports that individuals
with dyslexia perform better with a sense of purpose focussing on goal pulls rather
than goal push. A goal push is a goal that an individual pushes themselves to
complete, a forced hard dynamic driven by pressure and willpower, whereas a goal
pull is a goal that an individual feels naturally drawn towards, a natural and
effortless dynamic driven by passion and dedication.
The inability to have control over their learning successes or failures can
lead to ‘learned helplessness’ (Peterson, Maier, & Seligman, 1993). Burden (2008)
cites Humphrey and Mullins (2002) proposition that the parallels between learned
helplessness and children with reading difficulties are ‘striking’. These feelings of
impotence and inefficiency can permeate from the classroom into other contexts
effecting social interactions with peers (Nash, 2008). School can be a disenabling
and damaging environment with profound negative lifelong implications
(Alexander-Passe, 2006). Indeed, Nicolson (2015) contends that such adverse
experiences make dyslexia an ‘acquired learning disability’. Lyon, Shaywitz and
Shaywitz (2003) argue that school for a student with dyslexia is a disenabling
strengths environment and the legacy of the current schooling system is the erosion
of confidence, lack of motivation and goal setting and a negative outlook.
Further evidence investigating the self-esteem and psychosocial adjustment
of 68 children with dyslexia (mean age 11.2 years) suggests that children and
38
adolescents with dyslexia exhibit low self-esteem (Terras, Thompson & Minnis,
2009). Findings revealed no deficit in global self-esteem; however, academic self-
esteem was markedly lower than the general population. Moreover, rates of social,
emotional and behavioural difficulties were significantly increased when compared
to the general population and correlated well with self-esteem.
Ingesson’s (2007) interviews with 75 teenagers and young adults with
dyslexia explored school experiences in terms of well-being, educational
achievement, self-esteem, peer relations and belief in their future. Failure and
distress permeated early grades years with incidents of bullying. Later school years
difficulties seemed limited to reading and writing abilities, resulting in low
academic self-esteem. The young participants with dyslexia were encouraged to
engage in their strength subjects in order to view themselves in a positive light. In
retrospective research with adults with dyslexia, Undheim (2009) also found
evidence for lower academic self-esteem and reduced educational attainment.
Furthermore, Glazzard and Dale (2013) highlight the positive impact of empathetic
teachers and the negative effect of the teachers lacking empathy and patience on
self-concept.
Glazzard’s (2010) study of 14-15 years old adolescents with dyslexia in
mainstream school centred around individual semi-structured interviews which
focussed specifically on the effect of dyslexia. The significance of peer comparison
and impact of teachers, peer and family on self-esteem was underscored. This study
highlighted that the main contributor to students’ self-esteem was a positive early
diagnosis of dyslexia and the subsequent ‘ownership’ of this label. The diagnosis of
dyslexia as a genuine specific deficit, in contrast to a general learning difficulty,
appeared to be a defining juncture in terms of identity and self-esteem for these
39
adolescents, in line with earlier findings by Riddick (1995). Taylor, Hume and
Welsh (2010) suggest that those labelled earlier in development have consequential
higher self-esteem levels, equating this to longer support and a protracted period of
acclimatisation. The timing of a dyslexia diagnosis was linked to adolescent
competency perceptions, in that an earlier diagnosis results in increased general and
academic competency perceptions (Battistutta, Commissaire & Steffgen, 2018).
Careful explanation of dyslexia and encouragement to excel in areas of perceived
positivity is also important. However, on the other hand, early diagnosis can be
perceived as a non-enabling practice where the child grows into the label and lives
their life accordingly. There is ongoing controversy whether it is in the child’s best
interest to label or not label a child as dyslexic whilst Elliott and Grigorenko’s
(2014) ‘dyslexia debate’ questions the scientific existence of dyslexia, arguing that
the dyslexia label is conceptually perplexing and may be the embodiment of the
middle class badge for illiteracy.
Notwithstanding the convergent evidence linking dyslexia and low self-
esteem, it must be noted it is harder to isolate specific correlations with dyslexia due
to co-occurrences with other learning difficulties. Furthermore, small sample sizes
and the preponderance of self-report measures limit the generalisability of findings
in the wider adolescent population. Caution must also be taken when considering
retrospective narratives in terms of accuracy and that memories associated to strong
emotions are more likely to be recalled and discussed more frequently
(Christianson, 1992).
Contrary to the deficit model, a strengths-based perspective on dyslexia is
taken by the ‘Positive dyslexia’ movement (Nicolson, 2012) which consists of
positive diagnosis of strengths, positive ambitions, positive acceleration and positive
40
career. This represents a paradigm shift from the focus upon weaknesses often
reported in relation to this developmental disorder. Further embracing this ‘dyslexia
upside hypothesis’, Gladwell (2013) considers dyslexia a ‘desirable difficulty’,
believing those who have developed significant compensatory strategies due to
facing adversity are a societal necessity.
Central to this dyslexia strengths debate is the ‘Delayed Neural Commitment
Hypothesis’ postulated by Nicolson and Fawcett (1990, 2007, 2015). Such a
hypothesis is underpinned by the ‘Automatisation deficit hypothesis’ referred to
earlier. This hypothesis suggests that as children with dyslexia are relatively slow to
automate skills (especially language based) and create/recreate neural networks,
they therefore exhibit ‘delayed neural commitment’. This is beneficial in some
situations, namely when it is advantageous to maintain earlier skills or when useful
to combine two separate skills which are not within the same developmental ‘time
window’. This delayed neural commitment can therefore facilitate retention of
access to pre-linguistic abilities and allow the merging of knowledge from two
disparate domains.
Since adults with dyslexia rely predominately on their declarative
(knowledge based) skills instead of on their procedural skills, this facts and verbal
knowledge base continues to expand and improve. In comparison, once a habit or
procedure is learned through procedural memory process there is no further
enhancement. Struggles at school means pupils with dyslexia necessitate asking for
and receiving help from others and problem-solving techniques – such skills are not
targeted in children without dyslexia. This ‘Delayed Neural Commitment
Hypothesis’ theory, therefore, exposes critical advantages in specific cognitive and
41
interpersonal strengths that individuals with dyslexia possess if channelled into
relevant careers.
Prevett, Bell and Ralph (2013) identified three gaps in the current dyslexia
literature that needed to be developed: narrative methodology, identity of children
and adolescents with dyslexia in education and the application of a strengths-based
perspective. It is evident that the impact of dyslexia on the day-to-day well-being of
the child or adolescent with dyslexia should be uppermost in the minds of
practitioners, parents and researchers. It is therefore through a strengths-based
perspective and through the promotion of positive emotions that the strengths profile
of male adolescents with dyslexia is explored within this thesis.
1.6.2 Adolescents at risk of becoming NEET
The acronym NEET was first coined in the United Kingdom to refer to
young people who are Not engaged in Education, Employment and Training. In
April-June 2018, according to Powell (2018) there were 729,000 18-24 year olds
(13%) and 55,000 people aged 16–17 (4%) classified as NEET in the UK. These are
only slighter higher than figures published by the UK Office for National Statistics,
revealing there are 760,000 young NEET people (aged 16 to 24 years) (July-
November, 2018 bulletin). Across all state-funded schools in England the
percentage of young people who are ‘persistent absentees’ is nearly 11% (DfE
2018).
There is sustained concern within policy discourses in the UK about the
number of NEETs (Mawn et al. 2017). Evidence suggests when adolescents are
engaged with school, academic motivation is increased and school success is
facilitated (Fredricks, Blumenfeld, & Paris, 2004). Ramifications of being NEET are
not limited to the school environment, with research indicating poorer mental and
42
physical well-being, an increased risk of depression in early adulthood (Social
Exclusion Unit, 1999) with drug and alcohol dependence (Godfrey, Bradshaw, &
Hutton, 2002).
Empirical findings indicate that engagement is a multidimensional concept
(Glanville & Wildhagen, 2007). Three concepts have been revealed to be pivotal to
understanding the difficulties underpinning disengagement in adolescents. Firstly,
students can be disengaged at various levels such as content, class, school and or the
entire educational process. Secondly, engagement is seen as a three-dimensional
construct comprising behavioural, cognitive and emotional types (Fredricks
Blumenfeld, & Paris, 2004). Behavioural engagement considers the behaviour
exhibited by students in the school context as positive (i.e., good attendance) or
negative (i.e., truancy). Cognitive engagement is exhibited in students’ motivation
to give time and effort in comprehending the subject matter and comprises
perseverance in the face of academic challenges (Rumberger, 2004). Emotional
engagement incorporates interest in their academic study and sense of belonging to
school (Sciarra & Seirup, 2008) or, in contrast, boredom with schoolwork and
disidentification with school. However, little uniformity in defining emotional
engagement led Davis, Chang, Andrzejewski, and Poirier (2010) to suggest such a
definition is referring to relational engagement. Thirdly, interactions between these
levels and types of disengagement result in different outcomes; for example,
emotional disengagement from the educational system may be shown in a lack of
school connectedness, whereas behavioural disengagement with class content may
be revealed as poor classroom behaviour. Furthermore, research findings suggest
that lower grades and a higher probability of dropping out of school are rooted in
behavioural, emotional (Janosz, Archambault, Morizot, & Pagani, 2008), and
43
cognitive (Steinmayr & Spinath, 2009) disengagement. Moreover, Li and Lerner
(2013) demonstrated that behavioural and emotional engagement had a bidirectional
relationship, and that behavioural engagement impacted cognitive engagement (but
not vice versa).
According to Rumberger and Lim (2008), the factors influencing student
disengagement can be divided into individual, which focus on the student, and
institutional elements, which are associated to the family environment, social and
educational context. Notably, it is a combination of both individual and institutional
elements that uniquely impact the student in the process of disengagement
(Rumberger & Rotermund, 2012).
1.6.2.1 Individual factors impacting student disengagement
Low self-esteem (Henderson, Hawke, Chaim, & Network, 2017) is one of
multiple indicators exhibited in students at risk of school disengagement (Finn &
Voelkl, 1993; Fredricks Blumenfeld, & Paris, 2004; Régner & Loose, 2006).
Utilising data from the Longitudinal Study of Young People in England, Mendolia
and Walker (2014) demonstrated that low self-esteem increases the chances of
experiencing NEET and remaining in this condition for at least two years.
There are conceptual theories regarding the process of disengagement and
self-esteem. Finn (1989) regards school dropout as the final stage of a dynamic and
cumulative process of school disengagement, whilst underscoring the crucial role of
school achievement in both the students’ perception of self and their identification
with their school. In the frustration–self-esteem model, Finn (1989) suggests the
behavioural disengagement process emanates from the adolescent’s frustration as a
result of constant repetitive failures in school which culminate in low self-esteem. In
order to preserve their self-esteem, the adolescent rejects school, exhibits
44
problematic behaviour and may shows signs of withdrawal (Finn, 1989; Rumberger
& Lim, 2008). Such a process can be likened to learned helplessness.
Moreover, the relationship between disengagement and self-esteem has been
explored in terms of psychological disengagement where a defensive detachment of
self-esteem from a specific domain is exhibited – this detachment within the school
context relates to academic self-esteem. It is argued that the lower the academic
self-esteem, the higher the disengagement from school. This is understandable since
academic self-esteem is a division of global self-esteem (Harter, 1998) and a decline
in academic self-esteem (for example due to poor grades) is likely to impact
negatively on global self-esteem. However, this threat to global self-esteem stems
from the decline in academic self-esteem not the poor grades received. In situations
like this, when a student’s global self-esteem is under threat or undermined, students
may disengage psychologically from the academic domain in order to self-protect
(Crocker & Major, 1989; Crocker, Major & Steele., 1998; Steele, 1997).
There is evidence to suggest that disengagement can result from two
processes – devaluing and discounting. Devaluing academic success is where the
significance of academic success is decreased to the extent where they no longer
consider it as a self-relevant domain, whereas discounting the validity of academic
outcomes is a process where the significance of grades received is decreased by
perceiving them as biased measures of their ability (Major & Schmader, 1998;
Schmader, Major, & Gramzow, 2001).
Loose, Régner, Morin and Dumas (2012) reported that discounting is
positively associated with global self-esteem, and this holds true for adolescents
with lower academic self-esteem. Discounting was unrelated to grades and
achievement goals. In contrast, devaluing was unrelated to global self-esteem,
45
negatively associated to all achievement goals and linked to lower grades (Loose,
Régner, Morin, & Dumas, 2012). The researchers concluded that discounting was a
genuine self-protective strategy, shielding self-evaluation without lessening the
motivation to succeed, whereas devaluing represents a maladaptive strategy, with no
enhanced self-evaluation and with a detrimental impact on grades and the
motivation to succeed.
Poor attitudes regarding school and future aspirations can also predict
whether an adolescent becomes NEET; indeed, 42% of 14 year olds who strongly
disagreed that a job was important were NEET four years later (Department for
Children, Schools and Families, 2008). Furthermore, chronic illness, disability or
mental health difficulties (Department for Children, Schools and Families, 2009) are
further factors in disengagement. The misuse of drugs or alcohol dependence is also
a risk factor – 71% of NEET adolescents are reported to use drugs compared to 47%
of their peers (Social Exclusion Unit, 1999). According to statistics from the
Department for Children, Schools and Families (2005, 2008), persistent truants are
over five times more likely to become NEET at 16 years of age than those who have
never been truant; moreover, of those adolescents excluded in years 10 and 11, 21%
became NEET.
It has also been noted that there is an overrepresentation of boys in the
NEET population, with boys reported to be 20% more likely to be NEET aged 16-
18 years old than girls, (Institute for Public Policy Research, 2009); however,
internationally young girls are most at risk of becoming NEET, perhaps due to
young parenthood (OECD, 2015).
46
1.6.2.2 Institutional factors impacting student disengagement
Aside from individual risk factors for disengagement, institutional factors
such as family, social and school context influence whether a student disengages.
Students from low income households (Department for Children, Schools and
Families, 2009), students from ethnic minority groups (Department for Children,
Schools and Families, 2008), students whose families give minimal educational
support or who do not value education (Rennison, Maguire, Middleton & Ashworth,
2006) are all at greater risk of disengagement, in addition to parents’ or parental
employment status (Payne, 2000) and carer responsibilities (Rennison et al., 2006).
In combination with the plethora of interconnected individual level
variables, growing evidence suggests there are school-based factors that increase the
chance of becoming NEET (Freeman & Simonsen, 2015). These school level
determinants include for example, school size, academic pressure, bullying, peer
pressure, and lack of pastoral support (Conchas & Rodriguez, 2007). In addition,
frequent school absences, failure to form connections to peers, school or teachers,
low academic attainment (Department for Children, Schools and Families, 2008) are
also considered risk factors for disengagement. School organisation and structure
may also play a significant part in disengagement in terms of their policies, poverty
concentration, offered courses, and student-teacher relationships (Lee & Burkam,
2003, Rumberger, 2011, Rumberger & Thomas, 2000). Furthermore, Bielby,
Judkins, O'Donnell and McCrone (2012) emphasise the significance of a good
relationship with just one adult can influence student engagement and learning and
how at risk a student is considered at school. There is also evidence to suggest that,
after considering individual student characteristics, students have a greater
propensity to disengage from a school that is perceived to have a high percentage of
47
students with behavioural problems or an unfair disciplinary system (Wehlage,
1986). Research suggests school characteristics account for a significant variation in
student disengagement after individual student and family context have been
accounted for (Goldschmidt & Wang, 1999).
In order to counter disengagement, some argue for the introduction of a
systematic, tiered, preventative strategy to reduce the number of students
disengaging from the schooling process (Mac Iver & Mac Iver, 2010). Others
propose the positive collaboration of schools and communities to verify that
activities and interventions within schools are administered within a culturally and
contextually appropriate manner (Sugai, O’Keeffe, Fallon, (2012).
González-Rodríguez, Vieira and Vidal (2019) favour an integrated and
concentric approach, aligned with Bronfenbrenner’s (1992) ecological systems
theory. The student is centred at micro-level; the institutional/social context such as
school, friends, family, teachers and peers represent the meso-level, whilst structural
interconnections between the other levels are embedded within the macro level.
Such a perspective acknowledges the co-existence of different variables associated
with the student (Tomaszewska-Pękała, Marchlik & Wrona 2017). An individual
student’s trajectory is contingent on the specific context and their variables
interactions with each other at macro-level. González-Rodríguez, Vieira and Vidal
(2019) contend the most predominant groups of variables linked to disengagement
are those related to individual characteristics and those related to the family which
accounted from 76% of the variance in their model.
Overall, research has highlighted that influenced by both individual and
institutional factors disengagement from school can be defined as both a process and
outcome. In other words, a student’s absenteeism may indicate disengagement from
48
school, but it also signifies a risk factor for other indicators of disengagement such
as leaving school early. However, Demanet, and Van Houtte (2014) argued that
inconsistent conceptualizations of ‘engagement’ undermine its scientific validity
and rigour (Fredricks, Blumenfeld, & Paris, 2004; Johnson et al., 2001). Indeed,
Manlove (1998) correlated ‘engagement’ with the time students spend completing
their homework or revising for tests, whilst, Ryan and Patrick (2001) considered
engagement as self-regulated learning and conforming behaviour and Finn (1989)
highlighted participation and identification with school. According to Libbey
(2004), the situation has been further confused by interchangeability of the term
engagement with school climate, attachment, bonding, teacher support and
involvement.
Inadequacies lie in lack of clarity of definition, inaccuracies in quantifying
the number of under 18’s in the group and ill-informed stereotyping of NEET
characteristics (Maguire, 2015). Moreover, limitations are also evident in failing to
have fixed universal criteria for the characteristics associated with those students at
risk of temporary disconnection from learning. This is normally gauged by a
combination of ‘hard’ outcome measures (low levels of attainment/achievement,
lack of commitment) and ‘softer’ behavioural or attitudinal measures. However,
Filmer-Sankey and McCrone’s (2012) findings indicate that adolescents at risk of
temporary disconnection tend not to exhibit complex needs and therefore may not
be found by the traditional indicators of NEET risks.
It is therefore evident that the NEET group is heterogeneous comprising
young people with a plethora of characteristics, needs, attributes and goals.
Crawford, Duckworth, Vignoles and Wyness (2011) report that almost half of those
who are NEET at 17/18 years old are still NEET a year later, emphasising the
49
persistent nature of becoming NEET and underscoring the importance of addressing
the issues of those at risk of becoming NEET.
Indeed, Spielhofer’s (2009) statistical segmentation of the NEET
classification distinguished three broad subgroups: sustained, ‘open to learning’ and
undecided. Since over 3/5th of NEETs fell into the last two categories, it is suggested
that these young people could have been prevented from becoming NEET if
targeted by effective interventions. The Audit Commission (2010) suggests that re-
engaging 14-16 year olds at risk of temporary disconnection from learning would
facilitate post-16 resources being consolidated and directed towards a smaller
sustained group. Indeed, interventions targeting those at risk of NEET appear to be
more effective than intervening with those adolescents already disengaged
according to Public Health England (2014).
1.7 Rationale underlying adoption of a mixed methodology
The multi-dimensional construct of self-esteem has been discussed with
reference to both adolescents with dyslexia and disengaged adolescents. Taking into
consideration that the literature highlights the prevalence of low self-esteem within
both these vulnerable adolescent groups, it is important to view their self-esteem
through multiple lens. Indeed, the rationale underpinning the adoption to take a
pluralistic approach is that it is only though the amalgamation of qualitative and
quantitative methodology that a truly holistic and representative picture of the
adolescent is obtained. This stance is diametrically opposed to the argument posited
in the “Incompatibility Thesis” where it is argued that quantitative and qualitative
research paradigms must never be interwoven (Howe, 1988). Such a perspective is
50
perpetuated by researchers that deem both epistemology and method inseparable
(Howe, 1988, 1992).
Epistemology is considered a branch of philosophy related to the nature,
origins and limitations of knowledge in combination with the justification of truth
claims. Epistemology does not specify data collection and analysis methodology
(Onwuegbuzie & Leech, 2005). Every researcher adopts a stance regarding what
constitutes acceptable knowledge and in doing so can be categorised as a pragmatist,
situationist or purist (Rossman & Wilson, 1985). Each category is situated on a
continuum dependent on how far they believe qualitative and quantitative research
can be interwoven. Purists advocate mono-methodology underpinned by the belief
that it is incompatible to blend paradigms that perceive the world and what is
considered critical knowledge differently. Although situationists see the merit in
both methodologies and admit they may be complimentary, the superiority of mono-
methodology is underscored. According to Newman and Benz (1998), those who
adopt a pragmatic approach believe that a false dichotomy lies at the centre of the
quantitative and qualitative debate. In other words, quantitative methods may not be
positivist (with its scientific focus on causality and generalisations where only
observable phenomenon yield credible data) and indeed qualitative data generation
may not always be deemed hermeneutic, i.e., a subjective interpretivism with a
focus on the details underpinning reality (Daft, 1983; Miller & Fredericks, 1991).
Indeed, pragmatists propose the integration of methodology within a single study
(Cresswell, 1995, 2013).
The benefits and drawbacks of conducting mixed-methods research has been
addressed in the literature (Creswell & Clark 2011; Johnson & Onwuegbuzie, 2004).
In terms of strengths, mixed methodology, by rejecting traditionalist dualism, aims
51
to bridge the divide between the purely quantitative and the purely qualitative
paradigm, by producing research more aligned with practice. This endorsement of
practical theory which informs effective practice is preferred to the philosophical.
Indeed, knowledge is perceived as being both constructed and emanated from the
reality of individual experiences which are constantly evolving and adapting to new
environments and situations. Indeed, a mixed method approach allows an
opportunity for researchers to integrate both quantitative and qualitative design
elements that provide the best chance of answering a wider and more
comprehensive set of specific research questions (Hoshmand, 2003; Johnson &
Onwuegbuzie, 2004). Consequently, such an approach can yield more robust
support for a conclusion through the convergence and corroboration of results, and
potentially increase the generalisability of the findings. In sum, utilising a
combination of quantitative and qualitative methodology may provide a more
holistic knowledge base which is crucial in informing theory and practice. In terms
of drawbacks, mixed methodology can be more time-consuming and costly
especially when conducting concurrent research. Some research methodology issues
need further confirmation and clarification such as the interpretation of conflicting
findings and the methods of qualitatively analysing quantitative data. Some purists
believe that adopting a pragmatist perspective may advance only incremental
change rather than more fundamental societal change.
However, in sum, reflecting that both subjective meaning and observable
phenomena can demonstrate knowledge, and that integrating these complimentary
perspectives help interpret the data, both research methodologies are considered best
fitting to address the research questions posed throughout this thesis. A pragmatic
52
approach is therefore adopted in the belief that qualitative and quantitative findings
can be bound by an intrinsic synergy to explore adolescent self-esteem.
1.7.1 A quantitative approach
Positive attributes and strengths are intrinsic to all life domains and are
defined in a multitude of ways by the different researchers. However, the lack of
valid and reliable strengths-based assessments prompted researchers (Epstein &
Sharma, 1998; Peterson’s & Seligman, 2004; Rawana & Brownlee, 2011) to
formulate their own self-report instruments stemming from their specific viewpoints
to measure strengths. These instruments are used within this thesis and their
psychometric properties are discussed within the Materials Section.
Seligman and Csikszentmihalyi (2000) formulised the construct of positive
psychology as a backlash to a century preoccupied by psychopathology and the
deficit model of disability. Such a positive psychology perspective is adopted
throughout this thesis, in that although weaknesses are acknowledged, attention is
focussed upon strengths which are nurtured to allow individuals to flourish and
optimise their potential. Keyes (2002) defines ‘flourishing’ as to be filled with
positive emotion and to be functioning well psychologically and socially; indeed,
Fredrickson and Losada (2005) view flourishing as the antithesis of the pathology
and languishing embodied in a vacuous life. However, the research underpinning
their proposition that flourishing occurs when the ratio of positive emotions to
negative emotions surpasses a 3:1 ratio has been highly debated and after much
contention has been retracted.
The ‘positive psychology’ movement questions whether the purpose of
education is solely to develop young people’s academic abilities or if it should
encompass nurturing the spectrum of character strengths - tools for well-being that
53
are required to live fulfilled and successful lives. According to Fox (2008),
specified outcomes, learning expectation and pre-determined subject requirements
dampen holistic development, intrinsic motivation and strengths development and
undermine true immersion in the learning process. In the school context, Linkins,
Niemiec, Gillham and Mayerson (2014) argue for a more individualized approach to
the recognition and use of character strengths as distinguished from the monolithic
and one-size-fits-all (traditional) character approaches that have predominated.
Consequentially, the construct of positive education developed which
encompasses education for both traditional skills as well as for happiness (Seligman,
Ernst, Gillham, Reivich, & Linkins, 2009). Some schools are recognising the need
to develop the ‘whole child’ with emphasis on well-being (Huitt, 2011; Linkins,
Niemiec, Gilham, & Mayerson, 2014). Furthermore, Margolis and McCabe (2004)
argue that both experiences and subjective traits play a crucial role in education as
the student learning should be both positive and appropriately challenging.
In concurrence with the positive psychology principles, a strength-based
approach (Wieck, Rapp, Sullivan, and Kisthardt, 1989) emphasizes individuals’
positive attributes. Strengths-based practice refuses to judge everyone by a single
benchmark. Although, pathologies, diagnoses and negative labelling are recognised
the focus is transferred to how individuals discover resiliency in such circumstances
(Manthey, Knowles, Asher & Wahab, 2011).
Contrary to the prescriptive approach, Peterson and Park (2009) suggest that
character is a multifaceted and evolving individualistic construct. Therefore, the
purpose of strengths based-character education is to identify, use and nurture
existing strengths. In addition, Anderson and Heyne (2012) emphasise reflection as
a crucial element within strength identification and development. An individual’s
54
unique character strengths profile is constructed from a combination and synergy
constellation of the 24 character strengths incorporated in the Values in Action-
Youth version (VIA, Park & Peterson, 2006).
1.7.2 A qualitative approach
Rooted in literacy, therapeutic and philosophical epistemologies, the origins
of narrative are tripartite stemming from the common usage of storytelling,
discourse elements and events of narration itself (Genette, 1980). The narrative
structures and vocabularies that individuals use when they craft and tell tales of their
perceptions and experience are deemed significant in themselves, providing
contextualism in terms of social, historical and cultural positioning (Burr, 2003;
Elliott, 2005). Social issues can be addressed, as well as encouraging the ‘voice’ of
marginalised individuals and the enhancement of social inclusion (Billington, 2006).
Narrative acknowledges the complexity of life where rich data can be accumulated
by individual stories (Reissman, 2008); the underlying rationale is that all
individuals construct narratives to make sense of their experience (Kearney, 2002).
Against the backdrop of developmental identity theories and their impact on
self-esteem, the creation of an autobiographical account is a critical task in
adolescence. This narrative links one’s past, present and future selves (Faircloth,
2012), therefore integrating past experiences, evolving personal changes, the
demands of society and future expectations. Moreover, McLean, Syed, Yoder, and
Greenhoot (2014) point to narrative as a prominent approach to identity
development (e.g., McAdams, 1993). In narrative terms the ‘self’ comprises
constructing and giving meaning to experiences.
55
Identity formation is critical to the development of the personal story; a
compilation of narratives and their main themes which order the course of
development, where individuals are defined in narrative instead of declarative terms.
Identity can be defined as a process, and the individual as one who “is becoming”
rather than one who “is” (Cierpka, 2014). This is especially pertinent for adolescents
when the ability to produce their ‘own narrative’ allows them to be biographers of
their ‘self’.
This internalized, evolving life story therefore comprises emotions, personal
meanings, characters, problems and solutions. However, the most significant tenet
of this ‘personal myth’ is the plot that integrates the narrative as this is
representative of how an individual organizes their personal meaning (McAdams,
2001). As children reach the formal operational stage (at about 12 years of age), as
defined by Piaget (1972), they develop logical and abstract thinking, hypothetical-
deductive reasoning and reflective capability. They also begin to delineate their own
morality in terms good and bad, values and the meaning of life.
The creation of a narrative identity does not occur within a vacuum, it is
dependent upon relationships with family, friends, peers and teachers. The role of
supportive parents in co-creating such a narrative is pivotal and those that fail to
receive such support have been labelled by Harter (2006a) as an ‘impoverished self’.
Such young people are particularly vulnerable during adolescence when
developmental demands require that they now create a self-identity that is coherent
and continuous.
Flexibility of narrative is one of its greatest attributes, facilitating its use in
combination with other approaches (Wood & Frey, 2003) and with a diverse
child/adolescent population (Von Korff, 2008). However, despite a growing body
56
of literature exploring narrative, there is scarce quality evidence of its effectiveness
(Wallis, Burns, & Capdevila, 2011) or how it can be evaluated. Small studies do not
demonstrate adequate conclusive evidence or generalisation within the population.
However, Androutsopoulo, Thanopoulou, Economou and Bafiti (2004) argue that
the coherence of narrative is significant and can be measured by quantifiable tenets
such as linearity, consistency of plot, relevance and lack of contradiction.
Furthermore, Morrow (2005) considers social validity, subjectivity and reflexivity,
suitability of data, and adequacy of interpretation as evaluation indicators.
Investigating the truth of narrative is extremely complex, with no reliance on
the posture of descriptive realism or external psychometric criteria as with positivist
methodology. Whilst researcher bias is countered by being systematic and reflexive,
it is difficult to consider the construct of inter-rater reliability. Furthermore, Linden
(2007) proposes that the narrative building function of the left cortex is constantly
active, facilitating the continual creation of narratives from snippets of perception
and memory. Neuro-scientific research such as this blurs the line between the
positivism of quantifiable scientific ‘absolutes’ and the anti-positivism perspective
of qualitative methodology and reinforcing the significance of the adoption of a
pragmatist perspective.
In sum, although Rahmani (2011) refers to narratives as enriching the human
soul, transcending cultures, time epochs, ideologies and academic disciplines,
narratives are still a contested, elaborate, transitional and evolving arena (Chase,
2005). Having dismissed the negative ethical and power consequences emanating
from an authoritative voice, the potential for multiple realities within the adolescent
can develop. It appears that narrative can potentially serve to facilitate both re-
presentation and in part a re-creation of the experience, perception and emotion of
57
vulnerable adolescents. Indeed, Holte (2018) differentiates the quantitative
perspective with emphasis on ‘counting’ (Hacking, 1982) which focuses on the
‘anonymous’ elements of people’s lives with the qualitative perspective which
engages with the ‘authentic’ experience (Østerberg, 1976, p. 38).
1.7.2.1 The choice of the Life Story Interview (McAdams, 2001) as the
qualitative instrument
The use of qualitative methods such as narrative can highlight the
significance of those who feel marginalised. By assimilating different experiences
and opinions from both small groups of adolescents with dyslexia and disengaged
adolescents it is proposed that experiences are widely shared. Therefore, such
research can expand the collective knowledge base and discourse surrounding
dyslexia and disengagement and inform the wider population. Using a qualitative
method may produce deep and rich data about the lived experiences of adolescents.
Study 1 therefore utilised a semi-structured interview schedule as profiled by the
Life Story Methodology (McAdams, 2001). As identity formation lies at the core of
the Life Story Interview (McAdams, 2001), this protocol was selected to capture the
essence of the adolescents’ experience and to reinforce the sense of positive identity
through narrative.
The concept of structured boundaries for developmental stages has been
refuted by McAdams (2001) who proposes that identity construction takes the shape
of a ‘life story model’, an evolving chronicle with its setting, scenes, character, plot
and theme throughout the developmental trajectory. Reconstructions of the past,
present perceptions and future aims are unified by the individual to profile a
narrative life story. Incorporating cultural values and norms ensures that such a
portrayal is continually updated and re-evaluated within the transforming cultural
58
and social framework to give psychosocial unity and a purpose within the modern
world. McAdams (1985, 1990) postulates peak experiences, turning points and
earliest memories to be nuclear episodes in a person’s self–defining life
story. Subjective and selective narrative reconstructions impart valuable data for
construing the central thematic threads of adolescents’ identity, albeit dependent on
individual differences and culture.
Furthermore, McAdams (1985, 1990) argues that ideological setting (a
matrix of personal beliefs and values) plays a significant part in shaping narrative
identity in adolescence. In this period, adolescents re-evaluate their opinions, what
they consider normal and the principles they want to adhere to. Such a personal
belief matrix forms the foundation of their identity. Self-narrative also can help
bridge the relationship gap between the past, present and future. In order to answer
questions such as “Who am I?”, “Where am I going?”, adolescents delve back into
their past identifying ‘nuclear’ episodes’, i.e., pivotal events and turning points in
their lives which facilitate a sense of uniqueness. Successes and failures are
categorised and explanations for the causes are explored. It is suggested that
adolescents attribute meanings to differing aspects of their life by the ordering of
their past, present and future vision. The life story by integrating past, present and
future, allows the narrator to form a sense of cohesive self. The act of narrating our
life story can be cathartic and forces the adolescent to search for the key to their
existence. Through the recollection of life events a sense of continuity can be
established – the sense of remaining the same person through time and differing
situations – that allows the adolescent to see their place in the adult world.
Whilst McAdams’ life story model is based on adult identity, Habermas and
de Silveria (2008) successfully extracted whole life stories from 8 years old
59
children. Reese Yan, Jack and Hayne (2010) developed ‘The Emerging Life Story
Interview’ with 8- 12 years old probing the organisation of their life stories and how
they drew meaning from events. Findings revealed the organization of the life story,
not the level of insight, was concurrently linked to the early adolescents’ well-being.
Indeed, enhanced levels of self-esteem were reported by the adolescents with most
organised life story.
The research undertaken for this thesis aims to ‘give voice’ to these often
invisible and marginalised adolescents in a protected yet enabling safe environment.
Daley (2013) through her research with young substance users, emphasises the over-
dominance of risk-mitigation in research with vulnerable adolescents. She argues
against an environment in which the need to protect the young supersedes the need
to ensure that young people participate in discussions about themselves and that
may subsequently lead to policy decisions about them.
The importance of reflexivity in research is paramount and Chapter 2
includes a section on reflexivity recognising that the complexities of the researcher
all shape how ethical a research design is and how the data is interpreted. Daley also
emphasises the often ‘silent issue’ of vicarious trauma to the researcher
concentrating on physical safety rather than emotional. Daley (2013) also highlights
of the difference between beneficence and non-maleficence. With the construct of
beneficence – ‘doing good’ – rarely are the benefits of participants quantifiable or
observable. In contrast, non-maleficence is the avoidance of harm by its
identification and management. However, it is the gauging beneficence that is
future minded.
60
1.8 Overview of thesis
The overarching aim of this PhD is to contribute to knowledge relating to the
self-esteem of adolescents: by investigating the self-esteem of vulnerable
adolescents through assessment and Life Story Interviews; by exploring the
promotion of self-esteem through a ‘positive emotions’ intervention; and through
identifying the predictors of self-esteem domains in typically developing
adolescents. This thesis adopts this positive psychology mixed methodology
approach and reports three studies investigating self-esteem addressing three aims.
The first aim (explored in Study 1) is to explore the self-esteem of
vulnerable adolescents from both a quantitative (self-esteem and strengths
assessments) and qualitative (life story methodology) perspective. The importance
of interweaving qualitative and quantitative findings in a mixed methodology
framework is highlighted. ‘Vulnerable adolescents’ were investigated in two
samples; Sample 1 comprised four 13-14 year old boys with dyslexia; whereas
Sample 2 comprised of eight 14-15 year olds disengaged in school and at risk for
becoming NEET- Not in Education, Employment or Training.
Self-esteem scores were measured by the Culture-Free Self-Esteem
Inventory-3 (CFSEI-3; Battle, 1992) which assessed scores in different domains of
self-esteem (academic, general, parental, social and personal). To complement these
assessments, a qualitative approach was also adopted to further investigate the
underpinnings of the self-esteem of these adolescents. Since identity formation is a
crucial developmental function in adolescence (Erikson, 1968), the Life Story
Interview (McAdam, 2002) was used to investigate the lived experience of both
samples. This identity-based methodology consolidates past, present and future
emotion to facilitate the adolescent in achieving a cohesive sense of self.
61
Interpretative Phenomenological Analysis (IPA) identifies emergent umbrella
themes and their subordinate themes (Smith, Flowers & Larkin, 2009).
The second aim (covered in Study 2) was to evaluate the impact of a school-
based positive emotion intervention on specific domains of self-esteem. Orth and
Robins (2014) suggest that there is evidence to indicate that self-esteem can be
improved through intervention and that, indeed, effective interventions can have
multiple positive outcomes (O’ Mara, Marsh, Craven, & Debus, 2006). In the
adolescent population there is scarce, piecemeal and divergent research
investigating the impact of positive emotions on self-esteem. This research intended
to fill the research gap by focussing on the impact of positive emotions on the
different domains of self-esteem.
Therefore, both participant samples from Study 1 engaged in an 8-10 week
‘positive emotions’ intervention. Self-esteem was assessed at four time points; pre-
intervention, immediate post-intervention, 6 month post-intervention and 9 or 12
month post-intervention. The intervention focussed on positive emotions in the past
(gratitude), present (recognition and use of character strengths) and future (hope)
and was selected to reinforce the significance of temporal flow and connectivity
elements of past, present and future as established in the Life Story Interview
(McAdam, 2002). Positive emotions are proposed to have had a broadening effect
on the individual’s momentary thought-action repertoire (Fredrickson, 2004),
relinquishing automatic responses and instead searching for novel, creative and fluid
ways of thinking and acting (Fredrickson & Joiner, 2002, 2018). As a consequence,
an individual’s personal resources are increased thus creating an upward spiral of
positive emotions. Results were reported as a multiple single case design.
62
The third aim (addressed in Study 3) was to investigate correlations between
specific strengths and self-esteem domains. Literature underscores the significance
of the tripartite role of parents, schools and peers in self-esteem development
(Birkeland, Melkevik, Holsen, & Wold,2014; Orth, Erol, & Luciano, 2018).
However, it is debatable whether increased self-esteem is a consequence or
predictor in these associations (Masselink et al., 2018; Tetzner, Becker & Maaz,
2017).
An online questionnaire was therefore designed and circulated to a large
sample of adolescents (N= 953) from four secondary schools in the north and south
of England. Regression analyses explored the associations between specific
behavioural, emotional, personal, contextual and character strengths and self-esteem
domains. In addition, since research has highlighted the influence of demographics
upon adolescent self-esteem, the impact of age, gender, Special Educational Needs
(SEN) provision, ethnicity and multiple deprivation decile on self-esteem domains
were also investigated. Knowledge of strength predictors of self-esteem domains
could facilitate their inclusion into interventions aimed at enhancing the self-esteem
of those identified as at risk of experiencing low self-esteem
1.9 Summary
This introductory chapter introduced the constructs of positive psychology
within a mixed methods framework and defined the multi-dimensional and
hierarchical construct of self-esteem with reference to Battle (2002), whose
instrument is central to the three studies that comprise this thesis.
Historically, the investigation of global self-esteem in comparison to other
self-esteem domains (academic, general, parental, social and personal) has attracted
63
the most attention in the literature. Therefore, the objective of this thesis is to
investigate the specific domains underpinning the overarching construct of global
self-esteem. Numerous factors have been identified that impact the trajectory of
self-esteem including gender, ethnicity, education attainment and cultural
generational change.
Pivotal to mental and social well-being, self-esteem is a protective factor in
both physical and mental health. The literature indicates that for more ‘vulnerable
adolescents’ low self-esteem is associated with a wide spectrum of mental disorders
and social problems, including both internalising problems (e.g. anxiety, depression
and eating disorders) (Steiger, Allemand, Robins, & Fend, 2014) and externalising
problems (e.g. violence and substance abuse) (Donnellan, Trzesniewski, Robins,
Moffitt, & Caspi, 2005).
Since low self-esteem in adolescence leads to widespread and pervasive
negative outcomes, the participant samples in Studies 1 and 2 consist of a small
number of ‘vulnerable adolescents’ already identified in the literature as
experiencing low self-esteem (i.e., those living with dyslexia and those at risk of
becoming NEET). Self-esteem has been revealed to be stable during the adolescent
years and individuals possessing low self-esteem in adolescence have been found to
be more likely to have low self-esteem a decade or so later (Orth & Robins, 2014).
This provides the ideal opportunity to explore the promotion and prediction of the
self-esteem domains.
64
2 Chapter 2
Study 1 – A mixed methods exploration into the self-esteem
of vulnerable adolescents
2.1 Overview
This chapter introduces Study 1, an in-depth mixed method approach into
the self-esteem of vulnerable adolescents, through the assessment of self-esteem and
other strengths and Life Story Interview analysis. This study aims to provide a
holistic perspective of the self-esteem of two samples of vulnerable adolescents
whose low self-esteem has been well documented; adolescents with dyslexia,
(Alexander-Passe, 2006; Humphrey, 2002) and disengaged adolescents (Henderson,
Hawke, Chaim, & Network, 2017). In order to explore the underpinnings of self-
esteem it is important to portray the lived experience of these adolescents through
narrative, in the knowledge that this age is pivotal in terms of positive identity
formation (Erikson, 1968). Existing qualitative literature focussing on adolescents
with dyslexia and those disengaged and at risk of becoming NEET is discussed
before detailing the methodology used in Study 1. The self-esteem and strengths
characteristics of participants are detailed before introducing the themes that
emerged through Interpretative Phenomenological Analysis (IPA) of their Life Story
Interviews. An overview of the findings is then provided.
2.2 Qualitative studies with adolescents with dyslexia
There is a growing number of qualitative studies investigating adolescents
with dyslexia focussing upon their lived experiences as well as the experiences of
their parents and teachers. Such studies serve to enlighten and educate families and
65
teachers about the widespread impact of living with dyslexia recognising that school
is a critical environment laying the foundations of their success or failure
(Alexander-Passe, 2016). IPA is the predominant analysis method of interviews
with significant others in combination with adolescents with dyslexia and findings
underscore the need for more co-operation and understanding within the school
context (Alexander-Passe, 2015).
Rapus-Pavel, Vitalic and Rejec (2018) used IPA to interpret and compare the
experiences of coping within the school context from the perspectives of four
adolescents with dyslexia (aged between 12 and 13 years), their mothers and their
teachers. Three themes emerged: the cause of distress in school situations (a lack of
understanding from teachers, peer acceptance, learning activities and assessment,
mothers’ high expectations); reactions to problems (mothers take on learning
responsibilities, adolescents experience of severe distress); and expectations
regarding the supply of assistance (increased understanding of emotional distress,
more adaptive teaching strategies, increased guidance of special education teacher,
increased independence of adolescent). However, the comparison of the
adolescents', mothers' and teachers' narratives revealed divergent perspectives
regarding difficulties and the provision of support. Adolescents, unlike their mothers
and teachers, were concerned about peer acceptance and how their classmates
perceived their inability to learn. Moreover, adolescents and mothers wished for
teachers to implement more widespread adjustments in teaching strategies whilst
teachers raised concerns over a lack of guidance from the special educational
teachers relating to how to teach adolescents with dyslexia.
This contrast of experiences surrounding dyslexia was also revealed by the
IPA of semi-structured interviews with 13 children with dyslexia (aged between 10-
66
16 years) and 22 of their parents (Leitão, Dzidic, Claessen, Gordon, Howard,
Nayton, & Boyes, 2017). In this study, childrens’ accounts were ecologically
placed at both the micro and mesosystem level of Bronfenbrenner’s (1992)
ecological model, whereas parents’ perspective also included the wider exosystem.
Both accounts referred to the theme of ‘difference’. This is indicative of the
difficulties associated with societal and cultural attitudes that promote perceived
ability and shame difference. This may indeed be related to the negative emotional
coping such as self-harm revealed in interviews with adolescents with dyslexia
(Alexander-Passe, 2015). Retrospective narratives of young adults with dyslexia
revealed their perceptions of their quality of life as adolescents was relatively
normal, although thematic analysis highlighted challenges within the school
environment and the level of support required (Calleja, 2016).
Whilst Humphrey and Mullins (2002) revealed the negative impact of
dyslexia on self-esteem, Lithari’s (2018) interviews again highlighted relationships
with teachers, societal attitudes regarding literacy, support in school, academic
achievement and the responses of others as central to the dyslexia thread in the
transition to secondary school. Litharo (2018) refers to this culminating in a
‘fractured academic identity’.
In contrast to these qualitative findings emphasising the negative impact of
dyslexia, Burden and Burdett’s (2005) interviews with 50 boys (11-16 years old)
revealed positive feelings of locus of control, self-efficacy and a determined and
sustained work ethic, although this in part may be explained by the independent
special school context. Furthermore, interviews with language students with
dyslexia also reinforced the impact of a positive relationship with their teacher and
motivational teaching strategies (Kormos, Csizér, & Sarkadi, 2009). Claassens and
67
Lessing’s (2015) analysis of interviews with six young adults with dyslexia (18-21
years) revealed the significance of social support networks and individual coping
strategies in influencing socio-emotional outcomes. Participants identified positive
emotions about dyslexia, social support, acceptance and their personal strengths as
indicators to success.
Indeed, Agahi, Nicolson and Sepulveda’s (2015) IPA of interviews with
successful adults revealed a ‘Strengths Decathlon’ consisting of triads of cognitive
(visuospatial, big picture, creativity), social (empathy, teamwork, communication)
and work (determination, proactivity and flexible coping) skills with a bias towards
unconventional thinking. However, most of these skills are thought to develop post-
school through experience when freedom facilitates the use of latent/emergent
talents.
2.3 Qualitative studies with adolescents at risk of becoming NEET
Emerging qualitative research has explored the lived experience of NEET
young people through a variety of interview procedures. Reiter and Schlimbach’s
(2015) qualitative longitudinal German study of 21 adolescents (15-24 years old)
consisted of 13 young people who had experienced periods of exclusion from
education, employment and training. Another 8 were young people who had reacted
against the threat of becoming NEET by involving themselves in pseudo-activities
such as falsely claiming to work in family businesses and completing courses they
had already finished.
The research used a stand-alone problem-centred interview to reconstruct the
adolescents’ biographical accounts of the school to work transition, in conjunction
with their interpretations of such experience. Analysis revealed seven main narrative
68
themes; vocational status, self-actualisation, meaningful activity, convenience,
finances, leisure and life struggles. Such findings highlight how conscious these
adolescents were of the struggles of being NEET, and their biographical narratives
revealed the use of rival narratives to entrench the experience of being NEET, to
circumvent it or evade talking about altogether. Such behaviour was coined as
’NEET in disguise’ (Reiter & Schlimbach, 2015).
Experiences of young NEET people in England have also been documented
and analysed taking an ethnographical perspective (Russell, 2013, Simmons,
Russell, & Thompson, 2014), where individual participants were contextualised in
terms of social, cultural and political positioning.
Yates and Payne’s (2006) interviews with other 855 young people
highlighted the plethora of diverse reasons underlying NEET status. Three
subgroups were identified: those in temporary ‘transition’ due to individual
circumstances that would quickly re-engage with employment, education or
training; young parents who disengaged with the school system to care for their
children; and a more ‘complicated’ group that displayed a variety of ‘risks’ that
were instrumental in their NEET status, for example, experiencing addition, having
emotional and behavioural struggles, being homeless and engaging in criminal
behaviour.
Building upon these subgroup definitions, Seddon, Hazenburg and Denny’s
(2013) study focused upon 24 NEET individual defined as ‘complicated’. The
outcome benefits of a 6 week EEP were investigated through a general efficacy
measure in terms of positive changes to the participant’s (N = 24) states of mind that
would improve future employability (Epstein & McFarlan, 2011). Whilst semi-
structured interviews explored the participants’ (N = 15) perceptions of the EEP
69
they had engaged in. Results revealed a statistically significant increase in the
levels of general self-efficacy of the participants completing the EEP. Analysis of
scripts through an iterative method based on grounded theory revealed four themes
prior to the EEP and four post-intervention. Three of the themes (‘prior experience’,
‘self’ and ‘future’) identified prior to the EEP resurfaced post-intervention. The
post-intervention theme engagement in ‘the programme’ highlighted the importance
of structure in the day, a new positive outlook having tried new activities, the
development of sense of community and positive peer relationships. Moreover,
findings suggest that engagement in the EEP enhanced the participants ability to
counter the impact of ‘social exclusion’ through, for example, improvements in self-
perception and aspiration. There was also evidence to suggest that participants
exhibited more structured employment-seeking strategies as well as more realistic
career ambitions. Such results reinforce the main objective of the EEP, namely, to
increase motivation to seek employment, education and training opportunities.
Improvements in social-confidence, self-respect, self-image and social skills were
also revealed. Overall, results for these ‘complicated’ NEET young people reveal
the significance of progress in their lives in parts that they regard as important.
Triangulation of both the quantitative and qualitative findings suggest a
causal relationship between the EEP and the beneficial outcomes described above.
Indeed, the authors propose these findings in combination with prior research
(Denny, Hazenberg, Irwin, & Seddon, 2011) demonstrate a potential link between
participants perceptions of EEP benefits and improvements in their general self-
efficacy levels. However, caution is warranted when interpreting these findings due
to the small sample size, the difficulties in operationalising ‘complicated’, attrition
rates and lack of further reassessments points.
70
Recently, Ryan, D’Angelo, Kaye and Lorinc (2019) adopted a mixed
methods approach to investigate the factors that cause adolescents to disengage from
and potentially re-engage with the school environment. By examining the literature
on school engagement and perceived support, this paper illustrated that enhancing
perceptions of support can have a positive impact on school engagement. This
study utilised a sequential design with a quantitative students’ questionnaire (N =
3,018), followed by two sessions of interviews with a smaller sub-sample of
adolescents (N = 16 and N = 10). They argued it was crucial to consider perceived
support needs in terms that are ‘differentiated, diffuse and dynamic’ (Ryan,
D’Angelo, Kaye & Lorinc, 2019, p.2).
Differentiated types of support can comprise emotional, practical and
informational whilst diffuse players including parents, teachers and significant
others are origins of perceived support. These fluid and dynamic interactions
between perceived support and school engagement are revealed over time through
the study’s longitudinal qualitative findings. This evolving interplay provides
opportunities to improve positive outcomes. Quantitative findings revealed a
‘hierarchal’ relationship between engagement and the various sources of support.
After controlling for demographic characteristics, academic ability and self-reported
behaviour in school, the strongest predictor of school engagement was perceived
teacher support, then parental and friends’ support. The process of how this operated
was dependent on individual adolescent circumstances, contexts and available
opportunities and this was investigated through narrative. Narrative reinforced the
importance of perceived teacher support, especially the significance of the
encouragement of individual teachers, although this fluctuated over time. It also
emerged that perceived parental support which encompassed wider familial
71
connections were especially important when deciding educational paths, in that,
those university educated members of the family were deemed to be significant in
terms of knowledge base. The narratives regarding perceived friendship support was
complex and not so positive, with narratives underscoring that friends can also play
a negative influence in terms of school engagement. Furthermore, changing
circumstances related to family economics, geographical mobility, new environment
and family breakdown, can all influence perceived support, engagement levels and
outcomes (Ryan, D’Angelo, Kaye, & Lorinc, 2019).
The present chapter reports the quantitative and qualitative findings for these
two samples. The participant demographics and self-esteem scores are tabulated
(strengths assessment findings for the samples are listed in Appendices 1-4) before
exploring the qualitative findings from the staged process of analysis of their Life
Story Interviews through Interpretative Phenomenological Analysis (IPA). Such an
approach allows the individual participants’ self-esteem profile to be viewed
through the lens of the themes generated from their narratives. A section on
reflexivity, a vital component of IPA, is also included, before a general overarching
discussion considering the interplay and interlinking of all the findings.
2.4 Research Question
The current study sought to answer the following research question, with the aim of
identifying emergent themes from the adolescents’ Life Story Interviews which may
underpin self-esteem.
Do vulnerable adolescents exhibit lower self-esteem than normative scores
measured by the Culture-Free Self-Esteem Inventory (CFSEI-3, Battle,
2002)?
72
2.5 Method
2.5.1 Participants
Participants were recruited through opportunity sample, from those that were
willing and available to participate in the intervention.
These two small samples of vulnerable adolescents comprised adolescents
with dyslexia (Sample 1) and adolescents considered at risk of becoming NEET
(Sample 2).
2.5.1.1 Sample 1 – Adolescents with dyslexia
The participants for the study were identified by the Learning Support
Department in collaboration with the individual class teachers of an independent
single sex (boys) secondary school in Yorkshire. After discussions with the Head,
four participants from Year 9 were identified by having a diagnosis of dyslexia
(with no co-morbidity). These participants were considered most likely to gain from
a strengths-based interventionist approach and were not partaking in any other
programs. This opportunity sample were invited to take part through letter,
information packs were circulated and all consent forms from both parents and
adolescents were returned to the Head of Learning Support.
Participant characteristics of Sample 1
The four participants had received a diagnosis for dyslexia (with no co-
morbidity) and were receiving learning support. Participants were aged between 13
and 14 years (M = 13.94, SD = 0.44). All participants were male and White British.
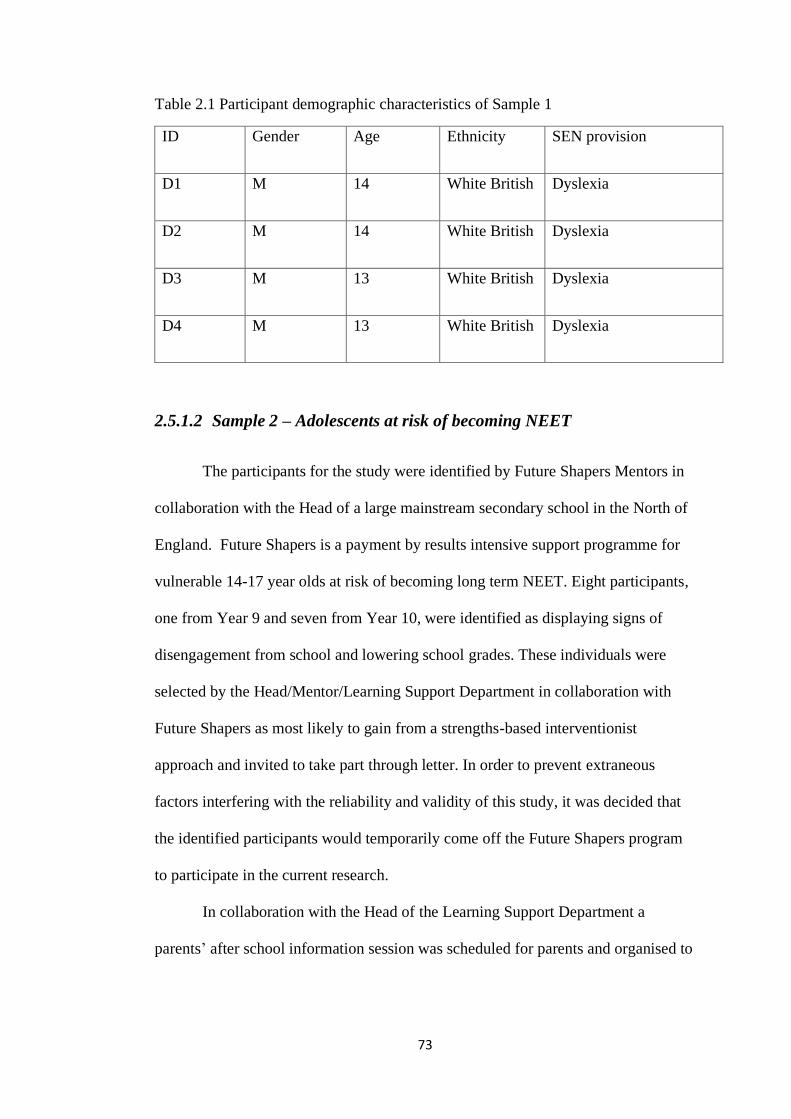
73
Table 2.1 Participant demographic characteristics of Sample 1
ID Gender Age Ethnicity SEN provision
D1 M 14 White British Dyslexia
D2 M 14 White British Dyslexia
D3 M 13 White British Dyslexia
D4 M 13 White British Dyslexia
2.5.1.2 Sample 2 – Adolescents at risk of becoming NEET
The participants for the study were identified by Future Shapers Mentors in
collaboration with the Head of a large mainstream secondary school in the North of
England. Future Shapers is a payment by results intensive support programme for
vulnerable 14-17 year olds at risk of becoming long term NEET. Eight participants,
one from Year 9 and seven from Year 10, were identified as displaying signs of
disengagement from school and lowering school grades. These individuals were
selected by the Head/Mentor/Learning Support Department in collaboration with
Future Shapers as most likely to gain from a strengths-based interventionist
approach and invited to take part through letter. In order to prevent extraneous
factors interfering with the reliability and validity of this study, it was decided that
the identified participants would temporarily come off the Future Shapers program
to participate in the current research.
In collaboration with the Head of the Learning Support Department a
parents’ after school information session was scheduled for parents and organised to
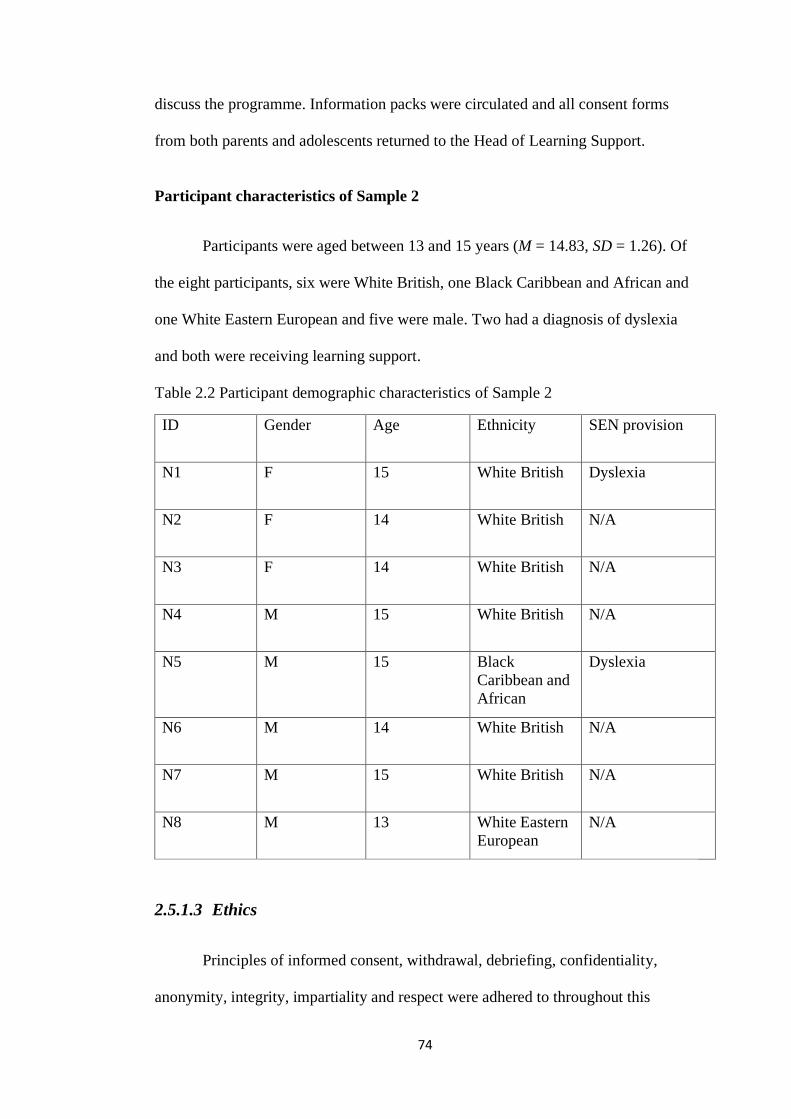
74
discuss the programme. Information packs were circulated and all consent forms
from both parents and adolescents returned to the Head of Learning Support.
Participant characteristics of Sample 2
Participants were aged between 13 and 15 years (M = 14.83, SD = 1.26). Of
the eight participants, six were White British, one Black Caribbean and African and
one White Eastern European and five were male. Two had a diagnosis of dyslexia
and both were receiving learning support.
Table 2.2 Participant demographic characteristics of Sample 2
ID Gender Age Ethnicity SEN provision
N1 F 15 White British Dyslexia
N2 F 14 White British N/A
N3 F 14 White British N/A
N4 M 15 White British N/A
N5 M 15 Black
Caribbean and
African
Dyslexia
N6 M 14 White British N/A
N7 M 15 White British N/A
N8 M 13 White Eastern
European
N/A
2.5.1.3 Ethics
Principles of informed consent, withdrawal, debriefing, confidentiality,
anonymity, integrity, impartiality and respect were adhered to throughout this
75
research (Code of ethics and Conduct, BPS, August 2009) and Studies 1 and 2 had
full Ethics approval from the Department of Psychology at the University of
Sheffield before commencement of empirical work (See Appendix A.). Due to the
involvement of vulnerable participants (i.e., adolescents) the researcher was checked
by the Disclosure and Barring Service (DBS) to obtain an enhanced DBS check.
Although this research was intended to be an empowering, inspiring and
enjoyable experience for the participants, it was acknowledged that these
participants are vulnerable due not only to age but due to their circumstances.
Although this research did not touch intentionally upon potentially highly sensitive
topics, the process of recalling a life story may evoke strong emotional responses
and it was crucial for the researcher to remain mindful and respectful throughout.
Since an individual’s vulnerability oscillates it may be that at this particular time in
their life a participant felt more vulnerable, due to their social-economic background
or cultural and living circumstances. Throughout the process, constant liaison with
relevant staff ensured none of the participants felt particularly emotionally
vulnerable.
Interviews always have the potential for disclosing difficult and challenging
issues. The Life Story Interview may evoke negative (as well as positive)
challenging emotions and memories when exploring different junctures in their past.
The Non-Malfeasance - 'doing no harm' - concept was particularly pertinent to
ensure those feeling particularly vulnerable coped with painful recollections that
surfaced during narrative.
All questions were asked in a responsible and caring manner and the
participant could refuse to answer any question at any time. At any point during the
interview the participant could stop the interview and request ‘time out’. However,
76
if any information was imparted to the researcher regarding harm or potential harm
involving the participant, such information would be passed to the relevant
individual or body. This scenario did not occur.
The participants were told the aims of the study at the onset and again after
completion of the study and were encouraged to ask as many questions as possible.
In line with BPS ethics guidelines, at no point were participants misled or deceived;
transparency was essential. They were verbally briefed and debriefed in an age
appropriate child friendly manner and could withdraw at any stage. It was believed
that by facilitating an open exchange of information, the adolescents felt more
involved in the research process. The aim of this research was to achieve
Beneficence - 'doing positive good' - allowing participants to reflect upon the
research as a positive directional experience.
As inconvenience during the school day may have be a concern to the
participants and their parents, interviews were scheduled with the Heads, Year/Form
Tutors and the Learning Support Department to cause the least disruption to the
academic lessons of the school day.
2.5.2 Materials
2.5.2.1 Demographic information
Consent forms and age-appropriate information sheets were circulated for
both the parents and participants. A demographic questionnaire completed by the
parent ascertained age of participant, ethnicity, whether difficulties were
experienced in the school environment, if a specific learning disability had been
diagnosed, and if the participant was in receipt of learning support.
77
2.5.2.2 Quantitative Assessments
The primary outcome measure was self-esteem, the other measures gave
behavioural and emotional, personal, contextual and character strengths information
and those results are reported and analysed in the Appendix B (Tables B1-B4). A
summary is seen in Table 2.3.
Normative based instruments (compared individual performances with age–
related peers)
• Culture Free Self-Esteem Inventory -3 (CFSEI-3, Battle, 2002) (adolescent
version).
• Behavioural & Emotional Ratings Scales (Youth) (Epstein, 2004) self,
parent, teacher versions.
Ipsative instruments (gauged differences over time within each participant)
• Values in Action Inventory for Youth (VIA-IS (Youth), Peterson &
Seligman, 2004).
• Strengths Assessment Inventory (SAI-Y, Rawana & Brownlee 2010).
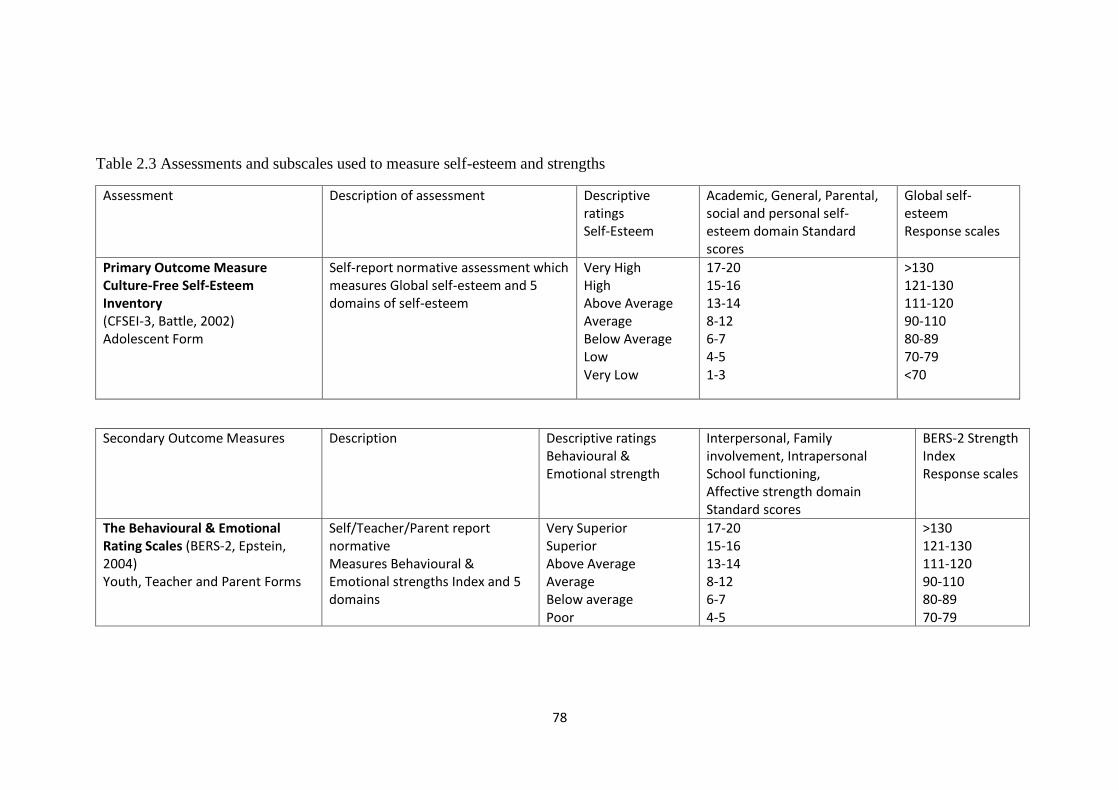
78
Table 2.3 Assessments and subscales used to measure self-esteem and strengths
Assessment Description of assessment Descriptive ratings Self-Esteem
Academic, General, Parental, social and personal self-esteem domain Standard scores
Global self-esteem Response scales
Primary Outcome Measure Culture-Free Self-Esteem Inventory (CFSEI-3, Battle, 2002) Adolescent Form
Self-report normative assessment which measures Global self-esteem and 5 domains of self-esteem
Very High High Above Average Average Below Average Low Very Low
17-20 15-16 13-14 8-12 6-7 4-5 1-3
>130 121-130 111-120 90-110 80-89 70-79 <70
Secondary Outcome Measures Description Descriptive ratings Behavioural & Emotional strength
Interpersonal, Family involvement, Intrapersonal School functioning, Affective strength domain Standard scores
BERS-2 Strength Index Response scales
The Behavioural & Emotional Rating Scales (BERS-2, Epstein, 2004) Youth, Teacher and Parent Forms
Self/Teacher/Parent report normative Measures Behavioural & Emotional strengths Index and 5 domains
Very Superior Superior Above Average Average Below average Poor
17-20 15-16 13-14 8-12 6-7 4-5
>130 121-130 111-120 90-110 80-89 70-79
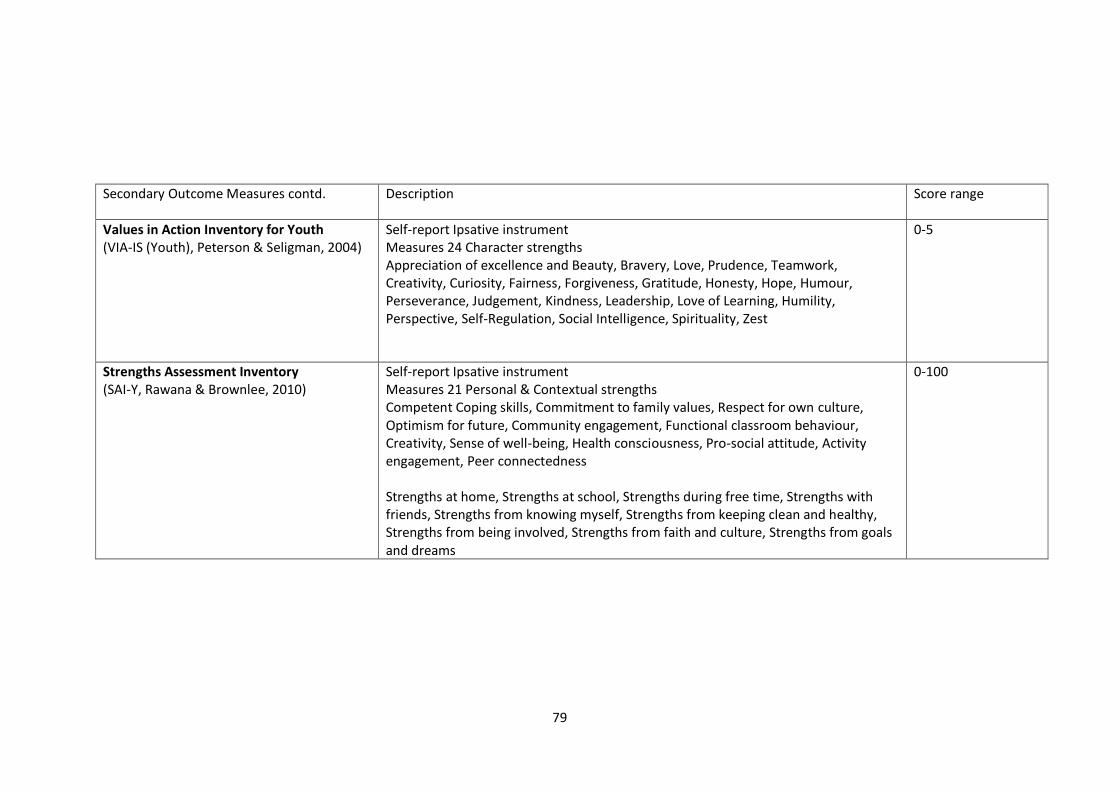
79
Secondary Outcome Measures contd. Description Score range
Values in Action Inventory for Youth (VIA-IS (Youth), Peterson & Seligman, 2004)
Self-report Ipsative instrument Measures 24 Character strengths Appreciation of excellence and Beauty, Bravery, Love, Prudence, Teamwork, Creativity, Curiosity, Fairness, Forgiveness, Gratitude, Honesty, Hope, Humour, Perseverance, Judgement, Kindness, Leadership, Love of Learning, Humility, Perspective, Self-Regulation, Social Intelligence, Spirituality, Zest
0-5
Strengths Assessment Inventory (SAI-Y, Rawana & Brownlee, 2010)
Self-report Ipsative instrument Measures 21 Personal & Contextual strengths Competent Coping skills, Commitment to family values, Respect for own culture, Optimism for future, Community engagement, Functional classroom behaviour, Creativity, Sense of well-being, Health consciousness, Pro-social attitude, Activity engagement, Peer connectedness Strengths at home, Strengths at school, Strengths during free time, Strengths with friends, Strengths from knowing myself, Strengths from keeping clean and healthy, Strengths from being involved, Strengths from faith and culture, Strengths from goals and dreams
0-100
80
Battle’s Culture-Free Self-Esteem Inventory (CFSEI-3)
The CFSEI-3 is a normative self-report instrument designed to elicit
perception of personal traits and characteristics from 6 years to 18 years. The
CFSEI-3 is designed on the premise that self-esteem is perceived to be an
individual’s personal evaluation of their own attributes (abilities and limitations)
and the instrument has been utilised with different adolescent populations
(Alexander-Passe, 2006; Descartes, Ramesar & Mills, 2018).
Due to the age cohort under investigation the Adolescent version CFSE1-3
was administered. The adolescent version covers early, middle and late adolescence
(13 -18 years) and is therefore suitable for these participants. The CFSEI-3
adolescent inventory consists of 67 items grouped into five subscales: academic,
general, parental, social and personal. The personal self-esteem subscale is included
specifically in the adolescent form and gauges the individual’s most intimate
perceptions of self-worth and anxiety. Participants are asked to respond ‘Yes’ or
‘No’ to questions like: “Do you feel you are important as most people?” and “Are
you easily depressed?”. These subscale scores are combined to create a Global Self-
Esteem quotient and a defensiveness score. Raw scores are then converted into
standard scores, percentiles and descriptive ratings.
The CFSEI-3 instrument was normed using a representative U.S. sample of
1,727 individuals (6-18 years) based on geographical area, age, gender, race,
disability status, urban/rural residence, ethnicity and income. The CFSEI-3
instrument demonstrates strong psychometric properties.
In terms of reliability, this instrument is considered internally consistent with
Cronbach’s alphas for the subscales around .80 across gender (.75-.84 for males,
.80-.87 for females), ethnicity (.80-.88 for European Americans and .77-.86 for
81
Hispanic Americans) and disability (.75-89 for learning disabled) categories. Good
test-retest reliability of subscales (r = .78-.95) has been demonstrated. An analysis
of internal consistency of the subscales from the normative sample yielded
acceptable/good Cronbach alpha reliabilities (across all age categories), Global self-
esteem (α = .93) and for each subscale Academic self-esteem (α = .81) Parental self-
esteem (α = .79), Social self-esteem (α = .77), General self-esteem (α = .80) and
Personal self-esteem (α = .86).
In terms of validity, the CFSE1-3 Manual reports that a maximum likelihood
confirmatory analysis was performed to assess the goodness-of-fit of the model
utilised to produce the adolescent CFSEI-3. The CFSEI-3 yielded a .990 goodness
of fit with the Tucker and Lewis’s (1973) index of Fit (TLI) and .995 with the
Bentler and Bonnett’s (1980) normed fit index (BBNFI). Both values at close to 1
demonstrate a very good fit. Construct and concurrent validity was confirmed
through correlating the adolescent CFSEI-3 with the Multidimensional Self Concept
Scale (MSCS) (Bracken, 1992) the subscales generally correlated in the .40s.
In line with Guilford and Fruchter (1978), Battle (2002) purports item
validity can be obtained by correlating scores on the items with the total score made
on the instrument, arguing inventories with weak construct identification validity
would not be composed of items having scale coefficients as high as those detailed
in the Manual (i.e. .35 -.61).
The CFSEI-3 is relatively easy to administer (completion in 10 minutes) and
score and has been used widely in studies with participants with dyslexia
(Alexander-Passe, 2006).
82
The Behavioural & Emotional Youth Rating Scales 2 (BERS-2, Epstein, 2004)
The BERS-2 (Epstein & Sharma, 1998) measures Behavioural and
Emotional Strengths, Epstein and Sharma (1998) define strengths-based assessment
as the gauging of emotional and behavioural skills and characteristics that facilitate
a sense of accomplishment, contribute to satisfying relationship with family
members, peers, and adults, increases the ability to cope with stress, and enhance
social and academic development. The BERS-2 is a standardised (i.e., norm
referenced) strength-based assessment for use with 5 to 18 year olds and has been a
widely used measure with diverse populations (Worling & Langton, 2015).
The original 57 item BERS-2 Youth Rating Scale (YRS; Buckley & Epstein
2004) is used here as a vehicle to profile emotional and behavioural strengths,
identify those with limited emotional and behavioural strengths, and to chart
progress in strength areas following intervention. Designed to be completed in 10
minutes the BERS-2 gauges the participants’ behaviour from three perspectives,
Youth, (YRS), Teacher (TRS) and Parent (PRS), to facilitate a triangulation
approach.
Data from a national sample of typically developing children (n = 2,176)
identified five domains: interpersonal strengths (15 items), family involvement (10
items), intrapersonal strength (11 items), school functioning (9 items), and affective
development (7 items) (Epstein, Ryser & Pearson, 2002).
The BERS-2 therefore assesses these five domains: Interpersonal Strength,
Family Involvement, Intrapersonal Strength, School Functioning, and Affective
Strengths. Interpersonal Strengths measures a child’s ability to interact with others
in social situations. Family Involvement gauges a child’s relationship with or
commitment to his or her family. Intrapersonal Strength concentrates on how a child
83
perceives their own competence and accomplishments in general terms. School
Functioning assess a child’s performance and competence in the classroom whilst
Affective Strength measures a child’s ability to give and receive affection from
others. A summary strength score of the five subscales is given in terms of an
overall Strength Index. The PRS and YRS also incorporate a 5 item career strength
subscale which is not included in the TRS or in the overall Strengths Index. Eight
open ended questions on each version are included to assimilate specific
information, e.g., Who are the most important people in the child’s life? What is the
best thing about the child?
The participant is rated on a four-point likert-style scale from 0 (Not at all
like the child) to 3 (Very much like the child). Questions posed include ‘I know
when I am happy and when I am sad’ and ‘I complete my homework’.
Scoring of the BERS-2 is done manually to calculate various scores. For
each of the strength areas (subscales) a total raw score is determined by summing
the scores. The manual details normative tables to enable the raw scores from the
subscales to be converted to percentile ranks and to standard scores with a mean of
10 (SD = 3) and a range of 0 to 20, with higher scores representing greater perceived
strengths. The sum of the subscale standard scores can be converted into the BERS
Strength Quotient with a mean of 100 (SD = 15).
In terms of reliability, an analysis of internal consistency of the YRS items
yielded acceptable/good Cronbach alpha reliabilities (across all age categories) for
each subscale; Interpersonal strength α = .82, Family involvement α = .80,
Intrapersonal strength α = .82, School functioning α =.88 and Affective strength α =
.80, and .95 for the strength index (Epstein, 2004). Cronbach’s alphas have ranged
from .79 to .99 (Epstein, Mooney, Ryser & Pierce, 2004). The BERS-2 also yielded
84
good test-retest reliability for each of the subscales (r = .84-.91) (Epstein, Ryser &
Pearson, 2002).
The Youth Rating Scale demonstrates good validity based upon its ability to
differentiate between youth identified with behavioural and emotional problems and
those who are not, as well as its negative correlations with self-report assessments of
psychological difficulties. In addition, analysis from 49 adolescents (mean age 12
years 11 months) demonstrated that the BERS-2 subscales showed overall high
positive correlations (.43- .74) with the social skills composite score from the Social
Skills Rating System–Student Form (Secondary Level, 12-18 years) (Epstein,
Mooney, Ryser, & Pierce, 2004).
In terms of validity, the BERS-2 Manual reports that a maximum likelihood
confirmatory analysis was performed to assess the goodness-of-fit of the model
utilised to produce the Youth Rating Scale. The Youth Rating Scale yielded a .986
goodness of fit with the Tucker and Lewis’s (1973) index of Fit (TLI) and .995 with
the Bentler and Bonnett’s (1980) normed fit index (BBNFI). Both values at close to
1 demonstrate a very good fit.
Ipsative measures
The Values in Action Inventory of Strengths for Youth (VIA-IS (Youth)
(Peterson & Seligman, 2004)
The Values in Action Classification of Strengths VIA (Peterson & Seligman,
2004) profiles twenty-four character strengths within the six virtue categories of
wisdom, courage, humanity, justice, temperance and transcendence. These character
strengths are defined as morally valued traits whose use contributes to fulfilment
and happiness (Peterson & Seligman, 2004). Specific criteria for character strengths
include ubiquity (cross-cultural universality), measurability as an individual
85
difference and fulfilling to the individual. Linkins, Niemiec, Gilham, and Mayerson
(2014) have argued for an individualised perspective in the application of character
strengths in contrast to the monolithic traditional approaches. The VIA has been a
central tool underlying the strengths approach in diverse, clinical and non-clinical
settings and across cultural divides. It has been applied in both educational (Park &
Peterson, 2008: Seligman, Ernst, Gilham, Reivich & Linkins 2009) and within youth
development work (Proctor, Tsukayama, Wood, Maltby, Eades, & Linley, 2011).
The Values in Action Inventory of Strengths for Youth (VIA-Y) has been
utilised frequently as a strengths assessment tool to assess character strengths in 10-
17 year olds (Seider, Novick, & Gomez, 2013, Ferragut, Blanca, & Ortiz-Tallo,
2014). The VIA-Youth is a framework to assist in the exploration of character
strengths by means of a long version 198 item or shortened 96 item self-report
questionnaire using youth-friendly language and age-appropriate scenarios.
Dissatisfaction from researchers, parents and teachers regarding usability
(completion of 45 minutes) of the original 198 items with the youth population,
spurred the creation of the shorter 96 item self-report – seen as a more effective and
equally valid instrument (Park & Peterson, 2006c). The 96-item abbreviated Youth
version was derived from the original 198-item youth survey by selecting the 4
items per scale with the highest corrected item-total correlations (Park & Peterson,
2006). A mean correlation between the original and revised forms was .82 statistic
(N = 253) (McGrath & Walker, 2016).
The character strengths of creativity, curiosity, judgment, love of learning
and perspective fall under the virtue of wisdom and knowledge; bravery,
perseverance, honesty and zest fall under courage; love, kindness and social
intelligence are grouped under the virtue of humanity; teamwork, fairness and
86
leadership fall under the virtue of justice; forgiveness, humility, prudence and self-
regulation are grouped under the virtue of temperance whilst appreciation of beauty
and excellence, gratitude, hope, humour and spirituality fall under the virtue of
transcendence.
Statements in the VIA-IS (Youth) 96 item version include ‘I get excited
when I see there is something new to learn’ (love of learning), ‘I stand up for what
is right, even when I am scared’ (bravery) and ‘I am able to control my anger really
well’ (self-regulation). The measure is typically administered online, but for this
study, participants used a pen and paper version. Permission was provided by the
VIA Institute of Character to use the VIA Surveys in this research project.
The adolescents are asked to rate the items by the degree to which the
statement accurately describes their behaviour, emotions or thoughts on a five-point
Likert Scale. Adolescents’ response to statements range from ‘very much like me’,
‘mostly like me’, somewhat like me’ through to ‘a little like me’ and ‘not like me at
all’. The VIA-Youth results are given as a list of 24 ranked strengths of character,
allowing ipsative identification of “signature strengths” for the individual as well as
group comparisons. The top five strengths of an individual are considered their
signature strengths. Since scores are intra individual and not normed, those strengths
score ranked low on an individual’s strengths list does not indicate that the
individual possesses less than the average person in the general population.
The original 198-item VIA-Youth has undergone considerable psychometric
testing that has demonstrated adequate internal consistency, stability, and validity
(Park & Peterson, 2006). Overall, although not studied as extensively as the adult
version of the VIA, the 198-item VIA-Youth appears to demonstrate acceptable to
good levels of reliability and validity. In terms of reliability, Park and Peterson
87
(2006b) presented results from a US sample of 250 typically adolescents (10 & 13
years). They found satisfactory Cronbach’s alpha > .70 for all 24 scales, ranging
from .72 for social intelligence to .91 for spirituality. Six-month test-retest
correlations ranged between .46 (teamwork) and .71 (religiousness/spirituality) and
revealed a median of .58 across the 24 scales, suggesting good reliability. Most
subscale scores were skewed but still had acceptable variability.
The Strengths Assessment Inventory -Youth Version (10-18 years) (SAI-Y;
Rawana & Brownlee 2010; MacArthur, Rawana & Brownlee, 2011).
Rawana and Brownlee (2010, p.10) designed the Strengths Assessment
Inventory and define strengths as “a set of developed competencies and
characteristics that is valued by the individual and society and is embedded in
culture” (as cited by MacArthur, Rawana & Brownlee, 2011).
The SAI-Y is an ipsative self-report assessment tool developed to assess
intrinsic strengths (personal developmental) and strengths appertaining to the
individual’s interaction with the environment (contextual) (Brazeau, Teatero,
Rawana, Brownlee & Blanchette, 2012). Claimed to reflect day-to-day functioning
throughout the lifespan of the child, it was used as the primary instrument when
Franks, Rawana and Brownlee (2013) investigated the relationship between
adolescent (11-15) strengths and bullying experiences.
The original SAI-Y 124 items assess 21 strengths appertaining to: home;
school; free time; friends; knowing yourself; keeping clean & healthy; being
involved; faith & culture and goals & dreams; competent coping skills; commitment
to family values; respect for own culture; optimism for the future; community
engagement; functional classroom behaviour; creativity; sense of well-being; health
consciousness; pro-social attitude; activity engagement & peer connectedness.
88
These items are scored on a 3 point likert-style scale and responses are given
in terms of the best description of self as ‘Not at all’, ‘Sometimes’ or ‘Almost
always’ with higher scores representing greater strengths. Each item also has a
‘Does not apply’ response. Responses are elicited for statements such as ‘I use my
listening skills at school’ (school), ‘I can tell right from wrong’ (knowing myself)
and ‘I work to be at a certain grade level in school’ (goals & dreams). A total
strength assessment score is given as well as individual strengths, again it is noted as
an ipsative measure, scores are beneficial on an intra individual basis only.
In terms of reliability, analysis of data from a representative sample of
typically developing children (N = 572, M = 12.82, SD = 2.47) indicated acceptable
to good levels of reliability. (Brazeau, Teatero, Rawana, Brownlee & Blanchette,
2012). Cronbach alpha’s (across all age categories) for the subscales ranged from
.60 for peer connectedness to .87 for commitment to family values with the majority
of alphas being between .70 - .87. The SAI-Y ratings have demonstrated good test–
retest reliability when used with a sample of 572 children and adolescents (9 to 19
years), with correlations ranging from .47 to .82 (Brazeau et al., 2012).
In terms of validity, in the validation sample (Rawana & Brownlee, 2010),
the SAI-Y total scores also demonstrated good convergent (r = .52–.60) and
divergent (r = .40–.45) validity with standardized instruments of strengths and
emotional and behavioural functioning (i.e., Conners Comprehensive Behaviour
Rating Scales; Conners, 2008), and self-concept (Piers Harris Children’s Self-
Concept Scale-2; Piers & Herzberg, 2002). The SAI’s validity has also been
confirmed through positive correlations with the BERS-2 (Rawana & Brownlee,
2010). In a sample of 230 male and female adolescent offenders, confirmatory
factor analyses indicated that the SAI-Y’s factor structure exhibited an acceptable fit
89
overall, while some factors fitted the data well, other factors displayed a
questionable fit (Royer-Gagnier, Skilling, Brown, Moore, & Rawana, 2016).
Overall, in terms of psychometric properties, the SAI has demonstrated
acceptable to good levels of reliability and validity.
2.5.2.3 Qualitative measure
The Life Story Interview (McAdams, 1998)
Life-narrative data are typically obtained through Life Story Interview and
the questions used in this semi-structured interview are aligned directly with the
Life Story Interview Protocol as profiled by McAdams (1995, 2008 revised) (see
Appendix C). This format was adopted primarily due to the interplay with identity
formation within a social, historical and cultural context. In recognising that 13 to
15 year olds were capable of formulating life stories and their importance in terms
of self-esteem, the Life Story Interview was considered the exemplar in charting the
identity development of these participants. In addition, this methodology can be
utilised to explore specific social, cultural and historical topics through an
individual’s life story and investigates the connections between individual lives and
a broader range of public events (see Table 2.4)
The researcher started the one-to one interview with the adolescent by
explaining that this is the story of their lives and emphasised that she was interested
in hearing stories of parts of the past as the individual remembers them and well as
their imagined future. A few key things in the past would be focussed upon as well
as future hopes. The adolescent was ensured there are no right or wrong answers. If
they struggled to understand a question or felt they didn’t want to answer any
90
questions or indeed if they wanted to stop the interview at any point and withdraw
from the study, that was completely acceptable.
The adolescent was informed that although the interview is audiotaped, once
transcribed and the PhD completed the transcript would be destroyed to ensure
anonymity and confidentiality. Throughout the adolescent was referred to by a name
previously chosen from a pre-selected list.
The adolescent was then asked if they could think about their life as a book
how would they name these Life chapters. Questions exploring Key Scenes (or
moments) in the Life Story are then posed, key scenes were defined as those that
stood out for a specific reason, maybe because it was particularly good or bad,
particularly vivid, important, or memorable.
These key scenes that the participant was asked to expand upon were: a high
point, an episode in their life that stood out as an especially positive experience; a
low point, an episode opposite to the first scene; a turning point; a positive
childhood memory and; a negative childhood memory – an unhappy memory,
perhaps entailing sadness or fear. For each of these key scenes, the adolescent was
asked who was there, what did they do, how did they feel and what strength was
revealed. It was further explored whether they saw this strength often and how
possessing this strength made them feel.
The next three questions focussed on their future script and the adolescent
was asked to describe: the next chapter in their life; their plans, dreams, or hopes for
the future and; whether they had a project in life they were working on.
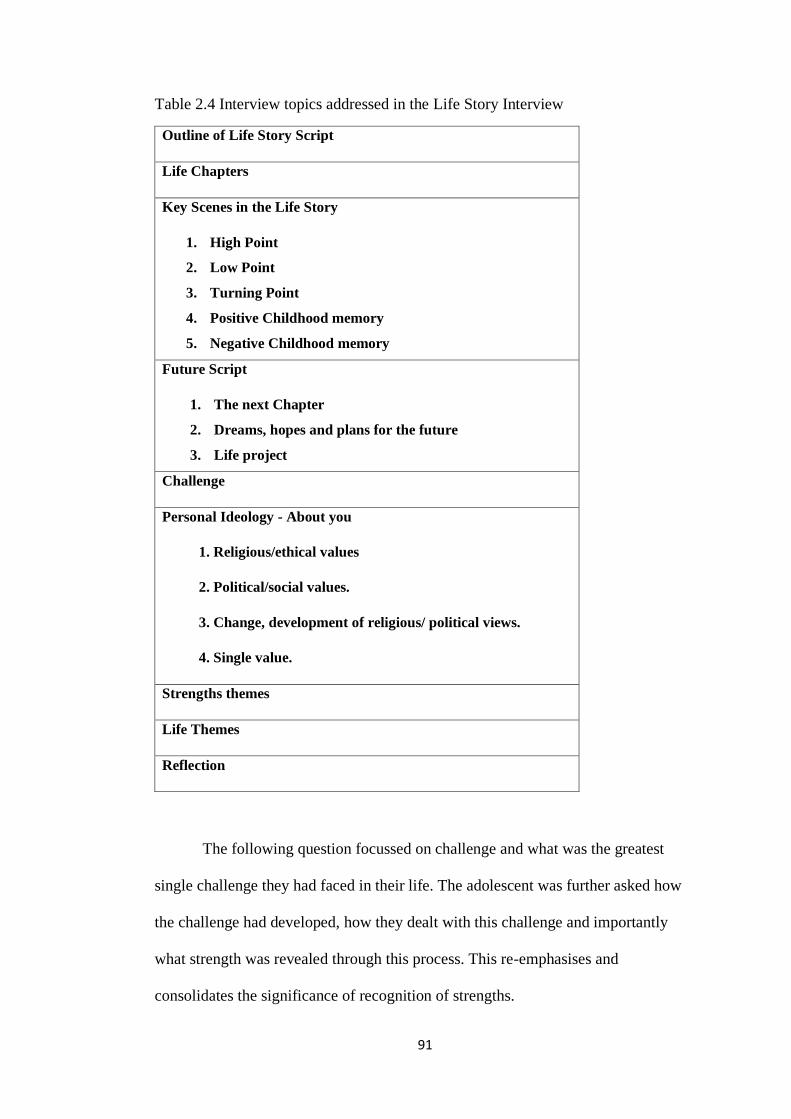
91
Table 2.4 Interview topics addressed in the Life Story Interview
Outline of Life Story Script
Life Chapters
Key Scenes in the Life Story
1. High Point
2. Low Point
3. Turning Point
4. Positive Childhood memory
5. Negative Childhood memory
Future Script
1. The next Chapter
2. Dreams, hopes and plans for the future
3. Life project
Challenge
Personal Ideology - About you
1. Religious/ethical values
2. Political/social values.
3. Change, development of religious/ political views.
4. Single value.
Strengths themes
Life Themes
Reflection
The following question focussed on challenge and what was the greatest
single challenge they had faced in their life. The adolescent was further asked how
the challenge had developed, how they dealt with this challenge and importantly
what strength was revealed through this process. This re-emphasises and
consolidates the significance of recognition of strengths.
92
The following series of related questions explored the personal ideology of
the adolescent. The first question investigated religious beliefs and values and
whether they held an overall ethical or moral approach to life. The second explored
political and social values, in that did they hold a specific political viewpoint and
was there a social issue that they felt strongly about. The third question asked
whether they had recognised a change over the years in the development of their
religious and political views and the last question investigated the adolescent’s
views on what they considered to be the most important single value in human
living.
The next questions focussed on strength themes. Adolescents were asked
what they did that so absorbed them they lost track of time and in what kind of
activities did they make their boldest choices and took the greatest risks.
The penultimate question referred to a life theme, and the adolescent was
asked to reflect over their whole life story with all its chapters, scenes and
challenges, extending back to the past and forward to the future, and whether they
could identify a central theme that ran through their story. Change and continuity
was also addressed by asking them how they believed they had changed since they
were 8 years old. After thanking the adolescent for the interview, the last questions
posed focussed on reflection acknowledging that most people do not have the
opportunity to share their life stories in such a way regularly. The adolescent was
asked what the interview had been like for them, what were their thoughts and
feelings during the interview, how did they think the interview had affected them
and whether they had any other comments about the interview process.
In summary, this Life Story Interview harnessed the key tenets of the
McAdams’ Model. Questions focussed upon different critical life events, life
93
challenges and personal ideology in terms of religious/ethical/political and social
values. Participants were asked their single most important value, strength and life
themes. In a reflective section, participants were asked to consider change and
continuity within their life. Throughout the Life Story Interview, the adolescents
were asked which strength that they recognised had emerged from that specific life
event, how frequent this strength appeared and the accompanying feelings. In
addition, the focus on strengths was consolidated when life strength themes were
referred to near the end of the interview. Such questioning aimed to further reinforce
that strengths may evolve from all types of life episodes and aligns well with the
strengths-based quantitative instruments used within this Study. The questions on
personal ideology allowed the researcher a window into facets of identity
development. Indeed, McAdams considers identity explored through narrative is the
personal myth individuals construct to define themselves and weave together a
coherent sense of self.
Interpretative Phenomenological Analysis (IPA)
Underpinned by phenomenology, hermeneutics and idiography (Smith,
Flower, & Larkin, 2009), Interpretative Phenomenological Analysis is used for the
analysis of semi-structured interviews as it seeks to comprehend lived experience
and how particular individuals make sense of their personal and social experiences.
Phenomenology is derived from the Greek terms phainómenon, meaning
“that which appears”, as well as λόγiς, meaning “science, study, theory”. It
highlights our individual capacity to construct our own meaning from our
experiences. With its origins in philosophy as well as psychology,
phenomenologists suggest that our experiences of our environment are made up of
the interaction between “raw matter” (i.e., objects) and our mental abilities, and as
94
such are highly subjective. IPA is phenomenological in that it seeks to investigate an
individual’s personal perception or account of an episode or state instead of
endeavouring to give an objective record of the episode or state itself. The research
process is complex and dynamic in which the researcher plays an active role (Smith
& Osborn, 2008) in harnessing their own personal understandings and biases. The
participants’ ability to express their experiences and thought adequately impacts
upon interpretation, as will the researchers analytical and reflective skills.
The small number of participants profiled in this research (four in Sample 1
and eight in Sample 2) is in line with the small numbers recommended by IPA to
facilitate an in-depth analysis of individual cases and the explore commonalities
across cases. Interviews lasted between 35 to 60 minutes and were audio recorded
and then transcribed, with all identifying information either removed or disguised.
The semi-structured nature of Life Story Interview fits well within this
framework. Questions asked about high points, low points, turning points and other
life junctures which allow the researcher and the adolescent to co-construct meaning
of their past – allowing a more cohesive sense of self (Smith & Osbourne, 2003).
The schedule guided interviews rather than dictating them, facilitating the
participants’ ability to tell their own story in their own words. Questions were
initially delivered in an open-ended and non-directive style in order to get as close
as possible to the participants’ views without them being led too much by the
interviewer’s questions.
In line with IPA, each interview was commenced by adopting an open mind
and, as much as possible, to attempt to enter the personal world of the young people.
It is important to note, however, that questions and non-verbal communication may
have encouraged or discouraged certain responses and a different researcher may
95
have elicited different responses. Personal beliefs and assumptions may also have
influenced the way in which the data was engaged with and made sense of. A
reflexive journal was kept throughout the research process in order to raise
awareness of such issues and to ensure a constant mindfulness of them.
Questioning was aligned as much as possible to the interview schedule to
enhance reliability but when participants wanted to elaborate on a particular topic
the flow of conversation was followed with probes such as ‘Can you tell me more
about that?’ or ‘How do you feel about that?’. It was believed the need for
expansion reflected the significance of the subject being broached.
After the interview detailed notes were made about the experience, recording
initial thoughts, body language, feelings and impressions as well as documenting
anything that might have affected the interview, such as interruptions or salient
points about the environment in which the interview had taken place.
All interviews were recorded using two recording devices to ensure if one
device failed during the interview process material there would be no risk of losing
the material. All participants were fully aware of the audio recordings and all
consent was received not only in writing at the beginning of the research process but
also verbally at the commencement of each interview session.
Due to the pace of the interviews, simultaneously written transcripts could
not be made and would have only captured ‘gists’ of information and miss vital
nuances. The flow of conversation would have been interrupted and the establishing
of a rapport with the participant would have been punctuated. However, the making
of notes immediately after the interview ensued that non-verbal behaviour were not
missed.
96
The level of transcription for IPA is generally at a semantic level where all
aspects of the words spoken and language are explored. Significant pauses,
hesitancy, laughs, and false starts are all recorded in an accompanying notebook.
The time involved in transcribing is dependent on individual typing speed and the
clarity of recording. On average transcribing ranged from 4 to 6 hours each
interview.
The researcher then endeavours to gain the essence of the individuals’
experience through conducting a thorough stage analysis in line with Smith, Flowers
and Larkin (2009) (See Appendix D for IPA flow diagram). The procedure taken in
the data analysis are profiled; Step 1: Initial annotation of interesting and significant
comments; Step 2: Second annotation - higher levels of abstraction and use of more
psychological terminology; Step 3: Generating a table of initial themes; Step 4:
Analytical and theoretical ordering of themes; and Step 5: Generating a visual table
of subordinate themes and culminating in write-up (Smith, Flowers & Larkin,
2009). These stages are now described in further detail.
The interview transcripts were transcribed verbatim. The initial stage of
analysis involved investigating each of the transcripts to gain greater insight into the
life story of each participants – this facilitated an interpretative relationship with the
transcript as recommended by Smith et al. (2009). The role of the researcher as
investigator was to encapsulate the intended meaning of the spoken word, to centre
the participant at the core of their mental and social world. In order to emerge
completely in the text and process of interpretation involved prolonged engagement.
The final transcript for each participant was re-read on a number of
occasions, and in compliance to IPA format, the left-hand margin was used to
annotate what the researcher considered significant remarks said by the participant.
97
By extensive familiarisation with the transcript, these comments represented
synopsises of what had been said, connections or early interpretations. The process
was replicated for the first transcript of each participant.
The first stage was the initial marginal annotation of significant comments.
This IPA stage 1 process was continued for all four transcripts. The whole re-
reading of the transcripts then commenced again, this time the marginal annotations
was converted into concise phrases comprising psychological terminology yet still
reflecting the words actually transcribed. The ability was to capture expressions
which were high enough to allow theoretical associations within and across
participant transcripts yet still rooted in the phraseology actually spoken.
The second stage was the higher level of abstraction. At this stage the entire
transcript was treated as data, and hence no attempt was made to select particular
passages for special attention nor to omit them. At the same time, not every statement
necessarily generated particular themes. Some passages were richer than others with
regards to the number of themes which were found and identified.
The third stage was the noting of initial themes and their connections.
Emergent themes revealed throughout all transcripts were then listed (as in the table
below) and connections found between them.
The fourth stage comprised ordering the themes in a more analytical and
theoretical way. An exploration of the emergent themes was made before allocated
them into groups of themes – with reference and compatibility with the primary
source material (actual transcript). Using interpretative and reflective skills to
elucidate whether these themes made sense and mirrored the original data.
In the final fifth stage a table of themes was produced and grouped them in a
coherent order. The clusters were named representing the superordinate theme. See
98
Appendix E for an example of the interview transcript showing the attempts to
explore the meaning and lived reality of this participant, D3, talking about his
relationship with his father.
In sum, individual transcripts are initially analysed. After the initial reading,
re-reading and initial noting, quotations from adolescents were sorted in emergent
themes which were then refined to produce subordinate themes for each case. The
themes from the transcripts were collated and patterns identified within and between
the samples. This allowed the development of group themes dependent on the
strength of the participants’ voices underpinning it.
Inter-rater reliability is a gauge of the level of concordance between the
independent coding choices of two (or more) coders (Hallgren, 2012). For this
research, to ensure a level of inter-rater reliability, another doctoral student
evaluated the research quality at the end of the study (as with Lincoln & Guba,
1985). This approach was taken to ensure a level of rigour and trustworthiness as
all qualitative quality frameworks aim to mitigate interpretive bias of a sole
researcher. The doctoral student herself was researching from a positive psychology
framework and was familiar with IPA process and coding. Coding is an iterative
process that aims to discern “a word or short phrase that captures and signals what is
going on in a piece of data in a way that links it to some more general analysis
issue” (Rossman & Rallis, 2012, p. 282). The researcher gave significance to the
final themes by giving explanations and drawing conclusions (Creswell, 2013;
Rossman & Rallis, 2012).
While IPA comprises the participant’s interpretation of their experience, it
acknowledges the position and the pre-conceptions of the researcher in making
99
sense of the individual’s accounts. This reflexivity is now discussed before
detailing the procedure of this Study.
Reflexivity
A major component of Interpretative Phenomenological Analysis is
reflexivity. Reflexivity refers to the process by which the researcher references their
earlier understandings and biases related to the participants and settings of their
observations. The subjectivity of qualitative research and analysis makes it
incumbent upon the researcher to reveal any pre-existing biases or influences that
may influence the interpretative process. Every time one returns to the script it can
be viewed with a slightly different perspective, in the acknowledgment that it is
equally important to question my identity in relation to the identities of the
participants. With this newly acquired self-awareness it allows us to understand that
every event is constructed and understood by an interaction between our
observations and earlier knowledge. It is therefore crucial that I counter the effect of
my personal subjectivities on this research. It is my duty to inform the reader of my
background and my position as researcher. Such a stance then allows the reader to
evaluate my position as researcher in relation to the context of the research, the
participants and the overarching answers to the research questions. If objectivity is
impossible it is the task of the researcher to expose pre-existing biases, motivations,
relationships and narratives that underpin their ideology.
Although there was evidence to support the low self-esteem of the two
samples in Studies 1 and 2 of my thesis I had only had experience with working
with children with dyslexia. I have always empathised with participants with hidden
invisible disabilities, such as dyslexia. As a unilaterally deaf person, I fully
comprehend how life involves ‘consciously compensating’ (Nicolson & Fawcett
100
1990) and planning. I believe my deafness gave me a unique perspective into their
world and my own experience with three adolescent children enabled me to sense
underlying meaning to their narrative. The participants in Sample 1 were chosen
from the same school used in my MSc research. Although the environment was the
senior not the junior school, I was comparatively comfortable and knew the
teachers. Initially I was concerned that the fact my husband had worked as a teacher
in the same school and my elder son was in the year below the participants would
give me potentially a positive biased view of the school; however, the positivity
entrenched within the school environment was reflected in the participants’
narrative. The participants did not see the familial connection as my son has my
maiden surname.
I had no prior practical knowledge of working with adolescents at risk of
becoming NEET as in Sample 2 and initially felt slightly daunted by the fact that the
school said they were ‘going to throw their worst at me’. It was fascinating how
their disruptive behaviour in the class (for example, shouting, throwing paper
aeroplanes in sessions, walking around) masked a very different person revealed in
one-to-one Life Story Interviews. I felt very privileged when they shared the
intricacies of their stories and hopes with me. For some, talking about sad, and
sometimes the tragic, events that had punctuated their lives represented an
unburdening experience. I believe that the experience of sharing these feelings with
me underscored the power of narrative. In being allowed a window into their world,
I could also understand and track their disengagement. I realised I was learning as
much from them as they were learning about themselves. Without the motivation,
kindness and dedication of the Learning Support department in sending reminders to
101
my participants on a weekly basis, I would not have achieved data from all
participants at all time points.
This entire research was fuelled by my compulsion to ‘give voice’ to those
who feel marginalised and those with ‘invisible disabilities’, especially when
struggles are combined with the normative tribulations of adolescence and to guide
them to formulate a positive identity underscored by positive emotions in the past,
present and future.
Interviews were of varying lengths, due to participants forgetting and the
long way they had to travel across the school campus to the room. I collected each
participant in Sample 1 from their classroom and each participant in Sample 2 from
the Learning Support department prior to the session. The walk from these rooms
enabled me to talk to participants prior to the actual audiotaped interview. This
allowed me a window on their world as many talked about extra curricula activities
such as fixtures and the levels of nervousness of each participant could be gauged
with the intention of reducing it prior to the semi-structured interview.
As a precursor to the interview session as we were arranging seats, I always
mentioned my need to sit on their right side due to my unilateral deafness, it was
hoped that by revealing my own vulnerabilities would enable them to feel
comfortable in exposing their own struggles.
Some participants’ non-verbal mannerisms exposed anxieties (leg shaking
under the table, tapping underneath the desk) that would not have been revealed by
just listening to the audiotape. One participant from Sample 1 used the phrase ‘to be
honest’ 15 times during his interview; however, his defensiveness level was low (as
measured by the CFSEI-3) so this could just be a turn of phrase he uses often. A
transcript punctuated by ‘to be honest’ is an example of an ‘adverbial disjunct’
102
which indicates participant D4’s attitude towards the sentence without affecting the
meaning of the sentence. It is suggested that this is frequently used (consciously or
otherwise) to preface or affix a statement that D4 believes is particularly sincere in
the present context.
The extended temporal nature of completing research with my Sample 1
meant that from preliminary discussions with the headmaster, the ethics review and
literature research to the 12 month post-intervention follow-up took over one year 9
months. During the first few months of this process when I was initially due to
collate data and interview my participants, my fifteen years old daughter was
diagnosed with a large adrenal tumour and had to undergo life-threatening surgery. I
was given leave of absence from January to March 2015. This period covered her
pre-operative care at home (she was poorly due to the intensity of the medication
and was unable to attend school), the 12 days in hospital and post-operative care at
home. My daughter now has a life management condition with yearly MRIs and
tests. The Department of Psychology, specifically my Supervisors Professor Rod
Nicolson and Dr Jilly Martin and Josie Cassidy were wonderful during this
traumatic period.
After this leave of absence, I found enthusiastic motivation extremely
difficult to sustain and my ability to concentrate was depleted. Prior enjoyment of
my subject temporarily morphed into a potentially insurmountable endurance
challenge.
The shock of my daughter’s diagnosis, in conjunction with recent close
bereavement and serious illness, has had a very negative long-term impact on my
anxiety levels and progression of my fibromyalgia for which I take medication. In
the month before my thesis submission, my daughter had emergency surgery which
103
she again bravely endured. Throughout these continuing ongoing periods of
uncertainty regarding health issues, I believe my PhD has resembled a constant
companion. A companion from which I have derived strength and direction but
sometimes one which has depleted my already low energy levels and competed for
time and attention with my three children.
I now consider my knowledge base and furthermore, my acquired profiling
skills, enhancement and progress. The knowledge base on the entire subject of self-
esteem is dynamic. Pivotal research at the commencement of the project has been
contradicted within the intervening months. To ensure my research was centred in
relation to existent published literature, it was essential to be mindful and inclusive
of burgeoning research and not to be blinkered by previous assumptions just
because they fitted in with my ideology. By adopting a mixed methodology,
(Teddlie & Tashakkori, 2009), I faced the amalgamation of quantifiable positivism
and the tenets of anti-positivism - the fluidity and abstract nature of qualitative data.
However, these potentially incompatible paradigms revealed inherent duality
(Patton, 2002) and yielded rich data. Nevertheless, the importance of pragmatism in
interpretation must be underscored (Feilzer, 2010). Amidst this research process I
believe previously fragmented knowledge has been coagulated.
Translation of theory-based knowledge into real-life situation is complex,
where the ‘faceless participants’ described in research are replaced by ‘real
participants’. Transcribing and coding provided a welcome framework (Smith,
1996) to extrapolate what the participants meant from what they said.
The relation between researcher(s) and researched has been a consistently
debated theme in qualitative literature and the inherent power imbalance between
104
researcher and research is acknowledged (Råheim, Magnussen, Sekse, Lunde,
Jacobsen, & Blystad, 2016).
In terms of researcher positionality, it is important to reflect upon the duality
of the position I held as both a mother and researcher. In researching a population
where I am parenting a child of the same age, I believe gave me a privileged and
unique insight into the adolescents’ lives. Although I understand this may have
influenced my interpretation of stories and indeed my interactions with the
adolescents.
I understand through the complexities of my own children’s lives, the long-
lasting impact of familial death, illness, exam stress and the intricacies of forging
good family relationships (with stepfather and biological father). Indeed, listening to
my son’s anxieties about school exams and the internal pressure involved in
constantly trying to achieve academically gave context and colour to the stories
shared by the adolescents.
Some of the adolescents’ stories were accompanied by strong powerful
emotions, especially when discussing parents or grandparent’s deaths, parental
separation and exam stress. The expression of emotions was vital in this context and
although it was critical not to interrupt, I sometimes struggled to curtail my maternal
instinct to comfort.
Due to understanding the intricacies of my son’s life, I was knowledgeable
of current issues that were being discussed amongst my son’s peer group (for
example, memes, music, TV programmes). I could therefore easily discuss this
information in the preamble to the interview and at the beginning of the intervention
sessions whilst waiting for the arrival of all participants. Such communality help
forge tentative connections. Indeed, by the end of the intervention program and
105
post-intervention assessments, some of the adolescents may have seen me in slightly
more of a maternal role rather than researcher. It was difficult to gauge how this
potential blurring of roles influenced the adolescent’s perceptions of myself.
However, I was very aware that their perceptions could influence our interaction and
subsequently the information that was revealed (Richards & Emslie, 2000). Upon
reflection, I believe being a mother was a very positive element, allowing me to gain
rich descriptive data from an age group that I holds an intrinsic interest for me. I
have gained so much from researching such a fascinating and diverse cohort. The
discoveries from my studies have also impacted upon my parenting and how I now
actively encourage my children to feel positive emotions, embrace creativity and
follow career paths that align and promotes their strengths.
My knowledge as a mother with a similar aged son made me feel I was in a
better position to elucidate meanings. In terms of reflexivity - a critical element of
narrative - the affinity for the participants in Sample 1 that I had known over a
protracted time in school may indeed have biased my approach. In previous MSc
research one of new participants was the older brother of an earlier participant, so I
felt I knew the dynamics of his family life well. Although I endeavoured to treat
each participant identically, I empathised more with familiar participants whose
home and life story I understood. I acknowledge that through the narrative process I
felt more infinity with the participants from both samples whose lives had been
punctuated by divorce, death and struggle than the ones that appeared to have not
experienced such difficulties. I held the utmost admiration and felt a heightened
level of care to all participants, in particular those that faced daily barriers, in terms
of learning, family illnesses and other complexities.
106
Considering skills enhancement, I found from the onset that my
interpersonal skills were developed - my patience, caring and listening skills
fostered by earlier learnt counselling skills and a previous history of interviewing
participants in a school setting. I tried to prevent myself from over-talking and
asking two questions combined as one - rather I waited to receive a full explanation
of the first question. Having to suppress my natural conversational and enquiring
instinct was sometimes a struggle and could be considered a newly acquired skill.
When participants asked for clarification of a question, I replied in a very open-
ended rhetorical manner (against my innate nature to give specific leads). I hoped
this abstractness would enhance the participants’ natural flow of conversation.
During interviews I was concerned about guiding the participants’ responses due to
inadvertently mentioning a trigger word (for Sample 1, this would be dyslexia and
for Sample 2, disengagement). Usually animated in my conversational interactions
with these participants I was bland in my responses in order to ensure there was no
bias (McCambridge, de Bruin & Witton, 2012). When participants were not as
forthcoming as I had hoped, I did not labour questions. In the earlier MSc
interviews my naive compulsion to stick rigidly to the interview schedule, in order
to ensure parity between participants, could have been considered a negative – by
failing to follow potential leads that may have yielded a deeper understanding of
their lived experience.
In addition, I had to dispense with any preconceptions to assimilate
information as it was given. None of the participants in Sample 1 mentioned
dyslexia early in their interview; however, such disclosures regarding struggles in
English and concentration difficulties were commonplace amongst these
participants and I found myself subconsciously willing participants to mention
107
dyslexia in order to perhaps provide ‘substance’ to my research. I had to learn not to
attribute all difficulties experienced by the disengaged participants to be directly
associated to their disengagement from school and similarly so with the struggles
experienced by participants with dyslexia to be directly linked with dyslexia. I
realised that what adolescents fail to mention is, in some circumstances, more
significant then what they explicitly say. Omission can be equally as important as
inclusion in reinforcing that the participants in Sample 1 did not themselves identify
as dyslexic. Communication and team skills were improved as I conversed with the
Heads, class teachers and learning support teams. I believe I dealt with stress by
problem-focussed rather than emotion-based coping strategy (Struthers, Perry &
Menec, 2000). Pouring energy into my work allowed me in the short term to shelve
my continual underlying anxiety about my daughter.
Planned scheduling was relatively stress-free, planning around school trips,
school holidays, away matches, pupil illnesses, and my own children’s ailments.
Participants’ and school feedback were very positive with the Head of Interventions
for Sample 2 commenting that they were “well aware of the positive impact you
have on our students in school’. He elaborated ‘we have seen big changes in the
attitude and behaviour of the students you have worked with. This impact is now
being seen in their engagement in lessons and although not perfect, the students are
not getting in to as much trouble with their ‘Behaviour for learning’ system”.
‘Behaviour for learning’ was their whole school rewards and discipline procedure
that covered many aspects of school life including behaviour in the classroom and
around school. Such kind comments on the participants’ progress were very
appreciated and, indeed, the school requested me to implement the intervention
108
again for a new ‘disengaged’ group the next term, an invitation I sadly couldn’t
further due to commitments.
My intrinsic motivation propelled me along a slow path of self-actualisation
(Maslow, 1954). As a positive, this entire process has made me more
psychologically literate (Cranney, Botwood & Morris, 2012) and it has strengthened
my natural motivation, built confidence and encouraged meaning and integrative
learning. The motivation to complete this research stems primarily to add to the
body of research and to the adolescent participants who willingly shared their time
and thoughts with me so I could delve into their self-esteem. This research has
indeed been something of a privilege. In sum, it has tracked both the adolescent’s
lives and self-esteem, and provided me with a very worthwhile reflective journey.
2.5.3 Procedure
All parents received an information pack and adolescents also had an
information sheet outlining the research and procedures in age-appropriate
language. All who were asked to participate consented. This comprised four
participants in Sample 1 (dyslexic) and eight participants in Sample 2 (NEET). All
signed the consent forms and completed the short demographics forms. These were
then returned to the researcher in a prepaid envelope. The researcher circulated the
Parents’ version of the BERS-2 through the school Learning Support Department.
The Heads of Houses/Form Teachers were allocated to complete the Teacher
version of the BERS-2 due to their close knowledge of the individual participating.
All parents’ assessments were returned for Sample 1, whereas none of the parents
returned their version of the BERS-2 assessment for Sample 2 participants.
The written self-esteem and strengths assessments were collected in three
tranches as it was essential that the participants did not feel time pressurised or
109
overwhelmed by data collection. The four participants with dyslexia in Sample 1
were identified as D1, D2, D3 and D4 and the eight disengaged at risk of becoming
NEET participants in Sample 2 were identified as N1 to N8, these identifiers were
unknown to themselves or the group. Participants N1, N2 and N3 were female, all
the other participants were male. Paper versions (rather than online) of the
assessments were provided, completion time of each measure was 10-15 minutes
and carried out in a group setting, this ensured any queries were answered
immediately by the researcher and the participants were not time pressurised.
Participants were told that the activities were not school assessments, thereby
removing the potential of negative connotations.
Data collection took place in a room off the School Library for Sample 1 and
a quiet teaching room for Sample 2.
The life-story interview was conducted on a different day to the completion
of any other assessments. On average it took just under 60 minutes to complete
depending on how talkative the participant was (range 44-59 minutes) which is
slightly longer than the intended range of 35-45 minutes. All interviews were
audiotaped. Any names of individuals (e.g. teachers) or other identifying
information has been changed to fictitious references. All interviews for both
samples took place individually in a quiet room off the Learning Support
department on school grounds and within normal school hours. The function of
interviews is not only to evoke responses, but indeed, to learn which questions to
ask and how to ask them. Moreover, the qualitative technique of interviewing
requires the researcher to be genuinely interested, empathetic and respectful to the
participants as individuals.
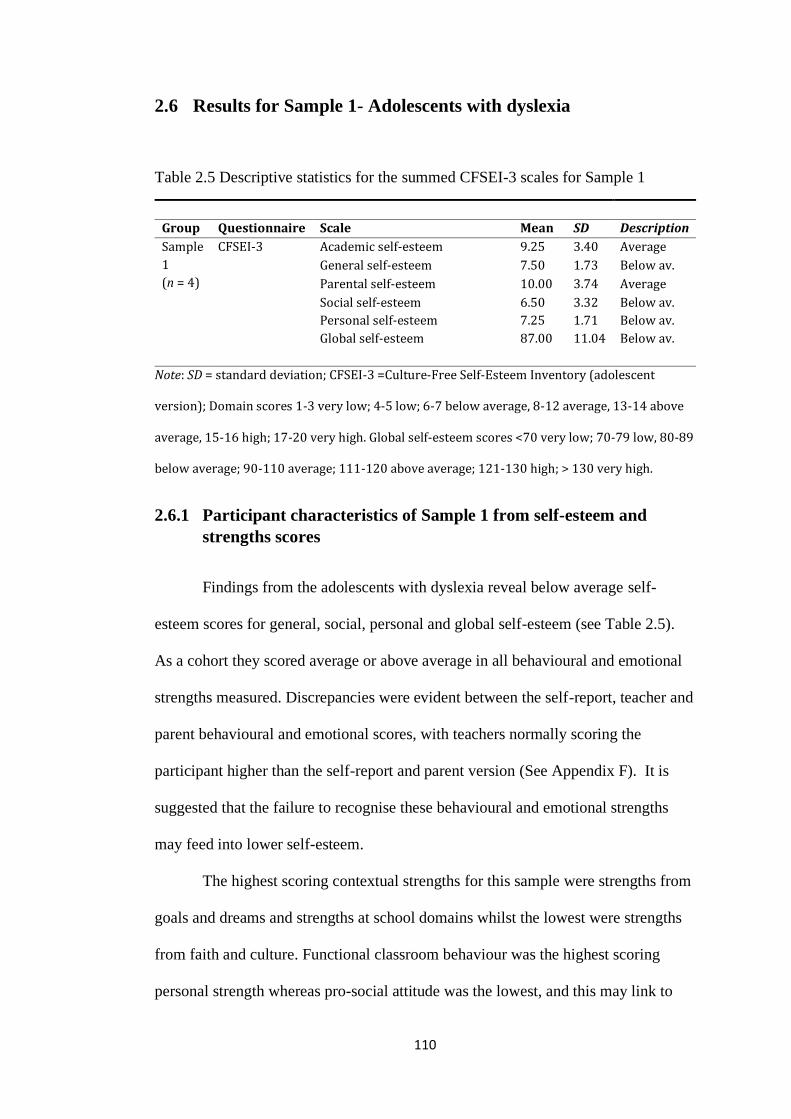
110
2.6 Results for Sample 1- Adolescents with dyslexia
Table 2.5 Descriptive statistics for the summed CFSEI-3 scales for Sample 1
Group Questionnaire Scale Mean SD Description
Sample
1
(n = 4)
CFSEI-3 Academic self-esteem 9.25 3.40 Average
General self-esteem 7.50 1.73 Below av.
Parental self-esteem 10.00 3.74 Average
Social self-esteem
Personal self-esteem
Global self-esteem
6.50
7.25
87.00
3.32
1.71
11.04
Below av.
Below av.
Below av.
Note: SD = standard deviation; CFSEI-3 =Culture-Free Self-Esteem Inventory (adolescent
version); Domain scores 1-3 very low; 4-5 low; 6-7 below average, 8-12 average, 13-14 above
average, 15-16 high; 17-20 very high. Global self-esteem scores <70 very low; 70-79 low, 80-89
below average; 90-110 average; 111-120 above average; 121-130 high; > 130 very high.
2.6.1 Participant characteristics of Sample 1 from self-esteem and
strengths scores
Findings from the adolescents with dyslexia reveal below average self-
esteem scores for general, social, personal and global self-esteem (see Table 2.5).
As a cohort they scored average or above average in all behavioural and emotional
strengths measured. Discrepancies were evident between the self-report, teacher and
parent behavioural and emotional scores, with teachers normally scoring the
participant higher than the self-report and parent version (See Appendix F). It is
suggested that the failure to recognise these behavioural and emotional strengths
may feed into lower self-esteem.
The highest scoring contextual strengths for this sample were strengths from
goals and dreams and strengths at school domains whilst the lowest were strengths
from faith and culture. Functional classroom behaviour was the highest scoring
personal strength whereas pro-social attitude was the lowest, and this may link to
111
the below average social self-esteem. The five highest scoring character strengths
for Sample 1 are termed their ‘signature strengths’ and were in order of ranking;
zest, curiosity, bravery, then jointly creativity and gratitude (see Appendix G).
2.6.2 Results of the IPA of the Life Story Interviews with Sample 1
Seven themes were identified from the transcripts of Sample 1 (see Table
2.6). The themes were grouped in a coherent order dependent on their frequency and
level of description, i.e., academic self-evaluation was the strongest theme, followed
by self-efficacy etc. The themes were named representing the subordinate themes.
There was inter-rater agreement on all the themes, their subordinate themes and the
theme names.

112
Table 2.6 Themes with subordinate themes for Sample 1 ordered by their frequency
and level of description
Themes Subordinate themes
1 Academic Self-
Evaluation
Academic peer comparison
Academic struggles
Self-regulation
Perseverance
Awareness of optimum learning environment
2 Self-efficacy Creativity
Academic self-efficacy
Athletic ability
3 Emotional awareness
Emotional awareness related to self, others and situations
Expression of emotion -externalisation (anger and frustration)
internalisation of emotion (anxiety, fear, grief and depression)
4 Identity Significance of family dyads (father-son)
Self-knowledge
Decision making and autonomy
Future career plans
Wider societal thoughts
5 Social Self-Evaluation Friendship
Popularity
Reputation/status
Teamwork
Social self-regulation
Bullying
Physical comparison
6 Emotional self-
efficacy
Productive coping strategies
Non-productive coping strategies
Reference to others coping strategies
7 Self-attribution Internal locus of control
External locus of control (learned helplessness)
113
2.6.2.1 Theme 1 - Academic self-evaluation
The participants were acutely aware of their academic positioning in relation
to others in the class and academic peer comparisons were often mentioned,
although some comparisons were becoming more positive, a more negative slant
was normally adopted. Being in different sets (1 being the top and 4 being the
lowest set) allowed participants to identify their positioning not only within their set
but within the entire year set. This ranking system perpetuated a competitiveness
within and between sets, participant D1 reflected that although he was in the lowest
set he was achieving marks higher than Sets 3 and 2 in annual core maths tests.
Another participant D4 believed he was ‘in the top five in my Science set’ noting last
year only a couple of boys were moved into the higher set. A general comparison
was made between those taking triple science and those that struggled more who sat
double science as they ‘don’t do as much as the others and you have like a
shortened exam which really isn’t that good’. The significance of academic
achievement was underscored by participant D4 who believed that to be ‘smart
naturally gifted’ is the important attribute and believed ‘they have it easier than
anyone else as everyone’s learning it and they have already got it in their heads its
already there so they don’t have to put in as much work as everyone else’.
Academic struggles in the school and home environment were mentioned by
all the participants; they referenced schoolwork, revising, and a lack of
concentration and distraction. Although dyslexia was not mentioned explicitly,
difficulties in both English and Maths were profiled by all participants. As
participant D4 eluded to difficulties with ‘the grammar and writing essays’ and he
also found Maths ‘quite tiring cause it’s quite hard and you see we have to be on the
ball to listen to what the teacher says all the time’.
114
Distraction and lack of concentration permeated the narratives. Participant
D3 admitted ‘I get distracted and then do something else and then I realised I
should have revised’ and participant D2 also lacked self-regulation ‘I find it so hard
to receive a text from someone and not text them back’. This thread of challenges
ran through their narratives. Whilst participant D3 recognised concentration
difficulties in similar subjects such as History ‘because it is like English’, one
participant D1 revealed its long-term impact ‘I’m hoping for a good future the thing
that downs it is that like erhm like I’m not very clever’. Revising was also
problematic, participant D2 felt confused about his checking strategy and his
inability to rectify mistakes ‘I’ll do it, I’ll check it but I’ll check it the same way as I
got it wrong and think that I have got it right again’.
In addition, operationalising motivation and perseverance appeared a
difficulty for the participants. Although participant D4 was encouraged by his recent
success in Maths which he believed was the result of revising harder and in a
different way throughout the holidays‘ I’ve been beating some of the set 3’s and Set
2’s because of trying to put my mind to it and learn all the stuff’, although he
realised perseverance wasn’t his strength in that ‘sometimes after a few attempts
sometimes I can’t be bothered to carry on’. School transition was also referred to,
participant D3 mentioned the ‘big step’ transition from primary school to senior
school forced them to realise for ‘the first time that this is serious I’ve got to knuckle
down’.
Most participants were aware of the optimum learning environment for
them, one participant D4 believed that the class environment was more conducive
for concentration than home where ‘I often like when I’m sitting down and doing my
homework I often just drift off and think of something else’. English, History and
115
Maths were highlighted in the narratives as problematic for the participants.
However, some participants identified specific subjects where they struggled less,
one participant D3 cited geography as it was ‘more engaging and interactive’,
whilst participant D2 found ‘at school the atmosphere in Art is really good I find it
really easy’.
2.6.2.2 Theme 2 - Self-Efficacy
The core theme of self-efficacy incorporated creativity, academic
competence and athletic ability themes.
All the participants showed signs of expressive creativity whether this was in
music and dance and all enjoyed art. Moreover, although participant D1 had won
numerous singing competitions and admitted ‘I’m good at drama’ he held the
nuanced view that ‘maybe (these are) not subjects that contribute much to society’.
This may be reflective of how the creative arts are perceived as less important than
the core Sciences and Humanities. Participant D3 loved all types of dance including
jazz and ballet and acknowledged he is ‘more humanities, creative’ and reflected on
the advantages on creativity and its wider positive impact on connectivity.
‘I think we would all probably get on a lot better if we were open-minded
and having been a little bit creative it’s good because it takes you off all the main
subjects and it gives you ideas’
There were numerous references to academic competence throughout the
narratives, the participants recognised their ability in the subjects which contained
the least amount of English. Participant D2 enjoyed ‘the three sciences and Art and
DT and time goes really really fast’ whilst participant D4 believed Geography,
Maths, Chemistry and Physics were his strongest subjects. Some participants
116
recounted comparative academic ability whilst others mentioned accolades within
the academic arena.
Accounts of athletic competence and winning awards peppered the
narratives. Participants possessed widespread athletic competence and indeed this
may serve as a buffer to compensate for academic difficulties. Although most of
participant D1’s activities were now mostly solitary, his earlier promotion to higher
level in Rugby was seen as significant whilst he charted his progress as ‘from
playing in the B team at 9 to playing for the A’s sometimes (the year later) and that
was all because I had really good tackling’. The significance of external recognition
for efficacy in sport was also underscored. Being selected for the County Hockey
team gave participant D3 confidence ‘finding out what I’m good at that’s helped
me’.
Sporting proficiencies underpinned their self-efficacy and appeared to foster
a sense of identity whether it is through improvement in a team or through the
winning of individual awards.
2.6.2.3 Theme 3 - Emotional Awareness
This theme encompassed emotional awareness of self, others and situations
and the expression of emotions in terms of externalisation (anger and frustration)
and internalisation (anxiety and depression)
All participants generally kept their emotions to themselves, through fear of
bothering or hurting others’ feelings. The exception to this general rule of
suppressing emotions was participant D2, who recognised his own anger. He
experienced a volatile relationship and constant rows with his single mother but
rationalised this situation in that ‘my mum’s had a hard day at work, I’ve had a hard
117
long day at school erhm we both get home tired …not in a great mood and me and
my mum seem to have bad tempers’.
The participants tended to vent annoyance/frustration via arguments/physical
confrontations, which may have suggested an inability to control the situation
completely. Participant D2 admitted ‘me and my mum are very close erhm but
obviously we fight a lot erhm… no it tends to just spark and then it just elaborates’.
However, he exhibited a level of control with his absent father, after discovering he
lied about numerous matters ‘it annoys me like he tries to talk to me and I just
completely blank him cause he is trying to make all the effort’. However, he
recognised that he was struggling with the upset, anger and the frustration he felt
about his ailing grandparents with whom his spent most of his time. ‘I find it hard
being there all the time because erh my grandma her knees are bad erh and she just
sits in front of the TV all day, every day, just basically scoffing her face with biscuits
it just really upsets me to see her doing that cos I know she could be doing
something to stop her but she doesn’t and that really annoys me and my grandad’s
had three strokes’. Anger manifested itself in outbursts in school for participant D3
who was reprimanded for kicking somebody ‘because they were really annoying
me’.
Trust appeared vital for participant D2 within in both his peer group and
within his family settings. He found trusting difficult, and this probably emanated
from the relationship with his absent father ‘I don’t trust people anymore cos
people say I’ll promise I’ll do this I promise I’ll do that and I’ve been so I’m so used
to being let down now that I just don’t expect people to do it erh so I don’t trust
what people say’. This sentiment pervaded into other areas of his life when ‘ on the
rugby pitch I don’t like to trust other people’, indeed this may have increased his
118
growing autonomy and sense of identity believing ‘I trust myself I’ll back myself up
if something goes wrong something like that’.
All the participants mentioned anxiety (one in terms of social anxiety –
shyness) and in terms of other comparison to other people. Anxiety before exams is
reported widely in the narratives and participant D1 recognised ‘in the first year I
hadn’t done very well at all cos it was the first time and I was very nervous ehrm’.
Anxiety had overshadowed participant D2’s school life and he admitted he ‘cracks’
under the pressure of exams and this led to physical symptoms which culminated in
a medical diagnosis of stress ‘it’s always every time with exams, it just gets too
much and I always end up just breaking under the pressure, I always end up
shaking, I can’t think straight and then I will do the exam and I’ll come out of it
feeling absolutely dreadful because I haven’t done well’.
Anxiety was reduced for participant D3 if he was surrounded by his friends,
admitting he would be ‘far too scared’ to go to the sporting events on his own.
Whilst participant D4 believed he is ‘a bit more shy’ as a consequence of shunning
social media and revealed depressive tendencies ‘when I feel low when I don’t go
outside and I just stay at home like all day doing nothing’.
2.6.2.4 Theme 4 – Identity
This theme encompassed significance of family dyads, self-knowledge,
decision-making and autonomy, future careers plans and wider societal thoughts.
The father (whether absent or now part of a blended family) was mentioned
by all participants and the significance was underscored. Mothers were only referred
to cursorily, generally when their reactions were compared to the reactions of their
fathers. However, the single mother of participant D2 had a crucial role in the
narrative of her only child. When the fathers are not mentioned, grandfathers (or
119
substitute grandfathers) were portrayed as crucial role models. Indeed, participant
D1 reminisced about George who ‘acted like a grandfather figure in a way, but
sadly last year he died and so it kind of changed Christmas’.
Whilst participant D3 was close to and enjoyed discussions with his father,
participant D4 struggled to live up to his father’s expectations ‘my dad used to shout
at me quite a lot because I wasn’t getting into the high sets’. However, participant
D2’s narrative revealed the difficulties that surrounded his relationship with both the
men in his life. He experienced emotional trauma as a result of his father’s
behaviour ‘my dad doesn’t live with me he lives in Durham and erhm for nine years
he’d made all these promises’ which he allegedly broke forcing participant D2 to
terminate their relationship. His relationship with his loved incapacitated
grandfather was now also strained, and participant D2 felt frustrated as his
grandfather ‘used to be a very proactive person a person you wouldn’t find him in
the house for more than two hours a day’ however, after numerous strokes he was at
home, miserable and exhausted and ‘I don’t like seeing him struggle’. It was
pertinent that participant D2 talks of his future aim is ‘to be a good dad instead of
what he was’.
In terms of identity formation, participants were exhibiting varying levels of
autonomy demonstrated by independent decision making in political, religious and
career choices, all pivotal in identity formation. Participant D1, after promotion to a
higher level in Rugby, ‘made the decision in that I didn’t want to continue (rugby)
in the ‘A’ team’, due to other commitments. A committed Christian, he found
strength from his faith although likened Religious Education lessons to a debating
society as he felt forced to defend his religious beliefs. In terms of his future
planning, he considered palaeontology or volcanology. However, he needed Physics
120
A level, a subject he did not excel in. In terms of parental guidance, he had received
mixed messages regarding his choice of career ‘Mum is more like get the high
paying jobs, so you’ll be ok, and Dad is more like do want you want’.
Whilst participant D2, is ‘a lot more independent now’ after breaking contact
with his father and believed if questioned he can ‘back up my own point’. He had
also begun to formulate his own political ideas and affiliations ‘I’m a lot older and I
understand it more and because there it so much on the election I just watch it as
well’. However, he had questioned his former Christian values gained in the junior
school and ‘obviously going more in depth into Science I now have taken down the
route of the scientific reasons’. He perceived himself as stronger mentally and
physically which meant ‘I’ll back myself up if something goes wrong something like
that’. It was evident that in terms of identity the troubled relationship with his father
had a profound and lasting impression, this was displayed in the response he gave
when asked what he wanted for his future, he replied emphatically what he didn’t
want to be, in terms of a ‘feared’ self, I ‘just I don’t want to be what my dad was
when I’m older..yeh, I don’t want to do what he did to my mother I don’t want to do
what he did to me’. The influence of his mother on his future plans was apparent as
he wished to travel round the world before University ‘because of the adventure,
partly that and partly because my mum used to work on board ship’.
Participant D3 displayed growing certainty in his political views, and in
terms of career choice in that he didn’t want to go into medicine ‘because my dad’s
doing it, my mum’s doing it and my sister doing it’. He preferred to be a pilot
although this didn’t align with his strengths which were ‘DT and electronics and
music and drama’ and recognised this disparity ‘I am not very good at Maths and
would need Physics’ - the requisites for a pilot.
121
Participant D4 had based his political views entirely on his family views
however was now considering other parties. Recognising his strengths lay in Maths,
Physics, Chemistry, Geography and Economics, his choices were at odds with his
mother who ‘wants me to do something like Art of something but I can’t really do
Art I’ve already stopped it this year’. He had currently no fixed plans for his future
career ‘I haven’t put much thought into that to be honest’.
2.6.2.5 Theme 5 - Social Self-Evaluation
This theme encompassed popularity, teamwork, bullying and physical
appearance.
Blending in or standing out for the right reasons (achieving awards not
detentions) appeared to be extremely important within the peer group. However,
participant D4 had conflicting emotions between wanting to fit in and follow his
peer group and a conscious decision not to be involved with social media. In trying
to rationalise why he needed to meet new friends, he first believed it was just to get
away from home ‘why I don’t know it was just what everyone was doing’. However,
he recognised that his aversion to social media ‘I don’t find that fun or anything’
had a negative impact on his friendship circle.
In terms of popularity the participants appeared to fight the acceptance of a
diminishing friendship group on their transition to senior school and the potentiality
of ‘not fitting in’. Displaying a less developed and fixed ‘social identity’ this
flexibility facilitated an adaptive social identity. One participant D2 liked ‘being on
my own’, although it is hard to distinguish if this a protective mechanism as the
result of failing to make sustainable friendships. Another participant D4 commented
on his declining friendship number and used friendship as a vehicle to facilitate time
away from home whilst participant D3 used friends to scaffold other activities,
122
conquer his anxiety and build confidence believing he was ‘fairly popular’. In
general terms the participants appeared more definite about their likes and dislikes
within the friendship groups and appreciated the continuity and stability of
maintaining friendships.
All participants struggled with self-regulation, indeed narratives suggested
that participants lacked self-control and were more impulsive, except in situations
when they were part of a team where structure was imposed. Both participants D1
and D2 played rugby and enjoyed the rigours of a training routine. This may be
particularly useful for participant D2 who had previously displayed some anger
outbursts and admitted ‘you don’t think about the consequences’. Participant D3
explained why he found hockey gave him confidence ‘because it’s a team sport and
that everybody is motivated to carry on’. Participant D1 enjoyed and excelled in
outdoor solitary pursuits ‘stuff to do with rocks, it seems quite boring but sometimes
it can be interesting’ whilst participant D2 generally preferred his own company
when not playing rugby.
Bullying experiences were mentioned by some of the participants. At face
value the participants were bullied for ‘just being different’ (i.e., enjoying ballet) not
due to dyslexia. Participant D3 conceded ‘that was hard because people were
mocking me because dancing is supposed to be a girl’s thing. It’s usually ballet
people take the mick out’.
In line with Nelson’s (2000) view of cultural self, the participants have
adopted the standard and values of larger society. This is very prominent in the
narratives when related to physical appearance, especially height where being tall as
a male was perceived as a very positive attribute, participant D1 was delighted to be
getting taller ‘cause when I was eight I was more down towards the bottom (of the
123
class) whereas now I’m slowly climbing up’. Participant D2 also contended height is
empowering and that the ‘the bullies don’t bully me anymore because I’m a lot
taller than them’. On the other hand, participant D4 blamed his exclusion from the
Rugby team on his comparative failure to grow.
Theme 6 - Emotional Self-Efficacy
Participants appeared to have used differing coping strategies when dealing
with death, divorce, transition, anxiety and exams. Productive coping methods were
exhibited by all participants this included, for example, attempting to solve the
problem, taking a relaxing diversion and working hard to achieve their goal.
Such strategies included focusing on the positive which helped participant
D1 cope with bereavement by ‘I kind of experienced like a positive out of the thing
like I realise that over time that scars can like heal’. A retrospective perspective
facilitated the drawing of positive emotions from past events and was perceived as a
coping mechanism, for example participant D3 reflected a few years back to bad car
accident and thought ‘maybe it would have been a lot worse’.
Finding a relaxing diversion helped participant D2 cope when he
experienced overwhelming emotions ‘when it just gets too much I listen to music.
Music is like my little bubble (outlining bubble shape with hands) I end up listening
to music for hours on end and just because it calms me down very easily’.
Distraction was also seen as a coping mechanism for D3 as playing the X-box took
his ‘mind off everything’ whilst he also adopted the strategy of facing up to his
fears, for example, he overcomes his dislike of revising when he just had ‘just force
myself to do it! and don’t get distracted’.
124
Non-productive coping strategies were also exhibited by all participants,
these included, for example, worry (rumination), doing nothing/not coping, ignoring
the problem, suppressing tension (negative behaviour) and withdrawal.
Participant D2 avoided any relationship with his father ‘I just completely
blank him’ and withdrew himself to prevent seeing his once strong grandfather
struggle after his third stroke. He went up to his room, then felt guilty about leaving
his grandparents downstairs ‘cos I know that they need help…I do find it too hard’.
Participant D3 has learnt to use avoidance strategies to cope with his anger &
impulsiveness, in deciding not to express his anger he just ‘walks away’.
Reference to others was the third coping mechanism displayed by the
participants when they would talk to peers/professionals, teacher/family, establish
friendships, seek to belong or seek spiritual support.
Narrative revealed one participant D3 had used his friends and teachers to
help cope in the transition from junior school recognising that this was easier
because his had attended the junior school attached to his senior school. He had also
used his peers to help conquer nerves and scaffold involvement in outdoor activities.
This seeking to belong however did not proliferate through the other participants’
stories. Participant D3 also used his family to help him cope in ‘that if I’m ever
unsure or upset just to talk to my family’ and he coped in exam situations ‘by talking
to my family asking for the best tips and then I’ll probably revise’. Whereas
participant D1 started ‘like praying’ in situations in which he struggled to cope and
regarded his Christianity as ‘a strength’.
125
2.6.2.6 Theme 7 - Self-attribution
Self-attribution is the process through which individuals determine the
antecedents and consequences of behaviour. Locus of control is the ability to
control the environment (internal) rather than believing circumstances are
determined (external). Locus of control is bolstered by social competence and
attachment.
All participants craved some level of control, however there was evidence in
the narratives of this being achieved at varying levels, and that locus of control
fluctuated between the internal and external states. The participants appeared to
focus on control and its link to autonomy – perceived at wanting to assert more
control over their own emotions, other people’s emotions and situations. Such a
situation was apparent within participant D2’s narrative, he tried to regain control of
situation with his father ‘I had to ring him up and tell him I didn’t want to see him
any more erhm which was really hard but…..every single Tuesday I would never get
a call.. it just got to the point where I didn’t have to feel that anymore because it
was just beyond a joke’. As a self-protective strategy participant D2 told his father
‘not to text me not to call me or anything and he doesn’t’. He also exerted control
over his bullies, realising that as a result of his height and gym sessions ‘I’ve got
stronger than them they can’t push me about like the used to and they can’t do what
they used to do because I’ll now give them something back’. Participant D2
appeared to have transformed situations from where he exhibited external locus of
control, and potentially learned helplessness to ones in which internal locus of
control was evident.
Indeed, participant D4 enjoyed the control he wielded at his smaller former
school and in hockey where he enjoyed ‘being in charge and choose where to go,

126
choosing where people should go’. In his senior school he is proactive and ‘goal
driven’ rather than ‘goal push’ this is demonstrated by him when he helped ‘little
kids in hockey…..because it’s going toward my Duke of Edinburgh award to be
honest’. Such remarks showed the association between internal locus of control with
perseverance and motivation.
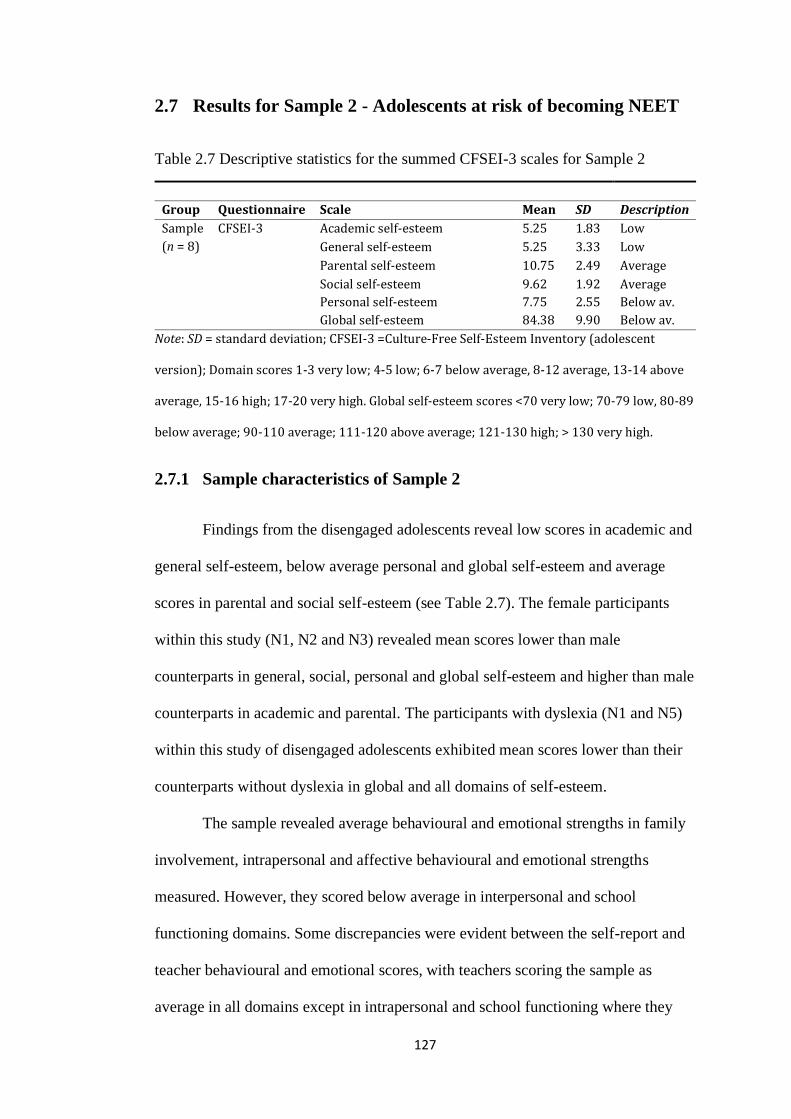
127
2.7 Results for Sample 2 - Adolescents at risk of becoming NEET
Table 2.7 Descriptive statistics for the summed CFSEI-3 scales for Sample 2
Group Questionnaire Scale Mean SD Description
Sample
(n = 8)
CFSEI-3 Academic self-esteem 5.25 1.83 Low
General self-esteem 5.25 3.33 Low
Parental self-esteem 10.75 2.49 Average
Social self-esteem
Personal self-esteem
Global self-esteem
9.62
7.75
84.38
1.92
2.55
9.90
Average
Below av.
Below av.
Note: SD = standard deviation; CFSEI-3 =Culture-Free Self-Esteem Inventory (adolescent
version); Domain scores 1-3 very low; 4-5 low; 6-7 below average, 8-12 average, 13-14 above
average, 15-16 high; 17-20 very high. Global self-esteem scores <70 very low; 70-79 low, 80-89
below average; 90-110 average; 111-120 above average; 121-130 high; > 130 very high.
2.7.1 Sample characteristics of Sample 2
Findings from the disengaged adolescents reveal low scores in academic and
general self-esteem, below average personal and global self-esteem and average
scores in parental and social self-esteem (see Table 2.7). The female participants
within this study (N1, N2 and N3) revealed mean scores lower than male
counterparts in general, social, personal and global self-esteem and higher than male
counterparts in academic and parental. The participants with dyslexia (N1 and N5)
within this study of disengaged adolescents exhibited mean scores lower than their
counterparts without dyslexia in global and all domains of self-esteem.
The sample revealed average behavioural and emotional strengths in family
involvement, intrapersonal and affective behavioural and emotional strengths
measured. However, they scored below average in interpersonal and school
functioning domains. Some discrepancies were evident between the self-report and
teacher behavioural and emotional scores, with teachers scoring the sample as
average in all domains except in intrapersonal and school functioning where they
128
scored below average (see Appendix H). The overall BERS-2 strengths Index from
both the self-report and teacher report was below average. Both the participants and
the teachers agreed that the participants exhibited below average school functioning
strength and this may indeed have feed into lower academic self-esteem. Although
this dual perspective was achieved, a triangulation of this data including the parents’
scores was not possible as none of the behavioural and emotional strengths forms
circulated to them were returned.
The highest scoring contextual strengths for the sample were strengths at
home and strengths from keeping clean and healthy whereas strengths from faith
and culture ranked lowest. Peer connectedness was the highest scoring personal
strength whilst respect for own culture was the lowest. The five highest scoring
character strengths for these disengaged adolescents are termed ‘signature strengths’
and were in order of ranking; love, humour, gratitude, kindness, then teamwork
(Appendix I).
2.7.2 Results of the IPA of the Life Story Interviews with Sample 2
Eight themes were identified from the transcripts of the disengaged
adolescents (see Table 2.8). Again, the themes were grouped in a coherent order
based on their frequency and level of description, i.e., academic self-evaluation was
the strongest theme.
The themes were named representing the subordinate themes. There was
agreeance between inter-rater and the researcher on all the themes, their subordinate
themes and finally the theme names.
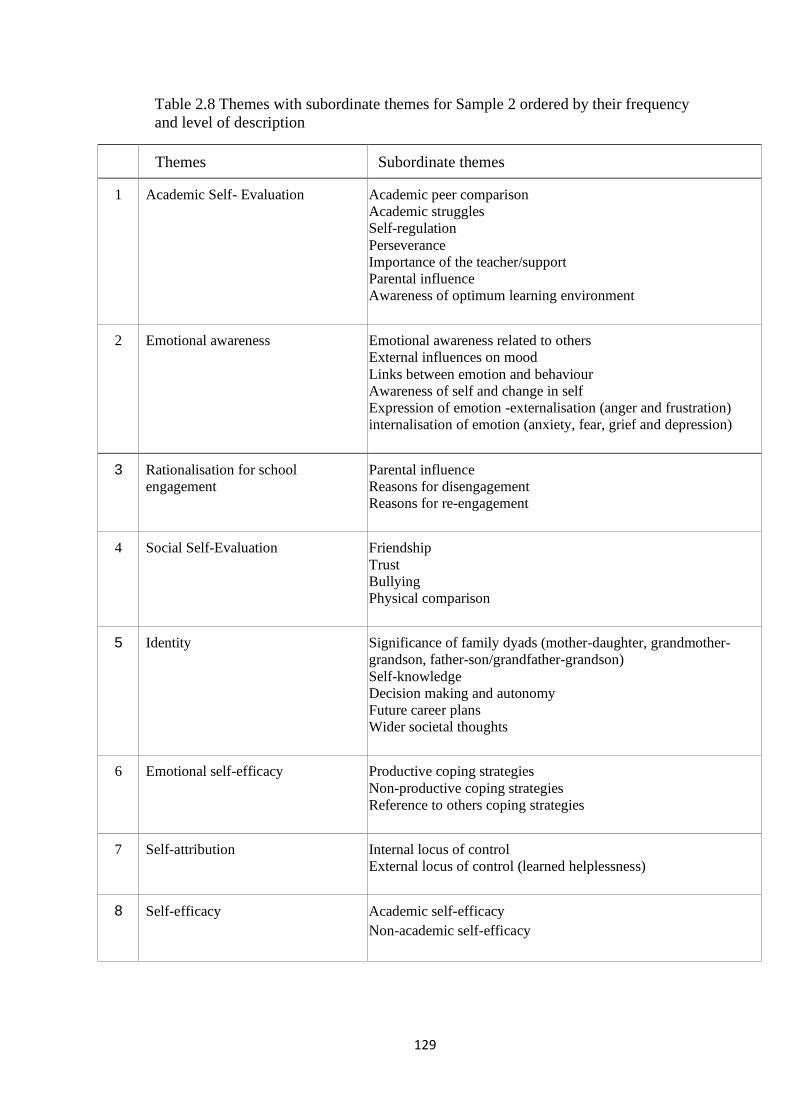
129
Table 2.8 Themes with subordinate themes for Sample 2 ordered by their frequency
and level of description
Themes Subordinate themes
1 Academic Self- Evaluation Academic peer comparison
Academic struggles
Self-regulation
Perseverance
Importance of the teacher/support
Parental influence
Awareness of optimum learning environment
2 Emotional awareness
Emotional awareness related to others
External influences on mood
Links between emotion and behaviour
Awareness of self and change in self
Expression of emotion -externalisation (anger and frustration)
internalisation of emotion (anxiety, fear, grief and depression)
3 Rationalisation for school
engagement
Parental influence
Reasons for disengagement
Reasons for re-engagement
4 Social Self-Evaluation Friendship
Trust
Bullying
Physical comparison
5 Identity Significance of family dyads (mother-daughter, grandmother-
grandson, father-son/grandfather-grandson)
Self-knowledge
Decision making and autonomy
Future career plans
Wider societal thoughts
6 Emotional self-efficacy Productive coping strategies
Non-productive coping strategies
Reference to others coping strategies
7 Self-attribution Internal locus of control
External locus of control (learned helplessness)
8 Self-efficacy Academic self-efficacy
Non-academic self-efficacy
130
2.7.2.1 Theme 1 – Academic Self-Evaluation
This theme comprised subordinate concepts of academic peer comparison,
academic struggles, self-regulation, perseverance, importance of the teacher/support,
parental influence, awareness of optimum learning environment.
The participants were acutely aware of their own academic profile, number
of detentions; sanctions etc. The majority did not display an interest in how they
ranked within their class in academic terms. However, the youngest participant N8
was very quick to emphasise that he had been offered the opportunity to follow the
Triple Science route at GCSE, but unfortunately due to timetabling schedule had to
settle with dual science which he regarded as inferior. Moreover, participant N3 had
begun to feel pride in her schoolwork, having recognised the consequences of her
recent effort in a Personal, Social and Health Education (PSHE) lesson had yielded
success ‘I got an A* out of it’ acknowledging she researched more than anyone else.
All participants experienced problems with self-regulation, in terms of lack
of concentration, organisation and distraction within school environment.
Furthermore, all referred to their academic struggles which normally stemmed from
a lack of concentration. Participant N2 felt she struggled especially in English,
Maths and Science, the internalisation of her perceived failure in these subjects
manifested in her believing ‘I’ve still no brain’. She contended that most of her
teachers didn’t understand and ‘just think that I’m just not concentrating, but I am
but I just forget, if you know what I mean? and then they just think that I’m not
doing anything and then I get done’.
Other participants identified sources for their struggles, such as participant
N3 who reflected on the past disruptions and inconsistencies in her primary school
education which impacted on her first years in Senior School. Although these initial
131
struggles were outside her control their negative ramifications were felt beyond
those years.
Various reasons were cited for their distraction in class. Whilst participant
N8 blamed others for being too funny and made him laugh too much, he recognised
the major part he played by talking in class. Indeed, participant N4 was unable to
curtail himself joining in with those that were vocal in the classroom, whilst
participant N5 believed distraction were the result of the lessons being boring, ‘I just
doze off, just like concentrate on other stuff and start day dreaming and stuff like
that. I try to concentrate again and my mind just drifts off, again, like’.
Participant N2 expanded and escalated these feelings further believing all
school was boring, and that indeed justified her dislike of school. However, she
realised that her lack of organisation and time-management within the school was
mirrored by the disorganised state of her bedroom where she just ‘likes shoving
everything under my bed’.
Although all were aware of the consequences of disrupting class, the
consensus is that teachers blamed them wrongly for behaviour in class. Participant
N1 summarised the feelings of the others by saying some teachers would ‘kick us
out of every lesson for nowt really’. Participants believed they were punished
unfairly by the behaviour system which involves being ‘on board’, sanctions,
detentions etc. The behaviour system left them feeling ‘annoyed’.
Although for all the participants, there was external organisational assistance
to scaffold a homework schedule, the opportunity was seldom grasped to attend
these offices as participant N2 admitted ‘Because after school, if we go there then
you’ve got to do it (homework), but if we go home then we can just chill.’ However,
participant N8 appears competent at self-regulating his routine at home, alternating
132
his time when he returned home from school with ‘a bit of football, do my
homework, play a bit of PlayStation, and then go and play football’.
External family factors, such as bereavement over a grandmother, had also
dampened one participant’s concentration levels. However, recently participant N2
had made an effort not to miss anything in a lesson, as it could be ‘like, proper
important but I just don’t know, because I’ve just missed it’.
Participants explained the struggles in operationalising motivation and
perseverance. Although all recognised the importance of education ‘to get a good
job’, it was measured by the outcome not the learning process. Participant N5
argued ‘there’s people who don’t have as good as an education but somehow, like,
still get on and stuff’ and may emphasise the lack of educational role models and
mentors. Participants appeared unsure of the grades needed to achieve entry into
relevant college courses, although there have been careers events held at school.
However, the importance of identifiable role models was crucial, for example,
participant N3 was inspired by her older sister’s progress to the local college and
now wished to study health and social care, having recognised the importance of
perseverance believing, ‘I've got Ds in most of my lessons, but all the teachers said
that if I put my head to it, then I'll definitely come out with a C or something’.
The importance of teachers is evident in the narratives and the distinction
between their positive and negative qualities impacted upon the participants.
Subjects were enjoyed primarily because teachers were ‘sound’, a ‘banter teacher’
or ‘quite chilled back’. Participant N5 praised his support teacher and other teachers
that ‘don’t shout at you’ when you asked for help and supported when you don’t
understand the lesson. The teacher-pupil interaction also influenced the
enjoyment/engagement in lessons, participant N8 commended his ‘funny Maths
133
teacher’ who was ‘strict at the same time’ and commented that he enjoyed the mini-
games like bingo at the end of the lesson.
Parental/Caregivers influence regarding school was evident, however
contradictory opinions were given on how their parents/caregivers felt about their
adolescent’s schooling. Whilst participant N4’s mother and stepfather displayed an
ambivalent attitude to their adolescent’s education, some of the parents played a
much more pro-active role in ensuring they attended school and always enquired
what homework was set. Indeed, the caregiver (grandmother) to participant N5 had
emphasised the importance of learning languages (although he doesn’t like French)
and that he needed to at ‘least try your hardest because learning different languages
is what’s so good for your education’. A few talked about career aspirations with
their parents, the mother of participant N3 reinforced her daughter’s interest in
becoming a carer having told her that she possesses the right attributes for that job,
such as patience.
Most of the participants acknowledged their optimum learning environment
whether it was in a specific subject or environmental. Most perceived home as not a
conducive environment to work, predominately due to it being perceived as place
needed to ‘chill out’ after the rigours of the school day. Positive comparisons were
made about the school in relation to a local academy which is ‘not a great school’.
For some participants, the variety of Senior school timetable was preferable
to Junior school, with different lessons being taught by different teachers compared
to primary school where one teacher takes all subjects. Away from the core subjects
that are obligatory for GCSE (e.g., Maths, English), participant N3 believed she
worked best in the subjects that she has actively chosen as options such as Health
and Social Care, PE and Food and Nutrition.
134
For the majority group work was the favoured mode of working and it was
suggested by participant N3 that ‘the more interactive it is, then the better I work,
really’. However, participant N6 proposed that it’s not just group work that is the
most salient factor, it’s the verbal collaboration with your neighbour ‘It’s more like,
being able to talk, instead of just working in silence….if you’re talking to someone
next to you, you both might not know it, but together, you’ll figure it out’. It was
interesting to note teamwork was one of the samples character strengths and this
indeed, may feed into social self-esteem.
2.7.2.2 Theme 2 – Emotional awareness
This theme comprises subordinate concepts of emotional awareness related
to other, external influences on mood, links between emotion and behaviour,
awareness of self and change in self, expression, externalisation and internalisation
of emotion.
The participants revealed an acute emotional awareness of others and good
levels of theory of mind were demonstrated in their narratives. One participant, N5
having experienced the tragic death of his mother when he was two years old,
‘doesn’t really ask about it’ to his maternal grandmother for fear of upsetting her.
Due to his concern about probing too much, he knew little about his mother apart
from his grandmother commenting that his mother ‘was alright’. Another
participant N3 with ambitions to become a carer was very socially aware of the
discrimination and suffering that some with disabilities encountered, ‘I just want to
help them’ and felt very angry when others are ‘taking the mick out of them.
Because, because they've only got a disability’. She believed respect was at the core
of connectedness ‘if you have respect, then you'll get along with more people and
135
get more things done in life, really’. Such sentiments are mirrored by another female
participant N1 who believed it was crucial ‘to have a heart because you get on
better in life, making those around you happier’. Indeed, participant N5 believed
you could live longer if you were happy and ‘smile all the time’ and if he noticed
someone was upset he would ‘go and sit with them and do something for them and
try and make them feel better’.
As well as exhibiting emotional awareness in relation to others, participants
acknowledged how external factors, such as friends, influenced their mood. One
participant N2 having come to school ‘in a bad mood’ recognised that after being
with her friends, ‘I just forget about everything and I’m just in a good mood, for
some reason’. Whilst participant N6 contended he ‘can just block out’ disruptive
behaviour of others in class, he correlated his mood and subsequent behaviour after
receiving a detention, in that it ‘affects your mood in the lesson…. you seem to lose
concentration. You seem to forget about the work, you just want to put your head
down and go to sleep’.
Participants were also aware of emotional changes in themselves. One
participant N7 contemplated his absences from school and how different friends
have impacted positively upon him and ‘changed me in myself’. He felt he had been
arrogant and ‘didn’t care about other people erh I just cared about me’, he blamed
himself for being too demanding of material things from his parents and ‘now I feel
like an idiot because like it was making them struggle but they were giving me what
I wanted’.
Earlier demonstrations of self-efficacy were interconnected with strong
positive emotions. One participant recalled his memories of his football experience
at Wembley as a much younger boy with‘ I just like so pleasured it was me’, whilst
136
another participant felt ‘untouchable like I was on top of world’ when he won his
first main boxing match and felt ‘like proper emotional’ when his parents cried.
The narratives also revealed that the participants dealt with their emotions
through displaying both externalising (anger/frustration) or internalising
(anxiety/depression) mechanisms.
Anger control was an issue for two of the participants (N4 and N5).
Participant N5 was fully aware of this aspect of himself ‘when I’m angry, I don’t
think I can control it that well’. His anger outbursts were apparent at primary
school, he retaliated to a younger boy pushing him ‘so I kicked him and I punched
him, and then he was on the floor crying’. Although this behaviour resulted in
school sanctions it didn’t dampen his anger which now manifested as ‘punch-ups
but not like, I don’t get into fights, no…..Like walls and doors and stuff’. In trying to
rationalise why he felt angry he believed ‘When I get upset, I also get angry’. The
anger is then vented quickly about ‘a lot of stuff… really easily’.
Other participants have internalised their emotions which resulted in anxiety
and depression. One participant N1 displayed symptoms of social anxiety ‘I hate
being around loads of people I fell reet enclosed’ which resulted in her feeling
‘right agitated’. Another female participant N3 believed anxiety develops gradually
‘when you’re young, you just think about toys and stuff. Now its worries …. My
GCSEs and things that I need that are important’. The impact of anxiety was
widespread, participant N7 believed his anxiety was interlinked with his irritable
bowel syndrome (IBS). His nervousness started when he thought about school and
triggered ‘stomach cramps and feeling sick’ and he believed the emotions stirred by
this anxiety then ‘switch to my IBS’. He also admitted to having exhibited signs of
depression and feeling ‘proper down all the time, always down’ when he had to stay
137
at home due to disruptive neighbours. This isolation led him to losing confidence ‘I
just felt behind and I felt like I didn’t have anyone (friends) to speak to’.
2.7.2.3 Theme 3 – Rationalising disengagement from school and potential
re-engagement
This theme comprises subordinate concepts of parental influence, reasons for
disengagement and reasons for re-engagement.
Parents influenced the adolescents’ feelings about engagement in school.
Whilst participant N1 replicated her mother’s negative attitude towards ‘silly’
school rules regarding make-up, allocated places to sit and the fact ‘you can’t stand
on a carpet’, participant N4’s mother displayed a more ambivalent attitude to their
adolescent’s schooling. When asked to explain how his mother reacted to his
detentions ‘she’s not proper bothered because she’s just got used to it now’, similar
feelings were reinforced by his stepfather who is ‘just used to me getting them’.
However, participant N6 mentioned parental differences in their reaction to his
detentions in that his father was ‘more calm’ whilst his mother was ‘more angry’.
A plethora of reasons, both school-centred and individual-centred, were
offered by the participants when they explained their disengagement from school.
Without being asked explicitly about school engagement, all participants were eager
to verbalise their individual reasons, as if explaining them aloud would be cathartic
in helping them to justify their rationale. School-centric reasons including
disgruntlement with the behaviour system, struggles with the logistics of the school
day and boredom. Individual-centred reasons such as fear, unhappiness, anxiety,
problems with friendship groups and bereavement were all cited as triggers for their
disengagement.
138
When discerning the school related factors, participant N8 mentioned rules
‘basically, all the rubbish rules, like no non-school shoes’ whereas participant N6
brought attention to the perceived injustices of how the behaviour system was
implemented at school and considered it ‘a waste of time, because some teachers
just see it as just a way to… almost abuse it really’. The negative effects on
learning and mood after receiving detentions on learning were mentioned by several
participants including participant N6. Some participants also complained about
having to wear the uniform, about the structure and content of the day, as participant
N3 conceded ‘Like, if it's just boring, then I start getting bored and then I stop doing
my work’ and having had to wake up ‘too early in the morning’.
Outside the school environment diverse individual reasons for
disengagement were given such as participant N7’s fear of walking alone past his
neighbour’s property as ‘they are all like 17, 18 they could do whatever can’t they?’
He continued ‘our next door neighbours are drugs dealers’. Female participants
mentioned problems with friendship groups ‘just arguing and it was all over daft
things’, participant N1 conceded she thought the other pupils ‘sort of disrespect me
all time like in lessons and then I get in trouble for it’. She also expressed how
environmental factors such as large enclosed spaces and had led to anxiety issues
that fuelled her disengagement. A dislike of crowds had manifested in negative
experiences from ‘when people shout you know like around me ….. I don’t like it’.
Such feelings culminated in symptoms akin to social anxiety. Health anxiety played
a central role in participant N7’s disengagement as concerns about his mother’s
health left him ‘like proper upset and scared’. He admitted he didn’t know what to
do and his behaviour deteriorated ‘like if a teacher told me to do something because
my mum was ill I just take it out on them and I just won’t listen’. According to
139
himself his behaviour became ‘shocking’ and he would get involved in numerous
fights. General feelings of unhappiness were also mentioned by one female
participant N2 as a factor in disengagement ‘it weren’t that long ago that I weren’t
happy in school so I didn’t want to do the work and I just didn’t want to listen’.
Numerous factors were cited as being instrumental in potential re-
engagement. Re-engagement for some participants centred on the awareness of
significant others, in terms of negative impact or an improvement in circumstances
of a loved one. Participant N1 struggled with the impact of her disengagement in
that ‘I just didn’t you know like seeing my mum upset because my mum could have
got into trouble. She tried to rationale the situation regarding her potential re-
engagement in school and realised ‘it’s like school is not forever’, furthermore she
recognised that her engagement could be improved with placements related to her
future career.
Participant N1 also told a ‘story’ ostensibly about ‘someone else’ who had
been missing school due to bullying. This centred around the cost of missing school
whilst ‘bullies are sat in class learning and like she isn’t is she? it’s like them are
going to get somewhere and she ain’t, you know what I mean?’ This could be
interpreted as her own story.
Role models were also significant, participant N3 re-engaged as she saw her
older sister who had attended the same school come out ‘with good grades’ and
thrived at the nearby college. Whereas for participant N7 now the medical worries
about his mother had subsided he reminisced when his behaviour was ‘minus 40 and
I was on report’ and now he didn’t even think ‘it’s a minus’. A general
improvement in happiness levels and being ‘out with my friends and that’
underpinned participant N2’s potential re-engagement.
140
Where negativity permeated previous narratives about school, some of the
male participants were less aware of the specific reasons why they became more re-
engaged but now listed the positive aspects of the school ranging from the football
pitches to the meat sandwiches served in the canteen. A renewed enthusiasm was
observed in participant N8, he recognised he was ‘improving a lot’ and put it down
to ‘growing up. getting more responsibility’. Indeed, for one participant it was a
conscious decision to increase his concentration, have considered the opportunity
cost of staying on at school ‘keeping getting detentions’ when he could ‘just stop
doing it so I could have more free time after school’.
2.7.2.4 Theme 4 – Social self-evaluation
This theme comprises subordinate concepts of friendship, trust, bullying and
physical comparison. The importance of peer groups and participating in peer group
was highlighted throughout the narratives and was supported by peer-connectedness
being the groups strongest personal strength. For most of the participants, school
was seen to function primarily as a vehicle to build and sustain friendship groups,
and for participant N5 it was his reason for coming to school as ‘every day you get
to see your friends’.
Male participants talked about a diminishing number of friends over their
senior school years citing about three or four important friendships, ‘they aren’t as
many, but they are better than my other friends’.
Participant N5 referred to the dynamics of friendship groups, and believed
that people pair up with like-minded people, with mutual interests (mainly football)
which resulted in the ‘the banter and stuff, that’s good’. Comparatively, time spent
with friends flew by whilst ‘when I’m in house time will go proper slow’. Although,
after his absence from school, participant N7 recognised he had fewer friends, yet
141
they seemed to care about him more and wanted to spend time with him ‘like the
first day I met my new mates one of them stopped at mine’. Indeed, participant N6
considered keeping friends as one of his strengths ‘not like, falling out, just making
up with them and stuff’.
One female participant spoke of a core group of around eight friends ‘who I
hang about with, and I’m real close to them’. Another distinguished between her
three or four close friends that ‘hang about together’ with others ‘that they just talk’.
Participant N3 admitted that lack of confidence had initially been her problem
‘because I never used to speak and I used to be right shy to speak to anyone’ but an
improved confidence was helping in connectedness.
Mutual support and encouragement ‘to do good things’ was significant
within their friendships groups, especially for the girls. Other qualities highlighted
by the girls were ‘just being respectful and kind to you’. However, one participant
N1 recognised that friendships can also have a negative influence, referring to her
older 17 year old friend who is ‘pulling her down’ although recognising that her
friend had ‘ loads of problems like she obviously had a bad bringing up and I
haven’t…now she’s pregnant and everything’.
Trust was also referred to as an essential ingredient of friendship by
participant N1, although she always preferred to be with boys, her best friend was
someone she could really trust ‘because she is not like two-faced’. Unfortunately,
participant N8 felt that trust has been lost in some of his peer relationships due to
gossiping.
Two participants referred to the impact of bullying, one participant N3
thought this was due to her being ‘different’ by starting late at primary school. For
another participant bullying had been a longstanding problem from primary school
142
where ‘it got sorted out really quickly’. In senior school the bully ‘started pushing
me about and calling me names and calling my mum very rude names’. Having then
befriended the individual who had bullied him, the volatility of this fragile
friendship was displayed because ‘now literally, I hate him’.
Physical appearance was mentioned by two of the male participants, in
comparative terms particularly height. One participant was delighted to be ‘one
head taller than my mum’ although shorter than his best friend whilst another
participant referred to how appearance is mentioned in ‘banter’, for example, ‘he
says I’ve got a big nose. So, I said he’s got a big gob. We just mess about with each
other’.
2.7.2.5 Theme 5 – Identity
This theme comprises subordinate concepts of significance of family dyads
(mother-daughter, grandmother-grandson, father-son/grandfather-grandson), self-
knowledge, decision making and autonomy, future career plans regarding and wider
societal thoughts.
Trying to establish an identity in this age group was critical, it was evident
that some participants lacked a role and struggled with a sense of purpose. The
significance of family dyads in scaffolding their evolving identities was crucial and
the significance of father-son/mother-daughter/grandmother-grandson dyad was
referred to throughout their narratives.
One participant N1 confided in her mother ‘you can tell my mum anything,
my mum – she is one of them that always has a word for everything…yes she is good
at advice’. She had also heeded her mother’s warning to stay away from her older
friend as ‘my mum didn’t like me going around with her’, believing that her
daughter neglected herself by investing too much emotional energy and time in the
143
relationship. When participant N5 referred to his deceased mother he believed ‘it’s
alright because my, it’s, my nan’s like my mum because she’s fine. I love her’.
However, he also had scant knowledge about his absent father ‘I don’t ask about
him, really at all’. He only knew that his father left his home when he was five or
six years old and some details about the job he held. This suppression of questions
about both his mother and father culminated in a lack of information about both
parents and may indeed have undermined his identity formation and be a
contributory factor in his anger management issues.
Although participant N6 described his best times were before his parents
separated, he now enjoyed time spent separately with each parent and recognised the
difference reactions between his parents on his detentions, stating that his mother
was more angry in contrast to his father who is ‘more chilled out about and won’t
shout, because he knows I won’t take it in if he shouts. So, he’s just calm. It’s easier
to talk to my dad’. This parental disparity was also evident in how they reacted
when he is out of the house, with his father happy, “as long as I know where you
are.”, whilst his mother repeated, “be in for this time.”. Another participant N8
‘doesn’t mind’ that his parents are separated as he enjoyed time with his father when
he has breaks. Such comments suggested that there is less negative impact of
parents’ separation when continuing contact with the father is maintained for these
adolescent boys. However, participant N8 was very close to his mother who is
‘mentally strong and a big inspiration’.
Siblings also proved a source of inspiration and confidence, whilst
participant N3 used her older sister as a career role model, participant N7 enjoyed
the closeness with his much older sister who lived on the same road. When he
watched videos of her caring for him as a baby it made him feel ‘like proper warm’.
144
Evolving identities seen through the lens of gender, religion and future
career thoughts also surfaced in narrative. There were disparities among the
participants in relation to their imagined or planned progression along their career
path. Apart from thoughts on careers, some shared wider societal thoughts that may
have impacted on their emerging identity.
Participant N1 believed ‘Yes, I am like a girl outside but inside I’m a bit
more like a boy sometimes?’ and elaborated that although she had a close female
friend she ‘always preferred to be with boys’. She didn’t appear to have a clear plan
on future plans ‘I’ve got a D (in health and social care) but I think it’s like for three
years as you have to do your thingy first and somebody has tried to explain it but…’.
She also feared the ramifications of being a girl specifically when considering rape
‘Like, it freaks me out because I’m a girl and even when I’ve walked home before
and there’s men, you just think, I just want to get away’.
Another participant N2 battled to consolidate the past experiences and
beliefs that assisted in identity formation. ‘I know I haven’t done much. I just felt
like my life were proper boring’, contending ‘oh, I’ve still got no brain’. She
struggled to recall how many GCSE’s she was taking ‘I don’t know, but I think
there’s a lot. I can’t remember’. Exhibiting an interest in a career linked to health
and beauty, she felt this was inferior to ‘all my friends they’re proper smart as in
like, doctors’. She felt torn in the direction she should aim, evidenced by her
narrative ‘if I was to say I wanted to be a hairdresser, I feel like I’m setting my goal
too low’ which was countered by ‘I don’t want to dream too big’. This uncertainty
about her future troubled her ‘I want to know what I want to be, but I don’t know
what I want to be’.
145
In contrast, participant N3 appeared to have a clearer view of her future ‘like,
working with people who have disabilities, like when I go into the Special school’. A
decision encouraged by her mother as it ideally suited ‘because I've got patience for
people and everything’. Participant N3 felt it was important that she was proactive
in deciding on her placement ‘yeah. I decided that I wanted to go on it, because now
I've got a work experience in a special school’. This represented a step towards her
eventual objective of becoming a carer. Although participant N3 showed a social
conscience in relation to how disabled people should be treated, her wider thoughts
on society were limited due to her ‘never watch(ing) the news or anything or really
reading books’.
In terms of attributes for potential careers, participant N4 compared himself
unfavourably to his stepfather who worked in telecom engineering ‘I’m not really
smart enough for all that’. He believed his main challenge had just been ‘just
growing up’. Living an insular existence, he was unable to give views on any wider
societal and political topics, He only watched football on the TV and Xbox and
football appeared his consuming passion at this stage of his life. His future plans
revolved around ‘just keeping my head down’.
However, one participant N5 had found clarification about his future through
one of the school support programmes which ‘helped you with your qualifications
and helps you see what a CV is like, and stuff’. He aimed to become a sports coach
or ‘an accountant because I’m quite good at Maths… my dad was an accountant,
well last time I saw him he was’. The influence of his father was apparent even
through the little knowledge he possessed of him. Although participant N5 has
investigated entry requirements, he has not looked at universities yet.
146
Becoming a plumber was important for participant N6 but this was
secondary to ‘having some children and being happily married’ with the aim ‘not be
rich, but stable, so you can go on holiday and do things’. Displaying an interest in
local politics he preferred the parties ‘that give money back’ to the community
reminiscing ‘when I was like seven, there were parks and football nets all over but
now it’s they just seem to be going’. The issue of immigration was referred to in that
he didn’t want to ‘stop it, but just calm it down a bit. Because it seems a lot’.
A career in plumbing or as an electrician was also favoured by participant
N7 if his ‘big dream’ of becoming a professional boxer didn’t materialise. He
believed he would be suited to plumbing or being an electrician ‘like I enjoy it, be
able to go round and fix things’ acknowledging there is ‘a lot of money in it’.
For one participant N8, his Christianity shaped his identity and instilled
‘courage’ within him. He believed his growing autonomy and responsibility is a
consequence of circumstances, in that his single mother left him alone at home
whilst she worked ‘my mum makes me more responsible’. In contrary to some
participants, N8 didn’t want to follow his father’s career. Instead, he originally
wanted to play for a good football team, however, recently discouraged by his
mother’s mention of the amount of training needed, he now believed he preferred to
become a policeman for ‘self-defence. say, if someone’s attacking me, I can easily
get them down and then arrest them’. Such a stance may have emanated from the
fear surrounding his neighbours in his home environment. As an Eastern European
immigrant, he was also eager to express a view on immigration ‘people saying that
if they send back the immigrants, they are expecting the others (that emigrated from
England) to come back, which got me kind of confused’.
147
It is interesting to note, that although these participants attended a faith-
based school, only participant N8 identified himself as religious. Narratives from the
other participants reflected a disinterest in religion such as ‘I just don’t believe in it.
None of my friends do either. None of my family do, so it’s the way I’ve been
brought up’. This suggested the significance of the belief matrix within which these
participants were brought up and live shaped their identity and, indeed how they
failed to question the beliefs held by their family and friends.
In terms of future career planning, although most have attended for careers
advice, it appeared that suggestions and advice from role models and parents was
the most influential and productive. This aligns with Ryan, D’Angelo, Kaye and
Lorinc’s (2019) findings emphasising the influence of educated relatives in guiding
adolescents future career paths.
2.7.2.6 Theme 6 – Emotional self-efficacy
This theme comprises subordinate concepts of coping strategies; productive
(weighing positive with negatives), non-productive and with reference to others.
Participants appear to have used differing coping strategies when coping with
diverse life events such as death, illness, divorce, transition, as well dealing with
anger, intergroup tension, bullying, anxiety and exams. Productive coping methods
surfaced through narrative these include trying to rationalise the situation and
focusing on the positive. Some relied on past emotions and experiences to bolster
present emotions by weighing positive with negatives (opposing valences).
The bereavement of grandparents appeared the most significant life event
that the participants have dealt with. One participant considered death ‘it’s just life
really isn’t it?’ and rationalised her grandmother’s death by believing ‘she is in a
148
better place now obviously as she was in loads of pain’ and that ‘she was just tired
and wanted to go’. Her coping strategy involved drawing the positives from this
bereavement in that it has made her feel closer to her father’s side of the family.
Another participant N8 believed he has coped with the death of his grandfather, who
had been the primary carer for the first 4 years of his life, although he recognised
‘it’s kind of a strong missing (of) my grandfather, and it’s missing a big part of me’.
Participant N7 also drew the positive out of negative life events such as his
mother’s illness, and believed that instead of being ‘like upset’ and ‘not being able
to do nowt, I just support people more …like I push through hard times and try and
bring good things out of bad things…just stay strong’ However, he struggled to
follow this strategy of thinking ‘of the good times that have happened’ when he
faced difficult times, conceding that ‘it’s hard to do sometimes isn’t it?’. A
productive strategy was also demonstrated by participant N6 when he reflected upon
his parents’ separation, initially, when he was much younger it bothered him ‘but
now I just seem to get on with it’ and enjoyed time spent separately with each
parent.
Productive strategies were also evident when coping with intergroup tension,
participant N3 had shifted her response from ‘crying and getting stressed out’ to
‘arguing with them back, but then I just started laughing at them and then that's it,
really’. Now she coped by ‘just letting it fly by me’. Participant N8 has similarly
adopted more of a relaxed stance when he dealt with a bully and ‘I just tell him to
shut up and walk off.’
Non-productive coping strategies however were exhibited by some of the
participants, these included worry (rumination), wishful thinking, doing nothing/not
coping, ignoring the problem, suppress tension (negative behaviour) and
149
withdrawal. Although, one participant N2 admitted she doesn’t cope well with
anxiety she ‘just gets on with it’. The exact phraseology was used by participant N3
when dealing with her grandmother’s death and was followed by ‘I just think she is
still here really’. Such suppression strategies were reflected in how one participant
who just ‘block’ outs others disruptive behaviour in the classroom. Whilst another
participant N7 used an avoidance strategy to cope, he had been unable to attend
school as it involved walking past his neighbour’s house. It was difficult to
disentangle whether it was fear of the neighbours or fear of school that generated
this mechanism. Another avoidance strategy was seen in participant N8 who hadn’t
spoken to his mother about his grandfather’s death ‘because if I even mention my
grandfather’s name to my mum, she’ll just get so upset and start crying’. An
inability to cope with very strong suppressed emotions manifested in participant
N5’s anger outbursts, having himself recognised that being upset was correlated
with his anger. This negative behaviour pattern may be due his suppression of
upsetting emotions, for example, although he wished to discuss his deceased mother
with his grandmother he feared upsetting her.
The third coping strategy displayed by some of the participants was
reference to others, examples of this were when participants would talk to
peers/professionals, teacher/family, try to establish friendships, seek to belong or
seek spiritual support. This coping mechanism appeared particularly helpful when
coping with bereavement. Participant N1 found it very difficult to cope when she
saw her father upset (at the death of her grandmother) ‘he weren’t eating or nowt’.
She reached out to her former best friend and a carer from her friend’s care home
stepped in ‘it kinda helped me, took me to park and got me some food and I rather
150
me doing that than sat in house upset because my Nanan wouldn’t want that’. The
school chaplain had also been a source of strength.
Two participants also mentioned friends as helping them on the transition
from primary to senior school, participant N3 refers to ‘they all helped me fit in with
everyone’. It may be that older people are sought in times of crisis, as in the case of
participant N8 who coped with his bullying by telling ‘grownups. like my aunty. I’d
tell her. I’d tell you, right now’ however he wouldn’t tell his ‘little cousins, because
they won’t understand’. One participant’s belief in ‘some sort of afterlife’ had eased
the pain when she dealt with her grandmother’s death.
2.7.2.7 Theme 7 – Self-attribution
This theme comprises subordinate concepts of internal locus of control and
external locus of control. Most of the participants reveal elements of both an internal
and external locus of control.
Internal locus of control was displayed by one participant N5 as he recalled
the intergenerational conflict between his maternal grandmother and father, after an
argument ‘I stopped seeing him’. Having escalated to Court proceedings he was
forced to make another very difficult decision where he ‘could’ve picked to go with
my dad or my nanna’ and chose his grandmother. This level of significant decision
making has impacted upon him, and he has since doubted his decision ‘sometimes, I
feel like it was a good idea, but sometimes I don’t’. Another participant N2 believed
that being in control of choices was very important for her and emphasised that ‘I
like the subjects that I picked to do’. Indeed, participant N3’s control over the choice
of her placement ‘yeah. I decided that I wanted to go on it - work with disabled
children’ was seen as a positive and now she has influenced a friend who is
151
struggling with distraction in class ‘so I tell her to stop because she was going to get
herself in trouble and then she starts focusing again’.
The decision to control his behaviour was pivotal for participant N6 who
recalled ‘at the start of the school year, I wasn’t exactly doing good. I was getting
lots of detentions. So, I decided to change’. He also improved self-regulation with
friends, outside school, realising ‘acting daft’ was acceptable when you are young,
but as an adolescent ‘I try and walk away from that now’. This was displayed by
those participants who have dealt with bullies ‘by letting it go’.
Displays of external locus of control were also evident in the narratives. One
participant N8 appeared to have little control over his behaviour in class and blamed
others for being ‘too funny, they make me laugh too much’. Whilst another
participant N1 felt ‘like trapped’ in the school system, unable to exert any control
over her destiny. This sign of helplessness and thoughts of the inability to change
the future was reflected by another participant N4 who has ‘sort of given up. yeah’.
Indeed, this helplessness is mirrored by another participant N2 who believed
everything was spiralling out of control ‘like, if I was to sit and think that my exams
aren’t that far away and I’m just not confident at all in any of my subjects and then I
just think, I’m going to fail. That’s all I think’.
Signs of learned helplessness were also evident in participant N7’s narrative
who appeared to attribute most events to outside his control. This was evidenced in
his narrative when he explained why he missed a lot of school in Years 8 and 9
‘Because of like next door neighbours well we were in house and every time like
they would be out front playing football’. Even when this mother did report this
perceived intimidating behaviour to the police there was no impact ‘it’s not like an
emergency like it’s just to log it but they never do owt’, and the lack of control was
152
reinforced. Gripped by worry over his mother’s illness heightened his feelings of
helplessness, which culminated in behaviour that was ‘shocking that year’. Again,
he believed that this year had started with’ a run of proper bad luck’ with family
medical emergencies and unfortunately, it seemed that participant N7’s external
locus of control narrative appeared to be replaying. Further environmental factors
contributed to an external locus of control. Participant N8 felt helpless and fearful in
his neighbourhood, ‘because if it’s near dark, and I’m alone, I always get that
feeling that someone’s going to attack me’. This feeling was warranted after his
friend was victim of a knife crime. His mother attributed this to crime to the
‘terrible’ area in which they lived, however, participant N8 disagreed as he thought
they had good neighbours or alternatively ‘my mum could just sort it out herself’.
2.7.2.8 Theme 8 – Self-efficacy
This theme comprises subordinate concepts of academic and non-academic
self-efficacy. In developmental terms, the study age group embodies a growth in
self-knowledge and awareness of individuality. Self-efficacy beliefs refer to the
judgements that individuals had about their capabilities to organise and affect
courses of action to attain given goals (Bandura, 1997), and manifests in an ability
to be confident and successful at a task where earlier, failure had been the norm.
Throughout the entire set of narratives, there is only one reference to
academic self-efficacy by one participant and this was the result of her achieving top
marks, ‘I got an A* out of it’ in recent work. Male participants’ self-efficacy
references were centred around sports. One participant N7 appeared a gifted boxer,
practising every evening. He talked with enthusiasm about his first fight ‘I was the
first person out and as I came out and all the entrance music and all the smoke and
everything going off and I just felt untouchable’.
153
Football was the area in which two of the male participants felt they
excelled. The experience of playing a football tournament on the Wembley pitch
had imbibed participant N5 with confidence and a sense of hope as ‘you never think
a little kid could play on Wembley and then, if you believe it, anything can happen’.
The other participant referred to his football team winning the league in his first
season. The female participants were generally more self-depreciating, one
participant N2 believed she was good at ‘nothing at all’ before she struggled to
remember ‘passing my swimming thing, .it went up to level nine’. Another
participant, after a few minutes of deliberation, referred to a street dancing medal
she had won when she was 13 years of age.
2.8 Overall discussion of themes generated and links between self-
esteem profiles and narratives
The current study sought to answer the following research question, with the
aim of identifying emergent themes from the adolescents’ Life Story Interviews
which may underpin self-esteem.
Do vulnerable adolescents exhibit lower self-esteem than normative scores
measured by the Culture-Free Self-Esteem Inventory (CFSEI-3, Battle,
2002)?
When considering the main research question, the mean scores of vulnerable
participants comprising Samples 1 and 2 revealed below average or low levels of
general, personal and global self-esteem. However, differences between the two
samples were displayed in two domains; adolescents with dyslexia had average
mean scores in academic self-esteem in comparison to the disengaged adolescents
who scored low. In contrast, the adolescents with dyslexia scored below average in
154
social self-esteem whilst the disengaged adolescents revealed an average score. Both
samples revealed average scores in the parental self-esteem.
Gender differentials displayed in Sample 2 are in line with Trzesniewski,
Tracy, Gosling, and Potter’s (2002) findings that girls generally exhibit lower self-
esteem than their male counterparts. Furthermore, it was interesting to note that the
two adolescents with dyslexia in the disengaged sample scored low self-esteem
scores on all domains compared to their peers without dyslexia. These two
participants’ scores may reflect the impact of being doubly vulnerable in terms of
both dyslexia and disengagement; however, it is difficult to disentangle the
influence of the relationship between these factors and is beyond the scope of this
thesis. Such suppositions are only conjecture due to the very small sample sizes and
little weight can be given to the generalisability of these results in isolation.
Furthermore, due to the contextual differences of the two samples, the two
adolescents with dyslexia from Sample 2 were considered at face value primarily as
‘disengaged adolescents’.
The triangulation of the perspectives from the adolescents with dyslexia,
their teachers and their parents demonstrated that although all the scores attributed
fell in the average range of behavioural and emotional strengths the teachers scored
the sample higher than the self-report on all the domains. However, the parents
appeared to be more critical, believing participants had lower than their self-
reported scores in school functioning and intrapersonal strength. This discrepancy
between teacher and self-report may imply that these adolescents with dyslexia fail
to fully recognise their strengths. In contrast, the teachers of the disengaged
adolescents scored them lower than self-report on the behavioural and emotional
strengths of affective, intrapersonal and family involvement. The teachers’
155
unspoken perceptions may indirectly adversely impact on the disengaged
adolescents.
The findings for the specific self-esteem domains are now discussed.
2.8.1 Academic self-esteem
Three of the four participants in Sample 1 exhibited average or above
average academic self-esteem. These findings contrast with the literature linking
dyslexia and low academic self-esteem (Humphrey, 2002; Terras, Thompson and
Minnis, 2009). These average academic self-esteem scores are atypical and may in
part reflect the positive influence of having an empathetic teacher (Glazzard & Dale,
2013), support and the school context (Burden & Burdett, 2005). Furthermore, the
sample’s strongest personal strength was shown to be functional classroom
behaviour and their joint strongest contextual strength was revealed to be at school
and these strengths may, indeed, feed into their academic self-esteem.
However, the average academic self-esteem revealed by the adolescents with
dyslexia may impact on their realistic judgement of attainable academic and career
goals. An inflation of their competences in this arena was revealed in the interviews
by a disparity between current strengths and future goals. This sample, however,
revealed strengths from goals and dreams as its joint strongest contextual strength,
and this perceived over inflation of competence may be underpinned by their
highest character strength, zest, which represented a vitality and enthusiasm for life.
In contrast to the others, one participant exhibited low academic self-esteem in a
very spiky self-esteem profile and may be employing an academic disengagement
strategy to ensure global self-esteem remains within the average range (Schmader et
al., 2001). Below average scores for school functioning were also exhibited in self,
156
teacher and parents reports for this specific participant and may reflect a ‘learned
helplessness’ in the school environment (Peterson, Maier, & Seligman, 1993).
Seven of the eight disengaged adolescents in Sample 2 revealed below
average, low or very low academic self-esteem, reinforcing the argument that the
lower the academic self-esteem, the higher the academic disengagement from
school. As mentioned previously, when global self-esteem is under threat the
disengagement of academic self-esteem may occur (Crocker, Major & Steele, 1998)
through two processes, devaluing or discounting (Schmader et al., 2001). It is
difficult to decipher by their levels of academic and global self-esteem which of
these two processes is being implemented by these disengaged adolescents’ global
self-esteem. Narratives reveal little comparison within the school environment
indeed some participants appear to be working within an academic vacuum. These
lower than average academic self-esteem scores are mirrored by lower than average
school functioning scores on BERS-2 self-report. Only one disengaged participant
revealed an average academic self-esteem and an average school functioning score
which was reinforced by their teacher’s opinion.
Furthermore, the parents of Sample 1 were generally highly educated and
from a higher socio-economic demographic than Sample 2 and this may impact
negatively the academic self-esteem of the disengaged adolescents. Indeed, von
Soest, Wichstrøm and Kvalem’s (2016) revealed that parents’ socio-economic class
underpinned the relationship between increased academic self-esteem and enhanced
education levels.
Most of the adolescents with dyslexia narratives were peppered with
examples where the adolescent had opportunities to flourish in the academic arena
with ample recognition of achievement (e.g. awards) and through the appointment
157
into leadership roles (in the school or sporting context). Indeed, there may be
evidence of spill over effects from athletic competence and creativity that impact
academic efficacy indirectly. This supports the research arguing that positive self-
esteem is fostered when adolescents consider themselves successful in domains they
regard as important (Findlay & Bowker, 2009; Wagnsson, Lindwall, & Gustafsson,
2014). In contrast, apart from sporting achievements there is sparse mention of self-
efficacy within the disengaged participants’ narrative and indeed they struggled to
recall their strengths. The lack of success within the academic arena is pivotal in
that research has shown academic achievement predicts self-esteem (Trautwein et
al., 2006a; Tetzner, Becker & Maaz, 2017).
It is interesting to note that certain themes such as creativity were apparent
only within Sample 1’s narratives where expressions of creativity (art, music, drama
and writing etc) were actively fostered within their school environment.
Furthermore, creativity was noted as one of the sample’s signature strengths. Some
researchers argue dyslexia is a gift conferring creativity amongst other intuitive
skills and enhancing problem-solving abilities (West, 2008; Davis & Braun, 2010).
This creative advantage is purported to stem from, for example, the propensity for
visual representations processing (West, 2009), for global information processing
(Schneps, Brockmole, Sonnert, & Pomplun, 2012) and enhanced innovation, novel
or insightful strategies which are claimed to be key tenets in creativity (Wolff,
2011). Indeed, Griffiths (2012) reveals student teachers with dyslexia bring
unacknowledged strengths in terms of innovative thinking, solving problems in
original ways, being creative in different ways and forging original connections.
Furthermore, Cancer, Manzoli, and Antonietti’s (2016) Italian research revealed
high school students with dyslexia performed significantly better than controls in the
158
connecting task of the WCR (widening, connecting and reorganizing) Creativity
Test (Antonietti, Pizzingrilli, & Valenti, (2012). This connectivity proclivity has
been identified as a process through which individuals with dyslexia derive
enjoyment and in which they are extremely proficient (Eide & Eide, 2012). It is
posited that such divergent thinking processes over time may become generalised to
other contexts (Cancer, Manzoli, & Antonietti 2016).
However, there has been conjecture over the tendency towards creativity
displayed by individuals with dyslexia, with some arguing there is anecdotal
evidence to verify the suggested association. Martellini and Schembri’s (2015)
investigation into the creativity profiles of Maltese male adolescents with dyslexia
found, when compared to an average reading control, that dyslexia need not bestow
enhanced non-verbal creativity (assessed by The Torrance tests of Creative
Thinking, 1966). However, the participants with average reading ability within this
study did not perform significantly better than the cohort with dyslexia. Such
findings appear to corroborate Ritchie, Luciano, Hansell, Wright, and Bates’s
(2013) results associating creativity with literacy ability, in other words the more
literate individuals show increased levels of creativity. Furthermore, Martellini and
Scembri (2015) assert creativity may in part be due to a compensatory mechanism
due to failure in other areas whilst Wolff (2015) argues only a small subcategory of
individuals with dyslexia have increased creative abilities.
However, explicit demonstrations of creativity by individuals with dyslexia
are evident in real world situations such as art and design (Wolff & Lundberg, 2002)
and problem management. The current study reveals, both through narratives and
signature character strengths, the significance of context in facilitating the
expression of creativity for these participants from Sample 1. It is therefore
159
suggested that more adolescents with dyslexia could potentially have their innate
strength of creativity unlocked within a nurturing and receptive education system.
Upon reflection, it is evident that the quantitative measures of academic self-
esteem and school functioning reflect the themes generated by the narratives.
2.8.2 General self-esteem
Three of the four of the participants with dyslexia in Sample 1 exhibited
lower than average general self-esteem and interestingly these participants also
displayed lower than average social self-esteem. This may point to how social self-
esteem pervades into general self-esteem and may be linked to associated scores on
the interpersonal domain on the BERS-2. For Sample 2, six of the eight disengaged
participants displayed lower than average general self-esteem. Low levels of general
self-esteem may be linked to identity status as narratives reveal participants have
reached various stages of exploration and commitment as described earlier in
Marcia’s identity stages. Participants exhibit varying levels of autonomy
demonstrated by independent decision making in political, religious and career
choices, all pivotal in identity formation. Those that are having opinions or deciding
upon careers independent of their parents are exhibiting a higher level of
exploration, however, none of the participants appear to have reached identity
achievement with the ensuing higher self-esteem (Adams & Marshall, 1996; Kroger,
2000).
Narratives of the adolescents with dyslexia reveal that three of the four
appear to be in the diffusion stage which is associated with passivity (Archer &
Waterman, 1990; Berzonsky & Kuk, 2000), and maladjustment (Kroger,
Martinussen & Marcia, 2010). Although the remaining participant has progressed to
the moratorium stage the lack of commitment to a career choice may result in
160
elevated anxiety (Lillevoll, Kroger, & Martinussen, 2013). However, the narratives
of the disengaged adolescents expose three adolescents are in the diffusion stage,
four in the foreclosure and one in the moratorium stage. Indeed, the two adolescents
who exhibited average general self-esteem fell in the latter two stages and supports
the proposition that further progression in identity formation is associated with an
increased general self-esteem (Adams & Marshall, 1996; Kroger, 2000). General
self-esteem may also be linked to self-efficacy and may in part explain why most of
that adolescents with dyslexia and the disengaged with school self-report lower than
average scores.
2.8.3 Parental self-esteem
Most of the participants had good, close family relationships and this was
reflected in average or above average parental self-esteem (Harris et al., 2015;
Wang & Sheikh-Khalil, 2014; Wissink, Dekovic, & Meijer, 2006). However, two
participants revealed below average parental self-esteem, and this was mirrored in
lower than average family involvement scores. These lower than average scores
may reflect living circumstances, in that one participant lived with his primary care-
giver -his grandmother whilst the other lived with his single mother. It may be
suggested that the absence of a father may impact on the boys’ self-esteem within
this domain (Kuzucu, & Özdemir, 2013).
Parental influence appears to have both a positive and negative impact.
Some parents of the disengaged participants showed an active dislike to the school
rules, were not proactive in preventing their children receiving detentions and
generally paid minimal attention to the future aspirations of their children, although
this may be through lack of knowledge. In fact, it may be suggested if these
adolescents are succeeding it is against the odds. In contrast, parents of the
161
adolescents with dyslexia appeared to reinforce the school values, discussed exams
and potential future careers and could be considered sometimes over-eager and
interested in their child’s education and this may emanate from paying fees for an
independent school.
2.8.4 Social self-esteem
Narratives of the adolescents with dyslexia revealed that they perceived
school as an environment for learning and work whereas for the disengaged
adolescents it was perceived primarily as a vehicle for socialisation with friends.
Three of the four participants with dyslexia in Sample 1 exhibited lower than
average social self-esteem, this may be due to negative comparisons with peers who
are not struggling academically (Gurney, 2018). The sample’s low pro-social
attitude personal strength may be associated with low social self-esteem. There is
evidence to suggest that having a learning difficulty impinges on social self-esteem
reflecting previous bullying and experiences where the participant feels
marginalised. Indeed, Mishna (2003) indicates adolescents with dyslexia are at an
increased risk to experience bullying by their peers resulting in lowered self-esteem
(Singer, 2005). Research also indicates those children with reading difficulties
experience heightened social anxiety and this may, indeed, influence social self-
esteem (Mammarella et al., 2016).
Most participants’ narratives highlighted the significance of friends in a
supporting and enabling role and this was exhibited more by the disengaged
participants. In addition, Sample 2 scored highly in terms of peer connectedness as a
personal strength and teamwork as a character strength. This was reflected in
average or above levels of social self-esteem in six out of eight disengaged
participants. The narratives of the two disengaged adolescents exhibiting lower than
162
average social-self-esteem scores revealed that one feared living in his
neighbourhood and the other participant had referenced her friend’s negative dis-
enabling influence upon her.
In Sum, it is evident that generally the quantitative measures of social self-
esteem and interpersonal reflect the themes generated by the narratives.
2.8.5 Personal self-esteem
Accounts of both internalising and externalising emotions were widespread
throughout the narratives with participants displaying an array of coping strategies.
Two of the participants with dyslexia in Sample 1 scored lower than average
personal self-esteem and references were found in their narratives that explained
such scores. One participant recalled how his anxiety manifests in physical
symptoms, whilst the other participant used friends as a vehicle to conquer nerves.
Such findings support Mugnaini, Lassi, La Malfa, and Albertini’s (2009)
supposition that dyslexia represents a specific risk factor for anxiety and depression.
Furthermore, adolescents with dyslexia are reported to experience anxiety,
depression and inferiority feelings which impact negatively on educational progress
(Anderson & Meier-Hedde, 2017). Indeed, research reveals individuals with
dyslexia have a fourfold chance of exhibiting anxious/depressed behaviour and three
times more likely to exhibit withdrawn behaviour due to lack of self-esteem (Yu,
Buka & McCormick et al., 2006).
Personal self-esteem was lower than average for five of the eight disengaged
participants from Sample 2. This was reflected in the narratives in which one
participant mentioned social anxiety, another revealed increasing anxiety about her
looming GCSE’s whilst one lived in constant fear of danger in his neighbourhood.
The other two remaining participants that scored lower than average personal self-
163
esteem both experienced anger management issues. It was surprising that the
participant who constantly referred to anxiety and its links with IBS throughout his
narrative scored within the average range for personal self-esteem, this level may
have been sustained by the employment of productive coping strategies.
Although, it is difficult to directly align the personal self-esteem domain to a
specific behavioural and emotional strength, it is evident this domain scores
generally reflects and reinforces the narratives.
2.8.6 Identification of emergent themes from Life Story Interviews
This study also aimed to identify emergent themes from the adolescents’
Life Story Interviews which may underpin self-esteem. Results show that seven
themes of academic self-evaluation, social self-evaluation, self-efficacy, emotional
awareness, identity, and self-attribution emerged for both samples. The additional
theme of rationalisation for school disengagement and potential re-engagement
emerged from the narratives of the disengaged adolescents. It is suggested themes
generated by IPA may be linked to academic, general, parental, social and personal
self-esteem domains measured by the CFSEI-3 and, to a lesser extent, the
behavioural and emotional strengths (interpersonal, family involvement,
intrapersonal, school functioning and affective) measured by the BERS-2. For
example; academic self-evaluation and rationalisation for school disengagement
themes could map onto academic self-esteem and school functioning. Feelings about
identity could map onto parental and general self-esteem and intrapersonal strength.
Emotional awareness, self-attribution and self-efficacy could map onto general and
personal self-esteem and affective strength, whilst social evaluation could map onto
social self-esteem and interpersonal strength.
164
Although the seven themes are similar with both samples it is interesting to
note differences in frequency, level of description and content. For example, self-
efficacy, a key element of self-esteem, is rarely mentioned by the disengaged
adolescents and consequently is positioned as Theme 8, whilst self-efficacy in terms
of academic, athletic or creativity was referred to widely by the adolescents with
dyslexia and this is reflected is in its positioning as Theme 2.
Narratives reveal similarities between the adolescents at risk of becoming
NEET and the adolescents with dyslexia in terms of lack of
concentration/distraction, operationalisation of motivation and perseverance and
anger management. In the academic arena, these findings support Calleja’s (2016)
thematic analysis of narratives by adolescents with dyslexia which highlighted the
prominent theme of struggles within the school environment and support needed.
However, in contrast to experiences resulting in ‘fractured academic identities’
(Lithari, 2018), three of these adolescents with dyslexia maintained average
academic self-esteem. This may be due to factors including; extensive SEN
provision, actively seeking support, positive feelings of self-efficacy in sporting or
creative activities and positive relationships with teachers (Kormos, Csizér, &
Sarkadi, 2009).
A prominent thread interwoven into the narrative of the adolescents at risk of
becoming NEET were the underlying reasons for their disengagement and potential
re-engagement in school and reinforced the awareness of their challenges (Reiter &
Schlimbach, 2015). The importance of viewing the disengaged adolescent centred
within their perceived support system was recently alluded to by Ryan, D’Angelo,
Kaye and Lorinc (2019). Both perceived practical, emotional and knowledge-based
support provided by teachers, parents and significant others and their interplay were
165
revealed as critical components of school engagement. Indeed, Ryan et al (2019)
highlighted that teacher support was the strongest predictor of school engagement.
The importance of individual teacher’s support was cursorily mentioned in the
narratives of Sample 2; however, it appears that the reasons to re-engage with the
school system were primarily instigated through an intrapersonal change in
perceptions and through not wanting to let their families down.
Findings suggest that for Sample 1 having dyslexia impacted on their social
self-esteem supporting earlier research referring to negative peer comparison (Nash,
2008; Glazzard, 2010; Gurney, 2018) and may have resulted from earlier bullying
experiences (Mishna, 2003). It was difficult to decipher from the narratives whether
dyslexia or disengagement were the determinant of the low self-esteem levels
exhibited by the two disengaged participants with dyslexia in Sample 2.
In general, the themes generated by the narratives reflected the quantitative
measure of self-esteem reflected, although individual differences were evident. Any
slight disparities between narratives and quantitative assessments may be due to
scheduling in that assessments represented the first point of physical contact
between the researcher and participants and were measured a few days before the
narratives. Certain participants may have been more defensive when self-scoring
than within the open communication in the narratives.
An integrated perspective of the adolescent has been achieved through this
mixed methods approach, where the self-esteem scores are contextualised and
reinforced when viewed in conjunction with the narrative. From this overview, it is
suggested that higher general self-esteem may by associated with further
progression in identity formation and that creativity plays a fundamental role in
maintaining academic self-esteem. The school environment, support from teachers,
166
parental influence and peer acceptance and connectedness are also seen as pivotal
tenets in self-esteem development.
2.9 Strengths and Limitations
The present study had three key strengths.
The first strength of Study 1 is that it facilitated a holistic in-depth
investigation into marginalised and vulnerable adolescents. The interview schedule,
in contrast to previous research (Duffy, & Elwood, 2013; Glazzard, 2010, 2012;
Humphrey & Mullins 2002), did not focus on dyslexia or disengagement. This
allowed the participants to determine for themselves if they wanted to refer to their
dyslexia or disengagement rather than having the topic explicitly referred to and
potentiality influencing the findings.
Secondly, combining quantitative assessment with Life Story methodology
facilitated the collation of rich descriptive in-depth data to give ‘voice’ to these
often mis-represented adolescents.
Thirdly, the triangulation approach of obtaining self, parent and teacher
reports of behavioural and emotional strengths (BERS-2) allow an assimilation of
perspectives to order to gauge a more transparent and more nuanced view. For some
participants, the BERS-2 self-reports align less with the narratives and, therefore, it
is important to view such scores in conjunction with the teachers’ and parents’
reports. This triangulation was achieved for Sample 1. However, for Sample 2, only
a dual teachers’ and adolescent perspective on behavioural and emotional strengths
was achieved as parents failed to return their BERS-2 forms. This may indeed be
symptomatic of the parents’ disengagement and disillusionment with the education
system.
167
The present study had three limitations.
Firstly, psychometric instruments used can be criticised. Ambiguity of a few
items in the CFSEI-3 caused confusion and needed an adult guide on interpretation.
Indeed, Brunsman (2003) purports there is insufficient evidence to justify the claim
that the CFSEI-3 is ‘culture free’ or indeed ‘culture fair’. The SAI contained culture
specific language, for example, hunting & fishing as an option within the free time
domain, phraseology that was more relevant to the Canadian population from which
it derived. The teacher’s version of the BERS-2 included some questions that
required a high level of intimacy e.g. ‘the child accepts a hug’ which teachers may
have struggled to answer.
Secondly, since this research centred on small participant samples with large
individual differences the findings cannot be generalised to the wider population.
Furthermore, Sample 1 were selected from one independent school which tends, in
the main, to cater for children of parents considered to be mostly of a higher socio-
economic status and not representative of the ‘wider’ education population
Thirdly, Willig (2008) identified limitations with IPA, the qualitative
methodology of analysis used in Study 1. She argues that the process of talking
about an experience may not actually be discussing the incident, that the language
ability of the participant may impact their descriptive powers and may indeed
exclude them from the interview process. Willig further contends that concentrating
on the appearances rather than causal factors restricts understanding of the
experience. Indeed, Smith (1996) and Willig (2008) purport that IPA’s focus on
cognition, is incompatible with phenomenological ideology. However, such points
are countered as the Life Story Interview is based on short and clear questions with
168
prompts needed if necessary, and that the participants’ possessed adequate language
ability and they were able to describe life experiences well.
2.10 Conclusion
Study 1 aimed to explore the self-esteem of the two samples of vulnerable
adolescents from both a quantitative and qualitative perspective. The participants’
self-esteem and strengths scores were explored in the context of the narratives to
investigate whether these quantitative measures were congruent or contradicted
themes that emerged throughout the narratives. Findings revealed that the methods
were congruent and complimentary with the narratives adding depth, context and
understanding to the self-esteem scores.
Self-esteem scores were measured by the Culture-Free Self-Esteem
Inventory -3 (CFSEI-3; Battle, 1992) and revealed that the adolescents with dyslexia
possessed self-esteem scores generally within the ‘average’ range for academic and
parental self-esteem Indeed, three of the four adolescents displayed average
academic self-esteem, contrary to the literature (Terras, Thompson and Minnis,
2009, Undheim, 2009) which highlights the association between dyslexia and lower
academic self-esteem. However, below average/low self-esteem scores were
registered in the general, personal and social domains and may be underscored by
struggles with identity formation (Adams & Marshall, 1996; Kroger, 2000;
Berzonsky & Kuk, 2000), anxiety (Mugnaini, Lassi, La Malfa, and Albertini, 2009;
Nelson & Harwood, 2011) and peer relationships (Glazzard, 2010; Mishna, 2003).
The disengaged adolescents possessed average self-esteem scores in social and
parental domains, yet lower self-esteem than normative scores measured by the
CFSEI-3, within the academic, general and personal domains. These lower than
169
average scores may be underpinned by factors including low self-efficacy,
disengagement (Crocker, Major & Steele., 1998; Loose, Régner, Morin & Dumas,
2012) difficulties with identity formation (Adams & Marshall, 1996; Kroger, 2000)
and anxiety (Vaughn, Wexler, Beaver, Perron, Roberts, & Fu, 2011). A failure to
recognise their strengths may also underpin these lower than average self-esteem
scores.
To complement these findings, a qualitative approach was adopted to further
investigate the underpinnings of the self-esteem of these adolescents. IPA identified
seven shared themes from the Life Story Interviews of both samples; academic self-
evaluation, social self-evaluation, self-efficacy, emotional awareness, emotional
self-efficacy, identity, and self-attribution. An additional theme of rationalisation for
school disengagement and potential re-engagement emerged from the adolescents at
risk of becoming NEET. The pervasive influence of events outside school, such as
illness, bereavement, parental divorce etc. manifested in these adolescents’
behaviour within the school context. The participants were acutely aware of, and
wanted to verbalise, their reasons for disengagement from school and the reasons
they would potentially re-engage in school.
The differences in self-esteem levels between the two samples may have
been reflective of the tripartite influence of parents, peers and school although,
individual differences were evident throughout both samples. It could be suggested
that the parents of the disengaged adolescents were less involved and interested in
the education process, peers played a crucial role within the adolescents’ lives, and
that, for some, school functioned as a social gathering space rather than a vehicle to
progress learning. It could also be argued that these two samples represented a
dichotomy in terms of opportunity. The adolescents with dyslexia were educated in
170
a single sex independent school with a multitude of intra-school and extracurricular
activities and well-funded thriving Music, Art and Drama departments. In
comparison, in general, the disengaged adolescents from a mixed inner-city
secondary school did not seek out activities in which to thrive; indeed, there may
have been limited opportunities to express creativity, for example, although
programmes were in place to encourage them into the workplace.
An alternative interpretation of these results draws on Bronfenbrenner’s
Ecological Systems theory (1992) which suggests how inherent qualities of an
individual interact with their multi-layered environment to influence development.
These multiple environments are nested within each other and that an adolescent
exists within their microsystem (immediate environment such as home and school),
mesosystem (connections for example between home and school), exosystem
(indirect environment such as larger neighbourhood or parents’ workplaces),
macrosystem (social and cultural values, dominant beliefs and ideas) and
chronosystem which accounts for the influence of change and constancy over time.
The quality and context of these ecological systems are significant. This theory
purports to elucidate the differences in an individual’s development, knowledge and
competencies through the scaffolding, guidance and structure of the society in
which they are positioned. Furthermore, individual growth, knowledge and
competencies all influence self-esteem. Indeed, an adolescent can be seen in
isolation but positioned within ecological systems (and their consequential
interactions) that may foster or impede positive self-esteem,
Upon reflection, narratives suggested that the adolescents with dyslexia
appeared to possess a wider knowledge of current affairs revealed through watching
the news, reading and discussing with parents than those disengaged adolescents.
171
Indeed, this disparity may reflect school differences. Such knowledge in turn
influences their beliefs and ideas embedded in their macrosystem and suggests
awareness of the diversity of interrelated influences on their development. The
connection of the school and parents of the adolescents with dyslexia appeared more
closely interwoven within the mesosystem than those of parents of the disengaged
adolescents. These improved type and quality of connections may positively
scaffold the adolescent’s self-esteem and identity. Individual participants from both
samples have experienced the instability and unpredictability of family life (through
death or divorce), leading to fractured connections with important individuals. Some
of the disengaged participants lived complex lives, living with a family member
with an illness and or disability. Participants experienced a range of challenges
within both the family and community context, such as bereavement through
accidental death, neighbours allegedly involved in substance misuse,
intergenerational conflict and parental separation. Indeed, for some, hurdles were
faced on their journey to school, before the routine of the timetable is even
implemented. These scenarios were played out in an environment where economic
hardship and living circumstances compound already multi-faceted and complex
problems. According to Bronfenbrenner (1992), this splintering of a microsystem
has a significantly detrimental impact on adolescents’ development, leading to
attention-seeking through other portals which may culminate in problematic
behaviours such as poor self-regulation and anti-social behaviour.
Although Sample 1’s environmental factors may be softened by their socio-
economic class the same themes were interwoven into the fabric of their narrative.
Findings suggested an interplay of protective factors for the participants with
dyslexia which included parental involvement, family environment, nurturing
172
school and displays of creativity, that enabled these participants to sustain self-
esteem. It was also evident that the adolescents with dyslexia recognised their
strengths more readily in an enabling environment where they have the potential to
flourish with the ability to dream ‘too big’.
In sum, Study 1 has established, in line with the literature, that disengaged
adolescents exhibited lower than average self-esteem levels. However, the
adolescents with dyslexia reveal a spiky self-esteem domain profile with scores
generally higher than those recorded for the disengaged adolescents. This
discrepancy may be reflected of the tripartite influence of parents, peers and school
upon the different samples. Narratives revealed that although the same themes
underpinned their self-esteem, they differed in content and significance. Indeed, the
importance of expressing creativity was underscored as a mechanism for potentiality
increasing academic self-esteem. Indeed, narratives may have foster coping
strategies which act as a major contributor to resilience in adolescents (Morgan,
2000). It was interesting to note that the actual process of describing the life story
may indeed assist in the understanding of self and encourage healthy levels of self-
esteem. This study could be viewed as a starting point to influence future pluralistic
research into lived experiences of those vulnerable adolescents. Qualitative research
of these marginalised young people may contribute to bridging a gap between
research concepts and the lived experiences of adolescents with dyslexia and those
disengaged from the school system, informing educational practice and influencing
policy.
The next objective of this thesis was to adopt and adapt an intervention
aimed at increasing the self-esteem levels of these participants. The vehicle for
promoting self-esteem in Study 2 is a school-based group intervention based upon

173
positive emotions. This intervention is profiled, implemented and discussed in the
next chapter.
174
3 Chapter 3
Study 2 – An investigation into the impact of a positive
emotion intervention on the self-esteem of vulnerable
adolescents
This chapter aims to evaluate the efficacy of a multi-component positive
psychology school intervention in terms of changes in self-esteem in two samples of
adolescents (i.e., those with dyslexia and NEETs) over four timepoints.
The main objective of positive psychology interventions (PPIs) is to improve
subjective well-being through the development of positive emotions, cognitions and
behaviours (Parks & Biswas-Diener, 2013). Whilst these objectives are relatively
clear, the translation of the positive education theory into practice is complex.
PPIs highlight adolescent strengths (Sin & Lyubomirsky, 2009; Boiler et al.
2013) and embrace tenets that facilitate positive development, for example,
subjective well-being. Recent systematic reviews and meta-analyses have revealed
short-term and long-term beneficial effects of using multi-component positive
psychology interventions through increasing subjective and psychological well-
being, and to a lesser extent decreasing depression and anxiety (Hendriks,
Schotanus-Dijkstra, Hassankhan, de Jong, & Bohlmeijer, 2019; White, Uttl, &
Holder, 2019) .
PPI programmes developed and implemented by Seligman, Steen, Park and
Peterson (2005) usually incorporate strategies and intentional activities including;
Gratitude visits/letters; three good things; You at your best and using signature
character strengths. Many similar interventions are also now delivered based upon
175
for example acts of kindness (Lyubomirsky, Sheldon, & Schkade, 2005) and hope
therapy (Cheavens, Feldman, Gum, Michael, & Snyder, 2006).
Positive psychology approaches have previously been incorporated into
school-based interventions designed to foster student subjective well-being (Suldo,
Savage & Mercer, 2014). According to Diener, Oishi and Lucas (2009) subjective
well-being is a broad construct comprising both an affective and cognitive
evaluation of one’s life and experiences (including assessment of life satisfaction
and positive and negative affect occurrence) and is sometimes considered as the
scientific operational definition of happiness. There is evidence to indicate a
correlation between subjective well-being and self-esteem (Schimmack & Diener,
2003; Ni, Shao, Qu, Zheng, & Jia, 2019). Consequently, the adoption and adaptation
of an intervention for the current study that had been primarily aimed to promote
adolescent subjective well-being may indirectly produce beneficial outcomes in
terms of improvements in self-esteem for the two samples.
This chapter focuses on the literature regarding positive emotions in school-
based interventions with reference to three key components; gratitude, the
recognition and use of character strengths and hope. The chapter then discusses the
rationale for adopting the positive emotions intervention used in Study 2. It is
envisaged through Fredrickson’s (1998, 2001) broaden and build theory that the
gratitude and hope elements of interventions promote an upward spiral of positive
emotions. Although character strengths are dispositional in nature it is their
recognition and use in interventions that engender and boost positive emotions. The
adaptations of the intervention are then discussed and its implementation within two
schools is profiled before reporting findings assessed at four time points for 12
participants.
176
3.1 The importance of positive emotions in school-based
interventions
Emotion theories acknowledge that emotions encompass several elements,
e.g., a feeling element (subjective experience), a cognitive element, a somatic
element (fluctuations in the nervous system) and a behavioural element (Moors,
2009). Similarly, Frederickson (1998) defines emotions as ‘short-lived experiences
that produce coordinated changes in people’s thoughts, actions, and physiological
responses’ (Fredrickson & Branigan, 2005, p. 313). Fredrickson (2001) also
differentiates emotions from affect, purporting emotions originate from personally
relevant episodes, evaluated consciously or unconsciously, and are experienced
briefly. Conversely, affect is perceived as a more generalised concept that is longer
lasting, objectless and varies only in positive and negative activation. Fredrickson
(2009) identifies hope and gratitude amongst the most prevalent positive emotions,
although it is acknowledged that ‘positive’ is not a universally applicable term
transcending all contexts and situations (Lazarus, 2003).
Fredrickson (1998, 2001) emphasises in her ‘Broaden and Build’ theory the
significance of positive or negative emotions in adaptation in terms of flourishing
(presence of mental health) or languishing (absence of mental health) (Frederickson
& Losada, 2005). In a nationally representative study of 1,200 adolescents, Keyes
(2009) illustrated that approximately 38% were flourishing, 56% were considered
moderately mentally healthy and 6% were languishing. Those adolescents that were
flourishing exhibited greater psychosocial functioning in terms of global self-
concept, self-determination, closeness to others and involvement in school. In
contrast, languishing counterparts reported increased levels of behavioural problems
177
which included alcohol use, cigarette smoking, marijuana use, truancy, and criminal
arrest.
Indeed, to feel more positive emotions (than negative emotions) is
considered a critical factor in optimising well-being; the more positive emotions
experienced by individuals results in ‘upward spirals’ of higher reported subjective
well-being (Fredrickson & Joiner, 2002). It is posited that positive emotions “widen
an individual’s momentary thought–action repertoire and spark exploration and
interest, stimulates ideas and social ties, which subsequently build an individual’s
personal resources and consequently promote adaptive coping” (Fredrickson 1998,
2001). For example, it is suggested joy appears to broaden the thought action
repertoire by stimulating creativity leading to an expansion of boundaries
(Fredrickson, 2001).
Fredrickson proposed that these broadening of emotions promote long
lasting personal resources in terms of social connectivity, health, and knowledge
base. Convergent literature supports this proposition suggesting positive emotions
expand attention, cognition and behaviour in addition to intellectual, social and
physical resources as well as impacting on psychological resilience (Tugade,
Fredrickson, & Feldman Barrett, 2004). Indeed, the relationship between positive
emotions and future well–being is suggested to be via its effect on adaptive coping,
which subsequently enhances functioning (during and after suffering adversity) and
influences well-being and future positive emotions (Fredrickson, 2001). It is argued
that academic buoyancy (Martin & Marsh, 2008), the concept where individuals
cope and bounce back from daily struggles, is improved by the ability to access
positive emotions in stressful periods. In other words, resilient people display more
positive emotions and facilitate a bouncing back from anxiety provoking
178
experiences more speedily and effectively than their non-resilient counterparts
(Tugade & Fredrickson, 2004). Positive emotions are suggested to offset negative
emotions through positive coping strategies which include problem-solving, positive
reappraisal, behavioural coping strategies (seeking social support) or permeating
daily episodes with positive meaning (Conway, Tugade, Catalino, & Fredrickson,
2013).
There is also evidence to suggest that positive emotions (experimentally
induced) not only enhance individuals’ breadth of visual attention and range of
desired actions (Fredrickson & Branigan, 2005), but also increase creativity (Rowe,
Hirsh & Anderson, 2007) and their sense of others (Waugh & Fredrickson, 2006).
Moreover, a longitudinal study by Fredrickson, Cohn, Coffey, Pek and Finkel
(2008) revealed that positive emotions experimentally induced through loving-
kindness meditation enhance individuals’ personal resources which resulted in
increased subjective well-being.
Despite some shortcomings in the research relating to lack of conceptual
clarity and coherence, evidence linking positive emotions and well-being and health
has rapidly accumulated (Fredrickson & Cohn, 2008), revealing robust long-term
effects. However, although supporting evidence for the broaden-and-build theory is
well documented, its application into the educational context is not as well
established. There is evidence to suggest utilising students’ unique personal
strengths in combination with environmental resources may indeed increase the
probability of students experiencing positive emotions within the school context
(Fredrickson, 2001), promoting an ‘upward spiral’ of engagement and success.
Reschly, Huebner, Appleton, and Antaramian’s (2008) research with 293
students (12 -15 years) demonstrated that experiencing frequent positive emotions
179
within the school context was associated with increased levels of adaptive coping
and student engagement. Convergent research revealed positive emotions showed
significant incremental validity in predicting adaptive school coping, student
engagement and school satisfaction, but not self-reported Grade Point Average
(Lewis, Huebner, Reschly & Valois, 2009). Furthermore, a review of research with
children and adolescents by Huebner, Hills, Jiang, Long, Kelly and Lyons (2014)
demonstrated the use of frequent positive emotions may influence increased positive
life experiences in other life dimensions. Moreover, positive emotions in school are
considered not only as a successful outcome but also as a buffer against disaffection
and as a facilitator of academic engagement (King, McInerney, Ganotice, &
Villarosa, 2015).
According to self-determination theory (Deci & Ryan, 1985; Ryan & Deci,
2000), school experiences that facilitate adolescents in satisfying their fundamental
psychological needs promote psychological growth and well-being; thus, a solely
unidirectional association between positive school experiences and subjective well-
being is purported. Alternatively, in line with the broaden and build theory, a
reciprocal relation is demonstrated, whereby subjective well-being is posited to
enable approach behaviour which in turn culminates in more positive school
experiences. Indeed, Suldo, Thalji and Ferron’s (2011) longitudinal research
demonstrated that subjective well-being was predictive of students' grade point
average a year later.
In sum, there is convergent evidence to suggest that positive emotions,
although transient in nature, broaden meaning, develop behavioural reservoirs,
foster new ideas and facilitate the reinterpretation of negative memories. This
broadening is seen to occur at cognitive, affect and behavioural levels. Although not
180
directly demonstrated with self-esteem, positive emotions can yield multiple
beneficial outcomes when incorporated into school-based interventions. The existent
literature on the impact of positive emotions in the past (gratitude), present
(recognition and use of character strengths) and future (hope) are now discussed.
3.1.1 The effect of gratitude
Gratitude has been described as a positive emotion that evolves from
noticing and appreciating the intentionally performed benefits that one has received
(Wood, Froh, & Geraghty, 2010) that is both valuable to the recipient and costly to
the benefactor (McCullough, Tsang, & Emmons, 2004). It is suggested that
gratitude has a unique evolutionary objective and distinct function, that is to
strengthen social bonds during good times which feed into the individuals’
additional resources to be utilised in adversity.
This aligns well with Frederickson’s (1998, 2001, 2004) broaden and build
proposition and upholds the bidirectional relationship between positive emotions
and success (Lyubomirsky, King & Diener, 2005). The ensuing upward spiral
generated by gratitude is argued to promote creativity, purposefulness and intrinsic
motivation (Froh & Bono, 2009). Indeed, Damon (2008) revealed a sense of
gratitude is a common characteristic in very purposeful adolescents. Furthermore, a
purposeful state has a beneficial influence on adolescents’ ability to communicate,
share and construct the self-narrative reinforcing the development of a strong
personal identity (McAdams, 2001; Niederhoffer & Pennebaker, 2002).
Gratitude is significantly associated with critical elements of adolescents’
mental health (e.g., negative affect, depression, and somatic symptoms) and well-
being (e.g., life satisfaction, positive self-appraisal, positive outlook and positive
affect) (Lambert, Fincham, & Stillman, 2012; Watkins, 2014). Although little
181
research has explored the direct effect of gratitude on self-esteem, growing research
has investigated the impact of gratitude on life satisfaction (the cognitive element of
subjective well-being) (Park, 2004) which is considered a correlate of self-esteem
(Diener & Diener, 2009). Indeed, self-esteem has been revealed to mediate the
relationships between gratitude and life satisfaction (Kong, Ding & Zhao, 2015),
well-being (Lin, 2015a), and depression (Lin, 2015b).
Gratitude is a complex cognitive emotion that develops gradually between
ages 7 and 10, reflecting necessary cognitive attributes to process judgments of
intentionality and cost to the benefactor (Emmons & Shelton, 2002), less
egocentricity and increased empathy which is considered the most crucial catalyst to
the development of gratitude development, (Saarni, 1999; McCullough, Kilpatrick,
Emmons & Larson, 2001). Early adolescent girls exhibit slightly increased gratitude
than boys, but boys appear to derive more social benefits from gratitude (Froh,
Yurkewicz, & Kashdan, 2009). Whereas boys were more grateful for material items
than girls, girls revealed increased gratitude for interpersonal relationships (Gordon,
Musher-Eizenman, Holub, & Dalrymple, 2004).
As gratitude appears more naturally prevalent in adults, more structured
activities to enhance gratitude are needed to promote gratitude in adolescents (Froh,
Kashdan, Ozimkowski, & Miller, 2009; Flinchbaugh, Moore, Chang, & May, 2012).
These are normally delivered in one of two formats. The first, ‘counting blessings’,
is where participants list down things for which they are grateful, normally in a
journal entry. The second, ‘the gratitude visit’, draws upon interpersonal action and
normally consists of participants being requested to write a letter to an individual to
whom they feel grateful and then personally delivering the letter to the recipient
whereupon they then read their written words to the recipient (Froh, Sefick,
182
Emmons, 2008; Layous, Lee, Choi, & Lyubomirsky, 2013). Outcomes suggest that
gratitude-based interventions may have more success potency with those with low
baseline positive affect (Froh, Kashdan, Ozimkowski, & Miller, 2009) or clinical
samples (Akhtar & Boniwell, 2010).
The expression of gratitude may promote positive emotions through the
following mechanisms; savouring positive experiences, people, and objects
(Sheldon & Lyubomirsky, 2006); preventing positive life dimensions to be taken for
granted (Lyubomirsky, Sheldon, & Schkade, 2005); being intrinsically incongruous
with negative affect and consequently preventing expression of negative emotions
(McCullough, Emmons & Tang, 2002); and as an adaptive coping strategy by
reframing struggles from a positive perspective (Fredrickson, Tugade, Waugh, &
Larkin, 2003; Lambert, Fincham, & Stillman, 2012). Gratitude also evokes positive
emotions through improved intrapersonal and interpersonal well-being (Helliwell,
Aknin, Shiplett, Huang & Wang, 2017) and the promotion of widespread optimal
functioning (Emmons, 2007). Examples include enhanced feelings about
relationships (Lambert & Fincham, 2011), prediction of social integration, (Keyes,
1998; Froh, Bono, & Emmons, 2010), connectedness (Ryan & Deci, 2000) and pro-
social behaviour (Bartlett & DeSteno, 2006; Bono, Froh, Disabato, Blalock,
Mcknoght & Bauset, 2019; Grant, & Gino, 2010; Tsang, 2006).
Although gratitude is acknowledged as a bona fide construct in positive
youth development that is measurable via reliable and valid psychometric
instruments (e.g., Froh, Fan, Emmons, Bono, Huebner, & Watkins, 2011), some
researchers question the effectiveness of the interventions. Confusion still exists
regarding the loose operationalisation of the term ‘gratitude’ (Renshaw & Olinger
Steeves, 2016), as well as the most effective format, dose and frequency of gratitude
183
interventions (Akhtar & Boniwell, 2010; Emmons & Mishra, 2011; Froh, Bono,
Fan, et al. 2014; Owens & Patterson).
In sum, gratitude-based interventions may potentially reveal more efficacy
than doing nothing different such as education-as-usual or a passive control.
Although there is little evidence that gratitude in adolescence has practically
meaningful links with performance or informant-based variables (i.e., academic
success) so validated by the educational system, the ramifications of enhanced well-
being must filter into the school context.
3.1.2 The effect of recognition and use of character strengths
Strengths can be defined as “a pre-existing capacity for a particular way of
behaving, thinking, or feeling that is authentic and energizing to the user, and
enables optimal functioning, development and performance” (Linley, 2008, p.9). As
strengths are purported to come naturally to an individual, they are distinct from
skills (which are learned through training), experience and talents (innate abilities
with a predominant biological underpinning) (Niemiec, 2013).
In most of the literature adolescent character strengths are classified and
measured by one self-report measure, the Values in Action for Youth Inventory of
Strengths (VIA-Youth; Park and Peterson, 2006). Twenty-four character strengths
(positive traits reflected in feelings, thoughts, and behaviours) are categorised under
six broad virtues which are individually morally valued. According to Peterson and
Seligman (2004) the five highest strengths that individuals feel are most integral to
who they are defined as ‘signature strengths’. Linley (2008) suggests that when
questioned only 1/3 of participants are cognisant of their signature strengths.
184
This failure to recognise strengths may stem from a variety of factors. Jones-
Smith (2011) argue strengths are so intrinsic to self that they fall beyond the scope
of their conscious awareness, whilst Niemiec (2013) refers to this as “the taking-
strengths-for-granted effect” (p. 29). Evidence also suggests a societal and cultural
component where individuals’ recognition of their strengths is skewed by family,
teachers and peers who emphasise weaknesses instead of promoting strengths
(Jones-Smith, 2011). Indeed, if ignored or not used, strengths may atrophy and such
a strengths estrangement may result in a disconnect between an individual and their
character strengths (Jones-Smith, 2011).
Positive psychology posits that the utilisation of signature strengths is
innately empowering and associated with an individual’s identity, sense of self, and
authenticity (Biswas-Diener, Kashdan & Minhas, 2011; Peterson & Seligman,
2004). Strengths use therefore comprises two components; firstly, the identification
of the individual’s ‘signature strengths’ (generated by completion of the VIA
survey) and, secondly, the use of these strengths in novel ways. Contrary to other
pedagogical perspectives, identification and utilising strengths highlight the
universality of strengths possession and is a process that does not include academic
comparison with the peer group. Moreover, some argue positive emotions are
generated whilst utilising character strengths and underlie the resultant increase in
personal resources which further feed into goal-directed actions (Xanthopoulou
Bakker, Demerouti, & Schaufeli, 2007).Another bidirectional mechanism is that the
use of character strengths promotes positive emotions, which widen the thought-
action repertoires synergistic with creative learning (Fredrickson, 1998).
The change in emphasis towards character education is a proactive response
to the significance increase in mental illness and psychological distress in children
185
and adolescents. According to the Mental Health Taskforce, (2016), 1 in 10 young
people aged 5-16 years experience a diagnosable mental health disorder - that
equates to around three children in every class (McGinnity, Meltzer, Ford, &
Goodman, 2005). Half of all mental health problems are entrenched by the age of 14
and this increases to 75% by 24 years of age (Mental Health Taskforce, 2016).
Furthermore, it is reported 5-19% of all children and adolescents suffer from anxiety
disorders (Costello, Egger, & Angold, 2004). Since mental health issues have a
profound detrimental impact on physical health and hinder adolescents maximising
their educational potential, early adolescence appears a critical period for
preventative interventions.
To counter the escalation in adolescent mental health disorders, there is
evidence to suggest increased use of specific character strengths (gratitude, hope,
perseverance and self-regulation) in adolescence are associated with reduced
symptoms of depression and anxiety (Gillham et al. 2011; Park & Peterson, 2008;
Peterson & Peterson, 2008). In addition, strengths use may buffer against
vulnerabilities (e.g. perfectionism and need for approval) that can culminate in
anxiety and depression (Huta & Hawley, 2010). Indeed, an estimated 60-70% of the
interventions with children and adolescents within positive psychotherapy
concentrate upon character strengths and trials have shown beneficial outcomes for
sufferers of anxiety, depression, schizophrenia, nicotine dependence, and borderline
personality (Rashid & Anjum, 2007; Seligman, Rashid, & Parks, 2006).
However, null and negative findings have also been reported. Tak,
Lichtwarck-Aschoff, Gillham, Van Zundert and Engels (2016) examined the impact
of the Dutch version of the Penn Resiliency Program (PRP) with 1,341 Year 8
pupils across nine schools. Findings revealed enhanced cognitive coping lasting
186
over the 18 month follow-up; however, no positive impact was found on levels of
anxiety, depression, hopelessness, happiness or life satisfaction. Furthermore,
Challen, Machin, and Gillham’s (2014) investigation into the effectiveness of the
UK Resilience Programme, the UK version of the PRP, revealed immediate slight
decreases in self-reported depressive symptoms, but the effect was small and no
decrease in depressive symptoms were revealed at 1-year or 2-year follow-ups. No
significant impact was demonstrated on anxiety symptoms or problematic
behaviour. Consequently, Bastounis, Callaghan, Banerjee, and Michail (2016)
questioned the structure and content of the PRP and argued against its large-scale
implementation after their meta-analysis of nine trails revealed no evidence of
alleviating anxiety or depression in 8 to 17 year olds.
Recognition and use of character strengths has also been correlated with
increased subjective well-being (Twenge, 2006) as well as a distinctive predictor of
subjective well-being after controlling for self-esteem and self-efficacy (Proctor,
Maltby, & Linley, 2009). Toner, Haslam Robinson and Williams (2012) found
hope, zest, leadership and prudence predicted subjective well-being on measures of
both happiness and life satisfaction. Furthermore, fairness predicted improved life
satisfaction while love and curiosity predicted increased happiness. Interestingly,
when controlling for other strengths, creativity, perseverance, judgment and
appreciation of beauty predicted decreased life satisfaction. These outcomes largely
reinforce Park, Peterson, and Seligman’s (2004) proposition that in adolescence
there is a tendency for more cognitive (intellectual) and aesthetic strengths to be
only weakly correlated to subjective well-being. In addition, interpersonal strengths
were not generally associated with subjective well-being, demonstrating that
although adolescents high on such strengths may exhibit a positive impact in a
187
social context, other strengths may impact more beneficially on their personal well-
being. Moreover, Linley, Nielsen, Gillett and Biswas-Diener (2010) believe the
strong correlation between strengths use and well-being may be due to strengths
facilitating goal progression, fulfilling our basic needs for competence, autonomy
and social relatedness.
The literature reveals school achievement as just one of the positive
outcomes empirically associated with character strengths. Indeed, Peterson and
Park (2009) found hope, gratitude, perseverance, love, competence and perspective
predicted high grade point averages. In addition, strengths use may improve
positive relationships in school culminating in a more positive classroom
environment. For example, Wagner and Ruch’s (2015) demonstrated strong
correlations between positive classroom behaviours and self-regulation, hope,
prudence and social intelligence. Interestingly, primary school childrens’ use of
signature strengths in novel ways combined with meaningful setting of goals yielded
improvements in both hope and engagement (Madden, Green & Grant, 2011).
Furthermore, classroom environment is intertwined with both the well-being and
academic outcomes of students, according to research supporting the prosocial
classroom theoretical model (Jennings & Greenberg, 2009).
However, there are divergent results regarding the link between the
recognition and use of character strengths and improved self-esteem. Wood, Linley,
Maltby, Kashdan and Hurling’s (2011) longitudinal adult study found that strengths
use was a significant predictor of well-being culminating in less stress and improved
self-esteem, positive affect and vitality, both at 3-month and 6-month follow-up.
Furthermore, self-esteem partially explained the association between life satisfaction
and strengths use, notably, this effect was greater for adolescents possessing low to
188
moderate levels of positive affect (Douglass & Duffy, 2015). However,
contradictory findings were noted by Proctor, Tsukayama, Wood, Maltby, Eades
and Linley (2011), when a 6 month teacher delivered character strengths programme
for adolescents yielded no statistically significant changes in self-esteem, positive
affect or negative affect.
Clinical populations also revealed contradictory outcomes. An intervention
concentrating on character strengths and their incorporation into coping skills,
yielded improved self-esteem and self-efficacy (both sustained at 3 month follow-
up) in psychiatrically hospitalised adolescents (Toback, Graham-Bermann, & Patel,
2016). Whereas a smaller study with adults diagnosed with early psychosis yielded
contrasting findings in that the identification of character strengths had no effect on
self-esteem or self-efficacy; however, qualitative feedback revealed participants
were paying more attention to positive attributes (Sims, Barker, Price & Fornells-
Ambrojo, 2015).
The existent research centres primarily around the sole measure of
assessment, VIA- Youth which provides continuity of definition. Whilst the efficacy
of character education programs are generally measured by improvements in
behaviour, the variability of programs implemented stems from the lack of clarity of
definition of character education (Lapsley & Narvaez, 2006). Theorists argue for
divergent core components of such programs with essential elements ranging from
for example; moral and prosocial development (Nucci & Narvaez, 2008), social and
emotional learning (Durlak, Weissberg, Dymnicki, Taylor & Schellinger, 2011) to
the seven character strengths adopted in the USA ‘Knowledge is Power program’
(Macey, Decker, & Eckes, 2009). Furthermore, Linkins, Niemiec, Gillham and
Mayerson (2014) purport there is an imbalance within character education
189
programmes, suggesting numerous character education courses underpin only three
of the six virtue clusters; justice, courage and humanity.
There is evidence to suggests strengths interventions (Proctor, Maltby, &
Linley, 2011; Quinlan, Swain, & Vella-Brodrick, 2012) improve strengths
knowledge which generally successfully translate into increased strengths use and
well-being. However, a better understanding is needed of the exercises involved,
stages of a successful strength intervention and underpinning mechanisms in order
to design more effective interventions. Such mechanisms may comprise not only
individual components such as strengths use, goal striving and fundamental needs
fulfilment but relational and contextual elements. Furthermore, research suggests the
inclusion of mindfulness may increase the effectiveness of the intervention, as
mindfulness naturally generates positive emotions that have increasingly become the
subject of systematic inquiry. Indeed, Niemiec, Rashid and Spinella (2012) argue
for the explicit integration and mutual impact of the combination of mindfulness and
character strengths (Borghans, Duckworth, Heckman, & ter Weel, 2008; Kabat-
Zinn, 1990; Peterson, 2006).
In sum, although there is scarcity of research with use of character strengths
and its direct effect upon adolescent self-esteem, there is evidence to suggest that
using character strengths may positively influence related constructs such as life
satisfaction.
3.1.3 The effect of hope
Hope is a positive motivational emotion that connects individuals
optimistically to the future (Park, Peterson & Seligman, 2004) and assists the
generation of and sustained activity towards long-term goals, including flexible
190
management of hurdles that hinder goal attainment (Bailey, Eng, Frisch, &
Snyder, 2007). This process of planning routes to achieve goals is considered as
mental action sequences (Snyder, 2002). Such sequences are posited to be the
fundamental force underpinning positive emotions and psychological well-being
(Snyder, 2002; Snyder, Shorey, Cheavens, Pulvers, Adams III & Wiklund, 2002),
culminating in flexible, efficient and creative problem solving (Frederickson, 1998,
2001). However, research suggests that individuals from families of higher socio-
economic status have a propensity to exhibit higher self-esteem and possess more
complex creative thinking styles (Zhang & Postiglione, 2001) which indeed may
impact on hope.
In the existent literature, strong associations have also been found between
hope and subjective well-being (Eryılmaz 2011; Demirli, Türkmen, & Arık, 2015),
psychological adjustment, resilience and life satisfaction (Michael & Snyder, 2005;
Peterson, Ruch, Beermann, Park, & Seligman, 2007; Valle, Huebner, & Suldo,
2006); happiness (Alarcon, Bowling, & Khazon, 2013); meaning in life (Varahrami,
Arnau, Rosen & Mascaro, 2010; Dogra, Basu., & Das, 2011); social support (Kemer
& Atik 2012) as well as positive affect and flourishing, (Ciarrochi, Heaven and
Davies, 2007; Demirli, Türkmen, & Arık, 2015). However, the relationship between
hope and greater positive affect is not reciprocal, in contrast to the reciprocal
association between hope and negative affective states (Ciarrochi, Parker, Kashdan,
Heaven, & Barkus, 2015). Hope is also seen to account for unique variance in
mental and physical health outcomes (Bailey et al, 2007) above and beyond
optimism and is associated with fewer problems with anxiety and depression (Park
& Peterson, 2008a), buffering against the negative impact of trauma (Park &
Peterson, 2006c; Park & Peterson, 2009a).
191
Within the school environment hope is linked to personal adjustment
(Gilman, Dooley & Florell, 2006) and enhanced academic performance (Ciarrochi,
Heaven & Davies, 2007; Rand, Martin & Shea, 2011). Predictive of future well-
being, particularly in school transition years, hope encourages positive youth
development which manifests in high levels of character, confidence, competence,
care and social connections (Ciarrochi, Parker, Kashdan, Heaven & Barkus, 2015).
Indeed, Schmid, Phelps, Kiely, Napolitano, Boyd and Lerner (2011) suggest that
hope is the strongest predictor of positive youth development, outperforming other
factors such as self-regulation. Whilst Van Ryzin, Gravely, and Roseth (2009)
purport that belongingness and autonomy are related to hope, and that class
engagement could be a vehicle by which this happens.
Toner, Haslam, Robinson and William (2012) argue for the explicit teaching
of hope as a critical component in any intervention seeking to enhance happiness
and life-satisfaction in adolescents (e.g. Marques, Lopez & Pais-Ribeiro 2011). The
Best Possible Activity (BPS), where the participant documents goals in life, is the
central intervention component to foster hope in diverse clinical and non-clinical
participants (Loveday, Lovell & Jones, 2018). Considered robust, the BPS is
effective when delivered on-line or in person (Layous, Nelson & Lyubomirsky,
2013), whether written or verbally expressed (Harrist, Carlozzi, McGovern &
Harrist, 2007) and as a stand-alone or component in a portfolio approach (Huffman,
DuBois, Healy, Boehm, Kashdan, Celano, et al., 2014).
In a classroom intervention, the BPS activity is a writing (or drawing) task
where participants are asked to project themselves positively into the future and
imagine they have met all the goals in their life domains (Peters, Flink, Boersma, &
Linton, 2010). This ability to generate possible selves is purported to stem from
192
increasing cognitive capability to think about hypothetical situations in adolescence
(Harter, 1990; Knox, Funk, Elliot, & Bush, 1998). Whilst enhanced self-esteem was
demonstrated in elementary school children, compared to control, after a drawing
BPS activity (Owens & Patterson, 2013), mixed outcomes have been reported
regarding increases in well-being. Mental imagery ability did not enhance the
efficacy of BPS in terms of an improvement in the well-being in adults (Odou
&Vella-Brodrick, 2013), indeed, writing short narratives about their best possible
selves in the future predicted present well-being in college students (Hill, Terrell,
Arellano, Schuetz & Nagoshi, 2014).
When drawing a picture of their BPS, girls tended to draw more realistic
images and images related with societal worries than boys (Owens & Patterson,
2013). Furthermore, Knox et al. (1998) suggested several descriptors of best
possible selves were positively linked to girls’ global self-esteem, (e.g. personal
attributes, physical appearance etc.), whereas only interpersonal relationships were
associated with boys’ self-esteem. Such discrepancies were argued to be the result
of girls’ increased psychological maturation and more differentiation in the
development of self-esteem. Boys’ possible selves may function to define them as
unique, independent and autonomous whereas girls’ possible selves include views of
others in constructing possible selves and in determining self-worth (Knox, 2006).
Heaven and Ciarrochi (2008) found the decline in hope during the earlier
adolescent years greater in girls (which increased in later adolescence according to
Ciarrochi et al., 2015) and in those exhibiting low baseline levels. Oscillations in
female hope levels may centre on the father’s role (Siegal, 1987), gender-biased
language (Tenenbaum & Leaper, 2003) and contradictory messages about women’s
roles in Western society (Leaper, 2002).
193
Other moderating variables including person features such as motivation
(Sheldon & Lyubomirsky, 2006), higher mental imaginary ability (Odou and Vella-
Brodrick, 2013), cultural differences (Boehm, Lyubomirsky & Sheldon (2011) and
mindfulness levels (Seear & Vella-Brodrick, 2013) may indeed alter the strength
and direction of the relationship between the BPS and its efficacy. However, activity
features such as repetition (Peters, Meevissen, & Hanssen, 2013) or dosage may
impact on effectiveness (Nelson & Lyubomirsky, 2014). Although the broaden and
build theory (Fredrickson, 2001) has been suggested as a probable mediator
(Meevissen, Peters & Alberts, 2011) in understanding how the BPS activity works,
such a supposition has not been empirically tested.
In sum, there is evidence to suggest that hope, when promoted through tasks
such as the BPS activity, yields beneficial outcomes in a multitude of life indicators
which may consequently positively impact adolescent self-esteem.
3.2 Rationale underlying adoption and adaptation of the tripartite
intervention
In line with the positive psychology perspective, a multi-component
intervention incorporating positive emotions in the past (gratitude), present
(recognition and use of character strengths) and future (hope) (Suldo, Savage, &
Mercer, 2014) was adopted and adapted for Study 2.
file:///C:/Users/Gabrielle/Downloads/PositivePsychologyInterventionManual-
FINAL%202007%20(4).pdf
The literature supporting the “Broaden & Build” theory (Fredrickson, 1998,
2001) suggests that these positive emotions engender long-lasting beneficial
outcomes including positive coping strategies (Conway, Tugade, Catalino, &
Fredrickson, 2013), increased creativity (Rowe, Hirsh & Anderson, 2007) improved
194
engagement Lewis, Huebner, Reschly & Valois, 2009) as well as enhanced
subjective well-being (Fredrickson, Cohn, Coffey, Pek and Finkel, 2008). As such
outcomes may beneficially impact upon self-esteem, the aim of Study 2 is to foster
an improvement in self-esteem by the composite domains through positive
emotions.
Suldo, Savage and Mercer’s (2014) novel 10 week group intervention aimed
to foster the subjective well-being of early adolescents (N=28, wait-list control
N=27, mean age 11.43 years, 60% female) who were ‘less than satisfied’ with their
lives. Students’ mental health was measured by five indicators; positive and
negative affect, life satisfaction, internalising psychopathology (anxious/depressed,
somatic complaints, and withdrawn/depressed) and externalising psychopathology
(aggressive behaviour & rule breaking behaviour) at different timepoints in the
study. The findings revealed significant increases in life satisfaction in the
intervention group which were sustained at 6 month follow-up (however, after an
initial decline similar gains were reported post-intervention in the control group).
The authors limitations centre on the nature of life satisfaction, low internal
consistency of assessments, and generalizability of results based on intervention
setting.
In Suldo et al.’s (2015) later pilot study with elementary children, the
original intervention was modified to include sessions on positive relationships
between student and teacher and between students through teambuilding. The
inclusion of these environmental resources in combination with the positive
emotions in this intervention yielded clinically meaningful lasting gains in the
multiple indicators of subjective well-being, specifically positive affect and
195
satisfaction with self. However, no changes were indicated in behavioural student
engagement such as attendance.
A further investigation of forty-two 12-13 year olds by Roth, Suldo, and
Ferron, (2017) built upon and improved the same intervention. These improvements
included a parent component (i.e., regular weekly correspondence,
psychoeducation) and booster sessions, at five and seven-weeks post-intervention,
aimed at maintaining and augmenting intervention gains. Immediate post-
intervention, students who had received the intervention revealed significant
increases in all components of subjective well-being; improved life satisfaction and
positive affect and decreased negative affect when compared to the wait-list group.
However, at seven-week follow-up only positive affect was significantly greater for
the intervention students compared to wait-control counterparts. Furthermore, the
intervention students did not exhibit any significant improvements in severity of
internalising and externalising problems post-intervention. Although the
involvement of parents was recommended as a valuable element, booster sessions
failed to maintain the beneficial outcomes in subjective well-being initially
demonstrated initially by the intervention.
Thus, there is evidence to suggest from these studies that Suldo et al.’s
(2014) original intervention, and subsequent modified versions, yield enhancements
in early adolescents’ positive affect and life satisfaction, both key indicators of
subjective well-being.
Life satisfaction is seen as a correlate of self-esteem (Diener & Diener,
2009). Therefore, the intervention used for Study 2 and reported in this chapter was
adapted from Suldo, Savage & Mercer’s 2014 study to improve the self-esteem of
vulnerable adolescents. The adapted intervention incorporated some of original
196
recommendations given by the authors, however later recommendations generated
by their two later studies in 2015 and 2017 could not be included due to the
timescale of implementation of the current study.
3.3 Research Question
• Does the positive emotion intervention increase the self-esteem of vulnerable
adolescents (as measured by the CFSEI-3)?
3.4 Method
3.4.1 Participants
The participants were the same as used in Study 1, excluding participant D2
who relocated to another school during the study.
3.4.2 Design
The current study employed a multiple single case design (a small-N design)
which consisted of a series of pre-post case studies. Single case designs comprise
the in-depth study of individual participants using repeated measures of assessment,
with each participant engaging in the intervention and each participant serving as
their own control (Barlow & Nock, 2009; Kazdin, 2011). Pre-intervention and
follow-up data were collected immediately post-intervention, 6 month post-
intervention and either 12 (Sample 1) or 9 (Sample 2) month post-intervention.
Comparisons are then made for each participant over time or across multiple
participants undertaking the same intervention. Single case studies yield data from
pre- and post-intervention assessments that can be interpreted through visual
analysis, and non-inferential statistics such as Effect size, TAU-U analysis and
Reliable change.
197
It appeared inappropriate to have a ‘control group’ of participants who are
intentionally denied an intervention and term time restrictions did not facilitate the
scheduling of a wait list control group. Although this design lacks the
methodological requirements such as a control group to draw valid inferences about
the relations among variables (Kazdin, 1981). As case studies do not require control
conditions or comparison groups, they can be easily incorporated into routine
educational practice and serve as a research tool (Normand, 2016). Indeed, Riley-
Tillman, Burns, & Kilgus. (2020) suggest single case design allows educational
professionals a route to conduct systematic replication and thus a pathway to
defensible claims as to the generalisability of the intervention findings. As this
intervention intends to serve only as a pilot study, an in-depth exploratory
investigation of whether the intervention may be associated with improvements of
domain specific self-esteem in vulnerable adolescents, the choice of multiple single
case design is applicable for this research.
Prior to starting the intervention, each participant’s teacher and parents (for
Sample 1) and teacher for Sample 2 completed a pre-intervention assessment phase
where they recorded the emotional and behavioural strengths of the participants.
Details are included in the Appendices F and H.
The primary outcome measure was self-esteem as measured by the
standardised CFSEI-3 questionnaire. In order to monitor extraneous variables,
participation in all other interventions was ceased to rule out as many alternative
explanations as possible.
3.4.3 Materials
The materials used to assess self-esteem were the same as reported in Chapter 2
(Study 1).
198
3.4.3.1 Primary outcome measure
The norm-referenced Culture Free Self-esteem Inventory (CFSEI-3;
Battle, 2002) was used to measure the academic, general, parental, social, personal
and global self-esteem of the participants.
3.4.3.2 Secondary outcome measures (recorded in Appendix J Tables J1-J9)
The norm-referenced Behavioural & Emotional Rating Scale (BERS-2,
Epstein (2004) for Youth, Teacher and Parent version was used to measure the
interpersonal, intrapersonal, school functioning, family involvement and affective
strengths of the participant.
The ipsative Values in Action Inventory of Strengths for Youth (VIA-IS
(Youth), Peterson & Seligman, 2004) was used to assess 24 character strengths
within the six virtue categories of wisdom, courage, humanity, justice, temperance
and transcendence.
The ipsative Strengths Assessment Inventory -Youth Version (10-18
years) (SAI-Y; Rawana & Brownlee 2010; MacArthur, Rawana & Brownlee,
2011) was used to assess intrinsic strengths (personal developmental) and strengths
appertaining to the individual’s interaction with the environment (contextual).
3.4.4 Procedure
All pre- and post-intervention data were collected in either the school library
for the adolescents with dyslexia or a quiet room for the disengaged adolescents.
Participants were told that the activities were not school assessments. All forms,
recordings and transcripts connected to the study were stored in a secure manner
with the raw data and the real names of the participants kept separate. The
199
assessments were administered over four time points (pre-intervention, immediate
post-intervention, 6 month post-intervention, and 12 or 9 month follow-up).
3.4.5 Development and details of the Positive Emotion Intervention
Suldo, Savage and Mercer’s (2014) school- based multi-component 10 week
intervention focussing upon positive emotions was adopted for the following
reasons:
1. While the intervention in Suldo’s (2014) research was administered by
psychologists, the extensive detail given in the text of the 78 page manual
allowed the researcher to deliver the intervention. There is evidence of the
efficacy of interventions delivered by teachers (Froh, Sefick, & Emmons,
2008), even when the teacher had received no specific training and relied
solely on the written manual (Proctor, Tsukayama, Wood, Maltby, Eades &
Linley, 2011).
2. It was important for the intervention to reflect a temporal aspect in terms of
past, present and future emotions that would reinforce the temporal nature of
the life story narrative and facilitate the adolescent in constructing a cohesive
sense of self (McAdams, 2001). Suldo, Savage and Mercer’s (2014) multi-
component intervention focused on positive emotions in the past, present and
future. Such an intervention performed after the life story narrative allowed
the participants to identify and plug gaps identified in narrative in order to
construct an empowered identity rather than an impoverished identity.
3. It was age appropriate having resulted from developmentally modifying
evidence-based adult strengths-based interventions.
4. The hope and goal setting component of the intervention included a Best
Possible Selves activity, the task was in the form of a drawing in line with
200
Owens and Patterson’s (2013) study with younger children which resulted in
enhanced self-esteem.
5. Interventions implemented over a longer period (8 to 10 weeks) appear more
beneficial.
The intervention used by Suldo, Savage and Mercer (2014) was adapted for
use in Study 2 through the following modifications:
1. The inclusion of a short five minute mindfulness-based exercise in the
beginning of each session of the intervention. Mindfulness is suggested to
improve the efficacy of interventions (Niemiec, Rashid & Spinella, 2012).
2. As recommended by Suldo, Savage and Mercer (2014), a sample of older
students were purposefully recruited to participate in this study. The mean
ages of Sample 1 (M = 13.94, SD = 0.44) and Sample 2 (M = 14.83, SD =
1.26) were higher than the mean age of group (M = 11.43, SD = 0.55) used
in Suldo et al.’s (2014) original sample. Therefore, the original content of the
intervention programme was therefore modified for a higher developmental
age, by introducing you tube clips from films certified as 12 and over
depicting the constructs under investigation such as hope and gratitude.
3. The composition of the participants for Samples 1 and 2 were chosen for the
intervention programme through Learning Support departments as those
exhibiting potential low self-esteem. In Suldo, Savage and Mercer’s (2014)
intervention, although participants were gauged as less than delighted with
their life, some scored a rating of 6 on the 7 point screening assessment
indicating a ‘pleased’ with life score. Hence, a ceiling effect had been
created where some participants had little space for improvement due to high
baseline levels. The authors suggested that findings may be different with a
201
clinical sample of participants with low baseline levels of life satisfaction.
Indeed, Froh, Kashdan, Ozimkowski and Miller (2009) indicated that the
beneficial effects of their gratitude intervention were exhibited more with
those adolescents with lower baseline levels of positive affect.
4. Sessions on ‘acts of happiness’ and ‘optimistic thinking’ were omitted (the
latter due to perceived cognitive complexity) to concentrate on introductory
group ground rules, gratitude, enhancement of strengths, hope and goal
setting.
5. The mode of delivery changed to be delivered around power point
presentations to increase the researcher’s adherence to the programme. In
addition, age-appropriate You Tube clips and trailers of movies in which
actors exhibited the construct under discussion, i.e., gratitude and hope were
included.
6. Suldo, Savage and Mercer (2014) recommended a larger sample size to
increase the power of the study; however, the adapted intervention was a
component of a holistic programme incorporating the qualitative Life Story
Interview and therefore the small number of participants in Samples 1 and 2
was deemed appropriate.
3.4.5.1 Implementation of the intervention
Consent for participation was required from each parent/guardian and all
issued with an invitation letter and detailed information pack.
No participant withdrew and no parent withdrew their child. However, one
participant from Sample 1 (D2) left to attend another school and contact ended
although there were numerous unsuccessful attempts to engage the participant to
obtain post-intervention assessment responses.
202
The intervention schedule was implemented within the school environment
as
• a series of eight interactive weekly sessions based around a power point
presentation and lasting 35 minutes for Sample 1 (adolescents with dyslexia)
• a series of ten interactive weekly sessions based around a power point
presentation and lasting 60 minutes for Sample 2 (disengaged adolescents)
The differences in mode of delivery (e.g. session duration and length of
complete intervention) was due to feedback from participants in Sample 1. Timeline
schedules of the intervention with Sample 1 and Sample 2 is shown in Appendix K.
3.4.5.2 Composition of intervention
Small groups of participants contributed in interactive sessions. A simple
five minute mindfulness exercise - ‘the raisin activity’ (Semple & Lee, 2014) started
each session, this involved taking a few minutes to explore the texture, colour and
smell of a single raisin before eating. During this mindfulness exercise the
participants practiced regulating their attention by returning their wandering minds
back to investigating with curiosity and attention the object of their attention. After
this introduction, the core programme sessions commenced as in Table 3.1.
All sessions included researcher-facilitated discussions of relevant constructs
such as happiness, introductions and outlined the goals of the session and homework
to consolidate; this either involved completion of tasks commenced in the session or
rehearsal of the positive emotion focussed upon in that group session. At the end of
each session, participants received a small chocolate bar or sweet. The first session
was an introductory session and the middle sessions were organised into three
203
sections in alignment with Seligman’s (2002) framework where intentional activities
enhance happiness.
The following sessions included focussing on expressions of gratitude for
past events, recognition and novel use of character strengths, and positive emotions
in the future through the development of a hopeful and goal-directed mindset in line
with Fredrickson’s (1998, 2001) broaden and build theory.
Suldo, Savage and Mercer’s (2014) character strengths component of their
multi-component intervention consisted of a review of the participants’ computer-
generated character strengths with the group facilitator, identification of signature
strengths and choosing of a signature strength to use in a novel manner every day
for one week. The authors acknowledged that developmentally appropriate
operationalisation of some strengths proved more difficult than others (e.g.,
appreciation of beauty and art, perspective, prudence). The following week involved
novel uses of another signature strength with the inclusion of using strengths across
life domains (i.e., family, peers, and school). Participants were asked to note their
feelings after each use of their chosen signature strength to enable them to see the
synergy between thoughts, actions, and feelings of well-being and prompted to
savour the positive experiences that emerged from use of signature strengths
(Gersema (2007) citing Bryant & Veroff, 2007).
Other activities throughout the sessions included ‘You at your best’ activity,
making and daily noting in their gratitude diaries, planning and undertaking
gratitude visits, and drawing their ‘Best Possible Self in the future’. The last session
recapped the sessions, incorporated a reflection on the intervention experience and
the completion of feedback forms. At the end of the intervention, each participant
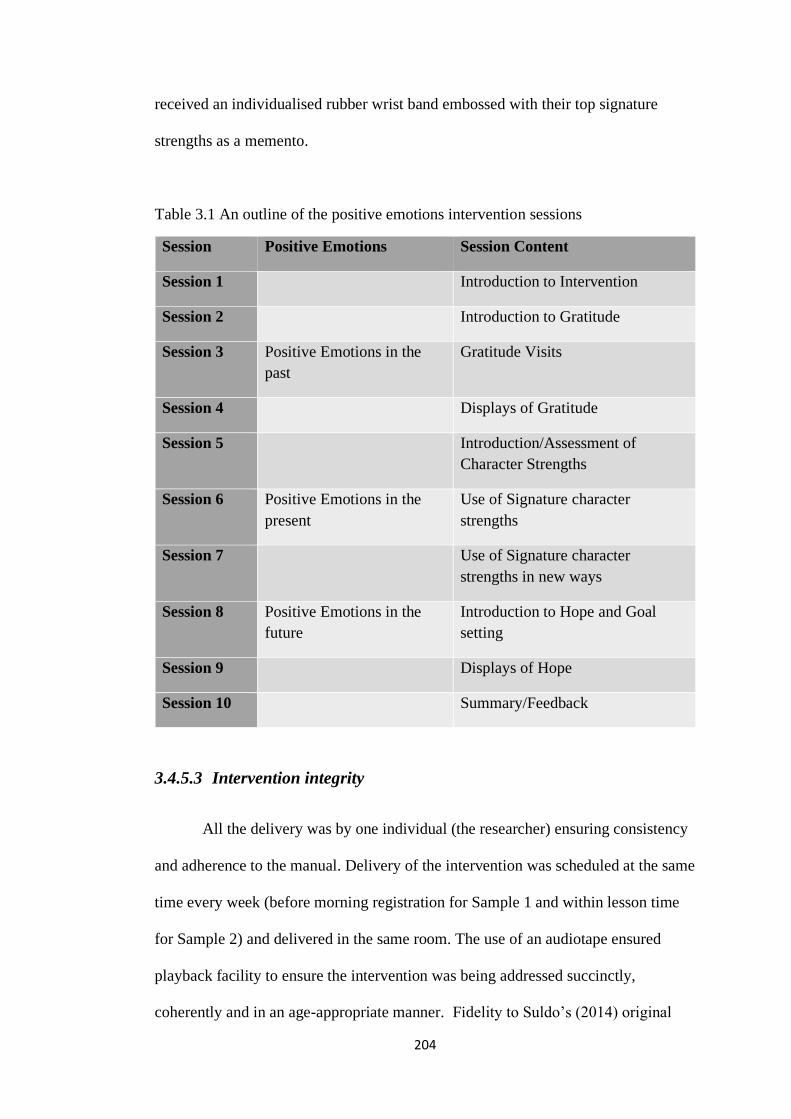
204
received an individualised rubber wrist band embossed with their top signature
strengths as a memento.
Table 3.1 An outline of the positive emotions intervention sessions
Session Positive Emotions Session Content
Session 1 Introduction to Intervention
Session 2 Introduction to Gratitude
Session 3 Positive Emotions in the
past
Gratitude Visits
Session 4 Displays of Gratitude
Session 5 Introduction/Assessment of
Character Strengths
Session 6 Positive Emotions in the
present
Use of Signature character
strengths
Session 7 Use of Signature character
strengths in new ways
Session 8 Positive Emotions in the
future
Introduction to Hope and Goal
setting
Session 9 Displays of Hope
Session 10 Summary/Feedback
3.4.5.3 Intervention integrity
All the delivery was by one individual (the researcher) ensuring consistency
and adherence to the manual. Delivery of the intervention was scheduled at the same
time every week (before morning registration for Sample 1 and within lesson time
for Sample 2) and delivered in the same room. The use of an audiotape ensured
playback facility to ensure the intervention was being addressed succinctly,
coherently and in an age-appropriate manner. Fidelity to Suldo’s (2014) original
205
programme was measured in five ways: (1) adherence, (2) dose, (3) quality of
programme delivery, (4) participant responsiveness and (5) programme
differentiation. The 78 page manual highlighted text (in italics) that had to be
delivered verbatim when explaining concepts, this was checked through playback of
the audiotape to ensure adherence after the session had finished. The dosage of
between 8 and 10 sessions was comparable to the original 10 session programme
implemented by Suldo et al. (2014). Consistency of implementation and the quality
of programme delivery was addressed through having the sessions facilitated by an
individual who was very familiar with the contents of the manual. However,
delivery could have been further improved through collaboration with an observer
familiar with the delivery of interventions. Such an observer could have potentially
advised on numerous matters, for example, if any areas were needing further
attention towards the end of the session and could have used cues to help the
researcher pace activities within the allocated time. That procedure could have
resulted in 100% fidelity with planned session activities. Participant responsiveness
to the entirety of the programme was gauged by the participant feedback. At the last
of the last session, participants completed a one page feedback form that comprised
five open-ended questions which included: ‘What did you like best about the
programme?; What do you feel are some of the most important things that you have
learned through the programme?. Additionally, the form listed the activities that had
taken place and ask participants ‘Which activities that you learned in the sessions
are you likely to continue to do on your own?’. Programme differentiation regarding
content was difficult to achieve on the compulsory verbatim text that had to be
strictly adhered to. However, with relation to the activities, rather than writing about
‘Best Possible self’ in the future, participants made a drawing, this was considered
206
more creative and the evidence suggests is as efficacious as its written counterpart
(Owens and Patterson, 2013). In terms of ensuring instruction was tailored to meet
individual needs, the researcher’s follow-up questions and prompts meant those who
struggled with comprehending some ambiguous items in the assessment could
understand and be fully immersed in the positive learning environment.
3.4.6 Data Analysis
3.4.6.1 Visual analysis
The data was first visually analysed following the guidelines on visual
analysis for single case data by Morley (2015). Visual analysis involves plotting
individual participants’ data, carefully scrutinising the data and making judgments
about whether and to what extent the independent variable (intervention) impacted
the dependent variable (self-esteem).
Several factors are appraised when visually inspecting the data. First, is
changes in the level of the self-esteem over time, for example from pre-invention to
immediate post-intervention. Second is trend, which relates to gradual increases or
decreases in self-esteem levels across observations. If self-esteem starts increasing
or decreasing with a change in conditions, then again this suggests that the
intervention had an effect. It can be especially noticeable when a trend changes
direction. Third is latency, which is the time it takes for self-esteem levels to begin
changing after the invention. In general, if a change in self-esteem level begins
shortly after the intervention, this implies that the intervention was responsible.
Inferential statistics are not typically utilised in visual analysis.
207
3.4.6.2 Statistical analysis
Effect sizes were calculated, giving a standardised, scale-free measure of a
relative size of the effect of an intervention and is typically assessed using Cohen’s
(1988) d, which is calculated by subtracting the mean pre-test score from the mean
post-test score and dividing the result by the mean standard deviation. Cohen
(1988) interprets effect sizes 0.20 to 0.50 as small, 0.50 to 0.80 as medium and
effect sizes of 0.80 and above as large.
TAU-U analysis was performed using the outline programme www.
singlecaseresearch.org/calculators/tau-u. A non-parametric technique, TAU-U is a
combination of Kendall Tau and Mann Whitney U test. Developed by Parker,
Vannest, Davis and Sauber (2011), TAU-U is described in Morley (2015) as a
technique to statistically analyse data in small-N designs. It gives a percentage of
non-overlap of data points between different phases (pre-intervention, end of
intervention, 6 month post-intervention and 9 or 12 month post-intervention) to
explore if there is a change in scores between phases. A significant difference
between phases shows that self-esteem scores in each phase are significantly
different. The direction of the effect determines whether the intervention is effective
at improving self-esteem. Graphical representations were used to compare pre-
intervention, end of intervention and the two follow-up phases and to compare
visual analysis to the statistical results.
Pre-intervention, end of intervention and the two follow-up assessments
were also examined to determine whether individual participants met criteria for
reliable change (Jacobson & Traux, 1991). In formulaic terms, a pre-test baseline
score from an outcome measure is subtracted from the post-test score, and the result
is divided by the standard error of difference of the outcome measure.
208
The reliable change index (RCI, Jacobson and Truax, 1991) was used to
calculate whether the difference between participants’ pre- and post-treatment
scores on the CFSEI-3 showed reliable change beyond what would be expected
from measurement error. For an individual to have made a reliable change, their
change score must be larger than the RCI value. RCI values are dependent on the
reliability of the specific assessment or domain measure (academic, general,
parental, social, personal and global) under investigation and the specific samples
dataset of results. In other words, for Sample 1, an increase in a participant’s
academic self-esteem scores of more than 2.04 points would represent a reliable
change within academic domain, however an increase of more than 4.12 points in
general self-esteem scores would be required to constitute a reliable change in
general self-esteem.
In order to calculate reliable change, reliability scores (Cronbach’s alpha)
were taken from the original scale development paper and manual as academic self-
esteem α = .81, general self-esteem α = .80, parental self-esteem α = .79, social self-
esteem α =.77, and personal self-esteem α =.86. Global self-esteem α = .93.
The graphical output of the RCI analysis are shown in the results and were
generated for each subscale using the Leeds Reliable Change Index Calculator
(Morley & Dowzer, 2014). The graphs (see Figures 3.7 to 3.12) reveal the plotted
pre- and post-treatment data points, the line of no change, the RCI (red, parallel
lines) and cut scores. Individual data points are colour coded and the average of all
the data is also shown (Morley & Dowzer, 2014).
Both statistical analyses (TAU-U and reliable change) represent two routes
for analysing the data from these single case designs and when combined with
visual analysis provide a very useful assessment tool (Harrington, & Velicer, 2015).
209
3.5 Results for Sample 1
3.5.1 Visual analysis
Participants’ scores at the four time points are presented in Table 3.2 and
displayed in Figures 3.1-3.6. There was no visual trend for an increase in
academic, general, parental, or social self-esteem due to the intervention. However,
at the end of the intervention there is a visual trend for an increase in both personal
and global self-esteem. Participants D1 and D3 reveal an increase in personal self-
esteem from pre-intervention levels to 12 month post-intervention, whilst, all three
participants show an increase in global self-esteem from pre-intervention to 12
month post-intervention.
However, these direct comparison of pre-intervention to 12 month post-
intervention masks dips either immediately after the intervention or at 6 month
follow-up. It may be suggested that the increase in personal self-esteem scores at the
12 month juncture reflects the latent impact of the intervention specifically upon this
domain which measures an individual’s most intimate perceptions of anxiety and
self-worth and this improvement may feed into an increase in global self-esteem.
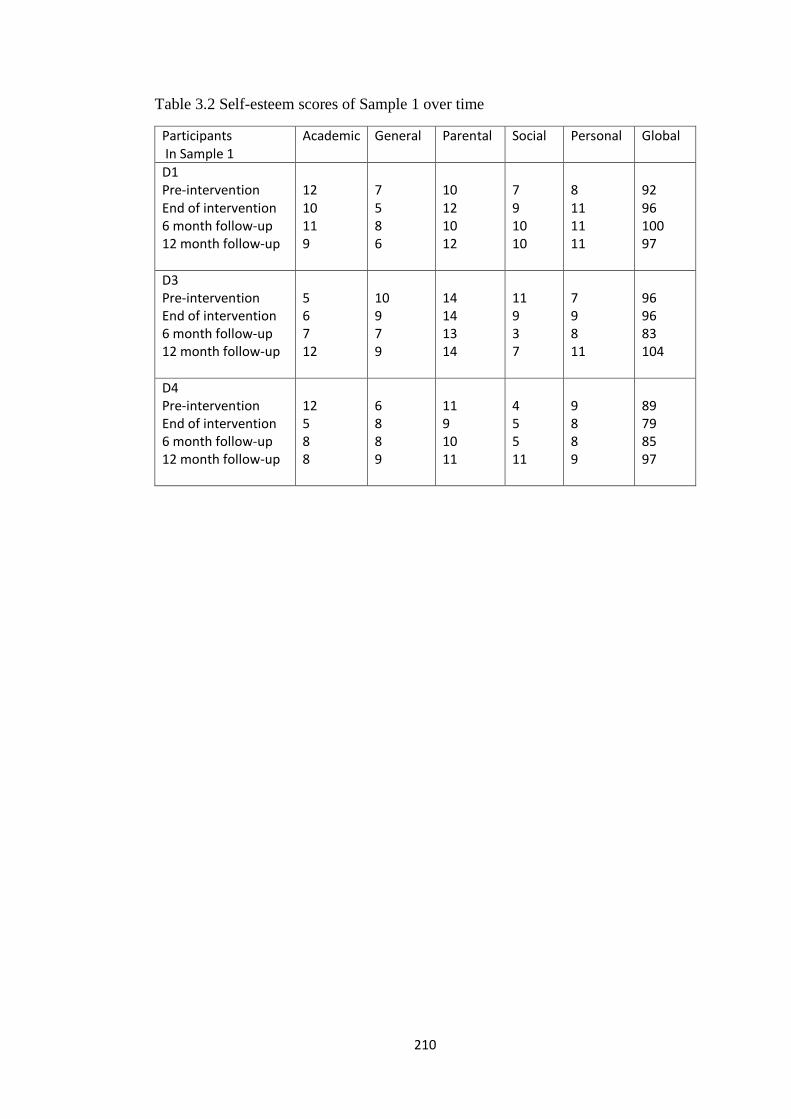
210
Table 3.2 Self-esteem scores of Sample 1 over time
Participants In Sample 1
Academic General Parental Social Personal Global
D1 Pre-intervention End of intervention 6 month follow-up 12 month follow-up
12 10 11 9
7 5 8 6
10 12 10 12
7 9 10 10
8 11 11 11
92 96 100 97
D3 Pre-intervention End of intervention 6 month follow-up 12 month follow-up
5 6 7 12
10 9 7 9
14 14 13 14
11 9 3 7
7 9 8 11
96 96 83 104
D4 Pre-intervention End of intervention 6 month follow-up 12 month follow-up
12 5 8 8
6 8 8 9
11 9 10 11
4 5 5 11
9 8 8 9
89 79 85 97
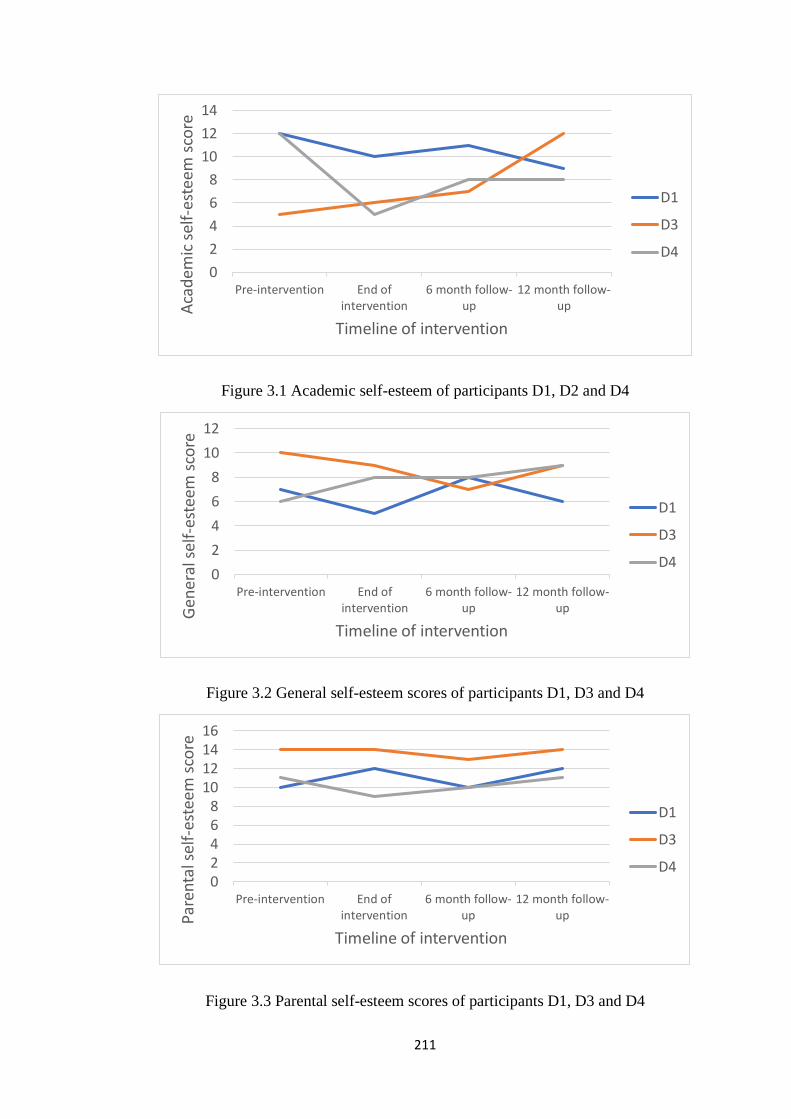
211
Figure 3.1 Academic self-esteem of participants D1, D2 and D4
Figure 3.2 General self-esteem scores of participants D1, D3 and D4
Figure 3.3 Parental self-esteem scores of participants D1, D3 and D4
0
2
4
6
8
10
12
14
Pre-intervention End ofintervention
6 month follow-up
12 month follow-upA
cad
emic
sel
f-es
teem
sco
re
Timeline of intervention
D1
D3
D4
0
2
4
6
8
10
12
Pre-intervention End ofintervention
6 month follow-up
12 month follow-upG
ener
al s
elf-
este
em s
core
Timeline of intervention
D1
D3
D4
02468
10121416
Pre-intervention End ofintervention
6 month follow-up
12 month follow-upP
aren
tal s
elf-
este
em s
core
Timeline of intervention
D1
D3
D4
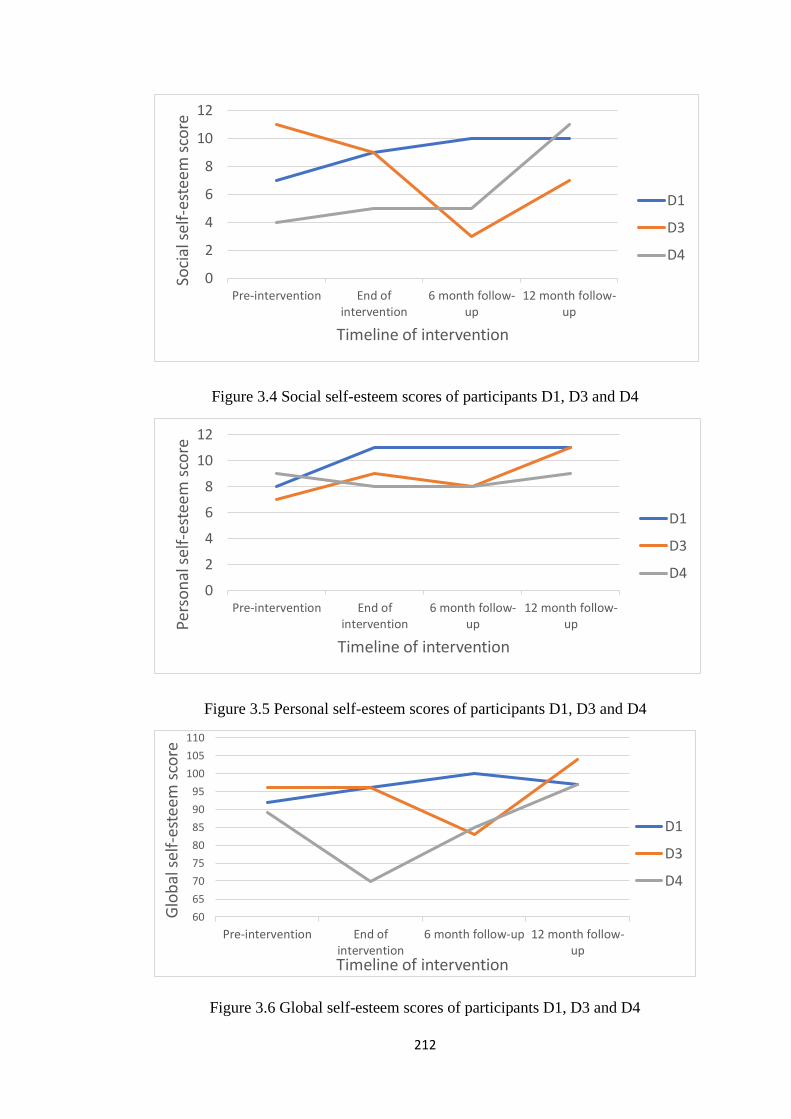
212
Figure 3.4 Social self-esteem scores of participants D1, D3 and D4
Figure 3.5 Personal self-esteem scores of participants D1, D3 and D4
Figure 3.6 Global self-esteem scores of participants D1, D3 and D4
0
2
4
6
8
10
12
Pre-intervention End ofintervention
6 month follow-up
12 month follow-up
Soci
al s
elf-
este
em s
core
Timeline of intervention
D1
D3
D4
0
2
4
6
8
10
12
Pre-intervention End ofintervention
6 month follow-up
12 month follow-upP
erso
nal
sel
f-es
teem
sco
re
Timeline of intervention
D1
D3
D4
60
65
70
75
80
85
90
95
100
105
110
Pre-intervention End ofintervention
6 month follow-up 12 month follow-up
Glo
bal
sel
f-es
teem
sco
re
Timeline of intervention
D1
D3
D4
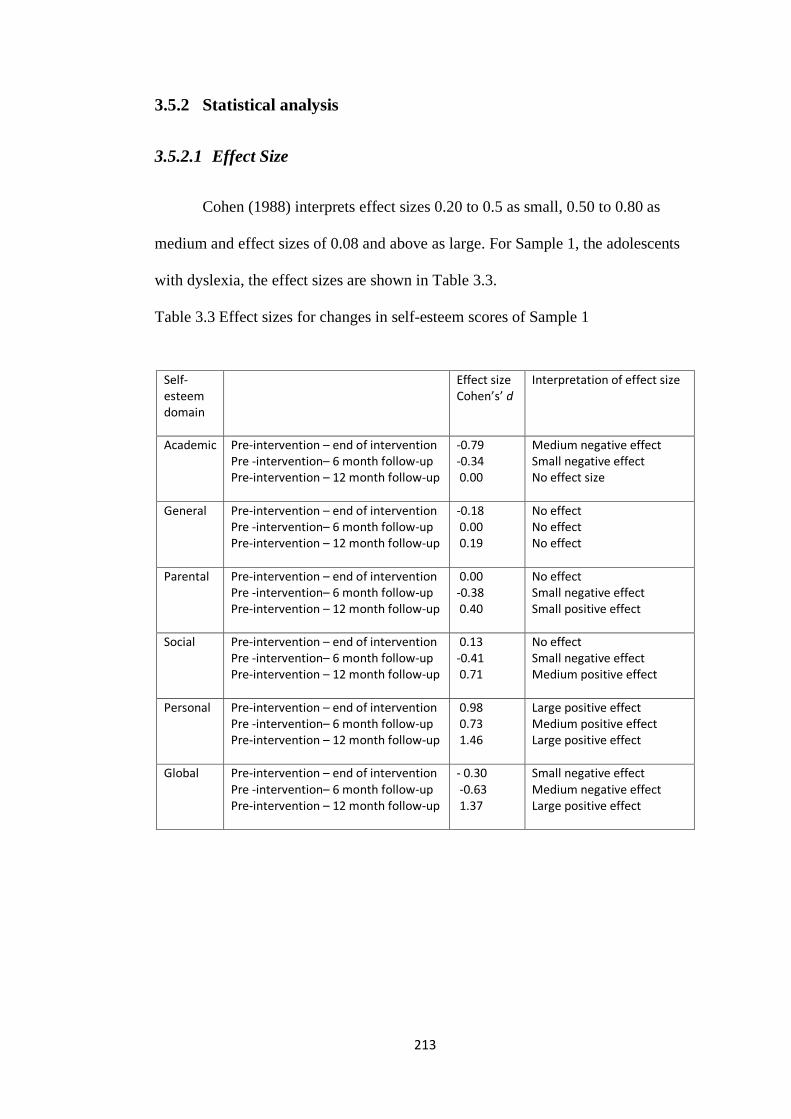
213
3.5.2 Statistical analysis
3.5.2.1 Effect Size
Cohen (1988) interprets effect sizes 0.20 to 0.5 as small, 0.50 to 0.80 as
medium and effect sizes of 0.08 and above as large. For Sample 1, the adolescents
with dyslexia, the effect sizes are shown in Table 3.3.
Table 3.3 Effect sizes for changes in self-esteem scores of Sample 1
Self-esteem domain
Effect size Cohen’s’ d
Interpretation of effect size
Academic Pre-intervention – end of intervention Pre -intervention– 6 month follow-up Pre-intervention – 12 month follow-up
-0.79 -0.34 0.00
Medium negative effect Small negative effect No effect size
General Pre-intervention – end of intervention Pre -intervention– 6 month follow-up Pre-intervention – 12 month follow-up
-0.18 0.00 0.19
No effect No effect No effect
Parental Pre-intervention – end of intervention Pre -intervention– 6 month follow-up Pre-intervention – 12 month follow-up
0.00 -0.38 0.40
No effect Small negative effect Small positive effect
Social Pre-intervention – end of intervention Pre -intervention– 6 month follow-up Pre-intervention – 12 month follow-up
0.13 -0.41 0.71
No effect Small negative effect Medium positive effect
Personal Pre-intervention – end of intervention Pre -intervention– 6 month follow-up Pre-intervention – 12 month follow-up
0.98 0.73 1.46
Large positive effect Medium positive effect Large positive effect
Global Pre-intervention – end of intervention Pre -intervention– 6 month follow-up Pre-intervention – 12 month follow-up
- 0.30 -0.63 1.37
Small negative effect Medium negative effect Large positive effect
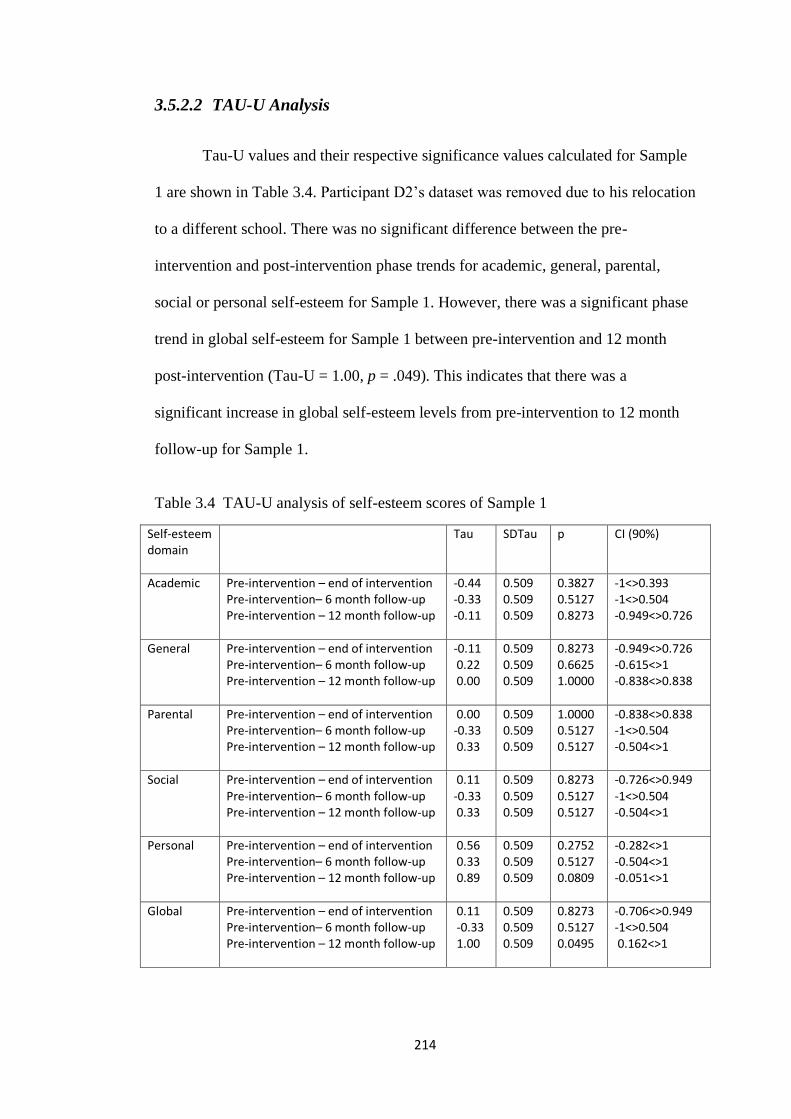
214
3.5.2.2 TAU-U Analysis
Tau-U values and their respective significance values calculated for Sample
1 are shown in Table 3.4. Participant D2’s dataset was removed due to his relocation
to a different school. There was no significant difference between the pre-
intervention and post-intervention phase trends for academic, general, parental,
social or personal self-esteem for Sample 1. However, there was a significant phase
trend in global self-esteem for Sample 1 between pre-intervention and 12 month
post-intervention (Tau-U = 1.00, p = .049). This indicates that there was a
significant increase in global self-esteem levels from pre-intervention to 12 month
follow-up for Sample 1.
Table 3.4 TAU-U analysis of self-esteem scores of Sample 1
Self-esteem domain
Tau SDTau p CI (90%)
Academic Pre-intervention – end of intervention Pre-intervention– 6 month follow-up Pre-intervention – 12 month follow-up
-0.44 -0.33 -0.11
0.509 0.509 0.509
0.3827 0.5127 0.8273
-1<>0.393 -1<>0.504 -0.949<>0.726
General Pre-intervention – end of intervention Pre-intervention– 6 month follow-up Pre-intervention – 12 month follow-up
-0.11 0.22 0.00
0.509 0.509 0.509
0.8273 0.6625 1.0000
-0.949<>0.726 -0.615<>1 -0.838<>0.838
Parental Pre-intervention – end of intervention Pre-intervention– 6 month follow-up Pre-intervention – 12 month follow-up
0.00 -0.33 0.33
0.509 0.509 0.509
1.0000 0.5127 0.5127
-0.838<>0.838 -1<>0.504 -0.504<>1
Social Pre-intervention – end of intervention Pre-intervention– 6 month follow-up Pre-intervention – 12 month follow-up
0.11 -0.33 0.33
0.509 0.509 0.509
0.8273 0.5127 0.5127
-0.726<>0.949 -1<>0.504 -0.504<>1
Personal Pre-intervention – end of intervention Pre-intervention– 6 month follow-up Pre-intervention – 12 month follow-up
0.56 0.33 0.89
0.509 0.509 0.509
0.2752 0.5127 0.0809
-0.282<>1 -0.504<>1 -0.051<>1
Global Pre-intervention – end of intervention Pre-intervention– 6 month follow-up Pre-intervention – 12 month follow-up
0.11 -0.33 1.00
0.509 0.509 0.509
0.8273 0.5127 0.0495
-0.706<>0.949 -1<>0.504 0.162<>1
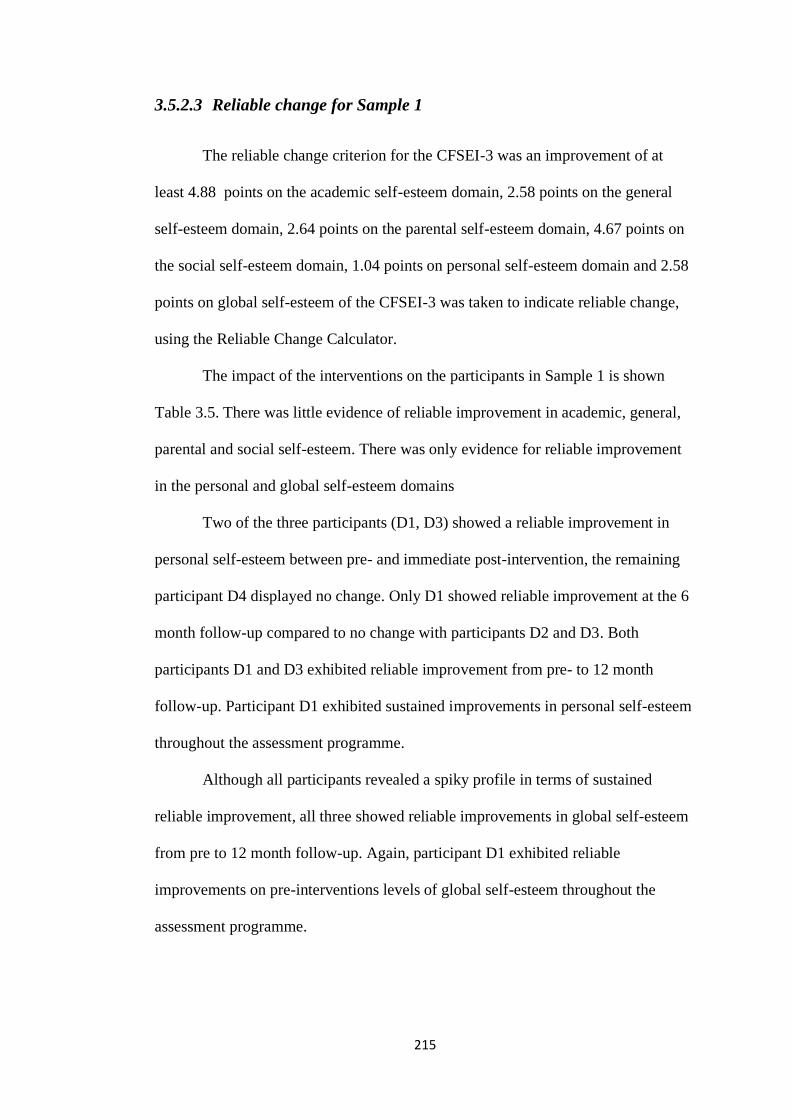
215
3.5.2.3 Reliable change for Sample 1
The reliable change criterion for the CFSEI-3 was an improvement of at
least 4.88 points on the academic self-esteem domain, 2.58 points on the general
self-esteem domain, 2.64 points on the parental self-esteem domain, 4.67 points on
the social self-esteem domain, 1.04 points on personal self-esteem domain and 2.58
points on global self-esteem of the CFSEI-3 was taken to indicate reliable change,
using the Reliable Change Calculator.
The impact of the interventions on the participants in Sample 1 is shown
Table 3.5. There was little evidence of reliable improvement in academic, general,
parental and social self-esteem. There was only evidence for reliable improvement
in the personal and global self-esteem domains
Two of the three participants (D1, D3) showed a reliable improvement in
personal self-esteem between pre- and immediate post-intervention, the remaining
participant D4 displayed no change. Only D1 showed reliable improvement at the 6
month follow-up compared to no change with participants D2 and D3. Both
participants D1 and D3 exhibited reliable improvement from pre- to 12 month
follow-up. Participant D1 exhibited sustained improvements in personal self-esteem
throughout the assessment programme.
Although all participants revealed a spiky profile in terms of sustained
reliable improvement, all three showed reliable improvements in global self-esteem
from pre to 12 month follow-up. Again, participant D1 exhibited reliable
improvements on pre-interventions levels of global self-esteem throughout the
assessment programme.
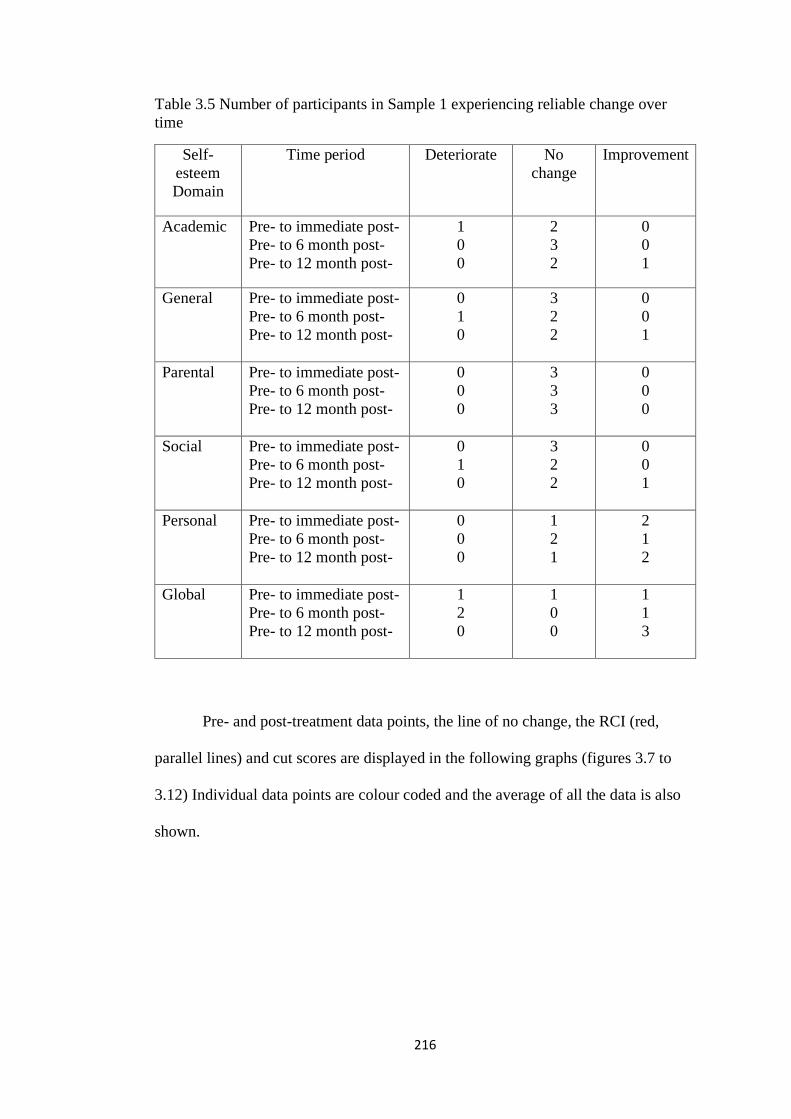
216
Table 3.5 Number of participants in Sample 1 experiencing reliable change over
time
Self-
esteem
Domain
Time period Deteriorate No
change
Improvement
Academic Pre- to immediate post-
Pre- to 6 month post-
Pre- to 12 month post-
1
0
0
2
3
2
0
0
1
General Pre- to immediate post-
Pre- to 6 month post-
Pre- to 12 month post-
0
1
0
3
2
2
0
0
1
Parental Pre- to immediate post-
Pre- to 6 month post-
Pre- to 12 month post-
0
0
0
3
3
3
0
0
0
Social Pre- to immediate post-
Pre- to 6 month post-
Pre- to 12 month post-
0
1
0
3
2
2
0
0
1
Personal Pre- to immediate post-
Pre- to 6 month post-
Pre- to 12 month post-
0
0
0
1
2
1
2
1
2
Global Pre- to immediate post-
Pre- to 6 month post-
Pre- to 12 month post-
1
2
0
1
0
0
1
1
3
Pre- and post-treatment data points, the line of no change, the RCI (red,
parallel lines) and cut scores are displayed in the following graphs (figures 3.7 to
3.12) Individual data points are colour coded and the average of all the data is also
shown.
217
Change in academic self-esteem scores over time
Figure 3.7a Change in academic self-esteem scores from pre- to immediate post-
intervention
Figure 3.7b Change in academic self-esteem scores from pre- to 6 month post-
intervention
Figure 3.7c Change in academic self-esteem scores from pre- to 12 month post-
intervention
0
5
10
15
20
0 5 10 15 20
Po
st-t
reat
men
t
Pre-treatment
Average clients score pre-and post-treatment
Line of no change
reliable change
no change
deteriorate
0
5
10
15
20
0 5 10 15 20
Po
st-t
reat
men
t
Pre-treatment
Average clients score pre-and post-treatment
Line of no change
reliable change
no change
deteriorate
0
5
10
15
20
0 5 10 15 20
Po
st-t
reat
men
t
Pre-treatment
Average clients score pre-and post-treatment
Line of no change
reliable change
no change
deteriorate
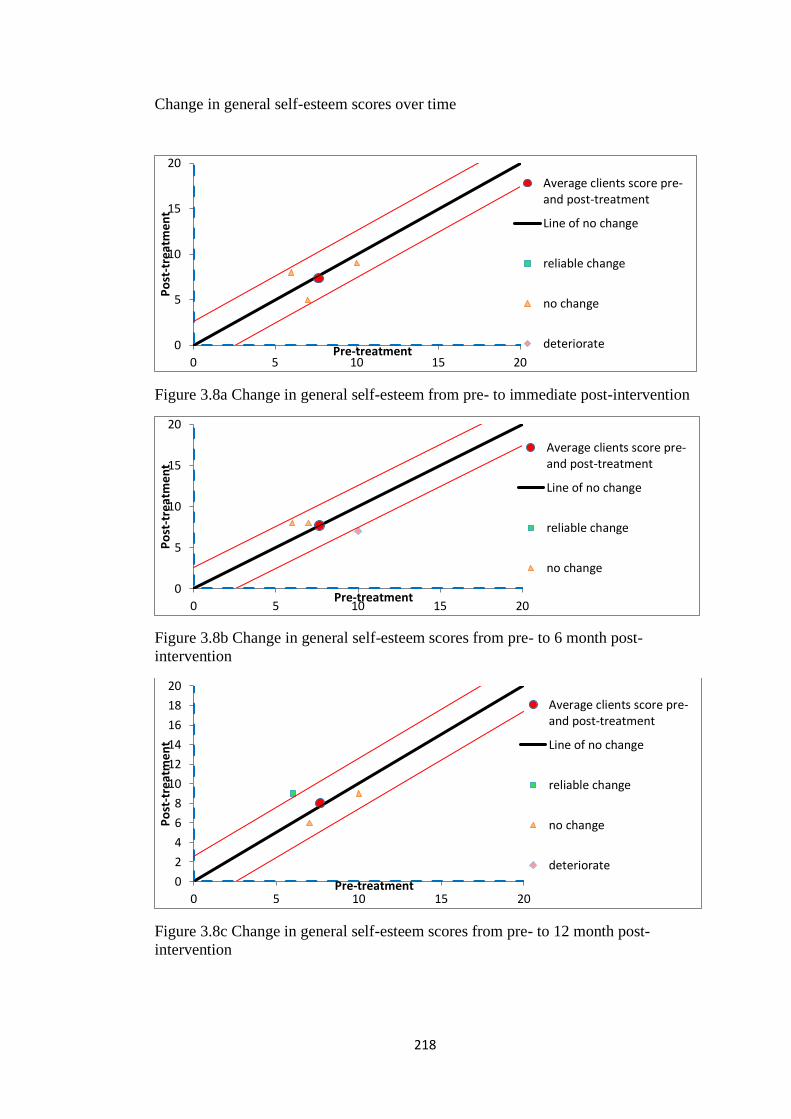
218
Change in general self-esteem scores over time
Figure 3.8a Change in general self-esteem from pre- to immediate post-intervention
Figure 3.8b Change in general self-esteem scores from pre- to 6 month post-
intervention
Figure 3.8c Change in general self-esteem scores from pre- to 12 month post-
intervention
0
5
10
15
20
0 5 10 15 20
Po
st-t
reat
men
t
Pre-treatment
Average clients score pre-and post-treatment
Line of no change
reliable change
no change
deteriorate
0
5
10
15
20
0 5 10 15 20
Po
st-t
reat
men
t
Pre-treatment
Average clients score pre-and post-treatment
Line of no change
reliable change
no change
0
2
4
6
8
10
12
14
16
18
20
0 5 10 15 20
Po
st-t
reat
men
t
Pre-treatment
Average clients score pre-and post-treatment
Line of no change
reliable change
no change
deteriorate
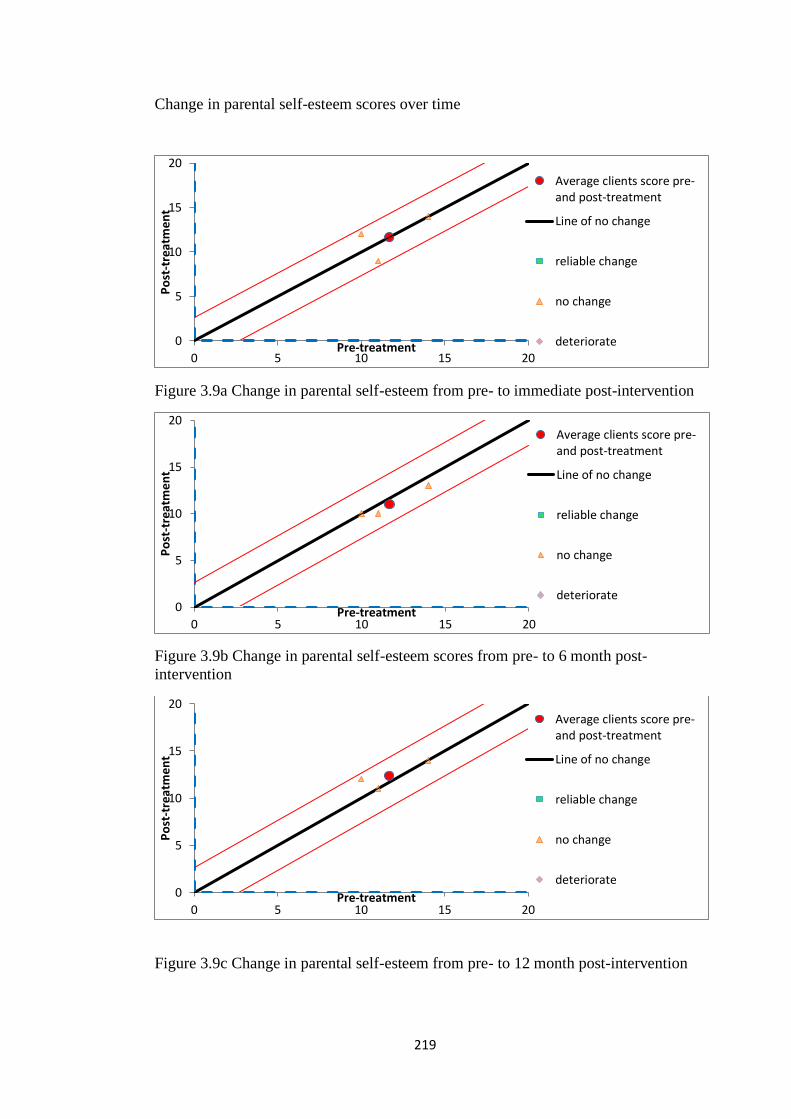
219
Change in parental self-esteem scores over time
Figure 3.9a Change in parental self-esteem from pre- to immediate post-intervention
Figure 3.9b Change in parental self-esteem scores from pre- to 6 month post-
intervention
Figure 3.9c Change in parental self-esteem from pre- to 12 month post-intervention
0
5
10
15
20
0 5 10 15 20
Po
st-t
reat
men
t
Pre-treatment
Average clients score pre-and post-treatment
Line of no change
reliable change
no change
deteriorate
0
5
10
15
20
0 5 10 15 20
Po
st-t
reat
men
t
Pre-treatment
Average clients score pre-and post-treatment
Line of no change
reliable change
no change
deteriorate
0
5
10
15
20
0 5 10 15 20
Po
st-t
reat
men
t
Pre-treatment
Average clients score pre-and post-treatment
Line of no change
reliable change
no change
deteriorate
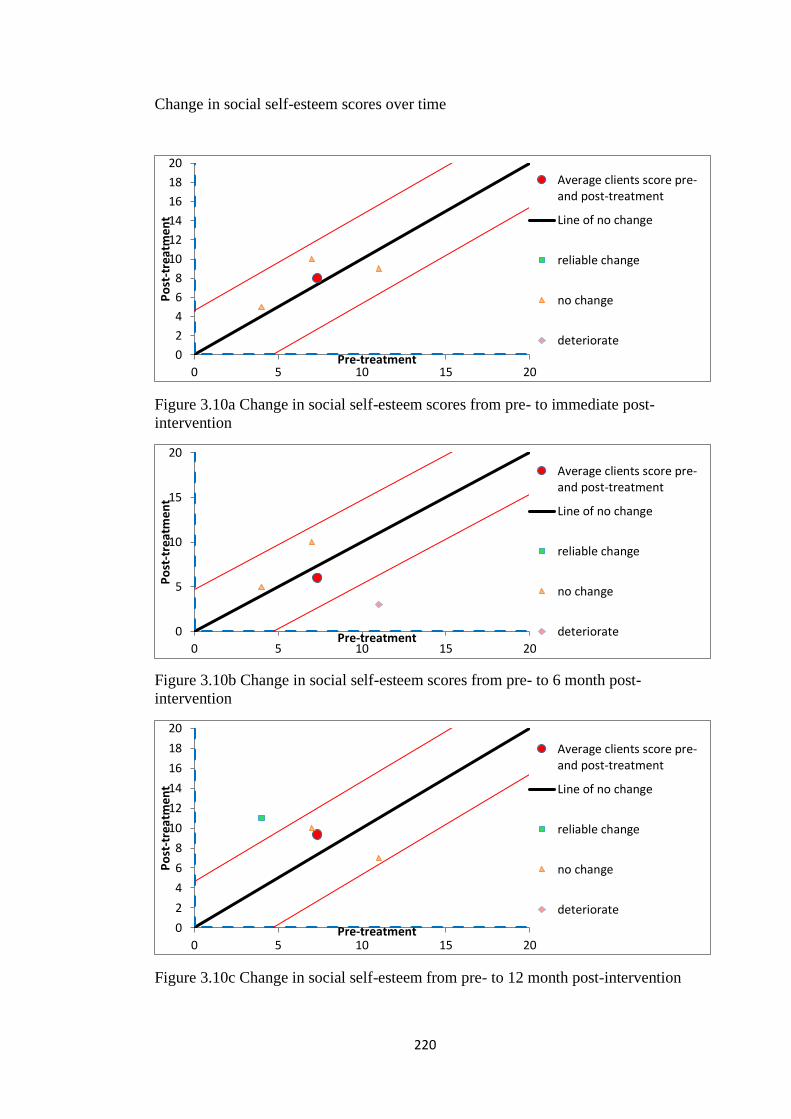
220
Change in social self-esteem scores over time
Figure 3.10a Change in social self-esteem scores from pre- to immediate post-
intervention
Figure 3.10b Change in social self-esteem scores from pre- to 6 month post-
intervention
Figure 3.10c Change in social self-esteem from pre- to 12 month post-intervention
0
2
4
6
8
10
12
14
16
18
20
0 5 10 15 20
Po
st-t
reat
men
t
Pre-treatment
Average clients score pre-and post-treatment
Line of no change
reliable change
no change
deteriorate
0
5
10
15
20
0 5 10 15 20
Po
st-t
reat
men
t
Pre-treatment
Average clients score pre-and post-treatment
Line of no change
reliable change
no change
deteriorate
0
2
4
6
8
10
12
14
16
18
20
0 5 10 15 20
Po
st-t
reat
men
t
Pre-treatment
Average clients score pre-and post-treatment
Line of no change
reliable change
no change
deteriorate
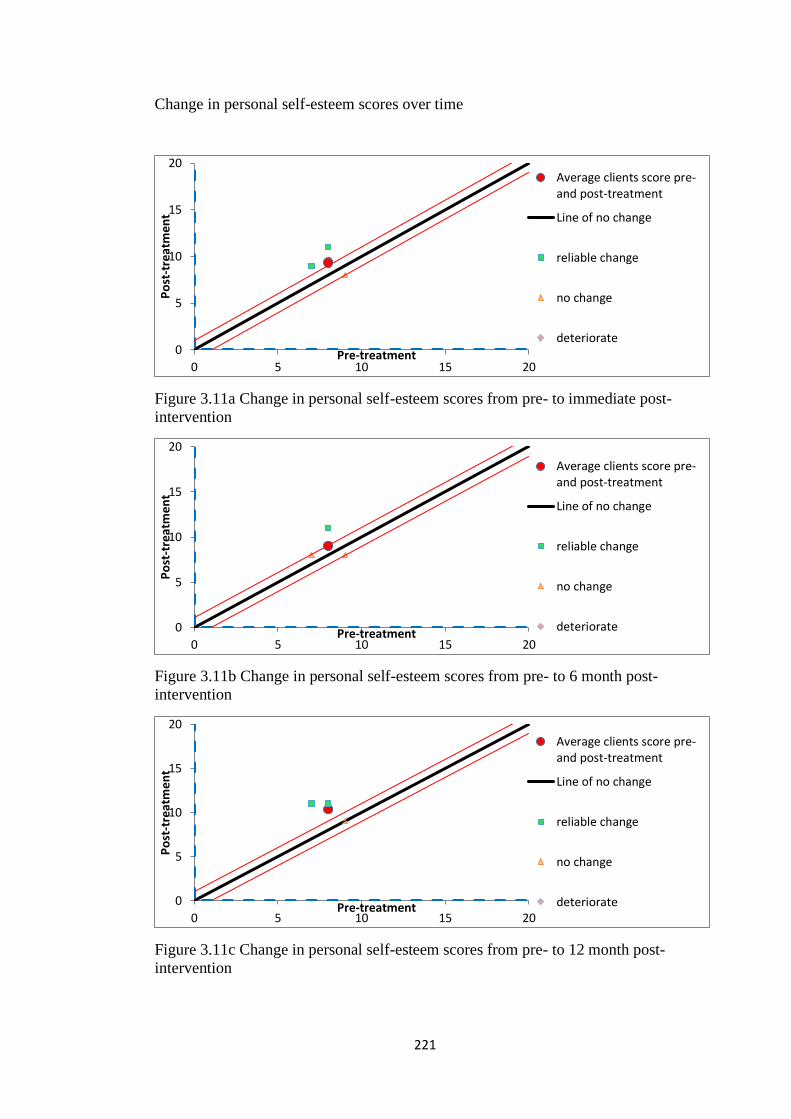
221
Change in personal self-esteem scores over time
Figure 3.11a Change in personal self-esteem scores from pre- to immediate post-
intervention
Figure 3.11b Change in personal self-esteem scores from pre- to 6 month post-
intervention
Figure 3.11c Change in personal self-esteem scores from pre- to 12 month post-
intervention
0
5
10
15
20
0 5 10 15 20
Po
st-t
reat
men
t
Pre-treatment
Average clients score pre-and post-treatment
Line of no change
reliable change
no change
deteriorate
0
5
10
15
20
0 5 10 15 20
Po
st-t
reat
men
t
Pre-treatment
Average clients score pre-and post-treatment
Line of no change
reliable change
no change
deteriorate
0
5
10
15
20
0 5 10 15 20
Po
st-t
reat
men
t
Pre-treatment
Average clients score pre-and post-treatment
Line of no change
reliable change
no change
deteriorate
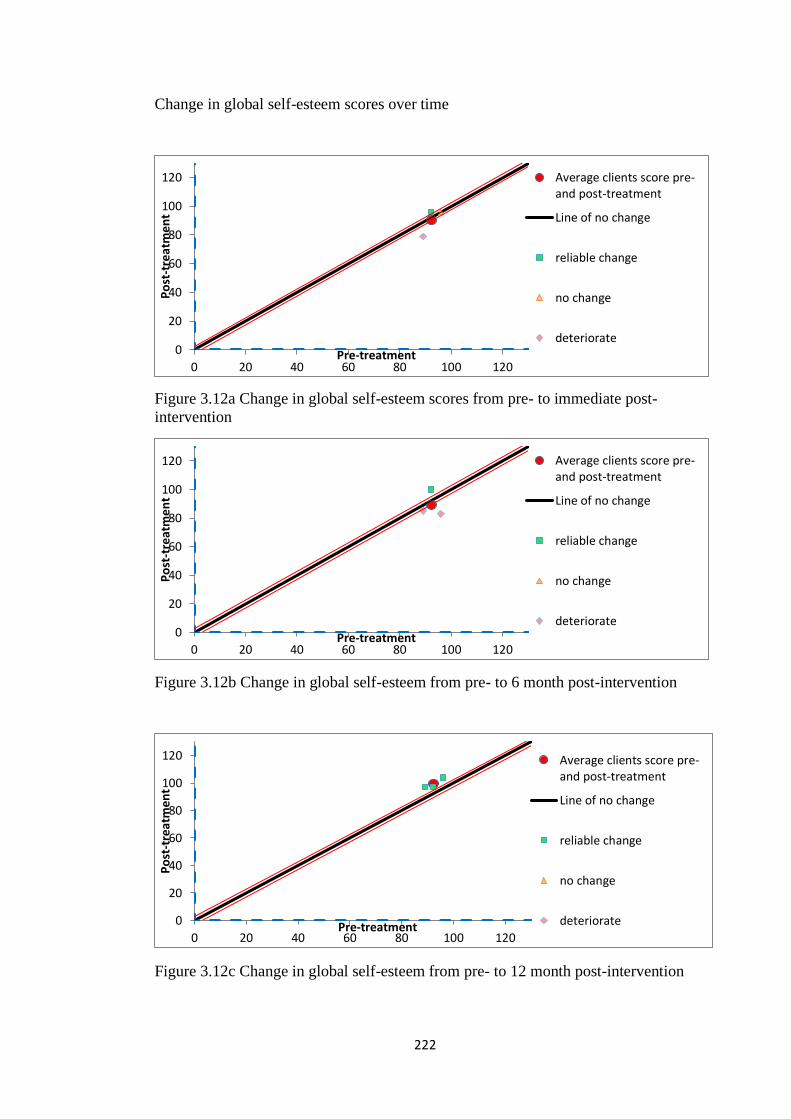
222
Change in global self-esteem scores over time
Figure 3.12a Change in global self-esteem scores from pre- to immediate post-
intervention
Figure 3.12b Change in global self-esteem from pre- to 6 month post-intervention
Figure 3.12c Change in global self-esteem from pre- to 12 month post-intervention
0
20
40
60
80
100
120
0 20 40 60 80 100 120
Po
st-t
reat
men
t
Pre-treatment
Average clients score pre-and post-treatment
Line of no change
reliable change
no change
deteriorate
0
20
40
60
80
100
120
0 20 40 60 80 100 120
Po
st-t
reat
men
t
Pre-treatment
Average clients score pre-and post-treatment
Line of no change
reliable change
no change
deteriorate
0
20
40
60
80
100
120
0 20 40 60 80 100 120
Po
st-t
reat
men
t
Pre-treatment
Average clients score pre-and post-treatment
Line of no change
reliable change
no change
deteriorate
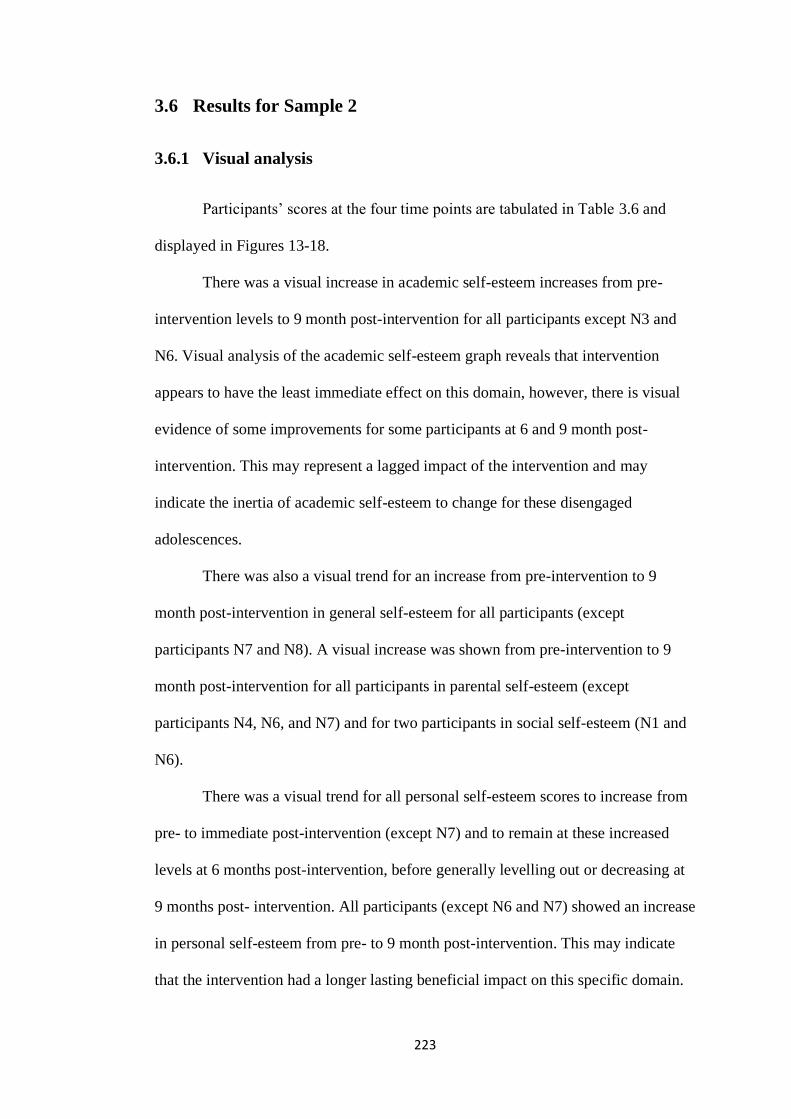
223
3.6 Results for Sample 2
3.6.1 Visual analysis
Participants’ scores at the four time points are tabulated in Table 3.6 and
displayed in Figures 13-18.
There was a visual increase in academic self-esteem increases from pre-
intervention levels to 9 month post-intervention for all participants except N3 and
N6. Visual analysis of the academic self-esteem graph reveals that intervention
appears to have the least immediate effect on this domain, however, there is visual
evidence of some improvements for some participants at 6 and 9 month post-
intervention. This may represent a lagged impact of the intervention and may
indicate the inertia of academic self-esteem to change for these disengaged
adolescences.
There was also a visual trend for an increase from pre-intervention to 9
month post-intervention in general self-esteem for all participants (except
participants N7 and N8). A visual increase was shown from pre-intervention to 9
month post-intervention for all participants in parental self-esteem (except
participants N4, N6, and N7) and for two participants in social self-esteem (N1 and
N6).
There was a visual trend for all personal self-esteem scores to increase from
pre- to immediate post-intervention (except N7) and to remain at these increased
levels at 6 months post-intervention, before generally levelling out or decreasing at
9 months post- intervention. All participants (except N6 and N7) showed an increase
in personal self-esteem from pre- to 9 month post-intervention. This may indicate
that the intervention had a longer lasting beneficial impact on this specific domain.
224
There was a visual trend in an immediate increase in global self-esteem from
pre-intervention to immediate post-intervention for six of the eight participants,
participant N6 decreased slightly whilst N7 remained unchanged. This steepest
increase was seen in participant N1.
At 9 month post-intervention six of the eight participants had increased
global self-esteem in comparison to their pre-intervention levels, Participant N6
score had remain unchanged and participant N7 had a decreased global self-esteem
scores.
In general, if a change in self-esteem level begins shortly after the
intervention, this may suggest that the intervention was responsible – this change
appeared to occur predominately for participants N1, N2, N3, N4 and N5. There was
a trend from a change from increasing self-esteem scores to declining self-esteem
scores at 6 months.
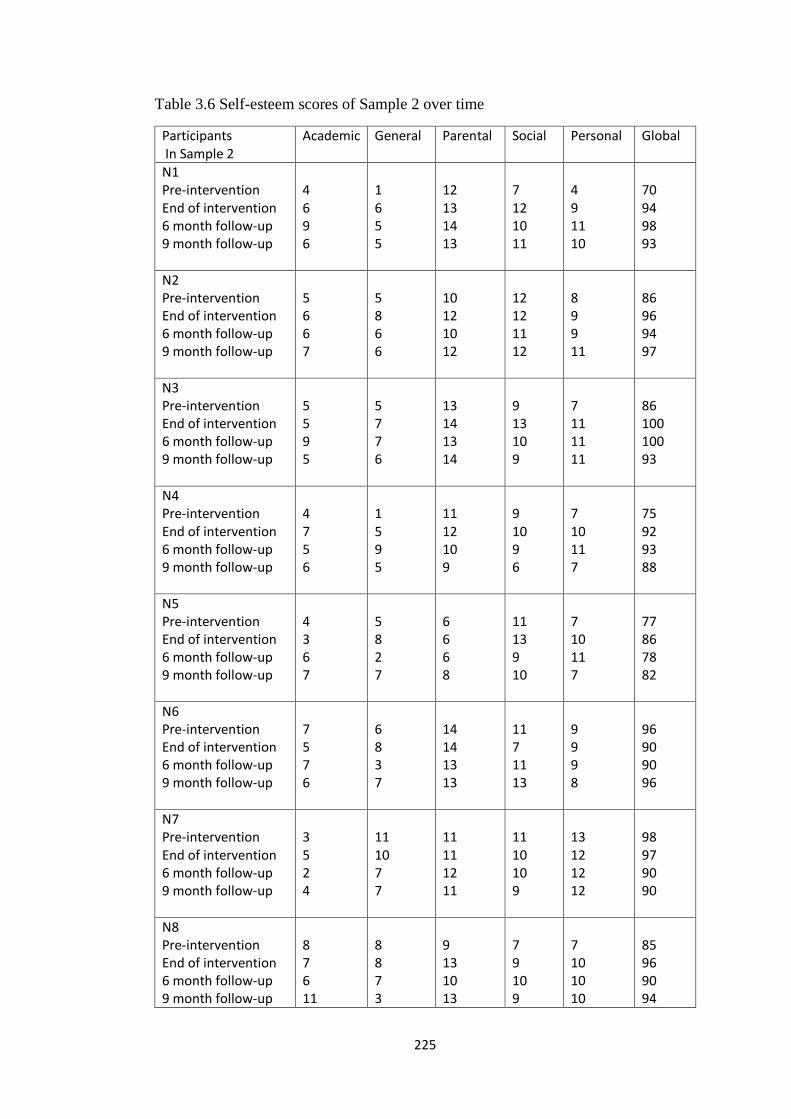
225
Table 3.6 Self-esteem scores of Sample 2 over time
Participants In Sample 2
Academic General Parental Social Personal Global
N1 Pre-intervention End of intervention 6 month follow-up 9 month follow-up
4 6 9 6
1 6 5 5
12 13 14 13
7 12 10 11
4 9 11 10
70 94 98 93
N2 Pre-intervention End of intervention 6 month follow-up 9 month follow-up
5 6 6 7
5 8 6 6
10 12 10 12
12 12 11 12
8 9 9 11
86 96 94 97
N3 Pre-intervention End of intervention 6 month follow-up 9 month follow-up
5 5 9 5
5 7 7 6
13 14 13 14
9 13 10 9
7 11 11 11
86 100 100 93
N4 Pre-intervention End of intervention 6 month follow-up 9 month follow-up
4 7 5 6
1 5 9 5
11 12 10 9
9 10 9 6
7 10 11 7
75 92 93 88
N5 Pre-intervention End of intervention 6 month follow-up 9 month follow-up
4 3 6 7
5 8 2 7
6 6 6 8
11 13 9 10
7 10 11 7
77 86 78 82
N6 Pre-intervention End of intervention 6 month follow-up 9 month follow-up
7 5 7 6
6 8 3 7
14 14 13 13
11 7 11 13
9 9 9 8
96 90 90 96
N7 Pre-intervention End of intervention 6 month follow-up 9 month follow-up
3 5 2 4
11 10 7 7
11 11 12 11
11 10 10 9
13 12 12 12
98 97 90 90
N8 Pre-intervention End of intervention 6 month follow-up 9 month follow-up
8 7 6 11
8 8 7 3
9 13 10 13
7 9 10 9
7 10 10 10
85 96 90 94
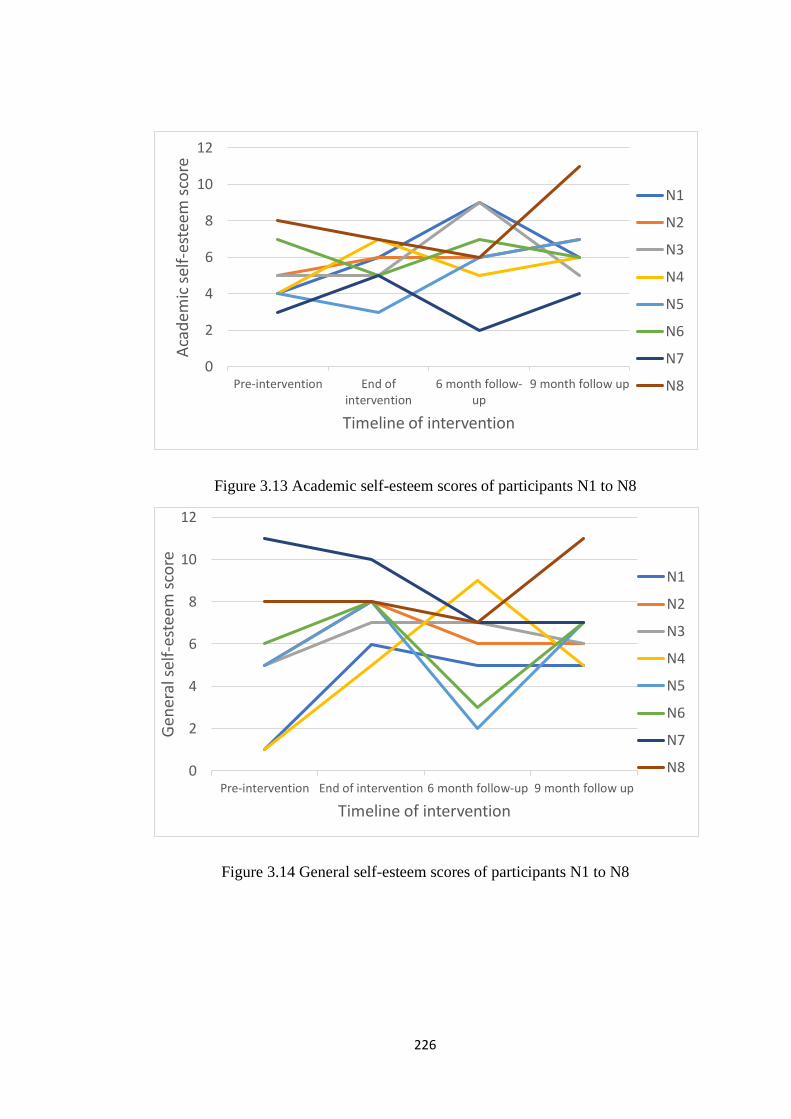
226
Figure 3.13 Academic self-esteem scores of participants N1 to N8
Figure 3.14 General self-esteem scores of participants N1 to N8
0
2
4
6
8
10
12
Pre-intervention End ofintervention
6 month follow-up
9 month follow up
Aca
dem
ic s
elf-
este
em s
core
Timeline of intervention
N1
N2
N3
N4
N5
N6
N7
N8
0
2
4
6
8
10
12
Pre-intervention End of intervention 6 month follow-up 9 month follow up
Gen
eral
sel
f-es
teem
sco
re
Timeline of intervention
N1
N2
N3
N4
N5
N6
N7
N8
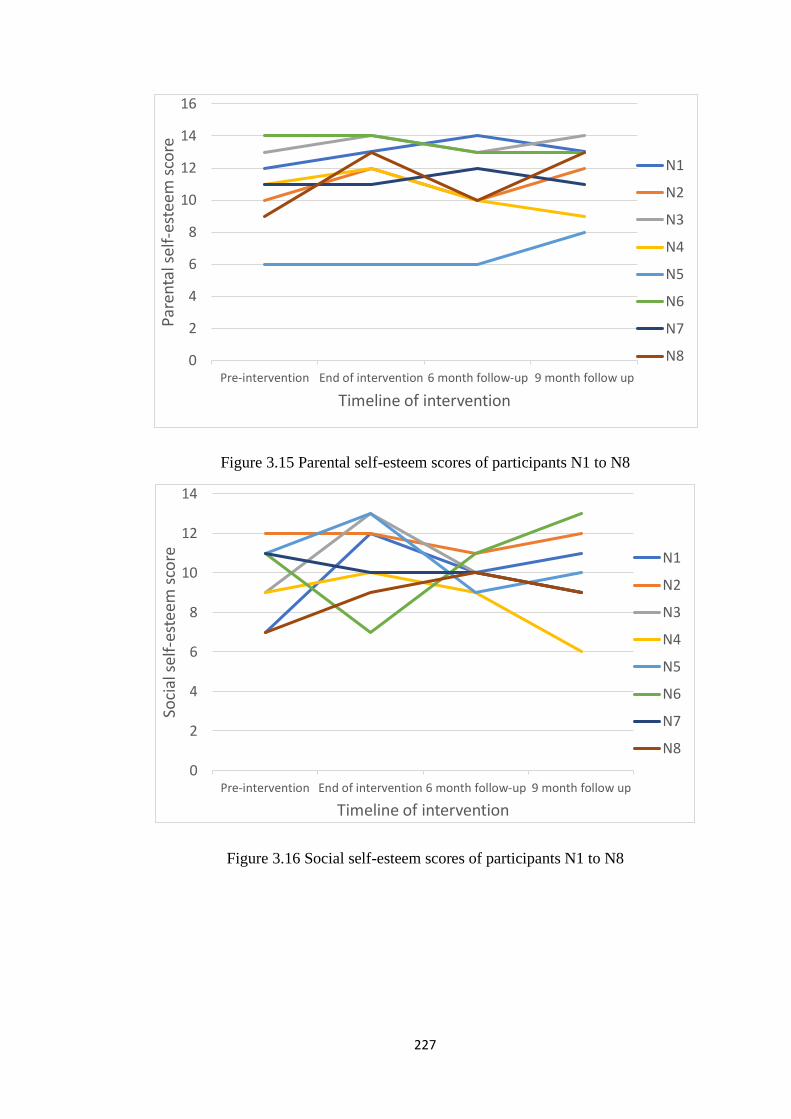
227
Figure 3.15 Parental self-esteem scores of participants N1 to N8
Figure 3.16 Social self-esteem scores of participants N1 to N8
0
2
4
6
8
10
12
14
16
Pre-intervention End of intervention 6 month follow-up 9 month follow up
Par
enta
l sel
f-es
teem
sco
re
Timeline of intervention
N1
N2
N3
N4
N5
N6
N7
N8
0
2
4
6
8
10
12
14
Pre-intervention End of intervention 6 month follow-up 9 month follow up
Soci
al s
elf-
este
em s
core
Timeline of intervention
N1
N2
N3
N4
N5
N6
N7
N8
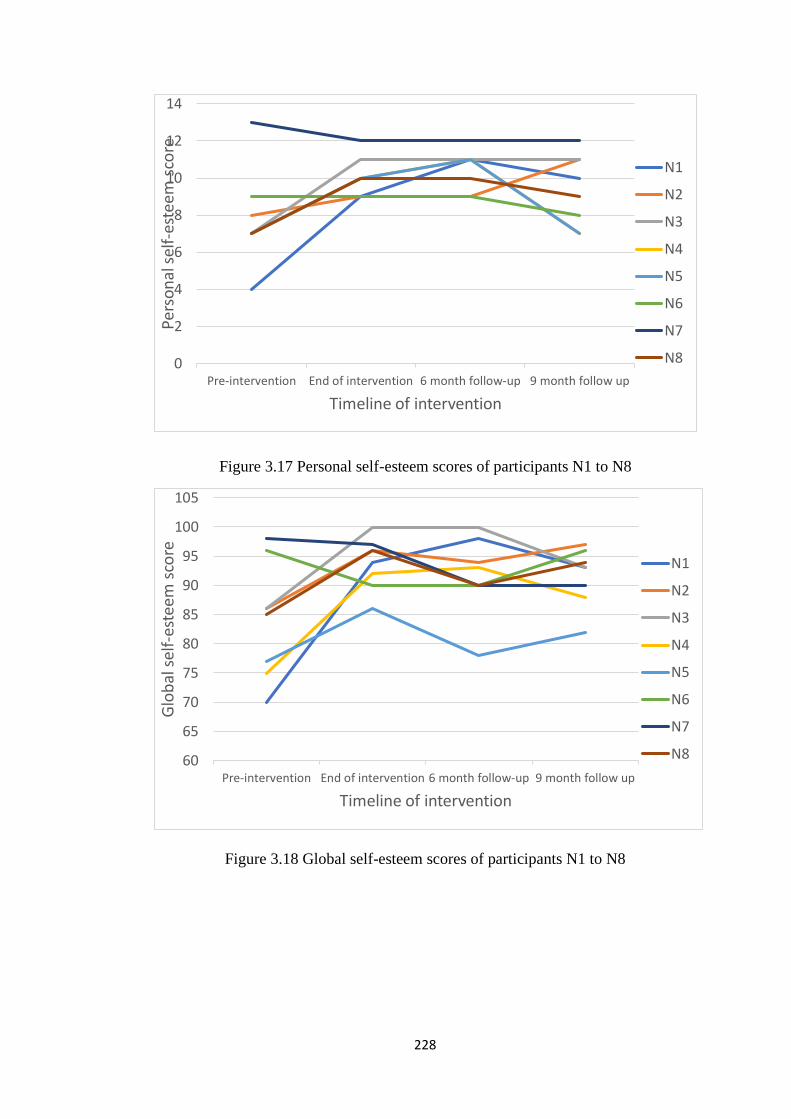
228
Figure 3.17 Personal self-esteem scores of participants N1 to N8
Figure 3.18 Global self-esteem scores of participants N1 to N8
0
2
4
6
8
10
12
14
Pre-intervention End of intervention 6 month follow-up 9 month follow up
Per
son
al s
elf-
este
em s
core
Timeline of intervention
N1
N2
N3
N4
N5
N6
N7
N8
60
65
70
75
80
85
90
95
100
105
Pre-intervention End of intervention 6 month follow-up 9 month follow up
Glo
bal
sel
f-es
teem
sco
re
Timeline of intervention
N1
N2
N3
N4
N5
N6
N7
N8
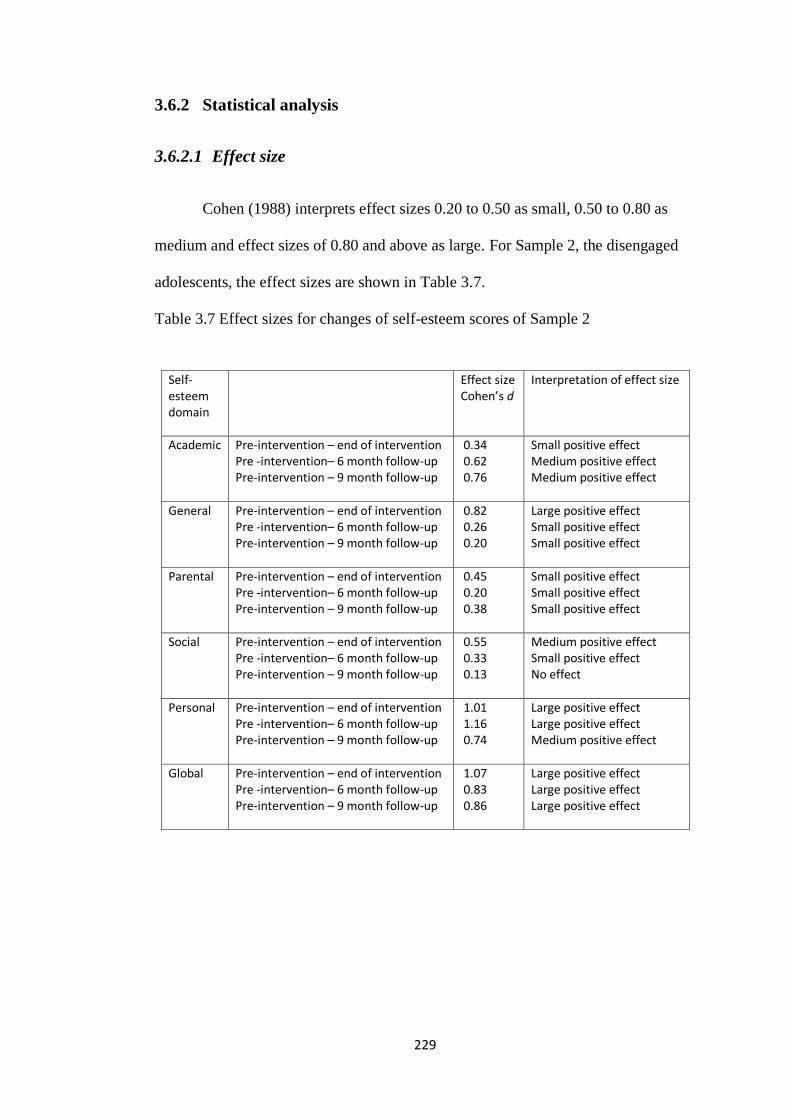
229
3.6.2 Statistical analysis
3.6.2.1 Effect size
Cohen (1988) interprets effect sizes 0.20 to 0.50 as small, 0.50 to 0.80 as
medium and effect sizes of 0.80 and above as large. For Sample 2, the disengaged
adolescents, the effect sizes are shown in Table 3.7.
Table 3.7 Effect sizes for changes of self-esteem scores of Sample 2
Self-esteem domain
Effect size Cohen’s d
Interpretation of effect size
Academic Pre-intervention – end of intervention Pre -intervention– 6 month follow-up Pre-intervention – 9 month follow-up
0.34 0.62 0.76
Small positive effect Medium positive effect Medium positive effect
General Pre-intervention – end of intervention Pre -intervention– 6 month follow-up Pre-intervention – 9 month follow-up
0.82 0.26 0.20
Large positive effect Small positive effect Small positive effect
Parental Pre-intervention – end of intervention Pre -intervention– 6 month follow-up Pre-intervention – 9 month follow-up
0.45 0.20 0.38
Small positive effect Small positive effect Small positive effect
Social Pre-intervention – end of intervention Pre -intervention– 6 month follow-up Pre-intervention – 9 month follow-up
0.55 0.33 0.13
Medium positive effect Small positive effect No effect
Personal Pre-intervention – end of intervention Pre -intervention– 6 month follow-up Pre-intervention – 9 month follow-up
1.01 1.16 0.74
Large positive effect Large positive effect Medium positive effect
Global Pre-intervention – end of intervention Pre -intervention– 6 month follow-up Pre-intervention – 9 month follow-up
1.07 0.83 0.86
Large positive effect Large positive effect Large positive effect
230
3.6.2.2 TAU-U analysis
Tau -U values and their respective significance values calculated for Sample
2 are shown in Table 3.8. There was no significant difference for Sample 2 between
the pre-intervention and post-intervention phase trends for academic, general,
parental or social self-esteem. However, there was a significant phase trend in
personal self-esteem for Sample 2 between pre-intervention and immediate post-
intervention (Tau-U = 0.70, p = .02) and pre-intervention and 6 month post-
intervention (Tau-U = 0.72, p = .02). In addition, a significant difference was noted
in global self-esteem between pre-intervention and immediate post-intervention
(Tau-U = 0.59, p = .046). This indicates that for Sample 2 there was significant
increase in self-esteem levels in both personal and global self-esteem immediately
after the intervention.
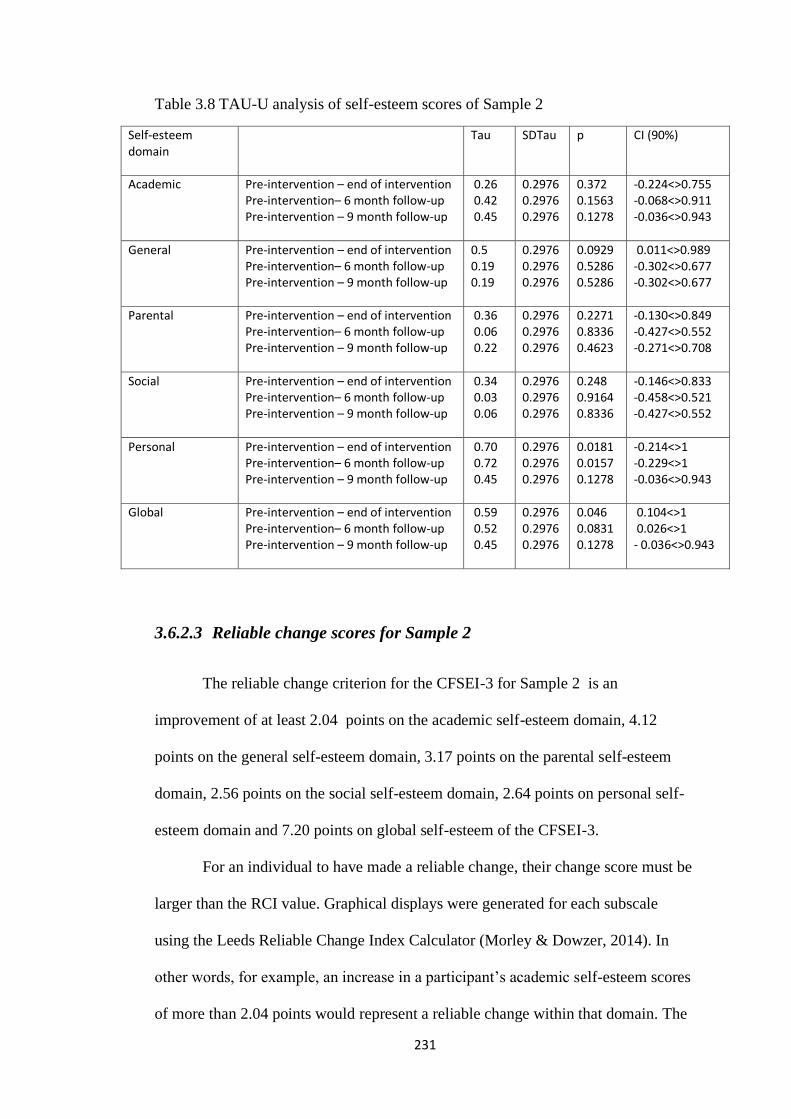
231
Table 3.8 TAU-U analysis of self-esteem scores of Sample 2
Self-esteem domain
Tau SDTau p CI (90%)
Academic Pre-intervention – end of intervention Pre-intervention– 6 month follow-up Pre-intervention – 9 month follow-up
0.26 0.42 0.45
0.2976 0.2976 0.2976
0.372 0.1563 0.1278
-0.224<>0.755 -0.068<>0.911 -0.036<>0.943
General Pre-intervention – end of intervention Pre-intervention– 6 month follow-up Pre-intervention – 9 month follow-up
0.5 0.19 0.19
0.2976 0.2976 0.2976
0.0929 0.5286 0.5286
0.011<>0.989 -0.302<>0.677 -0.302<>0.677
Parental Pre-intervention – end of intervention Pre-intervention– 6 month follow-up Pre-intervention – 9 month follow-up
0.36 0.06 0.22
0.2976 0.2976 0.2976
0.2271 0.8336 0.4623
-0.130<>0.849 -0.427<>0.552 -0.271<>0.708
Social Pre-intervention – end of intervention Pre-intervention– 6 month follow-up Pre-intervention – 9 month follow-up
0.34 0.03 0.06
0.2976 0.2976 0.2976
0.248 0.9164 0.8336
-0.146<>0.833 -0.458<>0.521 -0.427<>0.552
Personal Pre-intervention – end of intervention Pre-intervention– 6 month follow-up Pre-intervention – 9 month follow-up
0.70 0.72 0.45
0.2976 0.2976 0.2976
0.0181 0.0157 0.1278
-0.214<>1 -0.229<>1 -0.036<>0.943
Global Pre-intervention – end of intervention Pre-intervention– 6 month follow-up Pre-intervention – 9 month follow-up
0.59 0.52 0.45
0.2976 0.2976 0.2976
0.046 0.0831 0.1278
0.104<>1 0.026<>1 - 0.036<>0.943
3.6.2.3 Reliable change scores for Sample 2
The reliable change criterion for the CFSEI-3 for Sample 2 is an
improvement of at least 2.04 points on the academic self-esteem domain, 4.12
points on the general self-esteem domain, 3.17 points on the parental self-esteem
domain, 2.56 points on the social self-esteem domain, 2.64 points on personal self-
esteem domain and 7.20 points on global self-esteem of the CFSEI-3.
For an individual to have made a reliable change, their change score must be
larger than the RCI value. Graphical displays were generated for each subscale
using the Leeds Reliable Change Index Calculator (Morley & Dowzer, 2014). In
other words, for example, an increase in a participant’s academic self-esteem scores
of more than 2.04 points would represent a reliable change within that domain. The
232
three graphs for each domain represent the level of change that occurred for each
participant from pre- to post-treatments across each subscale of the questionnaires.
The middle section within the red lines portrays no reliable change, the top left
segment, beyond the red line depicts a reliable improvement, and the bottom right
segment depicts reliable deterioration.
There is little evidence of reliable improvement in academic, general,
parental and social self-esteem (see Table 3.9). An exception was participant N1
whose scores showed reliable improvement in social self-esteem throughout the
programme. There was evidence of reliable improvement in the personal and global
self-esteem domains. Five participants (N1, N3, N4, N5 and N8) showed a reliable
improvement in personal self-esteem between pre- and immediate post-, the
remaining three participants displayed no change. These five participants (N1, N3,
N4, N5 and N8) showed reliable improvement in their pre- to 6 month post-
intervention personal self-esteem scores, with three participants displaying no
change. Between pre- and 9 month post-intervention four participants showed
reliable change (N1, N2, N3 and N8) whilst the other four displayed no change.
Therefore, three participants N1, N3 and N8 exhibited sustained improvements in
personal self-esteem throughout the assessment programme.
Six participants (N1, N2, N3, N4, N5 and N8) of the eight participants
showed a reliable improvement in global self-esteem between pre- and immediate
post-. Four of these participants (N1, N2, N3 and N4) also showed reliable
improvement in their pre- to 6 month post-intervention scores, with three
participants displaying no change and one revealed a reliable deterioration (N7).
Between pre- and 9 month post-intervention four participants showed again showed
reliable change (N1, N2, N4 and N8) whilst three displayed no change, participant
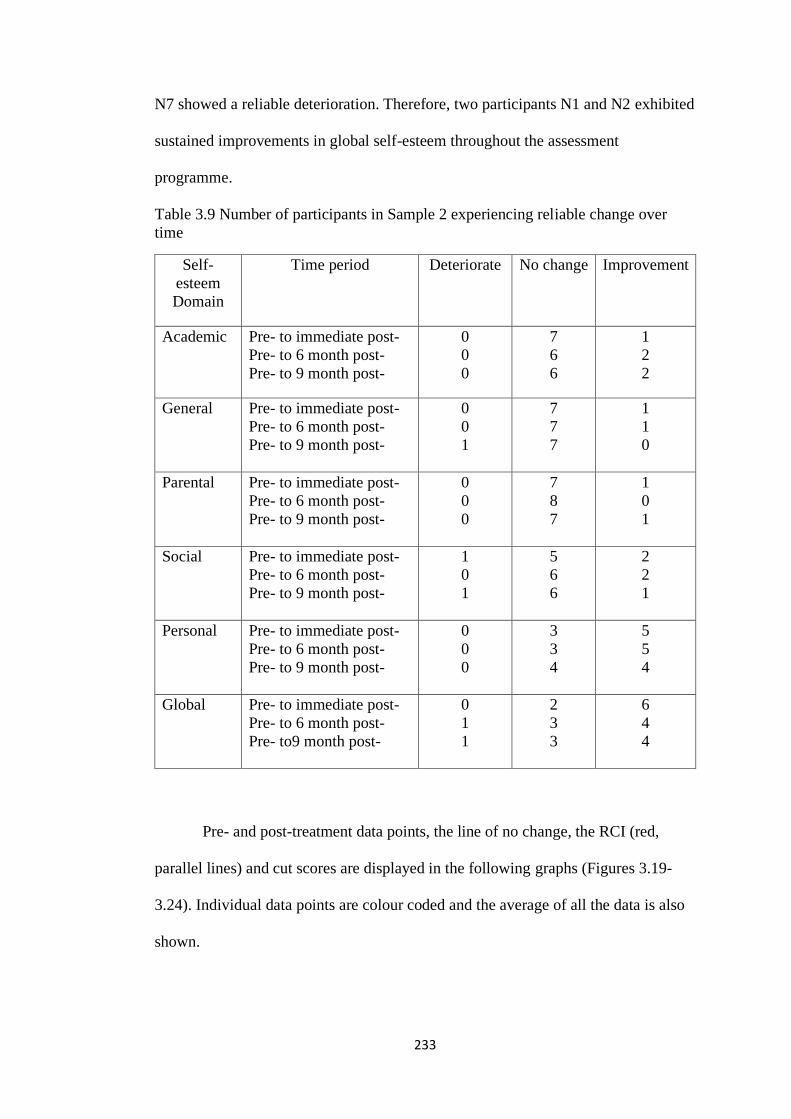
233
N7 showed a reliable deterioration. Therefore, two participants N1 and N2 exhibited
sustained improvements in global self-esteem throughout the assessment
programme.
Table 3.9 Number of participants in Sample 2 experiencing reliable change over
time
Self-
esteem
Domain
Time period Deteriorate No change Improvement
Academic Pre- to immediate post-
Pre- to 6 month post-
Pre- to 9 month post-
0
0
0
7
6
6
1
2
2
General Pre- to immediate post-
Pre- to 6 month post-
Pre- to 9 month post-
0
0
1
7
7
7
1
1
0
Parental Pre- to immediate post-
Pre- to 6 month post-
Pre- to 9 month post-
0
0
0
7
8
7
1
0
1
Social Pre- to immediate post-
Pre- to 6 month post-
Pre- to 9 month post-
1
0
1
5
6
6
2
2
1
Personal Pre- to immediate post-
Pre- to 6 month post-
Pre- to 9 month post-
0
0
0
3
3
4
5
5
4
Global Pre- to immediate post-
Pre- to 6 month post-
Pre- to9 month post-
0
1
1
2
3
3
6
4
4
Pre- and post-treatment data points, the line of no change, the RCI (red,
parallel lines) and cut scores are displayed in the following graphs (Figures 3.19-
3.24). Individual data points are colour coded and the average of all the data is also
shown.
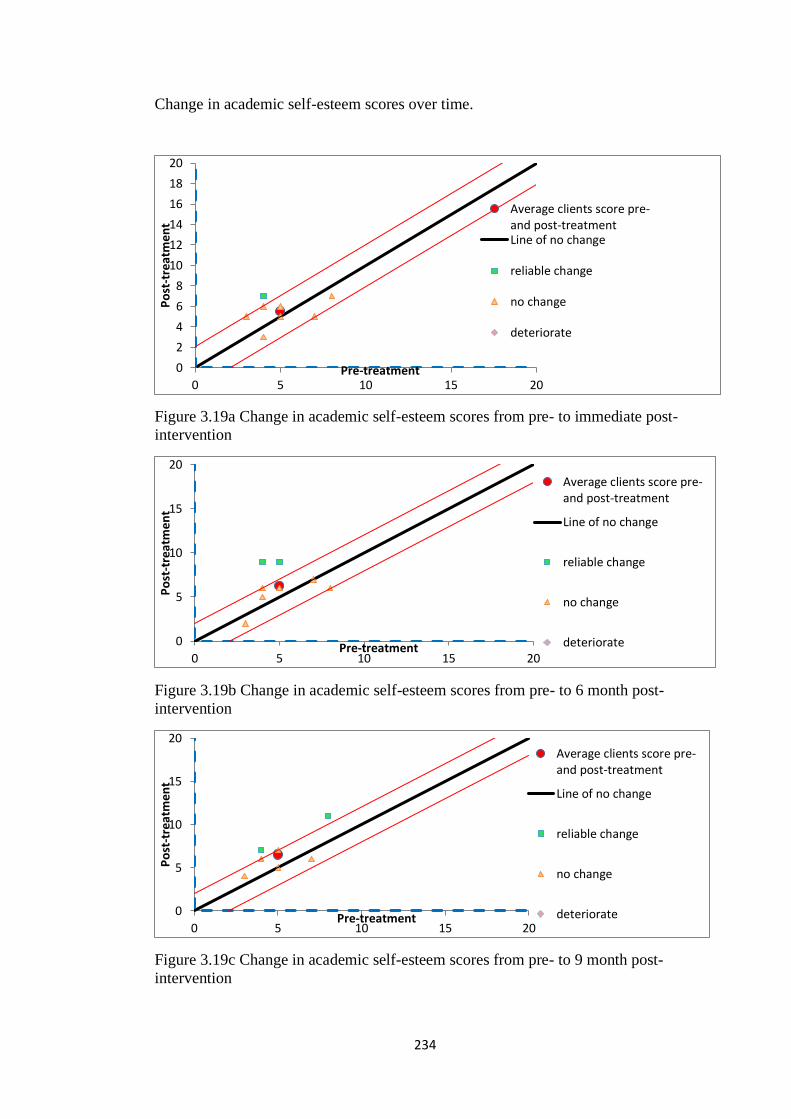
234
Change in academic self-esteem scores over time.
Figure 3.19a Change in academic self-esteem scores from pre- to immediate post-
intervention
Figure 3.19b Change in academic self-esteem scores from pre- to 6 month post-
intervention
Figure 3.19c Change in academic self-esteem scores from pre- to 9 month post-
intervention
0
2
4
6
8
10
12
14
16
18
20
0 5 10 15 20
Po
st-t
reat
men
t
Pre-treatment
Average clients score pre-and post-treatmentLine of no change
reliable change
no change
deteriorate
0
5
10
15
20
0 5 10 15 20
Po
st-t
reat
men
t
Pre-treatment
Average clients score pre-and post-treatment
Line of no change
reliable change
no change
deteriorate
0
5
10
15
20
0 5 10 15 20
Po
st-t
reat
men
t
Pre-treatment
Average clients score pre-and post-treatment
Line of no change
reliable change
no change
deteriorate
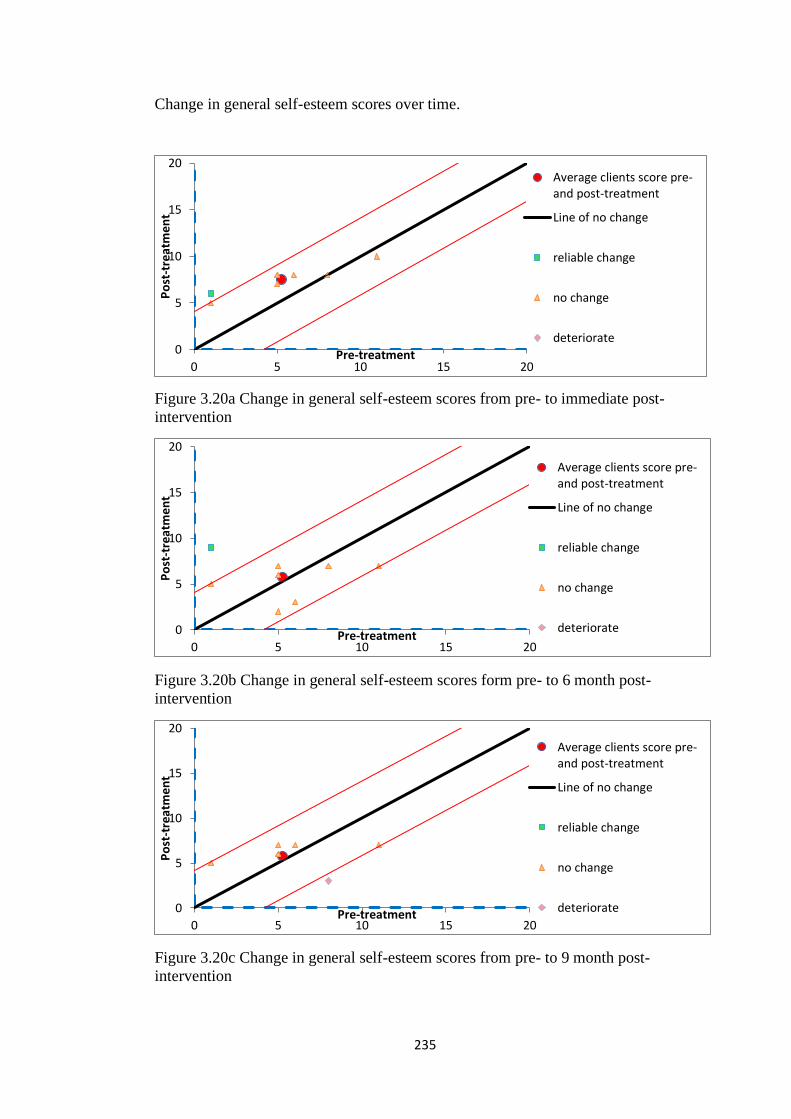
235
Change in general self-esteem scores over time.
Figure 3.20a Change in general self-esteem scores from pre- to immediate post-
intervention
Figure 3.20b Change in general self-esteem scores form pre- to 6 month post-
intervention
Figure 3.20c Change in general self-esteem scores from pre- to 9 month post-
intervention
0
5
10
15
20
0 5 10 15 20
Po
st-t
reat
men
t
Pre-treatment
Average clients score pre-and post-treatment
Line of no change
reliable change
no change
deteriorate
0
5
10
15
20
0 5 10 15 20
Po
st-t
reat
men
t
Pre-treatment
Average clients score pre-and post-treatment
Line of no change
reliable change
no change
deteriorate
0
5
10
15
20
0 5 10 15 20
Po
st-t
reat
men
t
Pre-treatment
Average clients score pre-and post-treatment
Line of no change
reliable change
no change
deteriorate
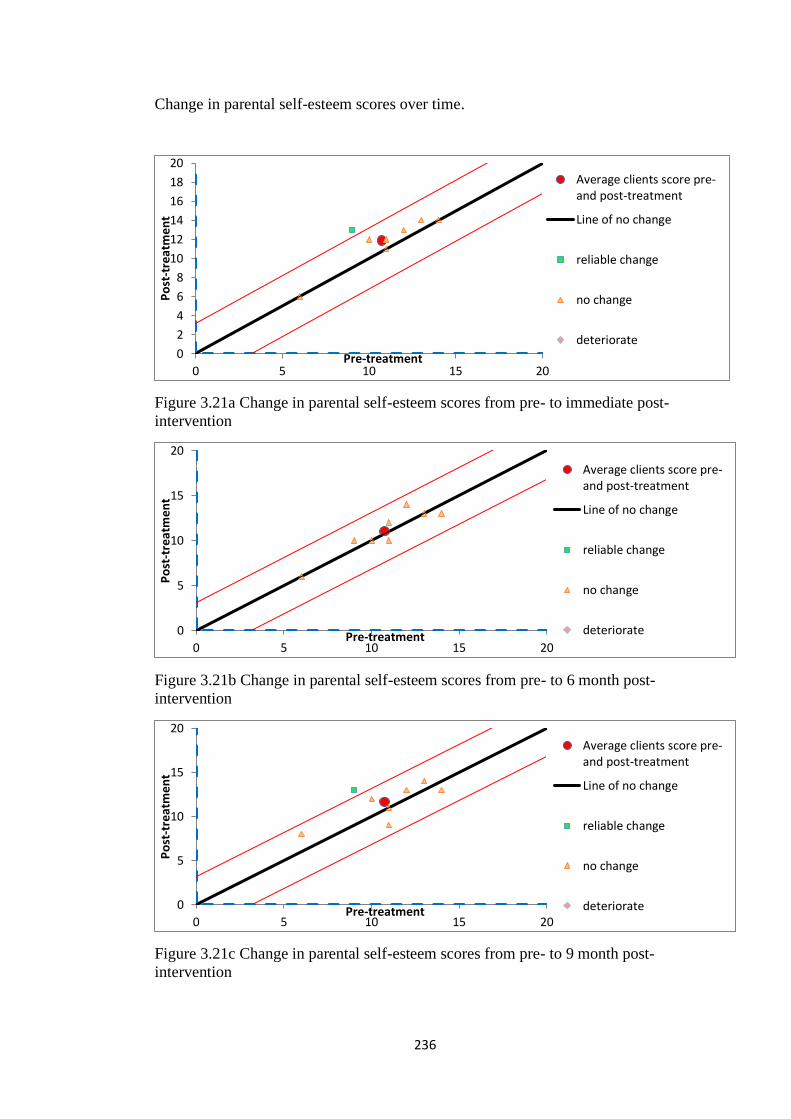
236
Change in parental self-esteem scores over time.
Figure 3.21a Change in parental self-esteem scores from pre- to immediate post-
intervention
Figure 3.21b Change in parental self-esteem scores from pre- to 6 month post-
intervention
Figure 3.21c Change in parental self-esteem scores from pre- to 9 month post-
intervention
0
2
4
6
8
10
12
14
16
18
20
0 5 10 15 20
Po
st-t
reat
men
t
Pre-treatment
Average clients score pre-and post-treatment
Line of no change
reliable change
no change
deteriorate
0
5
10
15
20
0 5 10 15 20
Po
st-t
reat
men
t
Pre-treatment
Average clients score pre-and post-treatment
Line of no change
reliable change
no change
deteriorate
0
5
10
15
20
0 5 10 15 20
Po
st-t
reat
men
t
Pre-treatment
Average clients score pre-and post-treatment
Line of no change
reliable change
no change
deteriorate
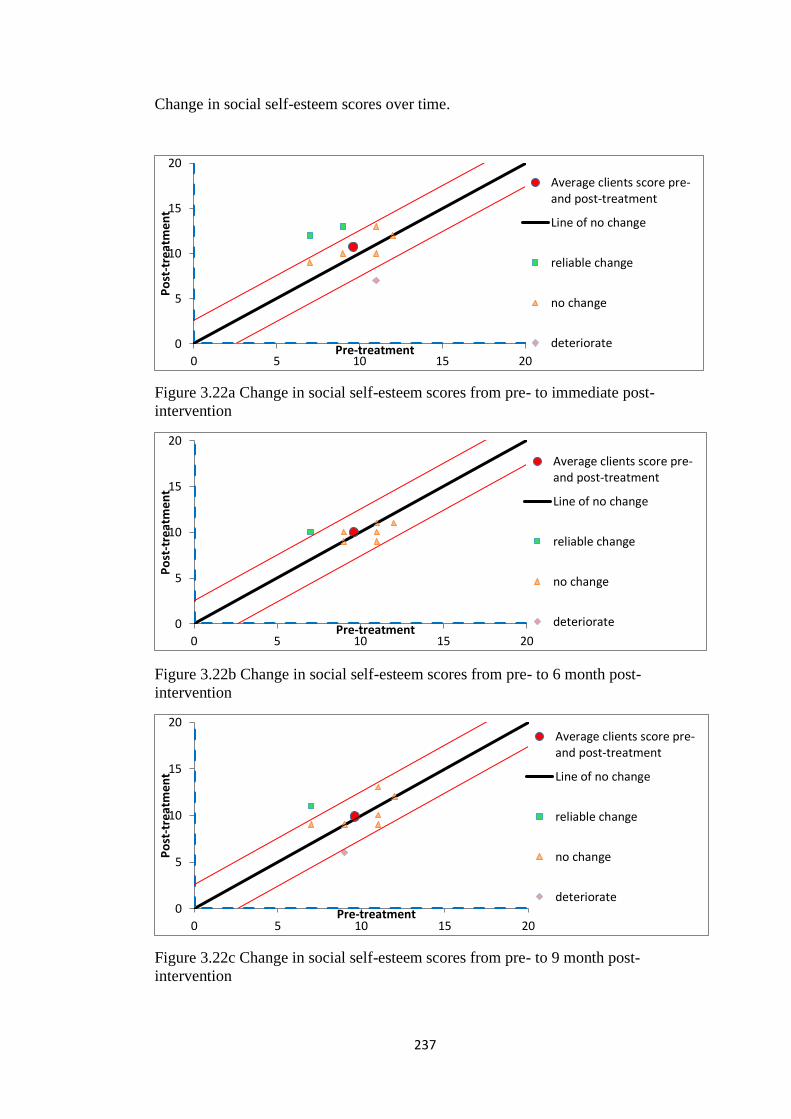
237
Change in social self-esteem scores over time.
Figure 3.22a Change in social self-esteem scores from pre- to immediate post-
intervention
Figure 3.22b Change in social self-esteem scores from pre- to 6 month post-
intervention
Figure 3.22c Change in social self-esteem scores from pre- to 9 month post-
intervention
0
5
10
15
20
0 5 10 15 20
Po
st-t
reat
men
t
Pre-treatment
Average clients score pre-and post-treatment
Line of no change
reliable change
no change
deteriorate
0
5
10
15
20
0 5 10 15 20
Po
st-t
reat
men
t
Pre-treatment
Average clients score pre-and post-treatment
Line of no change
reliable change
no change
deteriorate
0
5
10
15
20
0 5 10 15 20
Po
st-t
reat
men
t
Pre-treatment
Average clients score pre-and post-treatment
Line of no change
reliable change
no change
deteriorate
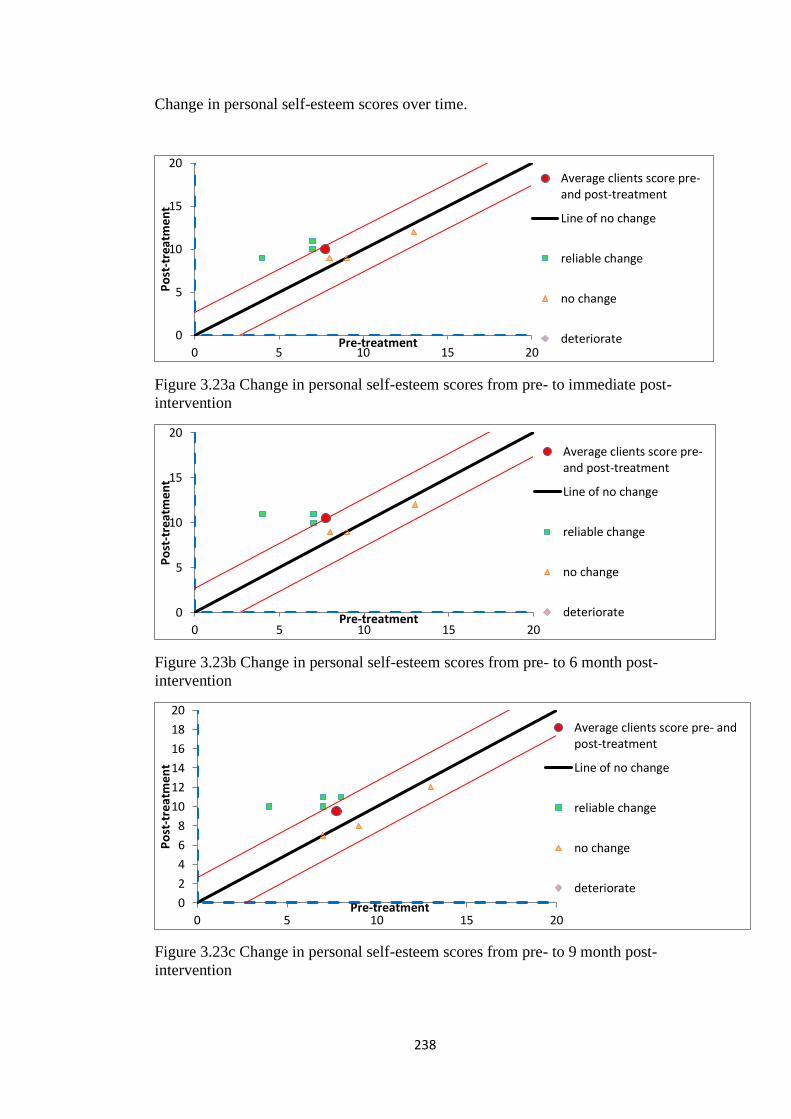
238
Change in personal self-esteem scores over time.
Figure 3.23a Change in personal self-esteem scores from pre- to immediate post-
intervention
Figure 3.23b Change in personal self-esteem scores from pre- to 6 month post-
intervention
Figure 3.23c Change in personal self-esteem scores from pre- to 9 month post-
intervention
0
5
10
15
20
0 5 10 15 20
Po
st-t
reat
men
t
Pre-treatment
Average clients score pre-and post-treatment
Line of no change
reliable change
no change
deteriorate
0
5
10
15
20
0 5 10 15 20
Po
st-t
reat
men
t
Pre-treatment
Average clients score pre-and post-treatment
Line of no change
reliable change
no change
deteriorate
0
2
4
6
8
10
12
14
16
18
20
0 5 10 15 20
Po
st-t
reat
men
t
Pre-treatment
Average clients score pre- andpost-treatment
Line of no change
reliable change
no change
deteriorate
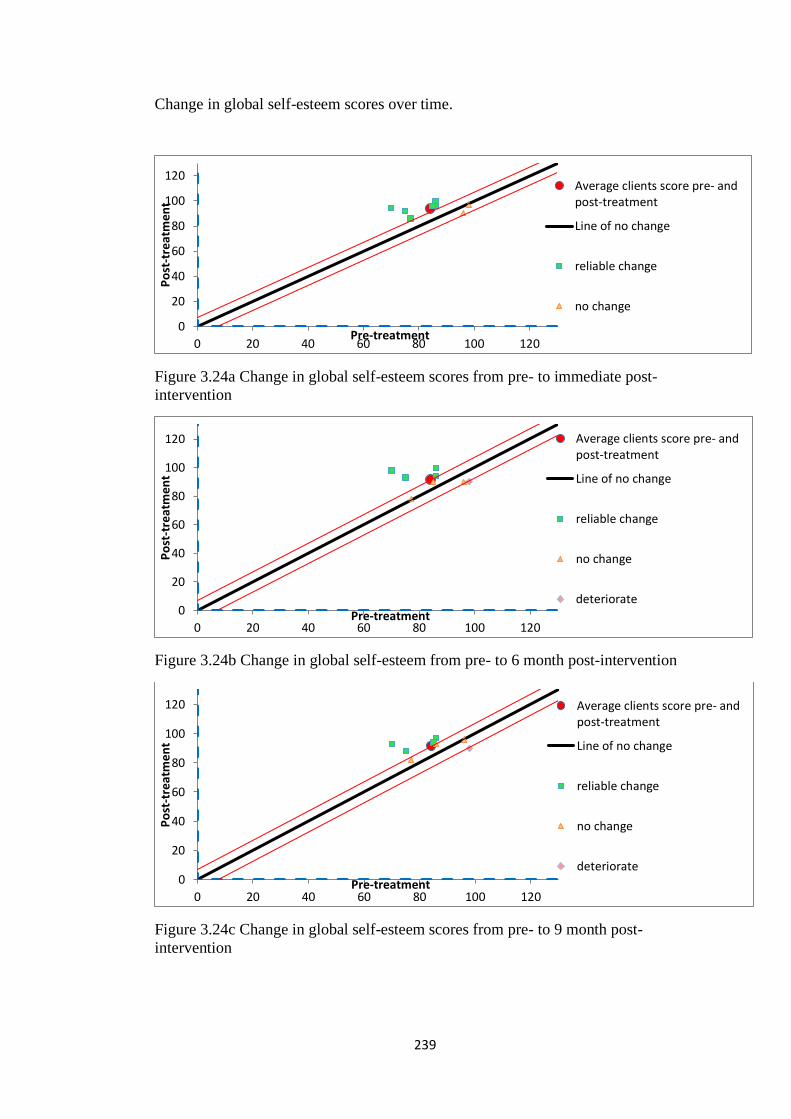
239
Change in global self-esteem scores over time.
Figure 3.24a Change in global self-esteem scores from pre- to immediate post-
intervention
Figure 3.24b Change in global self-esteem from pre- to 6 month post-intervention
Figure 3.24c Change in global self-esteem scores from pre- to 9 month post-
intervention
0
20
40
60
80
100
120
0 20 40 60 80 100 120
Po
st-t
reat
men
t
Pre-treatment
Average clients score pre- andpost-treatment
Line of no change
reliable change
no change
0
20
40
60
80
100
120
0 20 40 60 80 100 120
Po
st-t
reat
men
t
Pre-treatment
Average clients score pre- andpost-treatment
Line of no change
reliable change
no change
deteriorate
0
20
40
60
80
100
120
0 20 40 60 80 100 120
Po
st-t
reat
men
t
Pre-treatment
Average clients score pre- andpost-treatment
Line of no change
reliable change
no change
deteriorate
240
3.7 Summary of results
Visual inspection of the self-esteem scores of Sample 1 indicated a visual
trend in an increase between pre-intervention to 12 month post-intervention in
personal and global self-esteem. Visual inspection of the self-esteem scores of
Sample 2 suggested an increase in the domains measuring general, personal and
global self-esteem, this improvement was specifically notable between the pre-
intervention and immediate post-intervention scores and the pre-intervention and 9
month post-intervention phases.
Effect sizes measured the relative size of the effect of an intervention. For
Sample 1 large positive effect sizes were revealed at both pre-intervention to end of
intervention and pre-intervention to 12 month follow up for. A large positive effect
size was also revealed in global self-esteem between pre-intervention and 12 month
follow up. For Sample 2, large positive effect sizes were shown between pre-
intervention and end of intervention for general self-esteem, personal self-esteem
and global self-esteem and at pre-intervention to 6 month follow up for personal and
global self-esteem. In addition, a large positive effect size was shown for pre-
intervention to 9 month follow up for global self-esteem.
TAU-U analysis indicated that there was no significant difference between
the pre-intervention and post-intervention phase trends for academic, general,
parental and social self-esteem for Sample 1 and Sample 2. However, there was a
significant phase trend in global self-esteem for Sample 1 between pre-intervention
and 12 month post-intervention. This indicates that Sample 1 there was a significant
increase in global self-esteem levels from pre-intervention to 12 month follow-up.
In addition, TAU-U analysis revealed a significant phase trend in personal self-
esteem for Sample 2 between pre-intervention and immediate post-intervention and
241
between pre-intervention and 6 month post-intervention. Furthermore, significant
difference was noted in global self-esteem between pre-intervention and immediate
post-intervention for Sample 2. This indicates that for Sample 2 there was
significant increase in self-esteem levels over time in both personal and global self-
esteem.
There was little evidence to suggest reliable improvement for any of the
participants in Sample 1 or Sample 2 in the academic, general, parental or social
self-esteem domains. However, there was evidence to suggest improvements within
the personal and global self-esteem domains, although these were less pronounced
in the adolescents with dyslexia compared to the disengaged adolescents.
The intervention appears to have had the greatest impact on personal self-
esteem of the disengaged adolescents in Sample 2. Five of the eight participants
experienced reliable improvement from immediate post-intervention to 6 months
post- with the impact continuing to 9 months post-intervention for three of the eight
participants. Furthermore, the intervention showed a reliable improvement in global
self-esteem for six out of eight of the disengaged participants immediately post-
intervention, while half of participants showed reliable improvement at 6 and 9
month follow-up.
Although less pronounced with the adolescents with dyslexia in Sample 1, it
is evident that the greatest improvements were witnessed in those participants with
the lowest pre-intervention scores. For example, participant D3 exhibited the lowest
academic self-esteem score yet was the only participant to experience reliable
change between pre- and 12 month post-intervention. Similarly, D4 revealed the
lowest pre-intervention social self-esteem score yet was the only participant to
display reliable change between pre- and 12 month post-intervention. However,
242
participants of Sample 1 generally scored within the average ranges of self-esteem
scores compared to Sample 2 who predominately scored below average scores.
Although the global self-esteem of the adolescents with dyslexia fluctuated more
through the assessment period, at 12 month follow-up all three participants revealed
a reliable improvement in global self-esteem.
3.8 Discussion
The current study aimed to investigate the effectiveness of a group positive
emotions intervention (adapted from Suldo, Savage & Mercer, 2014) for increasing
self-esteem. Single case design was utilised to examine change after the intervention
- at three time points, immediately post-, 6 month post- and either 9 month (for the
disengaged adolescents in Sample 2 due to timing of GCSE’s) or 12 month post-
intervention (for the adolescents with dyslexia in Sample 1).
Although these effect sizes appear very encouraging, they must be
interpreted with caution due to the small sample size. In addition, it should be noted
that other measures of effect sizes have been reported in other studies. It is difficult
to directly compare the effect sizes (d) (Cohen, 1988) in the current study with those
effect sizes generated in studies using divergent methods of measuring effect size.
For example, some studies (Sin & Lyubomirsky, 2009; Bolier et al., 2013) have
used Pearson’s r as a measure of effect size. According to Cohen (1988, 1992), the
effect size is small if the value of r ranges between 0.10 and 0.30, medium it ranges
between 0.30 to 0.50, and large if it is greater than 0.50.
Meta-analyses have revealed divergent effect sizes regarding the efficacy of
PPI’s. Whilst Sin and Lyubomirsky (2009) showed effect sizes of PPIs on well-
being (r = .29) and depression (r = .31), Bolier et al. (2013) reported lower effect
243
sizes i.e. subjective well-being (r = .17), psychological well-being (r = .10), and
depression (r = .11). According to Cohen (1988, 1992), all these effect sizes (except
for depression) would be considered small.
However, White, Uttl & Hoilder’s, (2019) re-examination of the studies
(accounting for small sample sizes) included in Sin and Lyubomirsky (2009) and
Bolier et al. (2013) papers accounted for small sample sizes. They revealed smaller
but significant effect sizes of the PPI’s on well-being (approximately r = .10) but
near zero effect sizes of PPI’s on depression.
Indeed, White, Uttl & Hoilder’s (2019) recommended the need for standard
criteria for inclusion (such as all pre-post designs should report pre-post correlations
for outcome measures to ensure calculation of the most appropriate effect sizes) in
future meta-analyses to allow for clear comparisons to be drawn. This is particularly
timely as the number of relevant PPI studies currently total over 200, triple the
number since previous meta-analyses. Indeed, the question of what constitutes a PPI
needs to be re-examined, in order to ensure that their effectiveness on terms of
improving well-being and other outcome measures can be correctly scrutinized.
TAU-U and reliable change index (RCI) analyses were used within this
study and yielded similar outcomes, in that no significant effects were found in the
academic, general, parental and social self-esteem domains. However, there was
some evidence for significant effects on personal and global self-esteem in both
Samples. Indeed, TAU-U analyses indicated that for Sample 1 there was a
significant difference between pre-intervention and 12 month post-intervention
global self-esteem. TAU-U analyses also indicated that, for Sample 2, there was a
significant difference between pre-intervention and immediate post-intervention
personal self-esteem and again between pre-intervention and 6 month post-
244
intervention. For Sample 2 there was also a significant difference between pre-
intervention and immediate post-intervention for global self-esteem. These findings
mirror the reliable improvements found in personal self-esteem and global self-
esteem of Sample 1 and, to a greater extent, Sample 2. However, given the large
number of comparisons conducted, some of these significant results could be Type 1
errors.
Both TAU-U analysis and reliable change methodology are weighed equally
in the discussion, however both have strengths and limitations.
One strength of TAU-U analysis is that much of the data supplied by the
TAU-U designers (Parker, Vannest, Davis, & Sauber, 2011) offer applications to
real data instead of simulation studies. Although, TAU-U is deemed preferable
when a pre-intervention trend is evident in the data, no trend was observed in the
current self-esteem scores. Losada, Chacón-Moscoso, and Sanduvete-Chaves,
(2016) contend that a limitation of TAU-U analysis is that it is computationally and
interpretatively complex, with a tendency to be overly conservative (e.g.,
overcorrecting). Other limitations include: imprecise or inconsistent Tau-U
terminology in published single-case research; difficulties in graphing visually, and
the various Tau-U effect size statistics shows only weak correlations with visual
analysis (Brossart, Laird, & Armstrong, 2018).
The Reliable Change Index equation is limited to use with pre-post designs
and is related to the reliability of the outcome measure. The Cronbach’s alpha of
each of the domains of the CFSEI-3 (all α > .77) indicates good reliability; however,
inter-domain alpha discrepancies reveal that, for example, smaller differences are
needed to achieve significant personal self-esteem than in social self-esteem.
According to Busse, McGill, and Kennedy (2015) RCI values above 1.96 are
245
deemed statistically significant. Such a critical value is not arbitrary as it reflects a
two standard deviation increase from the baseline score. Indeed, Busse and
colleagues (Busse, & Kennedy, 2005; Busse, Elliott, & Kratochwill, 2010; Elliott, &
Busse, 2004) proposed that RCI can be interpreted as the magnitude of an effect size
suggesting the following (unvalidated) guidelines: RCIs>1.8 demonstrate a strong,
positive change, RCIs from 0.7 to 1.7 a moderate change, -0.6 to 0.6 demonstrate no
change, whilst -0.7 to -1.7 demonstrates a moderate negative effect, and RCIs < -
1.8 indicate that a situation has significantly deteriorated.
The RCI is considered particularly fitting for response to intervention
methods that use rating scales for screening and progress monitoring and has been
proposed to be more reliable in representing meaningful change in counselling
contexts than clinical judgement and participant self-reports (Lunnen & Ogles,
1998). In sum, the strengths of RCI are that it can be used to determine the
magnitude of an effect and that confidence intervals can be drawn. The limitations
are that it is sensitive to the reliability of the instruments used, and it is limited to
pre-post designs. In this current study, such limitations serve only to reinforce its
suitability.
Taking the respective positive attributes and shortcomings of both the TAU-
U and RCI into consideration, both the TAU-U and RCI appear sensitive and
appropriate for this data analysis.
The intervention appears to be most beneficial to those participants with the
lowest pre-intervention scores, in line with previous research by Froh, Kashdan,
Ozimkowski and Miller (2009). For example, participant N1 of Sample 2 exhibited
the second lowest personal and academic self-esteem scores and the joint lowest
general and social self-esteem scores yet experienced reliable improvement in all
246
domains (except parental self-esteem) throughout the post-intervention assessments.
Conversely, within the same sample, participants N6 and N7 who had the highest
scores in many domains failed to display any improvements, with participant N7
even exhibited a deterioration in global self-esteem at 6 and 9 months post-
intervention.
Such results highlight the importance of measuring the domains separately.
It is suggested that for the disengaged adolescents, global self-esteem gives a more
positive, perhaps less realistic, perspective of the participant’s self-esteem, masking
wide discrepancies in participants’ scores compared to the more nuanced approach
when investigating specific domains. However, conversely it may be suggested that
for the adolescents with dyslexia in Sample 1, global self-esteem exaggerates both
the reliable improvement and the reliable deterioration in participant’s self-esteem
scores.
Individual and gender differences may also impact on outcome measures.
Female participants (N1, N2 and N3) in Sample 2 all appeared to benefit from a
reliable improvement in personal self-esteem. Gender differentials may play a part,
in that the intervention may have been better received by the females due to being
implemented by a female. Individual differences may be evident with some
participants exhibiting a greater susceptibility to the intervention for example, the
scores of N1 of Sample 2 demonstrated reliable improvements in all domains
(except parental self-esteem) whether assessed immediately, 6 month post-or 9
month post-intervention.
247
3.9 Strengths and Limitations
A strength of the simple pre-post-interventions design with 3 follow-up
assessments is that it can serve as a pilot study (Cordery, Morrison, Wright, & Wall,
2010; O'Neill, Best, Gillespie, & O'Neill, 2013; Winkens, Ponds, Pouwels, Eilander,
& van Heugten, 2014). Both TAU-U analysis and RCI calculations findings
highlighted potentially significant reliable improvements in personal and global self-
esteem scores that may be attributed to the intervention. However, results replication
and inclusion through meta-analyses and systematic reviews are needed to enable
findings to contribute to the evidence base of intervention programs (Jenson, Clark,
Kircher, & Kristjansson, 2007). However, there are also four key limitations to
Study 2.
The first limitation is the significance of some findings could be Type I
errors due to multiple comparisons. Type 1 errors are a false positive, where results
are considered significant when the probability is that there occurred by chance. In
other words, as the number of comparisons increases, it becomes more probable that
the participants will appear to differ in terms of at least one attribute due to random
sampling error alone. Confidence in findings is therefore weaker than an analysis
involving only a single comparison. (Ranganathan, Pramesh, & Buyse, 2016). Since
multiple comparisons amplify the probability of a false-positive finding, caution
should therefore be taken when interpreting these findings.
Second, single case designs, such as those used within this current study,
unless part of a multiple baseline program, do not demonstrate a casual relationship
between the intervention and change in self-esteem. Therefore, any conclusions only
indicate the existence and amount of change in self-esteem and not the amount of
change that can be attributed to the intervention. Although it is speculated there is
248
evidence of gender effects and low initial baseline effects, there is insufficient data
to support such claims and strong conclusions cannot be drawn from the data
presented here.
Third, simple pre-post-intervention designs (noting participants are assessed
at three post-intervention) may be considered weaker in internal validity as there is
little control over alternative factors that may explain potential change in self-
esteem and the indication of the efficacy is not robust (Kazdin, 2012).
Fourth, it must also be recognised that these scores were assessed by self-
report and it may be difficult to disentangle how the impact of intervening
circumstances occurring between the measured times points influence self-esteem.
This may be evident in the lowering of academic self-esteem of Sample 1 after
sitting their exams (and receiving their results) just prior to the 12 month post-
intervention assessments.
3.10 Conclusion
There was little evidence to support the beneficial impact of the intervention
on academic, general, parental and social self-esteem domains. However, it was
noted that large effect sizes and significant phase differences and reliable
improvements were noted in personal self-esteem and global self-esteem for these
vulnerable adolescents. However, there is the risk of Type I errors and caution must
be applied when evaluating the potential effect of the intervention considering most
findings were non-significant.
Personal self-esteem represents the adolescents’ most intimate perceptions of
anxiety and self-worth. In line with Fredrickson’s (1998, 2001) broaden and build
theory, positive emotions may have beneficially impacted this domain through the
249
promotion of adaptive coping and fostered resilience, an ability to face anxiety
provoking experiences more speedily and effectively (Tugade & Fredrickson, 2004).
The mechanism through which positive emotions engendered this reliable
improvement in personal self-esteem is only speculated. Previous research has
shown that individual components of the intervention: gratitude (McCullough,
Emmons & Tsang., 2002, Fredrickson, Tugade, Waugh, & Larkin, 2003); use of
character strengths (Seligman, Steen, Park, & Peterson, 2005) and hope (Park &
Peterson, 2008a) may all have influenced an improvement in how an individual
perceives their anxiety. However, it is difficult to extrapolate which of these three
components may have generated this improvement in personal self-esteem, or
whether this positive outcome may have been generated by their synergy. Indeed,
the reliable improvements witnessed within personal self-esteem may have
underpinned the improvements in global self-esteem.
This study suggests that positive emotions may promote reliable
improvement in the self-esteem (particularly personal and global self-esteem) of two
small samples of vulnerable adolescents. Larger randomised controlled trials are
needed to identify if this is indeed the case with typically developing adolescents.
However, factors such as the importance of school context and alignment with
general school goals and philosophy (Forman, Olin, Hoagwood, Crowe, & Saka,
2009), booster sessions (Roth, Suldo, & Ferron, 2017), teacher versus outsider led
interventions (Rohrbach, Dent, Skara, Sun, & Sussman, 2007) and the involvement
of parents and caregivers (Roth, Suldo, & Ferron, 2017) must not be overlooked and
may increase the efficacy of such interventions.
Moreover, in order to develop more effective interventions, it is crucial to
pinpoint specific strengths that can be bolstered to foster increases in all self-esteem
250
domains. Such clarification could be the precursor of tailored interventions targeted
at adolescents at risk of suffering low self-esteem. Further exploration with a larger
sample of adolescents was therefore warranted to investigate if specific strengths are
associated with different self-esteem domains. This investigation comprises Study 3.
251
4 Chapter 4
Study 3 – An exploration into the predictors of self-esteem
domains in adolescents
4.1 Introduction
Orth and Robins (2014) emphasise that self-esteem is not just
epiphenomenon of, but also a predictor of, numerous significant life consequences
including educational attainment, life satisfaction, health and economic prospects. It
is also acknowledged that self-esteem is potentially malleable during adolescence
(Robins, Trzesniewski, & Donnellan, 2012) and functions as a protective factor in
both mental and physical well-being. Since mental health problems amongst young
people are escalating (e.g. McGorry, 2013), it is important to identify predictors of
self-esteem. This study is the first to address the extent to which different strengths
predict the five discrete self-esteem domains (academic, general, parental, social and
personal self-esteem) as defined by Battle (2002). Knowledge of the predictors of
individual self-esteem domains could enable tailoring of interventions aimed at
boosting of those at risk of low self-esteem before the establishment of low self-
esteem.
4.2 Self-esteem predictors
During the last two decades research has started to concentrate on life-span
development of self-esteem, its associations and its predictors (Huang, 2010; Orth,
Trzesniewski, & Robins, 2010; Orth, Robins, & Widaman, 2012; Robins,
Trzesniewski, Tracy, Gosling, & Potter, 2002). Longitudinal studies (e.g., Orth,
252
Erol, & Luciano, 2018; Birkeland, Melkevik, Holsen & Wold, 2012; Birkeland,
Breivik, & Wold, 2014) have sought to clarify the constellation of predictors in
adolescence, although the work is still far from conclusive.
The literature highlights the significance of secure attachments, school and
peer connectedness, as well as academic achievement and peer acceptance in
enhancing global self-esteem during adolescence. Such findings are not unsurprising
given that it has been argued that self-esteem emanates from interpersonal
relationships. Indeed, Cooley (1902) and Mead (1934) refer to the ‘looking glass
self’ which suggests that an individual’s sense of self develops through the lens of
other opinions (i.e., reflected appraisals) in social interactions. Moreover, both the
stage-environment fit (Eccles et al., 1993) and self-determination (Ryan & Deci,
2000) theories emphasise the crucial tripartite role of parents, schools and peers in
satisfying adolescents' innate necessity for competence, autonomy and relatedness.
Indeed, sociometer theory (Leary, 2008; Leary & Baumeister, 2000) proposes that
self-esteem is an internal gauge for social acceptance or rejection. Consequently,
self-esteem declines during events in which an adolescent feels socially excluded
and improves during events in which the individual feels involved.
Throughout the literature, exploring the correlates and predictors of
adolescence self-esteem, the operationalisation of self-esteem and associated
strengths is problematic. The varying definitions and multitude of instruments
utilised to measure individual constructs makes direct comparisons difficult. Many
studies discussed in this introduction measured character strengths using the Values
in Action Youth Inventory (VIA; Park & Peterson, 2006) and referred to the
definitions of the character strengths as given in the accompanying literature and
website (www.viacharacter.org/www/Character-Strengths). In contrast, other studies
253
have used different definitions; for example, Macaskill and Denovan (2014) defined
hope as a goal driven thought process comprising pathways and agency (Snyder,
Rand & Sigman, 2005) and utilised the Trait Hope scale (Snyder et al., 1991) in
combination with the Rosenberg Self-Esteem Scale (Rosenberg, 1965). The VIA
(youth version) was utilised by the current research in all three studies due to its
ease of use and congruency of definition with other positive psychology studies in
this literature.
In addition, the direction of relationships and the positioning of self-esteem
in either a consequence (scar) or vulnerability model, or indeed the potentiality of
reciprocal associations, also varies across the literature. For example, meta-analyses
of three studies recently conducted by Masselink et al. (2018) supported the
vulnerability model suggesting self-esteem has a significant but relatively weak
negative influence on symptoms of depression over time (rather than the scar model
which suggests depression leads to the development of low self-esteem). Although it
is established that academic success leads to increased self-esteem (Tetzner, Becker
& Maaz, 2017), research has indicated hope underpins this academic success (Park
& Peterson, 2008a) and thus feeds into higher levels of self-esteem. Indeed, specific
strengths may interact in conjunction with other strengths either promoting (Weber,
Ruch, Littman-Ovadia, Lavy, & Gai, 2013) or suppressing the resultant outcome.
More research is required to extrapolate the importance of individual strengths on
self-esteem.
The literature revealed complex relationships involving self-esteem and
strengths in terms of magnitude and direction. Moreover, these dynamics may be
further influenced by demographic variables such as gender differentials, age,
ethnicity, learning difficulties, and socio-economic status. Females have consistently
254
been reported to show lower self-esteem than males (Bleidorn et al., 2016; Heaven
& Ciarrochi, 2008). Furthermore, whilst boys reveal slight increases in self-esteem
during early adolescence girls tend to decrease (Birndorf, Ryan, Auinger, & Aten,
2005). Significant associations between ethnicity and self-esteem have also been
demonstrated by Bracey, Bamaca, & Umana-Taylor’s (2004) comparisons of
biracial, Asian and Black adolescents. There is also evidence to suggest that
adolescents with learning difficulties exhibit lower self-esteem due to negative
comparison with their typically developing peers (Theunissen, Rieffe, Briaire,
Soede, Kouwenberg & Frijns, 2014). Indeed, Terras, Thompson and Minnis (2009)
underscore that adolescents with dyslexia experience lower academic self-esteem
than typically developing counterparts. Those with higher socio-economic status are
also seen to exhibit higher self-esteem than those from lower socio-economic status
(Rhodes, Roffman, Redy, & Fredriksen, 2004). Therefore, it was important to
consider the influence of demographic variables such as gender, age, SEN
provision, ethnicity and socio-economic status upon self-esteem in Study 3.
4.3 Identification of potential predictors for further investigation
The selection of strengths to be further explored in Study 3 was informed by
Study 1. In these studies with vulnerable adolescents i.e. those at ‘risk of’ becoming
NEET and those adolescents with dyslexia, exploratory analyses indicated that 21
strengths had positive correlations with self-esteem. However, due to the small
sample sizes, the reliability and generalisability of these correlations can be
questioned.
In the literature, there is evidence that secure attachment (Sroufe, 2002;
Thompson, 2007), relationship with parents (Birkeland, Melkevik, Holsen & Wold,
255
2012), family environment (Orth, 2018), and parenting styles (e.g., Arbona &
Power, 2003; Laible, Carlo, & Roesch, 2004) influence self-esteem, therefore, the
strengths of family involvement and commitment to family values were selected for
further investigation in Study 3.
The importance of the social context is also underscored in the literature.
High levels of attachment or integration into friendship groups, or low levels of
loneliness and social isolation, have been revealed to significantly predict self-
esteem (Gorrese, & Ruggieri, 2013; Laible et al., 2004; Morin, Maiano, Marsh,
Nagengast, & Janosz, 2013). Indeed, McAdams (2001) argues that the self must be
viewed in conjunction with the self in relationships. Since research has highlighted
the significance of peer relationships and peer acceptance in the development of
adolescence self-esteem (Birkeland, Breivik, & Wold, 2014), interpersonal strength,
peer connectedness and pro-social attitude were selected for investigation.
The school environment is considered in the literature to be a significant part
in the fulfilment of the necessity for competence as adolescents start to internalise
the value and usefulness of what is learned at school in the development of their
own identity (Arens, Yeung, Nagengast, & Hasselhorn, 2013). Those adolescents
who perceive school as meaningless may doubt their ability to develop important
competencies. In addition, there is evidence to support higher academic
achievement predicts higher self-esteem (Tetzner, Becker & Maaz, 2017), as well as
the significance of intrapersonal and interpersonal elements of social inclusion with
the educational environment upon self-esteem (Denissen, Penke, Schmitt, & Van
Aken, 2008; von Soest, Wichstrøm, & Kvalem, 2016). Such factors influence
strengths such as interpersonal, intrapersonal, knowing myself and school
functioning and, therefore, these strengths were also selected for Study 3.
256
Evidence also suggests that adolescence engagement, whether in school
(Virtanen, Kiuru, Lerkkanen, Poikkeus, & Kuorelahti, 2016) or free-time (McClure,
Tanski, Kingsbury, Gerrard &Sargent, 2010) impacts on self-esteem and therefore
the strengths of activity engagement and being involved were selected for further
investigation. In addition, associations with adolescents’ perception of body image
and self-esteem (Wichstrøm & von Soest, 2016) reinforce the selection of
intrapersonal and knowing myself for further exploration in Study 3. In addition,
competent copings skills was selected for further investigation as it is reported that
adolescents in a school setting who displayed higher self-esteem relied more on
problem focused coping (using social and instrumental support) and less on
emotion-focussed coping (avoidance and venting feelings) strategies than those
adolescents with lower self-esteem (Mullis & Chapman, 2000).
There is a scarcity of studies focussing explicitly on character strengths that
predict adolescent self-esteem due to focus on correlations with well-being, life
satisfaction and positive and negative affect – all protective factors in buffering
against mental health difficulties. However, there is evidence of positive
correlations between self-esteem and the character strengths of creativity (Deng &
Zhang, 2011) and with hope (Macaskill & Denovan, 2014). A further eight strengths
were selected due their positive associations with self-esteem in Studies 1 and 2,
although not related directly to self-esteem in the literature; love of learning
(Kokkinos, & Voulgaridou, 2018), perspective (Cheng & Furnham, 2017), honesty
(Park & Peterson, 2008a), zest (Gusewell & Ruch, 2012), forgiveness, prudence,
self-regulation and leadership (Weber, Ruch, Littman-Ovadia, Lavy, & Gai, 2013).
In sum, from the original 51 strengths measured in Studies 1 and 2, 21
strengths were selected for further exploration in Study 3 to assess their association
257
with the self-esteem domains: four behavioural and emotional strengths
(interpersonal, intrapersonal, family involvement and school functioning), seven
personal and contextual strengths (knowing myself, activity engagement, peer
connectedness, competent coping skills, commitment to family values, prosocial
attitude and being involved) and ten character strengths (leadership, love of
learning, perspective, hope, self-regulation, creativity, prudence, zest, forgiveness
and honesty). Therefore, Study 3 was designed to explore whether these strengths
can predict self-esteem domains in a large sample of adolescents. Interventions
enhancing these predictors could impact positively on the developmental pathway of
individual or multiple self-esteem domains and subsequently feed into global self-
esteem (Robins, Trzesniewski, & Donnellan, 2012).
4.4 Research Questions
The current study sought to answer the following research questions:
1. Do age, gender, ethnicity, SEN and/or deprivation impact on self-esteem
domains?
2. Which specific behavioural and emotional, personal and contextual, and
character strengths predict different domains of self-esteem in adolescents
(10-17 years) in mainstream secondary schools?
4.5 Method
4.5.1 Participants
Participants for the study were recruited through opportunity sampling from
a potential pool of 2148 secondary school pupils (year 7-11 inclusive) aged 10-17
years from four secondary schools in the north and south of England. Two of the
schools, an independent boys’ school and inner-city state school, had participated in
258
Studies 1 and 2 and two independent girls’ schools were included for gender
balance. In total, 953 adolescents aged between 10-17 years completed the online
questionnaire.
4.5.1.1 Ethics
Principles of informed consent, withdrawal, debriefing, confidentiality,
anonymity, integrity, impartiality and respect were adhered to throughout this
research (Code of ethics and Conduct, BPS, August 2009) and the study had full
Ethics approval from the Department of Psychology at the University of Sheffield
before commencement of empirical work (See Appendix L).
4.5.2 Materials
Design and composition of online questionnaire
The online questionnaire (see Appendix M) consisted of demographic
questions and items selected from the four age-appropriate self-esteem and
strengths-based instruments used in Studies 1 and 2; namely, The Culture Free Self-
Esteem Inventory (CFSEI-3, Battle, 2002); the Behavioural and Emotional Rating
Scale for Youth (BERS-2, Epstein, 2004); Strengths Assessment Inventory -Youth
Version (SAI-Y; Rawana & Brownlee 2010) and the Values in Action Inventory of
Strengths for Youth (VIA; Peterson & Seligman, 2004).
Description of the original questionnaires and rationale for item inclusion
The original four instruments used in the current study are profiled with their
psychometric properties earlier in Chapters 2 and 3. Here the rationale for selection
of items to be used in Study 3 is discussed.
259
Culture Free Self-Esteem Inventory adolescent version (CFSEI-3, Battle, 2002).
Only strength domains that had strong positive correlations with the self-
esteem domains (significant at p < .005. Spearman’s rho r ≥ .70) in Studies 1 and 2
were assessed in the current study.
To assess reliability, item-total correlations were performed on these self-
esteem items (CFSEI-3, Battle, 2002). An item-total correlation is the correlation
between each item of the self-esteem scale with the total scale score (excluding that
item) and therefore can be used to check if any item within a self-esteem scale is
inconsistent with the average of the other items. Item-total correlations <.30 indicate
that the item does not correlate well with the overall self-esteem scale and therefore
those items with item-total correlations <.3 were removed from the scale (Pedhazur
& Schmelkin 1991; Field, 2005). Typically, items with item-total correlations of
>.30 have high levels of distinctness (Nunnally, 1994) and, therefore, are considered
worthy of inclusion in a scale. The items with the highest item-total correlation were
selected and resulted in a total of 27 items chosen from the original 67 item CFSEI-
3 inventory to be used in the current study (see Table 4.1 with corrected item-total
correlations).
All items exhibited satisfactory correlation with the total score (Pearson’s r >
.3) and ranged from .32 to .90 (see Table 4.1). Some cite item-total correlations > .9
can suggest some redundancies in contents/wording with the other items (Jacobs,
Berduszek, Dijkstra, & van der Sluis, 2017). The highest item-total correlations of
the academic self-esteem scale ranged from .80 to .90 and, although falling just
below this upper limit, were included.
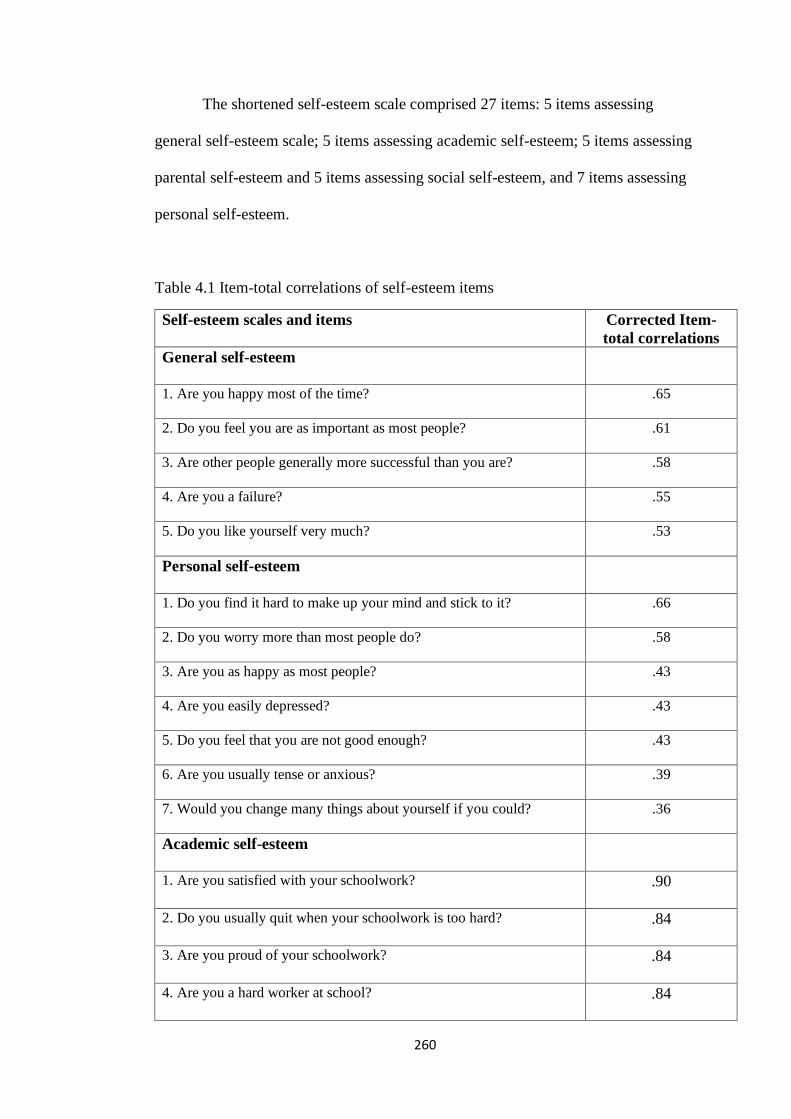
260
The shortened self-esteem scale comprised 27 items: 5 items assessing
general self-esteem scale; 5 items assessing academic self-esteem; 5 items assessing
parental self-esteem and 5 items assessing social self-esteem, and 7 items assessing
personal self-esteem.
Table 4.1 Item-total correlations of self-esteem items
Self-esteem scales and items Corrected Item-
total correlations
General self-esteem
1. Are you happy most of the time? .65
2. Do you feel you are as important as most people? .61
3. Are other people generally more successful than you are? .58
4. Are you a failure? .55
5. Do you like yourself very much? .53
Personal self-esteem
1. Do you find it hard to make up your mind and stick to it? .66
2. Do you worry more than most people do? .58
3. Are you as happy as most people? .43
4. Are you easily depressed? .43
5. Do you feel that you are not good enough? .43
6. Are you usually tense or anxious? .39
7. Would you change many things about yourself if you could? .36
Academic self-esteem
1. Are you satisfied with your schoolwork? .90
2. Do you usually quit when your schoolwork is too hard? .84
3. Are you proud of your schoolwork? .84
4. Are you a hard worker at school? .84
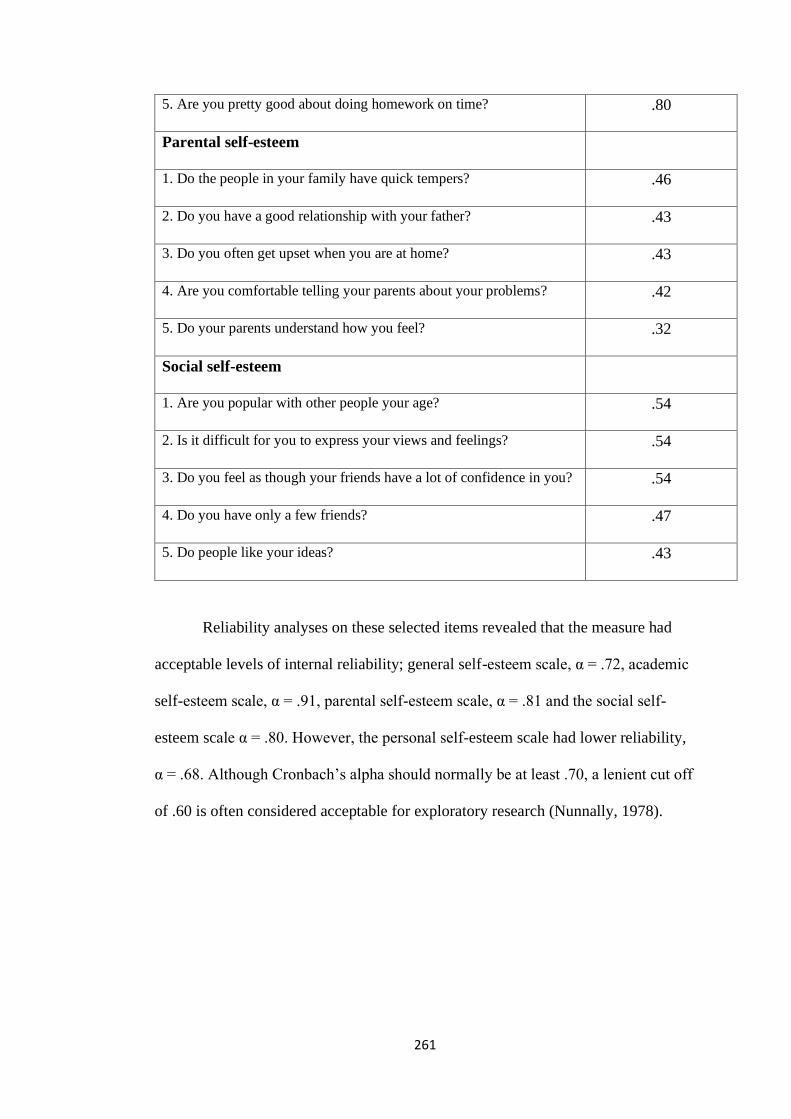
261
5. Are you pretty good about doing homework on time? .80
Parental self-esteem
1. Do the people in your family have quick tempers? .46
2. Do you have a good relationship with your father? .43
3. Do you often get upset when you are at home? .43
4. Are you comfortable telling your parents about your problems? .42
5. Do your parents understand how you feel? .32
Social self-esteem
1. Are you popular with other people your age? .54
2. Is it difficult for you to express your views and feelings? .54
3. Do you feel as though your friends have a lot of confidence in you? .54
4. Do you have only a few friends? .47
5. Do people like your ideas? .43
Reliability analyses on these selected items revealed that the measure had
acceptable levels of internal reliability; general self-esteem scale, α = .72, academic
self-esteem scale, α = .91, parental self-esteem scale, α = .81 and the social self-
esteem scale α = .80. However, the personal self-esteem scale had lower reliability,
α = .68. Although Cronbach’s alpha should normally be at least .70, a lenient cut off
of .60 is often considered acceptable for exploratory research (Nunnally, 1978).
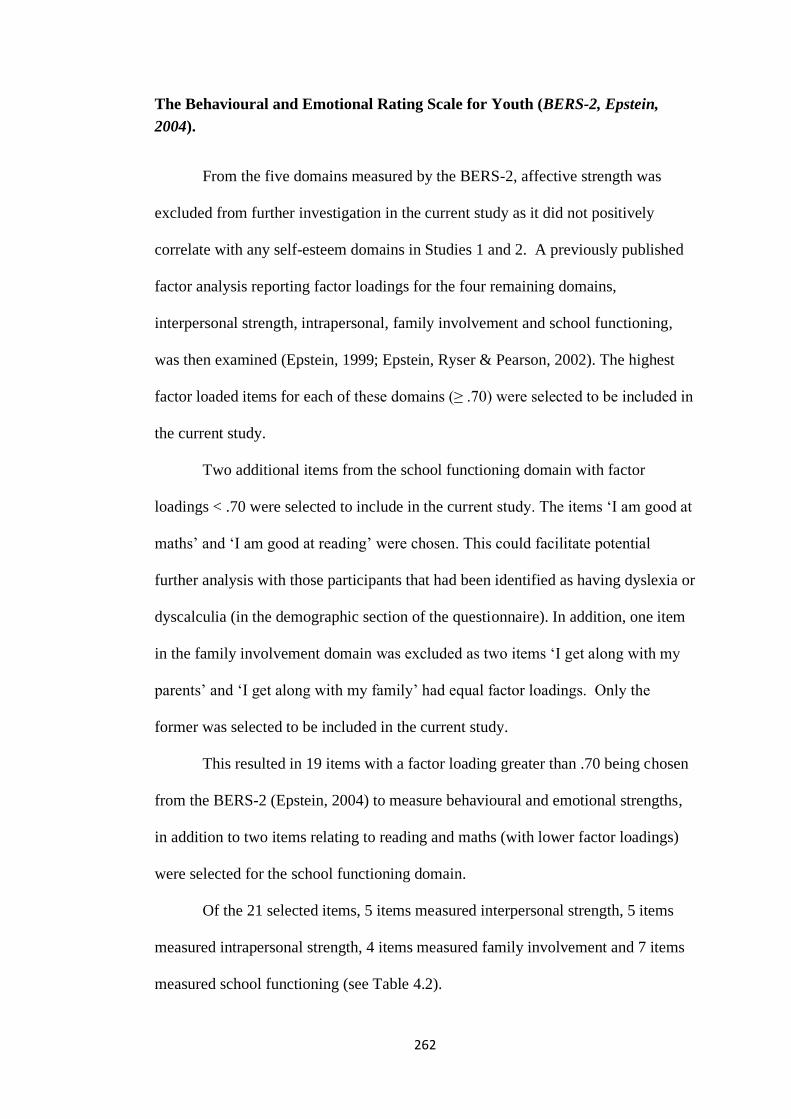
262
The Behavioural and Emotional Rating Scale for Youth (BERS-2, Epstein,
2004).
From the five domains measured by the BERS-2, affective strength was
excluded from further investigation in the current study as it did not positively
correlate with any self-esteem domains in Studies 1 and 2. A previously published
factor analysis reporting factor loadings for the four remaining domains,
interpersonal strength, intrapersonal, family involvement and school functioning,
was then examined (Epstein, 1999; Epstein, Ryser & Pearson, 2002). The highest
factor loaded items for each of these domains (≥ .70) were selected to be included in
the current study.
Two additional items from the school functioning domain with factor
loadings < .70 were selected to include in the current study. The items ‘I am good at
maths’ and ‘I am good at reading’ were chosen. This could facilitate potential
further analysis with those participants that had been identified as having dyslexia or
dyscalculia (in the demographic section of the questionnaire). In addition, one item
in the family involvement domain was excluded as two items ‘I get along with my
parents’ and ‘I get along with my family’ had equal factor loadings. Only the
former was selected to be included in the current study.
This resulted in 19 items with a factor loading greater than .70 being chosen
from the BERS-2 (Epstein, 2004) to measure behavioural and emotional strengths,
in addition to two items relating to reading and maths (with lower factor loadings)
were selected for the school functioning domain.
Of the 21 selected items, 5 items measured interpersonal strength, 5 items
measured intrapersonal strength, 4 items measured family involvement and 7 items
measured school functioning (see Table 4.2).
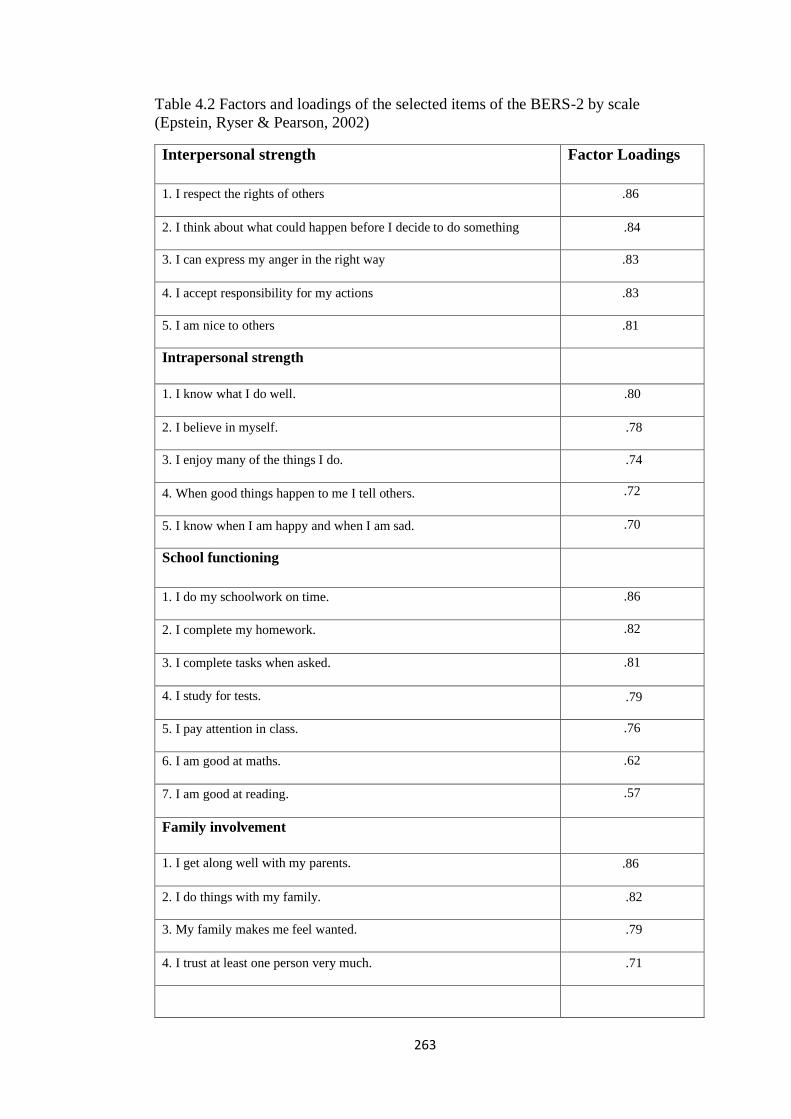
263
Table 4.2 Factors and loadings of the selected items of the BERS-2 by scale
(Epstein, Ryser & Pearson, 2002)
Interpersonal strength Factor Loadings
1. I respect the rights of others .86
2. I think about what could happen before I decide to do something .84
3. I can express my anger in the right way .83
4. I accept responsibility for my actions .83
5. I am nice to others .81
Intrapersonal strength
1. I know what I do well. .80
2. I believe in myself. .78
3. I enjoy many of the things I do. .74
4. When good things happen to me I tell others. .72
5. I know when I am happy and when I am sad. .70
School functioning
1. I do my schoolwork on time. .86
2. I complete my homework. .82
3. I complete tasks when asked. .81
4. I study for tests. .79
5. I pay attention in class. .76
6. I am good at maths. .62
7. I am good at reading. .57
Family involvement
1. I get along well with my parents. .86
2. I do things with my family. .82
3. My family makes me feel wanted. .79
4. I trust at least one person very much. .71
264
The Values in Action Inventory of Strengths for Youth (VIA; Peterson &
Seligman, 2004)
Most factor analyses of the VIA-Youth Inventory of Strengths do not
support the construct validity of the six virtue cluster model and instead propose a
four factor model that has been replicated across studies: temperance strengths (e.g.,
prudence, self-regulation), intellectual strengths (e.g., love of learning, curiosity),
theological or transcendence strengths (e.g., hope, religiousness, gratitude), and
other-directed strengths (modesty, kindness, teamwork) (Park & Peterson 2006a). In
agreement with the four factor model, McGrath and Walker’s (2016) recent
comprehensive analysis suggests two primarily interpersonal factors (general
engagement and other-directedness) with two other factors comprising intellectual
and self-control strengths.
Studies 1 and 2 (which utilised the shortened 96 item version of VIA-youth),
found that 10 of the 24 character strengths showed strong positive correlations with
the self-esteem domains. These were creativity, love of learning, perspective,
honesty, zest, hope, forgiveness, prudence, self-regulation and leadership. Three or
four items were selected for each of these 10 strengths from a total 4 items per
character strength in the shortened VIA for inclusion in the current study. Decision
for item selection were made on an item by item basis. Items were included if they
captured a different aspect of the same strength. For example, for creativity the
inclusion of ‘I often figure out different ways of doings things’ was included whilst
the item ‘I frequently have creative ideas’ was omitted. In total, 32 items were
included to measure character strengths (3 items assessing each of the following
character strengths - leadership, love of learning, perspective, creativity, self-
regulation, zest, forgiveness and honesty and 4 items assessing each of the character
265
strengths of hope and prudence) (see Table 4.3). All have strong factor loadings as
reported by Park and Peterson (2006).
Table 4.3 Factor Loadings of 96 item VIA for Youth (Park & Peterson, 2006)
Character strengths
Factor
Loadings
Creativity
1. I enjoy creating things that are new and different. .67
2. I often figure out different ways of doing things. .54
3. I see myself as a very creative person. .73
Love of Learning
1. I get excited when I see there is something new to learn. .64
2. I am energized by learning new things. .75
3. I love learning about how to do different things. .68
Perspective
1. Others tell me that I offer good advice to people. .60
2. My friends get my opinion before they make important decisions. .54
3. People tell me that I am a wise person .52
Honesty
1. I am honest even when lying could keep me from getting in trouble. .62
2. Others trust me to be truthful. .51
3. I tell the truth even when it means I won't get what I want. .59
Zest
1. I think that life is very exciting. .55
2. I am usually full of energy. .59
3. I have a lot of enthusiasm .61

266
Leadership
1. People look up to me as a leader and they give me their trust. .74
2. Others want me in charge when a group project needs to be done. .70
3. I am good at leading a group to get the job done. .63
Forgiveness
1. I often stay mad at people even when they apologise. .58
2. I am a forgiving person. .71
3. When someone apologizes, I give them a second chance. .74
Prudence
1. I review the consequences of my behaviour before I take action. .51
2. I think carefully before I act. .52
3. I am cautious not to do something that I will regret later. .50
4. I often find myself doing things that I know I shouldn't be doing.* .50
Self-Regulation
1. My temper often gets the best of me. .46
2. When I really want to do something right now, I am able to wait .32
3. I am able to control my anger really well. .49
Hope
1. I have a positive outlook on life. .68
2. I am certain I can get through bad things. .63
3. Even when things look bad, I stay hopeful. .66
4. I expect good things to come my way. * .61
Note. The two questions marked with *were not used in the analysis so that each character strength
had 3 items.
267
The Strengths Assessment Inventory – Youth Version (10-18 years) (SAI-Y;
Rawana & Brownlee, 2010; MacArthur, Rawana & Brownlee, 2011).
In Studies 1 and 2, seven of the 21 personal and contextual strengths were
found to have significant positive correlations with the self-esteem domains: activity
engagement; peer connectedness; competent coping skills; commitment to family
values; pro-social attitude; knowing myself and being involved. Within these seven
strengths, items with the highest factor loadings >.41 were taken from the Strengths
Assessment Inventory Manual (Rawana & Brownlee, 2010) to be included in the
current study. This resulted in a total of 31 items; 4 items measuring activity
engagement, 4 items measuring knowing myself, strength, 3 items measuring peer
connectedness, 5 items measuring competent coping skills, 5 items measuring
commitment to family values, 5 items measuring pro-social attitude and 5 items
measuring being involved (see Table 4.4).
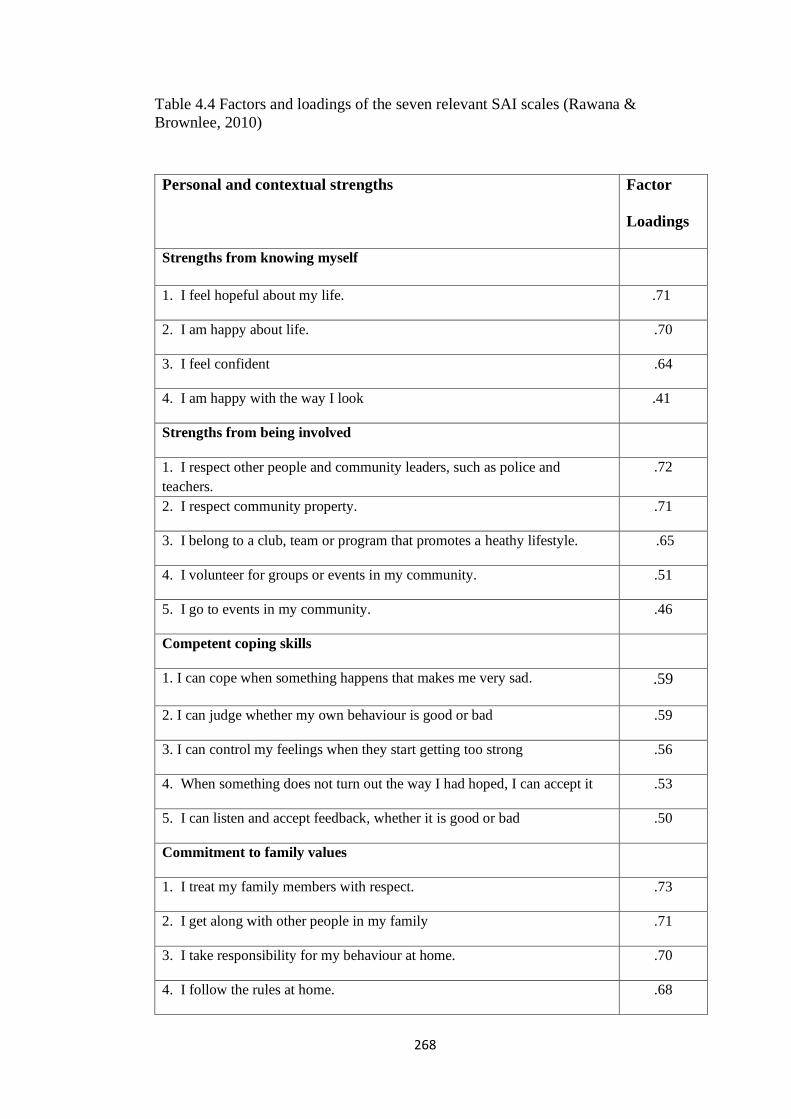
268
Table 4.4 Factors and loadings of the seven relevant SAI scales (Rawana &
Brownlee, 2010)
Personal and contextual strengths Factor
Loadings
Strengths from knowing myself
1. I feel hopeful about my life. .71
2. I am happy about life. .70
3. I feel confident .64
4. I am happy with the way I look .41
Strengths from being involved
1. I respect other people and community leaders, such as police and
teachers.
.72
2. I respect community property. .71
3. I belong to a club, team or program that promotes a heathy lifestyle. .65
4. I volunteer for groups or events in my community. .51
5. I go to events in my community. .46
Competent coping skills
1. I can cope when something happens that makes me very sad. .59
2. I can judge whether my own behaviour is good or bad .59
3. I can control my feelings when they start getting too strong .56
4. When something does not turn out the way I had hoped, I can accept it .53
5. I can listen and accept feedback, whether it is good or bad .50
Commitment to family values
1. I treat my family members with respect. .73
2. I get along with other people in my family .71
3. I take responsibility for my behaviour at home. .70
4. I follow the rules at home. .68
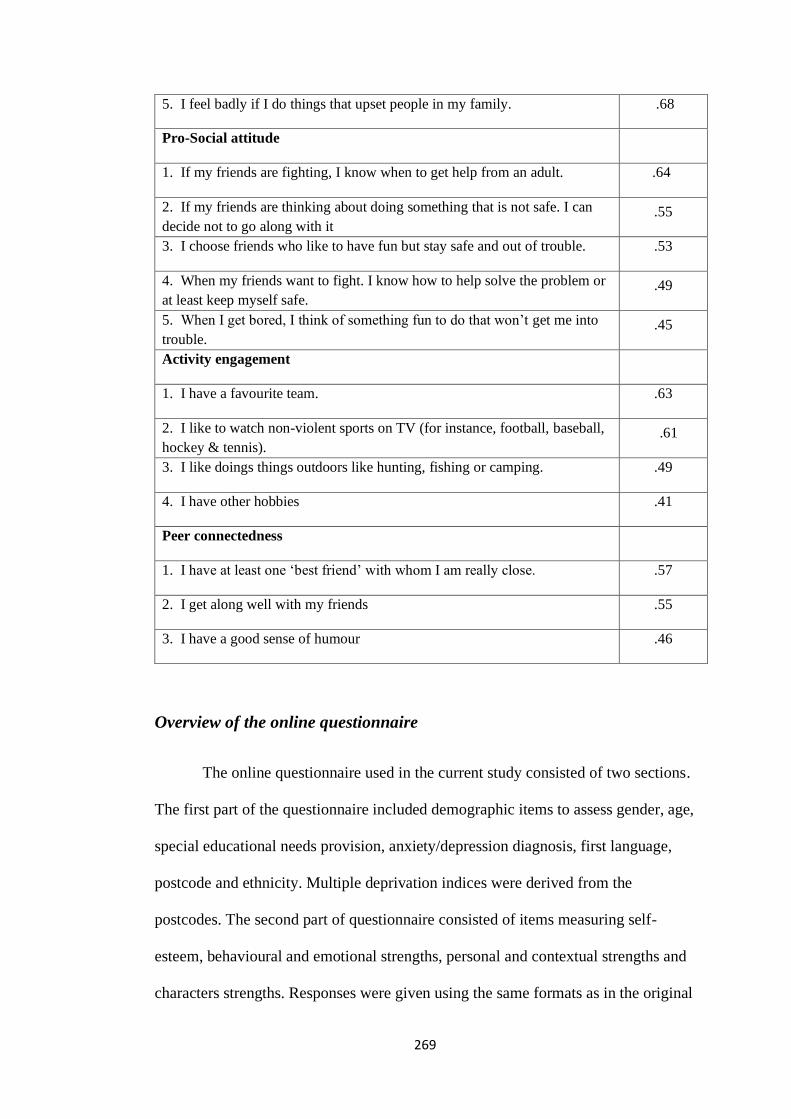
269
5. I feel badly if I do things that upset people in my family. .68
Pro-Social attitude
1. If my friends are fighting, I know when to get help from an adult. .64
2. If my friends are thinking about doing something that is not safe. I can
decide not to go along with it .55
3. I choose friends who like to have fun but stay safe and out of trouble. .53
4. When my friends want to fight. I know how to help solve the problem or
at least keep myself safe. .49
5. When I get bored, I think of something fun to do that won’t get me into
trouble. .45
Activity engagement
1. I have a favourite team. .63
2. I like to watch non-violent sports on TV (for instance, football, baseball,
hockey & tennis). .61
3. I like doings things outdoors like hunting, fishing or camping. .49
4. I have other hobbies .41
Peer connectedness
1. I have at least one ‘best friend’ with whom I am really close. .57
2. I get along well with my friends .55
3. I have a good sense of humour .46
Overview of the online questionnaire
The online questionnaire used in the current study consisted of two sections.
The first part of the questionnaire included demographic items to assess gender, age,
special educational needs provision, anxiety/depression diagnosis, first language,
postcode and ethnicity. Multiple deprivation indices were derived from the
postcodes. The second part of questionnaire consisted of items measuring self-
esteem, behavioural and emotional strengths, personal and contextual strengths and
characters strengths. Responses were given using the same formats as in the original
270
instruments (i.e., Yes/No responses for the CFSEI-3, 3, 4 and 5 point Likert scales
as appropriate for the other instruments). The items were worded exactly as in the
original instruments. The original VIA likert style measuring character strengths
responses ran from ‘not very much like me’ to ‘very much like me’. This response
pattern was reversed to run from ‘not very much like me’ to very much like me’ for
continuity with the rest of the questionnaire and ensuring that the higher scored
items represented positive responses.
Format of the online questionnaire
All the information and items were written in age appropriate wording to
ensure that the youngest of the potential participants (Year 7 – 10/11 years) could
fully understand the study’s objectives and the items included in the questionnaire.
To check its readability, the text was screened through the Flesch-Kincaid reading
ease score, obtaining a score of 88.4, a grade of about 5, the same reading level as
most comic books. This indicates that those with a reading age of 10 and above
would be able to comprehend both the participant information and consent
paragraph as well as the questionnaire items. In line with good practice the
questionnaire was designed to read better, removing ambiguous items, and being
easy to navigate with a quick completion time. Questionnaires were introduced and
administered by the form or class teacher, without the presence of the researcher
(Demetriou, Ozer, & Essau, 2015).
The participants were vulnerable due not only to age but due to potential
sensitivities (family circumstances, SEN, anxiety/depression). To mitigate any
potential effects of harm (even inadvertently) caused by answering the items, there
was appropriate signposting to their School’s pastoral team, counsellor or specific
mental health helpline number at the end of the questionnaire. Ethical approval was
271
given by Department of Psychology’s Research Ethics Committee at the University
of Sheffield. A pilot with a small sample of adolescents indicated the questionnaire
completion time was 10-15 minutes.
4.5.3 Procedure
Four secondary schools were approached and consented to participate in the
study. The initial email contact was sent by the school to the parent/carer describing
the survey and in an ‘opt out’ format giving a deadline to respond. This standard
format letter included a recommendation from the Head. Nulty (2008) indicates that
online questionnaires only have an average response rate of 33% (in comparison to
56% from paper questionnaires) so promotion from the Head and weekly email
reminders were circulated. A financial incentive in the form of a £100.00 Amazon
voucher (supplied by the Department of Psychology at the University of Sheffield)
was offered to the school with the highest percentage of completed questionnaires.
Three of the four schools scheduled a fixed allocated time within the school
timetable to complete the questionnaire (normally morning registration/form time).
The remaining school adopted a more flexible student-driven approach, allowing
participants to attend computer suites in lunchtime or through mobile devices.
Participant information consisting of description of study, voluntary participation,
risks, confidentiality, right to withdraw and consent paragraph was positioned on the
front page of the online questionnaire which was hosted on Qualtrics. See Appendix
N for timeline of recruitment of participants, design and implementation of the
questionnaire.
272
4.6 Results
Nine hundred and fifty-three adolescents aged between 10-17 years
completed the online questionnaire (see Table 4.5). The sample comprised 664
females and 227 males (other n = 26) with a mean age 13.35 (SD = 1.51), 66%
white, 13.5% SEN provison and 7.3% self-identified as experiencing anxiety and
4.4 % self-identified as experiencing depression. From the sample, 32.8 % were
identified as living in the 50% most deprived deciles.
A response rate of 44.3% was achieved, masking large inter school
differences (School 1, 74%, School 2, 79%, School 3, 79%, School 4, 9 %). Two
parents responded from School 3 and two responded from School 2 to opt out of the
questionnaire. Missing data on the dependent variable, the self-esteem domains,
ranged from 6.2 % of personal self-esteem to 16.8% of academic self-esteem (see
Table 4.6).
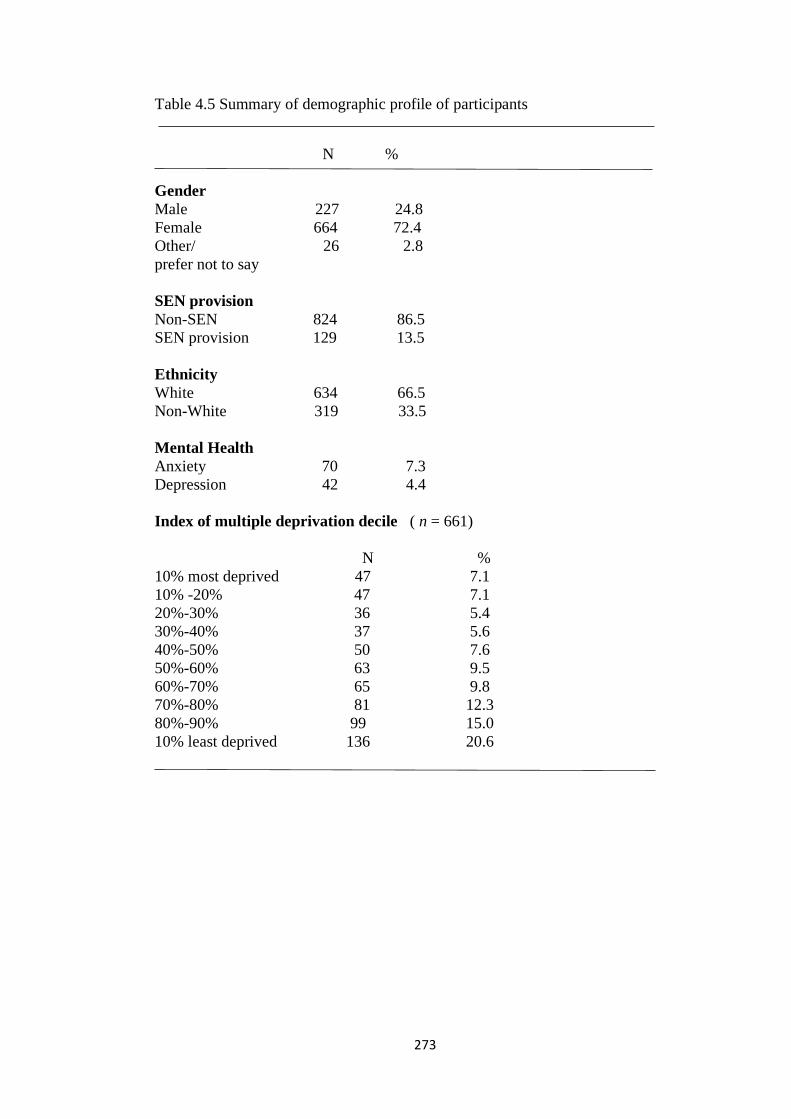
273
Table 4.5 Summary of demographic profile of participants
N
%
Gender
Male 227 24.8
Female 664 72.4
Other/ 26 2.8
prefer not to say
SEN provision
Non-SEN 824 86.5
SEN provision 129 13.5
Ethnicity
White 634 66.5
Non-White 319 33.5
Mental Health
Anxiety 70 7.3
Depression 42 4.4
Index of multiple deprivation decile ( n = 661)
N %
10% most deprived 47 7.1
10% -20% 47 7.1
20%-30% 36 5.4
30%-40% 37 5.6
40%-50% 50 7.6
50%-60% 63 9.5
60%-70% 65 9.8
70%-80% 81 12.3
80%-90% 99 15.0
10% least deprived 136 20.6
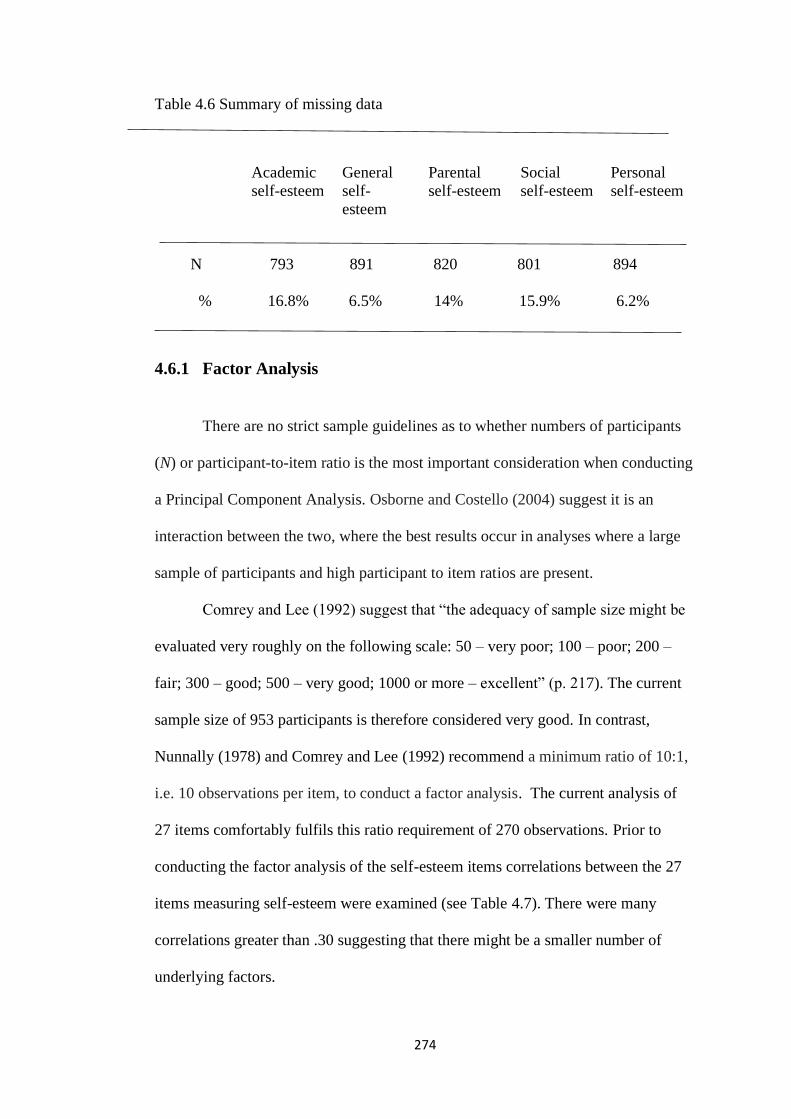
274
Table 4.6 Summary of missing data
Academic
self-esteem
General
self-
esteem
Parental
self-esteem
Social
self-esteem
Personal
self-esteem
N 793 891 820 801 894
% 16.8% 6.5% 14% 15.9% 6.2%
4.6.1 Factor Analysis
There are no strict sample guidelines as to whether numbers of participants
(N) or participant-to-item ratio is the most important consideration when conducting
a Principal Component Analysis. Osborne and Costello (2004) suggest it is an
interaction between the two, where the best results occur in analyses where a large
sample of participants and high participant to item ratios are present.
Comrey and Lee (1992) suggest that “the adequacy of sample size might be
evaluated very roughly on the following scale: 50 – very poor; 100 – poor; 200 –
fair; 300 – good; 500 – very good; 1000 or more – excellent” (p. 217). The current
sample size of 953 participants is therefore considered very good. In contrast,
Nunnally (1978) and Comrey and Lee (1992) recommend a minimum ratio of 10:1,
i.e. 10 observations per item, to conduct a factor analysis. The current analysis of
27 items comfortably fulfils this ratio requirement of 270 observations. Prior to
conducting the factor analysis of the self-esteem items correlations between the 27
items measuring self-esteem were examined (see Table 4.7). There were many
correlations greater than .30 suggesting that there might be a smaller number of
underlying factors.
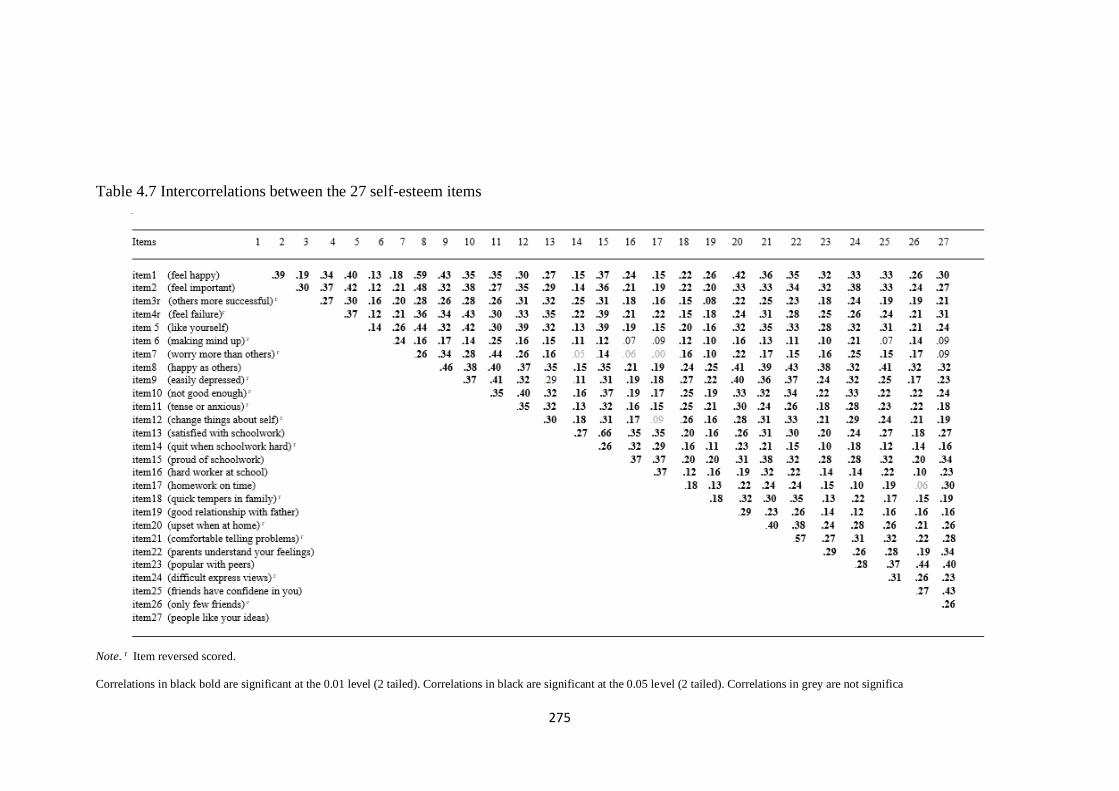
275
Table 4.7 Intercorrelations between the 27 self-esteem items
Note. r Item reversed scored.
Correlations in black bold are significant at the 0.01 level (2 tailed). Correlations in black are significant at the 0.05 level (2 tailed). Correlations in grey are not significa
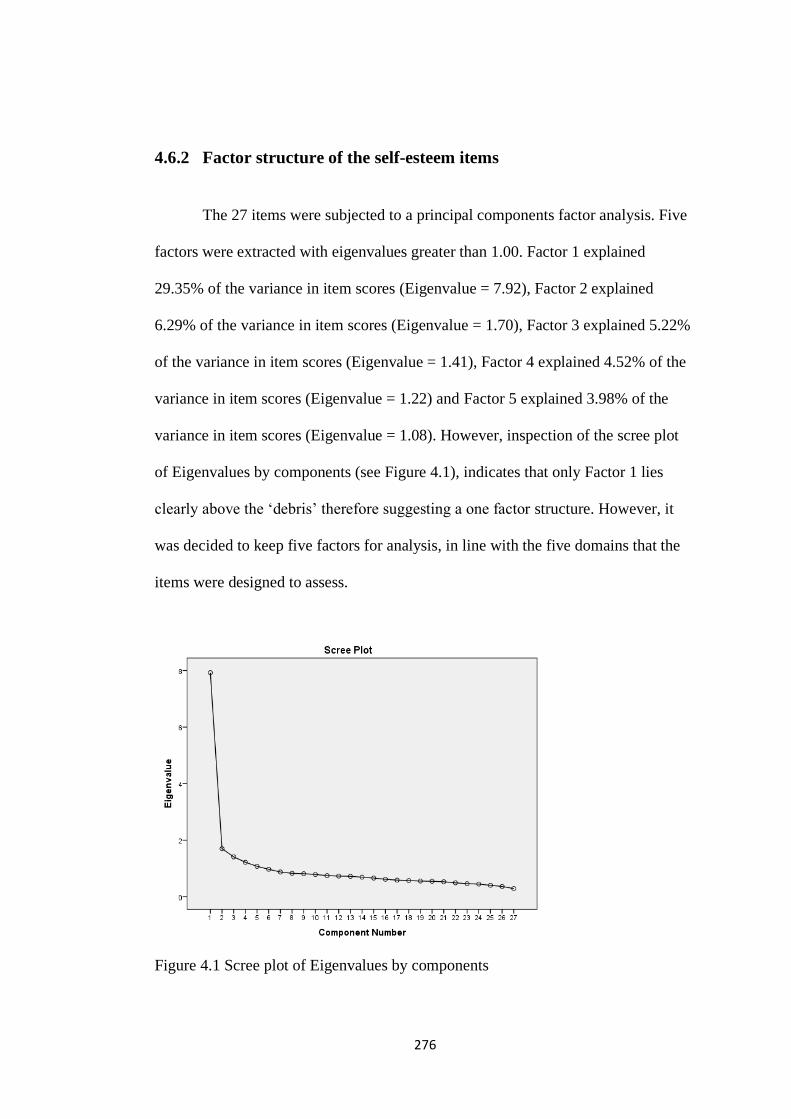
276
4.6.2 Factor structure of the self-esteem items
The 27 items were subjected to a principal components factor analysis. Five
factors were extracted with eigenvalues greater than 1.00. Factor 1 explained
29.35% of the variance in item scores (Eigenvalue = 7.92), Factor 2 explained
6.29% of the variance in item scores (Eigenvalue = 1.70), Factor 3 explained 5.22%
of the variance in item scores (Eigenvalue = 1.41), Factor 4 explained 4.52% of the
variance in item scores (Eigenvalue = 1.22) and Factor 5 explained 3.98% of the
variance in item scores (Eigenvalue = 1.08). However, inspection of the scree plot
of Eigenvalues by components (see Figure 4.1), indicates that only Factor 1 lies
clearly above the ‘debris’ therefore suggesting a one factor structure. However, it
was decided to keep five factors for analysis, in line with the five domains that the
items were designed to assess.
Figure 4.1 Scree plot of Eigenvalues by components
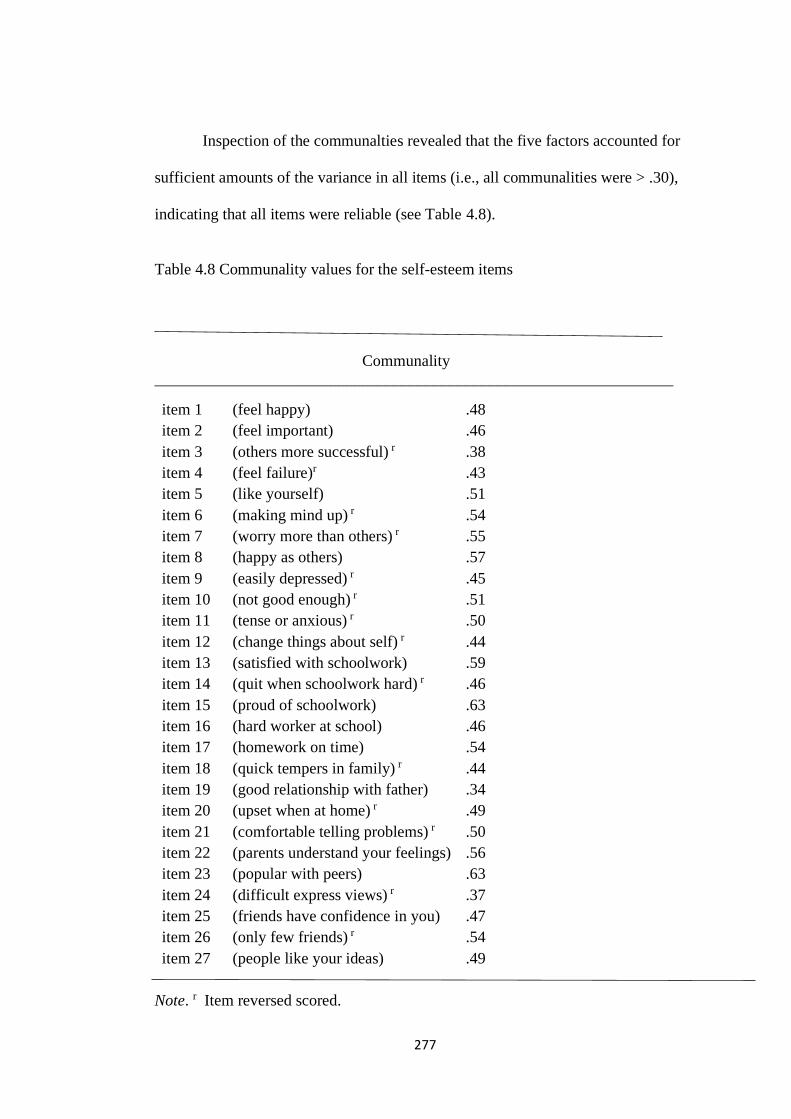
277
Inspection of the communalties revealed that the five factors accounted for
sufficient amounts of the variance in all items (i.e., all communalities were > .30),
indicating that all items were reliable (see Table 4.8).
Table 4.8 Communality values for the self-esteem items
Communality
_________________________________________________________________
item 1 (feel happy) .48
item 2 (feel important) .46
item 3 (others more successful) r .38
item 4 (feel failure)r .43
item 5 (like yourself) .51
item 6 (making mind up) r .54
item 7 (worry more than others) r .55
item 8 (happy as others) .57
item 9 (easily depressed) r .45
item 10 (not good enough) r .51
item 11 (tense or anxious) r .50
item 12 (change things about self) r .44
item 13 (satisfied with schoolwork) .59
item 14 (quit when schoolwork hard) r .46
item 15 (proud of schoolwork) .63
item 16 (hard worker at school) .46
item 17 (homework on time) .54
item 18 (quick tempers in family) r .44
item 19 (good relationship with father) .34
item 20 (upset when at home) r .49
item 21 (comfortable telling problems) r .50
item 22 (parents understand your feelings) .56
item 23 (popular with peers) .63
item 24 (difficult express views) r .37
item 25 (friends have confidence in you) .47
item 26 (only few friends) r .54
item 27 (people like your ideas) .49
Note. r Item reversed scored.
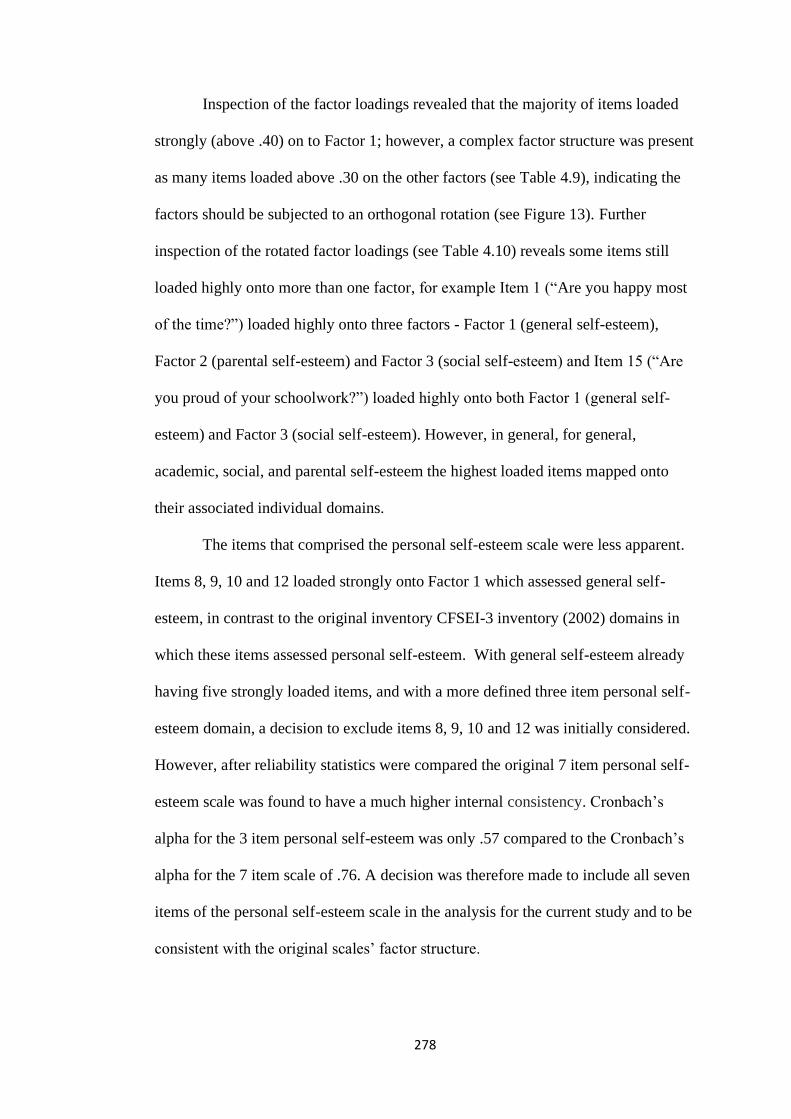
278
Inspection of the factor loadings revealed that the majority of items loaded
strongly (above .40) on to Factor 1; however, a complex factor structure was present
as many items loaded above .30 on the other factors (see Table 4.9), indicating the
factors should be subjected to an orthogonal rotation (see Figure 13). Further
inspection of the rotated factor loadings (see Table 4.10) reveals some items still
loaded highly onto more than one factor, for example Item 1 (“Are you happy most
of the time?”) loaded highly onto three factors - Factor 1 (general self-esteem),
Factor 2 (parental self-esteem) and Factor 3 (social self-esteem) and Item 15 (“Are
you proud of your schoolwork?”) loaded highly onto both Factor 1 (general self-
esteem) and Factor 3 (social self-esteem). However, in general, for general,
academic, social, and parental self-esteem the highest loaded items mapped onto
their associated individual domains.
The items that comprised the personal self-esteem scale were less apparent.
Items 8, 9, 10 and 12 loaded strongly onto Factor 1 which assessed general self-
esteem, in contrast to the original inventory CFSEI-3 inventory (2002) domains in
which these items assessed personal self-esteem. With general self-esteem already
having five strongly loaded items, and with a more defined three item personal self-
esteem domain, a decision to exclude items 8, 9, 10 and 12 was initially considered.
However, after reliability statistics were compared the original 7 item personal self-
esteem scale was found to have a much higher internal consistency. Cronbach’s
alpha for the 3 item personal self-esteem was only .57 compared to the Cronbach’s
alpha for the 7 item scale of .76. A decision was therefore made to include all seven
items of the personal self-esteem scale in the analysis for the current study and to be
consistent with the original scales’ factor structure.
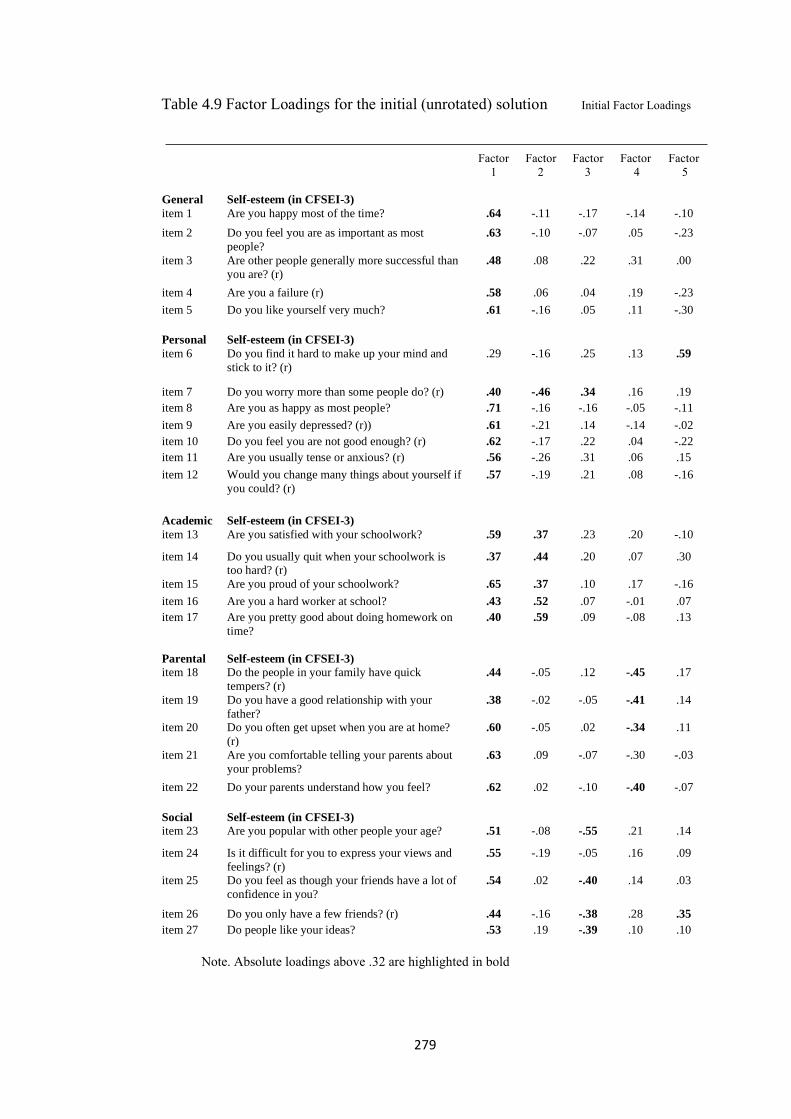
279
Table 4.9 Factor Loadings for the initial (unrotated) solution Initial Factor Loadings
Note. Absolute loadings above .32 are highlighted in bold
Factor
1
Factor
2
Factor
3
Factor
4
Factor
5
General
item 1
Self-esteem (in CFSEI-3)
Are you happy most of the time?
.64
-.11
-.17
-.14
-.10
item 2 Do you feel you are as important as most
people?
.63 -.10 -.07 .05 -.23
item 3 Are other people generally more successful than
you are? (r)
.48 .08 .22 .31 .00
item 4 Are you a failure (r) .58 .06 .04 .19 -.23
item 5 Do you like yourself very much? .61 -.16 .05 .11 -.30
Personal
item 6
Self-esteem (in CFSEI-3)
Do you find it hard to make up your mind and
stick to it? (r)
.29
-.16
.25
.13
.59
item 7 Do you worry more than some people do? (r) .40 -.46 .34 .16 .19
item 8 Are you as happy as most people? .71 -.16 -.16 -.05 -.11
item 9 Are you easily depressed? (r)) .61 -.21 .14 -.14 -.02
item 10 Do you feel you are not good enough? (r) .62 -.17 .22 .04 -.22
item 11 Are you usually tense or anxious? (r) .56 -.26 .31 .06 .15
item 12 Would you change many things about yourself if
you could? (r)
.57 -.19 .21 .08 -.16
Academic
item 13
Self-esteem (in CFSEI-3)
Are you satisfied with your schoolwork?
.59
.37
.23
.20
-.10
item 14 Do you usually quit when your schoolwork is too hard? (r)
.37 .44 .20 .07 .30
item 15 Are you proud of your schoolwork? .65 .37 .10 .17 -.16
item 16 Are you a hard worker at school? .43 .52 .07 -.01 .07
item 17 Are you pretty good about doing homework on
time?
.40 .59 .09 -.08 .13
Parental
item 18
Self-esteem (in CFSEI-3)
Do the people in your family have quick
tempers? (r)
.44
-.05
.12
-.45
.17
item 19 Do you have a good relationship with your
father?
.38 -.02 -.05 -.41 .14
item 20 Do you often get upset when you are at home?
(r)
.60 -.05 .02 -.34 .11
item 21 Are you comfortable telling your parents about
your problems?
.63 .09 -.07 -.30 -.03
item 22 Do your parents understand how you feel? .62 .02 -.10 -.40 -.07
Social
item 23
Self-esteem (in CFSEI-3)
Are you popular with other people your age?
.51
-.08
-.55
.21
.14
item 24 Is it difficult for you to express your views and
feelings? (r)
.55 -.19 -.05 .16 .09
item 25 Do you feel as though your friends have a lot of
confidence in you?
.54 .02 -.40 .14 .03
item 26 Do you only have a few friends? (r) .44 -.16 -.38 .28 .35
item 27 Do people like your ideas? .53 .19 -.39 .10 .10
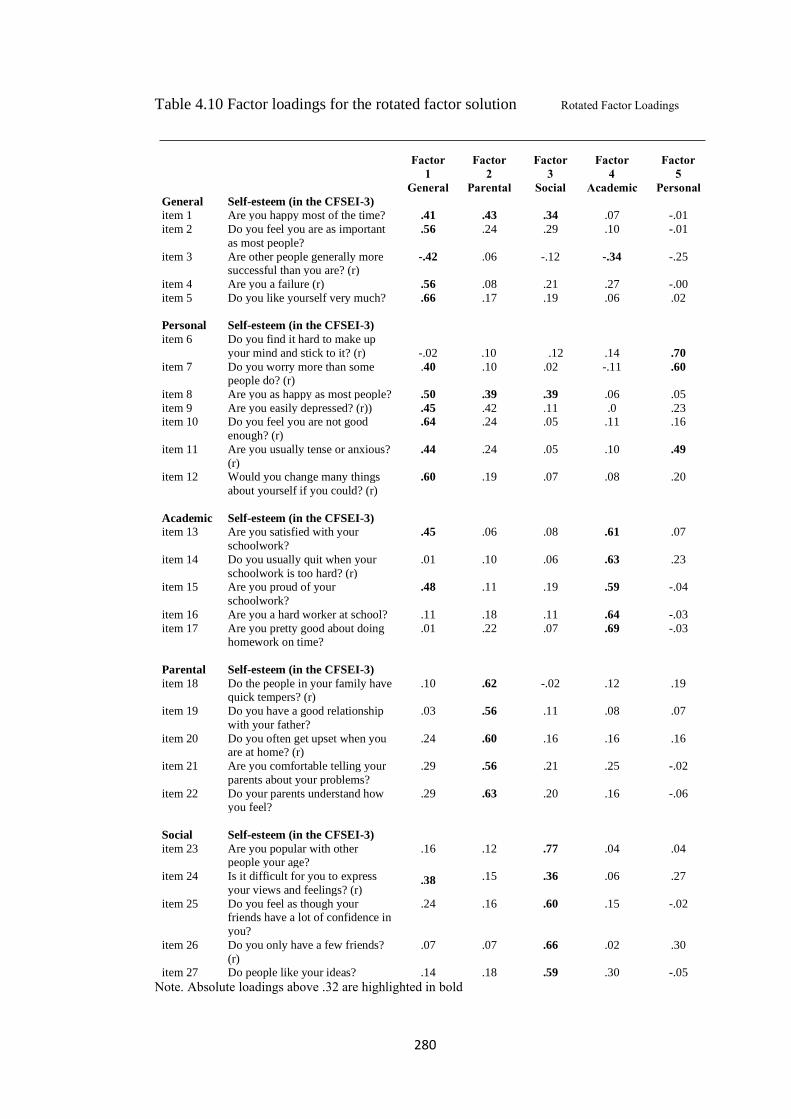
280
Table 4.10 Factor loadings for the rotated factor solution Rotated Factor Loadings
Factor
1
General
Factor
2
Parental
Factor
3
Social
Factor
4
Academic
Factor
5
Personal
General
item 1 Self-esteem (in the CFSEI-3)
Are you happy most of the time?
.41
.43
.34
.07
-.01
item 2 Do you feel you are as important
as most people?
.56 .24 .29 .10 -.01
item 3 Are other people generally more successful than you are? (r)
-.42 .06 -.12 -.34 -.25
item 4 Are you a failure (r) .56 .08 .21 .27 -.00
item 5 Do you like yourself very much? .66 .17 .19 .06 .02
Personal
item 6
Self-esteem (in the CFSEI-3)
Do you find it hard to make up
your mind and stick to it? (r)
-.02
.10
.12
.14
.70
item 7 Do you worry more than some people do? (r)
.40 .10 .02 -.11 .60
item 8 Are you as happy as most people? .50 .39 .39 .06 .05
item 9 Are you easily depressed? (r)) .45 .42 .11 .0 .23 item 10 Do you feel you are not good
enough? (r)
.64 .24 .05 .11 .16
item 11 Are you usually tense or anxious?
(r)
.44 .24 .05 .10 .49
item 12 Would you change many things
about yourself if you could? (r)
.60 .19 .07 .08 .20
Academic
item 13
Self-esteem (in the CFSEI-3)
Are you satisfied with your
schoolwork?
.45
.06
.08
.61
.07
item 14 Do you usually quit when your
schoolwork is too hard? (r)
.01 .10 .06 .63 .23
item 15 Are you proud of your
schoolwork?
.48 .11 .19 .59 -.04
item 16 Are you a hard worker at school? .11 .18 .11 .64 -.03
item 17 Are you pretty good about doing homework on time?
.01 .22 .07 .69 -.03
Parental
item 18
Self-esteem (in the CFSEI-3)
Do the people in your family have quick tempers? (r)
.10
.62
-.02
.12
.19
item 19 Do you have a good relationship
with your father?
.03 .56 .11 .08 .07
item 20 Do you often get upset when you are at home? (r)
.24 .60 .16 .16 .16
item 21 Are you comfortable telling your
parents about your problems?
.29 .56 .21 .25 -.02
item 22 Do your parents understand how
you feel?
.29 .63 .20 .16 -.06
Social
item 23
Self-esteem (in the CFSEI-3)
Are you popular with other people your age?
.16
.12
.77
.04
.04
item 24 Is it difficult for you to express
your views and feelings? (r)
.38 .15 .36 .06 .27
item 25 Do you feel as though your friends have a lot of confidence in
you?
.24 .16 .60 .15 -.02
item 26 Do you only have a few friends?
(r)
.07 .07 .66 .02 .30
item 27 Do people like your ideas? .14 .18 .59 .30 -.05
Note. Absolute loadings above .32 are highlighted in bold
.38
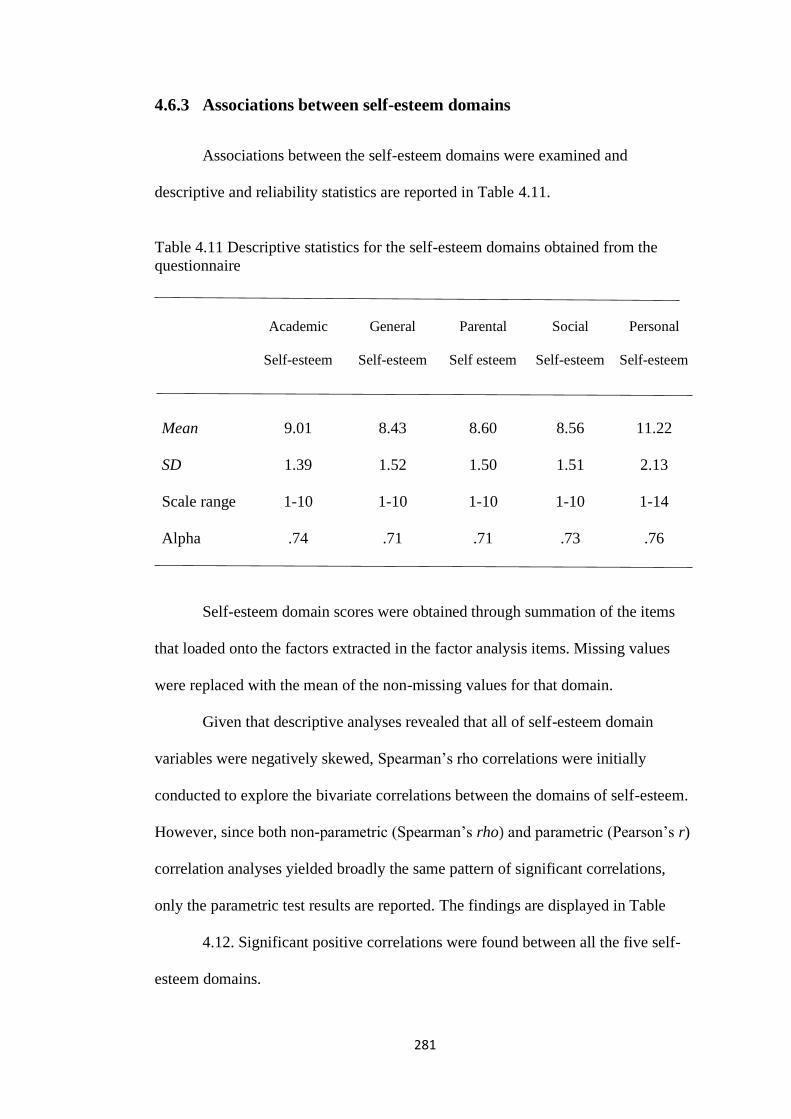
281
4.6.3 Associations between self-esteem domains
Associations between the self-esteem domains were examined and
descriptive and reliability statistics are reported in Table 4.11.
Table 4.11 Descriptive statistics for the self-esteem domains obtained from the
questionnaire
Academic
Self-esteem
General
Self-esteem
Parental
Self esteem
Social
Self-esteem
Personal
Self-esteem
Mean 9.01 8.43 8.60 8.56 11.22
SD
Scale range
Alpha
1.39
1-10
.74
1.52
1-10
.71
1.50
1-10
.71
1.51
1-10
.73
2.13
1-14
.76
Self-esteem domain scores were obtained through summation of the items
that loaded onto the factors extracted in the factor analysis items. Missing values
were replaced with the mean of the non-missing values for that domain.
Given that descriptive analyses revealed that all of self-esteem domain
variables were negatively skewed, Spearman’s rho correlations were initially
conducted to explore the bivariate correlations between the domains of self-esteem.
However, since both non-parametric (Spearman’s rho) and parametric (Pearson’s r)
correlation analyses yielded broadly the same pattern of significant correlations,
only the parametric test results are reported. The findings are displayed in Table
4.12. Significant positive correlations were found between all the five self-
esteem domains.
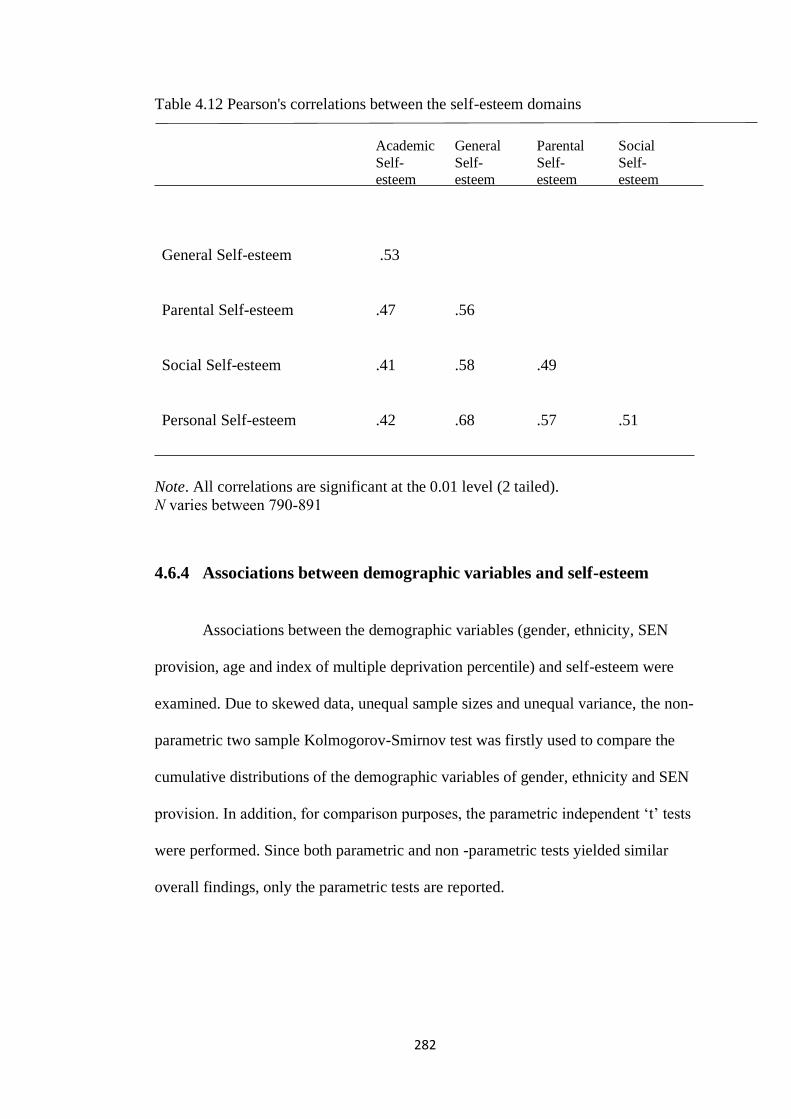
282
Table 4.12 Pearson's correlations between the self-esteem domains
Note. All correlations are significant at the 0.01 level (2 tailed).
N varies between 790-891
4.6.4 Associations between demographic variables and self-esteem
Associations between the demographic variables (gender, ethnicity, SEN
provision, age and index of multiple deprivation percentile) and self-esteem were
examined. Due to skewed data, unequal sample sizes and unequal variance, the non-
parametric two sample Kolmogorov-Smirnov test was firstly used to compare the
cumulative distributions of the demographic variables of gender, ethnicity and SEN
provision. In addition, for comparison purposes, the parametric independent ‘t’ tests
were performed. Since both parametric and non -parametric tests yielded similar
overall findings, only the parametric tests are reported.
Academic
Self-
esteem
General
Self-
esteem
Parental
Self-
esteem
Social
Self-
esteem
General Self-esteem .53
Parental Self-esteem
.47
.56
Social Self-esteem
.41
.58
.49
Personal Self-esteem
.42
.68
.57
.51
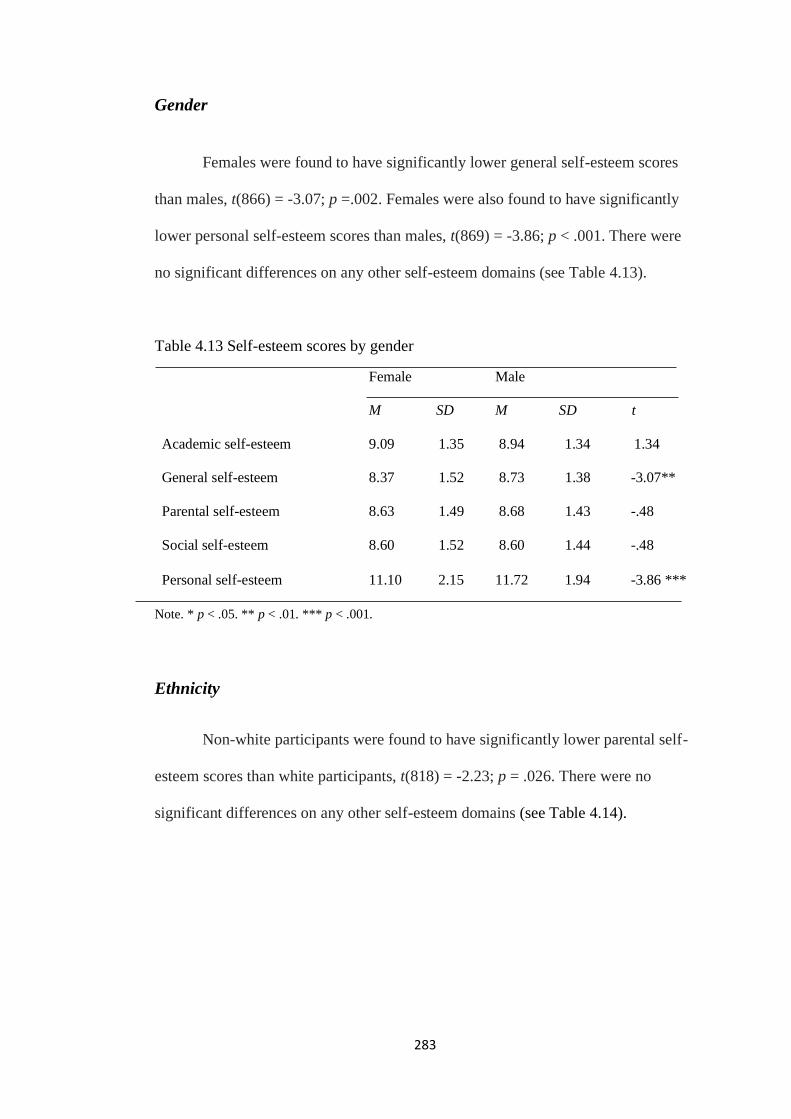
283
Gender
Females were found to have significantly lower general self-esteem scores
than males, t(866) = -3.07; p =.002. Females were also found to have significantly
lower personal self-esteem scores than males, t(869) = -3.86; p < .001. There were
no significant differences on any other self-esteem domains (see Table 4.13).
Table 4.13 Self-esteem scores by gender
Female
M SD
Male
M SD t
Academic self-esteem
General self-esteem
9.09 1.35
8.37 1.52
8.94 1.34 1.34
8.73 1.38 -3.07**
Parental self-esteem 8.63 1.49 8.68 1.43 -.48
Social self-esteem 8.60 1.52 8.60 1.44 -.48
Personal self-esteem 11.10 2.15 11.72 1.94 -3.86 ***
Note. * p < .05. ** p < .01. *** p < .001.
Ethnicity
Non-white participants were found to have significantly lower parental self-
esteem scores than white participants, t(818) = -2.23; p = .026. There were no
significant differences on any other self-esteem domains (see Table 4.14).
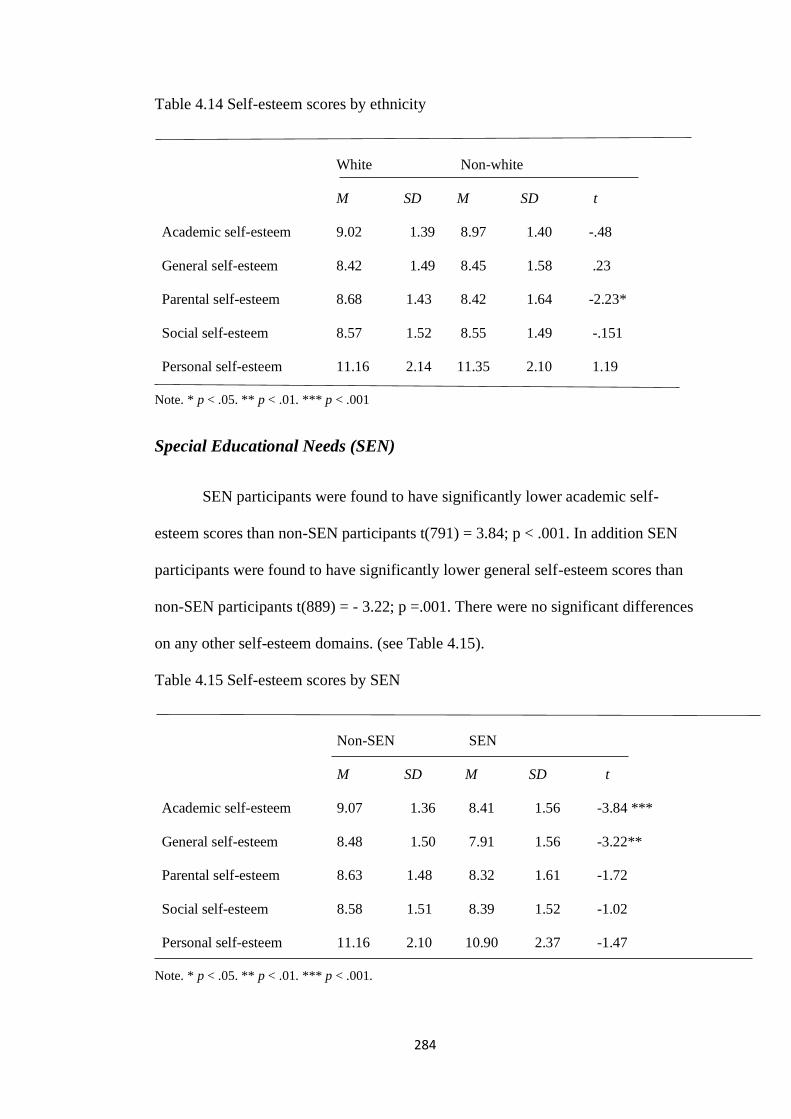
284
Table 4.14 Self-esteem scores by ethnicity
White
M SD
Non-white
M SD t
Academic self-esteem 9.02 1.39 8.97 1.40 -.48
General self-esteem 8.42 1.49 8.45 1.58 .23
Parental self-esteem 8.68 1.43 8.42 1.64 -2.23*
Social self-esteem 8.57 1.52 8.55 1.49 -.151
Personal self-esteem 11.16 2.14 11.35 2.10 1.19
Note. * p < .05. ** p < .01. *** p < .001
Special Educational Needs (SEN)
SEN participants were found to have significantly lower academic self-
esteem scores than non-SEN participants t(791) = 3.84; p < .001. In addition SEN
participants were found to have significantly lower general self-esteem scores than
non-SEN participants t(889) = - 3.22; p =.001. There were no significant differences
on any other self-esteem domains. (see Table 4.15).
Table 4.15 Self-esteem scores by SEN
Non-SEN
M SD
SEN
M SD t
Academic self-esteem 9.07 1.36 8.41 1.56 -3.84 ***
General self-esteem 8.48 1.50 7.91 1.56 -3.22**
Parental self-esteem 8.63 1.48 8.32 1.61 -1.72
Social self-esteem 8.58 1.51 8.39 1.52 -1.02
Personal self-esteem 11.16 2.10 10.90 2.37 -1.47
Note. * p < .05. ** p < .01. *** p < .001.
285
Age
Age was found to have significant negative correlations with all self-esteem
domains: academic self-esteem, r(793) = -.25, p < .001; parental self-esteem, r(820)
= - . 26, p < .001; social self-esteem, r(801) = -.13, p < .001; general self-esteem,
r(890) = - .21, p < .001; and personal self-esteem ( r(893) = - .28
Index of Multiple Deprivation
Participants’ multiple deprivation decile was significantly and positively
correlated with academic self-esteem, r(584) =.10, p = .011, and social self-esteem,
r(589) = .09, p = .022. Correlations with the other self-esteem domains were non-
significant.
4.6.5 Correlations between strengths and self-esteem
Significant positive correlations were found between behavioural and
emotional, personal and contextual and character strengths and all self-esteem
domains (see Table 4.16).
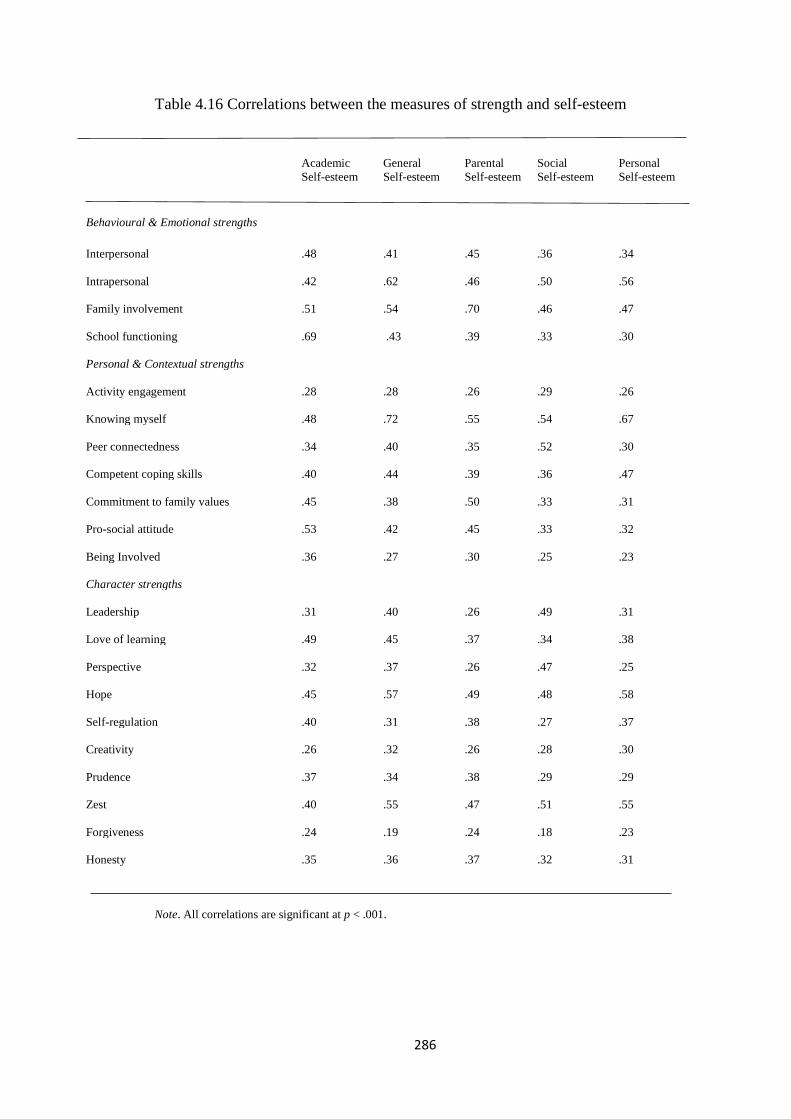
286
Table 4.16 Correlations between the measures of strength and self-esteem
Academic
Self-esteem
General
Self-esteem
Parental
Self-esteem
Social
Self-esteem Personal
Self-esteem
Behavioural & Emotional strengths
Interpersonal
.48
.41
.45
.36
.34
Intrapersonal
.42
.62
.46
.50
.56 Family involvement
.51
.54
.70
.46
.47
School functioning
.69
.43
.39
.33
.30 Personal & Contextual strengths
Activity engagement
.28
.28
.26
.29
.26 Knowing myself
.48
.72
.55
.54
.67
Peer connectedness
.34
.40
.35
.52
.30 Competent coping skills
.40
.44
.39
.36
.47
Commitment to family values
.45
.38
.50
.33
.31 Pro-social attitude
.53
.42
.45
.33
.32
Being Involved
.36
.27
.30
.25
.23 Character strengths
Leadership
.31
.40
.26
.49
.31 Love of learning
.49
.45
.37
.34
.38
Perspective
.32
.37
.26
.47
.25 Hope
.45
.57
.49
.48
.58
Self-regulation
.40
.31
.38
.27
.37 Creativity
.26
.32
.26
.28
.30
Prudence
.37
.34
.38
.29
.29 Zest
.40
.55
.47
.51
.55
Forgiveness
.24
.19
.24
.18
.23 Honesty
.35
.36
.37
.32
.31
Note. All correlations are significant at p < .001.
287
4.6.6 Inter-correlations between strengths
Significant positive correlations were found between behavioural and
emotional, personal and contextual and character strengths (see Table 4.17).
However, there was no evidence of multicollinearity among the independent
variables.
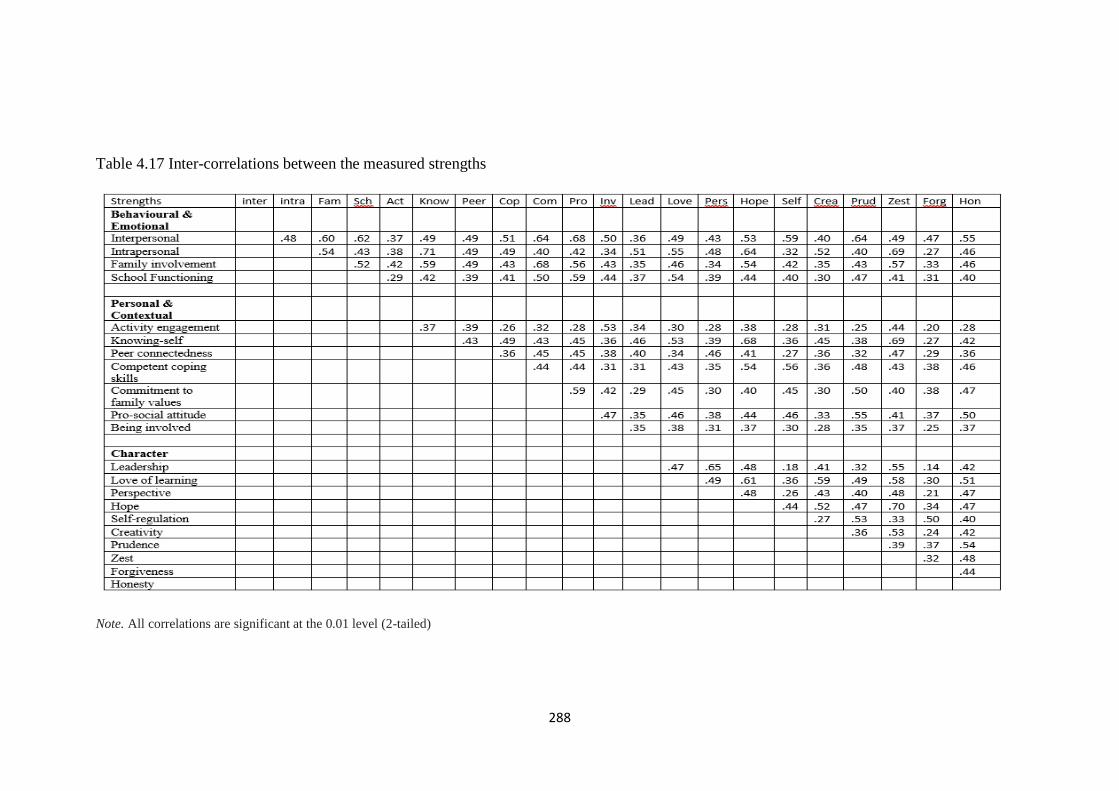
288
Table 4.17 Inter-correlations between the measured strengths
Note. All correlations are significant at the 0.01 level (2-tailed)
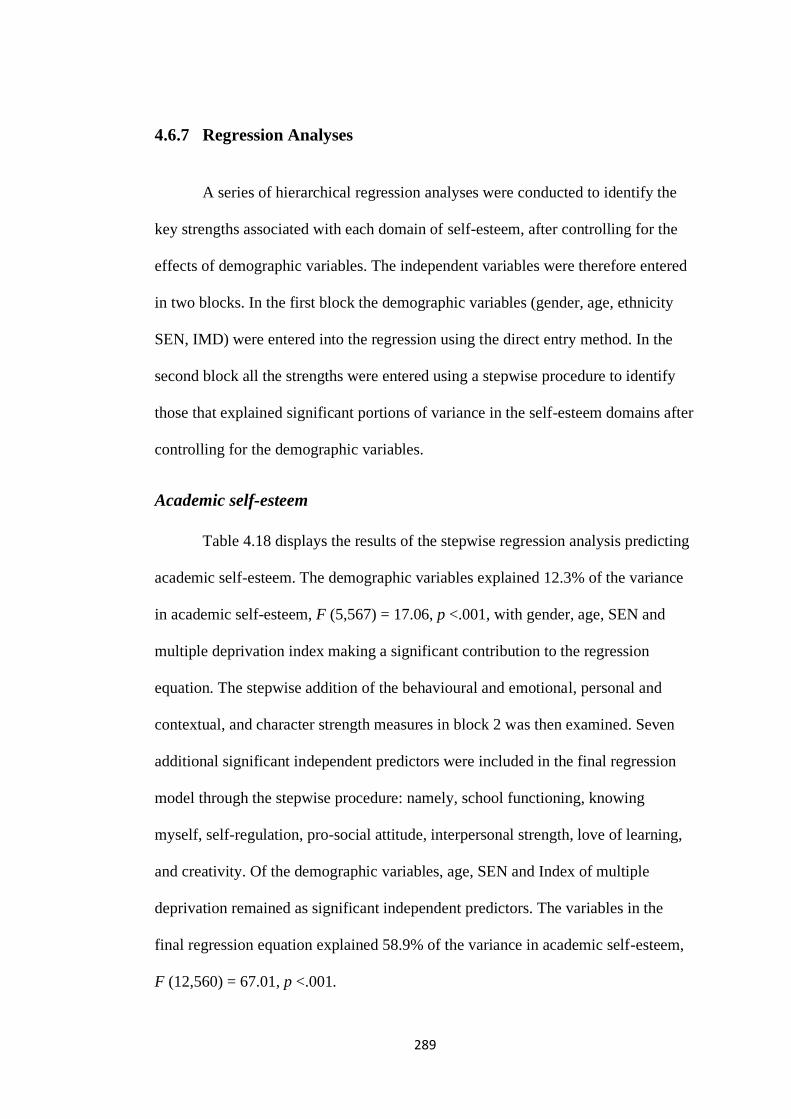
289
4.6.7 Regression Analyses
A series of hierarchical regression analyses were conducted to identify the
key strengths associated with each domain of self-esteem, after controlling for the
effects of demographic variables. The independent variables were therefore entered
in two blocks. In the first block the demographic variables (gender, age, ethnicity
SEN, IMD) were entered into the regression using the direct entry method. In the
second block all the strengths were entered using a stepwise procedure to identify
those that explained significant portions of variance in the self-esteem domains after
controlling for the demographic variables.
Academic self-esteem
Table 4.18 displays the results of the stepwise regression analysis predicting
academic self-esteem. The demographic variables explained 12.3% of the variance
in academic self-esteem, F (5,567) = 17.06, p <.001, with gender, age, SEN and
multiple deprivation index making a significant contribution to the regression
equation. The stepwise addition of the behavioural and emotional, personal and
contextual, and character strength measures in block 2 was then examined. Seven
additional significant independent predictors were included in the final regression
model through the stepwise procedure: namely, school functioning, knowing
myself, self-regulation, pro-social attitude, interpersonal strength, love of learning,
and creativity. Of the demographic variables, age, SEN and Index of multiple
deprivation remained as significant independent predictors. The variables in the
final regression equation explained 58.9% of the variance in academic self-esteem,
F (12,560) = 67.01, p <.001.
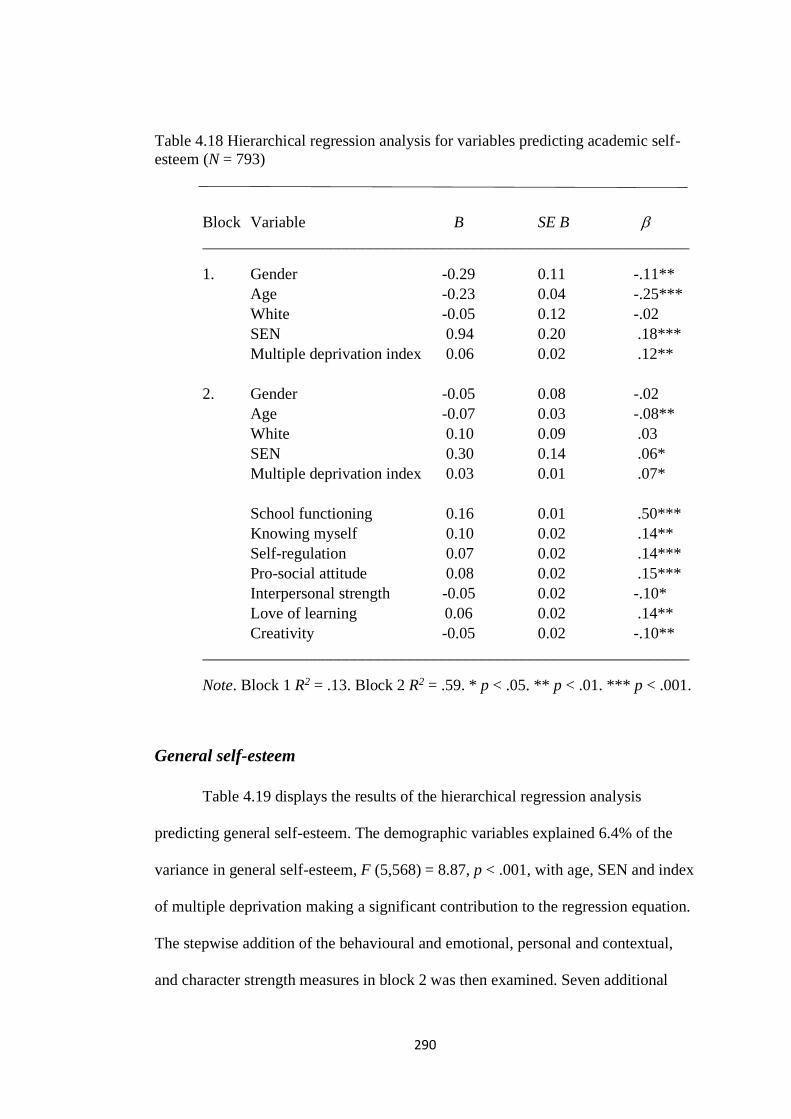
290
Table 4.18 Hierarchical regression analysis for variables predicting academic self-
esteem (N = 793)
Block Variable B SE B
_____________________________________________________________
1. Gender -0.29 0.11 -.11**
Age -0.23 0.04 -.25***
White -0.05 0.12 -.02
SEN 0.94 0.20 .18***
Multiple deprivation index 0.06 0.02 .12**
2. Gender -0.05 0.08 -.02
Age -0.07 0.03 -.08**
White 0.10 0.09 .03
SEN 0.30 0.14 .06*
Multiple deprivation index 0.03 0.01 .07*
School functioning 0.16 0.01 .50***
Knowing myself 0.10 0.02 .14**
Self-regulation 0.07 0.02 .14***
Pro-social attitude 0.08 0.02 .15***
Interpersonal strength -0.05 0.02 -.10*
Love of learning 0.06 0.02 .14**
Creativity -0.05 0.02 -.10**
_____________________________________________________________
Note. Block 1 R2 = .13. Block 2 R2 = .59. * p < .05. ** p < .01. *** p < .001.
General self-esteem
Table 4.19 displays the results of the hierarchical regression analysis
predicting general self-esteem. The demographic variables explained 6.4% of the
variance in general self-esteem, F (5,568) = 8.87, p < .001, with age, SEN and index
of multiple deprivation making a significant contribution to the regression equation.
The stepwise addition of the behavioural and emotional, personal and contextual,
and character strength measures in block 2 was then examined. Seven additional
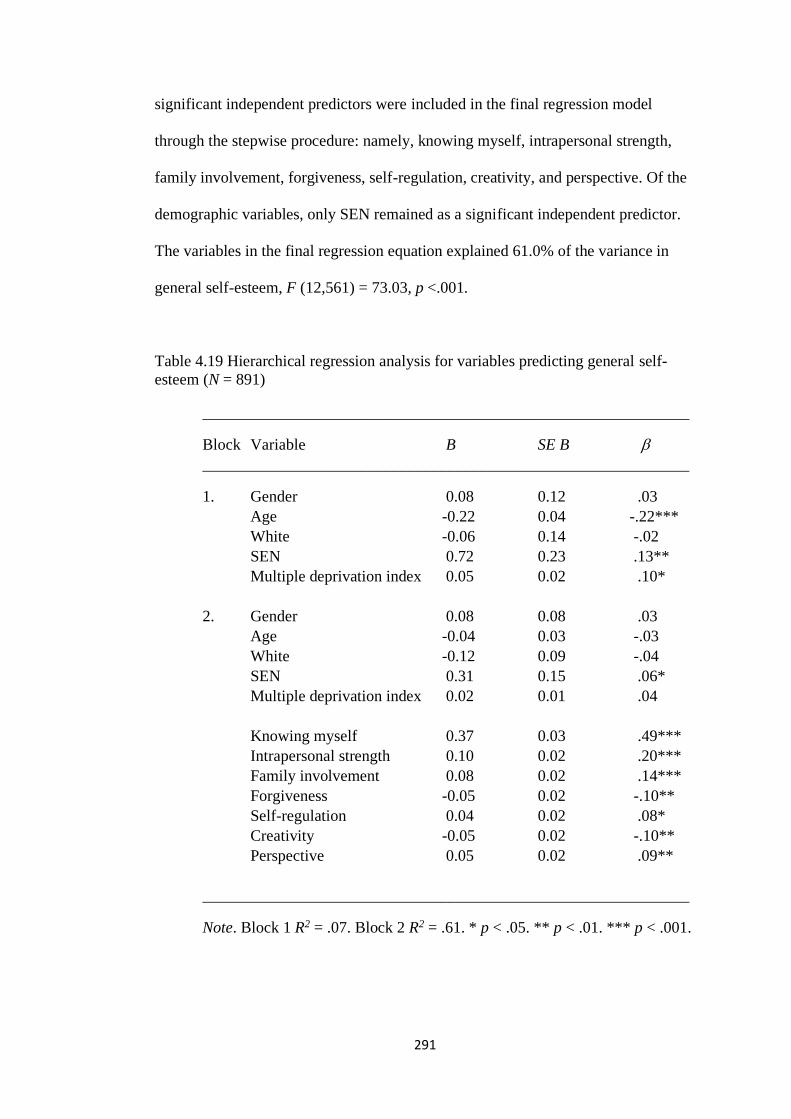
291
significant independent predictors were included in the final regression model
through the stepwise procedure: namely, knowing myself, intrapersonal strength,
family involvement, forgiveness, self-regulation, creativity, and perspective. Of the
demographic variables, only SEN remained as a significant independent predictor.
The variables in the final regression equation explained 61.0% of the variance in
general self-esteem, F (12,561) = 73.03, p <.001.
Table 4.19 Hierarchical regression analysis for variables predicting general self-
esteem (N = 891)
_____________________________________________________________
Block Variable B SE B
_____________________________________________________________
1. Gender 0.08 0.12 .03
Age -0.22 0.04 -.22***
White -0.06 0.14 -.02
SEN 0.72 0.23 .13**
Multiple deprivation index 0.05 0.02 .10*
2. Gender 0.08 0.08 .03
Age -0.04 0.03 -.03
White -0.12 0.09 -.04
SEN 0.31 0.15 .06*
Multiple deprivation index 0.02 0.01 .04
Knowing myself 0.37 0.03 .49***
Intrapersonal strength 0.10 0.02 .20***
Family involvement 0.08 0.02 .14***
Forgiveness -0.05 0.02 -.10**
Self-regulation 0.04 0.02 .08*
Creativity -0.05 0.02 -.10**
Perspective 0.05 0.02 .09**
_____________________________________________________________
Note. Block 1 R2 = .07. Block 2 R2 = .61. * p < .05. ** p < .01. *** p < .001.
292
Parental self-esteem
Table 4.20 displays the results of the regression analysis predicting parental
self-esteem. The demographic variables explained 7.2% of the variance in parental
self-esteem, F (5,567) = 9.84, p <.001, with age, ethnicity and SEN making a
significant contribution to the regression equation. The addition of the behavioural
and emotional, personal and contextual, and character strength measures in block 2
was then examined. Six additional significant independent predictors were included
in the final regression model through the stepwise procedure: namely, family
involvement, knowing myself, prudence, activity engagement, creativity, and
competent coping skills. Of the demographic variables, gender became a significant
independent predictor whilst age and ethnicity remained significant independent
predictors. The variables in the final regression equation explained 56.0% of the
variance in parental self-esteem, F (11,561) = 66.30, p <.001.
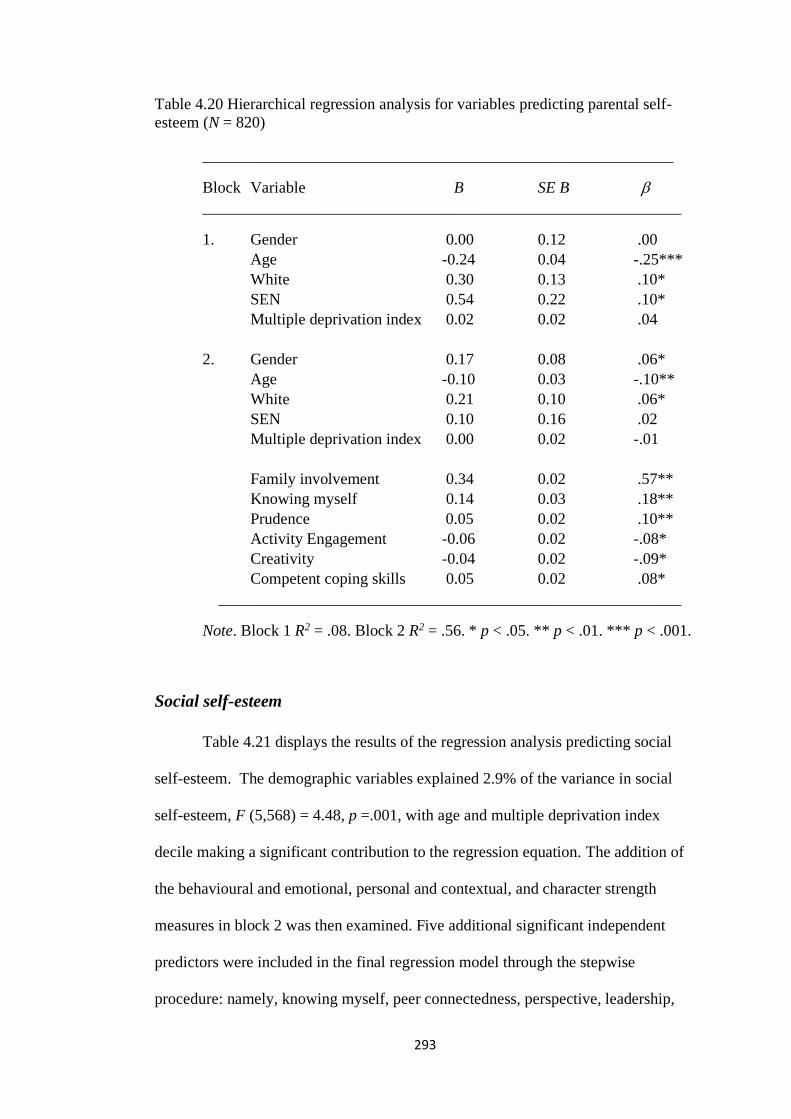
293
Table 4.20 Hierarchical regression analysis for variables predicting parental self-
esteem (N = 820)
___________________________________________________________
Block Variable B SE B
____________________________________________________________
1. Gender 0.00 0.12 .00
Age -0.24 0.04 -.25***
White 0.30 0.13 .10*
SEN 0.54 0.22 .10*
Multiple deprivation index 0.02 0.02 .04
2. Gender 0.17 0.08 .06*
Age -0.10 0.03 -.10**
White 0.21 0.10 .06*
SEN 0.10 0.16 .02
Multiple deprivation index 0.00 0.02 -.01
Family involvement 0.34 0.02 .57**
Knowing myself 0.14 0.03 .18**
Prudence 0.05 0.02 .10**
Activity Engagement -0.06 0.02 -.08*
Creativity -0.04 0.02 -.09*
Competent coping skills 0.05 0.02 .08*
__________________________________________________________
Note. Block 1 R2 = .08. Block 2 R2 = .56. * p < .05. ** p < .01. *** p < .001.
Social self-esteem
Table 4.21 displays the results of the regression analysis predicting social
self-esteem. The demographic variables explained 2.9% of the variance in social
self-esteem, F (5,568) = 4.48, p =.001, with age and multiple deprivation index
decile making a significant contribution to the regression equation. The addition of
the behavioural and emotional, personal and contextual, and character strength
measures in block 2 was then examined. Five additional significant independent
predictors were included in the final regression model through the stepwise
procedure: namely, knowing myself, peer connectedness, perspective, leadership,
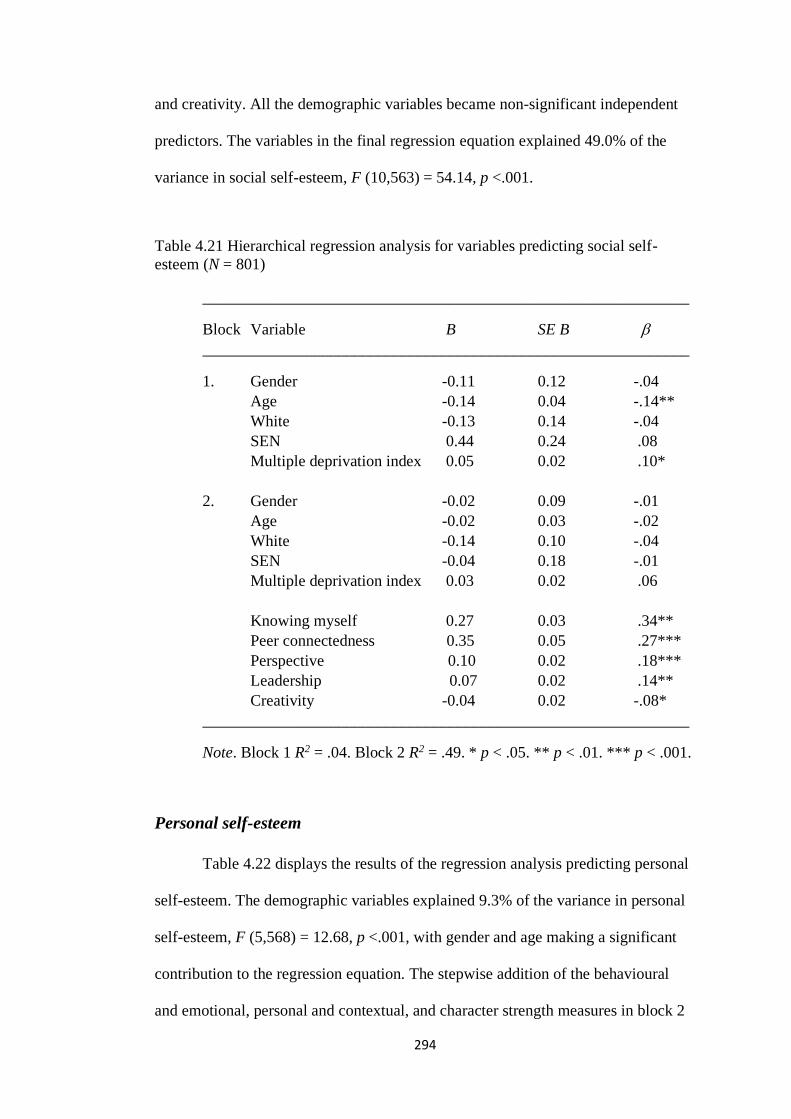
294
and creativity. All the demographic variables became non-significant independent
predictors. The variables in the final regression equation explained 49.0% of the
variance in social self-esteem, F (10,563) = 54.14, p <.001.
Table 4.21 Hierarchical regression analysis for variables predicting social self-
esteem (N = 801)
_____________________________________________________________
Block Variable B SE B
_____________________________________________________________
1. Gender -0.11 0.12 -.04
Age -0.14 0.04 -.14**
White -0.13 0.14 -.04
SEN 0.44 0.24 .08
Multiple deprivation index 0.05 0.02 .10*
2. Gender -0.02 0.09 -.01
Age -0.02 0.03 -.02
White -0.14 0.10 -.04
SEN -0.04 0.18 -.01
Multiple deprivation index 0.03 0.02 .06
Knowing myself 0.27 0.03 .34**
Peer connectedness 0.35 0.05 .27***
Perspective 0.10 0.02 .18***
Leadership 0.07 0.02 .14**
Creativity -0.04 0.02 -.08*
_____________________________________________________________
Note. Block 1 R2 = .04. Block 2 R2 = .49. * p < .05. ** p < .01. *** p < .001.
Personal self-esteem
Table 4.22 displays the results of the regression analysis predicting personal
self-esteem. The demographic variables explained 9.3% of the variance in personal
self-esteem, F (5,568) = 12.68, p <.001, with gender and age making a significant
contribution to the regression equation. The stepwise addition of the behavioural
and emotional, personal and contextual, and character strength measures in block 2
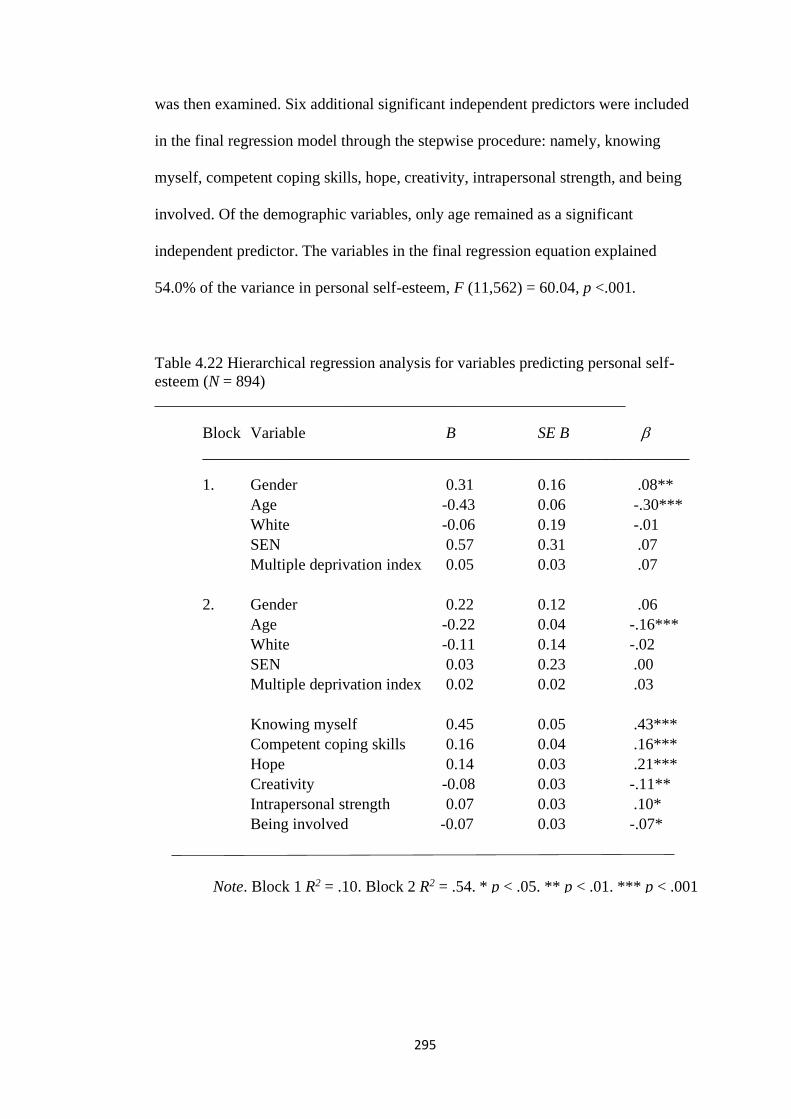
295
was then examined. Six additional significant independent predictors were included
in the final regression model through the stepwise procedure: namely, knowing
myself, competent coping skills, hope, creativity, intrapersonal strength, and being
involved. Of the demographic variables, only age remained as a significant
independent predictor. The variables in the final regression equation explained
54.0% of the variance in personal self-esteem, F (11,562) = 60.04, p <.001.
Table 4.22 Hierarchical regression analysis for variables predicting personal self-
esteem (N = 894)
___________________________________________________________
Block Variable B SE B
_____________________________________________________________
1. Gender 0.31 0.16 .08**
Age -0.43 0.06 -.30***
White -0.06 0.19 -.01
SEN 0.57 0.31 .07
Multiple deprivation index 0.05 0.03 .07
2. Gender 0.22 0.12 .06
Age -0.22 0.04 -.16***
White -0.11 0.14 -.02
SEN 0.03 0.23 .00
Multiple deprivation index 0.02 0.02 .03
Knowing myself 0.45 0.05 .43***
Competent coping skills 0.16 0.04 .16***
Hope 0.14 0.03 .21***
Creativity -0.08 0.03 -.11**
Intrapersonal strength 0.07 0.03 .10*
Being involved -0.07 0.03 -.07*
Note. Block 1 R2 = .10. Block 2 R2 = .54. * p < .05. ** p < .01. *** p < .001
296
For a summary of the hierarchical regression analyses for variables
predicting self-esteem see Table 4.23. Findings reveal the strengths of knowing
myself and creativity are significantly associated with all self-esteem domains,
whilst zest, honesty and commitment to family values are not associated with any of
the self-esteem domains.
4.6.8 Additional analyses
Due to the high levels of missing IMD data, the regression analyses were re-
run without IMD and are shown in Appendix O (Tables O1-O5) The results were
very similar; however, the following exceptions were noted. For academic self-
esteem, forgiveness became significant whilst for general self-esteem, SEN
provision, hope, school functioning, peer connectedness and being involved became
significant.
For parental self-esteem both self-regulation and hope became significant whilst for
social self-esteem, family involvement and being involved became significant. For
personal self-esteem, gender, interpersonal, family involvement and self-regulation
became significant when the regression analyses were re-run without IMD.
In order to gauge whether the adolescents with dyslexia in Study 1 differed
in self-esteem to those of the same age in Study 3, a comparison was sought. Due to
the different number of self-esteem items in the social, general and parental domains
in the shortened questionnaire devised for Study 3, direct comparison of these
domains with Study 1 could not be made. However, a comparison of mean self-
esteem scores reveal that the four adolescents with dyslexia in Study 1 have lower
academic and personal self-esteem scores than the 13 and 14 year old adolescent
with dyslexia from Study 3 (N = 28-32) (see Appendix P). Since samples for both
297
Studies were recruited predominately from independent schools, their educational
pathway may not account for these discrepancies. Indeed, a comparison of 13 and
14 years old in Study 3 showed that adolescents with dyslexia revealed lower self-
esteem in all domains (with the exception of social self-esteem in 14 year olds) than
their typically developing peers (see Appendix Q). Such findings were replicated for
the complete dataset of Study 3, in that, a comparison of the means of all the
adolescents with dyslexia with their typically developing counterparts, revealed that
adolescents with dyslexia scored lower in all self-esteem domains that their typically
developing peers (see Appendix R). Further analysis showed that the adolescents
with dyslexia were found to have significantly lower academic (t(791) = 3.86; p <
.001) and general (t(889) = 4.50; p < .001) self-esteem compared to their typically
developing counterparts (see Appendix S). These findings support the literature
highlighting that adolescents with dyslexia experience lower self-esteem.
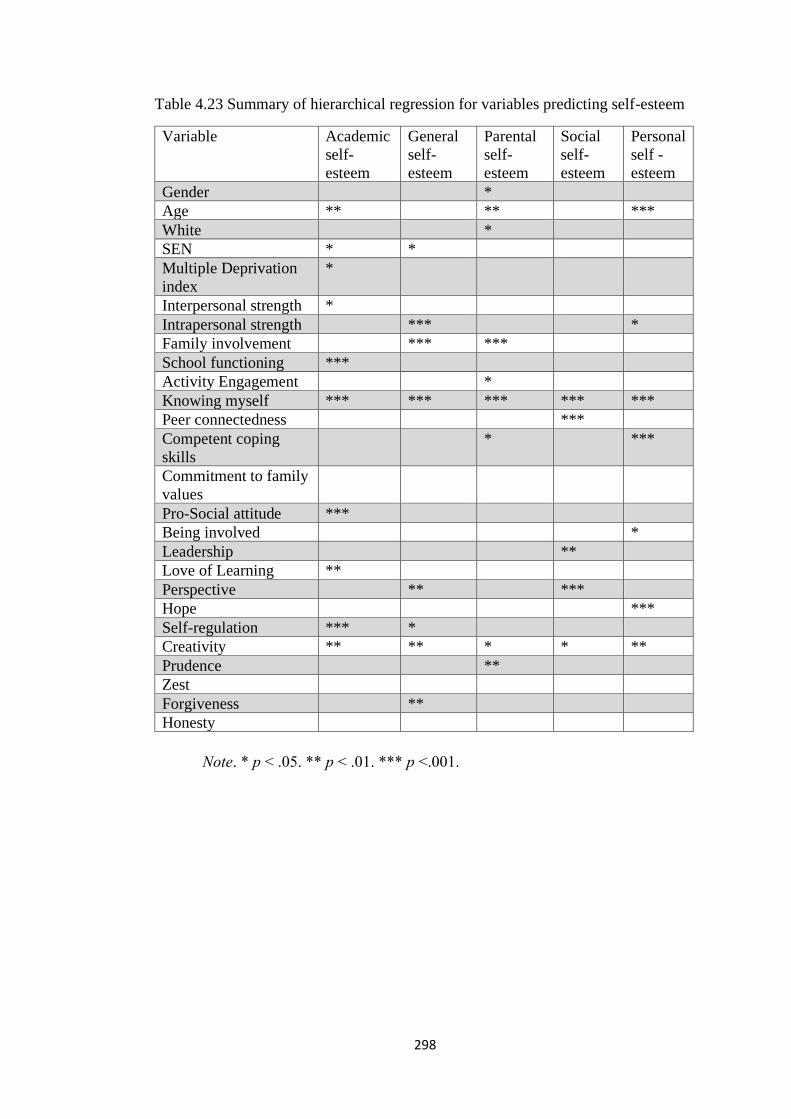
298
Table 4.23 Summary of hierarchical regression for variables predicting self-esteem
Variable Academic
self-
esteem
General
self-
esteem
Parental
self-
esteem
Social
self-
esteem
Personal
self -
esteem
Gender *
Age ** ** ***
White *
SEN * *
Multiple Deprivation
index
*
Interpersonal strength *
Intrapersonal strength *** *
Family involvement *** ***
School functioning ***
Activity Engagement *
Knowing myself *** *** *** *** ***
Peer connectedness ***
Competent coping
skills
* ***
Commitment to family
values
Pro-Social attitude ***
Being involved *
Leadership **
Love of Learning **
Perspective ** ***
Hope ***
Self-regulation *** *
Creativity ** ** * * **
Prudence **
Zest
Forgiveness **
Honesty
Note. * p < .05. ** p < .01. *** p <.001.
299
4.7 Discussion
Low self-esteem in adolescence impacts negatively on a broad spectrum of
mental disorders and social problems and research reveals such outcomes can have
pervasive negative ramifications throughout life. These include internalising
problems, for example, depression (Orth, Robins, & Roberts, 2008; Keane &
Loades, 2017), anxiety, (In-Albon, Meyer, Metzke, & Steinhausen, 2017), and
eating disorders (Courtney, Gamboz, & Johnson, 2008). In addition, low self-esteem
can also manifest in externalising problems such as violence and substance abuse
(Donnellan, Trzesniewski, Robins, Moffitt & Caspi, 2005; Mann, Hosman,
Schaalma, & De Vries, 2004), bullying (O'Moore & Kirkham, 2001), and
disparaging others (Collange, Fiske, & Sanitioso, 2009).
Building upon the findings of Study 1, this study specifically investigated
whether demographic variables impact self-esteem domains and whether certain
behavioural & emotional, personal and contextual and character strengths can
explain the variance in domain-specific self-esteem levels controlling for
demographic variables.
In response to the first research question of Study 3, findings revealed that
gender, age, ethnicity, special educational needs (SEN) provision, and multiple
deprivation decile impacted on specific self-esteem domains. Whilst much of the
previous research have highlighted the impact of these demographic variables on
self-esteem, the current study identifies their influence on specific domains of self-
esteem.
Females had significantly lower general and personal self-esteem than their
male counterparts, supporting previous research indicating males have consistently
reported higher self-esteem than females (Bleidorn et al., 2016; Heaven &
300
Ciarrochi, 2008; Kiviruusu, Huurre, Aro, Marttunen, & Haukkala, 2015). Gender
differentials have also been shown in age-related changes, while self-esteem among
boys is more likely to increase, self-esteem among girls tends to decrease slightly
during early adolescence (Birndorf, Ryan, Auinger, & Aten, 2005; Robins,
Trzesniewski, Tracy, Gosling & Potter, 2002).
Non-white participants had significantly lower parental self-esteem scores,
supporting earlier findings suggesting ethnicity influences adolescent self-esteem
(Bachman, O'Malley, Freedman-Doan, Trzesniewski, & Donnellan, 2011; McLoed
& Owens, 2004;). Bracey, Bamaca, & Umana-Taylor (2004) found significant
associations between ethnicity and self-esteem, in reporting that biracial adolescents
had significantly higher levels of self-esteem compared with their Asian
counterparts, but significantly lower self-esteem when compared to Black
adolescents. In addition, a significant and positive relationship between ethnic
identity and self-esteem was found for all groups. Furthermore, the negative impact
of ethnic/racial discrimination has been found to be related to lower self-esteem
(Panchanadeswaran, & Dawson, 2011; Harris-Britt, Valrie, Kurtz-Costes & Rowley,
2007).
Within the current study, SEN participants were found to have significantly
lower general and academic self-esteem. This supports earlier findings suggesting
that SEN participants develop a negative self-perception of themselves in
comparison to their typically developing peers (LaBarbera, 2008; Theunissen,
Rieffe, Netten, Briaire, Soede, Kouwenberg & Frijns, 2014). Additional analyses
specifically highlighted that adolescents with dyslexia displayed significantly lower
academic and general self-esteem than their typically developing peers. Such
findings support earlier research revealing adolescents with dyslexia exhibit lower
301
academic self-esteem (Terras, Thompson & Minnis, 2009), however, the influence
of context (Burden & Burdett, 2005) or gender (Alexander-Passe, 2006) has been
emphasised.
In the current study, age was significantly negatively correlated with all self-
esteem domains. Whilst this supports the decline in adolescent self-esteem profiled
by Bleidorn et al. (2016) and Robins, Trzesniewski, Tracy, Gosling and Potter,
(2002) it is contradictory to recent findings documenting overall stability then an
increase in self-esteem through adolescence (Orth, Erol & Luciano, 2018).
Multiple deprivation decile was significantly and positively associated with
academic and social self-esteem, such that participants living in more deprived areas
had lower self-esteem. Although not directly related to the IMD profiling, this
supports findings that indicate that those with higher socio-economic status display
higher self-esteem than those with lower socio-economic status (Rhodes, Roffman,
Reddy, & Fredriksen, 2004; Francis & Jones, 1996). However, contradictory
findings are found from a British study (using data from the British Youth Panel and
the National Longitudinal Survey of Children and Youth on adolescents aged 11-15
years, 1994-2004) which suggest no significant differences in the self-esteem of
adolescents between the most deprived and most affluent neighbourhoods (Fagg,
Curtis, Cummins, Stansfeld, & Quesnel-Vallée, 2013). Among socio-economic
variables, family income appears to have the highest association with adolescent
self-esteem (Birndorf, Ryan, Auinger, & Aten, 2005), although, Veselska,
Madarasova Geckova Gajdosova, Orosova, van Dijk & Reijneveld (2009) revealed
that socio-economic discrepancies in adolescent (N = 3694, mean age =14.3 years)
self-esteem was influenced by personality, mental health and social support.
Furthermore, results showed that personality dimensions (extroversion, emotional
302
stability and openness to experience), social support from family and significant
others and mental health contributed to the correlation between family affluence and
self-esteem.
In response to the second research question considering the strengths, the
findings revealed that higher levels of academic self-esteem were associated with
higher levels of functioning in school, knowing myself, self-regulation, pro-social
attitude, interpersonal strength, love of learning and creativity. Higher levels of
general self-esteem were associated with higher levels of intrapersonal strength,
knowing myself, involvement in family, creativity, forgiveness, perspective and
self-regulation. Higher parental self-esteem was associated with higher levels of
family involvement, knowing myself, prudence, activity engagement, creativity and
competent coping skills. Higher levels of social self-esteem were associated with
higher levels of knowing myself, peer connectedness, perspective, leadership and
creativity. Higher levels of personal self-esteem were associated with higher levels
of knowing myself, competent coping skills, hope, creativity, being involved and
intrapersonal strength. Support was found for a constellation of 18 strengths that
predict specific domains of self-esteem (see Table 38).
It was notable that two strengths were significant independent predictors of
all five self-esteem domains, namely knowing myself and creativity whilst five
strengths - self-regulation, intrapersonal strength, competent coping skills, family
involvement and perspective each predicted two domains. Knowing myself was
classified as the most significant of predictors for all domains, although this position
was shared, on occasion, with other strengths pertinent to the specific domains, for
example, knowing myself, competent coping skills and hope were the most
significant predictors for personal self-esteem. Furthermore, the generalised
303
importance of creativity as a significant predictor of all the domains must not be
overlooked and shall be addressed now as an individual strength and its relatedness
to identity formation which aligns well with the knowing myself.
This study lends its weight to the increasing body of knowledge that
indicates the ‘inherent latent power’ (Baran, Erdogan, & Cakmak, 2011) of
creativity existent in adolescents needs a portal for activation. Such a discussion
brings to the fore the concept of a creative identity. Indeed, Glăveanu and
Tanggaard (2014) propose a socio-cultural model of creative identities in which
creative identities are representational projects evolving from the inter-connections
between self (as creator), multiple others and ideas of creativity based on societal
rhetoric. In other words, our creative identity is both an individual and collective
entity which emerges from our collaborations within many groups and across a
multitude of contexts. Creative identities can be either perceived as promoted,
denied or problematic and each influence the engagement in creative work. For
example, promoted identity positively impacts on the choice to start creative work
whilst the opposite effect stems from a denied creative identity. Moreover, there is
reciprocal relationship of identity and behaviour and their interplay is positioned
within a multiple and dynamic matrix. In sum, in understanding the potential
significance of creativity and identity to increase self-esteem, there is a necessity to
promote creative identities within the academic curriculum.
4.8 Strengths and limitations
The main strength of this study lies in that it is the first, to our knowledge, to
examine strengths predictors of adolescent self-esteem domains in a school setting.
There has been a paucity of research investigating the predictors of the five domains
304
of self-esteem (academic, general, parental, social and personal). Previous studies
have predominately concentrated on global self-esteem. It is suggested that
possession of intricate knowledge of the strengths predicting each self-esteem
domain can allow the implementation of interventions to intercept the
establishement of low self-esteem within that individual context. Indeed,
determining what predicts an adolescent to construe or develop low self-esteem may
have significant implications for prevention. It is envisaged further research could
facilitate the implementation of gender and age specific tailored interventions to
increase and sustain normative levels of self-esteem. In line with the literature, the
current study found gender impacted on self-esteem, such that females exhibited
significantly lower general and personal self-esteem than their male counterparts. In
recognising the impact of a multitude of demographic variables influencing self-
esteem, the analysis in the current study controlled for the effects of gender, age,
ethnicity, SEN provision and index of multiple derivation. This study therefore
provides initial data on the predictors of specific self-esteem domains.
In an era marked by the prevailing burden and impact of adolescent mental
health problems (e.g., anxiety) (Das et al., 2016), knowledge of the personal self-
esteem predictors (knowing myself, creativity, intrapersonal strength, being
involved, hope and comptent coping skills) is crucial. Such findings highlight
strengths that may promote mental well-being, allowing practitioners a vehicle to
enhance adolescents intimate perceptions of anxiety and self-worth through
preventative intervention before mental health issues manifest themselves.
A second strength of this study was the large sample size (N=953)
facilitating the the identification of a constellation of strengths predicting self-
esteem domains. Within the school context, these findings allow a unique
305
opportunity for bolstering individual self-esteem domains through interventions
with a specific armoury of strengths. This large dataset was generated from four
schools with differing demographics within a three week period. However, the
results may not be generalisable as the schools were not chosen to be representative
of all schools in England.
Despite recognising the strengths embodied by this study, it is important that
a number of limitations should be acknowledged when discussing results regarding
questionnaire design, participants and implementation.
The first limitation is that the data from this study has been collated from
mainly independent schools and, therefore, findings cannot be generalised to
adolescents within the state educational system.
The second limitation is that the current study is cross-sectional and, as a
result, it may be difficult to clarify evidence of temporal ordering indicating whether
self-esteem is a predictor or consequence of a specific construct in adolescence
and/or whether reciprocal relationships exists (Marshall, Parker, Ciarrochi &
Heaven (2014). Indeed, acknowledging correlation is not causation (Baumeister &
Vohs, 2018), Baumeister, Campbell, Krueger, and Vohs (2003, 2005) argued for
more longitudinal design and robust methodology suggesting that self-esteem may
be consequence of other processes, rather than a propelling force of positive
ramifications for individuals.
Third, a further weakness is the design of the questionnaire developed for the
current study. Although items were selected ‘word for word’ (to ensure continuity of
construct definition) from the adolescent versions of four valid and reliable
assessments measuring self-esteem and strengths, the number of items were reduced
resulting in shortened scales. In the formative stages of the questionnaire design, a
306
more systematic approach may have been warranted in the selection of items from
the original questionnaires. Shortened scales had to be used to reduce the number of
items and led to dilemas of which items truly represented the construct. For
example, factor analysis had revealed four items loaded strongly onto General self-
esteem, in contrast to the original inventory CFSEI-3 inventory (2002) domains in
which these items assess personal self-esteem. Further analysis reinforced the
inclusion of the 7 item scale as it demonstrated a higher and more acceptable
Cronbach’s alpha than the 3 item scale. It must also be emphasised that after
analysis of Study 1 only 10 character strengths were considered worthy of inclusion.
The VIA (youth) measured 24 strengths and further investigation of all character
strengths is warranted.
The fourth study limitation was that the logistics of disseminating the
questionnaire within the school context relied on the goodwill, kindness and
competence of those teachers who scheduled and organised form time for
completion and indeed the adolescents willingness to complete the questionnaire.
Three of the four schools scheduled a fixed allocated time within the school
timetable to complete the questionnaire (normally morning registration/form time).
The remaining school adopted a more flexible student-driven approach, which very
probably accounts for the reduced response rates (9% compared to an average of
77% for the other three schools). This particular school was an inner city secondary
school in comparison to the other three independent schools.
Missing data ranged from 16.8% of academic self-esteem scores to 6.2% of
personal self-esteem scores. This may be due to a number of factors; positioning of
these items in the questionniare, for example, the personal self-esteem items were
on the first page of the questionniare whereas academic self-esteem was positioned
307
much later as the the last domain to be measured. Alternatively, the discrepancy
could be due to the participants feeling more comfortable responding to personal
self-esteem items which predominately featured emotions. On reflection, due to this
level of missing data, randomisation of presentation of items may have been
preferable.
The demographic profile of the dataset was convergent with recent England
data in terms of SEN provision (13.5% of the current study compared to 14.6%
according to the DoE Special educational needs in England: January 2018 paper)
and mental health difficulties (11.7 % compared to 11.5% as cited by Green,
McGinnity, Meltzer, Ford & Goodman, 2005). However, with regard to gender,
72.4 % were female compare to the 50.5% cited for girls in primary and secondary
educuation according to Trading Economics data (2015). In addition there was a
lower percentage of white participants compared to those recorded in the 2011
England Census, i.e., 66.5% compared to 85.4%. The current sample revealed
7.1% in the most deprived decile and 20.6% in the least deprived decile. Future
research would want to replicate these findings in a more representative sample
including more boys and fewer affluent (least deprived) adolescents.
4.9 Conclusions
The current study sought to answer the following research questions:
1. Do age, gender, ethnicity, SEN and/or deprivation deciles impact on self-
esteem domains?
2. Which specific behavioural and emotional, personal, contextual and
character strengths predict different domains of self-esteem in adolescents
(10-17 years) in mainstream secondary school?
308
In answer to first research question, the findings revealed that gender, age,
ethnicity, SEN provision, and multiple deprivation decile impacted on specific self-
esteem domains. Females had significantly lower general and personal self-esteem
than their male counterparts. Non-white participants had significantly lower parental
self-esteem scores, whilst SEN participants were found to have significantly lower
general and academic self-esteem. Age was significantly negatively correlated with
all self-esteem domains, and multiple deprivation decile was significantly and
positively associated with academic and social self-esteem.
With reference to the second research question, stepwise multiple
hierarchical regression analysis indicated a constellation of 18 predictors of domain
specific self-esteem. The strengths of knowing myself and creativity were
underscored as the universal predictors of all domains of self-esteem.
This study, therefore, provides an initial overview of the identification of
predictors of specific self-esteem domains in adolescents. It is hoped that the results
of the current study will not only contribute to the knowledge of the development of
self-esteem in adolescence, but also provide implications for incorporating strengths
and creativity into education and training into the school curriculum. Indeed,
research has implied that adolescence is an advantageous period to enhance creative
processes and “out of the box” thinking. Within the school context, these findings
provide a unique opportunity of bolstering individual self-esteem domains through
interventions that target strengths.
309
Chapter 5
General Discussion
The overarching aim of this PhD was to contribute to the knowledge relating
to the self-esteem of adolescents: by investigating the self-esteem of vulnerable
adolescents through assessment and Life Story Interviews; by exploring the
promotion of self-esteem through an intervention; and through identifying the
predictors of self-esteem domains in adolescents. Throughout the thesis a positive
psychology perspective was adopted, this influenced the strengths-based instruments
used and the school-based positive emotion intervention that was implemented.
In order to understand and capture the broad landscape of adolescent self-
esteem a mixed methodology was used which ranged from individual narratives
with two samples of ‘vulnerable’ adolescents to online questionnaires completed by
a large sample of adolescents. The diversity of methodology included a qualitative
analysis of rich descriptive data. This data explored the lived experience of
adolescents and revealed themes which underpinned their self-esteem and emerging
identities as well as a generation of a sizeable dataset which facilitated the
investigation of strengths predictors of self-esteem through multiple regression
analysis. A strength of this research stems from acknowledging the significance of
self-esteem in different contexts and arenas of lives. In contrary to much of the self-
esteem literature which has investigated overarching global self-esteem, this
research followed a more nuanced approach by focussing on the five specific self-
esteem domains (academic, general, parental, social and personal) as identified by
Battle (2002) and in line with Harter’s proposition that self-esteem is hierarchical
and multidimensional (1988).
310
4.10 Research questions
The research questions posed by this thesis concentrated upon these different
domains of self-esteem with a small number of vulnerable adolescents (Studies 1
and 2) and a larger sample of adolescents (Study 3). Two samples of vulnerable
adolescents were recruited for Studies 1 and 2. Sample 1 comprised four adolescents
with dyslexia and Sample 2 comprised eight disengaged adolescents at risk of
becoming NEETs.
Study 1 investigated if these vulnerable adolescents reported lower self-
esteem than the norm (as measured by the CFSEI-3) and sought to understand the
reasons underpinning their self-esteem through the identity-based Life Story
Interview.
Study 2 explored the impact of an 8/10 week school-based positive emotion
intervention on the different domains of self-esteem at four time points.
Study 3 sought to answer two research questions through the analysis of an
online questionnaire circulated to a large number (N =953) of adolescents. Firstly,
do age, gender, ethnicity, SEN and/or deprivation deciles impact on self-esteem
domains? Secondly, which specific behavioural and emotional, personal, contextual
and character strengths predict different domains of self-esteem in adolescents (10 -
17 years) in mainstream secondary school?
4.11 Main Findings
4.11.1 Study 1
This study reported on IPA of the Life Story Interview (McAdams, 2002) of
two samples of vulnerable adolescents. It is posited that during adolescence an
integrated narrative of self gives life with a level of purpose and psychosocial unity

311
(Breger,1974; McAdams, 2001). The narratives investigated their lived experiences
embedded within the cultural context and norms in which the adolescent lives with
its assumptions about gender, ethnicity, disability, social class etc. The IPA revealed
seven similar emergent themes for both samples; academic self-evaluation, social
self-evaluation, self-efficacy, emotional self-efficacy, emotional awareness, identity,
and self-attribution. An additional theme of rationalisation for school disengagement
and potential re-engagement emerged from Sample 2 although the subject of
disengagement was not instigated by the researcher.
Emergent themes may explain the spiky self-esteem profiles of both
samples, and indeed why the adolescents with dyslexia in Sample 1 maintained an
average level of self-esteem compared to the lower levels of self-esteem exhibited
by the disengaged adolescents in Sample 2. Indeed, seven of the eight disengaged
adolescents at ‘risk’ of becoming NEET displayed lower than average academic
self-esteem scores, in line with previous research highlighting the link between
lower academic self-esteem and lower engagement in school (Arens & Major, 1989;
Crocker et al., 1998; Steele, 1997). A strength of the study also lay in the
triangulation of self, parent and teacher reports assessed behavioural and emotional
strengths of the participants in Sample 1 which facilitated a more holistic integrated
perspective. Unfortunately, for Sample 2, due to the absence of the returned forms,
only the self and teacher reports were available to be assessed.
Although the samples shared seven themes, their significance in terms of
frequency of reference and their content differed. Such a disparity was specifically
witnessed in the content of academic self-efficacy. Stark discrepancies existed when
links to creativity were examined, references to expressions of creativity were
interwoven through the narratives of the adolescents with dyslexia and may provide
312
a portal for stress and foster improved coping with negative emotions. There is
divergent research regarding the association between dyslexia and creativity.
Whether innate or not, expressions of creativity were promoted within the school
environment and included enjoyment of and, in some cases, excelling in art, music
and drama. It was interesting to note from Study 3 that creativity was found to be a
significant predictor of all self-esteem domains.
Assessment and narratives revealed disparities in self-esteem levels between
Sample 1 and Sample 2 and centred not only on self-evaluations but the divergent
influence of parents, peers and the school. The adolescents with dyslexia from
Sample 1 appear buffered from suffering low academic self-esteem. According to
Bronfenbrenner’s Ecological Systems theory (1992) this may be due to the
protective influence of their home and school (microsystem), connections forged
between their parents and school (mesosystem) and their wider societal and cultural
knowledge that has embedded them within their macrosystem, fostering a positive
self-esteem and progressed identity formation.
4.11.2 Study 2
Findings from Study 1 recognised that, in line with the literature, some
vulnerable adolescents displayed lower than average self-esteem. Therefore, Study 2
recruited the same samples and focussed on the impact of an 8/10 week group
school-based ‘positive emotions’ intervention (Suldo, Savage & Mercer, 2014) to
promote self-esteem. Fredrickson’s ‘broaden and build theory’ (Fredrickson, 2004)
of positive emotions underpinned the adoption and adaptation of the intervention.
The components of the intervention focussed on the positive emotions in the past
(gratitude), present (recognition and use of character strengths) and future
(gratitude). Single case design was used to investigate change post-intervention at
313
three time points - immediately post-, 6 month post- and either 9 (Sample 2) or 12
month post-intervention (Sample 1).
Visual inspection of the graphs of Sample 1 revealed only slight evidence of
an increase in both personal and global self-esteem domains for two participants
from pre-intervention to 12 month post-intervention. A visual inspection of the
graphs for Sample 2 showed increases in academic, general, personal and global
self-esteem domains for most of the participants from pre-intervention to immediate
post-intervention.
Effect sizes measured the relative size of the effect of an intervention. For
Sample 1 large positive effect sizes were revealed at both pre-intervention to end of
intervention and pre-intervention to 12 month follow up for. A large positive effect
size was also revealed in global self-esteem between pre-intervention and 12 month
follow up. For Sample 2, large positive effect sizes were shown between pre-
intervention and end of intervention for general self-esteem, personal self-esteem
and global self-esteem and at pre-intervention to 6 month follow up for personal and
global self-esteem. In addition, a large positive effect size was shown for pre-
intervention to 9 month follow up for global self-esteem.
TAU-U analysis found no significant difference between the pre-
intervention and post-intervention phase trends for academic, general, parental or
social or personal self-esteem for Sample 1. However, there was a significant phase
trend in global self-esteem between pre-intervention and 12 month post-intervention
(Tau-U = 1.00, p = .049). This indicates that there was a significant increase in
global self-esteem levels from pre-intervention to 12 month follow-up for Sample 1.
There was no significant difference for Sample 2 between the pre-intervention and
post-intervention phase trends for academic, general, parental or social self-esteem.
314
However, there was a significant phase trend in personal self-esteem for Sample 2
between pre-intervention and immediate post-intervention (Tau-U = 0.70, p = .02)
and pre-intervention and 6 month post-intervention (Tau-U = 0.72, p = .02). In
addition, a significant difference was noted in global self-esteem between pre-
intervention and immediate post-intervention (Tau-U = 0.59, p = .046). This
indicates that for Sample 2 there was significant increase in self-esteem levels in
both personal and global self-esteem between pre- and immediately post-
intervention
For five of the eight disengaged participants comprising Sample 2, a reliable
improvement was noted in personal self-esteem immediately post-intervention, four
at 6 months post-intervention and five participants experienced reliable
improvement at the 9 months post-intervention assessment. Although the impact
was less discernible in the three participants of Sample 1, a reliable improvement
was seen in one participant at immediate post-intervention, two participants at 6
month post-intervention, and three participants at 12 month post-intervention
assessment. Since this domain represents adolescents’ most intimate perceptions of
anxiety and self-worth, the positive emotions intervention may have promoted
adaptive coping strategies improving resilience in times of stress (Tugade &
Fredrickson, 2004). Such a proposition is consistent with Fredrickson’s (1998,
2001) broaden & build theory.
Although not the focus of this thesis, the overarching construct of global
self-esteem was also measured. For six of the eight disengaged participants
comprising Sample 2, a reliable improvement was seen immediately post-
intervention, whilst, four participants experienced reliable improvement at both the
6 and the 9 months post-intervention assessment. This mirrors the improvement
315
witnessed in personal self -esteem. The impact of the intervention on global self-
esteem (as with personal self-esteem) for the three participants in Sample 1 was
more fluctuating, however, all three showed a reliable improvement from pre-
intervention to the 12 month follow-up assessment. Nevertheless, such findings
demonstrate how global self-esteem can mask wide discrepancies in inter domain
scores and re-emphasise the importance of examined specific self-esteem domains.
Although the finding of improvements within the personal and global self-esteem
scores for both Samples are encouraging, some of these significant results could be
Type 1 errors due the large number of comparisons conducted.
In line with previous research (Froh, Kashdan, Ozimkowski & Miller, 2009),
this intervention appeared to yield the most positive outcomes with participants that
started with the lowest pre-intervention scores. A consideration is whether the
intervention yields beneficial outcomes for a certain subset of individuals. It could
be suggested that the participants low in self-esteem are expected to derive more
benefits from the positive emotions intervention, furthermore positive emotions may
be experienced less with those participants experiencing low self-esteem. However,
it could be speculated that a moderator variable may indeed be altering the strength
and direction of the relationship between positive emotions and self-esteem. Indeed,
it could be speculated that a synergetic relationship between positive emotions and
self-esteem might occur naturally with those participants possessing increased levels
of the moderator variable. Conversely those experiencing low levels of this
moderator variable may benefit from a jump-start, like a positive emotions
intervention, to fire up the process. Further studies may be warranted to investigate
this proposition.
316
Personality factors may indeed influence whether a participant benefits most
from an intervention. (Rash, Matsuba, & Prkachin, 2011). Whilst Wood, Froh, and
Geraghty (2010) proposed the schematic hypothesis which suggests grateful
individuals possess a cognitive lens which perceives the world from a more positive,
altruistic perspective, McCullough, Tsang and Emmons (2004) proposed a
conductance hypothesis postulating individuals with a predilection towards
gratefulness display the greatest beneficial outcomes from gratitude related daily
episodes. According to both these hypotheses, grateful individuals are ‘primed’ to
experience and derive benefit both positive events.
Conversely, a resistance hypothesis suggests that those predisposed to being
grateful, may have already reached their ‘ceiling gratefulness’ and therefore not
yield positive outcomes from a gratitude intervention) McCullough et al., 2004).
Research has revealed preliminary support for the resistance hypothesis (Froh et al.,
2009). Such findings would therefore imply that that the participants with average
self-esteem in Study 2 having reached their ‘ceiling self-esteem’ would not display
the enhancements in self-esteem revealed by those with lower baseline self-esteem
scores.
Individual differences, gender and special educational need (SEN)
provisions also need further elucidation in future research. For example, in this
small sample, girls demonstrated the highest reliable improvements in personal self-
esteem.
In addition, there is evidence to suggest the potential inclusion of parents,
booster sessions after the 6 month assessments, teacher-led interventions may
improve the effectiveness of this school-based intervention (Roth, Suldo, & Ferron,
2017). Moreover, as Macaskill and Denovan (2014) found no significant differences
317
in character strengths exhibited in clinical and non-clinical undergraduates, it can be
suggested that previous school-based strengths use interventions could translate
effectively into clinical and therapeutic practice.
4.11.3 Study 3
Whilst Studies 1 and 2 focussed on a small and diverse participant samples
with large individual differences and gave a ‘voice’ to often marginalised
adolescents, the findings from the large number of participants in Study 3 yielded an
overview of the key strengths predictors of adolescent self-esteem that potentiality
could be generalised to the wider population. A deeper knowledge of the
associations of specific self-esteem domain predictors was also facilitated.
Stepwise multiple hierarchical regression analysis revealed 18 predictors of
domain specific self-esteem. The significance of knowing myself (identity
formation) and creativity as universal predictors for all domains of self-esteems was
highlighted. Such results are important considering adolescence is a significant
epoch for identity formation and creativity (Barbot & Heuser, 2017; Dollinger,
Clancy Dollinger, & Centeno, 2005).
The discovery of these universal predictors is understandable as adolescence
marks an epoch of recognition and shaping of creative pursuits (Barbot, Lubart &
Besançon, 2016). Indeed, Barbot and Heuser (2017) propose three mechanisms to
explain the reciprocal relationship between creativity and identity formation. First,
creativity may reinforce the thinking process implicated in identity development;
second, creativity may attribute to the definition of self, bolstering a positive self-
esteem; and third, creativity may provide a conduit for ‘adaptive’ self-expression.
According to this hypothesis it is not surprising therefore that creativity and
knowing myself were predictive of all self-esteem domains. Indeed, recently Sica,
318
Ragozini, Di Palma and Sestito’s (2017) confirmed the relationship between identity
and creativity in late adolescents, by identifying six identity stages (moratorium,
critical exploration, achievement, early closure, diffusion and searching
moratorium) each differentially interplaying with creativity.
The findings from Study 3 not only recognise the synergy between creativity
and identity formation (knowing myself) but add to the existent literature in
deciphering the directionality of the relationship between creativity and self-esteem
domain. This has significant implications for the development of creativity-based
interventions designed to promote adolescents’ self-esteem. This builds on evidence
to suggesting art making is crucial in the identity formation of adolescents with
differing social behaviours (Fletcher & Lawrence, 2018).
Indeed, the act of storytelling may be suggested as a vehicle for tapping into
an adolescent’s creative potential, thus facilitating positive identity formation. By
harnessing social and intellectual creativity, storytelling can help form a cohesive
and coherent sense of self. (McAdams,1999). Such storytelling was used in Studies
1 and 2 through the Life Story Interview (McAdams, 1999). Although based on
biographical facts, participants select appropriate elements of past episodes to merge
with an imaginary future to give unity, meaning and purpose to life (McAdams,
1998, 2001). Further investigation is warranted as to whether the Life Story
Interview could be implemented as an individual brief intervention for the
promotion of self-esteem. Indeed, it is posited that the fictional element of creative
story writing is related to future self-esteem, in that the adolescent self is positively
projected into the future and can be used as a platform for creating narrative fiction
(Dollinger & Clancy, 1993). Furthermore, Keem, Shalley, Kim, and Jeong, (2018)
cite the author Coupland who posited that ‘Storytelling is ultimately a creative act of
319
pattern recognition…(where) the storyteller posits a series of dots that the reader can
connect’.
Interestingly, recent research by Barbot (2018) associates different aspects of
creativity with different domains of self-esteem. Research has historically revolved
around established creativity assessments which all associate with different facets of
creativity, these include divergent thinking tasks, achievements in creativity and
self-reported creativity. Due to the sparse and inconsistent empirical research
investigating domain specific creativity and domain specific self-esteem, Barbot
(2018) investigated the multivariate relationships between three aspects of creativity
(music, literary-verbal and graphic) and seven domains of self-esteem (e.g., global,
academic, emotional, physical, academic, creative and future) in 170 adolescents.
Findings revealed global self-esteem was uniquely linked to musical creativity,
whilst academic and future self-esteem were uniquely and distinctly related to the
story writing task (literary-verbal domain) (Barbot, 2018). However, none of the
self-esteem domains were uniquely related to drawing task creativity. Furthermore,
Barbot (2018) contends that the specific demands of a creativity activity dictate the
relationships it forms, for example, demands can comprise both the situational
(confidence levels required to perform the creative act) as well as the nature of the
creative act.
Through understanding the associations between hope and personal self-
esteem revealed in the findings of Study 3, it is suggested that the hope component
of the positive emotion intervention may have triggered the widespread reliable
improvements within the personal self-esteem domain demonstrated in Study 2
findings. Recognising the relationship between hope, future self-esteem and
320
identity development, creative writing skills may be a useful inclusion in the hope-
based ‘best possible selves’ intervention (Barbot, 2018; Barbot & Heuser, 2017)
The context, in terms of peer group interaction, with whom the intervention
takes place warrants further examination. A recent study (Van de Vyver & Crisp,
2019) revealed that creative thinking can be improved by exposure (or imaginary
exposure) to individuals that are socially diverse in terms of gender, age, ethnicity,
geography and education. It is suggested that such exposure leads individuals to
question the heuristic-based thinking that underpins automatic thoughts, promotes
new and complex information processing which is reflected in the individual
generating more creative thinking. A parallel can be drawn with this creative
thinking process and the broaden and build theory (Fredrickson, 1998). Since
creativity was indicated as a significant predictor of all self-esteem levels in Study 3
it is posited that integrating participants from Sample 1 and Sample 2 (different
schools and diverse backgrounds) into the same intervention could have increased
their creativity and consequently all domain-specific self-esteem levels.
Identifying predictors, in a sizeable number of adolescent participants, is
important as this research could help consolidate and advance the body of
knowledge that straddles both adolescence self-esteem and strengths. These findings
have implications for the education system in terms of including strengths in school-
based interventions, as well in being incorporated in programmes with those with
mental health difficulties such as anxiety.
4.12 Overall findings
The three studies on adolescent self-esteem that comprise this thesis have
highlighted the importance of combining mixed methodology which delves into
321
individual differences in specific self-esteem domains levels and consequential
discrepancies in response to the positive emotion intervention.
The significance of forming a positive sense of identity is highlighted
throughout this thesis, aligned with the definition operationalised by Schwartz,
Luyckx and Vignoles (2011, p. 4), a sense of identity has been seen to pervade all
contexts and relationships, centring the individual adolescents socially and
culturally. The IPA of the narratives of Samples 1 and 2 in Study 1 revealed that the
multi-faceted construct of identity was a shared theme interwoven throughout their
life stories, influencing interpersonal relationships, family dyads and integral to the
exploration and commitment critical in career path development. Indeed, regression
analyses of Study 3 underscored ‘knowing myself’ as a universal predictor of the
five self-esteem domains under exploration.
The findings from the large number of participants that completed
questionnaires identified eighteen strengths predictors of self-esteem, highlighting
the strengths of knowing myself and creativity as significant universal predictors of
all self-esteem domains. The literature focussing on creativity, identity formation
and indeed the emergence of a creative identity has been discussed with its
implications for self-esteem.
The importance of context is considered in terms of Bronfenbrenner’s
ecological systems framework (1992) where the adolescent is centred within
multiple environments embedded within their wider societal and cultural values and
historical context. Furthermore, the contexts in which the adolescent develops (e.g.,
family, school, peers) and their interactions with each other and the adolescent
impact self-esteem.
322
4.13 Strengths and Limitations
The strengths and limitations of the individual studies have already been
addressed within the related chapters. This section considers more general strengths
and limitations of the work presented in this thesis.
Previous research has highlighted that low self-esteem in adolescence
impacts negatively on outcomes which can have pervasive detrimental ramifications
throughout life. Much of the previous research has measured global self-esteem
using the Rosenberg’s 10 item scale (1965) (RSE; Rosenberg, 1979) and there is a
paucity of research that has examined associations with, or predictors of, specific
self-esteem domains. Therefore, in order to explore these relationships, Battle’s five
domain self-esteem inventory (CFSEI-3, 2002) was used in all three studies
incorporated into this research.
The strength of the work presented in this thesis into adolescent self-esteem
lies in its holistic perspective and mixed methodology, where narrative is combined
with analysis from both single case design and large sample dataset. Rich,
descriptive qualitative data gave ‘voice’ to these marginalised adolescents from the
two small and diverse samples. The impact of dyslexia or disengagement was
woven into their stories yet conversations regarding these constructs were neither
prompted nor instigated by the researcher. By adopting a positive psychology
stance, the participants had the opportunity to recognise and use their strengths in
the intervention and, from a wider perspective, strengths predictors of self-esteem
domains were revealed from a large sample of adolescents with potential
generalisability to the general population. The inclusion of strengths predictors in
interventions has wide reaching implications in targeted populations and may prove
323
especially useful in combating the burgeoning mental health issues prevalent within
adolescence.
Another strength is that the temporal validity of Battle’s Self-Esteem
Inventory (CFSEI-3, 2002) is generally supported. Due to the different number of
self-esteem items in the social, general and parental domains in the shortened
questionnaire devised for Study 3, direct comparison of these domains with the
Battle’s normative scores could not be made. However, comparison of mean
academic and personal self-esteem scores of the 13-14 years old from Study 3 and
Battle’s normative self-esteem scores fall within the ‘average’ self-esteem
descriptors (8-12) referenced in the manual. Such findings highlight that in the 18
year period from when Battle’s original sample was normed in 2000 to Study 3 that
levels of ‘average’ self-esteem have remained within the same range for academic
and personal self-esteem (see Appendix T). This supports the generalisability of
Battle’s self-esteem normative results across time.
Self-esteem is a reflexive and conscious phenomenon dependent upon how
the individual acknowledges his or her value, therefore, implicit and explicit self-
esteem must also be considered, acknowledging their primary distinction being
whether self-evaluations are accessible to conscious awareness.
Explicit self-esteem is measured by what an individual says about
themselves and gauges an individual’s private self-valuation as a person based on an
integrative and synthetic understanding. Traditionally, self-esteem has been assessed
explicitly, such as in Battle’s Culture-Free Self-esteem inventory (2002) where
direct questions are posed such as ‘Would you change many things about yourself if
you could?’ which tapped into personal self-esteem domain.
324
On the other hand, implicit self-esteem is gauged by automatic responses
and assesses the degree to which the self is cognitively associated with positive
versus negative thoughts, for example, how an individual associates words that have
negative or positive connotations with themselves (Greenwald & Farnham, 2000).
Further measures have been developed to assess implicit self-esteem including the
Name liking effect where individuals with high self-esteem tend to like their own
name (Gebauer, Riketta, Broemer, & Maio, 2008).
Those individuals who reveal a high explicit self-esteem combined with a
low implicit self-esteem are prone to be defensive in response to criticism (e.g.,
Bosson, Brown, Zeigler-Hill, & Swann Jr., 2003) and discriminatory against other
ethnicities (Jordan, Spencer, & Zanna, 2005). Such discrepancies can manifest in a
fragile self-esteem.
However, congruence between implicit and explicit self-esteem, due to the
integration of the two representations, is suggested to reduce anger and enhance
mental health (Schroder-Abe, Rudolph, & Schutz, 2007). Indeed, there is consensus
that those that can readily access and comprehend their intuitive or emotional states
can derive their explicit self-esteem from implicit representations display a
congruent implicit and explicit self-esteem (Jordan, Whitfield, & Zeigler-Hill, 2007)
Tafarodi and Ho (2006) question the theoretical validity of the implicit self-
esteem arguing that struggles with operationalisation of this theoretical construct of
self-esteem and its subsequent measurement impacts the construct validity of
implicit self-esteem questionnaires.
Self-esteem, by definition, is a construct that relies on individual's subjective
evaluation of their abilities and limitations, therefore self-report is considered the
natural method for assessment. It is acknowledged that the psychometric
325
assessments used within this thesis were predominately self-report, and therefore
intrinsically biased for example in terms of social desirability. Indeed, it is well-
documented that the ‘better than average effect’ (e.g. Sedikides & Gregg, 2008) is
cited as evidence that some individuals self-score more generously that objective
facts would justify. This led Baumeister and Vohs (2018) to call for a more
objective observation of actual behaviour than the reliance on (predominately
online) self-report. This self-report limitation was present in Study 3, however, was
countered in Study 2. The BERS instruments allowed the collation and analysis of
behavioural and emotional strengths scores by not only the adolescent but their
teacher and parent (for Sample 1 only). Such triangulation revealed adolescents
self-scored themselves generally lower than both their teachers and parents and
provides a counter-argument to the ‘better than average effect’.
The overarching limitations of the three studies that are reported within this
thesis lie in the representativeness of the participant samples and indeed within the
design of the studies.
Although the findings of Studies 1 and 2 serve as platforms for further
research the small sample sizes do not facilitate the generalisability of findings to
the wider population. Indeed, the high proportion of females and participants from
independent schools within the sample in Study 3 skews findings and therefore are
not representative in terms of the wider education arena in terms of gender and
social economic status.
Furthermore, although the design of Studies 1 and 2 suffers many threats to
internal validity, the aim of the intervention study was to provide preliminary
evidence for its effectiveness. Due to the prolonged period of the intervention of 8 to
10 weeks (punctuated by school holidays) with follow-up assessments up to 12
326
months post intervention, it is reasonable to assume that more circumstances arose
that obscure the effects of the intervention. These are collectively termed ’threats to
internal validity’. These threats include placebo effects, hawthorne effects,
maturation, history and instrument threats. The study did not suffer from
instrumentation and reporting threats as these were eliminated through
administering the same questionnaires in the same format and under the same
conditions for all assessments.
The placebo effect operates through a psychological mechanism which
results in improved self-esteem. The participant believes the intervention will be
beneficial and this has an impact in itself on the outcome.
Indeed, another limitation that could have been present in Studies 1 and 2 is
that derived from the ‘Hawthorne effect’. First coined by Roethlisberger and
Dickson (1939) although the ‘Hawthorne effect’ has multiple, contradictory, and
unreliable meanings (Chiesa & Hobbs, 2008). The definition used for the purpose of
this limitation is when there is a change in the particpant’s normal behaviour,
attributed to the knowledge that their behaviour is being watched or studied. Indeed
the researcher can be considered a causal influence in the Hawthorne effect by
‘merely by studying’, ‘merely observing’ and indeed the ‘mere presence of an
observer’. By friendly supervision, showing concern for their welfare and
endeavouring to create a warm, inclusive and secure space where the participants
were given individualised attention (for the Life story Interviews) and throughout
the group assessments and intervention the researcher may have inadvertently
promoted the ‘Hawthorne effect’. This supposistion could have been assessed by
having the researcher spend the same time with a ‘control goup’ without delivering
the intervention.
327
A further limitation and threat to internal validity is that maturation may
occur naturally with these adolescent samples, where the participants in the
intervention group develop in ways independent of the intervention (e.g. aging,
increasing experience and autonomy) which potentially affect self-esteem levels.
The history threat is when an event, such as school exams, which is not part
of the intervention (but could influence the outcome) occurs between pre- and post-
intervention assessments. Within the school environment, the probability of the
history threat occurring is high and exam results can both positively and negatively
impact academic self-esteem.
These three studies may also have suffered from Cohort effects (sometimes
referred to as “generation effects” (Last, 2001) as the adolescent cohort investigated
have shared common life experiences and experience similar social trends. These
adolescents, referred to a Generation Z (born between 1995-2012) will have
experienced very different historical events, arts and popular culture, political
realities, economic conditions and moral climate than the Millennials (born between
1980-1994). These shared group characteristics in terms of sociocultural contexts
may impact research cross-sectional findings and can be countered by conducting
longitudinal research investigating the way people change over time.
4.14 Future Implications
It is envisaged that the results of the thesis will not only contribute to the
knowledge of the development of self-esteem in adolescence for vulnerable
adolescents but for the wider adolescent population.
These studies provide a platform for further investigation into the realms of
the strengths of creativity and knowing myself. These two universal significant
328
predictors of self-esteem and sixteen other domain specific strengths have been
identified and may inform the design of interventions aimed at adolescents at risk of
suffering low self-esteem. Within the school context, the findings demonstrated
within this thesis provide unique opportunity of bolstering individual self-esteem
domains through interventions that target strengths.
It is hoped this research also provides support for incorporating strengths and
creativity into education and training into the school curriculum. This may be
difficult against a backdrop where creative arts are subjugated in comparison to the
more traditional and highly regarded ‘academic’ subjects. This is reinforced by
recently reported A level results (2019) which indicate a decrease in the number of
students taking music and drama. In such a divisive landscape, some educationalists
have contemplated a two-tier degree system where an arts degree may be construed
as inferior in terms of future earning power than science degrees. Since research has
implied that adolescence is a favourable time to improve “out of the box” thinking
and creativity processes, some argue that the decrease in creative subjects being
studied and perspective taken for higher education reflect an undervaluing of the
skills provided by creative and artistic subjects. Indeed, this perspective may also
impact upon adolescent self-esteem and well-being. However, according to the
Department of Education it has allegedly ringfenced £500 million of funding
between 2016-2020 for the provision of a diverse selection arts and music education
programmes.
The strength of knowing myself as a universal self-esteem predictor
underscores the importance of the development trajectory of identity formation in
terms of career exploration and commitment (Marcia, 1966) on self-esteem. Indeed,
there is evidence to suggest that adolescents possessing some career goals exhibit
329
significantly higher self-esteem than peers without any career goal (Lian-Huang,
1990). Such findings emphasise the significance of skilled career guidance in
schools. However, Patton, Bartrum, and Creed’s (2004) study with Australian high
school students revealed gender differentials, it was only for males that self-esteem
influenced career expectations, sequentially predicting career goals, career planning
and career exploration. Contextual factors such as the emphasise of the parents,
school and peers on career development were not explored.
There is scope for the introduction of a simplified version of the positive
emotions intervention utilised in Study 2. Indeed, it is posited that the application of
findings from these studies and those that it built upon, could result in a universal
‘Positive self-esteem’ programme. This comprehensive programme could be
implemented as a group school-based intervention for all children (10-13 years)
which equates to Years 6, 7 and 8 of the UK educational system. This sensitive
period presents the optimum epoch in which to foster a positive sense of self
through a preventative intervention. Indeed, a significant period acknowledging that
half of all mental health difficulties are entrenched by the age of 14 (Mental Health
Taskforce, 2016).
This eclectic programme would incorporate evidence-based research and
best practice. It would be deemed to yield the most beneficial outcomes for those in
the early adolescent years in the final year of junior school and through the
transition through the first two years of secondary school. This age provides a
window of opportunity before self-esteem is seen to decrease with age (Robins,
Trzesniewski, Tracy, Gosling and Potter, 2002). This programme would not only
reinforce the ethos and goals of the school (Forman, Olin, Hoagwood, Crowe, &
Saka, 2009) but it would actively encourage parents/caregivers to engage with the
330
programme though regular weekly correspondence and psycho-education (Roth,
Suldo & Ferron, 2017). Such knowledge would enable parents to confidently
reinforce the core ideas at home and within discussions with their children.
Creativity, identity formation and hope would be the central tenets of the
programme. The 5 session programme would be implemented on an inter-school
basis, in other words, schools would be twinned with other schools on the basis of
dichotomic social diversity in terms of gender, age, ethnicity in order to spark
creative thinking and exchanges (Van de Vyver & Crisp, 2019). Each 60 minute
session would commence with a ‘mindfulness’ activity – a crucial skill that can be
utilised in times of stress. Over the five sessions, each pupil would be encouraged to
write their life story (McAdams, 2002), illustrating nuclear episodes and improve
their creative writing in the hope-based ‘best possible selves’ activity (Barbot, 2018;
Barbot & Heuser, 2017). After the initial completion of the VIA (Peterson &
Seligman, 2004) Youth assessment online, each pupil would be able to recognise
their top five ‘signature strengths’. Each week they would have the opportunity to
use one of their five signature strengths and understand which umbrella Virtue it fell
under (for example, the character strength leadership under the Virtue of Justice).
Pupils would join five other pupils (all with different Virtue strengths) for a team
building activity. Within these team building activities, pupils would concentrate on
their character strength and together collaborate to make a positive creative
difference to their school environment or those within the school context, for
example, designing a poster that could sent out as a flyer for sports day. This would
encourage pupil development as socially responsible individuals who contribute
meaningfully to the community, through learning and the application of values,
knowledge and skills. It is suggested that by integrating a positive sense of self in
331
the present and through future projections, sparking creativity through idea
formation within diverse teams and being scaffolded by a supportive and knowledge
parental and school network, that the pupil’s self-esteem will grow and flourish.
It is also suggested that changes in the instruments measuring self-esteem be
implemented. Reflecting upon societal and cultural changes it is suggested that a
revision of a multidimensional self-esteem scale includes a new domain on body
esteem and a revised social self-esteem domain to incorporate cyber self-esteem.
Indeed, a single instrument Body Esteem Scale (BES; Franzoi & Shields
1984) exists, and there is evidence of a revision to this multidimensional and gender
specific scale by Frost, Franzoi, Oswald and Shields (2018). Moreover, since results
from the current study identified knowing myself as the most significant predictor of
all self-esteem domains it is posited that a new domain be constructed to measure
body esteem as an addition to the already existent domain specific instrument. Body
image is as an individual’s perceptions, feelings and thoughts about their body and
body dissatisfaction arises when there is perceived discrepancy in the assessment
between actual body and ideal body. Such dissatisfaction is extenuated by the media
platform promotion of an ideal, unrealistic airbrushed standard of attractiveness.
Evidence suggests such social comparison has a significant negative impact
upon body image (Jones, 2001). As referred to in the introduction of this thesis,
emerging research suggests a correlation between social media use (specifically
popular image-based platforms (such as Facebook, Instagram etc.) and body
dissatisfaction (Holland & Tiggemann, 2016). Dissatisfaction about body shape and
facial/body features is widespread amongst both female and male adolescents
(Arim, Shapka & Dahinten, 2006) and is revealed to manifest in lower self-esteem
in both girls and boys in adolescence ((Erickson, Hahn-Smith & Smith, 2009;
332
Paxton, Neumark-Sztainer, Hannan & Eisenberg, 2006). Although it can be counter-
argued that those most dissatisfied with their appearance trawl the internet in search
of reassurance and self-improvement advice (Franchina & Coco, 2018). It is
interesting to note that adolescent girls who often share ‘selfies’ and spend time on
the editing and photoshopping of this self-image have poorer levels of body image
(McLean, Paxton, Wertheim & Masters, 2015). As eluded to earlier, the evaluation
of one’s physical appearance is highly correlated to global self-esteem, i.e., in the
range of .45–.75 in studies from Western countries (van der Berg, Mond, Eisenberg,
Ackard, & Neumark-Sztainer, 2010) and Asia (Chen, Fox, Haase, & Ku, 2010).
Indeed, Kiviruusu et al. (2016) revealed that higher and increasing Body Mass Index
in females is correlated with lower and more slowly increasing self-esteem in
adolescence, associations were weaker amongst males. Since, body esteem is
considered a significant dimension of self-esteem and refers to self-evaluations of
one’s own body (Mendelson, Mendelson & Andrews 2000), it is crucial that items
relating to body image and body dissatisfaction are included in future
multidimensional self-esteem measures.
Although not specifically addressed in this thesis, research highlights that
increased internet use is associated with declining adolescent self-esteem (Langlais,
Seidman & Bruxvoort, 2018) as well as decreased and slower adaptability in
decision-making regarding careers compared to adolescents who spend less time on
the internet (Sinkkonen, Puhakka, & Meriläinen, 2018). Therefore, the potential
inclusion of items measuring cyber self-esteem in a revised social self-esteem
domain is warranted.
333
4.15 Conclusion
It is envisaged that the results of the thesis exploring the levels, promotion
and prediction of self-esteem domains will not only contribute to the knowledge of
the development of self-esteem in adolescence, but also provide implications of
incorporating strengths and creativity into education and training into the school
curriculum. Indeed, this research offers persuasive evidence for the introduction of
preventative strengths intervention programmes for early adolescents in order to
bolster low self-esteem within a positive school environment. It is through the
attainment and maintenance of resultant healthy levels of self-esteem that a climate
is fostered in which adolescents can flourish with the ability to ‘dream too big’.
334
References
Adams, G. R., & Marshall, S. K. (1996). A developmental social psychology of
identity: Understanding the person-in-context. Journal of
adolescence, 19(5), 429-442.
Akhtar, M., & Boniwell, I. (2010). Applying positive psychology to alcohol-
misusing adolescents: A group intervention. Groupwork: An
Interdisciplinary Journal for Working with Groups, 20 (3), 6-31.
Alberts, C., Mbalo, N. F., & Ackermann, C. J. (2003). Adolescents' perceptions of
the relevance of domains of identity formation: A South African cross-
cultural study. Journal of Youth and Adolescence, 32(3), 169-184.
Alesi, M., Rappo, G., & Pepi, A. (2012). Self-esteem at school and self-
handicapping in childhood: Comparison of groups with learning
disabilities. Psychological reports, 111(3), 952-962.
Alexander-Passe, N. (2006). How dyslexic teenagers cope: An investigation of self-
esteem, coping and depression. Dyslexia, 12(4), 256-275.
Alexander‐Passe, N. (2008). The sources and manifestations of stress amongst
school‐aged dyslexics, compared with sibling controls. Dyslexia, 14(4), 291-
313.
Alexander-Passe, N. (2012). Dyslexia and depression: The hidden sorrow: An
investigation of cause and effect. Novinka/Nova Science Publishers.
335
Alexander-Passe, N. (2015). Dyslexia: Investigating self-harm and suicidal
thoughts/attempts as a coping strategy. Journal of Psychology &
Psychotherapy, 5(6), 1-11.
Alexander-Passe, N. (2016). The School’s role in creating Successful and
Unsuccessful Dyslexics. Journal of Psychology & Psychotherapy, 6(1), 1-
13.
Algoe, S. B. (2012). Find, remind, and bind: The functions of gratitude in everyday
relationships. Social and Personality Psychology Compass, 6(6), 455-469.
Algoe, S. B., Fredrickson, B. L., & Gable, S. L. (2013). The social functions of the
emotion of gratitude via expression. Emotion, 13(4), 605-609.
Alicke, M. D., & Sedikides, C. (2009). Self-enhancement and self-protection: What
they are and what they do. European Review of Social Psychology, 20(1), 1-
48.
Al-Owidha, A., Green, K. E., & Kroger, J. (2009). On the question of an identity
status category order: Rasch model step and scale statistics used to identify
category order. International Journal of Behavioral Development, 33(1), 88-
96.
Anderson, L., & Heyne, L. (2012). Therapeutic recreation practice: A strengths
approach. State College, PA: Venture Publishing.
Anderson, P. L., & Meier-Hedde, R. (2017). Cross-case analysis and reflections.
In Dyslexia in Adolescence (pp. 245-288). Routledge.
336
Androutsopoulou, A., Thanopoulou, K., Economou, E. and Bafiti, T. (2004).
Forming criteria for assessing the coherence of client's life stories: a
narrative study. Journal of Family Therapy, 26, 384-406.
Alarcon, G. M., Bowling, N. A., & Khazon, S. (2013). Great expectations: A meta-
analytic examination of optimism and hope. Personality and Individual
Differences, 54(7), 821-827.
American Psychiatric Association (2013). Diagnostic and Statistical manual of
mental disorders. Washington DC, APA.
Antonietti, A., Pizzingrilli, P., & Valenti, C. (2012). Il test ACR: versione per la
scuola secondaria di primo grado [The WCR test: Junior high school
version]. Milano: Servizio di Psicologia dell’Apprendimento e
dell’Educazione in Età Evolutiva, Università Cattolica del Sacro Cuore.
Arbona, C., & Power, T. G. (2003). Parental attachment, self-esteem, and antisocial
behaviors among African American, European American, and Mexican
American adolescents. Journal of Counseling Psychology, 50(1), 40-51.
Archer, S. L., & Waterman, A. S. (1990). Varieties of identity diffusions and
foreclosures: An exploration of subcategories of the identity
statuses. Journal of Adolescent Research, 5(1), 96-111.
Arens, A. K., Yeung, A. S., Nagengast, B., & Hasselhorn, M. (2013). Relationship
between self-esteem and academic self-concept for German elementary and
secondary school students. Educational Psychology, 33(4), 443-464.
Arim, R. G., Shapka, J. D., & Dahinten, V. S. (2006). The developmental
trajectories of psychopathology in adolescence: An investigation of the
337
effects of gender and pubertal timing. In 10th Conference of the European
Association for Research on Adolescence (EARA), Antalya, Turkey.
Aunola, K., Stattin, H., & Nurmi, J. E. (2000). Parenting styles and adolescents'
achievement strategies. Journal of adolescence, 23(2), 205-222.
Bachman, J. G., O'Malley, P. M., Freedman-Doan, P., Trzesniewski, K. H., &
Donnellan, M. B. (2011). Adolescent self-esteem: Differences by
race/ethnicity, gender, and age. Self and Identity, 10(4), 445-473.
Bailey, T. C., Eng, W., Frisch, M. B., & Snyder, C. R. (2007). Hope and optimism
as related to life satisfaction. The Journal of Positive Psychology, 2(3), 168-
175.
Baran, G., Erdogan, S., & Cakmak, A. (2011). A study on the relationship between
six‐year ability. International Educational Studies, 4, 105–111.
Barbot, B. (2018). Creativity and self‐esteem in adolescence: A study of their
domain‐specific, multivariate relationships. The Journal of Creative
Behaviour, 1-14.
Barbot, B., Lubart, T. I., & Besançon, M. (2016). “Peaks, slumps, and bumps”:
Individual differences in the development of creativity in children and
adolescents. New directions for child and adolescent
development, 2016(151), 33-45.
Barbot, B., & Heuser, B. (2017). Creativity and identity formation in adolescence:
A developmental perspective. In The Creative Self (pp. 87-98). Academic
Press.
338
Bartlett, M. Y., & DeSteno, D. (2006). Gratitude and prosocial behavior: Helping
when it costs you. Psychological science, 17(4), 319-325.
Barlow, D. H., & Nock, M. K. (2009). Why can't we be more idiographic in our
research?. Perspectives on Psychological Science, 4(1), 19-21.
Bastounis, A., Callaghan, P., Banerjee, A., & Michail, M. (2016). The effectiveness
of the Penn Resiliency Programme (PRP) and its adapted versions in
reducing depression and anxiety and improving explanatory style: A
systematic review and meta-analysis. Journal of adolescence, 52, 37-48.
Bateman, B. (1965). An educator's view of a diagnostic approach to learning
disorders. Learning disorders, 1, 219-239.e
Battistutta, L., Commissaire, E., & Steffgen, G. (2018). Impact of the Time of
Diagnosis on the Perceived Competence of Adolescents with
Dyslexia. Learning Disability Quarterly, 41(3), 170-178.
Battle, J. (1981). Culture-free SEI: Self-esteem inventories for children and adults.
Special Child Publications.
Battle, J. (2002). Culture-Free Self-Esteem Inventories Examiner’s Manual. Austin,
TX: Pro-Ed.
Brunsman, B.A. (2003). Review of the Culture-Free Self-Esteem Inventories, third
edition. Mental Measurements Yearbook, 15, 274-276.
Baumeister, R. F., Campbell, J. D., Krueger, J. I., & Vohs, K. D. (2003). Does high
self-esteem cause better performance, interpersonal success, happiness, or
healthier lifestyles? Psychological science in the public interest, 4(1), 1-44.
339
Baumeister, R. F., Campbell, J. D., Krueger, J. I., & Vohs, K. D. (2005). Exploding
the self-esteem myth. Scientific American, 292(1), 84-91.
Baumeister, R. F., & Vohs, K. D. (2018). Revisiting our reappraisal of the
(surprisingly few) benefits of high self-esteem. Perspectives on
Psychological Science, 13(2), 137-140.
Bentler, P. M., & Bonett, D. G. (1980). Significance tests and goodness of fit in the
analysis of covariance structures. Psychological bulletin, 88(3), 588-606.
Berzonsky, M. D., & Kuk, L. S. (2000). Identity status, identity processing style,
and the transition to university. Journal of adolescent research, 15(1), 81-
98.
Bielby, G., Judkins, M., o’Donnell, L., & McCrone, T. (2012). Review of the
curriculum and qualification needs of young people who are at risk of
disengagement. Slough, Berkshire: National Foundation for Educational
Research.
Billington, T. (2006). Working with children: Assessment, representation and
intervention. London: Sage.
Birkeland, M. S., Melkevik, O., Holsen, I., & Wold, B. (2012). Trajectories of
global self-esteem development during adolescence. Journal of
Adolescence, 35(1), 43-54.
Birkeland, M. S., Breivik, K., & Wold, B. (2014). Peer acceptance protects global
self-esteem from negative effects of low closeness to parents during
adolescence and early adulthood. Journal of Youth and Adolescence, 43(1),
70-80.
340
Birndorf, S., Ryan, S., Auinger, P., & Aten, M. (2005). High self-esteem among
adolescents: Longitudinal trends, sex differences, and protective
factors. Journal of Adolescent Health, 37(3), 194-201
Biswas-Diener, R., Kashdan, T. B., & Minhas, G. (2011). A dynamic approach to
psychological strength development and intervention. The Journal of
Positive Psychology, 6(2), 106-118.
Bleidorn, W., Arslan, R. C., Denissen, J. J., Rentfrow, P. J., Gebauer, J. E., Potter,
J., & Gosling, S. D. (2016). Age and gender differences in self-esteem—A
cross-cultural window. Journal of personality and social
psychology, 111(3), 396-410.
Boehm, J. K., Lyubomirsky, S., & Sheldon, K. M. (2011). A longitudinal
experimental study comparing the effectiveness of happiness-enhancing
strategies in Anglo Americans and Asian Americans. Cognition &
Emotion, 25(7), 1263-1272.
Bolier, L., Haverman, M., Westerhof, G. J., Riper, H., Smit, F., & Bohlmeijer, E.
(2013). Positive psychology interventions: a meta-analysis of randomized
controlled studies. BMC public health, 13(1), 119. doi:10.1186/1471-2458-
13-119
Bono, G., Froh, J. J., Disabato, D., Blalock, D., McKnight, P., & Bausert, S. (2019).
Gratitude’s role in adolescent antisocial and prosocial behavior: A 4-year
longitudinal investigation. The Journal of Positive Psychology, 14(2), 230-
243.
341
Borghans, L., Duckworth, A. L., Heckman, J. J., & Ter Weel, B. (2008). The
economics and psychology of personality traits. Journal of human
Resources, 43(4), 972-1059.
Bosson, J. K., Brown, R. P., Zeigler-Hill, V., & Swann, W. B., Jr. (2003). Self-
enhancement tendencies among people with high explicit self-esteem: The
moderating role of implicit self-esteem. Self and Identity, 2, 169-187.
Bracken, B. A. (1992). Multidimensional self concept scale. Pro-ed.
Brazeau, J. N., Teatero, M. L., Rawana, E. P., Brownlee, K., & Blanchette, L. R.
(2012). The strengths assessment inventory: Reliability of a new measure of
psychosocial strengths for youth. Journal of Child and Family
Studies, 21(3), 384-390.
Brdar, I., Anić, P., & Rijavec, M. (2011). Character strengths and well-being: are
there gender differences? In The human pursuit of well-being (pp. 145-156).
Springer, Dordrecht.
Breger, L. (1974). From instinct to identity: The development of personality.
Englewood Cliffs, NJ: Prentice-Hall.
British Psychological Society (2009). Code of Ethics and Conduct. BPS: Leicester.
Bronfenbrenner, U. (1992). Ecological systems theory. Jessica Kingsley Publishers.
Brossart, D. F., Laird, V. C., & Armstrong, T. W. (2018). Interpreting Kendall’s
Tau and Tau-U for single-case experimental designs. Cogent
Psychology, 5(1), 1518687.
Brunsman, B.A. (2003). Review of the Culture-Free Self-Esteem Inventories, third
edition. Mental Measurements Yearbook, 15, 274-276.
342
Bryant, F. B., & Veroff, J. (2007). Savoring: A new model of positive experience.
Mahwah, NJ: Lawrence Erlbaum.
Buckley, J. A., & Epstein, M. H. (2004). The Behavioral and Emotional Rating
Scale-2 (BERS-2): Providing a comprehensive approach to strength-based
assessment. The California School Psychologist, 9(1), 21-27.
Bundick, M. J. (2011). Extracurricular activities, positive youth development, and
the role of meaningfulness of engagement. The Journal of Positive
Psychology, 6(1), 57-74.
Burden, R., & Burdett, J. (2005). Factors associated with successful learning in
pupils with dyslexia: a motivational analysis. British Journal of special
education, 32(2), 100-104.
Burden, R. (2008). Is dyslexia necessarily associated with negative feelings of self‐
worth? A review and implications for future research. Dyslexia, 14(3), 188-
196.
Burr, V. (2003). Social constructionism. Routledge
Burwell, R. A., & Shirk, S. R. (2006). Self Processes in adolescent depression: The
role of self‐worth contingencies. Journal of Research on Adolescence, 16(3),
479-490.
Busse, R. T., & Kennedy, K. (2005). Methods for assessing response to
intervention. In Workshop presented at the annual convention of the
National Association of School Psychologists, Atlanta, GA.
Busse, R. T., Elliott, S. N., & Kratochwill, T. R. (2010). Convergent evidence
scaling for multiple assessment indicators: Conceptual issues, applications,
343
and technical challenges. Journal of Applied School Psychology, 26(2), 149-
161.
Busse, R. T., McGill, R. J., & Kennedy, K. S. (2015). Methods for assessing single-
case school-based intervention outcomes. Contemporary School
Psychology, 19(3), 136-144.
Calleja, N. (2016). The effect of a profile of dyslexia on the adolescents’ quality of
life: listening to the memories of young adults (Bachelor's thesis, University
of Malta).
Cancer, A., Manzoli, S., & Antonietti, A. (2016). The alleged link between
creativity and dyslexia: Identifying the specific process in which dyslexic
students excel. Cogent Psychology, 3(1), 1190309.
Carter, M. J. (2014). Gender socialization and identity theory. Social Sciences, 3,
242–263.
Cavazos‐Rehg, P. A., & DeLucia‐Waack, J. L. (2009). Education, ethnic identity,
and acculturation as predictors of self‐esteem in Latino adolescents. Journal
of Counseling & Development, 87(1), 47-54.
Challen, A. R., Machin, S. J., & Gillham, J. E. (2014). The UK Resilience
Programme: A school-based universal nonrandomized pragmatic controlled
trial. Journal of consulting and clinical psychology, 82(1), 75-89.
Cheavens, J. S., Feldman, D. B., Gum, A., Michael, S. T., & Snyder, C. R. (2006).
Hope therapy in a community sample: A pilot investigation. Social
indicators research, 77(1), 61-78.
344
Chen, L. J., Fox, K. R., Haase, A. M., & Ku, P. W. (2010). Correlates of body
dissatisfaction among Taiwanese adolescents. Asia Pacific Journal of
Clinical Nutrition, 19(2), 172-179.
Cheng, H., & Furnham, A. (2017). Early indicators of self-esteem in teenagers:
Findings from a nationally representative sample. Personality and Individual
Differences, 116, 139-143.
Ciarrochi, J., Heaven, P. C., & Davies, F. (2007). The impact of hope, self-esteem,
and attributional style on adolescents’ school grades and emotional well-
being: A longitudinal study. Journal of Research in Personality, 41(6),
1161-1178.
Ciarrochi, J., Parker, P., Kashdan, T. B., Heaven, P. C., & Barkus, E. (2015). Hope
and emotional well-being: A six-year study to distinguish antecedents,
correlates, and consequences. The Journal of Positive Psychology, 10(6),
520-532.
Cingel, D. P., & Olsen, M. K. (2018). Getting Over the Hump: Examining
Curvilinear Relationships between Adolescent Self-Esteem and Facebook
Use. Journal of Broadcasting & Electronic Media, 62(2), 215-231.
Christianson, A.A. (1992). Emotional stress and eyewitness memory: A critical
review. Psychological Bulletin, 112, 284–309.
Cierpka, A. (2014). Narrative identity of adolescents and family
functioning. Psychology of Language and Communication, 18(3), 263-279.
345
Claassens, T., & Lessing, A. C. (2015). Young adult learners with dyslexia: their
socio-emotional support needs during adolescence. Journal of Psychology in
Africa, 25(1), 32-36.
Clay, D., Vignoles, V. L., & Dittmar, H. (2005). Body image and self-esteem
among adolescent girls: testing the influence of sociocultural factors.
Journal of Research on Adolescence, 15, 451–477.
Cohen, J. (1988), Statistical Power Analysis for the Behavioral Sciences (2nd ed.),
New Jersey: Lawrence Erlbaum Associates, ISBN 978-0-8058-0283-2.
Collange, J., Fiske, S. T., & Sanitioso, R. (2009). Maintaining a positive self-image
by stereotyping others: Self-threat and the stereotype content model. Social
Cognition, 27(1), 138-149.
Colker, R., Shaywitz, S., Shaywitz, B., & Simon, J. A. (2012). Comments on
proposed DSM-5 criteria for specific learning disorder from a legal and
medical/scientific perspective. Dyslexia. Yale. Retrieved from
http://dyslexia.yale.edu/CommentsDSM5ColkerShaywitzSimon.pdf.
Comrey, A. L., & Lee, H. B. (1992). A First Course in Factor Analysis, 2nd Edn.
Hillsdale, NJ: L.
Conchas, G. Q., & Rodriguez, L. F. (2007). Small schools and urban youth: Using
the power of school culture to engage students. Thousand Oaks, CA: Corwin
Press.
Conners 3rd, K. C. (2008). Conners 3rd edition manual. New York: Multi-Health
Systems.
346
Conway, A. M., Tugade, M. M., Catalino, L. I., & Fredrickson, B. L. (2013). The
broaden-and-build theory of positive emotions: Form, function and
mechanisms. Oxford handbook of happiness, 17-34.
Cooley, C. H. (1902). The looking-glass self. O’Brien, 126-128. In Harter, S.
(1993). Causes and consequences of low self-esteem in children and
adolescents. In Self-esteem (pp. 87- 116). Springer US.
Cordery, J. L., Morrison, D., Wright, B. M., & Wall, T. D. (2010). The impact of
autonomy and task uncertainty on team performance: A longitudinal field
study. Journal of Organizational Behavior, 31(2‐3), 240-258.
Costello, E. J., Egger, H. L., & Angold, A. (2005). The developmental
epidemiology of anxiety disorders: phenomenology, prevalence, and
comorbidity. Child and Adolescent Psychiatric Clinics, 14(4), 631-648.
Cotton Bronk, K., Hill, P. L., Lapsley, D. K., Talib, T. L., & Finch, H. (2009).
Purpose, hope, and life satisfaction in three age groups. The Journal of
Positive Psychology, 4(6), 500-510.
Courtney, E. A., Gamboz, J., & Johnson, J. G. (2008). Problematic eating behaviors
in adolescents with low self-esteem and elevated depressive
symptoms. Eating Behaviors, 9(4), 408-414.
Cranney, J., Botwood, L., & Morris, S. (2012). National standards for psychological
literacy and global citizenship: Outcomes of undergraduate psychology
education. Australia: The University of New South Wales. Dostupné z:
http://www. groups. psychology. org.
au/Assets/Files/Cranney_NTF_Final_Report_231112_Final_pdf. pdf.
347
Crawford, C., Duckworth, K., Vignoles, A., & Wyness, G. (2011). Young people’s
education and labour market choices aged 16/17 to 18/19. London:
Department for Education.
Cresswell, J.W. (1995) Research design: Qualitative and quantitative
approaches. Thousand Oaks, CA: Sage.
Cresswell, J. W., & Plano Clark, V. L. (2011). Designing and conducting mixed
method research. 2nd Sage. Thousand Oaks, CA, 201.
Creswell, J. W. (2013). Qualitative inquiry and research design: Choosing among
five approaches (Third Edit). Los Angeles: Sage Publications.
Crocetti, E., Klimstra, T., Keijsers, L., Hale, W. W., & Meeus, W. (2009). Anxiety
trajectories and identity development in adolescence: A five-wave
longitudinal study. Journal of Youth and Adolescence, 38(6), 839-849.
Crocker, J., & Major, B. (1989). Social stigma and self-esteem: The self-protective
properties of stigma. Psychological Review, 96, 608–630.
Crocker, J., & Major, B. (86). Steele., C. (1998). Social stigma. The handbook of
social psychology, 504-553.
Daft, R. L. (1983). Learning the craft of organizational research. Academy of
Management Review, 8(4), 539-546.
Daley, K. (2015). The wrongs of protection: Balancing protection and participation
in research with marginalised young people. Journal of Sociology, 51(2),
121-138.
Damon, W. (2008). The path to purpose: Helping our children find their calling in
life. New York: The Free Press.
348
Das, J. K., Salam, R. A., Lassi, Z. S., Khan, M. N., Mahmood, W., Patel, V., &
Bhutta, Z. A. (2016). Interventions for adolescent mental health: an
overview of systematic reviews. Journal of Adolescent Health, 59(4), S49-
S60.
Davis, H. A., Chang, M. L., Andrzejewski, C. E., & Poirier, R. R. (2014).
Examining relational engagement across the transition to high schools in
three US high schools reformed to improve relationship quality. Learning
Environments Research, 17(2), 263-286.
Dawson, T. L., Fischer, K. W., & Stein, Z. (2006). Reconsidering qualitative and
quantitative research approaches: A cognitive developmental
perspective. New Ideas in Psychology, 24(3), 229-239.
Deci, E., & Ryan, R. M. (1985). Intrinsic motivation and self-determination in
human behaviour. Springer Science & Business Media.
Deci, E. L., & Ryan, R. M. (2000). The" what" and" why" of goal pursuits: Human
needs and the self-determination of behavior. Psychological inquiry, 11(4),
227-268.
Demanet, J., & Van Houtte, M. (2014). Social–ethnic school composition and
disengagement: An inquiry into the perceived control explanation. The
Social Science Journal, 51(4), 659-675.
Demetriou, C., Ozer, B.U. & Essau, C.A., 2015, ‘Self-report questionnaires’, in
R.L. Cautin & S.O. Lilienfeld (eds.), The encyclopedia of clinical
psychology, 1st edn., pp. 1–6, John Wiley & Sons, NJ.
349
Demirli, A., Türkmen, M., & Arık, R. S. (2015). Investigation of dispositional and
state hope levels’ relations with student subjective well-being. Social
Indicators Research, 120(2), 601-613.
Deng, X.‐P., & Zhang, X.‐K. (2011). Understanding the relationship between self‐
esteem and creativity: A meta‐analysis. Advances in Psychological
Science, 19, 645–651.
Denissen, J. J., Penke, L., Schmitt, D. P., & Van Aken, M. A. (2008). Self-esteem
reactions to social interactions: evidence for sociometer mechanisms across
days, people, and nations. Journal of personality and social
psychology, 95(1), 181-196.
Denny, S., Hazenberg, R., Irwin, W., & Seddon, F. (2011). Social enterprise:
evaluation of an enterprise skills programme. Social enterprise journal.
Department for Children, Schools and Families (2005) Youth Cohort Study: The
Activities and Experiences of 16 year olds: 2004. Statistical Bulletin.
Department for Children, Schools and Families (2008). Youth cohort study &
longitudinal study of young people in England: The activities and
experiences of 16 year olds: England 2007. Statistical Bulletin.
Department for Children, Schools and Families (2009) Youth Cohort Study &
Longitudinal Study of Young People in England: The Activities and
Experiences of 17 year olds: 2008. Statistical Bulletin.
Department for Children, Schools and Families (2009) Statistical First Release:
Permanent and fixed period exclusions from schools and exclusion appeals
in England, 2007/08. Statistical Bulletin.
350
Department for Communities and Local Government, The English Indices of
deprivation (2015) retrieved
https://www.gov.uk/government/statistics/english-indices-of-deprivation-
2015 and
https://assets.publishing.service.gov.uk/government/uploads/system/uploads/
attachment_data/file/579151/English_Indices_of_Deprivation_2015_-
_Frequently_Asked_Questions_Dec_2016.pdf
Descartes, C. H., Ramesar, M., & Mills, J. (2018). Global or Domain Specific Self-
Esteem: Can it Predict Aggression Among Children and Adolescents?
Journal of Aggression, Maltreatment & Trauma, 1-19.
Diener, E., & Diener, M. (2009). Cross-cultural correlates of life satisfaction and
self-esteem. In Culture and well-being (pp. 71-91). Springer, Netherlands
Diener, E., Oishi, S., & Lucas, R. E. (2009). Subjective well-being: The science of
happiness and life satisfaction. In S. J. Lopez & C. R. Snyder (Eds.), Oxford
handbook of positive psychology (2nd ed., pp. 187–194). New York: Oxford
University Press
Dogra, A. K., Basu, S., & Das, S. (2011). Impact of meaning in life and reasons for
living to hope and suicidal ideation: A study among college students. SIS
Journal of Projective Psychology & Mental Health, 18(1), 89-102.
Dollinger, S. J., & Clancy, S. M. (1993). Identity, self, and personality: II. Glimpses
through the autophotographic eye. Journal of Personality and Social
Psychology, 64(6), 1064-1071.
Dollinger, S. J., Clancy Dollinger, S. M., & Centeno, L. (2005). Identity and
creativity. Identity, 5(4), 315-339.
351
Donnellan, M. B., Trzesniewski, K. H., Robins, R. W., Moffitt, T. E., & Caspi, A.
(2005). Low self-esteem is related to aggression, antisocial behavior, and
delinquency. Psychological science, 16(4), 328-335.
Douglass, R. P., & Duffy, R. D. (2015). Strengths use and life satisfaction: A
moderated mediation approach. Journal of Happiness Studies, 16(3), 619-
632.
DSM-5 American Psychiatric Association. (2013). Diagnostic and statistical manual
of mental disorders. Arlington: American Psychiatric Publishing.
Du, H., Bernardo, A. B., & Yeung, S. S. (2015). Locus-of-hope and life satisfaction:
The mediating roles of personal self-esteem and relational self-
esteem. Personality and Individual Differences, 83, 228- 233.
Duffy, G., & Elwood, J. (2013). The perspectives of 'disengaged' students in the 14–
19 phase on motivations and barriers to learning within the contexts of
institutions and classrooms. London Review of Education, 11(2), 112-126.
Durlak, J. A., Weissberg, R. P., Dymnicki, A. B., Taylor, R. D., & Schellinger, K.
B. (2011). The impact of enhancing students’ social and emotional learning:
A meta‐analysis of school‐based universal interventions. Child
development, 82(1), 405-432.
Eccles, J. S., Midgley, C., Wigfield, A., Buchanan, C. M., Reuman, D., Flanagan,
C., & Mac Iver, D. (1993). Development during adolescence: The impact of
stage-environment fit on young adolescents' experiences in schools and in
families. American psychologist, 48(2), 90-101.
352
Eide, B., & Eide, F. (2012). The dyslexic advantage: Unlocking the hidden potential
of the dyslexic brain. Penguin.
Elkind, D. (1967). Egocentrism in adolescence. Child development, 1025-1034.
Elkind, D., & Bowen, R. (1979). Imaginary audience behaviour in children and
adolescents. Developmental Psychology 15(1), 38-44.
Elliott, J. (2005). Using narrative in social research: Qualitative and quantitative
approaches. Sage Publications.
Elliott, S. N., & Busse, R. T. (2004). Assessment and evaluation of students’
behaviour and intervention outcomes: The utility of rating scale methods.
Elliott, J. & Grigorenko, E.L. (2014). The Dyslexia Debate. Cambridge University
Press.
Emmons, R. A. (2007). Thanks!: How the new science of gratitude can make you
happier. Houghton Mifflin Harcourt.
Emmons, R. A., & Mishra, A. (2011). Why gratitude enhances well-being: What we
know, what we need to know. Designing positive psychology: Taking stock
and moving forward, 248-262.
Emmons, R. A., & Stern, R. (2013). Gratitude as a psychotherapeutic
intervention. Journal of clinical psychology, 69(8), 846-855.
Epstein, M. H., & Sharma, J. (1998). The Behavior and Emotional Rating Scale: A
strength, based approach to assessment. Austin, TX: PRO-ED.
353
Epstein, M. H. (1999). The development and validation of a scale to assess the
emotional and behavioral strengths of children and adolescents. Remedial
and Special Education, 20(5), 258-262.
Epstein, M. H., Ryser, G., & Pearson, N. (2002). Standardization of the Behavioral
and Emotional Rating Scale: Factor structure, reliability, and criterion
validity. The Journal of Behavioral Health Services & Research, 29(2), 208-
216.
Epstein, M. H. (2004). Behavioral and Emotional Rating Scale: A Strength-Based
Approach to Assessment: Examiner's Manual. Pro-Ed.
Epstein, M. H., Mooney, P., Ryser, G., & Pierce, C. D. (2004). Validity and
reliability of the behavioral and emotional rating scale: Youth rating
scale. Research on Social Work Practice, 14(5), 358-367.
Epstein, M. J., & McFarlan, F. W. (2011). Measuring the efficiency and
effectiveness of a non profit's performance. Strategic finance, 93(4), 27-34.
Erickson, S. J., Hahn-Smith, A., & Smith, J. E. (2009). One step closer:
Understanding the complex relationship between weight and self-esteem in
ethnically diverse preadolescent girls. Journal of Applied Developmental
Psychology, 30, 129–139.
Erikson, E. H. (1950). Childhood and Society, New York: Norton
Erikson, E. H. (1968). Identity, Youth and Crisis. New York: Norton.
Eryılmaz, A. (2011). The relationship between adolescents’ subjective well-being
and positive expectations towards future. The Journal of Psychiatry and
Neurological Sciences, 24, 209-215.
354
Fagg, J. H., Curtis, S. E., Cummins, S., Stansfeld, S. A., & Quesnel-Vallée, A.
(2013). Neighbourhood deprivation and adolescent self-esteem: Exploration
of the ‘socio-economic equalisation in youth’hypothesis in Britain and
Canada. Social Science & Medicine, 91, 168-177.
Faircloth, B. S. (2012). “Wearing a mask” vs. connecting identity with
learning. Contemporary Educational Psychology, 37(3), 186-194.
Fawcett, A. J., & Nicolson, R. I. (2007). Dyslexia, learning, and pedagogical
neuroscience. Developmental Medicine & Child Neurology, 49(4), 306-311.
Ferguson, G. M., Hafen, C. A., & Laursen, B. (2010). Adolescent psychological and
academic adjustment as a function of discrepancies between actual and ideal
self-perceptions. Journal of Youth and Adolescence, 39(12), 1485-1497.
Ferragut, M., Blanca, M. J., & Ortiz-Tallo, M. (2014). Psychological virtues during
adolescence: A longitudinal study of gender differences. European Journal
of Developmental Psychology, 11(5), 521-531.
Field, A., (2005). Discovering Statistics Using SPSS. 2nd ed. London: Sage
Filmer-Sankey, C., & McCrone, T. (2012). Developing indicators for early
identification of young people at risk of temporary disconnection from
learning. NFER.
Findlay, L. C., & Bowker, A. (2009). The link between competitive sport
participation and self-concept in early adolescence: A consideration of
gender and sport orientation. Journal of youth and adolescence, 38(1), 29-
40.
355
Finn, J. D. (1989). Withdrawing from school. Review of educational
research, 59(2), 117-142.
Finn, J. D., & Voelkl, K. E. (1993). School characteristics related to student
engagement. Journal of Negro Education, 62(3), 249–268.
Fischer, K. W., & Bidell, T. R. (2006). Dynamic development of action, thought,
and emotion. In W. Damon & R. M. Lerner (Eds.), 6th ed. Theoretical
models of human development. Handbook of child psychology, Vol. 1 (pp.
313–399). New York: Wiley
Flinchbaugh, C. L., Moore, E. W. G., Chang, Y. K., & May, D. R. (2012). Student
well-being interventions: The effects of stress management techniques and
gratitude journaling in the management education classroom. Journal of
Management Education, 36(2), 191-219.
Forman, S. G., Olin, S. S., Hoagwood, K. E., Crowe, M., & Saka, N. (2009).
Evidence-based interventions in schools: Developers’ views of
implementation barriers and facilitators. School Mental Health, 1(1), 26-36.
Fox, J. (2008). Your child's strengths: Discover them, develop them, use them.
Penguin.
Franchina, V., & Coco, G. L. (2018). The influence of social media use on body
image concerns. International Journal of Psychoanalysis and
Education, 10(1), 5-14.
Francis, L. J., & Jones, S. H. (1996). Social class and self-esteem. The Journal of
social psychology, 136(3), 405-406.
356
Franks, J., Rawana, E., & Brownlee, K. (2013). The relationship between strengths
in youth and bullying experiences at school. Educational & Child
Psychology, 30(4), 44-58.
Franzoi, S. L., & Shields, S. A. (1984). The Body Esteem Scale: Multidimensional
structure and sex differences in a college population. Journal of Personality
Assessment, 48, 173–178.
Fredricks, J. A., Blumenfeld, P. C., & Paris, A. H. (2004). School engagement:
Potential of the concept, state of the evidence. Review of educational
research, 74(1), 59-109.
Fredrickson, B.L. (1998). What good are positive emotions? Review of General
Psychiatry, 2, 300–319
Fredrickson, B. L. (2001). The role of positive emotions in positive psychology:
The broaden-and-build theory of positive emotions. American Psychologist,
56(3), 218-226.
Fredrickson, B. L. (2004). The broaden-and-build theory of positive
emotions. Philosophical Transactions of the Royal Society B: Biological
Sciences, 359(1449), 1367-1377.
Fredrickson, B. L. (2004). Gratitude, like other positive emotions, broadens and
builds. In R. A. Emmons & M. E. McCullough (Eds.), The psychology of
gratitude (pp. 145–166). New York: Oxford University Press
Fredrickson, B. L. (2009). Positivity. Harmony.
357
Fredrickson, B. L., & Branigan, C. (2005). Positive emotions broaden the scope of
attention and thought‐action repertoires. Cognition & emotion, 19(3), 313-
332.
Fredrickson, B. L., Cohn, M. A., Coffey, K. A., Pek, J., & Finkel, S. M. (2008).
Open hearts build lives: positive emotions, induced through loving-kindness
meditation, build consequential personal resources. Journal of personality
and social psychology, 95(5), 1045-1062.
Fredrickson, B., L., & Joiner, T. (2002). Positive emotions trigger upward spirals
toward emotional well-being. Psychological Science, 13, 172-175.
Fredrickson, B. L., & Joiner, T. (2018). Reflections on positive emotions and
upward spirals. Perspectives on Psychological Science, 13(2), 194-199.
Fredrickson, B. L., & Losada, M. F. (2005). Positive affect and the complex
dynamics of human flourishing. American Psychologist, 60(7), 678-686.
Fredrickson, B. L., Tugade, M. M., Waugh, C. E., & Larkin, G. R. (2003). What
good are positive emotions in crisis? A prospective study of resilience and
emotions following the terrorist attacks on the United States on September
11th, 2001. Journal of personality and social psychology, 84(2), 365-376.
Freeman, J., & Simonsen, B. (2015). Examining the impact of policy and practice
interventions on high school dropout and school completion rates: A
systematic review of the literature. Review of Educational Research, 85(2),
205-248.
Froh, J., & Bono, G. (2009). Gratitude in School: Benefits to Students and Schools.
In Handbook of positive psychology in schools (pp. 95-106). Routledge.
358
Froh, J. J., Bono, G., & Emmons, R. (2010). Being grateful is beyond good
manners: Gratitude and motivation to contribute to society among early
adolescents. Motivation and Emotion, 34(2), 144-157.
Froh, J. J., Bono, G., Fan, J., Emmons, R. A., Henderson, K., Harris, C., ... & Wood,
A. M. (2014). Nice thinking! An educational intervention that teaches
children to think gratefully. School Psychology Review, 43(2), 132-152.
Froh, J. J., Fan, J., Emmons, R. A., Bono, G., Huebner, E. S., & Watkins, P. (2011).
Measuring gratitude in youth: Assessing the psychometric properties of
adult gratitude scales in children and adolescents. Psychological
assessment, 23(2), 311-324.
Froh, J. J., Kashdan, T. B., Ozimkowski, K. M., & Miller, N. (2009). Who benefits
the most from a gratitude intervention in children and adolescents?
Examining positive affect as a moderator. The Journal of Positive
Psychology, 4(5), 408–422.
Froh, J. J., Sefick, W. J., & Emmons, R. A. (2008). Counting blessings in early
adolescents: An experimental study of gratitude and subjective well-
being. Journal of school psychology, 46(2), 213-233.
Froh, J. J., Yurkewicz, C., & Kashdan, T. B. (2009). Gratitude and subjective well-
being in early adolescence: Examining gender differences. Journal of
adolescence, 32(3), 633-650.
Frost, K. A., Franzoi, S. L., Oswald, D. L., & Shields, S. A. (2018). Revising the
Body Esteem Scale with a US college student sample: Evaluation,
validation, and uses for the BES-R. Sex Roles, 78(1-2), 1-17.
359
Galanaki, E. P. (2012). The imaginary audience and the personal fable: A test of
Elkind's theory of adolescent egocentrism. Psychology, 3(6), 457-466.
Gebauer, J. E., Riketta, M., Broemer, P., & Maio, G. R. (2008). "How must do you
like your name"? An implicit measure of global self-esteem. Journal of
Experimental Social Psychology, 44, 1346-1354.
Gee, J. P. (2000). Chapter 3: Identity as an analytic lens for research in
education. Review of research in education, 25(1), 99-125.
Genette, G. (1980). Narrative discourse (Trans. Jane E. Lewin). Oxford: Basil
Blackwell
Gersema, M. (2007). Savoring: A new model of positive experience. Journal of
Organizational Change Management.
Gibson, S., & Kendall, L. (2010). Stories from school: Dyslexia and learners’ voices
on factors impacting on achievement. Support for Learning, 25(4), 187-193.
Gillham, J., Adams-Deutsch, Z., Werner, J., Reivich, K., Coulter-Heindl, V.,
Linkins, M., ... & Contero, A. (2011). Character strengths predict subjective
well-being during adolescence. The Journal of Positive Psychology, 6(1),
31-44.
Gilman, R., Dooley, J., & Florell, D. (2006). Relative levels of hope and their
relationship with academic and psychological indicators among
adolescents. Journal of Social and Clinical Psychology, 25, 166-178.
Gladwell, M. (2013). David and Goliath: Underdogs, misfits, and the art of battling
giants. New York: Little, Brown and Company.
360
Glanville, J. L., & Wildhagen, T. (2007). The measurement of school engagement:
Assessing dimensionality and measurement invariance across race and
ethnicity. Educational and Psychological Measurement, 67(6), 1019–1041.
Glazzard, J. (2010). The impact of dyslexia on pupils’ self-esteem. Support for
Learning, 25(2), 63-69.
Glazzard, J. (2012). Dyslexia and self-esteem: stories of resilience. Wydell and
Fern-Pollak (. eds.), Dyslexia-A Comprehensive and International
Approach, 163-186.
Glazzard, J., & Dale, K. (2013). Trainee teachers with dyslexia: personal narratives
of resilience. Journal of Research in Special Educational Needs, 13(1), 26-
37.
Glăveanu, V. P., & Tanggaard, L. (2014). Creativity, identity, and representation:
Towards a socio-cultural theory of creative identity. New Ideas in
Psychology, 34, 12-21.
Godfrey, C., Bradshaw, J., & Hutton, S. (2002). Estimating the cost of being 'not in
education, employment or training' at age 16-18. Great Britain, Department
for Education and Skills.
González-Rodríguez, D., Vieira, M. J., & Vidal, J. (2019). Factors that influence
early school leaving: a comprehensive model. Educational Research, 61(2),
214-230.
Goodman, R. (1999). The extended version of the strengths and difficulties
questionnaire as a guide to child psychiatric caseness and consequent
burden. Journal of Child Psychology and Psychiatry, 40, 791–799.
361
Gordon, A. K., Musher-Eizenman, D. R., Holub, S. C., & Dalrymple, J. (2004).
What are children thankful for? An archival analysis of gratitude before and
after the attacks of September 11. Journal of Applied Developmental
Psychology, 25(5), 541-553.
Gorrese, A., & Ruggieri, R. (2013). Peer attachment and self-esteem: A meta-
analytic review. Personality and Individual Differences, 55(5), 559-568.
Grant, A. M., & Gino, F. (2010). A little thanks goes a long way: Explaining why
gratitude expressions motivate prosocial behavior. Journal of personality
and social psychology, 98(6), 946-955.
Green, H., McGinnity, A., Meltzer, H., Ford, T., & Goodman, R. (2005). Mental
health of children and adolescents in Great Britain, 2004. ONS. The
Stationery Office, London.
Greenwald, A. G., & Farnham, S. D. (2000). Using the implicit association test to
measure self-esteem and self-concept. Journal of Personality and Social
Psychology, 79, 1022-1038.
Guilford, J.P. & Fruchter, B. (1978). Fundamental statistics in psychology and
education. New York.: McGraw-Hill.
Gurney, P. W. (2018). Self-esteem in children with special educational needs.
Routledge.
Güsewell, A., & Ruch, W. (2012). Are only emotional strengths emotional?
Character strengths and disposition to positive emotions. Applied
Psychology: Health and Well‐Being, 4(2), 218-239.
362
Habermas, T., & de Silveira, C. (2008). The development of global coherence in life
narratives across adolescence: temporal, causal, and thematic aspects.
Developmental Psychology, 44(3), 707-721.
Hacking, I. (1992). ‘‘Style’’ for historians and philosophers. Studies in the History
and Philosophy of Science, 23(1), 1–20.
Hallgren, K. A. (2012). Computing inter-rater reliability for observational data: an
overview and tutorial. Tutorials in quantitative methods for
psychology, 8(1), 23-34.
Harrington, M., & Velicer, W. F. (2015). Comparing visual and statistical analysis
in single-case studies using published studies. Multivariate Behavioral
Research, 50(2), 162-183.
Harris, M. A., Gruenenfelder‐Steiger, A. E., Ferrer, E., Donnellan, M. B.,
Allemand, M., Fend, H., ... & Trzesniewski, K. H. (2015). Do parents foster
self‐esteem? Testing the prospective impact of parent closeness on
adolescent self‐esteem. Child Development, 86(4), 995-1013.
Harris, M. A., Wetzel, E., Robins, R. W., Donnellan, M. B., & Trzesniewski, K. H.
(2018). The development of global and domain self-esteem from ages 10 to
16 for Mexican-origin youth. International journal of behavioral
development, 42(1), 4-16.
Harris‐Britt, A., Valrie, C. R., Kurtz‐Costes, B., & Rowley, S. J. (2007). Perceived
racial discrimination and self‐esteem in African American youth: Racial
socialization as a protective factor. Journal of Research on
Adolescence, 17(4), 669-682.
363
Harrist, S., Carlozzi, B. L., McGovern, A. R., & Harrist, A. W. (2007). Benefits of
expressive writing and expressive talking about life goals. Journal of
Research in Personality, 41(4), 923–930.
Harter, S. (1985). Manual for the self-perception profile for children:(revision of the
perceived competence scale for children). University of Denver.
Harter, S. (1993). Causes and consequences of low self-esteem in children and
adolescents. In Self-esteem (pp. 87-116). Springer, Boston, MA.
Harter, S. (1998). The development of self-representations. In W. Damon (Series
Ed.) & Nancy Eisenberg (Vol. Ed.), Handbook of child psychology, Vol. 3,
Social, emotional, and personality development (5th edition), New York:
Wiley.
Harter, S. (2006a). The Development of Self Esteem. In M. H. Kernis (Ed.), Self-
esteem issues and answers: A sourcebook of current perspectives (pp. 144–
150). New York: Psychology Press
Harter, S. (2012). Self-perception profile for adolescents: Manual and
questionnaires. Denver, CO: University of Denver, Department of
Psychology.
Harter, S. (2015). The construction of the self: Developmental and sociocultural
foundations. Guilford Publications.
Harter, S., & Monsour, A. (1992). Development analysis of conflict caused by
opposing attributes in the adolescent self-portrait. Developmental
Psychology, 28(2), 251-260.
364
Harter, S., Waters, P. L., & Whitesell, N. R. (1997). Lack of voice as a
manifestation of false self-behavior among adolescents: The school setting
as a stage upon which the drama of authenticity is enacted. Educational
Psychologist, 32(3), 153-173.
Hawke, J. L., Wadsworth, S. J., Olson, R. K., & DeFries, J. C. (2007). Etiology of
reading difficulties as a function of gender and severity. Reading and
Writing, 20(1-2), 13-25.
Hay, I. (2000). Gender self-concept profiles of adolescents suspended from high
school. Journal of Child Psychology and Psychiatry, 41(3), 345-352.
Haywood, C., Mac an Ghaill, M., & Allan, J. A. (2015). Introduction: Schools,
Masculinity and Boyness in the War Against Boys. Boyhood Studies: An
Interdisciplinary Journal, 8(1), 15-22.
Heaven, P., & Ciarrochi, J. (2008). Parental styles, gender and the development of
hope and self‐esteem. European Journal of Personality: Published for the
European Association of Personality Psychology, 22(8), 707-724.
Hepper, E. G., Gramzow, R. H., & Sedikides, C. (2010). Individual differences in
self‐enhancement and self‐protection strategies: An integrative
analysis. Journal of personality, 78(2), 781-814
Helliwell, J. F., Aknin, L. B., Shiplett, H., Huang, H., & Wang, S. (2017). Social
capital and prosocial behaviour as sources of well-being (No. w23761).
National Bureau of Economic Research.
Henderson, J. L., Hawke, L. D., Chaim, G., & Network, N. Y. S. P. (2017). Not in
employment, education or training: Mental health, substance use, and
365
disengagement in a multi-sectoral sample of service-seeking Canadian
youth. Children and Youth Services Review, 75, 138-145.
Hendriks, T., Schotanus-Dijkstra, M., Hassankhan, A., de Jong, J., & Bohlmeijer, E.
(2019). The efficacy of multi-component positive psychology interventions:
A systematic review and meta-analysis of randomized controlled
trials. Journal of happiness studies, 1-34.
Hill, E. D., Terrell, H. K., Arellano, A., Schuetz, B., & Nagoshi, C. T. (2014). A
good story: Using future life narratives to predict present well-being.
Journal of Happiness Studies, 16(1), 1615–1634.
Holland, G., & Tiggemann, M. (2016). A systematic review of the impact of the use
of social networking sites on body image and disordered eating
outcomes. Body image, 17, 100-110.
Holte, B. H. (2018). Counting and meeting NEET young people: Methodology,
perspective and meaning in research on marginalized youth. Young, 26(1),
1-16.
Hoshmand, L. T. (2003). Can lessons of history and logical analysis ensure progress
in psychological science? Theory & Psychology, 13(1), 39-44.
Howe, K. R. (1988). Against the quantitative-qualitative incompatibility thesis or
dogmas die hard. Educational researcher, 17(8), 10-16.
Howe, K. R. (1992). Getting over the quantitative-qualitative debate. American
Journal of Education, 100(2), 236-256.
366
Huang, C. (2010). Mean-level change in self-esteem from childhood through
adulthood: Meta-analysis of longitudinal studies. Review of General
Psychology, 14(3), 251-260.
Huebner, E. S., Hills, K. J., Jiang, X., Long, R. F., Kelly, R., & Lyons, M. D.
(2014). Schooling and children’s subjective well-being. Handbook of child
well-being: Theories, methods and policies in global perspective, 797-819.
Huffman, J. C., DuBois, C. M., Healy, B. C., Boehm, J. K., Kashdan, T. B., Celano,
C. M., et al. (2014). Feasibility and utility of positive psychology exercises
for suicidal inpatients. General Hospital Psychiatry, 36(1), 88-94.
Huitt, W. (2011). A holistic view of education and schooling: Guiding students to
develop capacities, acquire virtues, and provide service. In Revision of paper
presented at the 12th Annual Conference sponsored by the Athens Institute
for Education and Research (ATINER), Athens, Greece.
Humphrey, N. (2002). Teacher and pupil ratings of self-esteem in developmental
dyslexia. British Journal of Special Education, 29(1), 29-36.
Humphrey, N. (2003). Facilitating a positive sense of self in pupils with dyslexia:
The role of teachers and peers. Support for Learning, 18(3), 130-136.
Humphrey, N. & Mullins, P.M. (2002). Self-concept and self-esteem in
developmental dyslexia. Journal of Research in Special Educational Needs,
2(2), 1-13.
Huta, V., & Hawley, L. (2010). Psychological strengths and cognitive
vulnerabilities: Are they two ends of the same continuum or do they have
367
independent relationships with well-being and ill-being? Journal of
Happiness Studies, 11, 71–93.
In-Albon, T., Meyer, A. H., Metzke, C. W., & Steinhausen, H. C. (2017). A Cross-
Lag Panel Analysis of Low Self-Esteem as a Predictor of Adolescent
Internalizing Symptoms in a Prospective Longitudinal Study. Child
Psychiatry & Human Development, 48(3), 411-422.
Ingesson, S. G. (2007). Growing Up with Dyslexia Interviews with Teenagers and
Young Adults. School Psychology International, 28(5), 574-591.
Jacobs, N. W., Berduszek, R. J., Dijkstra, P. U., & van der Sluis, C. K. (2017).
Validity and reliability of the upper extremity work demands scale. Journal
of occupational rehabilitation, 27(4), 520-529.
Jacobson, N. S., & Truax, P. (1991). Clinical significance: a statistical approach to
defining meaningful change in psychotherapy research. Journal of
consulting and clinical psychology, 59(1), 12-19.
James, W. (1892). Psychology: The briefer course. New York: Henry Holt
Janosz, M., Archambault, I., Morizot, J., & Pagani, L. S. (2008). School
engagement trajectories and their differential predictive relations to dropout.
Journal of Social Issues, 64(1), 21–40.
Jennings, P. A., & Greenberg, M. T. (2009). The prosocial classroom: Teacher
social and emotional competence in relation to student and classroom
outcomes. Review of educational research, 79(1), 491-525.
368
Jenson, W. R., Clark, E., Kircher, J. C., & Kristjansson, S. D. (2007). Statistical
reform: Evidence‐based practice, meta‐analyses, and single subject
designs. Psychology in the Schools, 44(5), 483-493.
Johnson, M. K., Crosnoe, R., & Elder, G. H. (2001). Students’ attachment and
academic engagement: The role of race and ethnicity. Sociology of
Education, 74(4), 318–340.
Johnson, R. B., & Onwuegbuzie, A. J. (2004). Mixed methods research: A research
paradigm whose time has come. Educational researcher, 33(7), 14-26.
Jones, D. C. (2001). Social comparison and body image: Attractiveness
comparisons to models and peers among adolescent girls and boys. Sex
roles, 45(9-10), 645-664.
Jones-Smith, E. (2011). Spotlighting the Strengths of Every Single Student: Why US
Schools Need a New, Strengths-Based Approach. ABC-CLIO.
Jordan, C. H., Spencer, S. J., & Zanna, M. P. (2005). Types of high self-esteem and
prejudice: How implicit self-esteem relates to ethnic discrimination among
high explicit self-esteem individuals. Personality and Social Psychology
Bulletin, 31, 693-702.
Jordan, C. H., Whitfield, M., & Zeigler-Hill, V. (2007). Intuition and the
correspondence between implicit and explicit self-esteem. Journal of
Personality and Social Psychology, 93, 1067-1079.
Kabat-Zinn, J. (1990). Full catastrophe living. New York: Delta Publishing.
369
Kaplan, A., & Flum, H. (2009). Motivation and identity: The relations of action and
development in educational contexts - An introduction to the special
issue. Educational Psychologist, 44(2), 73-77.
Kazdin, A. E. (1981). Drawing valid inferences from case studies. Journal of
Consulting and Clinical Psychology, 49(2), 183.
Kazdin, A. E. (2011). Single-case research designs: Methods for clinical and
applied settings. Oxford University Press.
Keane, L., & Loades, M. (2017). Low self‐esteem and internalizing disorders in
young people–a systematic review. Child and Adolescent Mental
Health, 22(1), 4-15.
Kearney, R. (2002). On stories. London: Routledge.
Keem, S., Shalley, C. E., Kim, E., & Jeong, I. (2018). Are creative individuals bad
apples? A dual pathway model of unethical behavior. Journal of Applied
Psychology, 103(4), 416-431.
Kemer, G., & Atik, G. (2012). Hope and social support in high school students from
urban and rural areas of Ankara, Turkey. Journal of Happiness
Studies, 13(5), 901-911.
Keyes, C. L. M. (1998). Social well-being. Social psychology quarterly, 121-140.
Keyes, C. L. (2002). The mental health continuum: From languishing to flourishing
in life. Journal of health and social behaviour, 207-222.
Keyes, C. L. (2009). Th e Nature and Importance of Positive Mental Health in
America’s Adolescents. In Handbook of positive psychology in schools (pp.
27-42). Routledge.
370
King, L. A. (2001). The health benefits of writing about life goals. Personality and
Social Psychology Bulletin, 27(7), 798–807.
King, R. B., McInerney, D. M., Ganotice, F. A., & Villarosa, J. B. (2015). Positive
affect catalyzes academic engagement: Cross-sectional, longitudinal, and
experimental evidence. Learning and Individual Differences, 39, 64-72.
Kirk, S. A. (1963). Behavioural diagnoses and remediation of learning disabilities.
In Proceedings of the annual meeting: Conference on exploration into the
problems of the perceptually handicapped child Evanston, IL, 1963 (pp. 1-
7).
Kirk, J., & Reid, G. (2001). An examination of the relationship between dyslexia
and offending in young people and the implications for the training
system. Dyslexia, 7(2), 77-84.
Kiviruusu, O., Huurre, T., Aro, H., Marttunen, M., & Haukkala, A. (2015). Self-
esteem growth trajectory from adolescence to mid-adulthood and its
predictors in adolescence. Advances in life course research, 23, 29-43.
Kiviruusu, O., Konttinen, H., Huurre, T., Aro, H., Marttunen, M., & Haukkala, A.
(2016). Self-esteem and body mass index from adolescence to mid-
adulthood. A 26-year follow-up. International journal of behavioral
medicine, 23(3), 355-363.
Knox, M., Funk, J., Elliot, R., & Bush, E. G. (1998). Adolescents' possible selves
and their relationship to global self-esteem. Sex Roles, 39(1-2), 61-80.
Knox, M. (2006). Gender and possible selves. Possible selves: Theory, research and
applications, 61-77.
371
Kokkinos, C. M., & Voulgaridou, I. (2018). Motivational beliefs as mediators in the
association between perceived scholastic competence, self-esteem and
learning strategies among Greek secondary school students. Educational
Psychology, 1-19.
Kong, F., Ding, K., & Zhao, J. (2015). The relationships among gratitude, self-
esteem, social support and life satisfaction among undergraduate
students. Journal of Happiness Studies, 16(2), 477-489.
Kormos, J., Csizér, K., & Sarkadi, A. (2009). The language learning experiences of
students with dyslexia: Lessons from an interview study. International
Journal of Innovation in Language Learning and Teaching, 3(2), 115-130.
Kounenou, K. (2010). Exploration of the relationship among drug use & alcohol
drinking, entertainment activities and self-esteem in Greek University
students. Procedia-social and behavioral sciences, 2(2), 1906-1910.
Kroger, J. (2000). Ego identity status research in the new millennium. International
Journal of Behavioral Development, 24(2), 145-148.
Kroger, J., Martinussen, M., & Marcia, J. E. (2010). Identity status change during
adolescence and young adulthood: A meta-analysis. Journal of
adolescence, 33(5), 683-698.
Kuzucu, Y., & Özdemir, Y. (2013). Predicting adolescent mental health in terms of
mother and father involvement. Egitim ve Bilim, 38(168), 96-112.
LaBarbera, R. (2008). Perceived Social Support and Self-Esteem in Adolescents
with Learning Disabilities at a Private School. Learning Disabilities: A
Contemporary Journal, 6(1), 33-44.
372
Laghi, F., Pallini, S., D’Alessio, M., & Baiocco, R. (2011). Development and
validation of the efficacious self-presentation scale. The Journal of genetic
psychology, 172(2), 209-219.
Laible, D. J., Carlo, G., & Roesch, S. C. (2004). Pathways to self-esteem in late
adolescence: The role of parent and peer attachment, empathy, and social
behaviours. Journal of adolescence, 27(6), 703-716.
Lambert, N. M., & Fincham, F. D. (2011). Expressing gratitude to a partner leads to
more relationship maintenance behavior. Emotion, 11(1), 52-60.
Lambert, N. M., Fincham, F. D., & Stillman, T. F. (2012). Gratitude and depressive
symptoms: The role of positive reframing and positive emotion. Cognition
& Emotion, 26(4), 615-633.
Lannegrand-Willems, L., & Bosma, H. A. (2006). Identity development-in-context:
The school as an important context for identity development. Identity, 6(1),
85-113.
Langlais, M. R., Seidman, G., & Bruxvoort, K. M. (2018). Adolescent Romantic
Relationship–Oriented Facebook Behaviors: Implications for Self-
Esteem. Youth & Society. Advance online publication.
https://doi.org/10.1177/0044118X1876064.
Lapsley, D. K., Milstead, M., Quintana, S. M., Flannery, D., & Buss, R. R. (1986).
Adolescent egocentrism and formal operations: Tests of a theoretical
assumption. Developmental Psychology, 22(6), 800-807.
Lapsley, D. K., & Narvaez, D. (2006). Character education. In A. Renninger & I.
Siegel (Eds.) and W. Damon & R. Lerner (Editors-in-Chief.), Handbook of
373
child psychology: Vol. 4. Child psychology in practice (6th ed., pp. 248-
296). New York, NY: Wiley.
Layous, K., Lee, H., Choi, I., & Lyubomirsky, S. (2013). Culture matters when
designing a successful happiness-increasing activity: A comparison of the
United States and South Korea. Journal of Cross-Cultural
Psychology, 44(8), 1294-1303.
Layous, K., Nelson, S. K., & Lyubomirsky, S. (2013). What is the optimal way to
deliver a positive activity intervention? The case of writing about one’s best
possible selves. Journal of Happiness Studies, 14(2), 635-654.
Leaper, C. (2002). Parenting girls and boys. In M. H. Bornstein (Ed.), Handbook of
parenting: Vol. 1. Children and parenting (pp. 189–225). Mahwah, NJ:
Erlbaum.
Leary, M. R. (2004). The sociometer, self-esteem, and the regulation of
interpersonal behavior/Handbook of self-regulation: Research, theory, and
applications. 373-391.
Leary, M. R., & Baumeister, R. F. (2000). The nature and function of self-esteem:
Sociometer theory. In Advances in experimental social psychology (Vol. 32,
pp. 1-62). Academic Press.
Lee, V. E., & Burkam, D. T. (2003). Dropping out of high school: The role of
school organization and structure. American educational research
journal, 40(2), 353-393.
Lee, A., & Hankin, B. L. (2009). Insecure attachment, dysfunctional attitudes, and
low self-esteem predicting prospective symptoms of depression and anxiety
374
during adolescence. Journal of clinical child & Adolescent
Psychology, 38(2), 219-231.
Leitão, S., Dzidic, P., Claessen, M., Gordon, J., Howard, K., Nayton, M., & Boyes,
M. E. (2017). Exploring the impact of living with dyslexia: The perspectives
of children and their parents. International journal of speech-language
pathology, 19(3), 322-334.
Lewis, A. D., Huebner, E. S., Reschly, A. L., & Valois, R. F. (2009). The
incremental validity of positive emotions in predicting school
functioning. Journal of Psychoeducational Assessment, 27(5), 397-408.
Li, Y., & Lerner, R. M. (2013). Interrelations of behavioral, emotional, and
cognitive school engagement in high school students. Journal of Youth and
Adolescence, 42(1), 20-32.
Lian-Huang, C. (1990). The relationship of career goal and self-esteem among
adolescents. Adolescence, 25(99), 593-597.
Libbey, H. P. (2004). Measuring student relationships to school: Attachment,
bonding, connectedness, and engagement. Journal of School Health, 74(7),
274–283.
Lillevoll, K. R., Kroger, J., & Martinussen, M. (2013). Identity status and anxiety:
A meta-analysis. Identity, 13(3), 214-227.
Lin, C. C. (2015a). Self-esteem mediates the relationship between dispositional
gratitude and well-being. Personality and Individual Differences, 85, 145-
148.
375
Lin, C. C. (2015b). Gratitude and depression in young adults: The mediating role of
self-esteem and well-being. Personality and Individual Differences, 87, 30-
34.
Lincoln, Y. S., & Guba, E. G. (1985). Establishing trustworthiness. Naturalistic
inquiry, 289(331), 289-327.
Linden, D. (2007). The accidental mind. Harvard University Press.
Linkins, M., Niemiec, R. M., Gillham, J., & Mayerson, D. (2015). Through the lens
of strength: A framework for educating the heart. The Journal of Positive
Psychology, 10(1), 64-68.
Linley, P. A. (2008). Average to A. Realising strengths in yourself and others.
Coventry, UK: CAPP Press. Linley, PA, Nielsen, KM, Wood, AM, Gillett, R.,
& Biswas-Diener.
Linley, P. A., Nielsen, K. M., Gillett, R., & Biswas-Diener, R. (2010). Using
signature strengths in pursuit of goals: Effects on goal progress, need
satisfaction, and well-being, and implications for coaching
psychologists. International Coaching Psychology Review, 5(1), 6-15.
Lithari, E. (2018). Fractured academic identities: dyslexia, secondary education,
self-esteem and school experiences. International Journal of Inclusive
Education, 1-17.
Litwack, S. D., Aikins, J. W., & Cillessen, A. H. (2012). The distinct roles of
sociometric and perceived popularity in friendship: Implications for
adolescent depressive affect and self-esteem. The Journal of Early
Adolescence, 32(2), 226-251.
376
Long, L., MacBlain, S., & Macblain, M. (2007). Supporting students with dyslexia
at the secondary level: An emotional model of literacy. Journal of
adolescent and adult literacy, 51(2), 124-134.
Loose, F., Régner, I., Morin, A. J., & Dumas, F. (2012). Are academic discounting
and devaluing double-edged swords? Their relations to global self-esteem,
achievement goals, and performance among stigmatized students. Journal of
educational psychology, 104(3), 713-725.
Loveday, P. M., Lovell, G. P., & Jones, C. M. (2018). The best possible selves
intervention: A review of the literature to evaluate efficacy and guide future
research. Journal of Happiness Studies, 19(2), 607-628.
Lowell, S. C., Felton, R. H., & Hook, P. E. (2014). Basic facts about assessment of
dyslexia: Testing for teaching. International Dyslexia Association,
Incorporated.
Lunnen, K. M., & Ogles, B. M. (1998). A multiperspective, multivariable
evaluation of reliable change. Journal of Consulting and Clinical
Psychology, 66(2), 400-410.
Luyckx, K., Schwartz, S. J., Berzonsky, M. D., Soenens, B., Vansteenkiste, M.,
Smits, I., & Goossens, L. (2008). Capturing ruminative exploration:
Extending the four-dimensional model of identity formation in late
adolescence. Journal of Research in Personality, 42(1), 58-82.
Lyon, G.R., Shaywitz, S.E., & Shaywitz, B.A. (2003). Defining dyslexia,
comorbidity, teachers’ knowledge of Language and Reading: A definition
of dyslexia. Annals of Dyslexia, 53, 1-14.
377
Lyubomirsky, S., King, L., & Diener, E. (2005). The benefits of frequent positive
affect: Does happiness lead to success? Psychological bulletin, 131(6), 803.
Lyubomirsky, S., Sheldon, K. M., & Schkade, D. (2005). Pursuing happiness: The
architecture of sustainable change. Review of general psychology, 9(2), 111-
131.
MacArthur, J., Rawana, E. P., & Brownlee, K. (2011). Implementation of a
strengths-based approach in the practice of child and youth care. Relational
Child and Youth Care Practice, 24(3), 6-16.
Mac Iver, M. A., & Mac Iver, D. J. (2010). How do we ensure that everyone
graduates? An integrated prevention and tiered intervention model for
schools and districts. New Directions for Youth Development, 2010(127),
25-35.
Macey, E., Decker, J., & Eckes, S. (2009). The knowledge is power program
(KIPP): An analysis of one model's efforts to promote achievement in
underserved communities. Journal of School Choice, 3(3), 212-241.
Madden, W., Green, S., & Grant, A. M. (2011). A pilot study evaluating strengths-
based coaching for primary school students: Enhancing engagement and
hope. International Coaching Psychology Review, 6 (1), 71-83.
Maguire, S. (2015). NEET, unemployed, inactive or unknown–why does it
matter? Educational research, 57(2), 121-132.
Major, B., & Schmader, T. (1998). Coping with stigma through psychological
disengagement. In Prejudice (pp. 219-241). Academic Press.
378
Mammarella, I. C., Ghisi, M., Bomba, M., Bottesi, G., Caviola, S., Broggi, F., &
Nacinovich, R. (2016). Anxiety and depression in children with nonverbal
learning disabilities, reading disabilities, or typical development. Journal of
learning disabilities, 49(2), 130-139.
Manlove, J. (1998). The influence of high school dropout and school disengagement
on the risk of school-age pregnancy. Journal of Research on Adolescence,
8(2), 187–220.
Mann, M. M., Hosman, C. M., Schaalma, H. P., & De Vries, N. K. (2004). Self-
esteem in a broad-spectrum approach for mental health promotion. Health
education research, 19(4), 357-372.
Manthey, T. J., Knowles, B., Asher, D., & Wahab, S. (2011). Strengths-based
practice and motivational interviewing. Advances in Social Work, 12(2),
126-151.
Marcia, J. (1966). Development and validation of ego-identity status. Journal of
Personality and Social Psychology, 3, 551-558.
Margolis, H., & McCabe, P. P. (2004). Self-efficacy: A key to improving the
motivation of struggling learners. The Clearing House: A Journal of
Educational Strategies, Issues and Ideas, 77(6), 241-249.
Marques, S. C., Lopez, S. J., & Pais-Ribeiro, J. L. (2011). “Building hope for the
future”: A program to foster strengths in middle-school students. Journal of
Happiness Studies, 12(1), 139-152.
379
Marsh, H. W., Parada, R. H., Yeung, A. S., & Healey, J. (2001). Aggressive school
troublemakers and victims: A longitudinal model examining the pivotal role
of selfconcept. Journal of Educational Psychology, 93(2), 411-419.
Marsh, H. W., Trautwein, U., Lüdtke, O., Köller, O., & Baumert, J. (2005).
Academic self‐concept, interest, grades, and standardized test scores:
Reciprocal effects models of causal ordering. Child development, 76(2),
397-416.
Marsh, H. W., Trautwein, U., Lüdtke, O., Köller, O., & Baumert, J. (2006).
Integration of multidimensional self-concept and core personality constructs:
Construct validation and relations to well-being and achievement. Journal of
Personality, 74(2), 403-456.
Marshall, S. L., Parker, P. D., Ciarrochi, J., & Heaven, P. C. (2014). Is self‐esteem a
cause or consequence of social support? A 4‐year longitudinal study. Child
Development, 85(3), 1275-1291.
Martin, A. J., & Marsh, H. W. (2008). Academic buoyancy: Towards an
understanding of students' everyday academic resilience. Journal of School
Psychology, 46(1), 53-83.
Maslow, A. (1954). Motivation and personality. New York: Harper & Row.
Masselink, M., Van Roekel, E., Hankin, B. L., Keijsers, L., Lodder, G. M. A.,
Vanhalst, J., ... & Oldehinkel, A. J. (2018). The Longitudinal Association
Between Self‐esteem and Depressive Symptoms in Adolescents: Separating
Between‐Person Effects from Within‐Person Effects. European journal of
personality, 32(6), 653-671.
380
Mawn, L., Oliver, E. J., Akhter, N., Bambra, C. L., Torgerson, C., Bridle, C., &
Stain, H. J. (2017). Are we failing young people not in employment,
education or training (NEETs)? A systematic review and meta-analysis of
re-engagement interventions. Systematic reviews, 6(1), 16. 9. doi:10.
1186/s13643-016-0394-2.
McAdams, D. P. (1985). Power, intimacy, and the life story. Homewood, IL:
Dorsey.
McAdams, D. P. (1990). Unity and purpose in human lives: The emergence of
identity as a life-story. In A. I. Robin, R. A. Zucker, R. A. Emmons, & S.
Frank (Eds.), Studying persons and lives (pp. 148 – 200). New York7
Springer
McAdams, D. P. (1993). The stories we live by: Personal myths and the making of
the self. Guilford Press.
McAdams, D. P. (1995). The life study interview questionnaire. The Foley institute
for the study of lives. Located at: http://www. sesp. northwestern.
edu/foley/instruments/interview. html.
McAdams, D. P. (2001). The psychology of life stories. Review of General
Psychology, 5, 100–122.
McAdams, D. P. (2008). The Life Story Interview. Evanston, IL: Northwestern
University.
McCarty, C. A., Stoep, A. V., & McCauley, E. (2007). Cognitive features
associated with depressive symptoms in adolescence: Directionality and
381
specificity. Journal of Clinical Child and Adolescent Psychology, 36(2),
147-158.
McCambridge, J., De Bruin, M., & Witton, J. (2012). The effects of demand
characteristics on research participant behaviours in non-laboratory settings:
a systematic review. PloS one, 7(6), e39116.
McCullough, M. E., Kilpatrick, S. D., Emmons, R. A., & Larson, D. B. (2001). Is
gratitude a moral affect? Psychological bulletin, 127(2), 249-266.
McCullough, M. E., Tsang, J. A., & Emmons, R. A. (2004). Gratitude in
intermediate affective terrain: links of grateful moods to individual
differences and daily emotional experience. Journal of personality and
social psychology, 86(2), 295-309.
McClure, A. C., Tanski, S. E., Kingsbury, J., Gerrard, M., & Sargent, J. D. (2010).
Characteristics associated with low self-esteem among US
adolescents. Academic pediatrics, 10(4), 238-244.
McGinnity, Á., Meltzer, H., Ford, T., & Goodman, R. (2005). Mental health of
children and young people in Great Britain, 2004. H. Green (Ed.).
Basingstoke: Palgrave Macmillan.
McGorry, P. (2013). Prevention, innovation and implementation science in mental
health: the next wave of reform. The British Journal of Psychiatry, 202(s54),
s3-s4.
McGrath, R. E., & Walker, D. I. (2016). Factor structure of character strengths in
youth: Consistency across ages and measures. Journal of Moral
Education, 45(4), 400-418.
382
McLean, K. C., Syed, M., Yoder, A., & Greenhoot, A. F. (2016). The role of
domain content in understanding identity development processes. Journal of
Research on Adolescence, 26(1), 60-75.
McLean, S. A., Paxton, S. J., Wertheim, E. H., & Masters, J. (2015). Photoshopping
the selfie: Self photo editing and photo investment are associated with body
dissatisfaction in adolescent girls. International Journal of Eating
Disorders, 48(8), 1132-1140.
McLeod, J. D., & Owens, T. J. (2004). Psychological well-being in the early life
course: Variations by socioeconomic status, gender, and
race/ethnicity. Social Psychology Quarterly, 67(3), 257-278.
Mead, G. H. (1934). Mind, self, and society: From the standpoint of a social
behaviorist (Works of George Herbert Mead, Vol. 1).
Meevissen, Y. M., Peters, M. L., & Alberts, H. J. (2011). Become more optimistic
by imagining a best possible self: Effects of a two week
intervention. Journal of behavior therapy and experimental
psychiatry, 42(3), 371-378.
Meeus, W. (2011). The study of adolescent identity formation 2000–2010: A review
of longitudinal research. Journal of research on adolescence, 21(1), 75-94.
Mendelson, M. J., Mendelson, B. K & Andrews, J. (2000). Self-esteem, body-
esteem, and body-mass in late adolescence: Is a competence X importance
model needed? Journal of Applied Developmental Psychology, 21, 249-266.
Mendolia, S., & Walker, I. (2014). Do NEETs need grit? IZA discussion paper No.
8740.
383
Mental Health Taskforce (2016). The five year forward view for mental health. A
report from the independent Mental Health Taskforce to the NHS in
England. Leeds: NHS England. Available at:
www.england.nhs.uk/mentalhealth/taskforce
Michael, S. T., & Snyder, C. R. (2005). Getting unstuck: The roles of hope, finding
meaning, and rumination in the adjustment to bereavement among college
students. Death studies, 29(5), 435-458.
Milevsky, A., Schlechter, M., Netter, S., & Keehn, D. (2007). Maternal and paternal
parenting styles in adolescents: Associations with self-esteem, depression
and life-satisfaction. Journal of child and family studies, 16(1), 39-47.
Miller, S. I., & Fredericks, M. (1991). Postpositivistic assumptions and educational
research: Another view. Educational Researcher, 20(4), 2-8.
Mishna, F. (2003). Learning disabilities and bullying double jeopardy. Journal of
learning disabilities, 36(4), 336-347.
Moors, A. (2009). Theories of emotion causation: A review. Cognition and
emotion, 23(4), 625-662.
Morawiak, A., Mrozinski, B., Gutral, J., Cypryańska, M., & Nezlek, J. B. (2018).
Self-Esteem Mediates Relationships between Self-Concept Clarity and
Perceptions of the Future. Journal of Education Culture and Society, 9(1),
99-108.
Morey, R. A., Dolcos, F., Petty, C. M., Cooper, D. A., Hayes, J. P., LaBar, K. S., &
McCarthy, G. (2009). The role of trauma-related distractors on neural

384
systems for working memory and emotion processing in posttraumatic stress
disorder. Journal of psychiatric research, 43(8), 809-817.
Morgan, A. (2000). What is narrative therapy? (p. 116). Adelaide: Dulwich Centre
Publications.
Morgan, W.P. (1896). A case of congenital word blindness. Speech, 23,357-377.
Morgan, E., & Klein, C. (2000). The dyslexic adult. London: Whurr Publishers.
Morin, A. J., Maïano, C., Marsh, H. W., Nagengast, B., & Janosz, M. (2013).
School life and adolescents' self‐esteem trajectories. Child
development, 84(6), 1967-1988.
Morley, S. (2015). Statistical analysis for single case data (draft chapter). Retrieved
from
https://www.researchgate.net/publication/283497496_Statistical_analysi
s_for_single_case_data_Draft_chapter
Morley, S., Dowzer, C.N. (2014) Manual for the Leeds Reliable Change Indicator:
Simple Excel(tm) applications for the analysis of individual patient and
group data. University of Leeds, Leeds, UK.
Morrow, S.L. (2005). Quality and trustworthiness in qualitative research in
counselling psychology. Journal of Counselling Psychology, 52(2), 250-
260.
Mullis, R. L., & Chapman, P. (2000). Age, gender, and self-esteem differences in
adolescent coping styles. The Journal of Social Psychology, 140(4), 539-
541.
385
Mugnanini, D., Lassi, S., La, Malfa G., & Albertini, G. (2009). Internalizing
correlates of dyslexia. Journal of World Paediatrics, 5 (4), 255- 264.
Nalavany, B.A., Carawan, L.W., & Brown L.S. (2011). Considering the role of
traditional and specialist schools: do school experiences impact the
emotional well-being and self- esteem of adults with dyslexia? British
Journal of Special Education, 38(4), 191-200.
Nash, P. (2008) Supporting vulnerable learners in their transition to secondary
school. Dyslexia Review, 20 (1), 26-30.
Nelson, J. M., & Harwood, H. (2011). Learning disabilities and anxiety: A meta-
analysis. Journal of Learning Disabilities, 44(1), 3-17.
Nelson, S. K., & Lyubomirsky, S. (2014). Finding happiness. Handbook of positive
emotions, 275-293.
Newman, I., Benz, C. R., & Ridenour, C. S. (1998). Qualitative-quantitative
research methodology: Exploring the interactive continuum. SIU Press.
Ni, X., Shao, X., Qu, R., Zheng, D., & Jia, R. (2019, January). The Association with
Online Social Media Use: “Self” and Subjective Well-being of Teenagers.
In 2nd International Conference on Social Science, Public Health and
Education (SSPHE 2018). Atlantis Press.
Nicolson, R.I. and Fawcett, A.J. (1990). Automaticity: a new framework for
dyslexia research? Cognition, 30, 159-182.
Nicolson, R., Fawcett, A., & Reid, G. (2015). Positive dyslexia. Sheffield, UK:
Rodin Books.
386
Niederhoffer, K. G., & Pennebaker, J. W. (2002). Linguistic style matching in social
interaction. Journal of Language and Social Psychology, 21(4), 337-360.
Niemiec, R. M. (2013). VIA character strengths: Research and practice (The first 10
years). In Well-being and cultures (pp. 11-29). Springer, Dordrecht.
Niemiec, R., Rashid, T., & Spinella, M. (2012). Strong mindfulness: Integrating
mindfulness and character strengths. Journal of Mental Health
Counseling, 34(3), 240-253.
Normand, M. P. (2016). Less is more: Psychologists can learn more by studying
fewer people. Frontiers in psychology, 7, 934. Retrieved from
https://doi.org/10.3389/fpsyg.2016.00934
Nucci, L., & Narvaez, D. (Eds.) (2008). Handbook of moral and character
education. New York, NY: Routledge.
Nulty, D. D. (2008). The adequacy of response rates to online and paper surveys:
what can be done? Assessment & evaluation in higher education, 33(3), 301-
314.
Nunnally, J. C. (1978). Psychometric Theory: 2d Ed. McGraw-Hill.
Nunnally, J. C. (1994). Psychometric theory 3E. Tata McGraw-Hill Education.
O'Mara, A. J., Marsh, H. W., Craven, R. G., & Debus, R. L. (2006). Do self-concept
interventions make a difference? A synergistic blend of construct validation
and meta-analysis. Educational Psychologist, 41(3), 181-206.
O'Moore, M., & Kirkham, C. (2001). Self-esteem and its relationship to bullying
behaviour. Aggressive Behavior, 27(4), 269–283.
387
O'Neill, B., Best, C., Gillespie, A., & O'Neill, L. (2013). Automated prompting
technologies in rehabilitation and at home. Social Care and
Neurodisability, 4(1), 17-28.
Odou, N., & Vella-Brodrick, D. A. (2013). The efficacy of positive psychology
interventions to increase well-being and the role of mental imagery ability.
Social Indicators Research, 110(1), 111–129
Onwuegbuzie, A. J., & Leech, N. L. (2005). On becoming a pragmatic researcher:
The importance of combining quantitative and qualitative research
methodologies. International journal of social research methodology, 8(5),
375-387.
Orth, U. (2018). The family environment in early childhood has a long-term effect
on self-esteem: A longitudinal study from birth to age 27 years. Journal of
personality and social psychology, 114(4), 637-655.
Orth, U., Erol, R. Y., & Luciano, E. C. (2018). Development of self-esteem from
age 4 to 94 years: A meta-analysis of longitudinal studies. Psychological
bulletin, 144(10), 1045-1080.
Orth, U., & Robins, R. W. (2014). The development of self-esteem. Current
Directions in Psychological Science, 23(5), 381-387.
Orth, U., & Robins, R. W. (2019). Development of self-esteem across the
lifespan. Handbook of personality development, 328-344.
Orth, U., Robins, R. W., & Roberts, B. W. (2008). Low self-esteem prospectively
predicts depression in adolescence and young adulthood. Journal of
Personality and Social Psychology, 95, 695-708.
388
Orth, U., Robins, R. W., & Widaman, K. F. (2012). Life-span development of self-
esteem and its effects on important life outcomes. Journal of personality and
social psychology, 102(6), 1271-1288.
Orth, U., Trzesniewski, K. H., & Robins, R. W. (2010). Self-esteem development
from young adulthood to old age: a cohort-sequential longitudinal
study. Journal of personality and social psychology, 98(4), 645-658.
Osborne, J. W., & Costello, A. B. (2004). Sample size and subject to item ratio in
principal components analysis. Practical assessment, research &
evaluation, 9(11), 1-15.
Østerberg, D. (1976). Meta-sociological essay. Duquesne University Press.
Owens, R. L., Baugh, L. M., Barrett-Wallis, R., Hui, N., & McDaniel, M. M.
(2018). Strengths across the Lifespan: A qualitative analysis of
developmental trajectories and influential factors. Translational Issues in
Psychological Science, 4, 265– 276.
Owens, R. L., & Patterson, M. M. (2013). Positive psychological interventions for
children: A comparison of gratitude and best possible selves approaches.
The Journal of Genetic Psychology: Research and Theory on Human
Development, 174(4), 403–428.
Panchanadeswaran, S., & Dawson, B. A. (2011). How discrimination and stress
affects self-esteem among Dominican immigrant women: An exploratory
study. Social Work in Public Health, 26(1), 60-77.
389
Park, N. (2004). The role of subjective well-being in positive youth
development. The Annals of the American Academy of Political and Social
Science, 591(1), 25-39.
Park, N., & Peterson, C. (2006). Values in Action (VIA) Inventory of Character
Strengths for Youth. Adolescent & Family Health, 4(1), 35-40.
Park, N., & Peterson, C. (2006a). Character strengths and happiness among young
children: Content analysis of parental descriptions. Journal of Happiness
Studies, 7, 323-341.
Park, N., & Peterson, C. (2006b). Moral competence and character strengths among
adolescents: The development and validation of the Values in Action
Inventory of Strengths for Youth. Journal of Adolescence, 29, 891-905.
Park, N., & Peterson, C. (2006c). Methodological issues in positive psychology and
the assessment of character strengths. In A. D. Ong & M. van Dulmen
(Eds.), Handbook of methods in positive psychology (pp. 292-305). New
York: Oxford University Press.
Park, N., & Peterson, C. (2008a). Positive psychology and character strengths:
Application to strengths-based school counseling. Professional School
Counseling, 12 (2), 85-92.
Park, N., & Peterson, C. (2009). Character strengths: Research and practice. Journal
of college and character, 10(4).
Park, N., Peterson, C., & Seligman, M. E. (2004). Strengths of character and well-
being. Journal of social and Clinical Psychology, 23(5), 603-619.
390
Park, N., Peterson, C., & Seligman, M. E. (2004). Strengths of character and well-
being: A closer look at hope and modesty. Journal of Social and Clinical
Psychology, 23(5), 628–634.
Park, N., Peterson, C., & Seligman, M. E. P. (2006). Character strengths in fifty-
four nations and the fifty US states. The Journal of Positive Psychology,
1 (3), 118-129.
Parker, R. I., Vannest, K. J., Davis, J. L., & Sauber, S. B. (2011). Combining
nonoverlap and trend for single-case research: Tau-U. Behavior
Therapy, 42(2), 284-299.
Parks, A. C., & Biswas-Diener, R. (2013). Positive interventions: Past, present and
future. Bridging acceptance and commitment therapy and positive
psychology: A practitioner’s guide to a unifying framework. Oakland, CA:
New Harbinger.
Paradise, A., & Kernis, M. (2002). Self-esteem and Psychological Well-being:
Implications of Fragile Self-esteem. Journal of Social and Clinical
Psychology, 21, 345-361.
Patton, M.Q. (2002). Qualitative Research and Evaluation Methods. Thousand
Oaks, CA: Sage Publications.
Patton, W., Bartrum, D. A., & Creed, P. A. (2004). Gender differences for
optimism, self-esteem, expectations and goals in predicting career planning
and exploration in adolescents. International Journal for Educational and
Vocational Guidance, 4(2-3), 193-209.
391
Paxton, S. J., Neumark-Sztainer, D., Hannan, P. J., & Eisenberg, M. E. (2006).
Body dissatisfaction prospectively predicts depressive mood and low self-
esteem in adolescent girls and boys. Journal of clinical child and adolescent
psychology, 35(4), 539-549.
Payne, J. (2000). Youth Cohort Study: Education, training and employment of 16-
18 year olds in England and the factors associated with non-
participation. Statistical Bulletin, 2, 2000.
Pedhazur, E. J., & Schmelkin, L. P. (2013). Measurement, design, and analysis: An
integrated approach. Psychology Press.
Peters, M. L., Flink, I. K., Boersma, K., & Linton, S. J. (2010). Manipulating
optimism: Can imagining a best possible self be used to increase positive
future expectancies? The Journal of Positive Psychology, 5(3), 204–211
Peters, M. L. S., Meevissen, Y. M. C., & Hanssen, M. M. (2013). Specificity of the
best possible self intervention for increasing optimism: Comparison with a
gratitude intervention. Terapia Psicolo´gica, 31(1), 93–100.
Peterson, C. (2006). A primer in positive psychology. Oxford University Press.
Peterson, C., & Park, N. (2009). Classifying and measuring strengths of character.
In S. J. Lopez & C. R. Snyder (Eds.), Oxford handbook of positive
psychology, 2nd edition (pp. 25-33). New York: Oxford University Press.
Peterson, C., Park, N., & Seligman, M. E. (2005). Orientations to happiness and life
satisfaction: The full life versus the empty life. Journal of happiness
studies, 6(1), 25-41.
392
Peterson, C., Ruch, W., Beerman, U., Park, N., & Seligman, M. E. P. (2007).
Strengths of character, orientations to happiness, and life
satisfaction. Journal of Positive Psychology, 2, 149-156.
Peterson, C., & Seligman, M. E. (2004). Character strengths and virtues: A
handbook and classification (Vol. 1). Oxford University Press.
Peterson, R.L., & Pennington, B.F. (2012). Developmental Dyslexia. The Lancet,
379 (9830), 1997-2007.
Peterson, T. D., & Peterson, E. W. (2008). Stemming the tide of law student
depression: What law schools need to learn from the science of positive
psychology. Yale Journal of Health Policy, Law, and Ethics, 9(2), 357-422.
Petretto, D.R., & Masala, C. (2017). Dyslexia and specific learning disorders: New
international diagnostic criteria. Journal of Childhood and Developmental
disorders, 3 (4:19), 1-5.
Piaget, J. (1972). The psychology of intelligence. Totowa, NJ: Littlefield Adams.
Piers, E., & Harris, D. (1963). Children’s self-concept scale. Nashville, Tenn.:
Recordings and Tests.
Pintrich, P. R. (2003). A motivational science perspective on the role of student
motivation in learning and teaching contexts. Journal of educational
Psychology, 95(4), 667-686.
Powell, A. (2018). NEET: young people not in education, employment or
training. House of Commons Library: Briefing Paper.
393
Preckel, F., Niepel, C., Schneider, M., & Brunner, M. (2013). Self-concept in
adolescence: A longitudinal study on reciprocal effects of self-perceptions in
academic and social domains. Journal of Adolescence, 36(6), 1165-1175.
Prevett, P., Bell, S., & Ralph, S. (2013). Dyslexia and education in the 21st
century. Journal of Research in Special Educational Needs, 13(1), 1-6.
Proctor, C., Maltby, J., & Linley, P. A. (2009) Strengths use as a predictor of well-
being and health-related quality of life. Journal of Happiness Studies,
10, 583-630.
Proctor, C., Maltby, J., & Linley, P. A. (2011). Strengths use as a predictor of well-
being and health-related quality of life. Journal of Happiness Studies, 12(1),
153-169.
Proctor, C., Tsukayama, E., Wood, A. M., Maltby, J., Eades, J. F., & Linley, P. A.
(2011). Strengths gym: The impact of a character strengths-based
intervention on the life satisfaction and well-being of adolescents. The
Journal of Positive Psychology, 6(5), 377-388.
Pyszczynski, T., Greenberg, J., Solomon, S., Arndt, J., & Schimel, J. (2004). Why
do people need self-esteem? A theoretical and empirical
review. Psychological bulletin, 130(3), 435-468.
Quinlan, D., Swain, N., & Vella-Brodrick, D. A. (2012). Character strengths
interventions: Building on what we know for improved outcomes. Journal of
Happiness Studies, 13(6), 1145-1163.
394
Quinn, J. M., & Wagner, R. K. (2015). Gender differences in reading impairment
and in the identification of impaired readers: Results from a large-scale
study of at-risk readers. Journal of learning disabilities, 48(4), 433-445.
Råheim, M., Magnussen, L. H., Sekse, R. J. T., Lunde, Å., Jacobsen, T., & Blystad,
A. (2016). Researcher–researched relationship in qualitative research: Shifts
in positions and researcher vulnerability. International journal of qualitative
studies on health and well-being, 11(1), 30996. Retrieved from
https://doi.org/10.3402/qhw.v11.30996
Rahmani, P. (2011). The efficacy of narrative therapy and storytelling in reading
errors of dyslexic children. Procedia – Social and Behavioural Sciences, 29,
780-785.
Rallis, S. F., & Rossman, G. B. (2012). The research journey: Introduction to
inquiry. Guilford Press.
Rand, K. L., Martin, A. D., & Shea, A. M. (2011). Hope, but not optimism, predicts
academic performance of law students beyond previous academic
achievement. Journal of Research in Personality, 45(6), 683-686.
Ranganathan, P., Pramesh, C. S., & Buyse, M. (2016). Common pitfalls in statistical
analysis: The perils of multiple testing. Perspectives in clinical
research, 7(2), 106-107.
Rapus-Pavel, J., Vitalic, H. S., & Rejec, T. (2018). Schoolwork of Adolescents with
Dyslexia: Comparison of Adolescents', Mothers' and Teachers'
Perspectives. International Journal of Special Education, 33(2), 264-278.
395
Rash, J. A., Matsuba, M. K., & Prkachin, K. M. (2011) considered if personality
factors. Gratitude and well‐being: Who benefits the most from a gratitude
intervention?. Applied Psychology: Health and Well‐Being, 3(3), 350-369.
Rashid, T., & Anjum, A. (2008). Positive psychotherapy for young adults and
children. Handbook of depression in children and adolescents, 250-287.
Rawana, E., & Brownlee, K. (2010). The strengths assessment inventory -
manual. Thunder Bay, ON: Centre of Excellence for Children and
Adolescents with Special Needs.
Reese, E., Yan, C., Jack, F., & Hayne, H. (2010). Emerging identities: Narrative and
self from early childhood to early adolescence. In Narrative development in
adolescence (pp. 23-43). Springer US.
Régner, I., & Loose, F. (2006). Relationship of sociocultural factors and academic
self-esteem to school grades and school disengagement in North African
French adolescents. British Journal of Social Psychology, 45(4), 777–797.
Reid, G. (2011). Dyslexia. A & C Black.
Reissman, C. (2008). Narrative methods for the human sciences. Thousand Oaks,
CA: Sage.
Reiter, H., & Schlimbach, T. (2015). NEET in disguise? Rival narratives in troubled
youth transitions. Educational Research, 57(2), 133-150.
Rennison, J., Maguire, S., Middleton, S., & Ashworth, K. (2006). Young people not
in education, employment or training: evidence from the Education
Maintenance Allowance Pilots Database. Department for Education and
Skills research report, 628.
396
Renshaw, T. L., & Olinger Steeves, R. M. (2016). What good is gratitude in youth
and schools? A systematic review and meta‐analysis of correlates and
intervention outcomes. Psychology in the Schools, 53(3), 286-305.
Rentzsch, K., & Schröder‐Abé, M. (2018). Stability and Change in Domain‐specific
Self‐esteem and Global Self‐esteem. European Journal of
Personality, 32(4), 353-370.
Reschly, A. L., Huebner, E. S., Appleton, J. J., & Antaramian, S. (2008).
Engagement as flourishing: The contribution of positive emotions and
coping to adolescents' engagement at school and with learning. Psychology
in the Schools, 45(5), 419-431.
Rhodes, J., Roffman, J., Reddy, R., & Fredriksen, K. (2004). Changes in self-esteem
during the middle school years: A latent growth curve study of individual
and contextual influences. Journal of School Psychology, 42(3), 243-261.
Richards, H., & Emslie, C. (2000). The ‘doctor’ or the ‘girl from the University’?
Considering the influence of professional roles on qualitative
interviewing. Family practice, 17(1), 71-75.
Riddick, B. (1995). Dyslexia: dispelling the myths. Disability and Society, 10(4),
457-473.
Riley-Tillman, T. C., Burns, M. K., & Kilgus, S. P. (2020). Evaluating educational
interventions: Single-case design for measuring response to intervention.
Guilford press.
Robins, R. W., & Trzesniewski, K. H. (2005). Self-esteem development across the
lifespan. Current directions in psychological science, 14(3), 158-162.
397
Robins, R. W., Trzesniewski, K. H., & Donnellan, M. B. (2012). A brief primer on
self-esteem. The Prevention Researcher, 19(2), 3-8.
Robins, R. W., Trzesniewski, K. H., Tracy, J. L., Gosling, S. D., & Potter, J. (2002).
Global self-esteem across the life span. Psychology and aging, 17(3), 423-
434.
Rohrbach, L. A., Dent, C. W., Skara, S., Sun, P., & Sussman, S. (2007). Fidelity of
implementation in Project Towards No Drug Abuse (TND): a comparison of
classroom teachers and program specialists. Prevention Science, 8(2), 125-
132.
Rosenberg, M. (1965). Society and the adolescent self-image. Princeton, NJ:
Princeton University Press.
Rosenberg, M, (1979). Conceiving the self. New York: Basic Books.
Rosenberg, M., Schooler, C., Schoenbach, C., & Rosenberg, F. (1995). Global self-
esteem and specific self-esteem: Different concepts, different
outcomes. American sociological review, 141-156.
Rossman, G. B., & Wilson, B. L. (1985). Numbers and words: Combining
quantitative and qualitative methods in a single large-scale evaluation
study. Evaluation review, 9(5), 627-643.
Roth, R. A., Suldo, S. M., & Ferron, J. M. (2017). Improving middle school
students' subjective well-being: Efficacy of a multicomponent positive
psychology intervention targeting small groups of youth. School Psychology
Review, 46(1), 21-41.
398
Royer-Gagnier, K., Skilling, T. A., Brown, S. L., Moore, T. E., & Rawana, J. S.
(2016). The Strengths Assessment Inventory–Youth Version: An evaluation
of the psychometric properties with male and female justice-involved
youth. Psychological assessment, 28(5), 563-574.
Rowe, G., Hirsh, J. B., & Anderson, A. K. (2007). Positive affect increases the
breadth of attentional selection. Proceedings of the National Academy of
Sciences, 104(1), 383-388.
Rumberger, R. W. (2011). High school dropouts in the United States. In School
dropout and completion (pp. 275-294). Springer, Dordrecht.
Rumberger, R. W., & Lim, S. A. (2008). Why students drop out of school: A review
of 25 years of research. California Dropout Research Project, 15, 1-3.
Rumberger, R. W., & Rotermund, S. (2012). The relationship between engagement
and high school dropout. In Handbook of research on student
engagement (pp. 491-513). Springer, Boston, MA.
Rumberger, R. W., & Thomas, S. L. (2000). The distribution of dropout and
turnover rates among urban and suburban high schools. Sociology of
education, 39-67.
Russell, L. (2013). Researching marginalised young people. Ethnography and
Education, 8(1), 46-60.
Rutter, M., Caspi, A., Fergusson, D., Horwood, L. J., Goodman, R., Maughan, B.,
Moffitt, T.E., Meltzer, H., & Carroll, J. (2004). Sex differences in
developmental reading disability: new findings from 4 epidemiological
studies. Jama, 291(16), 2007-2012.
399
Ryan, L., D’Angelo, A., Kaye, N., & Lorinc, M. (2019). Young people, school
engagement and perceptions of support: a mixed methods analysis. Journal
of Youth Studies, 1-17.
Ryan, R. M., & Deci, E. L. (2000). Self-determination theory and the facilitation of
intrinsic motivation, social development, and well-being. American
psychologist, 55(1), 68-78.
Ryan, A. M., & Patrick, H. (2001). The classroom social environment and changes
in adolescents’ motivation and engagement during middle school. American
Educational Research Journal, 38(2), 437–460.
Ryff, C. D. (1989). Happiness is everything, or is it? Explorations on the meaning
of psychological well-being. Journal of personality and social
psychology, 57(6), 1069-1081.
Saarni, C. (1999). The development of emotional competence. New York: The
Guilford Press
Salmivalli, C. (1998). Intelligent, attractive, well-behaving, unhappy: The structure
of adolescents' self-concept and its relations to their social behavior. Journal
of Research on Adolescence, 8(3), 333-354.
Schmader, T., Major, B., & Gramzow, R. H. (2001). Coping with ethnic stereotypes
in the academic domain: Perceived injustice and psychological
disengagement. Journal of Social Issues, 57(1), 93-111.
Schneps, M. H., Brockmole, J. R., Sonnert, G., & Pomplun, M. (2012). History of
reading struggles linked to enhanced learning in low spatial frequency
scenes. PLoS One, 7(4), e35724.
400
Sciarra, D. T., & Seirup, H. J. (2008). The multidimensionality of school
engagement and math achievement among racial groups. Professional
School Counseling, 11(4), 218-228.
Seddon, F., Hazenberg, R., & Denny, S. (2013). Effects of an employment
enhancement programme on participant NEETs. Journal of youth
studies, 16(4), 503-520.
Sedikides, C., & Gregg, A. P. (2008). Self-enhancement: Food for thought.
Perspectives on Psychological Science, 3, 102–116.
Sedikides, C., Horton, R. S., & Gregg, A. P. (2007). The why's the limit: curtailing
self‐enhancement with explanatory introspection. Journal of
Personality, 75(4), 783-824.
Seligman, M. E. (2002). Authentic happiness: Using the new positive psychology to
realize your potential for lasting fulfillment. New York: The Free
Press, 160, 168-266.
Seligman, M. E., & Csikszentmihalyi, M. (2000). Positive psychology: An
introduction (Vol. 55, No. 1, p. 5). American Psychological Association.
Seligman, M. E., Ernst, R. M., Gillham, J., Reivich, K., & Linkins, M. (2009).
Positive education: Positive psychology and classroom interventions. Oxford
review of education, 35(3), 293-311.
Seligman, M. E., Rashid, T., & Parks, A. C. (2006). Positive
psychotherapy. American psychologist, 61(8), 774-788.
401
Seligman, M. E., Steen, T. A., Park, N., & Peterson, C. (2005). Positive psychology
progress: empirical validation of interventions. American
psychologist, 60(5), 410-421.
Semple, R. J., & Lee, J. (2014). Mindfulness-based cognitive therapy for children.
In Mindfulness-based treatment approaches (pp. 161-188). Academic Press.
Serpe, R. T., Long-Yarrison, F., Stets, J. E., & Stryker, S. (2019). Multiple
Identities and Self-Esteem. Identities in Everyday Life, 53-71.
Schmid, K. L., Phelps, E., Kiely, M. K., Napolitano, C. M., Boyd, M. J., & Lerner,
R. M. (2011). The role of adolescents’ hopeful futures in predicting positive
and negative developmental trajectories: Findings from the 4-H Study of
Positive Youth Development. The Journal of Positive Psychology, 6(1), 45-
56.
Schimmack, U., & Diener, E. (2003). Predictive validity of explicit and implicit
self-esteem for subjective well-being. Journal of Research in
personality, 37(2), 100-106.
Schmitt, D. P., & Allik, J. (2005). Simultaneous administration of the Rosenberg
Self-Esteem Scale in 53 nations: exploring the universal and culture-specific
features of global self-esteem. Journal of personality and social
psychology, 89(4), 623-642.
Schroder-Abe, M., Rudolph, A., & Schutz, A. (2007). High implicit self-esteem is
not necessarily advantageous: discrepancies between explicit and implicit
self-esteem and their relationship with anger expression and psychological
health. European Journal of Personality, 21, 319-339.
402
Schwartz, S. J., Luyckx, K., & Vignoles, V. L. (Eds.). (2011). Handbook of identity
theory and research. Springer Science & Business Media.
Schwartz, P. D., Maynard, A. M., & Uzelac, S. M. (2008). Adolescent egocentrism:
a contemporary view. Adolescence, 43(171), 441-448.
Seider, S., Novick, S., & Gomez, J. (2013). The effects of privileging moral or
performance character development in urban adolescents. The Journal of
Early Adolescence, 33(6), 786-820.
Sica, L. S., Ragozini, G., Di Palma, T., & Aleni Sestito, L. (2017). Creativity as
Identity Skill? Late Adolescents' Management of Identity, Complexity and
Risk‐Taking. The Journal of Creative Behavior.
Simmons, R., Russell, L., & Thompson, R. (2014). Young people and labour market
marginality: findings from a longitudinal ethnographic study. Journal of
Youth Studies, 17(5), 577-591.
Sims, A., Barker, C., Price, C., & Fornells-Ambrojo, M. (2015). Psychological
impact of identifying character strengths in people with
psychosis. Psychosis, 7(2), 179–182.
Sin, N. L., & Lyubomirsky, S. (2009). Enhancing well-being and alleviating
depressive symptoms with positive psychology interventions: A practice-
friendly meta-analysis. Journal of clinical psychology, 65(5), 467-487.
Singer, E. (2005). The strategies adopted by Dutch children with dyslexia to
maintain their self-esteem when teased at school. Journal of Learning
Disabilities. 38(5), 411-423.
403
Sinkkonen, H. M., Puhakka, H., & Meriläinen, M. (2018). Adolescents’ internet use
in relation to self-esteem and adaptability in career decision-making. British
Journal of Guidance & Counselling, 46(6), 738-751.
Snyder, C. R. (2002). Hope theory: Rainbows in the mind. Psychological
inquiry, 13(4), 249-275.
Snyder, C. R., Harris, C., Anderson, J. R., Holleran, S. A., Irving, L. M., Sigmon, S.
T., … Harney, P. (1991). The will and the ways: Development and
validation of an individual differences measure of hope. Personality and
Individual Differences, 41, 1263–1273.
Snyder, C. R., Shorey, H. S., Cheavens, J., Pulvers, K. M., Adams III, V. H., &
Wiklund, C. (2002). Hope and academic success in college. Journal of
educational psychology, 94(4), 820.
Smith, J. A. (1996). Beyond the divide between cognition and discourse: using
interpretative phenomenological analysis in health psychology. Psychology
and Health, 11, 261-271.
Smith, J. A, Flowers, P., & Larkin, M. (2009) Interpretative Phenomenological
Analysis: Theory, Method, Research. London: Sage.
Smith, J., & Osborn, M. (2003). Interpretative phenomenological analysis.
Qualitative psychology: a practical guide to methods.
Smith, J. A, & Osborn, M. (2008) Interpretative phenomenological analysis. In: JA
Smith, ed. Qualitative psychology: a practical guide to research methods.
London: Sage, 53-80.
404
Snyder, C. R. (Ed.). (2000). Handbook of hope: Theory, measures, and
applications. Academic press.
Snyder, C. R., Harris, C., Anderson, J. R., Holleran, S. A., Irving, L. M., Sigmon, S.
T., ... & Harney, P. (1991). The will and the ways: development and
validation of an individual- differences measure of hope. Journal of
personality and social psychology, 60(4),570–585
Snyder, C. R., Rand, K. L., & Sigmon, D. R. (2002). Hope theory. Handbook of
positive psychology, 257-276.
Social Exclusion Unit (1999) Bridging the Gap: New opportunities for 16–18 year
olds not in education, employment or training.
Sowislo, J. F., & Orth, U. (2013). Does low self-esteem predict depression and
anxiety? A meta-analysis of longitudinal studies. Psychological
bulletin, 139(1), 213-240.
Spielhofer, T. (2009). Increasing participation: understanding young people who do
not participate in education or training at 16 and 17. Nottingham: DCSF
Publications
Sroufe, L. A. (2002). From infant attachment to promotion of adolescent autonomy:
Prospective, longitudinal data on the role of parents in development. In J. G.
Borkowski, S. Landesman Ramey, & M. Bristol-Power (Eds.), Parenting
and the child’s world: Influences on academic, intellectual, and social-
emotional development (pp. 187– 202). Mahwah, NJ: Erlbaum
405
Steele, C. M. (1997). Race and the schooling of Black Americans. In L. Peplau & S.
Taylor (Eds.), Sociocultural perspectives in social psychology: Current
readings (pp. 359-371). Upper Saddle River, NJ: Prentice Hall.
Steiger, A. E., Allemand, M., Robins, R. W., & Fend, H. A. (2014). Low and
decreasing self-esteem during adolescence predict adult depression two
decades later. Journal of personality and social psychology, 106(2), 325.
Stein, C., Fisher, L., Berkey, C., & Colditz, G. (2007). Adolescent physical activity
and perceived competence: does change in activity level impact self-
perception? Journal of Adolescent Health, 40(5), 462-e1.
Steinmayr, R., & Spinath, B. (2009). The importance of motivation as a predictor of
school achievement. Learning and Individual Differences, 19(1), 80–90.
Stets, J. E., & Burke, P. J. (2014). Self-esteem and identities. Sociological
Perspectives, 57(4), 409-433.
Stevens, E. N., Lovejoy, M. C., & Pittman, L. D. (2014). Understanding the
relationship between actual: Ideal discrepancies and depressive symptoms:
A developmental examination. Journal of adolescence, 37(5), 612-621.
Sugai, G., O’Keeffe, B. V., & Fallon, L. M. (2012). A contextual consideration of
culture and school-wide positive behavior support. Journal of Positive
Behavior Interventions, 14(4), 197-208.
Suldo, S. M., Hearon, B. V., Bander, B., McCullough, M., Garofano, J., Roth, R.
A., & Tan, S. Y. (2015). Increasing elementary school students’ subjective
well-being through a classwide positive psychology intervention: Results of
a pilot study. Contemporary School Psychology, 19(4), 300-311.
406
Suldo, S. M., Savage, J. A., & Mercer, S. H. (2014). Increasing middle school
students’ life satisfaction: Efficacy of a positive psychology group
intervention. Journal of happiness studies, 15(1), 19-42.
Suldo, S., Thalji, A., & Ferron, J. (2011). Longitudinal academic outcomes
predicted by early adolescents’ subjective well-being, psychopathology, and
mental health status yielded from a dual factor model. The Journal of
Positive Psychology, 6(1), 17-30.
Tak, Y. R., Lichtwarck-Aschoff, A., Gillham, J. E., Van Zundert, R. M., & Engels,
R. C. (2016). Universal school-based depression prevention ‘Op Volle
Kracht’: a longitudinal cluster randomized controlled trial. Journal of
abnormal child psychology, 44(5), 949-961.
Tambelli, R., Laghi, F., Odorisio, F., & Notari, V. (2012). Attachment relationships
and internalizing and externalizing problems among Italian
adolescents. Children and youth services review, 34(8), 1465-1471.
Taylor, L.M., Hume, I. R., & Welsh, N. (2010). Labelling & self-esteem: the impact
of using specific vs. generic labels. Educational Psychology: An
International Journal of Experimental Educational Psychology, 30(2), 191-
202.
Teddlie, C., & Tashakkori, A. (2009). Foundations of mixed methods research:
Integrating quantitative and qualitative approaches in the social and
behavioral sciences. Sage.
Tenenbaum, H. R., & Leaper, C. (2003). Parent-child conversations about science:
The socialization of gender inequities? Developmental psychology, 39(1),
34-47.
407
Terras, M.M., Thompson, L.C. & Minnis, H. (2009). Dyslexia and psycho-social
functioning: an exploratory study of the role of self-esteem and
understanding. Dyslexia, 15, 304–327.
Tetzner, J., Becker, M., & Maaz, K. (2017). Development in multiple areas of life in
adolescence: Interrelations between academic achievement, perceived peer
acceptance, and self-esteem. International Journal of Behavioral
Development, 41(6), 704-713.
Theunissen, S. C., Rieffe, C., Netten, A. P., Briaire, J. J., Soede, W., Kouwenberg,
M., & Frijns, J. H. (2014). Self-esteem in hearing-impaired children: the
influence of communication, education, and audiological
characteristics. PLoS One, 9(4), e94521.
Thompson, R. A. (2006). The development of the person: Social understanding,
relationships, conscience, self. In W. Damon & R. M. Lerner (Series Eds.),
& N. Eisenberg (Vol. Ed.), Handbook of child psychology: Vol. 3. Social,
emotional, and personality development (6th ed., pp. 24 –98). New York,
NY: Wiley.
Toback, R. L., Graham-Bermann, S. A., & Patel, P. D. (2016). Outcomes of a
character strengths–based intervention on self-esteem and self-efficacy of
psychiatrically hospitalized youths. Psychiatric Services, 67(5), 574-577.
Toner, E., Haslam, N., Robinson, J., & Williams, P. (2012). Character strengths and
wellbeing in adolescence: Structure and correlates of the Values in Action
Inventory of Strengths for Children. Personality and Individual
Differences, 52(5), 637-642.
408
Tomaszewska-Pękała, H., Marchlik, P., & Wrona, A. (2017). RESL Publication 6
Finding Inspiring Practices on How to Prevent ESL and School
Disengagement. Lessons from the Educational Trajectories of Youth at Risk
from Nine EU Countries.
Trautwein, U. and Ludtke, O. (2006) Self-esteem, academic self-concept, and
achievement: How the learning environment moderates the dynamics of
self-concept. Journal of Personality and Social Psychology 90(2), 334 –349.
Trautwein, U., Lüdtke, O., Kastens, C., & Köller, O. (2006a). Effort on homework
in grades 5–9: Development, motivational antecedents, and the association
with effort on classwork. Child development, 77(4), 1094-1111.
Trzesniewski, K. H., Donnellan, M. B., Moffitt, T. E., Robins, R. W., Poulton, R.,
& Caspi, A. (2006). Low self-esteem during adolescence predicts poor
health, criminal behavior, and limited economic prospects during
adulthood. Developmental psychology, 42(2), 381-390.
Trzesniewski, K. H., Donnellan, M. B., & Robins, R. W. (2003). Stability of self-
esteem across the life span. Journal of personality and social
psychology, 84(1), 205-220.
Tucker, L. R., & Lewis, C. (1973). A reliability coefficient for maximum likelihood
factor analysis. Psychometrika, 38(1), 1-10.
Tugade, M. M. & Fredrickson, B. L. (2004). Resilient individuals use positive
emotions to bounce back from negative emotional
experiences. Journal of Personality and Social Psychology, 86(2), 320 – 333
409
Tugade, M. M., Fredrickson, B. L., & Feldman Barrett, L. (2004). Psychological
resilience and positive emotional granularity: Examining the benefits of
positive emotions on coping and health. Journal of personality, 72(6), 1161-
1190.
Twenge, J.M. (2006). Generation me. New York, NY: Free Press
Twenge, J. M., Carter, N. T., & Campbell, W. K. (2017). Age, time period, and
birth cohort differences in self-esteem: Reexamining a cohort-sequential
longitudinal study. Journal of personality and social psychology, 112(5), e9-
e17.
Umaña-Taylor, A. J. (2004). Ethnic identity and self-esteem: Examining the role of
social context. Journal of adolescence, 27(2), 139-146.
Undheim, A. (2009). A thirteen-year follow-up study of young Norwegian adults
with dyslexia in childhood: Reading development and educational levels.
Dyslexia: An International Journal Of Research And Practice, 15(4), 291-
303.
Valkenburg, P. M., & Peter, J. (2009). Social consequences of the Internet for
adolescents: A decade of research. Current Directions in Psychological
Science, 18, 1-5.
Valle, M. F., Huebner, E. S., & Suldo, S. M. (2006). An analysis of hope as a
psychological strength. Journal of school psychology, 44(5), 393-406.
Van de Vyver, J & Crisp, R (2019). Crossing Divides: The friends who are good for
your brain. Accessed July 7, 2019. https://www.bbc.co.uk/news/uk-
47369648.
410
van den Berg, P. A., Mond, J., Eisenberg, M., Ackard, D., & Neumark-Sztainer, D.
(2010). The link between body dissatisfaction and self-esteem in
adolescents: Similarities across gender, age, weight status, race/ethnicity,
and socioeconomic status. Journal of Adolescent Health, 47(3), 290-296.
Van Ryzin, M. J., Gravely, A. A., & Roseth, C. J. (2009). Autonomy,
belongingness, and engagement in school as contributors to adolescent
psychological well-being. Journal of youth and adolescence, 38(1), 1-12.
Vanhalst, J., Luyckx, K., Scholte, R. H., Engels, R. C., & Goossens, L. (2013). Low
self-esteem as a risk factor for loneliness in adolescence: Perceived-but not
actual-social acceptance as an underlying mechanism. Journal of abnormal
child psychology, 41(7), 1067-1081.
Vannest, K. J., Parker, R. I., Gonen, O., & Adiguzel, T. (2011). Single Case
Research: web-based calculators for SCR analysis.
Varahrami, A., Arnau, R. C., Rosen, D. H., & Mascaro, N. (2010). The relationships
between meaning, hope, and psychosocial development. International
Journal of Existential Psychology and Psychotherapy, 3, 1-13
Vaughn, M. G., Wexler, J., Beaver, K. M., Perron, B. E., Roberts, G., & Fu, Q.
(2011). Psychiatric correlates of behavioral indicators of school
disengagement in the United States. Psychiatric Quarterly, 82(3), 191-206.
Veselska, Z., Madarasova Geckova, A., Gajdosova, B., Orosova, O., van Dijk, J. P.,
& Reijneveld, S. A. (2009). Socio-economic differences in self-esteem of
adolescents influenced by personality, mental health and social
support. European Journal of Public Health, 20(6), 647-652.
411
Von Korff, L. A. (2008). Pathways to narrative adoptive identity formation in
adolescence and emerging adulthood.
von Soest, T., Wichstrøm, L., & Kvalem, I. L. (2016). The development of global
and domain-specific self-esteem from age 13 to 31. Journal of Personality
and Social Psychology, 110(4), 592-608.
Wagner, J., Lüdtke, O., Robitzsch, A., Göllner, R., & Trautwein, U. (2018). Self‐
esteem development in the school context: The roles of intrapersonal and
interpersonal social predictors. Journal of personality, 86(3), 481-497.
Wagner, L., & Ruch, W. (2015). Good character at school: positive classroom
behavior mediates the link between character strengths and school
achievement. Frontiers in Psychology, 6, 610. Retrieved from
doi:10.3389/fpsyg.2015.00610.
Wagnsson, S., Lindwall, M., & Gustafsson, H. (2014). Participation in organized
sport and self-esteem across adolescence: the mediating role of perceived
sport competence. Journal of sport and exercise psychology, 36(6), 584-594.
Wallis, J., Burns, J., & Capdevila, R. (2011). What is narrative therapy and what is
it not? The usefulness of Q methodology to explore accounts of White and
Epston's (1990) approach to narrative therapy. Clinical Psychology &
Psychotherapy, 18(6), 486-497.
Wang, M. T., & Sheikh‐Khalil, S. (2014). Does parental involvement matter for
student achievement and mental health in high school? Child
development, 85(2), 610-625.
412
Watkins, P. C. (2014). Does Gratitude Enhance Experience of the Past?
In Gratitude and the Good Life (pp. 117-138). Springer, Dordrecht.
Waugh, C. E., & Fredrickson, B. L. (2006). Nice to know you: Positive emotions,
self–other overlap, and complex understanding in the formation of a new
relationship. The Journal of Positive Psychology, 1(2), 93-106.
Weber, M., Ruch, W., Littman-Ovadia, H., Lavy, S., & Gai, O. (2013).
Relationships among higher-order strengths factors, subjective well-being,
and general self-efficacy – The case of Israeli adolescents. Personality and
Individual Differences, 55, 322-327.
Wehlage, G. G. (1986). At-risk students and the need for High School
reform. Education, 107(1).
West, T. (2008). It is time to get serious about the talents of dyslexics. Perspectives
on Language and Literacy, 34(3), 9-11.
West, T. G. (2009). In the mind's eye: Creative visual thinkers, gifted dyslexics, and
the rise of visual technologies. Prometheus books.
White, C. A., Uttl, B., & Holder, M. D. (2019). Meta-analyses of positive
psychology interventions: The effects are much smaller than previously
reported. PloS one, 14(5), e0216588.
Wichstrøm, L., & von Soest, T. (2016). Reciprocal relations between body
satisfaction and self-esteem: A large 13-year prospective study of
adolescents. Journal of adolescence, 47, 16-27.
Willig, C. (2012). Qualitative analysis and interpretation in psychology. McGraw
Hill/Open University Press.
413
Winkens, I., Ponds, R., Pouwels, C., Eilander, H., & van Heugten, C. (2014). Using
single-case experimental design methodology to evaluate the effects of the
ABC method for nursing staff on verbal aggressive behaviour after acquired
brain injury. Neuropsychological rehabilitation, 24(3-4), 349-364.
Wissink, I. B., Dekovic, M., & Meijer, A. M. (2006). Parenting behavior, quality of
the parent-adolescent relationship, and adolescent functioning in four ethnic
groups. The Journal of Early Adolescence, 26(2), 133-159.
Wolff, U., & Lundberg, I. (2002). The prevalence of dyslexia among art
students. Dyslexia, 8(1), 34-42.
Wood, G. G., & Frey, A. (2003). Helping children cope: A narrative approach to the
Life Space Interview. School Social Work Journal, 27(2), 57-78.
Wood, A. M., Froh, J. J., & Geraghty, A. W. (2010). Gratitude and well-being: A
review and theoretical integration. Clinical psychology review, 30(7), 890-
905.
Wood, A. M., Linley, P. A., Maltby, J., Kashdan, T. B., & Hurling, R. (2011).
Using personal and psychological strengths leads to increases in well-being
over time: A longitudinal study and the development of the strengths use
questionnaire. Personality and Individual Differences, 50(1), 15-19.
Wood, A. M., Maltby, J., Gillett, R., Linley, P. A., & Joseph, S. (2008). The role of
gratitude in the development of social support, stress, and depression: Two
longitudinal studies. Journal of Research in Personality, 42(4), 854-871.
414
Wood, A. M., & Tarrier, N. (2010). Positive clinical psychology: A new vision and
strategy for integrated research and practice. Clinical psychology
review, 30(7), 819-829.
Worling, J. R., & Langton, C. M. (2015). A prospective investigation of factors that
predict desistance from recidivism for adolescents who have sexually
offended. Sexual abuse: a journal of research and treatment, 27(1), 127-
142.
Xanthopoulou, D., Bakker, A. B., Demerouti, E., & Schaufeli, W. B. (2007). The
role of personal resources in the job demands-resources model. International
journal of stress management, 14(2), 121.
Yates, S., & Payne, M. (2006). Not so NEET? A critique of the use of ‘NEET’ in
setting targets for interventions with young people. Journal of youth
studies, 9(3), 329-344.
Yip, T. (2014). Ethnic identity in everyday life: The influence of identity
development status. Child Development, 85(1), 205-219.
Yu, J. W., Buka, S. L., McCormick, M. C., Fitzmaurice, G. M., & Indurkhya, A.
(2006). Behavioral problems and the effects of early intervention on eight-
year-old children with learning disabilities. Maternal and Child Health
Journal, 10(4), 329-338.
Zeiders, K. H., Umaña-Taylor, A. J., & Derlan, C. L. (2013). Trajectories of
depressive symptoms and self-esteem in Latino youths: Examining the role
of gender and perceived discrimination. Developmental psychology, 49(5),
951.
415
Zhang, L. F., & Postiglione, G. A. (2001). Thinking styles, self-esteem, and socio-
economic status. Personality and individual differences, 31(8), 1333-1346.
416
Appendices
Appendix A.
Ethical Approval Letter - Studies 1 and 2
417
RESEARCH ETHICS APPROVAL FORM
STAFF/POSTGRADUATE RESEARCH
All staff (including research staff) and postgraduate students conducting research in the
Department of Psychology must complete this form before commencing their research.
Empirical work must not begin until the Department Ethics Sub-Committee has approved the
research.
Postgraduate Name Gabrielle Pitfield
Research Staff Name
Staff Name Professor Rod Nicolson and Dr Jilly Martin
Date Ethics Form submitted 6 November 2014
Proposed starting date of research 1 December 2014
Brief title of investigation (state if this application is for a single study or for a series of studies
using the same methodology):
‘Positive Education – Identifying and enhancing strengths to empower, inspire and maximise
learning potential’
This is a single study (Study 1)
Study 2 (not yet fully designed) will develop this template for utilisation with young dyslexic
adolescents (13-14 years) ‘at risk of offending’.
Aims/value of research:
To identify if dyslexic adolescents exhibit specific strengths compared to non-dyslexic adolescents.
Both dyslexic and non-dyslexic adolescents are then randomly allocated to a composite of positive
psychology interventions to nurture strengths. Strengths and Self-esteem will be measured at
baseline, immediately post intervention and at 6 and 12 months follow up. By the recognition and
cultivation of strengths it is envisaged that the adolescents will feel empowered and inspired to
maximise their learning potential and carve out the most suitable career path.
The value of this study is to broaden previous ‘Positive Dyslexia’ research on adults by focussing
specifically on young dyslexic and non-dyslexic adolescents. These research findings will provide
a platform for Study 2.
Proposed participants in research (Explain fully who the participants will be and how they
will be recruited. If the study does not involves a Level 1 Psychology student sample, the
information sheet provided to participants must be attached to this form. If the study involves
animals, state none and go to final section on research involving animals). If the study does not
involve human or animals, e.g., computer modelling, state none and go to signature(s):
Participants will be early adolescents (13-14 years old) Year 9 students from mainstream secondary
school.
418
Proposed participants in research (Explain fully who the participants will be and how they
will be recruited. If the study does not involves a Level 1 Psychology student sample, the
information sheet provided to participants must be attached to this form. If the study involves
animals, state none and go to final section on research involving animals). If the study does not
involve human or animals, e.g., computer modelling, state none and go to signature(s):
Participants will be early adolescents (13-14 years old) Year 9 students from mainstream secondary
school.
The participants will consist of two groups:-
(i) adolescents with a formal/suspected diagnosis of dyslexia and receiving learning support
(ii) non-dyslexic adolescents.
Individuals fitting these criteria and likely to gain from a strengths-based intervention (as determined
by the Head/Learning support Department) will be invited to take part through letter.
Due to the time consuming methodology and interventions, it is envisaged that the study will be
limited to 12 -16 participants.
Brief description of methods and procedure (give reference to established method where
appropriate):
A mixed method approach will be adopted.
Step 1 – Identification of Strengths
To identify if dyslexic exhibit specific strengths compared to non-dyslexia adolescents, all
participants will partake in the first part of the study which consists of:-
1. Investigative Strengths Assessments –
Values in Action Inventory of Strengths for Youth (VIA; Peterson & Seligman, 2004)
MIND reasoning (Eide & Eide, 2011)
Strengths Assessment Inventory –Youth (SAI-Y; Rawana & Brownlee, 2009)
Behavioural & Emotional Youth Rating Scale (BERS-2; Epstein, 2004)
2. Narrative –
Emerging Life Story Interview (ELSI; - Reese et al. 2010 - adapted from McAdams & St.
Aubin, 1992). This will be audio-taped to facilitate thematic analysis.
Pre- and post-intervention self-esteem will be measured using the Culture Free Self-Esteem
Inventory (CFSEI-3, Battle, 2002).
Step 2 – Enhancement of Strengths
Enhancement of strengths is the second part of the study and consists of a group programme of eight
weekly positive psychology interventions. For this, dyslexic and non-dyslexic adolescents wil be
randomly allocated (stratified) into two groups – the experimental and the control.
Both experimental and control group will receive interventions utilising mindfulness exercises and
mind mapping focusing on gratitude, hope and goal setting. In order to investigate the effects of the
Brief description of methods and procedure (give reference to established method where
appropriate):
A mixed method approach will be adopted.
Step 1 – Identification of Strengths
To identify if dyslexic exhibit specific strengths compared to non-dyslexia adolescents, all
participants will partake in the first part of the study which consists of:-
1. Investigative Strengths Assessments –
Values in Action Inventory of Strengths for Youth (VIA; Peterson & Seligman, 2004)
MIND reasoning (Eide & Eide, 2011)
Strengths Assessment Inventory –Youth (SAI-Y; Rawana & Brownlee, 2009)
Behavioural & Emotional Youth Rating Scale (BERS-2; Epstein, 2004)
2. Narrative –
Emerging Life Story Interview (ELSI; - Reese et al. 2010 - adapted from McAdams & St.
Aubin, 1992). This will be audio-taped to facilitate thematic analysis.
Pre- and post-intervention self-esteem will be measured using the Culture Free Self-Esteem
Inventory (CFSEI-3, Battle, 2002).
Step 2 – Enhancement of Strengths
Enhancement of strengths is the second part of the study and consists of a group programme of eight
weekly positive psychology interventions. For this, dyslexic and non-dyslexic adolescents will be
randomly allocated (stratified) into two groups – the experimental and the control.
Both experimental and control group will receive interventions utilising mindfulness exercises and
mind mapping focusing on gratitude, hope and goal setting. In order to investigate the effects of the
enhancement of strengths the experimental group will in addition receive the strengths enhancement
sessions. The control group will continue gratitude interventions during these sessions.
These group sessions will be audiotaped to ensure ongoing compliance with the implementation of
the intervention.
Feedback and debrief after final intervention.
Participants will complete the investigative strengths assessment and self-esteem measure a week
after the final intervention and follow up at 6 and 12 months post intervention.
Additional academic measures
Prior consultation with the School Head will determine the most appropriate school-implemented
measure (e.g., SATS score) to gauge any change in academic ability within the research timeframe.
This will be supplemental to the measures below and the participant will not undergo additional
assessment.
419
Brief description of methods and procedure (give reference to established method where
appropriate):
A mixed method approach will be adopted.
Step 1 – Identification of Strengths
To identify if dyslexic exhibit specific strengths compared to non-dyslexia adolescents, all
participants will partake in the first part of the study which consists of:-
1. Investigative Strengths Assessments –
Values in Action Inventory of Strengths for Youth (VIA; Peterson & Seligman, 2004)
MIND reasoning (Eide & Eide, 2011)
Strengths Assessment Inventory –Youth (SAI-Y; Rawana & Brownlee, 2009)
Behavioural & Emotional Youth Rating Scale (BERS-2; Epstein, 2004)
2. Narrative –
Emerging Life Story Interview (ELSI; - Reese et al. 2010 - adapted from McAdams & St.
Aubin, 1992). This will be audio-taped to facilitate thematic analysis.
Pre- and post-intervention self-esteem will be measured using the Culture Free Self-Esteem
Inventory (CFSEI-3, Battle, 2002).
Step 2 – Enhancement of Strengths
Enhancement of strengths is the second part of the study and consists of a group programme of eight
weekly positive psychology interventions. For this, dyslexic and non-dyslexic adolescents will be
randomly allocated (stratified) into two groups – the experimental and the control.
Both experimental and control group will receive interventions utilising mindfulness exercises and
mind mapping focusing on gratitude, hope and goal setting. In order to investigate the effects of the
enhancement of strengths the experimental group will in addition receive the strengths enhancement
sessions. The control group will continue gratitude interventions during these sessions.
These group sessions will be audiotaped to ensure ongoing compliance with the implementation of
the intervention.
Feedback and debrief after final intervention.
Participants will complete the investigative strengths assessment and self-esteem measure a week
after the final intervention and follow up at 6 and 12 months post intervention.
Additional academic measures
Prior consultation with the School Head will determine the most appropriate school-implemented
measure (e.g., SATS score) to gauge any change in academic ability within the research timeframe.
This will be supplemental to the measures below and the participant will not undergo additional
assessment.
Has it been established that the proposed methodology will produce data from which
meaningful conclusions can be drawn?
Yes. The quantitative measures provide before- and after- data which are appropriate for inferential
multivariate statistical analyses, and the interview data will be analysed using appropriate qualitative
techniques (IPA or equivalent).
The individual interventions used have been shown to be effective with similar groups of
participants, but the combination of positive psychology and strengths enhancement methods has
not been tried
Quantitative
The strengths assessments and self-esteem measure have been chosen for their age appropriateness,
reliability and validity.
Qualitative
The Emerging Life Story Interview, an adaptation of McAdams (1992) Life Story Interview, will
yield rich data and gives a subjective perspective to strengths. Since this epoch is profiled by
Erikson’s (1968) ‘Identity versus Role Confusion’ psychosocial stage, this life story will chart
identity through different life junctures. The combinations of assessments and narrative aim to
facilitate a holistic picture of strengths to be identified.
Positive Psychology Interventions
The interventions will take place in structured group sessions for 1 hr a week over an 8 week
program.
Each session will start with a Mindfulness exercise as it is believed to increase the effectiveness of
positive psychology interventions. Mindfulness exercises are also claimed to reduce anxiety and
help in emotion-regulation.
Interventions will then concentrate on positivity, drawn from past events (gratitude), present
(strengths) and the future (hope & goal setting). Mind maps will be used to draw upon these
constructs.
Gratitude exercises will include gratitude for strengths already identified, a ‘counting blessings’
diary and a gratitude visit.
In the experimental group, recognition and enhancement of strengths shall be encouraged by the
use of signature strengths in new ways across life.
Hope will be explored with relation to individual self-concordant goals. Hope Theory explains
goal directed thinking as the utilisation of pathways thinking (i.e. the capacity to determine how to
achieve goals) and agency thinking (i.e. the motivation to enact specific behaviours to remain
focussed and overcome hurdles in order to achieve these goals).
Since it has been established that there is a robust relationship between gratitude and hope with both
satisfaction with school experience and increased general well-being, these constructs are very
suitable for use with this age group. Capitalising to the adolescents’ strengths and fostering positive
attributes (gratitude and hope) may buffer against negative emotions and outcomes.
How will participants give informed consent to participate in the study? (Give details,
including details of procedures involving parental or guardian consent):
420
Does the study involve any of the following ethical issues? (circle all that apply)
An intervention/treatment is being conducted (i.e. this is a clinical trial
see University definition at:
http://www.sheffield.ac.uk/ris/other/gov-
ethics/clinicaltrials
No
Questionnaires touching on sensitive issues No
Deception No
A procedure that might cause distress - even inadvertently Yes
Designs involving stressful situations No
Possible breach of confidentiality Yes
Invasion of privacy No
Working with children Yes
Working with disabled people
The production of recorded media such as audio and/or video
recordings?
No
Yes
What procedures will be used to address these issues (e.g. debriefing, providing
information/help, ensuring confidentiality is preserved). Please ensure that if your project is
a clinical trial you complete monitoring and adverse incident forms and submit them to the
Chair of the Ethics Committee as required. The committee may ask to see copies of relevant
documents.
The Principles of Informed Consent, Withdrawal, Debriefing, Confidentiality, Anonymity,
Integrity, Impartiality and Respect will be adhered to at all times through this research (Code of
Ethics and Conduct, BPS, August 2009). In addition the researcher ensures that this research shall
be conducted with honesty, integrity, minimal possible risk to participants (and self) and with
cultural sensitivity.
Although this research is intended to be an empowering, inspiring and enjoyable experience for the
participants it is acknowledged that some of these participants may be vulnerable due not only to
age but due to their learning disability.
However consideration will be given to all the following ethical issues identified in the previous
section.
Working with children
Constant liaison with relevant staff will ensure none of the participants will feel particularly
emotionally vulnerable regarding their dyslexia in line with Singer’s (2005) suggestion that
dyslexic children are at an increased risk of intense emotional reaction.
The participants will be told the aims of the study at the onset and will be again after completion of
the study, and shall be encouraged to ask as many questions as possible. In line with BPS Ethics at
no point are the participants to be misled or deceived, transparency is essential. They are to be
verbally briefed and debriefed in an age appropriate child friendly manner. It is believed that by
facilitating an open exchange of information that the adolescents shall feel more involved in the
research process.
421
The participant will be made aware that at any point during the research study the participant may withdraw
without giving any reason.
Inconvenience during the school day may be a concern to the participants and their parents. Assessments,
interviews and interventions are planned to be scheduled with the Head, Year & Form Tutor and the
Learning Support Department to cause the least disruption to the academic lessons of the school day. It is
envisaged research will take place in reading time, study periods or learning support periods.
Procedures that may cause distress - even inadvertently.
The Investigative Strengths Assessments are short paper measures (15 minutes each). There will be no time
limit for answering. To avoid confusion and ambiguity the researcher will read the questions to the
participants and answer any questions posed.
Interviews always have the potential for disclosing difficult and challenging issues.
The Emerging Life Story Interview may allow negative (as well as positive) challenging emotions and
memories to surface when exploring different junctures in their past. The Non-Malfeasance - 'doing no
harm' concept is particularly scrutinised to ensure those of particular vulnerability deal with painful
recollections that
may surface during narrative.
All questions will be asked in a responsible and caring manner and the participant can refuse to answer any
question at any time. At any point during the interview the participant may stop the interview and request
‘time out’. However, if any information is given to the researcher regarding harm or potential harm
involving the participant, it is a duty that such information such be passed to the relevant individual or body.
Possible breach of confidentiality:-
At the commencement of the research, the participant will be asked to choose a pseudonym and will be
informed that everything they say wil be treated with the utmost confidence, anonymity and sensitivity.
However, it is the duty of the researcher that if any information is given regarding harm or potential harm
involving the participant, that such information such be passed to the relevant individual or body.
The production of recorded media such as audio and/or video recordings:-
The Emerging Life Story Interview will be audiotaped to facilitate analysis. Throughout the interview the
participant will only be referred to by the pseudonym they have chosen from a pre-determined selection of
pseudonyms. The group Intervention sessions shall be audiotaped to ensure continuity in implementation of
intervention.
The raw data and transcripts shall be stored on a University of Sheffield Computer. The Computer is
password secure and located within a locked office within The University of Sheffield Psychology
Department. Upon completion the individually-traceable data will be deleted.
Previous study:-
Earlier MSc Dissertation research involved conducting assessments and audio-taped interviews with
dyslexic primary school children (7-11 years old). Feedback from this study revealed the participants found
it an enjoyable and enriching experience.
However, I am aware of the sensitivities and potential complexities this research may entail.
Summary
It is my utmost priority that the potential for psychological distress is minimised. It is critical these
vulnerable participants are fully aware of the research objectives and their right to withdraw at any point. It
is believed that this research will achieve beneficence - 'doing positive good', allowing
422
participants to reflect upon the research as a positive directional experience.
I hold an enhanced DBS clearance.
IF YOUR EXPERIMENT INVOLVES LEVEL 1 PSYCHOLOGY STUDENTS: Please
provide a description of your experiment that can be given to participants once they have
taken part. Note that this description should include full account of the aims and method
that you used (min. 150 words) – students will need this information for their PSY104
assessment. Please also include a reference to a similar or related experiment that
participants can read about if they are interested in the topic. Please ensure that the
reference provided is available through the University of Sheffield library.
Not applicable.
What measures will be put in place to ensure confidentiality of personal data, where
appropriate?
All information will be anonymous (participants shall choose their own pseudonyms at the
commencement of the research) and all data shall be stored in a locked office at The University
and within password secure computer files. Upon completion of the research all data will be
deleted or destroyed.
Will financial / in kind payments (other than reasonable expenses and compensation for
time) be offered to participants? (Indicate how much and on what basis this has been decided)
None
Research Involving Animals
Under whose personal licence will the work be conducted? Not applicable
Under which project licence will the work be conducted? Not applicable
If the work is not covered by a licence (e.g., because it involves insects) please give justification
Not applicable
I confirm that I have read the current version of the University of Sheffield ‘Ethics Policy
Governing Research Involving Human Participants, Personal Data and Human Tissue’, as
shown on the University’s research ethics website at: www.sheffield.ac.uk/ris/other/gov-
ethics/ethicspolicy
√
423
Title of Research Project: ‘Positive Education – Identifying and enhancing strengths to empower,
inspire and maximise learning potential’
I confirm my responsibility to deliver the research project in accordance with the University of Sheffield’s policies and procedures, which include the University’s ‘Financial Regulations’, ‘Good Research Practice Standards’ and the ‘Ethics Policy Governing Research Involving Human Participants, Personal Data and Human Tissue’ (Ethics Policy) and, where externally funded, with the terms and conditions of the research funder.
In signing this research ethics application form I am also confirming that:
• The form is accurate to the best of my knowledge and belief.
• The project will abide by the University’s Ethics Policy.
• There is no potential material interest that may, or may appear to, impair the independence and objectivity of researchers conducting this project.
• Subject to the research being approved, I undertake to adhere to the project protocol without unagreed deviation and to comply with any conditions set out in the letter from the University ethics reviewers notifying me of this.
• I undertake to inform the ethics reviewers of significant changes to the protocol (by contacting my academic department’s Ethics Administrator in the first instance).
• I am aware of my responsibility to be up to date and comply with the requirements of the law and relevant guidelines relating to security and confidentiality of personal data, including the need to register when necessary with the appropriate Data Protection Officer (within the University the Data Protection Officer is based in CiCS).
• I understand that the project, including research records and data, may be subject to inspection for audit purposes, if required in future.
• I understand that personal data about me as a researcher in this form will be held by those involved in the ethics review procedure (e.g. the Ethics Administrator and/or ethics reviewers) and that this will be managed according to Data Protection Act principles.
• If this is an application for a ‘generic’ project all the individual projects that fit under the generic project are compatible with this application.
• I have read the BPS ethical guidelines for research and I am satisfied that all ethical issues have been
identified and that satisfactory procedures are in place to deal with those issues in this research. I will
abide by University Health and Safety Regulations (http://www.shef.ac.uk/safety/cop/part1/index.html)
including the codes of practice designed to ensure the safety of researchers working away from University
premises.
• I understand that this project cannot be submitted for ethics approval in more than one department, and that if I wish to appeal against the decision made, this must be done through the original department.
Name of the Principal Investigator (or the name of the Supervisor if this is a postgraduate researcher project): Professor Rod Nicolson
If this is a postgraduate researcher project insert the student’s name here:
Gabrielle Pitfield
Signature of Principal Investigator (or the Supervisor): R. Nicolson Date: 20 November 2014
424
1 of 2
EXPERIMENTER SAFETY
This form must be completed by all students prior to starting their projects and must be submitted at the
same time as they submit an ethics form. No research must be conducted until after the Department has
considered both the Ethics form and the Experimenter Safety form and given permission for the research
to go ahead.
Background
Students in the Department of Psychology will frequently be involved in projects that involve experimenters
collecting data from participants. For example, these projects might include collecting data for laboratory classes
in taught modules, for Level 3 dissertations, or for postgraduate research. The participants could include, for
example, other Psychology students, students in other Departments, friends and acquaintances outside the
Department, or members of the public. The research might take place on University premises, or in other
organisations (e.g. schools, hospitals, companies), or might be conducted in public places. Supervisors and
students must consider the potential risks to experimenters in any empirical research. Supervisors and students
must be familiar with the guidance and advice provided by Safety Services about conducting research, especially
when the experimenter is working alone.
See http://www.shef.ac.uk/safety/guidance/loneworking.html
Please complete the following (please answer all questions that are relevant):
Will the project be conducted on Sheffield University premises? NO
Will the experimenter conduct research on other premises? YES
If YES please specify by ticking box(es) below and give details:
Other University premises where?......................................................
School/Educational premises where?.Mainstream Secondary school in Sheffield
Hospital/Clinic where?......................................................
Company/Business where?......................................................
Prison/Offenders institution where?......................................................
Social/bar premises where?......................................................
Private houses/flats etc. where?......................................................
Other premises where?......................................................
Will the experimenter conduct research in other places? NO
If YES please specify by ticking box(es) below and give details
Camps/playgrounds where?......................................................
Sports facilities where?......................................................
Public spaces/malls where?......................................................
Streets where?......................................................
√
√
425
Might the participants pose any risk to the experimenter? NO
If YES please give details of risk:
It is extremely unlikely that risk any may occur to myself. Although I shall be administering
assessments on an individual basis in a quiet room, the door will always be open to ensure there
are teachers in the vicinity.
Where necessary, please describe below the measures that have been put in place to ensure
the safety of the experimenter. Please refer to the Safety Services web pages for examples
of
appropriate measures.
The location, timings and days of assessments, interviews and interventions will be noted by a
family member to ensure that my whereabouts shall be known at all times.
Please note. Undergraduate experimenters must never work alone in the following environments: participants’
homes, social/bar premises, or any other environment that may pose a risk to the experimenter.
Students should tick the following boxes and sign below:
I have read the relevant Safety Services information.
I have fully considered any potential risks that the proposed experiment might have.
I will inform my supervisor/the Department immediately should the research alter in such a way that
the level of risk becomes greater than stated above.
If, at any time, I am concerned about the risks entailed in my research I will stop the research and
discuss my concerns with my supervisor.
\
Signed Student: G. Pitfield Date: 20 November 2014
Supervisors should tick the following boxes and sign below:
I have read the relevant Safety Services information.
I have discussed any potential risks with the student.
I am satisfied that measures outlined above are the most appropriate ones to minimise risk to
the experimenter.
\Signed Supervisor: R. Nicolson Date: 20 November 2014
Completed Ethics Forms and any supporting materials should be submitted as a single document by a HEFCE-
funded member of staff via http://psy-research.group.shef.ac.uk/login.php
√
√
√
√
√
√
√
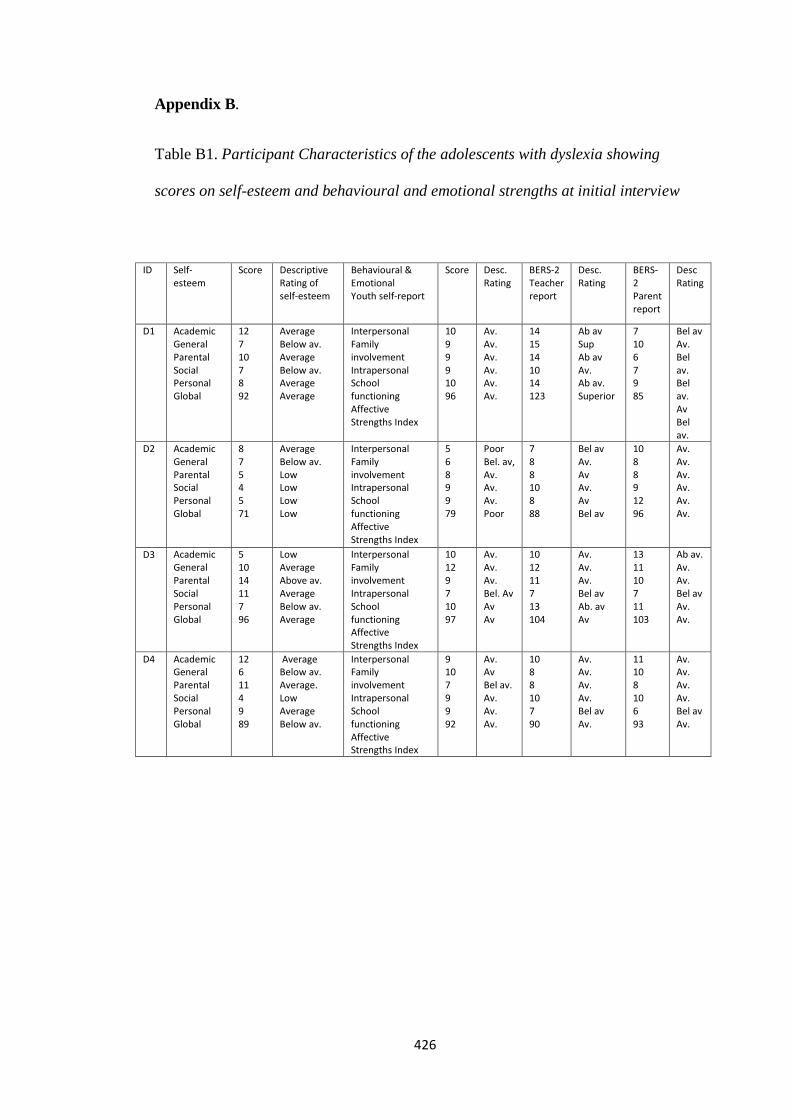
426
Appendix B.
Table B1. Participant Characteristics of the adolescents with dyslexia showing
scores on self-esteem and behavioural and emotional strengths at initial interview
ID Self-esteem
Score Descriptive Rating of self-esteem
Behavioural & Emotional Youth self-report
Score Desc. Rating
BERS-2 Teacher report
Desc. Rating
BERS-2 Parent report
Desc Rating
D1 Academic General Parental Social Personal Global
12 7 10 7 8 92
Average Below av. Average Below av. Average Average
Interpersonal Family involvement Intrapersonal School functioning Affective Strengths Index
10 9 9 9 10 96
Av. Av. Av. Av. Av. Av.
14 15 14 10 14 123
Ab av Sup Ab av Av. Ab av. Superior
7 10 6 7 9 85
Bel av Av. Bel av. Bel av. Av Bel av.
D2 Academic General Parental Social Personal Global
8 7 5 4 5 71
Average Below av. Low Low Low Low
Interpersonal Family involvement Intrapersonal School functioning Affective Strengths Index
5 6 8 9 9 79
Poor Bel. av, Av. Av. Av. Poor
7 8 8 10 8 88
Bel av Av. Av Av. Av Bel av
10 8 8 9 12 96
Av. Av. Av. Av. Av. Av.
D3 Academic General Parental Social Personal Global
5 10 14 11 7 96
Low Average Above av. Average Below av. Average
Interpersonal Family involvement Intrapersonal School functioning Affective Strengths Index
10 12 9 7 10 97
Av. Av. Av. Bel. Av Av Av
10 12 11 7 13 104
Av. Av. Av. Bel av Ab. av Av
13 11 10 7 11 103
Ab av. Av. Av. Bel av Av. Av.
D4 Academic General Parental Social Personal Global
12 6 11 4 9 89
Average Below av. Average. Low Average Below av.
Interpersonal Family involvement Intrapersonal School functioning Affective Strengths Index
9 10 7 9 9 92
Av. Av Bel av. Av. Av. Av.
10 8 8 10 7 90
Av. Av. Av. Av. Bel av Av.
11 10 8 10 6 93
Av. Av. Av. Av. Bel av Av.
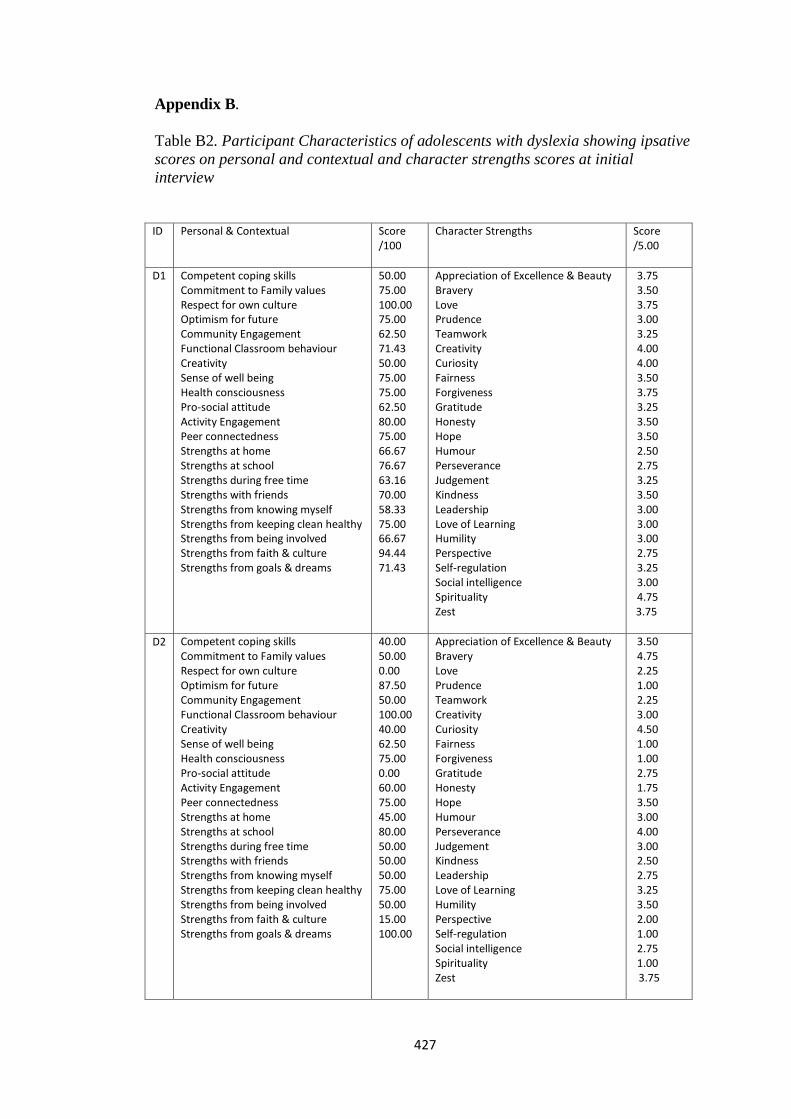
427
Appendix B.
Table B2. Participant Characteristics of adolescents with dyslexia showing ipsative
scores on personal and contextual and character strengths scores at initial
interview
ID Personal & Contextual Score
/100 Character Strengths Score
/5.00
D1 Competent coping skills Commitment to Family values Respect for own culture Optimism for future Community Engagement Functional Classroom behaviour Creativity Sense of well being Health consciousness Pro-social attitude Activity Engagement Peer connectedness Strengths at home Strengths at school Strengths during free time Strengths with friends Strengths from knowing myself Strengths from keeping clean healthy Strengths from being involved Strengths from faith & culture Strengths from goals & dreams
50.00 75.00 100.00 75.00 62.50 71.43 50.00 75.00 75.00 62.50 80.00 75.00 66.67 76.67 63.16 70.00 58.33 75.00 66.67 94.44 71.43
Appreciation of Excellence & Beauty Bravery Love Prudence Teamwork Creativity Curiosity Fairness Forgiveness Gratitude Honesty Hope Humour Perseverance Judgement Kindness Leadership Love of Learning Humility Perspective Self-regulation Social intelligence Spirituality Zest
3.75 3.50 3.75 3.00 3.25 4.00 4.00 3.50 3.75 3.25 3.50 3.50 2.50 2.75 3.25 3.50 3.00 3.00 3.00 2.75 3.25 3.00 4.75
3.75
D2 Competent coping skills Commitment to Family values Respect for own culture Optimism for future Community Engagement Functional Classroom behaviour Creativity Sense of well being Health consciousness Pro-social attitude Activity Engagement Peer connectedness Strengths at home Strengths at school Strengths during free time Strengths with friends Strengths from knowing myself Strengths from keeping clean healthy Strengths from being involved Strengths from faith & culture Strengths from goals & dreams
40.00 50.00 0.00 87.50 50.00 100.00 40.00 62.50 75.00 0.00 60.00 75.00 45.00 80.00 50.00 50.00 50.00 75.00 50.00 15.00 100.00
Appreciation of Excellence & Beauty Bravery Love Prudence Teamwork Creativity Curiosity Fairness Forgiveness Gratitude Honesty Hope Humour Perseverance Judgement Kindness Leadership Love of Learning Humility Perspective Self-regulation Social intelligence Spirituality Zest
3.50 4.75 2.25 1.00 2.25 3.00 4.50 1.00 1.00 2.75 1.75 3.50 3.00 4.00 3.00 2.50 2.75 3.25 3.50 2.00 1.00 2.75 1.00
3.75
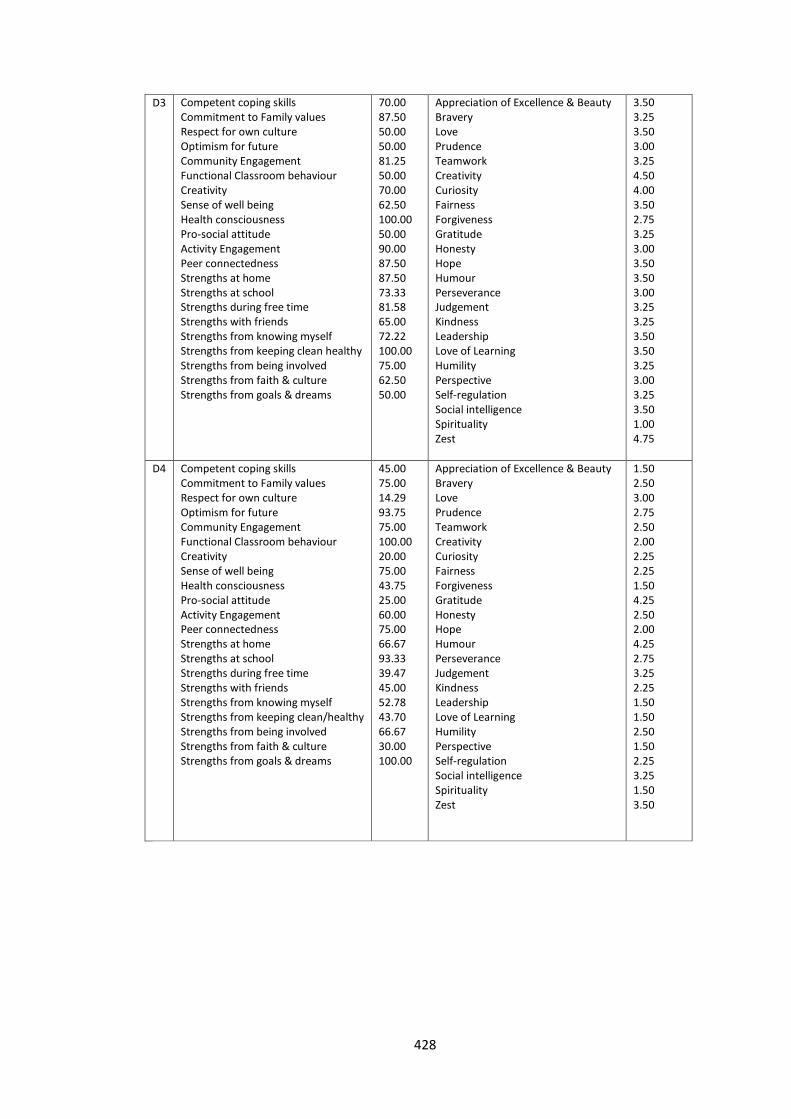
428
D3 Competent coping skills Commitment to Family values Respect for own culture Optimism for future Community Engagement Functional Classroom behaviour Creativity Sense of well being Health consciousness Pro-social attitude Activity Engagement Peer connectedness Strengths at home Strengths at school Strengths during free time Strengths with friends Strengths from knowing myself Strengths from keeping clean healthy Strengths from being involved Strengths from faith & culture Strengths from goals & dreams
70.00 87.50 50.00 50.00 81.25 50.00 70.00 62.50 100.00 50.00 90.00 87.50 87.50 73.33 81.58 65.00 72.22 100.00 75.00 62.50 50.00
Appreciation of Excellence & Beauty Bravery Love Prudence Teamwork Creativity Curiosity Fairness Forgiveness Gratitude Honesty Hope Humour Perseverance Judgement Kindness Leadership Love of Learning Humility Perspective Self-regulation Social intelligence Spirituality Zest
3.50 3.25 3.50 3.00 3.25 4.50 4.00 3.50 2.75 3.25 3.00 3.50 3.50 3.00 3.25 3.25 3.50 3.50 3.25 3.00 3.25 3.50 1.00 4.75
D4 Competent coping skills Commitment to Family values Respect for own culture Optimism for future Community Engagement Functional Classroom behaviour Creativity Sense of well being Health consciousness Pro-social attitude Activity Engagement Peer connectedness Strengths at home Strengths at school Strengths during free time Strengths with friends Strengths from knowing myself Strengths from keeping clean/healthy Strengths from being involved Strengths from faith & culture Strengths from goals & dreams
45.00 75.00 14.29 93.75 75.00 100.00 20.00 75.00 43.75 25.00 60.00 75.00 66.67 93.33 39.47 45.00 52.78 43.70 66.67 30.00 100.00
Appreciation of Excellence & Beauty Bravery Love Prudence Teamwork Creativity Curiosity Fairness Forgiveness Gratitude Honesty Hope Humour Perseverance Judgement Kindness Leadership Love of Learning Humility Perspective Self-regulation Social intelligence Spirituality Zest
1.50 2.50 3.00 2.75 2.50 2.00 2.25 2.25 1.50 4.25 2.50 2.00 4.25 2.75 3.25 2.25 1.50 1.50 2.50 1.50 2.25 3.25 1.50 3.50
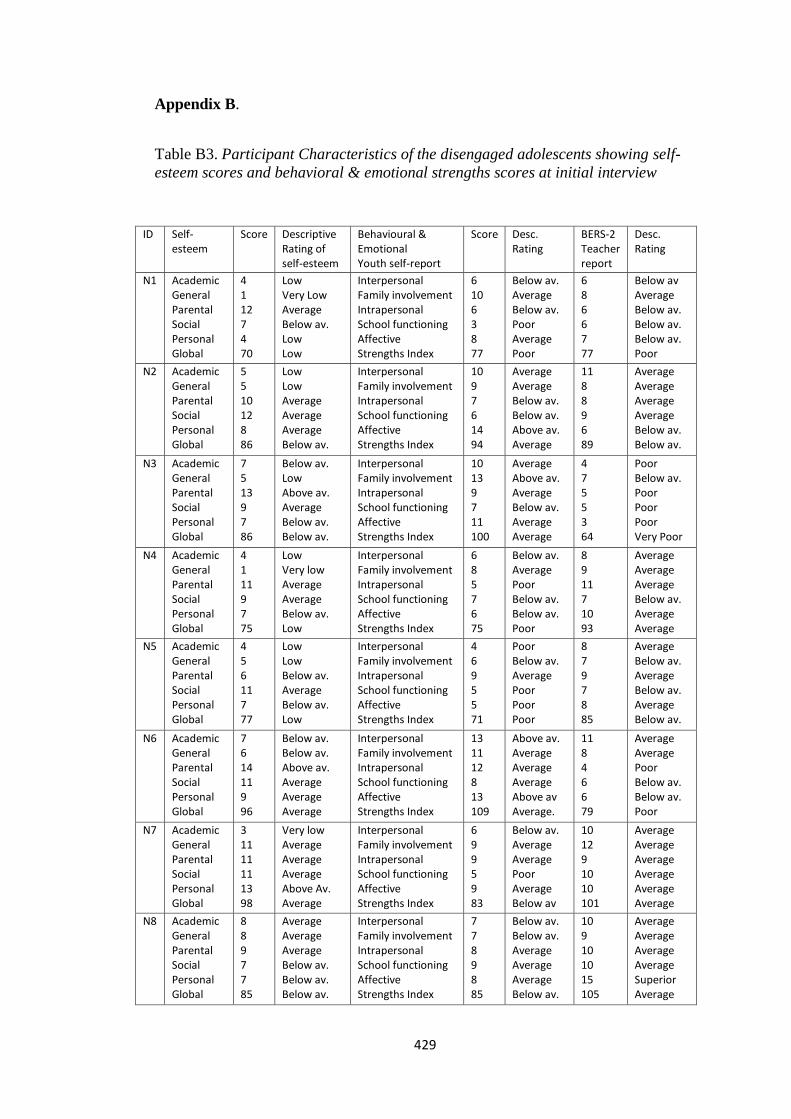
429
Appendix B.
Table B3. Participant Characteristics of the disengaged adolescents showing self-
esteem scores and behavioral & emotional strengths scores at initial interview
ID Self-esteem
Score Descriptive Rating of self-esteem
Behavioural & Emotional Youth self-report
Score Desc. Rating
BERS-2 Teacher report
Desc. Rating
N1 Academic General Parental Social Personal Global
4 1 12 7 4 70
Low Very Low Average Below av. Low Low
Interpersonal Family involvement Intrapersonal School functioning Affective Strengths Index
6 10 6 3 8 77
Below av. Average Below av. Poor Average Poor
6 8 6 6 7 77
Below av Average Below av. Below av. Below av. Poor
N2 Academic General Parental Social Personal Global
5 5 10 12 8 86
Low Low Average Average Average Below av.
Interpersonal Family involvement Intrapersonal School functioning Affective Strengths Index
10 9 7 6 14 94
Average Average Below av. Below av. Above av. Average
11 8 8 9 6 89
Average Average Average Average Below av. Below av.
N3 Academic General Parental Social Personal Global
7 5 13 9 7 86
Below av. Low Above av. Average Below av. Below av.
Interpersonal Family involvement Intrapersonal School functioning Affective Strengths Index
10 13 9 7 11 100
Average Above av. Average Below av. Average Average
4 7 5 5 3 64
Poor Below av. Poor Poor Poor Very Poor
N4 Academic General Parental Social Personal Global
4 1 11 9 7 75
Low Very low Average Average Below av. Low
Interpersonal Family involvement Intrapersonal School functioning Affective Strengths Index
6 8 5 7 6 75
Below av. Average Poor Below av. Below av. Poor
8 9 11 7 10 93
Average Average Average Below av. Average Average
N5 Academic General Parental Social Personal Global
4 5 6 11 7 77
Low Low Below av. Average Below av. Low
Interpersonal Family involvement Intrapersonal School functioning Affective Strengths Index
4 6 9 5 5 71
Poor Below av. Average Poor Poor Poor
8 7 9 7 8 85
Average Below av. Average Below av. Average Below av.
N6 Academic General Parental Social Personal Global
7 6 14 11 9 96
Below av. Below av. Above av. Average Average Average
Interpersonal Family involvement Intrapersonal School functioning Affective Strengths Index
13 11 12 8 13 109
Above av. Average Average Average Above av Average.
11 8 4 6 6 79
Average Average Poor Below av. Below av. Poor
N7 Academic General Parental Social Personal Global
3 11 11 11 13 98
Very low Average Average Average Above Av. Average
Interpersonal Family involvement Intrapersonal School functioning Affective Strengths Index
6 9 9 5 9 83
Below av. Average Average Poor Average Below av
10 12 9 10 10 101
Average Average Average Average Average Average
N8 Academic General Parental Social Personal Global
8 8 9 7 7 85
Average Average Average Below av. Below av. Below av.
Interpersonal Family involvement Intrapersonal School functioning Affective Strengths Index
7 7 8 9 8 85
Below av. Below av. Average Average Average Below av.
10 9 10 10 15 105
Average Average Average Average Superior Average
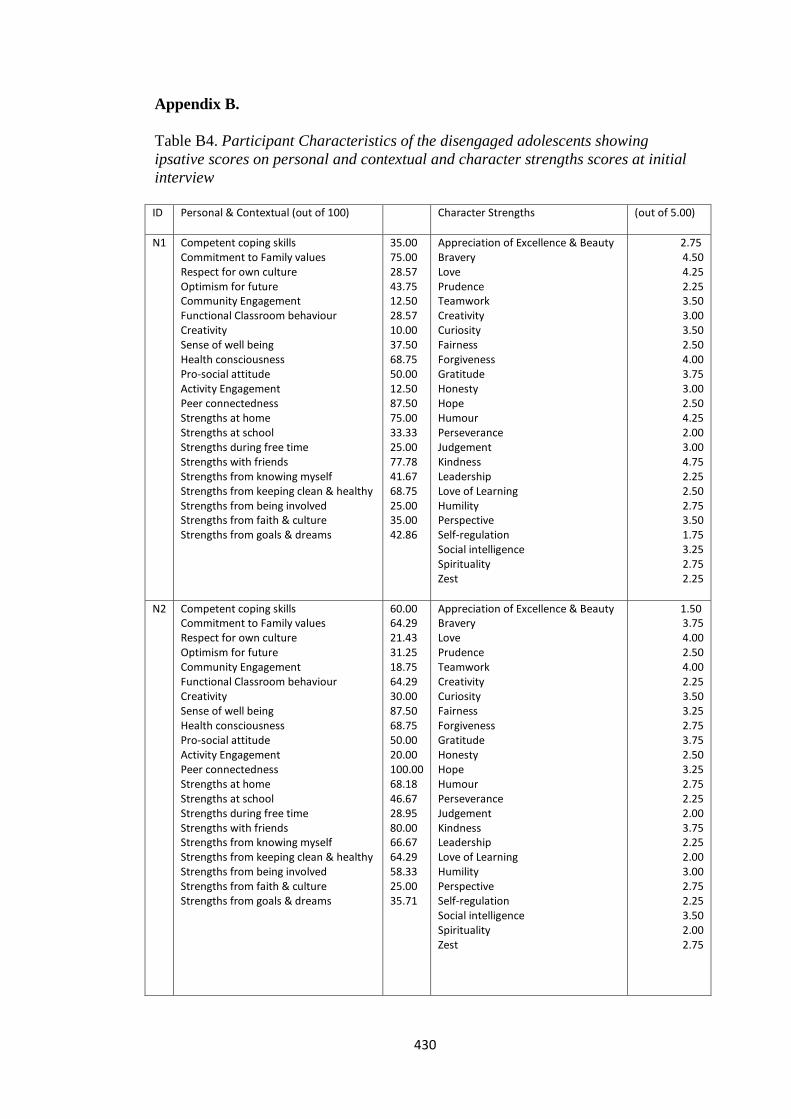
430
Appendix B.
Table B4. Participant Characteristics of the disengaged adolescents showing
ipsative scores on personal and contextual and character strengths scores at initial
interview
ID Personal & Contextual (out of 100) Character Strengths (out of 5.00)
N1 Competent coping skills Commitment to Family values Respect for own culture Optimism for future Community Engagement Functional Classroom behaviour Creativity Sense of well being Health consciousness Pro-social attitude Activity Engagement Peer connectedness Strengths at home Strengths at school Strengths during free time Strengths with friends Strengths from knowing myself Strengths from keeping clean & healthy Strengths from being involved Strengths from faith & culture Strengths from goals & dreams
35.00 75.00 28.57 43.75 12.50 28.57 10.00 37.50 68.75 50.00 12.50 87.50 75.00 33.33 25.00 77.78 41.67 68.75 25.00 35.00 42.86
Appreciation of Excellence & Beauty Bravery Love Prudence Teamwork Creativity Curiosity Fairness Forgiveness Gratitude Honesty Hope Humour Perseverance Judgement Kindness Leadership Love of Learning Humility Perspective Self-regulation Social intelligence Spirituality Zest
2.75 4.50 4.25 2.25 3.50 3.00 3.50 2.50 4.00 3.75 3.00 2.50 4.25 2.00 3.00 4.75 2.25 2.50 2.75 3.50 1.75 3.25 2.75 2.25
N2 Competent coping skills Commitment to Family values Respect for own culture Optimism for future Community Engagement Functional Classroom behaviour Creativity Sense of well being Health consciousness Pro-social attitude Activity Engagement Peer connectedness Strengths at home Strengths at school Strengths during free time Strengths with friends Strengths from knowing myself Strengths from keeping clean & healthy Strengths from being involved Strengths from faith & culture Strengths from goals & dreams
60.00 64.29 21.43 31.25 18.75 64.29 30.00 87.50 68.75 50.00 20.00 100.00 68.18 46.67 28.95 80.00 66.67 64.29 58.33 25.00 35.71
Appreciation of Excellence & Beauty Bravery Love Prudence Teamwork Creativity Curiosity Fairness Forgiveness Gratitude Honesty Hope Humour Perseverance Judgement Kindness Leadership Love of Learning Humility Perspective Self-regulation Social intelligence Spirituality Zest
1.50 3.75 4.00 2.50 4.00 2.25 3.50 3.25 2.75 3.75 2.50 3.25 2.75 2.25 2.00 3.75 2.25 2.00 3.00 2.75 2.25 3.50 2.00 2.75
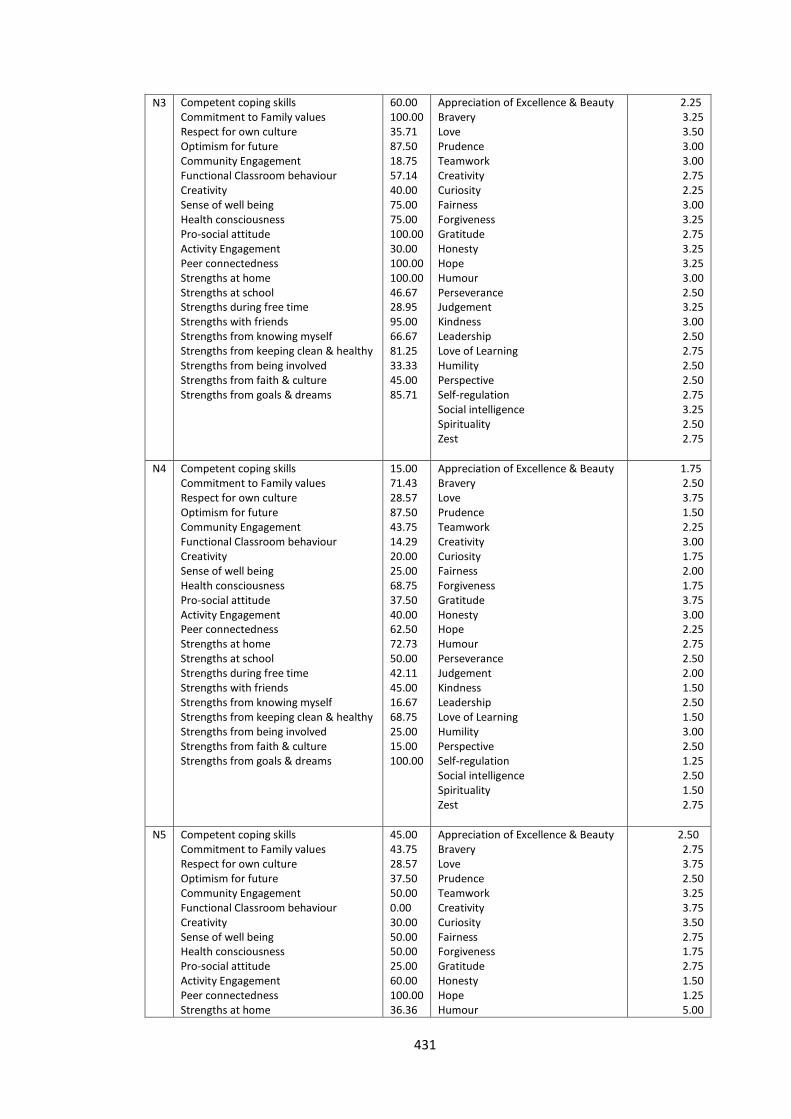
431
N3 Competent coping skills Commitment to Family values Respect for own culture Optimism for future Community Engagement Functional Classroom behaviour Creativity Sense of well being Health consciousness Pro-social attitude Activity Engagement Peer connectedness Strengths at home Strengths at school Strengths during free time Strengths with friends Strengths from knowing myself Strengths from keeping clean & healthy Strengths from being involved Strengths from faith & culture Strengths from goals & dreams
60.00 100.00 35.71 87.50 18.75 57.14 40.00 75.00 75.00 100.00 30.00 100.00 100.00 46.67 28.95 95.00 66.67 81.25 33.33 45.00 85.71
Appreciation of Excellence & Beauty Bravery Love Prudence Teamwork Creativity Curiosity Fairness Forgiveness Gratitude Honesty Hope Humour Perseverance Judgement Kindness Leadership Love of Learning Humility Perspective Self-regulation Social intelligence Spirituality Zest
2.25 3.25 3.50 3.00 3.00 2.75 2.25 3.00 3.25 2.75 3.25 3.25 3.00 2.50 3.25 3.00 2.50 2.75 2.50 2.50 2.75 3.25 2.50 2.75
N4 Competent coping skills Commitment to Family values Respect for own culture Optimism for future Community Engagement Functional Classroom behaviour Creativity Sense of well being Health consciousness Pro-social attitude Activity Engagement Peer connectedness Strengths at home Strengths at school Strengths during free time Strengths with friends Strengths from knowing myself Strengths from keeping clean & healthy Strengths from being involved Strengths from faith & culture Strengths from goals & dreams
15.00 71.43 28.57 87.50 43.75 14.29 20.00 25.00 68.75 37.50 40.00 62.50 72.73 50.00 42.11 45.00 16.67 68.75 25.00 15.00 100.00
Appreciation of Excellence & Beauty Bravery Love Prudence Teamwork Creativity Curiosity Fairness Forgiveness Gratitude Honesty Hope Humour Perseverance Judgement Kindness Leadership Love of Learning Humility Perspective Self-regulation Social intelligence Spirituality Zest
1.75 2.50 3.75 1.50 2.25 3.00 1.75 2.00 1.75 3.75 3.00 2.25 2.75 2.50 2.00 1.50 2.50 1.50 3.00 2.50 1.25 2.50 1.50 2.75
N5 Competent coping skills Commitment to Family values Respect for own culture Optimism for future Community Engagement Functional Classroom behaviour Creativity Sense of well being Health consciousness Pro-social attitude Activity Engagement Peer connectedness Strengths at home
45.00 43.75 28.57 37.50 50.00 0.00 30.00 50.00 50.00 25.00 60.00 100.00 36.36
Appreciation of Excellence & Beauty Bravery Love Prudence Teamwork Creativity Curiosity Fairness Forgiveness Gratitude Honesty Hope Humour
2.50 2.75 3.75 2.50 3.25 3.75 3.50 2.75 1.75 2.75 1.50 1.25 5.00
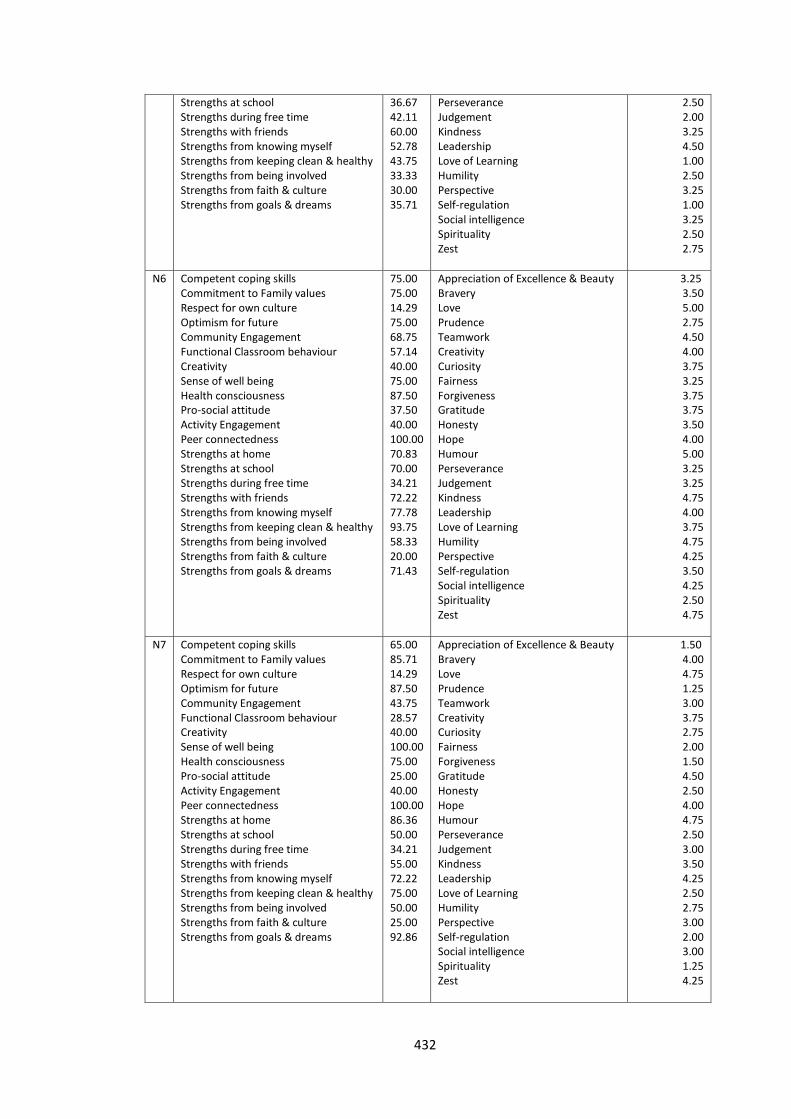
432
Strengths at school Strengths during free time Strengths with friends Strengths from knowing myself Strengths from keeping clean & healthy Strengths from being involved Strengths from faith & culture Strengths from goals & dreams
36.67 42.11 60.00 52.78 43.75 33.33 30.00 35.71
Perseverance Judgement Kindness Leadership Love of Learning Humility Perspective Self-regulation Social intelligence Spirituality Zest
2.50 2.00 3.25 4.50 1.00 2.50 3.25 1.00 3.25 2.50 2.75
N6 Competent coping skills Commitment to Family values Respect for own culture Optimism for future Community Engagement Functional Classroom behaviour Creativity Sense of well being Health consciousness Pro-social attitude Activity Engagement Peer connectedness Strengths at home Strengths at school Strengths during free time Strengths with friends Strengths from knowing myself Strengths from keeping clean & healthy Strengths from being involved Strengths from faith & culture Strengths from goals & dreams
75.00 75.00 14.29 75.00 68.75 57.14 40.00 75.00 87.50 37.50 40.00 100.00 70.83 70.00 34.21 72.22 77.78 93.75 58.33 20.00 71.43
Appreciation of Excellence & Beauty Bravery Love Prudence Teamwork Creativity Curiosity Fairness Forgiveness Gratitude Honesty Hope Humour Perseverance Judgement Kindness Leadership Love of Learning Humility Perspective Self-regulation Social intelligence Spirituality Zest
3.25 3.50 5.00 2.75 4.50 4.00 3.75 3.25 3.75 3.75 3.50 4.00 5.00 3.25 3.25 4.75 4.00 3.75 4.75 4.25 3.50 4.25 2.50 4.75
N7 Competent coping skills Commitment to Family values Respect for own culture Optimism for future Community Engagement Functional Classroom behaviour Creativity Sense of well being Health consciousness Pro-social attitude Activity Engagement Peer connectedness Strengths at home Strengths at school Strengths during free time Strengths with friends Strengths from knowing myself Strengths from keeping clean & healthy Strengths from being involved Strengths from faith & culture Strengths from goals & dreams
65.00 85.71 14.29 87.50 43.75 28.57 40.00 100.00 75.00 25.00 40.00 100.00 86.36 50.00 34.21 55.00 72.22 75.00 50.00 25.00 92.86
Appreciation of Excellence & Beauty Bravery Love Prudence Teamwork Creativity Curiosity Fairness Forgiveness Gratitude Honesty Hope Humour Perseverance Judgement Kindness Leadership Love of Learning Humility Perspective Self-regulation Social intelligence Spirituality Zest
1.50 4.00 4.75 1.25 3.00 3.75 2.75 2.00 1.50 4.50 2.50 4.00 4.75 2.50 3.00 3.50 4.25 2.50 2.75 3.00 2.00 3.00 1.25 4.25
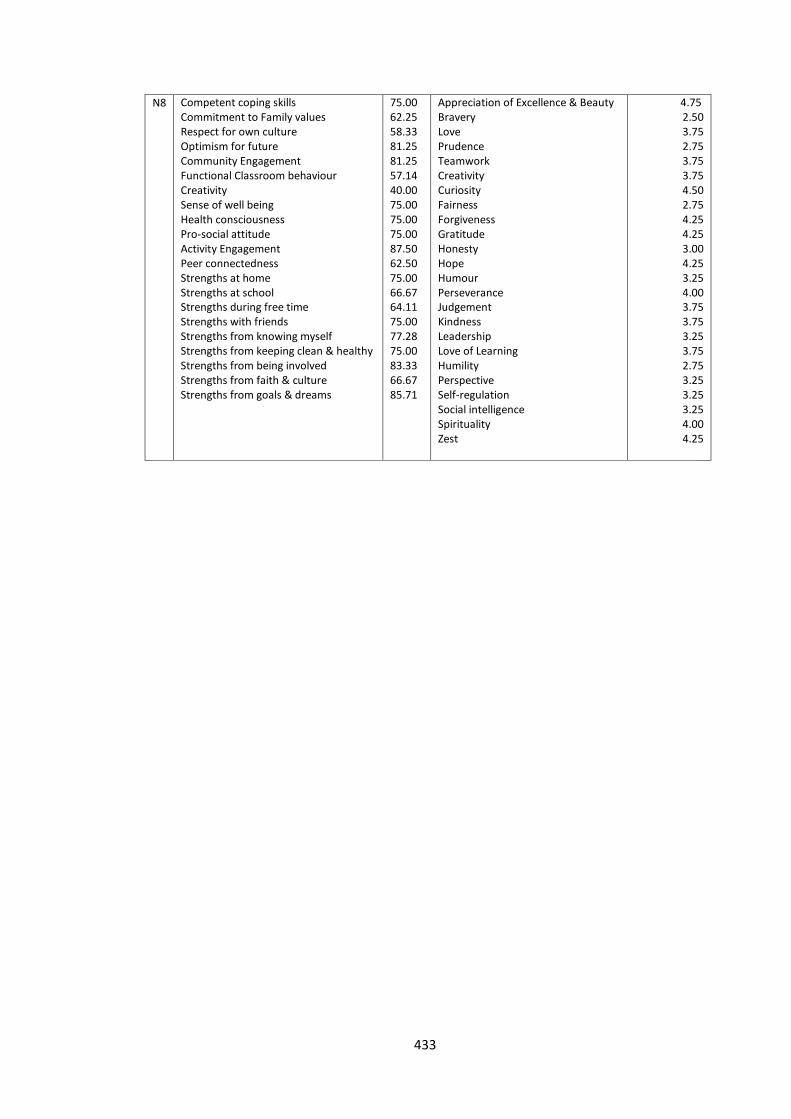
433
N8 Competent coping skills Commitment to Family values Respect for own culture Optimism for future Community Engagement Functional Classroom behaviour Creativity Sense of well being Health consciousness Pro-social attitude Activity Engagement Peer connectedness Strengths at home Strengths at school Strengths during free time Strengths with friends Strengths from knowing myself Strengths from keeping clean & healthy Strengths from being involved Strengths from faith & culture Strengths from goals & dreams
75.00 62.25 58.33 81.25 81.25 57.14 40.00 75.00 75.00 75.00 87.50 62.50 75.00 66.67 64.11 75.00 77.28 75.00 83.33 66.67 85.71
Appreciation of Excellence & Beauty Bravery Love Prudence Teamwork Creativity Curiosity Fairness Forgiveness Gratitude Honesty Hope Humour Perseverance Judgement Kindness Leadership Love of Learning Humility Perspective Self-regulation Social intelligence Spirituality Zest
4.75 2.50 3.75 2.75 3.75 3.75 4.50 2.75 4.25 4.25 3.00 4.25 3.25 4.00 3.75 3.75 3.25 3.75 2.75 3.25 3.25 3.25 4.00 4.25
434
Appendix C.
Life Story Interview Script
This is an interview about the story of your life.
I am interested in hearing your story, including parts of the past as you remember
them and the future as you imagine it. I will ask you to focus on a few key things in
your past life and your future hopes There are no right or wrong answers to my
questions. I will guide you through the interview so that we finish it in about 45-60
minutes. It shall be audiotaped and only I will hear this later to transcribe it then I
will destroy it. I will refer to you in this interview by the name you have chosen.
The interview is for research purposes only, and its main goal is simply to hear your
story. Everything you say is voluntary, anonymous, and confidential. You can ask
me if you don’t understand a question or if you don’t want to answer it or if you
want to stop the interview. You can withdraw from the interview at any point. I
think you will enjoy the interview. Do you have any questions?
A. Life Chapters
Please begin by thinking about your life as if it were a book.
B. Key Scenes (moments) in the Life Story
Focus in on a few key scenes that stand out in the story. A key scene to be a moment
in your life story that stands out for a particular reason – perhaps because it was
especially good or bad, particularly vivid, important, or memorable.
1. High point.
Please describe an episode in your life that stands out as an especially positive
experience- happy, joyous, exciting, or wonderful.
Who is there, what did you do, how did you feel, what strength is revealed? Do you
see this strength often and how does having this strength make you feel?
2. Low point.
The second scene is the opposite of the first. Thinking back over your entire life,
please identify a scene that stands out as a low point in your life story.
Who is there, what did you do, how did you feel, what strength is revealed? Do you
see this strength often and how does having this strength make you feel?
3. Turning point.
Please try and identify certain key moments that stands out as turning points?
Who is there, what did you do, how did you feel, what strength is revealed? Do you
see this strength often and how does having this strength make you feel?
435
4. Positive childhood memory.
Please tell me of a very positive, happy memory from your early years.
Who is there, what did you do, how did you feel, what strength is revealed? Do you
see this strength often and how does having this strength make you feel?
5. Negative childhood memory.
Please tell me of a very negative, unhappy memory, perhaps entailing sadness or
fear.
Who is there, what did you do, how did you feel, what strength is revealed? Do you
see this strength often and how does having this strength make you feel?
Now, we’re going to talk about the future.
C. Future Script
1. The next chapter.
Please describe what you see to be the next chapter in your life.
2. Dreams, hopes, and plans for the future.
Please describe your plans, dreams, or hopes for the future.
3. Life project.
Do you have a project in life that you are working on?
D. Challenge.
What is the greatest single challenge you have faced in your life? How did the
challenge develop? How did you a deal with this challenge What strength did you
reveal through this process?
E. Personal Ideology - About you
1. Religious/ethical values.
Please describe in a nutshell your religious beliefs and values. What is your overall
ethical or moral approach to life?
2. Political/social values.
436
Do you have a particular political point of view? Is there a social issue you feel
strongly about?
3. Change, development of religious and political views.
Have these views changed over the years?
4. Single value.
What is the most important value in human living?
F. Strength themes
1. What are you doing when you are so absorbed that you lose track of time?
2. In what kind of activities do you make the boldest choices and take the greatest
risks?
G. Life Theme
What is the major central theme in your life story?
Change and continuity -Do think you have changed since 8 years old?
Thank you for this interview now
H. Reflection
What were your thoughts and feelings during the interview?
How do you think this interview has affected you?
Do you have any other comments about the interview process?
I hope it has been an enjoyable process.
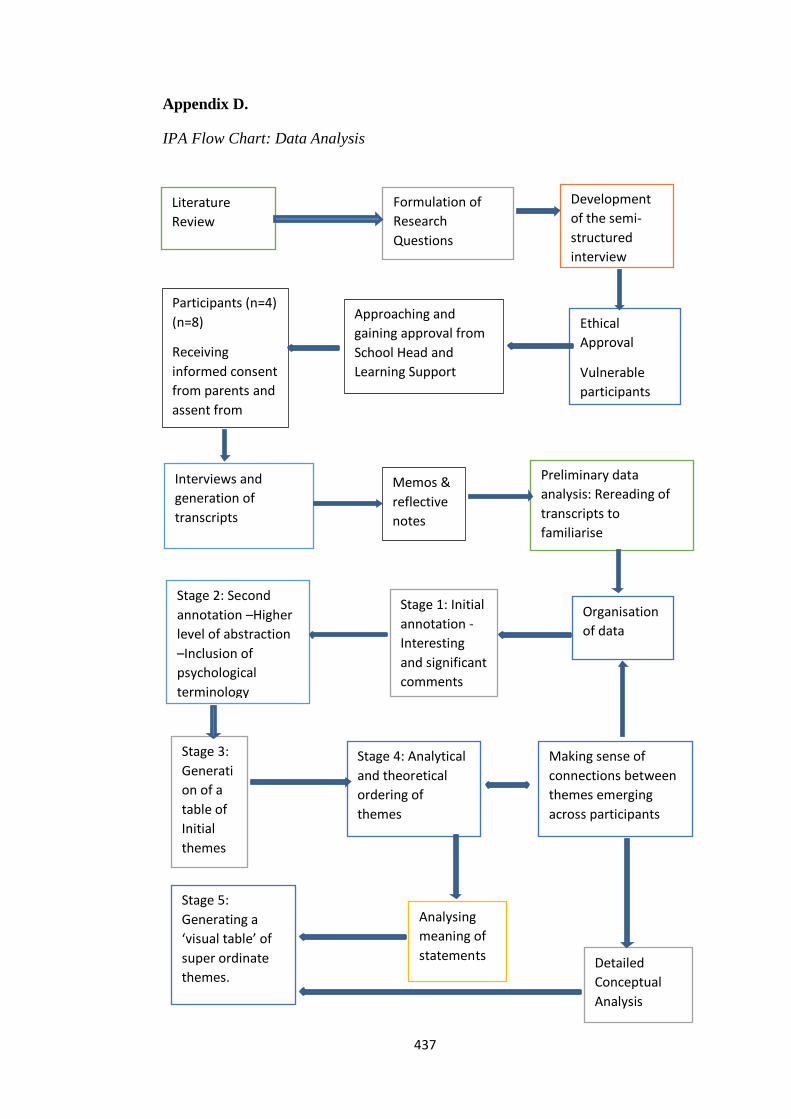
437
Appendix D.
IPA Flow Chart: Data Analysis
Literature
Review
Formulation of
Research
Questions
Development
of the semi-
structured
interview
schedule
Ethical
Approval
Vulnerable
participants
Approaching and
gaining approval from
School Head and
Learning Support
Participants (n=4)
(n=8)
Receiving
informed consent
from parents and
assent from
students.
Consent to
audiotape
sessions Interviews and
generation of
transcripts
Memos &
reflective
notes
Preliminary data
analysis: Rereading of
transcripts to
familiarise
Organisation
of data
Stage 1: Initial
annotation -
Interesting
and significant
comments
Stage 2: Second
annotation –Higher
level of abstraction
–Inclusion of
psychological
terminology
Stage 3:
Generati
on of a
table of
Initial
themes
Stage 4: Analytical
and theoretical
ordering of
themes
Making sense of
connections between
themes emerging
across participants
Analysing
meaning of
statements Detailed
Conceptual
Analysis
Stage 5:
Generating a
‘visual table’ of
super ordinate
themes.
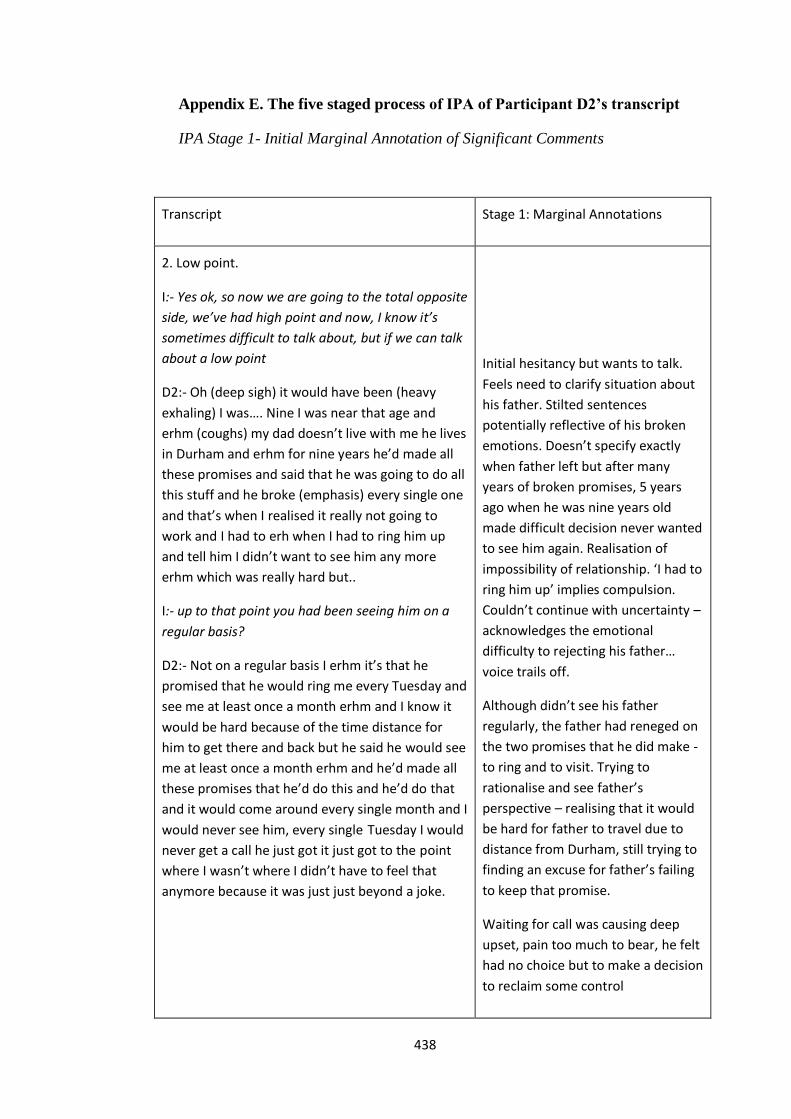
438
Appendix E. The five staged process of IPA of Participant D2’s transcript
IPA Stage 1- Initial Marginal Annotation of Significant Comments
Transcript Stage 1: Marginal Annotations
2. Low point.
I:- Yes ok, so now we are going to the total opposite
side, we’ve had high point and now, I know it’s
sometimes difficult to talk about, but if we can talk
about a low point
D2:- Oh (deep sigh) it would have been (heavy
exhaling) I was…. Nine I was near that age and
erhm (coughs) my dad doesn’t live with me he lives
in Durham and erhm for nine years he’d made all
these promises and said that he was going to do all
this stuff and he broke (emphasis) every single one
and that’s when I realised it really not going to
work and I had to erh when I had to ring him up
and tell him I didn’t want to see him any more
erhm which was really hard but..
I:- up to that point you had been seeing him on a
regular basis?
D2:- Not on a regular basis I erhm it’s that he
promised that he would ring me every Tuesday and
see me at least once a month erhm and I know it
would be hard because of the time distance for
him to get there and back but he said he would see
me at least once a month erhm and he’d made all
these promises that he’d do this and he’d do that
and it would come around every single month and I
would never see him, every single Tuesday I would
never get a call he just got it just got to the point
where I wasn’t where I didn’t have to feel that
anymore because it was just just beyond a joke.
Initial hesitancy but wants to talk.
Feels need to clarify situation about
his father. Stilted sentences
potentially reflective of his broken
emotions. Doesn’t specify exactly
when father left but after many
years of broken promises, 5 years
ago when he was nine years old
made difficult decision never wanted
to see him again. Realisation of
impossibility of relationship. ‘I had to
ring him up’ implies compulsion.
Couldn’t continue with uncertainty –
acknowledges the emotional
difficulty to rejecting his father…
voice trails off.
Although didn’t see his father
regularly, the father had reneged on
the two promises that he did make -
to ring and to visit. Trying to
rationalise and see father’s
perspective – realising that it would
be hard for father to travel due to
distance from Durham, still trying to
finding an excuse for father’s failing
to keep that promise.
Waiting for call was causing deep
upset, pain too much to bear, he felt
had no choice but to make a decision
to reclaim some control
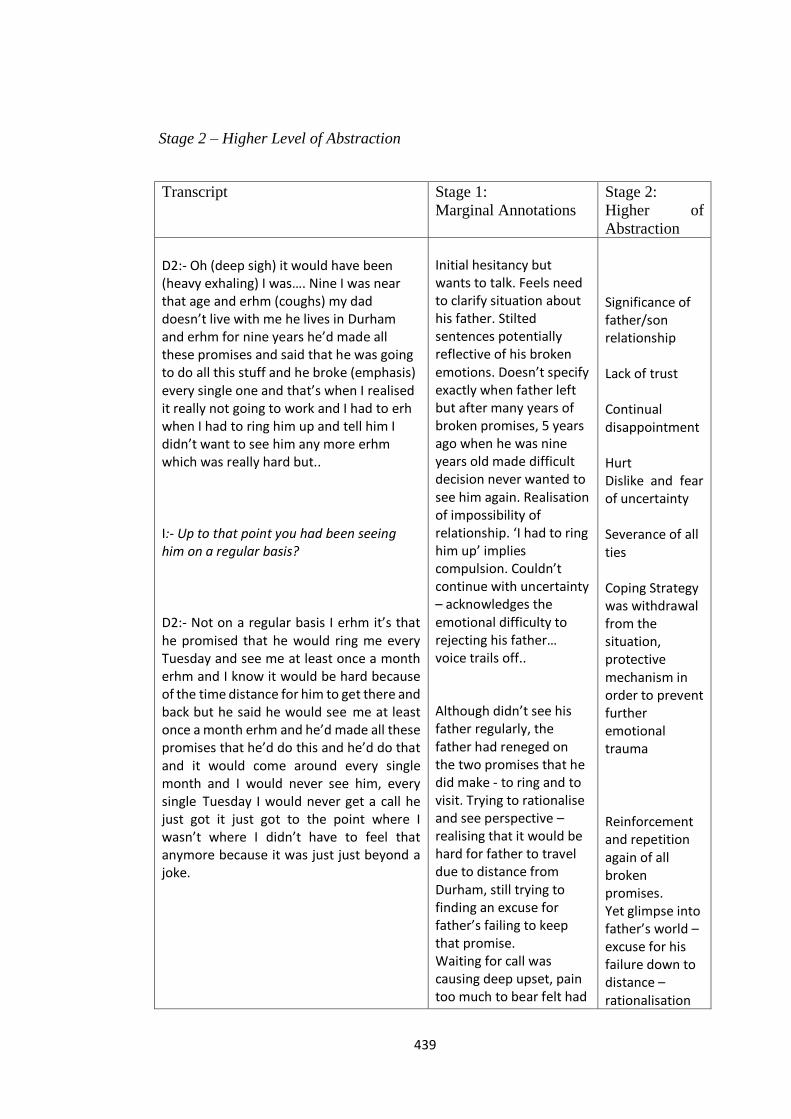
439
Stage 2 – Higher Level of Abstraction
Transcript Stage 1:
Marginal Annotations
Stage 2:
Higher of
Abstraction
D2:- Oh (deep sigh) it would have been (heavy exhaling) I was…. Nine I was near that age and erhm (coughs) my dad doesn’t live with me he lives in Durham and erhm for nine years he’d made all these promises and said that he was going to do all this stuff and he broke (emphasis) every single one and that’s when I realised it really not going to work and I had to erh when I had to ring him up and tell him I didn’t want to see him any more erhm which was really hard but.. I:- Up to that point you had been seeing him on a regular basis? D2:- Not on a regular basis I erhm it’s that he promised that he would ring me every Tuesday and see me at least once a month erhm and I know it would be hard because of the time distance for him to get there and back but he said he would see me at least once a month erhm and he’d made all these promises that he’d do this and he’d do that and it would come around every single month and I would never see him, every single Tuesday I would never get a call he just got it just got to the point where I wasn’t where I didn’t have to feel that anymore because it was just just beyond a joke.
Initial hesitancy but wants to talk. Feels need to clarify situation about his father. Stilted sentences potentially reflective of his broken emotions. Doesn’t specify exactly when father left but after many years of broken promises, 5 years ago when he was nine years old made difficult decision never wanted to see him again. Realisation of impossibility of relationship. ‘I had to ring him up’ implies compulsion. Couldn’t continue with uncertainty – acknowledges the emotional difficulty to rejecting his father… voice trails off..
Although didn’t see his father regularly, the father had reneged on the two promises that he did make - to ring and to visit. Trying to rationalise and see perspective – realising that it would be hard for father to travel due to distance from Durham, still trying to finding an excuse for father’s failing to keep that promise. Waiting for call was causing deep upset, pain too much to bear felt had
Significance of father/son relationship Lack of trust Continual disappointment Hurt Dislike and fear of uncertainty Severance of all ties Coping Strategy was withdrawal from the situation, protective mechanism in order to prevent further emotional trauma
Reinforcement and repetition again of all broken promises. Yet glimpse into father’s world – excuse for his failure down to distance – rationalisation
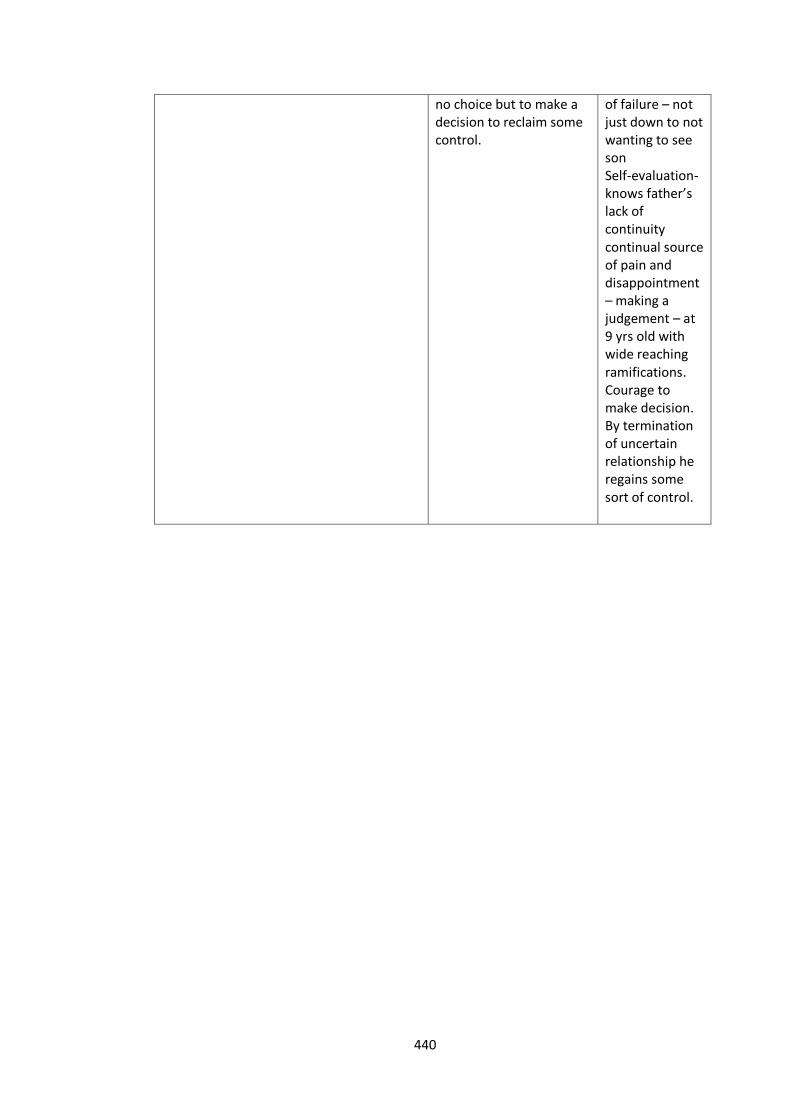
440
no choice but to make a decision to reclaim some control.
of failure – not just down to not wanting to see son Self-evaluation- knows father’s lack of continuity continual source of pain and disappointment – making a judgement – at 9 yrs old with wide reaching ramifications. Courage to make decision. By termination of uncertain relationship he regains some sort of control.
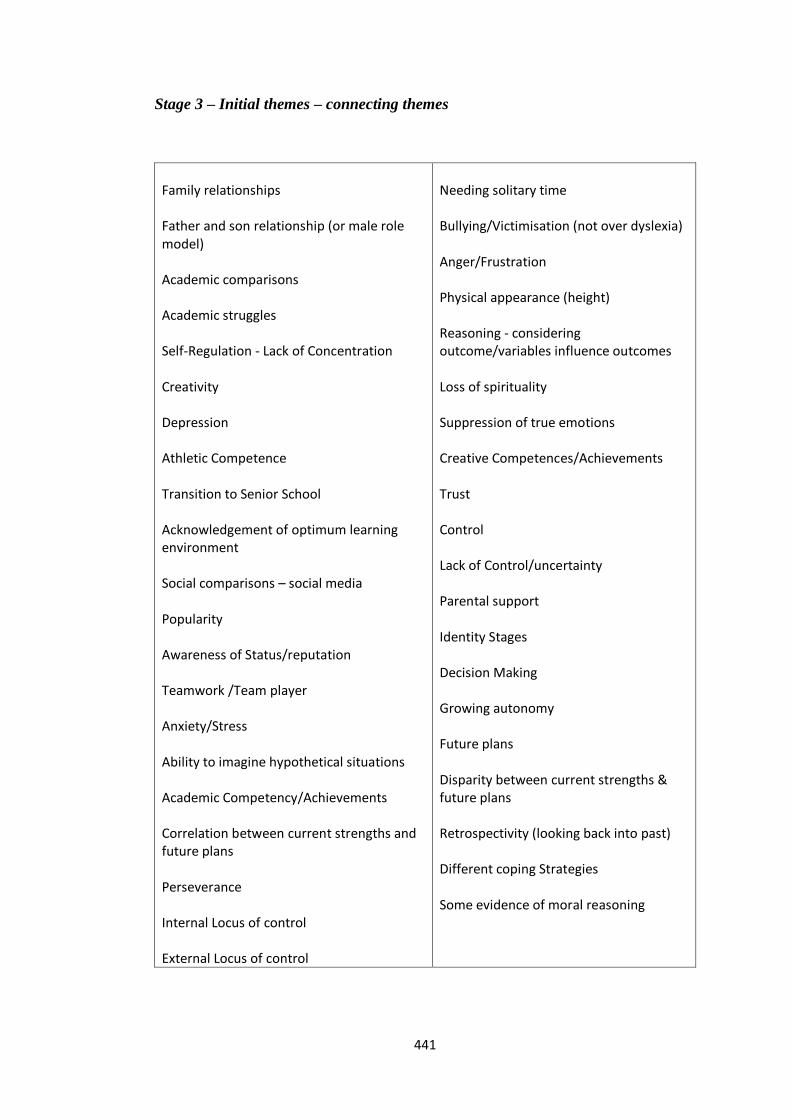
441
Stage 3 – Initial themes – connecting themes
Family relationships Father and son relationship (or male role model) Academic comparisons Academic struggles Self-Regulation - Lack of Concentration Creativity Depression Athletic Competence Transition to Senior School Acknowledgement of optimum learning environment Social comparisons – social media Popularity Awareness of Status/reputation Teamwork /Team player Anxiety/Stress Ability to imagine hypothetical situations Academic Competency/Achievements Correlation between current strengths and future plans Perseverance Internal Locus of control External Locus of control
Needing solitary time Bullying/Victimisation (not over dyslexia) Anger/Frustration Physical appearance (height) Reasoning - considering outcome/variables influence outcomes Loss of spirituality Suppression of true emotions Creative Competences/Achievements Trust Control Lack of Control/uncertainty Parental support Identity Stages Decision Making Growing autonomy Future plans Disparity between current strengths & future plans Retrospectivity (looking back into past) Different coping Strategies Some evidence of moral reasoning
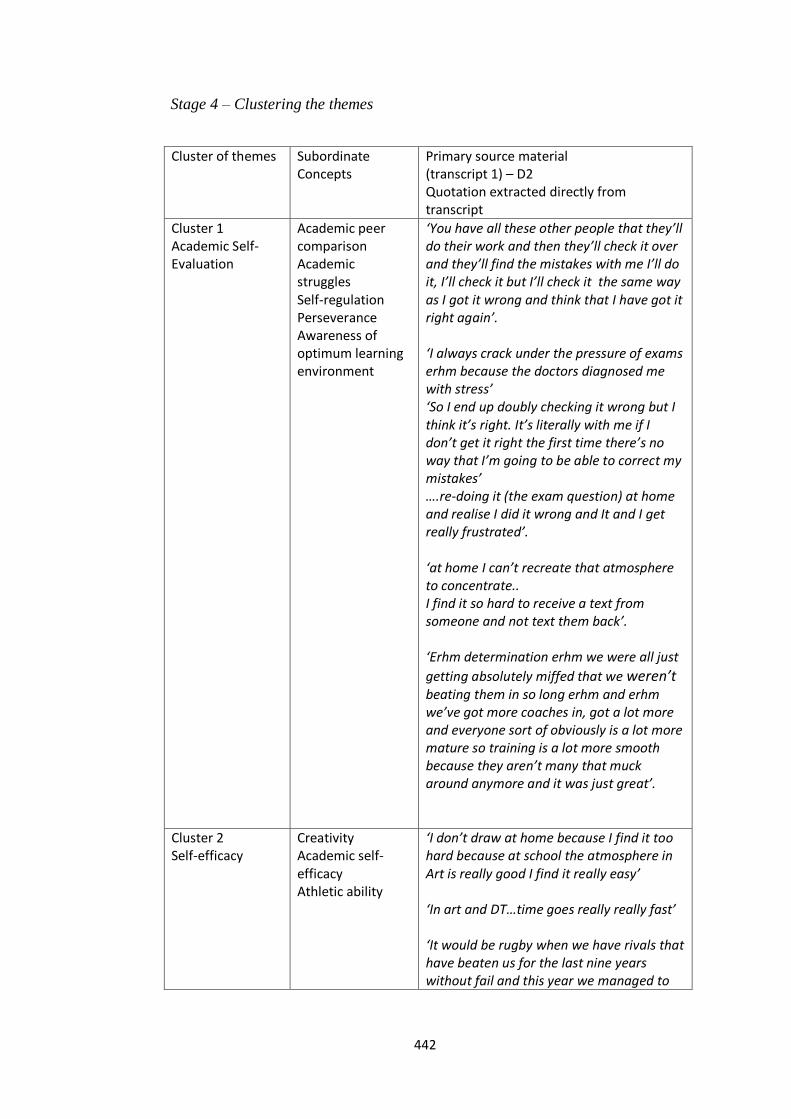
442
Stage 4 – Clustering the themes
Cluster of themes Subordinate Concepts
Primary source material (transcript 1) – D2 Quotation extracted directly from transcript
Cluster 1 Academic Self- Evaluation
Academic peer comparison Academic struggles Self-regulation Perseverance Awareness of optimum learning environment
‘You have all these other people that they’ll do their work and then they’ll check it over and they’ll find the mistakes with me I’ll do it, I’ll check it but I’ll check it the same way as I got it wrong and think that I have got it right again’. ‘I always crack under the pressure of exams erhm because the doctors diagnosed me with stress’ ‘So I end up doubly checking it wrong but I think it’s right. It’s literally with me if I don’t get it right the first time there’s no way that I’m going to be able to correct my mistakes’ ….re-doing it (the exam question) at home and realise I did it wrong and It and I get really frustrated’. ‘at home I can’t recreate that atmosphere to concentrate.. I find it so hard to receive a text from someone and not text them back’. ‘Erhm determination erhm we were all just
getting absolutely miffed that we weren’t beating them in so long erhm and erhm we’ve got more coaches in, got a lot more and everyone sort of obviously is a lot more mature so training is a lot more smooth because they aren’t many that muck around anymore and it was just great’.
Cluster 2 Self-efficacy
Creativity Academic self-efficacy Athletic ability
‘I don’t draw at home because I find it too hard because at school the atmosphere in Art is really good I find it really easy’ ‘In art and DT…time goes really really fast’ ‘It would be rugby when we have rivals that have beaten us for the last nine years without fail and this year we managed to
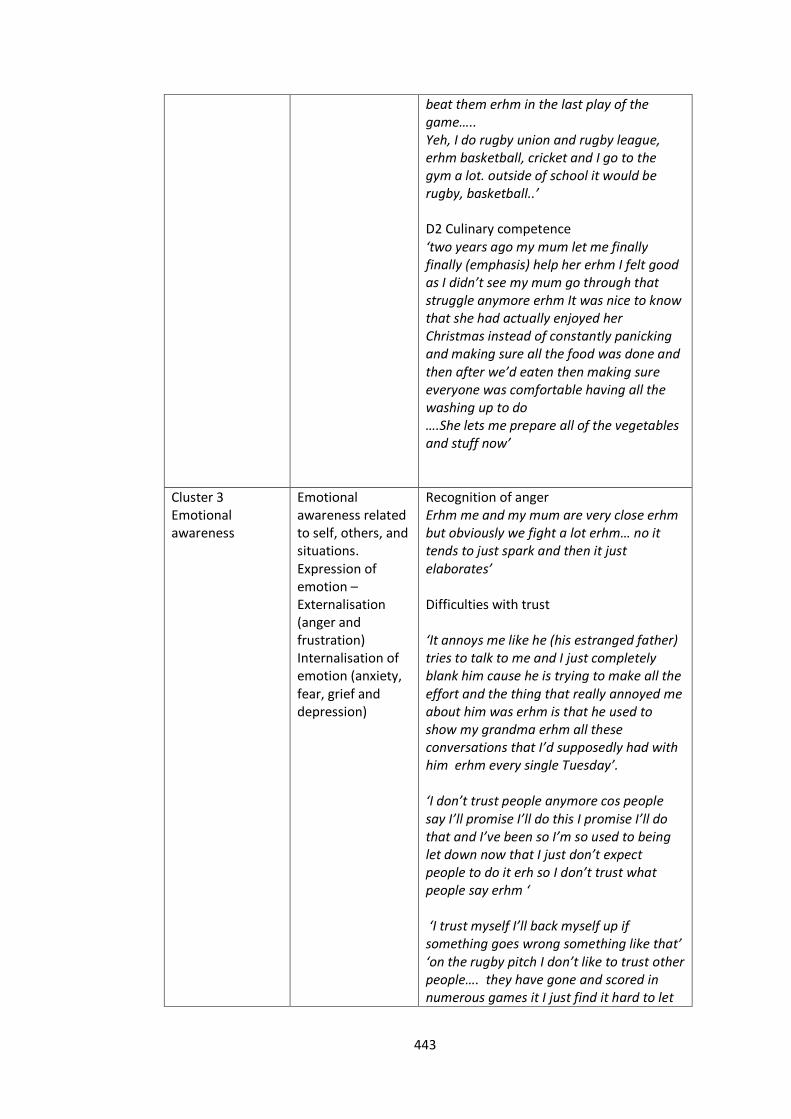
443
beat them erhm in the last play of the game….. Yeh, I do rugby union and rugby league, erhm basketball, cricket and I go to the gym a lot. outside of school it would be rugby, basketball..’
D2 Culinary competence ‘two years ago my mum let me finally finally (emphasis) help her erhm I felt good as I didn’t see my mum go through that struggle anymore erhm It was nice to know that she had actually enjoyed her Christmas instead of constantly panicking and making sure all the food was done and then after we’d eaten then making sure everyone was comfortable having all the washing up to do ….She lets me prepare all of the vegetables and stuff now’
Cluster 3 Emotional awareness
Emotional awareness related to self, others, and situations. Expression of emotion – Externalisation (anger and frustration) Internalisation of emotion (anxiety, fear, grief and depression)
Recognition of anger Erhm me and my mum are very close erhm but obviously we fight a lot erhm… no it tends to just spark and then it just elaborates’ Difficulties with trust ‘It annoys me like he (his estranged father) tries to talk to me and I just completely blank him cause he is trying to make all the effort and the thing that really annoyed me about him was erhm is that he used to show my grandma erhm all these conversations that I’d supposedly had with him erhm every single Tuesday’. ‘I don’t trust people anymore cos people say I’ll promise I’ll do this I promise I’ll do that and I’ve been so I’m so used to being let down now that I just don’t expect people to do it erh so I don’t trust what people say erhm ‘ ‘I trust myself I’ll back myself up if something goes wrong something like that’ ‘on the rugby pitch I don’t like to trust other people…. they have gone and scored in numerous games it I just find it hard to let
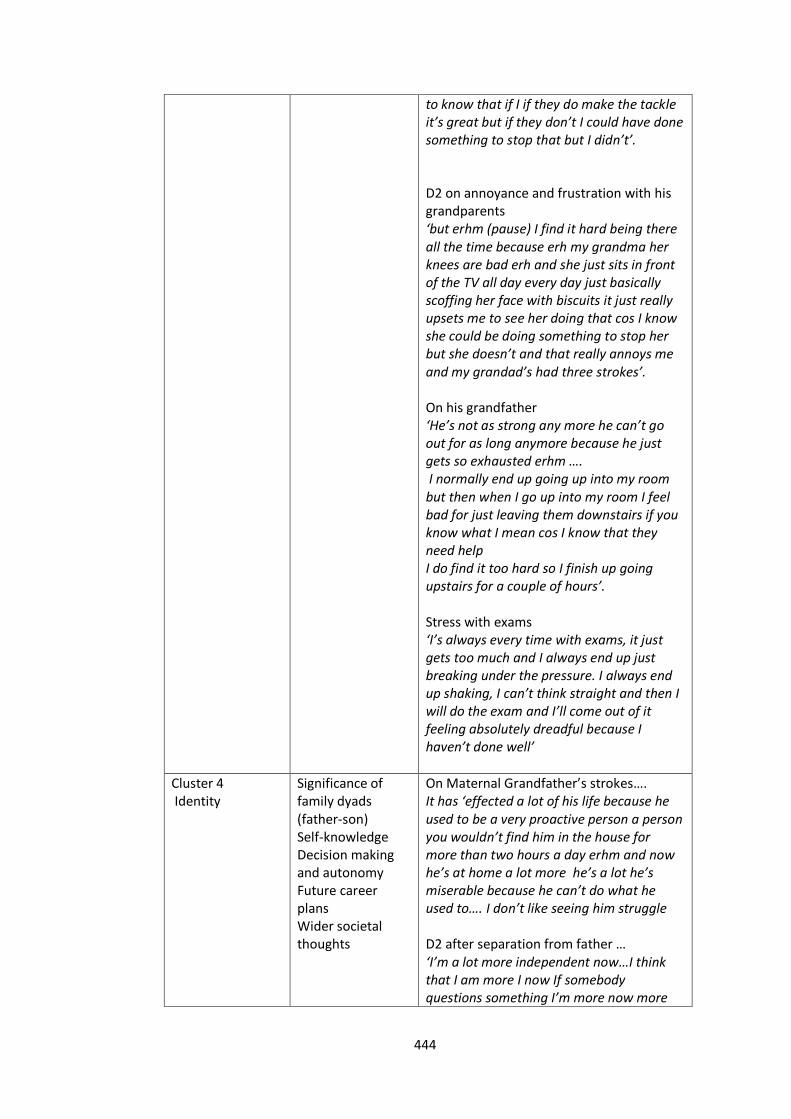
444
to know that if I if they do make the tackle it’s great but if they don’t I could have done something to stop that but I didn’t’.
D2 on annoyance and frustration with his grandparents ‘but erhm (pause) I find it hard being there all the time because erh my grandma her knees are bad erh and she just sits in front of the TV all day every day just basically scoffing her face with biscuits it just really upsets me to see her doing that cos I know she could be doing something to stop her but she doesn’t and that really annoys me and my grandad’s had three strokes’. On his grandfather ‘He’s not as strong any more he can’t go out for as long anymore because he just gets so exhausted erhm …. I normally end up going up into my room but then when I go up into my room I feel bad for just leaving them downstairs if you know what I mean cos I know that they need help I do find it too hard so I finish up going upstairs for a couple of hours’. Stress with exams ‘I’s always every time with exams, it just gets too much and I always end up just breaking under the pressure. I always end up shaking, I can’t think straight and then I will do the exam and I’ll come out of it feeling absolutely dreadful because I haven’t done well’
Cluster 4 Identity
Significance of family dyads (father-son) Self-knowledge Decision making and autonomy Future career plans Wider societal thoughts
On Maternal Grandfather’s strokes…. It has ‘effected a lot of his life because he used to be a very proactive person a person you wouldn’t find him in the house for more than two hours a day erhm and now he’s at home a lot more he’s a lot he’s miserable because he can’t do what he used to…. I don’t like seeing him struggle D2 after separation from father … ‘I’m a lot more independent now…I think that I am more I now If somebody questions something I’m more now more
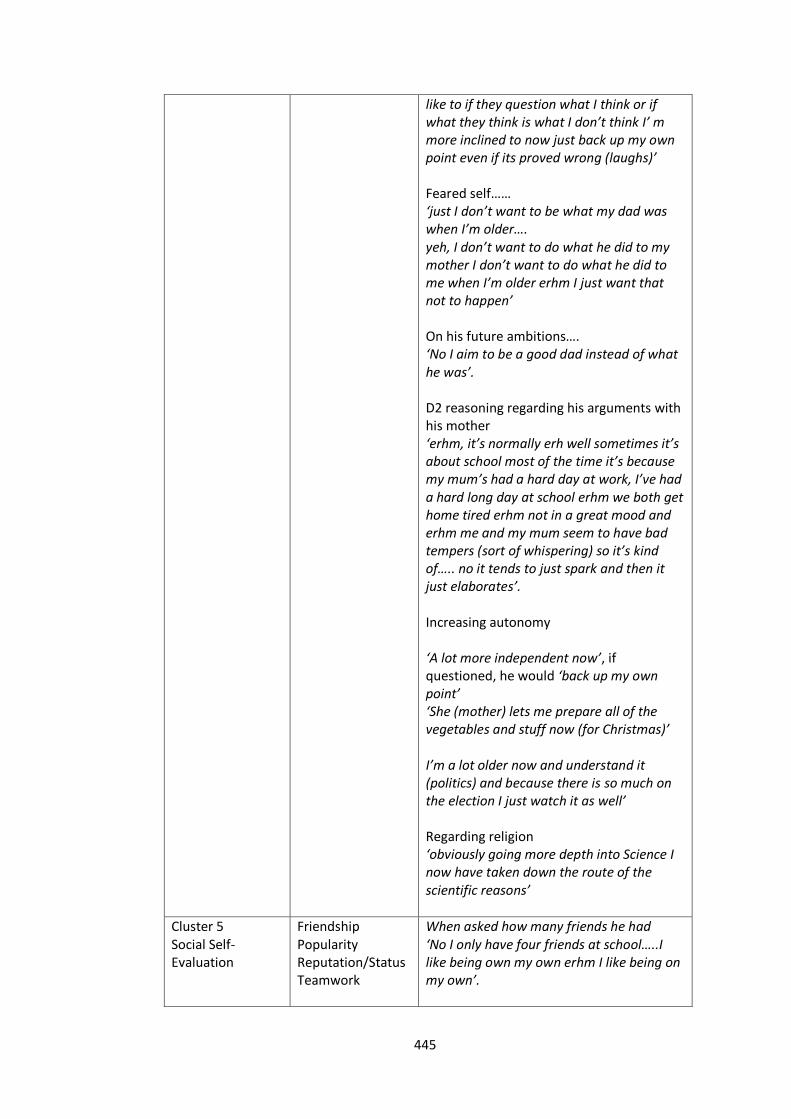
445
like to if they question what I think or if what they think is what I don’t think I’ m more inclined to now just back up my own point even if its proved wrong (laughs)’ Feared self…… ‘just I don’t want to be what my dad was when I’m older…. yeh, I don’t want to do what he did to my mother I don’t want to do what he did to me when I’m older erhm I just want that not to happen’ On his future ambitions…. ‘No I aim to be a good dad instead of what he was’. D2 reasoning regarding his arguments with his mother ‘erhm, it’s normally erh well sometimes it’s about school most of the time it’s because my mum’s had a hard day at work, I’ve had a hard long day at school erhm we both get home tired erhm not in a great mood and erhm me and my mum seem to have bad tempers (sort of whispering) so it’s kind of….. no it tends to just spark and then it just elaborates’. Increasing autonomy ‘A lot more independent now’, if questioned, he would ‘back up my own point’ ‘She (mother) lets me prepare all of the vegetables and stuff now (for Christmas)’ I’m a lot older now and understand it (politics) and because there is so much on the election I just watch it as well’ Regarding religion ‘obviously going more depth into Science I now have taken down the route of the scientific reasons’
Cluster 5 Social Self-Evaluation
Friendship Popularity Reputation/Status Teamwork
When asked how many friends he had ‘No I only have four friends at school…..I like being own my own erhm I like being on my own’.
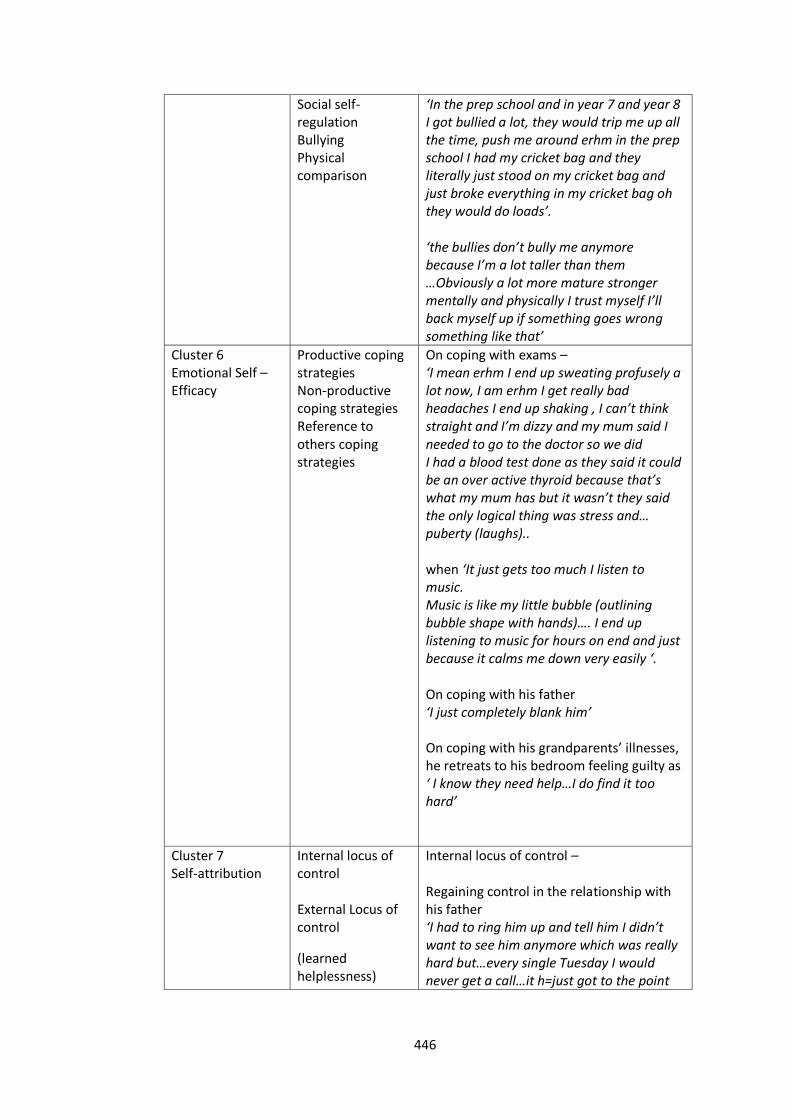
446
Social self-regulation Bullying Physical comparison
‘In the prep school and in year 7 and year 8 I got bullied a lot, they would trip me up all the time, push me around erhm in the prep school I had my cricket bag and they literally just stood on my cricket bag and just broke everything in my cricket bag oh they would do loads’. ‘the bullies don’t bully me anymore because I’m a lot taller than them …Obviously a lot more mature stronger mentally and physically I trust myself I’ll back myself up if something goes wrong something like that’
Cluster 6 Emotional Self –Efficacy
Productive coping strategies Non-productive coping strategies Reference to others coping strategies
On coping with exams – ‘I mean erhm I end up sweating profusely a lot now, I am erhm I get really bad headaches I end up shaking , I can’t think straight and I’m dizzy and my mum said I needed to go to the doctor so we did I had a blood test done as they said it could be an over active thyroid because that’s what my mum has but it wasn’t they said the only logical thing was stress and… puberty (laughs).. when ‘It just gets too much I listen to music. Music is like my little bubble (outlining bubble shape with hands)…. I end up listening to music for hours on end and just because it calms me down very easily ‘. On coping with his father ‘I just completely blank him’ On coping with his grandparents’ illnesses, he retreats to his bedroom feeling guilty as ‘ I know they need help…I do find it too hard’
Cluster 7 Self-attribution
Internal locus of control External Locus of control
(learned helplessness)
Internal locus of control – Regaining control in the relationship with his father ‘I had to ring him up and tell him I didn’t want to see him anymore which was really hard but…every single Tuesday I would never get a call…it h=just got to the point
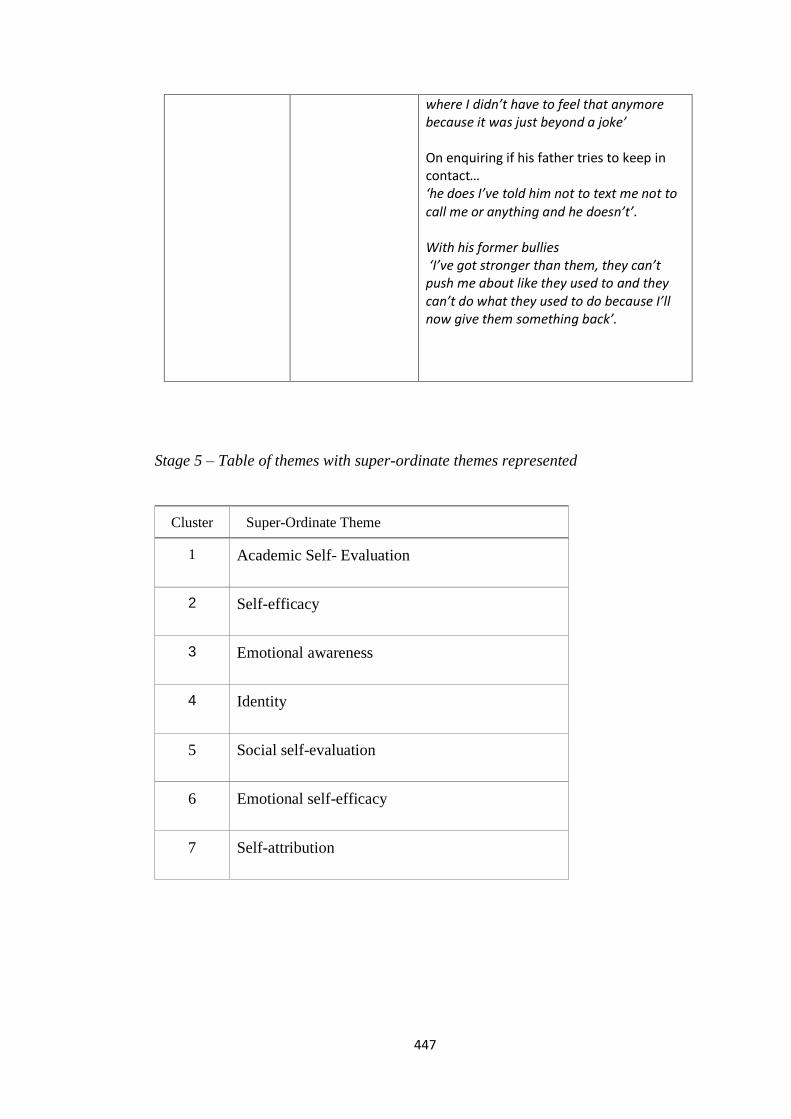
447
where I didn’t have to feel that anymore because it was just beyond a joke’ On enquiring if his father tries to keep in contact… ‘he does I’ve told him not to text me not to
call me or anything and he doesn’t’. With his former bullies ‘I’ve got stronger than them, they can’t push me about like they used to and they can’t do what they used to do because I’ll now give them something back’.
Stage 5 – Table of themes with super-ordinate themes represented
Cluster Super-Ordinate Theme
1 Academic Self- Evaluation
2 Self-efficacy
3 Emotional awareness
4 Identity
5 Social self-evaluation
6 Emotional self-efficacy
7 Self-attribution
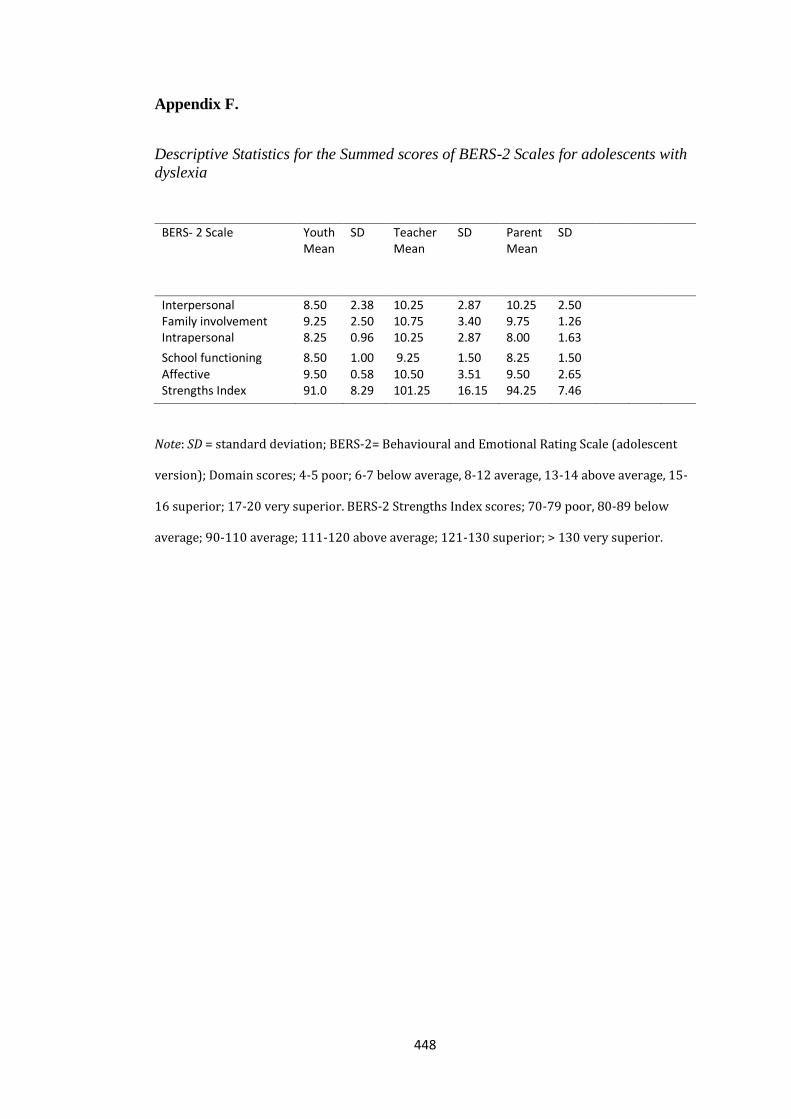
448
Appendix F.
Descriptive Statistics for the Summed scores of BERS-2 Scales for adolescents with
dyslexia
BERS- 2 Scale Youth Mean
SD Teacher Mean
SD Parent Mean
SD
Interpersonal Family involvement Intrapersonal
8.50 9.25 8.25
2.38 2.50 0.96
10.25 10.75 10.25
2.87 3.40 2.87
10.25 9.75 8.00
2.50 1.26 1.63
School functioning Affective Strengths Index
8.50 9.50 91.0
1.00 0.58 8.29
9.25 10.50 101.25
1.50 3.51 16.15
8.25 9.50 94.25
1.50 2.65 7.46
Note: SD = standard deviation; BERS-2= Behavioural and Emotional Rating Scale (adolescent
version); Domain scores; 4-5 poor; 6-7 below average, 8-12 average, 13-14 above average, 15-
16 superior; 17-20 very superior. BERS-2 Strengths Index scores; 70-79 poor, 80-89 below
average; 90-110 average; 111-120 above average; 121-130 superior; > 130 very superior.
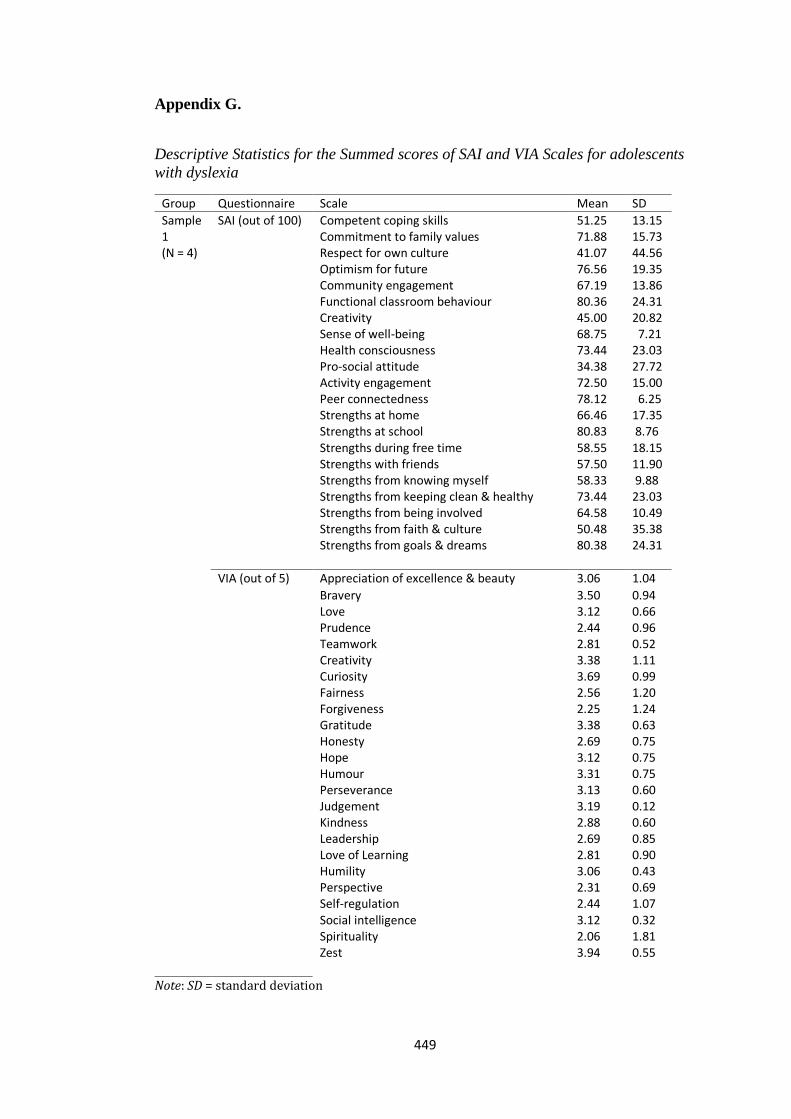
449
Appendix G.
Descriptive Statistics for the Summed scores of SAI and VIA Scales for adolescents
with dyslexia
Group Questionnaire Scale Mean SD
Sample 1 (N = 4)
SAI (out of 100) Competent coping skills Commitment to family values Respect for own culture Optimism for future Community engagement Functional classroom behaviour Creativity Sense of well-being Health consciousness Pro-social attitude Activity engagement Peer connectedness Strengths at home Strengths at school Strengths during free time Strengths with friends Strengths from knowing myself Strengths from keeping clean & healthy Strengths from being involved Strengths from faith & culture Strengths from goals & dreams
51.25 71.88 41.07 76.56 67.19 80.36 45.00 68.75 73.44 34.38 72.50 78.12 66.46 80.83 58.55 57.50 58.33 73.44 64.58 50.48 80.38
13.15 15.73 44.56 19.35 13.86 24.31 20.82 7.21 23.03 27.72 15.00 6.25 17.35 8.76 18.15 11.90 9.88 23.03 10.49 35.38 24.31
VIA (out of 5) Appreciation of excellence & beauty 3.06 1.04
Bravery Love Prudence Teamwork Creativity Curiosity Fairness Forgiveness Gratitude Honesty Hope Humour Perseverance Judgement Kindness Leadership Love of Learning Humility Perspective Self-regulation Social intelligence Spirituality Zest
3.50 3.12 2.44 2.81 3.38 3.69 2.56 2.25 3.38 2.69 3.12 3.31 3.13 3.19 2.88 2.69 2.81 3.06 2.31 2.44 3.12 2.06 3.94
0.94 0.66 0.96 0.52 1.11 0.99 1.20 1.24 0.63 0.75 0.75 0.75 0.60 0.12 0.60 0.85 0.90 0.43 0.69 1.07 0.32 1.81 0.55
Note: SD = standard deviation
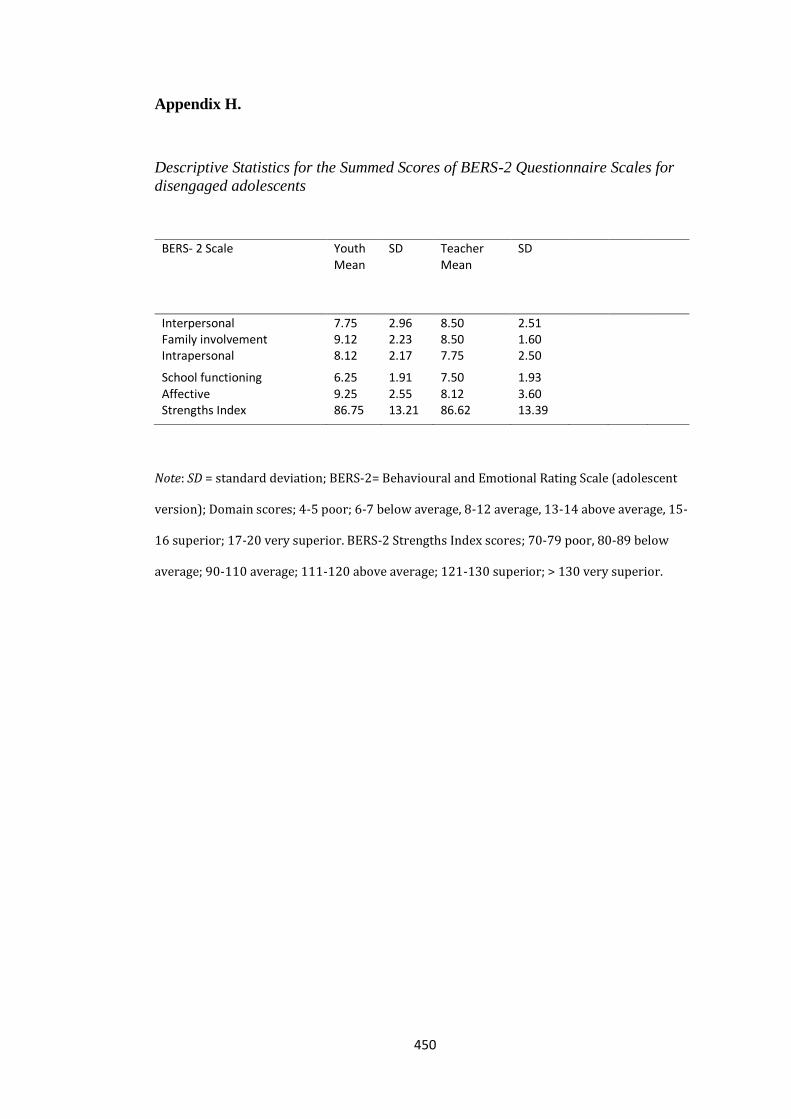
450
Appendix H.
Descriptive Statistics for the Summed Scores of BERS-2 Questionnaire Scales for
disengaged adolescents
BERS- 2 Scale Youth Mean
SD Teacher Mean
SD
Interpersonal Family involvement Intrapersonal
7.75 9.12 8.12
2.96 2.23 2.17
8.50 8.50 7.75
2.51 1.60 2.50
School functioning Affective Strengths Index
6.25 9.25 86.75
1.91 2.55 13.21
7.50 8.12 86.62
1.93 3.60 13.39
Note: SD = standard deviation; BERS-2= Behavioural and Emotional Rating Scale (adolescent
version); Domain scores; 4-5 poor; 6-7 below average, 8-12 average, 13-14 above average, 15-
16 superior; 17-20 very superior. BERS-2 Strengths Index scores; 70-79 poor, 80-89 below
average; 90-110 average; 111-120 above average; 121-130 superior; > 130 very superior.
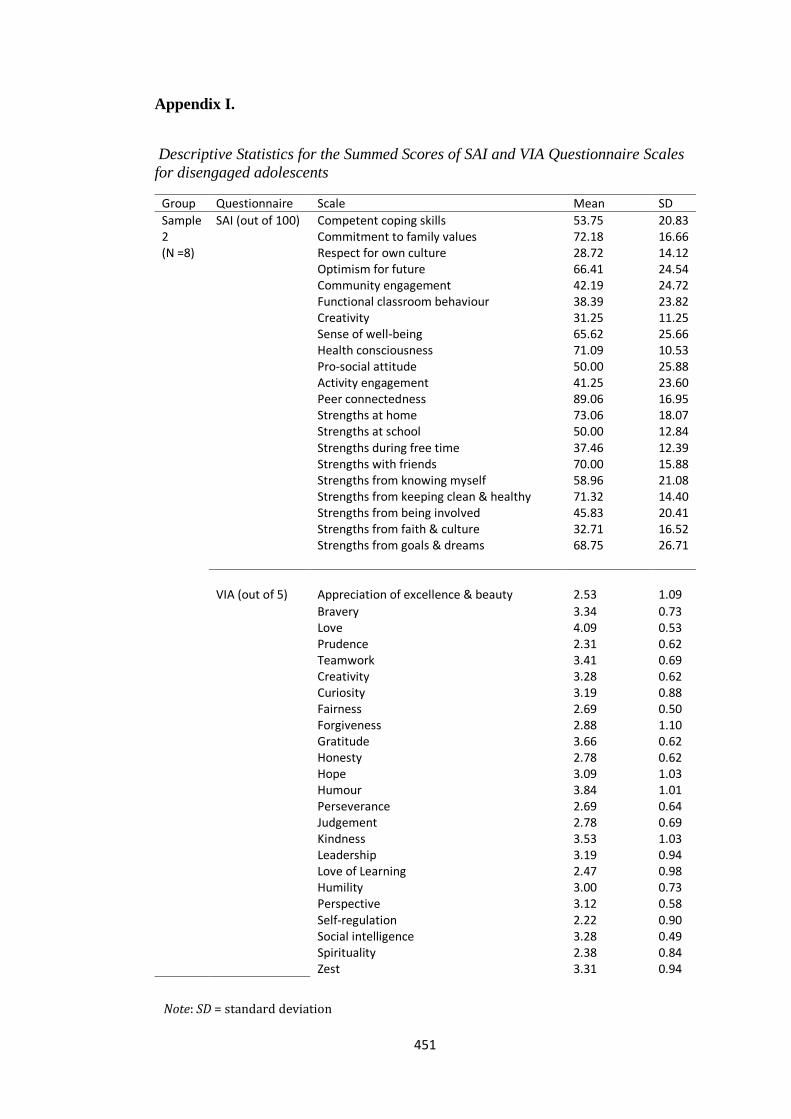
451
Appendix I.
Descriptive Statistics for the Summed Scores of SAI and VIA Questionnaire Scales
for disengaged adolescents
Group Questionnaire Scale Mean SD
Sample 2 (N =8)
SAI (out of 100) Competent coping skills Commitment to family values Respect for own culture Optimism for future Community engagement Functional classroom behaviour Creativity Sense of well-being Health consciousness Pro-social attitude Activity engagement Peer connectedness Strengths at home Strengths at school Strengths during free time Strengths with friends Strengths from knowing myself Strengths from keeping clean & healthy Strengths from being involved Strengths from faith & culture Strengths from goals & dreams
53.75 72.18 28.72 66.41 42.19 38.39 31.25 65.62 71.09 50.00 41.25 89.06 73.06 50.00 37.46 70.00 58.96 71.32 45.83 32.71 68.75
20.83 16.66 14.12 24.54 24.72 23.82 11.25 25.66 10.53 25.88 23.60 16.95 18.07 12.84 12.39 15.88 21.08 14.40 20.41 16.52 26.71
VIA (out of 5)
Appreciation of excellence & beauty
2.53
1.09
Bravery Love Prudence Teamwork Creativity Curiosity Fairness Forgiveness Gratitude Honesty Hope Humour Perseverance Judgement Kindness Leadership Love of Learning Humility Perspective Self-regulation Social intelligence Spirituality Zest
3.34 4.09 2.31 3.41 3.28 3.19 2.69 2.88 3.66 2.78 3.09 3.84 2.69 2.78 3.53 3.19 2.47 3.00 3.12 2.22 3.28 2.38 3.31
0.73 0.53 0.62 0.69 0.62 0.88 0.50 1.10 0.62 0.62 1.03 1.01 0.64 0.69 1.03 0.94 0.98 0.73 0.58 0.90 0.49 0.84 0.94
Note: SD = standard deviation
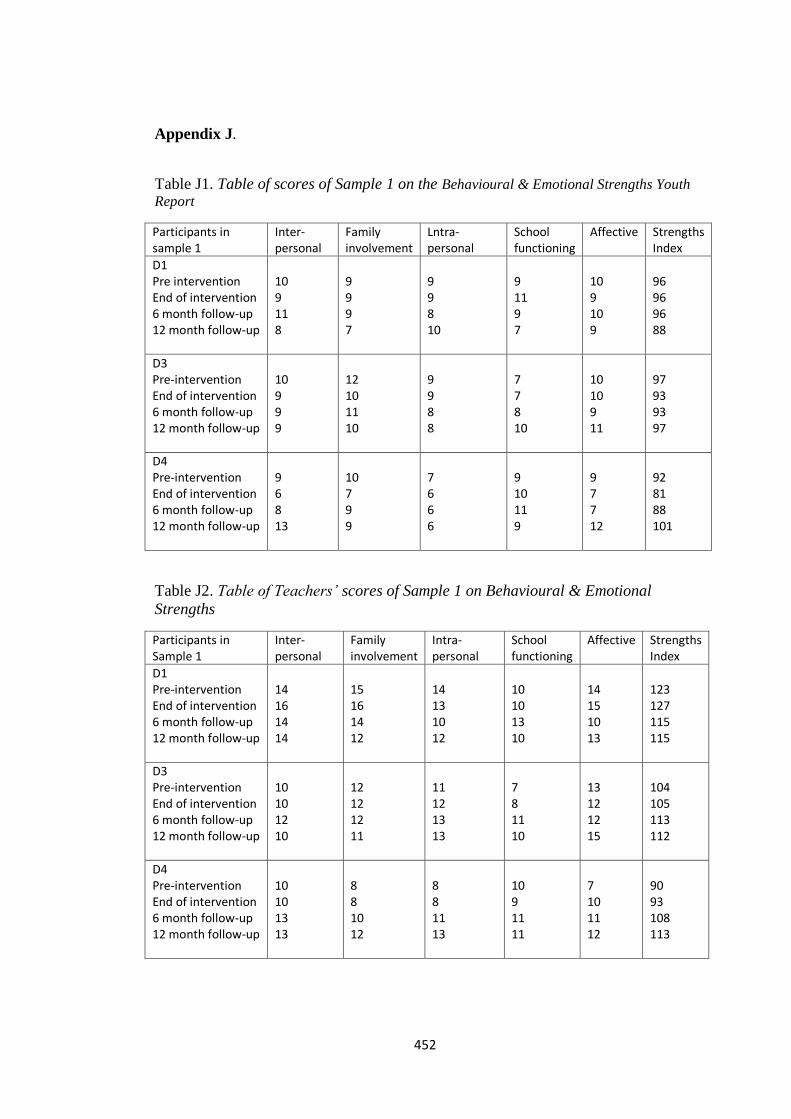
452
Appendix J.
Table J1. Table of scores of Sample 1 on the Behavioural & Emotional Strengths Youth
Report
Participants in sample 1
Inter-personal
Family involvement
Lntra-personal
School functioning
Affective Strengths Index
D1 Pre intervention End of intervention 6 month follow-up 12 month follow-up
10 9 11 8
9 9 9 7
9 9 8 10
9 11 9 7
10 9 10 9
96 96 96 88
D3 Pre-intervention End of intervention 6 month follow-up 12 month follow-up
10 9 9 9
12 10 11 10
9 9 8 8
7 7 8 10
10 10 9 11
97 93 93 97
D4 Pre-intervention End of intervention 6 month follow-up 12 month follow-up
9 6 8 13
10 7 9 9
7 6 6 6
9 10 11 9
9 7 7 12
92 81 88 101
Table J2. Table of Teachers’ scores of Sample 1 on Behavioural & Emotional
Strengths
Participants in Sample 1
Inter- personal
Family involvement
Intra- personal
School functioning
Affective Strengths Index
D1 Pre-intervention End of intervention 6 month follow-up 12 month follow-up
14 16 14 14
15 16 14 12
14 13 10 12
10 10 13 10
14 15 10 13
123 127 115 115
D3 Pre-intervention End of intervention 6 month follow-up 12 month follow-up
10 10 12 10
12 12 12 11
11 12 13 13
7 8 11 10
13 12 12 15
104 105 113 112
D4 Pre-intervention End of intervention 6 month follow-up 12 month follow-up
10 10 13 13
8 8 10 12
8 8 11 13
10 9 11 11
7 10 11 12
90 93 108 113
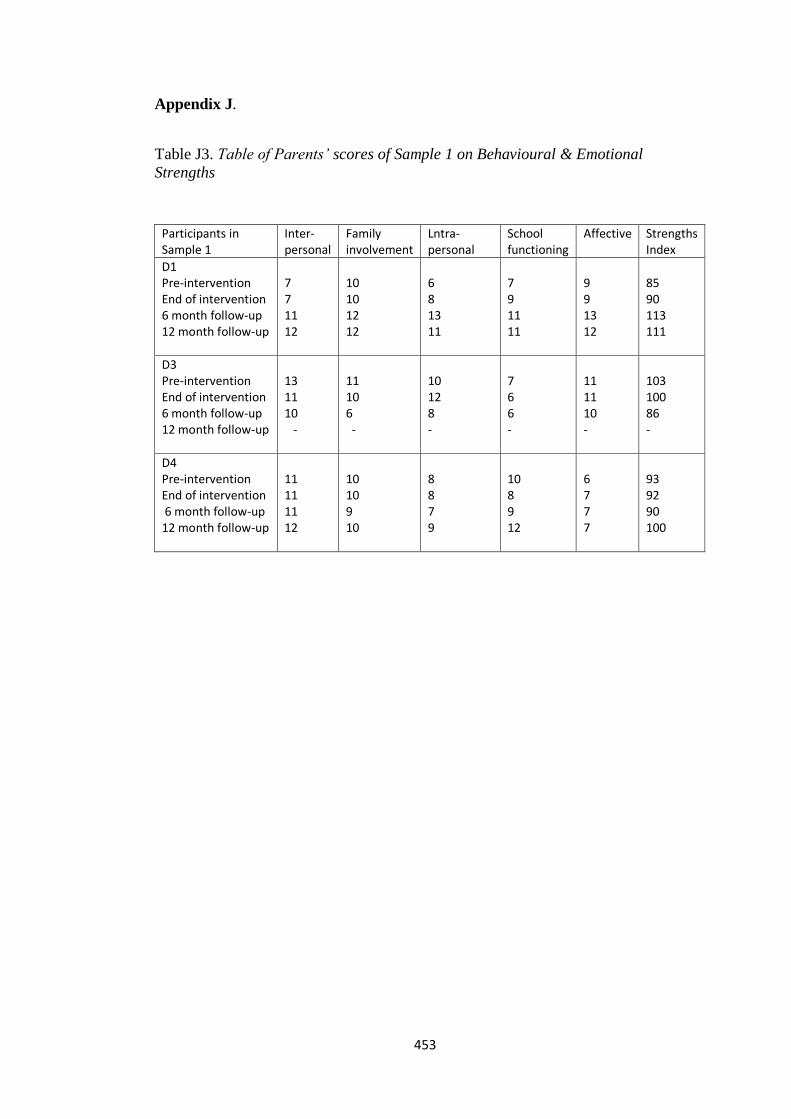
453
Appendix J.
Table J3. Table of Parents’ scores of Sample 1 on Behavioural & Emotional
Strengths
Participants in Sample 1
Inter- personal
Family involvement
Lntra- personal
School functioning
Affective Strengths Index
D1 Pre-intervention End of intervention 6 month follow-up 12 month follow-up
7 7 11 12
10 10 12 12
6 8 13 11
7 9 11 11
9 9 13 12
85 90 113 111
D3 Pre-intervention End of intervention 6 month follow-up 12 month follow-up
13 11 10 -
11 10 6 -
10 12 8 -
7 6 6 -
11 11 10 -
103 100 86 -
D4 Pre-intervention End of intervention 6 month follow-up 12 month follow-up
11 11 11 12
10 10 9 10
8 8 7 9
10 8 9 12
6 7 7 7
93 92 90 100
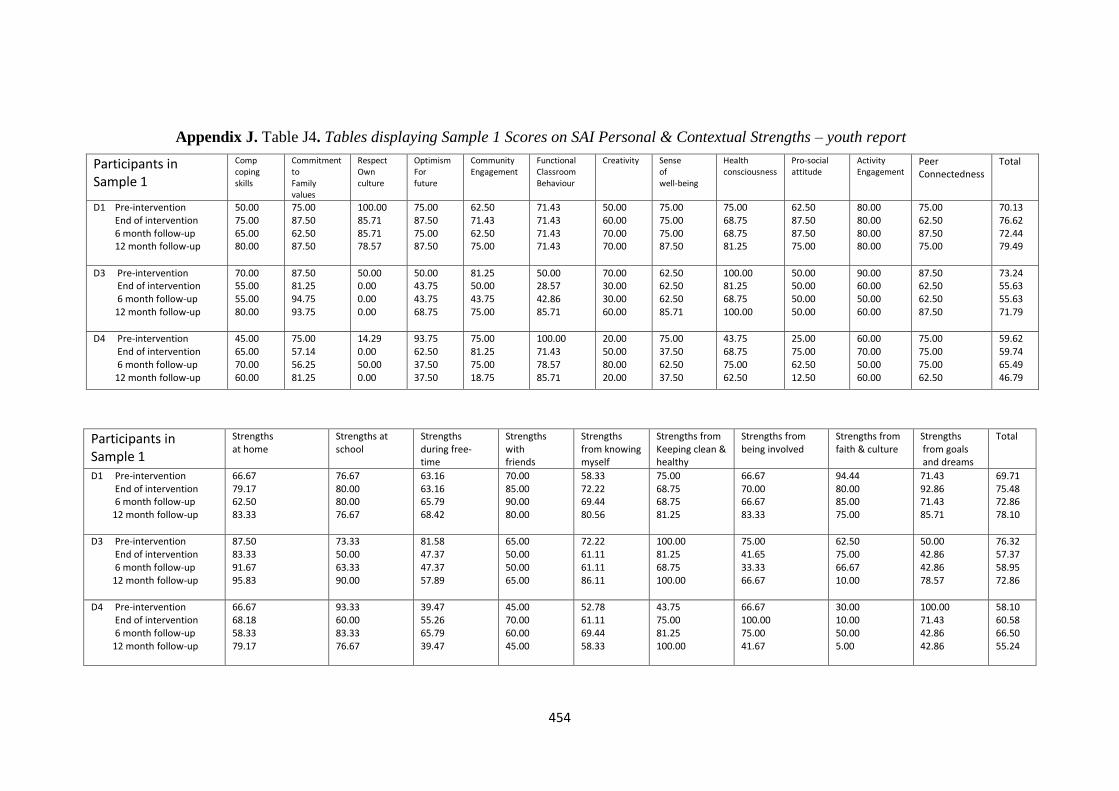
454
Participants in Sample 1
Comp coping skills
Commitment to Family values
Respect Own culture
Optimism For future
Community Engagement
Functional Classroom Behaviour
Creativity Sense of well-being
Health consciousness
Pro-social attitude
Activity Engagement
Peer Connectedness
Total
D1 Pre-intervention End of intervention 6 month follow-up 12 month follow-up
50.00 75.00 65.00 80.00
75.00 87.50 62.50 87.50
100.00 85.71 85.71 78.57
75.00 87.50 75.00 87.50
62.50 71.43 62.50 75.00
71.43 71.43 71.43 71.43
50.00 60.00 70.00 70.00
75.00 75.00 75.00 87.50
75.00 68.75 68.75 81.25
62.50 87.50 87.50 75.00
80.00 80.00 80.00 80.00
75.00 62.50 87.50 75.00
70.13 76.62 72.44 79.49
D3 Pre-intervention End of intervention 6 month follow-up 12 month follow-up
70.00 55.00 55.00 80.00
87.50 81.25 94.75 93.75
50.00 0.00 0.00 0.00
50.00 43.75 43.75 68.75
81.25 50.00 43.75 75.00
50.00 28.57 42.86 85.71
70.00 30.00 30.00 60.00
62.50 62.50 62.50 85.71
100.00 81.25 68.75 100.00
50.00 50.00 50.00 50.00
90.00 60.00 50.00 60.00
87.50 62.50 62.50 87.50
73.24 55.63 55.63 71.79
D4 Pre-intervention End of intervention 6 month follow-up 12 month follow-up
45.00 65.00 70.00 60.00
75.00 57.14 56.25 81.25
14.29 0.00 50.00 0.00
93.75 62.50 37.50 37.50
75.00 81.25 75.00 18.75
100.00 71.43 78.57 85.71
20.00 50.00 80.00 20.00
75.00 37.50 62.50 37.50
43.75 68.75 75.00 62.50
25.00 75.00 62.50 12.50
60.00 70.00 50.00 60.00
75.00 75.00 75.00 62.50
59.62 59.74 65.49 46.79
Participants in Sample 1
Strengths at home
Strengths at school
Strengths during free-time
Strengths with friends
Strengths from knowing myself
Strengths from Keeping clean & healthy
Strengths from being involved
Strengths from faith & culture
Strengths from goals and dreams
Total
D1 Pre-intervention End of intervention 6 month follow-up 12 month follow-up
66.67 79.17 62.50 83.33
76.67 80.00 80.00 76.67
63.16 63.16 65.79 68.42
70.00 85.00 90.00 80.00
58.33 72.22 69.44 80.56
75.00 68.75 68.75 81.25
66.67 70.00 66.67 83.33
94.44 80.00 85.00 75.00
71.43 92.86 71.43 85.71
69.71 75.48 72.86 78.10
D3 Pre-intervention End of intervention 6 month follow-up 12 month follow-up
87.50 83.33 91.67 95.83
73.33 50.00 63.33 90.00
81.58 47.37 47.37 57.89
65.00 50.00 50.00 65.00
72.22 61.11 61.11 86.11
100.00 81.25 68.75 100.00
75.00 41.65 33.33 66.67
62.50 75.00 66.67 10.00
50.00 42.86 42.86 78.57
76.32 57.37 58.95 72.86
D4 Pre-intervention End of intervention 6 month follow-up 12 month follow-up
66.67 68.18 58.33 79.17
93.33 60.00 83.33 76.67
39.47 55.26 65.79 39.47
45.00 70.00 60.00 45.00
52.78 61.11 69.44 58.33
43.75 75.00 81.25 100.00
66.67 100.00 75.00 41.67
30.00 10.00 50.00 5.00
100.00 71.43 42.86 42.86
58.10 60.58 66.50 55.24
Appendix J. Table J4. Tables displaying Sample 1 Scores on SAI Personal & Contextual Strengths – youth report
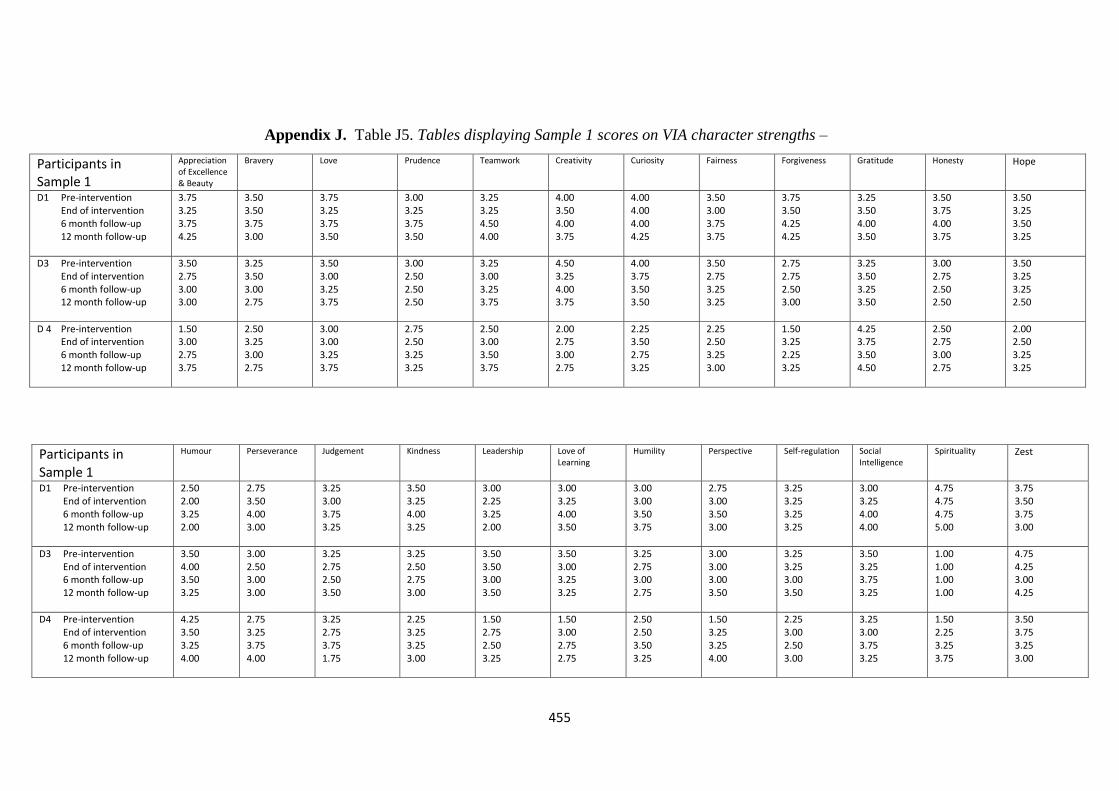
455
Participants in Sample 1
Appreciation of Excellence & Beauty
Bravery Love Prudence Teamwork Creativity Curiosity Fairness Forgiveness Gratitude Honesty Hope
D1 Pre-intervention End of intervention 6 month follow-up 12 month follow-up
3.75 3.25 3.75 4.25
3.50 3.50 3.75 3.00
3.75 3.25 3.75 3.50
3.00 3.25 3.75 3.50
3.25 3.25 4.50 4.00
4.00 3.50 4.00 3.75
4.00 4.00 4.00 4.25
3.50 3.00 3.75 3.75
3.75 3.50 4.25 4.25
3.25 3.50 4.00 3.50
3.50 3.75 4.00 3.75
3.50 3.25 3.50 3.25
D3 Pre-intervention End of intervention 6 month follow-up 12 month follow-up
3.50 2.75 3.00 3.00
3.25 3.50 3.00 2.75
3.50 3.00 3.25 3.75
3.00 2.50 2.50 2.50
3.25 3.00 3.25 3.75
4.50 3.25 4.00 3.75
4.00 3.75 3.50 3.50
3.50 2.75 3.25 3.25
2.75 2.75 2.50 3.00
3.25 3.50 3.25 3.50
3.00 2.75 2.50 2.50
3.50 3.25 3.25 2.50
D 4 Pre-intervention End of intervention 6 month follow-up 12 month follow-up
1.50 3.00 2.75 3.75
2.50 3.25 3.00 2.75
3.00 3.00 3.25 3.75
2.75 2.50 3.25 3.25
2.50 3.00 3.50 3.75
2.00 2.75 3.00 2.75
2.25 3.50 2.75 3.25
2.25 2.50 3.25 3.00
1.50 3.25 2.25 3.25
4.25 3.75 3.50 4.50
2.50 2.75 3.00 2.75
2.00 2.50 3.25 3.25
Participants in Sample 1
Humour Perseverance Judgement Kindness Leadership Love of Learning
Humility Perspective Self-regulation Social Intelligence
Spirituality Zest
D1 Pre-intervention End of intervention 6 month follow-up 12 month follow-up
2.50 2.00 3.25 2.00
2.75 3.50 4.00 3.00
3.25 3.00 3.75 3.25
3.50 3.25 4.00 3.25
3.00 2.25 3.25 2.00
3.00 3.25 4.00 3.50
3.00 3.00 3.50 3.75
2.75 3.00 3.50 3.00
3.25 3.25 3.25 3.25
3.00 3.25 4.00 4.00
4.75 4.75 4.75 5.00
3.75 3.50 3.75 3.00
D3 Pre-intervention End of intervention 6 month follow-up 12 month follow-up
3.50 4.00 3.50 3.25
3.00 2.50 3.00 3.00
3.25 2.75 2.50 3.50
3.25 2.50 2.75 3.00
3.50 3.50 3.00 3.50
3.50 3.00 3.25 3.25
3.25 2.75 3.00 2.75
3.00 3.00 3.00 3.50
3.25 3.25 3.00 3.50
3.50 3.25 3.75 3.25
1.00 1.00 1.00 1.00
4.75 4.25 3.00 4.25
D4 Pre-intervention End of intervention 6 month follow-up 12 month follow-up
4.25 3.50 3.25 4.00
2.75 3.25 3.75 4.00
3.25 2.75 3.75 1.75
2.25 3.25 3.25 3.00
1.50 2.75 2.50 3.25
1.50 3.00 2.75 2.75
2.50 2.50 3.50 3.25
1.50 3.25 3.25 4.00
2.25 3.00 2.50 3.00
3.25 3.00 3.75 3.25
1.50 2.25 3.25 3.75
3.50 3.75 3.25 3.00
Appendix J. Table J5. Tables displaying Sample 1 scores on VIA character strengths –
youth report
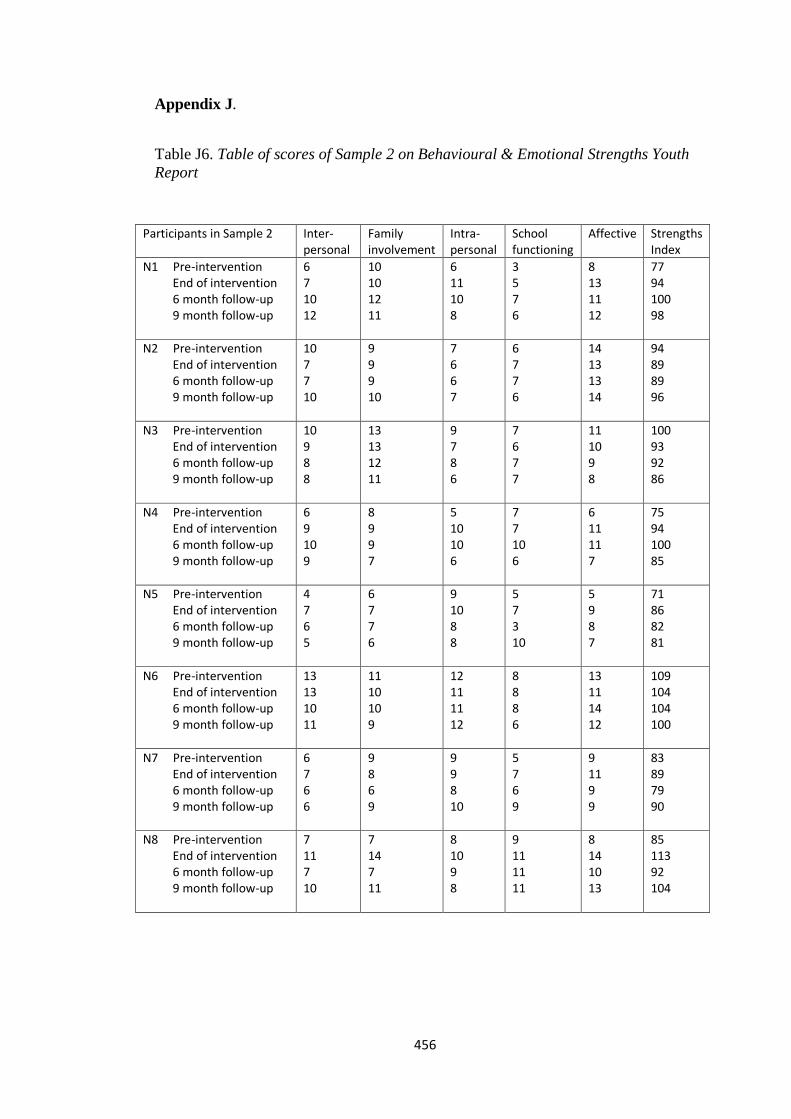
456
Appendix J.
Table J6. Table of scores of Sample 2 on Behavioural & Emotional Strengths Youth
Report
Participants in Sample 2 Inter- personal
Family involvement
Intra- personal
School functioning
Affective Strengths Index
N1 Pre-intervention End of intervention 6 month follow-up 9 month follow-up
6 7 10 12
10 10 12 11
6 11 10 8
3 5 7 6
8 13 11 12
77 94 100 98
N2 Pre-intervention End of intervention 6 month follow-up 9 month follow-up
10 7 7 10
9 9 9 10
7 6 6 7
6 7 7 6
14 13 13 14
94 89 89 96
N3 Pre-intervention End of intervention 6 month follow-up 9 month follow-up
10 9 8 8
13 13 12 11
9 7 8 6
7 6 7 7
11 10 9 8
100 93 92 86
N4 Pre-intervention End of intervention 6 month follow-up 9 month follow-up
6 9 10 9
8 9 9 7
5 10 10 6
7 7 10 6
6 11 11 7
75 94 100 85
N5 Pre-intervention End of intervention 6 month follow-up 9 month follow-up
4 7 6 5
6 7 7 6
9 10 8 8
5 7 3 10
5 9 8 7
71 86 82 81
N6 Pre-intervention End of intervention 6 month follow-up 9 month follow-up
13 13 10 11
11 10 10 9
12 11 11 12
8 8 8 6
13 11 14 12
109 104 104 100
N7 Pre-intervention End of intervention 6 month follow-up 9 month follow-up
6 7 6 6
9 8 6 9
9 9 8 10
5 7 6 9
9 11 9 9
83 89 79 90
N8 Pre-intervention End of intervention 6 month follow-up 9 month follow-up
7 11 7 10
7 14 7 11
8 10 9 8
9 11 11 11
8 14 10 13
85 113 92 104
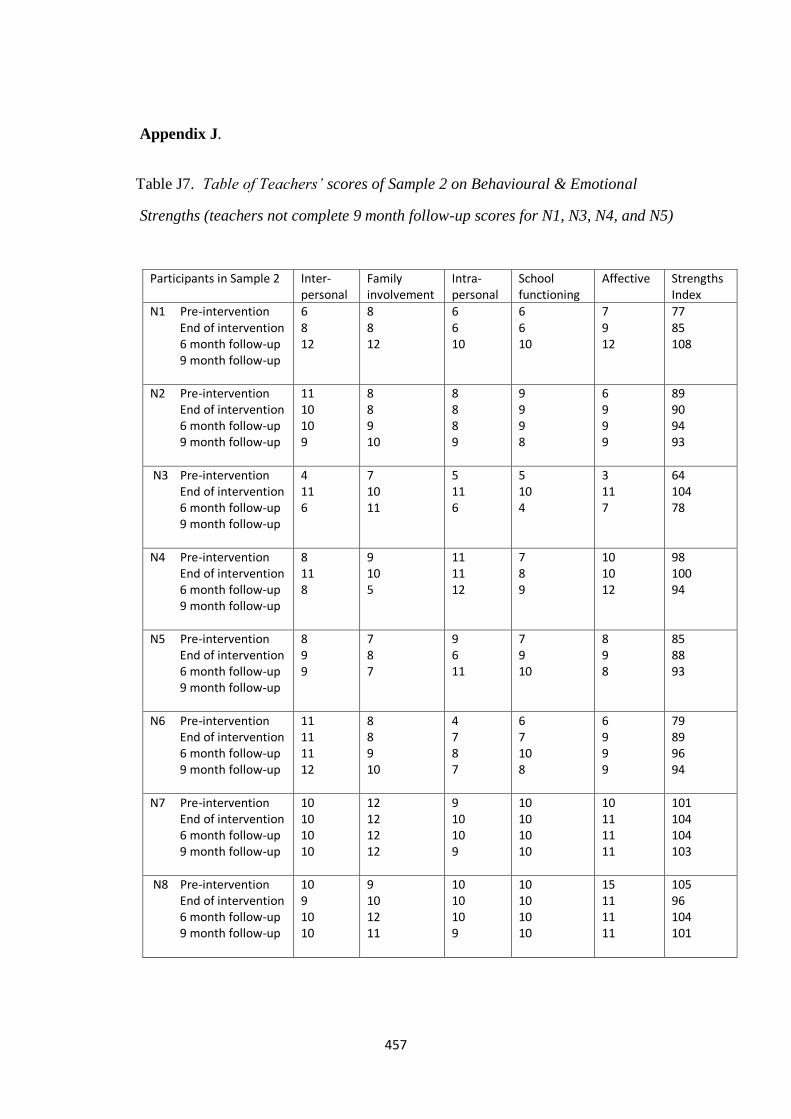
457
Appendix J.
Table J7. Table of Teachers’ scores of Sample 2 on Behavioural & Emotional
Strengths (teachers not complete 9 month follow-up scores for N1, N3, N4, and N5)
Participants in Sample 2 Inter-personal
Family involvement
Intra- personal
School functioning
Affective Strengths Index
N1 Pre-intervention End of intervention 6 month follow-up 9 month follow-up
6 8 12
8 8 12
6 6 10
6 6 10
7 9 12
77 85 108
N2 Pre-intervention End of intervention 6 month follow-up 9 month follow-up
11 10 10 9
8 8 9 10
8 8 8 9
9 9 9 8
6 9 9 9
89 90 94 93
N3 Pre-intervention End of intervention 6 month follow-up 9 month follow-up
4 11 6
7 10 11
5 11 6
5 10 4
3 11 7
64 104 78
N4 Pre-intervention End of intervention 6 month follow-up 9 month follow-up
8 11 8
9 10 5
11 11 12
7 8 9
10 10 12
98 100 94
N5 Pre-intervention End of intervention 6 month follow-up 9 month follow-up
8 9 9
7 8 7
9 6 11
7 9 10
8 9 8
85 88 93
N6 Pre-intervention End of intervention 6 month follow-up 9 month follow-up
11 11 11 12
8 8 9 10
4 7 8 7
6 7 10 8
6 9 9 9
79 89 96 94
N7 Pre-intervention End of intervention 6 month follow-up 9 month follow-up
10 10 10 10
12 12 12 12
9 10 10 9
10 10 10 10
10 11 11 11
101 104 104 103
N8 Pre-intervention End of intervention 6 month follow-up 9 month follow-up
10 9 10 10
9 10 12 11
10 10 10 9
10 10 10 10
15 11 11 11
105 96 104 101
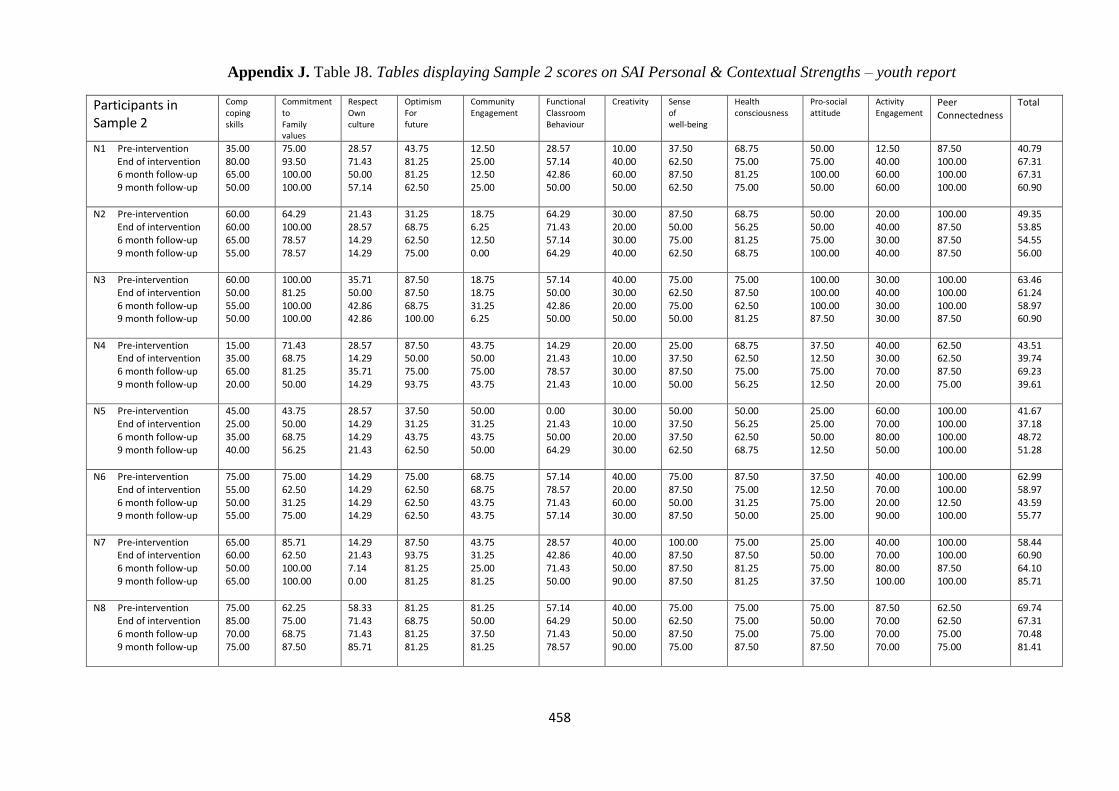
458
Participants in Sample 2
Comp coping skills
Commitment to Family values
Respect Own culture
Optimism For future
Community Engagement
Functional Classroom Behaviour
Creativity Sense of well-being
Health consciousness
Pro-social attitude
Activity Engagement
Peer Connectedness
Total
N1 Pre-intervention End of intervention 6 month follow-up 9 month follow-up
35.00 80.00 65.00 50.00
75.00 93.50 100.00 100.00
28.57 71.43 50.00 57.14
43.75 81.25 81.25 62.50
12.50 25.00 12.50 25.00
28.57 57.14 42.86 50.00
10.00 40.00 60.00 50.00
37.50 62.50 87.50 62.50
68.75 75.00 81.25 75.00
50.00 75.00 100.00 50.00
12.50 40.00 60.00 60.00
87.50 100.00 100.00 100.00
40.79 67.31 67.31 60.90
N2 Pre-intervention End of intervention 6 month follow-up 9 month follow-up
60.00 60.00 65.00 55.00
64.29 100.00 78.57 78.57
21.43 28.57 14.29 14.29
31.25 68.75 62.50 75.00
18.75 6.25 12.50 0.00
64.29 71.43 57.14 64.29
30.00 20.00 30.00 40.00
87.50 50.00 75.00 62.50
68.75 56.25 81.25 68.75
50.00 50.00 75.00 100.00
20.00 40.00 30.00 40.00
100.00 87.50 87.50 87.50
49.35 53.85 54.55 56.00
N3 Pre-intervention End of intervention 6 month follow-up 9 month follow-up
60.00 50.00 55.00 50.00
100.00 81.25 100.00 100.00
35.71 50.00 42.86 42.86
87.50 87.50 68.75 100.00
18.75 18.75 31.25 6.25
57.14 50.00 42.86 50.00
40.00 30.00 20.00 50.00
75.00 62.50 75.00 50.00
75.00 87.50 62.50 81.25
100.00 100.00 100.00 87.50
30.00 40.00 30.00 30.00
100.00 100.00 100.00 87.50
63.46 61.24 58.97 60.90
N4 Pre-intervention End of intervention 6 month follow-up 9 month follow-up
15.00 35.00 65.00 20.00
71.43 68.75 81.25 50.00
28.57 14.29 35.71 14.29
87.50 50.00 75.00 93.75
43.75 50.00 75.00 43.75
14.29 21.43 78.57 21.43
20.00 10.00 30.00 10.00
25.00 37.50 87.50 50.00
68.75 62.50 75.00 56.25
37.50 12.50 75.00 12.50
40.00 30.00 70.00 20.00
62.50 62.50 87.50 75.00
43.51 39.74 69.23 39.61
N5 Pre-intervention End of intervention 6 month follow-up 9 month follow-up
45.00 25.00 35.00 40.00
43.75 50.00 68.75 56.25
28.57 14.29 14.29 21.43
37.50 31.25 43.75 62.50
50.00 31.25 43.75 50.00
0.00 21.43 50.00 64.29
30.00 10.00 20.00 30.00
50.00 37.50 37.50 62.50
50.00 56.25 62.50 68.75
25.00 25.00 50.00 12.50
60.00 70.00 80.00 50.00
100.00 100.00 100.00 100.00
41.67 37.18 48.72 51.28
N6 Pre-intervention End of intervention 6 month follow-up 9 month follow-up
75.00 55.00 50.00 55.00
75.00 62.50 31.25 75.00
14.29 14.29 14.29 14.29
75.00 62.50 62.50 62.50
68.75 68.75 43.75 43.75
57.14 78.57 71.43 57.14
40.00 20.00 60.00 30.00
75.00 87.50 50.00 87.50
87.50 75.00 31.25 50.00
37.50 12.50 75.00 25.00
40.00 70.00 20.00 90.00
100.00 100.00 12.50 100.00
62.99 58.97 43.59 55.77
N7 Pre-intervention End of intervention 6 month follow-up 9 month follow-up
65.00 60.00 50.00 65.00
85.71 62.50 100.00 100.00
14.29 21.43 7.14 0.00
87.50 93.75 81.25 81.25
43.75 31.25 25.00 81.25
28.57 42.86 71.43 50.00
40.00 40.00 50.00 90.00
100.00 87.50 87.50 87.50
75.00 87.50 81.25 81.25
25.00 50.00 75.00 37.50
40.00 70.00 80.00 100.00
100.00 100.00 87.50 100.00
58.44 60.90 64.10 85.71
N8 Pre-intervention End of intervention 6 month follow-up 9 month follow-up
75.00 85.00 70.00 75.00
62.25 75.00 68.75 87.50
58.33 71.43 71.43 85.71
81.25 68.75 81.25 81.25
81.25 50.00 37.50 81.25
57.14 64.29 71.43 78.57
40.00 50.00 50.00 90.00
75.00 62.50 87.50 75.00
75.00 75.00 75.00 87.50
75.00 50.00 75.00 87.50
87.50 70.00 70.00 70.00
62.50 62.50 75.00 75.00
69.74 67.31 70.48 81.41
Appendix J. Table J8. Tables displaying Sample 2 scores on SAI Personal & Contextual Strengths – youth report
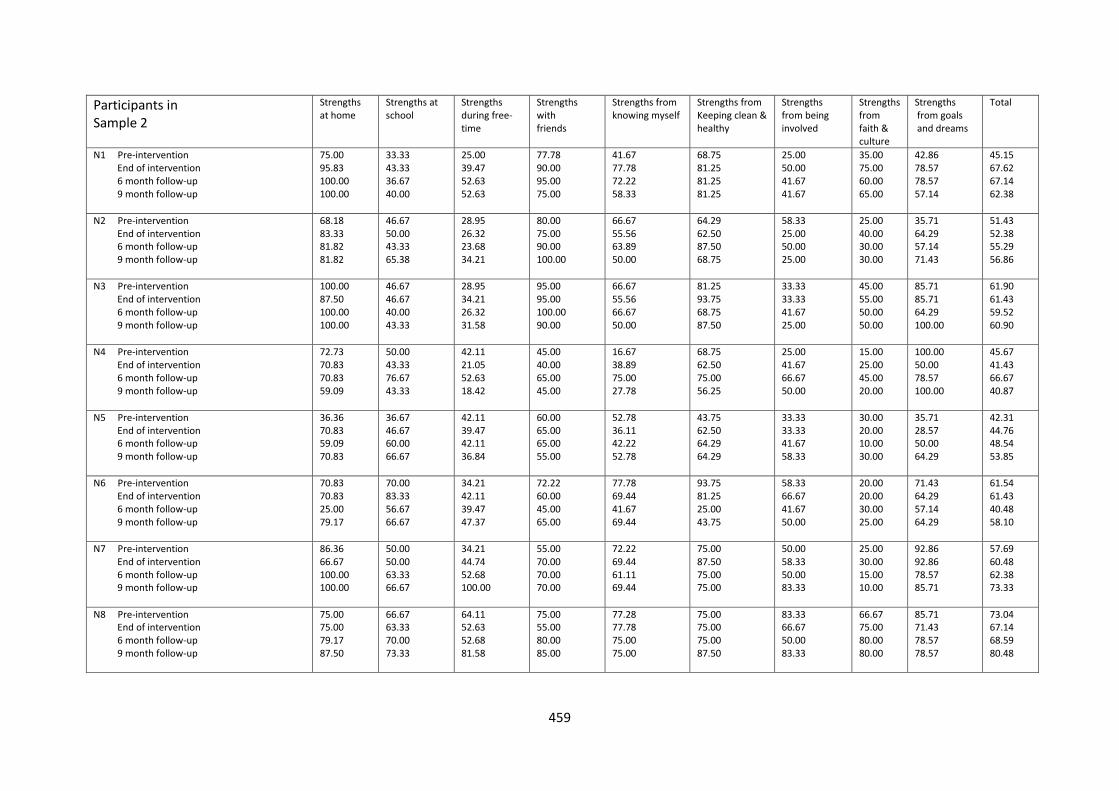
459
Participants in Sample 2
Strengths at home
Strengths at school
Strengths during free-time
Strengths with friends
Strengths from knowing myself
Strengths from Keeping clean & healthy
Strengths from being involved
Strengths from faith & culture
Strengths from goals and dreams
Total
N1 Pre-intervention End of intervention 6 month follow-up 9 month follow-up
75.00 95.83 100.00 100.00
33.33 43.33 36.67 40.00
25.00 39.47 52.63 52.63
77.78 90.00 95.00 75.00
41.67 77.78 72.22 58.33
68.75 81.25 81.25 81.25
25.00 50.00 41.67 41.67
35.00 75.00 60.00 65.00
42.86 78.57 78.57 57.14
45.15 67.62 67.14 62.38
N2 Pre-intervention End of intervention 6 month follow-up 9 month follow-up
68.18 83.33 81.82 81.82
46.67 50.00 43.33 65.38
28.95 26.32 23.68 34.21
80.00 75.00 90.00 100.00
66.67 55.56 63.89 50.00
64.29 62.50 87.50 68.75
58.33 25.00 50.00 25.00
25.00 40.00 30.00 30.00
35.71 64.29 57.14 71.43
51.43 52.38 55.29 56.86
N3 Pre-intervention End of intervention 6 month follow-up 9 month follow-up
100.00 87.50 100.00 100.00
46.67 46.67 40.00 43.33
28.95 34.21 26.32 31.58
95.00 95.00 100.00 90.00
66.67 55.56 66.67 50.00
81.25 93.75 68.75 87.50
33.33 33.33 41.67 25.00
45.00 55.00 50.00 50.00
85.71 85.71 64.29 100.00
61.90 61.43 59.52 60.90
N4 Pre-intervention End of intervention 6 month follow-up 9 month follow-up
72.73 70.83 70.83 59.09
50.00 43.33 76.67 43.33
42.11 21.05 52.63 18.42
45.00 40.00 65.00 45.00
16.67 38.89 75.00 27.78
68.75 62.50 75.00 56.25
25.00 41.67 66.67 50.00
15.00 25.00 45.00 20.00
100.00 50.00 78.57 100.00
45.67 41.43 66.67 40.87
N5 Pre-intervention End of intervention 6 month follow-up 9 month follow-up
36.36 70.83 59.09 70.83
36.67 46.67 60.00 66.67
42.11 39.47 42.11 36.84
60.00 65.00 65.00 55.00
52.78 36.11 42.22 52.78
43.75 62.50 64.29 64.29
33.33 33.33 41.67 58.33
30.00 20.00 10.00 30.00
35.71 28.57 50.00 64.29
42.31 44.76 48.54 53.85
N6 Pre-intervention End of intervention 6 month follow-up 9 month follow-up
70.83 70.83 25.00 79.17
70.00 83.33 56.67 66.67
34.21 42.11 39.47 47.37
72.22 60.00 45.00 65.00
77.78 69.44 41.67 69.44
93.75 81.25 25.00 43.75
58.33 66.67 41.67 50.00
20.00 20.00 30.00 25.00
71.43 64.29 57.14 64.29
61.54 61.43 40.48 58.10
N7 Pre-intervention End of intervention 6 month follow-up 9 month follow-up
86.36 66.67 100.00 100.00
50.00 50.00 63.33 66.67
34.21 44.74 52.68 100.00
55.00 70.00 70.00 70.00
72.22 69.44 61.11 69.44
75.00 87.50 75.00 75.00
50.00 58.33 50.00 83.33
25.00 30.00 15.00 10.00
92.86 92.86 78.57 85.71
57.69 60.48 62.38 73.33
N8 Pre-intervention End of intervention 6 month follow-up 9 month follow-up
75.00 75.00 79.17 87.50
66.67 63.33 70.00 73.33
64.11 52.63 52.68 81.58
75.00 55.00 80.00 85.00
77.28 77.78 75.00 75.00
75.00 75.00 75.00 87.50
83.33 66.67 50.00 83.33
66.67 75.00 80.00 80.00
85.71 71.43 78.57 78.57
73.04 67.14 68.59 80.48
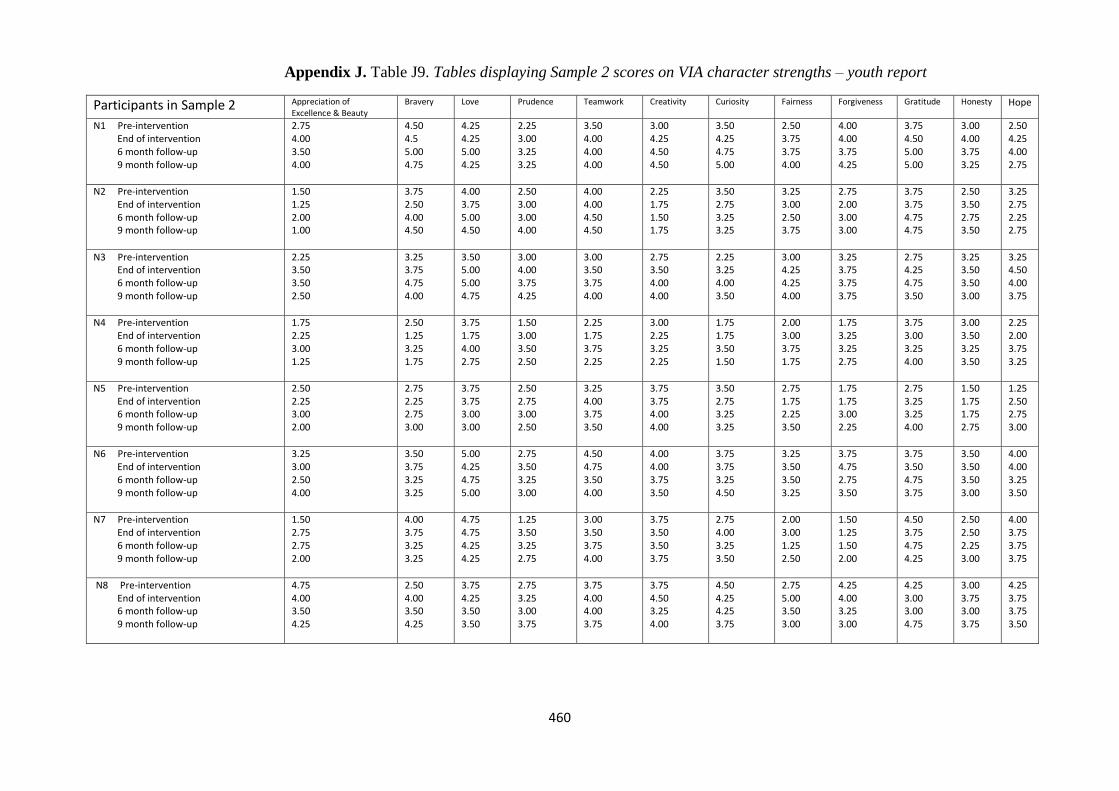
460
Participants in Sample 2 Appreciation of Excellence & Beauty
Bravery Love Prudence Teamwork Creativity Curiosity Fairness Forgiveness Gratitude Honesty Hope
N1 Pre-intervention End of intervention 6 month follow-up 9 month follow-up
2.75 4.00 3.50 4.00
4.50 4.5 5.00 4.75
4.25 4.25 5.00 4.25
2.25 3.00 3.25 3.25
3.50 4.00 4.00 4.00
3.00 4.25 4.50 4.50
3.50 4.25 4.75 5.00
2.50 3.75 3.75 4.00
4.00 4.00 3.75 4.25
3.75 4.50 5.00 5.00
3.00 4.00 3.75 3.25
2.50 4.25 4.00 2.75
N2 Pre-intervention End of intervention 6 month follow-up 9 month follow-up
1.50 1.25 2.00 1.00
3.75 2.50 4.00 4.50
4.00 3.75 5.00 4.50
2.50 3.00 3.00 4.00
4.00 4.00 4.50 4.50
2.25 1.75 1.50 1.75
3.50 2.75 3.25 3.25
3.25 3.00 2.50 3.75
2.75 2.00 3.00 3.00
3.75 3.75 4.75 4.75
2.50 3.50 2.75 3.50
3.25 2.75 2.25 2.75
N3 Pre-intervention End of intervention 6 month follow-up 9 month follow-up
2.25 3.50 3.50 2.50
3.25 3.75 4.75 4.00
3.50 5.00 5.00 4.75
3.00 4.00 3.75 4.25
3.00 3.50 3.75 4.00
2.75 3.50 4.00 4.00
2.25 3.25 4.00 3.50
3.00 4.25 4.25 4.00
3.25 3.75 3.75 3.75
2.75 4.25 4.75 3.50
3.25 3.50 3.50 3.00
3.25 4.50 4.00 3.75
N4 Pre-intervention End of intervention 6 month follow-up 9 month follow-up
1.75 2.25 3.00 1.25
2.50 1.25 3.25 1.75
3.75 1.75 4.00 2.75
1.50 3.00 3.50 2.50
2.25 1.75 3.75 2.25
3.00 2.25 3.25 2.25
1.75 1.75 3.50 1.50
2.00 3.00 3.75 1.75
1.75 3.25 3.25 2.75
3.75 3.00 3.25 4.00
3.00 3.50 3.25 3.50
2.25 2.00 3.75 3.25
N5 Pre-intervention End of intervention 6 month follow-up 9 month follow-up
2.50 2.25 3.00 2.00
2.75 2.25 2.75 3.00
3.75 3.75 3.00 3.00
2.50 2.75 3.00 2.50
3.25 4.00 3.75 3.50
3.75 3.75 4.00 4.00
3.50 2.75 3.25 3.25
2.75 1.75 2.25 3.50
1.75 1.75 3.00 2.25
2.75 3.25 3.25 4.00
1.50 1.75 1.75 2.75
1.25 2.50 2.75 3.00
N6 Pre-intervention End of intervention 6 month follow-up 9 month follow-up
3.25 3.00 2.50 4.00
3.50 3.75 3.25 3.25
5.00 4.25 4.75 5.00
2.75 3.50 3.25 3.00
4.50 4.75 3.50 4.00
4.00 4.00 3.75 3.50
3.75 3.75 3.25 4.50
3.25 3.50 3.50 3.25
3.75 4.75 2.75 3.50
3.75 3.50 4.75 3.75
3.50 3.50 3.50 3.00
4.00 4.00 3.25 3.50
N7 Pre-intervention End of intervention 6 month follow-up 9 month follow-up
1.50 2.75 2.75 2.00
4.00 3.75 3.25 3.25
4.75 4.75 4.25 4.25
1.25 3.50 3.25 2.75
3.00 3.50 3.75 4.00
3.75 3.50 3.50 3.75
2.75 4.00 3.25 3.50
2.00 3.00 1.25 2.50
1.50 1.25 1.50 2.00
4.50 3.75 4.75 4.25
2.50 2.50 2.25 3.00
4.00 3.75 3.75 3.75
N8 Pre-intervention End of intervention 6 month follow-up 9 month follow-up
4.75 4.00 3.50 4.25
2.50 4.00 3.50 4.25
3.75 4.25 3.50 3.50
2.75 3.25 3.00 3.75
3.75 4.00 4.00 3.75
3.75 4.50 3.25 4.00
4.50 4.25 4.25 3.75
2.75 5.00 3.50 3.00
4.25 4.00 3.25 3.00
4.25 3.00 3.00 4.75
3.00 3.75 3.00 3.75
4.25 3.75 3.75 3.50
Appendix J. Table J9. Tables displaying Sample 2 scores on VIA character strengths – youth report
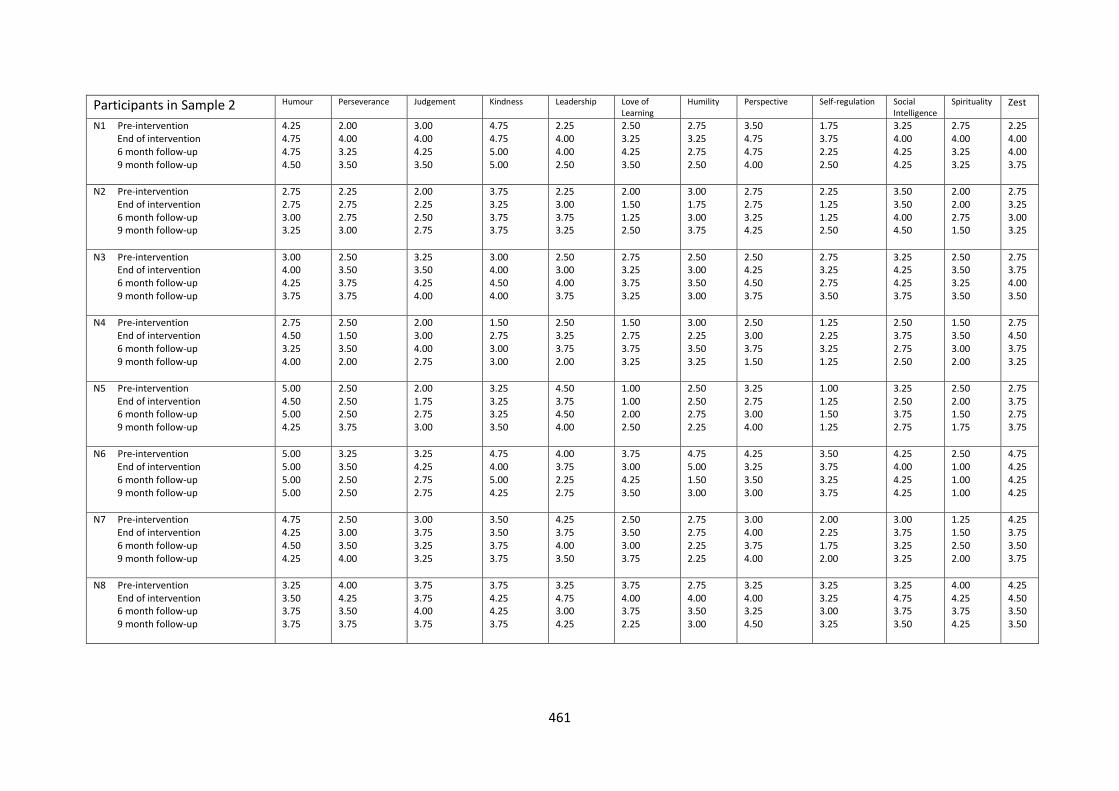
461
Participants in Sample 2 Humour Perseverance Judgement Kindness Leadership Love of Learning
Humility Perspective Self-regulation Social Intelligence
Spirituality Zest
N1 Pre-intervention End of intervention 6 month follow-up 9 month follow-up
4.25 4.75 4.75 4.50
2.00 4.00 3.25 3.50
3.00 4.00 4.25 3.50
4.75 4.75 5.00 5.00
2.25 4.00 4.00 2.50
2.50 3.25 4.25 3.50
2.75 3.25 2.75 2.50
3.50 4.75 4.75 4.00
1.75 3.75 2.25 2.50
3.25 4.00 4.25 4.25
2.75 4.00 3.25 3.25
2.25 4.00 4.00 3.75
N2 Pre-intervention End of intervention 6 month follow-up 9 month follow-up
2.75 2.75 3.00 3.25
2.25 2.75 2.75 3.00
2.00 2.25 2.50 2.75
3.75 3.25 3.75 3.75
2.25 3.00 3.75 3.25
2.00 1.50 1.25 2.50
3.00 1.75 3.00 3.75
2.75 2.75 3.25 4.25
2.25 1.25 1.25 2.50
3.50 3.50 4.00 4.50
2.00 2.00 2.75 1.50
2.75 3.25 3.00 3.25
N3 Pre-intervention End of intervention 6 month follow-up 9 month follow-up
3.00 4.00 4.25 3.75
2.50 3.50 3.75 3.75
3.25 3.50 4.25 4.00
3.00 4.00 4.50 4.00
2.50 3.00 4.00 3.75
2.75 3.25 3.75 3.25
2.50 3.00 3.50 3.00
2.50 4.25 4.50 3.75
2.75 3.25 2.75 3.50
3.25 4.25 4.25 3.75
2.50 3.50 3.25 3.50
2.75 3.75 4.00 3.50
N4 Pre-intervention End of intervention 6 month follow-up 9 month follow-up
2.75 4.50 3.25 4.00
2.50 1.50 3.50 2.00
2.00 3.00 4.00 2.75
1.50 2.75 3.00 3.00
2.50 3.25 3.75 2.00
1.50 2.75 3.75 3.25
3.00 2.25 3.50 3.25
2.50 3.00 3.75 1.50
1.25 2.25 3.25 1.25
2.50 3.75 2.75 2.50
1.50 3.50 3.00 2.00
2.75 4.50 3.75 3.25
N5 Pre-intervention End of intervention 6 month follow-up 9 month follow-up
5.00 4.50 5.00 4.25
2.50 2.50 2.50 3.75
2.00 1.75 2.75 3.00
3.25 3.25 3.25 3.50
4.50 3.75 4.50 4.00
1.00 1.00 2.00 2.50
2.50 2.50 2.75 2.25
3.25 2.75 3.00 4.00
1.00 1.25 1.50 1.25
3.25 2.50 3.75 2.75
2.50 2.00 1.50 1.75
2.75 3.75 2.75 3.75
N6 Pre-intervention End of intervention 6 month follow-up 9 month follow-up
5.00 5.00 5.00 5.00
3.25 3.50 2.50 2.50
3.25 4.25 2.75 2.75
4.75 4.00 5.00 4.25
4.00 3.75 2.25 2.75
3.75 3.00 4.25 3.50
4.75 5.00 1.50 3.00
4.25 3.25 3.50 3.00
3.50 3.75 3.25 3.75
4.25 4.00 4.25 4.25
2.50 1.00 1.00 1.00
4.75 4.25 4.25 4.25
N7 Pre-intervention End of intervention 6 month follow-up 9 month follow-up
4.75 4.25 4.50 4.25
2.50 3.00 3.50 4.00
3.00 3.75 3.25 3.25
3.50 3.50 3.75 3.75
4.25 3.75 4.00 3.50
2.50 3.50 3.00 3.75
2.75 2.75 2.25 2.25
3.00 4.00 3.75 4.00
2.00 2.25 1.75 2.00
3.00 3.75 3.25 3.25
1.25 1.50 2.50 2.00
4.25 3.75 3.50 3.75
N8 Pre-intervention End of intervention 6 month follow-up 9 month follow-up
3.25 3.50 3.75 3.75
4.00 4.25 3.50 3.75
3.75 3.75 4.00 3.75
3.75 4.25 4.25 3.75
3.25 4.75 3.00 4.25
3.75 4.00 3.75 2.25
2.75 4.00 3.50 3.00
3.25 4.00 3.25 4.50
3.25 3.25 3.00 3.25
3.25 4.75 3.75 3.50
4.00 4.25 3.75 4.25
4.25 4.50 3.50 3.50
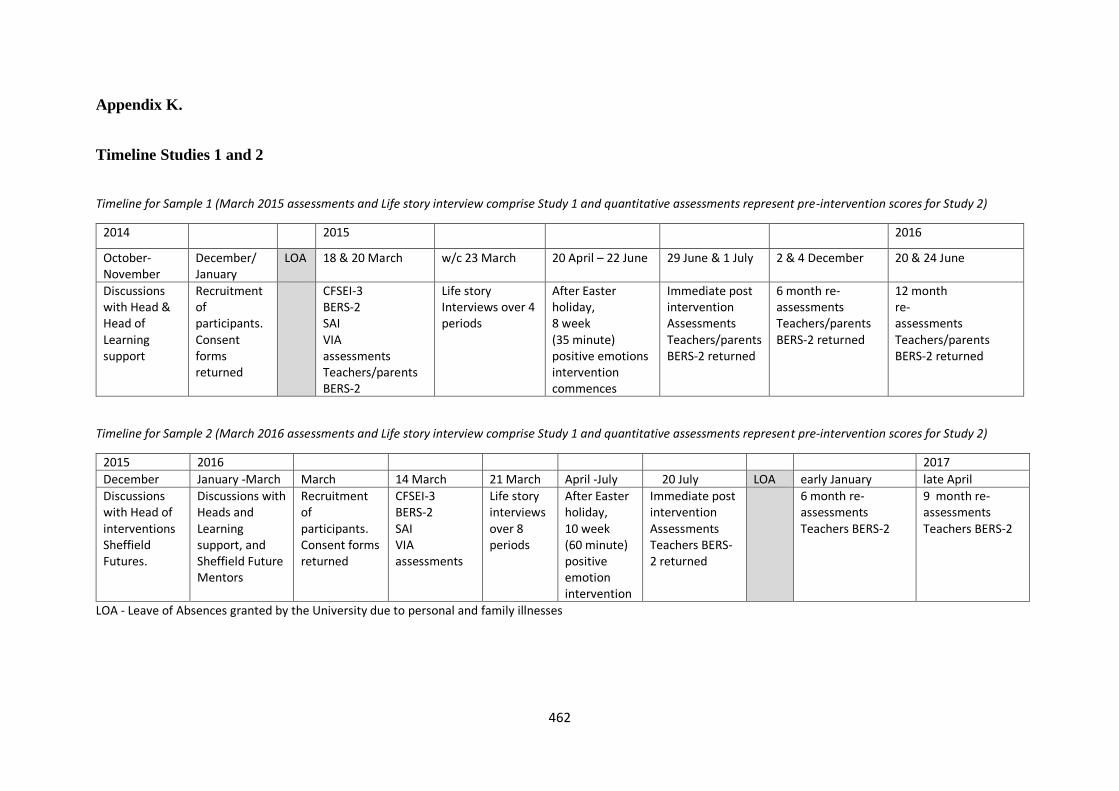
462
Appendix K.
Timeline Studies 1 and 2
Timeline for Sample 1 (March 2015 assessments and Life story interview comprise Study 1 and quantitative assessments represent pre-intervention scores for Study 2)
2014 2015 2016
October- November
December/ January
LOA 18 & 20 March w/c 23 March 20 April – 22 June 29 June & 1 July 2 & 4 December 20 & 24 June
Discussions with Head & Head of Learning support
Recruitment of participants. Consent forms returned
CFSEI-3 BERS-2 SAI VIA assessments Teachers/parents BERS-2
Life story Interviews over 4 periods
After Easter holiday, 8 week (35 minute) positive emotions intervention commences
Immediate post intervention Assessments Teachers/parents BERS-2 returned
6 month re-assessments Teachers/parents BERS-2 returned
12 month re- assessments Teachers/parents BERS-2 returned
Timeline for Sample 2 (March 2016 assessments and Life story interview comprise Study 1 and quantitative assessments represent pre-intervention scores for Study 2)
2015 2016 2017
December January -March March 14 March 21 March April -July 20 July LOA early January late April
Discussions with Head of interventions Sheffield Futures.
Discussions with Heads and Learning support, and Sheffield Future Mentors
Recruitment of participants. Consent forms returned
CFSEI-3 BERS-2 SAI VIA assessments
Life story interviews over 8 periods
After Easter holiday, 10 week (60 minute) positive emotion intervention
Immediate post intervention Assessments Teachers BERS-2 returned
6 month re-assessments Teachers BERS-2
9 month re- assessments Teachers BERS-2
LOA - Leave of Absences granted by the University due to personal and family illnesses
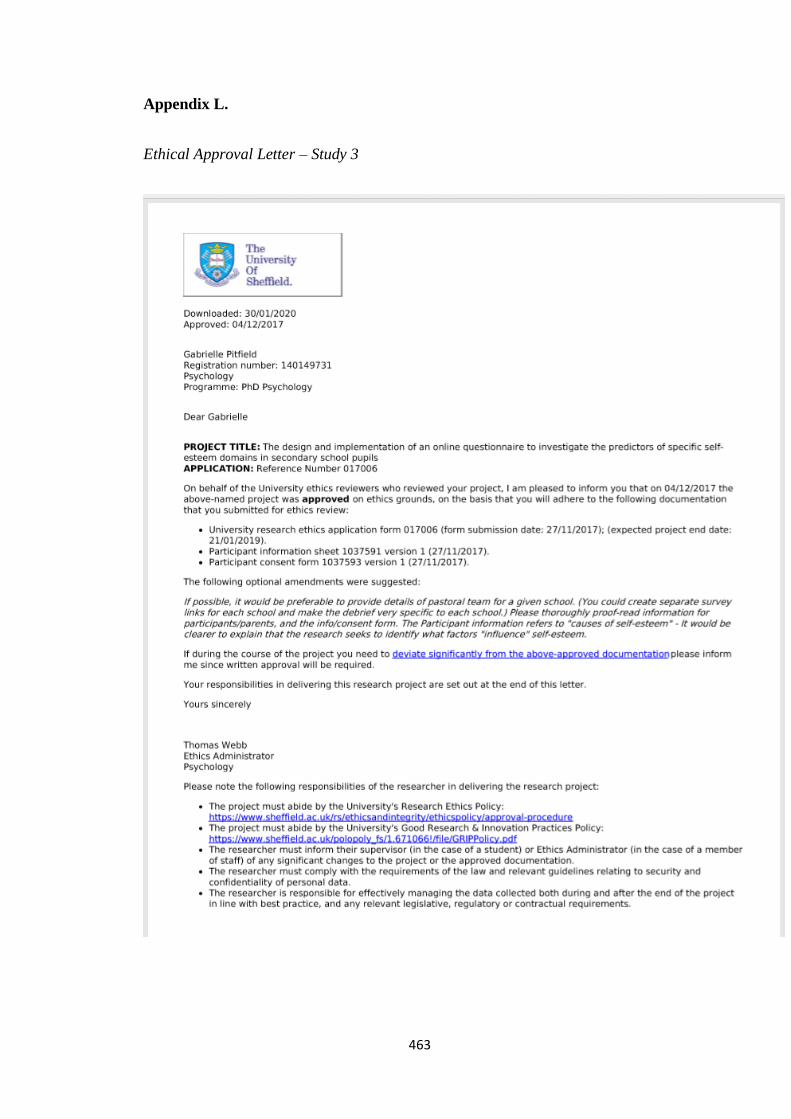
463
Appendix L.
Ethical Approval Letter – Study 3
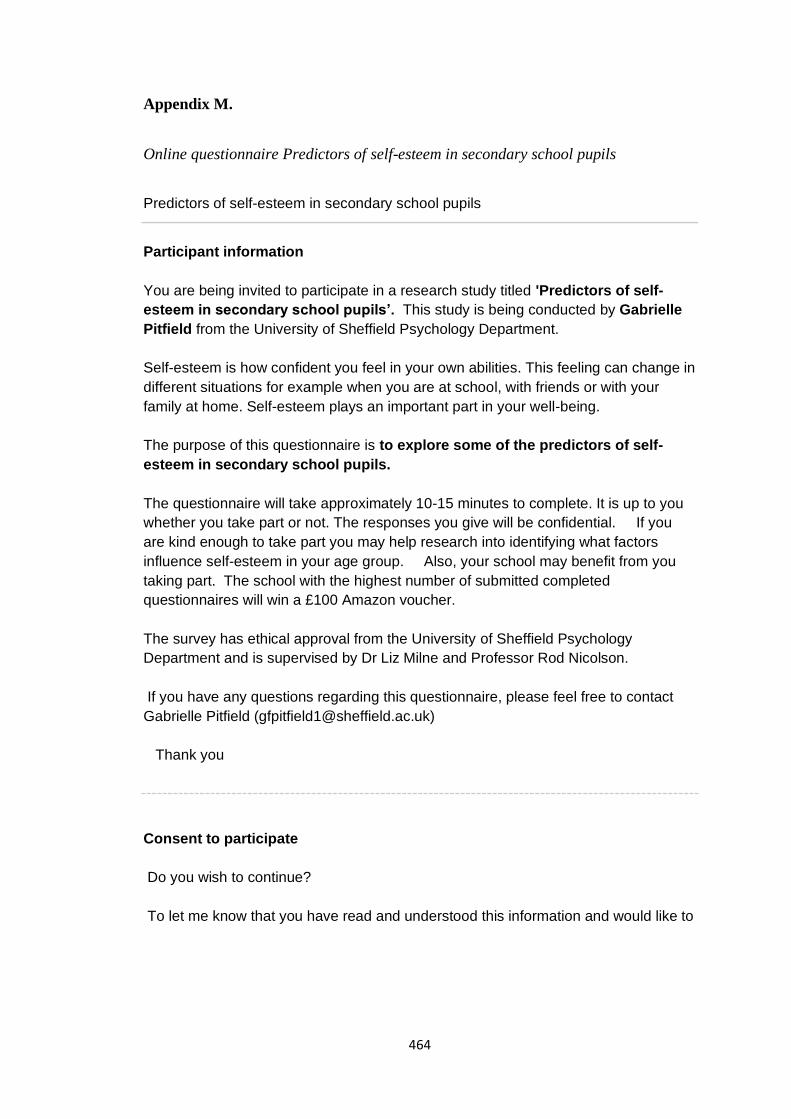
464
Appendix M.
Online questionnaire Predictors of self-esteem in secondary school pupils
Predictors of self-esteem in secondary school pupils
Participant information
You are being invited to participate in a research study titled 'Predictors of self-
esteem in secondary school pupils’. This study is being conducted by Gabrielle
Pitfield from the University of Sheffield Psychology Department.
Self-esteem is how confident you feel in your own abilities. This feeling can change in
different situations for example when you are at school, with friends or with your
family at home. Self-esteem plays an important part in your well-being.
The purpose of this questionnaire is to explore some of the predictors of self-
esteem in secondary school pupils.
The questionnaire will take approximately 10-15 minutes to complete. It is up to you
whether you take part or not. The responses you give will be confidential. If you
are kind enough to take part you may help research into identifying what factors
influence self-esteem in your age group. Also, your school may benefit from you
taking part. The school with the highest number of submitted completed
questionnaires will win a £100 Amazon voucher.
The survey has ethical approval from the University of Sheffield Psychology
Department and is supervised by Dr Liz Milne and Professor Rod Nicolson.
If you have any questions regarding this questionnaire, please feel free to contact
Gabrielle Pitfield ([email protected])
Thank you
Consent to participate
Do you wish to continue?
To let me know that you have read and understood this information and would like to
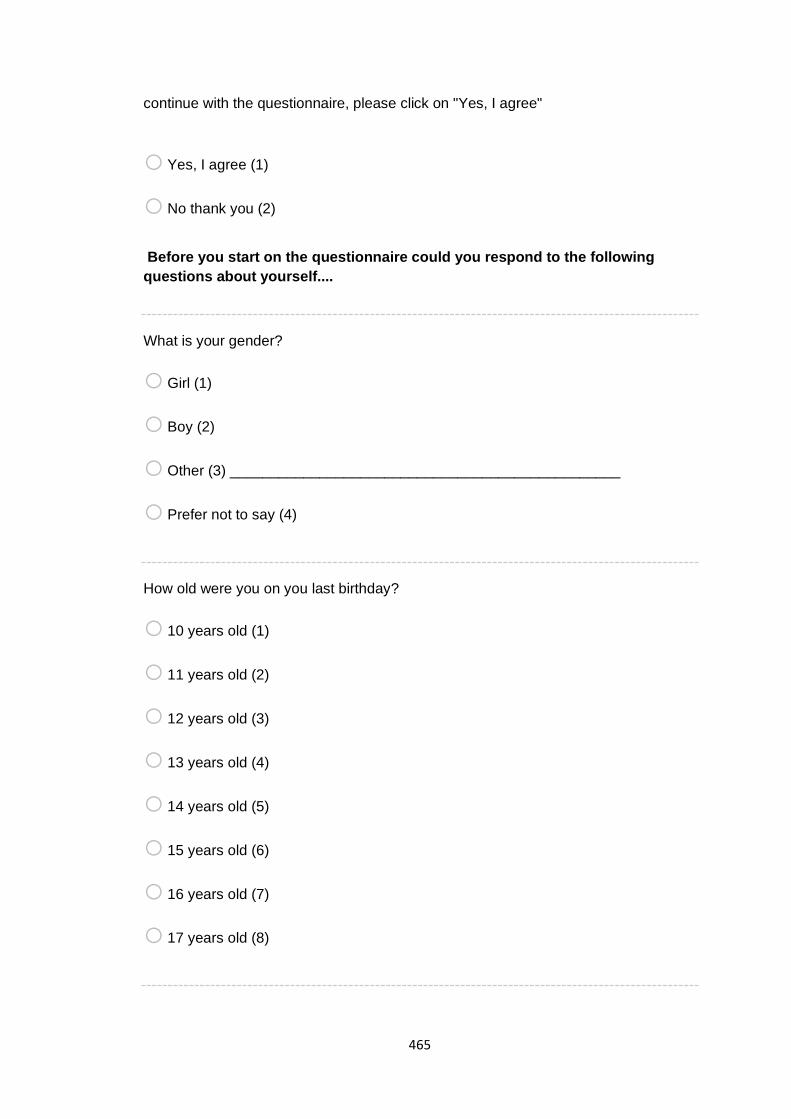
465
continue with the questionnaire, please click on "Yes, I agree"
o Yes, I agree (1)
o No thank you (2)
Before you start on the questionnaire could you respond to the following
questions about yourself....
What is your gender?
o Girl (1)
o Boy (2)
o Other (3) ________________________________________________
o Prefer not to say (4)
How old were you on you last birthday?
o 10 years old (1)
o 11 years old (2)
o 12 years old (3)
o 13 years old (4)
o 14 years old (5)
o 15 years old (6)
o 16 years old (7)
o 17 years old (8)
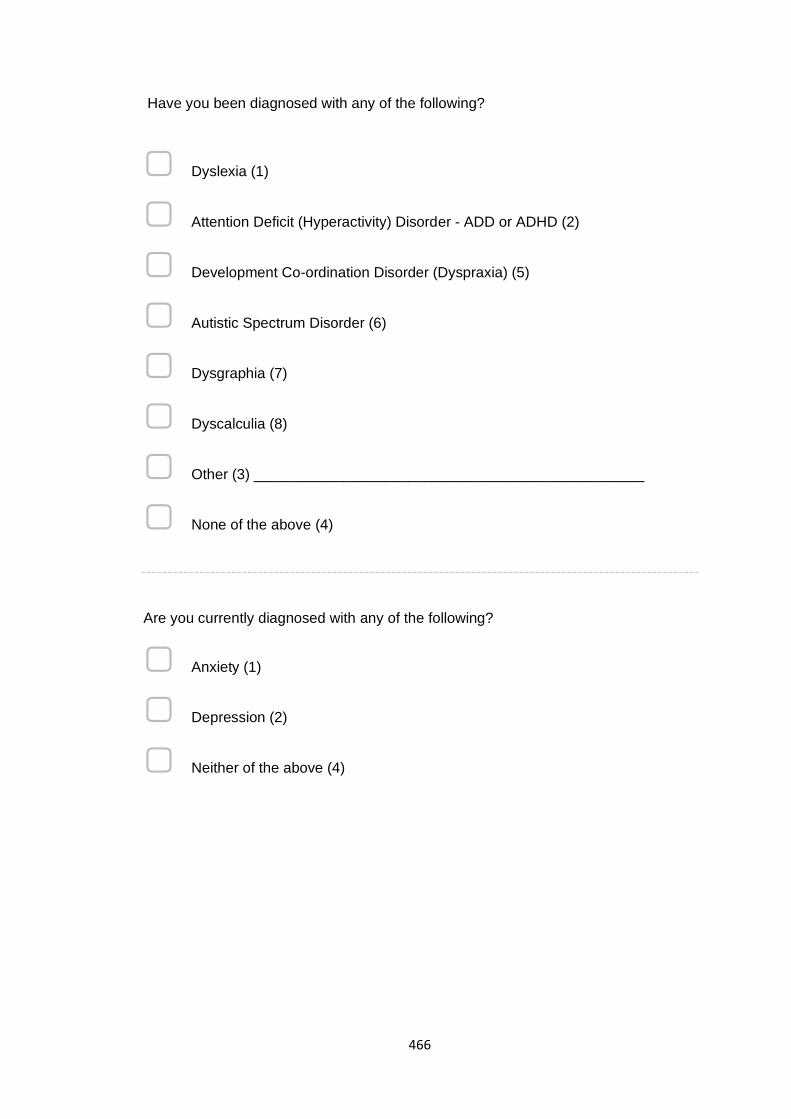
466
Have you been diagnosed with any of the following?
▢ Dyslexia (1)
▢ Attention Deficit (Hyperactivity) Disorder - ADD or ADHD (2)
▢ Development Co-ordination Disorder (Dyspraxia) (5)
▢ Autistic Spectrum Disorder (6)
▢ Dysgraphia (7)
▢ Dyscalculia (8)
▢ Other (3) ________________________________________________
▢ None of the above (4)
Are you currently diagnosed with any of the following?
▢ Anxiety (1)
▢ Depression (2)
▢ Neither of the above (4)
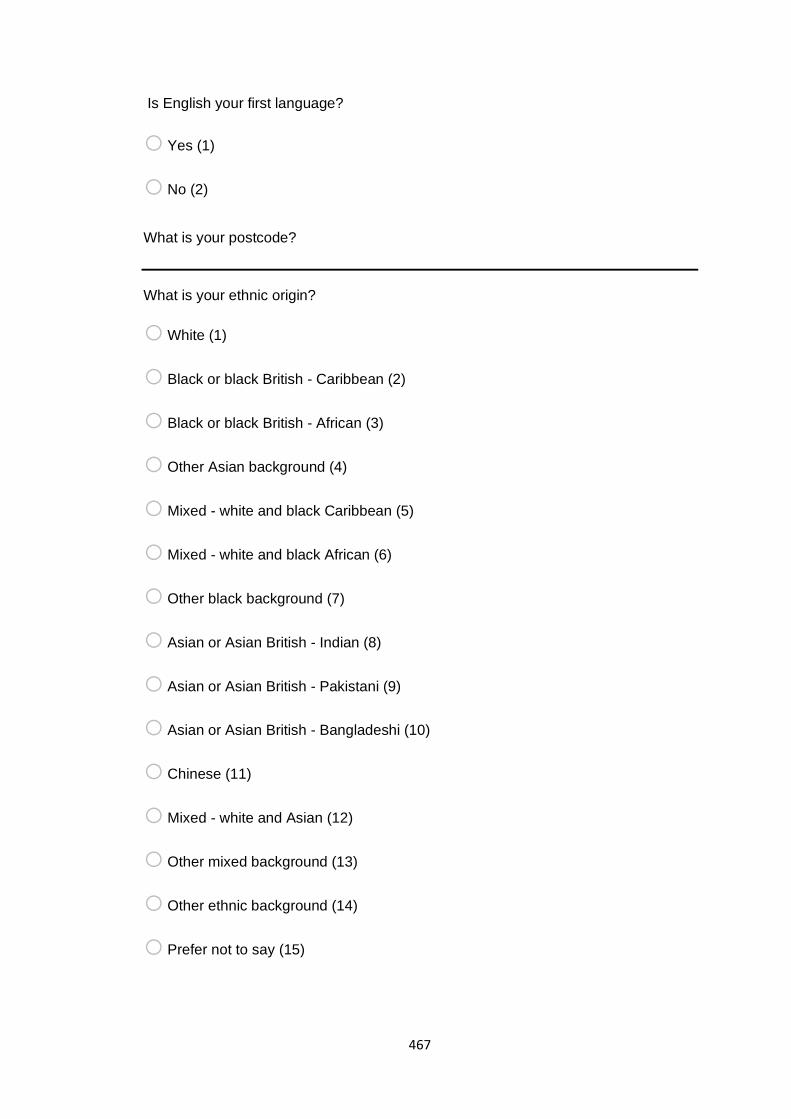
467
Is English your first language?
o Yes (1)
o No (2)
What is your postcode?
What is your ethnic origin?
o White (1)
o Black or black British - Caribbean (2)
o Black or black British - African (3)
o Other Asian background (4)
o Mixed - white and black Caribbean (5)
o Mixed - white and black African (6)
o Other black background (7)
o Asian or Asian British - Indian (8)
o Asian or Asian British - Pakistani (9)
o Asian or Asian British - Bangladeshi (10)
o Chinese (11)
o Mixed - white and Asian (12)
o Other mixed background (13)
o Other ethnic background (14)
o Prefer not to say (15)
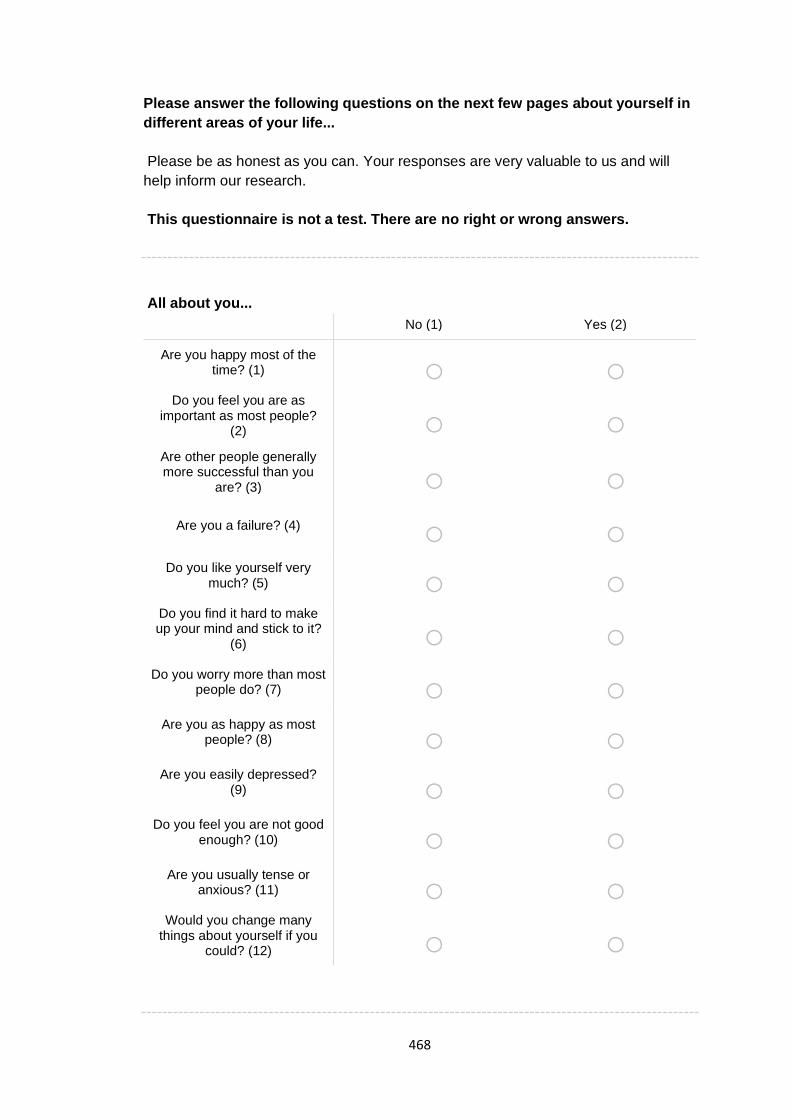
468
Please answer the following questions on the next few pages about yourself in
different areas of your life...
Please be as honest as you can. Your responses are very valuable to us and will
help inform our research.
This questionnaire is not a test. There are no right or wrong answers.
All about you...
No (1) Yes (2)
Are you happy most of the time? (1) o o
Do you feel you are as important as most people?
(2) o o Are other people generally more successful than you
are? (3) o o
Are you a failure? (4) o o Do you like yourself very
much? (5) o o Do you find it hard to make up your mind and stick to it?
(6) o o Do you worry more than most
people do? (7) o o Are you as happy as most
people? (8) o o Are you easily depressed?
(9) o o Do you feel you are not good
enough? (10) o o Are you usually tense or
anxious? (11) o o Would you change many
things about yourself if you could? (12) o o
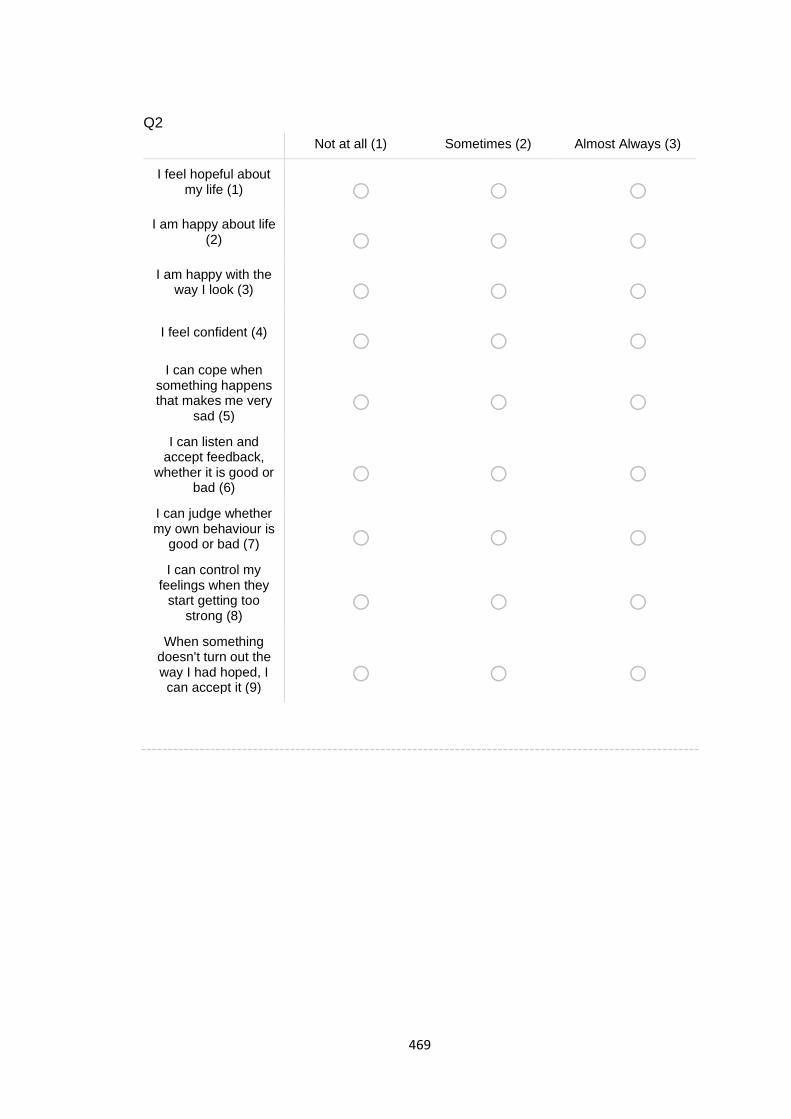
469
Q2
Not at all (1) Sometimes (2) Almost Always (3)
I feel hopeful about my life (1) o o o
I am happy about life (2) o o o
I am happy with the way I look (3) o o o
I feel confident (4) o o o I can cope when
something happens that makes me very
sad (5) o o o
I can listen and accept feedback,
whether it is good or bad (6)
o o o I can judge whether my own behaviour is
good or bad (7) o o o I can control my
feelings when they start getting too
strong (8) o o o
When something doesn't turn out the way I had hoped, I can accept it (9)
o o o
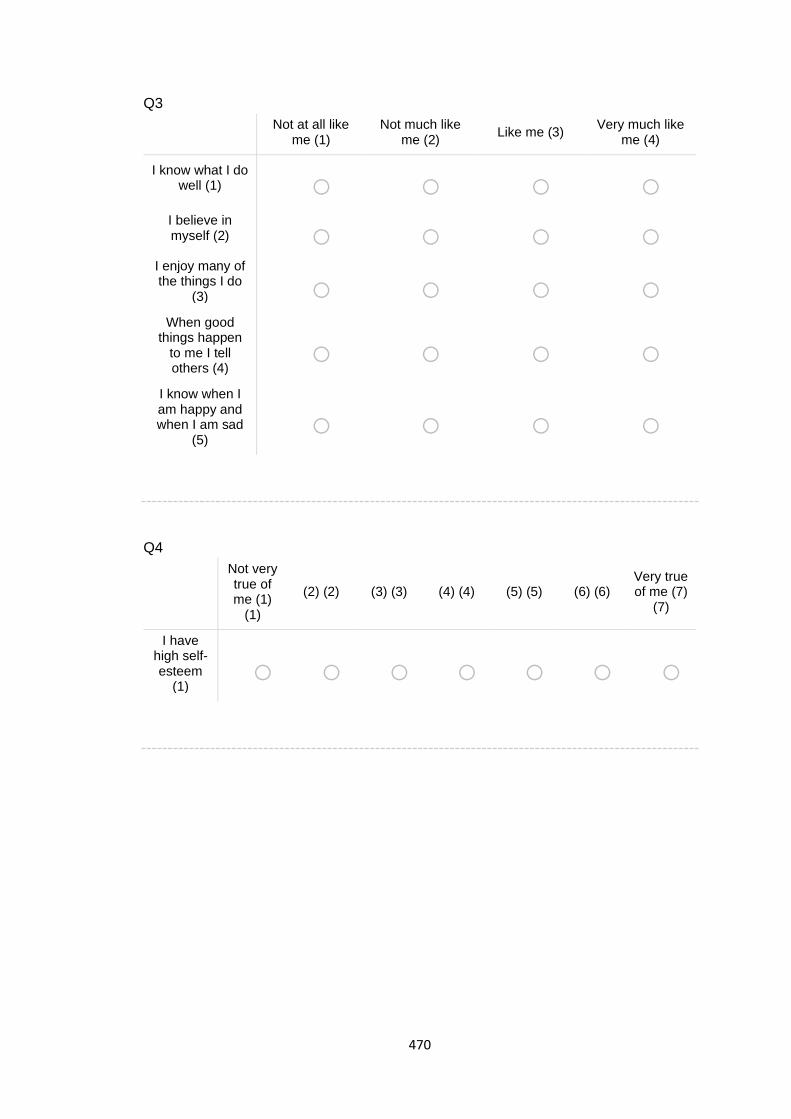
470
Q3
Not at all like
me (1) Not much like
me (2) Like me (3)
Very much like me (4)
I know what I do well (1) o o o o
I believe in myself (2) o o o o
I enjoy many of the things I do
(3) o o o o When good
things happen to me I tell others (4)
o o o o I know when I am happy and when I am sad
(5) o o o o
Q4
Not very true of me (1)
(1)
(2) (2) (3) (3) (4) (4) (5) (5) (6) (6) Very true of me (7)
(7)
I have high self-esteem
(1) o o o o o o o
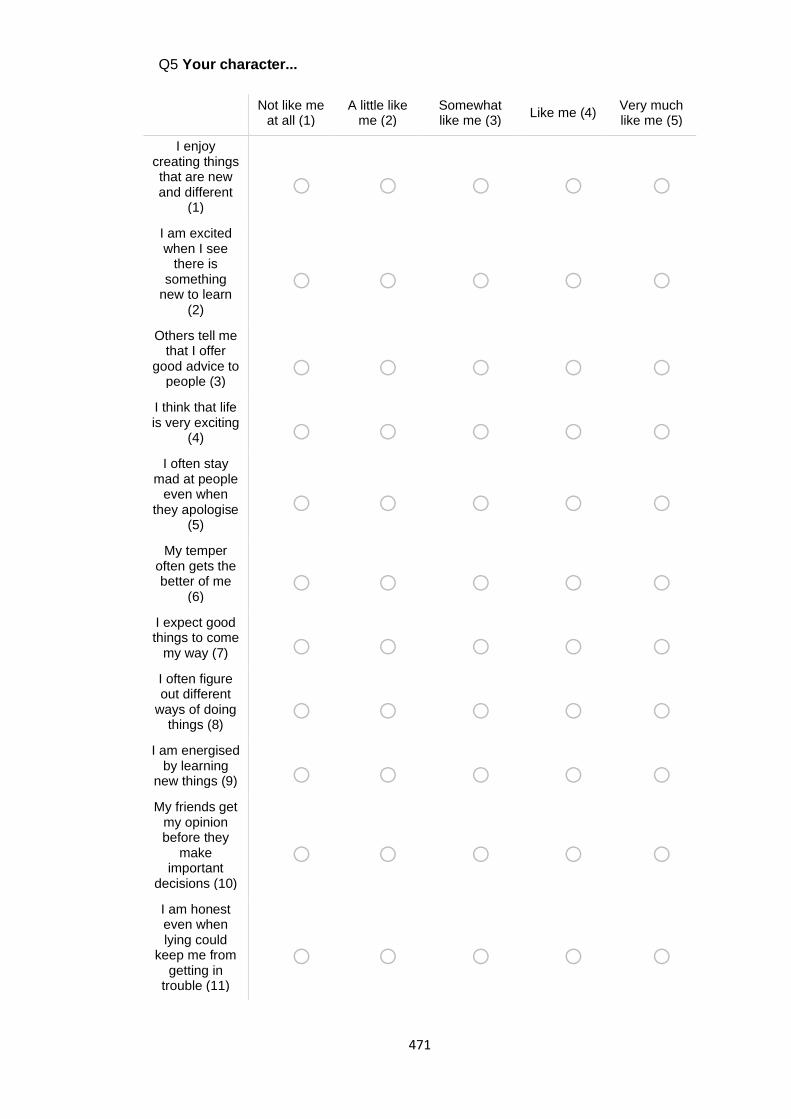
471
Not like me
at all (1) A little like
me (2) Somewhat like me (3)
Like me (4) Very much like me (5)
I enjoy creating things that are new and different
(1)
o o o o o
I am excited when I see
there is something
new to learn (2)
o o o o o
Others tell me that I offer
good advice to people (3)
o o o o o I think that life is very exciting
(4) o o o o o I often stay
mad at people even when
they apologise (5)
o o o o o
My temper often gets the better of me
(6) o o o o o
I expect good things to come
my way (7) o o o o o I often figure out different
ways of doing things (8)
o o o o o I am energised
by learning new things (9) o o o o o My friends get
my opinion before they
make important
decisions (10)
o o o o o
I am honest even when lying could
keep me from getting in
trouble (11)
o o o o o
Q5 Your character...
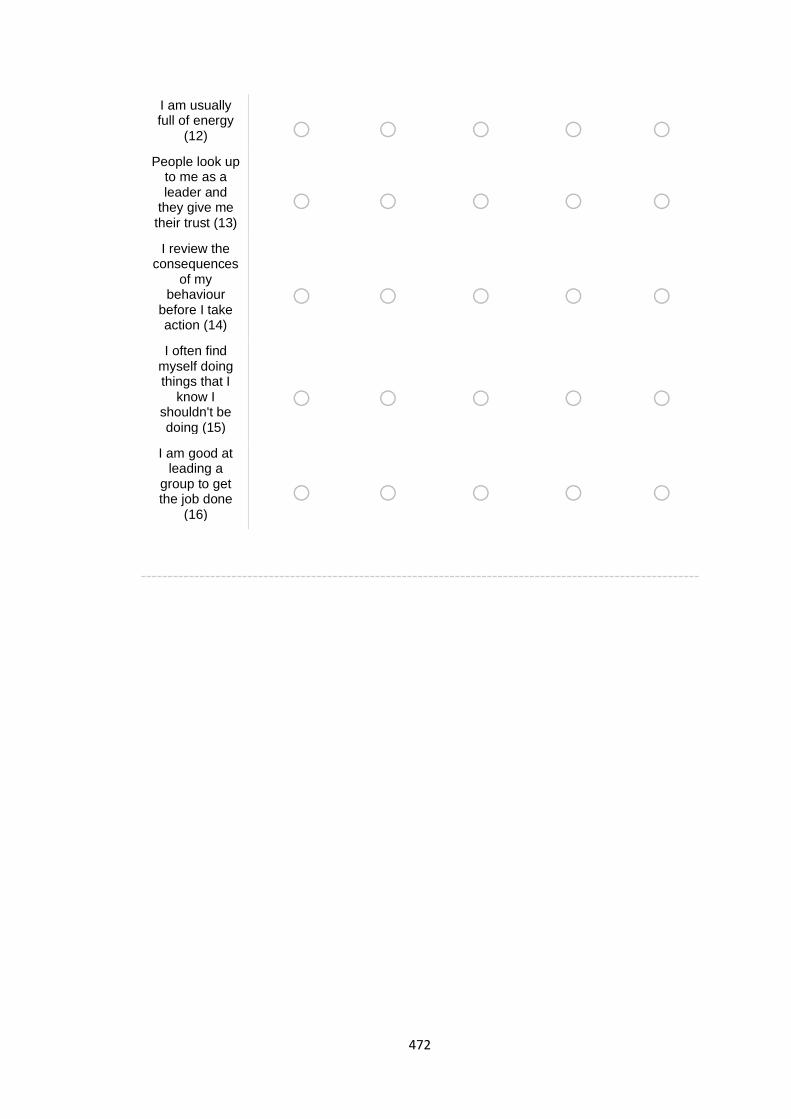
472
I am usually full of energy
(12) o o o o o People look up
to me as a leader and
they give me their trust (13)
o o o o o
I review the consequences
of my behaviour
before I take action (14)
o o o o o
I often find myself doing things that I
know I shouldn't be doing (15)
o o o o o
I am good at leading a
group to get the job done
(16)
o o o o o
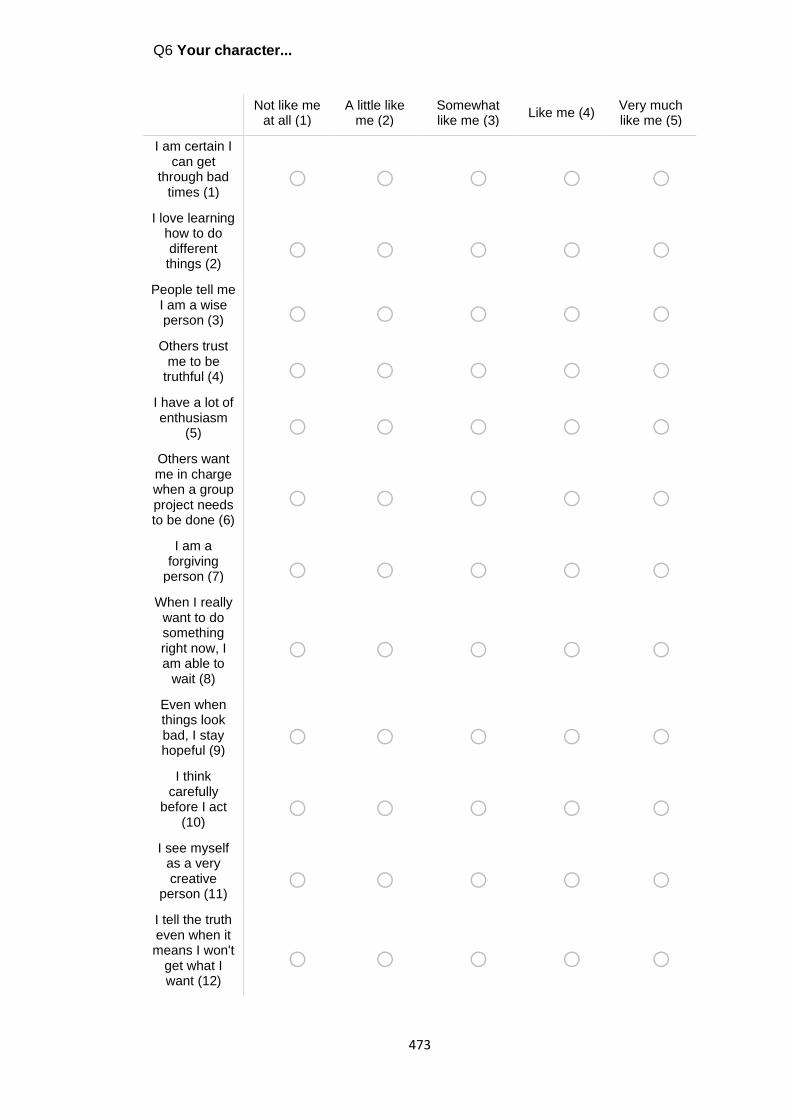
473
Not like me
at all (1) A little like
me (2) Somewhat like me (3)
Like me (4) Very much like me (5)
I am certain I can get
through bad times (1)
o o o o o I love learning
how to do different things (2)
o o o o o People tell me
I am a wise person (3) o o o o o
Others trust me to be
truthful (4) o o o o o I have a lot of enthusiasm
(5) o o o o o Others want me in charge when a group project needs to be done (6)
o o o o o
I am a forgiving
person (7) o o o o o When I really
want to do something right now, I am able to
wait (8)
o o o o o
Even when things look bad, I stay hopeful (9)
o o o o o I think
carefully before I act
(10) o o o o o
I see myself as a very creative
person (11) o o o o o
I tell the truth even when it means I won't
get what I want (12)
o o o o o
Q6 Your character...
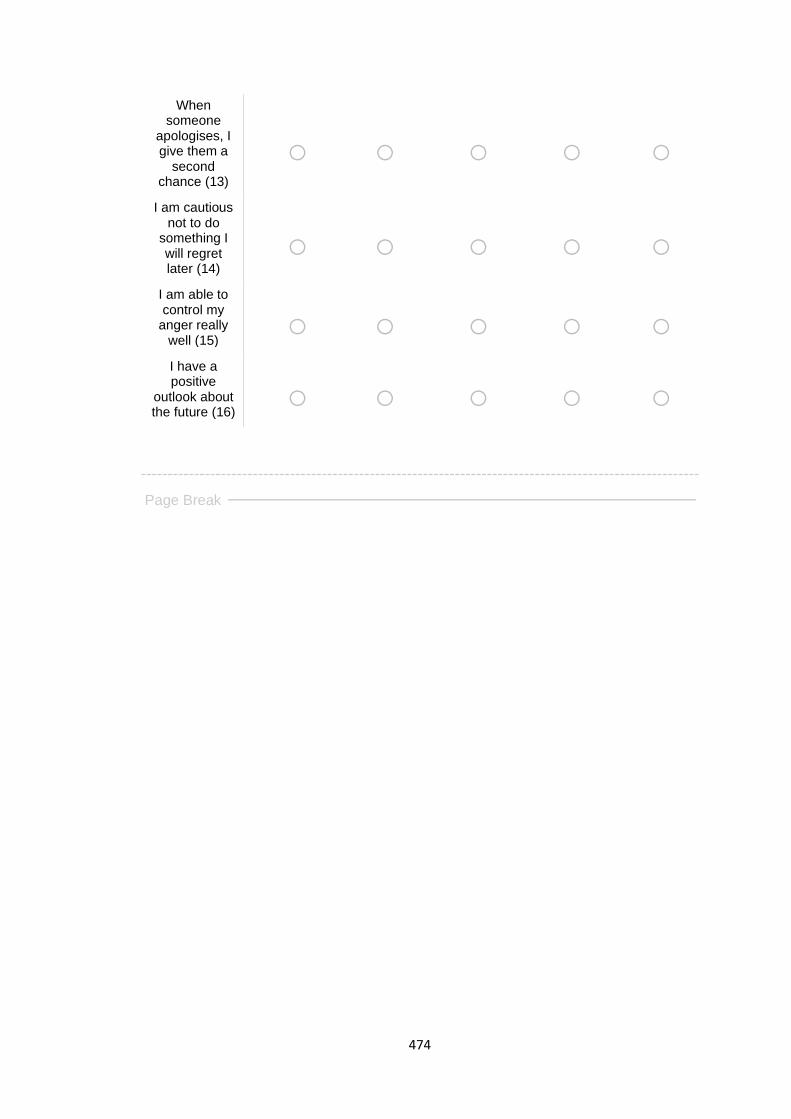
474
When someone
apologises, I give them a
second chance (13)
o o o o o
I am cautious not to do
something I will regret later (14)
o o o o o
I am able to control my
anger really well (15)
o o o o o I have a positive
outlook about the future (16)
o o o o o
Page Break
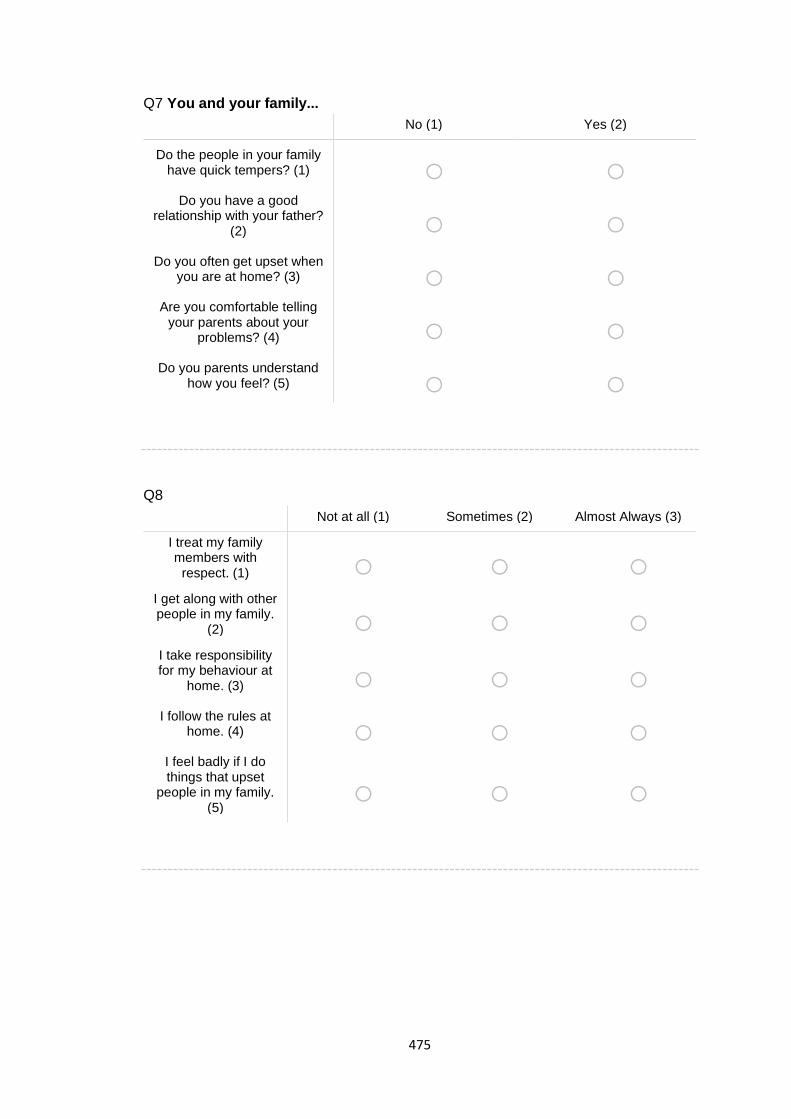
475
Q7 You and your family...
No (1) Yes (2)
Do the people in your family have quick tempers? (1) o o
Do you have a good relationship with your father?
(2) o o Do you often get upset when
you are at home? (3) o o Are you comfortable telling
your parents about your problems? (4) o o
Do you parents understand how you feel? (5) o o
Q8
Not at all (1) Sometimes (2) Almost Always (3)
I treat my family members with
respect. (1) o o o I get along with other people in my family.
(2) o o o I take responsibility for my behaviour at
home. (3) o o o I follow the rules at
home. (4) o o o I feel badly if I do things that upset
people in my family. (5)
o o o
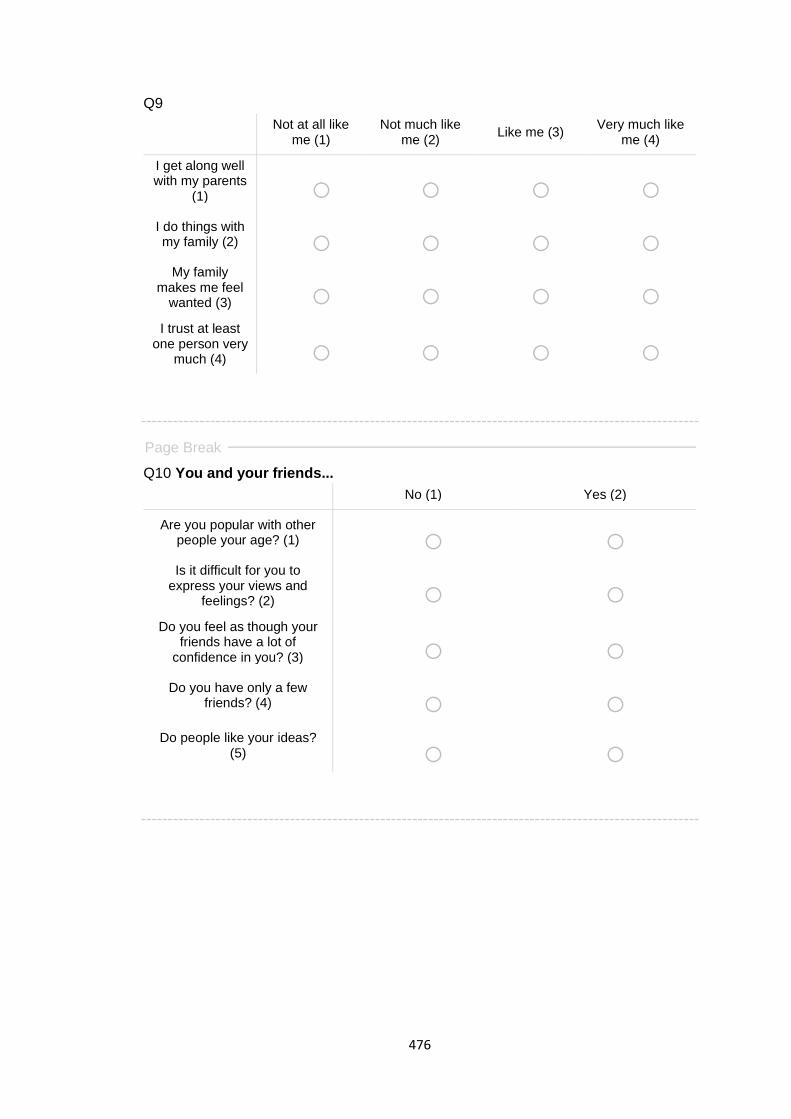
476
Q9
Not at all like
me (1) Not much like
me (2) Like me (3)
Very much like me (4)
I get along well with my parents
(1) o o o o I do things with my family (2) o o o o
My family makes me feel
wanted (3) o o o o I trust at least
one person very much (4) o o o o
Page Break
Q10 You and your friends...
No (1) Yes (2)
Are you popular with other people your age? (1) o o Is it difficult for you to
express your views and feelings? (2) o o
Do you feel as though your friends have a lot of
confidence in you? (3) o o Do you have only a few
friends? (4) o o Do people like your ideas?
(5) o o
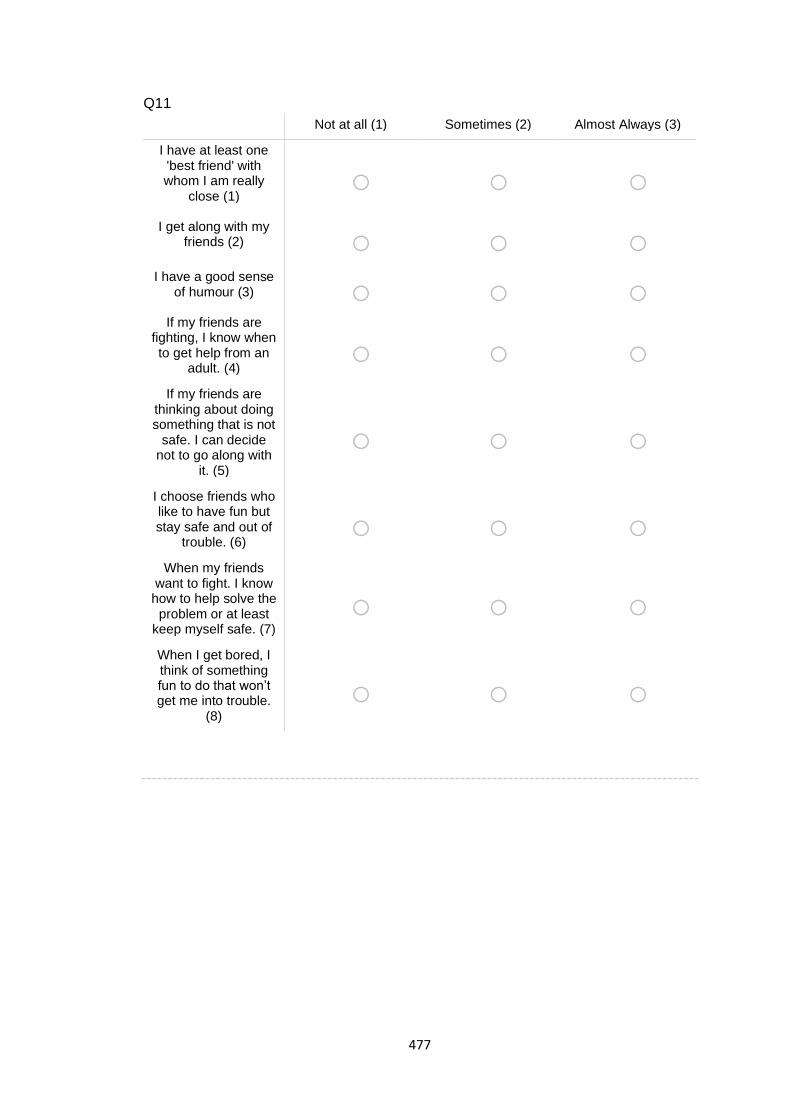
477
Q11
Not at all (1) Sometimes (2) Almost Always (3)
I have at least one 'best friend' with whom I am really
close (1) o o o
I get along with my friends (2) o o o
I have a good sense of humour (3) o o o
If my friends are fighting, I know when to get help from an
adult. (4) o o o
If my friends are thinking about doing something that is not
safe. I can decide not to go along with
it. (5)
o o o
I choose friends who like to have fun but stay safe and out of
trouble. (6) o o o
When my friends want to fight. I know
how to help solve the problem or at least
keep myself safe. (7)
o o o
When I get bored, I think of something fun to do that won’t get me into trouble.
(8)
o o o
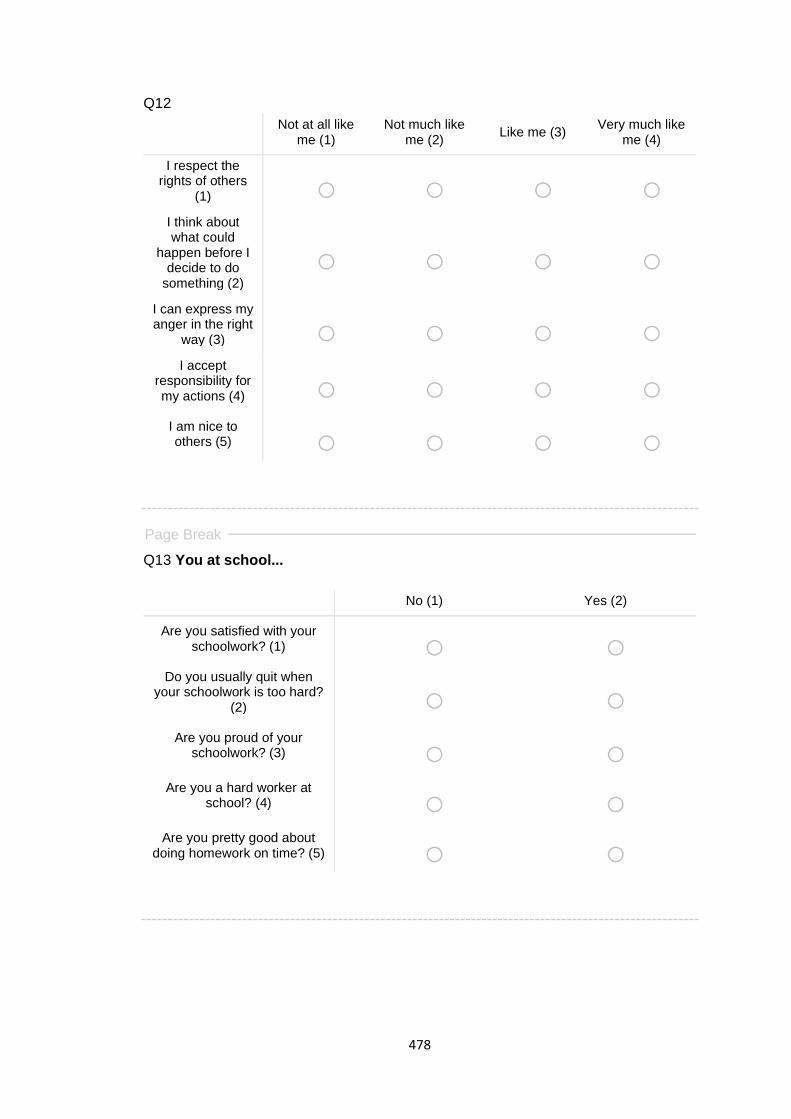
478
Q12
Not at all like
me (1) Not much like
me (2) Like me (3)
Very much like me (4)
I respect the rights of others
(1) o o o o I think about what could
happen before I decide to do
something (2)
o o o o
I can express my anger in the right
way (3) o o o o I accept
responsibility for my actions (4) o o o o
I am nice to others (5) o o o o
Page Break
Q13 You at school...
No (1) Yes (2)
Are you satisfied with your schoolwork? (1) o o
Do you usually quit when your schoolwork is too hard?
(2) o o Are you proud of your
schoolwork? (3) o o Are you a hard worker at
school? (4) o o Are you pretty good about
doing homework on time? (5) o o
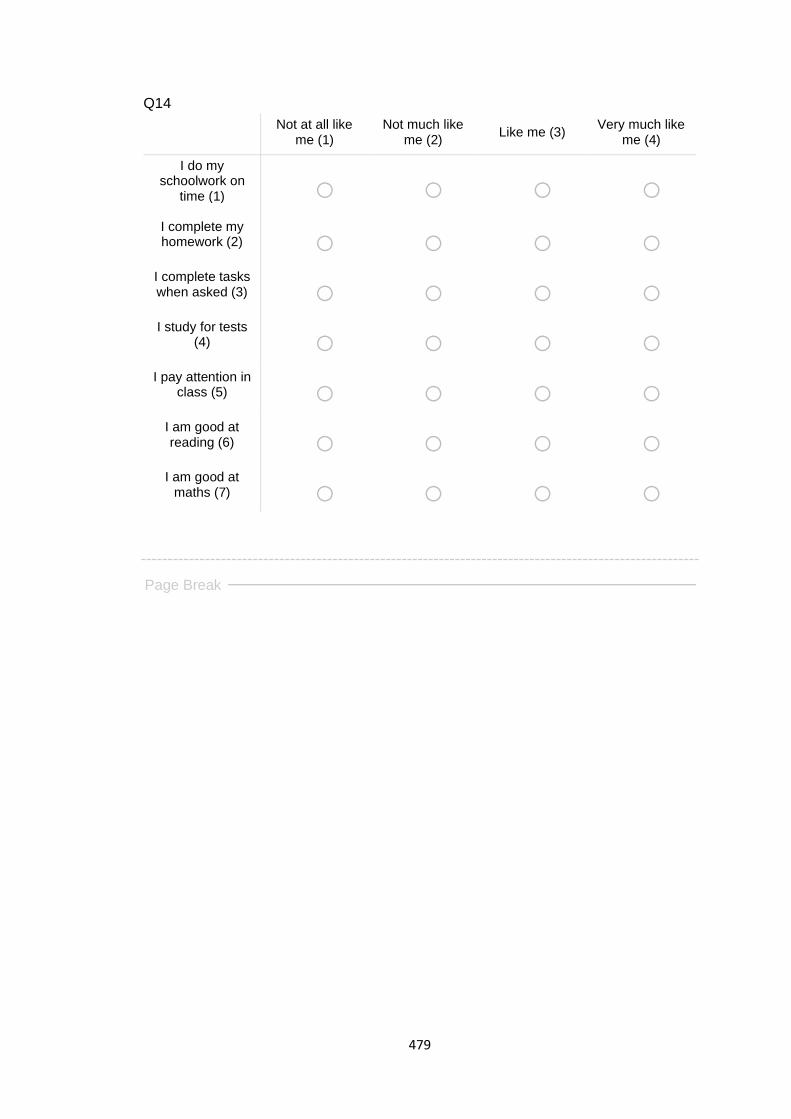
479
Q14
Not at all like
me (1) Not much like
me (2) Like me (3)
Very much like me (4)
I do my schoolwork on
time (1) o o o o I complete my homework (2) o o o o
I complete tasks when asked (3) o o o o I study for tests
(4) o o o o I pay attention in
class (5) o o o o I am good at reading (6) o o o o
I am good at maths (7) o o o o
Page Break
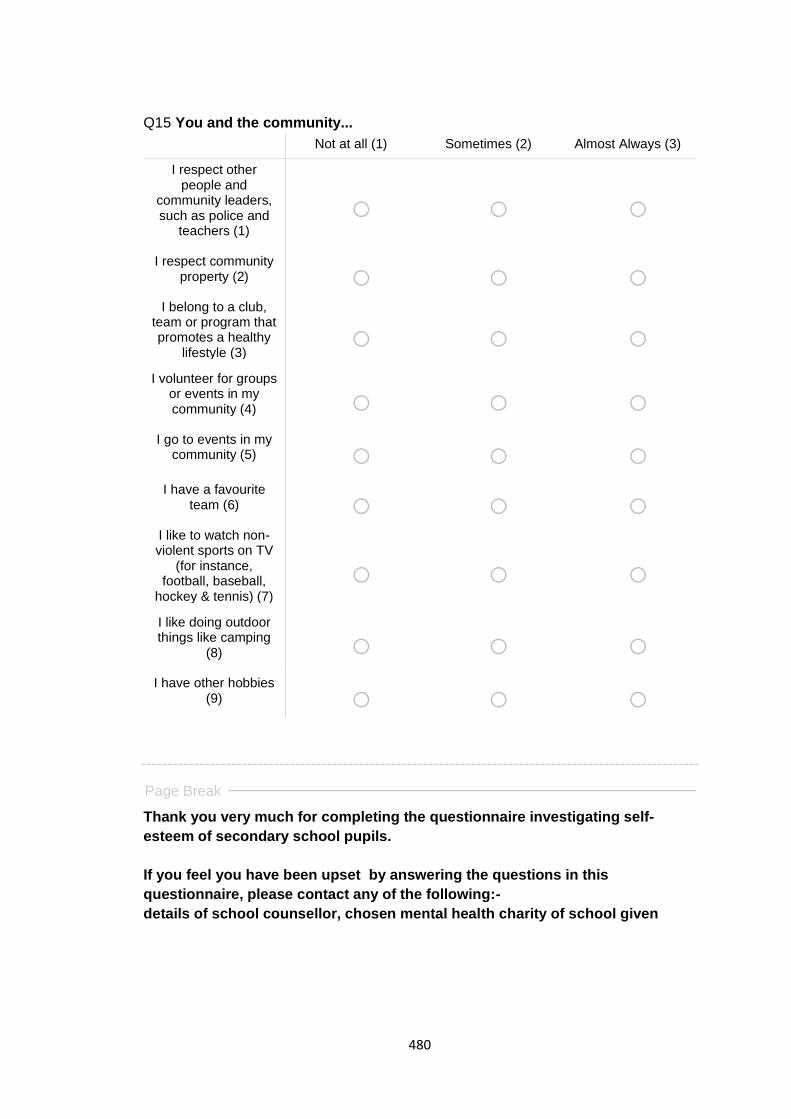
480
Q15 You and the community...
Not at all (1) Sometimes (2) Almost Always (3)
I respect other people and
community leaders, such as police and
teachers (1)
o o o
I respect community property (2) o o o
I belong to a club, team or program that promotes a healthy
lifestyle (3) o o o
I volunteer for groups or events in my community (4) o o o
I go to events in my community (5) o o o
I have a favourite team (6) o o o
I like to watch non- violent sports on TV
(for instance, football, baseball,
hockey & tennis) (7)
o o o
I like doing outdoor things like camping
(8) o o o I have other hobbies
(9) o o o
Page Break
Thank you very much for completing the questionnaire investigating self-
esteem of secondary school pupils.
If you feel you have been upset by answering the questions in this
questionnaire, please contact any of the following:-
details of school counsellor, chosen mental health charity of school given
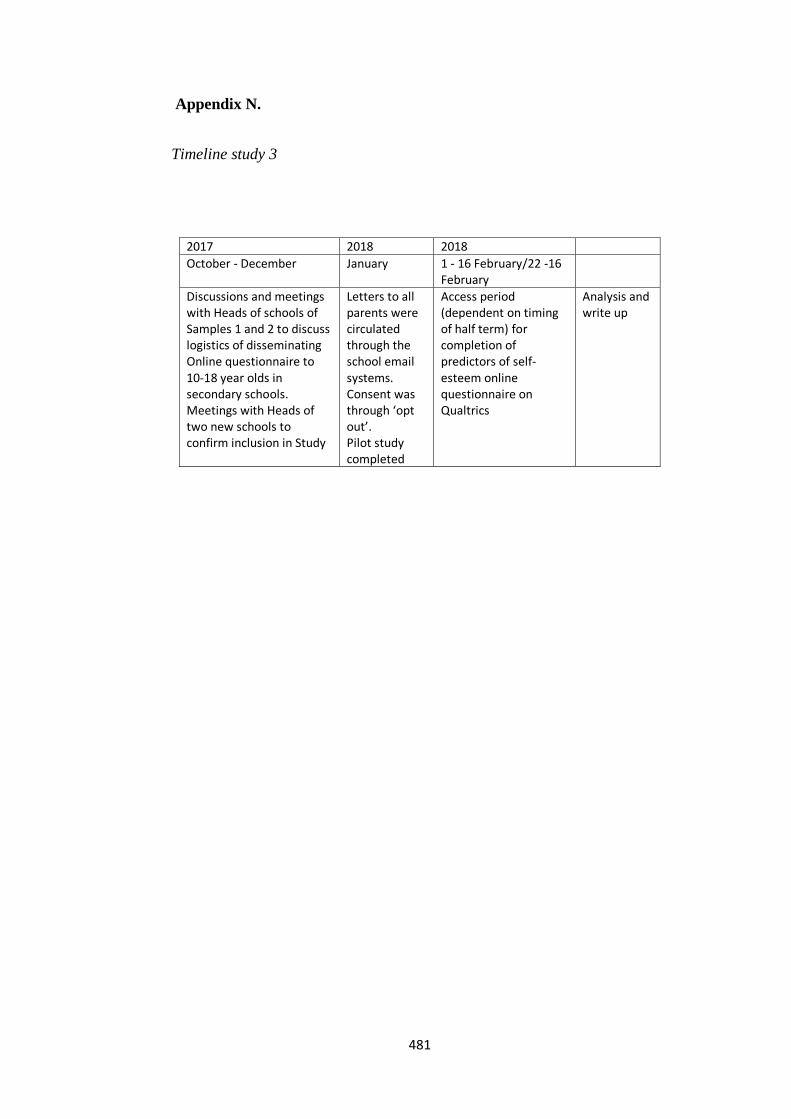
481
Appendix N.
Timeline study 3
2017 2018 2018
October - December January 1 - 16 February/22 -16 February
Discussions and meetings with Heads of schools of Samples 1 and 2 to discuss logistics of disseminating Online questionnaire to 10-18 year olds in secondary schools. Meetings with Heads of two new schools to confirm inclusion in Study
Letters to all parents were circulated through the school email systems. Consent was through ‘opt out’. Pilot study completed
Access period (dependent on timing of half term) for completion of predictors of self-esteem online questionnaire on Qualtrics
Analysis and write up

482
Appendix O.
Table O1 Hierarchical regression analysis for variables (without IMD)
predicting Academic self-esteem (N = 793).
_____________________________________________________________
Block Variable B SE B
_____________________________________________________________
1. Gender -0.22 0.09 -.09*
Age -0.21 0.03 -.23***
White 0.08 0.11 .03
SEN 0.57 0.17 .12**
2. Gender 0.00 0.07 .01
Age -0.07 0.02 -.08**
White 0.23 0.08 .06**
SEN 0.09 0.12 .02
School functioning 0.16 0.01 .50***
Knowing myself 0.12 0.02 .17***
Self-regulation 0.05 0.02 .10**
Pro-social attitude 0.05 0.02 .10**
Forgiveness -0.04 0.01 -.08**
Love of learning 0.05 0.02 .12**
Creativity -0.05 0.02 -.09**
________________________________________________________
Note.
Block 1 R2 = .09. Block 2 R2 = .55. * p < .05. ** p < .01. *** p < .001.

483
Appendix O.
Table O2 Hierarchical regression analysis for variables (without IMD)
predicting General self-esteem (N = 891).
_____________________________________________________________
Block Variable B SE B
_____________________________________________________________
1. Gender 0.10 0.10 .04
Age -0.21 0.04 -.21***
White 0.07 0.12 .02
SEN 0.55 0.19 .10**
2. Gender 0.04 0.07 .02
Age -0.02 0.03 -.02
White 0.01 0.08 .00
SEN 0.28 0.13 .05*
Knowing myself 0.36 0.03 .46***
Intrapersonal strength 0.09 0.02 .17***
Family involvement 0.07 0.02 .11**
School functioning 0.03 0.01 .09**
Forgiveness -0.04 0.01 -.07**
Creativity -0.04 0.02 -.09**
Hope 0.05 0.02 .11**
Being involved -0.04 0.02 -.06*
Peer connectedness 0.07 0.04 .06*
_____________________________________________________________
Note.
Block 1 R2 = .06. Block 2 R2 = .57. * p < .05. ** p < .01. *** p < .001.
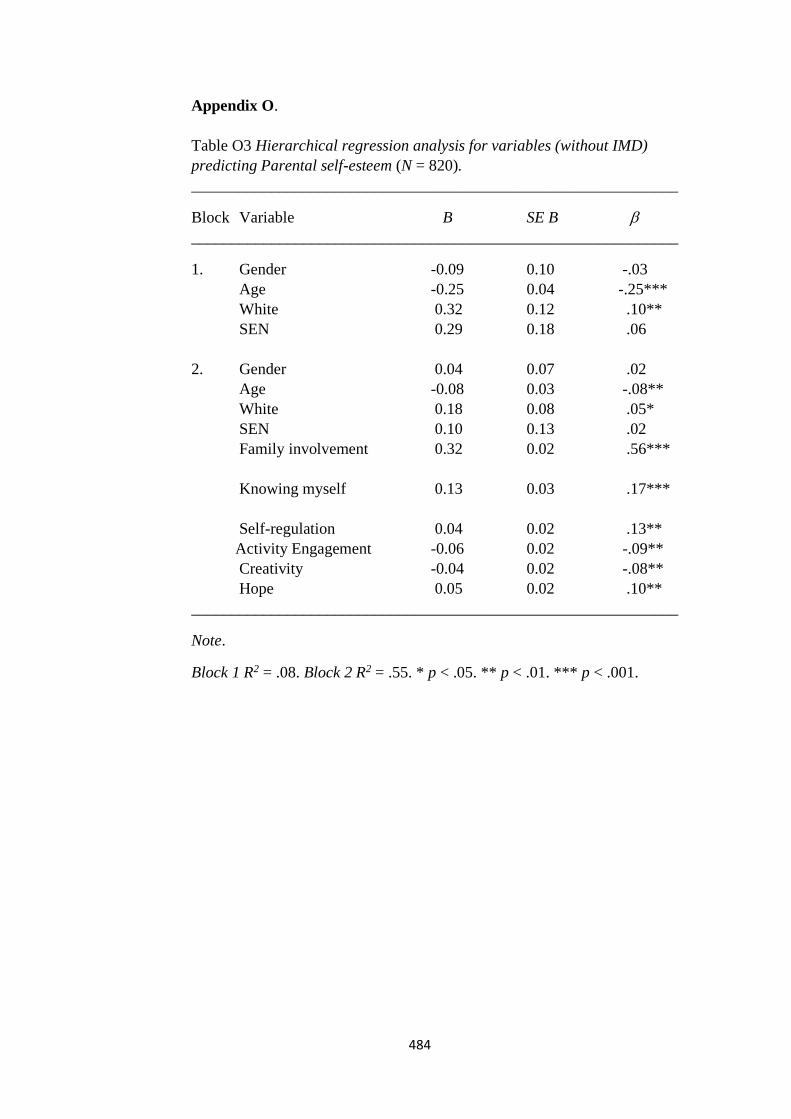
484
Appendix O.
Table O3 Hierarchical regression analysis for variables (without IMD)
predicting Parental self-esteem (N = 820).
_____________________________________________________________
Block Variable B SE B
_____________________________________________________________
1. Gender -0.09 0.10 -.03
Age -0.25 0.04 -.25***
White 0.32 0.12 .10**
SEN 0.29 0.18 .06
2. Gender 0.04 0.07 .02
Age -0.08 0.03 -.08**
White 0.18 0.08 .05*
SEN 0.10 0.13 .02
Family involvement 0.32 0.02 .56***
Knowing myself 0.13 0.03 .17***
Self-regulation 0.04 0.02 .13**
Activity Engagement -0.06 0.02 -.09**
Creativity -0.04 0.02 -.08**
Hope 0.05 0.02 .10**
_____________________________________________________________
Note.
Block 1 R2 = .08. Block 2 R2 = .55. * p < .05. ** p < .01. *** p < .001.
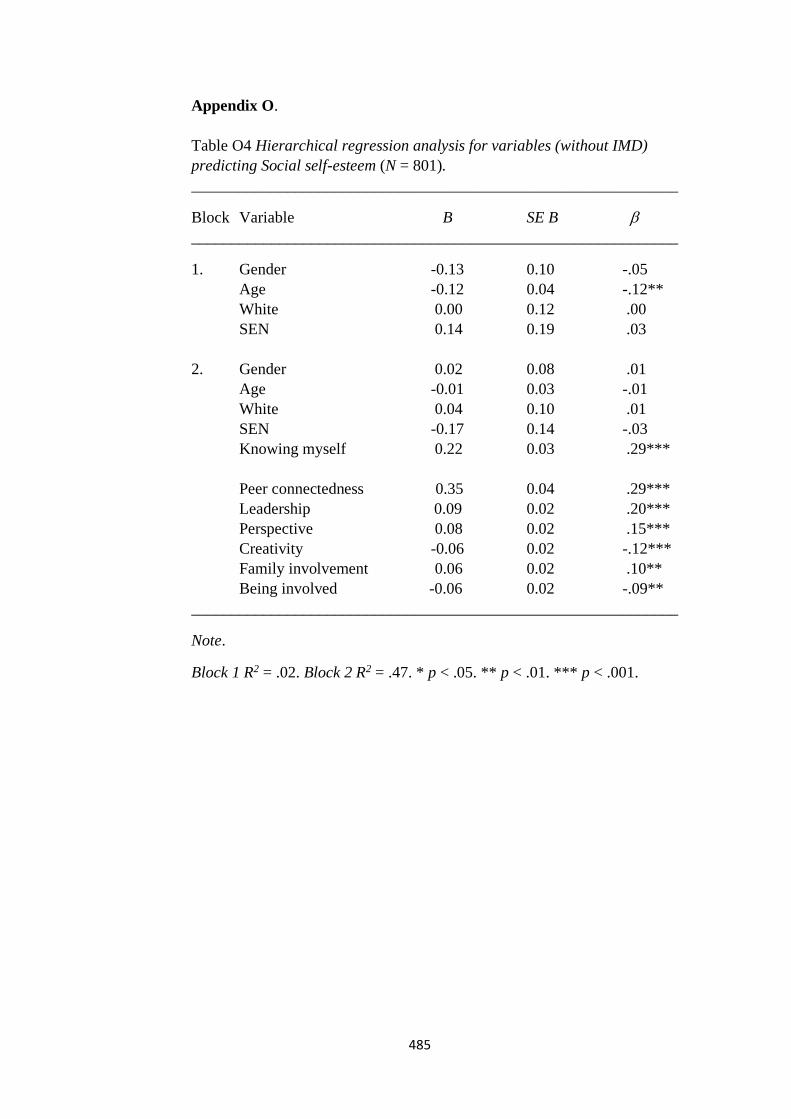
485
Appendix O.
Table O4 Hierarchical regression analysis for variables (without IMD)
predicting Social self-esteem (N = 801).
_____________________________________________________________
Block Variable B SE B
_____________________________________________________________
1. Gender -0.13 0.10 -.05
Age -0.12 0.04 -.12**
White 0.00 0.12 .00
SEN 0.14 0.19 .03
2. Gender 0.02 0.08 .01
Age -0.01 0.03 -.01
White 0.04 0.10 .01
SEN -0.17 0.14 -.03
Knowing myself 0.22 0.03 .29***
Peer connectedness 0.35 0.04 .29***
Leadership 0.09 0.02 .20***
Perspective 0.08 0.02 .15***
Creativity -0.06 0.02 -.12***
Family involvement 0.06 0.02 .10**
Being involved -0.06 0.02 -.09**
_____________________________________________________________
Note.
Block 1 R2 = .02. Block 2 R2 = .47. * p < .05. ** p < .01. *** p < .001.
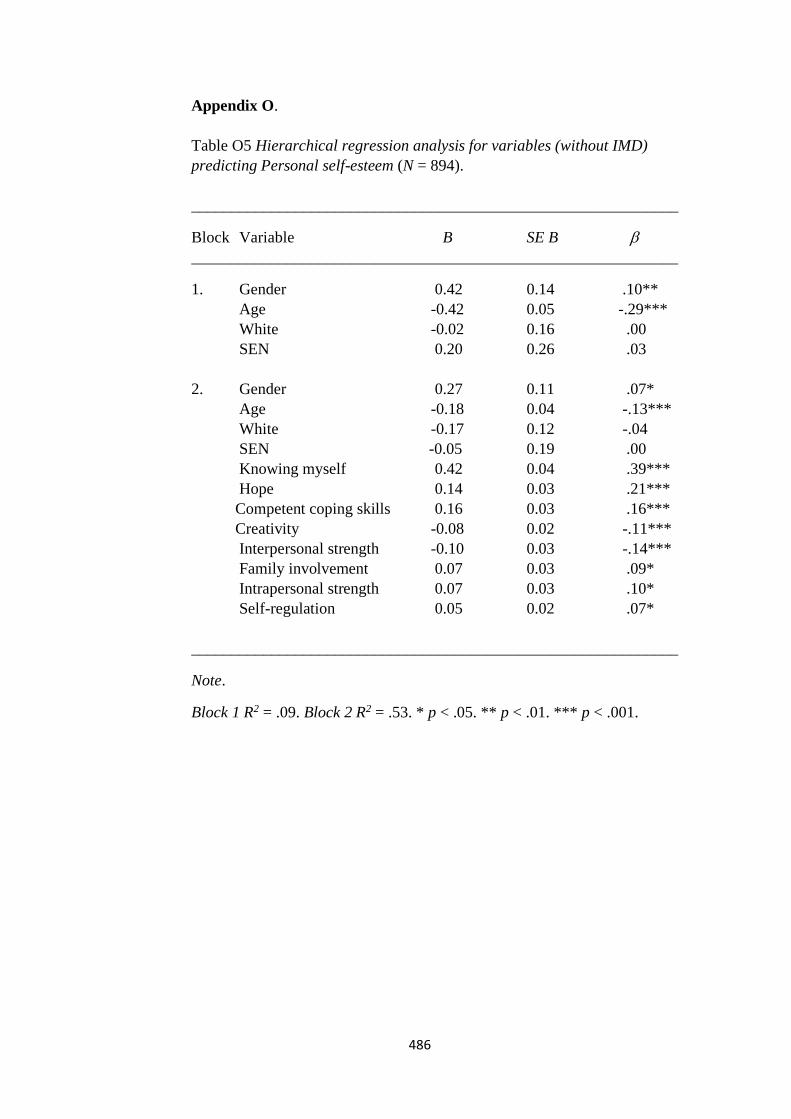
486
Appendix O.
Table O5 Hierarchical regression analysis for variables (without IMD)
predicting Personal self-esteem (N = 894).
_____________________________________________________________
Block Variable B SE B
_____________________________________________________________
1. Gender 0.42 0.14 .10**
Age -0.42 0.05 -.29***
White -0.02 0.16 .00
SEN 0.20 0.26 .03
2. Gender 0.27 0.11 .07*
Age -0.18 0.04 -.13***
White -0.17 0.12 -.04
SEN -0.05 0.19 .00
Knowing myself 0.42 0.04 .39***
Hope 0.14 0.03 .21***
Competent coping skills 0.16 0.03 .16***
Creativity -0.08 0.02 -.11***
Interpersonal strength -0.10 0.03 -.14***
Family involvement 0.07 0.03 .09*
Intrapersonal strength 0.07 0.03 .10*
Self-regulation 0.05 0.02 .07*
_____________________________________________________________
Note.
Block 1 R2 = .09. Block 2 R2 = .53. * p < .05. ** p < .01. *** p < .001.
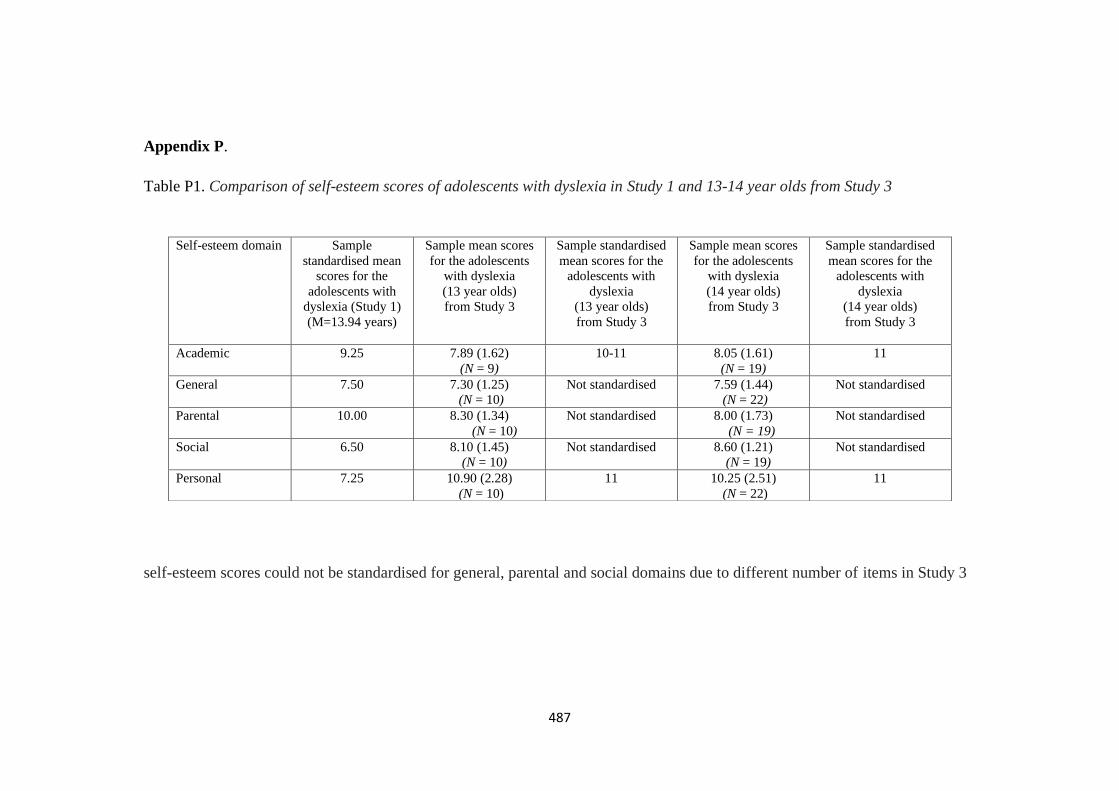
487
Appendix P.
Table P1. Comparison of self-esteem scores of adolescents with dyslexia in Study 1 and 13-14 year olds from Study 3
self-esteem scores could not be standardised for general, parental and social domains due to different number of items in Study 3
Self-esteem domain Sample
standardised mean
scores for the
adolescents with
dyslexia (Study 1)
(M=13.94 years)
Sample mean scores
for the adolescents
with dyslexia
(13 year olds)
from Study 3
Sample standardised
mean scores for the
adolescents with
dyslexia
(13 year olds)
from Study 3
Sample mean scores
for the adolescents
with dyslexia
(14 year olds)
from Study 3
Sample standardised
mean scores for the
adolescents with
dyslexia
(14 year olds)
from Study 3
Academic 9.25 7.89 (1.62)
(N = 9)
10-11 8.05 (1.61)
(N = 19)
11
General 7.50 7.30 (1.25)
(N = 10)
Not standardised 7.59 (1.44)
(N = 22)
Not standardised
Parental 10.00 8.30 (1.34)
(N = 10)
Not standardised 8.00 (1.73)
(N = 19)
Not standardised
Social 6.50 8.10 (1.45)
(N = 10)
Not standardised 8.60 (1.21)
(N = 19)
Not standardised
Personal 7.25 10.90 (2.28)
(N = 10)
11 10.25 (2.51)
(N = 22)
11
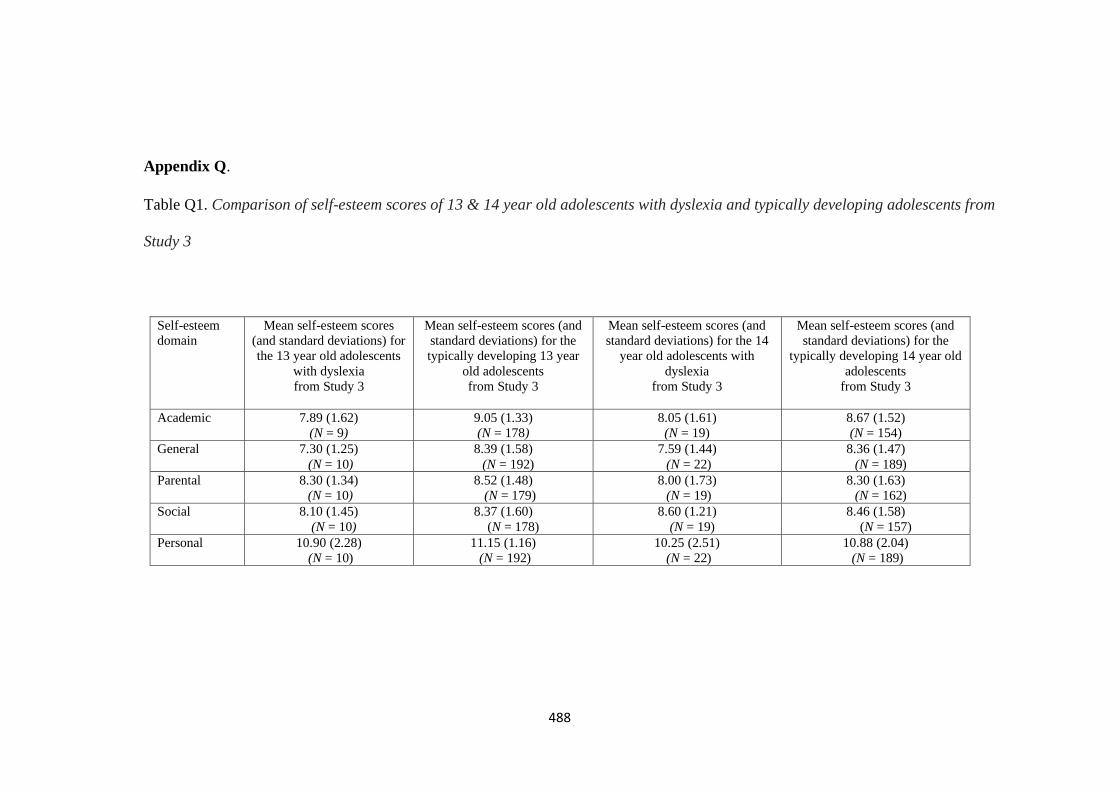
488
Appendix Q.
Table Q1. Comparison of self-esteem scores of 13 & 14 year old adolescents with dyslexia and typically developing adolescents from
Study 3
Self-esteem
domain
Mean self-esteem scores
(and standard deviations) for
the 13 year old adolescents
with dyslexia
from Study 3
Mean self-esteem scores (and
standard deviations) for the
typically developing 13 year
old adolescents
from Study 3
Mean self-esteem scores (and
standard deviations) for the 14
year old adolescents with
dyslexia
from Study 3
Mean self-esteem scores (and
standard deviations) for the
typically developing 14 year old
adolescents
from Study 3
Academic 7.89 (1.62)
(N = 9)
9.05 (1.33)
(N = 178)
8.05 (1.61)
(N = 19)
8.67 (1.52)
(N = 154)
General 7.30 (1.25)
(N = 10)
8.39 (1.58)
(N = 192)
7.59 (1.44)
(N = 22)
8.36 (1.47)
(N = 189)
Parental 8.30 (1.34)
(N = 10)
8.52 (1.48)
(N = 179)
8.00 (1.73)
(N = 19)
8.30 (1.63)
(N = 162)
Social 8.10 (1.45)
(N = 10)
8.37 (1.60)
(N = 178)
8.60 (1.21)
(N = 19)
8.46 (1.58)
(N = 157)
Personal 10.90 (2.28)
(N = 10)
11.15 (1.16)
(N = 192)
10.25 (2.51)
(N = 22)
10.88 (2.04)
(N = 189)
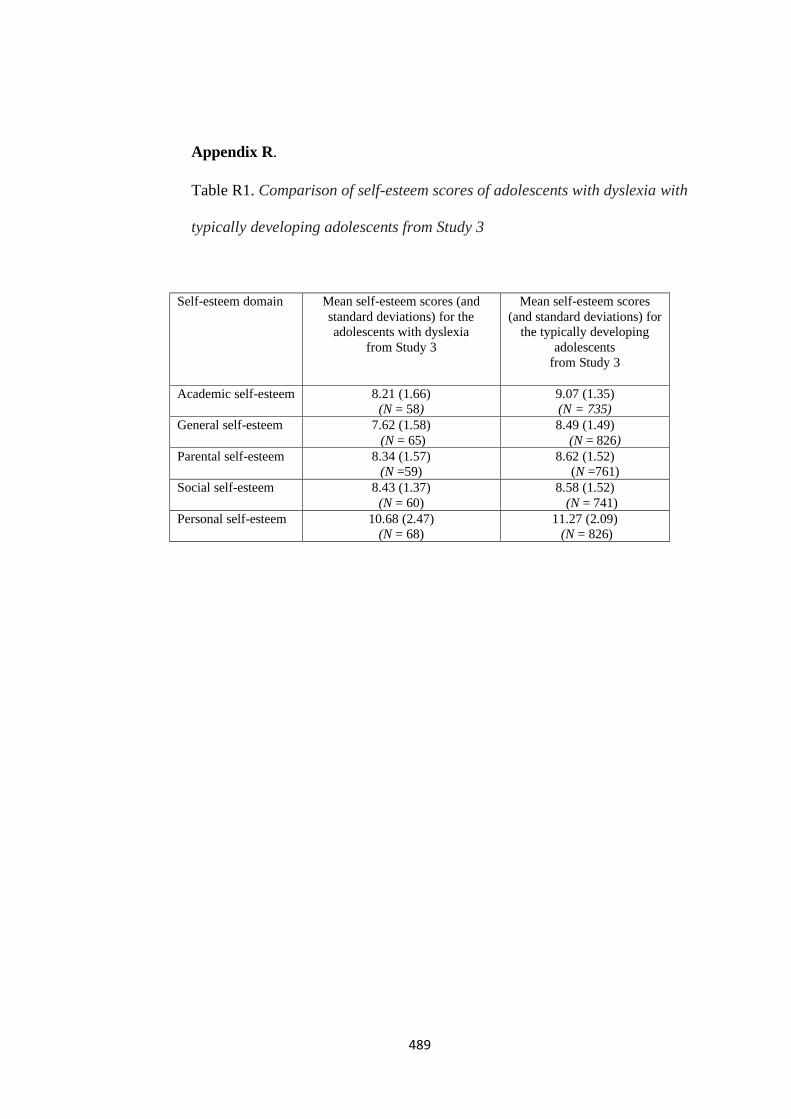
489
Appendix R.
Table R1. Comparison of self-esteem scores of adolescents with dyslexia with
typically developing adolescents from Study 3
Self-esteem domain Mean self-esteem scores (and
standard deviations) for the
adolescents with dyslexia
from Study 3
Mean self-esteem scores
(and standard deviations) for
the typically developing
adolescents
from Study 3
Academic self-esteem 8.21 (1.66)
(N = 58)
9.07 (1.35)
(N = 735)
General self-esteem 7.62 (1.58)
(N = 65)
8.49 (1.49)
(N = 826)
Parental self-esteem 8.34 (1.57)
(N =59)
8.62 (1.52)
(N =761)
Social self-esteem 8.43 (1.37)
(N = 60)
8.58 (1.52)
(N = 741)
Personal self-esteem 10.68 (2.47)
(N = 68)
11.27 (2.09)
(N = 826)
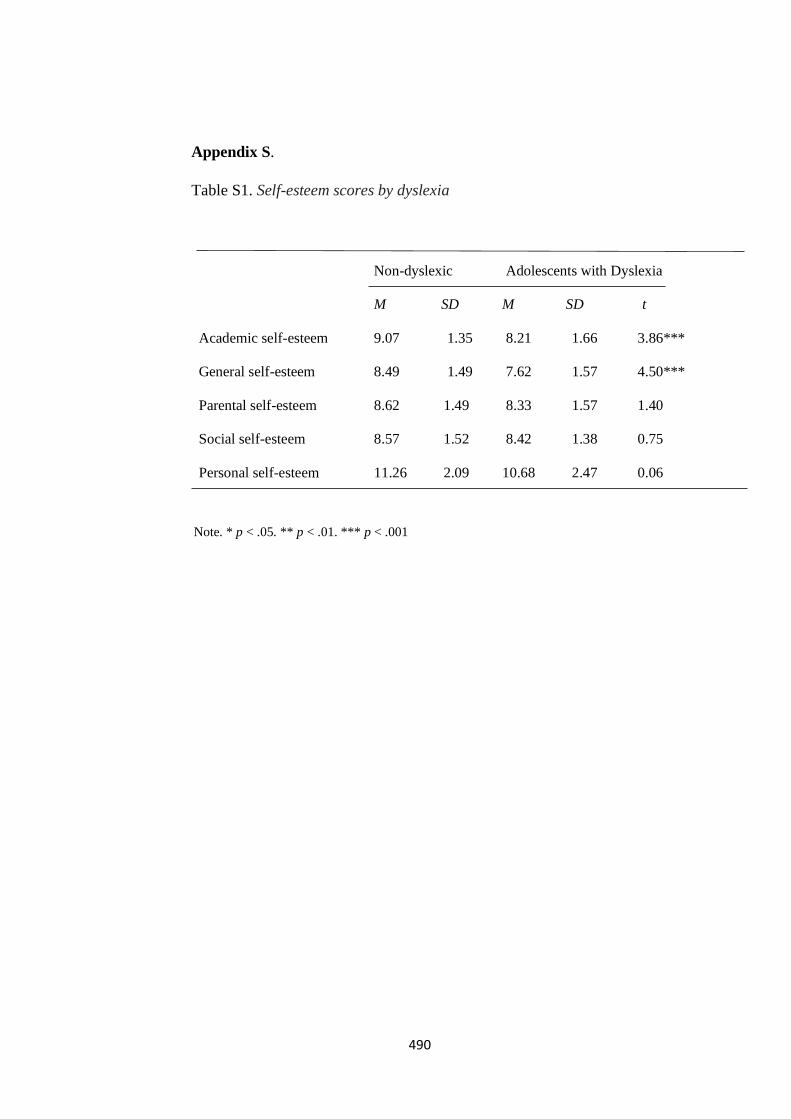
490
Appendix S.
Table S1. Self-esteem scores by dyslexia
Note. * p < .05. ** p < .01. *** p < .001
Non-dyslexic
M SD
Adolescents with Dyslexia
M SD t
Academic self-esteem 9.07 1.35 8.21 1.66 3.86***
General self-esteem 8.49 1.49 7.62 1.57 4.50***
Parental self-esteem 8.62 1.49 8.33 1.57 1.40
Social self-esteem 8.57 1.52 8.42 1.38 0.75
Personal self-esteem 11.26 2.09 10.68 2.47 0.06
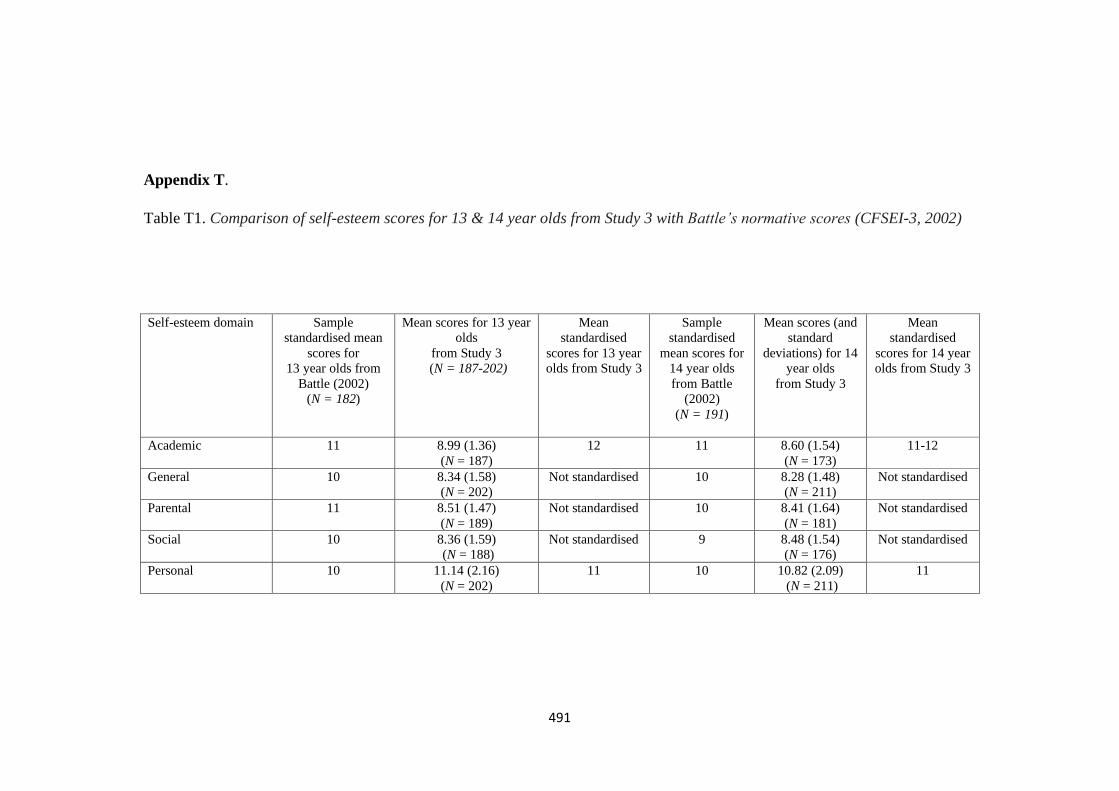
491
Appendix T.
Table T1. Comparison of self-esteem scores for 13 & 14 year olds from Study 3 with Battle’s normative scores (CFSEI-3, 2002)
Self-esteem domain Sample
standardised mean
scores for
13 year olds from
Battle (2002)
(N = 182)
Mean scores for 13 year
olds
from Study 3
(N = 187-202)
Mean
standardised
scores for 13 year
olds from Study 3
Sample
standardised
mean scores for
14 year olds
from Battle
(2002)
(N = 191)
Mean scores (and
standard
deviations) for 14
year olds
from Study 3
Mean
standardised
scores for 14 year
olds from Study 3
Academic 11 8.99 (1.36)
(N = 187)
12 11 8.60 (1.54)
(N = 173)
11-12
General 10 8.34 (1.58)
(N = 202)
Not standardised 10 8.28 (1.48)
(N = 211)
Not standardised
Parental 11 8.51 (1.47)
(N = 189)
Not standardised 10 8.41 (1.64)
(N = 181)
Not standardised
Social 10 8.36 (1.59)
(N = 188)
Not standardised 9 8.48 (1.54)
(N = 176)
Not standardised
Personal 10 11.14 (2.16)
(N = 202)
11 10 10.82 (2.09)
(N = 211)
11
Related Documents