Welcome message from author
This document is posted to help you gain knowledge. Please leave a comment to let me know what you think about it! Share it to your friends and learn new things together.
Transcript
- 3 -
City of Houston, Texas Management’s Discussion and Analysis
(Unaudited)
June 30, 2005 As management of the City of Houston, we offer readers of the City of Houston’s financial statements this narrative overview and analysis of the financial activities of the City of Houston for the fiscal year ended June 30, 2005. Please read this information in conjunction with the basic financial statements that follow this section. The discussion and analysis includes comparative data for 2004. All amounts, unless otherwise indicated, are expressed in millions of dollars. Financial Highlights Some of the City’s financial highlights for the fiscal year ending June 30, 2005 include:
• The assets of the City of Houston exceeded its liabilities at the close of the most recent fiscal year by $4.5 billion.
• The City’s total net assets decreased during the year by $532 million. • Unrestricted assets are a deficit of $775 million. • The City of Houston’s total expenses were $3.435 billion. • Program revenues of $1.512 billion reduced the net cost of the City’s functions to be financed
from the City’s general revenues to $1.923 billion. Overview of the Financial Statements This discussion and analysis is intended to serve as an introduction to the City of Houston’s basic financial statements. The City of Houston’s basic financial statements are comprised of three components: (1) government-wide financial statements, (2) fund financial statements, and (3) notes to the financial statements. Government-wide financial statements. The government-wide financial statements are designed to provide readers with a broad overview of the City of Houston’s finances, in a manner similar to a private-sector business. The statement of net assets presents information on all of the City of Houston’s assets and liabilities, with the difference between the assets and liabilities reported as net assets. Over time, increases and decreases in net assets may serve as a useful indicator of whether the financial position of the City of Houston is improving or deteriorating. The statement of activities presents information showing how the government’s net assets changed during the most recent fiscal year. All changes in net assets are reported as soon as the underlying event giving rise to the change occurs, regardless of the timing of related cash flows. Thus, revenues and expenses are reported in this statement for some items that will not result in cash flows until future fiscal periods (e.g., uncollected taxes and earned but unused vacation leave). Both of the government-wide financial statements distinguish between functions of the City of Houston that are principally supported by taxes and intergovernmental revenues (governmental activities) from other functions that are intended to recover all or a significant portion of their costs through user fees and charges (business-type activities). The governmental activities of the City of Houston include general government, public safety, public works, health, housing and community development, parks and recreation, and library. The business-type activities of the City of Houston include the airport system, water & sewer system and convention & entertainment facilities.
- 4 -
The government-wide financial statements include not only the City of Houston itself (known as the primary government), but also legally separate component units for which the City of Houston is financially accountable. With the exception of the Houston Area Water Corporation and the three pension systems, financial information for the component units is reported separately from the financial information presented for the primary government itself. The Houston Area Water Corporation and the pension systems, although also legally separate, function for all practical purposes as departments of the City of Houston, and therefore have been included as an integral part of the primary government. Fund financial statements. A fund is a group of related accounts that is used to maintain control over resources that have been segregated for specific activities or objectives. The City of Houston, like other state and local governments, uses fund accounting to ensure and demonstrate compliance with finance-related legal requirements. All of the funds of the City of Houston can be divided into three categories: governmental funds, proprietary funds, and fiduciary funds. Governmental funds. Governmental funds are used to account for essentially the same functions reported as governmental activities in the government-wide financial statements. However, unlike the government-wide statements, fund financial statements focus on near-term inflows and outflows of spendable resources, as well as on balances of spendable resources available at the end of the fiscal year. Such information may be useful in evaluating a government’s near-term financing requirements. Because the focus of governmental funds is narrower than that of the government-wide financial statements, it is useful to compare the information presented for governmental funds with similar information presented for governmental activities in the government-wide financial statements. By doing so, readers may better understand the long-term impact of the government’s near-term financing decisions. The governmental fund balance sheet (see pgs. 18-19) displays a reconciliation to facilitate this comparison between governmental funds. The reconciliation between the governmental fund statement of revenues, expenditures, and changes in fund balances and governmental activities is provided on a separate schedule (see page 22). The City of Houston maintains nine individual governmental funds for financial reporting purposes. Information is presented separately in the governmental fund balance sheet (see page 18) and in the governmental fund statement of revenues, expenditures, and changes in fund balances (see page 20) for the general fund, the debt service fund, the capital projects fund and the grants fund, all of which are considered to be major funds. Data from the other funds is combined in the column labeled “Nonmajor Governmental Funds” on both of these statements (see also the separate tab labeled “Governmental Funds” for more information on these funds). Proprietary funds. The City of Houston maintains two different types of proprietary funds (see statements beginning on page 24): Enterprise funds (see also separate tab of same name) and internal service funds (see also separate tab of same name). Enterprise funds are used to report the same functions presented as business-type activities in the government-wide financial statements. The City of Houston uses enterprise funds to account for its aviation system, combined utility system (formerly called the water and sewer system), and the convention and entertainment facilities. The City also includes the Houston Area Water Corporation as a nonmajor proprietary fund. Internal service funds are an accounting device used to accumulate and allocate costs internally among the City of Houston’s various functions. The City of Houston uses internal service funds to account for health and benefits and long-term disability activities. Because both of these services predominantly benefit governmental rather than business-type functions, they have been included within governmental activities in the government-wide financial statements. Proprietary funds provide the same type of information as the government-wide financial statements, only in more detail. The proprietary fund financial statements provide separate information for the aviation system combined utility system and convention and entertainment facilities, all of which are considered to be major funds for the City of Houston. Conversely, both internal service funds are combined into a single, aggregated presentation in the proprietary fund financial statements.
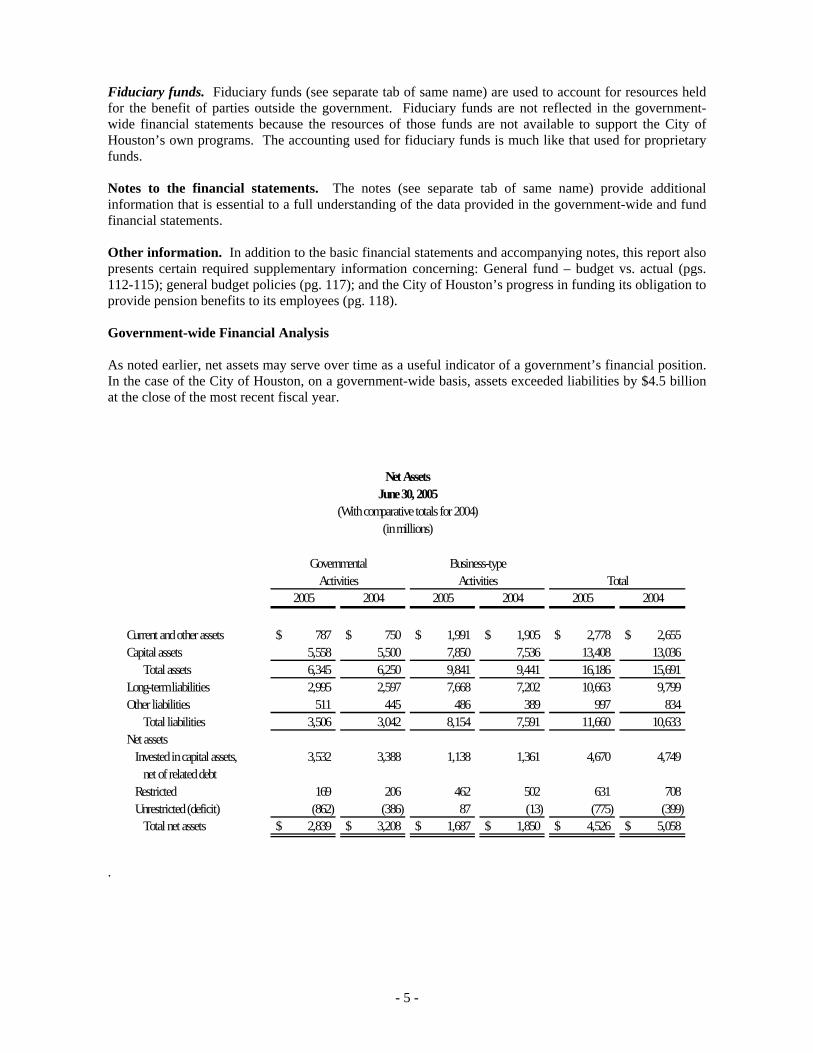
Fiduciary funds. Fiduciary funds (see separate tab of same name) are used to account for resources held for the benefit of parties outside the government. Fiduciary funds are not reflected in the government-wide financial statements because the resources of those funds are not available to support the City of Houston’s own programs. The accounting used for fiduciary funds is much like that used for proprietary funds. Notes to the financial statements. The notes (see separate tab of same name) provide additional information that is essential to a full understanding of the data provided in the government-wide and fund financial statements. Other information. In addition to the basic financial statements and accompanying notes, this report also presents certain required supplementary information concerning: General fund – budget vs. actual (pgs. 112-115); general budget policies (pg. 117); and the City of Houston’s progress in funding its obligation to provide pension benefits to its employees (pg. 118). Government-wide Financial Analysis As noted earlier, net assets may serve over time as a useful indicator of a government’s financial position. In the case of the City of Houston, on a government-wide basis, assets exceeded liabilities by $4.5 billion at the close of the most recent fiscal year.
2005 2004 2005 2004 2005 2004
Current and other assets 787$ 750$ 1,991$ 1,905$ 2,778$ 2,655$ Capital assets 5,558 5,500 7,850 7,536 13,408 13,036
Total assets 6,345 6,250 9,841 9,441 16,186 15,691 Long-term liabilities 2,995 2,597 7,668 7,202 10,663 9,799 Other liabilities 511 445 486 389 997 834
Total liabilities 3,506 3,042 8,154 7,591 11,660 10,633 Net assets
Invested in capital assets, 3,532 3,388 1,138 1,361 4,670 4,749 net of related debt
Restricted 169 206 462 502 631 708 Unrestricted (deficit) (862) (386) 87 (13) (775) (399)
Total net assets 2,839$ 3,208$ 1,687$ 1,850$ 4,526$ 5,058$
TotalBusiness-type
ActivitiesGovernmental
Activities
Net AssetsJune 30, 2005
(With comparative totals for 2004)(in millions)
.
- 5 -
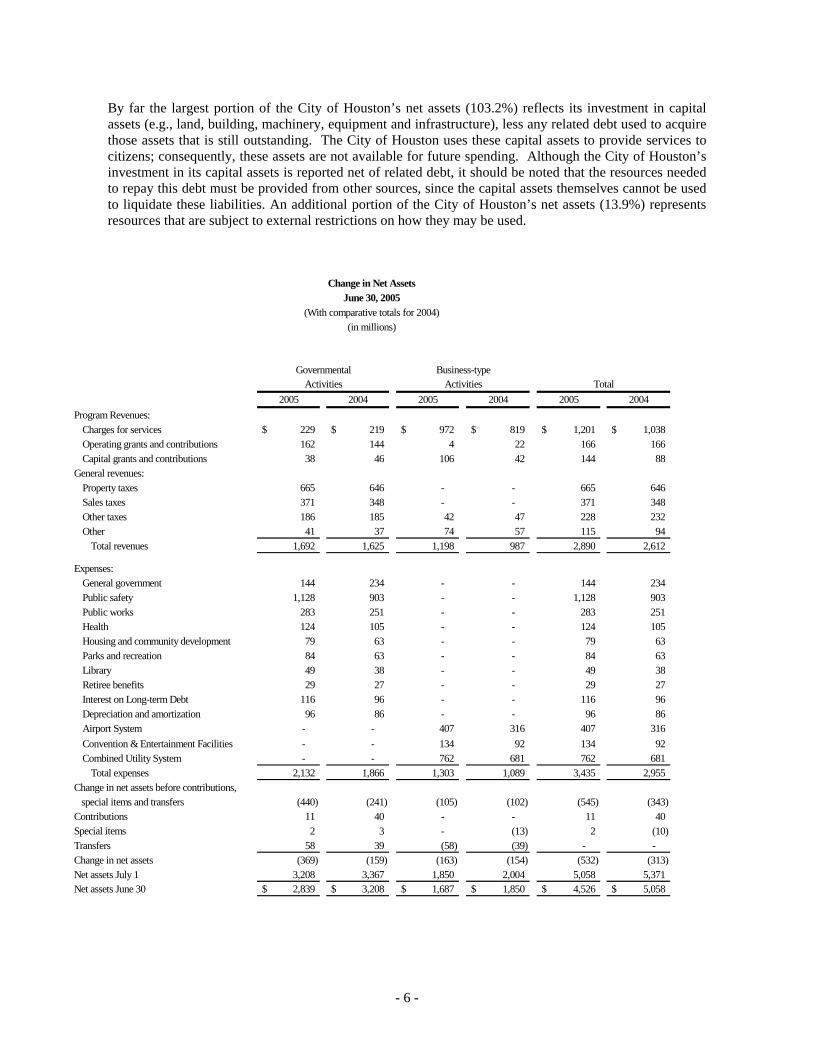
By far the largest portion of the City of Houston’s net assets (103.2%) reflects its investment in capital assets (e.g., land, building, machinery, equipment and infrastructure), less any related debt used to acquire those assets that is still outstanding. The City of Houston uses these capital assets to provide services to citizens; consequently, these assets are not available for future spending. Although the City of Houston’s investment in its capital assets is reported net of related debt, it should be noted that the resources needed to repay this debt must be provided from other sources, since the capital assets themselves cannot be used to liquidate these liabilities. An additional portion of the City of Houston’s net assets (13.9%) represents resources that are subject to external restrictions on how they may be used.
2005 2004 2005 2004 2005 2004Program Revenues:
Charges for services 229$ 219$ 972$ 819$ 1,201$ 1,038$ Operating grants and contributions 162 144 4 22 166 166 Capital grants and contributions 38 46 106 42 144 88
General revenues:Property taxes 665 646 - - 665 646 Sales taxes 371 348 - - 371 348 Other taxes 186 185 42 47 228 232 Other 41 37 74 57 115 94
Total revenues 1,692 1,625 1,198 987 2,890 2,612
Expenses:General government 144 234 - - 144 234 Public safety 1,128 903 - - 1,128 903 Public works 283 251 - - 283 251 Health 124 105 - - 124 105 Housing and community development 79 63 - - 79 63 Parks and recreation 84 63 - - 84 63 Library 49 38 - - 49 38 Retiree benefits 29 27 - - 29 27 Interest on Long-term Debt 116 96 - - 116 96 Depreciation and amortization 96 86 - - 96 86 Airport System - - 407 316 407 316 Convention & Entertainment Facilities - - 134 92 134 92 Combined Utility System - - 762 681 762 681
Total expenses 2,132 1,866 1,303 1,089 3,435 2,955 Change in net assets before contributions, special items and transfers (440) (241) (105) (102) (545) (343) Contributions 11 40 - - 11 40 Special items 2 3 - (13) 2 (10) Transfers 58 39 (58) (39) - - Change in net assets (369) (159) (163) (154) (532) (313) Net assets July 1 3,208 3,367 1,850 2,004 5,058 5,371 Net assets June 30 2,839$ 3,208$ 1,687$ 1,850$ 4,526$ 5,058$
Change in Net AssetsJune 30, 2005
(With comparative totals for 2004)(in millions)
TotalBusiness-type
ActivitiesGovernmental
Activities
- 6 -
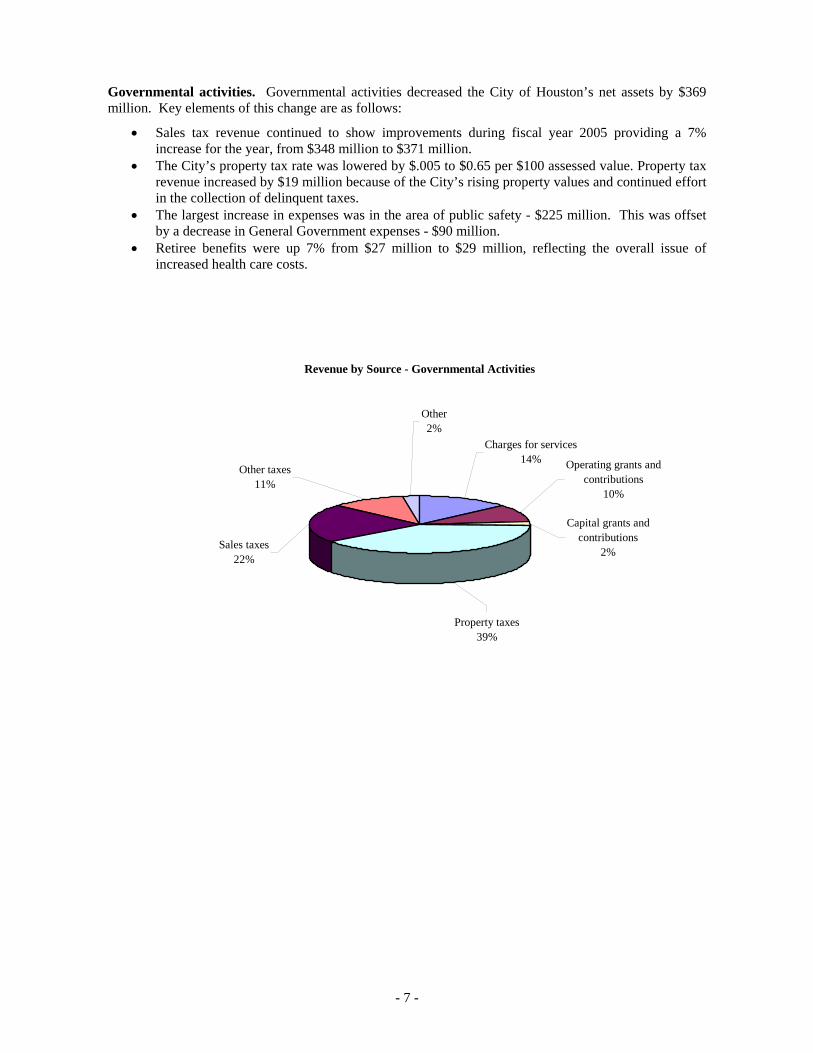
Governmental activities. Governmental activities decreased the City of Houston’s net assets by $369 million. Key elements of this change are as follows:
• Sales tax revenue continued to show improvements during fiscal year 2005 providing a 7% increase for the year, from $348 million to $371 million.
• The City’s property tax rate was lowered by $.005 to $0.65 per $100 assessed value. Property tax revenue increased by $19 million because of the City’s rising property values and continued effort in the collection of delinquent taxes.
• The largest increase in expenses was in the area of public safety - $225 million. This was offset by a decrease in General Government expenses - $90 million.
- 7 -
• Retiree benefits were up 7% from $27 million to $29 million, reflecting the overall issue of increased health care costs.
Revenue by Source - Governmental Activities
Property taxes39%
Capital grants and contributions
2%
Operating grants and contributions
10%
Charges for services14%
Sales taxes22%
Other taxes11%
Other2%
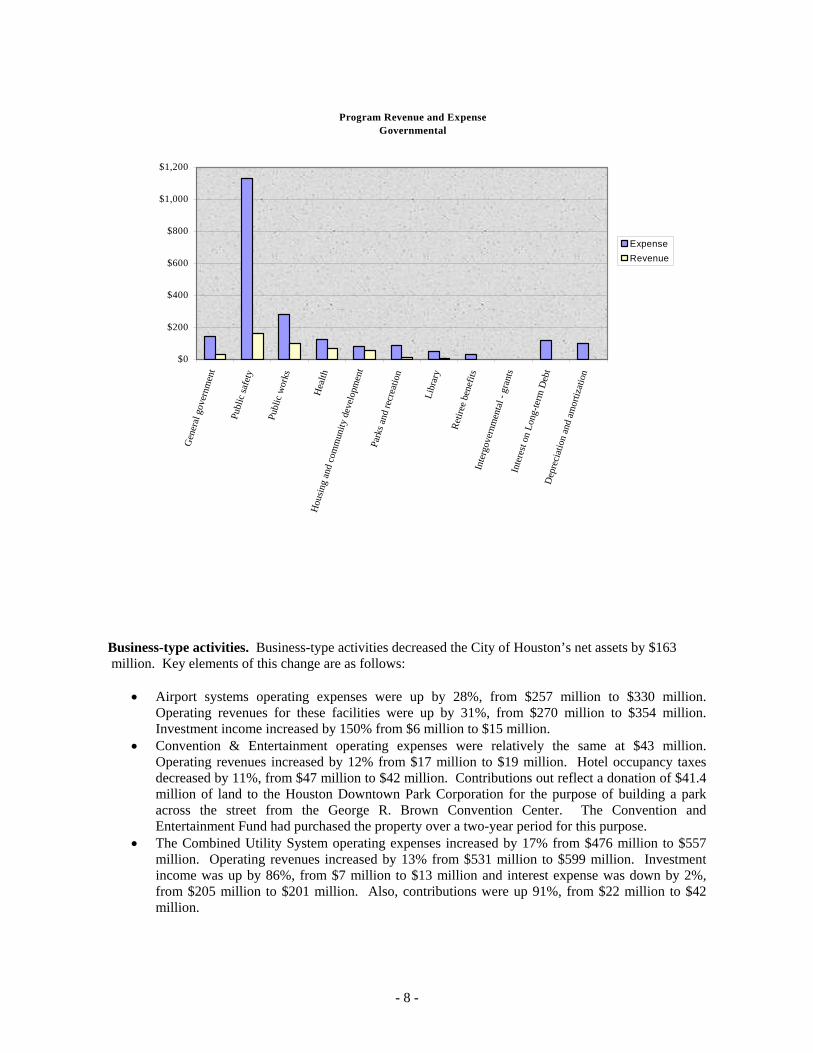
Program Revenue and ExpenseGovernmental
$0
$200
$400
$600
$800
$1,000
$1,200
Gen
eral
gov
ernm
ent
Publ
ic sa
fety
Publ
ic w
orks
Hea
lthH
ousin
g an
d co
mm
unity
dev
elop
men
tPa
rks a
nd re
crea
tion
Libr
ary
Retir
ee b
enef
itsIn
terg
over
nmen
tal -
gra
nts
Inte
rest
on L
ong-
term
Deb
tD
epre
ciat
ion
and
amor
tizat
ion
ExpenseRevenue
Business-type activities. Business-type activities decreased the City of Houston’s net assets by $163 million. Key elements of this change are as follows:
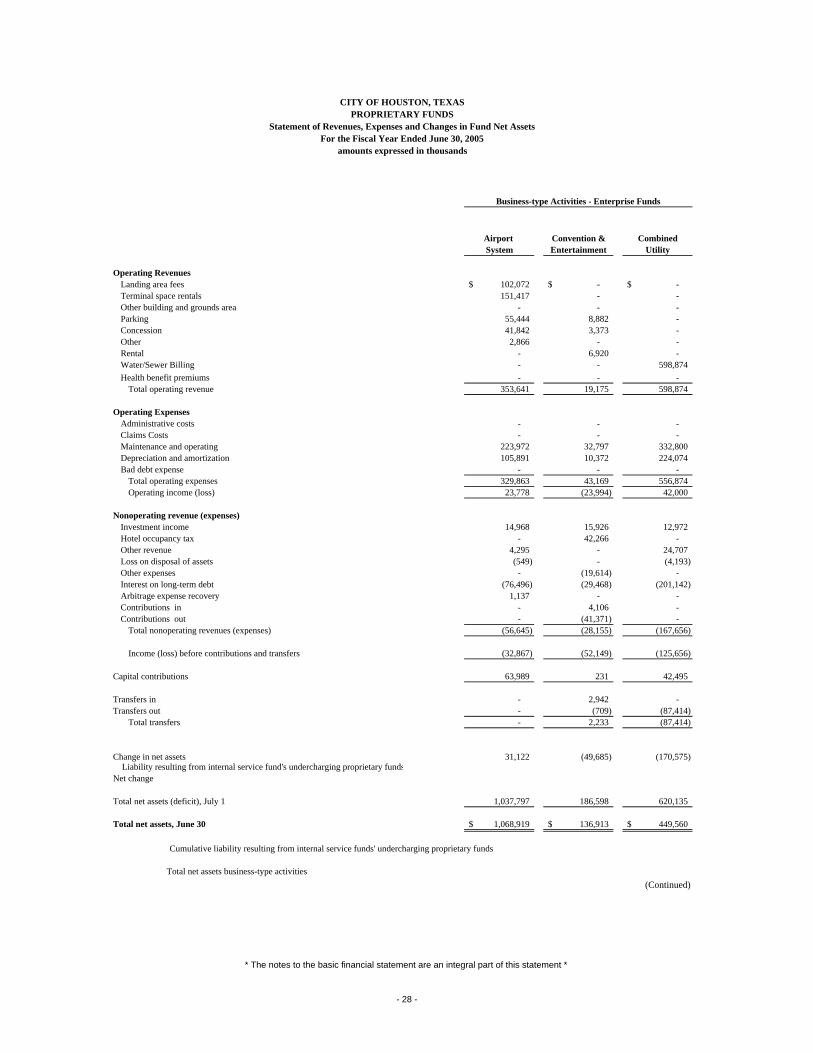
• Airport systems operating expenses were up by 28%, from $257 million to $330 million. Operating revenues for these facilities were up by 31%, from $270 million to $354 million. Investment income increased by 150% from $6 million to $15 million.
• Convention & Entertainment operating expenses were relatively the same at $43 million. Operating revenues increased by 12% from $17 million to $19 million. Hotel occupancy taxes decreased by 11%, from $47 million to $42 million. Contributions out reflect a donation of $41.4 million of land to the Houston Downtown Park Corporation for the purpose of building a park across the street from the George R. Brown Convention Center. The Convention and Entertainment Fund had purchased the property over a two-year period for this purpose.
• The Combined Utility System operating expenses increased by 17% from $476 million to $557 million. Operating revenues increased by 13% from $531 million to $599 million. Investment income was up by 86%, from $7 million to $13 million and interest expense was down by 2%, from $205 million to $201 million. Also, contributions were up 91%, from $22 million to $42 million.
- 8 -
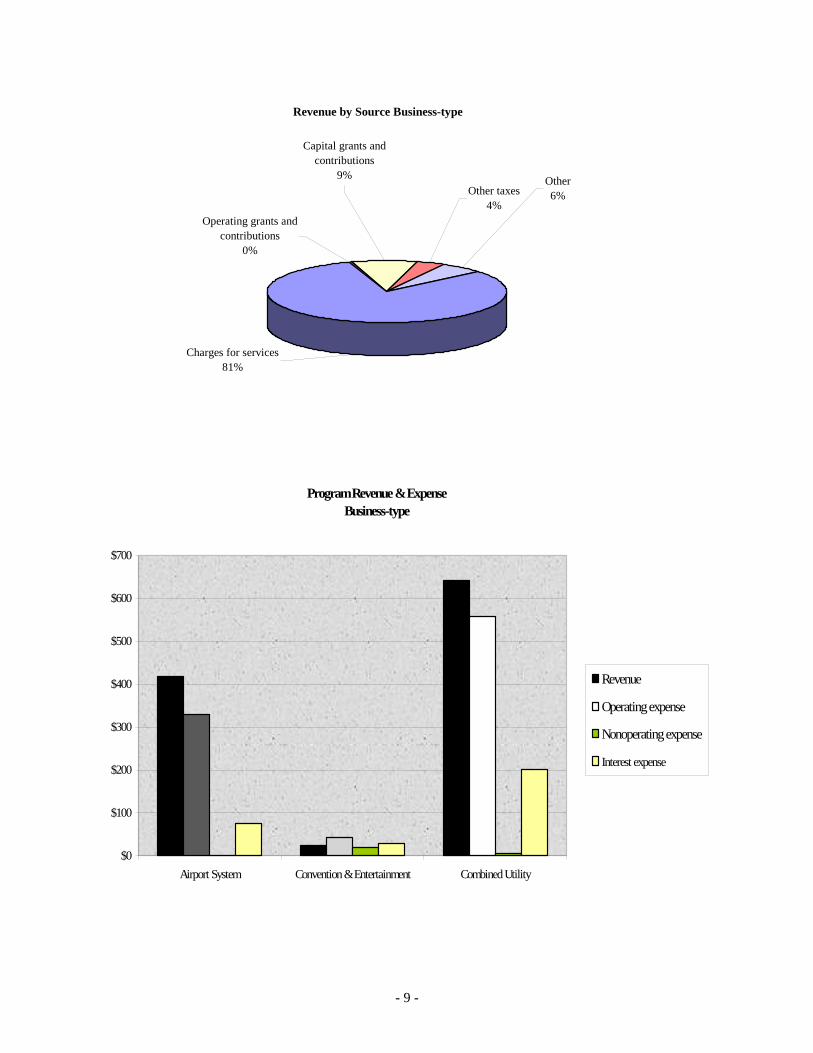
Revenue by Source Business-type
Other6%
Operating grants and contributions
0%
Capital grants and contributions
9%Other taxes
4%
Charges for services81%
Program Revenue & ExpenseBusiness-type
$0
$100
$200
$300
$400
$500
$600
$700
Airport System Convention & Entertainment Combined Utility
Revenue
Operating expense
Nonoperating expense
Interest expense
- 9 -
- 10 -
Financial Analysis of the Government’s Funds As noted earlier, the City of Houston uses fund accounting to ensure and demonstrate compliance with finance-related legal requirements. Governmental funds (see pgs.18-21 and separate tab of same name). The focus of the City of Houston’s governmental funds is to provide information on near-term inflows, outflows, and balances of spendable resources. Such information is useful in assessing the City of Houston’s financing requirements. In particular, unreserved fund balance may serve as a useful measure of a government’s net resources available for spending at the end of the fiscal year. As of the end of the current fiscal year, the City of Houston’s governmental funds reported combined ending fund balances of $438 million. Approximately 48% of this total amount ($210 million) constitutes unreserved fund balance, which is available for spending at the government’s discretion. The remainder of fund balance is reserved to indicate that it is not available for new spending because it has already been committed (1) for capital expenditures ($97 million), (2) to pay debt service ($109 million), or (3) a variety of other restricted purposes ($21.5 million). The general fund is the chief operating fund of the City of Houston. At the end of the current fiscal year, unreserved fund balance of the general fund was $142.7 million, while the total fund balance reached $170 million. As a measure of the general fund’s liquidity, it may be useful to compare both unreserved fund balance and total fund balance to total fund expenditures. Unreserved fund balance represents 10.6% of total general fund expenditures, while total fund balance represents 12.7% of that same amount. Key differences between last year’s general fund activity and this year’s include:
• $37 million increase in total revenues • $59 million increase in expenditures • $84.5 million increase in proceeds for issuance of debt • $5.8 million decrease in transfers from other funds • $3.1 million increase in interest expenditures • $22 million increase in transfers to other funds
The debt service fund has a total fund balance of $107 million, all of which is reserved for the payment of debt service. The net increase in fund balance during the current fiscal year in the debt service fund was $15 million. Interest expenditures decreased by $9 million. The capital projects fund, which is used for the acquisition and/or construction of capital facilities by the City (except those financed by Enterprise Funds), has a fund balance of $90.5 million. The net increase in fund balance during the current fiscal year was $15 million. The grants fund is used to account for grant resources received from various local, state and national agencies and organizations. The grants fund has a reserved fund balance of $3 million. Proprietary funds (see pgs.24-33 and tabs labeled “Enterprise Funds” and “Internal Services Funds”). The City of Houston proprietary funds provide the same type of information found in the government-wide financial statements, but in more detail. At the end of the year, unrestricted net assets were $0 for the Airport System, $19.2 million for Convention and Entertainment, $68 million for the Combined Utility System and $75 thousand for the Houston Area Water Corporation. The total increase in net assets for the Airport System and the Houston Area Water Corporation funds were $31 million and $27 million, respectively. The Combined Utility System and the Convention and Entertainment funds experienced decreases of $171 million and $50
million, respectively. Other factors concerning the finances of these funds have already been addressed in the discussion of the City of Houston’s business-type activities. General Fund Budgetary Highlights Total revenues were below of budget (pgs. 112-115), by $1 million. The details of the more significant variances are detailed below:
• $2 million increase in franchise taxes • $2 million increase in license and permits • $5 million decrease in direct services for other funds • $1 million increase in municipal courts fines and forfeits • $2 million decrease in other fines and forfeits • $1 million increase in interest • $1 million decrease in ambulance fees • $4 million increase in other revenues
Total expenditures for the General Fund were $36 million below the final expenditure budget. The details of the more significant variances are detailed below:
• $3 million decrease in total general government expenditures • $28 million decrease in public safety expenditures • $1 million decrease in debt service interest
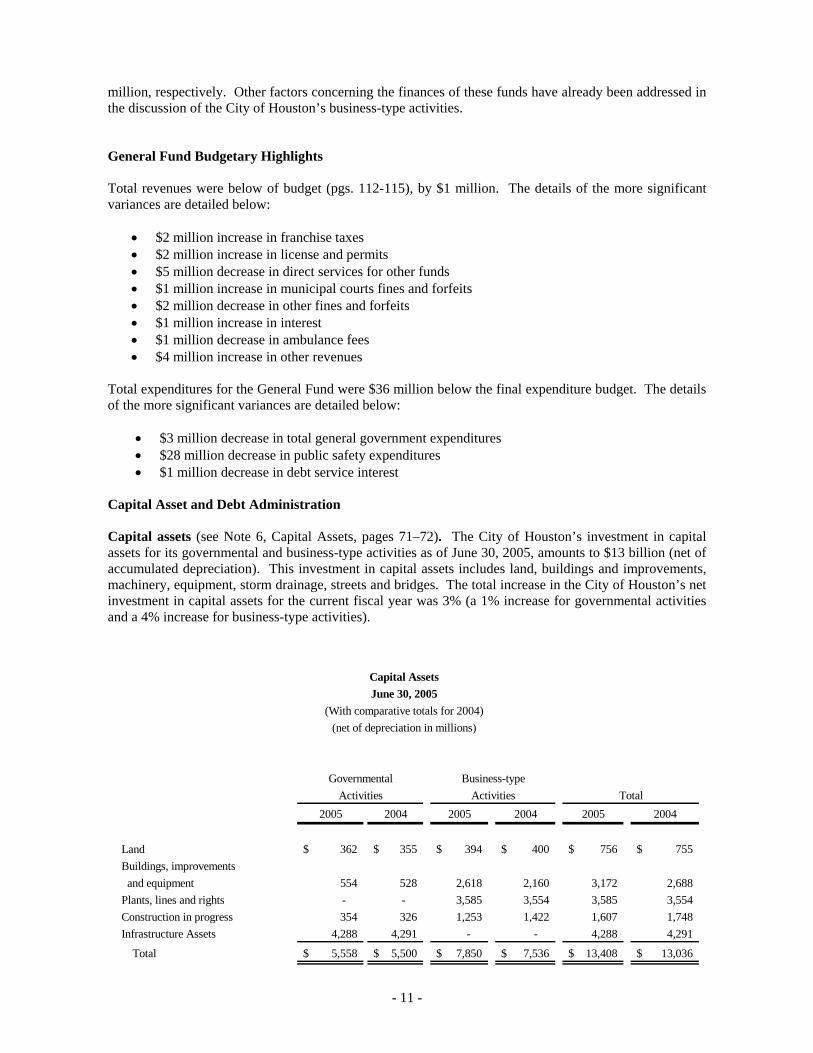
Capital Asset and Debt Administration Capital assets (see Note 6, Capital Assets, pages 71–72). The City of Houston’s investment in capital assets for its governmental and business-type activities as of June 30, 2005, amounts to $13 billion (net of accumulated depreciation). This investment in capital assets includes land, buildings and improvements, machinery, equipment, storm drainage, streets and bridges. The total increase in the City of Houston’s net investment in capital assets for the current fiscal year was 3% (a 1% increase for governmental activities and a 4% increase for business-type activities).
2005 2004 2005 2004 2005 2004
Land 362$ 355$ 394$ 400$ 756$ 755$ Buildings, improvements and equipment 554 528 2,618 2,160 3,172 2,688 Plants, lines and rights - - 3,585 3,554 3,585 3,554 Construction in progress 354 326 1,253 1,422 1,607 1,748 Infrastructure Assets 4,288 4,291 - - 4,288 4,291
Total 5,558$ 5,500$ 7,850$ 7,536$ 13,408$ 13,036$
Capital Assets
(net of depreciation in millions)(With comparative totals for 2004)
GovernmentalActivities
Business-typeActivities Total
June 30, 2005
- 11 -
Major capital asset events during the current fiscal year included the following:
• Governmental and Business-type activities construction in process balance reflects a $141 million decrease.
• Governmental and Business-type activities land balance reflects a $1 million increase. • Business-type activities buildings, improvements and equipment balance reflect a $458 million
increase. • Business-type activities plants, lines and rights balance reflects a $31 million increase.
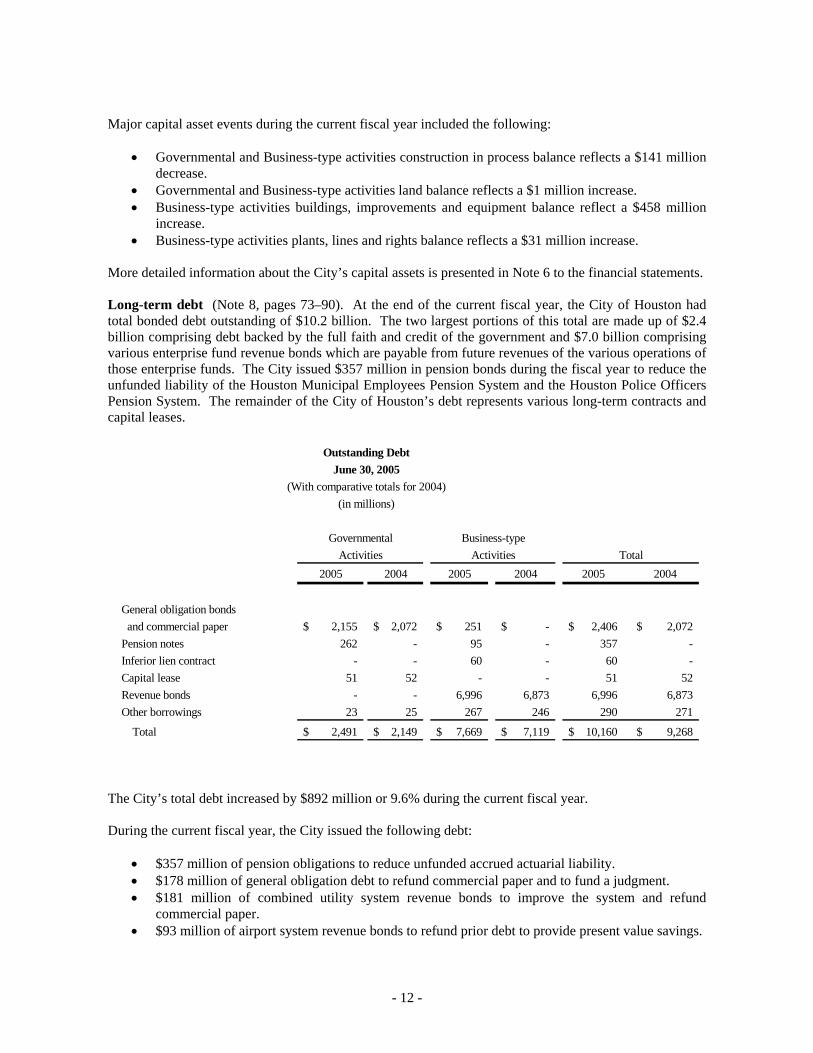
More detailed information about the City’s capital assets is presented in Note 6 to the financial statements. Long-term debt (Note 8, pages 73–90). At the end of the current fiscal year, the City of Houston had total bonded debt outstanding of $10.2 billion. The two largest portions of this total are made up of $2.4 billion comprising debt backed by the full faith and credit of the government and $7.0 billion comprising various enterprise fund revenue bonds which are payable from future revenues of the various operations of those enterprise funds. The City issued $357 million in pension bonds during the fiscal year to reduce the unfunded liability of the Houston Municipal Employees Pension System and the Houston Police Officers Pension System. The remainder of the City of Houston’s debt represents various long-term contracts and capital leases.
2005 2004 2005 2004 2005 2004
General obligation bonds and commercial paper 2,155$ 2,072$ 251$ -$ 2,406$ 2,072$ Pension notes 262 - 95 - 357 - Inferior lien contract - - 60 - 60 - Capital lease 51 52 - - 51 52 Revenue bonds - - 6,996 6,873 6,996 6,873 Other borrowings 23 25 267 246 290 271
Total 2,491$ 2,149$ 7,669$ 7,119$ 10,160$ 9,268$
(in millions)
June 30, 2005(With comparative totals for 2004)
Outstanding Debt
TotalGovernmental
ActivitiesBusiness-type
Activities
The City’s total debt increased by $892 million or 9.6% during the current fiscal year. During the current fiscal year, the City issued the following debt:
• $357 million of pension obligations to reduce unfunded accrued actuarial liability. • $178 million of general obligation debt to refund commercial paper and to fund a judgment. • $181 million of combined utility system revenue bonds to improve the system and refund
commercial paper. • $93 million of airport system revenue bonds to refund prior debt to provide present value savings.
- 12 -
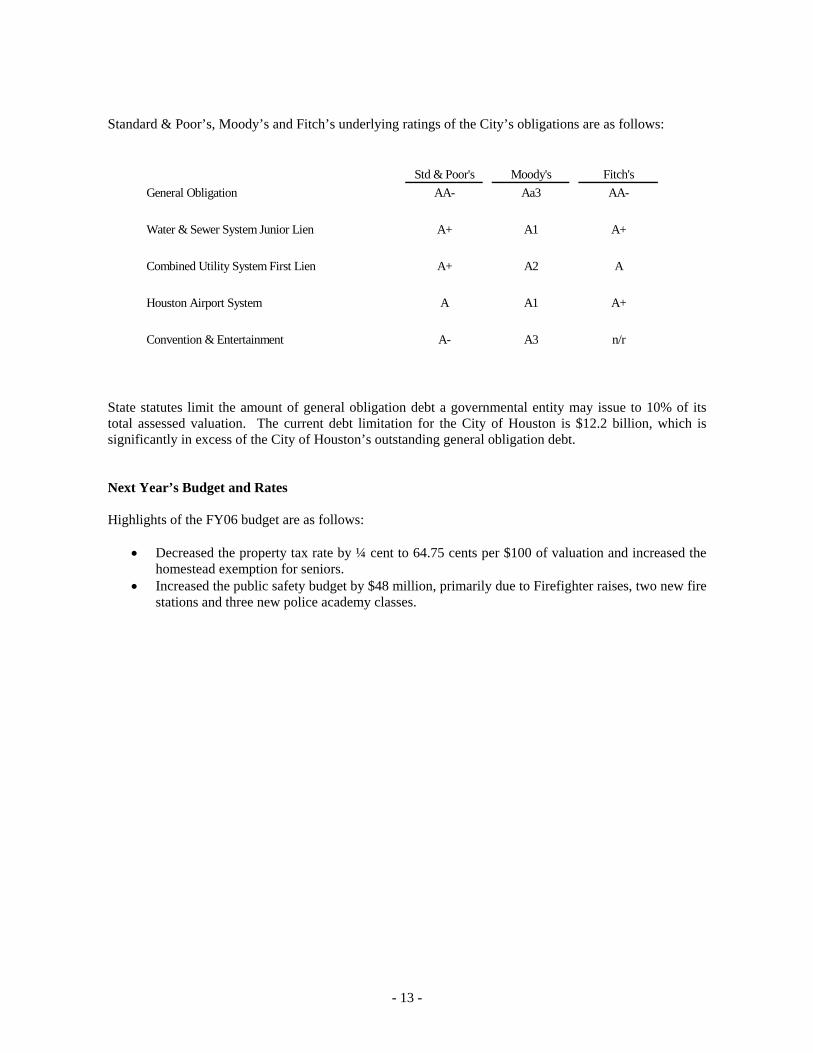
Standard & Poor’s, Moody’s and Fitch’s underlying ratings of the City’s obligations are as follows:
Std & Poor's Moody's Fitch'sGeneral Obligation AA- Aa3 AA-
Water & Sewer System Junior Lien A+ A1 A+
Combined Utility System First Lien A+ A2 A
Houston Airport System A A1 A+
Convention & Entertainment A- A3 n/r
State statutes limit the amount of general obligation debt a governmental entity may issue to 10% of its total assessed valuation. The current debt limitation for the City of Houston is $12.2 billion, which is significantly in excess of the City of Houston’s outstanding general obligation debt. Next Year’s Budget and Rates Highlights of the FY06 budget are as follows:
• Decreased the property tax rate by ¼ cent to 64.75 cents per $100 of valuation and increased the homestead exemption for seniors.
• Increased the public safety budget by $48 million, primarily due to Firefighter raises, two new fire stations and three new police academy classes.
- 13 -
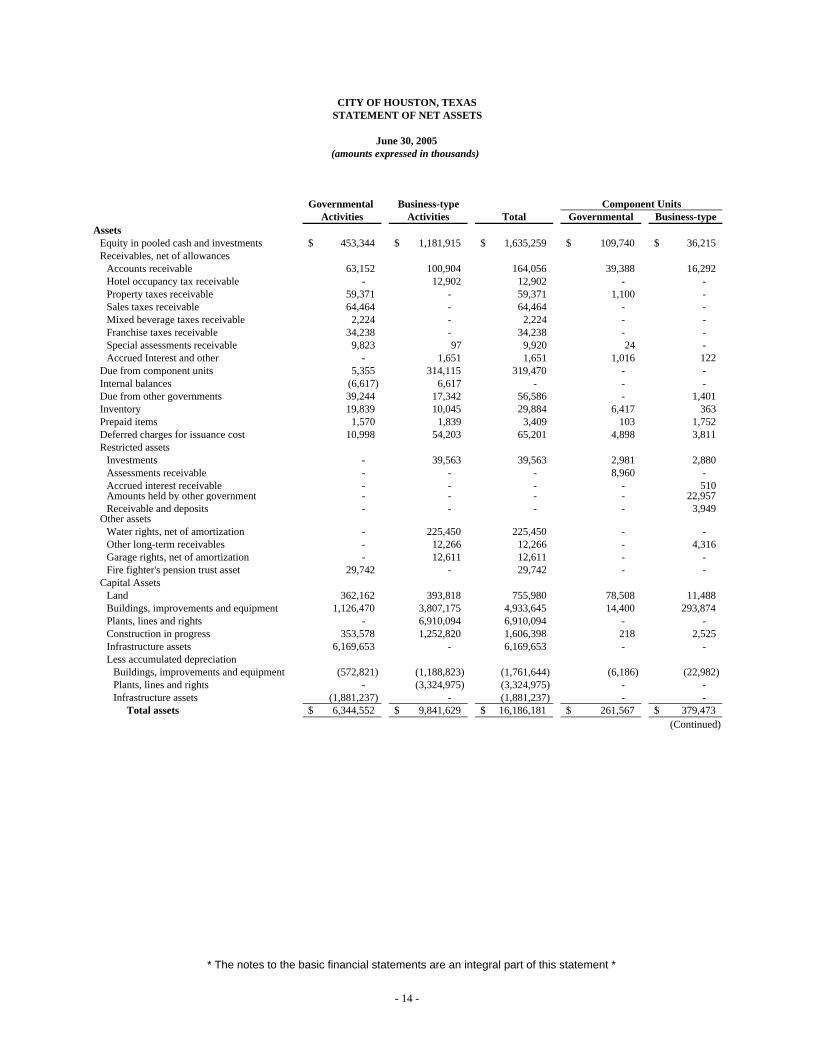
Governmental Business-typeActivities Activities Total Governmental Business-type
AssetsEquity in pooled cash and investments 453,344$ 1,181,915$ 1,635,259$ 109,740$ 36,215$ Receivables, net of allowances
Accounts receivable 63,152 100,904 164,056 39,388 16,292 Hotel occupancy tax receivable - 12,902 12,902 - - Property taxes receivable 59,371 - 59,371 1,100 - Sales taxes receivable 64,464 - 64,464 - - Mixed beverage taxes receivable 2,224 - 2,224 - - Franchise taxes receivable 34,238 - 34,238 - - Special assessments receivable 9,823 97 9,920 24 - Accrued Interest and other - 1,651 1,651 1,016 122
Due from component units 5,355 314,115 319,470 - - Internal balances (6,617) 6,617 - - - Due from other governments 39,244 17,342 56,586 - 1,401 Inventory 19,839 10,045 29,884 6,417 363 Prepaid items 1,570 1,839 3,409 103 1,752 Deferred charges for issuance cost 10,998 54,203 65,201 4,898 3,811 Restricted assets
Investments - 39,563 39,563 2,981 2,880 Assessments receivable - - - 8,960 - Accrued interest receivable - - - - 510 Amounts held by other government - - - - 22,957 Receivable and deposits - - - - 3,949
Other assets Water rights, net of amortization - 225,450 225,450 - - Other long-term receivables - 12,266 12,266 - 4,316 Garage rights, net of amortization - 12,611 12,611 - - Fire fighter's pension trust asset 29,742 - 29,742 - -
Capital AssetsLand 362,162 393,818 755,980 78,508 11,488 Buildings, improvements and equipment 1,126,470 3,807,175 4,933,645 14,400 293,874 Plants, lines and rights - 6,910,094 6,910,094 - - Construction in progress 353,578 1,252,820 1,606,398 218 2,525 Infrastructure assets 6,169,653 - 6,169,653 - - Less accumulated depreciation
Buildings, improvements and equipment (572,821) (1,188,823) (1,761,644) (6,186) (22,982) Plants, lines and rights - (3,324,975) (3,324,975) - - Infrastructure assets (1,881,237) - (1,881,237) - -
Total assets 6,344,552$ 9,841,629$ 16,186,181$ 261,567$ 379,473$ (Continued)
Component Units
CITY OF HOUSTON, TEXASSTATEMENT OF NET ASSETS
June 30, 2005(amounts expressed in thousands)
* The notes to the basic financial statements are an integral part of this statement *
- 14 -
Governmental Business-typeActivities Activities Total Governmental Business-type
Component Units
CITY OF HOUSTON, TEXASSTATEMENT OF NET ASSETS
June 30, 2005(amounts expressed in thousands)
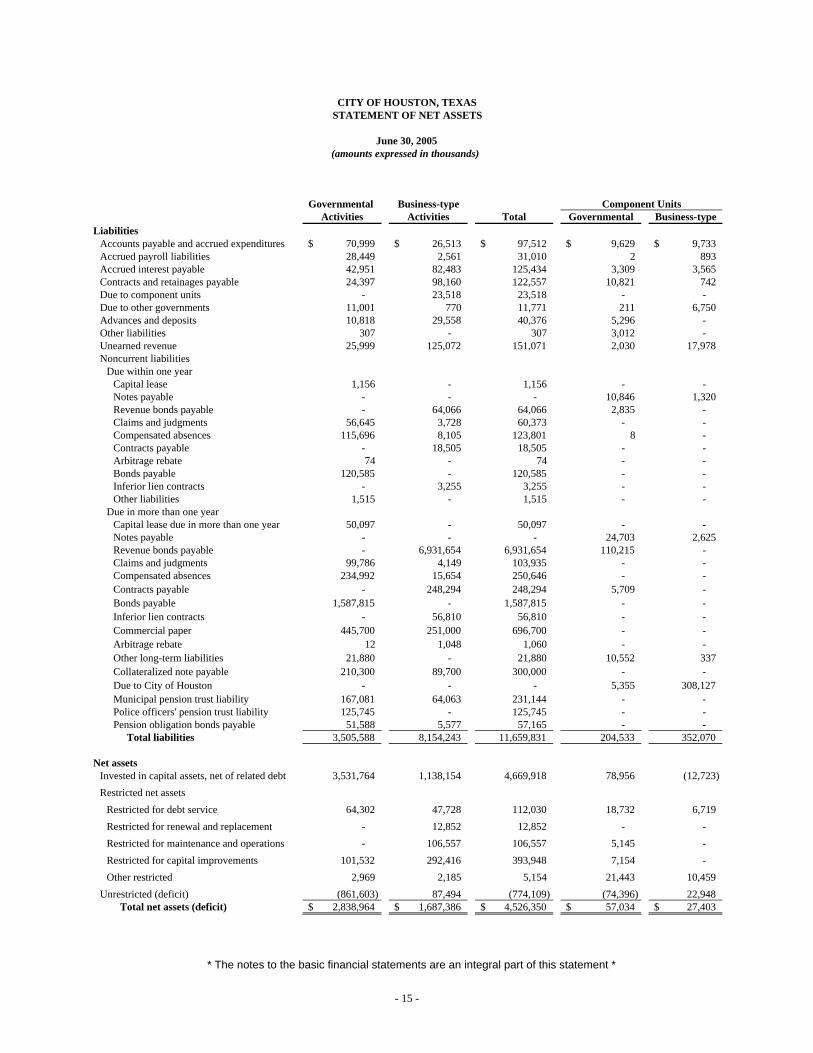
LiabilitiesAccounts payable and accrued expenditures 70,999$ 26,513$ 97,512$ 9,629$ 9,733$ Accrued payroll liabilities 28,449 2,561 31,010 2 893 Accrued interest payable 42,951 82,483 125,434 3,309 3,565 Contracts and retainages payable 24,397 98,160 122,557 10,821 742 Due to component units - 23,518 23,518 - - Due to other governments 11,001 770 11,771 211 6,750 Advances and deposits 10,818 29,558 40,376 5,296 - Other liabilities 307 - 307 3,012 - Unearned revenue 25,999 125,072 151,071 2,030 17,978 Noncurrent liabilities
Due within one yearCapital lease 1,156 - 1,156 - - Notes payable - - - 10,846 1,320 Revenue bonds payable - 64,066 64,066 2,835 - Claims and judgments 56,645 3,728 60,373 - - Compensated absences 115,696 8,105 123,801 8 - Contracts payable - 18,505 18,505 - - Arbitrage rebate 74 - 74 - - Bonds payable 120,585 - 120,585 - - Inferior lien contracts - 3,255 3,255 - - Other liabilities 1,515 - 1,515 - -
Due in more than one yearCapital lease due in more than one year 50,097 - 50,097 - - Notes payable - - - 24,703 2,625 Revenue bonds payable - 6,931,654 6,931,654 110,215 - Claims and judgments 99,786 4,149 103,935 - - Compensated absences 234,992 15,654 250,646 - - Contracts payable - 248,294 248,294 5,709 - Bonds payable 1,587,815 - 1,587,815 - - Inferior lien contracts - 56,810 56,810 - - Commercial paper 445,700 251,000 696,700 - - Arbitrage rebate 12 1,048 1,060 - - Other long-term liabilities 21,880 - 21,880 10,552 337 Collateralized note payable 210,300 89,700 300,000 - - Due to City of Houston - - - 5,355 308,127 Municipal pension trust liability 167,081 64,063 231,144 - - Police officers' pension trust liability 125,745 - 125,745 - - Pension obligation bonds payable 51,588 5,577 57,165 - -
Total liabilities 3,505,588 8,154,243 11,659,831 204,533 352,070
Net assetsInvested in capital assets, net of related debt 3,531,764 1,138,154 4,669,918 78,956 (12,723) Restricted net assets
Restricted for debt service 64,302 47,728 112,030 18,732 6,719 Restricted for renewal and replacement - 12,852 12,852 - - Restricted for maintenance and operations - 106,557 106,557 5,145 - Restricted for capital improvements 101,532 292,416 393,948 7,154 - Other restricted 2,969 2,185 5,154 21,443 10,459
Unrestricted (deficit) (861,603) 87,494 (774,109) (74,396) 22,948 Total net assets (deficit) 2,838,964$ 1,687,386$ 4,526,350$ 57,034$ 27,403$
* The notes to the basic financial statements are an integral part of this statement *
- 15 -
Operating CapitalCharges for Grants and Grants and
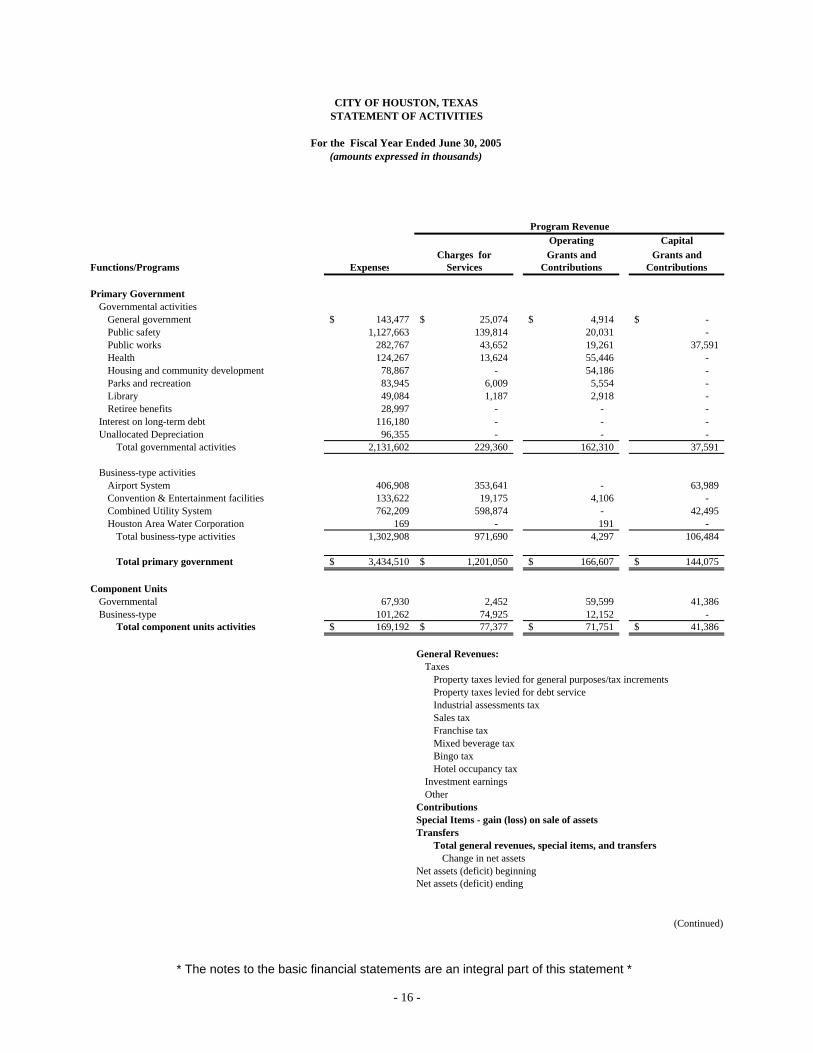
Functions/Programs Expenses Services Contributions Contributions
Primary GovernmentGovernmental activities
General government 143,477$ 25,074$ 4,914$ -$ Public safety 1,127,663 139,814 20,031 - Public works 282,767 43,652 19,261 37,591 Health 124,267 13,624 55,446 - Housing and community development 78,867 - 54,186 - Parks and recreation 83,945 6,009 5,554 - Library 49,084 1,187 2,918 - Retiree benefits 28,997 - - -
Interest on long-term debt 116,180 - - - Unallocated Depreciation 96,355 - - -
Total governmental activities 2,131,602 229,360 162,310 37,591
Business-type activitiesAirport System 406,908 353,641 - 63,989 Convention & Entertainment facilities 133,622 19,175 4,106 - Combined Utility System 762,209 598,874 - 42,495 Houston Area Water Corporation 169 - 191 -
Total business-type activities 1,302,908 971,690 4,297 106,484
Total primary government 3,434,510$ 1,201,050$ 166,607$ 144,075$
Component UnitsGovernmental 67,930 2,452 59,599 41,386 Business-type 101,262 74,925 12,152 -
Total component units activities 169,192$ 77,377$ 71,751$ 41,386$
General Revenues:Taxes
Property taxes levied for general purposes/tax incrementsProperty taxes levied for debt serviceIndustrial assessments taxSales taxFranchise taxMixed beverage taxBingo taxHotel occupancy tax
Investment earningsOther
ContributionsSpecial Items - gain (loss) on sale of assetsTransfers
Total general revenues, special items, and transfersChange in net assets
Net assets (deficit) beginning Net assets (deficit) ending
(Continued)
CITY OF HOUSTON, TEXAS
Program Revenue
(amounts expressed in thousands)For the Fiscal Year Ended June 30, 2005
STATEMENT OF ACTIVITIES
* The notes to the basic financial statements are an integral part of this statement *
- 16 -
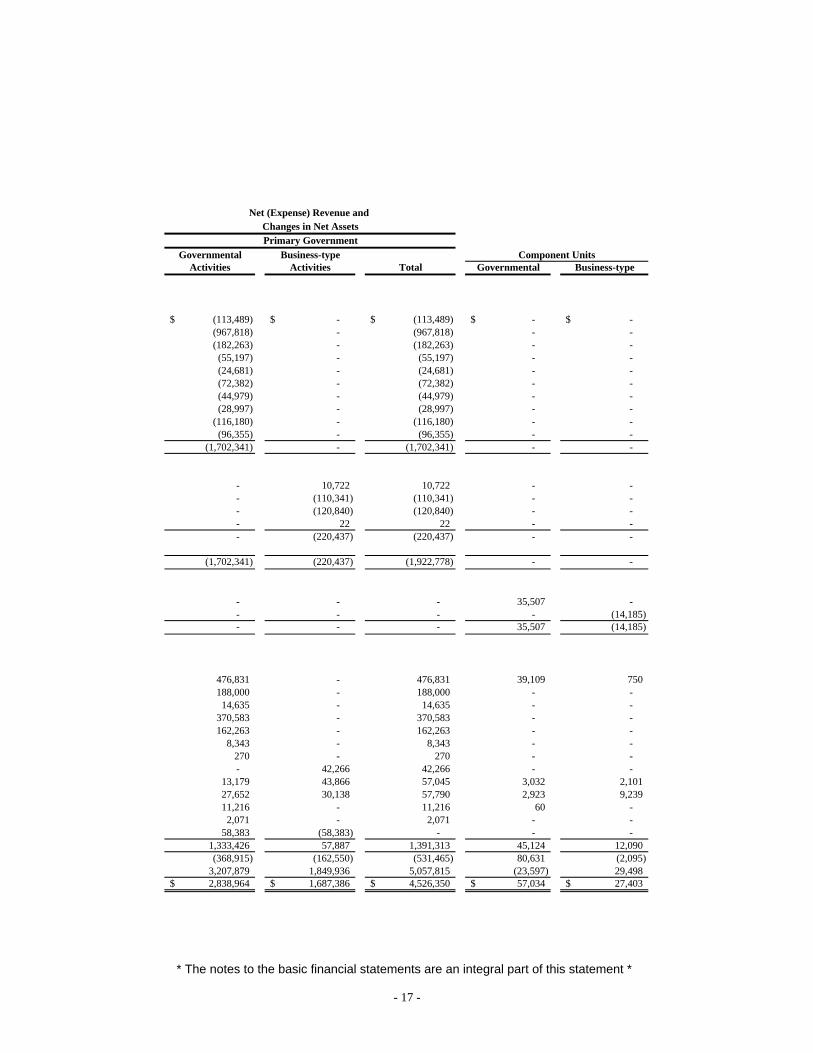
Governmental Business-typeActivities Activities Total Governmental Business-type
(113,489)$ -$ (113,489)$ -$ -$ (967,818) - (967,818) - - (182,263) - (182,263) - - (55,197) - (55,197) - - (24,681) - (24,681) - - (72,382) - (72,382) - - (44,979) - (44,979) - - (28,997) - (28,997) - -
(116,180) - (116,180) - - (96,355) - (96,355) - -
(1,702,341) - (1,702,341) - -
- 10,722 10,722 - - - (110,341) (110,341) - - - (120,840) (120,840) - - - 22 22 - - - (220,437) (220,437) - -
(1,702,341) (220,437) (1,922,778) - -
- - - 35,507 - - - - - (14,185) - - - 35,507 (14,185)
476,831 - 476,831 39,109 750 188,000 - 188,000 - - 14,635 - 14,635 - -
370,583 - 370,583 - - 162,263 - 162,263 - -
8,343 - 8,343 - - 270 - 270 - - - 42,266 42,266 - -
13,179 43,866 57,045 3,032 2,101 27,652 30,138 57,790 2,923 9,239 11,216 - 11,216 60 - 2,071 - 2,071 - -
58,383 (58,383) - - - 1,333,426 57,887 1,391,313 45,124 12,090 (368,915) (162,550) (531,465) 80,631 (2,095)
3,207,879 1,849,936 5,057,815 (23,597) 29,498 2,838,964$ 1,687,386$ 4,526,350$ 57,034$ 27,403$
Changes in Net AssetsNet (Expense) Revenue and
Component UnitsPrimary Government
* The notes to the basic financial statements are an integral part of this statement *
- 17 -
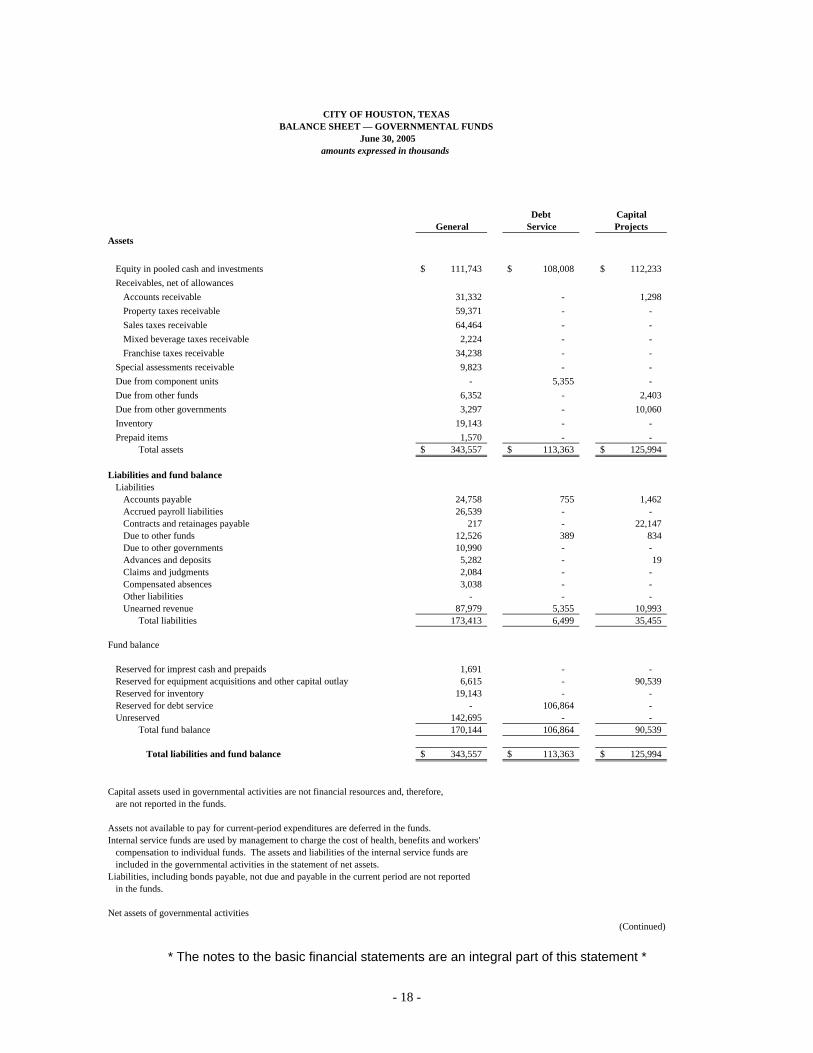
Debt CapitalGeneral Service Projects
Assets
Equity in pooled cash and investments 111,743$ 108,008$ 112,233$ Receivables, net of allowances
Accounts receivable 31,332 - 1,298 Property taxes receivable 59,371 - - Sales taxes receivable 64,464 - - Mixed beverage taxes receivable 2,224 - - Franchise taxes receivable 34,238 - -
Special assessments receivable 9,823 - - Due from component units - 5,355 - Due from other funds 6,352 - 2,403 Due from other governments 3,297 - 10,060 Inventory 19,143 - - Prepaid items 1,570 - -
Total assets 343,557$ 113,363$ 125,994$
Liabilities and fund balanceLiabilities
Accounts payable 24,758 755 1,462 Accrued payroll liabilities 26,539 - - Contracts and retainages payable 217 - 22,147 Due to other funds 12,526 389 834 Due to other governments 10,990 - - Advances and deposits 5,282 - 19 Claims and judgments 2,084 - - Compensated absences 3,038 - - Other liabilities - - - Unearned revenue 87,979 5,355 10,993
Total liabilities 173,413 6,499 35,455
Fund balance
Reserved for imprest cash and prepaids 1,691 - - Reserved for equipment acquisitions and other capital outlay 6,615 - 90,539 Reserved for inventory 19,143 - - Reserved for debt service - 106,864 - Unreserved 142,695 - -
Total fund balance 170,144 106,864 90,539
Total liabilities and fund balance 343,557$ 113,363$ 125,994$
Capital assets used in governmental activities are not financial resources and, therefore,are not reported in the funds.
Assets not available to pay for current-period expenditures are deferred in the funds.Internal service funds are used by management to charge the cost of health, benefits and workers'
compensation to individual funds. The assets and liabilities of the internal service funds areincluded in the governmental activities in the statement of net assets.
Liabilities, including bonds payable, not due and payable in the current period are not reportedin the funds.
Net assets of governmental activities(Continued)
CITY OF HOUSTON, TEXASBALANCE SHEET — GOVERNMENTAL FUNDS
June 30, 2005amounts expressed in thousands
* The notes to the basic financial statements are an integral part of this statement *
- 18 -
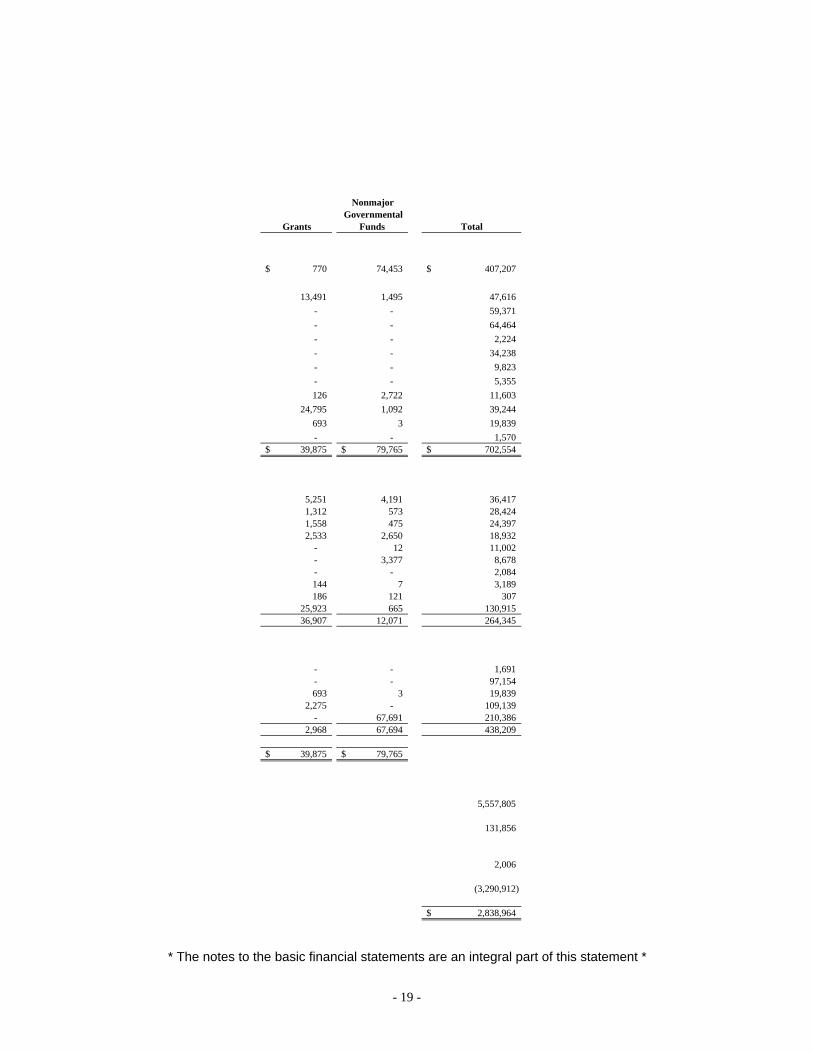
Grants Total
770$ 74,453 407,207$
13,491 1,495 47,616 - - 59,371 - - 64,464 - - 2,224 - - 34,238 - - 9,823 - - 5,355 126 2,722 11,603
24,795 1,092 39,244 693 3 19,839 - - 1,570
39,875$ 79,765$ 702,554$
5,251 4,191 36,417 1,312 573 28,424 1,558 475 24,397 2,533 2,650 18,932
- 12 11,002 - 3,377 8,678 - - 2,084 144 7 3,189 186 121 307
25,923 665 130,915 36,907 12,071 264,345
- - 1,691 - - 97,154 693 3 19,839
2,275 - 109,139 - 67,691 210,386
2,968 67,694 438,209
39,875$ 79,765$
5,557,805
131,856
2,006
(3,290,912)
2,838,964$
Nonmajor Governmental
Funds
* The notes to the basic financial statements are an integral part of this statement *
- 19 -
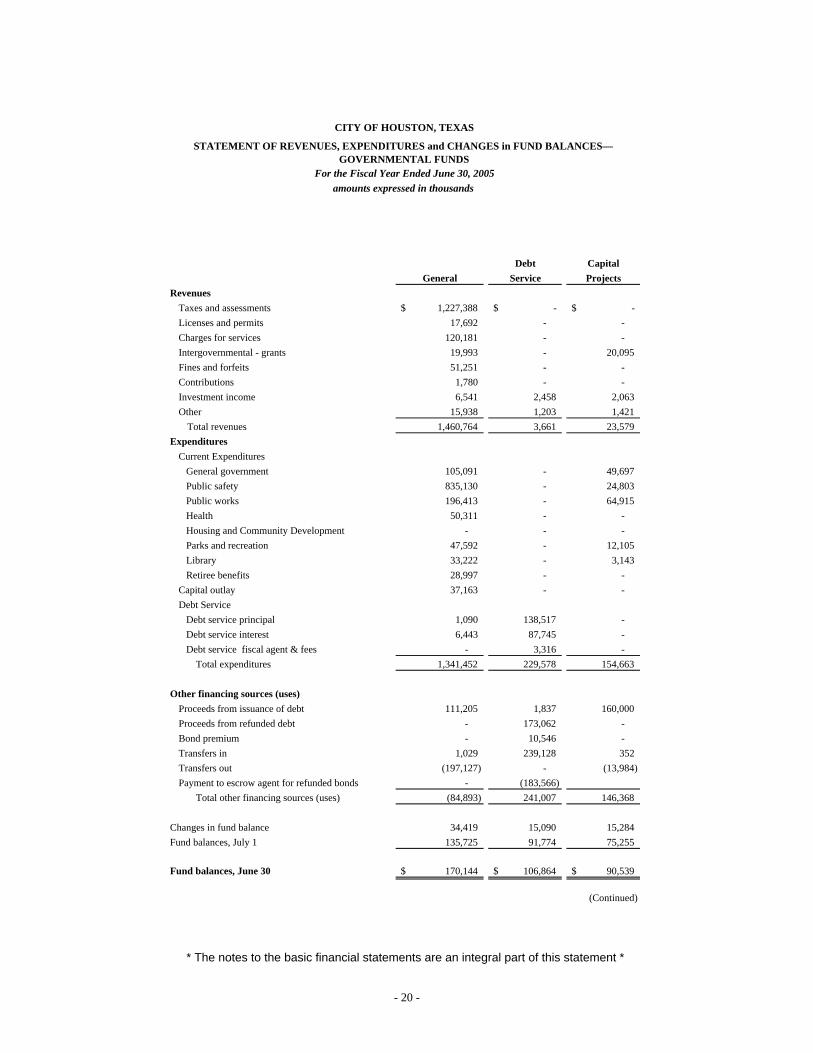
Debt CapitalGeneral Service Projects
RevenuesTaxes and assessments 1,227,388$ -$ -$ Licenses and permits 17,692 - - Charges for services 120,181 - - Intergovernmental - grants 19,993 - 20,095 Fines and forfeits 51,251 - - Contributions 1,780 - - Investment income 6,541 2,458 2,063 Other 15,938 1,203 1,421
Total revenues 1,460,764 3,661 23,579 Expenditures
Current Expenditures General government 105,091 - 49,697 Public safety 835,130 - 24,803 Public works 196,413 - 64,915 Health 50,311 - - Housing and Community Development - - - Parks and recreation 47,592 - 12,105 Library 33,222 - 3,143 Retiree benefits 28,997 - - Capital outlay 37,163 - - Debt Service Debt service principal 1,090 138,517 - Debt service interest 6,443 87,745 - Debt service fiscal agent & fees - 3,316 -
Total expenditures 1,341,452 229,578 154,663
Other financing sources (uses)Proceeds from issuance of debt 111,205 1,837 160,000 Proceeds from refunded debt - 173,062 - Bond premium - 10,546 - Transfers in 1,029 239,128 352 Transfers out (197,127) - (13,984) Payment to escrow agent for refunded bonds - (183,566)
Total other financing sources (uses) (84,893) 241,007 146,368
Changes in fund balance 34,419 15,090 15,284 Fund balances, July 1 135,725 91,774 75,255
Fund balances, June 30 170,144$ 106,864$ 90,539$
(Continued)
STATEMENT OF REVENUES, EXPENDITURES and CHANGES in FUND BALANCES— GOVERNMENTAL FUNDS
CITY OF HOUSTON, TEXAS
amounts expressed in thousands For the Fiscal Year Ended June 30, 2005
* The notes to the basic financial statements are an integral part of this statement *
- 20 -
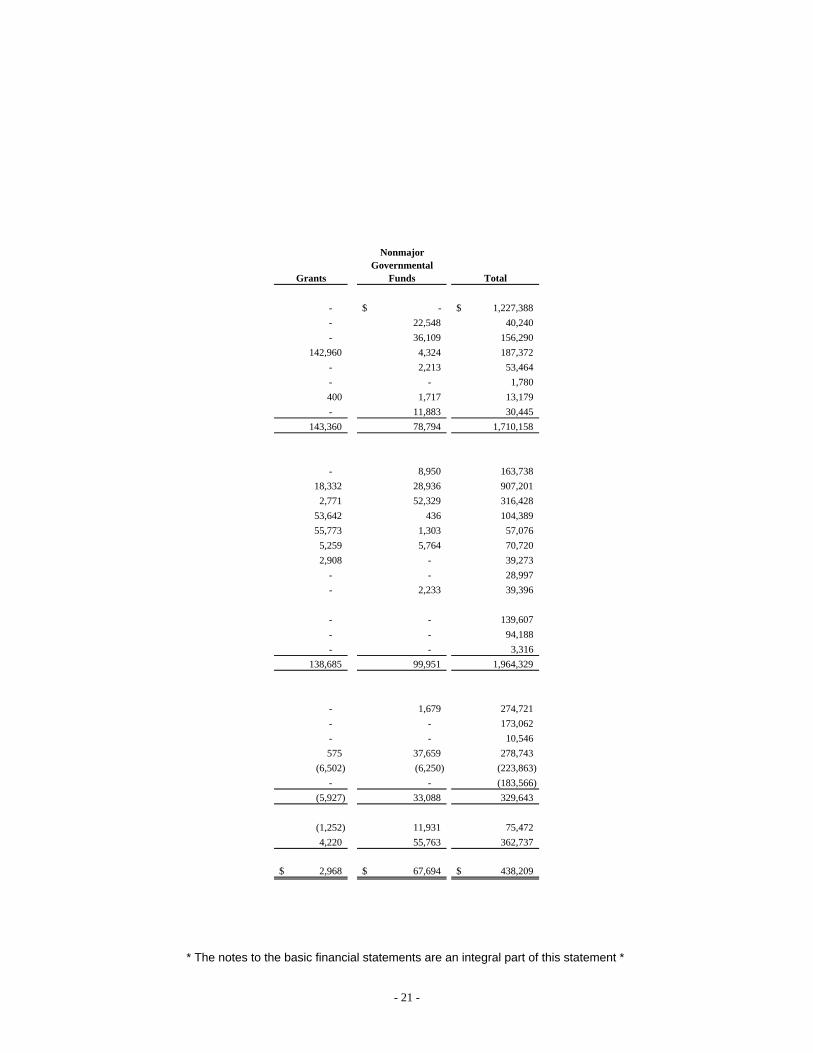
Grants Total
- -$ 1,227,388$ - 22,548 40,240 - 36,109 156,290
142,960 4,324 187,372 - 2,213 53,464 - - 1,780 400 1,717 13,179 - 11,883 30,445
143,360 78,794 1,710,158
- 8,950 163,738 18,332 28,936 907,201
2,771 52,329 316,428 53,642 436 104,389 55,773 1,303 57,076
5,259 5,764 70,720 2,908 - 39,273
- - 28,997 - 2,233 39,396
- - 139,607 - - 94,188 - - 3,316
138,685 99,951 1,964,329
- 1,679 274,721 - - 173,062 - - 10,546 575 37,659 278,743
(6,502) (6,250) (223,863) - - (183,566)
(5,927) 33,088 329,643
(1,252) 11,931 75,472 4,220 55,763 362,737
2,968$ 67,694$ 438,209$
Nonmajor Governmental
Funds
* The notes to the basic financial statements are an integral part of this statement *
- 21 -
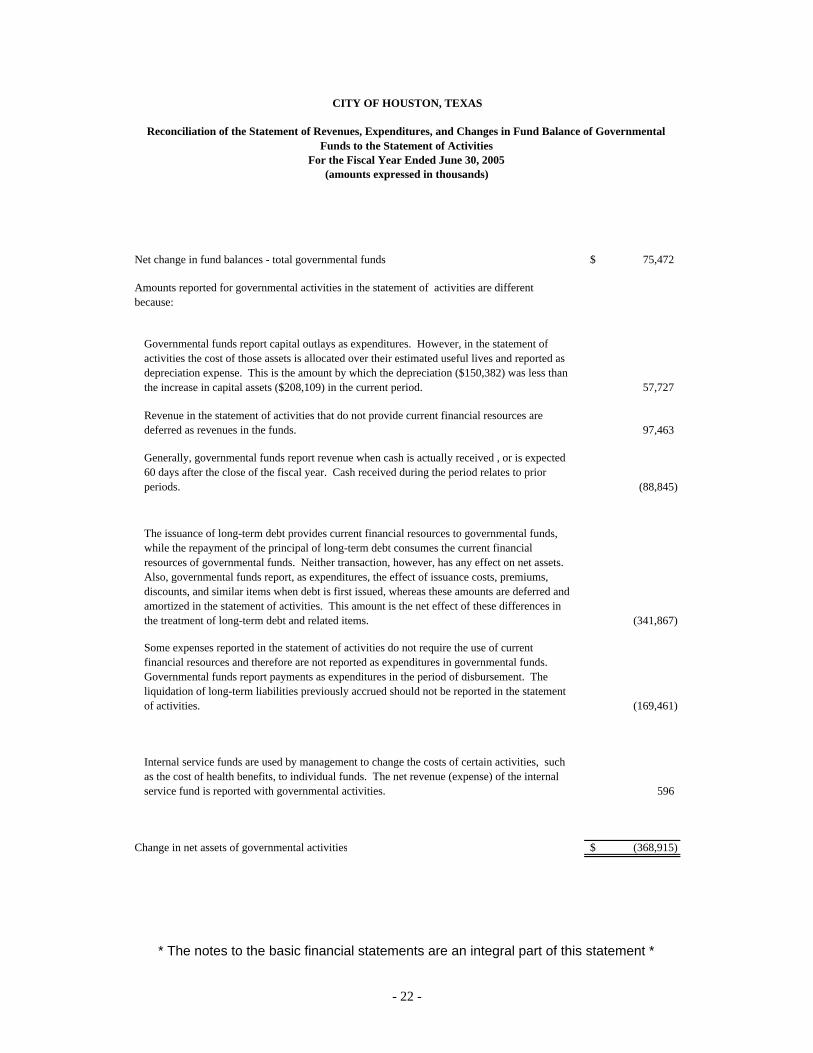
Net change in fund balances - total governmental funds 75,472$
57,727
97,463
(88,845)
(341,867)
Some expenses reported in the statement of activities do not require the use of current financial resources and therefore are not reported as expenditures in governmental funds. Governmental funds report payments as expenditures in the period of disbursement. The liquidation of long-term liabilities previously accrued should not be reported in the statement of activities. (169,461)
596
Change in net assets of governmental activities (368,915)$
Reconciliation of the Statement of Revenues, Expenditures, and Changes in Fund Balance of Governmental Funds to the Statement of Activities
Revenue in the statement of activities that do not provide current financial resources are deferred as revenues in the funds.
CITY OF HOUSTON, TEXAS
For the Fiscal Year Ended June 30, 2005(amounts expressed in thousands)
Amounts reported for governmental activities in the statement of activities are different because:
Internal service funds are used by management to change the costs of certain activities, such as the cost of health benefits, to individual funds. The net revenue (expense) of the internal service fund is reported with governmental activities.
Governmental funds report capital outlays as expenditures. However, in the statement of activities the cost of those assets is allocated over their estimated useful lives and reported as depreciation expense. This is the amount by which the depreciation ($150,382) was less than the increase in capital assets ($208,109) in the current period.
Generally, governmental funds report revenue when cash is actually received , or is expected 60 days after the close of the fiscal year. Cash received during the period relates to prior periods.
The issuance of long-term debt provides current financial resources to governmental funds, while the repayment of the principal of long-term debt consumes the current financial resources of governmental funds. Neither transaction, however, has any effect on net assets. Also, governmental funds report, as expenditures, the effect of issuance costs, premiums, discounts, and similar items when debt is first issued, whereas these amounts are deferred and amortized in the statement of activities. This amount is the net effect of these differences in the treatment of long-term debt and related items.
* The notes to the basic financial statements are an integral part of this statement *
- 22 -
CITY OF HOUSTON, TEXAS
This page is left blank intentionally
- 23 -
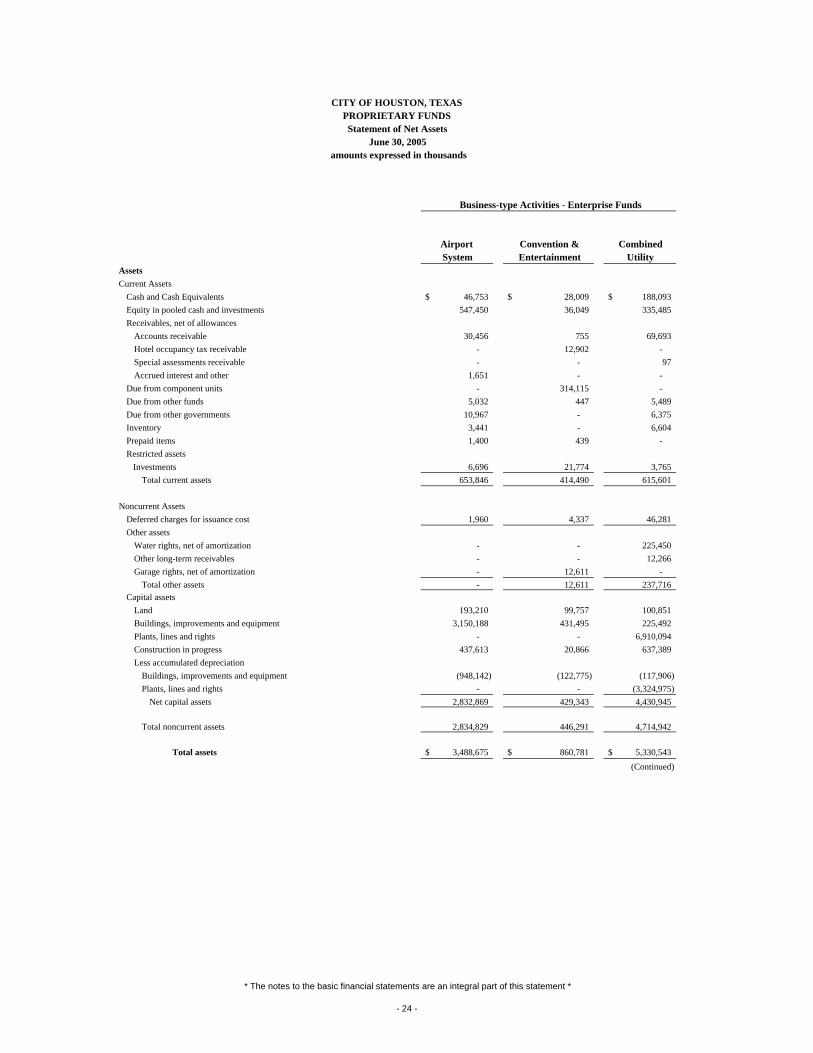
Airport Convention & CombinedSystem Entertainment Utility
AssetsCurrent Assets
Cash and Cash Equivalents 46,753$ 28,009$ 188,093$ Equity in pooled cash and investments 547,450 36,049 335,485 Receivables, net of allowances
Accounts receivable 30,456 755 69,693 Hotel occupancy tax receivable - 12,902 - Special assessments receivable - - 97 Accrued interest and other 1,651 - -
Due from component units - 314,115 - Due from other funds 5,032 447 5,489 Due from other governments 10,967 - 6,375 Inventory 3,441 - 6,604 Prepaid items 1,400 439 - Restricted assets Investments 6,696 21,774 3,765
Total current assets 653,846 414,490 615,601
Noncurrent AssetsDeferred charges for issuance cost 1,960 4,337 46,281 Other assets
Water rights, net of amortization - - 225,450 Other long-term receivables - - 12,266 Garage rights, net of amortization - 12,611 -
Total other assets - 12,611 237,716 Capital assets
Land 193,210 99,757 100,851 Buildings, improvements and equipment 3,150,188 431,495 225,492 Plants, lines and rights - - 6,910,094 Construction in progress 437,613 20,866 637,389 Less accumulated depreciation
Buildings, improvements and equipment (948,142) (122,775) (117,906) Plants, lines and rights - - (3,324,975)
Net capital assets 2,832,869 429,343 4,430,945
Total noncurrent assets 2,834,829 446,291 4,714,942
Total assets 3,488,675$ 860,781$ 5,330,543$ (Continued)
CITY OF HOUSTON, TEXASPROPRIETARY FUNDSStatement of Net Assets
June 30, 2005
Business-type Activities - Enterprise Funds
amounts expressed in thousands
* The notes to the basic financial statements are an integral part of this statement *
- 24 -
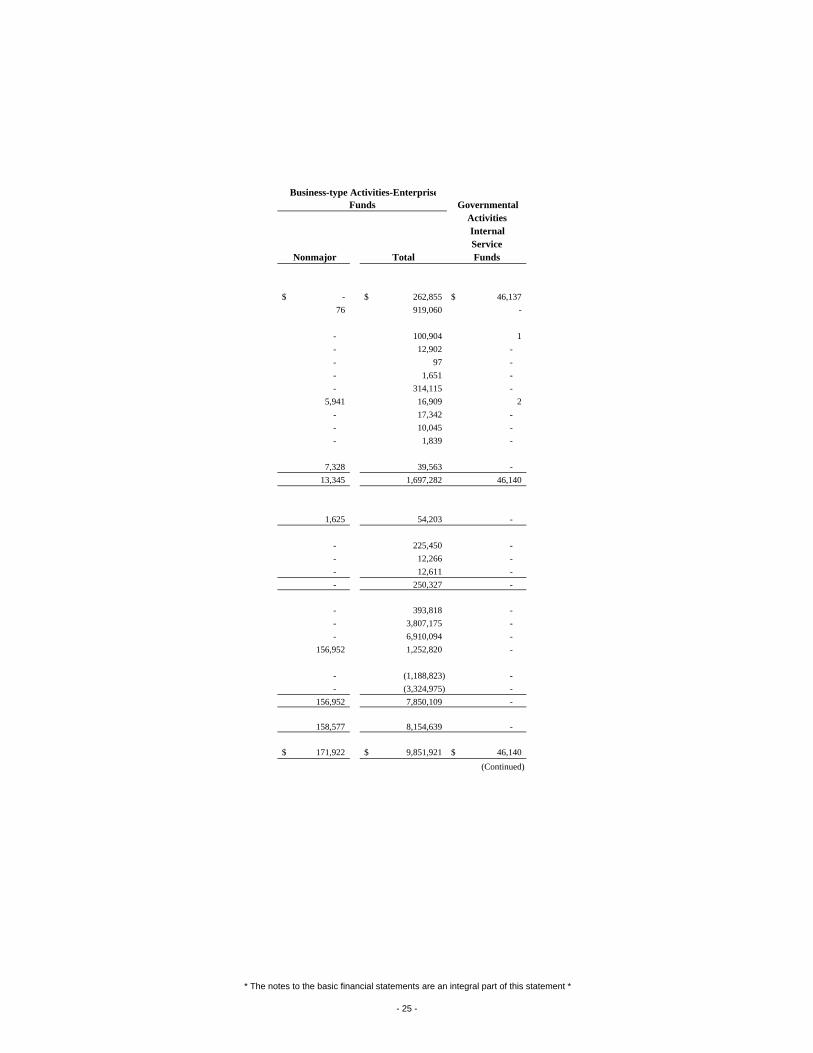
GovernmentalActivitiesInternalService
Nonmajor Total Funds
-$ 262,855$ 46,137$ 76 919,060 -
- 100,904 1 - 12,902 - - 97 - - 1,651 - - 314,115 -
5,941 16,909 2 - 17,342 - - 10,045 - - 1,839 -
7,328 39,563 - 13,345 1,697,282 46,140
1,625 54,203 -
- 225,450 - - 12,266 - - 12,611 - - 250,327 -
- 393,818 - - 3,807,175 - - 6,910,094 -
156,952 1,252,820 -
- (1,188,823) - - (3,324,975) -
156,952 7,850,109 -
158,577 8,154,639 -
171,922$ 9,851,921$ 46,140$ (Continued)
Business-type Activities-EnterpriseFunds
* The notes to the basic financial statements are an integral part of this statement *
- 25 -
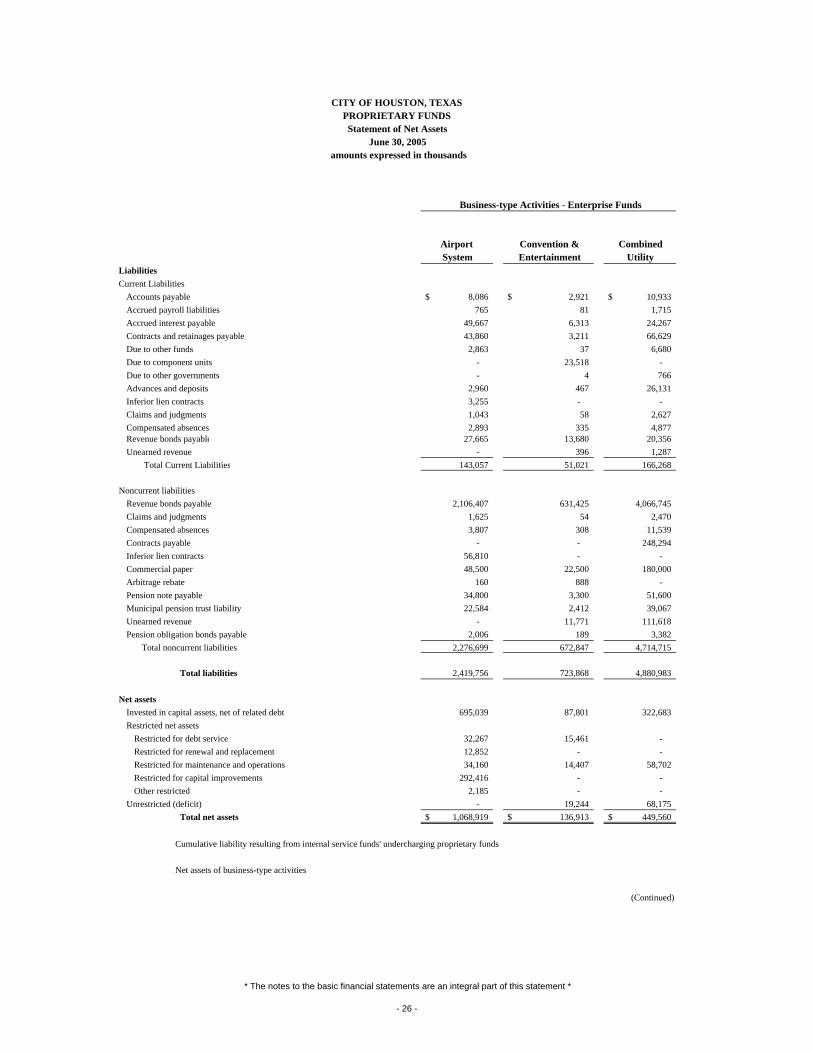
Airport Convention & CombinedSystem Entertainment Utility
CITY OF HOUSTON, TEXASPROPRIETARY FUNDSStatement of Net Assets
June 30, 2005
Business-type Activities - Enterprise Funds
amounts expressed in thousands
LiabilitiesCurrent Liabilities
Accounts payable 8,086$ 2,921$ 10,933$ Accrued payroll liabilities 765 81 1,715 Accrued interest payable 49,667 6,313 24,267 Contracts and retainages payable 43,860 3,211 66,629 Due to other funds 2,863 37 6,680 Due to component units - 23,518 - Due to other governments - 4 766 Advances and deposits 2,960 467 26,131 Inferior lien contracts 3,255 - - Claims and judgments 1,043 58 2,627 Compensated absences 2,893 335 4,877 Revenue bonds payable 27,665 13,680 20,356 Unearned revenue - 396 1,287
Total Current Liabilities 143,057 51,021 166,268
Noncurrent liabilitiesRevenue bonds payable 2,106,407 631,425 4,066,745 Claims and judgments 1,625 54 2,470 Compensated absences 3,807 308 11,539 Contracts payable - - 248,294 Inferior lien contracts 56,810 - - Commercial paper 48,500 22,500 180,000 Arbitrage rebate 160 888 - Pension note payable 34,800 3,300 51,600 Municipal pension trust liability 22,584 2,412 39,067 Unearned revenue - 11,771 111,618 Pension obligation bonds payable 2,006 189 3,382
Total noncurrent liabilities 2,276,699 672,847 4,714,715
Total liabilities 2,419,756 723,868 4,880,983
Net assetsInvested in capital assets, net of related debt 695,039 87,801 322,683 Restricted net assets
Restricted for debt service 32,267 15,461 - Restricted for renewal and replacement 12,852 - - Restricted for maintenance and operations 34,160 14,407 58,702 Restricted for capital improvements 292,416 - - Other restricted 2,185 - -
Unrestricted (deficit) - 19,244 68,175 Total net assets 1,068,919$ 136,913$ 449,560$
Cumulative liability resulting from internal service funds' undercharging proprietary funds
Net assets of business-type activities
(Continued)
* The notes to the basic financial statements are an integral part of this statement *
- 26 -
GovernmentalActivitiesInternalService
Nonmajor Total Funds
Business-type Activities-EnterpriseFunds
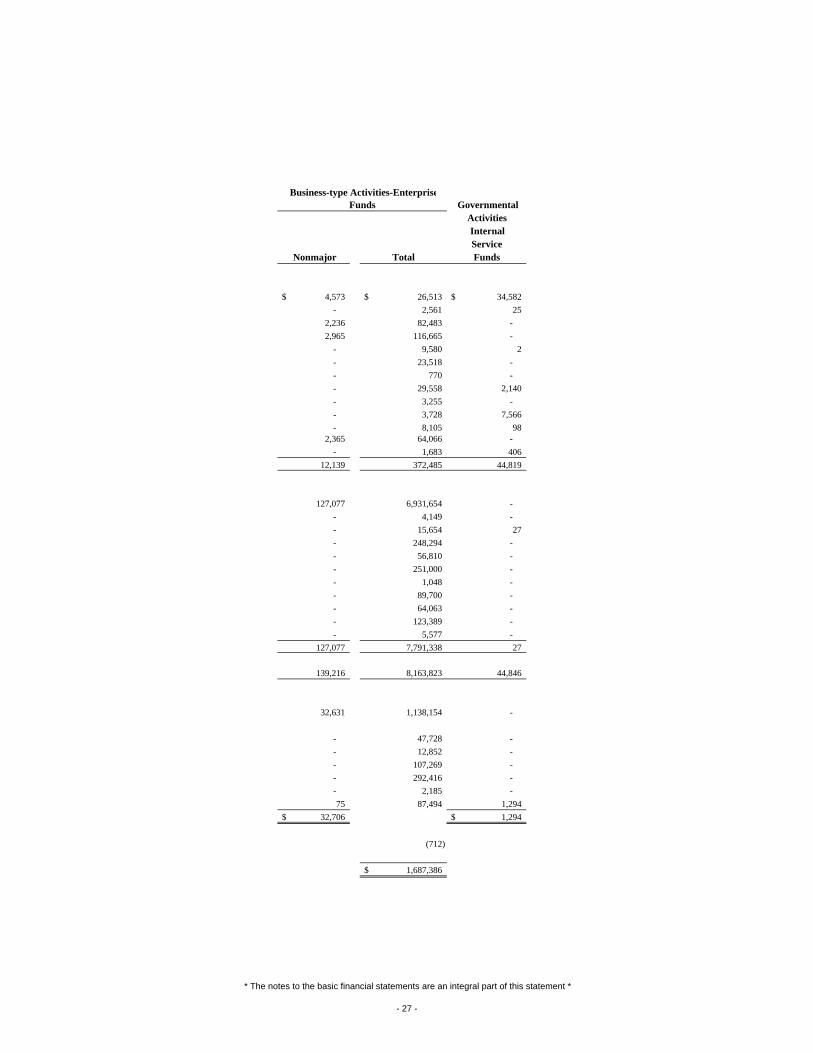
4,573$ 26,513$ 34,582$ - 2,561 25
2,236 82,483 - 2,965 116,665 -
- 9,580 2 - 23,518 - - 770 - - 29,558 2,140 - 3,255 - - 3,728 7,566 - 8,105 98
2,365 64,066 - - 1,683 406
12,139 372,485 44,819
127,077 6,931,654 - - 4,149 - - 15,654 27 - 248,294 - - 56,810 - - 251,000 - - 1,048 - - 89,700 - - 64,063 - - 123,389 - - 5,577 -
127,077 7,791,338 27
139,216 8,163,823 44,846
32,631 1,138,154 -
- 47,728 - - 12,852 - - 107,269 - - 292,416 - - 2,185 - 75 87,494 1,294
32,706$ 1,294$
(712)
1,687,386$
* The notes to the basic financial statements are an integral part of this statement *
- 27 -
Airport Convention & CombinedSystem Entertainment Utility
Operating RevenuesLanding area fees 102,072$ -$ -$ Terminal space rentals 151,417 - - Other building and grounds area - - - Parking 55,444 8,882 - Concession 41,842 3,373 - Other 2,866 - - Rental - 6,920 - Water/Sewer Billing - - 598,874 Health benefit premiums - - -
Total operating revenue 353,641 19,175 598,874
Operating ExpensesAdministrative costs - - - Claims Costs - - - Maintenance and operating 223,972 32,797 332,800 Depreciation and amortization 105,891 10,372 224,074 Bad debt expense - - -
Total operating expenses 329,863 43,169 556,874 Operating income (loss) 23,778 (23,994) 42,000
Nonoperating revenue (expenses)Investment income 14,968 15,926 12,972 Hotel occupancy tax - 42,266 - Other revenue 4,295 - 24,707 Loss on disposal of assets (549) - (4,193) Other expenses - (19,614) - Interest on long-term debt (76,496) (29,468) (201,142) Arbitrage expense recovery 1,137 - - Contributions in - 4,106 - Contributions out - (41,371) -
Total nonoperating revenues (expenses) (56,645) (28,155) (167,656)
Income (loss) before contributions and transfers (32,867) (52,149) (125,656)
Capital contributions 63,989 231 42,495
Transfers in - 2,942 - Transfers out - (709) (87,414)
Total transfers - 2,233 (87,414)
Change in net assets 31,122 (49,685) (170,575) Liability resulting from internal service fund's undercharging proprietary fundsNet change
Total net assets (deficit), July 1 1,037,797 186,598 620,135
Total net assets, June 30 1,068,919$ 136,913$ 449,560$
Cumulative liability resulting from internal service funds' undercharging proprietary funds
Total net assets business-type activities(Continued)
Business-type Activities - Enterprise Funds
CITY OF HOUSTON, TEXASPROPRIETARY FUNDS
Statement of Revenues, Expenses and Changes in Fund Net AssetsFor the Fiscal Year Ended June 30, 2005
amounts expressed in thousands
* The notes to the basic financial statement are an integral part of this statement *
- 28 -
GovernmentalActivities
Non-Major InternalHouston Area ServiceWater Corp. Total Funds
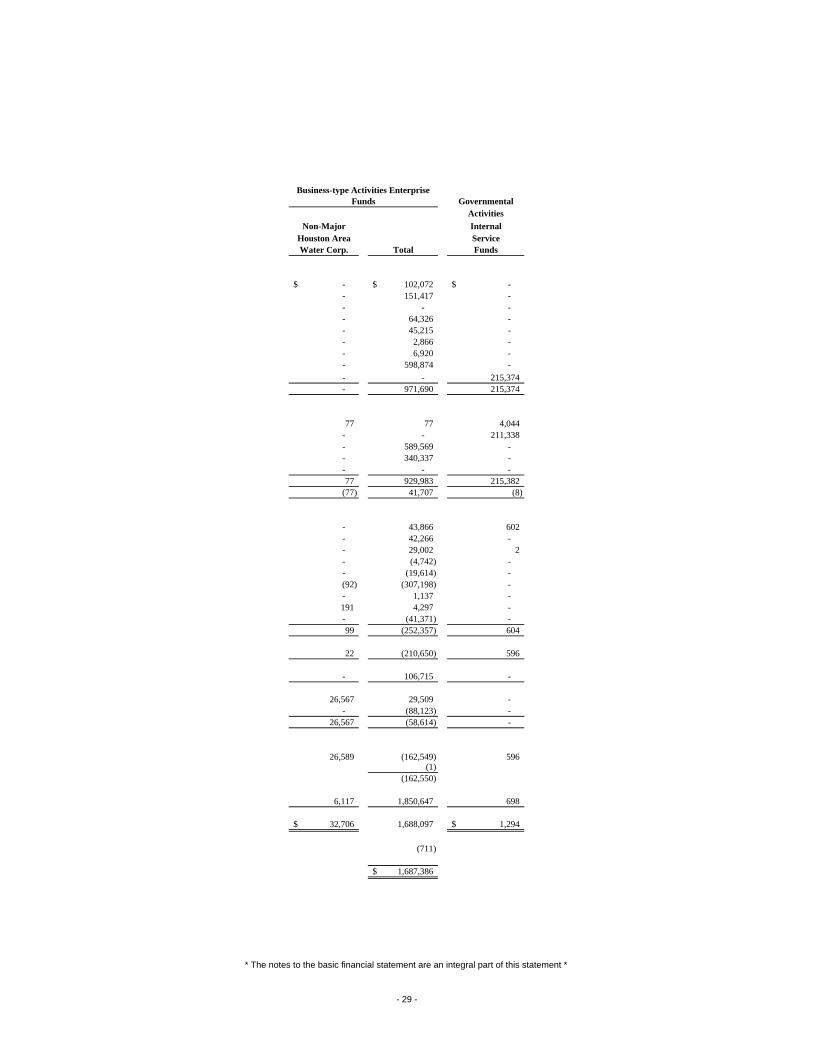
-$ 102,072$ -$ - 151,417 - - - - - 64,326 - - 45,215 - - 2,866 - - 6,920 - - 598,874 - - - 215,374 - 971,690 215,374
77 77 4,044 - - 211,338 - 589,569 - - 340,337 - - - - 77 929,983 215,382
(77) 41,707 (8)
- 43,866 602 - 42,266 - - 29,002 2 - (4,742) - - (19,614) - (92) (307,198) - - 1,137 - 191 4,297 - - (41,371) - 99 (252,357) 604
22 (210,650) 596
- 106,715 -
26,567 29,509 - - (88,123) -
26,567 (58,614) -
26,589 (162,549) 596 (1)
(162,550)
6,117 1,850,647 698
32,706$ 1,688,097 1,294$
(711)
1,687,386$
Business-type Activities Enterprise Funds
* The notes to the basic financial statement are an integral part of this statement *
- 29 -
Airport Convention &System Entertainment
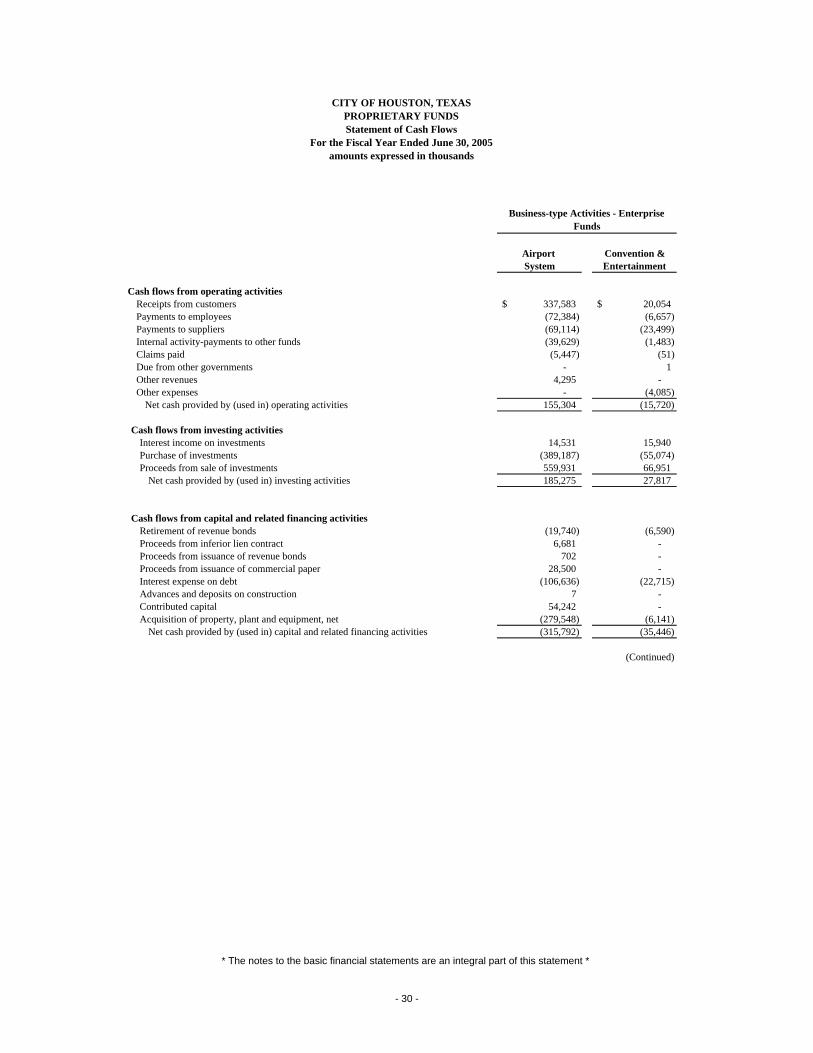
Cash flows from operating activitiesReceipts from customers 337,583$ 20,054$ Payments to employees (72,384) (6,657) Payments to suppliers (69,114) (23,499) Internal activity-payments to other funds (39,629) (1,483) Claims paid (5,447) (51) Due from other governments - 1 Other revenues 4,295 - Other expenses - (4,085)
Net cash provided by (used in) operating activities 155,304 (15,720)
Cash flows from investing activitiesInterest income on investments 14,531 15,940 Purchase of investments (389,187) (55,074) Proceeds from sale of investments 559,931 66,951
Net cash provided by (used in) investing activities 185,275 27,817
Cash flows from capital and related financing activitiesRetirement of revenue bonds (19,740) (6,590) Proceeds from inferior lien contract 6,681 - Proceeds from issuance of revenue bonds 702 - Proceeds from issuance of commercial paper 28,500 - Interest expense on debt (106,636) (22,715) Advances and deposits on construction 7 - Contributed capital 54,242 - Acquisition of property, plant and equipment, net (279,548) (6,141)
Net cash provided by (used in) capital and related financing activities (315,792) (35,446)
(Continued)
Business-type Activities - Enterprise Funds
amounts expressed in thousands
CITY OF HOUSTON, TEXASPROPRIETARY FUNDSStatement of Cash Flows
For the Fiscal Year Ended June 30, 2005
* The notes to the basic financial statements are an integral part of this statement *
- 30 -
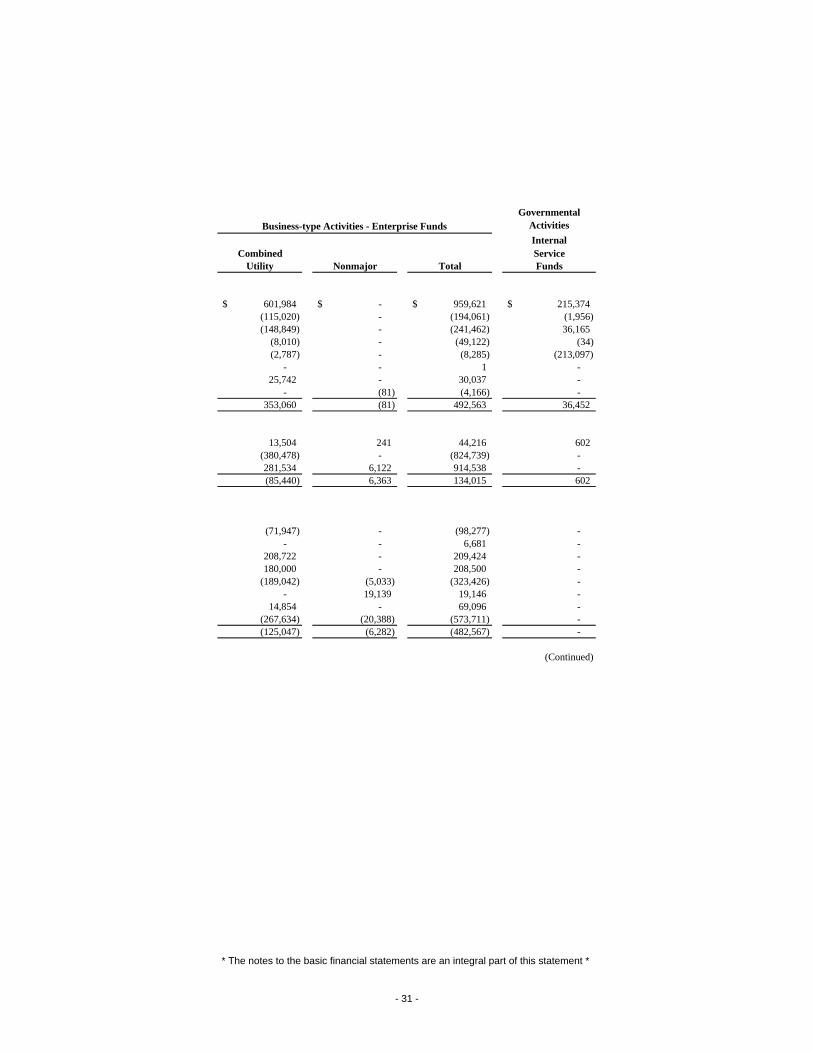
Governmental ActivitiesInternal
Combined ServiceUtility Nonmajor Total Funds
601,984$ -$ 959,621$ 215,374$ (115,020) - (194,061) (1,956) (148,849) - (241,462) 36,165
(8,010) - (49,122) (34) (2,787) - (8,285) (213,097)
- - 1 - 25,742 - 30,037 -
- (81) (4,166) - 353,060 (81) 492,563 36,452
13,504 241 44,216 602 (380,478) - (824,739) - 281,534 6,122 914,538 - (85,440) 6,363 134,015 602
(71,947) - (98,277) - - - 6,681 -
208,722 - 209,424 - 180,000 - 208,500 -
(189,042) (5,033) (323,426) - - 19,139 19,146 -
14,854 - 69,096 - (267,634) (20,388) (573,711) - (125,047) (6,282) (482,567) -
(Continued)
Business-type Activities - Enterprise Funds
* The notes to the basic financial statements are an integral part of this statement *
- 31 -
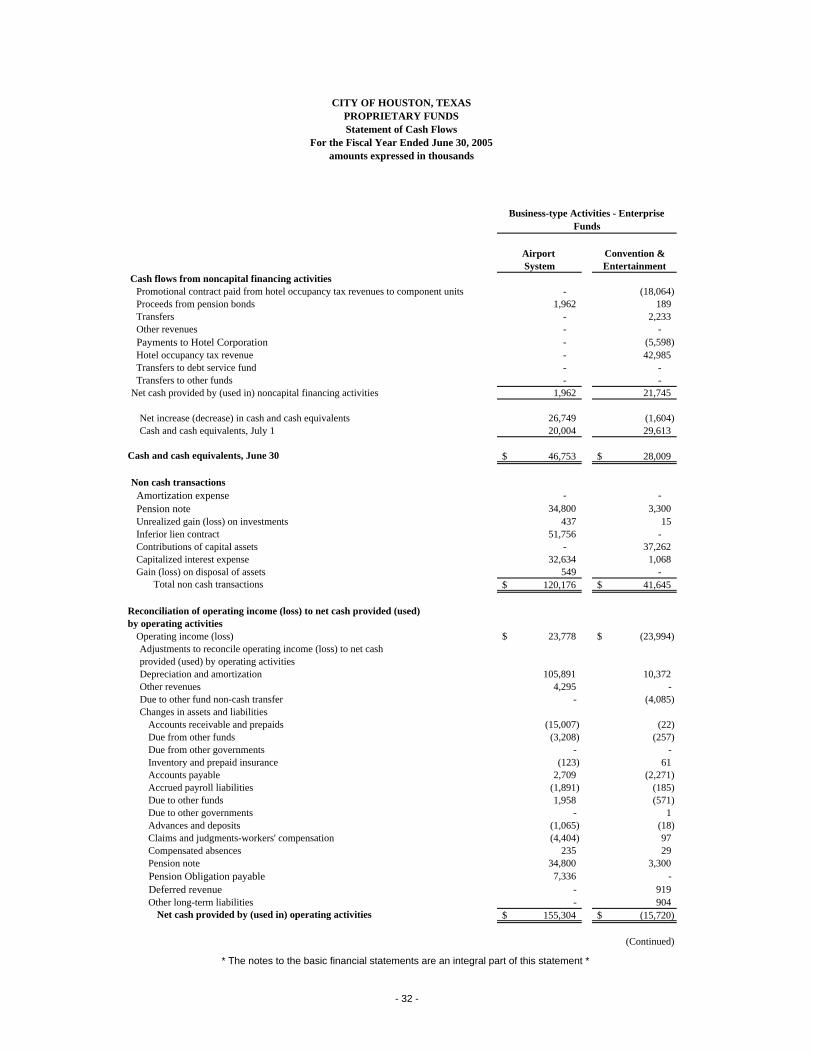
Airport Convention &System Entertainment
Business-type Activities - Enterprise Funds
amounts expressed in thousands
CITY OF HOUSTON, TEXASPROPRIETARY FUNDSStatement of Cash Flows
For the Fiscal Year Ended June 30, 2005
Cash flows from noncapital financing activitiesPromotional contract paid from hotel occupancy tax revenues to component units - (18,064) Proceeds from pension bonds 1,962 189 Transfers - 2,233 Other revenues - - Payments to Hotel Corporation - (5,598) Hotel occupancy tax revenue - 42,985 Transfers to debt service fund - - Transfers to other funds - -
Net cash provided by (used in) noncapital financing activities 1,962 21,745
Net increase (decrease) in cash and cash equivalents 26,749 (1,604) Cash and cash equivalents, July 1 20,004 29,613
Cash and cash equivalents, June 30 46,753$ 28,009$
Non cash transactionsAmortization expense - - Pension note 34,800 3,300 Unrealized gain (loss) on investments 437 15 Inferior lien contract 51,756 - Contributions of capital assets - 37,262 Capitalized interest expense 32,634 1,068 Gain (loss) on disposal of assets 549 -
Total non cash transactions 120,176$ 41,645$
Reconciliation of operating income (loss) to net cash provided (used)by operating activities
Operating income (loss) 23,778$ (23,994)$ Adjustments to reconcile operating income (loss) to net cashprovided (used) by operating activitiesDepreciation and amortization 105,891 10,372 Other revenues 4,295 - Due to other fund non-cash transfer - (4,085) Changes in assets and liabilities
Accounts receivable and prepaids (15,007) (22) Due from other funds (3,208) (257) Due from other governments - - Inventory and prepaid insurance (123) 61 Accounts payable 2,709 (2,271) Accrued payroll liabilities (1,891) (185) Due to other funds 1,958 (571) Due to other governments - 1 Advances and deposits (1,065) (18) Claims and judgments-workers' compensation (4,404) 97 Compensated absences 235 29 Pension note 34,800 3,300 Pension Obligation payable 7,336 - Deferred revenue - 919 Other long-term liabilities - 904
Net cash provided by (used in) operating activities 155,304$ (15,720)$
(Continued)
* The notes to the basic financial statements are an integral part of this statement *
- 32 -
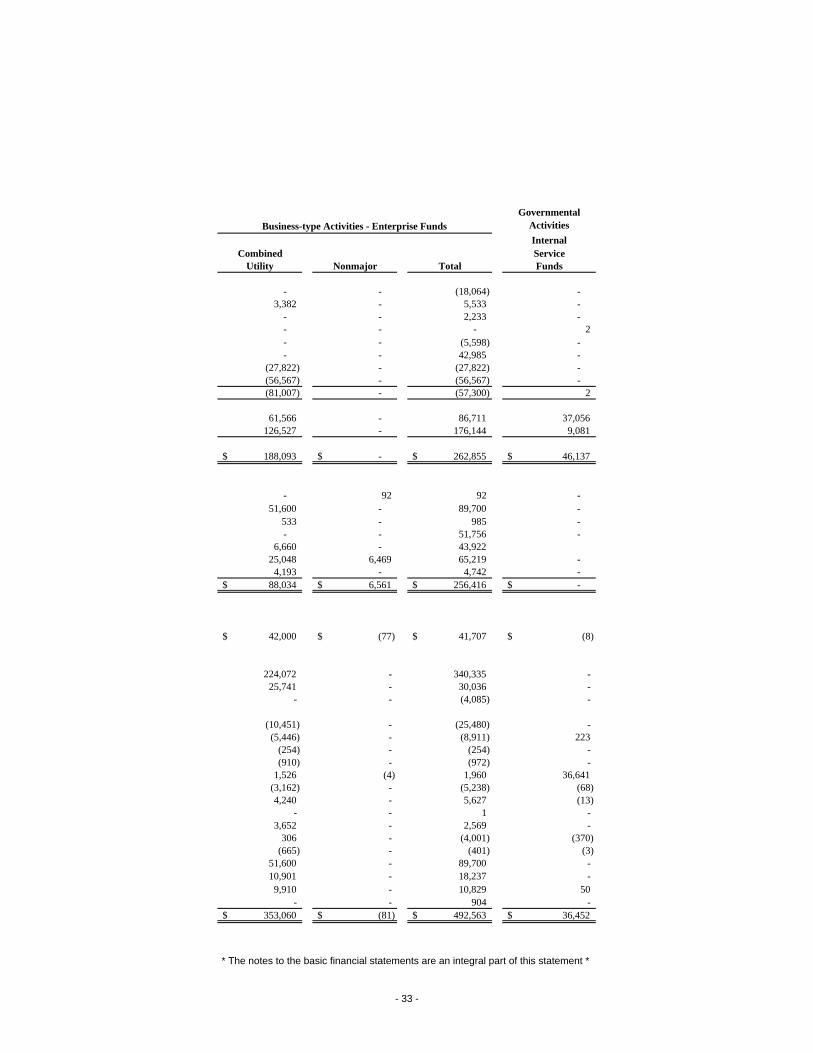
Governmental ActivitiesInternal
Combined ServiceUtility Nonmajor Total Funds
Business-type Activities - Enterprise Funds
- - (18,064) - 3,382 - 5,533 -
- - 2,233 - - - - 2 - - (5,598) - - - 42,985 -
(27,822) - (27,822) - (56,567) - (56,567) - (81,007) - (57,300) 2
61,566 - 86,711 37,056 126,527 - 176,144 9,081
188,093$ -$ 262,855$ 46,137$
- 92 92 - 51,600 - 89,700 -
533 - 985 - - - 51,756 -
6,660 - 43,922 25,048 6,469 65,219 -
4,193 - 4,742 - 88,034$ 6,561$ 256,416$ -$
42,000$ (77)$ 41,707$ (8)$
224,072 - 340,335 - 25,741 - 30,036 -
- - (4,085) -
(10,451) - (25,480) - (5,446) - (8,911) 223
(254) - (254) - (910) - (972) -
1,526 (4) 1,960 36,641 (3,162) - (5,238) (68) 4,240 - 5,627 (13)
- - 1 - 3,652 - 2,569 -
306 - (4,001) (370) (665) - (401) (3)
51,600 - 89,700 - 10,901 - 18,237 -
9,910 - 10,829 50 - - 904 -
353,060$ (81)$ 492,563$ 36,452$
* The notes to the basic financial statements are an integral part of this statement *
- 33 -
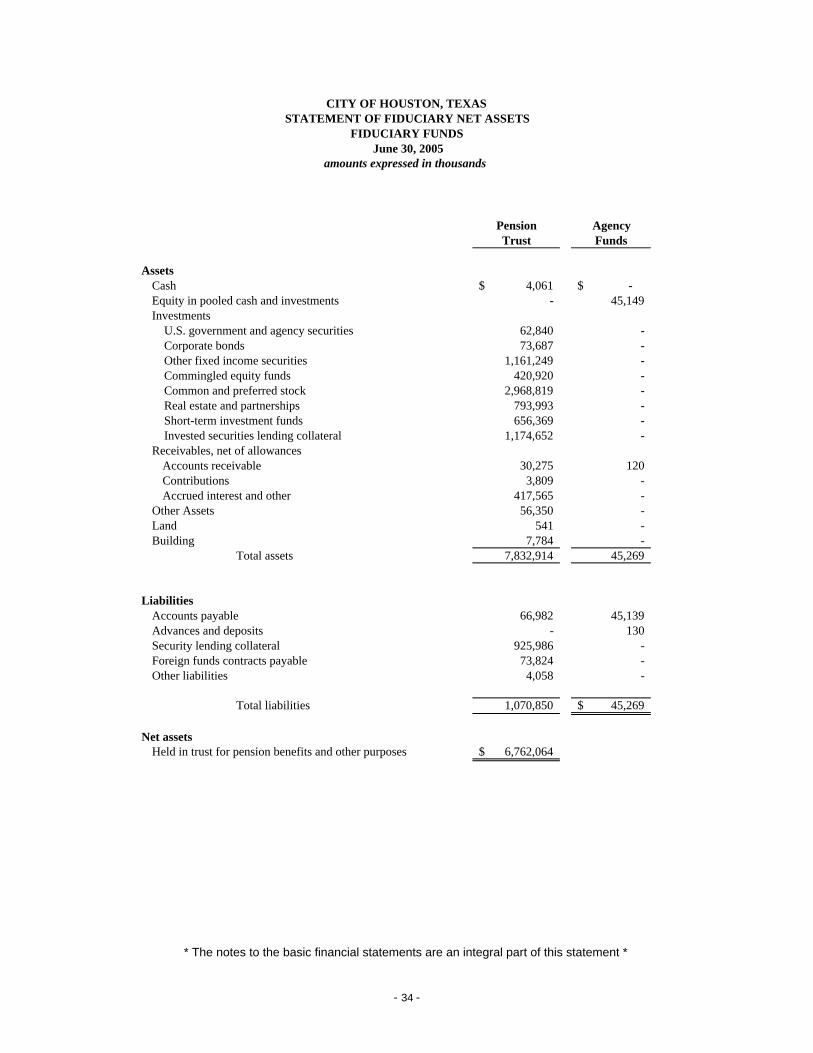
Pension AgencyTrust Funds
AssetsCash 4,061$ -$ Equity in pooled cash and investments - 45,149 Investments U.S. government and agency securities 62,840 - Corporate bonds 73,687 - Other fixed income securities 1,161,249 - Commingled equity funds 420,920 - Common and preferred stock 2,968,819 - Real estate and partnerships 793,993 - Short-term investment funds 656,369 - Invested securities lending collateral 1,174,652 - Receivables, net of allowances
Accounts receivable 30,275 120 Contributions 3,809 - Accrued interest and other 417,565 -
Other Assets 56,350 - Land 541 - Building 7,784 -
Total assets 7,832,914 45,269
LiabilitiesAccounts payable 66,982 45,139 Advances and deposits - 130 Security lending collateral 925,986 - Foreign funds contracts payable 73,824 - Other liabilities 4,058 -
Total liabilities 1,070,850 45,269$
Net assetsHeld in trust for pension benefits and other purposes 6,762,064$
FIDUCIARY FUNDS
amounts expressed in thousands
CITY OF HOUSTON, TEXASSTATEMENT OF FIDUCIARY NET ASSETS
June 30, 2005
* The notes to the basic financial statements are an integral part of this statement *
- 34 -
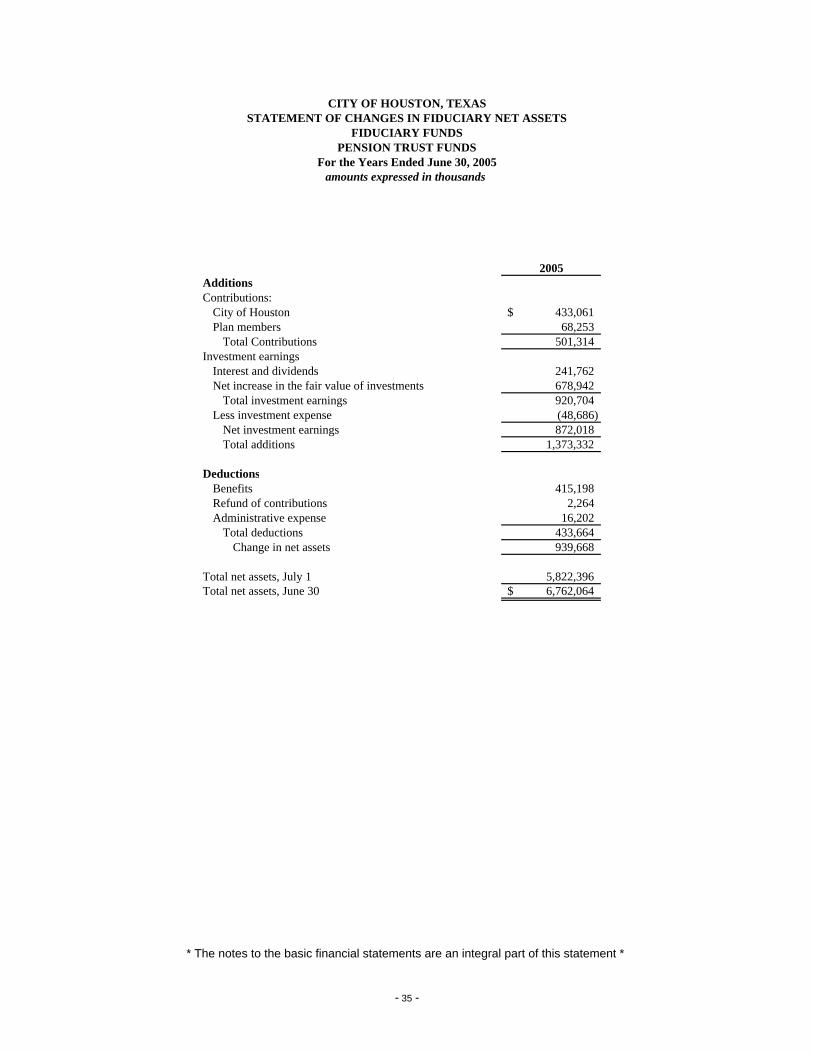
2005AdditionsContributions:
City of Houston 433,061$ Plan members 68,253
Total Contributions 501,314 Investment earnings
Interest and dividends 241,762 Net increase in the fair value of investments 678,942
Total investment earnings 920,704 Less investment expense (48,686)
Net investment earnings 872,018 Total additions 1,373,332
DeductionsBenefits 415,198 Refund of contributions 2,264 Administrative expense 16,202
Total deductions 433,664 Change in net assets 939,668
Total net assets, July 1 5,822,396 Total net assets, June 30 6,762,064$
amounts expressed in thousands
CITY OF HOUSTON, TEXASSTATEMENT OF CHANGES IN FIDUCIARY NET ASSETS
FIDUCIARY FUNDS
For the Years Ended June 30, 2005PENSION TRUST FUNDS
* The notes to the basic financial statements are an integral part of this statement *
- 35 -

CITY OF HOUSTON, TEXAS
- 36 -
Related Documents