RESERVE FEDERAL statistical release m ( « A L R E S * . G.7.2. nvvo» P G.7.2. MONTHLY DEPARTMENT STORE SALES NOTICE OF REVISED FORMAT Responsibility for preparation of national figures on monthly department store sales has been transferred to the Bureau of the Census. The Bureau will immediately begin to include such figures in its Advance Monthly Retail Sales release and will continue to show them in its more comprehensive report on Monthly Retail Trade• Interested persons should write to the Publications Section, Bureau of the Census, Washington, D. C# for further information. Monthly department store sales figures may also be found in the Survey of Current Business, a publication of the Office of Business Economics of the United States Department of Commerce. Although the Board of Governors will discontinue publication of national figures on monthly department store sales, it is planned to continue for the time being that part of the G.?.2. report devoted to the individual city and metropolitan area sales data compiled by the 12 Federal Reserve Banks. Next month's report will be on this new basis. " ot c i) V c HfV0$ v'" v -•, •y 0: " ' JL!:s " A s : Y ' RESERVE-^' Digitized for FRASER http://fraser.stlouisfed.org/ Federal Reserve Bank of St. Louis

Welcome message from author
This document is posted to help you gain knowledge. Please leave a comment to let me know what you think about it! Share it to your friends and learn new things together.
Transcript

R E S E R V E F E D E R A L s t a t i s t i c a l r e l e a s e
m
( « A L R E S * .
G.7.2.
nvvo» P G.7.2.
MONTHLY DEPARTMENT STORE SALES
NOTICE OF REVISED FORMAT
Responsibility for preparation of national figures on monthly
department store sales has been transferred to the Bureau of the Census.
The Bureau will immediately begin to include such figures in its Advance
Monthly Retail Sales release and will continue to show them in its more
comprehensive report on Monthly Retail Trade• Interested persons should
write to the Publications Section, Bureau of the Census, Washington, D. C#
for further information. Monthly department store sales figures may also
be found in the Survey of Current Business, a publication of the Office of
Business Economics of the United States Department of Commerce.
Although the Board of Governors will discontinue publication
of national figures on monthly department store sales, it is planned to
continue for the time being that part of the G.?.2. report devoted to
the individual city and metropolitan area sales data compiled by the 12
Federal Reserve Banks. Next month's report will be on this new basis.
" ot c i) V c HfV0$ v'"v-•, • y 0 : "
' J L ! : s " A s : Y '
RESERVE-^'
Digitized for FRASER http://fraser.stlouisfed.org/ Federal Reserve Bank of St. Louis
F E D E R A L R E S E R V E s t a t i s t i c a l r e l e a s e
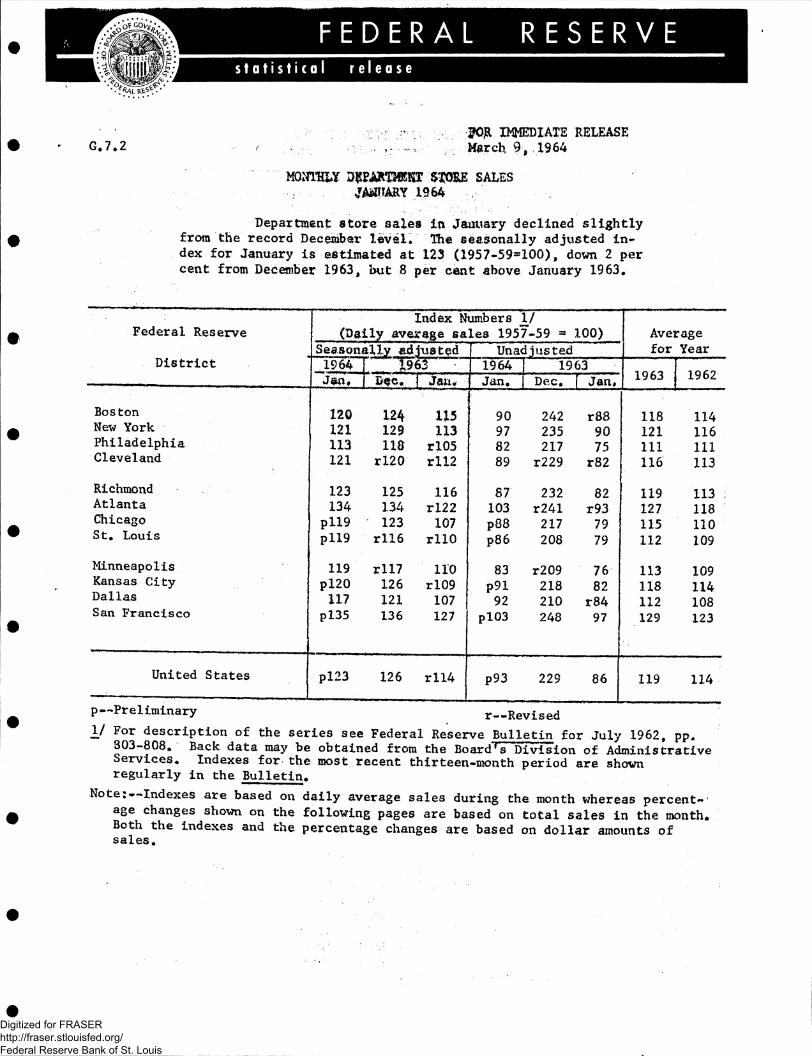
G.7.2 9 # IMMEDIATE RELEASE March 9,,1964
M O M I W DgFARTIOT STORE SALES JAtiHARY 1964
Department store sales in January declined slightly from the record December level. The seasonally adjusted in-dex for January is estimated at 123 (1957-59=100), down 2 per cent from December 1963, but 8 per cent above January 1963.
Index Numbers V Federal Reserve (Daily av< irage sales 1957-59 = 100) Average
Seasonally adjusted Unadjusted for Year District 1964 1963 1964 1963
1963 1962 J$o, D<?c. | Jan. Jan. Dec, Jan 1963 1962
Boston 120 124 115 90 242 r88 118 114 New York 121 129 113 97 235 90 121 116 Philadelphia 113 118 rl05 82 217 75 111 111 Cleveland 121 rl20 rll2 89 r229 r82 116 113
Richmond 123 125 116 87 232 82 119 113 i Atlanta 134 134 rl22 103 r241 r93 127 118 Chicago pll9 123 107 p88 217 79 115 110 St. Louis pll9 rll6 rllO p86 208 79 112 109
Minneapolis 119 rll7 110 83 r209 76 113 109 Kansas City pl20 126 rl09 p91 218 82 118 114 Dallas 117 121 107 92 210 r84 112 108 San Francisco pl35 136 127 P103 248 97 129 123
United States pl23 126 rll4 P93 229 86 119 114
p-~ preliminary r—Revised
JL/ For description of the series see Federal Reserve Bulletin for July 1962, pp. 303-808. Back data may be obtained from the Board's Division of Administrative Services, Indexes for the most recent thirteen-month period are shown regularly in the Bulletin.
Note:--Indexes are based on daily average sales during the month whereas percent-' age changes shown on the following pages are based on total sales in the month. Both the indexes and the percentage changes are based on dollar amounts of sales.
Digitized for FRASER http://fraser.stlouisfed.org/ Federal Reserve Bank of St. Louis

- 2
COMPARISON WITH PREVIOUS YEAR Percentage Change From Corresponding Period A Year Ago
Federal Reserve District, Area and City
i
t Jan. ] 1964
iDec.jYear 1963;1963
i
Federal Reserve District, Area and City
i Jan. 1964
|Dec, ! 1963
Yeat 1962
UNITED STATES E±_8 + 8 + 4 CLEVELAND DISTRICT + 8 +10 + 3 E±_8 Metropolitan Areas
BOSTON DISTRICT + 3 + 8 ± J l Lexington Ky. +15 +12 + 6 Metropolitan Areas V Akron* Ohio + 9 +10 + 5
Portland Maine 0 + 6 - 2 Canton* it + 5 +10 + 4 Boston Mass . 0 + 6 + 3 Cincinnati* II + 8 + 8 + 3 Downtown Boston* ,f 0 + 5 + 1 i Cleveland* n + 8 +16 + 5 Suburban Boston H + 1 + 6 + 6 I ; Downtown Cleve II - 2 + 2 - 4 Cambridge it + 1 + 5 + 4 i j Columbus* ii +10 + 8 + 4 Quincy ii - 8 + 3 o i i Springfield* ii +11 +16 + 8
Lowe 11 II - 3 +10 - 4 : Toledo ii +11 + 8 + 3 Worcester ii + 4 + 6 o i Youngstown ii + 9 + 9 + 1
Erie* Pa. +10 +13 + 2 NEW YORK DISTRICT ±_I ±_8 ± _ 4 i Pittsburgh ii + 6 + 9 + 3 Metropolitan Areas i/ Downtown Pit. ii + 1 + 5 - 1
Binghamton N.Y. - 8 + 2 - 2 ; Wheeling* W.Va. + 5 + 9 + 2 Buffalo II + 7 + 8 + 8 ' Buffalo* II + 1 + 6 - 1 City Niagara Falls II +12 + 2 - 2 Portsmouth* Ohio +15 + 2 - 3
New York-N.E. New Jersey-h 7 +10 + 4 New York City* N.Y. + 6 + 8 0 RICHMOND DISTRICT + 7 ±10 + 5
Newark N.J. + 7 +10 + 5 Metropolitan Areas 1/ Newark (City) ii + 3 + 7 + 3 Washington* D.C. + 6 +14 +10
Paterson, Clifton, Downtown Wash. 11 - 2 + 4 + 1 Passaic N.J. + 4 + 7 + 4 Baltimore* Md. +17 +18 + 8
Rochester* N.Y. + 7 + 8 + 6 . Downtown Bait. ii +10 +13 + 2 Rochester (City) 11 + 4 + 7 + 3 Asheville* N.C. + 2 + 7 + 4
Syracuse* II + 4 + 4 + 1 Raleigh* 11 - 5 - 3 - 6 Utica-Rome II +29 +24 +15 Winston-Salem* II 0 + 3 - 1 Utica II +13 +12 +10 Charleston* S.C. +16 +11 + 7
Columbia* II + 4 + 5 + 7 City Greenville* II + 3 + 1 - 3
Bridgeport* Conn. - 2 r + 6 + 1 Lynchburg* Va. 0 + 7 + 2 Norfolk-Portsmouth* " + 8 + 6 + 2
PHILADELPHIA DISTRICT ±_8 ±_L 0 Richmond II + 5 +10 + 1 Metropolitan Areas Roanoke* II 0 + 6 + 2 Wilmington Del. + 8 +22 + 7 Charleston* W.Va. + 8 +10 + 7 Trenton N.J. +11 + 8 + 4 Lancaster* Pa. + 7 +11 + 3 Cities Philadelphia* II +11 + 5 - 1 Cumbe r1and-Hage rstown, Central Phila. II +14 - 5 -11 Md. +13 +16 + 3
Reading II + 8 +12 + 4 Spartanburg S.C. +12 +10 + 7 Scranton II - 2 + 7 + 2 Newport News Va. + 5 + 5 + 3 Wilkes-Barre-- Fairmont-
Hazleton* II - 1 + 8 + 5 Morgantown W.Va. +11 +13 + 6 Huntington* ii + 5 + 8 + 5
City Parkersburg ii +12 +16 + 7 York* Pa. + 4 +10 + 2
Digitized for FRASER http://fraser.stlouisfed.org/ Federal Reserve Bank of St. Louis

COMPARISON WITH PREVIOUS JE-iR Percentage Change From Corresponding Period A Year Ago
Federal Reserve District. Jan. Dec. Year Federal Reserve District, Jan. Dec. Year
Area, and City 1964 1963 1963 Area, and City 1964 1963|1963
ATLANTA DISTRICT +10 +10 + 8 CHICAGO DISTRICT (Cont.) Metropolitan Areas 1/ Metropolitan Areas 1/ (Cont.)
+ 8 Birmingham Ala. + 3 - 5 — 6 Green Bay Vis. +16 +10 + 8
Mobile n + 2 - 1 + 1 Madison II +14 + 3 0 Montgomery if +33 +28 +13 Milwaukee* II + 4 + 4 + 2 Daytona Beach Fla. + 4 + 7 +13 Jacksonville* it +14 +20 +14 Cities Miami it +13 +12 +10 Banvilie 111. 0 + 5 + 2 Downtown Miami ii + 9 + 5 t Woria* II + 9 + 6 + 2
Orlando ii +23 *36 flwry Ind. +17 +16 + 8
St* Ptrsbg.-Tampa n + 8 •4* $ i Bettie Creek Mich . +10 +11 + 9 Atlanta* Ga. + 8 i Fontiac n +22 2/ 2/ Central Atlanta ft + 2 • k !#• 2 Port Huron ii + 9 + 8 + 1
Augusta ii + 4 * 4 * k Sheboygan Wis. +11 + 9 + 4
Macon* ii + 4 * 1. * 4 -Savannah ii + 5 + 9 + 8 ST. LCUIS DISTRICT p+ 8 + 5 + 3 Baton Rouge* La* + 7 +21 +16 Metropolitan Areas
+ 8 New Orleans* ii +11 + 9 + 8 Fort Smith Ark. 0 + 3 + 8
Jackson* Miss. +10 + 2 + 3 Little Rock* ii +13 + 5 + 5 Chattanooga* Tenn. + 9 + 6 + 4 Louisville* Ky. +17 + 8 + 4
Knoxville * 1! + 7 + 2 + 2 Louisville (dtj) 11 +18 +10 + 3 Bristo1-Kingsport- Springfield Ho. + 9 +10 + 5 Johnson City Tenn.-Va. + 3 - 2 - 1 St. Louis n + 5 + 3 4" 1
Bristol ii + 1 - 2 - 1 St. Louis (City) " + l 0 - 2 l.emphis * Tenn. +11 + 4 + 3
City Rome Ga. + 7 + 5 + 5 Cities
Quincy 111. +17 0 - 5 CHICAGO DISTRICT P+12 + 8 + 3 paducah Ky. + 8 + 6 + 9 Metropolitan Areas 1/
+ 8 +_8 Chicago* 111. +13 + 8 + 5 MINNEAPOLIS DISTRICT +_8 +_2 ±Jt State Street it + 5 + 3 - 1 Metropolitan Areas
+_2 ±Jt Joliet* IT +20 + 7 0 Mpls.-St. Paul* Minn . + 8 + 9 + 5
Decatur* II +13 +10 + 6 Minneapolis* If + 7 + 7 + 5 Rockford II + 9 + 5 + 1 St. Paul* II +12 +15 + 5 Springfield 11 + 7 + 7 + 3 Sioux Falls S.D. +11 - 8 - 2 Port Wayne * Ind. + 8 + 8 + 4 Indianapolis* ii + 4 + 4 + 3 Cities Muncie tl + 7 + 9 + o Duluth-Superior*Minn4&3, . + 6 + 8 0 South Bend* 11 + 6 + 3 •f 1 Hankato Minn. +23 + 3 - 2 Terre Haute* H + 1 + 1 + 3 Rochester if + 1 - 2 - 3 Cedar Rapids Iowa + 9 + 7 + 4 Willmar ii + 6 + 7 + 1 Des Moines M + 9 + 3 + 5 Billings Mont, . +20 + 3 + 5 Dubuque 11 - 1 - 1 - 1 Great Falls 11 - 4 - 9 - 2 Sioux City 1! + 4 - 4 - 4 Fargo N.D. + 4 + 5 + 5 Waterloo If +16 + 8 + 5! 1 Grand Forks ii - 1 - 2 - 6 Detroit Mich. +16 +10 + 61 Mi not it 0 - 2 + 7 Downtown Detroit ii +11 + 4 0| Aberdeen S.D. + 9 - 8 - 2
Flint* ii +11 +13 + 9j LaCrosse 'lis. - 5 — 2 - 2 Grand Rapids* n +16 +10 + 3; Jackson t» +13 + 9 + 2j 1 Kalamazoo n +13 +13 + 8| 1 Lansir. * ii +14 +11 + 5! I Muskc.»oYi ii +l4 +12 + 2 j Digitized for FRASER
http://fraser.stlouisfed.org/ Federal Reserve Bank of St. Louis

Percentage Change From Corresponding Period A Year Ago
Federal Reserve District, Area, and City
Jan. 1964
Dec. 1963
Year 1963
Federal Reserve District, Area, and City
" I Jan.(Dec.i Year 1964j196311963
1 I
KANSAS CITY DISTRICT p+11 ±1 + 4 SAN FRANCISCO DISTRICT (Cont.) Metropolitan Areas Denver Col. +17 +10 + 6 San Jose* Topeka Kans. + 7 + 6 - 2 Stockton* Wichita if + 8 + 3 + 1 Eugene Kansas City Mo.-Kans. +12 + 7 + 5 Portland* Downtown K.C. Mo. + 2 - 2 - •5 Salt Lake
St. Joseph 1! - 3 - 1 — 3 Seattle* Lincoln Webr. + 8 + 8 + 3 Seattle Omaha If + 7 + 8 + 3 Spokane* Albuquerque N. Hex. +12 + 9 + 8 Tacoma* Oklahoma City Okla. + 7 + 2 + 3 Tulsa u + 5 + 5 + 3 Cities Tulsa 3 Cities
Cities Greeley Colo. +29 +44 +20 Hutchinson Kans. + 2 ~ 7 -10 Joplin Ho. +12 + 1 + 2 Enid Okla. +11 +12 + 3jj
1/ (Cont.) Calif. p+ 9 +10 + 6
1! +11 + 7 + 5 Ore. + 8 0 0
1! p+ 8 + 4 + 3 Utah p+ 2 + 5 + 3 Wash. P- 4 - 3 - 7
ti p- 4 ; 3 - 7 ?! P- 3 + 1 + 1 11 - 2 + 1 - 1
DALLAS DISTRICT +_9 ±9 Metropolitan Areas Shreveport La. 0 + 4 Corpus Christi Tex. - 2 - 2 Dallas " +10 + 8 El Paso M + 5 + 5 Houston n +13 +l4 San Antonio - M + 5 + 6 Waco H +11 + 7
Boise and Nampa Idaho p+ 3 + 5 - 7 Idaho Falls ii +10 + 1 + 2
Twin Falls it + 2 + 8 + 5 Salem Ore. p+ 4 + 3 + 4
Bellingham Wash. - 6 + 4 + 3 Walla Walla* it + 9 + 5 + 5 Yakima* if p+ 2 + 4 - 1
SAN FRANCISCO DISTRICT p+ Metropolitan Areas 1/ Tucson Ariz. + 7 + Bakersfield* Calif, 0 Fresno* n pf 8 + Los Angeles-Long Beach* p+ 7 + Downtown L.A.* ° + 1 Weatside L.A.* " + 5 + San Fernando Valley n p+ 3 +
Long Beach* I! p- 3 + Pasadena " p + 5 + Riverside, San Bernardino, Ontario u p+13
Sacramento* tf p+15 San Diego* ,f p+ 8 + San Fran.-Oakland M p+ 1 + Alameda & Contra. Costa Cos. u p- 1 +
Oakland-Berkeley* n p- 8 + Edwntown Oakland* n -15
San Francisco* u p- 4 +
+' 7 + 5
+13 +16 + 5 + 8
+ 1 + 2 + 5 + 7 - 2 + 2 +10 + 5 + 4
+10 + 8 + 4 + 6
7 2 3 5
7 1 4 0
r——Revised under various metropolitan areas do not necessarily include all
p—Preliminary 1/ Breakdowns.shown — portions of such areas 2/ Data not avanaoie, *--Indexes showing longer-time comparisons are also available for these areas and
cities and may be obtained upon request from the Federal Reserve Bank in the district in which the area or city is located.
Digitized for FRASER http://fraser.stlouisfed.org/ Federal Reserve Bank of St. Louis
Related Documents


