G5 Performance Report It’s all about the bottleneck: determining the performance bottleneck of an Apple Power Mac G5, when high performance networking is requested Version 1.0 Niels Visser & Daniël Hilster University of Amsterdam, Amsterdam, The Netherlands February 1, 2004

Welcome message from author
This document is posted to help you gain knowledge. Please leave a comment to let me know what you think about it! Share it to your friends and learn new things together.
Transcript
G5 Performance Report
It’s all about the bottleneck: determining the performance bottleneck of an Apple Power Mac G5, when high performance
networking is requested
Version 1.0
Niels Visser & Daniël Hilster
University of Amsterdam, Amsterdam, The Netherlands
February 1, 2004
G5 Performance Report – Version 1.0 – By Niels Visser & Daniël Hilster – February 1, 2004 2
Index
ABSTRACT.........................................................................................................................3
1. INTRODUCTION.........................................................................................................3
2. G5 ARCHITECTURE ....................................................................................................4
2.1 A CLOSER LOOK ........................................................................................................4 2.1.1 PCI-X...............................................................................................................4 2.1.2 HyperTransport .................................................................................................4 2.1.3 System controller ..............................................................................................5 2.1.4 Frontside bus....................................................................................................5 2.1.5 Memory ...........................................................................................................6
3. SETUP........................................................................................................................6
3.1 OPERATING SYSTEMS..................................................................................................6 3.2 32BIT VS. 64 BIT......................................................................................................6 3.3 SYSTEM SETUP .........................................................................................................6 3.4 INTEL PRO/10GBE ...................................................................................................6 3.5 CONFIGURING LINUX ..................................................................................................6 3.6 CONFIGURING MAC OS X ............................................................................................7
4. BENCHMARKING........................................................................................................7
4.1 SYSTEM BENCHMARKS: MAC OS X ..................................................................................7 4.2 SYSTEM BENCHMARK: LINUX .........................................................................................7
4.2.1 Memperf ..........................................................................................................7 4.2.2 CacheBench......................................................................................................9
4.3 SYSTEM BENCHMARKS: MAC OS X & LINUX.......................................................................9 4.4 NETWORK BENCHMARKS............................................................................................. 10
4.4.1 Linux network benchmarks ............................................................................... 10 4.4.2 Mac OS X network benchmarks ......................................................................... 12
5. FUTURE WORK.........................................................................................................12
6. CONCLUSION...........................................................................................................12
7. REFERENCES............................................................................................................14
8. APPENDIX 1: XBENCH RESULTS...............................................................................16
G5 Performance Report – Version 1.0 – By Niels Visser & Daniël Hilster – February 1, 2004 3
Abstract Apple recently introduced the G5, a 64 bit personal computer running at speeds up to 2.0 GHz. The G5, having high bus and memory speeds, seems perfectly fit to be used in a high speed networking environment. In order to determine if the G5 incorporates a bottleneck when performance is concerned, a number of tests were conducted on both Linux and Mac OS X 10.3. The tests focussed on several aspects of the G5 architecture like memory, network and processor speeds. It seems both theoretically and practically the G5 does not have a bottleneck when performance is concerned, except for the bandwidth limit of the PCI-X bus which must be used to install a high performance network card, the Intel PRO/10GbE. The PCI-X bus limitations, reduces the bandwidth of the network card to 8.5 Gigabit/s. However, this theoretical maximum speed of 8.5 Gigabit/s was never reached by the NIC during tests, topping at 3.5 Gigabit/s. From our experience we think software is the main performance limiting factor. When this is fixed Apple’s G5 should be a suitable candidate for high speed networking environments.
1. Introduction Currently the Advanced Internet Research group at the University of Amsterdam is researching high speed long distance data transfers over Ethernet using TCP/IP and other transport mechanisms. This is done using the NetherLight1 infrastructure, which is partly based upon 10 Gigabit/s Ethernet. Earlier research2 showed the maximum throughput from memory-to-memory using single stream TCP was about 5.22 Gigabit/s. This result was obtained using Intel Itanium2 and Xeon based systems all equipped with an Intel Pro/10GbE network interface card (NIC) connected through a PCI-X slot. Recently Apple introduced a new generation of their Power Mac systems based upon an exclusively for Apple designed version of the IBM PowerPC 970 processor, called the G53. The G5 is a 64 bit processor currently running up to a maximum clock speed of 2.0 GHz. Unique feature of the G5 design is the Frontside Bus (FSB) which runs at half the clock speed. In addition to two G5 processors, the new Power Mac G5’s are all equipped with one 133 MHz and two 100MHz 64 bit PCI-X slots. Theoretically this architecture allows for high data transfer and processing speeds compared to other equally priced systems. Therefore the Advanced Internet Research group is curious if the Power Mac G5 can life up to its specifications and is able to produce similar or even better results than the Intel Itanium2 systems mentioned earlier. This curiosity provided an opportunity for two students System & Network Administration to research the performance of the G5, thereby focussing on both theoretical and practical performance bottleneck these systems possibly have when used for high speed networking. The results of this research are described in this document.
G5 Performance Report – Version 1.0 – By Niels Visser & Daniël Hilster – February 1, 2004 4
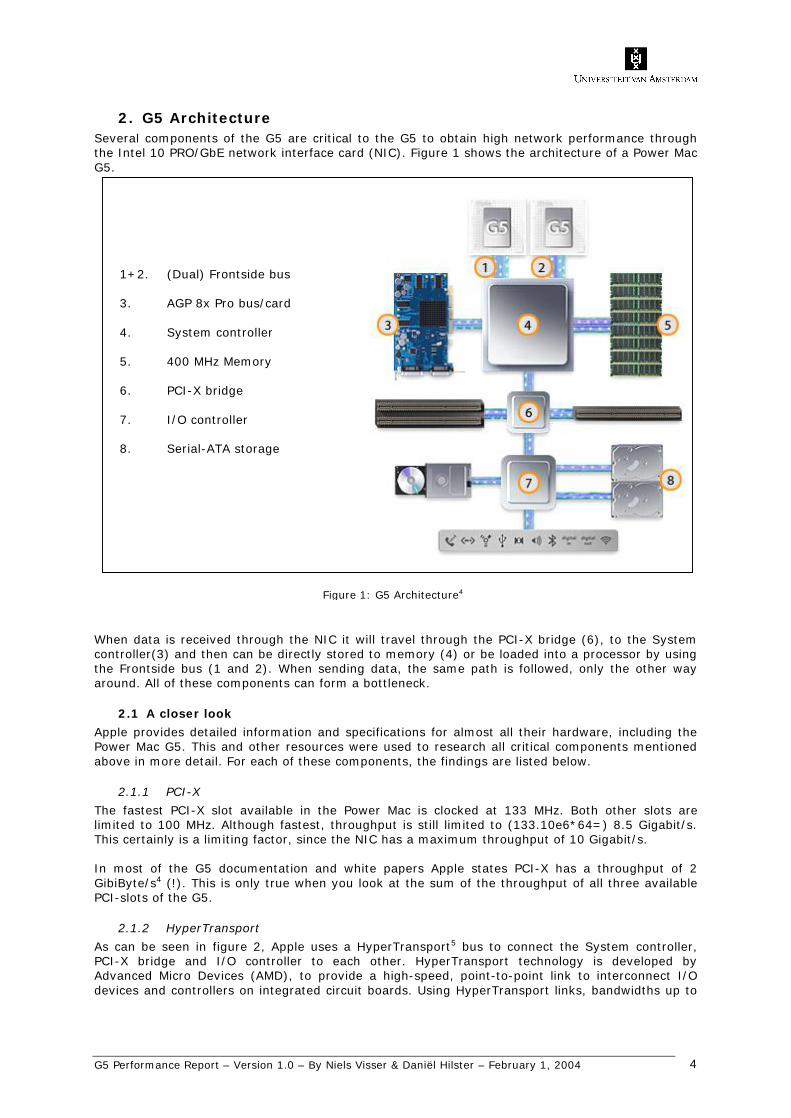
2. G5 Architecture Several components of the G5 are critical to the G5 to obtain high network performance through the Intel 10 PRO/GbE network interface card (NIC). Figure 1 shows the architecture of a Power Mac G5.
When data is received through the NIC it will travel through the PCI-X bridge (6), to the System controller(3) and then can be directly stored to memory (4) or be loaded into a processor by using the Frontside bus (1 and 2). When sending data, the same path is followed, only the other way around. All of these components can form a bottleneck.
2.1 A closer look
Apple provides detailed information and specifications for almost all their hardware, including the Power Mac G5. This and other resources were used to research all critical components mentioned above in more detail. For each of these components, the findings are listed below.
2.1.1 PCI-X
The fastest PCI-X slot available in the Power Mac is clocked at 133 MHz. Both other slots are limited to 100 MHz. Although fastest, throughput is still limited to (133.10e6*64=) 8.5 Gigabit/s. This certainly is a limiting factor, since the NIC has a maximum throughput of 10 Gigabit/s. In most of the G5 documentation and white papers Apple states PCI-X has a throughput of 2 GibiByte/s4 (!). This is only true when you look at the sum of the throughput of all three available PCI-slots of the G5.
2.1.2 HyperTransport
As can be seen in figure 2, Apple uses a HyperTransport5 bus to connect the System controller, PCI-X bridge and I/O controller to each other. HyperTransport technology is developed by Advanced Micro Devices (AMD), to provide a high-speed, point-to-point link to interconnect I/O devices and controllers on integrated circuit boards. Using HyperTransport links, bandwidths up to
1+2. (Dual) Frontside bus
3. AGP 8x Pro bus/card
4. System controller
5. 400 MHz Memory
6. PCI-X bridge
7. I/O controller
8. Serial-ATA storage
Figure 1: G5 Architecture4

G5 Performance Report – Version 1.0 – By Niels Visser & Daniël Hilster – February 1, 2004 5
12.8 GibiByte/s are possible. HyperTransport is intended to be used in cases where high bandwidth and low latency are necessary, such as networking.
2.1.3 System controller
A HyperTransport bus can be used in several different configurations. The G5 is equipped with two of them. One is used to connect the System controller, U3 in figure 2, to the PCI-X bridge. This bus consists of two 16 bits wide point-to-point unidirectional paths and uses an 800 MHz clock. Since this bus is ‘double pumped’, meaning both rising and falling edge of the clock are used (double date rate), bandwidth in each direction is (2*16*800.10e6=) 25.6 Gigabit/s (3,2 GigaByte/s). The other bus is used to connect the I/O controller to the PCI-X bridge. So when looking purely to data throughput, the HyperTransport bus between System Controller and PCI-X bridge is not a bottleneck. However, data from and to the PCI-X bridge must be encapsulated into a communication protocol used by HyperTransport. At the end of the bus that same data will have to be rebuild. This process of encapsulating and rebuilding data will most certainly have some influence on the data delay to and from the PCI-X slots.
2.1.4 Frontside bus
The Frontside bus (FSB) of the Power Mac G5 is something special. First of all the G5 offers two Frontside busses, one for each processor. Secondly, the FBS’s works at half the processor’s clock speed. So in our case, with a Dual 2.0 GHz G5 system, the FSB’s run at 1.0 GHz. Both FSB’s consist of two unidirectional 32 bit data paths: one travelling into the processor and the other one travelling out of the processor. These two paths can be used simultaneously, which implies that each FSB provides a total bandwidth of (2*32/8*1.10e9=) 8 GigaByte/s. Therefore
Figure 2: Detailed architecture overview6
G5 Performance Report – Version 1.0 – By Niels Visser & Daniël Hilster – February 1, 2004 6
there a data flow of 8 GigaByte/s to and from the processors is possible. Compared to the maximum data flow coming from the NIC, 8.5 Gigabit/s, the FSB is most certainly not a bottleneck.
2.1.5 Memory
The G5 uses 400 MHz 128 bits DDR memory which, for high performance desktop systems, is rather regular nowadays. Double Data Rate (DDR) technology implies both rising and falling edges of the clock are used to read or write data. By using a 128 bit interface, it is possible to access two banks of DDR-RAM at a time resulting in a total throughput of (2*128/8*400.10e6=) 6.4 GigaByte/s.
3. Setup
3.1 Operating Systems
While the goal of this project being to achieve the highest possible performance using an Apple G5, for comparison reasons it would be wise to test performance under more than one operating system. The Apple G5 came with Mac OS X 10.3 preinstalled so this was the default choice for the tests. In a previous research2, tests were conducted using the Linux operating system. Although not being as widely available for the Power PC platform (in comparison to the x86 platform) decided was to also use Linux in the performance tests. Linux distribution of choice is Gentoo Linux which offers a Power PC, G5 ready, (Gentoo PPC) flavour and is compiled fully from source allowing for better system optimalisation (GCC Flags: -03 –mcpu=powerpc –altivec) than a binary distribution.
3.2 32bit vs. 64 bit
Traditionally PC operating systems are 32 bit. However, with the G5 Apple has introduced 64 bit computing to the desktop and thus setting the need for a 64 bit operating system. To satisfy this need Apple launched Mac OS 10.3, also known as Panther, the new, 64 bit ready, version of their operating system. However 64 bit in Panther is not as fully supported as Apple claims7. The only 64 bit “feature” Panther supports is 64 bit addressing, making it possible to address huge amounts of memory (up to 17 billion GibiByte). The Gentoo PPC distribution currently only offers a 32 bit Linux kernel. A 64 bit kernel for PowerPC G5 is available from YellowDog Linux8. Together with a 64 bit compiler it becomes possible to use 64 bit applications running under Linux. 32 bit Linux as well as 64 bit Linux is used in order to determine performance differences.
3.3 System Setup
In total four Apple Power Mac G5 machines were used. Two of which were setup as a testing environment. The two other G5 machines were equipped with 10 Gigabit/s NICs and configured for network benchmarks. The 10 Gigabit/s NIC were connected to the G5 via the 64 bit 133 Mhz PCI-X slot. The two G5's to be used for network benchmarking are connected to each other using a back-to-back connection established using single mode fiber.
3.4 Intel PRO/10Gbe
The Intel PRO/10GbE NIC9 was used. This card supports theoretical speeds up to 10 Gigabit/s allowing for high speed data transfer using the Ethernet standard. Its support for jumbo frames (MTU size up until 16 KibiByte) enhances performance even further. Also it adds support for NAPI, a system for better network performance by combining polling for heavy loads with interrupts for light loads.
3.5 Configuring Linux
The systems were installed using the Gentoo Linux PPC G5 live cd10. Instead of using the Linux 2.6.0-test9 kernel supplied with the live cd, we opted for using a newer release, Linux 2.6.1-rc1-test1 because it had support for G5 power management to silence the fans. Linux was installed according to Gentoo Linux PPC installation instructions11. Hereby some problems were encountered and solved. An installation howto can be found on this project's website12. We also upgraded some of the existing tools and packages. Packages updated were: glibc-2.3.2-r3, binutils-2.14-r6 and gcc-3.2.3-r3.
G5 Performance Report – Version 1.0 – By Niels Visser & Daniël Hilster – February 1, 2004 7
To speedup the kernel we tried minimising it as much as possible by eliminating all unnecessary features and thus keeping functionality to a minimum. Support for the Intel PRO/10GbE NIC is available in the Linux 2.6 kernel by default (make menuconfig, and then Device drivers-> Networking support -> Ethernet 10000 Mbit). Support was enabled and compiled directly in the kernel (no module). We tried compiling the driver with NAPI enabled (again look in the menuconfig) which succeeded. However, the machines were not able to boot after that, hanging when bringing up the Ethernet interfaces. Before compiling a 64 bit Linux kernel could be tried, a compiler able to compile 64 bits binaries had to be created. Documentation on the Linux PPC 64 site13 was used in order to accomplish this. Unfortunately creating a 64 bit compiler was not successful, because of some compilation errors we were not able to resolve. These errors were caused by a mismatch between the 64 bit source patch and the gcc sources to be patched.
3.6 Configuring Mac OS X
A basic install of Mac OS X 10.3 was performed. When installation was finished the systems were brought up to date, using Apple software update. Additionally Apple Developer Tools July 2002 were installed. Mac OS X does not offer native support for the Intel PRO/10GbE NIC. Intel themselves also do not offer support for Mac OS X. A solution to this problem was found in a small Minnesota based company called Small Tree Communications14. This company offers a driver and support for the Intel PRO/10GbE on the Mac OS X platform.
4. Benchmarking In order to determine the bottleneck of the Apple Power Mac G5 a number of benchmarks were performed which were split up in two categories: system benchmarks and network benchmarks. Where possible these benchmarks were executed on both operating systems, Linux and Mac OS X Panther.
4.1 System benchmarks: Mac OS X
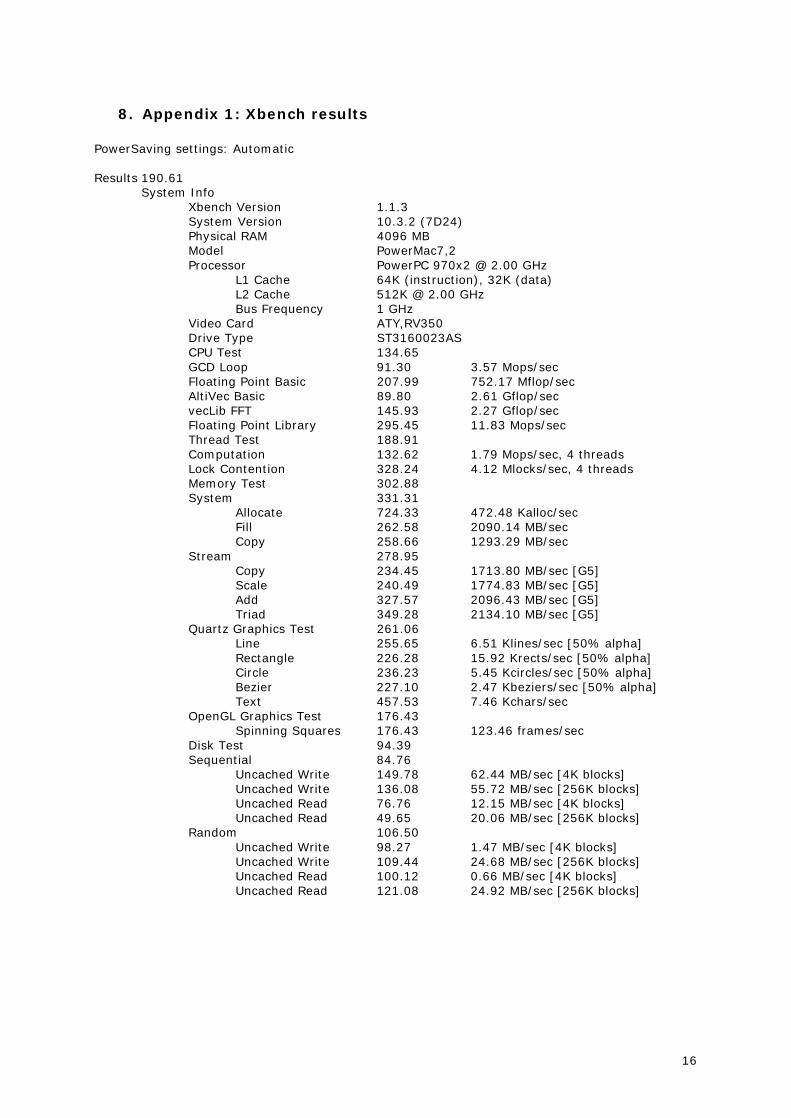
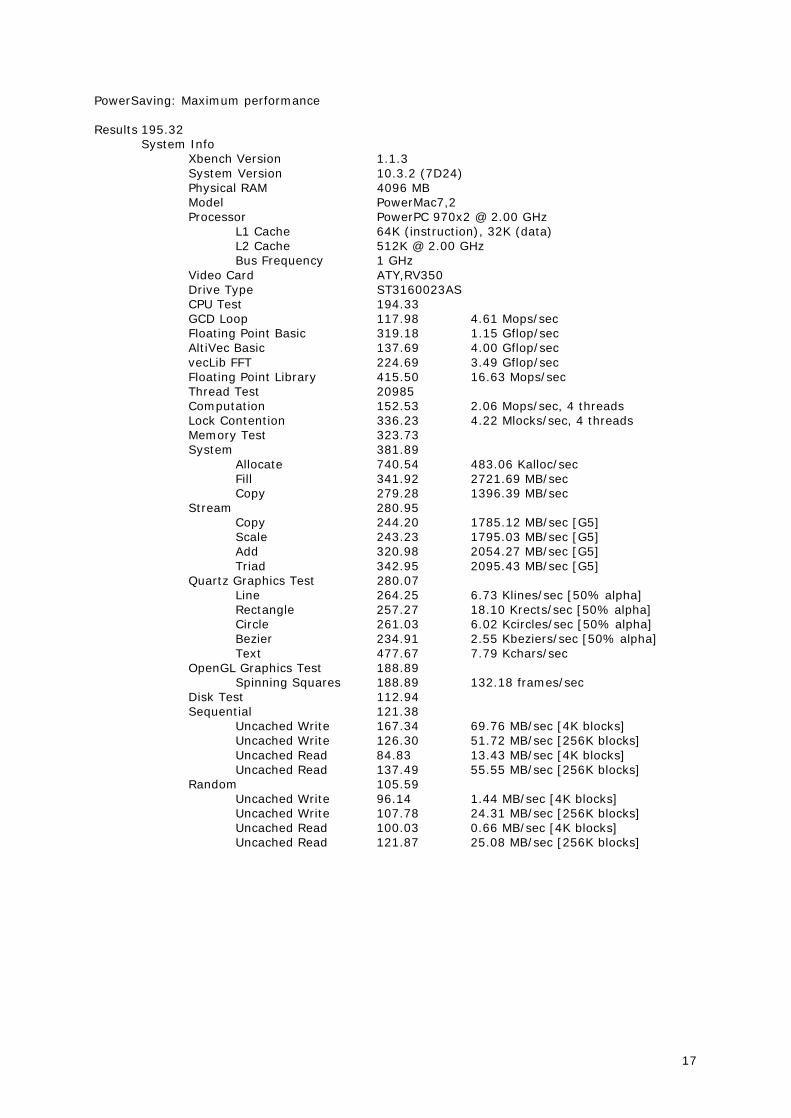
To determine the system performance of the G5 running Mac OS 10.3, the Xbench benchmark was used. Xbench15 was developed to provide a comprehensive benchmarking solution for Mac OS X and is therefore only available for Mac OS X. It consists of different performance tests like a memory, CPU and graphic tests. All tests of the Xbench benchmark were run with the exception of the User Interface Test. Apple's G5 incorporates a technique called “bus slewing” which is used to dynamically alter the system's performance to whatever level needed. According to Apple leaving the performance setting on automatic (which in fact is automatic bus slewing) will have no impact on performance (these settings can be found under System Preferences -> Energy Saver -> Options). However, Xbench tests show otherwise. The overall CPU performance score increased by nearly 45% when using the highest performance setting. Also, the highest setting had some impact on memory and multi threading scores. Overall the performance of the automatic setting was more or less comparable with the highest setting with a difference of only 2.5%. Memory speed as tested by Xbench resulted in a maximum memory fill rate of 2.7 GibiByte/s and a maximum memory copy rate of 1.4 GibiByte/s. All memory stream tests (Copy, Scale, Add and Triad) scored around 2 GibiByte/s. Full results of the Xbench test can be found in Appendix 1. The theoretical memory bandwidth of 6.4 GigaByte/s is never reached by the Xbench benchmark. However the values we did obtain show no bottleneck for memory performance when using a single memory operation (such as memcopy). When multiple memory operations are needed to obtain high network performance, memory performance may become a bottleneck.
4.2 System benchmark: Linux
Two system benchmarks were performed on Linux, CacheBench and Memperf. These should give a more detailed look at the memory performance.
4.2.1 Memperf
“Memperf measures the memory bandwidth in a 2 dimensional way. First it varies the block size which provides information of the throughput in different memory system hierarchy’s (different
G5 Performance Report – Version 1.0 – By Niels Visser & Daniël Hilster – February 1, 2004 8
cache levels). Secondly it varies the access pattern from contiguous blocks to different strided accesses.” 16
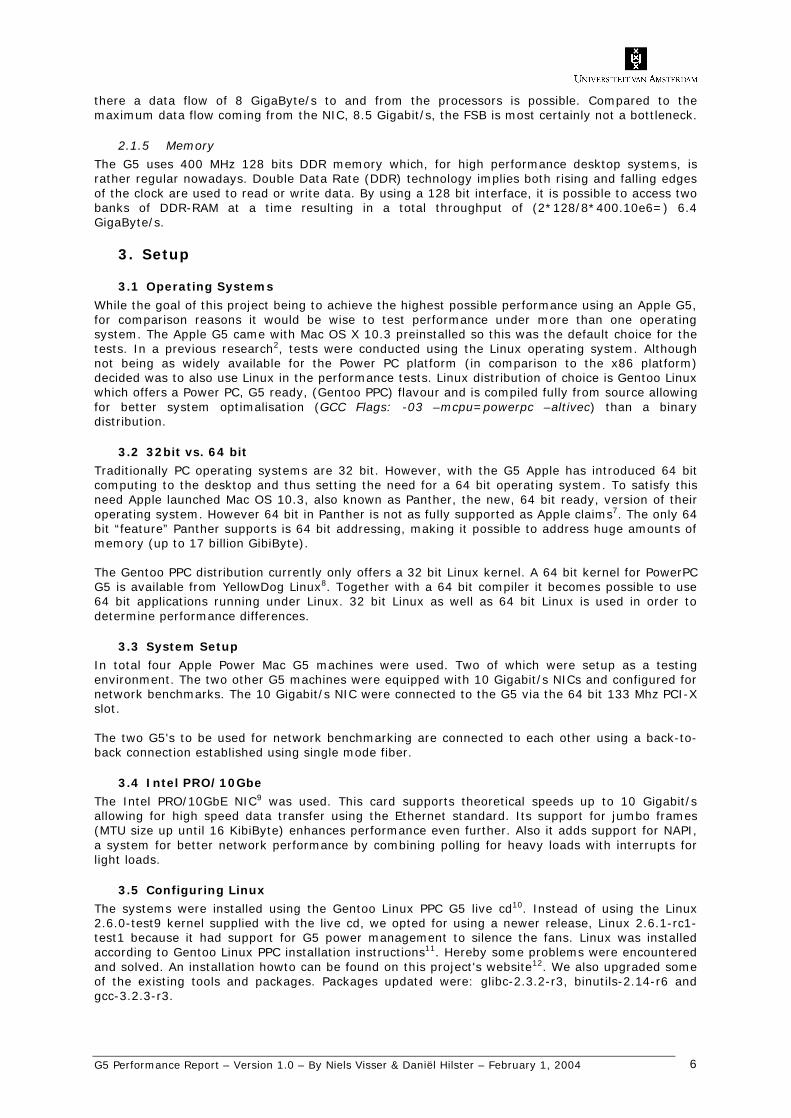
Strided access refers to a series of I/O requests, where each request is for the same number of bytes, and the file pointer is incremented by the same amount between each request. Contiguous blocks refer to the situation where data is allocated as a complete block, without leaps. The Memperf benchmark itself consists of 4 different memory performance tests. It starts with a load test, figure 3, to measure the speed at which data can be loaded from memory. This is done for different block sizes and different strides.
1 3 5 712 16 31 48 64
127
192
0.5 K
4 K32 K
256 K
2 M
0
5000
10000
15000
20000
25000
30000
35000
Ban
dwid
th [M
ebiB
yte/
s]
Stride
Workload
Load Sum Performance
1 3 5 712 16 31 48 64
127
192
0.5 K
4 K32 K
256 K
2 M
0
2000
4000
6000
8000
10000
12000
14000
Ban
dwid
th [M
ebiB
yte/
s]
Stride
Workload
Constant store performance
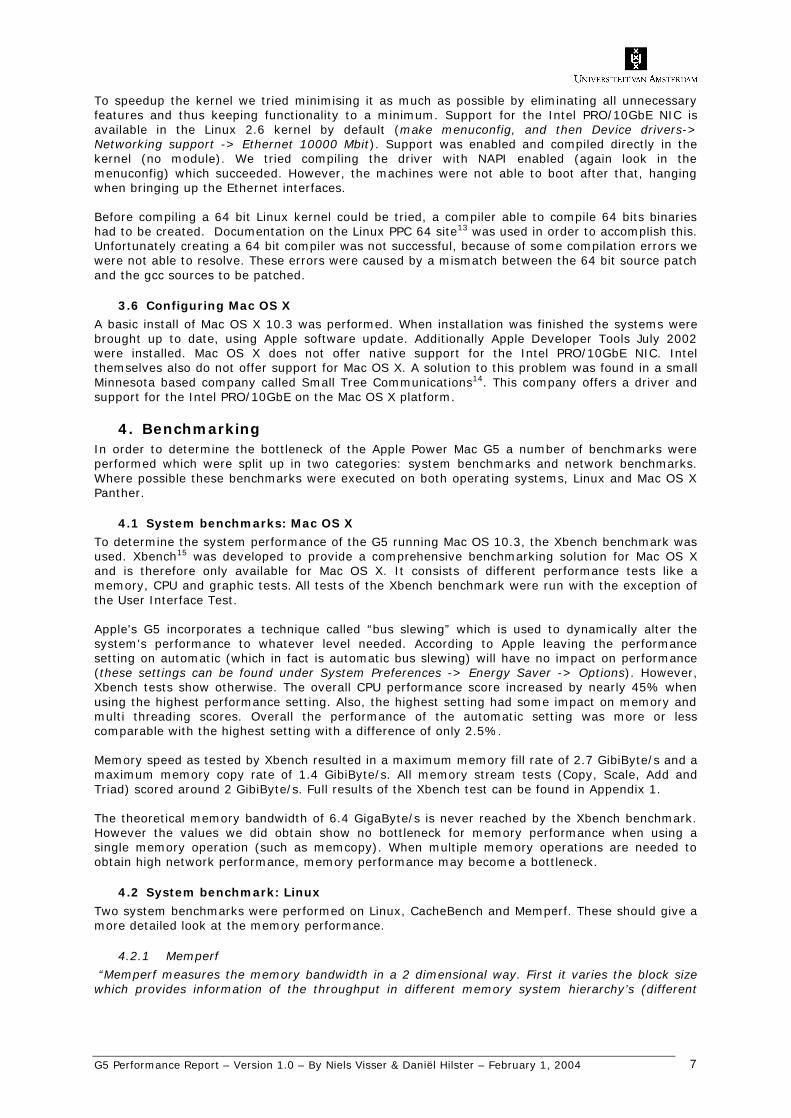
The constants store test does the opposite of the load test. Instead of loading from memory, data is now stored to memory, using the same differences in block sizes and strided, see figure 4. The load copy test combines the load and constant store test. Memory is loaded in a strided way and stored contiguous, as can be seen in figure 5.
1 3 5 712 16 31 48 64
127
192
0.5 K
4 K32 K
256 K
2 M
0
5000
10000
15000
20000
25000
30000
35000
Ban
dwid
th [M
ebiB
yte/
s]
Stride
Workload
Load Copy Performance
1 3 5 712 16 31 48 64
127
192
0.5 K
4 K32 K
256 K
2 M
0
5000
10000
15000
20000
25000
30000
35000
Ban
dwid
th [M
ebiB
yte/
s]
Stride
Workload
Copy Store Performance
The last test, copy store, uses contiguous access to load data from memory and strided access to write it back. See figure 6. Memperf shows the memory performance of the G5 in much more detail than the previously mentioned Xbench. Looking at the results of Memperf one can conclude that maximum memory bandwidth is reached when using small block sizes. When block size increases, memory bandwidth decreases. When block sizes becomes too large data can no longer be stored in cache memory, so main memory (RAM) must be used. Using only one memory operation (store or load) bandwidth suddenly drops after 256 KibiByte. During the last two tests where two memory operations (load and store) are performed, bandwidth drops after 64 KibiByte. Peak results show a maximum bandwidth of around 20 GibiByte/s and drops to around 2 GibiByte/s. Needless to say this is not a bottleneck when the needed network performance is concerned. However, when multiple memory operations with large (> 256 KibiByte) block sizes are needed for high network performance, memory bandwidth may not be sufficient.
Figure 3: Memperf Load Sum Figure 4: Memperf Constant Store
Figure 5: Memperf Load Copy Figure 6: Memperf Copy Store
G5 Performance Report – Version 1.0 – By Niels Visser & Daniël Hilster – February 1, 2004 9
4.2.2 CacheBench
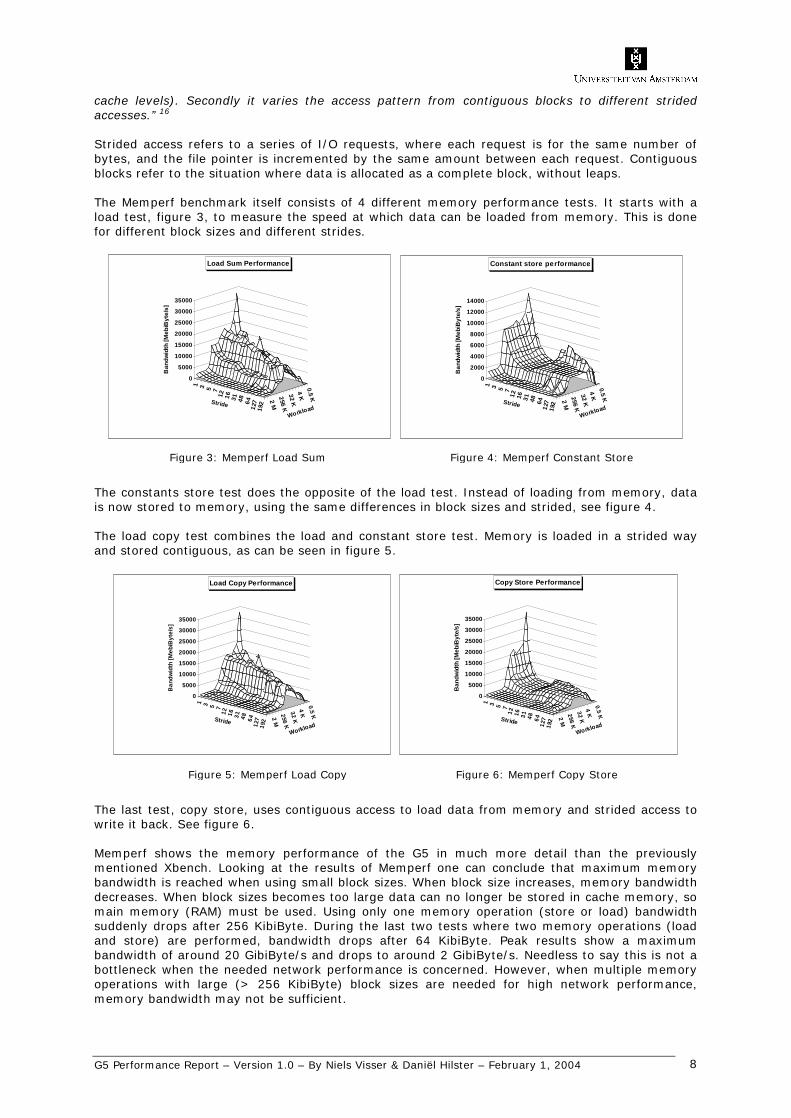
“CacheBench is a benchmark designed to evaluate the performance of the memory hierarchy of computer systems. Its specific focus is to parameterize the performance of possibly multiple levels of cache present on and off the processor. By performance, we mean raw bandwidth in megabytes per second. Of interest to us is the ability of the cache to sustain large, unit-stride, floating point workloads.”17
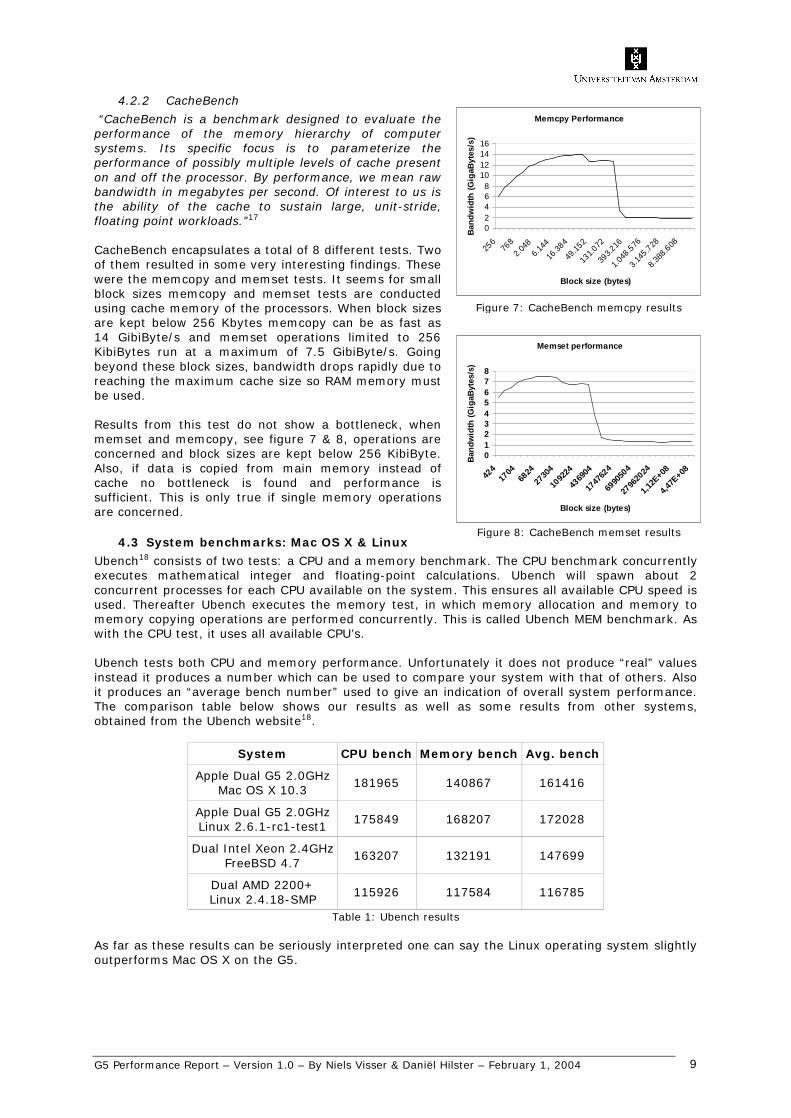
CacheBench encapsulates a total of 8 different tests. Two of them resulted in some very interesting findings. These were the memcopy and memset tests. It seems for small block sizes memcopy and memset tests are conducted using cache memory of the processors. When block sizes are kept below 256 Kbytes memcopy can be as fast as 14 GibiByte/s and memset operations limited to 256 KibiBytes run at a maximum of 7.5 GibiByte/s. Going beyond these block sizes, bandwidth drops rapidly due to reaching the maximum cache size so RAM memory must be used. Results from this test do not show a bottleneck, when memset and memcopy, see figure 7 & 8, operations are concerned and block sizes are kept below 256 KibiByte. Also, if data is copied from main memory instead of cache no bottleneck is found and performance is sufficient. This is only true if single memory operations are concerned.
4.3 System benchmarks: Mac OS X & Linux
Ubench18 consists of two tests: a CPU and a memory benchmark. The CPU benchmark concurrently executes mathematical integer and floating-point calculations. Ubench will spawn about 2 concurrent processes for each CPU available on the system. This ensures all available CPU speed is used. Thereafter Ubench executes the memory test, in which memory allocation and memory to memory copying operations are performed concurrently. This is called Ubench MEM benchmark. As with the CPU test, it uses all available CPU’s. Ubench tests both CPU and memory performance. Unfortunately it does not produce “real” values instead it produces a number which can be used to compare your system with that of others. Also it produces an “average bench number” used to give an indication of overall system performance. The comparison table below shows our results as well as some results from other systems, obtained from the Ubench website18.
System CPU bench Memory bench Avg. bench
Apple Dual G5 2.0GHz Mac OS X 10.3
181965 140867 161416
Apple Dual G5 2.0GHz Linux 2.6.1-rc1-test1
175849 168207 172028
Dual Intel Xeon 2.4GHz FreeBSD 4.7
163207 132191 147699
Dual AMD 2200+ Linux 2.4.18-SMP
115926 117584 116785
Table 1: Ubench results As far as these results can be seriously interpreted one can say the Linux operating system slightly outperforms Mac OS X on the G5.
Figure 7: CacheBench memcpy results
Figure 8: CacheBench memset results
Memcpy Performance
02468
10121416
256
768
2.048
6.144
16.38
4
49.15
2
131.0
72
393.2
16
1.048
.576
3.145
.728
8.388
.608
Block size (bytes)
Band
wid
th (G
igaB
ytes
/s)
Memset performance
012345678
424
1704
6824
2730
4
1092
24
4369
04
1747
624
6990
504
2796
2024
1,12E
+08
4,47E
+08
Block size (bytes)
Band
wid
th (G
igaB
ytes
/s)
G5 Performance Report – Version 1.0 – By Niels Visser & Daniël Hilster – February 1, 2004 10
4.4 Network benchmarks
To test the network performance two tools were used, Iperf and Netperf. The tests were conducted under both Linux and Mac OS X.
4.4.1 Linux network benchmarks
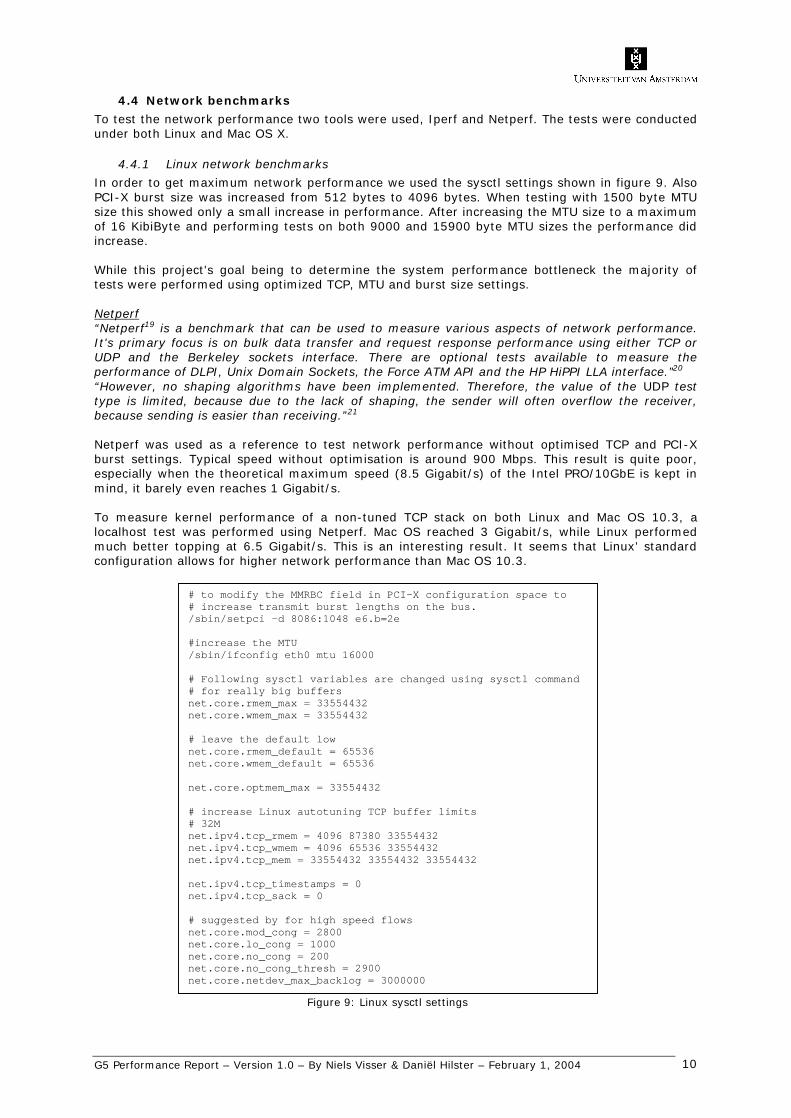
In order to get maximum network performance we used the sysctl settings shown in figure 9. Also PCI-X burst size was increased from 512 bytes to 4096 bytes. When testing with 1500 byte MTU size this showed only a small increase in performance. After increasing the MTU size to a maximum of 16 KibiByte and performing tests on both 9000 and 15900 byte MTU sizes the performance did increase. While this project's goal being to determine the system performance bottleneck the majority of tests were performed using optimized TCP, MTU and burst size settings. Netperf
“Netperf19 is a benchmark that can be used to measure various aspects of network performance. It's primary focus is on bulk data transfer and request response performance using either TCP or UDP and the Berkeley sockets interface. There are optional tests available to measure the performance of DLPI, Unix Domain Sockets, the Force ATM API and the HP HiPPI LLA interface.”20 “However, no shaping algorithms have been implemented. Therefore, the value of the UDP test type is limited, because due to the lack of shaping, the sender will often overflow the receiver, because sending is easier than receiving.”21
Netperf was used as a reference to test network performance without optimised TCP and PCI-X burst settings. Typical speed without optimisation is around 900 Mbps. This result is quite poor, especially when the theoretical maximum speed (8.5 Gigabit/s) of the Intel PRO/10GbE is kept in mind, it barely even reaches 1 Gigabit/s. To measure kernel performance of a non-tuned TCP stack on both Linux and Mac OS 10.3, a localhost test was performed using Netperf. Mac OS reached 3 Gigabit/s, while Linux performed much better topping at 6.5 Gigabit/s. This is an interesting result. It seems that Linux’ standard configuration allows for higher network performance than Mac OS 10.3.
# to modify the MMRBC field in PCI-X configuration space to # increase transmit burst lengths on the bus. /sbin/setpci -d 8086:1048 e6.b=2e #increase the MTU /sbin/ifconfig eth0 mtu 16000 # Following sysctl variables are changed using sysctl command # for really big buffers net.core.rmem_max = 33554432 net.core.wmem_max = 33554432 # leave the default low net.core.rmem_default = 65536 net.core.wmem_default = 65536 net.core.optmem_max = 33554432 # increase Linux autotuning TCP buffer limits # 32M net.ipv4.tcp_rmem = 4096 87380 33554432 net.ipv4.tcp_wmem = 4096 65536 33554432 net.ipv4.tcp_mem = 33554432 33554432 33554432 net.ipv4.tcp_timestamps = 0 net.ipv4.tcp_sack = 0 # suggested by for high speed flows net.core.mod_cong = 2800 net.core.lo_cong = 1000 net.core.no_cong = 200 net.core.no_cong_thresh = 2900 net.core.netdev_max_backlog = 3000000 Figure 9: Linux sysctl settings
G5 Performance Report – Version 1.0 – By Niels Visser & Daniël Hilster – February 1, 2004 11
Iperf “Iperf22 is a tool for measuring maximum TCP and or UDP bandwidth associated with a link, reminiscent of ttcp and nettest. It has been written to overcome the shortcomings of those ageing tools. It attempts to throttle a network with TCP or UDP traffic - discovering the maximum transfer throughput (bandwidth) between two nodes in a network, without monitoring in-between nodes/routers. It can also utilise parallel-streamed transfers if the appropriate libraries are installed and have the benefit of using user-specified window size for network transfers.”23
“…Iperf basically tries to send as much information down a connection as quickly as possible reporting on the throughput achieved. This tool is especially useful in determining the volume of data that links between two machines can supply.”23 “Because Iperf has implemented shaping algorithms its UDP test is more reliable then that of Netperf.”21
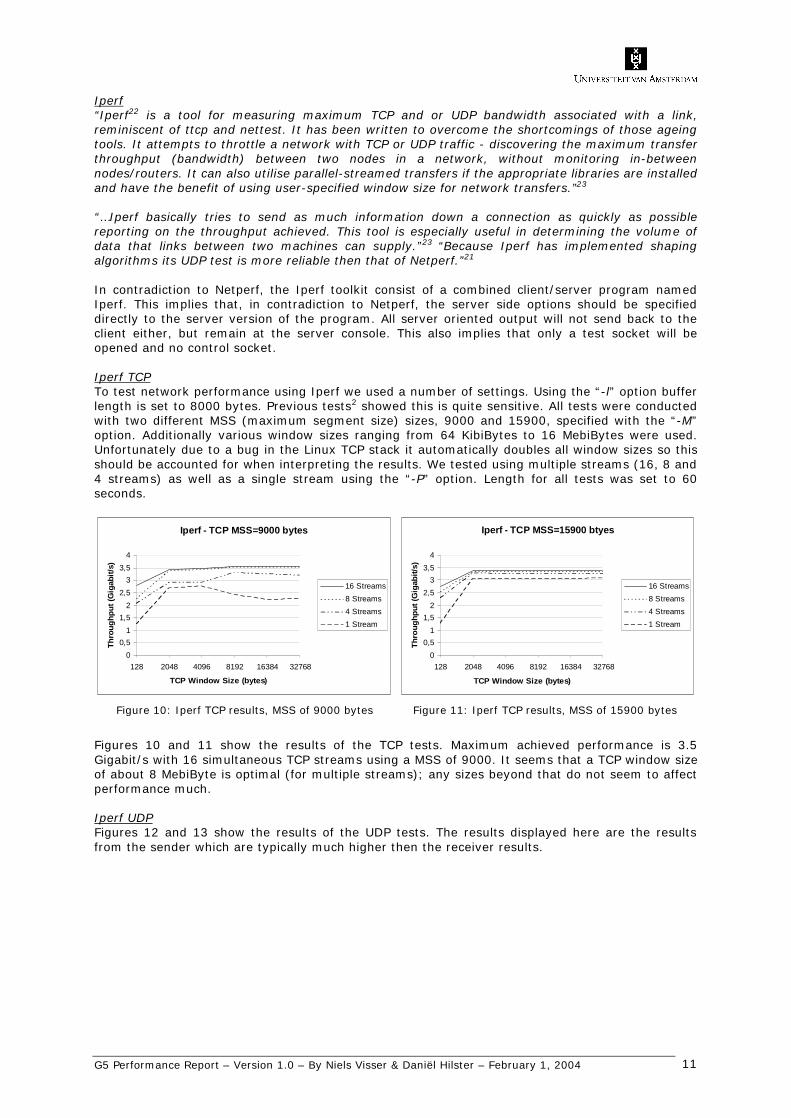
In contradiction to Netperf, the Iperf toolkit consist of a combined client/server program named Iperf. This implies that, in contradiction to Netperf, the server side options should be specified directly to the server version of the program. All server oriented output will not send back to the client either, but remain at the server console. This also implies that only a test socket will be opened and no control socket. Iperf TCP To test network performance using Iperf we used a number of settings. Using the “-l” option buffer length is set to 8000 bytes. Previous tests2 showed this is quite sensitive. All tests were conducted with two different MSS (maximum segment size) sizes, 9000 and 15900, specified with the “-M” option. Additionally various window sizes ranging from 64 KibiBytes to 16 MebiBytes were used. Unfortunately due to a bug in the Linux TCP stack it automatically doubles all window sizes so this should be accounted for when interpreting the results. We tested using multiple streams (16, 8 and 4 streams) as well as a single stream using the “-P” option. Length for all tests was set to 60 seconds.
Iperf - TCP MSS=9000 bytes
00,5
11,5
22,5
33,5
4
128 2048 4096 8192 16384 32768
TCP Window Size (bytes)
Thro
ughp
ut (G
igab
it/s)
16 Streams8 Streams4 Streams1 Stream
Iperf - TCP MSS=15900 btyes
00,5
11,5
22,5
33,5
4
128 2048 4096 8192 16384 32768
TCP Window Size (bytes)
Thro
ughp
ut (G
igab
it/s)
16 Streams8 Streams4 Streams1 Stream
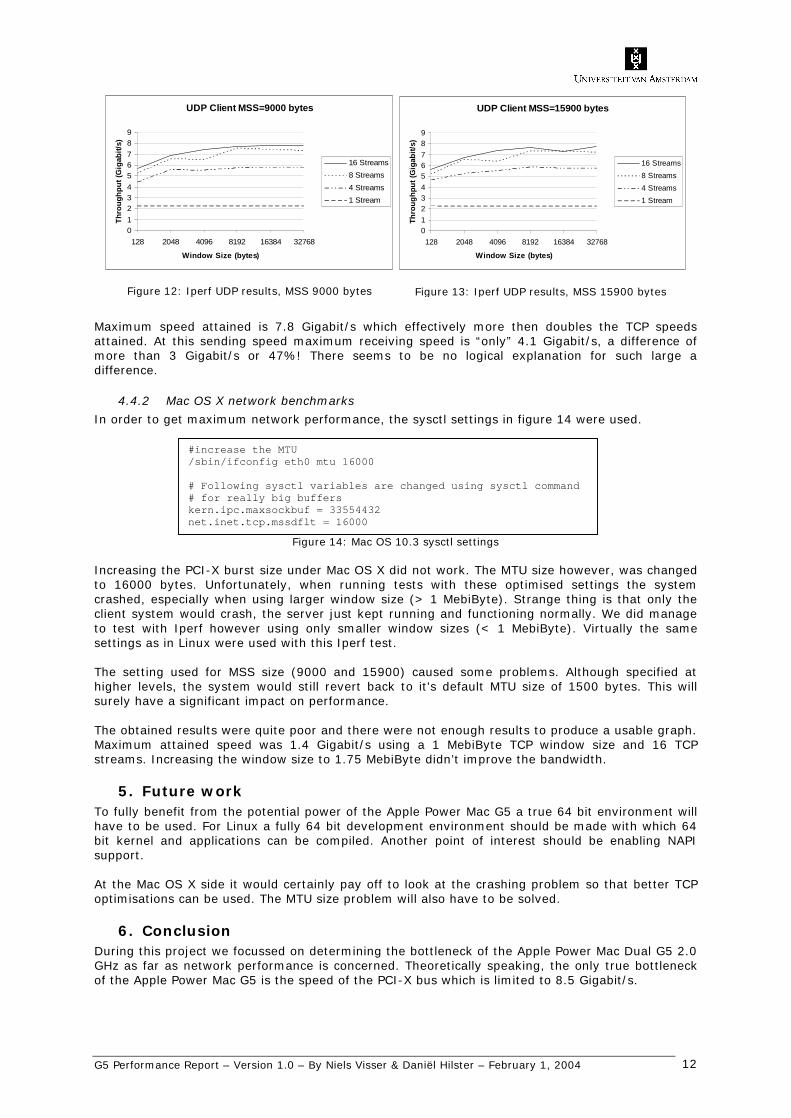
Figures 10 and 11 show the results of the TCP tests. Maximum achieved performance is 3.5 Gigabit/s with 16 simultaneous TCP streams using a MSS of 9000. It seems that a TCP window size of about 8 MebiByte is optimal (for multiple streams); any sizes beyond that do not seem to affect performance much. Iperf UDP Figures 12 and 13 show the results of the UDP tests. The results displayed here are the results from the sender which are typically much higher then the receiver results.
Figure 10: Iperf TCP results, MSS of 9000 bytes Figure 11: Iperf TCP results, MSS of 15900 bytes
G5 Performance Report – Version 1.0 – By Niels Visser & Daniël Hilster – February 1, 2004 12
UDP Client MSS=9000 bytes
0123456789
128 2048 4096 8192 16384 32768
Window Size (bytes)
Thro
ughp
ut (G
igab
it/s)
16 Streams8 Streams4 Streams1 Stream
UDP Client MSS=15900 bytes
0123456789
128 2048 4096 8192 16384 32768
Window Size (bytes)
Thro
ughp
ut (G
igab
it/s)
16 Streams8 Streams4 Streams1 Stream
Maximum speed attained is 7.8 Gigabit/s which effectively more then doubles the TCP speeds attained. At this sending speed maximum receiving speed is “only” 4.1 Gigabit/s, a difference of more than 3 Gigabit/s or 47%! There seems to be no logical explanation for such large a difference.
4.4.2 Mac OS X network benchmarks
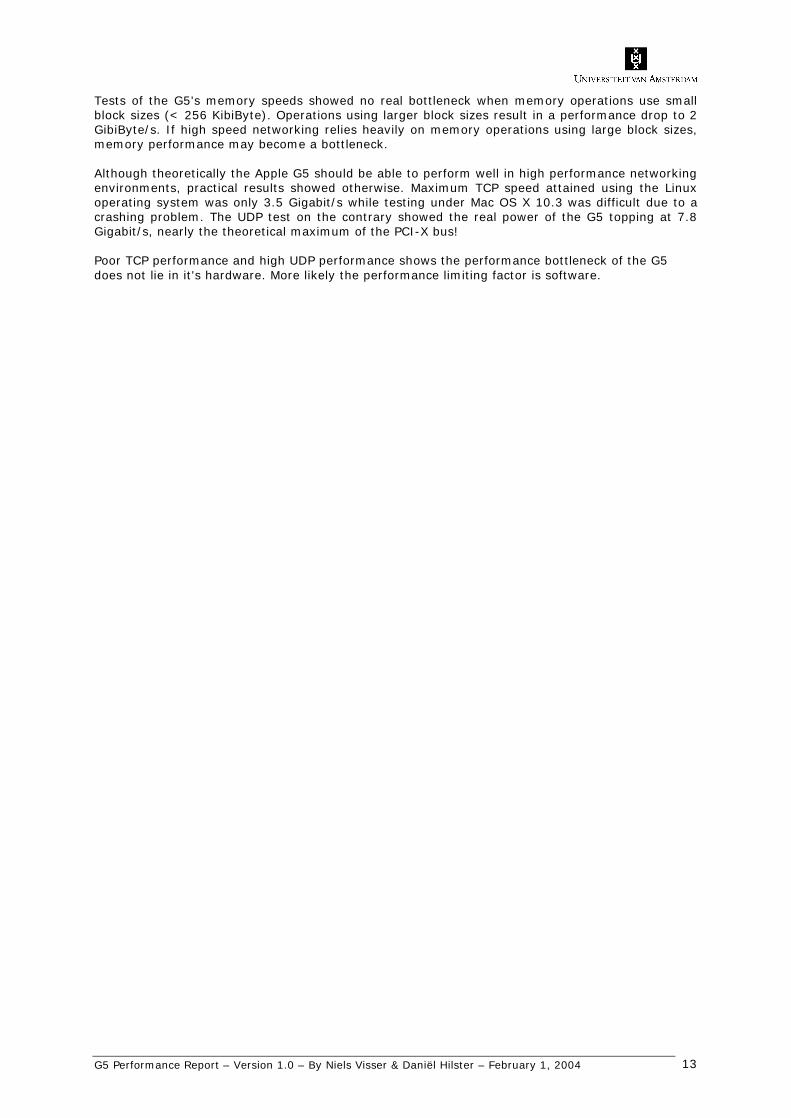
In order to get maximum network performance, the sysctl settings in figure 14 were used.
Figure 14: Mac OS 10.3 sysctl settings Increasing the PCI-X burst size under Mac OS X did not work. The MTU size however, was changed to 16000 bytes. Unfortunately, when running tests with these optimised settings the system crashed, especially when using larger window size (> 1 MebiByte). Strange thing is that only the client system would crash, the server just kept running and functioning normally. We did manage to test with Iperf however using only smaller window sizes (< 1 MebiByte). Virtually the same settings as in Linux were used with this Iperf test. The setting used for MSS size (9000 and 15900) caused some problems. Although specified at higher levels, the system would still revert back to it's default MTU size of 1500 bytes. This will surely have a significant impact on performance. The obtained results were quite poor and there were not enough results to produce a usable graph. Maximum attained speed was 1.4 Gigabit/s using a 1 MebiByte TCP window size and 16 TCP streams. Increasing the window size to 1.75 MebiByte didn’t improve the bandwidth.
5. Future work To fully benefit from the potential power of the Apple Power Mac G5 a true 64 bit environment will have to be used. For Linux a fully 64 bit development environment should be made with which 64 bit kernel and applications can be compiled. Another point of interest should be enabling NAPI support. At the Mac OS X side it would certainly pay off to look at the crashing problem so that better TCP optimisations can be used. The MTU size problem will also have to be solved.
6. Conclusion During this project we focussed on determining the bottleneck of the Apple Power Mac Dual G5 2.0 GHz as far as network performance is concerned. Theoretically speaking, the only true bottleneck of the Apple Power Mac G5 is the speed of the PCI-X bus which is limited to 8.5 Gigabit/s.
Figure 12: Iperf UDP results, MSS 9000 bytes Figure 13: Iperf UDP results, MSS 15900 bytes
#increase the MTU /sbin/ifconfig eth0 mtu 16000 # Following sysctl variables are changed using sysctl command # for really big buffers kern.ipc.maxsockbuf = 33554432 net.inet.tcp.mssdflt = 16000
G5 Performance Report – Version 1.0 – By Niels Visser & Daniël Hilster – February 1, 2004 13
Tests of the G5's memory speeds showed no real bottleneck when memory operations use small block sizes (< 256 KibiByte). Operations using larger block sizes result in a performance drop to 2 GibiByte/s. If high speed networking relies heavily on memory operations using large block sizes, memory performance may become a bottleneck. Although theoretically the Apple G5 should be able to perform well in high performance networking environments, practical results showed otherwise. Maximum TCP speed attained using the Linux operating system was only 3.5 Gigabit/s while testing under Mac OS X 10.3 was difficult due to a crashing problem. The UDP test on the contrary showed the real power of the G5 topping at 7.8 Gigabit/s, nearly the theoretical maximum of the PCI-X bus! Poor TCP performance and high UDP performance shows the performance bottleneck of the G5 does not lie in it's hardware. More likely the performance limiting factor is software.
G5 Performance Report – Version 1.0 – By Niels Visser & Daniël Hilster – February 1, 2004 14
7. References 1: NetherLight infrastructure http://www.surfnet.nl/innovatie/netherlight/ 2: A new look at Ethernet: Experiences from 10 Gigabit Ethernet End-to-End network between Amsterdam and Geneva. http://nikhef.antony.nl/writing/10-wan-phy-cern.pdf 3: Apple Power Mac G5 http://www.apple.com/powermac/ 4: Power Mac G5 Technology and Performance Overview, November 2003 http://www.apple.com/powermac/pdf/PowerMacG5_TO_111803.pdf 5: HyperTransport™ Technology I/O Link: A High-Bandwidth I/O Architeture http://www.amd.com/us-en/assets/content_type/white_papers_and_tech_docs/HyperTransport_IO_Link_Whitepaper_25012A.pdf 6: Power Mac G5 Developer Note: Block Diagram and Buses http://developer.apple.com/documentation/Hardware/Developer_Notes/Macintosh_CPUs-G5/PowerMacG5/2Architecture/chapter_3_section_2.html 7: Thoughts on Mac OS X 10.3: Counting the Bits of a Panther http://www.osnews.com/story.php?news_id=4009 8: G5 support Yellow Dog Linux http://www.terrasoftsolutions.com/products/apple/g5s.shtml 9: Intel PRO/10GbE LR Server Adapter http://www.intel.com/network/connectivity/products/pro10GbE_LR_server_adapter.htm 10: Gentoo G5 http://www.gentoo.org/news/20031111-g5.xml 11: Gentoo Linux/PPC 1.4 Installation Instructions http://www.gentoo.org/doc/en/gentoo-ppc-install.xml 12: Gentooo G5 installation guide http://www.os3.nl/~visser2d/g5install.html 13: PPC64 toolchain construction http://linuxppc64.org/toolchain.shtml 14: Small Tree http://www.small-tree.com/ 15: Xbench http://www.xbench.com 16: Memperf http://www.cs.inf.ethz.ch/CoPs/ECT/ http://www.cs.inf.ethz.ch/CoPs/ECT/README 17: Cachebench http://www.cs.utk.edu/~london/papers/cachebench.ps http://icl.cs.utk.edu/projects/llcbench/cachebench.html 18: Ubench http://www.phystech.com/download/ubench.html
G5 Performance Report – Version 1.0 – By Niels Visser & Daniël Hilster – February 1, 2004 15
19: Netperf home http://www.netperf.org/netperf/NetperfPage.html 20: Building a Network http://www.qsl.net/n9zia/wireless/page08.html 21: Network Test Tools http://carol.wins.uva.nl/~jblom/datatag/wp3_1/tools/test_tools.html 22: Iperf http://dast.nlanr.net/Projects/Iperf/ 23: Iperf http://www.hep.ucl.ac.uk/~ytl/monitoring/iperf/description.html Definitions of the SI unit: The binary prefixes http://www.physics.nist.gov/cuu/Units/binary.html NAPI and other 10 GbE research http://www.sc-conference.org/sc2003/paperpdfs/pap293.pdf
16
8. Appendix 1: Xbench results PowerSaving settings: Automatic Results 190.61 System Info Xbench Version 1.1.3 System Version 10.3.2 (7D24) Physical RAM 4096 MB Model PowerMac7,2 Processor PowerPC 970x2 @ 2.00 GHz L1 Cache 64K (instruction), 32K (data) L2 Cache 512K @ 2.00 GHz Bus Frequency 1 GHz Video Card ATY,RV350 Drive Type ST3160023AS CPU Test 134.65 GCD Loop 91.30 3.57 Mops/sec Floating Point Basic 207.99 752.17 Mflop/sec AltiVec Basic 89.80 2.61 Gflop/sec vecLib FFT 145.93 2.27 Gflop/sec Floating Point Library 295.45 11.83 Mops/sec Thread Test 188.91 Computation 132.62 1.79 Mops/sec, 4 threads Lock Contention 328.24 4.12 Mlocks/sec, 4 threads Memory Test 302.88 System 331.31 Allocate 724.33 472.48 Kalloc/sec Fill 262.58 2090.14 MB/sec Copy 258.66 1293.29 MB/sec Stream 278.95 Copy 234.45 1713.80 MB/sec [G5] Scale 240.49 1774.83 MB/sec [G5] Add 327.57 2096.43 MB/sec [G5] Triad 349.28 2134.10 MB/sec [G5] Quartz Graphics Test 261.06 Line 255.65 6.51 Klines/sec [50% alpha] Rectangle 226.28 15.92 Krects/sec [50% alpha] Circle 236.23 5.45 Kcircles/sec [50% alpha] Bezier 227.10 2.47 Kbeziers/sec [50% alpha] Text 457.53 7.46 Kchars/sec OpenGL Graphics Test 176.43 Spinning Squares 176.43 123.46 frames/sec Disk Test 94.39 Sequential 84.76 Uncached Write 149.78 62.44 MB/sec [4K blocks] Uncached Write 136.08 55.72 MB/sec [256K blocks] Uncached Read 76.76 12.15 MB/sec [4K blocks] Uncached Read 49.65 20.06 MB/sec [256K blocks] Random 106.50 Uncached Write 98.27 1.47 MB/sec [4K blocks] Uncached Write 109.44 24.68 MB/sec [256K blocks] Uncached Read 100.12 0.66 MB/sec [4K blocks] Uncached Read 121.08 24.92 MB/sec [256K blocks]
17
PowerSaving: Maximum performance Results 195.32 System Info Xbench Version 1.1.3 System Version 10.3.2 (7D24) Physical RAM 4096 MB Model PowerMac7,2 Processor PowerPC 970x2 @ 2.00 GHz L1 Cache 64K (instruction), 32K (data) L2 Cache 512K @ 2.00 GHz Bus Frequency 1 GHz Video Card ATY,RV350 Drive Type ST3160023AS CPU Test 194.33 GCD Loop 117.98 4.61 Mops/sec Floating Point Basic 319.18 1.15 Gflop/sec AltiVec Basic 137.69 4.00 Gflop/sec vecLib FFT 224.69 3.49 Gflop/sec Floating Point Library 415.50 16.63 Mops/sec Thread Test 20985 Computation 152.53 2.06 Mops/sec, 4 threads Lock Contention 336.23 4.22 Mlocks/sec, 4 threads Memory Test 323.73 System 381.89 Allocate 740.54 483.06 Kalloc/sec Fill 341.92 2721.69 MB/sec Copy 279.28 1396.39 MB/sec Stream 280.95 Copy 244.20 1785.12 MB/sec [G5] Scale 243.23 1795.03 MB/sec [G5] Add 320.98 2054.27 MB/sec [G5] Triad 342.95 2095.43 MB/sec [G5] Quartz Graphics Test 280.07 Line 264.25 6.73 Klines/sec [50% alpha] Rectangle 257.27 18.10 Krects/sec [50% alpha] Circle 261.03 6.02 Kcircles/sec [50% alpha] Bezier 234.91 2.55 Kbeziers/sec [50% alpha] Text 477.67 7.79 Kchars/sec OpenGL Graphics Test 188.89 Spinning Squares 188.89 132.18 frames/sec Disk Test 112.94 Sequential 121.38 Uncached Write 167.34 69.76 MB/sec [4K blocks] Uncached Write 126.30 51.72 MB/sec [256K blocks] Uncached Read 84.83 13.43 MB/sec [4K blocks] Uncached Read 137.49 55.55 MB/sec [256K blocks] Random 105.59 Uncached Write 96.14 1.44 MB/sec [4K blocks] Uncached Write 107.78 24.31 MB/sec [256K blocks] Uncached Read 100.03 0.66 MB/sec [4K blocks] Uncached Read 121.87 25.08 MB/sec [256K blocks]
Related Documents