FY2013 Trends in Fisheries FY2014 Fishery Policy White Paper on Fisheries: Summary

Welcome message from author
This document is posted to help you gain knowledge. Please leave a comment to let me know what you think about it! Share it to your friends and learn new things together.
Transcript
FY2013 Trends in Fisheries
FY2014
Fishery Policy
White Paper on Fisheries: Summary
This document is a report on fishery trends and the policy implemented during FY2013 in accordance with the provisions of Article 10, paragraph (1) of the Fisheries Basic Act (Act No. 89 of 2001) as well as the policy to be implemented in FY2014 in accordance with the provisions of paragraph (2) of said Article.
Table of Contents
Section 1: Developments of aquaculture to date (1) Significance of aquaculture (2) History of aquaculture (3) Various aquaculture methods (4) Status of Japan‘s aquaculture production (5) Laws concerning aquaculture (6) Status of the world‘s aquaculture production Section 2: Challenges facing aquaculture production (1) Aquaculture business management (2) Environment of aquaculture sites (3) Limits in the use of natural seeds (4) Improvement of aquaculture feed (5) Status of occurrence of fish diseases and use of fishery medicines, etc. Section 3: Aquaculture products and dining table (1) New efforts to sell cultured fish (2) If aquaculture products disappear (3) Consumers’ evaluation of aquaculture products Section 4: Toward sustainable development of aquaculture (1) Building a sustainable supply framework (2) Securing a favorable aquaculture site environment (3) Appropriate use of wild resources (4) Technology development for dealing with environmental changes and maintaining
wild resources (5) Further promotion of safe and reliable aquaculture production sought by consumers (6) Contribution to food security, etc.
--------------------------------------------------------- 1 ------------------------------------------------------------------------------------ 1
------------------------------------------------------------------------------------------- 1 --------------------------------------------------------------------------------- 2
----------------------------------------------------------------- 2 --------------------------------------------------------------------------------- 4
------------------------------------------------------------- 4 ------------------------------------------------- 5
------------------------------------------------------------------------ 5 ---------------------------------------------------------------------------- 8 ---------------------------------------------------------------------------- 9 --------------------------------------------------------------------------- 9
--------------------------10 ------------------------------------------------------10
-------------------------------------------------------------------------------10 ---------------------------------------------------------------------------11
---------------------------------------------------------12 -----------------------------------------12
------------------------------------------------------------------12 -----------------------------------------------------12
----------------------------------------------------------------------------13
------------13 ---------13
-----------------------------------------------------------------------------13
Chapter I: [Special Feature] Sustainable Development of Aquaculture
FY2013 Trends in Fisheries
Section 1: Management of fishery resources in Japan (1) Status of fishery resources in waters surrounding Japan (2) Framework for implementation of resource assessments (3) Necessity of resource management (4) Characteristics of Japan’s fishery management (5) Specific implementation status of resource management in Japan (6) Voluntary resource management and support for fishers who make such efforts (7) International cooperation in resource management Section 2: Trends in Japan’s fishing ground environment (1) Conservation of fishing ground environment (2) Fishery damage caused by wildlife (3) Efforts for effective resource management Section 3: Trends in Japan’s fishing industry (1) Trends in fisheries and aquaculture (2) Trends in fishery cooperatives (3) Trends in distribution and processing of fishery products Section 4: Trends in consumption and the supply and demand of fish and
fishery products (1) Trends in the supply and demand of fish and fishery products (2) Trends in Japan’s fish and fishery products imports and exports (3) Status of fish and fishery products consumption Section 5: International affairs surrounding the fisheries (1) State of global fishery and aquaculture production (2) Consumption of fishery products in the world (3) Global trade of fishery products (4) Japan’s relations in international fisheries Section 6: Development of safe and vigorous fishing communities (1) Seashore revitalization plan (2) Use of local resources in the fishing industry and fishing communities (3) Multiple functions of the fishing industry and fishing communities (4) Roles of fishing ports in the promotion of the fishing industry (5) Strengthening disaster prevention and promoting disaster mitigation in fishing
communities (6) Energy conservation and use of renewable energy in the fishing industry and
fishing communities Section 7: Developments toward reconstruction from the Great East Japan
Earthquake (1) Status of reconstruction of the fishing industry and fishing communities (2) Dealing with the nuclear power plant accident
Prize winners at the 2013 Agriculture, Forestry, and Fisheries Festival
------------------------------------------------14 ---------------------------------------------14 --------------------------------------------14
------------------------------------------------------------------------14 ---------------------------------------------------------14
---------------------------------15 --------------15
----------------------------------------------------16 ------------------------------------------16
-------------------------------------------------------------16 --------------------------------------------------------------------------17
---------------------------------------------------------------17 ------------------------------------------------------------17
-------------------------------------------------------------------------17 --------------------------------------------------------------------------------21
---------------------------------------------21
---------------------22 --------------------------------------22
-----------------------------------23 ---------------------------------------------------------24
--------------------------------------------25 -----------------------------------------------------25
------------------------------------------------------------26 ------------------------------------------------------------------------------27
----------------------------------------------------------------27 ------------------------------28
-----------------------------------------------------------------------------------28 ----------------------------28
----------------------------------28 ----------------------------------------29
-----------------29
-----------------29
-----------------29
--------------------------29 -----------------------------------------------------------32
--------------------------------33
Chapter II: Review of Japan’s Fisheries since FY2012
FY2004 Fishery Policy ---------------34
Cultured22%
Wild78%
Total production volume
4.86 million tons
Eel18,000 tons
Wild
Cultured99%
1%
Red sea bream
72,000 tons
Wild
Cultured79%
21%Yellowtails
263,000 tons
Wild
Cultured61%
39% Scallop500,000
tons
Wild
Cultured37%
63%
Kelps107,000
tons
Wild
Cultured32%
68%
Bluefin tuna
18,000 tonsWild
Cultured53%
47%
Salmons151,000
tonsWild
Cultured6%
94%
Section 1: Developments of aquaculture to date
Chapter I: [Special Feature] Sustainable Development of Aquaculture
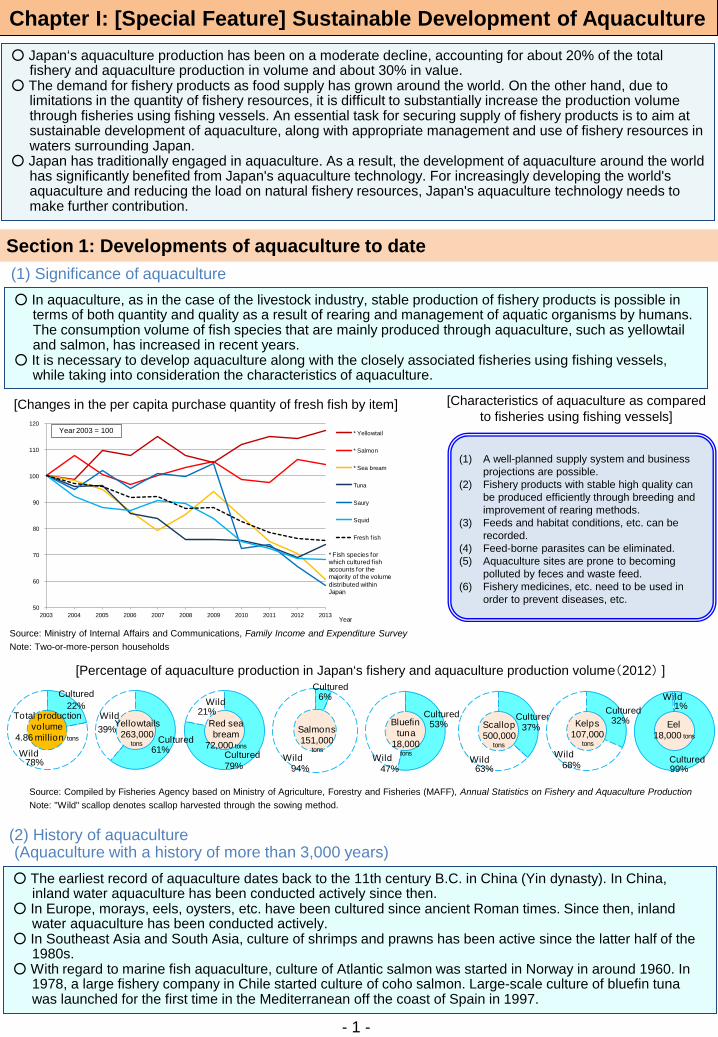
(1) Significance of aquaculture ○ In aquaculture, as in the case of the livestock industry, stable production of fishery products is possible in
terms of both quantity and quality as a result of rearing and management of aquatic organisms by humans. The consumption volume of fish species that are mainly produced through aquaculture, such as yellowtail and salmon, has increased in recent years.
○ It is necessary to develop aquaculture along with the closely associated fisheries using fishing vessels, while taking into consideration the characteristics of aquaculture.
- 1 -
(1) A well-planned supply system and business projections are possible.
(2) Fishery products with stable high quality can be produced efficiently through breeding and improvement of rearing methods.
(3) Feeds and habitat conditions, etc. can be recorded.
(4) Feed-borne parasites can be eliminated. (5) Aquaculture sites are prone to becoming
polluted by feces and waste feed. (6) Fishery medicines, etc. need to be used in
order to prevent diseases, etc.
○ Japan‘s aquaculture production has been on a moderate decline, accounting for about 20% of the total fishery and aquaculture production in volume and about 30% in value.
○ The demand for fishery products as food supply has grown around the world. On the other hand, due to limitations in the quantity of fishery resources, it is difficult to substantially increase the production volume through fisheries using fishing vessels. An essential task for securing supply of fishery products is to aim at sustainable development of aquaculture, along with appropriate management and use of fishery resources in waters surrounding Japan.
○ Japan has traditionally engaged in aquaculture. As a result, the development of aquaculture around the world has significantly benefited from Japan's aquaculture technology. For increasingly developing the world's aquaculture and reducing the load on natural fishery resources, Japan's aquaculture technology needs to make further contribution.
(2) History of aquaculture
○ The earliest record of aquaculture dates back to the 11th century B.C. in China (Yin dynasty). In China, inland water aquaculture has been conducted actively since then.
○ In Europe, morays, eels, oysters, etc. have been cultured since ancient Roman times. Since then, inland water aquaculture has been conducted actively.
○ In Southeast Asia and South Asia, culture of shrimps and prawns has been active since the latter half of the 1980s.
○ With regard to marine fish aquaculture, culture of Atlantic salmon was started in Norway in around 1960. In 1978, a large fishery company in Chile started culture of coho salmon. Large-scale culture of bluefin tuna was launched for the first time in the Mediterranean off the coast of Spain in 1997.
(Aquaculture with a history of more than 3,000 years)
[Characteristics of aquaculture as compared to fisheries using fishing vessels]
[Changes in the per capita purchase quantity of fresh fish by item]
[Percentage of aquaculture production in Japan‘s fishery and aquaculture production volume(2012) ]
Source: Compiled by Fisheries Agency based on Ministry of Agriculture, Forestry and Fisheries (MAFF), Annual Statistics on Fishery and Aquaculture Production Note: "Wild" scallop denotes scallop harvested through the sowing method.
50
60
70
80
90
100
110
120
2003 2004 2005 2006 2007 2008 2009 2010 2011 2012 2013
* Yellowtail
* Salmon
* Sea bream
Tuna
Saury
Squid
Fresh f ish
Year 2003 = 100
* Fish species for which cultured fish accounts for the majority of the volume distributed within Japan
Year
Source: Ministry of Internal Affairs and Communications, Family Income and Expenditure Survey Note: Two-or-more-person households
- 2 -
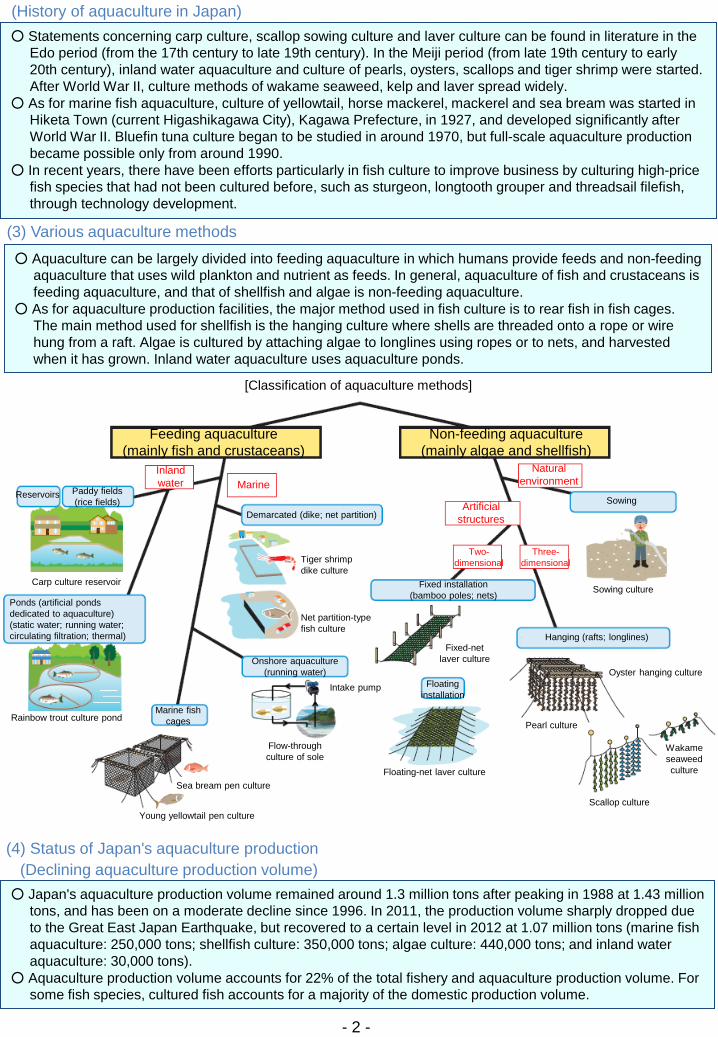
○ Aquaculture can be largely divided into feeding aquaculture in which humans provide feeds and non-feeding aquaculture that uses wild plankton and nutrient as feeds. In general, aquaculture of fish and crustaceans is feeding aquaculture, and that of shellfish and algae is non-feeding aquaculture.
○ As for aquaculture production facilities, the major method used in fish culture is to rear fish in fish cages. The main method used for shellfish is the hanging culture where shells are threaded onto a rope or wire hung from a raft. Algae is cultured by attaching algae to longlines using ropes or to nets, and harvested when it has grown. Inland water aquaculture uses aquaculture ponds.
(3) Various aquaculture methods
[Classification of aquaculture methods]
(4) Status of Japan's aquaculture production
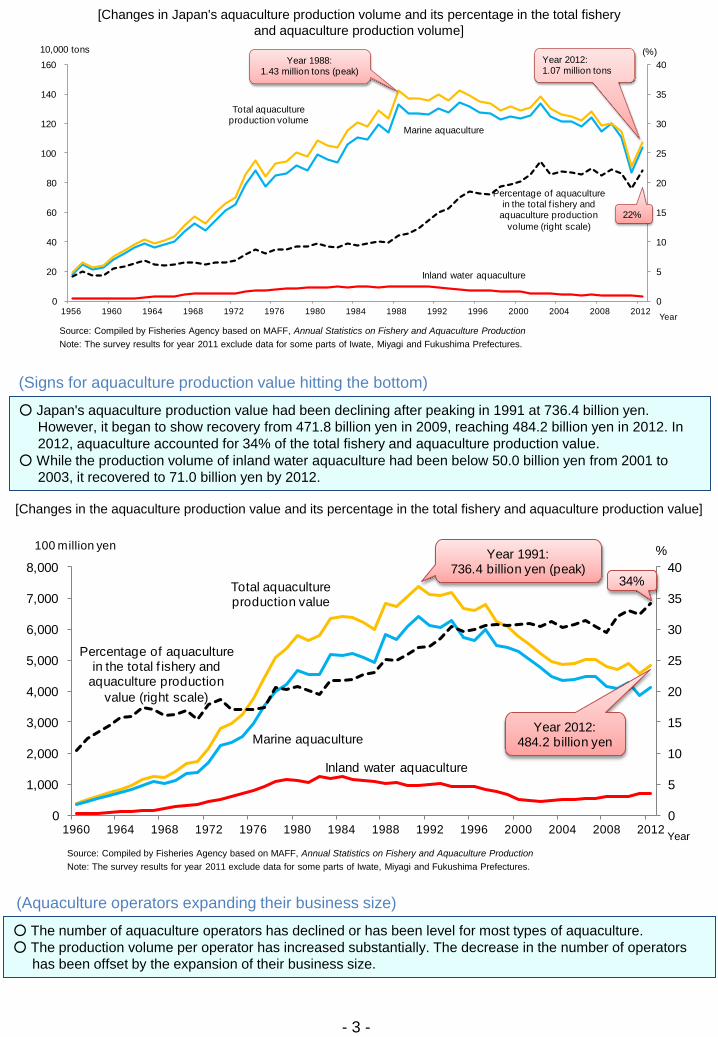
○ Japan's aquaculture production volume remained around 1.3 million tons after peaking in 1988 at 1.43 million tons, and has been on a moderate decline since 1996. In 2011, the production volume sharply dropped due to the Great East Japan Earthquake, but recovered to a certain level in 2012 at 1.07 million tons (marine fish aquaculture: 250,000 tons; shellfish culture: 350,000 tons; algae culture: 440,000 tons; and inland water aquaculture: 30,000 tons).
○ Aquaculture production volume accounts for 22% of the total fishery and aquaculture production volume. For some fish species, cultured fish accounts for a majority of the domestic production volume.
(Declining aquaculture production volume)
○ Statements concerning carp culture, scallop sowing culture and laver culture can be found in literature in the Edo period (from the 17th century to late 19th century). In the Meiji period (from late 19th century to early 20th century), inland water aquaculture and culture of pearls, oysters, scallops and tiger shrimp were started. After World War II, culture methods of wakame seaweed, kelp and laver spread widely.
○ As for marine fish aquaculture, culture of yellowtail, horse mackerel, mackerel and sea bream was started in Hiketa Town (current Higashikagawa City), Kagawa Prefecture, in 1927, and developed significantly after World War II. Bluefin tuna culture began to be studied in around 1970, but full-scale aquaculture production became possible only from around 1990.
○ In recent years, there have been efforts particularly in fish culture to improve business by culturing high-price fish species that had not been cultured before, such as sturgeon, longtooth grouper and threadsail filefish, through technology development.
(History of aquaculture in Japan)
Demarcated (dike; net partition)
Feeding aquaculture (mainly fish and crustaceans)
Inland water
Reservoirs Paddy fields (rice fields)
Carp culture reservoir
Ponds (artificial ponds dedicated to aquaculture) (static water; running water; circulating filtration; thermal)
Rainbow trout culture pond
Marine
Tiger shrimp dike culture
Net partition-type fish culture
Onshore aquaculture (running water)
Sea bream pen culture
Intake pump
Flow-through culture of sole
Marine fish cages
Young yellowtail pen culture
Non-feeding aquaculture (mainly algae and shellfish)
Natural environment
Sowing
Sowing culture
Artificial structures
Two-dimensional
Fixed installation (bamboo poles; nets)
Floating installation
Fixed-net laver culture
Floating-net laver culture
Three-dimensional
Hanging (rafts; longlines)
Pearl culture
Oyster hanging culture
Wakame seaweed culture
Scallop culture
0
5
10
15
20
25
30
35
40
0
20
40
60
80
100
120
140
160
1956 1960 1964 1968 1972 1976 1980 1984 1988 1992 1996 2000 2004 2008 2012
(%)10,000 tons
Total aquaculture production volume
Inland water aquaculture
Percentage of aquaculture in the total f ishery and
aquaculture production volume (right scale)
Year
Marine aquaculture
Year 1988: 1.43 million tons (peak)
Year 2012: 1.07 million tons
22%
- 3 -
○ Japan's aquaculture production value had been declining after peaking in 1991 at 736.4 billion yen. However, it began to show recovery from 471.8 billion yen in 2009, reaching 484.2 billion yen in 2012. In 2012, aquaculture accounted for 34% of the total fishery and aquaculture production value.
○ While the production volume of inland water aquaculture had been below 50.0 billion yen from 2001 to 2003, it recovered to 71.0 billion yen by 2012.
(Signs for aquaculture production value hitting the bottom)
[Changes in the aquaculture production value and its percentage in the total fishery and aquaculture production value]
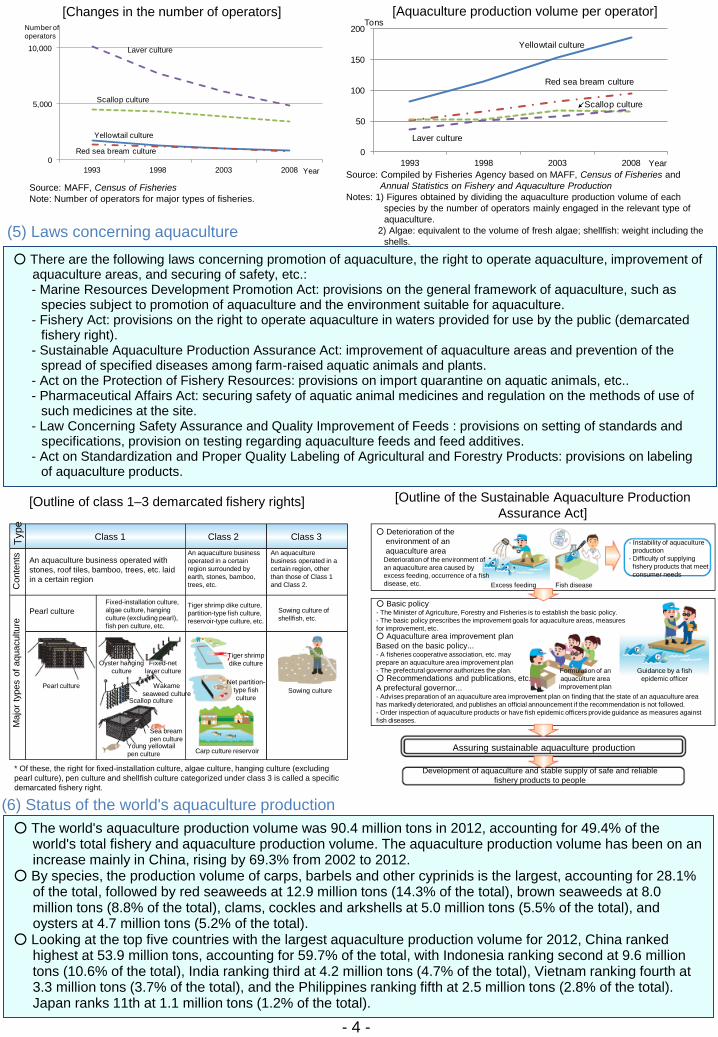
(Aquaculture operators expanding their business size)
○ The number of aquaculture operators has declined or has been level for most types of aquaculture. ○ The production volume per operator has increased substantially. The decrease in the number of operators
has been offset by the expansion of their business size.
Source: Compiled by Fisheries Agency based on MAFF, Annual Statistics on Fishery and Aquaculture Production Note: The survey results for year 2011 exclude data for some parts of Iwate, Miyagi and Fukushima Prefectures.
[Changes in Japan's aquaculture production volume and its percentage in the total fishery and aquaculture production volume]
0
5
10
15
20
25
30
35
40
0
1,000
2,000
3,000
4,000
5,000
6,000
7,000
8,000
1960 1964 1968 1972 1976 1980 1984 1988 1992 1996 2000 2004 2008 2012
%100 million yen
Total aquaculture production value
Marine aquaculture
Percentage of aquaculture in the total f ishery and
aquaculture production value (right scale)
Inland water aquaculture
Year
Year 1991: 736.4 billion yen (peak)
Year 2012: 484.2 billion yen
34%
Source: Compiled by Fisheries Agency based on MAFF, Annual Statistics on Fishery and Aquaculture Production Note: The survey results for year 2011 exclude data for some parts of Iwate, Miyagi and Fukushima Prefectures.
0
50
100
150
200
1993 1998 2003 2008
Tons
Yellowtail culture
Red sea bream culture
Laver culture
Scallop culture
Year
[Changes in the number of operators] [Aquaculture production volume per operator]
○ There are the following laws concerning promotion of aquaculture, the right to operate aquaculture, improvement of aquaculture areas, and securing of safety, etc.: - Marine Resources Development Promotion Act: provisions on the general framework of aquaculture, such as
species subject to promotion of aquaculture and the environment suitable for aquaculture. - Fishery Act: provisions on the right to operate aquaculture in waters provided for use by the public (demarcated
fishery right). - Sustainable Aquaculture Production Assurance Act: improvement of aquaculture areas and prevention of the
spread of specified diseases among farm-raised aquatic animals and plants. - Act on the Protection of Fishery Resources: provisions on import quarantine on aquatic animals, etc.. - Pharmaceutical Affairs Act: securing safety of aquatic animal medicines and regulation on the methods of use of
such medicines at the site. - Law Concerning Safety Assurance and Quality Improvement of Feeds : provisions on setting of standards and
specifications, provision on testing regarding aquaculture feeds and feed additives. - Act on Standardization and Proper Quality Labeling of Agricultural and Forestry Products: provisions on labeling
of aquaculture products.
(5) Laws concerning aquaculture
[Outline of class 1–3 demarcated fishery rights] [Outline of the Sustainable Aquaculture Production Assurance Act]
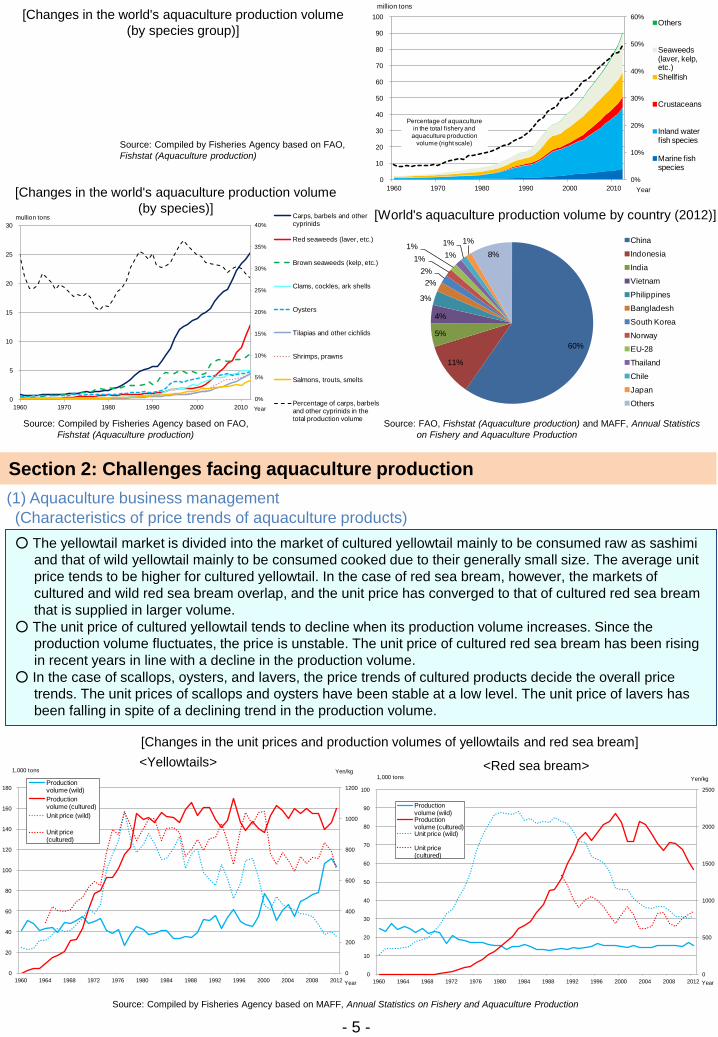
(6) Status of the world's aquaculture production ○ The world's aquaculture production volume was 90.4 million tons in 2012, accounting for 49.4% of the
world's total fishery and aquaculture production volume. The aquaculture production volume has been on an increase mainly in China, rising by 69.3% from 2002 to 2012.
○ By species, the production volume of carps, barbels and other cyprinids is the largest, accounting for 28.1% of the total, followed by red seaweeds at 12.9 million tons (14.3% of the total), brown seaweeds at 8.0 million tons (8.8% of the total), clams, cockles and arkshells at 5.0 million tons (5.5% of the total), and oysters at 4.7 million tons (5.2% of the total).
○ Looking at the top five countries with the largest aquaculture production volume for 2012, China ranked highest at 53.9 million tons, accounting for 59.7% of the total, with Indonesia ranking second at 9.6 million tons (10.6% of the total), India ranking third at 4.2 million tons (4.7% of the total), Vietnam ranking fourth at 3.3 million tons (3.7% of the total), and the Philippines ranking fifth at 2.5 million tons (2.8% of the total). Japan ranks 11th at 1.1 million tons (1.2% of the total).
- 4 -
0
5,000
10,000
1993 1998 2003 2008
Number of operators
Scallop culture
Laver culture
Yellowtail culture
Red sea bream culture
Year
Source: MAFF, Census of Fisheries Note: Number of operators for major types of fisheries.
Source: Compiled by Fisheries Agency based on MAFF, Census of Fisheries and Annual Statistics on Fishery and Aquaculture Production
Notes: 1) Figures obtained by dividing the aquaculture production volume of each species by the number of operators mainly engaged in the relevant type of aquaculture.
2) Algae: equivalent to the volume of fresh algae; shellfish: weight including the shells.
Type
Class 1 Class 2 Class 3
Con
tent
s
An aquaculture business operated with stones, roof tiles, bamboo, trees, etc. laid in a certain region
An aquaculture business operated in a certain region surrounded by earth, stones, bamboo, trees, etc.
An aquaculture business operated in a certain region, other than those of Class 1 and Class 2.
Maj
or ty
pes
of a
quac
ultu
re Pearl culture
Pearl culture
Fixed-installation culture, algae culture, hanging culture (excluding pearl), fish pen culture, etc.
Tiger shrimp dike culture, partition-type fish culture, reservoir-type culture, etc.
Sowing culture of shellfish, etc.
Oyster hanging culture
Fixed-net laver culture
Tiger shrimp dike culture
Wakame seaweed culture
Scallop culture
Sea bream pen culture
Young yellowtail pen culture
Sowing culture Net partition-
type fish culture
Carp culture reservoir
* Of these, the right for fixed-installation culture, algae culture, hanging culture (excluding pearl culture), pen culture and shellfish culture categorized under class 3 is called a specific demarcated fishery right.
○ Deterioration of the environment of an aquaculture area
Deterioration of the environment of an aquaculture area caused by excess feeding, occurrence of a fish disease, etc. Excess feeding
- Instability of aquaculture production
- Difficulty of supplying fishery products that meet consumer needs
Fish disease
○ Basic policy - The Minister of Agriculture, Forestry and Fisheries is to establish the basic policy. - The basic policy prescribes the improvement goals for aquaculture areas, measures for improvement, etc.
○ Aquaculture area improvement plan Based on the basic policy... - A fisheries cooperative association, etc. may prepare an aquaculture area improvement plan - The prefectural governor authorizes the plan. ○ Recommendations and publications, etc. A prefectural governor... - Advises preparation of an aquaculture area improvement plan on finding that the state of an aquaculture area has markedly deteriorated, and publishes an official announcement if the recommendation is not followed. - Order inspection of aquaculture products or have fish epidemic officers provide guidance as measures against fish diseases.
Formulation of an aquaculture area improvement plan
Guidance by a fish epidemic officer
Assuring sustainable aquaculture production
Development of aquaculture and stable supply of safe and reliable fishery products to people
0%
5%
10%
15%
20%
25%
30%
35%
40%
0
5
10
15
20
25
30
1960 1970 1980 1990 2000 2010
mullion tons Carps, barbels and other cyprinids
Red seaweeds (laver, etc.)
Brown seaweeds (kelp, etc.)
Clams, cockles, ark shells
Oysters
Tilapias and other cichlids
Shrimps, prawns
Salmons, trouts, smelts
Percentage of carps, barbels and other cyprinids in the total production volume
Year
0
500
1000
1500
2000
2500
0
10
20
30
40
50
60
70
80
90
100
1960 1964 1968 1972 1976 1980 1984 1988 1992 1996 2000 2004 2008 2012
Yen/kg1,000 tons
Production volume (wild)Production volume (cultured)Unit price (wild)
Unit price (cultured)
Year
0
200
400
600
800
1000
1200
0
20
40
60
80
100
120
140
160
180
1960 1964 1968 1972 1976 1980 1984 1988 1992 1996 2000 2004 2008 2012
Yen/kg1,000 tons
Production volume (wild)Production volume (cultured)Unit price (wild)
Unit price (cultured)
Year
60%
11%
5%
4%
3%
2%2%
1%1%
1%1% 1%
8%
China
Indonesia
India
Vietnam
Philippines
Bangladesh
South Korea
Norway
EU-28
Thailand
Chile
Japan
Others
0%
10%
20%
30%
40%
50%
60%
0
10
20
30
40
50
60
70
80
90
100
1960 1970 1980 1990 2000 2010
million tons
Others
Seaweeds (laver, kelp, etc.)Shellfish
Crustaceans
Inland water fish species
Marine fish species
Year
Percentage of aquaculture in the total fishery and aquaculture production
volume (right scale)
- 5 -
[Changes in the world's aquaculture production volume (by species group)]
Source: Compiled by Fisheries Agency based on FAO, Fishstat (Aquaculture production)
[Changes in the world's aquaculture production volume (by species)] [World's aquaculture production volume by country (2012)]
Source: Compiled by Fisheries Agency based on FAO, Fishstat (Aquaculture production)
Source: FAO, Fishstat (Aquaculture production) and MAFF, Annual Statistics on Fishery and Aquaculture Production
Section 2: Challenges facing aquaculture production
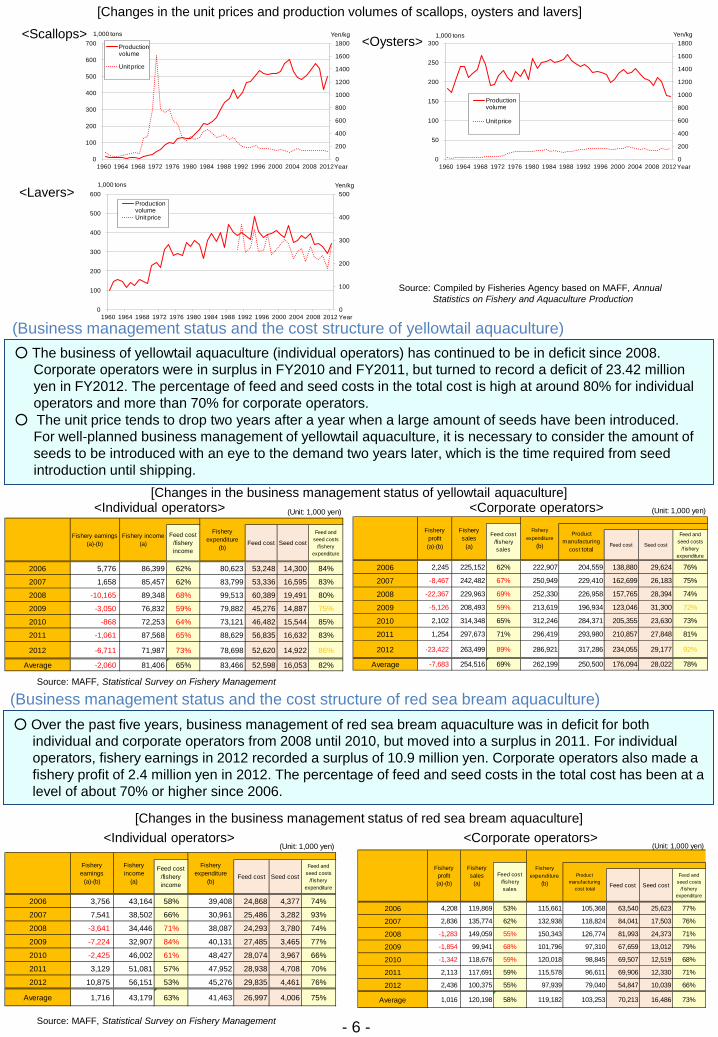
○ The yellowtail market is divided into the market of cultured yellowtail mainly to be consumed raw as sashimi and that of wild yellowtail mainly to be consumed cooked due to their generally small size. The average unit price tends to be higher for cultured yellowtail. In the case of red sea bream, however, the markets of cultured and wild red sea bream overlap, and the unit price has converged to that of cultured red sea bream that is supplied in larger volume.
○ The unit price of cultured yellowtail tends to decline when its production volume increases. Since the production volume fluctuates, the price is unstable. The unit price of cultured red sea bream has been rising in recent years in line with a decline in the production volume.
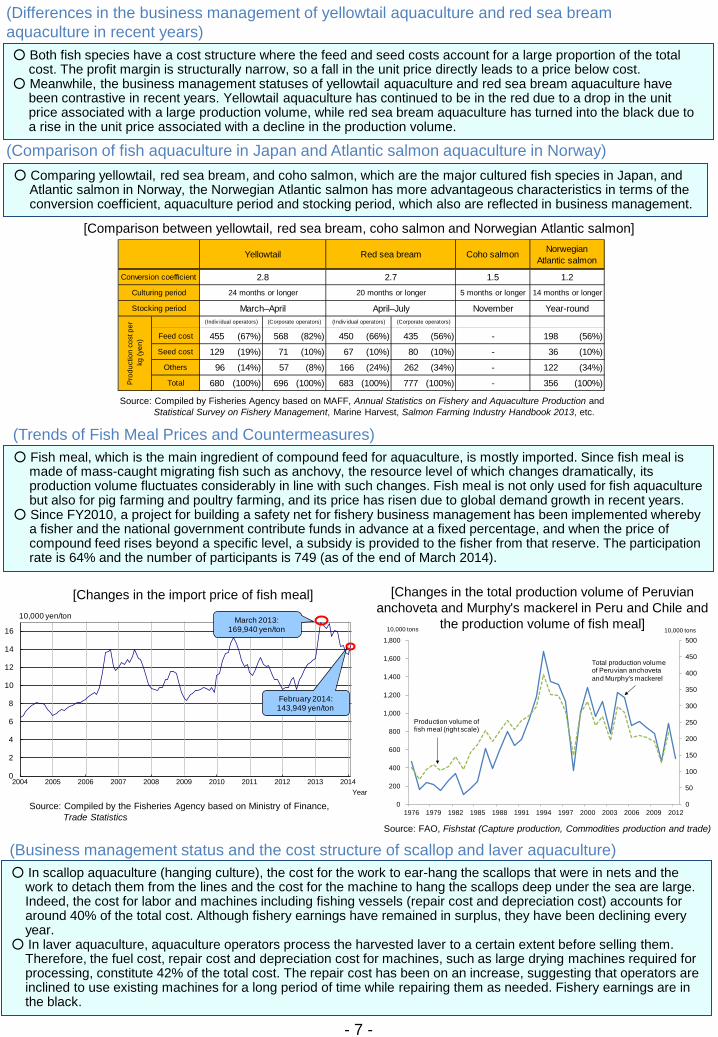
○ In the case of scallops, oysters, and lavers, the price trends of cultured products decide the overall price trends. The unit prices of scallops and oysters have been stable at a low level. The unit price of lavers has been falling in spite of a declining trend in the production volume.
(1) Aquaculture business management (Characteristics of price trends of aquaculture products)
[Changes in the unit prices and production volumes of yellowtails and red sea bream] <Yellowtails>
Source: Compiled by Fisheries Agency based on MAFF, Annual Statistics on Fishery and Aquaculture Production
<Red sea bream>
0
100
200
300
400
500
0
100
200
300
400
500
600
1960 1964 1968 1972 1976 1980 1984 1988 1992 1996 2000 2004 2008 2012
Yen/kg1,000 tons
Production volumeUnit price
Year
(Unit: 1,000 yen)
Feed cost/fisheryincome
Feed cost Seed cost
Feed andseed costs
/f isheryexpenditure
2006 3,756 43,164 58% 39,408 24,868 4,377 74%
2007 7,541 38,502 66% 30,961 25,486 3,282 93%
2008 -3,641 34,446 71% 38,087 24,293 3,780 74%
2009 -7,224 32,907 84% 40,131 27,485 3,465 77%
2010 -2,425 46,002 61% 48,427 28,074 3,967 66%
2011 3,129 51,081 57% 47,952 28,938 4,708 70%
2012 10,875 56,151 53% 45,276 29,835 4,461 76%
Average 1,716 43,179 63% 41,463 26,997 4,006 75%
Fisheryearnings
(a)-(b)
Fisheryincome
(a)
Fisheryexpenditure
(b)
(Unit: 1,000 yen)
Feed cost Seed cost
Feed andseed costs
/f isheryexpenditure
2006 4,208 119,869 53% 115,661 105,368 63,540 25,623 77%
2007 2,836 135,774 62% 132,938 118,824 84,041 17,503 76%
2008 -1,283 149,059 55% 150,343 126,774 81,993 24,373 71%
2009 -1,854 99,941 68% 101,796 97,310 67,659 13,012 79%
2010 -1,342 118,676 59% 120,018 98,845 69,507 12,519 68%
2011 2,113 117,691 59% 115,578 96,611 69,906 12,330 71%
2012 2,436 100,375 55% 97,939 79,040 54,847 10,039 66%
Average 1,016 120,198 58% 119,182 103,253 70,213 16,486 73%
Fisheryexpenditure
(b)Feed cost
/fisherysales
Productmanufacturing
cost total
Fisheryprofit(a)-(b)
Fisherysales
(a)
(Unit: 1,000 yen)
Feed cost Seed cost
Feed andseed costs
/f isheryexpenditure
2006 2,245 225,152 62% 222,907 204,559 138,880 29,624 76%
2007 -8,467 242,482 67% 250,949 229,410 162,699 26,183 75%
2008 -22,367 229,963 69% 252,330 226,958 157,765 28,394 74%
2009 -5,126 208,493 59% 213,619 196,934 123,046 31,300 72%
2010 2,102 314,348 65% 312,246 284,371 205,355 23,630 73%
2011 1,254 297,673 71% 296,419 293,980 210,857 27,848 81%
2012 -23,422 263,499 89% 286,921 317,286 234,055 29,177 92%
Average -7,683 254,516 69% 262,199 250,500 176,094 28,022 78%
Fisheryprofit(a)-(b)
Fisherysales
(a)
Fisheryexpenditure
(b)
Feed cost/fisherysales
Productmanufacturing
cost total
(Unit: 1,000 yen)
2006 5,776 86,399 62% 80,623 53,248 14,300 84%
2007 1,658 85,457 62% 83,799 53,336 16,595 83%
2008 -10,165 89,348 68% 99,513 60,389 19,491 80%
2009 -3,050 76,832 59% 79,882 45,276 14,887 75%
2010 -868 72,253 64% 73,121 46,482 15,544 85%
2011 -1,061 87,568 65% 88,629 56,835 16,632 83%
2012 -6,711 71,987 73% 78,698 52,620 14,922 86%
Average -2,060 81,406 65% 83,466 52,598 16,053 82%
Feed andseed costs
/f isheryexpenditure
Seed costFeed cost
Fisheryexpenditure
(b)
Feed cost/fisheryincome
Fishery income(a)
Fishery earnings(a)-(b)
- 6 -
(Business management status and the cost structure of yellowtail aquaculture) ○ The business of yellowtail aquaculture (individual operators) has continued to be in deficit since 2008.
Corporate operators were in surplus in FY2010 and FY2011, but turned to record a deficit of 23.42 million yen in FY2012. The percentage of feed and seed costs in the total cost is high at around 80% for individual operators and more than 70% for corporate operators.
○ The unit price tends to drop two years after a year when a large amount of seeds have been introduced. For well-planned business management of yellowtail aquaculture, it is necessary to consider the amount of seeds to be introduced with an eye to the demand two years later, which is the time required from seed introduction until shipping.
Source: Compiled by Fisheries Agency based on MAFF, Annual Statistics on Fishery and Aquaculture Production
<Individual operators> <Corporate operators>
Source: MAFF, Statistical Survey on Fishery Management
[Changes in the business management status of yellowtail aquaculture]
(Business management status and the cost structure of red sea bream aquaculture) ○ Over the past five years, business management of red sea bream aquaculture was in deficit for both
individual and corporate operators from 2008 until 2010, but moved into a surplus in 2011. For individual operators, fishery earnings in 2012 recorded a surplus of 10.9 million yen. Corporate operators also made a fishery profit of 2.4 million yen in 2012. The percentage of feed and seed costs in the total cost has been at a level of about 70% or higher since 2006.
[Changes in the business management status of red sea bream aquaculture] <Individual operators> <Corporate operators>
Source: MAFF, Statistical Survey on Fishery Management
[Changes in the unit prices and production volumes of scallops, oysters and lavers]
0
200
400
600
800
1000
1200
1400
1600
1800
0
100
200
300
400
500
600
700
1960 1964 1968 1972 1976 1980 1984 1988 1992 1996 2000 2004 2008 2012
Yen/kg1,000 tons
Production volume
Unit price
Year0
200
400
600
800
1000
1200
1400
1600
1800
0
50
100
150
200
250
300
1960 1964 1968 1972 1976 1980 1984 1988 1992 1996 2000 2004 2008 2012
Yen/kg1,000 tons
Production volume
Unit price
Year
<Lavers>
<Oysters> <Scallops>
0
50
100
150
200
250
300
350
400
450
500
0
200
400
600
800
1,000
1,200
1,400
1,600
1,800
1976 1979 1982 1985 1988 1991 1994 1997 2000 2003 2006 2009 2012
10,000 tons10,000 tons
Production volume of fish meal (right scale)
Total production volume of Peruvian anchoveta and Murphy's mackerel
0
2
4
6
8
10
12
14
16
2004 2005 2006 2007 2008 2009 2010 2011 2012 2013 2014
10,000 yen/ton March 2013:169,940 yen/ton
Year
February 2014:143,949 yen/ton
Feed cost 455 (67%) 568 (82%) 450 (66%) 435 (56%) 198 (56%)
Seed cost 129 (19%) 71 (10%) 67 (10%) 80 (10%) 36 (10%)
Others 96 (14%) 57 (8%) 166 (24%) 262 (34%) 122 (34%)
Total 680 (100%) 696 (100%) 683 (100%) 777 (100%) 356 (100%)
-
-
-
-
Stocking period
Culturing period 20 months or longer
March–April April–July
Conversion coefficient
(Corporate operators) (Indiv idual operators)
NorwegianAtlantic salmon
1.2
14 months or longer
Year-round
Yellowtail
(Indiv idual operators)
24 months or longer
2.8 2.7
Red sea bream
Prod
uctio
n co
st p
erkg
(yen
)
Coho salmon
1.5
5 months or longer
November(Corporate operators)
- 7 -
(Differences in the business management of yellowtail aquaculture and red sea bream aquaculture in recent years) ○ Both fish species have a cost structure where the feed and seed costs account for a large proportion of the total
cost. The profit margin is structurally narrow, so a fall in the unit price directly leads to a price below cost. ○ Meanwhile, the business management statuses of yellowtail aquaculture and red sea bream aquaculture have
been contrastive in recent years. Yellowtail aquaculture has continued to be in the red due to a drop in the unit price associated with a large production volume, while red sea bream aquaculture has turned into the black due to a rise in the unit price associated with a decline in the production volume.
(Comparison of fish aquaculture in Japan and Atlantic salmon aquaculture in Norway) ○ Comparing yellowtail, red sea bream, and coho salmon, which are the major cultured fish species in Japan, and
Atlantic salmon in Norway, the Norwegian Atlantic salmon has more advantageous characteristics in terms of the conversion coefficient, aquaculture period and stocking period, which also are reflected in business management.
(Trends of Fish Meal Prices and Countermeasures) ○ Fish meal, which is the main ingredient of compound feed for aquaculture, is mostly imported. Since fish meal is
made of mass-caught migrating fish such as anchovy, the resource level of which changes dramatically, its production volume fluctuates considerably in line with such changes. Fish meal is not only used for fish aquaculture but also for pig farming and poultry farming, and its price has risen due to global demand growth in recent years.
○ Since FY2010, a project for building a safety net for fishery business management has been implemented whereby a fisher and the national government contribute funds in advance at a fixed percentage, and when the price of compound feed rises beyond a specific level, a subsidy is provided to the fisher from that reserve. The participation rate is 64% and the number of participants is 749 (as of the end of March 2014).
[Comparison between yellowtail, red sea bream, coho salmon and Norwegian Atlantic salmon]
Source: Compiled by Fisheries Agency based on MAFF, Annual Statistics on Fishery and Aquaculture Production and Statistical Survey on Fishery Management, Marine Harvest, Salmon Farming Industry Handbook 2013, etc.
[Changes in the import price of fish meal]
Source: Compiled by the Fisheries Agency based on Ministry of Finance, Trade Statistics
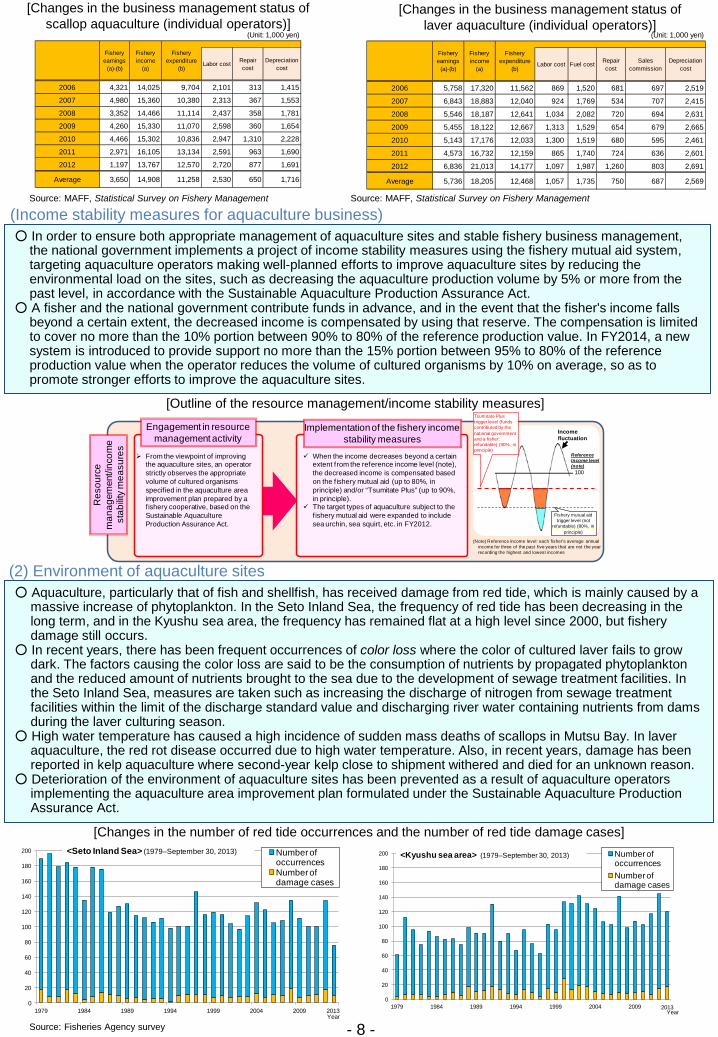
(Business management status and the cost structure of scallop and laver aquaculture) ○ In scallop aquaculture (hanging culture), the cost for the work to ear-hang the scallops that were in nets and the
work to detach them from the lines and the cost for the machine to hang the scallops deep under the sea are large. Indeed, the cost for labor and machines including fishing vessels (repair cost and depreciation cost) accounts for around 40% of the total cost. Although fishery earnings have remained in surplus, they have been declining every year.
○ In laver aquaculture, aquaculture operators process the harvested laver to a certain extent before selling them. Therefore, the fuel cost, repair cost and depreciation cost for machines, such as large drying machines required for processing, constitute 42% of the total cost. The repair cost has been on an increase, suggesting that operators are inclined to use existing machines for a long period of time while repairing them as needed. Fishery earnings are in the black.
[Changes in the total production volume of Peruvian anchoveta and Murphy's mackerel in Peru and Chile and
the production volume of fish meal]
Source: FAO, Fishstat (Capture production, Commodities production and trade)
0
20
40
60
80
100
120
140
160
180
200
1979 1984 1989 1994 1999 2004 2009
Number of occurrencesNumber of damage cases
<Seto Inland Sea> (1979–September 30, 2013)
2013Year
Res
ourc
e m
anag
emen
t/inc
ome
stab
ility
mea
sure
s
Implementation of the fishery income stability measures
Tsumitate Plus trigger level (funds contributed by the national government and a fisher; refundable) (90%, in principle)
Income fluctuation
100
Reference Income level (note)
(Note) Reference income level: each fisher’s average annual income for three of the past five years that are not the year recording the highest and lowest incomes
When the income decreases beyond a certain extent from the reference income level (note), the decreased income is compensated based on the fishery mutual aid (up to 80%, in principle) and/or “Tsumitate Plus” (up to 90%, in principle).
The target types of aquaculture subject to the fishery mutual aid were expanded to include sea urchin, sea squirt, etc. in FY2012.
From the viewpoint of improving the aquaculture sites, an operator strictly observes the appropriate volume of cultured organisms specified in the aquaculture area improvement plan prepared by a fishery cooperative, based on the Sustainable Aquaculture Production Assurance Act.
Engagement in resource management activity
Fishery mutual aid trigger level (not
refundable) (80%, in principle)
- 8 -
(Income stability measures for aquaculture business) ○ In order to ensure both appropriate management of aquaculture sites and stable fishery business management,
the national government implements a project of income stability measures using the fishery mutual aid system, targeting aquaculture operators making well-planned efforts to improve aquaculture sites by reducing the environmental load on the sites, such as decreasing the aquaculture production volume by 5% or more from the past level, in accordance with the Sustainable Aquaculture Production Assurance Act.
○ A fisher and the national government contribute funds in advance, and in the event that the fisher's income falls beyond a certain extent, the decreased income is compensated by using that reserve. The compensation is limited to cover no more than the 10% portion between 90% to 80% of the reference production value. In FY2014, a new system is introduced to provide support no more than the 15% portion between 95% to 80% of the reference production value when the operator reduces the volume of cultured organisms by 10% on average, so as to promote stronger efforts to improve the aquaculture sites.
[Outline of the resource management/income stability measures]
(2) Environment of aquaculture sites ○ Aquaculture, particularly that of fish and shellfish, has received damage from red tide, which is mainly caused by a
massive increase of phytoplankton. In the Seto Inland Sea, the frequency of red tide has been decreasing in the long term, and in the Kyushu sea area, the frequency has remained flat at a high level since 2000, but fishery damage still occurs.
○ In recent years, there has been frequent occurrences of color loss where the color of cultured laver fails to grow dark. The factors causing the color loss are said to be the consumption of nutrients by propagated phytoplankton and the reduced amount of nutrients brought to the sea due to the development of sewage treatment facilities. In the Seto Inland Sea, measures are taken such as increasing the discharge of nitrogen from sewage treatment facilities within the limit of the discharge standard value and discharging river water containing nutrients from dams during the laver culturing season.
○ High water temperature has caused a high incidence of sudden mass deaths of scallops in Mutsu Bay. In laver aquaculture, the red rot disease occurred due to high water temperature. Also, in recent years, damage has been reported in kelp aquaculture where second-year kelp close to shipment withered and died for an unknown reason.
○ Deterioration of the environment of aquaculture sites has been prevented as a result of aquaculture operators implementing the aquaculture area improvement plan formulated under the Sustainable Aquaculture Production Assurance Act.
[Changes in the business management status of scallop aquaculture (individual operators)]
[Changes in the business management status of laver aquaculture (individual operators)]
Source: MAFF, Statistical Survey on Fishery Management
[Changes in the number of red tide occurrences and the number of red tide damage cases]
(Unit: 1,000 yen)
Labor cost Repaircost
Depreciationcost
2006 4,321 14,025 9,704 2,101 313 1,415
2007 4,980 15,360 10,380 2,313 367 1,553
2008 3,352 14,466 11,114 2,437 358 1,781
2009 4,260 15,330 11,070 2,598 360 1,654
2010 4,466 15,302 10,836 2,947 1,310 2,228
2011 2,971 16,105 13,134 2,591 963 1,690
2012 1,197 13,767 12,570 2,720 877 1,691
Average 3,650 14,908 11,258 2,530 650 1,716
Fisheryearnings
(a)-(b)
Fisheryincome
(a)
Fisheryexpenditure
(b)
Source: MAFF, Statistical Survey on Fishery Management
(Unit: 1,000 yen)
Labor cost Fuel cost Repaircost
Salescommission
Depreciationcost
2006 5,758 17,320 11,562 869 1,520 681 697 2,519
2007 6,843 18,883 12,040 924 1,769 534 707 2,415
2008 5,546 18,187 12,641 1,034 2,082 720 694 2,631
2009 5,455 18,122 12,667 1,313 1,529 654 679 2,665
2010 5,143 17,176 12,033 1,300 1,519 680 595 2,461
2011 4,573 16,732 12,159 865 1,740 724 636 2,601
2012 6,836 21,013 14,177 1,097 1,987 1,260 803 2,691
Average 5,736 18,205 12,468 1,057 1,735 750 687 2,569
Fisheryincome
(a)
Fisheryexpenditure
(b)
Fisheryearnings
(a)-(b)
0
20
40
60
80
100
120
140
160
180
200
1979 1984 1989 1994 1999 2004 2009
Number of occurrencesNumber of damage cases
<Kyushu sea area> (1979–September 30, 2013)
2013Year
Source: Fisheries Agency survey
24.4 22.5
10.1
27.5 22.2
11.4
24.7
9.2 9.5 9.0 5.2
1.6 2.2
8.7
1.7
2.9
10.3
4.2
10.7 12.5
6.9
7.4
16 25
66
27 36
78
38
82 87
215
248
0
50
100
150
200
250
300
0.0
5.0
10.0
15.0
20.0
25.0
30.0
35.0
2003 2004 2005 2006 2007 2008 2009 2010 2011 2012 2013 2014
輸入量
採捕量
平均価格
Import volume
Catch volume
Average price (right scale)
10,000 yen/kg
26.0 24.7
18.8
29.2
25.1
21.7
28.9
19.922.0
15.9
12.6
Tons
2003 2004 2005 2006 2007 2008 2009 2010 2011 2012 2013 2014
- 9 -
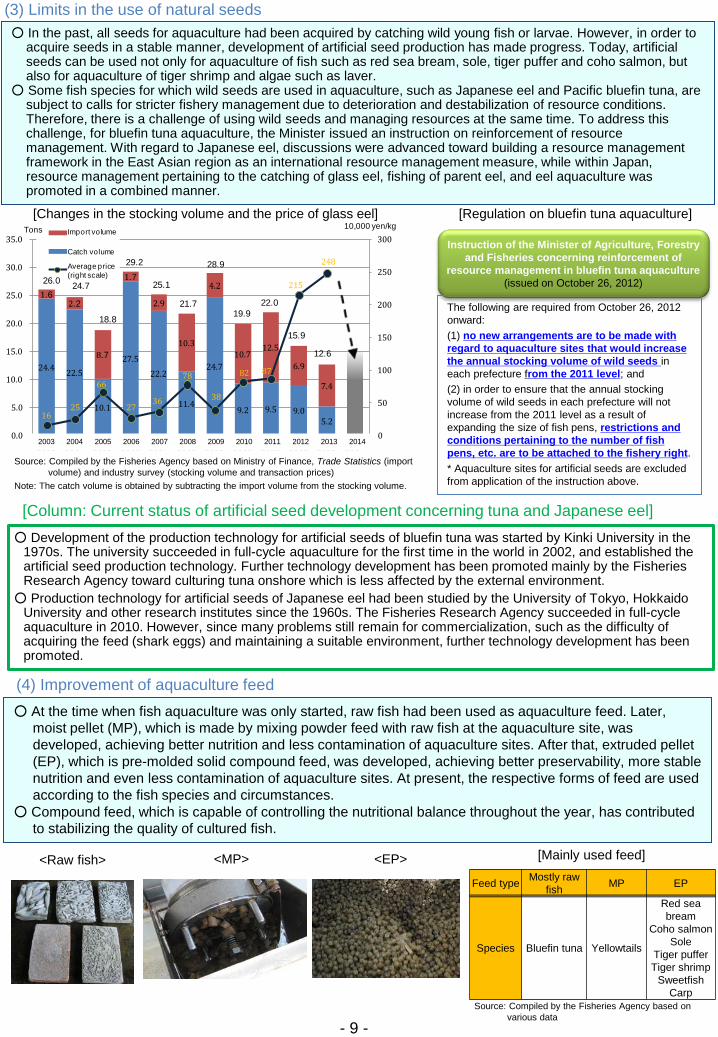
(3) Limits in the use of natural seeds ○ In the past, all seeds for aquaculture had been acquired by catching wild young fish or larvae. However, in order to
acquire seeds in a stable manner, development of artificial seed production has made progress. Today, artificial seeds can be used not only for aquaculture of fish such as red sea bream, sole, tiger puffer and coho salmon, but also for aquaculture of tiger shrimp and algae such as laver.
○ Some fish species for which wild seeds are used in aquaculture, such as Japanese eel and Pacific bluefin tuna, are subject to calls for stricter fishery management due to deterioration and destabilization of resource conditions. Therefore, there is a challenge of using wild seeds and managing resources at the same time. To address this challenge, for bluefin tuna aquaculture, the Minister issued an instruction on reinforcement of resource management. With regard to Japanese eel, discussions were advanced toward building a resource management framework in the East Asian region as an international resource management measure, while within Japan, resource management pertaining to the catching of glass eel, fishing of parent eel, and eel aquaculture was promoted in a combined manner.
○ Development of the production technology for artificial seeds of bluefin tuna was started by Kinki University in the 1970s. The university succeeded in full-cycle aquaculture for the first time in the world in 2002, and established the artificial seed production technology. Further technology development has been promoted mainly by the Fisheries Research Agency toward culturing tuna onshore which is less affected by the external environment.
○ Production technology for artificial seeds of Japanese eel had been studied by the University of Tokyo, Hokkaido University and other research institutes since the 1960s. The Fisheries Research Agency succeeded in full-cycle aquaculture in 2010. However, since many problems still remain for commercialization, such as the difficulty of acquiring the feed (shark eggs) and maintaining a suitable environment, further technology development has been promoted.
[Column: Current status of artificial seed development concerning tuna and Japanese eel]
[Regulation on bluefin tuna aquaculture] [Changes in the stocking volume and the price of glass eel]
○ At the time when fish aquaculture was only started, raw fish had been used as aquaculture feed. Later, moist pellet (MP), which is made by mixing powder feed with raw fish at the aquaculture site, was developed, achieving better nutrition and less contamination of aquaculture sites. After that, extruded pellet (EP), which is pre-molded solid compound feed, was developed, achieving better preservability, more stable nutrition and even less contamination of aquaculture sites. At present, the respective forms of feed are used according to the fish species and circumstances.
○ Compound feed, which is capable of controlling the nutritional balance throughout the year, has contributed to stabilizing the quality of cultured fish.
(4) Improvement of aquaculture feed
[Mainly used feed] <Raw fish> <MP> <EP>
Source: Compiled by the Fisheries Agency based on various data
Instruction of the Minister of Agriculture, Forestry and Fisheries concerning reinforcement of
resource management in bluefin tuna aquaculture (issued on October 26, 2012)
The following are required from October 26, 2012 onward: (1) no new arrangements are to be made with regard to aquaculture sites that would increase the annual stocking volume of wild seeds in each prefecture from the 2011 level; and (2) in order to ensure that the annual stocking volume of wild seeds in each prefecture will not increase from the 2011 level as a result of expanding the size of fish pens, restrictions and conditions pertaining to the number of fish pens, etc. are to be attached to the fishery right. * Aquaculture sites for artificial seeds are excluded from application of the instruction above.
Feed type Mostly raw fish MP EP
Species Bluefin tuna Yellowtails
Red sea bream
Coho salmon Sole
Tiger puffer Tiger shrimp
Sweetfish Carp
Source: Compiled by the Fisheries Agency based on Ministry of Finance, Trade Statistics (import volume) and industry survey (stocking volume and transaction prices)
Note: The catch volume is obtained by subtracting the import volume from the stocking volume.
0
2
4
6
8
10
12
0
50
100
150
200
250
300
350
400
1984 1987 1990 1993 1996 1999 2002 2005 2008
100 million yen10,000 f ish Estimated value of macrolide antibiotics used (right scale)
Estimated value of damage f rom streptococcosis
(right scale)
Year
Number of f ish vaccinated against
streptococcosis
- 10 -
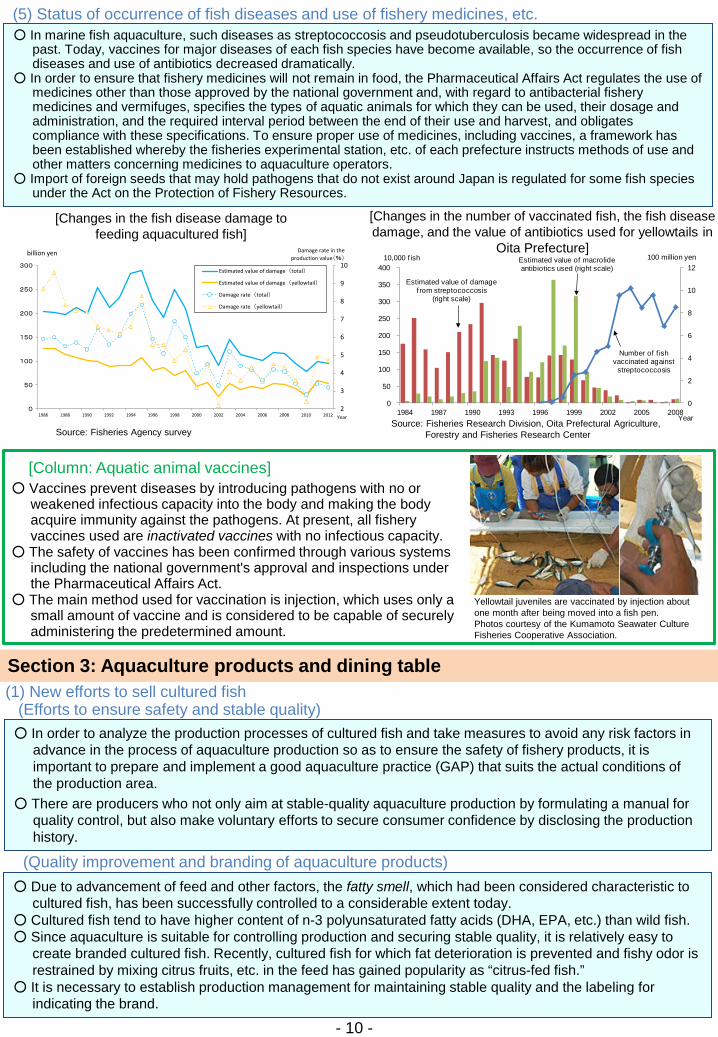
○ In marine fish aquaculture, such diseases as streptococcosis and pseudotuberculosis became widespread in the past. Today, vaccines for major diseases of each fish species have become available, so the occurrence of fish diseases and use of antibiotics decreased dramatically.
○ In order to ensure that fishery medicines will not remain in food, the Pharmaceutical Affairs Act regulates the use of medicines other than those approved by the national government and, with regard to antibacterial fishery medicines and vermifuges, specifies the types of aquatic animals for which they can be used, their dosage and administration, and the required interval period between the end of their use and harvest, and obligates compliance with these specifications. To ensure proper use of medicines, including vaccines, a framework has been established whereby the fisheries experimental station, etc. of each prefecture instructs methods of use and other matters concerning medicines to aquaculture operators.
○ Import of foreign seeds that may hold pathogens that do not exist around Japan is regulated for some fish species under the Act on the Protection of Fishery Resources.
(5) Status of occurrence of fish diseases and use of fishery medicines, etc.
○ Vaccines prevent diseases by introducing pathogens with no or weakened infectious capacity into the body and making the body acquire immunity against the pathogens. At present, all fishery vaccines used are inactivated vaccines with no infectious capacity.
○ The safety of vaccines has been confirmed through various systems including the national government's approval and inspections under the Pharmaceutical Affairs Act.
○ The main method used for vaccination is injection, which uses only a small amount of vaccine and is considered to be capable of securely administering the predetermined amount.
[Column: Aquatic animal vaccines]
Source: Fisheries Research Division, Oita Prefectural Agriculture, Forestry and Fisheries Research Center
Yellowtail juveniles are vaccinated by injection about one month after being moved into a fish pen. Photos courtesy of the Kumamoto Seawater Culture Fisheries Cooperative Association.
Section 3: Aquaculture products and dining table (1) New efforts to sell cultured fish
○ In order to analyze the production processes of cultured fish and take measures to avoid any risk factors in advance in the process of aquaculture production so as to ensure the safety of fishery products, it is important to prepare and implement a good aquaculture practice (GAP) that suits the actual conditions of the production area.
○ There are producers who not only aim at stable-quality aquaculture production by formulating a manual for quality control, but also make voluntary efforts to secure consumer confidence by disclosing the production history.
(Efforts to ensure safety and stable quality)
[Changes in the fish disease damage to feeding aquacultured fish]
[Changes in the number of vaccinated fish, the fish disease damage, and the value of antibiotics used for yellowtails in
Oita Prefecture]
Source: Fisheries Agency survey
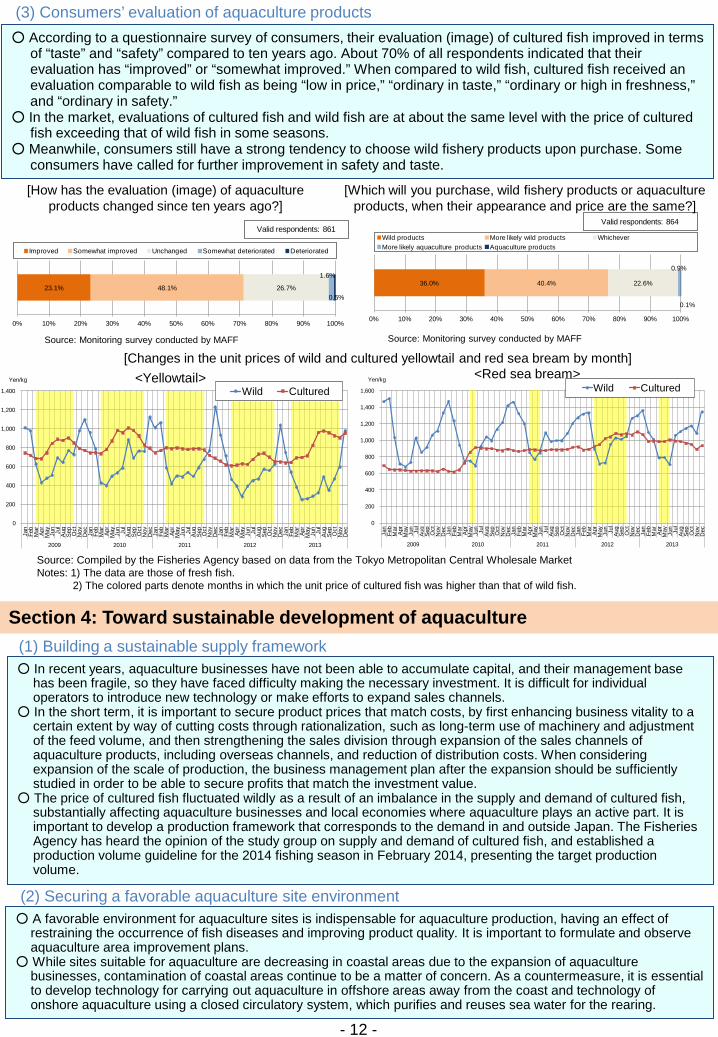
(Quality improvement and branding of aquaculture products) ○ Due to advancement of feed and other factors, the fatty smell, which had been considered characteristic to
cultured fish, has been successfully controlled to a considerable extent today. ○ Cultured fish tend to have higher content of n-3 polyunsaturated fatty acids (DHA, EPA, etc.) than wild fish. ○ Since aquaculture is suitable for controlling production and securing stable quality, it is relatively easy to
create branded cultured fish. Recently, cultured fish for which fat deterioration is prevented and fishy odor is restrained by mixing citrus fruits, etc. in the feed has gained popularity as “citrus-fed fish.”
○ It is necessary to establish production management for maintaining stable quality and the labeling for indicating the brand.
2
3
4
5
6
7
8
9
10
0
50
100
150
200
250
300
1986 1988 1990 1992 1994 1996 1998 2000 2002 2004 2006 2008 2010 2012
Damage rate in the production value(%)
billion yen
Estimated value of damage(total)
Estimated value of damage(yellowtail)
Damage rate(total)
Damage rate(yellowtail)
Year
- 11 -
(Promoting of export of aquaculture products) ○ In Japan’s aquaculture production, globally advanced new technologies such as the full-cycle aquaculture of
bluefin tuna and the “citrus-fed fish” have been applied one after another. Thus, Japan’s aquaculture has sufficient potential to cultivate the global market.
○ Careful marketing will be required, including studying the consumption trends in the respective countries. Also, when exporting fishery products, it is necessary to satisfy the hygiene control standards of the export destination countries and regions.
○ In order to expand the export of agricultural, forestry, fishery and food products, the national government has formulated the export strategy for agricultural, forestry, fishery and food products by country and by item. Based on this strategy, the government has provided support to enhance efforts toward promoting exports.
Source: Ministry of Education, Culture, Sports, Science and Technology, Standard Tables of Food Composition in Japan 2010
○ Aquaculture production holds an important position in fishery product supply. If aquaculture production were discontinued, salmons and trouts to be eaten raw and eel, oyster, shrimp, laver, etc. may disappear from the table, the price of tiger puffer, etc. may rise even higher, and stable supply of yellowtail, salmon, shrimp, scallop, etc. may become difficult.
(2) If aquaculture products disappear
[Content of n-3 polyunsaturated fatty acids]
[If aquaculture products disappear] <Assorted sushi platter (yellowtail, salmons
and trouts, shrimp, scallop, laver)> <Eel rice bowl (eel)>)
<Rice balls <laver>
○ Burimy Corporation and its affiliate company, Fukuyoshi Gyorui Co., Ltd., carry out full-cycle aquaculture of bluefin tuna, using seeds introduced from Kinki University.
○ In 2010, they started exporting cultured tuna as bluefin tuna that do not affect the ecosystems. Since people in the United States have very high interest in environmental conservation, they have a favorable view of full-cycle cultured bluefin tuna.
○ At present, about 20 to 30% of cultured bluefin tuna processed and produced by Burimy is exported to the United States. The company is also considering export to the EU and Asia, such as Hong Kong.
[Case example: Export of full-cycle cultured bluefin tuna (Burimy Corporation and Fukuyoshi Gyorui Co., Ltd. in Kumamoto Prefecture)]
○ The Japan Marine Aquaculture Association promotes export expansion of cultured fish through development of the export environment within Japan and dissemination of and awareness-raising on Japanese fishery products overseas.
○ The Association creates logo marks and posters to be used overseas, holds cultured fish seminars overseas, and conducts overseas marketing activities.
○ In July 2013, the Japan Council for Export Promotion of Cultured Fish was established as a framework where corporations and organizations engaged in export operations become members and where producers and exporters carry out export operations in an integrated manner.
[Case example: Establishment of the Japan Council for Export Promotion of Cultured Fish (the Japan Marine Aquaculture Association)]
Cultured fish seminar held in Moscow City. The master chef of a Japanese restaurant in Moscow City taught local chefs how to cook cultured yellowtail.
Logo mark for use overseas
3.353.63
1.16
2.05
0.510.85
0.460.82
0
0.5
1
1.5
2
2.5
3
3.5
4
Wild Cultured Wild Cultured Wild Cultured Wild Cultured
Yellowtail Red sea bream Sole Sweetfish
Con
tent
per
100
g o
f edi
ble
part
g
23.1% 48.1% 26.7%
1.6%
0.5%
0% 10% 20% 30% 40% 50% 60% 70% 80% 90% 100%
Improved Somewhat improved Unchanged Somewhat deteriorated Deteriorated
Valid respondents: 861
36.0% 40.4% 22.6%
0.9%
0.1%
0% 10% 20% 30% 40% 50% 60% 70% 80% 90% 100%
Wild products More likely wild products WhicheverMore likely aquaculture products Aquaculture products
Valid respondents: 864
0
200
400
600
800
1,000
1,200
1,400
Jan
Feb
Mar Apr
May Jun
Jul
Aug
Sep Oct
Nov
Dec Jan
Feb
Mar Apr
May Jun
Jul
Aug
Sep Oct
Nov
Dec Jan
Feb
Mar Apr
May Jun
Jul
Aug
Sep Oct
Nov
Dec Jan
Feb
Mar Apr
May Jun
Jul
Aug
Sep Oct
Nov
Dec Jan
Feb
Mar Apr
May Jun
Jul
Aug
Sep Oct
Nov
Dec
2009 2010 2011 2012 2013
Yen/kg
Wild Cultured
0
200
400
600
800
1,000
1,200
1,400
1,600 Ja
nFe
bM
ar Apr
May Jun
Jul
Aug
Sep Oct
Nov
Dec Jan
Feb
Mar Apr
May Jun
Jul
Aug
Sep Oct
Nov
Dec Jan
Feb
Mar Apr
May Jun
Jul
Aug
Sep Oct
Nov
Dec Jan
Feb
Mar Apr
May Jun
Jul
Aug
Sep Oct
Nov
Dec Jan
Feb
Mar Apr
May Jun
Jul
Aug
Sep Oct
Nov
Dec
2009 2010 2011 2012 2013
Yen/kg
Wild Cultured
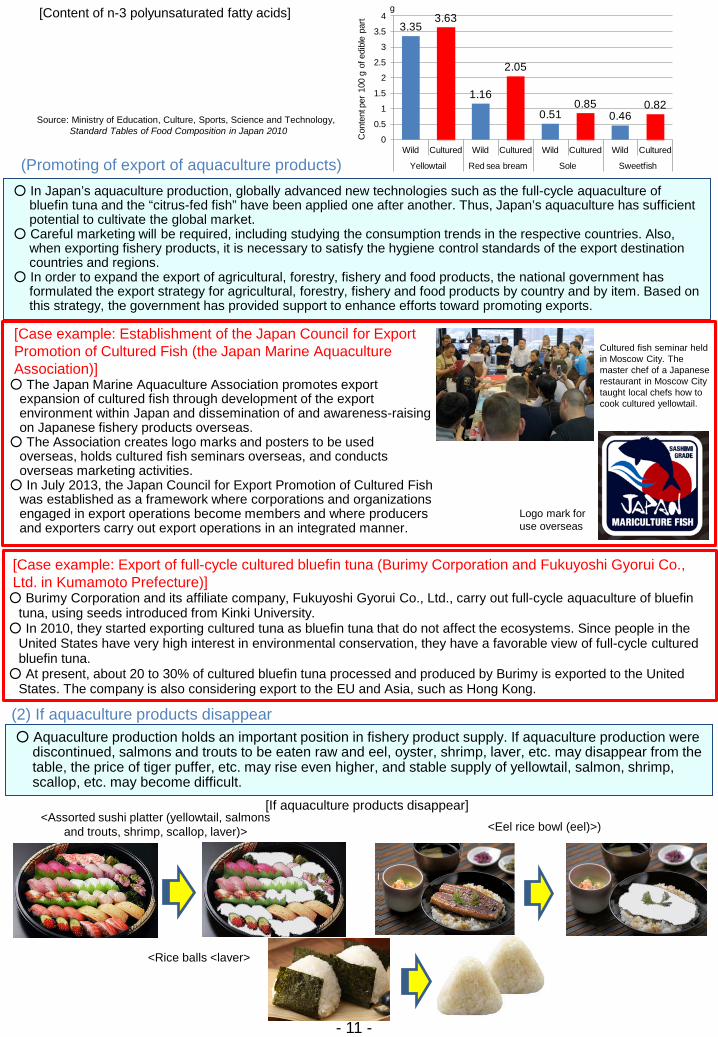
○ According to a questionnaire survey of consumers, their evaluation (image) of cultured fish improved in terms of “taste” and “safety” compared to ten years ago. About 70% of all respondents indicated that their evaluation has “improved” or “somewhat improved.” When compared to wild fish, cultured fish received an evaluation comparable to wild fish as being “low in price,” “ordinary in taste,” “ordinary or high in freshness,” and “ordinary in safety.”
○ In the market, evaluations of cultured fish and wild fish are at about the same level with the price of cultured fish exceeding that of wild fish in some seasons.
○ Meanwhile, consumers still have a strong tendency to choose wild fishery products upon purchase. Some consumers have called for further improvement in safety and taste.
(3) Consumers’ evaluation of aquaculture products
[Changes in the unit prices of wild and cultured yellowtail and red sea bream by month]
Source: Compiled by the Fisheries Agency based on data from the Tokyo Metropolitan Central Wholesale Market Notes: 1) The data are those of fresh fish. 2) The colored parts denote months in which the unit price of cultured fish was higher than that of wild fish.
<Yellowtail> <Red sea bream>
Section 4: Toward sustainable development of aquaculture (1) Building a sustainable supply framework ○ In recent years, aquaculture businesses have not been able to accumulate capital, and their management base
has been fragile, so they have faced difficulty making the necessary investment. It is difficult for individual operators to introduce new technology or make efforts to expand sales channels.
○ In the short term, it is important to secure product prices that match costs, by first enhancing business vitality to a certain extent by way of cutting costs through rationalization, such as long-term use of machinery and adjustment of the feed volume, and then strengthening the sales division through expansion of the sales channels of aquaculture products, including overseas channels, and reduction of distribution costs. When considering expansion of the scale of production, the business management plan after the expansion should be sufficiently studied in order to be able to secure profits that match the investment value.
○ The price of cultured fish fluctuated wildly as a result of an imbalance in the supply and demand of cultured fish, substantially affecting aquaculture businesses and local economies where aquaculture plays an active part. It is important to develop a production framework that corresponds to the demand in and outside Japan. The Fisheries Agency has heard the opinion of the study group on supply and demand of cultured fish, and established a production volume guideline for the 2014 fishing season in February 2014, presenting the target production volume.
- 12 -
○ A favorable environment for aquaculture sites is indispensable for aquaculture production, having an effect of restraining the occurrence of fish diseases and improving product quality. It is important to formulate and observe aquaculture area improvement plans.
○ While sites suitable for aquaculture are decreasing in coastal areas due to the expansion of aquaculture businesses, contamination of coastal areas continue to be a matter of concern. As a countermeasure, it is essential to develop technology for carrying out aquaculture in offshore areas away from the coast and technology of onshore aquaculture using a closed circulatory system, which purifies and reuses sea water for the rearing.
(2) Securing a favorable aquaculture site environment
[How has the evaluation (image) of aquaculture products changed since ten years ago?]
Source: Monitoring survey conducted by MAFF
[Which will you purchase, wild fishery products or aquaculture products, when their appearance and price are the same?]
Source: Monitoring survey conducted by MAFF
- 13 -
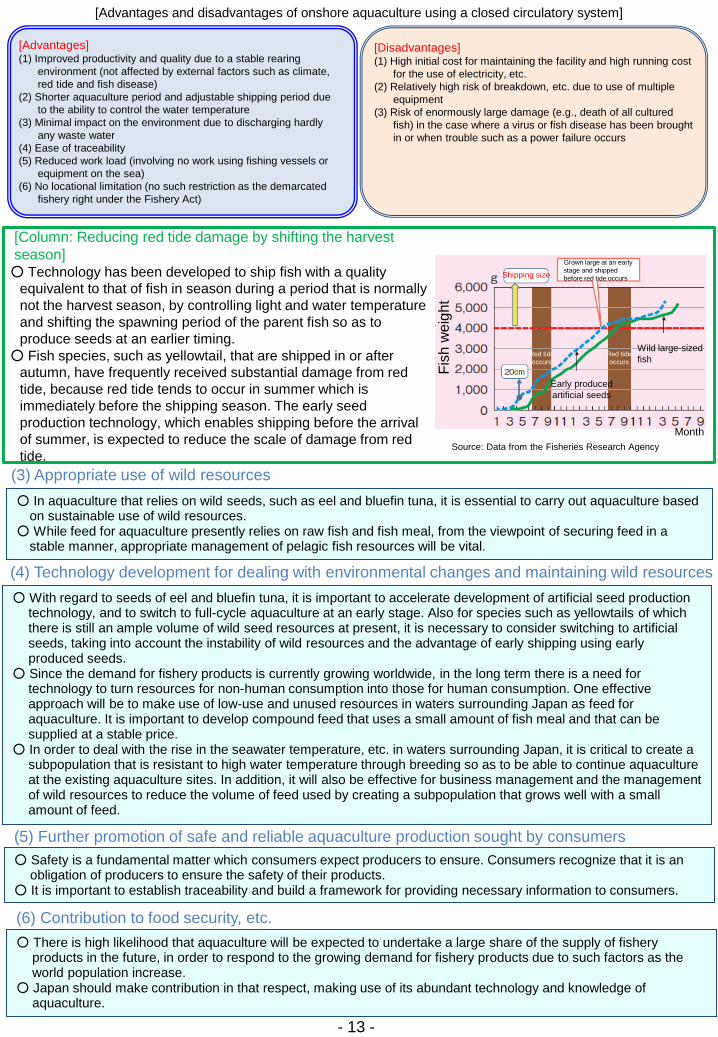
○ Technology has been developed to ship fish with a quality equivalent to that of fish in season during a period that is normally not the harvest season, by controlling light and water temperature and shifting the spawning period of the parent fish so as to produce seeds at an earlier timing.
○ Fish species, such as yellowtail, that are shipped in or after autumn, have frequently received substantial damage from red tide, because red tide tends to occur in summer which is immediately before the shipping season. The early seed production technology, which enables shipping before the arrival of summer, is expected to reduce the scale of damage from red tide.
[Column: Reducing red tide damage by shifting the harvest season]
[Disadvantages] (1) High initial cost for maintaining the facility and high running cost
for the use of electricity, etc. (2) Relatively high risk of breakdown, etc. due to use of multiple
equipment (3) Risk of enormously large damage (e.g., death of all cultured
fish) in the case where a virus or fish disease has been brought in or when trouble such as a power failure occurs
[Advantages] (1) Improved productivity and quality due to a stable rearing
environment (not affected by external factors such as climate, red tide and fish disease)
(2) Shorter aquaculture period and adjustable shipping period due to the ability to control the water temperature
(3) Minimal impact on the environment due to discharging hardly any waste water
(4) Ease of traceability (5) Reduced work load (involving no work using fishing vessels or
equipment on the sea) (6) No locational limitation (no such restriction as the demarcated
fishery right under the Fishery Act)
[Advantages and disadvantages of onshore aquaculture using a closed circulatory system]
○ In aquaculture that relies on wild seeds, such as eel and bluefin tuna, it is essential to carry out aquaculture based on sustainable use of wild resources.
○ While feed for aquaculture presently relies on raw fish and fish meal, from the viewpoint of securing feed in a stable manner, appropriate management of pelagic fish resources will be vital.
(3) Appropriate use of wild resources
○ With regard to seeds of eel and bluefin tuna, it is important to accelerate development of artificial seed production technology, and to switch to full-cycle aquaculture at an early stage. Also for species such as yellowtails of which there is still an ample volume of wild seed resources at present, it is necessary to consider switching to artificial seeds, taking into account the instability of wild resources and the advantage of early shipping using early produced seeds.
○ Since the demand for fishery products is currently growing worldwide, in the long term there is a need for technology to turn resources for non-human consumption into those for human consumption. One effective approach will be to make use of low-use and unused resources in waters surrounding Japan as feed for aquaculture. It is important to develop compound feed that uses a small amount of fish meal and that can be supplied at a stable price.
○ In order to deal with the rise in the seawater temperature, etc. in waters surrounding Japan, it is critical to create a subpopulation that is resistant to high water temperature through breeding so as to be able to continue aquaculture at the existing aquaculture sites. In addition, it will also be effective for business management and the management of wild resources to reduce the volume of feed used by creating a subpopulation that grows well with a small amount of feed.
(4) Technology development for dealing with environmental changes and maintaining wild resources
○ Safety is a fundamental matter which consumers expect producers to ensure. Consumers recognize that it is an obligation of producers to ensure the safety of their products.
○ It is important to establish traceability and build a framework for providing necessary information to consumers.
(5) Further promotion of safe and reliable aquaculture production sought by consumers
Source: Data from the Fisheries Research Agency
○ There is high likelihood that aquaculture will be expected to undertake a large share of the supply of fishery products in the future, in order to respond to the growing demand for fishery products due to such factors as the world population increase.
○ Japan should make contribution in that respect, making use of its abundant technology and knowledge of aquaculture.
(6) Contribution to food security, etc.
Fish
wei
ght
Month
Early produced artificial seeds
Wild large-sized fish
Shipping size Grown large at an early stage and shipped before red tide occurs
Red tide occurs
Red tide occurs
AnchovyAbout 770,000
tons(About
410,000 tons)
MackerelAbout 140,000
tons(Abou 424,000
tons)
SauryAbout 44,000
tons(About
242,000 tons)
Krill, Alaska pollack,sardine,
Japanese common squid About 382,000
tons(About
615,000 tons)
Copepods, etc.
About 294,000 tons
(No data)
Amount of predation
About 1.63 million tons
0%
20%
40%
60%
80%
100%
1995 1997 1999 2001 2003 2005 2007 2009 2011 2013
Low
Lower-mediumMedium
Upper-medium
High
FY
Chapter II: Review of Japan’s Fisheries since FY2012
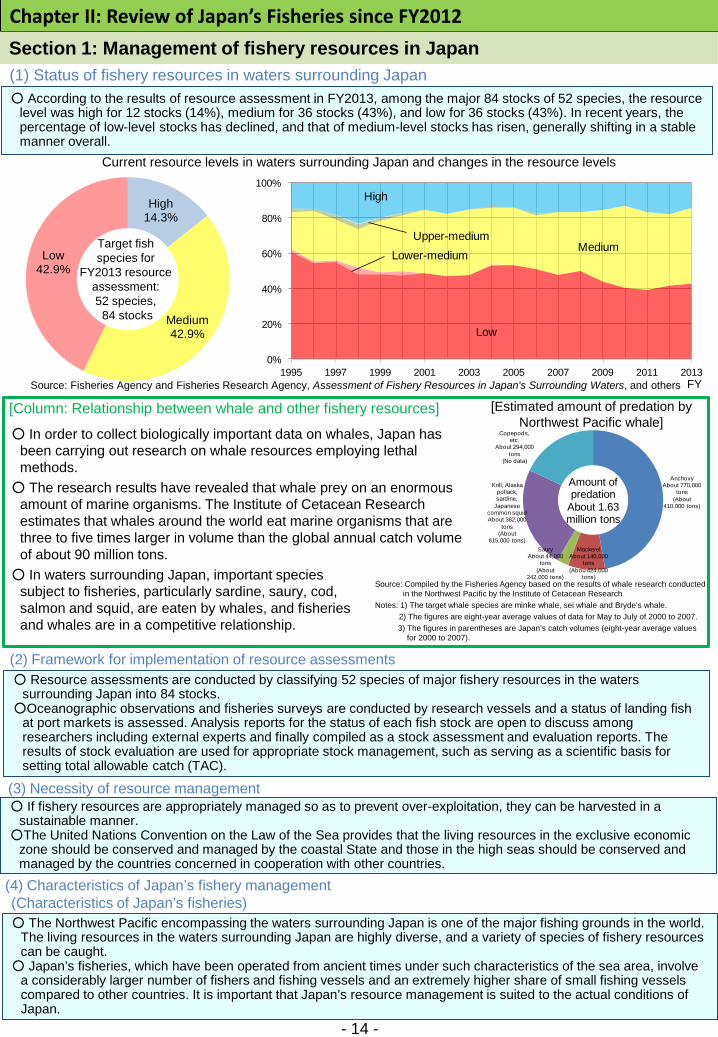
○ According to the results of resource assessment in FY2013, among the major 84 stocks of 52 species, the resource level was high for 12 stocks (14%), medium for 36 stocks (43%), and low for 36 stocks (43%). In recent years, the percentage of low-level stocks has declined, and that of medium-level stocks has risen, generally shifting in a stable manner overall.
Section 1: Management of fishery resources in Japan (1) Status of fishery resources in waters surrounding Japan
Current resource levels in waters surrounding Japan and changes in the resource levels
○ Resource assessments are conducted by classifying 52 species of major fishery resources in the waters surrounding Japan into 84 stocks.
○Oceanographic observations and fisheries surveys are conducted by research vessels and a status of landing fish at port markets is assessed. Analysis reports for the status of each fish stock are open to discuss among researchers including external experts and finally compiled as a stock assessment and evaluation reports. The results of stock evaluation are used for appropriate stock management, such as serving as a scientific basis for setting total allowable catch (TAC).
(2) Framework for implementation of resource assessments
- 14 -
○ If fishery resources are appropriately managed so as to prevent over-exploitation, they can be harvested in a sustainable manner.
○The United Nations Convention on the Law of the Sea provides that the living resources in the exclusive economic zone should be conserved and managed by the coastal State and those in the high seas should be conserved and managed by the countries concerned in cooperation with other countries.
(3) Necessity of resource management
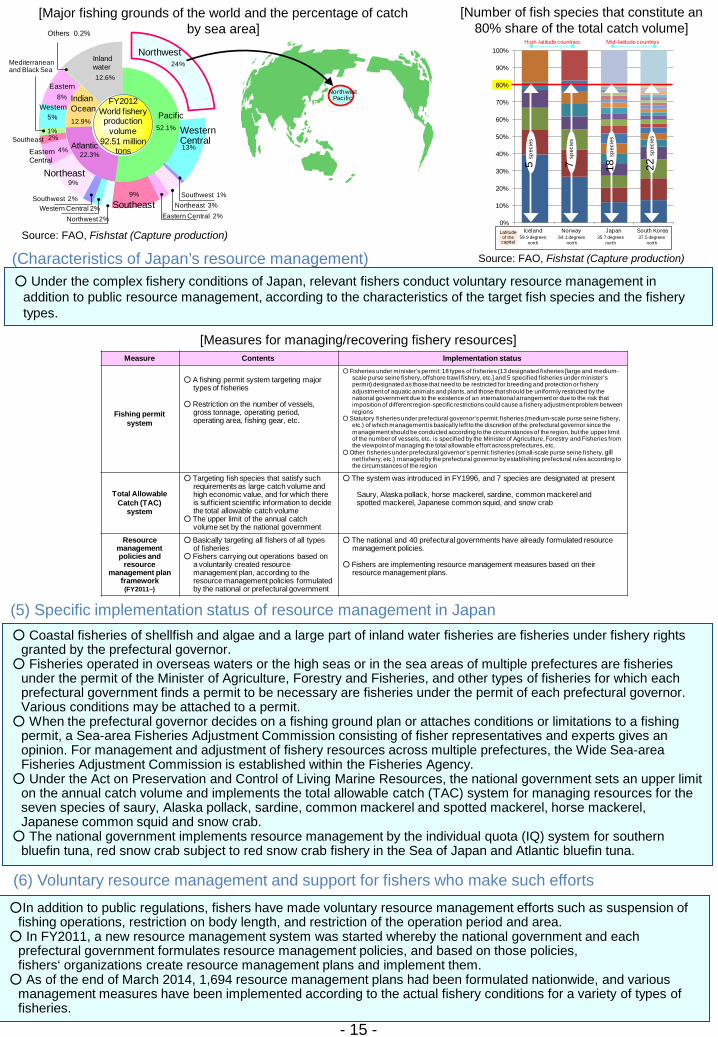
○ The Northwest Pacific encompassing the waters surrounding Japan is one of the major fishing grounds in the world. The living resources in the waters surrounding Japan are highly diverse, and a variety of species of fishery resources can be caught.
○ Japan’s fisheries, which have been operated from ancient times under such characteristics of the sea area, involve a considerably larger number of fishers and fishing vessels and an extremely higher share of small fishing vessels compared to other countries. It is important that Japan’s resource management is suited to the actual conditions of Japan.
(4) Characteristics of Japan’s fishery management (Characteristics of Japan’s fisheries)
Source: Fisheries Agency and Fisheries Research Agency, Assessment of Fishery Resources in Japan's Surrounding Waters, and others
○ In order to collect biologically important data on whales, Japan has been carrying out research on whale resources employing lethal methods.
○ The research results have revealed that whale prey on an enormous amount of marine organisms. The Institute of Cetacean Research estimates that whales around the world eat marine organisms that are three to five times larger in volume than the global annual catch volume of about 90 million tons.
○ In waters surrounding Japan, important species subject to fisheries, particularly sardine, saury, cod, salmon and squid, are eaten by whales, and fisheries and whales are in a competitive relationship.
[Column: Relationship between whale and other fishery resources]
Source: Compiled by the Fisheries Agency based on the results of whale research conducted in the Northwest Pacific by the Institute of Cetacean Research
Notes: 1) The target whale species are minke whale, sei whale and Bryde‘s whale. 2) The figures are eight-year average values of data for May to July of 2000 to 2007. 3) The figures in parentheses are Japan’s catch volumes (eight-year average values
for 2000 to 2007).
[Estimated amount of predation by Northwest Pacific whale]
High 14.3%
Medium 42.9%
Low 42.9%
Target fish species for
FY2013 resource assessment: 52 species, 84 stocks
52.1%
22.3%
12.9%
12.6%
24%
13%
9%
9%
4%
2%1%
5%
8% FY2012World fishery production
volume 92.51 million
tons
Northwest Pacific
Northwest 2%Western Central 2%
Southwest 2%
Southeast
Mediterranean and Black Sea
Others 0.2%
Western Central
Southwest 1%Northeast 3%
Eastern Central 2%Southeast
Northeast
Eastern Central
Western
Eastern
Inland water
Northwest
IndianOcean
Pacific
Atlantic
(Characteristics of Japan’s resource management) ○ Under the complex fishery conditions of Japan, relevant fishers conduct voluntary resource management in
addition to public resource management, according to the characteristics of the target fish species and the fishery types.
○ Coastal fisheries of shellfish and algae and a large part of inland water fisheries are fisheries under fishery rights granted by the prefectural governor.
○ Fisheries operated in overseas waters or the high seas or in the sea areas of multiple prefectures are fisheries under the permit of the Minister of Agriculture, Forestry and Fisheries, and other types of fisheries for which each prefectural government finds a permit to be necessary are fisheries under the permit of each prefectural governor. Various conditions may be attached to a permit.
○ When the prefectural governor decides on a fishing ground plan or attaches conditions or limitations to a fishing permit, a Sea-area Fisheries Adjustment Commission consisting of fisher representatives and experts gives an opinion. For management and adjustment of fishery resources across multiple prefectures, the Wide Sea-area Fisheries Adjustment Commission is established within the Fisheries Agency.
○ Under the Act on Preservation and Control of Living Marine Resources, the national government sets an upper limit on the annual catch volume and implements the total allowable catch (TAC) system for managing resources for the seven species of saury, Alaska pollack, sardine, common mackerel and spotted mackerel, horse mackerel, Japanese common squid and snow crab.
○ The national government implements resource management by the individual quota (IQ) system for southern bluefin tuna, red snow crab subject to red snow crab fishery in the Sea of Japan and Atlantic bluefin tuna.
(5) Specific implementation status of resource management in Japan
[Measures for managing/recovering fishery resources]
- 15 -
○In addition to public regulations, fishers have made voluntary resource management efforts such as suspension of fishing operations, restriction on body length, and restriction of the operation period and area.
○ In FY2011, a new resource management system was started whereby the national government and each prefectural government formulates resource management policies, and based on those policies, fishers‘ organizations create resource management plans and implement them.
○ As of the end of March 2014, 1,694 resource management plans had been formulated nationwide, and various management measures have been implemented according to the actual fishery conditions for a variety of types of fisheries.
(6) Voluntary resource management and support for fishers who make such efforts
[Major fishing grounds of the world and the percentage of catch by sea area]
Source: FAO, Fishstat (Capture production)
[Number of fish species that constitute an 80% share of the total catch volume]
Source: FAO, Fishstat (Capture production)
0%
10%
20%
30%
40%
50%
60%
70%
80%
90%
100%
アイスランド ノルウェー 日本 韓国59.9 degrees
north64.1 degrees
north35.7 degrees
north37.5 degrees
north
Latitude of the capital
High-latitude countries Mid-latitude countries
5 sp
ecie
s
18 sp
ecie
s
7 sp
ecie
s
22 sp
ecie
s
Iceland Norway Japan South Korea
Measure Contents Implementation status
Fishing permit system
○ A fishing permit system targeting major types of fisheries
○ Restriction on the number of vessels, gross tonnage, operating period, operating area, fishing gear, etc.
○Fisheries under minister’s permit: 18 types of fisheries (13 designated fisheries [large and medium-scale purse seine fishery, offshore trawl fishery, etc.] and 5 specified fisheries under minister’s permit) designated as those that need to be restricted for breeding and protection or fishery adjustment of aquatic animals and plants, and those that should be uniformly restricted by the national government due to the existence of an international arrangement or due to the risk that imposition of different region-specific restrictions could cause a fishery adjustment problem between regions
○Statutory fisheries under prefectural governor’s permit: fisheries (medium-scale purse seine fishery, etc.) of which management is basically left to the discretion of the prefectural governor since the management should be conducted according to the circumstances of the region, but the upper limit of the number of vessels, etc. is specified by the Minister of Agriculture, Forestry and Fisheries from the viewpoint of managing the total allowable effort across prefectures, etc.
○Other fisheries under prefectural governor’s permit: fisheries (small-scale purse seine fishery, grill net fishery, etc.) managed by the prefectural governor by establishing prefectural rules according to the circumstances of the region
Total Allowable Catch (TAC)
system
○ Targeting fish species that satisfy such requirements as large catch volume and high economic value, and for which there is sufficient scientific information to decide the total allowable catch volume
○ The upper limit of the annual catch volume set by the national government
○ The system was introduced in FY1996, and 7 species are designated at present
Saury, Alaska pollack, horse mackerel, sardine, common mackerel and spotted mackerel, Japanese common squid, and snow crab
Resource management policies and
resource management plan
framework(FY2011–)
○ Basically targeting all fishers of all types of fisheries
○ Fishers carrying out operations based on a voluntarily created resource management plan, according to the resource management policies formulated by the national or prefectural government
○ The national and 40 prefectural governments have already formulated resource management policies.
○ Fishers are implementing resource management measures based on their resource management plans.
gill
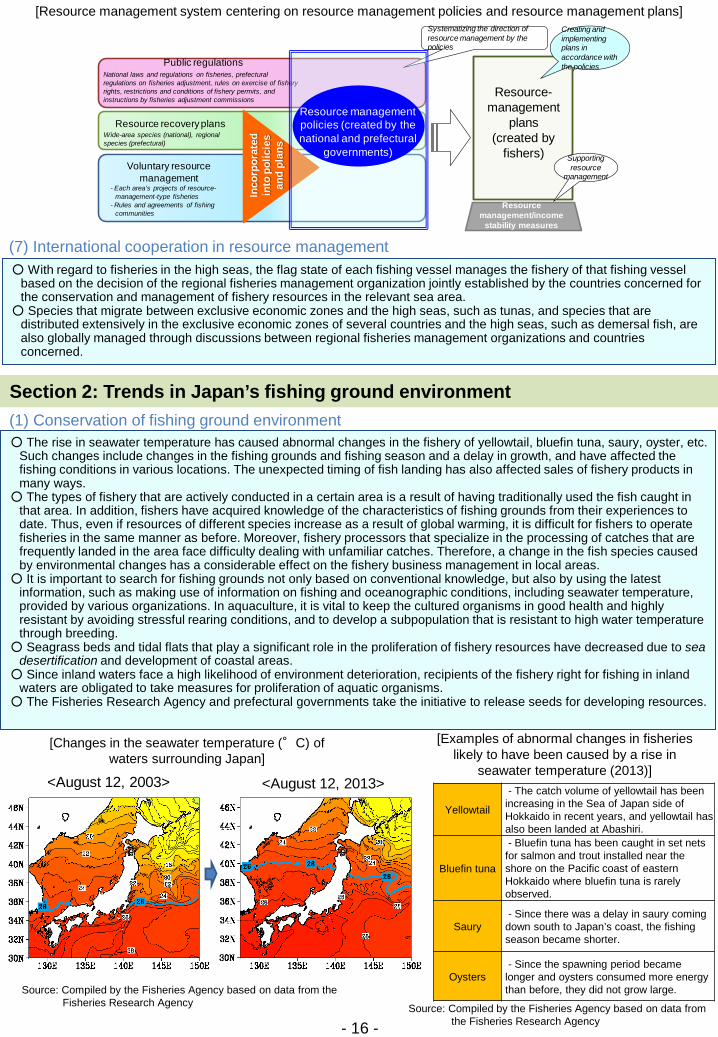
<August 12, 2003> <August 12, 2013>
Public regulations National laws and regulations on fisheries, prefectural regulations on fisheries adjustment, rules on exercise of fishery rights, restrictions and conditions of fishery permits, and instructions by fisheries adjustment commissions
Resource recovery plans Wide-area species (national), regional species (prefectural)
Voluntary resource management
- Each area’s projects of resource-management-type fisheries
- Rules and agreements of fishing communities
Systematizing the direction of resource management by the policies
Resource-management
plans (created by
fishers)
Creating and implementing plans in accordance with the policies
Inco
rpor
ated
in
to p
olic
ies
and
plan
s
Supporting resource
management
Resource management policies (created by the national and prefectural
governments)
Resource management/income
stability measures
Section 2: Trends in Japan’s fishing ground environment
○ The rise in seawater temperature has caused abnormal changes in the fishery of yellowtail, bluefin tuna, saury, oyster, etc. Such changes include changes in the fishing grounds and fishing season and a delay in growth, and have affected the fishing conditions in various locations. The unexpected timing of fish landing has also affected sales of fishery products in many ways.
○ The types of fishery that are actively conducted in a certain area is a result of having traditionally used the fish caught in that area. In addition, fishers have acquired knowledge of the characteristics of fishing grounds from their experiences to date. Thus, even if resources of different species increase as a result of global warming, it is difficult for fishers to operate fisheries in the same manner as before. Moreover, fishery processors that specialize in the processing of catches that are frequently landed in the area face difficulty dealing with unfamiliar catches. Therefore, a change in the fish species caused by environmental changes has a considerable effect on the fishery business management in local areas.
○ It is important to search for fishing grounds not only based on conventional knowledge, but also by using the latest information, such as making use of information on fishing and oceanographic conditions, including seawater temperature, provided by various organizations. In aquaculture, it is vital to keep the cultured organisms in good health and highly resistant by avoiding stressful rearing conditions, and to develop a subpopulation that is resistant to high water temperature through breeding.
○ Seagrass beds and tidal flats that play a significant role in the proliferation of fishery resources have decreased due to sea desertification and development of coastal areas.
○ Since inland waters face a high likelihood of environment deterioration, recipients of the fishery right for fishing in inland waters are obligated to take measures for proliferation of aquatic organisms.
○ The Fisheries Research Agency and prefectural governments take the initiative to release seeds for developing resources.
(1) Conservation of fishing ground environment
- 16 -
[Examples of abnormal changes in fisheries likely to have been caused by a rise in
seawater temperature (2013)]
Source: Compiled by the Fisheries Agency based on data from the Fisheries Research Agency
○ With regard to fisheries in the high seas, the flag state of each fishing vessel manages the fishery of that fishing vessel based on the decision of the regional fisheries management organization jointly established by the countries concerned for the conservation and management of fishery resources in the relevant sea area.
○ Species that migrate between exclusive economic zones and the high seas, such as tunas, and species that are distributed extensively in the exclusive economic zones of several countries and the high seas, such as demersal fish, are also globally managed through discussions between regional fisheries management organizations and countries concerned.
(7) International cooperation in resource management
[Changes in the seawater temperature (°C) of waters surrounding Japan]
[Resource management system centering on resource management policies and resource management plans]
Yellowtail
- The catch volume of yellowtail has been increasing in the Sea of Japan side of Hokkaido in recent years, and yellowtail has also been landed at Abashiri.
Bluefin tuna
- Bluefin tuna has been caught in set nets for salmon and trout installed near the shore on the Pacific coast of eastern Hokkaido where bluefin tuna is rarely observed.
Saury - Since there was a delay in saury coming down south to Japan’s coast, the fishing season became shorter.
Oysters - Since the spawning period became longer and oysters consumed more energy than before, they did not grow large.
Source: Compiled by the Fisheries Agency based on data from the Fisheries Research Agency
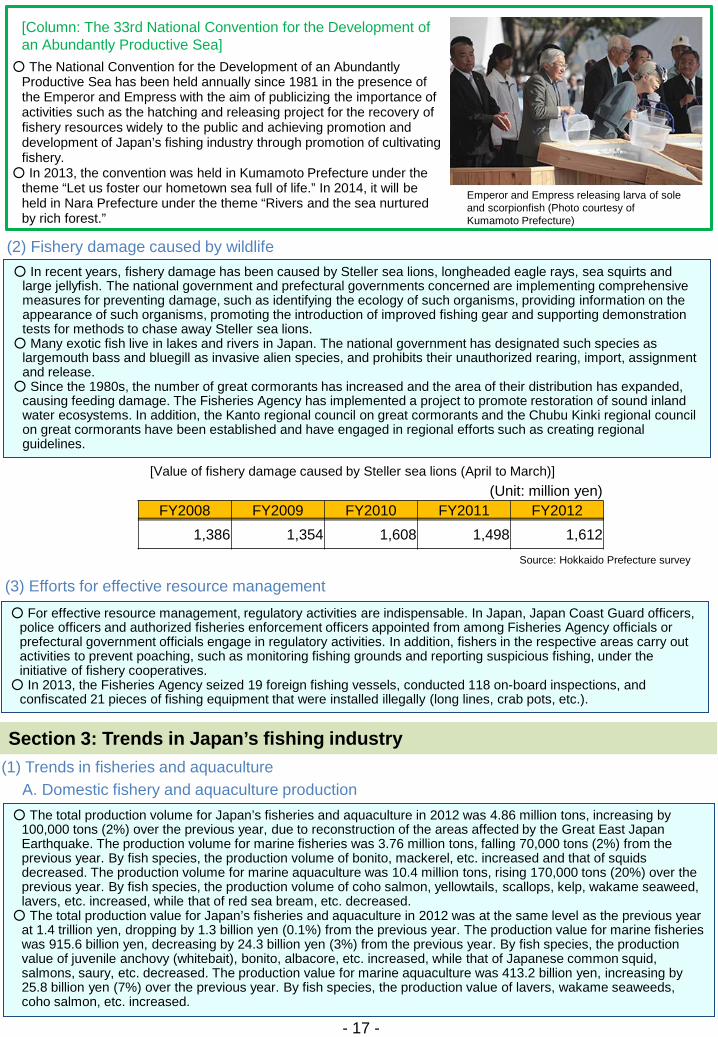
- 17 -
○ In recent years, fishery damage has been caused by Steller sea lions, longheaded eagle rays, sea squirts and large jellyfish. The national government and prefectural governments concerned are implementing comprehensive measures for preventing damage, such as identifying the ecology of such organisms, providing information on the appearance of such organisms, promoting the introduction of improved fishing gear and supporting demonstration tests for methods to chase away Steller sea lions.
○ Many exotic fish live in lakes and rivers in Japan. The national government has designated such species as largemouth bass and bluegill as invasive alien species, and prohibits their unauthorized rearing, import, assignment and release.
○ Since the 1980s, the number of great cormorants has increased and the area of their distribution has expanded, causing feeding damage. The Fisheries Agency has implemented a project to promote restoration of sound inland water ecosystems. In addition, the Kanto regional council on great cormorants and the Chubu Kinki regional council on great cormorants have been established and have engaged in regional efforts such as creating regional guidelines.
(2) Fishery damage caused by wildlife
○ For effective resource management, regulatory activities are indispensable. In Japan, Japan Coast Guard officers, police officers and authorized fisheries enforcement officers appointed from among Fisheries Agency officials or prefectural government officials engage in regulatory activities. In addition, fishers in the respective areas carry out activities to prevent poaching, such as monitoring fishing grounds and reporting suspicious fishing, under the initiative of fishery cooperatives.
○ In 2013, the Fisheries Agency seized 19 foreign fishing vessels, conducted 118 on-board inspections, and confiscated 21 pieces of fishing equipment that were installed illegally (long lines, crab pots, etc.).
(3) Efforts for effective resource management
Section 3: Trends in Japan’s fishing industry
○ The total production volume for Japan’s fisheries and aquaculture in 2012 was 4.86 million tons, increasing by 100,000 tons (2%) over the previous year, due to reconstruction of the areas affected by the Great East Japan Earthquake. The production volume for marine fisheries was 3.76 million tons, falling 70,000 tons (2%) from the previous year. By fish species, the production volume of bonito, mackerel, etc. increased and that of squids decreased. The production volume for marine aquaculture was 10.4 million tons, rising 170,000 tons (20%) over the previous year. By fish species, the production volume of coho salmon, yellowtails, scallops, kelp, wakame seaweed, lavers, etc. increased, while that of red sea bream, etc. decreased.
○ The total production value for Japan’s fisheries and aquaculture in 2012 was at the same level as the previous year at 1.4 trillion yen, dropping by 1.3 billion yen (0.1%) from the previous year. The production value for marine fisheries was 915.6 billion yen, decreasing by 24.3 billion yen (3%) from the previous year. By fish species, the production value of juvenile anchovy (whitebait), bonito, albacore, etc. increased, while that of Japanese common squid, salmons, saury, etc. decreased. The production value for marine aquaculture was 413.2 billion yen, increasing by 25.8 billion yen (7%) over the previous year. By fish species, the production value of lavers, wakame seaweeds, coho salmon, etc. increased.
(1) Trends in fisheries and aquaculture A. Domestic fishery and aquaculture production
[Value of fishery damage caused by Steller sea lions (April to March)]
Source: Hokkaido Prefecture survey
○ The National Convention for the Development of an Abundantly Productive Sea has been held annually since 1981 in the presence of the Emperor and Empress with the aim of publicizing the importance of activities such as the hatching and releasing project for the recovery of fishery resources widely to the public and achieving promotion and development of Japan’s fishing industry through promotion of cultivating fishery.
○ In 2013, the convention was held in Kumamoto Prefecture under the theme “Let us foster our hometown sea full of life.” In 2014, it will be held in Nara Prefecture under the theme “Rivers and the sea nurtured by rich forest.”
[Column: The 33rd National Convention for the Development of an Abundantly Productive Sea]
Emperor and Empress releasing larva of sole and scorpionfish (Photo courtesy of Kumamoto Prefecture)
(Unit: million yen) FY2008 FY2009 FY2010 FY2011 FY2012
1,386 1,354 1,608 1,498 1,612
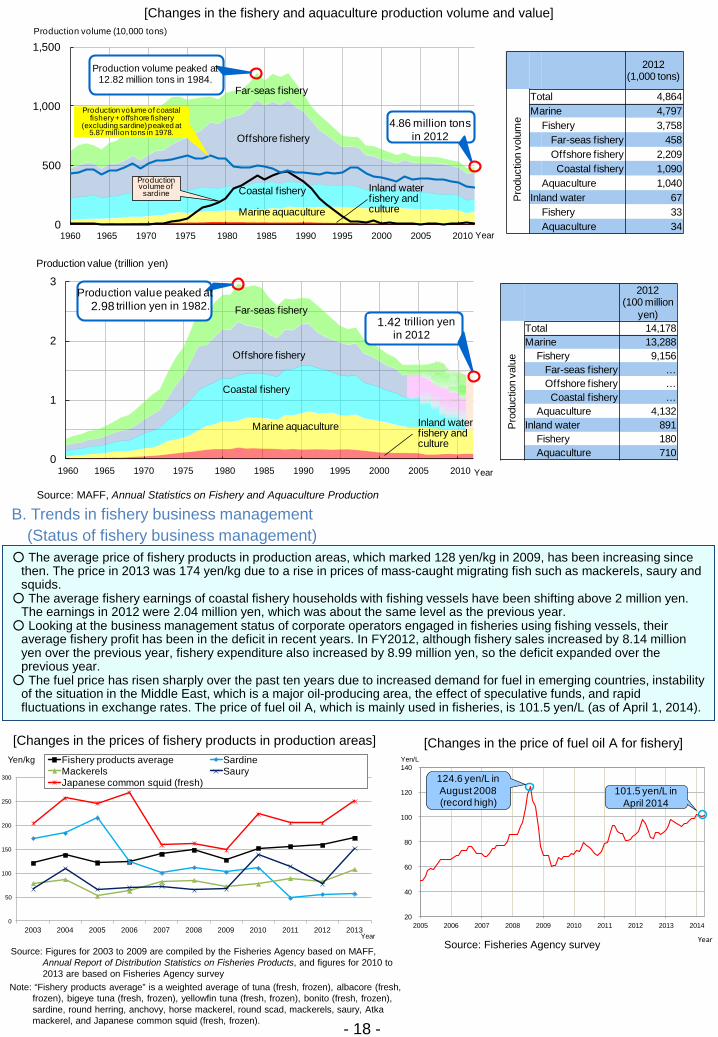
20
40
60
80
100
120
140
2005 2006 2007 2008 2009 2010 2011 2012 2013 2014
Yen/L
124.6 yen/L in August 2008 (record high)
101.5 yen/L in April 2014
Year
0
50
100
150
200
250
300
2003 2004 2005 2006 2007 2008 2009 2010 2011 2012 2013
Yen/kg Fishery products average SardineMackerels SauryJapanese common squid (fresh)
Year
0
500
1,000
1,500
昭和35
(1960)
40
(1965)
45
(1970)
50
(1975)
55
(1980)
60
(1985)
平成2
(1990)
7
(1995)
12
(2000)
17
(2005)
22
(2010)
Offshore fishery
Coastal fishery
Marine aquaculture
Inland waterfishery and culture
Production volume (10,000 tons)
Far-seas fishery
1960 1965 1970 1975 1980 1985 1990 1995 2000 2005 2010 Year
4.86 million tons in 2012
Production volume of sardine
Production volume of coastal fishery + offshore fishery
(excluding sardine) peaked at 5.87 million tons in 1978.
0
1
2
3
昭和35
(1960)
40
(1965)
45
(1970)
50
(1975)
55
(1980)
60
(1985)
平成2
(1990)
7
(1995)
12
(2000)
17
(2005)
22
(2010)
Production value (trillion yen)
1960 1965 1970 1975 1980 1985 1990 1995 2000 2005 2010 Year
Far-seas fishery
Offshore fishery
Coastal fishery
Marine aquaculture Inland waterfishery and culture
1.4178 trillion yen in 2012
Production value peaked at 2.9772 trillion yen in 1982.
Production volume peaked at 12.82 million tons in 1984.
2012(1,000 tons)
Total 4,864 Marine 4,797
Fishery 3,758 Far-seas fishery 458Offshore fishery 2,209 Coastal fishery 1,090
Aquaculture 1,040Inland water 67
Fishery 33Aquaculture 34
2012(100 million
yen)Total 14,178Marine 13,288
Fishery 9,156Far-seas fishery …Offshore fishery …Coastal fishery …
Aquaculture 4,132Inland water 891
Fishery 180Aquaculture 710
Pro
duct
ion
volu
me
Pro
duct
ion
valu
e
- 18 -
Source: MAFF, Annual Statistics on Fishery and Aquaculture Production
[Changes in the fishery and aquaculture production volume and value]
B. Trends in fishery business management
○ The average price of fishery products in production areas, which marked 128 yen/kg in 2009, has been increasing since then. The price in 2013 was 174 yen/kg due to a rise in prices of mass-caught migrating fish such as mackerels, saury and squids.
○ The average fishery earnings of coastal fishery households with fishing vessels have been shifting above 2 million yen. The earnings in 2012 were 2.04 million yen, which was about the same level as the previous year.
○ Looking at the business management status of corporate operators engaged in fisheries using fishing vessels, their average fishery profit has been in the deficit in recent years. In FY2012, although fishery sales increased by 8.14 million yen over the previous year, fishery expenditure also increased by 8.99 million yen, so the deficit expanded over the previous year.
○ The fuel price has risen sharply over the past ten years due to increased demand for fuel in emerging countries, instability of the situation in the Middle East, which is a major oil-producing area, the effect of speculative funds, and rapid fluctuations in exchange rates. The price of fuel oil A, which is mainly used in fisheries, is 101.5 yen/L (as of April 1, 2014).
(Status of fishery business management)
Source: Fisheries Agency survey Source: Figures for 2003 to 2009 are compiled by the Fisheries Agency based on MAFF,
Annual Report of Distribution Statistics on Fisheries Products, and figures for 2010 to 2013 are based on Fisheries Agency survey
Note: “Fishery products average” is a weighted average of tuna (fresh, frozen), albacore (fresh, frozen), bigeye tuna (fresh, frozen), yellowfin tuna (fresh, frozen), bonito (fresh, frozen), sardine, round herring, anchovy, horse mackerel, round scad, mackerels, saury, Atka mackerel, and Japanese common squid (fresh, frozen).
[Changes in the price of fuel oil A for fishery] [Changes in the prices of fishery products in production areas]
2.98 1.42
1960 1965 1970 1975 1980 1985 1990 1995 2000 2005 2010
1960 1965 1970 1975 1980 1985 1990 1995 2000 2005 2010
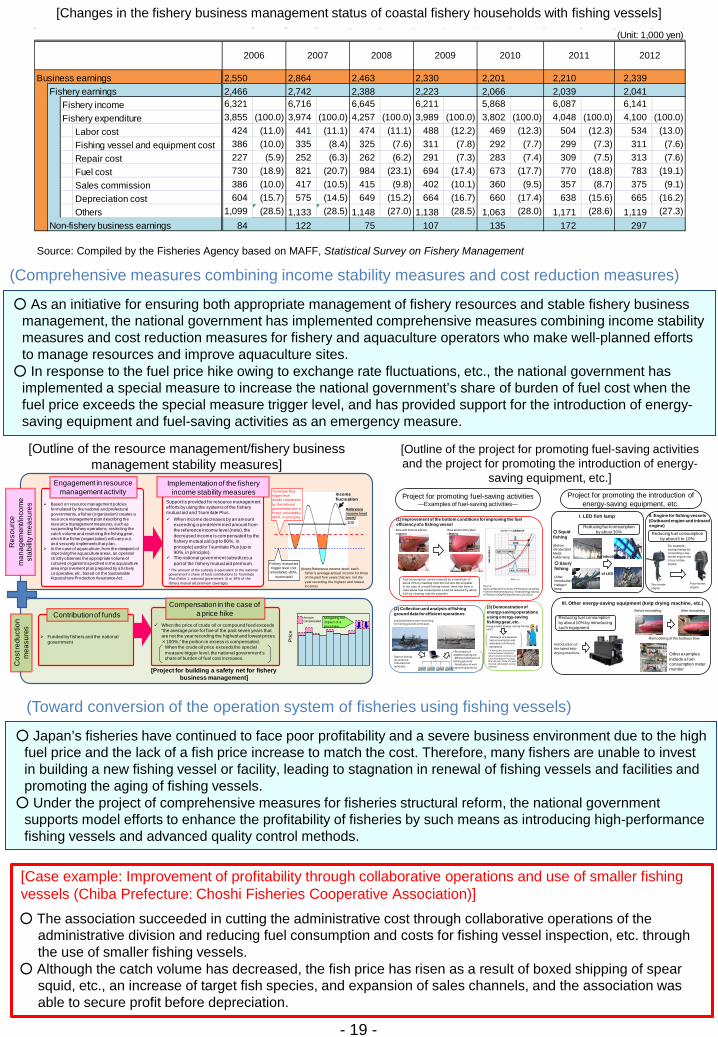
Project for promoting the introduction of energy-saving equipment, etc.
I. LED fish lamp
Reducing fuel consumption by about 30%○ Squid
fishing
(Before introduction)Metal halide lamp
○ Sauryfishing
(After introduction)Halogen lamp
Introduction
of LED
III. Other energy-saving equipment (kelp drying machine, etc.)
Introduction of the latest kelp drying machine
Remodeling of the bulbous bow
Other examples include a fuel consumption meter monitor
Reducing fuel consumption by about 10% by introducing such equipment
Before remodeling After remodeling
II. Engine for fishing vessels(Outboard engine and inboard engine)
Reducing fuel consumption by about 5 to 10%
For example, saving energy by converting a two-stroke engine into a four-stroke engine
Two-stroke engine
Four-stroke engine
Engagement in resource management activity Tsumitate Plus
trigger level (funds contributed by the national government and a fisher; refundable) (90%, in principle)
Fishery mutual aid trigger level (not
refundable) (80%, in principle)
Income fluctuation
100
Reference Income level (note)
(Note) Reference income level: each fisher’s average annual income for three of the past five years that are not the year recording the highest and lowest incomes
Based on resource management policies formulated by the national and prefectural governments, a fisher (organization) creates a resource management plan describing the resource management measures, such as suspending fishery operations, restricting the catch volume and restricting the fishing gear, which the fisher (organization) will carry out, and securely implements that plan.
In the case of aquaculture, from the viewpoint of improving the aquaculture areas, an operator strictly observes the appropriate volume of cultured organisms specified in the aquaculture area improvement plan prepared by a fishery cooperative, etc. based on the Sustainable Aquaculture Production Assurance Act.
Implementation of the fishery income stability measures
When income decreases by an amount exceeding a predetermined amount from the reference income level (note), the decreased income is compensated by the fishery mutual aid (up to 80%, in principle) and/or Tsumitate Plus (up to 90%, in principle).
The national government subsidizes a part of the fishery mutual aid premium.
Support is provided for resource management efforts by using the systems of the fishery mutual aid and Tsumitate Plus.
* The amount of the subsidy is equivalent to the national government’s share of fund contributions to TsumitatePlus (fisher 1: national government 3) or 30% of the fishery mutual aid premium (average).
Res
ourc
e m
anag
emen
t/inc
ome
stab
ility
mea
sure
s
Contribution of funds
Funded by fishers and the national government
When the price of crude oil or compound feed exceeds “the average price for five of the past seven years that are not the year recording the highest and lowest prices ×100%,” the portion in excess is compensated.
When the crude oil price exceeds the special measure trigger level, the national government’s share of burden of fuel cost increases.
Compensation in the case of a price hike
[Project for building a safety net for fishery business management]
0.0
90.0 Mitigating the impact of a price hike
Pric
e
Amount compensated
Cos
t red
uctio
n m
easu
res
(Unit: 1,000 yen)
Business earnings 2,550 2,864 2,463 2,330 2,201 2,210 2,339Fishery earnings 2,466 2,742 2,388 2,223 2,066 2,039 2,041
Fishery income 6,321 6,716 6,645 6,211 5,868 6,087 6,141Fishery expenditure 3,855 (100.0) 3,974 (100.0) 4,257 (100.0) 3,989 (100.0) 3,802 (100.0) 4,048 (100.0) 4,100 (100.0)
Labor cost 424 (11.0) 441 (11.1) 474 (11.1) 488 (12.2) 469 (12.3) 504 (12.3) 534 (13.0)Fishing vessel and equipment cost 386 (10.0) 335 (8.4) 325 (7.6) 311 (7.8) 292 (7.7) 299 (7.3) 311 (7.6)Repair cost 227 (5.9) 252 (6.3) 262 (6.2) 291 (7.3) 283 (7.4) 309 (7.5) 313 (7.6)Fuel cost 730 (18.9) 821 (20.7) 984 (23.1) 694 (17.4) 673 (17.7) 770 (18.8) 783 (19.1)Sales commission 386 (10.0) 417 (10.5) 415 (9.8) 402 (10.1) 360 (9.5) 357 (8.7) 375 (9.1)Depreciation cost 604 (15.7) 575 (14.5) 649 (15.2) 664 (16.7) 660 (17.4) 638 (15.6) 665 (16.2)Others 1,099 (28.5) 1,133 (28.5) 1,148 (27.0) 1,138 (28.5) 1,063 (28.0) 1,171 (28.6) 1,119 (27.3)
Non-fishery business earnings 84 122 75 107 135 172 297
2006 2007 2008 2009 20122010 2011
(Comprehensive measures combining income stability measures and cost reduction measures)
○ As an initiative for ensuring both appropriate management of fishery resources and stable fishery business management, the national government has implemented comprehensive measures combining income stability measures and cost reduction measures for fishery and aquaculture operators who make well-planned efforts to manage resources and improve aquaculture sites.
○ In response to the fuel price hike owing to exchange rate fluctuations, etc., the national government has implemented a special measure to increase the national government’s share of burden of fuel cost when the fuel price exceeds the special measure trigger level, and has provided support for the introduction of energy-saving equipment and fuel-saving activities as an emergency measure.
[Outline of the resource management/fishery business management stability measures]
- 19 -
○ The association succeeded in cutting the administrative cost through collaborative operations of the administrative division and reducing fuel consumption and costs for fishing vessel inspection, etc. through the use of smaller fishing vessels.
○ Although the catch volume has decreased, the fish price has risen as a result of boxed shipping of spear squid, etc., an increase of target fish species, and expansion of sales channels, and the association was able to secure profit before depreciation.
[Case example: Improvement of profitability through collaborative operations and use of smaller fishing vessels (Chiba Prefecture: Choshi Fisheries Cooperative Association)]
(Toward conversion of the operation system of fisheries using fishing vessels)
○ Japan’s fisheries have continued to face poor profitability and a severe business environment due to the high fuel price and the lack of a fish price increase to match the cost. Therefore, many fishers are unable to invest in building a new fishing vessel or facility, leading to stagnation in renewal of fishing vessels and facilities and promoting the aging of fishing vessels.
○ Under the project of comprehensive measures for fisheries structural reform, the national government supports model efforts to enhance the profitability of fisheries by such means as introducing high-performance fishing vessels and advanced quality control methods.
[Changes in the fishery business management status of coastal fishery households with fishing vessels]
Source: Compiled by the Fisheries Agency based on MAFF, Statistical Survey on Fishery Management
[Outline of the project for promoting fuel-saving activities and the project for promoting the introduction of energy-
saving equipment, etc.] Project for promoting fuel-saving activities
—Examples of fuel-saving activities—
Source: National Research Institute of Fisheries Engineering, Fisheries Research Agency, Toward Energy-Saving of Fisheries Using Fishing Vessels (July 2013)
(1) Improvement of the bottom conditions for improving the fuel efficiency of a fishing vessel
Fuel consumption can be reduced by a maximum of about 22% by cleaning both the hull and the propeller.In the case of a small f ishing vessel, there has been a case where fuel consumption could be reduced by about 41% by cleaning only the propeller.
Bow and bottom before cleaning
Bow and bottom af ter cleaning
(2) Collection and analysis of fishing ground data for efficient operationsIndividual fishers were searching for fishing grounds in the past.
Data on fishing grounds are collected and analyzed.
- Prevention of wasteful sailing out- Efficient discovery of fishing grounds- Realization of well-planned operations
(3) Demonstration of energy-saving operations using energy-saving fishing gear, etc.Using a latest energy-saving fishing net(*)
* A fishing net that achieves reduced water resistance when hoisted and improved fuel consumption by using fine net yarn made of a well-drained, lightweight, strong material
- Restraint of excessive fuel consumption and realization of efficient operations
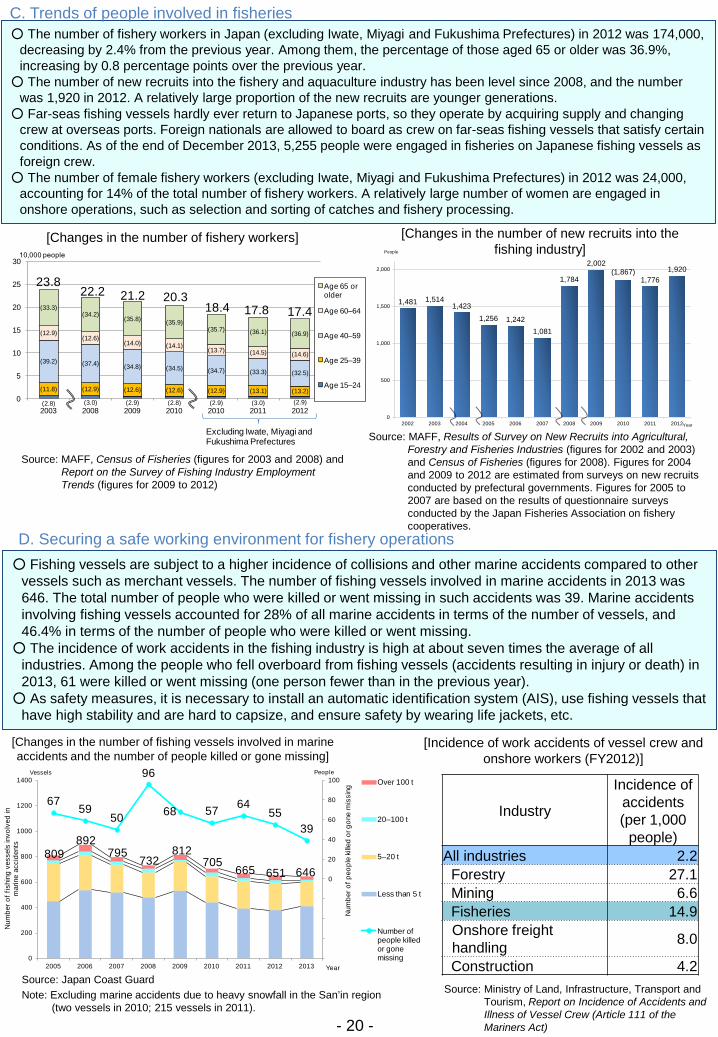
809892
795732
812705
665 651 646
6759
50
96
68 57 6455
39
-80
-60
-40
-20
0
20
40
60
80
100
0
200
400
600
800
1000
1200
1400
2005 2006 2007 2008 2009 2010 2011 2012 2013
Over 100 t
20–100 t
5–20 t
Less than 5 t
Number of people killed or gone missing
Vessels
Num
ber o
f fis
hing
ves
sels
invo
lved
in
mar
ine
acci
dent
s
Year
Num
ber o
f peo
ple
kille
d or
gon
e m
issi
ng
People
1,481 1,5141,423
1,256 1,2421,081
1,784
2,002(1,867)
1,7761,920
0
500
1,000
1,500
2,000
2002 2003 2004 2005 2006 2007 2008 2009 2010 2011 2012
People
Year
(2.8) (3.0) (2.9) (2.8) (2.9) (3.0) (2.9)
(11.8) (12.9) (12.6) (12.6) (12.9) (13.1) (13.2)
(39.2) (37.4) (34.8) (34.5) (34.7) (33.3) (32.5)
(12.9)(12.6)
(14.0) (14.1)(13.7) (14.5) (14.6)
(33.3)(34.2)
(35.8) (35.9)(35.7) (36.1) (36.9)
0
5
10
15
20
25
30
2003 2008 2009 2010 2010 2011 2012
Age 65 or older
Age 60–64
Age 40–59
Age 25–39
Age 15–24
23.822.2
10,000 people
21.2 20.317.818.4
Excluding Iwate, Miyagi and Fukushima Prefectures
17.4
- 20 -
Source: MAFF, Census of Fisheries (figures for 2003 and 2008) and Report on the Survey of Fishing Industry Employment Trends (figures for 2009 to 2012)
Source: MAFF, Results of Survey on New Recruits into Agricultural, Forestry and Fisheries Industries (figures for 2002 and 2003) and Census of Fisheries (figures for 2008). Figures for 2004 and 2009 to 2012 are estimated from surveys on new recruits conducted by prefectural governments. Figures for 2005 to 2007 are based on the results of questionnaire surveys conducted by the Japan Fisheries Association on fishery cooperatives.
D. Securing a safe working environment for fishery operations ○ Fishing vessels are subject to a higher incidence of collisions and other marine accidents compared to other
vessels such as merchant vessels. The number of fishing vessels involved in marine accidents in 2013 was 646. The total number of people who were killed or went missing in such accidents was 39. Marine accidents involving fishing vessels accounted for 28% of all marine accidents in terms of the number of vessels, and 46.4% in terms of the number of people who were killed or went missing.
○ The incidence of work accidents in the fishing industry is high at about seven times the average of all industries. Among the people who fell overboard from fishing vessels (accidents resulting in injury or death) in 2013, 61 were killed or went missing (one person fewer than in the previous year).
○ As safety measures, it is necessary to install an automatic identification system (AIS), use fishing vessels that have high stability and are hard to capsize, and ensure safety by wearing life jackets, etc.
Source: Japan Coast Guard Note: Excluding marine accidents due to heavy snowfall in the San’in region
(two vessels in 2010; 215 vessels in 2011).
[Incidence of work accidents of vessel crew and onshore workers (FY2012)]
Source: Ministry of Land, Infrastructure, Transport and Tourism, Report on Incidence of Accidents and Illness of Vessel Crew (Article 111 of the Mariners Act)
○ The number of fishery workers in Japan (excluding Iwate, Miyagi and Fukushima Prefectures) in 2012 was 174,000, decreasing by 2.4% from the previous year. Among them, the percentage of those aged 65 or older was 36.9%, increasing by 0.8 percentage points over the previous year.
○ The number of new recruits into the fishery and aquaculture industry has been level since 2008, and the number was 1,920 in 2012. A relatively large proportion of the new recruits are younger generations.
○ Far-seas fishing vessels hardly ever return to Japanese ports, so they operate by acquiring supply and changing crew at overseas ports. Foreign nationals are allowed to board as crew on far-seas fishing vessels that satisfy certain conditions. As of the end of December 2013, 5,255 people were engaged in fisheries on Japanese fishing vessels as foreign crew.
○ The number of female fishery workers (excluding Iwate, Miyagi and Fukushima Prefectures) in 2012 was 24,000, accounting for 14% of the total number of fishery workers. A relatively large number of women are engaged in onshore operations, such as selection and sorting of catches and fishery processing.
C. Trends of people involved in fisheries
[Changes in the number of fishery workers]
Industry
Incidence of accidents (per 1,000
people) All industries 2.2 Forestry 27.1 Mining 6.6 Fisheries 14.9
Onshore freight handling 8.0
Construction 4.2
[Changes in the number of new recruits into the fishing industry]
[Changes in the number of fishing vessels involved in marine accidents and the number of people killed or gone missing]
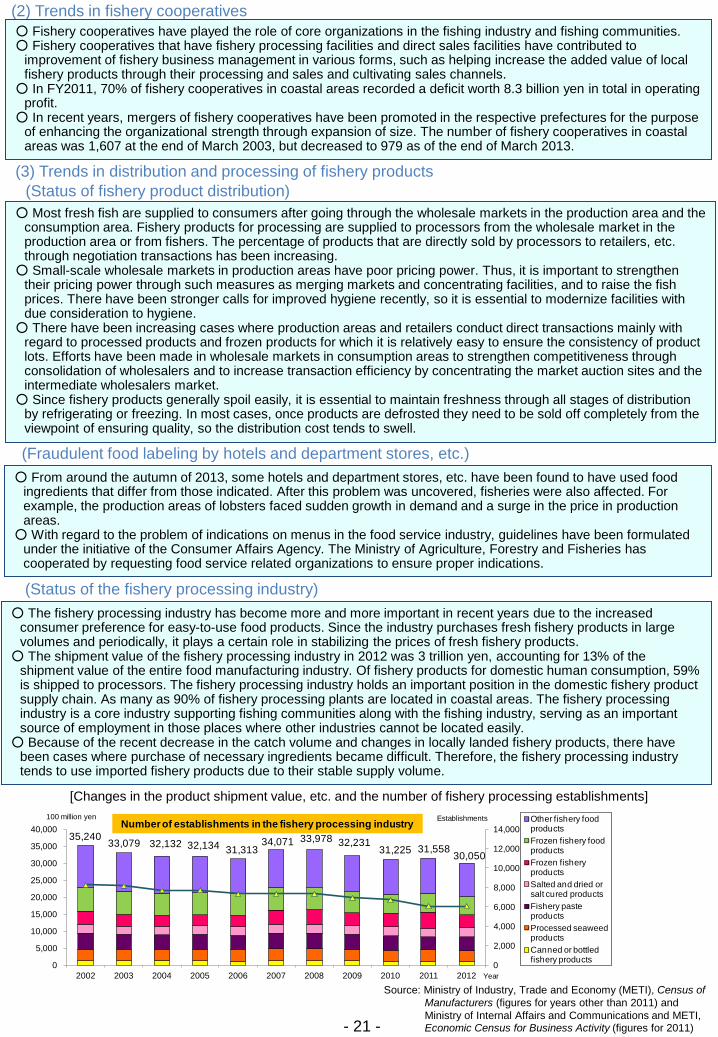
○ From around the autumn of 2013, some hotels and department stores, etc. have been found to have used food ingredients that differ from those indicated. After this problem was uncovered, fisheries were also affected. For example, the production areas of lobsters faced sudden growth in demand and a surge in the price in production areas.
○ With regard to the problem of indications on menus in the food service industry, guidelines have been formulated under the initiative of the Consumer Affairs Agency. The Ministry of Agriculture, Forestry and Fisheries has cooperated by requesting food service related organizations to ensure proper indications.
(3) Trends in distribution and processing of fishery products
○ Most fresh fish are supplied to consumers after going through the wholesale markets in the production area and the consumption area. Fishery products for processing are supplied to processors from the wholesale market in the production area or from fishers. The percentage of products that are directly sold by processors to retailers, etc. through negotiation transactions has been increasing.
○ Small-scale wholesale markets in production areas have poor pricing power. Thus, it is important to strengthen their pricing power through such measures as merging markets and concentrating facilities, and to raise the fish prices. There have been stronger calls for improved hygiene recently, so it is essential to modernize facilities with due consideration to hygiene.
○ There have been increasing cases where production areas and retailers conduct direct transactions mainly with regard to processed products and frozen products for which it is relatively easy to ensure the consistency of product lots. Efforts have been made in wholesale markets in consumption areas to strengthen competitiveness through consolidation of wholesalers and to increase transaction efficiency by concentrating the market auction sites and the intermediate wholesalers market.
○ Since fishery products generally spoil easily, it is essential to maintain freshness through all stages of distribution by refrigerating or freezing. In most cases, once products are defrosted they need to be sold off completely from the viewpoint of ensuring quality, so the distribution cost tends to swell.
(Status of fishery product distribution)
(Status of the fishery processing industry) ○ The fishery processing industry has become more and more important in recent years due to the increased
consumer preference for easy-to-use food products. Since the industry purchases fresh fishery products in large volumes and periodically, it plays a certain role in stabilizing the prices of fresh fishery products.
○ The shipment value of the fishery processing industry in 2012 was 3 trillion yen, accounting for 13% of the shipment value of the entire food manufacturing industry. Of fishery products for domestic human consumption, 59% is shipped to processors. The fishery processing industry holds an important position in the domestic fishery product supply chain. As many as 90% of fishery processing plants are located in coastal areas. The fishery processing industry is a core industry supporting fishing communities along with the fishing industry, serving as an important source of employment in those places where other industries cannot be located easily.
○ Because of the recent decrease in the catch volume and changes in locally landed fishery products, there have been cases where purchase of necessary ingredients became difficult. Therefore, the fishery processing industry tends to use imported fishery products due to their stable supply volume.
- 21 -
(2) Trends in fishery cooperatives ○ Fishery cooperatives have played the role of core organizations in the fishing industry and fishing communities. ○ Fishery cooperatives that have fishery processing facilities and direct sales facilities have contributed to
improvement of fishery business management in various forms, such as helping increase the added value of local fishery products through their processing and sales and cultivating sales channels.
○ In FY2011, 70% of fishery cooperatives in coastal areas recorded a deficit worth 8.3 billion yen in total in operating profit.
○ In recent years, mergers of fishery cooperatives have been promoted in the respective prefectures for the purpose of enhancing the organizational strength through expansion of size. The number of fishery cooperatives in coastal areas was 1,607 at the end of March 2003, but decreased to 979 as of the end of March 2013.
(Fraudulent food labeling by hotels and department stores, etc.)
[Changes in the product shipment value, etc. and the number of fishery processing establishments]
Source: Ministry of Industry, Trade and Economy (METI), Census of Manufacturers (figures for years other than 2011) and Ministry of Internal Affairs and Communications and METI, Economic Census for Business Activity (figures for 2011)
0
2,000
4,000
6,000
8,000
10,000
12,000
14,000
0
5,000
10,000
15,000
20,000
25,000
30,000
35,000
40,000
2002 2003 2004 2005 2006 2007 2008 2009 2010 2011 2012
Other fishery food productsFrozen fishery food productsFrozen fishery productsSalted and dried or salt cured productsFishery paste productsProcessed seaweed productsCanned or bottled fishery products
100 million yen Establishments
32,132 32,134 31,31334,071 33,978 32,231
31,225 31,55835,240 33,079
30,050
Number of establishments in the fishery processing industry
Year
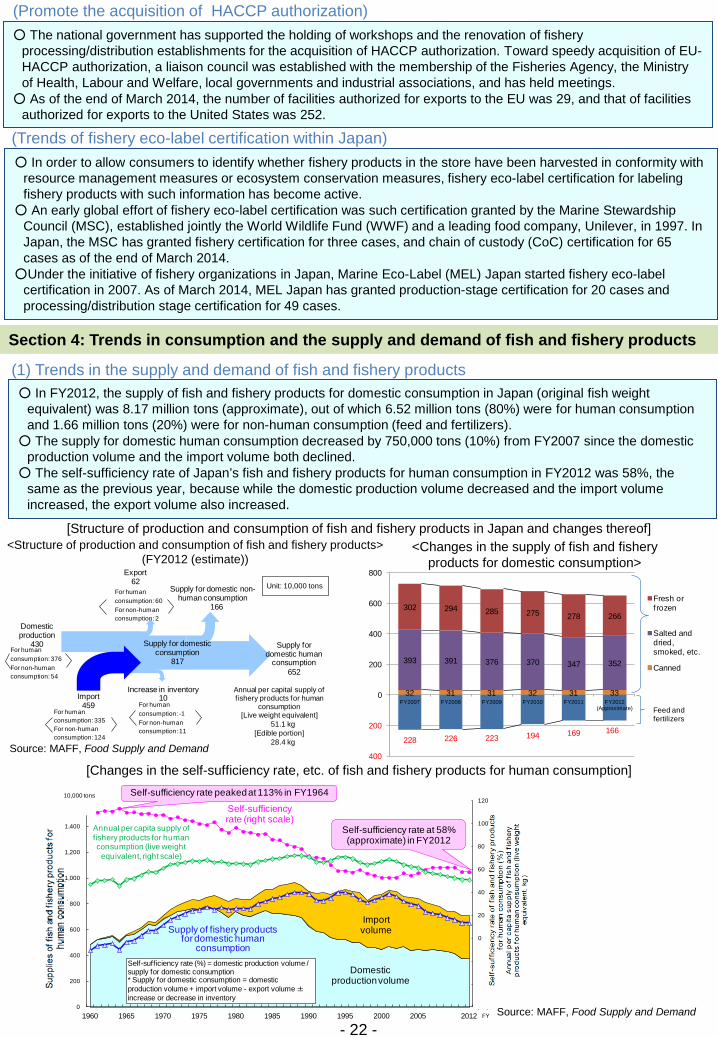
(60)
(40)
(20)
0
20
40
60
80
100
120
0
200
400
600
800
1,000
1,200
1,400
1,600
1960 1965 1970 1975 1980 1985 1990 1995 2000 2005 2012
Import volume
Self-sufficiency rate (right scale)
10,000 tons
Sup
ply
of fi
sher
y pr
oduc
ts fo
r hum
an
cons
umpt
ion
Ann
ual p
er c
apita
sup
ply
of fi
sher
y pr
oduc
ts f
or h
uman
co
nsum
ptio
n (li
ve w
eigh
t equ
ival
ent,
kg)
Sel
f-su
ffic
ienc
y ra
te o
f fis
hery
pro
duct
s fo
r hum
an
cons
umpt
ion
(%)
Self-sufficiency rate at 58% (approximate) in FY2012
Self-sufficiency rate peaked at 113% in FY1964
Domestic production volume
Annual per capita supply of fishery products for human consumption (live weight
equivalent, right scale)
Supply of fishery products for domestic human
consumptionSelf-sufficiency rate (%) = domestic production volume / supply for domestic consumption* Supply for domestic consumption = domestic production volume + import volume - export volume ±increase or decrease in inventory
FY
228 226 223 194 169 166
32 31 31 32 31 33
393 391 376 370 347 352
302 294 285 275 278 266
400
200
0
200
400
600
800
FY2007 FY2008 FY2009 FY2010 FY2011 FY2012 (Approximate)
Fresh or f rozen
Salted and dried, smoked, etc.
Canned
Feed and fertilizers
Supply for domestic non-human consumption
166
Domestic production
430
Export62
Supply for domestic human
consumption652
Increase in inventory10
For human consumption: -1For non-human consumption: 11
Unit: 10,000 tons
Supply for domestic consumption
817
Import459
For human consumption: 376For non-human consumption: 54
For human consumption: 335For non-human consumption: 124
For human consumption: 60For non-human consumption: 2
Annual per capital supply of f ishery products for human
consumption[Live weight equivalent]
51.1 kg[Edible portion]
28.4 kg
○ The national government has supported the holding of workshops and the renovation of fishery processing/distribution establishments for the acquisition of HACCP authorization. Toward speedy acquisition of EU-HACCP authorization, a liaison council was established with the membership of the Fisheries Agency, the Ministry of Health, Labour and Welfare, local governments and industrial associations, and has held meetings.
○ As of the end of March 2014, the number of facilities authorized for exports to the EU was 29, and that of facilities authorized for exports to the United States was 252.
(Trends of fishery eco-label certification within Japan) ○ In order to allow consumers to identify whether fishery products in the store have been harvested in conformity with
resource management measures or ecosystem conservation measures, fishery eco-label certification for labeling fishery products with such information has become active.
○ An early global effort of fishery eco-label certification was such certification granted by the Marine Stewardship Council (MSC), established jointly the World Wildlife Fund (WWF) and a leading food company, Unilever, in 1997. In Japan, the MSC has granted fishery certification for three cases, and chain of custody (CoC) certification for 65 cases as of the end of March 2014.
○Under the initiative of fishery organizations in Japan, Marine Eco-Label (MEL) Japan started fishery eco-label certification in 2007. As of March 2014, MEL Japan has granted production-stage certification for 20 cases and processing/distribution stage certification for 49 cases.
- 22 -
Section 4: Trends in consumption and the supply and demand of fish and fishery products
(1) Trends in the supply and demand of fish and fishery products ○ In FY2012, the supply of fish and fishery products for domestic consumption in Japan (original fish weight
equivalent) was 8.17 million tons (approximate), out of which 6.52 million tons (80%) were for human consumption and 1.66 million tons (20%) were for non-human consumption (feed and fertilizers).
○ The supply for domestic human consumption decreased by 750,000 tons (10%) from FY2007 since the domestic production volume and the import volume both declined.
○ The self-sufficiency rate of Japan’s fish and fishery products for human consumption in FY2012 was 58%, the same as the previous year, because while the domestic production volume decreased and the import volume increased, the export volume also increased.
[Structure of production and consumption of fish and fishery products in Japan and changes thereof]
Source: MAFF, Food Supply and Demand
(Promote the acquisition of HACCP authorization)
[Changes in the self-sufficiency rate, etc. of fish and fishery products for human consumption]
Source: MAFF, Food Supply and Demand
<Structure of production and consumption of fish and fishery products> (FY2012 (estimate))
<Changes in the supply of fish and fishery products for domestic consumption>
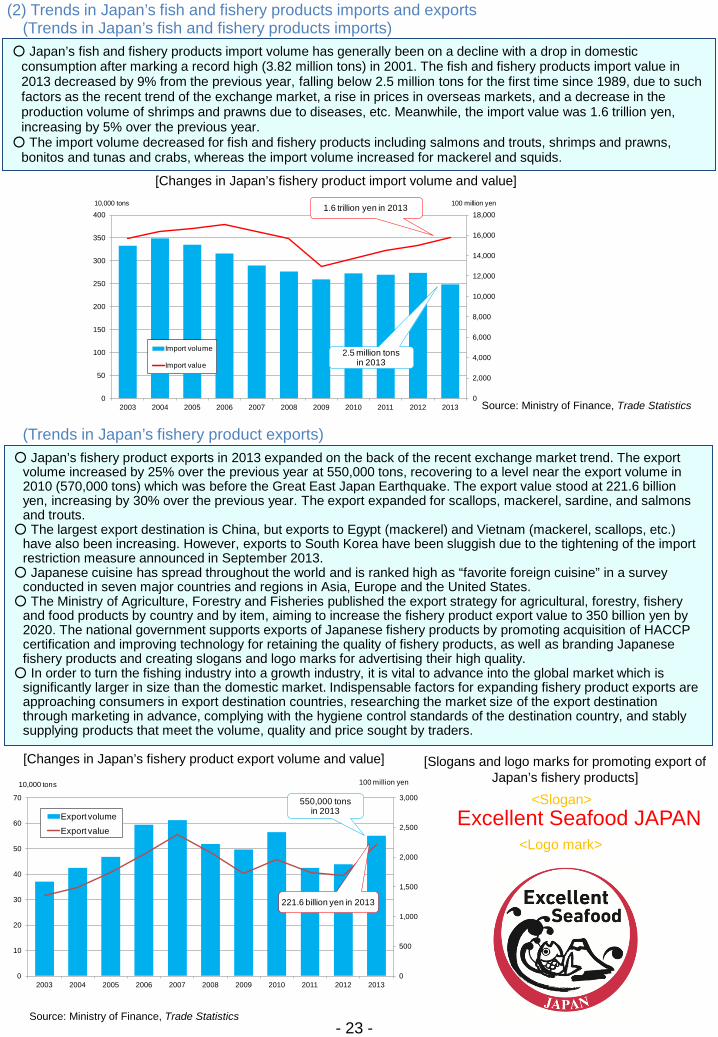
0
2,000
4,000
6,000
8,000
10,000
12,000
14,000
16,000
18,000
0
50
100
150
200
250
300
350
400
2003 2004 2005 2006 2007 2008 2009 2010 2011 2012 2013
Import volume
Import value
1.6 trillion yen in 2013
2.5 million tons in 2013
10,000 tons 100 million yen
0
500
1,000
1,500
2,000
2,500
3,000
0
10
20
30
40
50
60
70
2003 2004 2005 2006 2007 2008 2009 2010 2011 2012 2013
Export volumeExport value
221.6 billion yen in 2013
550,000 tons in 2013
10,000 tons 100 million yen
- 23 -
(2) Trends in Japan’s fish and fishery products imports and exports
○ Japan’s fish and fishery products import volume has generally been on a decline with a drop in domestic consumption after marking a record high (3.82 million tons) in 2001. The fish and fishery products import value in 2013 decreased by 9% from the previous year, falling below 2.5 million tons for the first time since 1989, due to such factors as the recent trend of the exchange market, a rise in prices in overseas markets, and a decrease in the production volume of shrimps and prawns due to diseases, etc. Meanwhile, the import value was 1.6 trillion yen, increasing by 5% over the previous year.
○ The import volume decreased for fish and fishery products including salmons and trouts, shrimps and prawns, bonitos and tunas and crabs, whereas the import volume increased for mackerel and squids.
(Trends in Japan’s fish and fishery products imports)
[Changes in Japan’s fishery product import volume and value]
○ Japan’s fishery product exports in 2013 expanded on the back of the recent exchange market trend. The export volume increased by 25% over the previous year at 550,000 tons, recovering to a level near the export volume in 2010 (570,000 tons) which was before the Great East Japan Earthquake. The export value stood at 221.6 billion yen, increasing by 30% over the previous year. The export expanded for scallops, mackerel, sardine, and salmons and trouts.
○ The largest export destination is China, but exports to Egypt (mackerel) and Vietnam (mackerel, scallops, etc.) have also been increasing. However, exports to South Korea have been sluggish due to the tightening of the import restriction measure announced in September 2013.
○ Japanese cuisine has spread throughout the world and is ranked high as “favorite foreign cuisine” in a survey conducted in seven major countries and regions in Asia, Europe and the United States.
○ The Ministry of Agriculture, Forestry and Fisheries published the export strategy for agricultural, forestry, fishery and food products by country and by item, aiming to increase the fishery product export value to 350 billion yen by 2020. The national government supports exports of Japanese fishery products by promoting acquisition of HACCP certification and improving technology for retaining the quality of fishery products, as well as branding Japanese fishery products and creating slogans and logo marks for advertising their high quality.
○ In order to turn the fishing industry into a growth industry, it is vital to advance into the global market which is significantly larger in size than the domestic market. Indispensable factors for expanding fishery product exports are approaching consumers in export destination countries, researching the market size of the export destination through marketing in advance, complying with the hygiene control standards of the destination country, and stably supplying products that meet the volume, quality and price sought by traders.
(Trends in Japan’s fishery product exports)
Source: Ministry of Finance, Trade Statistics
[Changes in Japan’s fishery product export volume and value]
Source: Ministry of Finance, Trade Statistics
[Slogans and logo marks for promoting export of Japan’s fishery products]
<Slogan> Excellent Seafood JAPAN
<Logo mark>
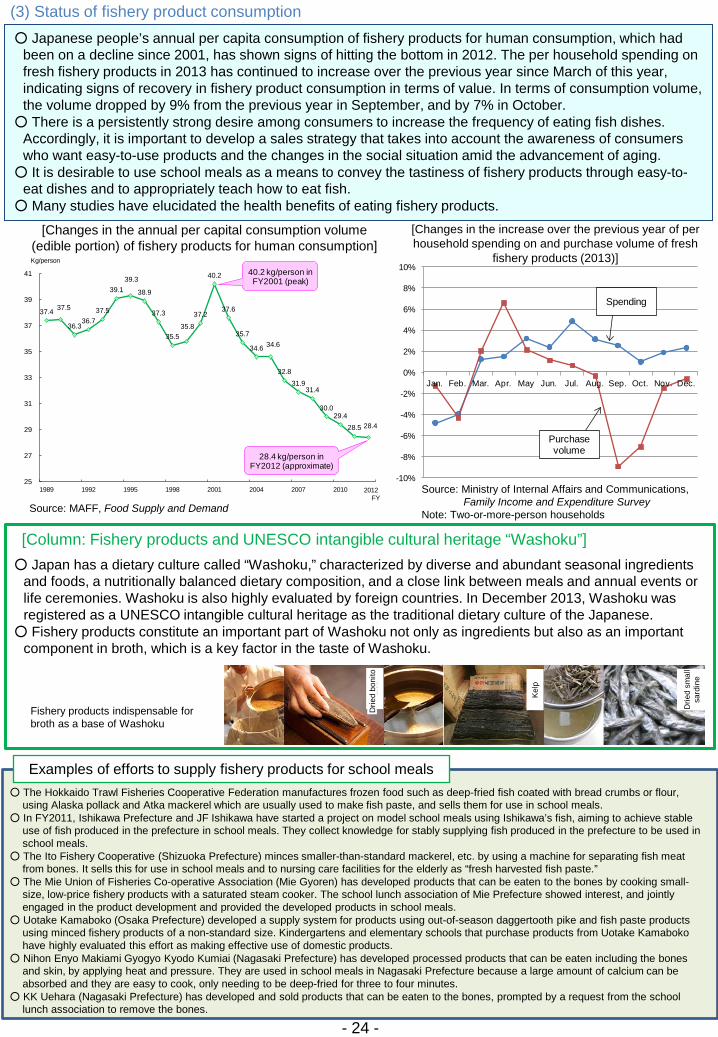
-10%
-8%
-6%
-4%
-2%
0%
2%
4%
6%
8%
10%
Jan. Feb. Mar. Apr. May Jun. Jul. Aug. Sep. Oct. Nov. Dec.
Spending
Purchase volume
37.4 37.5
36.336.7
37.5
39.139.3
38.9
37.3
35.535.8
37.2
40.2
37.6
35.7
34.6 34.6
32.831.9
31.4
30.029.4
28.5 28.4
25
27
29
31
33
35
37
39
41
1989 1992 1995 1998 2001 2004 2007 2010
Kg/person
28.4 kg/person in FY2012 (approximate)
2012FY
40.2 kg/person in FY2001 (peak)
- 24 -
[Changes in the annual per capital consumption volume (edible portion) of fishery products for human consumption]
Source: MAFF, Food Supply and Demand
Source: Ministry of Internal Affairs and Communications, Family Income and Expenditure Survey
Note: Two-or-more-person households
[Changes in the increase over the previous year of per household spending on and purchase volume of fresh
fishery products (2013)]
○ The Hokkaido Trawl Fisheries Cooperative Federation manufactures frozen food such as deep-fried fish coated with bread crumbs or flour, using Alaska pollack and Atka mackerel which are usually used to make fish paste, and sells them for use in school meals.
○ In FY2011, Ishikawa Prefecture and JF Ishikawa have started a project on model school meals using Ishikawa’s fish, aiming to achieve stable use of fish produced in the prefecture in school meals. They collect knowledge for stably supplying fish produced in the prefecture to be used in school meals.
○ The Ito Fishery Cooperative (Shizuoka Prefecture) minces smaller-than-standard mackerel, etc. by using a machine for separating fish meat from bones. It sells this for use in school meals and to nursing care facilities for the elderly as “fresh harvested fish paste.”
○ The Mie Union of Fisheries Co-operative Association (Mie Gyoren) has developed products that can be eaten to the bones by cooking small-size, low-price fishery products with a saturated steam cooker. The school lunch association of Mie Prefecture showed interest, and jointly engaged in the product development and provided the developed products in school meals.
○ Uotake Kamaboko (Osaka Prefecture) developed a supply system for products using out-of-season daggertooth pike and fish paste products using minced fishery products of a non-standard size. Kindergartens and elementary schools that purchase products from Uotake Kamaboko have highly evaluated this effort as making effective use of domestic products.
○ Nihon Enyo Makiami Gyogyo Kyodo Kumiai (Nagasaki Prefecture) has developed processed products that can be eaten including the bones and skin, by applying heat and pressure. They are used in school meals in Nagasaki Prefecture because a large amount of calcium can be absorbed and they are easy to cook, only needing to be deep-fried for three to four minutes.
○ KK Uehara (Nagasaki Prefecture) has developed and sold products that can be eaten to the bones, prompted by a request from the school lunch association to remove the bones.
Examples of efforts to supply fishery products for school meals
○ Japan has a dietary culture called “Washoku,” characterized by diverse and abundant seasonal ingredients and foods, a nutritionally balanced dietary composition, and a close link between meals and annual events or life ceremonies. Washoku is also highly evaluated by foreign countries. In December 2013, Washoku was registered as a UNESCO intangible cultural heritage as the traditional dietary culture of the Japanese.
○ Fishery products constitute an important part of Washoku not only as ingredients but also as an important component in broth, which is a key factor in the taste of Washoku.
[Column: Fishery products and UNESCO intangible cultural heritage “Washoku”]
Fishery products indispensable for broth as a base of Washoku
(3) Status of fishery product consumption ○ Japanese people’s annual per capita consumption of fishery products for human consumption, which had
been on a decline since 2001, has shown signs of hitting the bottom in 2012. The per household spending on fresh fishery products in 2013 has continued to increase over the previous year since March of this year, indicating signs of recovery in fishery product consumption in terms of value. In terms of consumption volume, the volume dropped by 9% from the previous year in September, and by 7% in October.
○ There is a persistently strong desire among consumers to increase the frequency of eating fish dishes. Accordingly, it is important to develop a sales strategy that takes into account the awareness of consumers who want easy-to-use products and the changes in the social situation amid the advancement of aging.
○ It is desirable to use school meals as a means to convey the tastiness of fishery products through easy-to-eat dishes and to appropriately teach how to eat fish.
○ Many studies have elucidated the health benefits of eating fishery products.
Drie
d bo
nito
Kelp
Drie
d sm
all
sard
ine
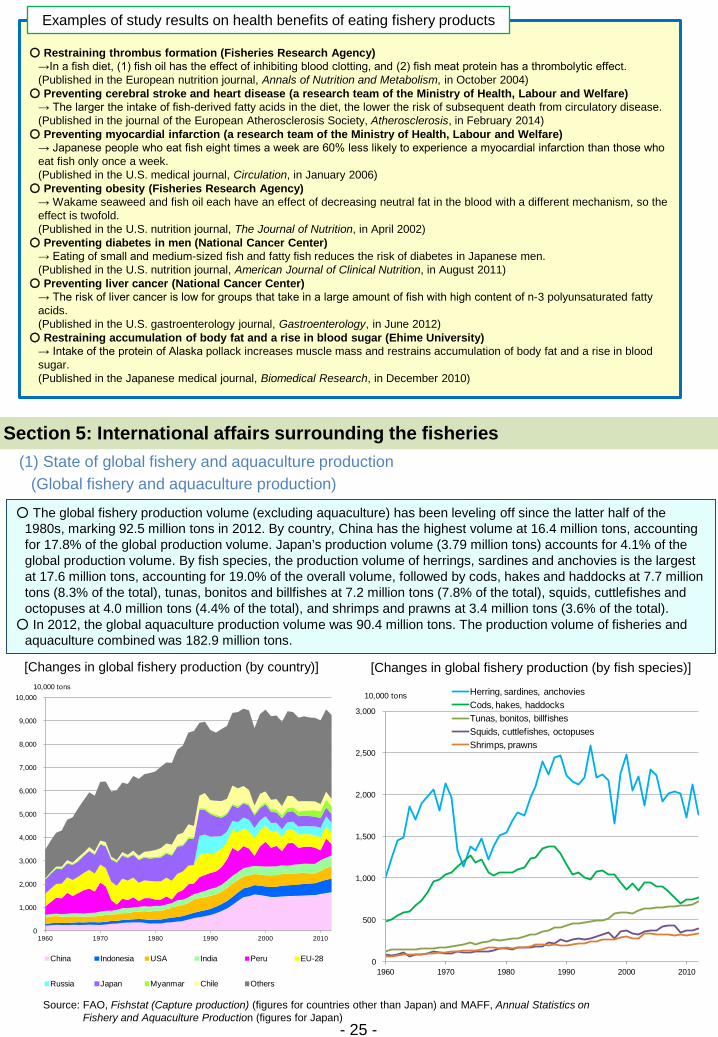
0
500
1,000
1,500
2,000
2,500
3,000
1960 1970 1980 1990 2000 2010
10,000 tons Herring, sardines, anchoviesCods, hakes, haddocksTunas, bonitos, billfishesSquids, cuttlefishes, octopusesShrimps, prawns
0
1,000
2,000
3,000
4,000
5,000
6,000
7,000
8,000
9,000
10,000
1960 1970 1980 1990 2000 2010
10,000 tons
China Indonesia USA India Peru EU-28
Russia Japan Myanmar Chile Others
Section 5: International affairs surrounding the fisheries
○ The global fishery production volume (excluding aquaculture) has been leveling off since the latter half of the 1980s, marking 92.5 million tons in 2012. By country, China has the highest volume at 16.4 million tons, accounting for 17.8% of the global production volume. Japan’s production volume (3.79 million tons) accounts for 4.1% of the global production volume. By fish species, the production volume of herrings, sardines and anchovies is the largest at 17.6 million tons, accounting for 19.0% of the overall volume, followed by cods, hakes and haddocks at 7.7 million tons (8.3% of the total), tunas, bonitos and billfishes at 7.2 million tons (7.8% of the total), squids, cuttlefishes and octopuses at 4.0 million tons (4.4% of the total), and shrimps and prawns at 3.4 million tons (3.6% of the total).
○ In 2012, the global aquaculture production volume was 90.4 million tons. The production volume of fisheries and aquaculture combined was 182.9 million tons.
(1) State of global fishery and aquaculture production (Global fishery and aquaculture production)
[Changes in global fishery production (by country)]
Source: FAO, Fishstat (Capture production) (figures for countries other than Japan) and MAFF, Annual Statistics on Fishery and Aquaculture Production (figures for Japan)
[Changes in global fishery production (by fish species)]
- 25 -
Examples of study results on health benefits of eating fishery products
○ Restraining thrombus formation (Fisheries Research Agency) →In a fish diet, (1) fish oil has the effect of inhibiting blood clotting, and (2) fish meat protein has a thrombolytic effect. (Published in the European nutrition journal, Annals of Nutrition and Metabolism, in October 2004)
○ Preventing cerebral stroke and heart disease (a research team of the Ministry of Health, Labour and Welfare) → The larger the intake of fish-derived fatty acids in the diet, the lower the risk of subsequent death from circulatory disease. (Published in the journal of the European Atherosclerosis Society, Atherosclerosis, in February 2014)
○ Preventing myocardial infarction (a research team of the Ministry of Health, Labour and Welfare) → Japanese people who eat fish eight times a week are 60% less likely to experience a myocardial infarction than those who eat fish only once a week. (Published in the U.S. medical journal, Circulation, in January 2006)
○ Preventing obesity (Fisheries Research Agency) → Wakame seaweed and fish oil each have an effect of decreasing neutral fat in the blood with a different mechanism, so the effect is twofold. (Published in the U.S. nutrition journal, The Journal of Nutrition, in April 2002)
○ Preventing diabetes in men (National Cancer Center) → Eating of small and medium-sized fish and fatty fish reduces the risk of diabetes in Japanese men. (Published in the U.S. nutrition journal, American Journal of Clinical Nutrition, in August 2011)
○ Preventing liver cancer (National Cancer Center) → The risk of liver cancer is low for groups that take in a large amount of fish with high content of n-3 polyunsaturated fatty acids. (Published in the U.S. gastroenterology journal, Gastroenterology, in June 2012)
○ Restraining accumulation of body fat and a rise in blood sugar (Ehime University) → Intake of the protein of Alaska pollack increases muscle mass and restrains accumulation of body fat and a rise in blood sugar. (Published in the Japanese medical journal, Biomedical Research, in December 2010)
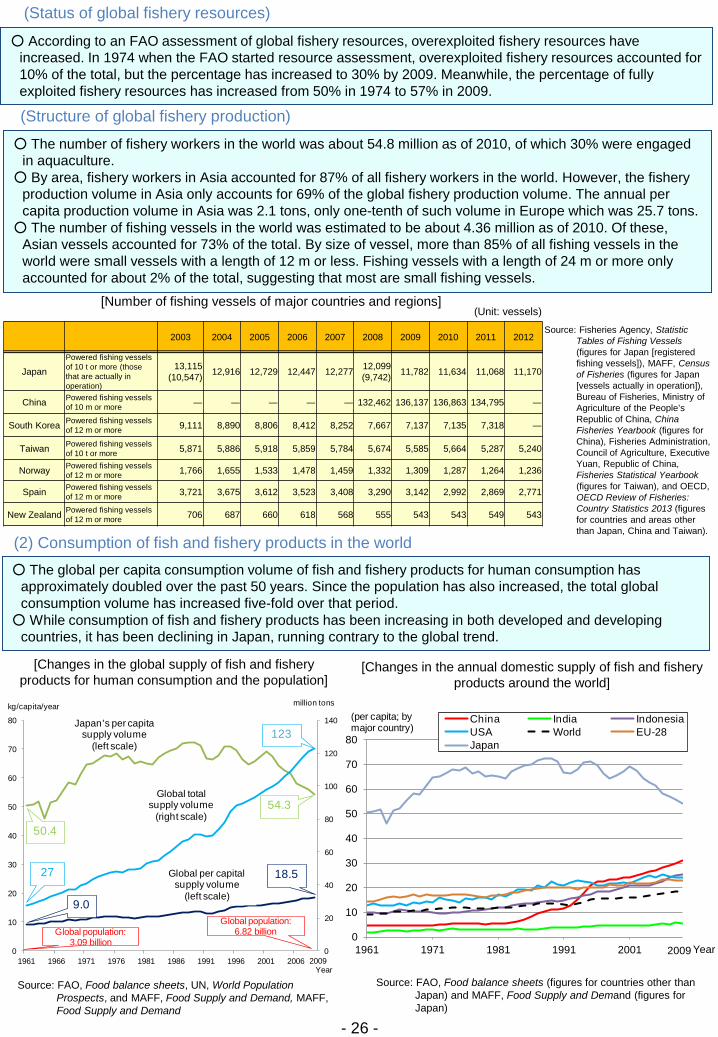
0
10
20
30
40
50
60
70
80
1961 1971 1981 1991 2001 Year
China India IndonesiaUSA World EU-28Japan
2009
(per capita; by major country)
0
20
40
60
80
100
120
140
0
10
20
30
40
50
60
70
80
1961 1966 1971 1976 1981 1986 1991 1996 2001 2006
18.5
2009Year
123
27
Global population: 3.09 billion
Global population: 6.82 billion
9.0
Global per capital supply volume
(left scale)
Global total supply volume
(right scale)
Japan’s per capita supply volume
(left scale)
54.3
50.4
kg/capita/year million tons
(2) Consumption of fish and fishery products in the world ○ The global per capita consumption volume of fish and fishery products for human consumption has
approximately doubled over the past 50 years. Since the population has also increased, the total global consumption volume has increased five-fold over that period.
○ While consumption of fish and fishery products has been increasing in both developed and developing countries, it has been declining in Japan, running contrary to the global trend.
- 26 -
[Changes in the global supply of fish and fishery products for human consumption and the population]
[Changes in the annual domestic supply of fish and fishery products around the world]
Source: Fisheries Agency, Statistic Tables of Fishing Vessels (figures for Japan [registered fishing vessels]), MAFF, Census of Fisheries (figures for Japan [vessels actually in operation]), Bureau of Fisheries, Ministry of Agriculture of the People’s Republic of China, China Fisheries Yearbook (figures for China), Fisheries Administration, Council of Agriculture, Executive Yuan, Republic of China, Fisheries Statistical Yearbook (figures for Taiwan), and OECD, OECD Review of Fisheries: Country Statistics 2013 (figures for countries and areas other than Japan, China and Taiwan).
Source: FAO, Food balance sheets, UN, World Population Prospects, and MAFF, Food Supply and Demand, MAFF, Food Supply and Demand
Source: FAO, Food balance sheets (figures for countries other than Japan) and MAFF, Food Supply and Demand (figures for Japan)
(Structure of global fishery production)
○ The number of fishery workers in the world was about 54.8 million as of 2010, of which 30% were engaged in aquaculture.
○ By area, fishery workers in Asia accounted for 87% of all fishery workers in the world. However, the fishery production volume in Asia only accounts for 69% of the global fishery production volume. The annual per capita production volume in Asia was 2.1 tons, only one-tenth of such volume in Europe which was 25.7 tons.
○ The number of fishing vessels in the world was estimated to be about 4.36 million as of 2010. Of these, Asian vessels accounted for 73% of the total. By size of vessel, more than 85% of all fishing vessels in the world were small vessels with a length of 12 m or less. Fishing vessels with a length of 24 m or more only accounted for about 2% of the total, suggesting that most are small fishing vessels.
(Status of global fishery resources)
○ According to an FAO assessment of global fishery resources, overexploited fishery resources have increased. In 1974 when the FAO started resource assessment, overexploited fishery resources accounted for 10% of the total, but the percentage has increased to 30% by 2009. Meanwhile, the percentage of fully exploited fishery resources has increased from 50% in 1974 to 57% in 2009.
(Unit: vessels)
2003 2004 2005 2006 2007 2008 2009 2010 2011 2012
Japan Powered fishing vessels of 10 t or more (those that are actually in operation)
13,115 (10,547) 12,916 12,729 12,447 12,277 12,099
(9,742) 11,782 11,634 11,068 11,170
China Powered fishing vessels of 10 m or more ― ― ― ― ― 132,462 136,137 136,863 134,795 ―
South Korea Powered fishing vessels of 12 m or more 9,111 8,890 8,806 8,412 8,252 7,667 7,137 7,135 7,318 ―
Taiwan Powered fishing vessels of 10 t or more 5,871 5,886 5,918 5,859 5,784 5,674 5,585 5,664 5,287 5,240
Norway Powered fishing vessels of 12 m or more 1,766 1,655 1,533 1,478 1,459 1,332 1,309 1,287 1,264 1,236
Spain Powered fishing vessels of 12 m or more 3,721 3,675 3,612 3,523 3,408 3,290 3,142 2,992 2,869 2,771
New Zealand Powered fishing vessels of 12 m or more 706 687 660 618 568 555 543 543 549 543
[Number of fishing vessels of major countries and regions]
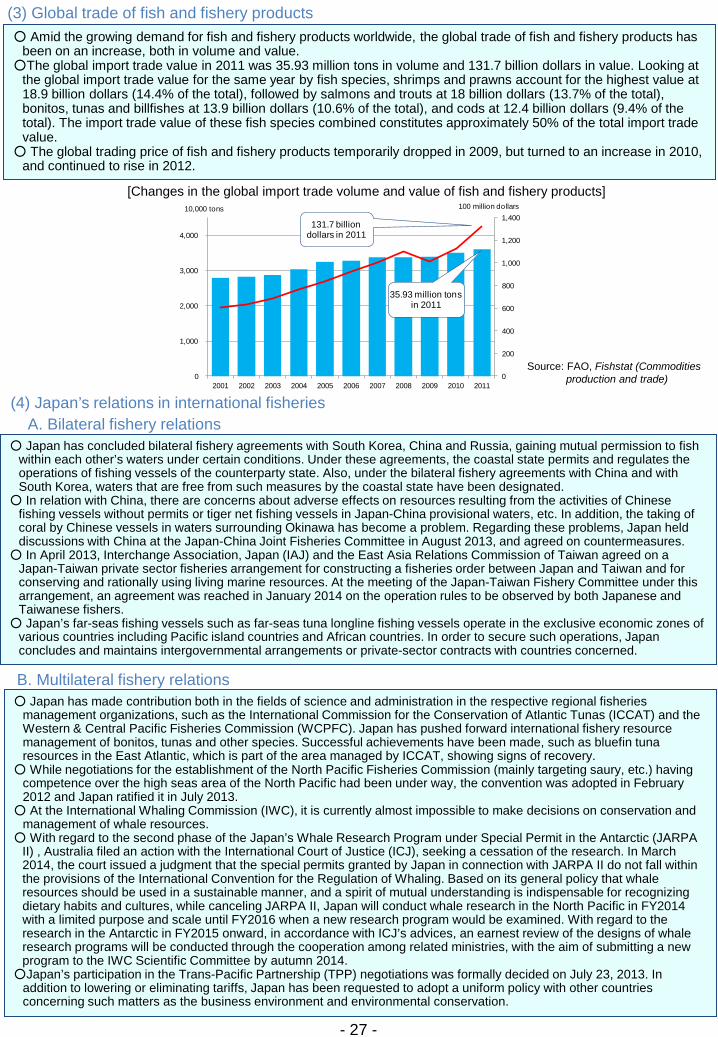
0
200
400
600
800
1,000
1,200
1,400
0
1,000
2,000
3,000
4,000
2001 2002 2003 2004 2005 2006 2007 2008 2009 2010 2011
10,000 tons
35.93 million tons in 2011
131.7 billion dollars in 2011
100 million dollars
○ Japan has made contribution both in the fields of science and administration in the respective regional fisheries management organizations, such as the International Commission for the Conservation of Atlantic Tunas (ICCAT) and the Western & Central Pacific Fisheries Commission (WCPFC). Japan has pushed forward international fishery resource management of bonitos, tunas and other species. Successful achievements have been made, such as bluefin tuna resources in the East Atlantic, which is part of the area managed by ICCAT, showing signs of recovery.
○ While negotiations for the establishment of the North Pacific Fisheries Commission (mainly targeting saury, etc.) having competence over the high seas area of the North Pacific had been under way, the convention was adopted in February 2012 and Japan ratified it in July 2013.
○ At the International Whaling Commission (IWC), it is currently almost impossible to make decisions on conservation and management of whale resources.
○ With regard to the second phase of the Japan’s Whale Research Program under Special Permit in the Antarctic (JARPA II) , Australia filed an action with the International Court of Justice (ICJ), seeking a cessation of the research. In March 2014, the court issued a judgment that the special permits granted by Japan in connection with JARPA II do not fall within the provisions of the International Convention for the Regulation of Whaling. Based on its general policy that whale resources should be used in a sustainable manner, and a spirit of mutual understanding is indispensable for recognizing dietary habits and cultures, while canceling JARPA II, Japan will conduct whale research in the North Pacific in FY2014 with a limited purpose and scale until FY2016 when a new research program would be examined. With regard to the research in the Antarctic in FY2015 onward, in accordance with ICJ’s advices, an earnest review of the designs of whale research programs will be conducted through the cooperation among related ministries, with the aim of submitting a new program to the IWC Scientific Committee by autumn 2014.
○Japan’s participation in the Trans-Pacific Partnership (TPP) negotiations was formally decided on July 23, 2013. In addition to lowering or eliminating tariffs, Japan has been requested to adopt a uniform policy with other countries concerning such matters as the business environment and environmental conservation.
- 27 -
B. Multilateral fishery relations
○ Japan has concluded bilateral fishery agreements with South Korea, China and Russia, gaining mutual permission to fish within each other’s waters under certain conditions. Under these agreements, the coastal state permits and regulates the operations of fishing vessels of the counterparty state. Also, under the bilateral fishery agreements with China and with South Korea, waters that are free from such measures by the coastal state have been designated.
○ In relation with China, there are concerns about adverse effects on resources resulting from the activities of Chinese fishing vessels without permits or tiger net fishing vessels in Japan-China provisional waters, etc. In addition, the taking of coral by Chinese vessels in waters surrounding Okinawa has become a problem. Regarding these problems, Japan held discussions with China at the Japan-China Joint Fisheries Committee in August 2013, and agreed on countermeasures.
○ In April 2013, Interchange Association, Japan (IAJ) and the East Asia Relations Commission of Taiwan agreed on a Japan-Taiwan private sector fisheries arrangement for constructing a fisheries order between Japan and Taiwan and for conserving and rationally using living marine resources. At the meeting of the Japan-Taiwan Fishery Committee under this arrangement, an agreement was reached in January 2014 on the operation rules to be observed by both Japanese and Taiwanese fishers.
○ Japan’s far-seas fishing vessels such as far-seas tuna longline fishing vessels operate in the exclusive economic zones of various countries including Pacific island countries and African countries. In order to secure such operations, Japan concludes and maintains intergovernmental arrangements or private-sector contracts with countries concerned.
(4) Japan’s relations in international fisheries A. Bilateral fishery relations
○ Amid the growing demand for fish and fishery products worldwide, the global trade of fish and fishery products has been on an increase, both in volume and value.
○The global import trade value in 2011 was 35.93 million tons in volume and 131.7 billion dollars in value. Looking at the global import trade value for the same year by fish species, shrimps and prawns account for the highest value at 18.9 billion dollars (14.4% of the total), followed by salmons and trouts at 18 billion dollars (13.7% of the total), bonitos, tunas and billfishes at 13.9 billion dollars (10.6% of the total), and cods at 12.4 billion dollars (9.4% of the total). The import trade value of these fish species combined constitutes approximately 50% of the total import trade value.
○ The global trading price of fish and fishery products temporarily dropped in 2009, but turned to an increase in 2010, and continued to rise in 2012.
(3) Global trade of fish and fishery products
[Changes in the global import trade volume and value of fish and fishery products]
Source: FAO, Fishstat (Commodities production and trade)
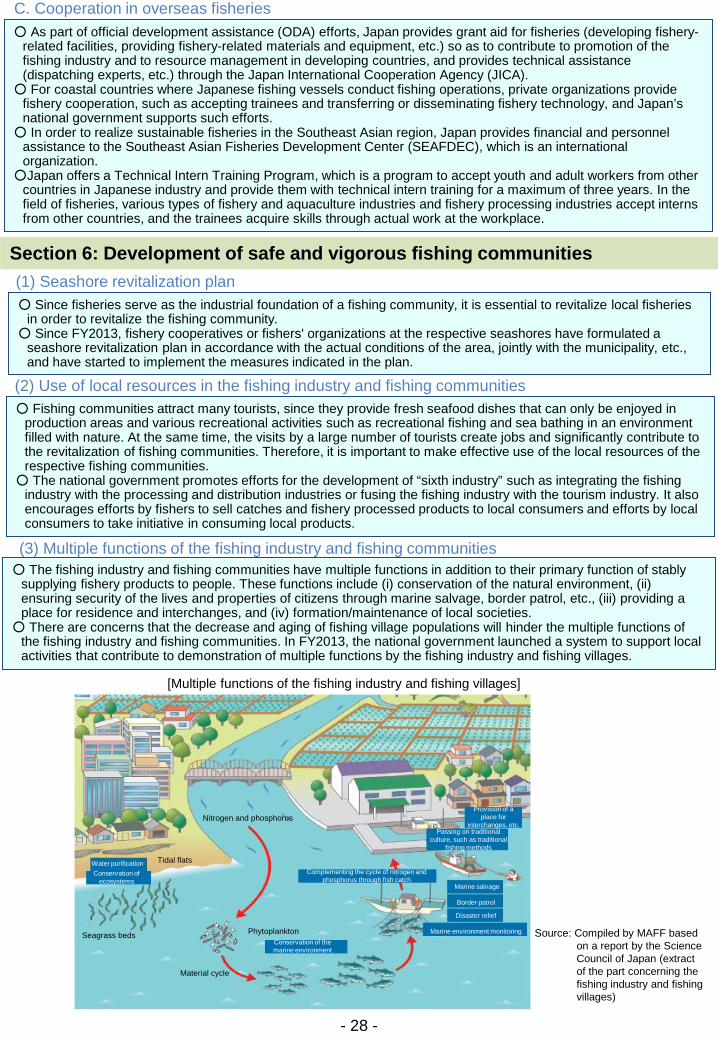
C. Cooperation in overseas fisheries ○ As part of official development assistance (ODA) efforts, Japan provides grant aid for fisheries (developing fishery-
related facilities, providing fishery-related materials and equipment, etc.) so as to contribute to promotion of the fishing industry and to resource management in developing countries, and provides technical assistance (dispatching experts, etc.) through the Japan International Cooperation Agency (JICA).
○ For coastal countries where Japanese fishing vessels conduct fishing operations, private organizations provide fishery cooperation, such as accepting trainees and transferring or disseminating fishery technology, and Japan’s national government supports such efforts.
○ In order to realize sustainable fisheries in the Southeast Asian region, Japan provides financial and personnel assistance to the Southeast Asian Fisheries Development Center (SEAFDEC), which is an international organization.
○Japan offers a Technical Intern Training Program, which is a program to accept youth and adult workers from other countries in Japanese industry and provide them with technical intern training for a maximum of three years. In the field of fisheries, various types of fishery and aquaculture industries and fishery processing industries accept interns from other countries, and the trainees acquire skills through actual work at the workplace.
Section 6: Development of safe and vigorous fishing communities
- 28 -
(1) Seashore revitalization plan
○ Since fisheries serve as the industrial foundation of a fishing community, it is essential to revitalize local fisheries in order to revitalize the fishing community.
○ Since FY2013, fishery cooperatives or fishers' organizations at the respective seashores have formulated a seashore revitalization plan in accordance with the actual conditions of the area, jointly with the municipality, etc., and have started to implement the measures indicated in the plan.
(2) Use of local resources in the fishing industry and fishing communities ○ Fishing communities attract many tourists, since they provide fresh seafood dishes that can only be enjoyed in
production areas and various recreational activities such as recreational fishing and sea bathing in an environment filled with nature. At the same time, the visits by a large number of tourists create jobs and significantly contribute to the revitalization of fishing communities. Therefore, it is important to make effective use of the local resources of the respective fishing communities.
○ The national government promotes efforts for the development of “sixth industry” such as integrating the fishing industry with the processing and distribution industries or fusing the fishing industry with the tourism industry. It also encourages efforts by fishers to sell catches and fishery processed products to local consumers and efforts by local consumers to take initiative in consuming local products.
(3) Multiple functions of the fishing industry and fishing communities ○ The fishing industry and fishing communities have multiple functions in addition to their primary function of stably
supplying fishery products to people. These functions include (i) conservation of the natural environment, (ii) ensuring security of the lives and properties of citizens through marine salvage, border patrol, etc., (iii) providing a place for residence and interchanges, and (iv) formation/maintenance of local societies.
○ There are concerns that the decrease and aging of fishing village populations will hinder the multiple functions of the fishing industry and fishing communities. In FY2013, the national government launched a system to support local activities that contribute to demonstration of multiple functions by the fishing industry and fishing villages.
[Multiple functions of the fishing industry and fishing villages]
Source: Compiled by MAFF based on a report by the Science Council of Japan (extract of the part concerning the fishing industry and fishing villages)
Marine environment monitoring
Water purification Conservation of
ecosystems
Tidal flats
Seagrass beds
Nitrogen and phosphorus
Phytoplankton
Material cycle
Conservation of the marine environment
Complementing the cycle of nitrogen and phosphorus through fish catch
Provision of a place for
interchanges, etc. Passing on traditional
culture, such as traditional fishing methods
Marine salvage
Border patrol
Disaster relief
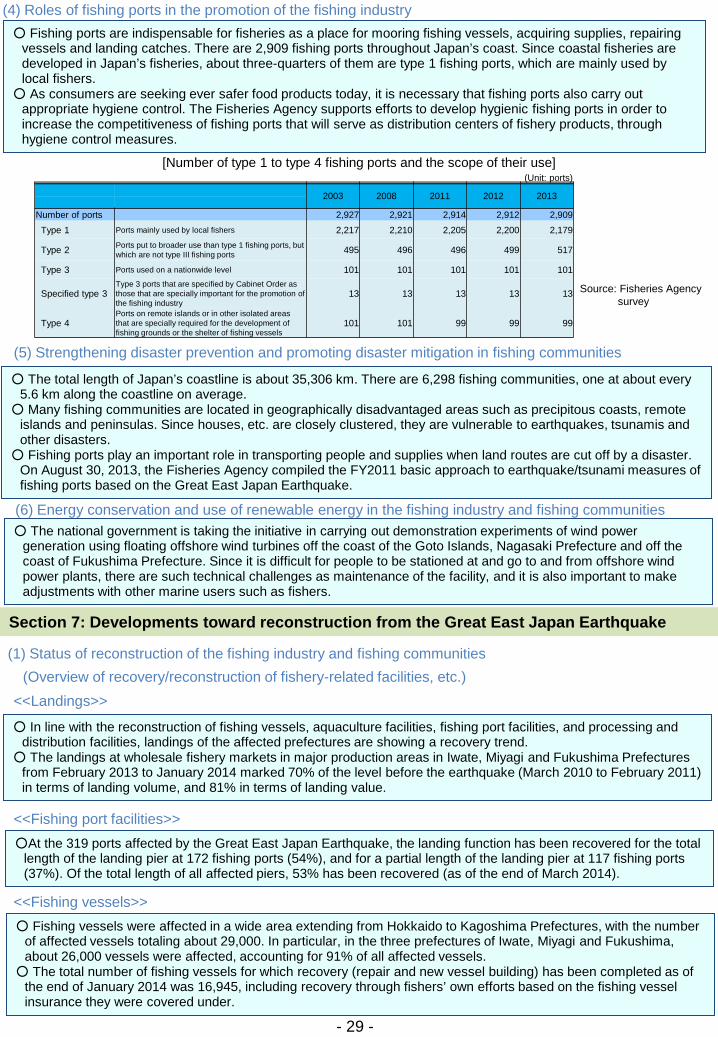
- 29 -
(6) Energy conservation and use of renewable energy in the fishing industry and fishing communities ○ The national government is taking the initiative in carrying out demonstration experiments of wind power
generation using floating offshore wind turbines off the coast of the Goto Islands, Nagasaki Prefecture and off the coast of Fukushima Prefecture. Since it is difficult for people to be stationed at and go to and from offshore wind power plants, there are such technical challenges as maintenance of the facility, and it is also important to make adjustments with other marine users such as fishers.
○ Fishing ports are indispensable for fisheries as a place for mooring fishing vessels, acquiring supplies, repairing vessels and landing catches. There are 2,909 fishing ports throughout Japan’s coast. Since coastal fisheries are developed in Japan’s fisheries, about three-quarters of them are type 1 fishing ports, which are mainly used by local fishers.
○ As consumers are seeking ever safer food products today, it is necessary that fishing ports also carry out appropriate hygiene control. The Fisheries Agency supports efforts to develop hygienic fishing ports in order to increase the competitiveness of fishing ports that will serve as distribution centers of fishery products, through hygiene control measures.
(4) Roles of fishing ports in the promotion of the fishing industry
(5) Strengthening disaster prevention and promoting disaster mitigation in fishing communities
○ The total length of Japan’s coastline is about 35,306 km. There are 6,298 fishing communities, one at about every 5.6 km along the coastline on average.
○ Many fishing communities are located in geographically disadvantaged areas such as precipitous coasts, remote islands and peninsulas. Since houses, etc. are closely clustered, they are vulnerable to earthquakes, tsunamis and other disasters.
○ Fishing ports play an important role in transporting people and supplies when land routes are cut off by a disaster. On August 30, 2013, the Fisheries Agency compiled the FY2011 basic approach to earthquake/tsunami measures of fishing ports based on the Great East Japan Earthquake.
Source: Fisheries Agency survey
Section 7: Developments toward reconstruction from the Great East Japan Earthquake
○ In line with the reconstruction of fishing vessels, aquaculture facilities, fishing port facilities, and processing and distribution facilities, landings of the affected prefectures are showing a recovery trend.
○ The landings at wholesale fishery markets in major production areas in Iwate, Miyagi and Fukushima Prefectures from February 2013 to January 2014 marked 70% of the level before the earthquake (March 2010 to February 2011) in terms of landing volume, and 81% in terms of landing value.
(1) Status of reconstruction of the fishing industry and fishing communities
<<Landings>> (Overview of recovery/reconstruction of fishery-related facilities, etc.)
<<Fishing port facilities>> ○At the 319 ports affected by the Great East Japan Earthquake, the landing function has been recovered for the total
length of the landing pier at 172 fishing ports (54%), and for a partial length of the landing pier at 117 fishing ports (37%). Of the total length of all affected piers, 53% has been recovered (as of the end of March 2014).
<<Fishing vessels>> ○ Fishing vessels were affected in a wide area extending from Hokkaido to Kagoshima Prefectures, with the number
of affected vessels totaling about 29,000. In particular, in the three prefectures of Iwate, Miyagi and Fukushima, about 26,000 vessels were affected, accounting for 91% of all affected vessels.
○ The total number of fishing vessels for which recovery (repair and new vessel building) has been completed as of the end of January 2014 was 16,945, including recovery through fishers’ own efforts based on the fishing vessel insurance they were covered under.
(Unit: ports) 2003 2008 2011 2012 2013 Number of ports 2,927 2,921 2,914 2,912 2,909 Type 1 Ports mainly used by local fishers 2,217 2,210 2,205 2,200 2,179
Type 2 Ports put to broader use than type 1 fishing ports, but which are not type III fishing ports 495 496 496 499 517
Type 3 Ports used on a nationwide level 101 101 101 101 101
Specified type 3 Type 3 ports that are specified by Cabinet Order as those that are specially important for the promotion of the fishing industry
13 13 13 13 13
Type 4 Ports on remote islands or in other isolated areas that are specially required for the development of fishing grounds or the shelter of fishing vessels
101 101 99 99 99
[Number of type 1 to type 4 fishing ports and the scope of their use]
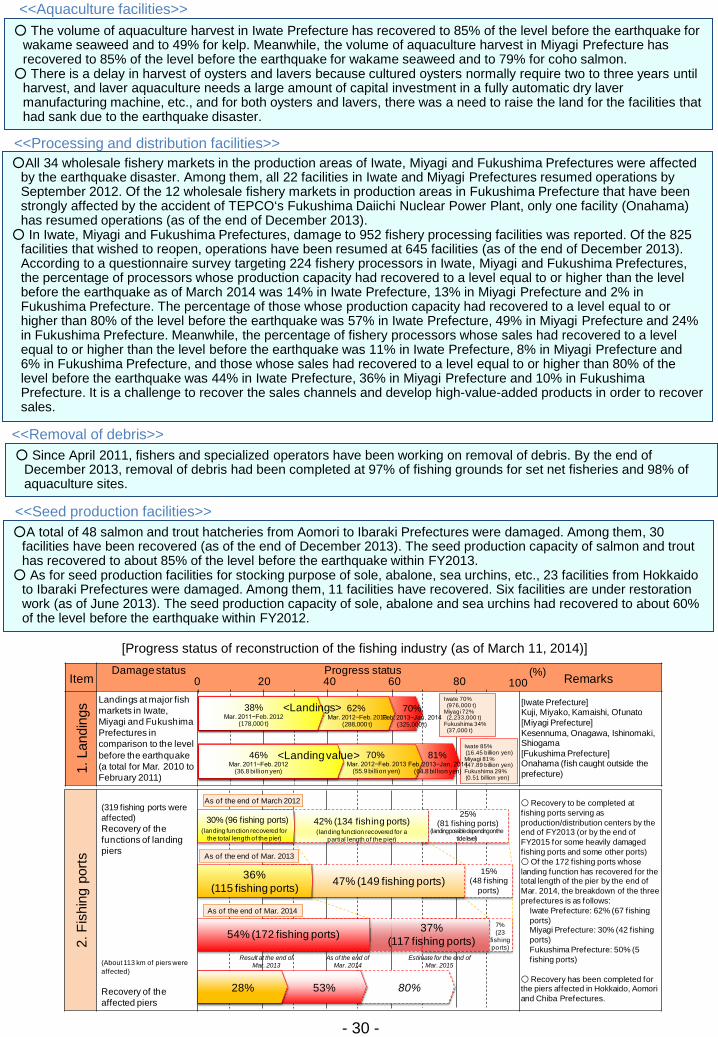
Item Remarks
1. L
andi
ngs Landings at major fish
markets in Iwate, Miyagi and Fukushima Prefectures in comparison to the level before the earthquake (a total for Mar. 2010 to February 2011)
[Iwate Prefecture]Kuji, Miyako, Kamaishi, Ofunato[Miyagi Prefecture]Kesennuma, Onagawa, Ishinomaki, Shiogama[Fukushima Prefecture]Onahama (fish caught outside the prefecture)
0 20 40 60 80 100Progress status (%)
Iwate 70% (976,000 t)
Miyagi 72% (2,233,000 t)
Fukushima 34% (37,000 t)
Iwate 85% (16.45 billion yen)Miyagi 81% (47.89 billion yen)Fukushima 29% (0.51 billion yen)
81% Feb. 2013−Jan. 2014
(64.8 billion yen)
46%Mar. 2011−Feb. 2012
(36.8 billion yen)
70% Mar. 2012−Feb. 2013
(55.9 billion yen)
38%Mar. 2011−Feb. 2012
(178,000 t)
62% Mar. 2012−Feb. 2013
(288,000 t)
70%Feb. 2013−Jan. 2014
(325,000 t)
2. F
ishi
ng p
orts
(319 fishing ports were affected)Recovery of the functions of landing piers
(About 113 km of piers were affected)
Recovery of the affected piers
○ Recovery to be completed at f ishing ports serving as production/distribution centers by the end of FY2013 (or by the end of FY2015 for some heavily damaged fishing ports and some other ports)○ Of the 172 fishing ports whose landing function has recovered for the total length of the pier by the end of Mar. 2014, the breakdown of the three prefectures is as follows:
Iwate Prefecture: 62% (67 fishing ports)Miyagi Prefecture: 30% (42 fishing ports)Fukushima Prefecture: 50% (5 fishing ports)
○ Recovery has been completed for the piers affected in Hokkaido, Aomori and Chiba Prefectures.
37% (117 fishing ports)
53% 80%
54% (172 fishing ports)
As of the end of March 2012
As of the end of Mar. 2014
(landing function recovered for the total length of the pier)
(landing function recovered for a partial length of the pier)
7% (23
fishing ports)
(landing possible depending on the tide level)
36% (115 fishing ports) 47% (149 fishing ports)
15%(48 fishing
ports)
30% (96 fishing ports) 42% (134 fishing ports)25%
(81 fishing ports)
Estimate for the end of Mar. 2015
As of the end of Mar. 2014
Result at the end of Mar. 2013
28%
As of the end of Mar. 2013
<Landings>
<Landing value>
Damage status
○All 34 wholesale fishery markets in the production areas of Iwate, Miyagi and Fukushima Prefectures were affected by the earthquake disaster. Among them, all 22 facilities in Iwate and Miyagi Prefectures resumed operations by September 2012. Of the 12 wholesale fishery markets in production areas in Fukushima Prefecture that have been strongly affected by the accident of TEPCO‘s Fukushima Daiichi Nuclear Power Plant, only one facility (Onahama) has resumed operations (as of the end of December 2013).
○ In Iwate, Miyagi and Fukushima Prefectures, damage to 952 fishery processing facilities was reported. Of the 825 facilities that wished to reopen, operations have been resumed at 645 facilities (as of the end of December 2013). According to a questionnaire survey targeting 224 fishery processors in Iwate, Miyagi and Fukushima Prefectures, the percentage of processors whose production capacity had recovered to a level equal to or higher than the level before the earthquake as of March 2014 was 14% in Iwate Prefecture, 13% in Miyagi Prefecture and 2% in Fukushima Prefecture. The percentage of those whose production capacity had recovered to a level equal to or higher than 80% of the level before the earthquake was 57% in Iwate Prefecture, 49% in Miyagi Prefecture and 24% in Fukushima Prefecture. Meanwhile, the percentage of fishery processors whose sales had recovered to a level equal to or higher than the level before the earthquake was 11% in Iwate Prefecture, 8% in Miyagi Prefecture and 6% in Fukushima Prefecture, and those whose sales had recovered to a level equal to or higher than 80% of the level before the earthquake was 44% in Iwate Prefecture, 36% in Miyagi Prefecture and 10% in Fukushima Prefecture. It is a challenge to recover the sales channels and develop high-value-added products in order to recover sales.
<<Aquaculture facilities>>
<<Removal of debris>>
○ The volume of aquaculture harvest in Iwate Prefecture has recovered to 85% of the level before the earthquake for wakame seaweed and to 49% for kelp. Meanwhile, the volume of aquaculture harvest in Miyagi Prefecture has recovered to 85% of the level before the earthquake for wakame seaweed and to 79% for coho salmon.
○ There is a delay in harvest of oysters and lavers because cultured oysters normally require two to three years until harvest, and laver aquaculture needs a large amount of capital investment in a fully automatic dry laver manufacturing machine, etc., and for both oysters and lavers, there was a need to raise the land for the facilities that had sank due to the earthquake disaster.
○ Since April 2011, fishers and specialized operators have been working on removal of debris. By the end of December 2013, removal of debris had been completed at 97% of fishing grounds for set net fisheries and 98% of aquaculture sites.
- 30 -
<<Seed production facilities>> ○A total of 48 salmon and trout hatcheries from Aomori to Ibaraki Prefectures were damaged. Among them, 30
facilities have been recovered (as of the end of December 2013). The seed production capacity of salmon and trout has recovered to about 85% of the level before the earthquake within FY2013.
○ As for seed production facilities for stocking purpose of sole, abalone, sea urchins, etc., 23 facilities from Hokkaido to Ibaraki Prefectures were damaged. Among them, 11 facilities have recovered. Six facilities are under restoration work (as of June 2013). The seed production capacity of sole, abalone and sea urchins had recovered to about 60% of the level before the earthquake within FY2012.
[Progress status of reconstruction of the fishing industry (as of March 11, 2014)]
<<Processing and distribution facilities>>
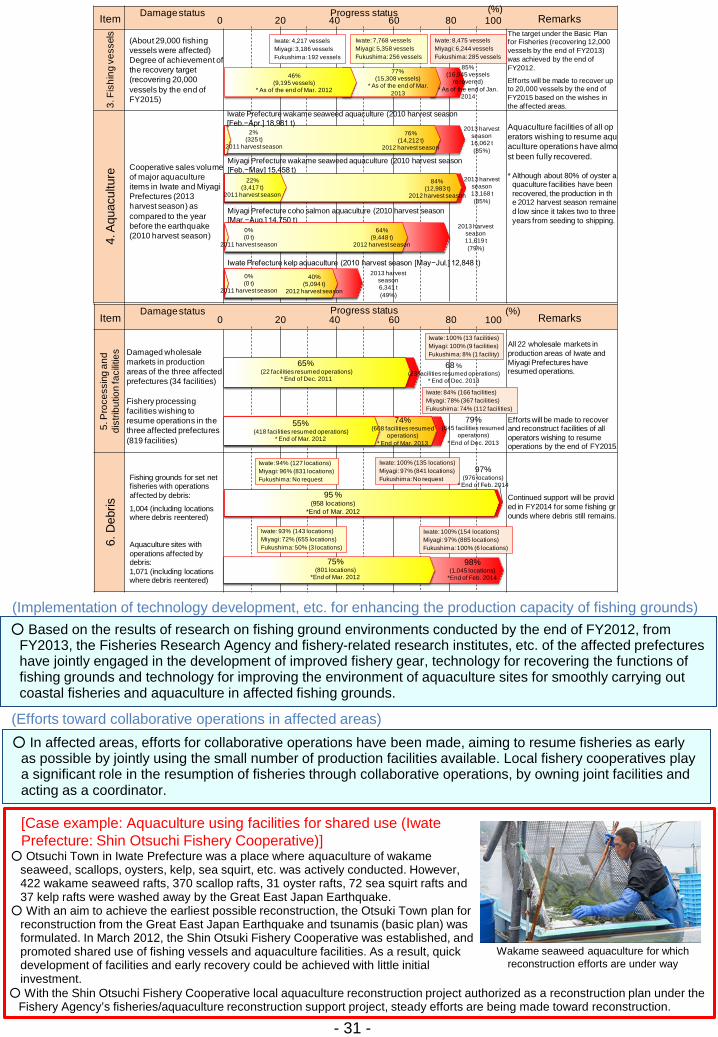
Item Remarks
5. P
roce
ssin
g an
d di
strib
utio
n fa
cilit
ies Damaged wholesale
markets in production areas of the three affected prefectures (34 facilities)
Fishery processing facilities wishing to resume operations in the three affected prefectures (819 facilities)
All 22 wholesale markets in production areas of Iwate and Miyagi Prefectures have resumed operations.
Efforts will be made to recover and reconstruct facilities of all operators wishing to resume operations by the end of FY2015.
6. D
ebris
Fishing grounds for set net fisheries with operations affected by debris:
1,004 (including locations where debris reentered)
Aquaculture sites with operations affected by debris: 1,071 (including locations where debris reentered)
Continued support will be provided in FY2014 for some fishing grounds where debris still remains.
0 20 40 60 80 100
Iwate: 100% (13 facilities)Miyagi: 100% (9 facilities)Fukushima: 8% (1 facility)
(%)
68 %(23 facilities resumed operations)
* End of Dec. 2013
65%(22 facilities resumed operations)
* End of Dec. 2011
Iwate: 100% (135 locations)Miyagi: 97% (841 locations)Fukushima: No request
Iwate: 94% (127 locations)Miyagi: 96% (831 locations)Fukushima: No request
95 %(958 locations)
*End of Mar. 2012
Iwate: 93% (143 locations)Miyagi: 72% (655 locations)Fukushima: 50% (3 locations)
Iwate: 100% (154 locations)Miyagi: 97% (885 locations)Fukushima: 100% (6 locations)
75%(801 locations)
*End of Mar. 2012
98%(1,045 locations)
*End of Feb. 2014
Iwate: 84% (166 facilities)Miyagi: 78% (367 facilities)Fukushima: 74% (112 facilities)
55%(418 facilities resumed operations)
* End of Mar. 2012
79%(645 facilities resumed
operations)* End of Dec. 2013
74%(608 facilities resumed
operations)* End of Mar. 2013
97%(976 locations)
* End of Feb. 2014
Damage status Progress status
Item Remarks
3. F
ishi
ng v
esse
ls (About 29,000 fishing vessels were affected)Degree of achievement of the recovery target (recovering 20,000 vessels by the end of FY2015)
The target under the Basic Plan for Fisheries (recovering 12,000 vessels by the end of FY2013) was achieved by the end of FY2012.
Efforts will be made to recover up to 20,000 vessels by the end of FY2015 based on the wishes in the affected areas.
4. A
quac
ultu
re
Cooperative sales volume of major aquaculture items in Iwate and Miyagi Prefectures (2013 harvest season) as compared to the year before the earthquake (2010 harvest season)
Aquaculture facilities of all operators wishing to resume aquaculture operations have almost been fully recovered.
* Although about 80% of oyster aquaculture facilities have been recovered, the production in the 2012 harvest season remained low since it takes two to three years from seeding to shipping.
0 20 40 60 80 100(%)
2013 harvest season16,062 t(85%)
Iwate Prefecture wakame seaweed aquaculture (2010 harvest season [Feb.−Apr.] 18,981 t)
76%(14,212 t)
2012 harvest season
Miyagi Prefecture wakame seaweed aquaculture (2010 harvest season [Feb.−May] 15,458 t)
2013 harvest season13,168 t(85%)
84%(12,983 t)
2012 harvest season
Miyagi Prefecture coho salmon aquaculture (2010 harvest season [Mar.−Aug.] 14,750 t)
2013 harvest season11,619 t(79%)
64%(9,448 t)
2012 harvest season
2013 harvest season6,341 t(49%)
40%(5,094 t)
2012 harvest season
Iwate Prefecture kelp aquaculture (2010 harvest season [May−Jul.] 12,848 t)
Iwate: 4,217 vesselsMiyagi: 3,186 vesselsFukushima: 192 vessels
Iwate: 7,768 vesselsMiyagi: 5,358 vesselsFukushima: 256 vessels
Iwate: 8,475 vesselsMiyagi: 6,244 vesselsFukushima: 285 vessels
77%(15,308 vessels)
* As of the end of Mar. 2013
85%(16,945 vessels
recovered)* As of the end of Jan.
2014
46%(9,195 vessels)
* As of the end of Mar. 2012
Damage status Progress status
2%(325 t)
2011 harvest season
22%(3,417 t)
2011 harvest season
0%(0 t)
2011 harvest season
0%(0 t)
2011 harvest season
- 31 -
(Implementation of technology development, etc. for enhancing the production capacity of fishing grounds) ○ Based on the results of research on fishing ground environments conducted by the end of FY2012, from
FY2013, the Fisheries Research Agency and fishery-related research institutes, etc. of the affected prefectures have jointly engaged in the development of improved fishery gear, technology for recovering the functions of fishing grounds and technology for improving the environment of aquaculture sites for smoothly carrying out coastal fisheries and aquaculture in affected fishing grounds.
(Efforts toward collaborative operations in affected areas) ○ In affected areas, efforts for collaborative operations have been made, aiming to resume fisheries as early
as possible by jointly using the small number of production facilities available. Local fishery cooperatives play a significant role in the resumption of fisheries through collaborative operations, by owning joint facilities and acting as a coordinator.
○ Otsuchi Town in Iwate Prefecture was a place where aquaculture of wakame seaweed, scallops, oysters, kelp, sea squirt, etc. was actively conducted. However, 422 wakame seaweed rafts, 370 scallop rafts, 31 oyster rafts, 72 sea squirt rafts and 37 kelp rafts were washed away by the Great East Japan Earthquake.
○ With an aim to achieve the earliest possible reconstruction, the Otsuki Town plan for reconstruction from the Great East Japan Earthquake and tsunamis (basic plan) was formulated. In March 2012, the Shin Otsuki Fishery Cooperative was established, and promoted shared use of fishing vessels and aquaculture facilities. As a result, quick development of facilities and early recovery could be achieved with little initial investment.
[Case example: Aquaculture using facilities for shared use (Iwate Prefecture: Shin Otsuchi Fishery Cooperative)]
Wakame seaweed aquaculture for which reconstruction efforts are under way
○ With the Shin Otsuchi Fishery Cooperative local aquaculture reconstruction project authorized as a reconstruction plan under the Fishery Agency’s fisheries/aquaculture reconstruction support project, steady efforts are being made toward reconstruction.
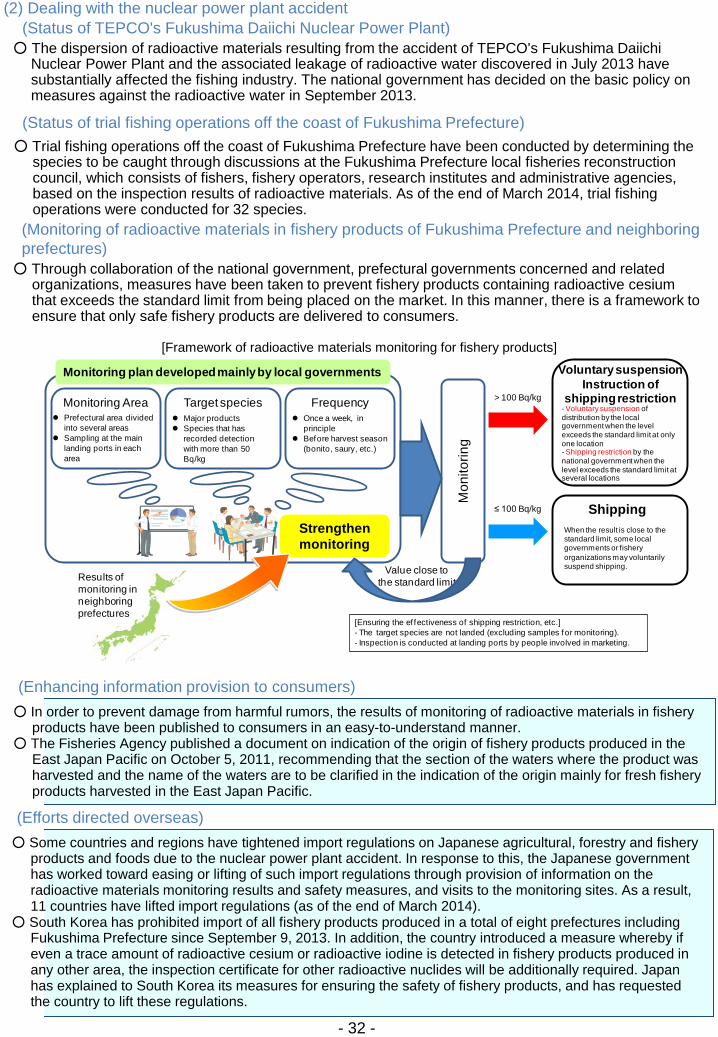
Mon
itorin
g
> 100 Bq/kg
≤ 100 Bq/kg
Strengthen monitoring
Monitoring plan developed mainly by local governments
Target species Major products Species that has
recorded detection with more than 50 Bq/kg
Monitoring Area Prefectural area divided
into several areas Sampling at the main
landing ports in each area
Frequency Once a week, in
principle Before harvest season
(bonito, saury, etc.)
Results of monitoring in neighboring prefectures
Value close to the standard limit
[Ensuring the ef fectiveness of shipping restriction, etc.]- The target species are not landed (excluding samples for monitoring).- Inspection is conducted at landing ports by people involved in marketing.
Voluntary suspensionInstruction of
shipping restriction- Voluntary suspension of distribution by the local government when the level exceeds the standard limit at only one location- Shipping restriction by the national government when the level exceeds the standard limit at several locations
ShippingWhen the result is close to the standard limit, some local governments or fishery organizations may voluntarily suspend shipping.
○ The dispersion of radioactive materials resulting from the accident of TEPCO's Fukushima Daiichi Nuclear Power Plant and the associated leakage of radioactive water discovered in July 2013 have substantially affected the fishing industry. The national government has decided on the basic policy on measures against the radioactive water in September 2013.
(2) Dealing with the nuclear power plant accident (Status of TEPCO's Fukushima Daiichi Nuclear Power Plant)
(Monitoring of radioactive materials in fishery products of Fukushima Prefecture and neighboring prefectures)
○ Through collaboration of the national government, prefectural governments concerned and related organizations, measures have been taken to prevent fishery products containing radioactive cesium that exceeds the standard limit from being placed on the market. In this manner, there is a framework to ensure that only safe fishery products are delivered to consumers.
(Status of trial fishing operations off the coast of Fukushima Prefecture) ○ Trial fishing operations off the coast of Fukushima Prefecture have been conducted by determining the
species to be caught through discussions at the Fukushima Prefecture local fisheries reconstruction council, which consists of fishers, fishery operators, research institutes and administrative agencies, based on the inspection results of radioactive materials. As of the end of March 2014, trial fishing operations were conducted for 32 species.
- 32 -
(Efforts directed overseas) ○ Some countries and regions have tightened import regulations on Japanese agricultural, forestry and fishery
products and foods due to the nuclear power plant accident. In response to this, the Japanese government has worked toward easing or lifting of such import regulations through provision of information on the radioactive materials monitoring results and safety measures, and visits to the monitoring sites. As a result, 11 countries have lifted import regulations (as of the end of March 2014).
○ South Korea has prohibited import of all fishery products produced in a total of eight prefectures including Fukushima Prefecture since September 9, 2013. In addition, the country introduced a measure whereby if even a trace amount of radioactive cesium or radioactive iodine is detected in fishery products produced in any other area, the inspection certificate for other radioactive nuclides will be additionally required. Japan has explained to South Korea its measures for ensuring the safety of fishery products, and has requested the country to lift these regulations.
(Enhancing information provision to consumers) ○ In order to prevent damage from harmful rumors, the results of monitoring of radioactive materials in fishery
products have been published to consumers in an easy-to-understand manner. ○ The Fisheries Agency published a document on indication of the origin of fishery products produced in the
East Japan Pacific on October 5, 2011, recommending that the section of the waters where the product was harvested and the name of the waters are to be clarified in the indication of the origin mainly for fresh fishery products harvested in the East Japan Pacific.
[Framework of radioactive materials monitoring for fishery products]
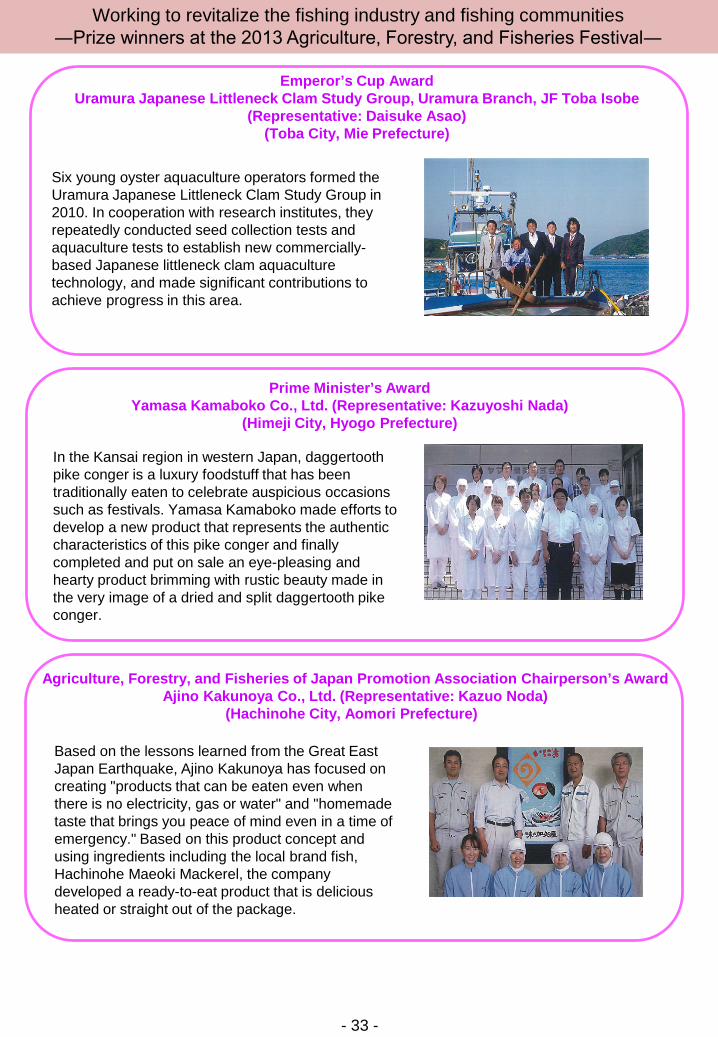
Emperor’s Cup Award Uramura Japanese Littleneck Clam Study Group, Uramura Branch, JF Toba Isobe
(Representative: Daisuke Asao) (Toba City, Mie Prefecture)
Prime Minister’s Award Yamasa Kamaboko Co., Ltd. (Representative: Kazuyoshi Nada)
(Himeji City, Hyogo Prefecture)
Agriculture, Forestry, and Fisheries of Japan Promotion Association Chairperson’s Award Ajino Kakunoya Co., Ltd. (Representative: Kazuo Noda)
(Hachinohe City, Aomori Prefecture)
Working to revitalize the fishing industry and fishing communities ―Prize winners at the 2013 Agriculture, Forestry, and Fisheries Festival―
Six young oyster aquaculture operators formed the Uramura Japanese Littleneck Clam Study Group in 2010. In cooperation with research institutes, they repeatedly conducted seed collection tests and aquaculture tests to establish new commercially-based Japanese littleneck clam aquaculture technology, and made significant contributions to achieve progress in this area.
In the Kansai region in western Japan, daggertooth pike conger is a luxury foodstuff that has been traditionally eaten to celebrate auspicious occasions such as festivals. Yamasa Kamaboko made efforts to develop a new product that represents the authentic characteristics of this pike conger and finally completed and put on sale an eye-pleasing and hearty product brimming with rustic beauty made in the very image of a dried and split daggertooth pike conger.
Based on the lessons learned from the Great East Japan Earthquake, Ajino Kakunoya has focused on creating "products that can be eaten even when there is no electricity, gas or water" and "homemade taste that brings you peace of mind even in a time of emergency." Based on this product concept and using ingredients including the local brand fish, Hachinohe Maeoki Mackerel, the company developed a ready-to-eat product that is delicious heated or straight out of the package.
- 33 -
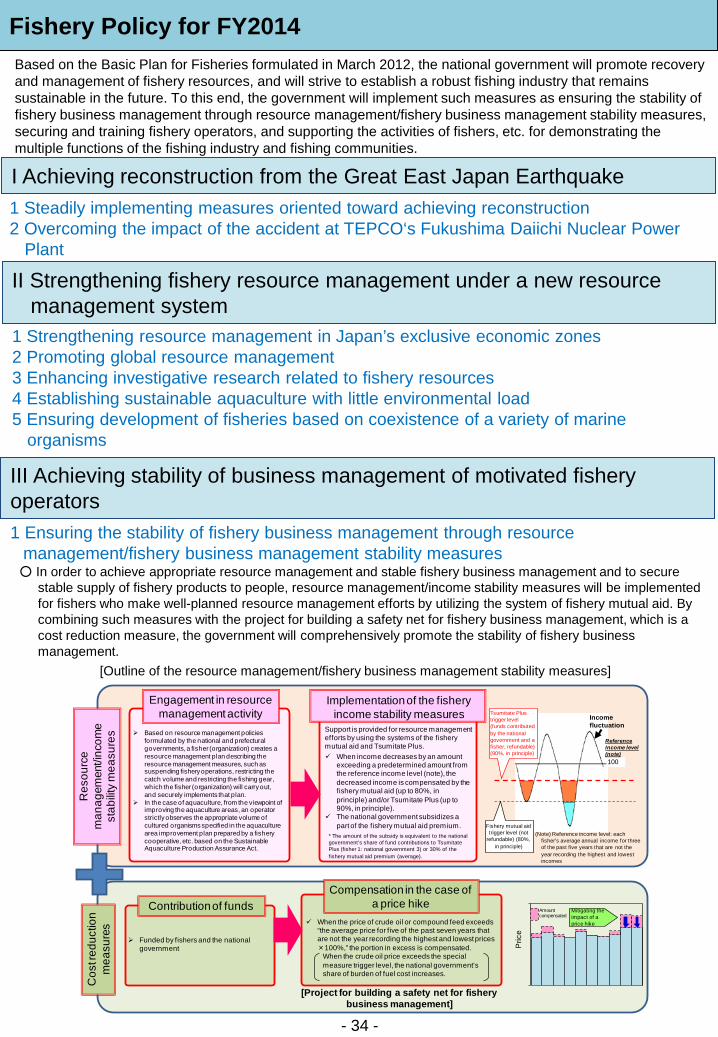
Fishery Policy for FY2014
I Achieving reconstruction from the Great East Japan Earthquake 1 Steadily implementing measures oriented toward achieving reconstruction 2 Overcoming the impact of the accident at TEPCO‘s Fukushima Daiichi Nuclear Power
Plant
II Strengthening fishery resource management under a new resource management system
1 Strengthening resource management in Japan’s exclusive economic zones 2 Promoting global resource management 3 Enhancing investigative research related to fishery resources 4 Establishing sustainable aquaculture with little environmental load 5 Ensuring development of fisheries based on coexistence of a variety of marine
organisms
III Achieving stability of business management of motivated fishery operators 1 Ensuring the stability of fishery business management through resource
management/fishery business management stability measures ○ In order to achieve appropriate resource management and stable fishery business management and to secure
stable supply of fishery products to people, resource management/income stability measures will be implemented for fishers who make well-planned resource management efforts by utilizing the system of fishery mutual aid. By combining such measures with the project for building a safety net for fishery business management, which is a cost reduction measure, the government will comprehensively promote the stability of fishery business management.
[Outline of the resource management/fishery business management stability measures]
Based on the Basic Plan for Fisheries formulated in March 2012, the national government will promote recovery and management of fishery resources, and will strive to establish a robust fishing industry that remains sustainable in the future. To this end, the government will implement such measures as ensuring the stability of fishery business management through resource management/fishery business management stability measures, securing and training fishery operators, and supporting the activities of fishers, etc. for demonstrating the multiple functions of the fishing industry and fishing communities.
- 34 -
Engagement in resource management activity Tsumitate Plus
trigger level (funds contributed by the national government and a fisher; refundable) (90%, in principle)
Fishery mutual aid trigger level (not
refundable) (80%, in principle)
Income fluctuation
100
Reference Income level (note)
(Note) Reference income level: each fisher’s average annual income for three of the past five years that are not the year recording the highest and lowest incomes
Based on resource management policies formulated by the national and prefectural governments, a fisher (organization) creates a resource management plan describing the resource management measures, such as suspending fishery operations, restricting the catch volume and restricting the fishing gear, which the fisher (organization) will carry out, and securely implements that plan.
In the case of aquaculture, from the viewpoint of improving the aquaculture areas, an operator strictly observes the appropriate volume of cultured organisms specified in the aquaculture area improvement plan prepared by a fishery cooperative, etc. based on the Sustainable Aquaculture Production Assurance Act.
Implementation of the fishery income stability measures
When income decreases by an amount exceeding a predetermined amount from the reference income level (note), the decreased income is compensated by the fishery mutual aid (up to 80%, in principle) and/or Tsumitate Plus (up to 90%, in principle).
The national government subsidizes a part of the fishery mutual aid premium.
Support is provided for resource management efforts by using the systems of the fishery mutual aid and Tsumitate Plus.
* The amount of the subsidy is equivalent to the national government’s share of fund contributions to TsumitatePlus (fisher 1: national government 3) or 30% of the fishery mutual aid premium (average).
Res
ourc
e m
anag
emen
t/inc
ome
stab
ility
mea
sure
s
Contribution of funds
Funded by fishers and the national government
When the price of crude oil or compound feed exceeds “the average price for five of the past seven years that are not the year recording the highest and lowest prices ×100%,” the portion in excess is compensated.
When the crude oil price exceeds the special measure trigger level, the national government’s share of burden of fuel cost increases.
Compensation in the case of a price hike
[Project for building a safety net for fishery business management]
0.0
90.0 Mitigating the impact of a price hike
Pric
e
Amount compensated
Cos
t red
uctio
n m
easu
res
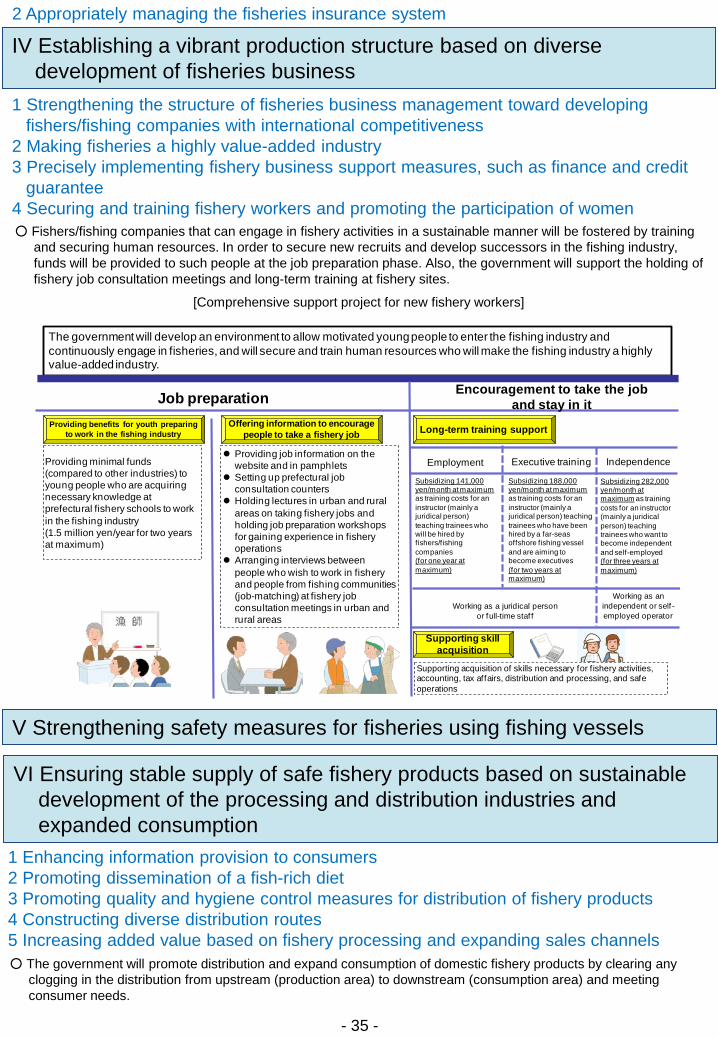
V Strengthening safety measures for fisheries using fishing vessels
1 Strengthening the structure of fisheries business management toward developing fishers/fishing companies with international competitiveness
2 Making fisheries a highly value-added industry 3 Precisely implementing fishery business support measures, such as finance and credit
guarantee 4 Securing and training fishery workers and promoting the participation of women
1 Enhancing information provision to consumers 2 Promoting dissemination of a fish-rich diet 3 Promoting quality and hygiene control measures for distribution of fishery products 4 Constructing diverse distribution routes 5 Increasing added value based on fishery processing and expanding sales channels
[Comprehensive support project for new fishery workers]
○ Fishers/fishing companies that can engage in fishery activities in a sustainable manner will be fostered by training and securing human resources. In order to secure new recruits and develop successors in the fishing industry, funds will be provided to such people at the job preparation phase. Also, the government will support the holding of fishery job consultation meetings and long-term training at fishery sites.
- 35 -
2 Appropriately managing the fisheries insurance system
IV Establishing a vibrant production structure based on diverse development of fisheries business
○ The government will promote distribution and expand consumption of domestic fishery products by clearing any clogging in the distribution from upstream (production area) to downstream (consumption area) and meeting consumer needs.
VI Ensuring stable supply of safe fishery products based on sustainable development of the processing and distribution industries and expanded consumption
The government will develop an environment to allow motivated young people to enter the fishing industry and continuously engage in fisheries, and will secure and train human resources who will make the fishing industry a highly value-added industry.
Providing job information on the website and in pamphlets
Setting up prefectural job consultation counters
Holding lectures in urban and rural areas on taking fishery jobs and holding job preparation workshops for gaining experience in fishery operations
Arranging interviews between people who wish to work in fishery and people from fishing communities (job-matching) at fishery job consultation meetings in urban and rural areas
Subsidizing 141,000 yen/month at maximumas training costs for an instructor (mainly a juridical person) teaching trainees who will be hired by fishers/fishing companies(for one year at maximum)
Supporting acquisition of skills necessary for f ishery activities, accounting, tax affairs, distribution and processing, and safe operations
Offering information to encourage people to take a fishery job
Supporting skill acquisition
Providing benefits for youth preparing to work in the fishing industry
Job preparation Encouragement to take the job and stay in it
EmploymentProviding minimal funds (compared to other industries) to young people who are acquiring necessary knowledge at prefectural fishery schools to work in the fishing industry(1.5 million yen/year for two years at maximum)
Executive training Independence
Subsidizing 188,000 yen/month at maximumas training costs for an instructor (mainly a juridical person) teaching trainees who have been hired by a far-seas offshore fishing vessel and are aiming to become executives(for two years at maximum)
Subsidizing 282,000 yen/month at maximum as training costs for an instructor (mainly a juridical person) teaching trainees who want to become independent and self-employed(for three years at maximum)
Long-term training support
Working as an independent or self -employed operator
Working as a juridical person or full-time staf f
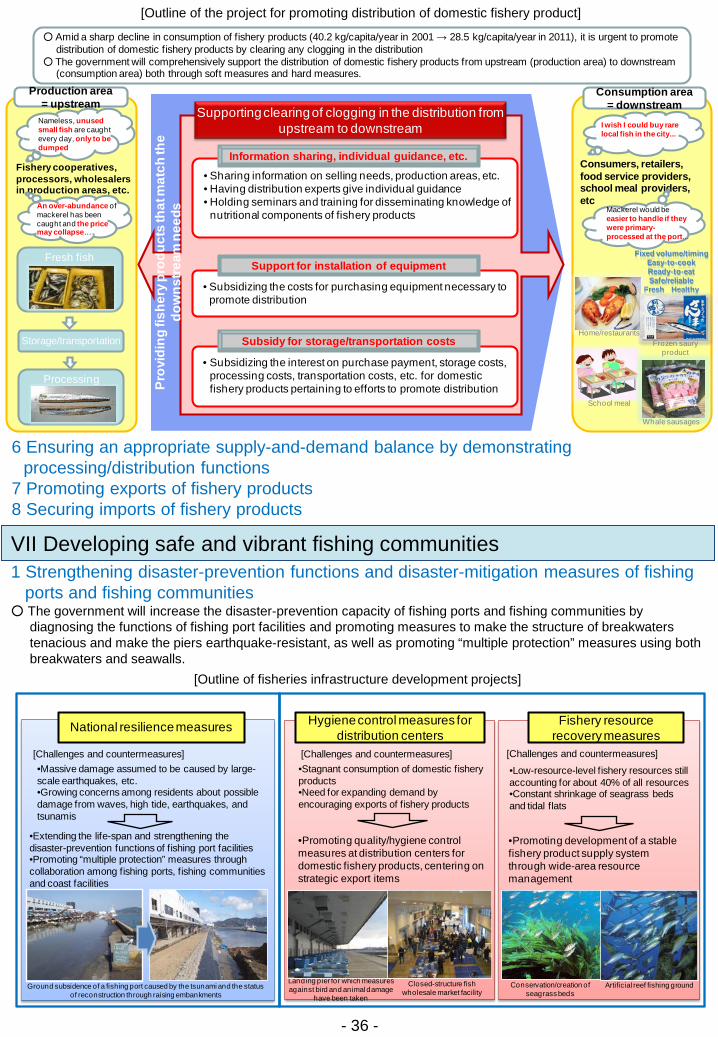
Hygiene control measures for distribution centers
•Stagnant consumption of domestic fishery products•Need for expanding demand by encouraging exports of fishery products
[Challenges and countermeasures]
•Promoting quality/hygiene control measures at distribution centers for domestic fishery products, centering on strategic export items
Closed-structure fish wholesale market facility
Landing pier for which measures against bird and animal damage
have been taken
Fishery resource recovery measures
[Challenges and countermeasures]
Conservation/creation of seagrassbeds
Artificial reef fishing ground
•Promoting development of a stable fishery product supply system through wide-area resource management
•Low-resource-level fishery resources still accounting for about 40% of all resources•Constant shrinkage of seagrass beds and tidal flats
[Challenges and countermeasures]•Massive damage assumed to be caused by large-scale earthquakes, etc.•Growing concerns among residents about possible damage from waves, high tide, earthquakes, and tsunamis
•Extending the life-span and strengthening the disaster-prevention functions of fishing port facilities•Promoting “multiple protection” measures through collaboration among fishing ports, fishing communities and coast facilities
National resilience measures
Ground subsidence of a fishing port caused by the tsunami and the status of reconstruction through raising embankments
Consumers, retailers, food service providers, school meal providers, etc
Fishery cooperatives, processors, wholesalers in production areas, etc.
○ Amid a sharp decline in consumption of fishery products (40.2 kg/capita/year in 2001 → 28.5 kg/capita/year in 2011), it is urgent to promote distribution of domestic fishery products by clearing any clogging in the distribution
○ The government will comprehensively support the distribution of domestic fishery products from upstream (production area) to downstream (consumption area) both through soft measures and hard measures.
• Sharing information on selling needs, production areas, etc.• Having distribution experts give individual guidance• Holding seminars and training for disseminating knowledge of
nutritional components of fishery products
Storage/transportation
• Subsidizing the costs for purchasing equipment necessary to promote distribution
Fresh fish
Processing
Information sharing, individual guidance, etc.
Production area = upstream
Consumption area = downstream
Fixed volume/timingEasy-to-cook Ready-to-eatSafe/reliable
Fresh Healthy
Supporting clearing of clogging in the distribution from upstream to downstream
Nameless, unused small fish are caught every day, only to be dumped
I wish I could buy rare local fish in the city...
Mackerel would be easier to handle if they were primary-processed at the port...
」
An over-abundance of mackerel has been caught and the price may collapse…
Support for installation of equipment
• Subsidizing the interest on purchase payment, storage costs, processing costs, transportation costs, etc. for domestic fishery products pertaining to efforts to promote distribution
Subsidy for storage/transportation costsHome/restaurants
Frozen sauryproduct
Whale sausages
School meal
Prov
idin
g fis
hery
pro
duct
s th
at m
atch
the
dow
nstre
am n
eeds
VII Developing safe and vibrant fishing communities 1 Strengthening disaster-prevention functions and disaster-mitigation measures of fishing
ports and fishing communities
[Outline of the project for promoting distribution of domestic fishery product]
- 36 -
○ The government will increase the disaster-prevention capacity of fishing ports and fishing communities by diagnosing the functions of fishing port facilities and promoting measures to make the structure of breakwaters tenacious and make the piers earthquake-resistant, as well as promoting “multiple protection” measures using both breakwaters and seawalls.
6 Ensuring an appropriate supply-and-demand balance by demonstrating processing/distribution functions
7 Promoting exports of fishery products 8 Securing imports of fishery products
[Outline of fisheries infrastructure development projects]
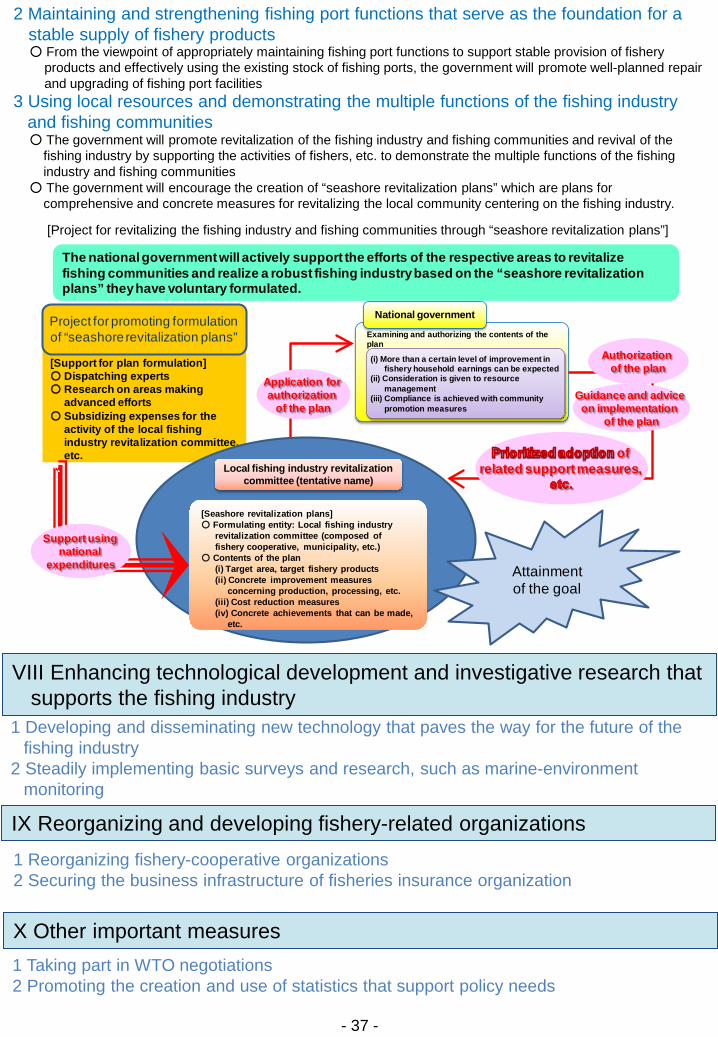
[Support for plan formulation]○ Dispatching experts○ Research on areas making
advanced efforts○ Subsidizing expenses for the
activity of the local fishing industry revitalization committee, etc.
The national government will actively support the efforts of the respective areas to revitalize fishing communities and realize a robust fishing industry based on the “seashore revitalization plans” they have voluntary formulated.
Examining and authorizing the contents of the plan
National government
(i) More than a certain level of improvement in fishery household earnings can be expected
(ii) Consideration is given to resource management
(iii) Compliance is achieved with community promotion measures
[Seashore revitalization plans]○ Formulating entity: Local fishing industry
revitalization committee (composed of fishery cooperative, municipality, etc.)
○ Contents of the plan(i) Target area, target fishery products(ii) Concrete improvement measures
concerning production, processing, etc.(iii) Cost reduction measures(iv) Concrete achievements that can be made,
etc.
Local fishing industry revitalization committee (tentative name)
Project for promoting formulation of “seashore revitalization plans”
of related support measures,
Attainment of the goal
Authorization of the plan
Guidance and advice on implementation
of the plan
Application for authorization
of the plan
Support using national
expenditures
VIII Enhancing technological development and investigative research that supports the fishing industry
1 Developing and disseminating new technology that paves the way for the future of the fishing industry
2 Steadily implementing basic surveys and research, such as marine-environment monitoring
- 37 -
2 Maintaining and strengthening fishing port functions that serve as the foundation for a stable supply of fishery products ○ From the viewpoint of appropriately maintaining fishing port functions to support stable provision of fishery
products and effectively using the existing stock of fishing ports, the government will promote well-planned repair and upgrading of fishing port facilities
3 Using local resources and demonstrating the multiple functions of the fishing industry and fishing communities ○ The government will promote revitalization of the fishing industry and fishing communities and revival of the
fishing industry by supporting the activities of fishers, etc. to demonstrate the multiple functions of the fishing industry and fishing communities
○ The government will encourage the creation of “seashore revitalization plans” which are plans for comprehensive and concrete measures for revitalizing the local community centering on the fishing industry.
[Project for revitalizing the fishing industry and fishing communities through “seashore revitalization plans”]
IX Reorganizing and developing fishery-related organizations 1 Reorganizing fishery-cooperative organizations 2 Securing the business infrastructure of fisheries insurance organization
X Other important measures 1 Taking part in WTO negotiations 2 Promoting the creation and use of statistics that support policy needs
XI Necessary items for comprehensively and systematically promoting fishery-related measures
- 38 -
1 Implementing measures based on the experience of the Great East Japan Earthquake
2 Efficiently promoting measures through coordination between relevant ministries and agencies
3 Implementing measures from a public interest perspective based on the needs of consumers and the public
4 Promoting demonstrations of independence, originality, and ingenuity by business operators and production areas
5 Administrating fiscal measures in an efficient and focused manner
Related Documents