Welcome message from author
This document is posted to help you gain knowledge. Please leave a comment to let me know what you think about it! Share it to your friends and learn new things together.
Transcript
COMMISSION ON GOVERNMENT FORECASTING & ACCOUNTABILITY
SENATE HOUSE
SENATOR JEFFREY M. SCHOENBERG, CO-CHAIR
REPRESENTATIVE PATRICIA BELLOCK, CO-CHAIR
Michael Frerichs Elaine Nekritz Matt Murphy Raymond Poe Suzi Schmidt Al Riley
David Syverson Michael Tryon Donne Trotter
EXECUTIVE DIRECTOR Dan R. Long
DEPUTY DIRECTOR
Trevor J. Clatfelter
REVENUE MANAGER Jim Muschinske
PENSION MANAGER
Dan Hankiewicz
CHIEF ECONOMIST Edward H. Boss, Jr.
AUTHORS OF THE REPORT
Anthony Bolton, Revenue Analyst Eric Noggle, Senior Revenue Analyst Matt Dragoo, Pension Analyst Gregg Scott, Pension Analyst
Lynnae Kapp, Revenue - Bond Analyst Benjamin L. Varner, Sr. Rev. Analyst
OFFICE ASSISTANT Briana Jackson
AUGUST 2012

TABLE OF CONTENTS
SECTION PAGE Introduction 1-10
• Introduction 3 • The Budget Process 4 • Basis of Budgeting 6 • FY 2013 Budget Chronology 7 • FY 2013 Primary General Fund Budget Bills 8 • Other FY 2013 Budget and Related Bills 9
Section 1. FY 2012 Budget Review 11 - 22
• FY 2012 Revenue Recap 13 • Review of FY 2012 Revenue Assumptions 16 • Review of Most Recent Revenue Estimate 17 • Impact of Higher Income Tax Rates 18 • Federal Stimulus 21
Section 2. FY 2013 Budget 23 - 54
• FY 2013 Budget Summary 25 • FY 2013 Revenue Related Budget Highlights 26 • FY 2013 Revenue Assumptions 28 • FY 2013 Budget Implementation Bills 33 • Governor’s Actions 38 • FY 2013 Appropriations (by Agency) 44
Section 3. FY 2013 Budget & Historical Data 55 - 64
• FY 2013 Budget by Funding Source 57 • FY 2013 General Funds Revenues by Source 57 • FY 2013 Total Operating Appropriations by Major Purpose 58 • FY 2013 GRF Operating Appropriations by Major Purpose 58 • General Funds – Appropriations 59 • Detailed General Funds Revenue History 60 • General Funds Revenue History: Annual $ Change 61 • General Funds Base Expenditures History 62 • General Funds Expenditures by Category 62 • General Funds Expenditures by Function 62 • Health and Social Services Expenditure History 63 • Public Protection and Justice Expenditure History 63 • General Government Expenditure History 64
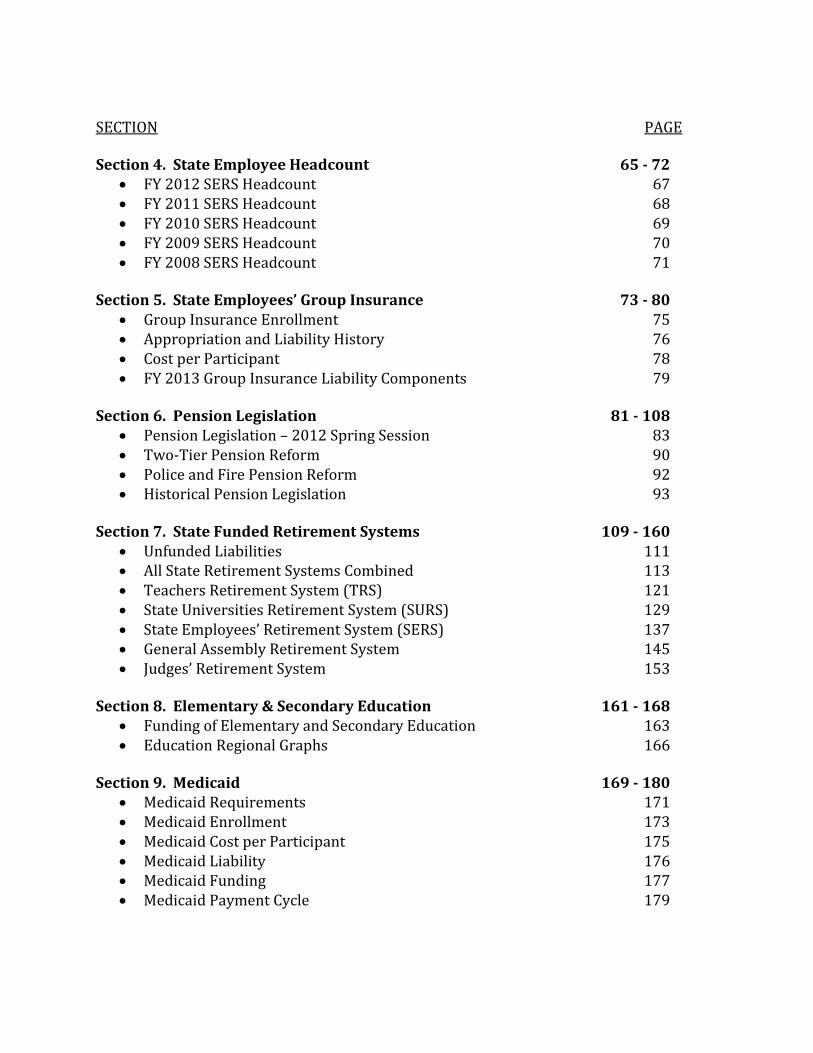
SECTION PAGE Section 4. State Employee Headcount 65 - 72
• FY 2012 SERS Headcount 67 • FY 2011 SERS Headcount 68 • FY 2010 SERS Headcount 69 • FY 2009 SERS Headcount 70 • FY 2008 SERS Headcount 71
Section 5. State Employees’ Group Insurance 73 - 80
• Group Insurance Enrollment 75 • Appropriation and Liability History 76 • Cost per Participant 78 • FY 2013 Group Insurance Liability Components 79
Section 6. Pension Legislation 81 - 108
• Pension Legislation – 2012 Spring Session 83 • Two-Tier Pension Reform 90 • Police and Fire Pension Reform 92 • Historical Pension Legislation 93
Section 7. State Funded Retirement Systems 109 - 160 • Unfunded Liabilities 111 • All State Retirement Systems Combined 113 • Teachers Retirement System (TRS) 121 • State Universities Retirement System (SURS) 129 • State Employees’ Retirement System (SERS) 137 • General Assembly Retirement System 145 • Judges’ Retirement System 153
Section 8. Elementary & Secondary Education 161 - 168
• Funding of Elementary and Secondary Education 163 • Education Regional Graphs 166
Section 9. Medicaid 169 - 180
• Medicaid Requirements 171 • Medicaid Enrollment 173 • Medicaid Cost per Participant 175 • Medicaid Liability 176 • Medicaid Funding 177 • Medicaid Payment Cycle 179
SECTION PAGE Section 10. Debt of the State of Illinois 181 - 190
• Debt of the State of Illinois 183 • Pension Obligation Bonds 185 • Short Term Borrowing 186 • Illinois Credit Ratings History 187
Section 11. Special Fund Transfers 191 - 262
• Special Fund Transfers 193 • FY 2012 Consolidated Service Transfers 195 • FY 2011 Interfund Borrowing 198 • FY 2010 Special Fund Transfers 208 • FY 2009 Special Fund Transfers 216 • FY 2008 Special Fund Transfers 225 • FY 2007 Special Fund Transfers 229 • FY 2006 Special Fund Transfers 236 • FY 2005 Special Fund Transfers 247 • FY 2004 Special Fund Transfers 255 • FY 2003 Special Fund Transfers 261
Section 12. Glossary & Description of Funds 262 - 275
• Glossary 264 • Description of Funds 275

INTRODUCTION
Introduction The Budget Process Basis of Budgeting FY 2013 Budget Chronology FY 2013 Primary General Fund Budget Bills Other FY 2013 Budget and Related Bills

I N T R O D U C T I O N
Page 3
INTRODUCTION Public Act 92-0067 mandates that the Commission on Government Forecasting and Accountability (CGFA) prepare and publish a BUDGET SUMMARY REPORT detailing Illinois’ most recently enacted budget. The report is to be made available to all citizens of the State of Illinois who request a copy. The summary report is to include information pertaining to the major categories of appropriations, issues the General Assembly faced in allocating appropriations, comparisons of appropriations from previous State fiscal years and other information related to the current State of Illinois Budget. The following report fulfills this mandate. The report begins with a discussion of the budgeting process. The budgetary process is then summarized chronologically. Then follows a highlighting of the bills that constitute the budget, along with other major legislation passed during the past spring legislative session. A review of the previous year’s budget is then provided. The FY 2013 budget is then summarized including a listing of appropriations by agency. Various areas of the budget and State government operations, such as Elementary/Secondary Education, Medicaid, and State pensions, are then looked at in detail. The report concludes with a Glossary of Terms and a Description of the various funds. The Commission on Government Forecasting and Accountability would like to thank the four Legislative Appropriation Staff’s and the Governor’s Office of Management and Budget for supplying information making this report possible.

I N T R O D U C T I O N
Page 4
THE BUDGET PROCESS
The Illinois Constitution requires the Governor to prepare and submit a state budget to the General Assembly that includes recommended spending levels for state agencies, estimated funds available from tax collections and other sources, and state debt and liabilities. The Office of Management and Budget (OMB), by statute a part of the Governor's office, is responsible for estimating revenues and developing budget recommendations that reflect the Governor's programmatic and spending priorities. The Commission on Government Forecasting and Accountability, by statute, is responsible for estimating revenues for the legislative branch of government.
State agencies begin the budget process for the next fiscal year almost as soon as appropriations for the current fiscal year, which begins July 1, are enacted. Budget analysts and agency staff identify and estimate the cost of potential spending pressures for the next fiscal year, including maintaining or annualizing current program levels, expanding services for existing programs and initiating new programs. Revenue estimates for the current fiscal year and preliminary estimates for the coming fiscal year are made by both the Governor’s Office of Management and Budget and the Commission on Government Forecasting and Accountability.
During November and December, a detailed financial and programmatic review of agency budgets is conducted. Funding requests typically exceed available resources. The Office of Management and Budget works closely with agencies and the Governor's senior staff to try and reduce programs and to redesign others to make them more efficient. Once budget options are developed, they are presented to the Governor for his final decisions. Narrative statements explaining the budget and complete budget request forms are printed in the budget book. Concurrent with the operations and grants budgeting process, agencies develop a capital budget. The Capital Development Board conducts a technical review and prepares cost estimates for state facility projects for which it will be responsible. Other types of capital projects such as highway construction, mass transit and airport facilities, alternative energy or school facilities are reviewed by other State agencies. Once reviewed, projects are ranked by category considering need, availability of resources and the Governor's priorities regarding repair and maintenance projects versus new construction. The Governor presents his recommended budget to a joint session of the Illinois General Assembly. By law, the Governor must present his budget to the General Assembly no later than the third Wednesday in February of each year. In addition to the Governor's official presentation, briefings are held to acquaint legislators, their staffs, the media, and others with the budget recommendations.
Legislative review of the Governor's budget recommendations begins almost immediately with hearings before House and Senate appropriation committees. Appropriation committees may adopt amendments to change the funding level recommended by the Governor. Once adopted by the first committee, the appropriation bill moves to the full House or Senate for debate, amendment and a vote. When an appropriation bill passes in
I N T R O D U C T I O N
Page 5
one chamber the bill moves to the second chamber, where a similar process takes place. Changes made in either chamber must ultimately be accepted by both the House and the Senate for the bill to pass and be presented to the Governor.
By statute, any proposed amendments to the budget and any substantive legislation with fiscal or revenue impacts must be accompanied by a Fiscal Note to describe such impacts. Final approval of the budget usually does not occur until the end of the legislative session. Appropriation bills require an immediate effective date in order to be available for expenditure at the beginning of the fiscal year, July 1. The Illinois Constitution requires a simple majority vote of the General Assembly for a bill passed on or before May 31 to take effect immediately. On or after June 1, a three-fifths vote of the General Assembly is required in order for a bill to take effect immediately.
Once the General Assembly passes the budget, the Governor must sign the appropriation bills before funds can be spent. If the Governor does not want to approve a specific appropriation, he may either line item veto (eliminate) it or reduce it. The rest of the appropriation bill is unaffected by these vetoes and becomes effective. Line items that have been vetoed or reduced must be reconsidered by the General Assembly during the fall session. The General Assembly may return an item to the enacted level by majority vote in both houses in the case of a reduction veto and by a three-fifths vote in the case of a line item veto.
If additional resources beyond those initially approved in the budget become necessary, a supplemental appropriation bill may be passed any time the General Assembly is in session.

I N T R O D U C T I O N
Page 6
BASIS OF BUDGETING
Over time, the Illinois budget has been viewed as balanced in several ways, both at the time it is presented by the Governor and at the time it is passed by the General Assembly. Illinois' daily activities and annual budget historically have been operated and presented on a cash basis. Expenditures are made from the available cash balances on hand, and the budget balances estimated expenditures with estimated resources. The state's Comprehensive Annual Financial Report, however, conforms with generally accepted accounting principles (GAAP) as prescribed in pronouncements of the Governmental Accounting Standards Board. Public Act 90-479, effective as of fiscal year 1999, amended the Civil Administrative Code to provide guidance to the Governor, as he proposes the budget, and to the General Assembly, as it makes appropriations, regarding the balanced budget requirements in the state constitution. This act incorporates aspects of a modified accrual basis into the budget process for certain designated funds, including the general funds.
State law and the constitution require the Governor to prepare and submit to the General Assembly an Executive Budget for the next fiscal year, which sets forth the Governor's recommended appropriations, estimated revenues from taxes and other sources, estimated balance of funds available for appropriation at the beginning of the fiscal year, and the plan for expenditures during the fiscal year for every department of the state. Constitutionally, the Governor must balance the budget by proposing expenditure recommendations that do not exceed funds estimated to be available for the fiscal year. The budget includes most state funds but excludes locally held funds and those state funds that are not subject to appropriation pursuant to state law. It is submitted by line item with accompanying program information, including personnel and capital detail, and performance and activity measures. The General Assembly makes appropriations for all expenditures of public funds. Constitutionally, the General Assembly must balance the budget by appropriating amounts not to exceed funds they estimate to be available during the year. The Governor has the power to approve, reduce or veto each appropriation passed by the General Assembly, and the General Assembly may override these vetoes. Transfers in and out of funds pursuant to law or discretionary acts of the Governor are not part of the appropriation process. The state general funds include the Common School Fund, the General Revenue-Common School Special Account Fund, the Education Assistance Fund and the General Revenue Fund. All state revenues, not otherwise restricted by law, including the majority of the state's major revenue sources, the income and sales taxes, are deposited into these funds to specifically fund education programs and to generally fund the rest of state government.
I N T R O D U C T I O N
Page 7
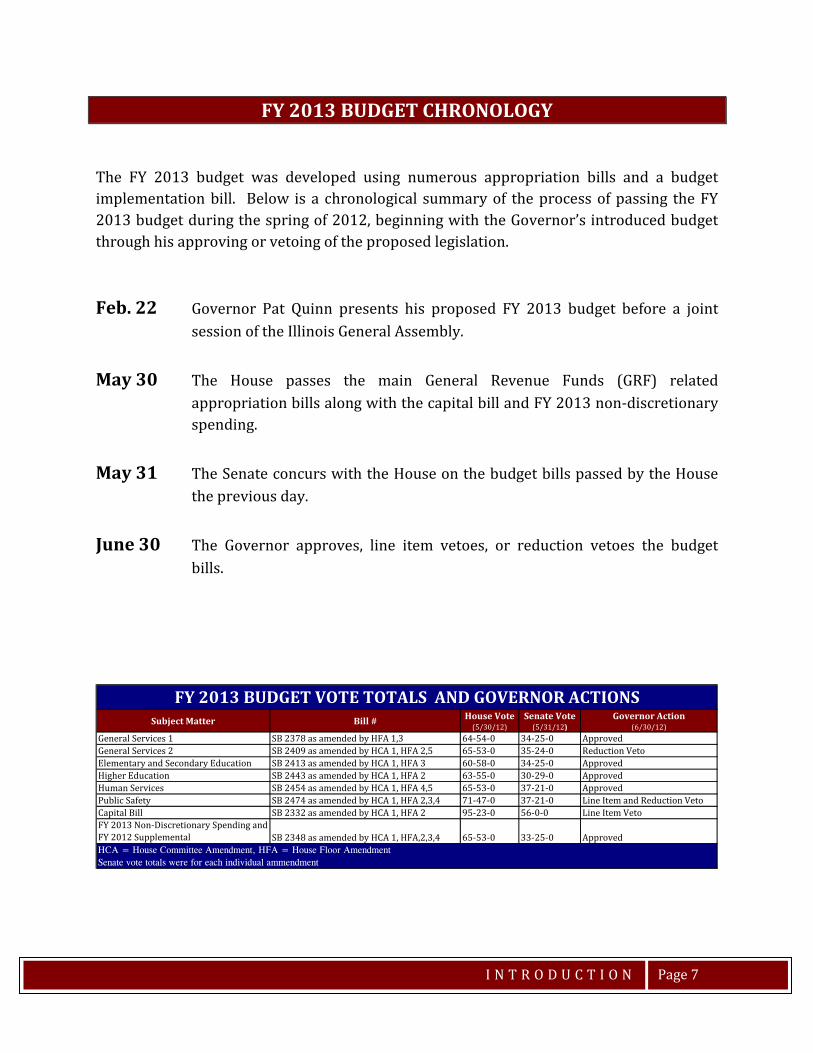
FY 2013 BUDGET CHRONOLOGY The FY 2013 budget was developed using numerous appropriation bills and a budget implementation bill. Below is a chronological summary of the process of passing the FY 2013 budget during the spring of 2012, beginning with the Governor’s introduced budget through his approving or vetoing of the proposed legislation. Feb. 22 Governor Pat Quinn presents his proposed FY 2013 budget before a joint
session of the Illinois General Assembly. May 30 The House passes the main General Revenue Funds (GRF) related
appropriation bills along with the capital bill and FY 2013 non-discretionary spending.
May 31 The Senate concurs with the House on the budget bills passed by the House
the previous day. June 30 The Governor approves, line item vetoes, or reduction vetoes the budget
bills.
Subject Matter Bill # House Vote (5/30/12)
Senate Vote (5/31/12)
Governor Action (6/30/12)
General Services 1 SB 2378 as amended by HFA 1,3 64-54-0 34-25-0 ApprovedGeneral Services 2 SB 2409 as amended by HCA 1, HFA 2,5 65-53-0 35-24-0 Reduction VetoElementary and Secondary Education SB 2413 as amended by HCA 1, HFA 3 60-58-0 34-25-0 ApprovedHigher Education SB 2443 as amended by HCA 1, HFA 2 63-55-0 30-29-0 ApprovedHuman Services SB 2454 as amended by HCA 1, HFA 4,5 65-53-0 37-21-0 ApprovedPublic Safety SB 2474 as amended by HCA 1, HFA 2,3,4 71-47-0 37-21-0 Line Item and Reduction VetoCapital Bill SB 2332 as amended by HCA 1, HFA 2 95-23-0 56-0-0 Line Item VetoFY 2013 Non-Discretionary Spending and FY 2012 Supplemental SB 2348 as amended by HCA 1, HFA,2,3,4 65-53-0 33-25-0 Approved
FY 2013 BUDGET VOTE TOTALS AND GOVERNOR ACTIONS
HCA = House Committee Amendment, HFA = House Floor AmendmentSenate vote totals were for each individual ammendment
I N T R O D U C T I O N
Page 8
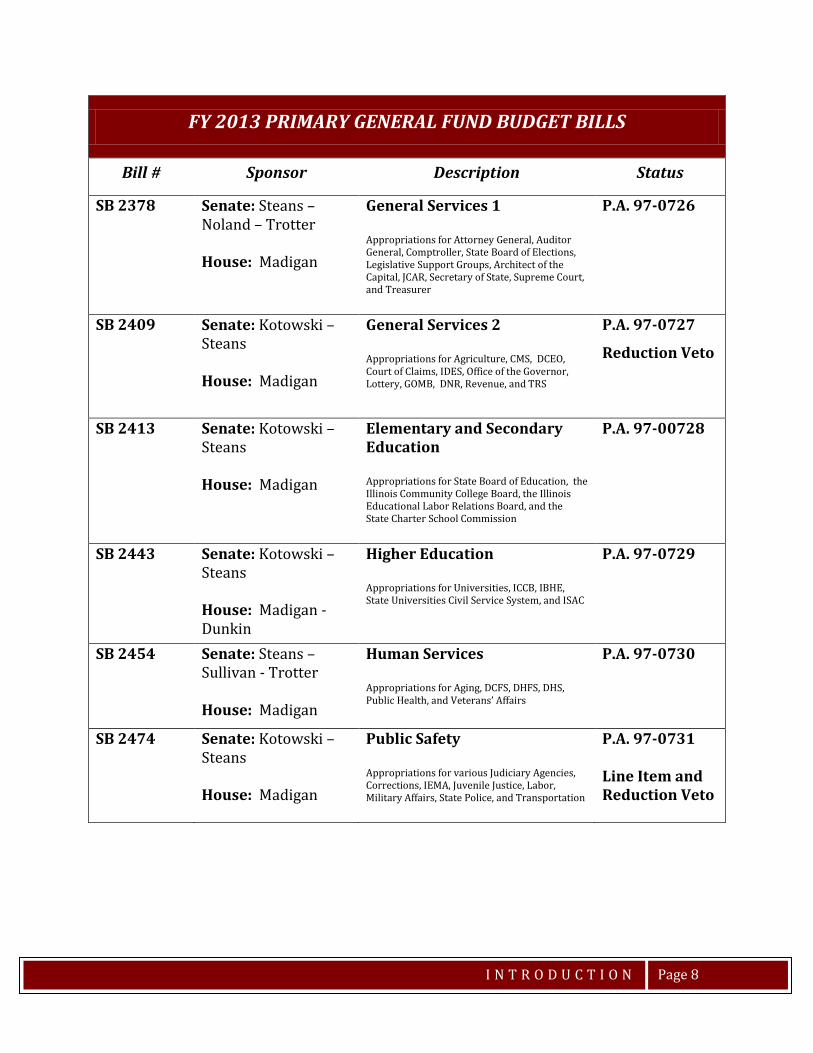
FY 2013 PRIMARY GENERAL FUND BUDGET BILLS
Bill # Sponsor Description Status
SB 2378 Senate: Steans – Noland – Trotter House: Madigan
General Services 1 Appropriations for Attorney General, Auditor General, Comptroller, State Board of Elections, Legislative Support Groups, Architect of the Capital, JCAR, Secretary of State, Supreme Court, and Treasurer
P.A. 97-0726
SB 2409 Senate: Kotowski – Steans House: Madigan
General Services 2 Appropriations for Agriculture, CMS, DCEO, Court of Claims, IDES, Office of the Governor, Lottery, GOMB, DNR, Revenue, and TRS
P.A. 97-0727
Reduction Veto
SB 2413 Senate: Kotowski – Steans House: Madigan
Elementary and Secondary Education Appropriations for State Board of Education, the Illinois Community College Board, the Illinois Educational Labor Relations Board, and the State Charter School Commission
P.A. 97-00728
SB 2443 Senate: Kotowski – Steans House: Madigan - Dunkin
Higher Education Appropriations for Universities, ICCB, IBHE, State Universities Civil Service System, and ISAC
P.A. 97-0729
SB 2454 Senate: Steans – Sullivan - Trotter House: Madigan
Human Services Appropriations for Aging, DCFS, DHFS, DHS, Public Health, and Veterans’ Affairs
P.A. 97-0730
SB 2474 Senate: Kotowski – Steans House: Madigan
Public Safety Appropriations for various Judiciary Agencies, Corrections, IEMA, Juvenile Justice, Labor, Military Affairs, State Police, and Transportation
P.A. 97-0731 Line Item and Reduction Veto

I N T R O D U C T I O N
Page 9
OTHER FY 2013 BUDGET AND RELATED BILLS
Bill # Sponsor Description Status
SB 0179 Senate: Kotowski – Steans – Trotter House: Madigan
Authorizes State Actuary
P.A. 97-0694
SB 1313 Senate: Schoenberg – Radogno House: Madigan – Cross - Yarbrough
State Employee Health Insurance Reform
P. A. 97-0695
SB 2194 Senate: Schoenberg – Kotowski, et. al House: Currie – Yarbrough – Du Buclet
Cigarette and Tobacco Product Tax Increase
P. A. 97-0688
SB 2332 Senate: Kotowski – Steans – Trotter House: Madigan
Capital Bill
P.A. 97-0725 Line Item Veto
SB 2348 Senate: Steans – Sullivan - Trotter House: Madigan
Supplemental Appropriations for FY 12 and FY 13 non-discretionary
P.A. 97-0685
SB 2621 Senate: Raoul – Noland, et. al. House: Currie – Sacia, et. al.
Prisoner Early Release
P.A. 97-0697
SB 2840 Senate: Steans – Mulroe House: Feigenholtz – Bellock – Winters
Medicaid Reform
P.A. 97-0689

I N T R O D U C T I O N
Page 10
OTHER FY 2013 BUDGET AND RELATED BILLS
Bill # Sponsor Description Status
SB 2958 Senate: Althoff – Martinez, et. al. House: Currie – Pritchard – Hatcher
Workers Compensation Privatization for State Employees
Sent to Governor
SB 3397 Senate: Steans - Righter, et. al. House: Currie – Chapa LaVia, et. al.
Prisoner Early Release
P.A. 97-0697
SB 3802 Senate: Steans House: Currie
Eliminates or Reduces Secton 25 Medicaid Spending
P.A. 97-0691
HB 4513 House: Nekritz – Lang - Harris Senate: Cullerton – Maloney
Metropolitan Water Reclamation District Pension Reform
Sent to Governor
SECTION 1. FY 2012 BUDGET REVIEW
FY 2012 Revenue Recap Review of FY 2012 Revenue Assumptions Review of Most Recent Revenue Estimate Impact of Higher Income Tax Rates Federal Stimulus

S E C T I O N 1 . F Y 2 0 1 2 B U D G E T R E V I E W
Page 13
FY 2012 REVENUE RECAP
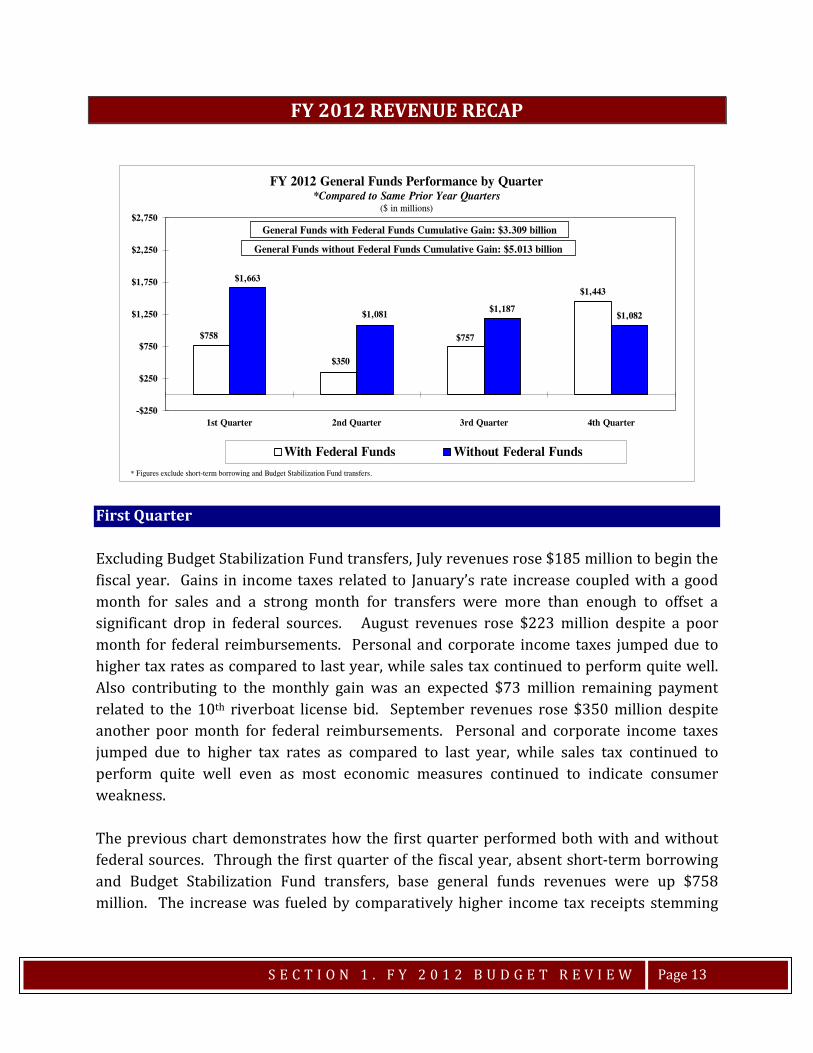
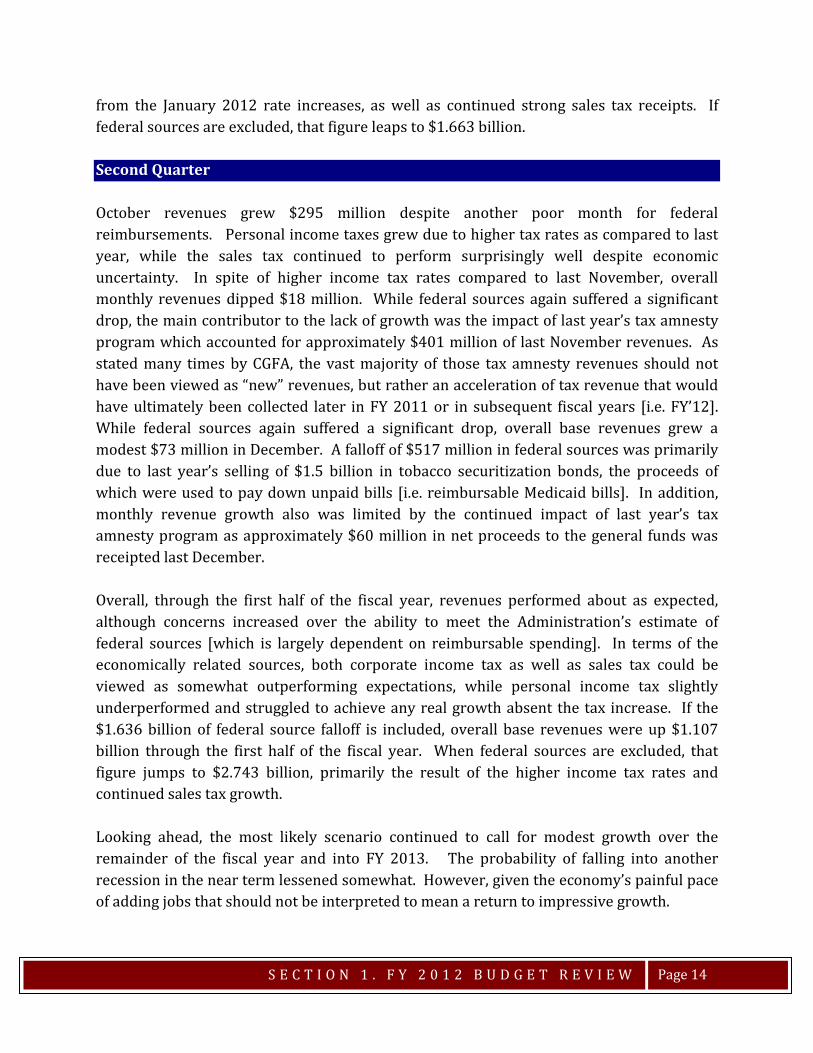
First Quarter Excluding Budget Stabilization Fund transfers, July revenues rose $185 million to begin the fiscal year. Gains in income taxes related to January’s rate increase coupled with a good month for sales and a strong month for transfers were more than enough to offset a significant drop in federal sources. August revenues rose $223 million despite a poor month for federal reimbursements. Personal and corporate income taxes jumped due to higher tax rates as compared to last year, while sales tax continued to perform quite well. Also contributing to the monthly gain was an expected $73 million remaining payment related to the 10th riverboat license bid. September revenues rose $350 million despite another poor month for federal reimbursements. Personal and corporate income taxes jumped due to higher tax rates as compared to last year, while sales tax continued to perform quite well even as most economic measures continued to indicate consumer weakness. The previous chart demonstrates how the first quarter performed both with and without federal sources. Through the first quarter of the fiscal year, absent short-term borrowing and Budget Stabilization Fund transfers, base general funds revenues were up $758 million. The increase was fueled by comparatively higher income tax receipts stemming
$758
$350
$757
$1,443 $1,663
$1,081 $1,187 $1,082
-$250
$250
$750
$1,250
$1,750
$2,250
$2,750
1st Quarter 2nd Quarter 3rd Quarter 4th Quarter
FY 2012 General Funds Performance by Quarter*Compared to Same Prior Year Quarters
($ in millions)
With Federal Funds Without Federal Funds
* Figures exclude short-term borrowing and Budget Stabilization Fund transfers.
General Funds with Federal Funds Cumulative Gain: $3.309 billion
General Funds without Federal Funds Cumulative Gain: $5.013 billion
S E C T I O N 1 . F Y 2 0 1 2 B U D G E T R E V I E W
Page 14
from the January 2012 rate increases, as well as continued strong sales tax receipts. If federal sources are excluded, that figure leaps to $1.663 billion. Second Quarter October revenues grew $295 million despite another poor month for federal reimbursements. Personal income taxes grew due to higher tax rates as compared to last year, while the sales tax continued to perform surprisingly well despite economic uncertainty. In spite of higher income tax rates compared to last November, overall monthly revenues dipped $18 million. While federal sources again suffered a significant drop, the main contributor to the lack of growth was the impact of last year’s tax amnesty program which accounted for approximately $401 million of last November revenues. As stated many times by CGFA, the vast majority of those tax amnesty revenues should not have been viewed as “new” revenues, but rather an acceleration of tax revenue that would have ultimately been collected later in FY 2011 or in subsequent fiscal years [i.e. FY’12]. While federal sources again suffered a significant drop, overall base revenues grew a modest $73 million in December. A falloff of $517 million in federal sources was primarily due to last year’s selling of $1.5 billion in tobacco securitization bonds, the proceeds of which were used to pay down unpaid bills [i.e. reimbursable Medicaid bills]. In addition, monthly revenue growth also was limited by the continued impact of last year’s tax amnesty program as approximately $60 million in net proceeds to the general funds was receipted last December. Overall, through the first half of the fiscal year, revenues performed about as expected, although concerns increased over the ability to meet the Administration’s estimate of federal sources [which is largely dependent on reimbursable spending]. In terms of the economically related sources, both corporate income tax as well as sales tax could be viewed as somewhat outperforming expectations, while personal income tax slightly underperformed and struggled to achieve any real growth absent the tax increase. If the $1.636 billion of federal source falloff is included, overall base revenues were up $1.107 billion through the first half of the fiscal year. When federal sources are excluded, that figure jumps to $2.743 billion, primarily the result of the higher income tax rates and continued sales tax growth. Looking ahead, the most likely scenario continued to call for modest growth over the remainder of the fiscal year and into FY 2013. The probability of falling into another recession in the near term lessened somewhat. However, given the economy’s painful pace of adding jobs that should not be interpreted to mean a return to impressive growth.
S E C T I O N 1 . F Y 2 0 1 2 B U D G E T R E V I E W
Page 15
Third Quarter While federal sources again suffered a significant drop, overall base revenues were fairly positive in January, posting gains of $576 million. For the month, virtually all non-federal revenue sources managed to post gains. It was mentioned that we are now beginning to compare against the post-income tax period of last year. As a result, rates of growth will slow over the remainder of the year. While federal sources again suffered a monthly drop, overall base revenues reported another decent month in February, posting gains of $219 million. Overall base revenues for March dropped $38 million. While the larger economically-related sources performed quite well for the month, their gains were wiped out by comparatively poor federal receipting and transfers. Through the first three-fourths of the fiscal year, absent short-term borrowing, tobacco settlement proceeds, Pension Contribution Fund transfers and Budget Stabilization Fund transfers, base general funds revenues are up $1.864 billion. The increase has been fueled by comparatively higher income tax receipts stemming from the January 2011 rate increases as well as continued strong sales tax receipts. Those items have been more than enough to overcome a significant falloff in federal sources that resulted from less reimbursable spending as well as a return to a lower federal matching. Fourth Quarter Overall base revenues in April grew $733 million. The significant growth was largely due to the expected boost from final income tax payments. Continued strong sales taxes also helped monthly receipts. In addition, what had been a rare occurrence this fiscal year, federal sources experienced a positive month. Overall base revenues grew $474 million in May. The growth was largely due to federal sources. After struggling for most of the year, a significant increase in reimbursable spending resulted in higher receipts. In addition, the economic-related sources also performed favorably. Overall base revenues grew $236 million in June. The large economic sources performed well, and even federal sources were able to post gains despite a very good closing month experienced last year. For the fiscal year, absent short-term borrowing, tobacco settlement proceeds, Pension Contribution Fund transfers and Budget Stabilization Fund transfers that occurred last year, base general funds revenues grew $3.309 billion. The increase was fueled by comparatively higher income tax receipts stemming from the January 2011 rate increases as well as continued strong sales tax receipts. Those items were more than enough to overcome a significant falloff in federal sources resulting from less reimbursable spending as well as a return to a lower federal matching rates. When the falloff in federal sources is excluded, receipt growth expands to $5.013 billion.

S E C T I O N 1 . F Y 2 0 1 2 B U D G E T R E V I E W
Page 16
REVIEW OF FY 2012 REVENUE ASSUMPTIONS The following table illustrates that total general funds revenues in FY 2012 exceeded assumptions used to craft the FY 2012 budget. In March 2011, the House passed HR 110, which was the revenue framework used throughout much of the spring 2011 legislative session. As shown, actual revenues ended up exceeding HR 110 by $624 million. While federal sources fell $1.162 billion short of expectations, the economic sources more than made up for that shortage as personal, corporate, and sales taxes all far exceeded the estimates. In August2012, the GOMB released its FY 2012 Budget Review document which detailed the official revenue number used in the enacted budget. While overall quite similar to HR 110, it was slightly lower by $49 million. As a result, actual FY 2012 revenues exceeded the enacted budget forecast by $673 million.
FY 2012 ACTUALS vs. ENACTED BUDGET
Revenue SourcesFY 2012 Actual
HR 110 Mar-12 FY 2012
Difference Actuals from
Estimate
GOMB EST. Aug -11 FY 2012
Difference Actuals from
EstimateState Taxes Personal Income Tax $17,000 $16,389 $611 $16,500 $500 Corporate Income Tax (regular) $2,983 $2,435 $548 $2,853 $130 Sales Taxes $7,226 $6,586 $640 $6,610 $616 Public Utility (regular) $995 $1,082 ($87) $1,082 ($87) Cigarette Tax $354 $355 ($1) $355 ($1) Liquor Gallonage Taxes $164 $162 $2 $162 $2 Vehicle Use Tax $29 $32 ($3) $32 ($3) Inheritance Tax (gross) $235 $182 $53 $182 $53 Insurance Taxes & Fees $345 $318 $27 $318 $27 Corporate Franchise Tax & Fees $192 $204 ($12) $204 ($12) Interest on State Funds & Investments $21 $25 ($4) $25 ($4) Cook County Intergovernmental Transfer $244 $244 $0 $244 $0 Other Sources $399 $365 $34 $365 $34
Subtotal $30,187 $28,379 $1,808 $28,932 $1,255
Transfers
Lottery $640 $645 ($5) $645 ($5) Riverboat transfers & receipts $340 $426 ($86) $426 ($86) Proceeds from sale of 10th license $73 $75 ($2) $75 ($2) Other $885 $664 $221 $664 $221
Total State Sources $32,125 $30,189 $1,936 $30,742 $1,383
Federal Sources $3,682 $4,844 ($1,162) $4,325 ($643)
Total Federal & State Sources $35,807 $35,033 $774 $35,067 $740
Nongeneral Funds Distribution:
Refund Fund Personal Income Tax ($1,488) ($1,434) ($54) ($1,444) ($44) Corporate Income Tax ($522) ($426) ($96) ($499) ($23)
Subtotal General Funds $33,797 $33,173 $624 $33,124 $673
($ millions)

S E C T I O N 1 . F Y 2 0 1 2 B U D G E T R E V I E W
Page 17
REVIEW OF MOST RECENT REVENUE ESTIMATE The table below demonstrates how the February 2012 estimates of CGFA and GOMB preformed relative to actuals. As shown, actual base revenues ended up exceeding expectations in both instances. Revenues out-performed CGFA’s projections by $405 million, or 1.2% as income taxes managed to outpace expectations. The February estimate of GOMB was surpassed by $576 million, or 1.7%, as again, stronger income taxes were the main cause of divergence.
Revenue SourcesFY 2012 Actual
CGFA EST. Feb-12
FY 2012
Difference Actuals from
Estimate
GOMB EST. Feb-12
FY 2012
Difference Actuals from
Estimate Net Income Tax [Personal & Corporate] $17,973 $17,624 $349 $17,416 $557 Sales Taxes $7,226 $7,160 $66 $7,145 $81 Other Receipts $2,978 $2,979 ($1) $3,026 ($48) Transfers $1,938 $1,824 $114 $1,829 $109 Federal Sources $3,682 $3,805 ($123) $3,805 ($123) Subtotal General Funds $33,797 $33,392 $405 $33,221 $576
($ millions)FY 2012 ACTUALS vs. ESTIMATES: CGFA and GOMB
S E C T I O N 1 . F Y 2 0 1 2 B U D G E T R E V I E W
Page 18
IMPACT OF HIGHER INCOME TAX RATES In January 2011, P.A. 96-1496 was signed into law creating the first income tax rate increase in many years. The Public Act altered the Illinois Income Tax by making the following changes:
• Increase Individual Income Tax Rate. Increases the personal income tax rate from 3% to 5% in tax year 2011; to 3.75% in tax year 2015; and, to 3.25% in tax year 2025.
• Increase Corporate Income Tax Rate. Increases the corporate income tax rate from 4.8% to 7% in tax year 2011; to 5.25% in tax year 2015; and, to 4.8% in tax year 2025.
• Temporarily Eliminate Net Operating Loss Deduction. In the case of a corporation (other than a Subchapter S corporation), P.A. 96-1496 provides that no carryover deduction shall be allowed for tax years 2011, 2012, and 2013; provided that, for purposes of determining the taxable years to which a net loss may be carried, no taxable year for which a deduction is disallowed shall be counted.
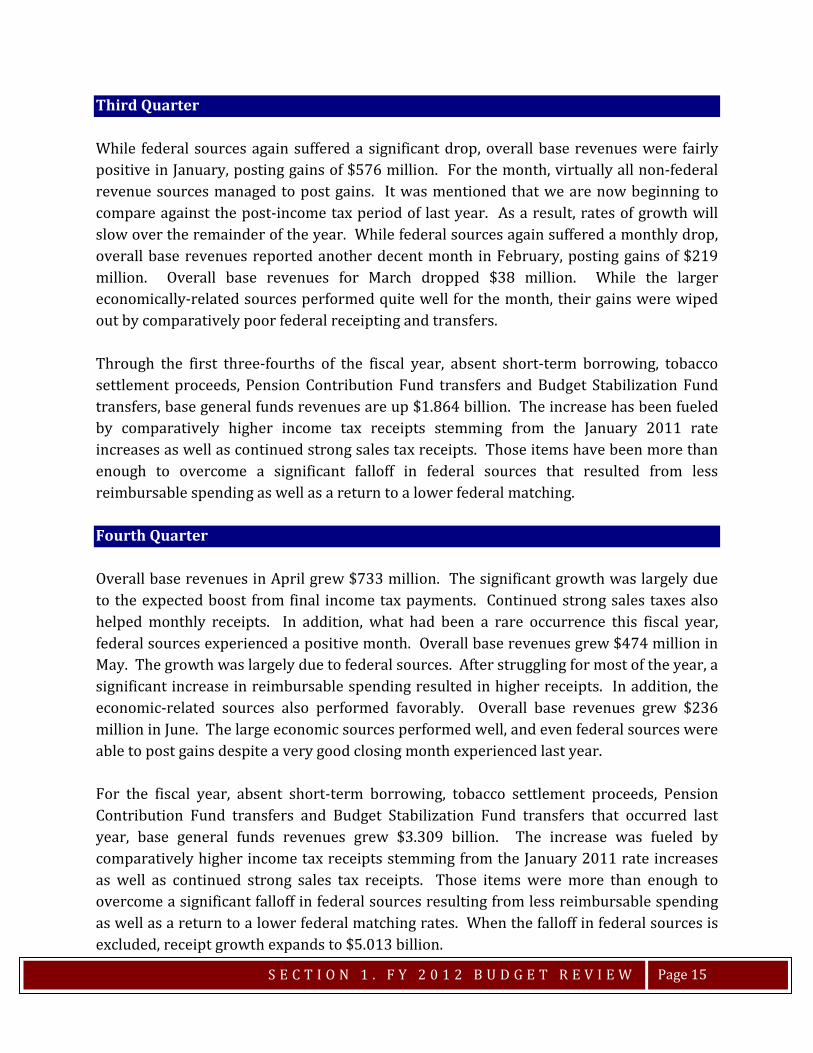
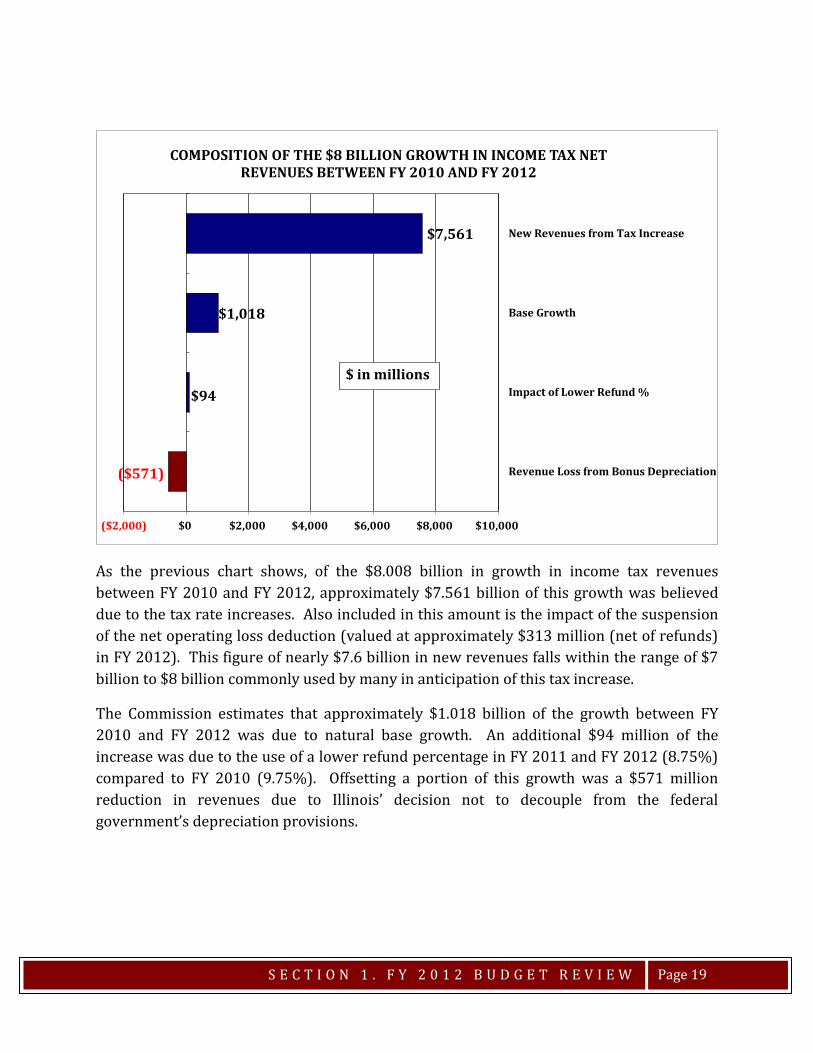
With FY 2012 now complete, an examination of the annualized impact of the tax changes on State revenues can be conducted. To do this, the Commission compared FY 2010 revenues (last fiscal year before tax increase) with FY 2012 revenues (first full year of tax increases, as FY 2011 was a transition year). Complicating any analysis of income tax revenues since FY 2010 (base year) is the revenue impact of the tax amnesty program (and its impact on future revenues), the effect of federal depreciation provisions that the State elected not to decouple from, and the lowering of the income tax refund percentage that is used to pay income tax refunds. With these mitigating factors in mind, the following chart displays the estimated composition of the $8.008 billion in net income tax revenue growth (personal and corporate combined) between FY 2010 and FY 2012.
S E C T I O N 1 . F Y 2 0 1 2 B U D G E T R E V I E W
Page 19
As the previous chart shows, of the $8.008 billion in growth in income tax revenues between FY 2010 and FY 2012, approximately $7.561 billion of this growth was believed due to the tax rate increases. Also included in this amount is the impact of the suspension of the net operating loss deduction (valued at approximately $313 million (net of refunds) in FY 2012). This figure of nearly $7.6 billion in new revenues falls within the range of $7 billion to $8 billion commonly used by many in anticipation of this tax increase.
The Commission estimates that approximately $1.018 billion of the growth between FY 2010 and FY 2012 was due to natural base growth. An additional $94 million of the increase was due to the use of a lower refund percentage in FY 2011 and FY 2012 (8.75%) compared to FY 2010 (9.75%). Offsetting a portion of this growth was a $571 million reduction in revenues due to Illinois’ decision not to decouple from the federal government’s depreciation provisions.
($571)
$94
$1,018
$7,561
Revenue Loss from Bonus Depreciation
Impact of Lower Refund %
Base Growth
New Revenues from Tax Increase
($2,000) $0 $2,000 $4,000 $6,000 $8,000 $10,000
COMPOSITION OF THE $8 BILLION GROWTH IN INCOME TAX NET REVENUES BETWEEN FY 2010 AND FY 2012
$ in millions
S E C T I O N 1 . F Y 2 0 1 2 B U D G E T R E V I E W
Page 20
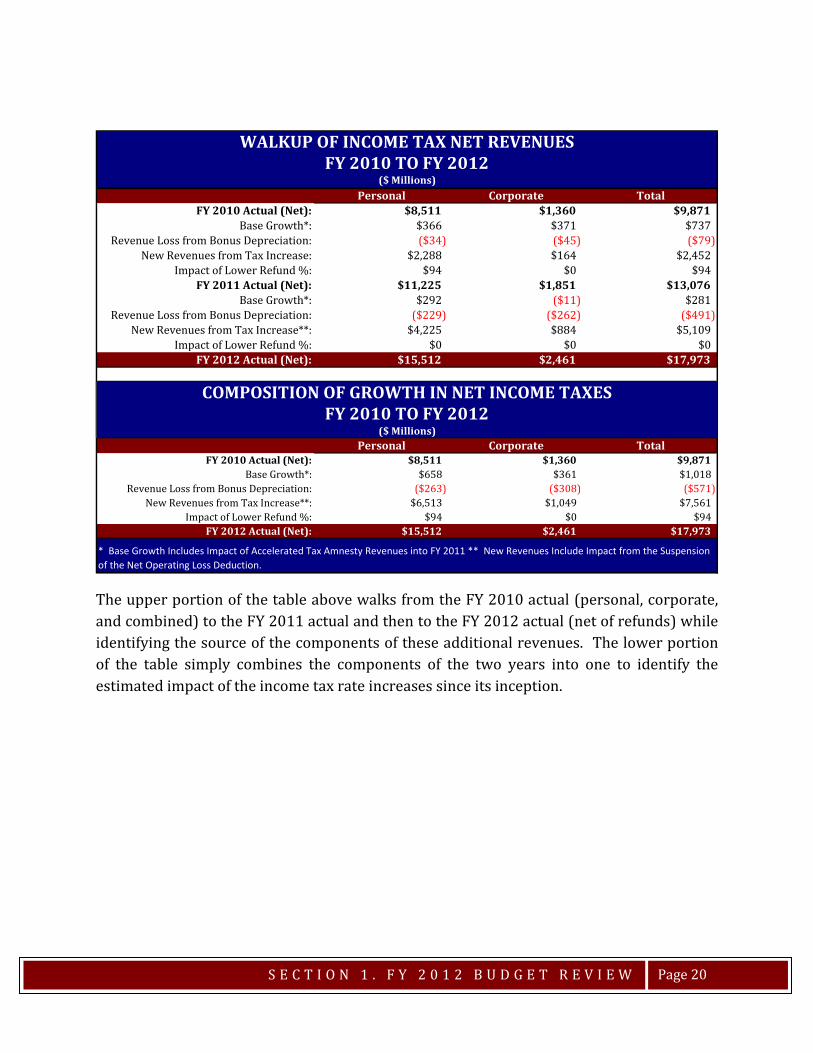
The upper portion of the table above walks from the FY 2010 actual (personal, corporate, and combined) to the FY 2011 actual and then to the FY 2012 actual (net of refunds) while identifying the source of the components of these additional revenues. The lower portion of the table simply combines the components of the two years into one to identify the estimated impact of the income tax rate increases since its inception.
Personal Corporate TotalFY 2010 Actual (Net): $8,511 $1,360 $9,871
Base Growth*: $366 $371 $737Revenue Loss from Bonus Depreciation: ($34) ($45) ($79)
New Revenues from Tax Increase: $2,288 $164 $2,452Impact of Lower Refund %: $94 $0 $94
FY 2011 Actual (Net): $11,225 $1,851 $13,076Base Growth*: $292 ($11) $281
Revenue Loss from Bonus Depreciation: ($229) ($262) ($491)New Revenues from Tax Increase**: $4,225 $884 $5,109
Impact of Lower Refund %: $0 $0 $0FY 2012 Actual (Net): $15,512 $2,461 $17,973
Personal Corporate TotalFY 2010 Actual (Net): $8,511 $1,360 $9,871
Base Growth*: $658 $361 $1,018Revenue Loss from Bonus Depreciation: ($263) ($308) ($571)
New Revenues from Tax Increase**: $6,513 $1,049 $7,561Impact of Lower Refund %: $94 $0 $94
FY 2012 Actual (Net): $15,512 $2,461 $17,973
FY 2010 TO FY 2012WALKUP OF INCOME TAX NET REVENUES
($ Millions)
COMPOSITION OF GROWTH IN NET INCOME TAXESFY 2010 TO FY 2012
($ Millions)
* Base Growth Includes Impact of Accelerated Tax Amnesty Revenues into FY 2011 ** New Revenues Include Impact from the Suspension of the Net Operating Loss Deduction.
S E C T I O N 1 . F Y 2 0 1 2 B U D G E T R E V I E W
Page 21
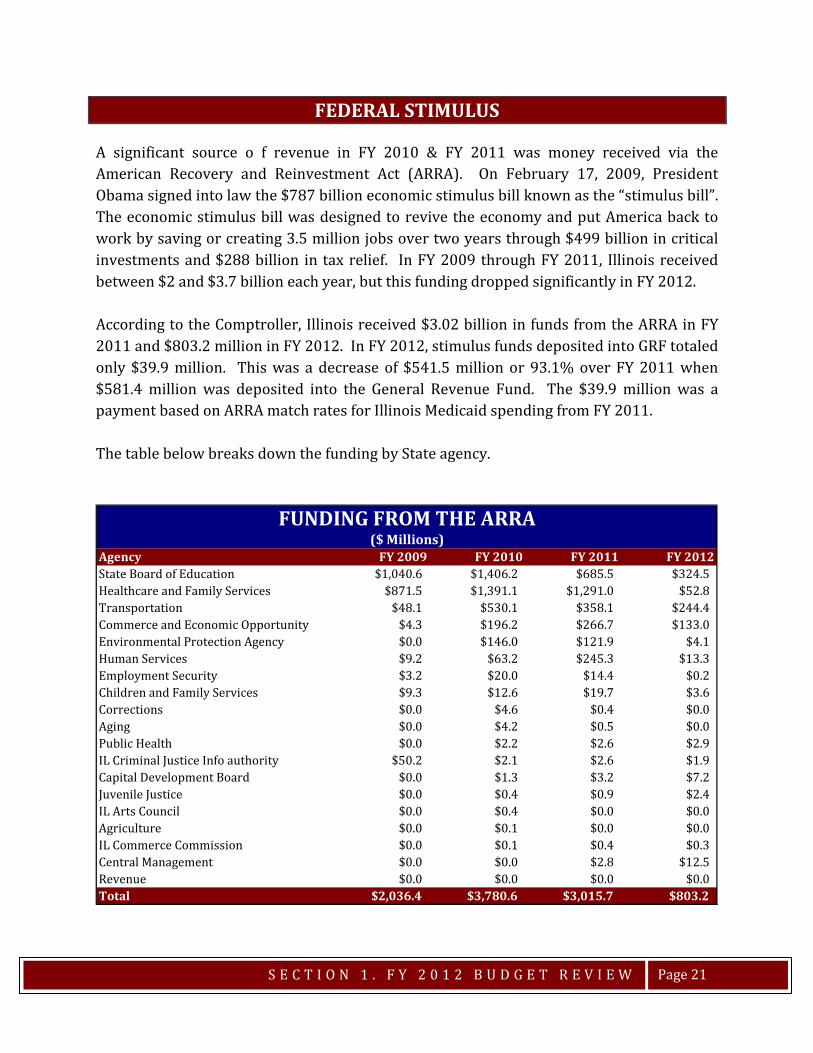
FEDERAL STIMULUS A significant source o f revenue in FY 2010 & FY 2011 was money received via the American Recovery and Reinvestment Act (ARRA). On February 17, 2009, President Obama signed into law the $787 billion economic stimulus bill known as the “stimulus bill”. The economic stimulus bill was designed to revive the economy and put America back to work by saving or creating 3.5 million jobs over two years through $499 billion in critical investments and $288 billion in tax relief. In FY 2009 through FY 2011, Illinois received between $2 and $3.7 billion each year, but this funding dropped significantly in FY 2012. According to the Comptroller, Illinois received $3.02 billion in funds from the ARRA in FY 2011 and $803.2 million in FY 2012. In FY 2012, stimulus funds deposited into GRF totaled only $39.9 million. This was a decrease of $541.5 million or 93.1% over FY 2011 when $581.4 million was deposited into the General Revenue Fund. The $39.9 million was a payment based on ARRA match rates for Illinois Medicaid spending from FY 2011. The table below breaks down the funding by State agency.
Agency FY 2009 FY 2010 FY 2011 FY 2012State Board of Education $1,040.6 $1,406.2 $685.5 $324.5Healthcare and Family Services $871.5 $1,391.1 $1,291.0 $52.8Transportation $48.1 $530.1 $358.1 $244.4Commerce and Economic Opportunity $4.3 $196.2 $266.7 $133.0Environmental Protection Agency $0.0 $146.0 $121.9 $4.1Human Services $9.2 $63.2 $245.3 $13.3Employment Security $3.2 $20.0 $14.4 $0.2Children and Family Services $9.3 $12.6 $19.7 $3.6Corrections $0.0 $4.6 $0.4 $0.0Aging $0.0 $4.2 $0.5 $0.0Public Health $0.0 $2.2 $2.6 $2.9IL Criminal Justice Info authority $50.2 $2.1 $2.6 $1.9Capital Development Board $0.0 $1.3 $3.2 $7.2Juvenile Justice $0.0 $0.4 $0.9 $2.4IL Arts Council $0.0 $0.4 $0.0 $0.0Agriculture $0.0 $0.1 $0.0 $0.0IL Commerce Commission $0.0 $0.1 $0.4 $0.3Central Management $0.0 $0.0 $2.8 $12.5Revenue $0.0 $0.0 $0.0 $0.0Total $2,036.4 $3,780.6 $3,015.7 $803.2
FUNDING FROM THE ARRA($ Millions)


SECTION 2. FY 2013 BUDGET
FY 2013 Budget Summary FY 2013 Revenue Related Budget Highlights FY 2013 Revenue Assumptions FY 2013 Budget Implementation Bills Governor’s Actions FY 2013 Appropriations (by Agency)


S E C T I O N 2 . F Y 2 0 1 3 B U D G E T
Page 25
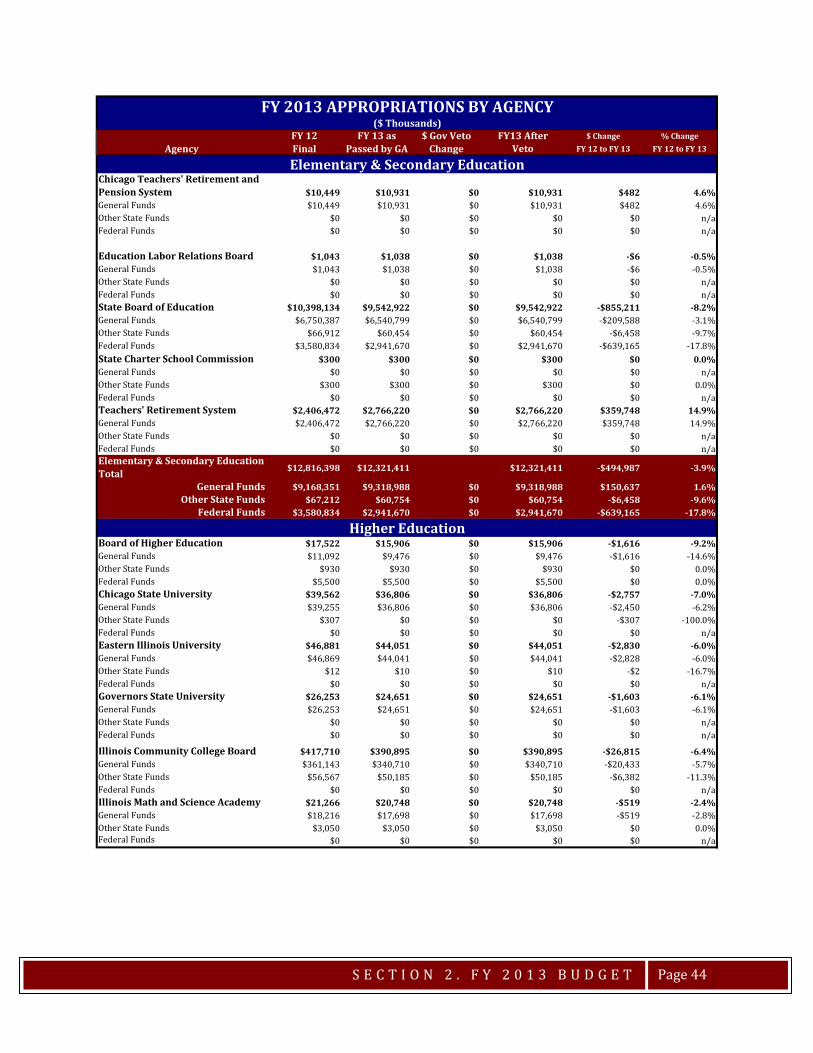
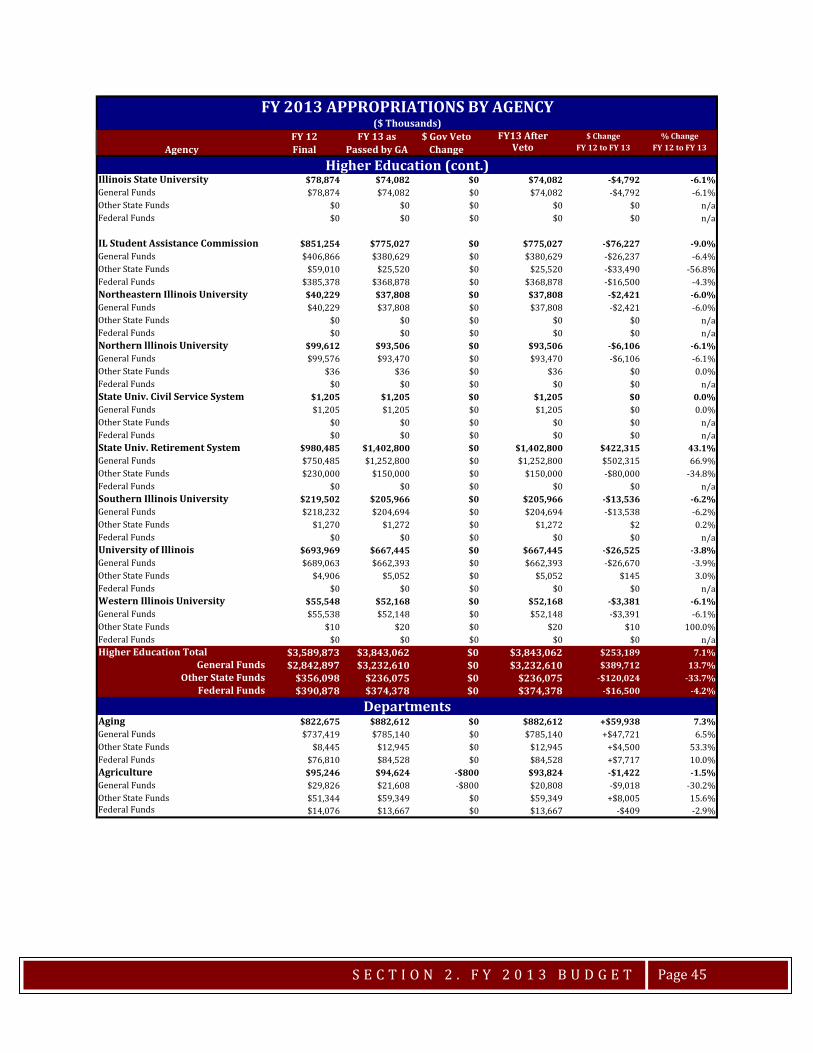
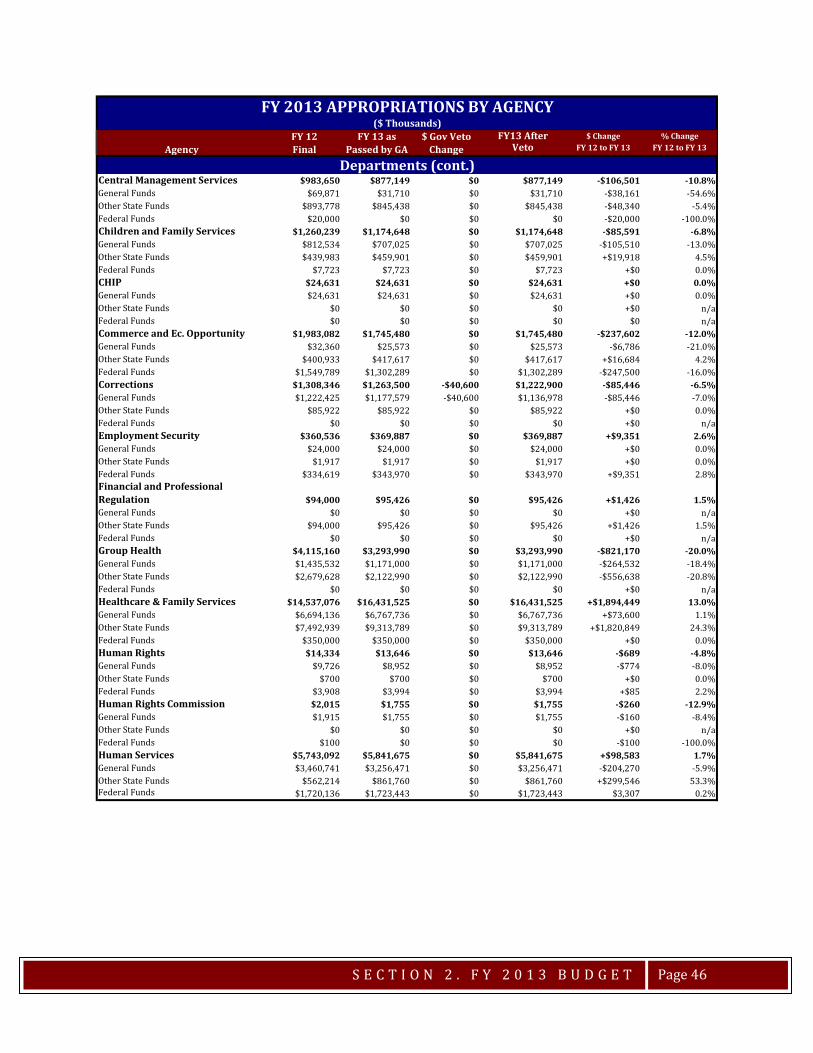
FY 2013 BUDGET SUMMARY According to Illinois law, no later than the third Wednesday in February of each year, the Governor is responsible for presenting a recommended budget before a joint session of the Illinois General Assembly. Governor Quinn presented his FY 2012 Budget proposal on February 22, 2012. The Governor’s introduced a budget focused on: • Pension and Medicaid Stabilization • Rebalancing care for people with developmental disabilities and mental illness • Tax reform • Investing in Education In FY 2012, final appropriations totaled $60.7 billion of which $29.3 billion were from General Funds. The FY 2013 budget as passed by the General Assembly totaled $61.7 billion with $29.4 billion coming from General Funds. The Governor then vetoed $68 million in appropriations from this amount which left the budget at $61.5 billion. This is an increase of $902 million or 1.5% from FY 2012. General Funds appropriations were basically flat as FY 2013 appropriations were down $5 million. The table below demonstrates the budget totals as the FY 2013 budget went through the legislative process to its current state. These totals exclude debt service, payments for old bills and various transfers out. A break-down of appropriations by agency in the budget passed by the General Assembly can be found on page 44.
FY13 After $ Change % ChangeVeto FY 12 to FY 13 FY 12 to FY 13
Grand Total $60.744 $61.715 -$0.068 $61.647 $0.902 1.5%General Funds $29.306 $29.357 -$0.057 $29.300 -$0.005 0.0%
Other State Funds $22.277 $24.147 -$0.011 $24.136 $1.859 8.3%Federal Funds $9.162 $8.210 $0.000 $8.210 -$0.951 -10.4%
Excludes Debt Service, Payments for Old Bills and various Transfers Out
FY 2013 BUDGET SUMMARY
$ Gov Veto Change
FY 13 as Passed by GA
FY 12Final
($ Billions)
S E C T I O N 2 . F Y 2 0 1 3 B U D G E T
Page 26
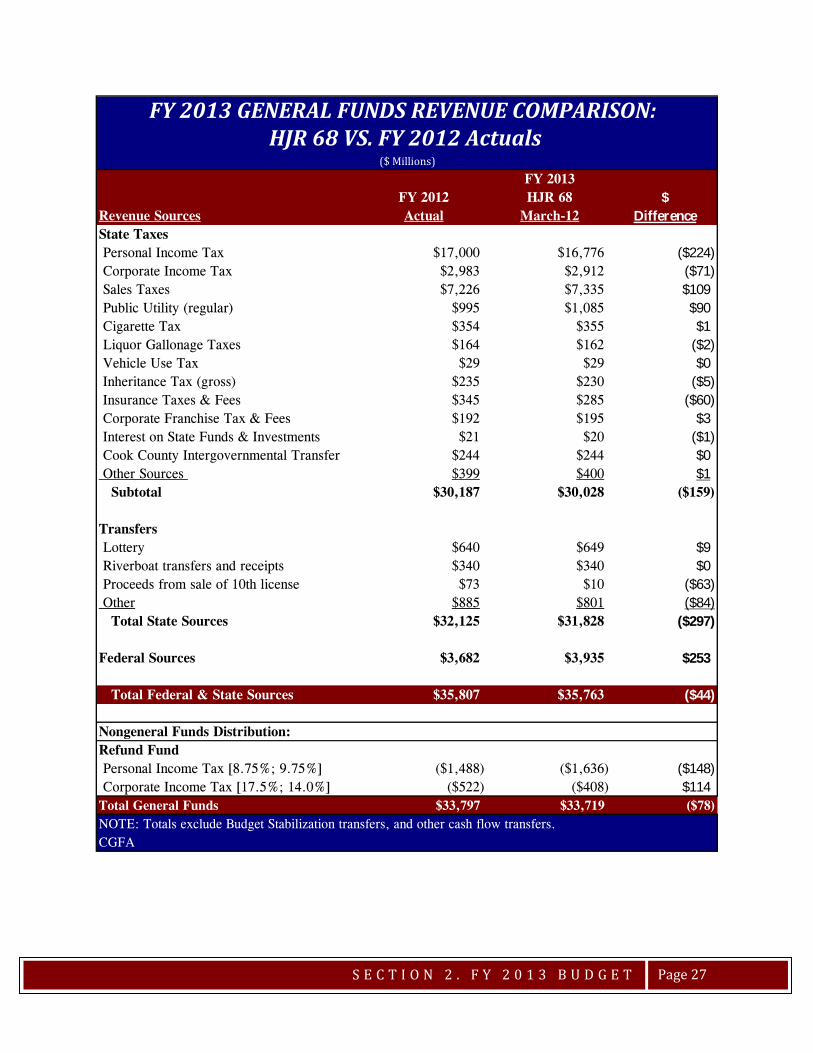
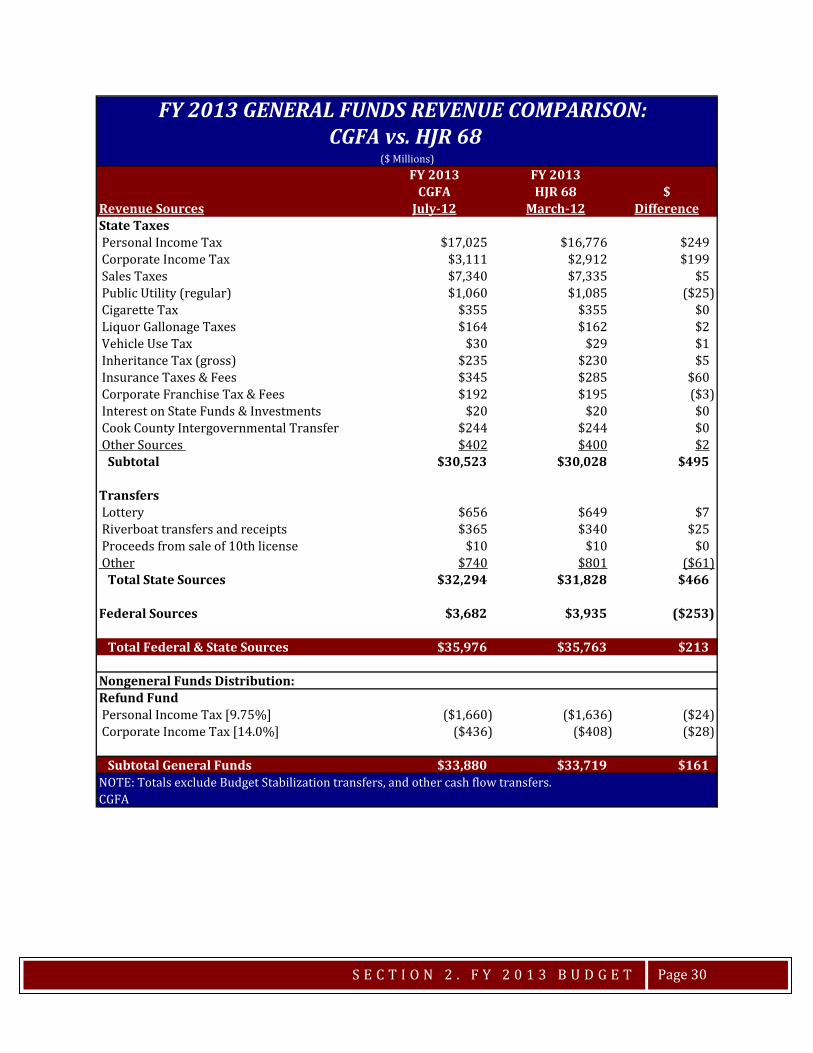
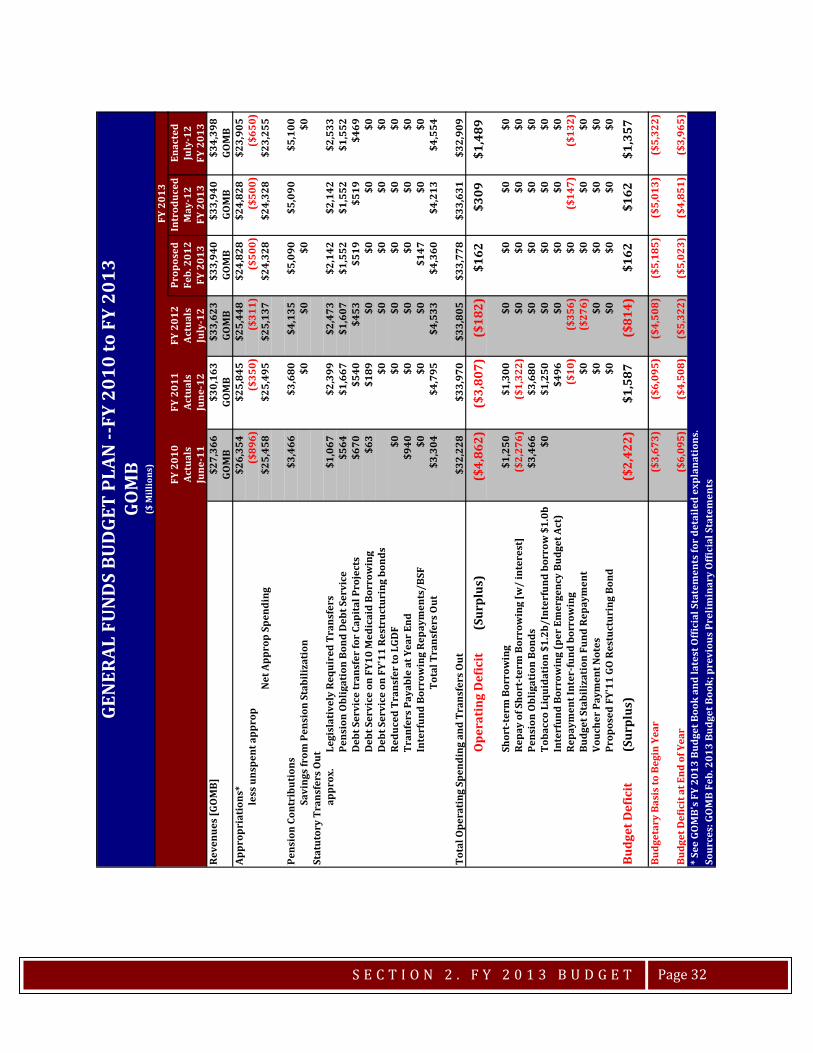
FY 2013 REVENUE RELATED BUDGET HIGHLIGHTS In early March, the General Assembly passed House Joint Resolution 68 which established the estimate of general revenues that was to be utilized in crafting the spending plan for FY 2013. As shown on the next page, HJR 68, which was developed by members from both the House and Senate, estimates FY 2013 revenues to be $33.719 billion. That figure represents a decrease of $78 million, or -0.2%, year over year from FY 2012. The table on page 30 compares CGFA’s July 2012 estimate and that assumed under HJR 68. As shown, CGFA estimates that FY 2013 revenues will be $33.880 billion which exceeds HJR 68 projections by $161 million. CGFA’s projections of the economically related sources are $495 million higher than HRJ 68’s, while the projections for Federal Sources are $253 million lower. The table on page 32 illustrates the latest General Funds Budget Plan for FY 2013 as provided by the Governor’s Office of Management and Budget.
S E C T I O N 2 . F Y 2 0 1 3 B U D G E T
Page 27
FY 2013FY 2012 HJR 68 $
Revenue Sources Actual March-12 DifferenceState Taxes Personal Income Tax $17,000 $16,776 ($224) Corporate Income Tax $2,983 $2,912 ($71) Sales Taxes $7,226 $7,335 $109 Public Utility (regular) $995 $1,085 $90 Cigarette Tax $354 $355 $1 Liquor Gallonage Taxes $164 $162 ($2) Vehicle Use Tax $29 $29 $0 Inheritance Tax (gross) $235 $230 ($5) Insurance Taxes & Fees $345 $285 ($60) Corporate Franchise Tax & Fees $192 $195 $3 Interest on State Funds & Investments $21 $20 ($1) Cook County Intergovernmental Transfer $244 $244 $0 Other Sources $399 $400 $1 Subtotal $30,187 $30,028 ($159)
Transfers Lottery $640 $649 $9 Riverboat transfers and receipts $340 $340 $0 Proceeds from sale of 10th license $73 $10 ($63) Other $885 $801 ($84) Total State Sources $32,125 $31,828 ($297)
Federal Sources $3,682 $3,935 $253
Total Federal & State Sources $35,807 $35,763 ($44)
Nongeneral Funds Distribution:Refund Fund Personal Income Tax [8.75%; 9.75%] ($1,488) ($1,636) ($148) Corporate Income Tax [17.5%; 14.0%] ($522) ($408) $114Total General Funds $33,797 $33,719 ($78)NOTE: Totals exclude Budget Stabilization transfers, and other cash flow transfers.CGFA
FY 2013 GENERAL FUNDS REVENUE COMPARISON: HJR 68 VS. FY 2012 Actuals
($ Millions)
S E C T I O N 2 . F Y 2 0 1 3 B U D G E T
Page 28
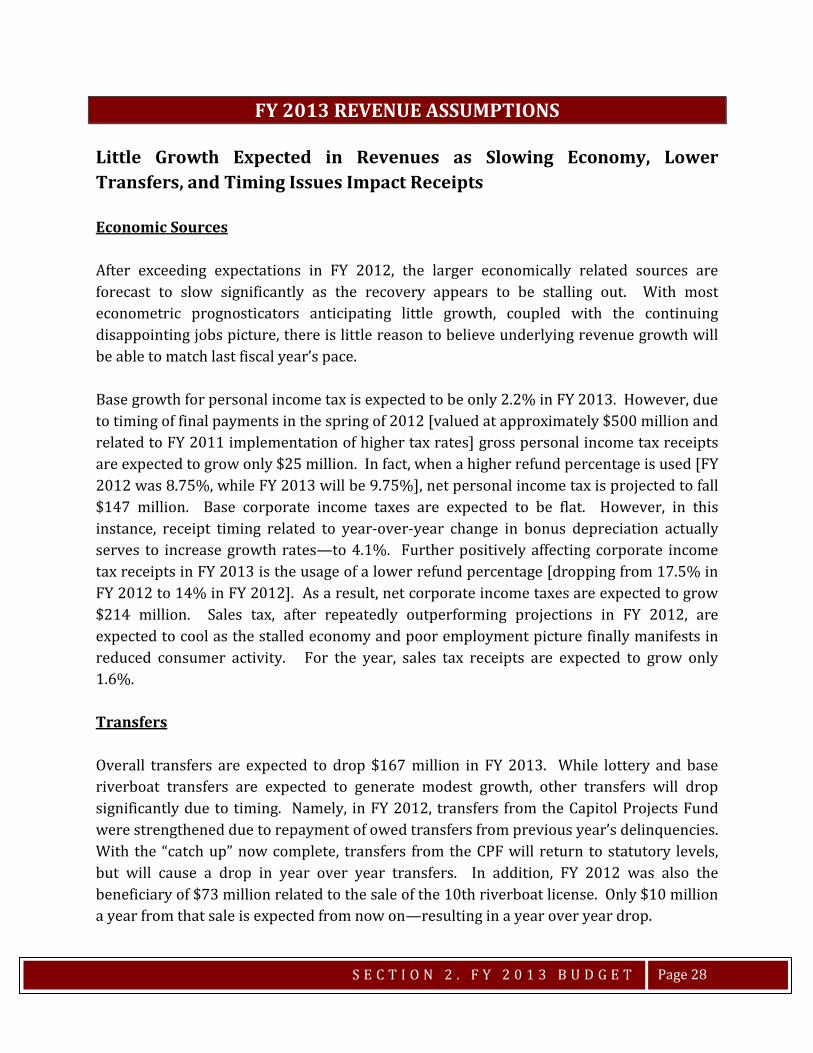
FY 2013 REVENUE ASSUMPTIONS Little Growth Expected in Revenues as Slowing Economy, Lower Transfers, and Timing Issues Impact Receipts Economic Sources After exceeding expectations in FY 2012, the larger economically related sources are forecast to slow significantly as the recovery appears to be stalling out. With most econometric prognosticators anticipating little growth, coupled with the continuing disappointing jobs picture, there is little reason to believe underlying revenue growth will be able to match last fiscal year’s pace. Base growth for personal income tax is expected to be only 2.2% in FY 2013. However, due to timing of final payments in the spring of 2012 [valued at approximately $500 million and related to FY 2011 implementation of higher tax rates] gross personal income tax receipts are expected to grow only $25 million. In fact, when a higher refund percentage is used [FY 2012 was 8.75%, while FY 2013 will be 9.75%], net personal income tax is projected to fall $147 million. Base corporate income taxes are expected to be flat. However, in this instance, receipt timing related to year-over-year change in bonus depreciation actually serves to increase growth rates—to 4.1%. Further positively affecting corporate income tax receipts in FY 2013 is the usage of a lower refund percentage [dropping from 17.5% in FY 2012 to 14% in FY 2012]. As a result, net corporate income taxes are expected to grow $214 million. Sales tax, after repeatedly outperforming projections in FY 2012, are expected to cool as the stalled economy and poor employment picture finally manifests in reduced consumer activity. For the year, sales tax receipts are expected to grow only 1.6%. Transfers Overall transfers are expected to drop $167 million in FY 2013. While lottery and base riverboat transfers are expected to generate modest growth, other transfers will drop significantly due to timing. Namely, in FY 2012, transfers from the Capitol Projects Fund were strengthened due to repayment of owed transfers from previous year’s delinquencies. With the “catch up” now complete, transfers from the CPF will return to statutory levels, but will cause a drop in year over year transfers. In addition, FY 2012 was also the beneficiary of $73 million related to the sale of the 10th riverboat license. Only $10 million a year from that sale is expected from now on—resulting in a year over year drop.
S E C T I O N 2 . F Y 2 0 1 3 B U D G E T
Page 29
Federal Sources Federal sources fell precipitously in FY 2012—dropping $1.704 billion due to lower reimbursement rates as well as related spending. While federal sources are governed by a combination of appropriation limits, Administration spending plans, and ultimately by available resources, it becomes quite difficult to anticipate precisely what the new fiscal year holds. However, given little change in general funds appropriations for reimbursable spending, for the time being the estimate remains the same as FY 2012, at $3.682 billion. Future adjustments may be needed as the fiscal year unfolds and the Administration’s budget plan is detailed.
S E C T I O N 2 . F Y 2 0 1 3 B U D G E T
Page 30
FY 2013 FY 2013CGFA HJR 68 $
Revenue Sources July-12 March-12 DifferenceState Taxes Personal Income Tax $17,025 $16,776 $249 Corporate Income Tax $3,111 $2,912 $199 Sales Taxes $7,340 $7,335 $5 Public Utility (regular) $1,060 $1,085 ($25) Cigarette Tax $355 $355 $0 Liquor Gallonage Taxes $164 $162 $2 Vehicle Use Tax $30 $29 $1 Inheritance Tax (gross) $235 $230 $5 Insurance Taxes & Fees $345 $285 $60 Corporate Franchise Tax & Fees $192 $195 ($3) Interest on State Funds & Investments $20 $20 $0 Cook County Intergovernmental Transfer $244 $244 $0 Other Sources $402 $400 $2 Subtotal $30,523 $30,028 $495
Transfers Lottery $656 $649 $7 Riverboat transfers and receipts $365 $340 $25 Proceeds from sale of 10th license $10 $10 $0 Other $740 $801 ($61) Total State Sources $32,294 $31,828 $466
Federal Sources $3,682 $3,935 ($253)
Total Federal & State Sources $35,976 $35,763 $213
Nongeneral Funds Distribution:Refund Fund Personal Income Tax [9.75%] ($1,660) ($1,636) ($24) Corporate Income Tax [14.0%] ($436) ($408) ($28)
Subtotal General Funds $33,880 $33,719 $161NOTE: Totals exclude Budget Stabilization transfers, and other cash flow transfers.CGFA
FY 2013 GENERAL FUNDS REVENUE COMPARISON:
($ Millions)
CGFA vs. HJR 68
S E C T I O N 2 . F Y 2 0 1 3 B U D G E T
Page 31
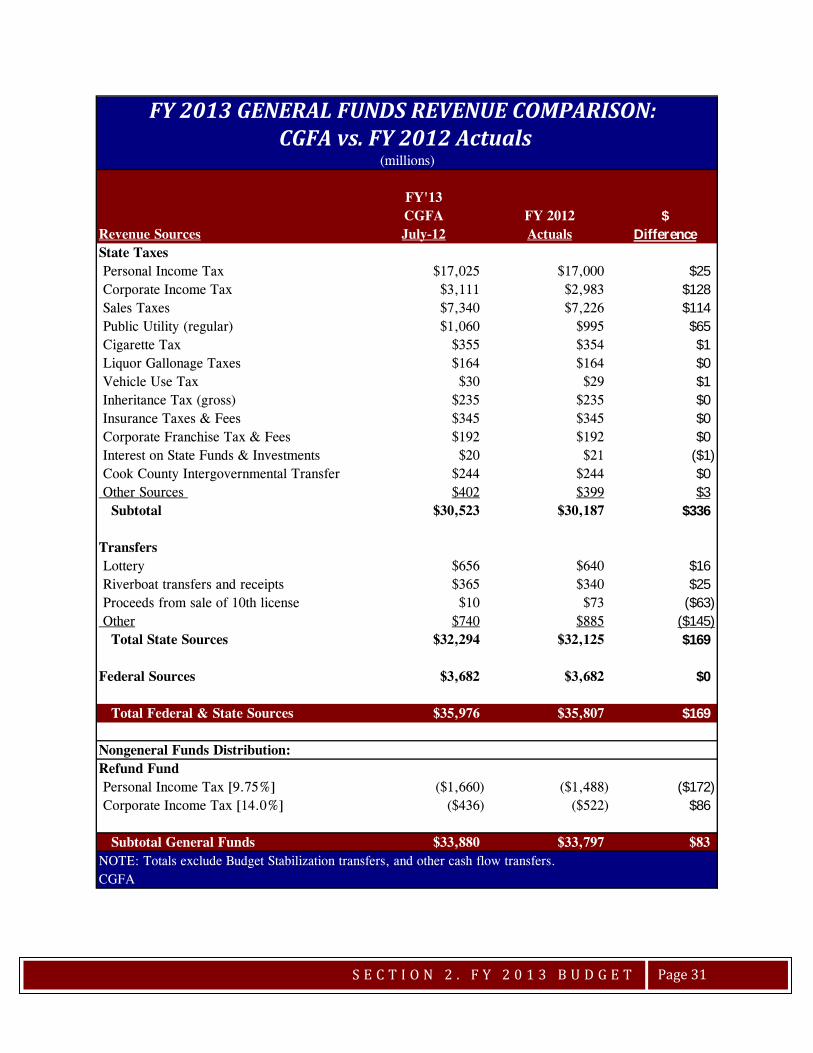
FY'13CGFA FY 2012 $
Revenue Sources July-12 Actuals DifferenceState Taxes Personal Income Tax $17,025 $17,000 $25 Corporate Income Tax $3,111 $2,983 $128 Sales Taxes $7,340 $7,226 $114 Public Utility (regular) $1,060 $995 $65 Cigarette Tax $355 $354 $1 Liquor Gallonage Taxes $164 $164 $0 Vehicle Use Tax $30 $29 $1 Inheritance Tax (gross) $235 $235 $0 Insurance Taxes & Fees $345 $345 $0 Corporate Franchise Tax & Fees $192 $192 $0 Interest on State Funds & Investments $20 $21 ($1) Cook County Intergovernmental Transfer $244 $244 $0 Other Sources $402 $399 $3 Subtotal $30,523 $30,187 $336
Transfers Lottery $656 $640 $16 Riverboat transfers and receipts $365 $340 $25 Proceeds from sale of 10th license $10 $73 ($63) Other $740 $885 ($145) Total State Sources $32,294 $32,125 $169
Federal Sources $3,682 $3,682 $0
Total Federal & State Sources $35,976 $35,807 $169
Nongeneral Funds Distribution:Refund Fund Personal Income Tax [9.75%] ($1,660) ($1,488) ($172) Corporate Income Tax [14.0%] ($436) ($522) $86
Subtotal General Funds $33,880 $33,797 $83NOTE: Totals exclude Budget Stabilization transfers, and other cash flow transfers.CGFA
(millions)
FY 2013 GENERAL FUNDS REVENUE COMPARISON: CGFA vs. FY 2012 Actuals
S E C T I O N 2 . F Y 2 0 1 3 B U D G E T
Page 32
FY 2
010
FY 2
011
FY 2
012
Prop
osed
Intr
oduc
edEn
acte
dAc
tual
sAc
tual
sAc
tual
sFe
b. 2
012
May
-12
July
-12
June
-11
June
-12
July
-12
FY 2
013
FY 2
013
FY 2
013
Reve
nues
[GO
MB]
$27,
366
$30,
163
$33,
623
$33,
940
$33,
940
$34,
398
GOM
BGO
MB
GOM
BGO
MB
GOM
BGO
MB
Appr
opri
atio
ns*
$26,
354
$25,
845
$25,
448
$24,
828
$24,
828
$23,
905
less
uns
pent
app
rop
($89
6)($
350)
($31
1)($
500)
($50
0)($
650)
Net
App
rop
Spen
ding
$25,
458
$25,
495
$25,
137
$24,
328
$24,
328
$23,
255
Pens
ion
Cont
ribu
tion
s $3
,466
$3,6
80$4
,135
$5,0
90$5
,090
$5,1
00Sa
ving
s fr
om P
ensi
on S
tabi
lizat
ion
$0$0
$0$0
Stat
utor
y Tr
ansf
ers
Out
appr
ox.
Legi
slat
ivel
y Re
quir
ed T
rans
fers
$1,0
67$2
,399
$2,4
73$2
,142
$2,1
42$2
,533
Pens
ion
Obl
igat
ion
Bond
Deb
t Ser
vice
$564
$1,6
67$1
,607
$1,5
52$1
,552
$1,5
52D
ebt S
ervi
ce tr
ansf
er fo
r Ca
pita
l Pro
ject
s$6
70$5
40$4
53$5
19$5
19$4
69D
ebt S
ervi
ce o
n FY
10 M
edic
aid
Borr
owin
g$6
3$1
89$0
$0$0
$0D
ebt S
ervi
ce o
n FY
'11
Rest
ruct
urin
g bo
nds
$0$0
$0$0
$0Re
duce
d Tr
ansf
er to
LGD
F$0
$0$0
$0$0
$0Tr
anfe
rs P
ayab
le a
t Yea
r En
d$9
40$0
$0$0
$0$0
Inte
rfun
d Bo
rrow
ing
Repa
ymen
ts/B
SF$0
$0$0
$147
$0$0
Tota
l Tra
nsfe
rs O
ut$3
,304
$4,7
95$4
,533
$4,3
60$4
,213
$4,5
54
Tota
l Ope
rati
ng S
pend
ing
and
Tran
sfer
s O
ut$3
2,22
8$3
3,97
0$3
3,80
5$3
3,77
8$3
3,63
1$3
2,90
9
Ope
rati
ng D
efic
it(S
urpl
us)
($4,
862)
($3,
807)
($18
2)$1
62$3
09$1
,489
Shor
t-te
rm B
orro
win
g$1
,250
$1,3
00$0
$0$0
$0Re
pay
of S
hort
-ter
m B
orro
win
g [w
/ in
tere
st]
($2,
276)
($1,
322)
$0$0
$0$0
Pens
ion
Obl
igat
ion
Bond
s$3
,466
$3,6
80$0
$0$0
$0To
bacc
o Li
quid
atio
n $1
.2b/
Inte
rfun
d bo
rrow
$1.
0b$0
$1,2
50$0
$0$0
$0In
terf
und
Borr
owin
g (p
er E
mer
genc
y Bu
dget
Act
)$4
96$0
$0$0
$0Re
paym
ent I
nter
-fund
bor
row
ing
($10
)($
356)
$0($
147)
($13
2)Bu
dget
Sta
biliz
atio
n Fu
nd R
epay
men
t$0
($27
6)$0
$0$0
Vouc
her
Paym
ent N
otes
$0$0
$0$0
$0Pr
opos
ed F
Y'11
GO
Res
tuct
urin
g Bo
nd$0
$0$0
$0$0
Budg
et D
efic
it(S
urpl
us)
($2,
422)
$1,5
87($
814)
$162
$162
$1,3
57
Budg
etar
y Ba
sis
to B
egin
Yea
r($
3,67
3)($
6,09
5)($
4,50
8)($
5,18
5)($
5,01
3)($
5,32
2)
Budg
et D
efic
it a
t End
of Y
ear
($6,
095)
($4,
508)
($5,
322)
($5,
023)
($4,
851)
($3,
965)
Sour
ces:
GO
MB
Feb.
201
3 Bu
dget
Boo
k; p
revi
ous
Prel
imin
ary
Offi
cial
Sta
tem
ents
GEN
ERAL
FU
ND
S BU
DGE
T PL
AN --
FY 2
010
to F
Y 20
13
($ M
illio
ns)
FY 2
013
* Se
e GO
MB'
s FY
201
3 Bu
dget
Boo
k an
d la
test
Offi
cial
Sta
tem
ents
for
deta
iled
expl
anat
ions
.
GOM
B
S E C T I O N 2 . F Y 2 0 1 3 B U D G E T
Page 33
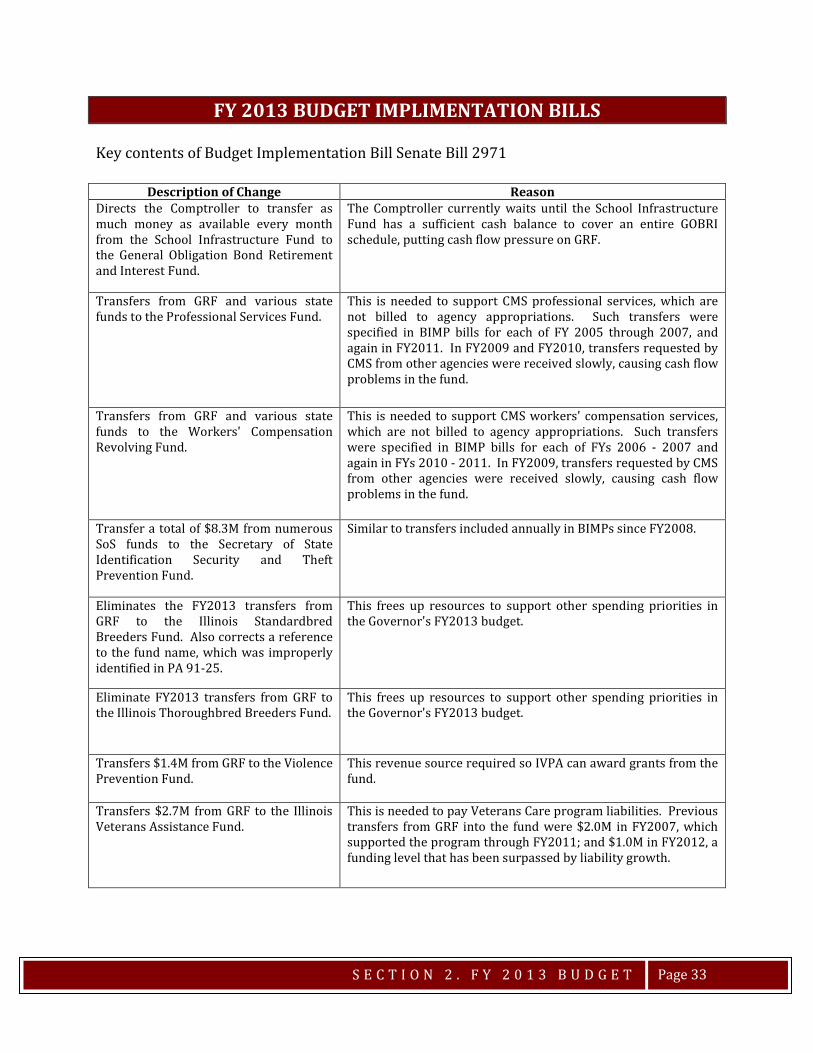
FY 2013 BUDGET IMPLIMENTATION BILLS Key contents of Budget Implementation Bill Senate Bill 2971
Description of Change Reason Directs the Comptroller to transfer as much money as available every month from the School Infrastructure Fund to the General Obligation Bond Retirement and Interest Fund.
The Comptroller currently waits until the School Infrastructure Fund has a sufficient cash balance to cover an entire GOBRI schedule, putting cash flow pressure on GRF.
Transfers from GRF and various state funds to the Professional Services Fund.
This is needed to support CMS professional services, which are not billed to agency appropriations. Such transfers were specified in BIMP bills for each of FY 2005 through 2007, and again in FY2011. In FY2009 and FY2010, transfers requested by CMS from other agencies were received slowly, causing cash flow problems in the fund.
Transfers from GRF and various state funds to the Workers' Compensation Revolving Fund.
This is needed to support CMS workers' compensation services, which are not billed to agency appropriations. Such transfers were specified in BIMP bills for each of FYs 2006 - 2007 and again in FYs 2010 - 2011. In FY2009, transfers requested by CMS from other agencies were received slowly, causing cash flow problems in the fund.
Transfer a total of $8.3M from numerous SoS funds to the Secretary of State Identification Security and Theft Prevention Fund.
Similar to transfers included annually in BIMPs since FY2008.
Eliminates the FY2013 transfers from GRF to the Illinois Standardbred Breeders Fund. Also corrects a reference to the fund name, which was improperly identified in PA 91-25.
This frees up resources to support other spending priorities in the Governor's FY2013 budget.
Eliminate FY2013 transfers from GRF to the Illinois Thoroughbred Breeders Fund.
This frees up resources to support other spending priorities in the Governor's FY2013 budget.
Transfers $1.4M from GRF to the Violence Prevention Fund.
This revenue source required so IVPA can award grants from the fund.
Transfers $2.7M from GRF to the Illinois Veterans Assistance Fund.
This is needed to pay Veterans Care program liabilities. Previous transfers from GRF into the fund were $2.0M in FY2007, which supported the program through FY2011; and $1.0M in FY2012, a funding level that has been surpassed by liability growth.
S E C T I O N 2 . F Y 2 0 1 3 B U D G E T
Page 34
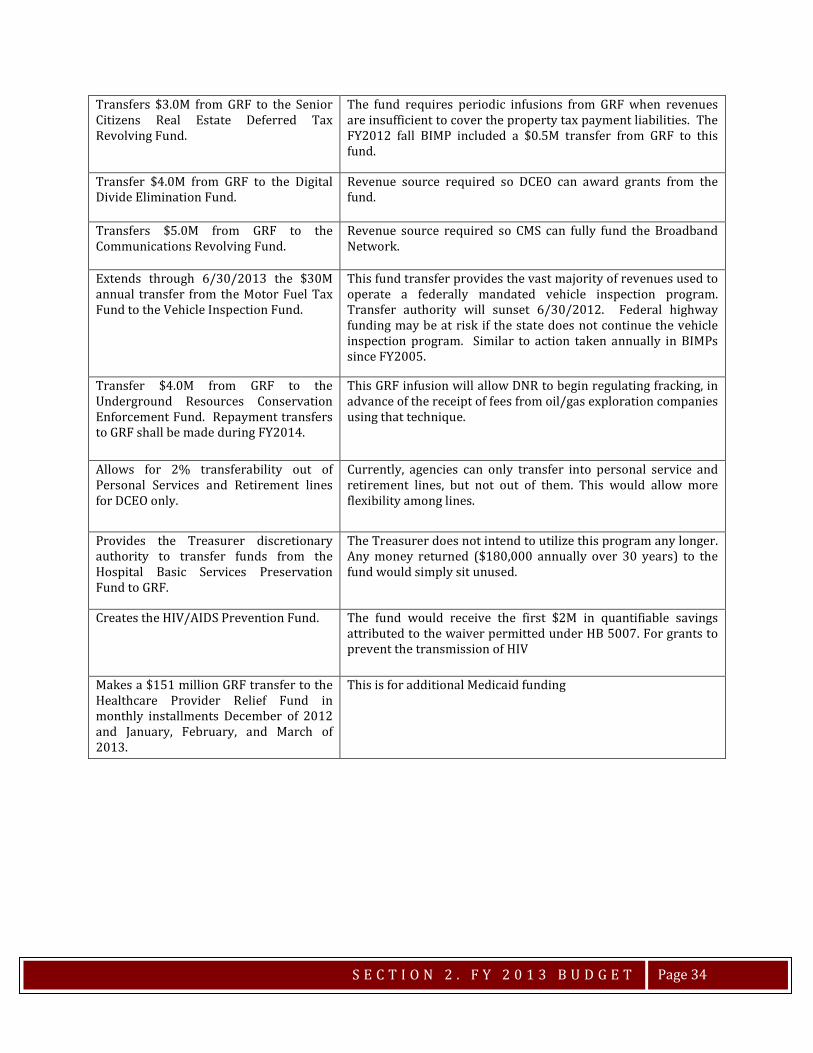
Transfers $3.0M from GRF to the Senior Citizens Real Estate Deferred Tax Revolving Fund.
The fund requires periodic infusions from GRF when revenues are insufficient to cover the property tax payment liabilities. The FY2012 fall BIMP included a $0.5M transfer from GRF to this fund.
Transfer $4.0M from GRF to the Digital Divide Elimination Fund.
Revenue source required so DCEO can award grants from the fund.
Transfers $5.0M from GRF to the Communications Revolving Fund.
Revenue source required so CMS can fully fund the Broadband Network.
Extends through 6/30/2013 the $30M annual transfer from the Motor Fuel Tax Fund to the Vehicle Inspection Fund.
This fund transfer provides the vast majority of revenues used to operate a federally mandated vehicle inspection program. Transfer authority will sunset 6/30/2012. Federal highway funding may be at risk if the state does not continue the vehicle inspection program. Similar to action taken annually in BIMPs since FY2005.
Transfer $4.0M from GRF to the Underground Resources Conservation Enforcement Fund. Repayment transfers to GRF shall be made during FY2014.
This GRF infusion will allow DNR to begin regulating fracking, in advance of the receipt of fees from oil/gas exploration companies using that technique.
Allows for 2% transferability out of Personal Services and Retirement lines for DCEO only.
Currently, agencies can only transfer into personal service and retirement lines, but not out of them. This would allow more flexibility among lines.
Provides the Treasurer discretionary authority to transfer funds from the Hospital Basic Services Preservation Fund to GRF.
The Treasurer does not intend to utilize this program any longer. Any money returned ($180,000 annually over 30 years) to the fund would simply sit unused.
Creates the HIV/AIDS Prevention Fund. The fund would receive the first $2M in quantifiable savings attributed to the waiver permitted under HB 5007. For grants to prevent the transmission of HIV
Makes a $151 million GRF transfer to the Healthcare Provider Relief Fund in monthly installments December of 2012 and January, February, and March of 2013.
This is for additional Medicaid funding
S E C T I O N 2 . F Y 2 0 1 3 B U D G E T
Page 35
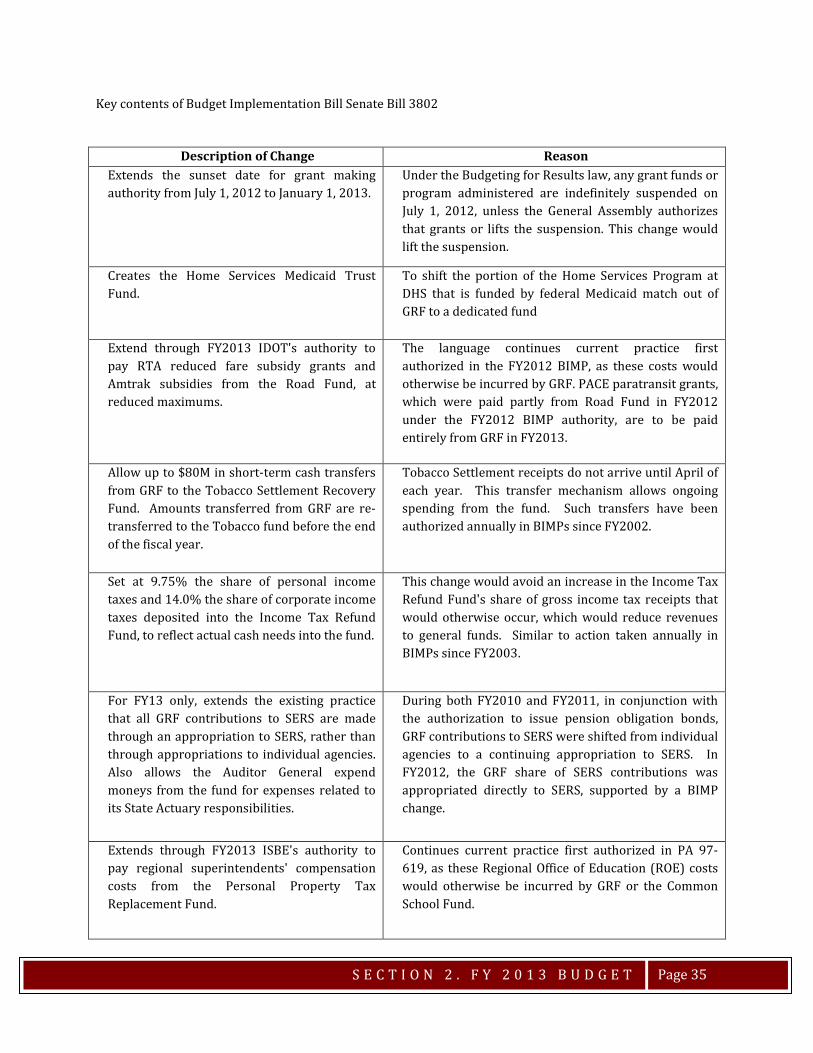
Key contents of Budget Implementation Bill Senate Bill 3802
Description of Change Reason Extends the sunset date for grant making authority from July 1, 2012 to January 1, 2013.
Under the Budgeting for Results law, any grant funds or program administered are indefinitely suspended on July 1, 2012, unless the General Assembly authorizes that grants or lifts the suspension. This change would lift the suspension.
Creates the Home Services Medicaid Trust Fund.
To shift the portion of the Home Services Program at DHS that is funded by federal Medicaid match out of GRF to a dedicated fund
Extend through FY2013 IDOT's authority to pay RTA reduced fare subsidy grants and Amtrak subsidies from the Road Fund, at reduced maximums.
The language continues current practice first authorized in the FY2012 BIMP, as these costs would otherwise be incurred by GRF. PACE paratransit grants, which were paid partly from Road Fund in FY2012 under the FY2012 BIMP authority, are to be paid entirely from GRF in FY2013.
Allow up to $80M in short-term cash transfers from GRF to the Tobacco Settlement Recovery Fund. Amounts transferred from GRF are re-transferred to the Tobacco fund before the end of the fiscal year.
Tobacco Settlement receipts do not arrive until April of each year. This transfer mechanism allows ongoing spending from the fund. Such transfers have been authorized annually in BIMPs since FY2002.
Set at 9.75% the share of personal income taxes and 14.0% the share of corporate income taxes deposited into the Income Tax Refund Fund, to reflect actual cash needs into the fund.
This change would avoid an increase in the Income Tax Refund Fund's share of gross income tax receipts that would otherwise occur, which would reduce revenues to general funds. Similar to action taken annually in BIMPs since FY2003.
For FY13 only, extends the existing practice that all GRF contributions to SERS are made through an appropriation to SERS, rather than through appropriations to individual agencies. Also allows the Auditor General expend moneys from the fund for expenses related to its State Actuary responsibilities.
During both FY2010 and FY2011, in conjunction with the authorization to issue pension obligation bonds, GRF contributions to SERS were shifted from individual agencies to a continuing appropriation to SERS. In FY2012, the GRF share of SERS contributions was appropriated directly to SERS, supported by a BIMP change.
Extends through FY2013 ISBE's authority to pay regional superintendents' compensation costs from the Personal Property Tax Replacement Fund.
Continues current practice first authorized in PA 97-619, as these Regional Office of Education (ROE) costs would otherwise be incurred by GRF or the Common School Fund.

S E C T I O N 2 . F Y 2 0 1 3 B U D G E T
Page 36
Description of Change Reason Clarifies Home Services Program reimbursement rates paid by DHS.
Language is needed to ensure that health care contributions made on behalf of Home Services Program Personal Assistants are able to qualify for federal Medicaid matching funds.
Allow IEMA to spend from the Radiation Protection Fund and the Nuclear Safety Emergency Preparedness Fund for general IEMA operational costs, remove the requirement that refunds be paid to Exelon if the balance in the Nuclear Safety Emergency Preparedness Fund exceeds a certain threshold, and remove the requirement that IEMA consult with Exelon in preparing its nuclear safety budget.
This will allow IEMA's GRF funding for disaster-related purposes to be reduced during FY2013.
Requires any convention and tourism bureau receiving a grant that requires matching funds to match funds by at least 50%
Currently, local convention and tourism bureaus are required to match 100% of state funds received. Allowing them to only match 50% will lessen the burden locally.
Audit Expense Fund transfers Annually, various other state funds are transferred into the Audit Expense Fund statutorily.
Creates the Estate Tax Refund Fund. Provides that the State Treasurer will collect estate tax money directly, and 6% of receipts will be transferred into a refund fund to pay estate tax overpayments.
Under current law, county treasurers collect all estate tax payments and remit those payments to the State Treasurer. In exchange, the county treasurers receive 6% of estate tax receipts (estimated $15 million in FY13). This language would end the county treasurers’ responsibility and payment. Instead, the State Treasurer will collect the money directly, and 6% of receipts will be transferred into a refund fund to pay estate tax overpayments. This will end the GRF pressure to pay these refunds.
Provides that for FY 13 the Historic Preservation Agency will reserve $2,000,000 of local tourism funds and $9,800,000 of funds in the Tourism Promotion Fund.
For the operation of the Abraham Lincoln Presidential Library and Museum and state historic sites.
Makes a $500 million GRF transfer to the Healthcare Provider Relief Fund in monthly installments in July, August, September, October, and November of 2012.
This language is for the payment of old bills.
S E C T I O N 2 . F Y 2 0 1 3 B U D G E T
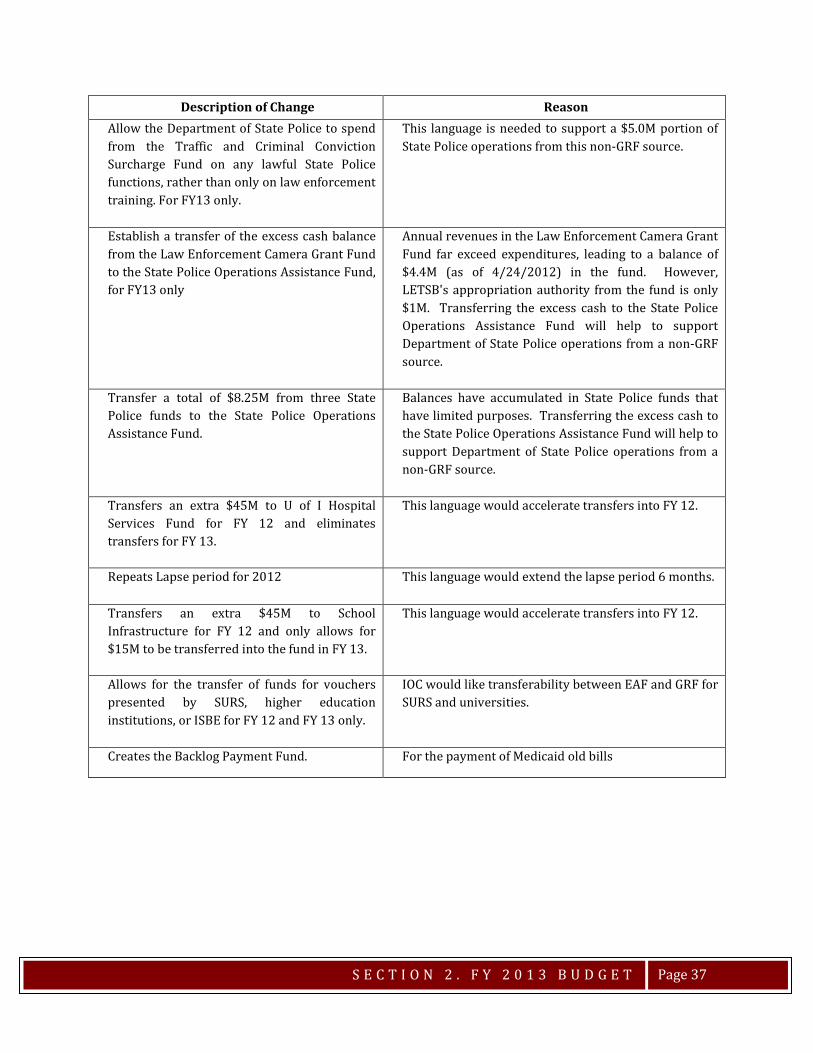
Page 37
Description of Change Reason Allow the Department of State Police to spend from the Traffic and Criminal Conviction Surcharge Fund on any lawful State Police functions, rather than only on law enforcement training. For FY13 only.
This language is needed to support a $5.0M portion of State Police operations from this non-GRF source.
Establish a transfer of the excess cash balance from the Law Enforcement Camera Grant Fund to the State Police Operations Assistance Fund, for FY13 only
Annual revenues in the Law Enforcement Camera Grant Fund far exceed expenditures, leading to a balance of $4.4M (as of 4/24/2012) in the fund. However, LETSB's appropriation authority from the fund is only $1M. Transferring the excess cash to the State Police Operations Assistance Fund will help to support Department of State Police operations from a non-GRF source.
Transfer a total of $8.25M from three State Police funds to the State Police Operations Assistance Fund.
Balances have accumulated in State Police funds that have limited purposes. Transferring the excess cash to the State Police Operations Assistance Fund will help to support Department of State Police operations from a non-GRF source.
Transfers an extra $45M to U of I Hospital Services Fund for FY 12 and eliminates transfers for FY 13.
This language would accelerate transfers into FY 12.
Repeats Lapse period for 2012 This language would extend the lapse period 6 months.
Transfers an extra $45M to School Infrastructure for FY 12 and only allows for $15M to be transferred into the fund in FY 13.
This language would accelerate transfers into FY 12.
Allows for the transfer of funds for vouchers presented by SURS, higher education institutions, or ISBE for FY 12 and FY 13 only.
IOC would like transferability between EAF and GRF for SURS and universities.
Creates the Backlog Payment Fund. For the payment of Medicaid old bills

S E C T I O N 2 . F Y 2 0 1 3 B U D G E T
Page 38
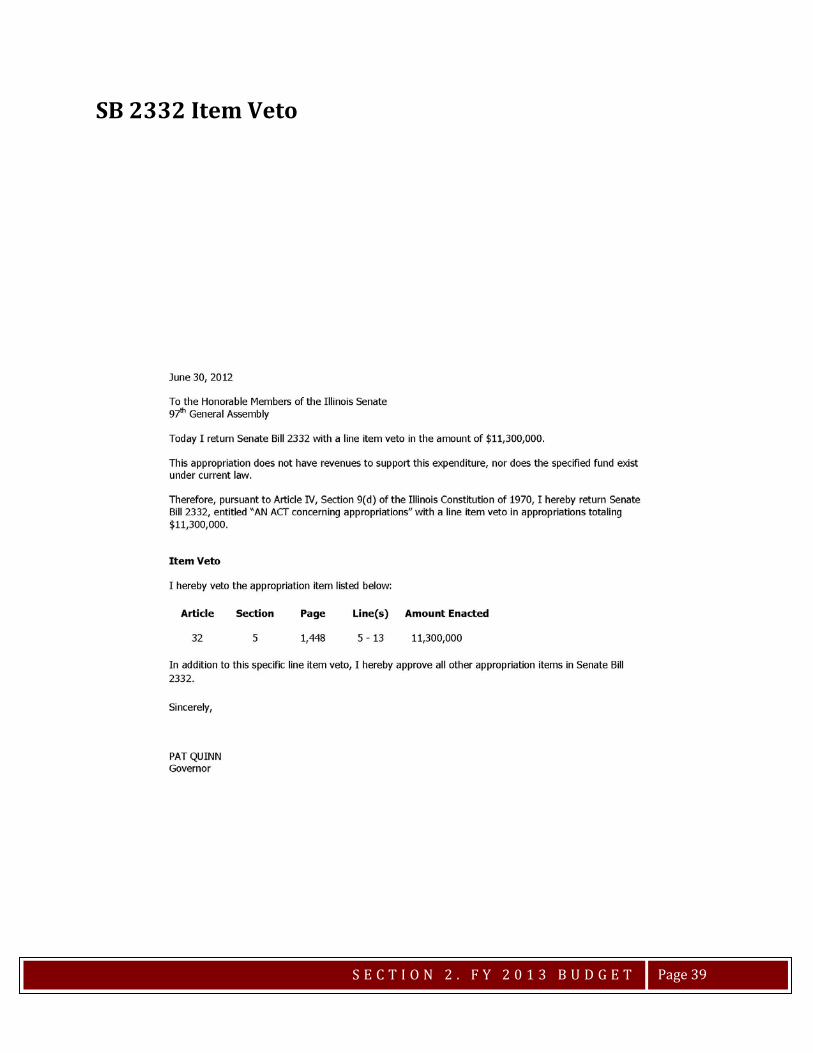
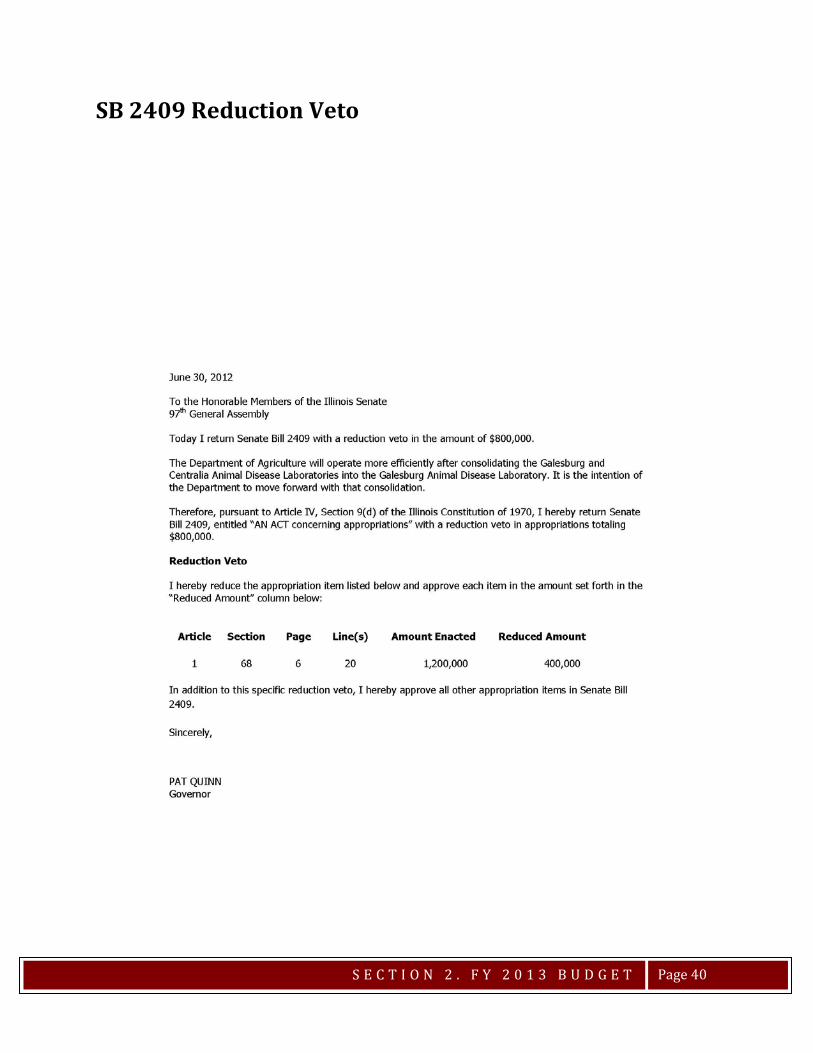
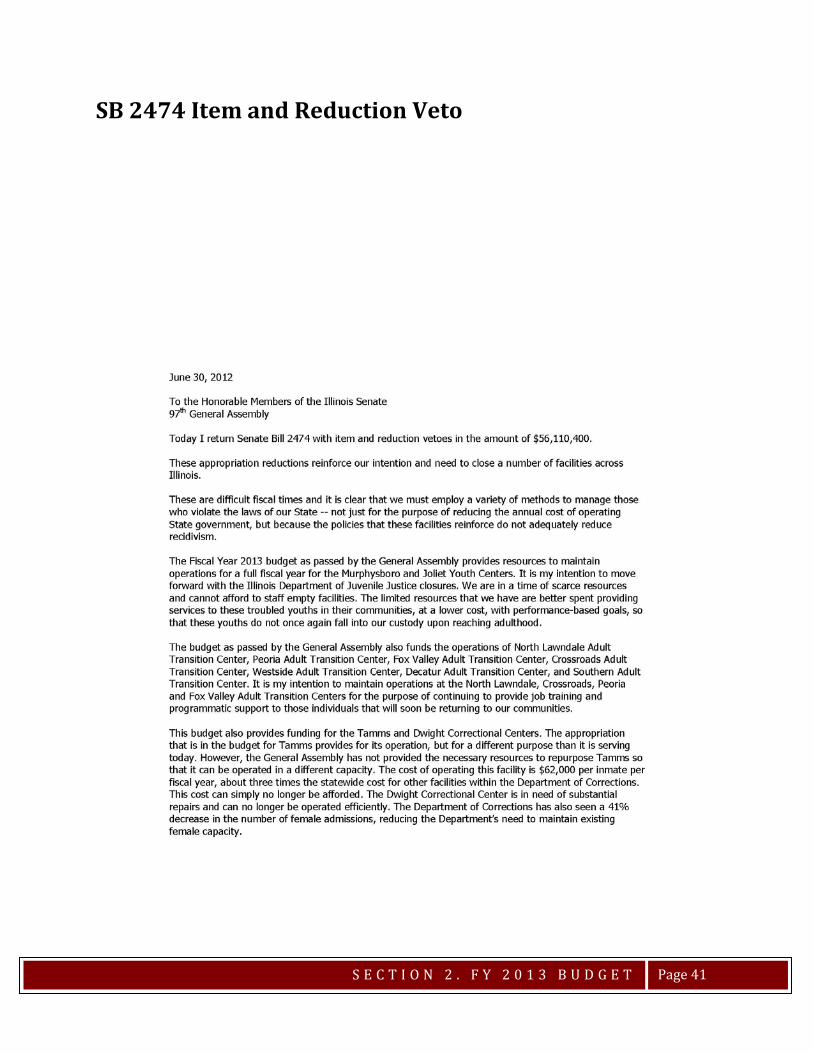
GOVERNOR’S ACTIONS The table below summarizes the Governor’s vetoes of the FY 2013 budget. These vetoes reduce or remove appropriation amounts for certain line items. These vetoes can be overridden by a 2/3 majority vote in both houses of the General Assembly. The table below lists the agency affected, a description of the change, the associated amounts of appropriations, and comments made about the line item in the Governor’s veto message. The subsequent pages contain the actual Governor’s messages related to each of the vetoed bills.
Agency Bill Description Amount Enacted Veto Amount After
Veto Fund Governor's Comments
Illinois Finance Authority
SB 2332 Fire and Ambulance Services Loans
$11,300,000 $11,300,000 $0 State Funds This appropriation does not have revenues to support this expenditure, nor does the specified fund exist under current law.
Agriculture SB 2409 Animal Disease Center Consolidation
$1,200,000 $800,000 $400,000 General Funds The Dept. of Ag will operate more efficiently after consolidating the Galesburg and Centralia Animal Disease Labs.
Corrections SB 2474 Dwight Correctional Center $23,825,800 $19,373,100 $4,452,700 General Funds The Dwight Correctional Center is in need of substantial repairs and can no longer be operated efficiently. The Department of Corrections has also seen a 41% decrease in the number of female admissions, reducing the Department’s need to maintain existing female capacity.
Corrections SB 2474 Tamms Correctional Center $26,265,300 $21,227,000 $5,038,300 General Funds The appropriation that is in the budget for Tamms provides for its operation, but for a different purpose than it is servingtoday. However, the General Assembly has not provided the necessary resources to repurpose Tamms so that it can be operated in a different capacity. The cost of operating this facility is $62,000 per inmate per fiscal year, about three times the statewide cost for other facilities within the Department of Corrections. This cost can simply no longer be afforded.
Juvenile Justice SB 2474 IYC - Joliet* $19,686,700 $8,934,900 $10,751,800 General Funds We are in a time of scarce resources and cannot afford to staff empty facilities. The limited resources that we have are better spent providingservices to these troubled youths in their communities, at a lower cost, with performance-based goals, so that these youths do not once again fall into our custody upon reaching adulthood.
Juvenile Justice SB 2474 IYC - Murphysboro* $7,779,600 $6,575,400 $1,204,200 General Funds See previous comment.
$56,910,400$11,300,000$68,210,400
Source: Office of the Governor
FY 2013 Budget Veto Descriptions
General Funds Reductions State Funds Reductions
Total*These veto summaries are the sum of several line item or reduction vetoes that are related to the individual facilities.
S E C T I O N 2 . F Y 2 0 1 3 B U D G E T
Page 39
SB 2332 Item Veto
S E C T I O N 2 . F Y 2 0 1 3 B U D G E T
Page 40
SB 2409 Reduction Veto
S E C T I O N 2 . F Y 2 0 1 3 B U D G E T
Page 41
SB 2474 Item and Reduction Veto

S E C T I O N 2 . F Y 2 0 1 3 B U D G E T
Page 42
S E C T I O N 2 . F Y 2 0 1 3 B U D G E T
Page 43
S E C T I O N 2 . F Y 2 0 1 3 B U D G E T
Page 44
FY13 After $ Change % ChangeVeto FY 12 to FY 13 FY 12 to FY 13
Chicago Teachers' Retirement and Pension System $10,449 $10,931 $0 $10,931 $482 4.6%General Funds $10,449 $10,931 $0 $10,931 $482 4.6%Other State Funds $0 $0 $0 $0 $0 n/aFederal Funds $0 $0 $0 $0 $0 n/a
Education Labor Relations Board $1,043 $1,038 $0 $1,038 -$6 -0.5%General Funds $1,043 $1,038 $0 $1,038 -$6 -0.5%Other State Funds $0 $0 $0 $0 $0 n/aFederal Funds $0 $0 $0 $0 $0 n/aState Board of Education $10,398,134 $9,542,922 $0 $9,542,922 -$855,211 -8.2%General Funds $6,750,387 $6,540,799 $0 $6,540,799 -$209,588 -3.1%Other State Funds $66,912 $60,454 $0 $60,454 -$6,458 -9.7%Federal Funds $3,580,834 $2,941,670 $0 $2,941,670 -$639,165 -17.8%State Charter School Commission $300 $300 $0 $300 $0 0.0%General Funds $0 $0 $0 $0 $0 n/aOther State Funds $300 $300 $0 $300 $0 0.0%Federal Funds $0 $0 $0 $0 $0 n/aTeachers' Retirement System $2,406,472 $2,766,220 $0 $2,766,220 $359,748 14.9%General Funds $2,406,472 $2,766,220 $0 $2,766,220 $359,748 14.9%Other State Funds $0 $0 $0 $0 $0 n/aFederal Funds $0 $0 $0 $0 $0 n/aElementary & Secondary Education Total $12,816,398 $12,321,411 $12,321,411 -$494,987 -3.9%
General Funds $9,168,351 $9,318,988 $0 $9,318,988 $150,637 1.6%Other State Funds $67,212 $60,754 $0 $60,754 -$6,458 -9.6%
Federal Funds $3,580,834 $2,941,670 $0 $2,941,670 -$639,165 -17.8%
Board of Higher Education $17,522 $15,906 $0 $15,906 -$1,616 -9.2%General Funds $11,092 $9,476 $0 $9,476 -$1,616 -14.6%Other State Funds $930 $930 $0 $930 $0 0.0%Federal Funds $5,500 $5,500 $0 $5,500 $0 0.0%Chicago State University $39,562 $36,806 $0 $36,806 -$2,757 -7.0%General Funds $39,255 $36,806 $0 $36,806 -$2,450 -6.2%Other State Funds $307 $0 $0 $0 -$307 -100.0%Federal Funds $0 $0 $0 $0 $0 n/aEastern Illinois University $46,881 $44,051 $0 $44,051 -$2,830 -6.0%General Funds $46,869 $44,041 $0 $44,041 -$2,828 -6.0%Other State Funds $12 $10 $0 $10 -$2 -16.7%Federal Funds $0 $0 $0 $0 $0 n/aGovernors State University $26,253 $24,651 $0 $24,651 -$1,603 -6.1%General Funds $26,253 $24,651 $0 $24,651 -$1,603 -6.1%Other State Funds $0 $0 $0 $0 $0 n/aFederal Funds $0 $0 $0 $0 $0 n/a
Illinois Community College Board $417,710 $390,895 $0 $390,895 -$26,815 -6.4%General Funds $361,143 $340,710 $0 $340,710 -$20,433 -5.7%Other State Funds $56,567 $50,185 $0 $50,185 -$6,382 -11.3%Federal Funds $0 $0 $0 $0 $0 n/aIllinois Math and Science Academy $21,266 $20,748 $0 $20,748 -$519 -2.4%General Funds $18,216 $17,698 $0 $17,698 -$519 -2.8%Other State Funds $3,050 $3,050 $0 $3,050 $0 0.0%Federal Funds $0 $0 $0 $0 $0 n/a
$ Gov Veto Change
FY 2013 APPROPRIATIONS BY AGENCY($ Thousands)
Elementary & Secondary Education
Higher Education
Agency FY 12Final
FY 13 as Passed by GA
S E C T I O N 2 . F Y 2 0 1 3 B U D G E T
Page 45
FY13 After $ Change % ChangeVeto FY 12 to FY 13 FY 12 to FY 13
Illinois State University $78,874 $74,082 $0 $74,082 -$4,792 -6.1%General Funds $78,874 $74,082 $0 $74,082 -$4,792 -6.1%Other State Funds $0 $0 $0 $0 $0 n/aFederal Funds $0 $0 $0 $0 $0 n/a
IL Student Assistance Commission $851,254 $775,027 $0 $775,027 -$76,227 -9.0%General Funds $406,866 $380,629 $0 $380,629 -$26,237 -6.4%Other State Funds $59,010 $25,520 $0 $25,520 -$33,490 -56.8%Federal Funds $385,378 $368,878 $0 $368,878 -$16,500 -4.3%Northeastern Illinois University $40,229 $37,808 $0 $37,808 -$2,421 -6.0%General Funds $40,229 $37,808 $0 $37,808 -$2,421 -6.0%Other State Funds $0 $0 $0 $0 $0 n/aFederal Funds $0 $0 $0 $0 $0 n/aNorthern lllinois University $99,612 $93,506 $0 $93,506 -$6,106 -6.1%General Funds $99,576 $93,470 $0 $93,470 -$6,106 -6.1%Other State Funds $36 $36 $0 $36 $0 0.0%Federal Funds $0 $0 $0 $0 $0 n/aState Univ. Civil Service System $1,205 $1,205 $0 $1,205 $0 0.0%General Funds $1,205 $1,205 $0 $1,205 $0 0.0%Other State Funds $0 $0 $0 $0 $0 n/aFederal Funds $0 $0 $0 $0 $0 n/aState Univ. Retirement System $980,485 $1,402,800 $0 $1,402,800 $422,315 43.1%General Funds $750,485 $1,252,800 $0 $1,252,800 $502,315 66.9%Other State Funds $230,000 $150,000 $0 $150,000 -$80,000 -34.8%Federal Funds $0 $0 $0 $0 $0 n/aSouthern Illinois University $219,502 $205,966 $0 $205,966 -$13,536 -6.2%General Funds $218,232 $204,694 $0 $204,694 -$13,538 -6.2%Other State Funds $1,270 $1,272 $0 $1,272 $2 0.2%Federal Funds $0 $0 $0 $0 $0 n/aUniversity of Illinois $693,969 $667,445 $0 $667,445 -$26,525 -3.8%General Funds $689,063 $662,393 $0 $662,393 -$26,670 -3.9%Other State Funds $4,906 $5,052 $0 $5,052 $145 3.0%Federal Funds $0 $0 $0 $0 $0 n/aWestern Illinois University $55,548 $52,168 $0 $52,168 -$3,381 -6.1%General Funds $55,538 $52,148 $0 $52,148 -$3,391 -6.1%Other State Funds $10 $20 $0 $20 $10 100.0%Federal Funds $0 $0 $0 $0 $0 n/aHigher Education Total $3,589,873 $3,843,062 $0 $3,843,062 $253,189 7.1%
General Funds $2,842,897 $3,232,610 $0 $3,232,610 $389,712 13.7%Other State Funds $356,098 $236,075 $0 $236,075 -$120,024 -33.7%
Federal Funds $390,878 $374,378 $0 $374,378 -$16,500 -4.2%
Aging $822,675 $882,612 $0 $882,612 +$59,938 7.3%General Funds $737,419 $785,140 $0 $785,140 +$47,721 6.5%Other State Funds $8,445 $12,945 $0 $12,945 +$4,500 53.3%Federal Funds $76,810 $84,528 $0 $84,528 +$7,717 10.0%Agriculture $95,246 $94,624 -$800 $93,824 -$1,422 -1.5%General Funds $29,826 $21,608 -$800 $20,808 -$9,018 -30.2%Other State Funds $51,344 $59,349 $0 $59,349 +$8,005 15.6%Federal Funds $14,076 $13,667 $0 $13,667 -$409 -2.9%
FY 2013 APPROPRIATIONS BY AGENCY($ Thousands)
Agency FY 12Final
FY 13 as Passed by GA
$ Gov Veto Change
Higher Education (cont.)
Departments
S E C T I O N 2 . F Y 2 0 1 3 B U D G E T
Page 46
FY13 After $ Change % ChangeVeto FY 12 to FY 13 FY 12 to FY 13
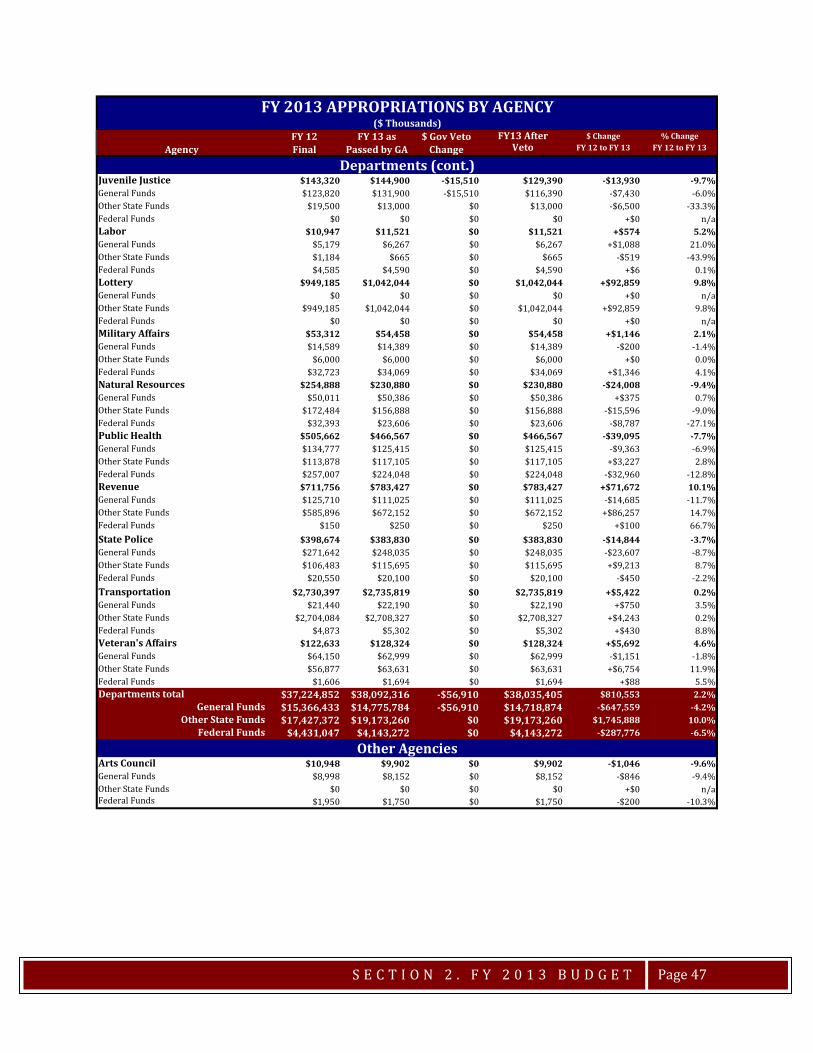
Central Management Services $983,650 $877,149 $0 $877,149 -$106,501 -10.8%General Funds $69,871 $31,710 $0 $31,710 -$38,161 -54.6%Other State Funds $893,778 $845,438 $0 $845,438 -$48,340 -5.4%Federal Funds $20,000 $0 $0 $0 -$20,000 -100.0%Children and Family Services $1,260,239 $1,174,648 $0 $1,174,648 -$85,591 -6.8%General Funds $812,534 $707,025 $0 $707,025 -$105,510 -13.0%Other State Funds $439,983 $459,901 $0 $459,901 +$19,918 4.5%Federal Funds $7,723 $7,723 $0 $7,723 +$0 0.0%CHIP $24,631 $24,631 $0 $24,631 +$0 0.0%General Funds $24,631 $24,631 $0 $24,631 +$0 0.0%Other State Funds $0 $0 $0 $0 +$0 n/aFederal Funds $0 $0 $0 $0 $0 n/aCommerce and Ec. Opportunity $1,983,082 $1,745,480 $0 $1,745,480 -$237,602 -12.0%General Funds $32,360 $25,573 $0 $25,573 -$6,786 -21.0%Other State Funds $400,933 $417,617 $0 $417,617 +$16,684 4.2%Federal Funds $1,549,789 $1,302,289 $0 $1,302,289 -$247,500 -16.0%Corrections $1,308,346 $1,263,500 -$40,600 $1,222,900 -$85,446 -6.5%General Funds $1,222,425 $1,177,579 -$40,600 $1,136,978 -$85,446 -7.0%Other State Funds $85,922 $85,922 $0 $85,922 +$0 0.0%Federal Funds $0 $0 $0 $0 +$0 n/aEmployment Security $360,536 $369,887 $0 $369,887 +$9,351 2.6%General Funds $24,000 $24,000 $0 $24,000 +$0 0.0%Other State Funds $1,917 $1,917 $0 $1,917 +$0 0.0%Federal Funds $334,619 $343,970 $0 $343,970 +$9,351 2.8%Financial and Professional Regulation $94,000 $95,426 $0 $95,426 +$1,426 1.5%General Funds $0 $0 $0 $0 +$0 n/aOther State Funds $94,000 $95,426 $0 $95,426 +$1,426 1.5%Federal Funds $0 $0 $0 $0 +$0 n/aGroup Health $4,115,160 $3,293,990 $0 $3,293,990 -$821,170 -20.0%General Funds $1,435,532 $1,171,000 $0 $1,171,000 -$264,532 -18.4%Other State Funds $2,679,628 $2,122,990 $0 $2,122,990 -$556,638 -20.8%Federal Funds $0 $0 $0 $0 +$0 n/aHealthcare & Family Services $14,537,076 $16,431,525 $0 $16,431,525 +$1,894,449 13.0%General Funds $6,694,136 $6,767,736 $0 $6,767,736 +$73,600 1.1%Other State Funds $7,492,939 $9,313,789 $0 $9,313,789 +$1,820,849 24.3%Federal Funds $350,000 $350,000 $0 $350,000 +$0 0.0%Human Rights $14,334 $13,646 $0 $13,646 -$689 -4.8%General Funds $9,726 $8,952 $0 $8,952 -$774 -8.0%Other State Funds $700 $700 $0 $700 +$0 0.0%Federal Funds $3,908 $3,994 $0 $3,994 +$85 2.2%Human Rights Commission $2,015 $1,755 $0 $1,755 -$260 -12.9%General Funds $1,915 $1,755 $0 $1,755 -$160 -8.4%Other State Funds $0 $0 $0 $0 +$0 n/aFederal Funds $100 $0 $0 $0 -$100 -100.0%Human Services $5,743,092 $5,841,675 $0 $5,841,675 +$98,583 1.7%General Funds $3,460,741 $3,256,471 $0 $3,256,471 -$204,270 -5.9%Other State Funds $562,214 $861,760 $0 $861,760 +$299,546 53.3%Federal Funds $1,720,136 $1,723,443 $0 $1,723,443 $3,307 0.2%
FY 2013 APPROPRIATIONS BY AGENCY($ Thousands)
Agency FY 12Final
FY 13 as Passed by GA
$ Gov Veto Change
Departments (cont.)
S E C T I O N 2 . F Y 2 0 1 3 B U D G E T
Page 47
FY13 After $ Change % ChangeVeto FY 12 to FY 13 FY 12 to FY 13
Juvenile Justice $143,320 $144,900 -$15,510 $129,390 -$13,930 -9.7%General Funds $123,820 $131,900 -$15,510 $116,390 -$7,430 -6.0%Other State Funds $19,500 $13,000 $0 $13,000 -$6,500 -33.3%Federal Funds $0 $0 $0 $0 +$0 n/aLabor $10,947 $11,521 $0 $11,521 +$574 5.2%General Funds $5,179 $6,267 $0 $6,267 +$1,088 21.0%Other State Funds $1,184 $665 $0 $665 -$519 -43.9%Federal Funds $4,585 $4,590 $0 $4,590 +$6 0.1%Lottery $949,185 $1,042,044 $0 $1,042,044 +$92,859 9.8%General Funds $0 $0 $0 $0 +$0 n/aOther State Funds $949,185 $1,042,044 $0 $1,042,044 +$92,859 9.8%Federal Funds $0 $0 $0 $0 +$0 n/aMilitary Affairs $53,312 $54,458 $0 $54,458 +$1,146 2.1%General Funds $14,589 $14,389 $0 $14,389 -$200 -1.4%Other State Funds $6,000 $6,000 $0 $6,000 +$0 0.0%Federal Funds $32,723 $34,069 $0 $34,069 +$1,346 4.1%Natural Resources $254,888 $230,880 $0 $230,880 -$24,008 -9.4%General Funds $50,011 $50,386 $0 $50,386 +$375 0.7%Other State Funds $172,484 $156,888 $0 $156,888 -$15,596 -9.0%Federal Funds $32,393 $23,606 $0 $23,606 -$8,787 -27.1%Public Health $505,662 $466,567 $0 $466,567 -$39,095 -7.7%General Funds $134,777 $125,415 $0 $125,415 -$9,363 -6.9%Other State Funds $113,878 $117,105 $0 $117,105 +$3,227 2.8%Federal Funds $257,007 $224,048 $0 $224,048 -$32,960 -12.8%Revenue $711,756 $783,427 $0 $783,427 +$71,672 10.1%General Funds $125,710 $111,025 $0 $111,025 -$14,685 -11.7%Other State Funds $585,896 $672,152 $0 $672,152 +$86,257 14.7%Federal Funds $150 $250 $0 $250 +$100 66.7%State Police $398,674 $383,830 $0 $383,830 -$14,844 -3.7%General Funds $271,642 $248,035 $0 $248,035 -$23,607 -8.7%Other State Funds $106,483 $115,695 $0 $115,695 +$9,213 8.7%Federal Funds $20,550 $20,100 $0 $20,100 -$450 -2.2%Transportation $2,730,397 $2,735,819 $0 $2,735,819 +$5,422 0.2%General Funds $21,440 $22,190 $0 $22,190 +$750 3.5%Other State Funds $2,704,084 $2,708,327 $0 $2,708,327 +$4,243 0.2%Federal Funds $4,873 $5,302 $0 $5,302 +$430 8.8%Veteran's Affairs $122,633 $128,324 $0 $128,324 +$5,692 4.6%General Funds $64,150 $62,999 $0 $62,999 -$1,151 -1.8%Other State Funds $56,877 $63,631 $0 $63,631 +$6,754 11.9%Federal Funds $1,606 $1,694 $0 $1,694 +$88 5.5%Departments total $37,224,852 $38,092,316 -$56,910 $38,035,405 $810,553 2.2%
General Funds $15,366,433 $14,775,784 -$56,910 $14,718,874 -$647,559 -4.2%Other State Funds $17,427,372 $19,173,260 $0 $19,173,260 $1,745,888 10.0%
Federal Funds $4,431,047 $4,143,272 $0 $4,143,272 -$287,776 -6.5%
Arts Council $10,948 $9,902 $0 $9,902 -$1,046 -9.6%General Funds $8,998 $8,152 $0 $8,152 -$846 -9.4%Other State Funds $0 $0 $0 $0 +$0 n/aFederal Funds $1,950 $1,750 $0 $1,750 -$200 -10.3%
Agency FY 12Final
FY 13 as Passed by GA
$ Gov Veto Change
Departments (cont.)
Other Agencies
($ Thousands)FY 2013 APPROPRIATIONS BY AGENCY

S E C T I O N 2 . F Y 2 0 1 3 B U D G E T
Page 48
FY13 After $ Change % ChangeVeto FY 12 to FY 13 FY 12 to FY 13
Capital Development Board $18,287 $22,260 $0 $22,260 +$3,973 21.7%General Funds $0 $0 $0 $0 +$0 n/aOther State Funds $18,287 $22,260 $0 $22,260 +$3,973 21.7%Federal Funds $0 $0 $0 $0 +$0 n/aCivil Service Commission $355 $290 $0 $290 -$65 -18.3%General Funds $355 $290 $0 $290 -$65 -18.3%Other State Funds $0 $0 $0 $0 +$0 n/aFederal Funds $0 $0 $0 $0 +$0 n/aCouncil on Developmental Disabilities $4,601 $4,724 $0 $4,724 +$123 2.7%General Funds $0 $0 $0 $0 +$0 n/aOther State Funds $0 $0 $0 $0 +$0 n/aFederal Funds $4,601 $4,724 $0 $4,724 +$123 2.7%Criminal Justice Information Authority $121,048 $153,008 $0 $153,008 +$31,960 26.4%General Funds $1,795 $24,003 $0 $24,003 +$22,208 1237.3%Other State Funds $7,353 $26,513 $0 $26,513 +$19,160 260.6%Federal Funds $111,900 $102,492 $0 $102,492 -$9,408 -8.4%Deaf and Hard of Hearing Commission $840 $851 $0 $851 +$11 1.3%General Funds $640 $651 $0 $651 +$11 1.7%Other State Funds $200 $200 $0 $200 +$0 0.0%Federal Funds $0 $0 $0 $0 +$0 n/aDrycleaners Environ. Response Trust Fund Council $5,360 $5,360 $0 $5,360 +$0 0.0%General Funds $0 $0 $0 $0 +$0 n/aOther State Funds $5,360 $5,360 $0 $5,360 +$0 0.0%Federal Funds $0 $0 $0 $0 +$0 n/aEast St. Louis Financial Advisory Authority $116 $116 $0 $116 +$0 0.0%General Funds $116 $116 $0 $116 +$0 0.0%Other State Funds $0 $0 $0 $0 +$0 n/aFederal Funds $0 $0 $0 $0 +$0 n/a
Environmental Protection Agency $288,579 $289,149 $0 $289,149 +$570 0.2%General Funds $0 $0 $0 $0 +$0 n/aOther State Funds $218,293 $223,361 $0 $223,361 +$5,067 2.3%Federal Funds $70,286 $65,789 $0 $65,789 -$4,497 -6.4%Executive Ethics Commission $7,012 $6,589 $0 $6,589 -$423 -6.0%General Funds $7,012 $6,589 $0 $6,589 -$423 -6.0%Other State Funds $0 $0 $0 $0 +$0 n/aFederal Funds $0 $0 $0 $0 +$0 n/aExecutive Inspector General $7,772 $7,265 $0 $7,265 -$507 -6.5%General Funds $5,772 $5,772 $0 $5,772 +$0 0.0%Other State Funds $2,000 $1,493 $0 $1,493 -$507 -25.3%Federal Funds $0 $0 $0 $0 +$0 n/aGaming Board $161,144 $168,023 $0 $168,023 +$6,879 4.3%General Funds $0 $0 $0 $0 +$0 n/aOther State Funds $161,144 $168,023 $0 $168,023 +$6,879 4.3%Federal Funds $0 $0 $0 $0 +$0 n/aGuardian Advocacy Commision $9,817 $9,945 $0 $9,945 +$127 1.3%General Funds $9,630 $9,757 $0 $9,757 +$127 1.3%Other State Funds $188 $188 $0 $188 +$0 0.0%Federal Funds $0 $0 $0 $0 $0 n/a
($ Thousands)
Agency FY 12Final
FY 13 as Passed by GA
$ Gov Veto Change
FY 2013 APPROPRIATIONS BY AGENCY
Other Agencies (cont.)
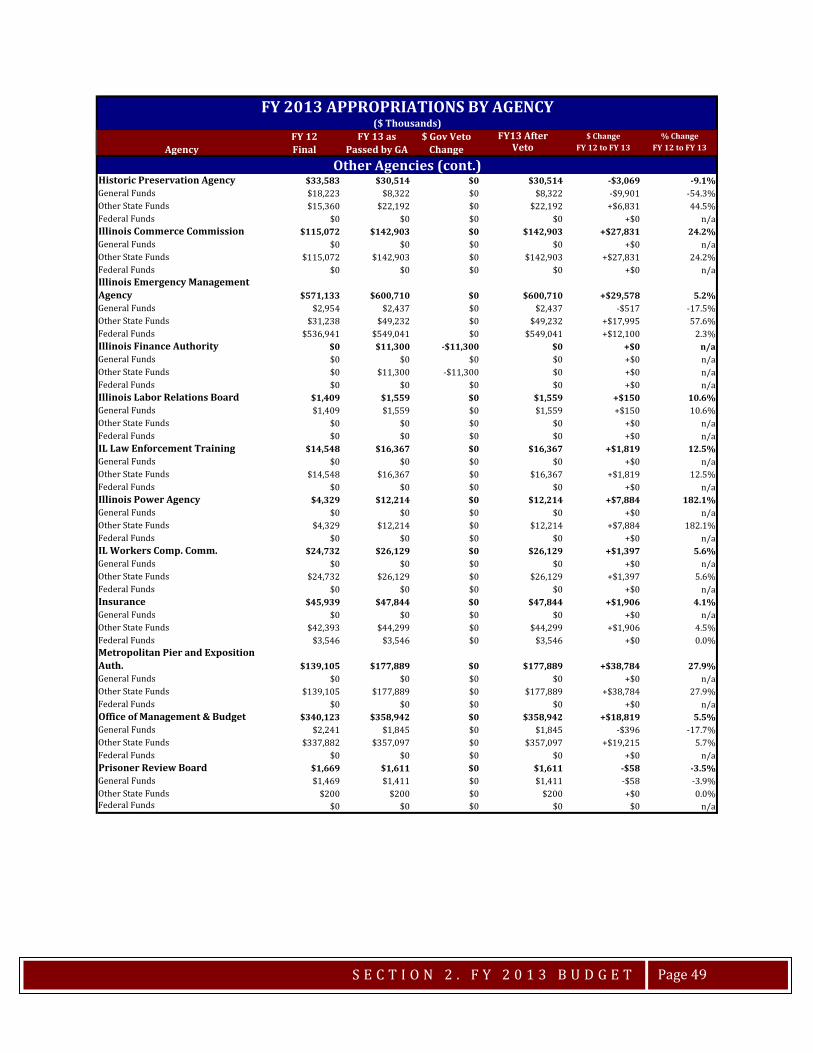
S E C T I O N 2 . F Y 2 0 1 3 B U D G E T
Page 49
FY13 After $ Change % ChangeVeto FY 12 to FY 13 FY 12 to FY 13
Historic Preservation Agency $33,583 $30,514 $0 $30,514 -$3,069 -9.1%General Funds $18,223 $8,322 $0 $8,322 -$9,901 -54.3%Other State Funds $15,360 $22,192 $0 $22,192 +$6,831 44.5%Federal Funds $0 $0 $0 $0 +$0 n/aIllinois Commerce Commission $115,072 $142,903 $0 $142,903 +$27,831 24.2%General Funds $0 $0 $0 $0 +$0 n/aOther State Funds $115,072 $142,903 $0 $142,903 +$27,831 24.2%Federal Funds $0 $0 $0 $0 +$0 n/aIllinois Emergency Management Agency $571,133 $600,710 $0 $600,710 +$29,578 5.2%General Funds $2,954 $2,437 $0 $2,437 -$517 -17.5%Other State Funds $31,238 $49,232 $0 $49,232 +$17,995 57.6%Federal Funds $536,941 $549,041 $0 $549,041 +$12,100 2.3%Illinois Finance Authority $0 $11,300 -$11,300 $0 +$0 n/aGeneral Funds $0 $0 $0 $0 +$0 n/aOther State Funds $0 $11,300 -$11,300 $0 +$0 n/aFederal Funds $0 $0 $0 $0 +$0 n/aIllinois Labor Relations Board $1,409 $1,559 $0 $1,559 +$150 10.6%General Funds $1,409 $1,559 $0 $1,559 +$150 10.6%Other State Funds $0 $0 $0 $0 +$0 n/aFederal Funds $0 $0 $0 $0 +$0 n/aIL Law Enforcement Training $14,548 $16,367 $0 $16,367 +$1,819 12.5%General Funds $0 $0 $0 $0 +$0 n/aOther State Funds $14,548 $16,367 $0 $16,367 +$1,819 12.5%Federal Funds $0 $0 $0 $0 +$0 n/aIllinois Power Agency $4,329 $12,214 $0 $12,214 +$7,884 182.1%General Funds $0 $0 $0 $0 +$0 n/aOther State Funds $4,329 $12,214 $0 $12,214 +$7,884 182.1%Federal Funds $0 $0 $0 $0 +$0 n/aIL Workers Comp. Comm. $24,732 $26,129 $0 $26,129 +$1,397 5.6%General Funds $0 $0 $0 $0 +$0 n/aOther State Funds $24,732 $26,129 $0 $26,129 +$1,397 5.6%Federal Funds $0 $0 $0 $0 +$0 n/aInsurance $45,939 $47,844 $0 $47,844 +$1,906 4.1%General Funds $0 $0 $0 $0 +$0 n/aOther State Funds $42,393 $44,299 $0 $44,299 +$1,906 4.5%Federal Funds $3,546 $3,546 $0 $3,546 +$0 0.0%Metropolitan Pier and Exposition Auth. $139,105 $177,889 $0 $177,889 +$38,784 27.9%General Funds $0 $0 $0 $0 +$0 n/aOther State Funds $139,105 $177,889 $0 $177,889 +$38,784 27.9%Federal Funds $0 $0 $0 $0 +$0 n/aOffice of Management & Budget $340,123 $358,942 $0 $358,942 +$18,819 5.5%General Funds $2,241 $1,845 $0 $1,845 -$396 -17.7%Other State Funds $337,882 $357,097 $0 $357,097 +$19,215 5.7%Federal Funds $0 $0 $0 $0 +$0 n/aPrisoner Review Board $1,669 $1,611 $0 $1,611 -$58 -3.5%General Funds $1,469 $1,411 $0 $1,411 -$58 -3.9%Other State Funds $200 $200 $0 $200 +$0 0.0%Federal Funds $0 $0 $0 $0 $0 n/a
FY 2013 APPROPRIATIONS BY AGENCY($ Thousands)
Agency FY 12Final
FY 13 as Passed by GA
$ Gov Veto Change
Other Agencies (cont.)

S E C T I O N 2 . F Y 2 0 1 3 B U D G E T
Page 50
FY13 After $ Change % ChangeVeto FY 12 to FY 13 FY 12 to FY 13
Procurement Policy Board $500 $475 $0 $475 -$25 -5.0%General Funds $500 $475 $0 $475 -$25 -5.0%Other State Funds $0 $0 $0 $0 +$0 n/aFederal Funds $0 $0 $0 $0 +$0 n/aProperty Tax Appeal Board $4,482 $4,778 $0 $4,778 +$296 6.6%General Funds $0 $0 $0 $0 +$0 n/aOther State Funds $4,482 $4,778 $0 $4,778 +$296 6.6%Federal Funds $0 $0 $0 $0 +$0 n/aRacing Board $8,612 $8,579 $0 $8,579 -$32 -0.4%General Funds $0 $0 $0 $0 +$0 n/aOther State Funds $8,612 $8,579 $0 $8,579 -$32 -0.4%Federal Funds $0 $0 $0 $0 +$0 n/aSouthwestern Illinois Development Auth. $2,107 $2,851 $0 $2,851 +$744 35.3%General Funds $2,107 $2,851 $0 $2,851 +$744 35.3%Other State Funds $0 $0 $0 $0 +$0 n/aFederal Funds $0 $0 $0 $0 +$0 n/aSports Facilities Authority $48,370 $50,368 $0 $50,368 +$1,998 4.1%General Funds $0 $0 $0 $0 +$0 n/aOther State Funds $48,370 $50,368 $0 $50,368 +$1,998 4.1%Federal Funds $0 $0 $0 $0 +$0 n/a System $899,583 $1,041,446 $0 $1,041,446 +$141,862 15.8%General Funds $899,583 $1,041,446 $0 $1,041,446 +$141,862 15.8%Other State Funds $0 $0 $0 $0 +$0 n/aFederal Funds $0 $0 $0 $0 +$0 n/aState Police Merit Board $879 $879 $0 $879 -$1 -0.1%General Funds $879 $879 $0 $879 -$1 -0.1%Other State Funds $0 $0 $0 $0 +$0 n/aFederal Funds $0 $0 $0 $0 +$0 n/aState Fire Marshall $27,681 $38,916 $0 $38,916 +$11,235 40.6%General Funds $0 $0 $0 $0 +$0 n/aOther State Funds $25,894 $38,077 $0 $38,077 +$12,183 47.0%Federal Funds $1,787 $840 $0 $840 -$947 -53.0%Upper IL River Valley Development $2,254 $288 $0 $288 -$1,966 -87.2%General Funds $2,254 $288 $0 $288 -$1,966 -87.2%Other State Funds $0 $0 $0 $0 +$0 n/aFederal Funds $0 $0 $0 $0 +$0 n/aViolence Prevention Authority $26,765 $4,477 $0 $4,477 -$22,289 -83.3%General Funds $12,512 $2,286 $0 $2,286 -$10,226 -81.7%Other State Funds $2,078 $2,190 $0 $2,190 +$113 5.4%Federal Funds $12,176 $0 $0 $0 -$12,176 -100.0%Other Agencies Total $2,948,752 $3,258,517 -$11,300 $3,247,217 $298,465 10.1%
General Funds $978,449 $1,119,129 $0 $1,119,129 $140,680 14.4%Other State Funds $1,227,118 $1,411,208 -$11,300 $1,399,908 $172,791 14.1%
Federal Funds $743,186 $728,181 $0 $728,181 -$15,005 -2.0%
Court Of Claims $48,806 $14,622 $0 $14,622 -$34,184 -70.0%General Funds $35,706 $1,397 $0 $1,397 -$34,309 -96.1%Other State Funds $2,975 $3,100 $0 $3,100 +$125 4.2%Federal Funds $10,125 $10,125 $0 $10,125 $0 0.0%
Other Agencies (cont.)
Judicial Agencies
FY 2013 APPROPRIATIONS BY AGENCY($ Thousands)
Agency FY 12Final
FY 13 as Passed by GA
$ Gov Veto Change
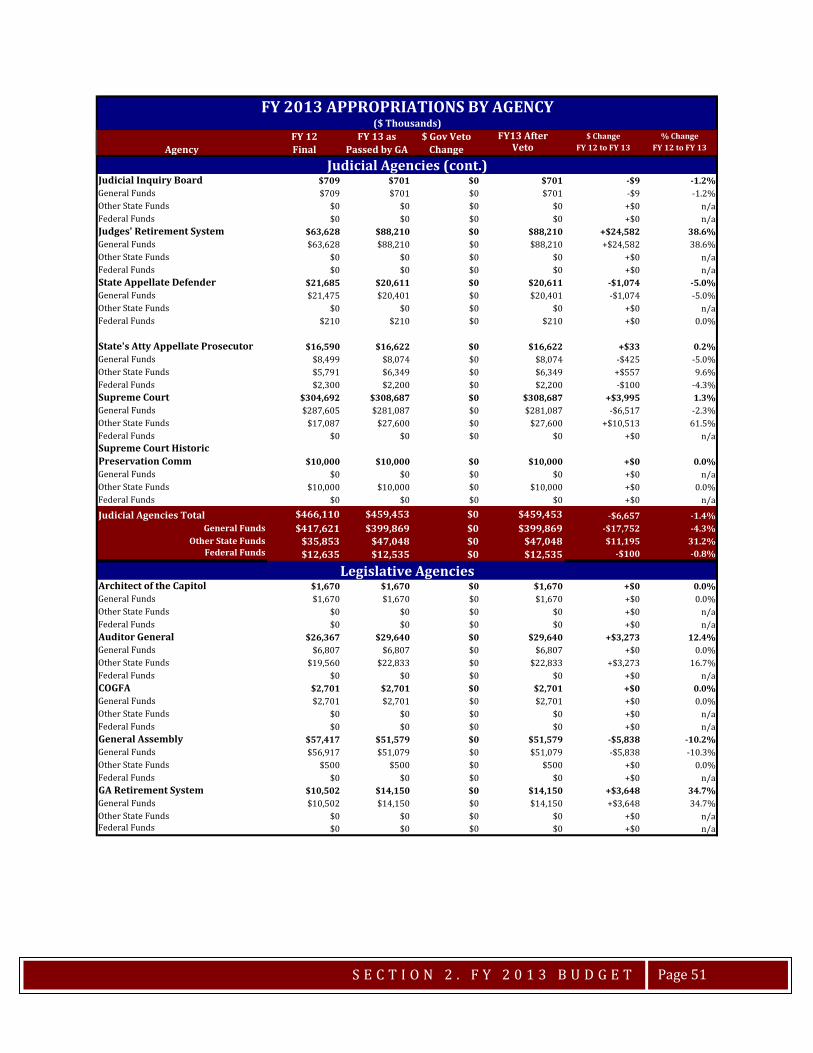
S E C T I O N 2 . F Y 2 0 1 3 B U D G E T
Page 51
FY13 After $ Change % ChangeVeto FY 12 to FY 13 FY 12 to FY 13
Judicial Inquiry Board $709 $701 $0 $701 -$9 -1.2%General Funds $709 $701 $0 $701 -$9 -1.2%Other State Funds $0 $0 $0 $0 +$0 n/aFederal Funds $0 $0 $0 $0 +$0 n/aJudges' Retirement System $63,628 $88,210 $0 $88,210 +$24,582 38.6%General Funds $63,628 $88,210 $0 $88,210 +$24,582 38.6%Other State Funds $0 $0 $0 $0 +$0 n/aFederal Funds $0 $0 $0 $0 +$0 n/aState Appellate Defender $21,685 $20,611 $0 $20,611 -$1,074 -5.0%General Funds $21,475 $20,401 $0 $20,401 -$1,074 -5.0%Other State Funds $0 $0 $0 $0 +$0 n/aFederal Funds $210 $210 $0 $210 +$0 0.0%
State's Atty Appellate Prosecutor $16,590 $16,622 $0 $16,622 +$33 0.2%General Funds $8,499 $8,074 $0 $8,074 -$425 -5.0%Other State Funds $5,791 $6,349 $0 $6,349 +$557 9.6%Federal Funds $2,300 $2,200 $0 $2,200 -$100 -4.3%Supreme Court $304,692 $308,687 $0 $308,687 +$3,995 1.3%General Funds $287,605 $281,087 $0 $281,087 -$6,517 -2.3%Other State Funds $17,087 $27,600 $0 $27,600 +$10,513 61.5%Federal Funds $0 $0 $0 $0 +$0 n/aSupreme Court Historic Preservation Comm $10,000 $10,000 $0 $10,000 +$0 0.0%General Funds $0 $0 $0 $0 +$0 n/aOther State Funds $10,000 $10,000 $0 $10,000 +$0 0.0%Federal Funds $0 $0 $0 $0 +$0 n/aJudicial Agencies Total $466,110 $459,453 $0 $459,453 -$6,657 -1.4%
General Funds $417,621 $399,869 $0 $399,869 -$17,752 -4.3%Other State Funds $35,853 $47,048 $0 $47,048 $11,195 31.2%
Federal Funds $12,635 $12,535 $0 $12,535 -$100 -0.8%
Architect of the Capitol $1,670 $1,670 $0 $1,670 +$0 0.0%General Funds $1,670 $1,670 $0 $1,670 +$0 0.0%Other State Funds $0 $0 $0 $0 +$0 n/aFederal Funds $0 $0 $0 $0 +$0 n/aAuditor General $26,367 $29,640 $0 $29,640 +$3,273 12.4%General Funds $6,807 $6,807 $0 $6,807 +$0 0.0%Other State Funds $19,560 $22,833 $0 $22,833 +$3,273 16.7%Federal Funds $0 $0 $0 $0 +$0 n/aCOGFA $2,701 $2,701 $0 $2,701 +$0 0.0%General Funds $2,701 $2,701 $0 $2,701 +$0 0.0%Other State Funds $0 $0 $0 $0 +$0 n/aFederal Funds $0 $0 $0 $0 +$0 n/aGeneral Assembly $57,417 $51,579 $0 $51,579 -$5,838 -10.2%General Funds $56,917 $51,079 $0 $51,079 -$5,838 -10.3%Other State Funds $500 $500 $0 $500 +$0 0.0%Federal Funds $0 $0 $0 $0 +$0 n/aGA Retirement System $10,502 $14,150 $0 $14,150 +$3,648 34.7%General Funds $10,502 $14,150 $0 $14,150 +$3,648 34.7%Other State Funds $0 $0 $0 $0 +$0 n/aFederal Funds $0 $0 $0 $0 +$0 n/a
FY 2013 APPROPRIATIONS BY AGENCY($ Thousands)
Agency FY 12Final
FY 13 as Passed by GA
$ Gov Veto Change
Legislative Agencies
Judicial Agencies (cont.)

S E C T I O N 2 . F Y 2 0 1 3 B U D G E T
Page 52
FY13 After $ Change % ChangeVeto FY 12 to FY 13 FY 12 to FY 13
Joint Committee on Admin. Rules $1,041 $1,141 $0 $1,141 +$100 9.6%General Funds $1,041 $1,141 $0 $1,141 +$100 9.6%Other State Funds $0 $0 $0 $0 +$0 n/aFederal Funds $0 $0 $0 $0 +$0 n/aLegislative Audit Commission $234 $234 $0 $234 +$0 0.0%General Funds $234 $234 $0 $234 +$0 0.0%Other State Funds $0 $0 $0 $0 +$0 n/aFederal Funds $0 $0 $0 $0 +$0 n/aLegislative Ethics Commission $313 $313 $0 $313 +$0 0.0%General Funds $313 $313 $0 $313 +$0 0.0%Other State Funds $0 $0 $0 $0 +$0 n/aFederal Funds $0 $0 $0 $0 +$0 n/aLegislative Information System $6,767 $6,767 $0 $6,767 +$0 0.0%General Funds $5,167 $5,167 $0 $5,167 +$0 0.0%Other State Funds $1,600 $1,600 $0 $1,600 +$0 0.0%
Federal Funds $0 $0 $0 $0 +$0 n/aLegislative Printing Unit $2,160 $2,160 $0 $2,160 +$0 0.0%General Funds $2,160 $2,160 $0 $2,160 +$0 0.0%Other State Funds $0 $0 $0 $0 +$0 n/a
Federal Funds $0 $0 $0 $0 +$0 n/aLegislative Reference Bureau $2,489 $2,489 $0 $2,489 +$0 0.0%General Funds $2,489 $2,489 $0 $2,489 +$0 0.0%Other State Funds $0 $0 $0 $0 +$0 n/aFederal Funds $0 $0 $0 $0 +$0 n/aLegislative Research Unit $2,931 $2,931 $0 $2,931 +$0 0.0%General Funds $2,931 $2,931 $0 $2,931 +$0 0.0%Other State Funds $0 $0 $0 $0 +$0 n/aFederal Funds $0 $0 $0 $0 +$0 n/aLegislative Agencies Total $114,590 $115,774 $0 $115,774 $1,184 1.0%
General Funds $92,931 $90,841 $0 $90,841 -$2,090 -2.2%Other State Funds $21,660 $24,933 $0 $24,933 $3,273 15.1%
Federal Funds $0 $0 $0 $0 $0 0.0%
Attorney General $78,224 $78,922 $0 $78,922 +$698 0.9%General Funds $32,593 $32,243 $0 $32,243 -$350 -1.1%Other State Funds $42,881 $43,929 $0 $43,929 +$1,048 2.4%Federal Funds $2,750 $2,750 $0 $2,750 +$0 0.0%Office of the Governor $6,486 $5,911 $0 $5,911 -$575 -8.9%General Funds $6,386 $5,811 $0 $5,811 -$575 -9.0%Other State Funds $100 $100 $0 $100 +$0 0.0%Federal Funds $0 $0 $0 $0 +$0 n/aOffice of the Lt Governor $2,151 $1,956 $0 $1,956 -$195 -9.1%General Funds $2,001 $1,846 $0 $1,846 -$155 -7.8%Other State Funds $150 $110 $0 $110 -$40 -26.7%Federal Funds $0 $0 $0 $0 +$0 n/aOffice of the Secretary of State $391,978 $389,669 $0 $389,669 -$2,309 -0.6%General Funds $260,277 $255,308 $0 $255,308 -$4,969 -1.9%Other State Funds $131,702 $127,361 $0 $127,361 -$4,340 -3.3%Federal Funds $0 $7,000 $0 $7,000 +$7,000 n/a
FY 2013 APPROPRIATIONS BY AGENCY($ Thousands)
Agency FY 12Final
FY 13 as Passed by GA
$ Gov Veto Change
Constitutional Officers & Elections
Legislative Agencies (cont.)
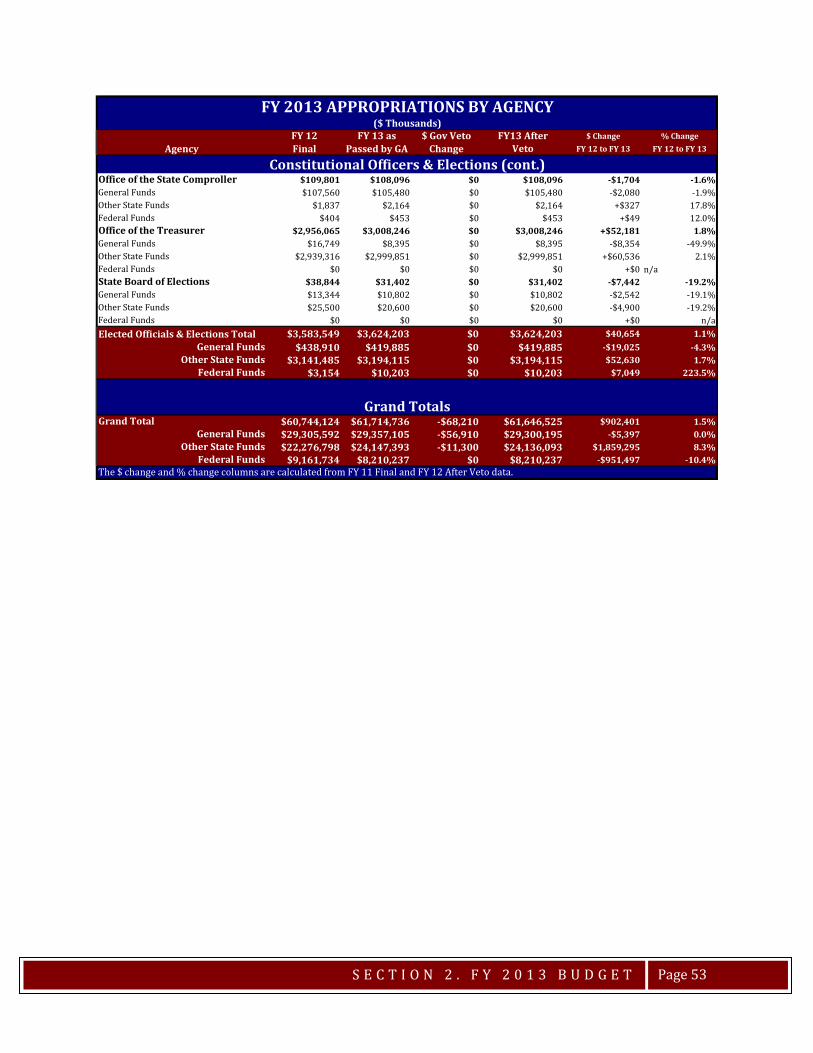
S E C T I O N 2 . F Y 2 0 1 3 B U D G E T
Page 53
FY13 After $ Change % ChangeVeto FY 12 to FY 13 FY 12 to FY 13
Office of the State Comproller $109,801 $108,096 $0 $108,096 -$1,704 -1.6%General Funds $107,560 $105,480 $0 $105,480 -$2,080 -1.9%Other State Funds $1,837 $2,164 $0 $2,164 +$327 17.8%Federal Funds $404 $453 $0 $453 +$49 12.0%Office of the Treasurer $2,956,065 $3,008,246 $0 $3,008,246 +$52,181 1.8%General Funds $16,749 $8,395 $0 $8,395 -$8,354 -49.9%Other State Funds $2,939,316 $2,999,851 $0 $2,999,851 +$60,536 2.1%Federal Funds $0 $0 $0 $0 +$0 n/aState Board of Elections $38,844 $31,402 $0 $31,402 -$7,442 -19.2%General Funds $13,344 $10,802 $0 $10,802 -$2,542 -19.1%Other State Funds $25,500 $20,600 $0 $20,600 -$4,900 -19.2%Federal Funds $0 $0 $0 $0 +$0 n/aElected Officials & Elections Total $3,583,549 $3,624,203 $0 $3,624,203 $40,654 1.1%
General Funds $438,910 $419,885 $0 $419,885 -$19,025 -4.3%Other State Funds $3,141,485 $3,194,115 $0 $3,194,115 $52,630 1.7%
Federal Funds $3,154 $10,203 $0 $10,203 $7,049 223.5%
Grand Total $60,744,124 $61,714,736 -$68,210 $61,646,525 $902,401 1.5%General Funds $29,305,592 $29,357,105 -$56,910 $29,300,195 -$5,397 0.0%
Other State Funds $22,276,798 $24,147,393 -$11,300 $24,136,093 $1,859,295 8.3%Federal Funds $9,161,734 $8,210,237 $0 $8,210,237 -$951,497 -10.4%
Constitutional Officers & Elections (cont.)
FY 2013 APPROPRIATIONS BY AGENCY($ Thousands)
Agency FY 12Final
FY 13 as Passed by GA
$ Gov Veto Change
Grand Totals
The $ change and % change columns are calculated from FY 11 Final and FY 12 After Veto data.

SECTION 3. FY 2013 BUDGET & HISTORICAL
DATA
FY 2013 Budget by Funding Source FY 2013 General Funds Revenues by Source FY 2013 Total Operating Appropriations by Major Source FY 2013 GRF Operating Appropriations by Major Source General Fund Appropriations Detailed General Revenue Funds History General Funds Base Expenditures History General Funds Expenditures by Category General Funds Expenditures by Function Health and Social Services Expenditures History Public Protection and Justice Expenditures History General Government Expenditure History

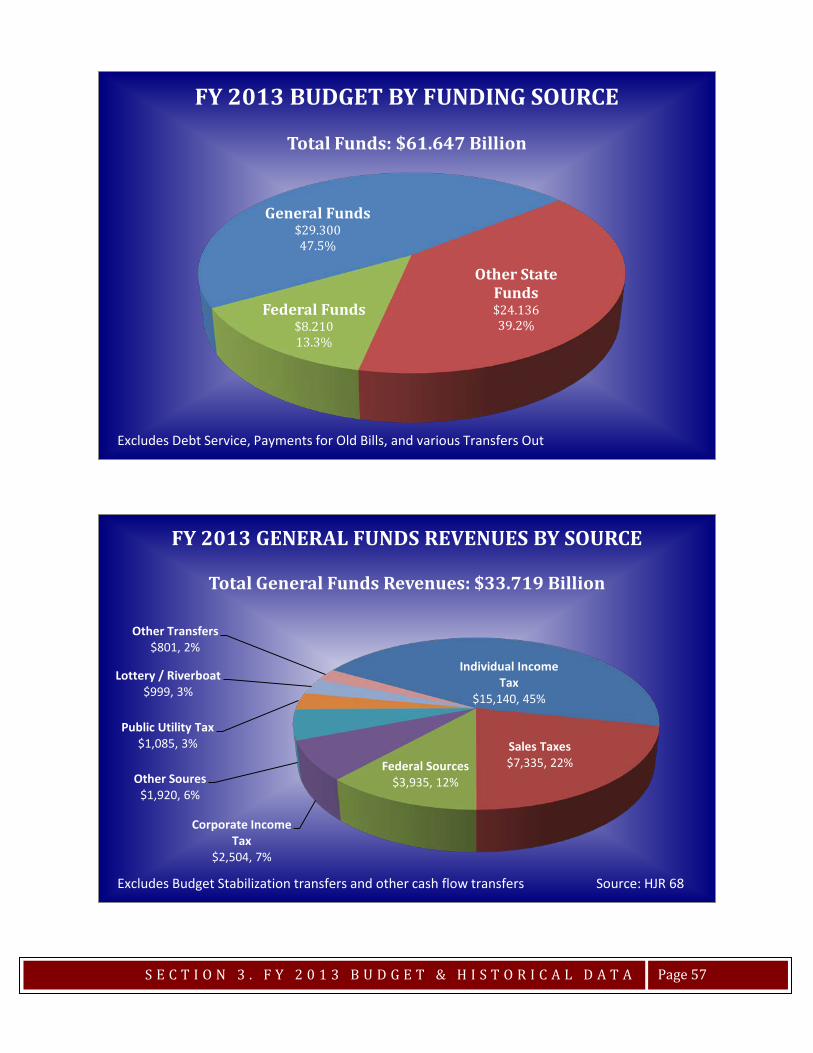
S E C T I O N 3 . F Y 2 0 1 3 B U D G E T & H I S T O R I C A L D A T A
Page 57
General Funds$29.30047.5%
Other State Funds$24.13639.2%
Federal Funds$8.21013.3%
FY 2013 BUDGET BY FUNDING SOURCE
Total Funds: $61.647 Billion
Excludes Debt Service, Payments for Old Bills, and various Transfers Out
Individual Income Tax
$15,140, 45%
Sales Taxes$7,335, 22%Federal Sources
$3,935, 12%
Corporate Income Tax
$2,504, 7%
Other Soures$1,920, 6%
Public Utility Tax$1,085, 3%
Lottery / Riverboat$999, 3%
Other Transfers$801, 2%
FY 2013 GENERAL FUNDS REVENUES BY SOURCE
Total General Funds Revenues: $33.719 Billion
Excludes Budget Stabilization transfers and other cash flow transfers Source: HJR 68

S E C T I O N 3 . F Y 2 0 1 3 B U D G E T & H I S T O R I C A L D A T A
Page 58
Human Services$25.351
41%
Education$16.164
26%
Government Services$11.815
19%
Economic Development
$4.9738%
Public Safety and Regulation
$3.0715%
Quality of Life$0.271
1%
FY 2013 TOTAL OPERATING APPROPRIATIONS BY MAJOR PURPOSE
Total Funds: $61.647 Billion
Excludes Budget Stabilization transfers and other cash flow transfers
Human Services$11.775
40%
Education$12.552
43%
Government Services$3.281
11%
Economic Development
$0.0780%
Public Safety and Regulation
$1.5486%
Quality of Life$0.067
0%
FY 2013 GRF OPERATING APPROPRIATIONS BY MAJOR PURPOSE
General Revenus Funds: $29.300 Billion
Excludes Budget Stabilization transfers and other cash flow transfers
S E C T I O N 3 . F Y 2 0 1 3 B U D G E T & H I S T O R I C A L D A T A
Page 59
$23.
409
$22.
335
$23.
483
$23.
831
$24.
517
$26.
016
$27.
538
$30.
280
$27.
198
$29.
214
$29.
306
$29.
300
$0.0
$5.0
$10.
0
$15.
0
$20.
0
$25.
0
$30.
0
$35.
0
2002
2003
2004
2005
2006
2007
2008
2009
2010
2011
2012
2013
Fisc
al Y
ear
Gene
ral F
unds
-Ap
prop
riat
ions
($ B
illio
ns)

S E C T I O N 3 . F Y 2 0 1 3 B U D G E T & H I S T O R I C A L D A T A
Page 60
Actu
alAc
tual
Actu
alAc
tual
Actu
alAc
tual
Actu
alAc
tual
Actu
alRe
ceip
tsRe
ceip
tsRe
ceip
tsRe
ceip
tsRe
ceip
tsRe
ceip
tsRe
ceip
tsRe
ceip
tsRe
ceip
tsRe
venu
e So
urce
sFY
200
4FY
200
5FY
200
6FY
200
7FY
200
8FY
200
9FY
201
0FY
201
1FY
201
2St
ate
Taxe
s P
erso
nal I
ncom
e Ta
x $8
,235
$8,8
73$9
,568
$10,
424
$11,
187
$10,
219
$9,4
30$1
2,30
1$1
7,00
0 C
orpo
rate
Inco
me
Tax
(reg
ular
)1,
379
1,54
81,
784
2,12
12,
201
2,07
31,
649
2,27
72,
983
Sal
es T
axes
6,33
16,
595
7,09
27,
136
7,21
56,
773
6,30
86,
833
7,22
6 P
ublic
Util
ity T
axes
(reg
ular
)1,
079
1,05
61,
074
1,13
11,
157
1,16
81,
089
1,14
799
5 C
igar
ette
Tax
400
450
400
350
350
350
355
355
354
Liq
uor G
allo
nage
Tax
es12
714
715
215
615
815
815
915
716
4 V
ehic
le U
se T
ax35
3234
3332
2730
3029
Inh
erita
nce
Tax
(Gro
ss)
222
310
272
264
373
288
243
122
235
Ins
uran
ce T
axes
and
Fee
s36
234
231
731
029
833
432
231
734
5 C
orpo
rate
Fra
nchi
se T
ax &
Fee
s16
318
118
119
322
520
120
820
719
2 I
nter
est o
n St
ate
Fund
s & In
vest
men
ts55
7315
320
421
281
2628
21 C
ook
Coun
ty In
terg
over
nmen
tal T
rans
fer
428
433
350
307
302
253
244
244
244
Oth
er S
ourc
es
439
468
441
449
442
418
431
404
399
S
ubto
tal
$19,
255
$20,
508
$21,
818
$23,
078
$24,
152
$22,
343
$20,
494
$24,
422
$30,
187
Tran
sfer
s L
otte
ry57
061
467
062
265
762
562
563
264
0 G
amin
g Fu
nd T
rans
fer [
and
rela
ted]
661
699
689
685
564
430
431
324
413
Oth
er1,
159
918
746
939
679
538
828
1,22
688
5
Tot
al S
tate
Sou
rces
$21,
645
$22,
739
$23,
923
$25,
324
$26,
052
$23,
936
$22,
378
$26,
604
$32,
125
Fede
ral S
ourc
es$5
,189
$4,6
91$4
,725
$4,7
03$4
,815
$6,5
67$5
,920
$5,3
86$3
,682
T
otal
Fed
eral
& S
tate
Sou
rces
$26,
834
$27,
430
$28,
648
$30,
027
$30,
867
$30,
503
$28,
298
$31,
990
$35,
807
Nong
ener
al F
unds
Dis
trib
utio
n:
Refu
nd F
und
Per
sona
l Inc
ome
Tax
($96
4)($
894)
($93
3)($
1,01
6)($
867)
($99
6)($
919)
($1,
076)
($1,
488)
Cor
pora
te In
com
e Ta
x(4
42)
(376
)(3
56)
(371
)(3
41)
(363
)(2
89)
(426
)(5
22)
S
ubto
tal G
ener
al F
unds
$25,
428
$26,
160
$27,
359
$28,
640
$29,
659
$29,
144
$27,
090
$30,
488
$33,
797
Chan
ge fr
om P
rior
Yea
r$2
,642
$732
$1,1
99$1
,281
$1,0
19($
515)
($2,
054)
$1,3
44$3
,309
Perc
ent C
hang
e11
.6%
2.9%
4.6%
4.7%
3.6%
-1.7
%-7
.0%
4.6%
10.9
%Sh
ort-
Term
Bor
row
ing
$0$7
65$1
,000
$900
$2,4
00$2
,400
$1,2
50$1
,300
$0To
bacc
o Li
quid
atio
n Pr
ocee
ds$0
$0$0
$0$0
$0$0
$1,2
50$0
HPF
and
HH
SMTF
Tra
nsfe
rs$0
$982
$0$4
56$1
,503
$0$0
$0$0
Budg
et S
tabi
lizat
ion
Fund
Tra
nsfe
r$2
26$2
76$2
76$2
76$2
76$5
76$1
,146
$535
$275
Pens
ion
Cont
ribu
tion
Fun
d Tr
ansf
er$1
,395
$0$0
$0$0
$0$8
43$2
24$0
Tot
al G
ener
al F
unds
$27,
049
$28,
183
$28,
635
$30,
272
$33,
838
$32,
120
$30,
329
$33,
797
$34,
072
Chan
ge fr
om P
rior
Yea
r$2
,062
$1,1
34$4
52$1
,637
$3,5
66($
1,71
8)($
1,79
1)$1
,677
$275
Perc
ent C
hang
e8.
3%4.
2%1.
6%5.
7%11
.8%
-5.1
%-5
.6%
5.2%
0.8%
CGFA
DET
AILE
D G
ENER
AL F
UN
DS
REVE
NU
E H
ISTO
RY F
Y 20
03 -
FY 2
012
($ m
illio
n)
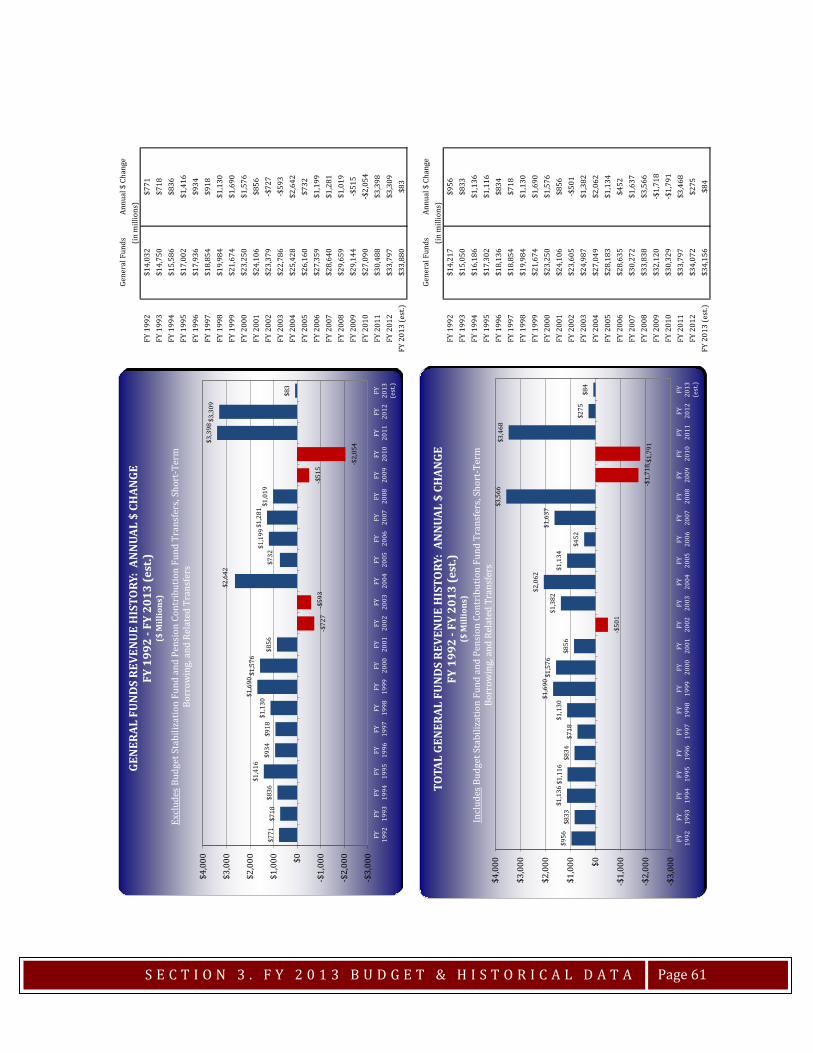
S E C T I O N 3 . F Y 2 0 1 3 B U D G E T & H I S T O R I C A L D A T A
Page 61
Gene
ral F
unds
Annu
al $
Cha
nge
FY 1
992
$14,
032
$771
FY 1
993
$14,
750
$718
FY 1
994
$15,
586
$836
FY 1
995
$17,
002
$1,4
16FY
199
6$1
7,93
6$9
34FY
199
7$1
8,85
4$9
18FY
199
8$1
9,98
4$1
,130
FY 1
999
$21,
674
$1,6
90FY
200
0$2
3,25
0$1
,576
FY 2
001
$24,
106
$856
FY 2
002
$23,
379
-$72
7FY
200
3$2
2,78
6-$
593
FY 2
004
$25,
428
$2,6
42FY
200
5$2
6,16
0$7
32FY
200
6$2
7,35
9$1
,199
FY 2
007
$28,
640
$1,2
81FY
200
8$2
9,65
9$1
,019
FY 2
009
$29,
144
-$51
5FY
201
0$2
7,09
0-$
2,05
4FY
201
1$3
0,48
8$3
,398
FY 2
012
$33,
797
$3,3
09FY
201
3 (e
st.)
$33,
880
$83
Gene
ral F
unds
Annu
al $
Cha
nge
FY 1
992
$14,
217
$956
FY 1
993
$15,
050
$833
FY 1
994
$16,
186
$1,1
36FY
199
5$1
7,30
2$1
,116
FY 1
996
$18,
136
$834
FY 1
997
$18,
854
$718
FY 1
998
$19,
984
$1,1
30FY
199
9$2
1,67
4$1
,690
FY 2
000
$23,
250
$1,5
76FY
200
1$2
4,10
6$8
56FY
200
2$2
3,60
5-$
501
FY 2
003
$24,
987
$1,3
82FY
200
4$2
7,04
9$2
,062
FY 2
005
$28,
183
$1,1
34FY
200
6$2
8,63
5$4
52FY
200
7$3
0,27
2$1
,637
FY 2
008
$33,
838
$3,5
66FY
200
9$3
2,12
0-$
1,71
8FY
201
0$3
0,32
9-$
1,79
1FY
201
1$3
3,79
7$3
,468
FY 2
012
$34,
072
$275
FY 2
013
(est
.)$3
4,15
6$8
4
(in
mill
ions
)
(in
mill
ions
)
$771
$718
$836
$1,4
16$9
34$9
18$1
,130
$1,6
90$1
,576
$856
-$72
7-$
593
$2,6
42
$732
$1,1
99$1
,281
$1,0
19
-$51
5
-$2,
054$3
,398
$3,3
09
$83
-$3,
000
-$2,
000
-$1,
000$0
$1,0
00
$2,0
00
$3,0
00
$4,0
00
FY 1992
FY 1993
FY 1994
FY 1995
FY 1996
FY 1997
FY 1998
FY 1999
FY 2000
FY 2001
FY 2002
FY 2003
FY 2004
FY 2005
FY 2006
FY 2007
FY 2008
FY 2009
FY 2010
FY 2011
FY 2012
FY 2013
(est
.)
Excl
udes
Budg
et S
tabi
lizat
ion
Fund
and
Pen
sion
Con
trib
utio
n Fu
nd T
rans
fers
, Sho
rt-T
erm
Bo
rrow
ing,
and
Rel
ated
Tra
nsfe
rs
GEN
ERAL
FU
ND
S RE
VEN
UE
HIS
TORY
: AN
NUA
L $
CHAN
GEFY
199
2 -F
Y 20
13 (e
st.)
($ M
illio
ns)
$956
$833
$1,1
36$1
,116
$834
$718
$1,1
30
$1,6
90$1
,576
$856
-$50
1
$1,3
82
$2,0
62
$1,1
34
$452
$1,6
37
$3,5
66
-$1,
718 -
$1,7
91
$3,4
68
$275
$84
-$3,
000
-$2,
000
-$1,
000$0
$1,0
00
$2,0
00
$3,0
00
$4,0
00
FY 1992
FY 1993
FY 1994
FY 1995
FY 1996
FY 1997
FY 1998
FY 1999
FY 2000
FY 2001
FY 2002
FY 2003
FY 2004
FY 2005
FY 2006
FY 2007
FY 2008
FY 2009
FY 2010
FY 2011
FY 2012
FY 2013
(est
.)
Incl
udes
Budg
et S
tabi
lizat
ion
Fund
and
Pen
sion
Con
trib
utio
n Fu
nd T
rans
fers
, Sho
rt-T
erm
Bo
rrow
ing,
and
Rel
ated
Tra
nsfe
rs
TOTA
L GE
NER
AL F
UN
DS
REVE
NU
E H
ISTO
RY:
ANN
UAL
$ CH
ANGE
FY 1
992
-FY
2013
(est
.)($
Mill
ions
)

S E C T I O N 3 . F Y 2 0 1 3 B U D G E T & H I S T O R I C A L D A T A
Page 62
FY 2000 FY 2001 FY 2002 FY 2003 FY 2004 FY 2005 FY 2006 FY 2007 FY 2008 FY 2009 FY 2010 FY 2011Total Operations $6,298 $6,630 $6,956 $6,466 $6,434 $6,303 $6,399 $6,696 $6,937 $7,306 $7,325 $7,453
Total Awards and Grants $14,567 $15,676 $15,731 $15,400 $16,207 $16,217 $17,687 $18,785 $20,208 $22,462 $18,993 $18,016
Other General Funds Warrants Issued $82 $60 $53 $28 -$11 $47 $17 $19 $12 $6 -$17 -$22
Regular Transfers Out $2,029 $2,217 $2,159 $2,031 $2,519 $3,657 $3,059 $2,973 $3,201 $3,185 $3,304 $5,070
Base General Funds Expenditures $22,976 $24,583 $24,899 $23,925 $25,149 $26,224 $27,162 $28,473 $30,358 $32,959 $29,605 $30,517Annual Change 6.7% 7.0% 1.3% -3.9% 5.1% 4.3% 3.6% 4.8% 6.6% 8.6% -10.2% 3.1%
Cash Flow Transfer (Hospital Provider Fund) $0 $0 $0 $0 $0 $979 $0 $1,356 $2,400 $300 $870 $260Short-Term Borrowing Repayment $0 $0 $0 $710 $990 $768 $1,014 $11 $1,503 $1,424 $2,276 $1,322Repayment of Interfund Borrowing $0 $0 $0 $0 $0 $0 $0 $0 $0 $0 $0 $9
Transfer to Budget Stabilization Fund $0 $0 $226 $226 $226 $276 $276 $276 $276 $276 $0 $276
Total General Funds Expenditures $22,976 $24,583 $25,125 $24,861 $26,365 $28,247 $28,452 $30,116 $34,537 $34,959 $32,751 $32,384Annual Change 6.7% 7.0% 2.2% -1.1% 6.0% 7.1% 0.7% 5.8% 14.7% 1.2% -6.3% -1.1%
FY 2000 FY 2001 FY 2002 FY 2003 FY 2004 FY 2005 FY 2006 FY 2007 FY 2008 FY 2009 FY 2010 FY 2011Health and Social Services $9,748 $10,495 $10,264 $9,837 $10,492 $9,991 $12,502 $13,012 $13,760 $15,404 $12,979 $13,016
Education $7,863 $8,320 $8,801 $8,594 $8,585 $8,970 $8,922 $9,630 $10,376 $11,358 $10,455 $9,358Public Protection and Justice $1,652 $1,757 $1,837 $1,705 $1,720 $1,719 $1,684 $1,769 $1,915 $2,056 $1,867 $1,939
General Government $1,194 $1,282 $1,341 $1,343 $1,527 $1,542 $616 $677 $686 $716 $762 $813Other $490 $512 $497 $415 $306 $345 $379 $412 $420 $240 $238 $321
Regular Transfers Out $2,029 $2,217 $2,159 $2,031 $2,519 $3,657 $3,059 $2,973 $3,201 $3,185 $3,304 $5,070
Base General Funds Expenditures $22,976 $24,583 $24,899 $23,925 $25,149 $26,224 $27,162 $28,473 $30,358 $32,959 $29,605 $30,517Cash Flow Transfer (Hospital Provider Fund) $0 $0 $0 $0 $0 $979 $0 $1,356 $2,400 $300 $870 $260
Short-Term Borrowing Repayment $0 $0 $0 $710 $990 $768 $1,014 $11 $1,503 $1,424 $2,276 $1,322Repayment of Interfund Borrowing $0 $0 $0 $0 $0 $0 $0 $0 $0 $0 $0 $9
Transfer to Budget Stabilization Fund $0 $0 $226 $226 $226 $276 $276 $276 $276 $276 $0 $276
Total General Funds Expenditures $22,976 $24,583 $25,125 $24,861 $26,365 $28,247 $28,452 $30,116 $34,537 $34,959 $32,751 $32,384
($ Millions)
($ Millions)
Total Warrants Issued
Total Warrants IssuedGENERAL FUNDS EXPENDITURES BY CATEGORY
GENERAL FUNDS EXPENDITURES BY FUNCTION (FROM CURRENT YEAR APPROPRIATIONS)
$1,449 $1,607
$316
-$974
$1,224 $1,075 $938$1,311
$1,885
$2,601
-$3,354
$912
-$4,000
-$3,000
-$2,000
-$1,000
$0
$1,000
$2,000
$3,000
FY 2000 FY 2001 FY 2002 FY 2003 FY 2004 FY 2005 FY 2006 FY 2007 FY 2008 FY 2009 FY2010**
FY 2011
GENERAL FUNDS BASE EXPENDITURES HISTORYANNUAL $ CHANGE IN MILLIONS
Total Warrants Issued*
Excludes Hospital Provider Fund Cash Flow Transfer, Repayment of Short-Term and Interfund Borrowing and Transfers to Budget Stabilization Fund* Warrants were issued over 14 - 18 months depending upon the Fiscal Year** FY 2010 decrease is due to funding Pensions through $3.466 billion in Pension Obligation Bonds
**
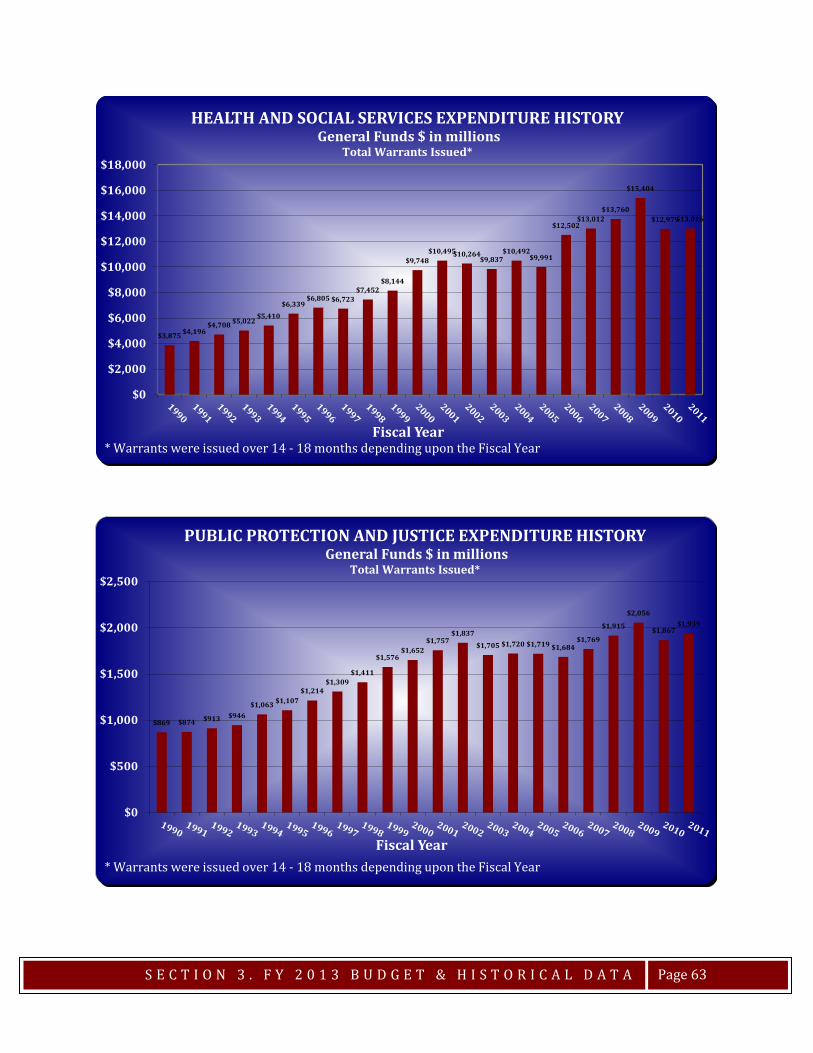
S E C T I O N 3 . F Y 2 0 1 3 B U D G E T & H I S T O R I C A L D A T A
Page 63
$3,875 $4,196$4,708 $5,022
$5,410$6,339
$6,805 $6,723$7,452
$8,144
$9,748$10,495$10,264
$9,837$10,492
$9,991
$12,502$13,012
$13,760
$15,404
$12,979$13,016
$0
$2,000
$4,000
$6,000
$8,000
$10,000
$12,000
$14,000
$16,000
$18,000
Fiscal Year
HEALTH AND SOCIAL SERVICES EXPENDITURE HISTORYGeneral Funds $ in millions
Total Warrants Issued*
* Warrants were issued over 14 - 18 months depending upon the Fiscal Year
$869 $874 $913 $946$1,063 $1,107
$1,214$1,309
$1,411
$1,576$1,652
$1,757$1,837
$1,705 $1,720 $1,719 $1,684$1,769
$1,915
$2,056
$1,867$1,939
$0
$500
$1,000
$1,500
$2,000
$2,500
Fiscal Year
PUBLIC PROTECTION AND JUSTICE EXPENDITURE HISTORYGeneral Funds $ in millions
Total Warrants Issued*
* Warrants were issued over 14 - 18 months depending upon the Fiscal Year
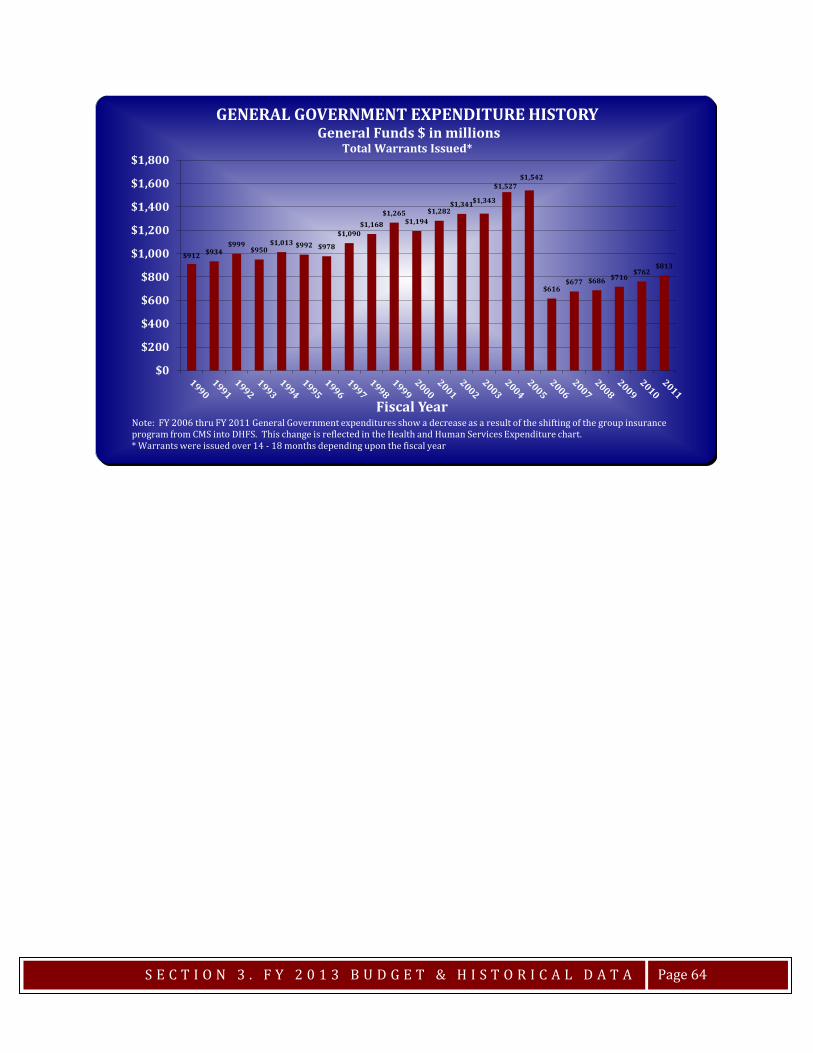
S E C T I O N 3 . F Y 2 0 1 3 B U D G E T & H I S T O R I C A L D A T A
Page 64
$912 $934$999
$950$1,013 $992 $978
$1,090$1,168
$1,265$1,194
$1,282$1,341$1,343
$1,527$1,542
$616$677 $686 $716
$762$813
$0
$200
$400
$600
$800
$1,000
$1,200
$1,400
$1,600
$1,800
Fiscal Year
GENERAL GOVERNMENT EXPENDITURE HISTORYGeneral Funds $ in millions
Total Warrants Issued*
Note: FY 2006 thru FY 2011 General Government expenditures show a decrease as a result of the shifting of the group insurance program from CMS into DHFS. This change is reflected in the Health and Human Services Expenditure chart. * Warrants were issued over 14 - 18 months depending upon the fiscal year

SECTION 4. STATE EMPLOYEE HEADCOUNT
FY 2012 SERS Headcount FY 2011 SERS Headcount FY 2010 SERS Headcount FY 2009 SERS Headcount FY 2008 SERS Headcount

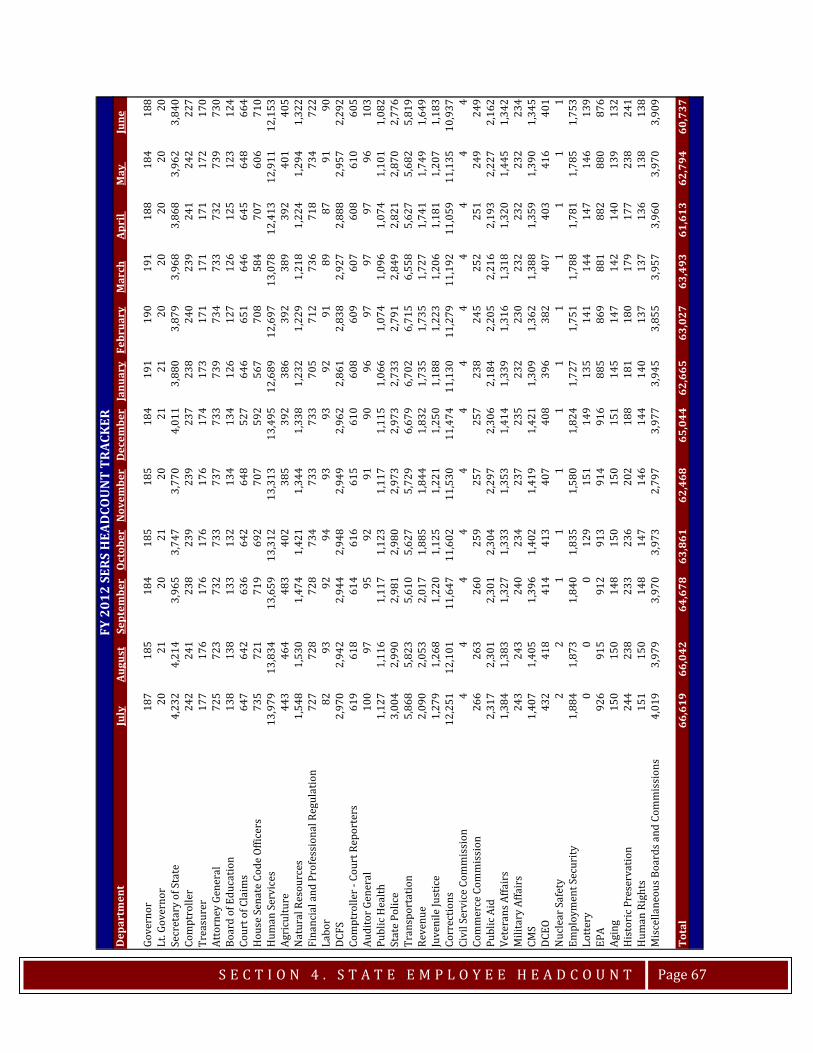
S E C T I O N 4 . S T A T E E M P L O Y E E H E A D C O U N T
Page 67
Dep
artm
ent
July
Augu
stSe
ptem
ber
Oct
ober
Nov
embe
rD
ecem
ber
Janu
ary
Febr
uary
Mar
chAp
ril
May
Ju
ne
Gove
rnor
187
185
184
185
185
184
191
190
191
188
184
188
Lt. G
over
nor
2021
2021
2021
2120
2020
2020
Secr
etar
y of
Sta
te4,
232
4,21
43,
965
3,74
73,
770
4,01
13,
880
3,87
93,
968
3,86
83,
962
3,84
0Co
mpt
rolle
r24
224
123
823
923
923
723
824
023
924
124
222
7Tr
easu
rer
177
176
176
176
176
174
173
171
171
171
172
170
Atto
rney
Gen
eral
725
723
732
733
737
733
739
734
733
732
739
730
Boar
d of
Edu
catio
n13
813
813
313
213
413
412
612
712
612
512
312
4Co
urt o
f Cla
ims
647
642
636
642
648
527
646
651
646
645
648
664
Hou
se S
enat
e Co
de O
ffice
rs73
572
171
969
270
759
256
770
858
470
760
671
0H
uman
Ser
vice
s13
,979
13,8
3413
,659
13,3
1213
,313
13,4
9512
,689
12,6
9713
,078
12,4
1312
,911
12,1
53Ag
ricu
lture
443
464
483
402
385
392
386
392
389
392
401
405
Nat
ural
Res
ourc
es1,
548
1,53
01,
474
1,42
11,
344
1,33
81,
232
1,22
91,
218
1,22
41,
294
1,32
2Fi
nanc
ial a
nd P
rofe
ssio
nal R
egul
atio
n72
772
872
873
473
373
370
571
273
671
873
472
2La
bor
8293
9294
9393
9291
8987
9190
DCFS
2,97
02,
942
2,94
42,
948
2,94
92,
962
2,86
12,
838
2,92
72,
888
2,95
72,
292
Com
ptro
ller -
Cou
rt R
epor
ters
619
618
614
616
615
610
608
609
607
608
610
605
Audi
tor G
ener
al10
097
9592
9190
9697
9797
9610
3Pu
blic
Hea
lth1,
127
1,11
61,
117
1,12
31,
117
1,11
51,
066
1,07
41,
096
1,07
41,
101
1,08
2St
ate
Polic
e3,
004
2,99
02,
981
2,98
02,
973
2,97
32,
733
2,79
12,
849
2,82
12,
870
2,77
6Tr
ansp
orta
tion
5,86
85,
823
5,61
05,
627
5,72
96,
679
6,70
26,
715
6,55
85,
627
5,68
25,
819
Reve
nue
2,09
02,
053
2,01
71,
885
1,84
41,
832
1,73
51,
735
1,72
71,
741
1,74
91,
649
Juve
nile
Just
ice
1,27
91,
268
1,22
01,
125
1,22
11,
250
1,18
81,
223
1,20
61,
181
1,20
71,
183
Corr
ectio
ns12
,251
12,1
0111
,647
11,6
0211
,530
11,4
7411
,130
11,2
7911
,192
11,0
5911
,135
10,9
37Ci
vil S
ervi
ce C
omm
issi
on4
44
44
44
44
44
4Co
mm
erce
Com
mis
sion
266
263
260
259
257
257
238
245
252
251
249
249
Publ
ic A
id2,
317
2,30
12,
301
2,30
42,
297
2,30
62,
184
2,20
52,
216
2,19
32,
227
2,16
2Ve
tera
ns A
ffair
s1,
384
1,38
31,
327
1,33
31,
353
1,41
41,
339
1,31
61,
318
1,32
01,
445
1,34
2M
ilita
ry A
ffair
s24
324
324
023
423
723
523
223
023
223
223
223
4CM
S1,
407
1,40
51,
396
1,40
21,
419
1,42
11,
309
1,36
21,
388
1,35
91,
390
1,34
5DC
EO43
241
841
441
340
740
839
638
240
740
341
640
1N
ucle
ar S
afet
y2
21
11
11
11
11
1Em
ploy
men
t Sec
urity
1,88
41,
873
1,84
01,
835
1,58
01,
824
1,72
71,
751
1,78
81,
781
1,78
51,
753
Lott
ery
00
012
915
114
913
514
114
414
714
613
9EP
A92
691
591
291
391
491
688
586
988
188
288
087
6Ag
ing
150
150
148
150
150
151
145
147
142
140
139
132
His
tori
c Pre
serv
atio
n24
423
823
323
620
218
818
118
017
917
723
824
1H
uman
Rig
hts
151
150
148
147
146
144
140
137
137
136
138
138
Mis
cella
neou
s Boa
rds a
nd C
omm
issi
ons
4,01
93,
979
3,97
03,
973
2,79
73,
977
3,94
53,
855
3,95
73,
960
3,97
03,
909
Tota
l66
,619
66,0
4264
,678
63,8
6162
,468
65,0
4462
,665
63,0
2763
,493
61,6
1362
,794
60,7
37
FY 2
012
SERS
HEA
DCO
UN
T TR
ACK
ER
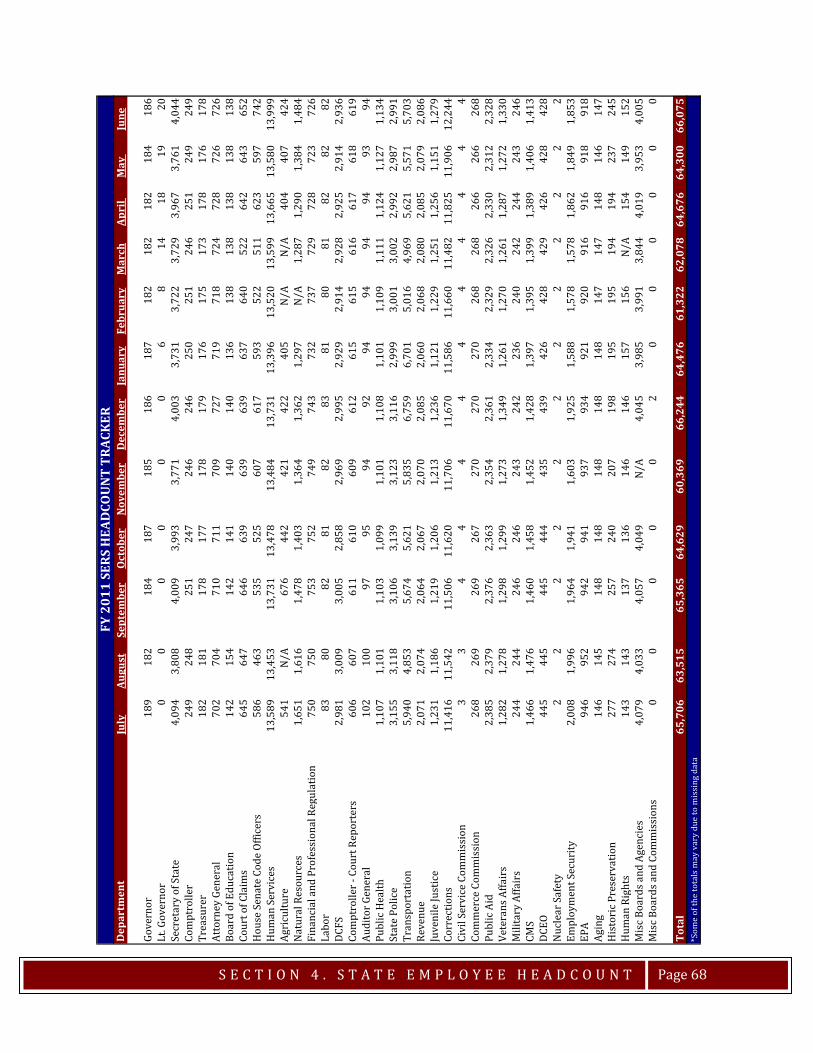
S E C T I O N 4 . S T A T E E M P L O Y E E H E A D C O U N T
Page 68
Dep
artm
ent
July
Augu
stSe
ptem
ber
Oct
ober
Nov
embe
rD
ecem
ber
Janu
ary
Febr
uary
Mar
chAp
ril
May
Ju
ne
Gove
rnor
189
182
184
187
185
186
187
182
182
182
184
186
Lt. G
over
nor
00
00
00
68
1418
1920
Secr
etar
y of
Sta
te4,
094
3,80
84,
009
3,99
33,
771
4,00
33,
731
3,72
23,
729
3,96
73,
761
4,04
4Co
mpt
rolle
r24
924
825
124
724
624
625
025
124
625
124
924
9Tr
easu
rer
182
181
178
177
178
179
176
175
173
178
176
178
Atto
rney
Gen
eral
702
704
710
711
709
727
719
718
724
728
726
726
Boar
d of
Edu
catio
n14
215
414
214
114
014
013
613
813
813
813
813
8Co
urt o
f Cla
ims
645
647
646
639
639
639
637
640
522
642
643
652
Hou
se S
enat
e Co
de O
ffice
rs58
646
353
552
560
761
759
352
251
162
359
774
2H
uman
Ser
vice
s13
,589
13,4
5313
,731
13,4
7813
,484
13,7
3113
,396
13,5
2013
,599
13,6
6513
,580
13,9
99Ag
ricu
lture
541
N/A
676
442
421
422
405
N/A
N/A
404
407
424
Nat
ural
Res
ourc
es1,
651
1,61
61,
478
1,40
31,
364
1,36
21,
297
N/A
1,28
71,
290
1,38
41,
484
Fina
ncia
l and
Pro
fess
iona
l Reg
ulat
ion
750
750
753
752
749
743
732
737
729
728
723
726
Labo
r83
8082
8182
8381
8081
8282
82DC
FS2,
981
3,00
93,
005
2,85
82,
969
2,99
52,
929
2,91
42,
928
2,92
52,
914
2,93
6Co
mpt
rolle
r - C
ourt
Rep
orte
rs60
660
761
161
060
961
261
561
561
661
761
861
9Au
dito
r Gen
eral
102
100
9795
9492
9494
9494
9394
Publ
ic H
ealth
1,10
71,
101
1,10
31,
099
1,10
11,
108
1,10
11,
109
1,11
11,
124
1,12
71,
134
Stat
e Po
lice
3,15
53,
118
3,10
63,
139
3,12
33,
116
2,99
93,
001
3,00
22,
992
2,98
72,
991
Tran
spor
tatio
n5,
940
4,85
35,
674
5,62
15,
835
6,75
96,
701
5,01
64,
969
5,62
15,
571
5,70
3Re
venu
e2,
071
2,07
42,
064
2,06
72,
070
2,08
52,
060
2,06
82,
080
2,08
52,
079
2,08
6Ju
veni
le Ju
stic
e1,
231
1,18
61,
219
1,20
61,
213
1,23
61,
121
1,22
91,
251
1,25
61,
151
1,27
9Co
rrec
tions
11,4
1611
,542
11,5
0611
,620
11,7
0611
,670
11,5
8611
,660
11,4
8211
,825
11,9
0612
,244
Civi
l Ser
vice
Com
mis
sion
33
44
44
44
44
44
Com
mer
ce C
omm
issi
on26
826
926
926
727
027
027
026
826
826
626
626
8Pu
blic
Aid
2,38
52,
379
2,37
62,
363
2,35
42,
361
2,33
42,
329
2,32
62,
330
2,31
22,
328
Vete
rans
Affa
irs
1,28
21,
278
1,29
81,
299
1,27
31,
349
1,26
11,
270
1,26
11,
287
1,27
21,
330
Mili
tary
Affa
irs
244
244
246
246
243
242
236
240
242
244
243
246
CMS
1,46
61,
476
1,46
01,
458
1,45
21,
428
1,39
71,
395
1,39
91,
389
1,40
61,
413
DCEO
445
445
445
444
435
439
426
428
429
426
428
428
Nuc
lear
Saf
ety
22
22
22
22
22
22
Empl
oym
ent S
ecur
ity2,
008
1,99
61,
964
1,94
11,
603
1,92
51,
588
1,57
81,
578
1,86
21,
849
1,85
3EP
A94
695
294
294
193
793
492
192
091
691
691
891
8Ag
ing
146
145
148
148
148
148
148
147
147
148
146
147
His
tori
c Pre
serv
atio
n27
727
425
724
020
719
819
519
519
419
423
724
5H
uman
Rig
hts
143
143
137
136
146
146
157
156
N/A
154
149
152
Mis
c Boa
rds a
nd A
genc
ies
4,07
94,
033
4,05
74,
049
N/A
4,04
53,
985
3,99
13,
844
4,01
93,
953
4,00
5M
isc B
oard
s and
Com
mis
sion
s0
00
00
20
00
00
0
Tota
l65
,706
63,5
1565
,365
64,6
2960
,369
66,2
4464
,476
61,3
2262
,078
64,6
7664
,300
66,0
75
FY 2
011
SERS
HEA
DCO
UN
T TR
ACK
ER
*Som
e of
the
tota
ls m
ay v
ary
due
to m
issi
ng d
ata

S E C T I O N 4 . S T A T E E M P L O Y E E H E A D C O U N T
Page 69
Dep
artm
ent
July
Augu
stSe
ptem
ber
Oct
ober
Nov
embe
rD
ecem
ber
Janu
ary
Febr
uary
Mar
chAp
ril
May
Ju
ne
Gove
rnor
186
192
185
186
184
176
179
183
183
186
189
192
Lt. G
over
nor
131
00
00
00
00
00
Secr
etar
y of
Sta
te4,
470
4,24
64,
018
4,01
84,
009
3,81
14,
027
3,80
13,
804
4,01
04,
015
4,09
8Co
mpt
rolle
r26
626
626
426
426
526
226
425
925
625
525
725
7Tr
easu
rer
186
187
184
185
186
183
184
185
185
186
187
184
Atto
rney
Gen
eral
702
702
706
708
712
711
718
717
716
715
714
708
Boar
d of
Edu
catio
n14
815
714
614
714
714
414
714
314
214
214
414
5Co
urt o
f Cla
ims
635
633
642
649
667
648
651
641
524
643
654
649
Hou
se S
enat
e Co
de O
ffice
rs73
072
172
373
973
671
572
675
050
674
575
672
2H
uman
Ser
vice
s14
,053
13,6
3513
,935
13,9
2413
,871
13,6
1113
,819
13,6
5413
,625
13,8
6213
,808
13,7
26Ag
ricu
lture
525
715
678
708
456
428
444
417
1241
644
050
3N
atur
al R
esou
rces
1,73
81,
687
1,58
71,
599
1,51
71,
409
1,40
41,
331
1,32
11,
379
1,44
91,
680
Fina
ncia
l and
Pro
fess
iona
l Reg
ulat
ion
736
740
740
741
742
744
742
740
745
742
746
749
Labo
r83
8181
8383
8283
8584
8585
82DC
FS3,
057
3,05
03,
076
3,06
93,
048
3,04
43,
057
2,99
02,
976
3,01
23,
030
3,05
4Co
mpt
rolle
r - C
ourt
Rep
orte
rs56
156
056
657
758
759
660
160
460
661
161
160
7Au
dito
r Gen
eral
100
100
100
100
100
100
104
106
105
105
105
106
Publ
ic H
ealth
1,14
31,
133
1,13
31,
133
1,12
31,
119
1,11
71,
111
1,11
41,
115
1,11
91,
112
Stat
e Po
lice
3,31
93,
284
3,28
13,
281
3,25
93,
241
3,24
03,
180
3,17
43,
158
3,16
73,
165
Tran
spor
tatio
n5,
773
5,75
05,
487
5,49
15,
442
4,87
56,
869
6,61
44,
917
5,48
75,
564
6,01
6Re
venu
e2,
067
2,05
22,
041
2,05
52,
069
2,09
12,
096
2,06
32,
056
2,05
22,
050
2,07
0Ju
veni
le Ju
stic
e1,
198
1,16
51,
178
1,20
21,
201
1,19
51,
213
1,21
91,
218
1,20
71,
224
1,23
3Co
rrec
tions
11,2
6211
,254
11,3
0211
,519
11,4
8811
,327
11,5
0211
,311
11,2
5911
,371
11,5
3611
,721
Civi
l Ser
vice
Com
mis
sion
44
44
44
44
44
44
Com
mer
ce C
omm
issi
on28
027
727
727
727
727
227
426
927
027
327
427
0Pu
blic
Aid
2,48
62,
465
2,46
42,
450
2,43
32,
410
2,42
02,
379
2,37
02,
375
2,37
72,
399
Vete
rans
Affa
irs
1,25
21,
244
1,26
21,
243
1,25
41,
257
1,28
31,
256
1,25
31,
262
1,28
41,
319
Mili
tary
Affa
irs
239
244
244
243
244
244
245
242
243
243
242
247
CMS
1,62
21,
606
1,61
21,
590
1,57
61,
567
1,56
61,
534
1,52
51,
514
1,51
71,
516
DCEO
456
453
445
449
448
447
446
434
433
436
433
447
Nuc
lear
Saf
ety
22
22
22
22
22
22
Empl
oym
ent S
ecur
ity1,
923
1,95
31,
947
1,95
71,
995
1,61
72,
011
1,59
81,
593
1,98
71,
991
2,01
6EP
A98
61,
001
982
982
981
974
972
961
954
953
954
956
Agin
g15
915
915
815
815
614
514
614
614
514
214
714
9H
isto
ric P
rese
rvat
ion
346
334
303
300
282
206
207
203
199
200
201
279
Hum
an R
ight
s14
314
514
614
614
514
714
814
714
714
714
814
5M
isc B
oard
s and
Age
ncie
s4,
176
4,16
24,
186
4,19
84,
189
2,84
94,
190
4,13
54,
111
4,10
44,
143
4,08
8M
isc B
oard
s and
Com
mis
sion
s1
11
224
03
00
020
0
Tota
l67
,026
66,3
6166
,086
66,3
9965
,882
62,6
5367
,104
65,4
1462
,777
65,1
2665
,587
66,6
16
FY 2
010
SERS
HEA
DCO
UN
T TR
ACK
ER

S E C T I O N 4 . S T A T E E M P L O Y E E H E A D C O U N T
Page 70
Dep
artm
ent
July
Augu
stSe
ptem
ber
Oct
ober
Nov
embe
rD
ecem
ber
Janu
ary
Febr
uary
Mar
chAp
ril
May
Ju
ne
Gove
rnor
185
188
186
191
185
191
188
187
190
179
183
183
Lt. G
over
nor
2626
2220
2020
2119
1517
1414
Secr
etar
y of
Sta
te4,
529
4,50
93,
879
4,04
74,
036
4,02
44,
030
3,82
23,
992
3,97
53,
958
4,42
3Co
mpt
rolle
r29
929
728
827
727
727
526
926
827
026
826
827
0Tr
easu
rer
188
186
185
182
183
181
180
183
184
184
184
183
Atto
rney
Gen
eral
751
743
737
707
704
701
696
692
697
696
702
700
Boar
d of
Edu
catio
n15
316
315
915
615
415
415
015
015
015
015
014
9Co
urt o
f Cla
ims
632
515
629
635
641
636
640
645
646
646
645
646
Hou
se S
enat
e Co
de O
ffice
rs71
468
343
864
373
773
672
874
775
775
274
673
2H
uman
Ser
vice
s14
,758
14,4
6514
,447
14,7
2314
,665
14,2
4614
,134
14,0
1714
,292
14,2
3813
,876
14,1
31Ag
ricu
lture
544
866
1045
345
443
443
042
843
042
744
350
0N
atur
al R
esou
rces
1,80
51,
765
1,63
81,
554
1,48
91,
453
1,39
81,
387
1,39
11,
451
1,58
71,
741
Fina
ncia
l and
Pro
fess
iona
l Reg
ulat
ion
780
781
781
785
787
784
777
775
780
780
776
745
Labo
r89
8984
8383
8182
8181
8282
82DC
FS3,
211
3,15
43,
155
3,17
33,
160
3,12
53,
108
3,09
63,
103
3,09
83,
070
3,08
2Co
mpt
rolle
r - C
ourt
Rep
orte
rs57
858
057
857
557
757
757
457
256
957
356
656
4Au
dito
r Gen
eral
9898
9697
9392
9493
9395
9510
1Pu
blic
Hea
lth1,
130
1,13
21,
140
1,14
01,
145
1,14
31,
135
1,13
21,
136
1,14
21,
143
1,14
5St
ate
Polic
e3,
408
3,38
13,
375
3,36
03,
353
3,34
73,
290
3,27
73,
264
3,27
03,
261
3,33
5Tr
ansp
orta
tion
5,82
25,
799
4,51
35,
557
5,90
16,
564
6,63
26,
545
6,52
25,
673
4,70
95,
802
Reve
nue
2,15
72,
118
2,11
12,
148
2,14
12,
109
2,11
22,
122
2,12
92,
134
2,12
92,
198
Juve
nile
Just
ice
1,13
21,
122
1,12
91,
125
1,16
81,
143
1,14
21,
125
1,16
01,
131
1,12
81,
181
Corr
ectio
ns11
,251
11,3
1411
,240
11,4
4411
,843
11,5
4911
,465
11,3
9611
,661
11,3
6011
,298
11,5
33Ci
vil S
ervi
ce C
omm
issi
on4
44
44
44
44
44
4Co
mm
erce
Com
mis
sion
269
269
267
271
280
278
276
276
281
281
281
281
Publ
ic A
id2,
526
2,54
42,
554
2,55
82,
562
2,54
42,
522
2,51
82,
520
2,47
32,
476
2,48
6Ve
tera
ns A
ffair
s1,
215
1,18
61,
143
1,16
41,
204
1,16
51,
182
1,18
61,
213
1,21
41,
164
1,28
7M
ilita
ry A
ffair
s23
924
023
623
723
623
623
523
623
724
124
524
2CM
S1,
648
1,69
61,
667
1,64
91,
663
1,65
91,
646
1,65
81,
664
1,65
71,
666
1,63
2DC
EO43
343
242
742
342
241
942
141
841
545
245
145
0N
ucle
ar S
afet
y2
22
22
22
22
22
2Em
ploy
men
t Sec
urity
1,75
71,
619
1,56
31,
715
1,72
91,
585
1,77
41,
570
1,79
31,
829
1,85
31,
875
EPA
1,01
11,
022
1,01
21,
009
1,00
51,
004
991
987
987
985
986
992
Agin
g16
015
916
116
016
116
116
016
015
815
915
915
9H
isto
ric P
rese
rvat
ion
335
266
251
247
239
205
202
198
195
195
305
347
Hum
an R
ight
s16
416
114
914
714
514
414
313
914
314
914
614
4M
isc B
oard
s and
Age
ncie
s4,
133
4,12
44,
088
4,10
34,
124
2,72
14,
080
4,09
94,
107
4,09
94,
078
4,05
3M
isc B
oard
s and
Com
mis
sion
s0
00
04
01
11
11
1
Tota
l68
,136
67,6
9864
,344
66,7
6467
,576
65,6
9266
,914
66,2
1167
,232
66,0
6264
,830
67,3
95
FY 2
009
SERS
HEA
DCO
UN
T TR
ACK
ER
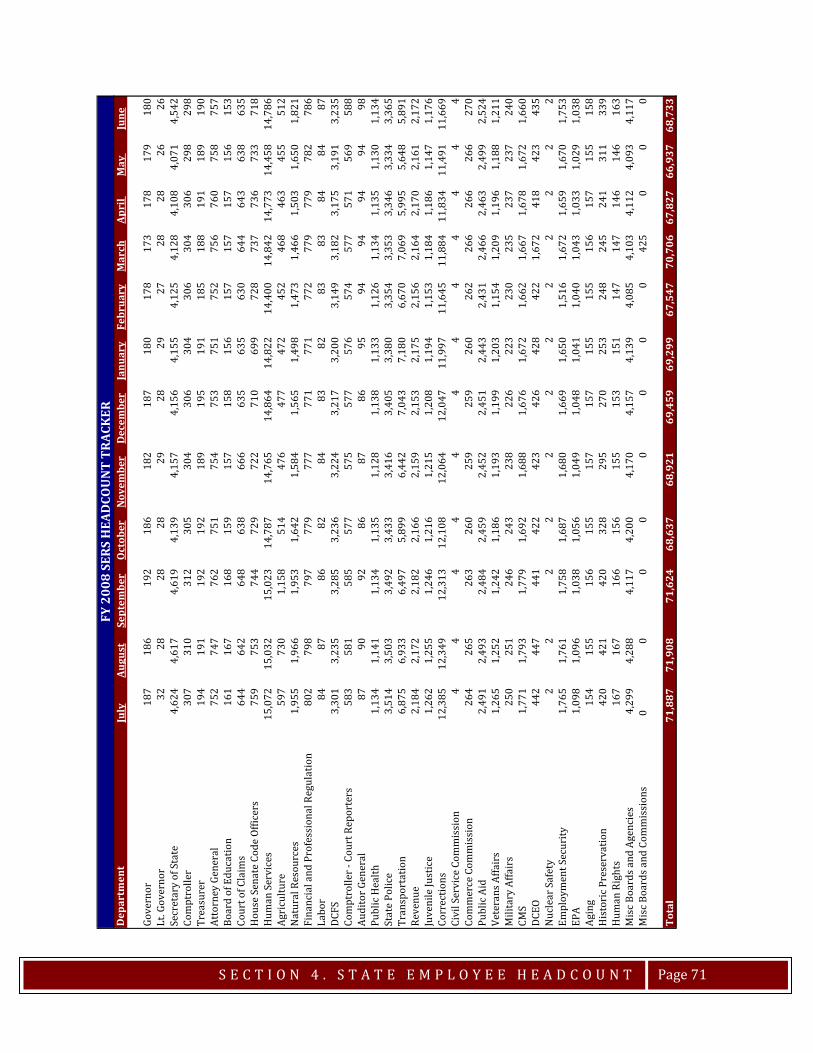
S E C T I O N 4 . S T A T E E M P L O Y E E H E A D C O U N T
Page 71
Dep
artm
ent
July
Augu
stSe
ptem
ber
Oct
ober
Nov
embe
rD
ecem
ber
Janu
ary
Febr
uary
Mar
chAp
ril
May
Ju
ne
Gove
rnor
187
186
192
186
182
187
180
178
173
178
179
180
Lt. G
over
nor
3228
2828
2928
2927
2828
2626
Secr
etar
y of
Sta
te4,
624
4,61
74,
619
4,13
94,
157
4,15
64,
155
4,12
54,
128
4,10
84,
071
4,54
2Co
mpt
rolle
r30
731
031
230
530
430
630
430
630
430
629
829
8Tr
easu
rer
194
191
192
192
189
195
191
185
188
191
189
190
Atto
rney
Gen
eral
752
747
762
751
754
753
751
752
756
760
758
757
Boar
d of
Edu
catio
n16
116
716
815
915
715
815
615
715
715
715
615
3Co
urt o
f Cla
ims
644
642
648
638
666
635
635
630
644
643
638
635
Hou
se S
enat
e Co
de O
ffice
rs75
975
374
472
972
271
069
972
873
773
673
371
8H
uman
Ser
vice
s15
,072
15,0
3215
,023
14,7
8714
,765
14,8
6414
,822
14,4
0014
,842
14,7
7314
,458
14,7
86Ag
ricu
lture
597
730
1,15
851
447
647
747
245
246
846
345
551
2N
atur
al R
esou
rces
1,95
51,
966
1,95
31,
642
1,58
41,
565
1,49
81,
473
1,46
61,
503
1,65
01,
821
Fina
ncia
l and
Pro
fess
iona
l Reg
ulat
ion
802
798
797
779
777
771
771
772
779
779
782
786
Labo
r84
8786
8284
8382
8383
8484
87DC
FS3,
301
3,23
53,
285
3,23
63,
224
3,21
73,
200
3,14
93,
182
3,17
53,
191
3,23
5Co
mpt
rolle
r - C
ourt
Rep
orte
rs58
358
158
557
757
557
757
657
457
757
156
958
8Au
dito
r Gen
eral
8790
9286
8786
9594
9494
9498
Publ
ic H
ealth
1,13
41,
141
1,13
41,
135
1,12
81,
138
1,13
31,
126
1,13
41,
135
1,13
01,
134
Stat
e Po
lice
3,51
43,
503
3,49
23,
433
3,41
63,
405
3,38
03,
354
3,35
33,
346
3,33
43,
365
Tran
spor
tatio
n6,
875
6,93
36,
497
5,89
96,
442
7,04
37,
180
6,67
07,
069
5,99
55,
648
5,89
1Re
venu
e2,
184
2,17
22,
182
2,16
62,
159
2,15
32,
175
2,15
62,
164
2,17
02,
161
2,17
2Ju
veni
le Ju
stic
e1,
262
1,25
51,
246
1,21
61,
215
1,20
81,
194
1,15
31,
184
1,18
61,
147
1,17
6Co
rrec
tions
12,3
8512
,349
12,3
1312
,108
12,0
6412
,047
11,9
9711
,645
11,8
8411
,834
11,4
9111
,669
Civi
l Ser
vice
Com
mis
sion
44
44
44
44
44
44
Com
mer
ce C
omm
issi
on26
426
526
326
025
925
926
026
226
626
626
627
0Pu
blic
Aid
2,49
12,
493
2,48
42,
459
2,45
22,
451
2,44
32,
431
2,46
62,
463
2,49
92,
524
Vete
rans
Affa
irs
1,26
51,
252
1,24
21,
186
1,19
31,
199
1,20
31,
154
1,20
91,
196
1,18
81,
211
Mili
tary
Affa
irs
250
251
246
243
238
226
223
230
235
237
237
240
CMS
1,77
11,
793
1,77
91,
692
1,68
81,
676
1,67
21,
662
1,66
71,
678
1,67
21,
660
DCEO
442
447
441
422
423
426
428
422
1,67
241
842
343
5N
ucle
ar S
afet
y2
22
22
22
22
22
2Em
ploy
men
t Sec
urity
1,76
51,
761
1,75
81,
687
1,68
01,
669
1,65
01,
516
1,67
21,
659
1,67
01,
753
EPA
1,09
81,
096
1,03
81,
056
1,04
91,
048
1,04
11,
040
1,04
31,
033
1,02
91,
038
Agin
g15
415
515
615
515
715
715
515
515
615
715
515
8H
isto
ric P
rese
rvat
ion
420
421
420
328
295
270
253
248
245
241
311
339
Hum
an R
ight
s16
716
716
615
615
515
315
114
714
714
614
616
3M
isc B
oard
s and
Age
ncie
s4,
299
4,28
84,
117
4,20
04,
170
4,15
74,
139
4,08
54,
103
4,11
24,
093
4,11
7M
isc B
oard
s and
Com
mis
sion
s0
00
00
00
042
50
00
Tota
l71
,887
71,9
0871
,624
68,6
3768
,921
69,4
5969
,299
67,5
4770
,706
67,8
2766
,937
68,7
33
FY 2
008
SERS
HEA
DCO
UN
T TR
ACK
ER


SECTION 5. STATE EMPLOYEES’ GROUP
INSURANCE
Group Insurance Enrollment Appropriation and Liability History Cost per Participant FY 2013 Group Insurance Liability Components

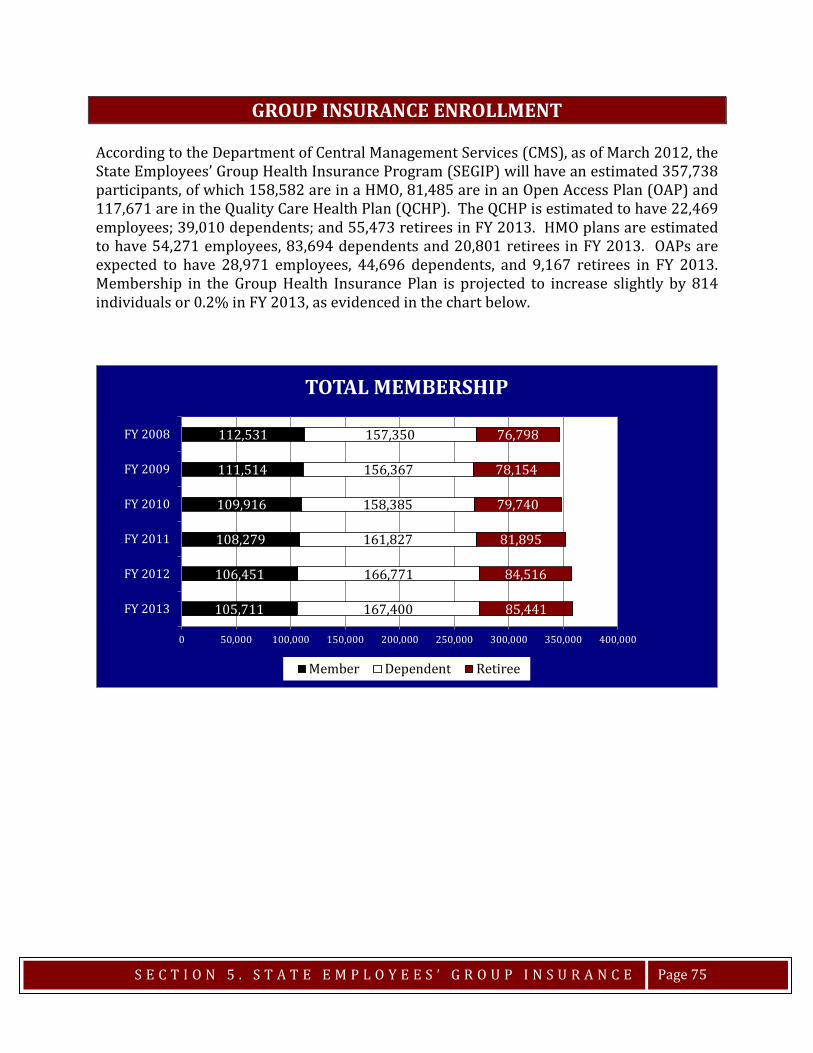
S E C T I O N 5 . S T A T E E M P L O Y E E S ’ G R O U P I N S U R A N C E
Page 75
GROUP INSURANCE ENROLLMENT According to the Department of Central Management Services (CMS), as of March 2012, the State Employees’ Group Health Insurance Program (SEGIP) will have an estimated 357,738 participants, of which 158,582 are in a HMO, 81,485 are in an Open Access Plan (OAP) and 117,671 are in the Quality Care Health Plan (QCHP). The QCHP is estimated to have 22,469 employees; 39,010 dependents; and 55,473 retirees in FY 2013. HMO plans are estimated to have 54,271 employees, 83,694 dependents and 20,801 retirees in FY 2013. OAPs are expected to have 28,971 employees, 44,696 dependents, and 9,167 retirees in FY 2013. Membership in the Group Health Insurance Plan is projected to increase slightly by 814 individuals or 0.2% in FY 2013, as evidenced in the chart below.
105,711
106,451
108,279
109,916
111,514
112,531
167,400
166,771
161,827
158,385
156,367
157,350
85,441
84,516
81,895
79,740
78,154
76,798
0 50,000 100,000 150,000 200,000 250,000 300,000 350,000 400,000
FY 2013
FY 2012
FY 2011
FY 2010
FY 2009
FY 2008
TOTAL MEMBERSHIP
Member Dependent Retiree

S E C T I O N 5 . S T A T E E M P L O Y E E S ’ G R O U P I N S U R A N C E
Page 76
APPROPRIATION AND LIABILITY HISTORY The Governor has requested that a total of $2.7 billion be appropriated for the SEGIP for FY 2013. The requested FY 2012 appropriation request for the Group Health Insurance Program was $2.5 billion. The table below shows the appropriation and liability history of the SEGIP from FY 2008 to FY 2013, as well as the Commissions estimated liability. Overall, the Commission’s FY 2013 estimate for group insurance liability is $39.0 million higher than the FY 2013 estimate from DHFS. CGFA’s FY 2012 HMO liability estimate is $2.5 million higher than DHFS, CGFA's Open Access Plan medical estimate is $12.4 million more than DHFS, and CGFA’s FY 2012 estimate for prescriptions is $3.9 million higher than the DHFS estimate. CGFA's dental estimate is $1.8 million more than DHFS. The tables on the following page show 1) a detailed comparison of the CGFA estimate for the various cost components and the DHFS projection for FY 2013 and 2) the cost components for the Group Health Insurance Program from FY 2004 through FY 2013. The Department’s estimate of liability for FY 2013 represents a 7.1% growth rate over FY 2012. This increase in estimated liability is larger than the increase from FY 2011 to FY 2012, when liability was estimated at 2.3% growth.
Approrpriation HFS Liability$1,884.9 $1,789.5$1,983.0 $1,892.4$1,991.6 $2,044.3$2,163.3 $2,178.7$2,229.0 $2,244.4$3,967.5 $2,388.7$2,650.0 $2,649.9
FY 2007
APPROPRIATION AND LIABILITY HISTORYFY 2008-2013($ in Millions)
Fiscal Year CGFA Liability
$2,688.9*Estimated for FY 2013
FY 2008FY 2009FY 2010FY 2011FY 2012FY 2013*
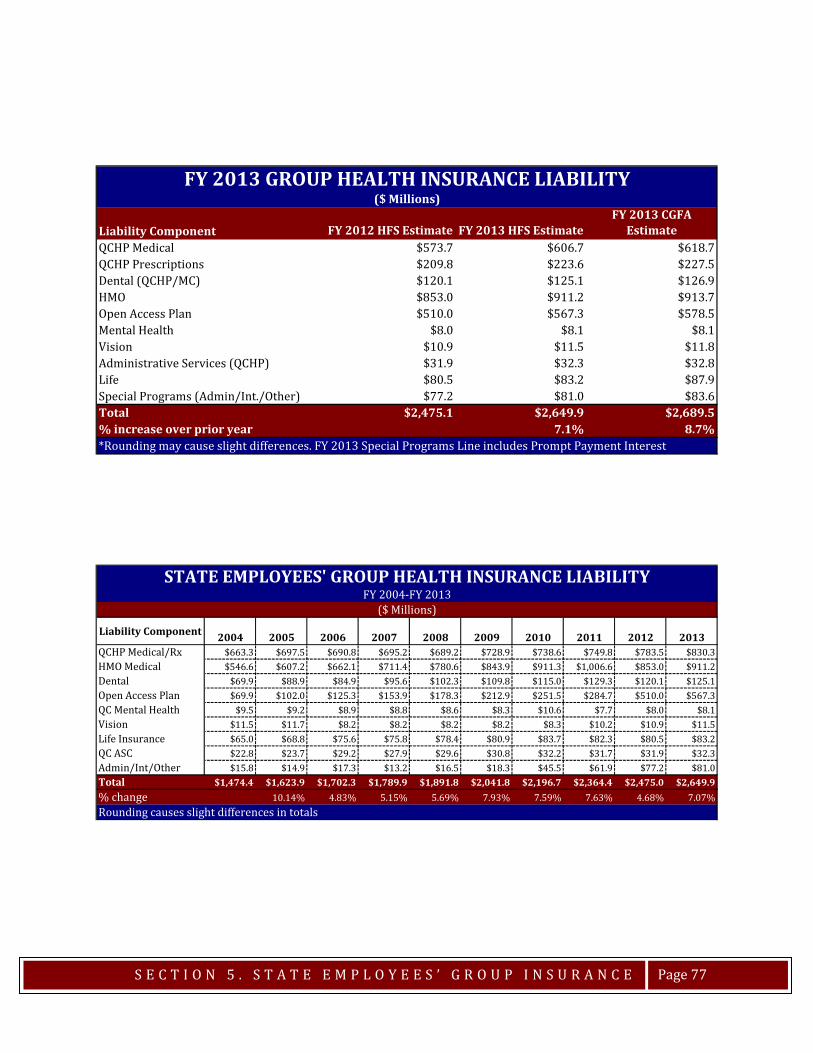
S E C T I O N 5 . S T A T E E M P L O Y E E S ’ G R O U P I N S U R A N C E
Page 77
Liability Component FY 2012 HFS Estimate FY 2013 HFS EstimateFY 2013 CGFA
EstimateQCHP Medical $573.7 $606.7 $618.7QCHP Prescriptions $209.8 $223.6 $227.5Dental (QCHP/MC) $120.1 $125.1 $126.9HMO $853.0 $911.2 $913.7Open Access Plan $510.0 $567.3 $578.5Mental Health $8.0 $8.1 $8.1Vision $10.9 $11.5 $11.8Administrative Services (QCHP) $31.9 $32.3 $32.8Life $80.5 $83.2 $87.9Special Programs (Admin/Int./Other) $77.2 $81.0 $83.6Total $2,475.1 $2,649.9 $2,689.5% increase over prior year 7.1% 8.7%
FY 2013 GROUP HEALTH INSURANCE LIABILITY($ Millions)
*Rounding may cause slight differences. FY 2013 Special Programs Line includes Prompt Payment Interest
Liability Component 2004 2005 2006 2007 2008 2009 2010 2011 2012 2013QCHP Medical/Rx $663.3 $697.5 $690.8 $695.2 $689.2 $728.9 $738.6 $749.8 $783.5 $830.3HMO Medical $546.6 $607.2 $662.1 $711.4 $780.6 $843.9 $911.3 $1,006.6 $853.0 $911.2Dental $69.9 $88.9 $84.9 $95.6 $102.3 $109.8 $115.0 $129.3 $120.1 $125.1Open Access Plan $69.9 $102.0 $125.3 $153.9 $178.3 $212.9 $251.5 $284.7 $510.0 $567.3QC Mental Health $9.5 $9.2 $8.9 $8.8 $8.6 $8.3 $10.6 $7.7 $8.0 $8.1Vision $11.5 $11.7 $8.2 $8.2 $8.2 $8.2 $8.3 $10.2 $10.9 $11.5Life Insurance $65.0 $68.8 $75.6 $75.8 $78.4 $80.9 $83.7 $82.3 $80.5 $83.2QC ASC $22.8 $23.7 $29.2 $27.9 $29.6 $30.8 $32.2 $31.7 $31.9 $32.3Admin/Int/Other $15.8 $14.9 $17.3 $13.2 $16.5 $18.3 $45.5 $61.9 $77.2 $81.0Total $1,474.4 $1,623.9 $1,702.3 $1,789.9 $1,891.8 $2,041.8 $2,196.7 $2,364.4 $2,475.0 $2,649.9% change 10.14% 4.83% 5.15% 5.69% 7.93% 7.59% 7.63% 4.68% 7.07%
STATE EMPLOYEES' GROUP HEALTH INSURANCE LIABILITYFY 2004-FY 2013
($ Millions)
Rounding causes slight differences in totals
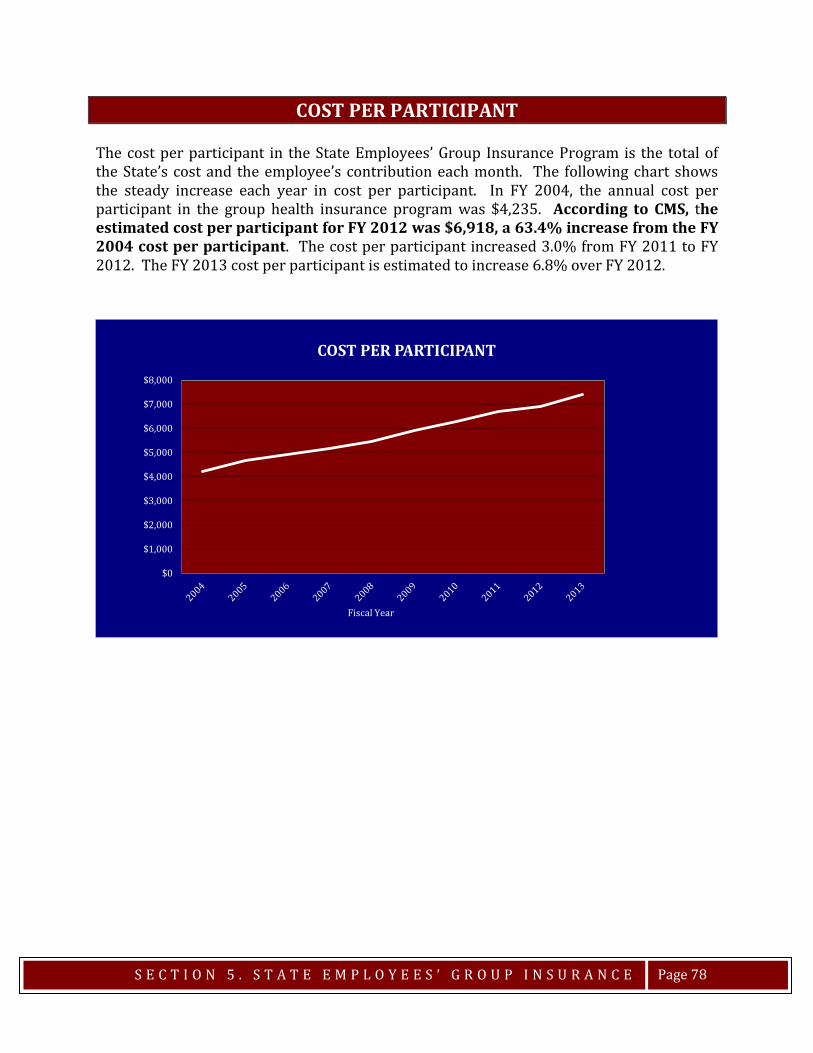
S E C T I O N 5 . S T A T E E M P L O Y E E S ’ G R O U P I N S U R A N C E
Page 78
COST PER PARTICIPANT The cost per participant in the State Employees’ Group Insurance Program is the total of the State’s cost and the employee’s contribution each month. The following chart shows the steady increase each year in cost per participant. In FY 2004, the annual cost per participant in the group health insurance program was $4,235. According to CMS, the estimated cost per participant for FY 2012 was $6,918, a 63.4% increase from the FY 2004 cost per participant. The cost per participant increased 3.0% from FY 2011 to FY 2012. The FY 2013 cost per participant is estimated to increase 6.8% over FY 2012.
$0
$1,000
$2,000
$3,000
$4,000
$5,000
$6,000
$7,000
$8,000
Fiscal Year
COST PER PARTICIPANT
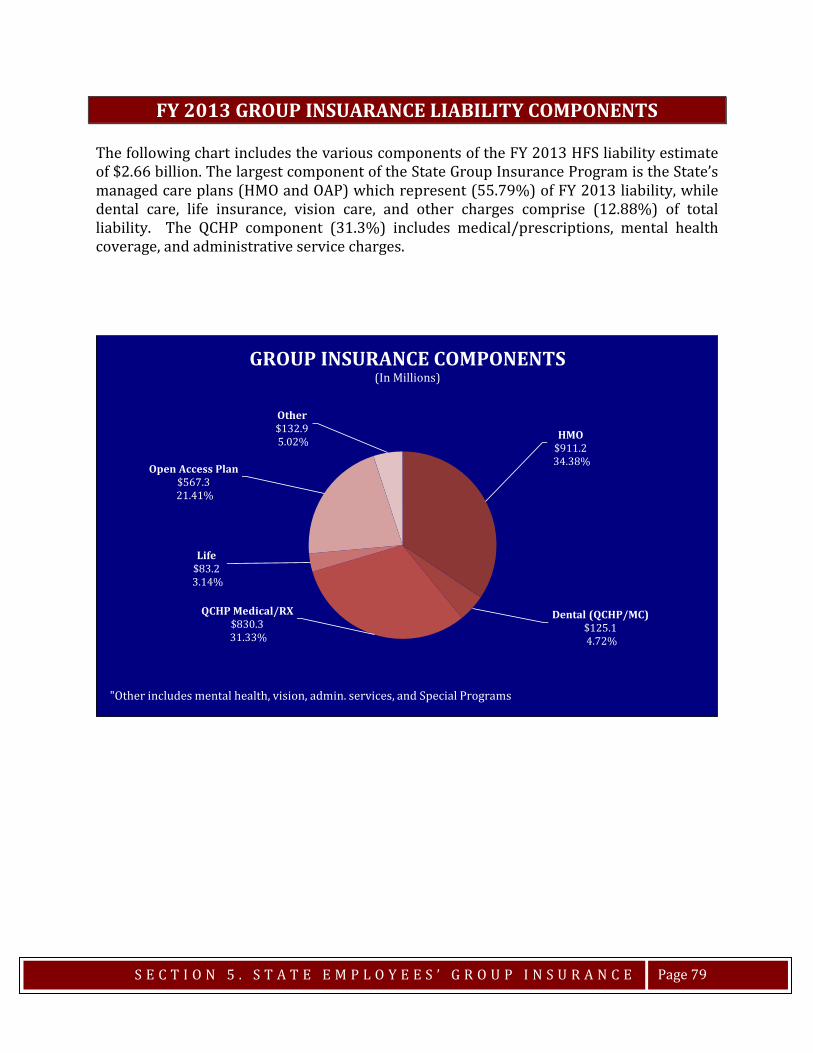
S E C T I O N 5 . S T A T E E M P L O Y E E S ’ G R O U P I N S U R A N C E
Page 79
FY 2013 GROUP INSUARANCE LIABILITY COMPONENTS The following chart includes the various components of the FY 2013 HFS liability estimate of $2.66 billion. The largest component of the State Group Insurance Program is the State’s managed care plans (HMO and OAP) which represent (55.79%) of FY 2013 liability, while dental care, life insurance, vision care, and other charges comprise (12.88%) of total liability. The QCHP component (31.3%) includes medical/prescriptions, mental health coverage, and administrative service charges.
HMO$911.234.38%
Dental (QCHP/MC)$125.14.72%
QCHP Medical/RX$830.331.33%
Life$83.23.14%
Open Access Plan$567.321.41%
Other$132.95.02%
GROUP INSURANCE COMPONENTS(In Millions)
"Other includes mental health, vision, admin. services, and Special Programs


SECTION 6. PENSION LEGISLATION
Pension Legislation – 2012 Spring Session Two-Tier Pension Reform Police and Fire Pension Reform Historical Pension Legislation

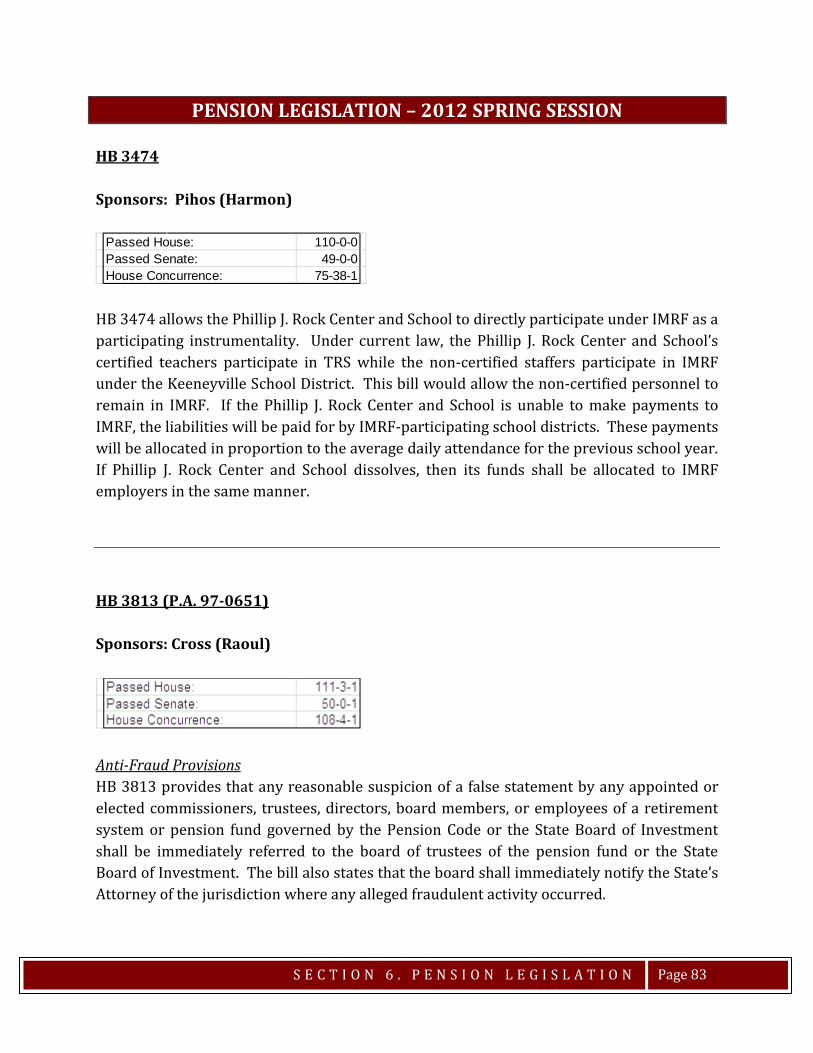
S E C T I O N 6 . P E N S I O N L E G I S L A T I O N
Page 83
PENSION LEGISLATION – 2012 SPRING SESSION HB 3474 Sponsors: Pihos (Harmon)
HB 3474 allows the Phillip J. Rock Center and School to directly participate under IMRF as a participating instrumentality. Under current law, the Phillip J. Rock Center and School’s certified teachers participate in TRS while the non-certified staffers participate in IMRF under the Keeneyville School District. This bill would allow the non-certified personnel to remain in IMRF. If the Phillip J. Rock Center and School is unable to make payments to IMRF, the liabilities will be paid for by IMRF-participating school districts. These payments will be allocated in proportion to the average daily attendance for the previous school year. If Phillip J. Rock Center and School dissolves, then its funds shall be allocated to IMRF employers in the same manner. HB 3813 (P.A. 97-0651) Sponsors: Cross (Raoul)
Anti-Fraud Provisions HB 3813 provides that any reasonable suspicion of a false statement by any appointed or elected commissioners, trustees, directors, board members, or employees of a retirement system or pension fund governed by the Pension Code or the State Board of Investment shall be immediately referred to the board of trustees of the pension fund or the State Board of Investment. The bill also states that the board shall immediately notify the State’s Attorney of the jurisdiction where any alleged fraudulent activity occurred.
Passed House: 110-0-0Passed Senate: 49-0-0House Concurrence: 75-38-1
S E C T I O N 6 . P E N S I O N L E G I S L A T I O N
Page 84
Police and Fire Leaves of Absence Prior to the passage of HB 3813, members of Downstate Police and Downstate Fire pension funds were eligible to take leaves of absence for various reasons, including service as an executive officer in an organization that represents police officers and firefighters. Prior law provided that the member continue to make the applicable employee contribution, and the employing entity must have made the employer’s contribution as well. HB 3813 provides that Downstate police officers and firefighters who take such leaves of absence must remain in sworn status, subject to the professional standards of the public employer. This requirement applies to those individuals whose leave of absence began before the efffective date of HB 3813. The bill specifies that the obligation to remain in sworn status while on leave of absence also applies to members of the Chicago Police and Chicago Fire pension funds, as well as police officers covered by the Cook County article of the Pension Code. Leaves of Absence and “Double Dipping“ - Chicago Municipal and Chicago Laborers Prior to the passage of HB 3813, members of the Chicago Municipal and Chicago Laborers Pension Funds were allowed to take leaves of absence to work for a local labor organization that represents municipal employees and earn pensionable service credit in that capacity. HB 3813 specifies that such leaves of absence are only allowed if taken before the effective date of this bill. The bill also provides a more thorough definition of “local labor organization“ to include affiliates of the local, intrastate, State, multi-state, national, or international union. The bill states that this expansion of “local labor organization“ is a declaration of existing law and shall not be construed as a new enactment. This provision is intended to prohibit “double dipping“ in cases where a member of the Chicago Municipal or Laborers pension fund on a leave of absence is eligible to receive concurrent service credit in the Chicago Municipal or Laborers pension fund and the union pension fund because the union is not deemed to be a “local labor organization.“ HB 3813 also contains a provision stating that the Chicago Municipal and Chicago Laborers Articles of the Pension Code shall not be construed to authorize a salary paid by an entity other than the city to be used to calculate the highest average annual salary of a participant. This provision is a declaration of existing law and shall not be construed as a new enactment. Pension Credit for Employees of Statewide Teacher Organizations – SURS and TRS Prior to the passage of HB 3813, members of SURS and TRS were allowed to earn pensionable service credit while working for a statewide teacher organization or national teacher organization under certain conditions. HB 3813 specifies that such service credit
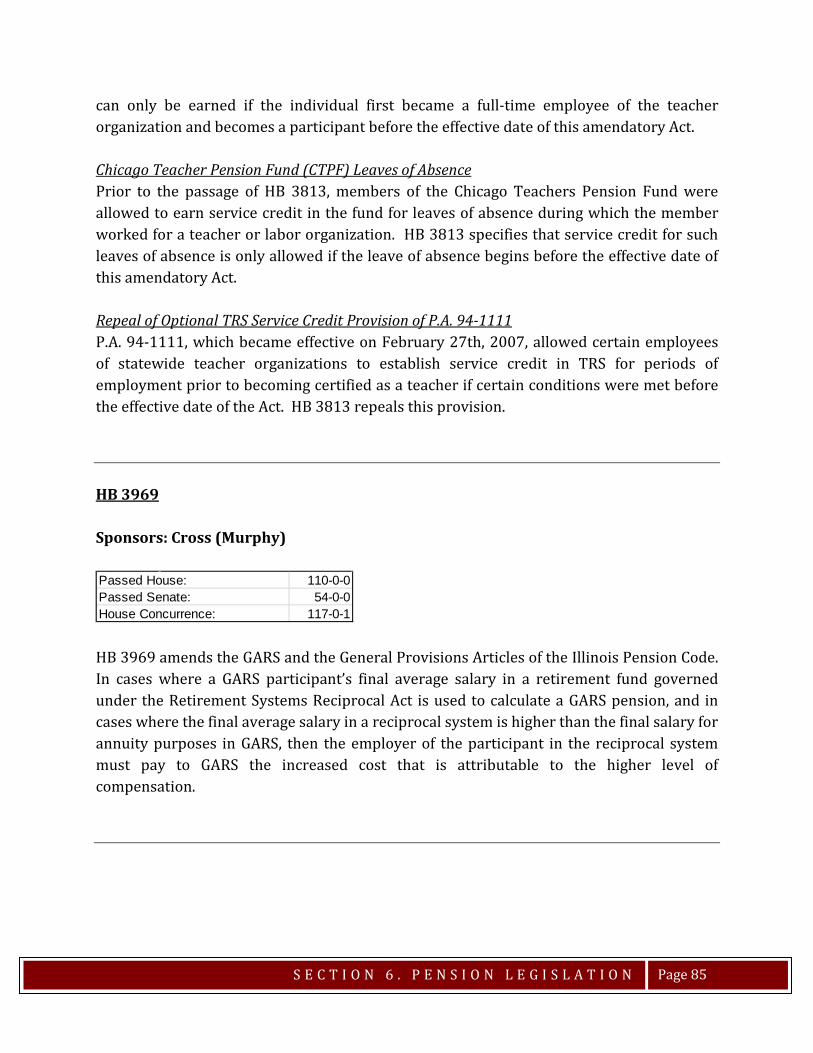
S E C T I O N 6 . P E N S I O N L E G I S L A T I O N
Page 85
can only be earned if the individual first became a full-time employee of the teacher organization and becomes a participant before the effective date of this amendatory Act. Chicago Teacher Pension Fund (CTPF) Leaves of Absence Prior to the passage of HB 3813, members of the Chicago Teachers Pension Fund were allowed to earn service credit in the fund for leaves of absence during which the member worked for a teacher or labor organization. HB 3813 specifies that service credit for such leaves of absence is only allowed if the leave of absence begins before the effective date of this amendatory Act. Repeal of Optional TRS Service Credit Provision of P.A. 94-1111 P.A. 94-1111, which became effective on February 27th, 2007, allowed certain employees of statewide teacher organizations to establish service credit in TRS for periods of employment prior to becoming certified as a teacher if certain conditions were met before the effective date of the Act. HB 3813 repeals this provision. HB 3969 Sponsors: Cross (Murphy)
HB 3969 amends the GARS and the General Provisions Articles of the Illinois Pension Code. In cases where a GARS participant’s final average salary in a retirement fund governed under the Retirement Systems Reciprocal Act is used to calculate a GARS pension, and in cases where the final average salary in a reciprocal system is higher than the final salary for annuity purposes in GARS, then the employer of the participant in the reciprocal system must pay to GARS the increased cost that is attributable to the higher level of compensation.
Passed House: 110-0-0Passed Senate: 54-0-0House Concurrence: 117-0-1

S E C T I O N 6 . P E N S I O N L E G I S L A T I O N
Page 86
HB 4513 Sponsors: Nekritz (Cullerton)
HB 4513 amends the Metropolitan Water Reclamation article of the Illinois Pension code. The bill increases employee contributions for employees hired before Jan. 1, 2011. The bill also creates a new amortization schedule for the pension fund, with increased employer contributions and a mandate of reaching a 90% funding ratio by 2050. Under current law, the MWRD levies a tax equal to the total amount of contributions made by employees in the calendar year 2 years prior to the year of the levy, multiplied by 2.19. HB 4513 would change this employer contribution rate such that the MWRD would make employer contributions to the pension fund as a level percentage of payroll with a goal of reaching a 90% funding ratio by 2050. The bill specifies that the employer contribution shall not exceed an amount equal to the total employee contributions 2 years prior to the year of the levy, multiplied by 4.19. Also under current law, MWRD employees contribute 9% of salary towards their pensions. HB 4513 would gradually ramp up contributions for employees hired before Jan. 1, 2011 (the effective date of P.A. 96-0889) such that by Jan. 1, 2015, MWRD employees would be contributing 12.0% of salary towards their pensions. The bill contains a provision that states that once the MWRD pension fund has reached a 90% funding ratio, the employee contribution rate will drop back to 9.0% of salary. HB 4622 Sponsors: Nekritz (Martinez)
HB 4622 amends the IMRF article of the Pension Code to remove obsolete Social Security procedures. The bill clarifies that taxes levied for IMRF purposes can only be used for IMRF employer contributions.
Passed House: 109-0-0Passed Senate: 50-2-2
Passed House: 110-0-0Passed Senate: 55-0-1
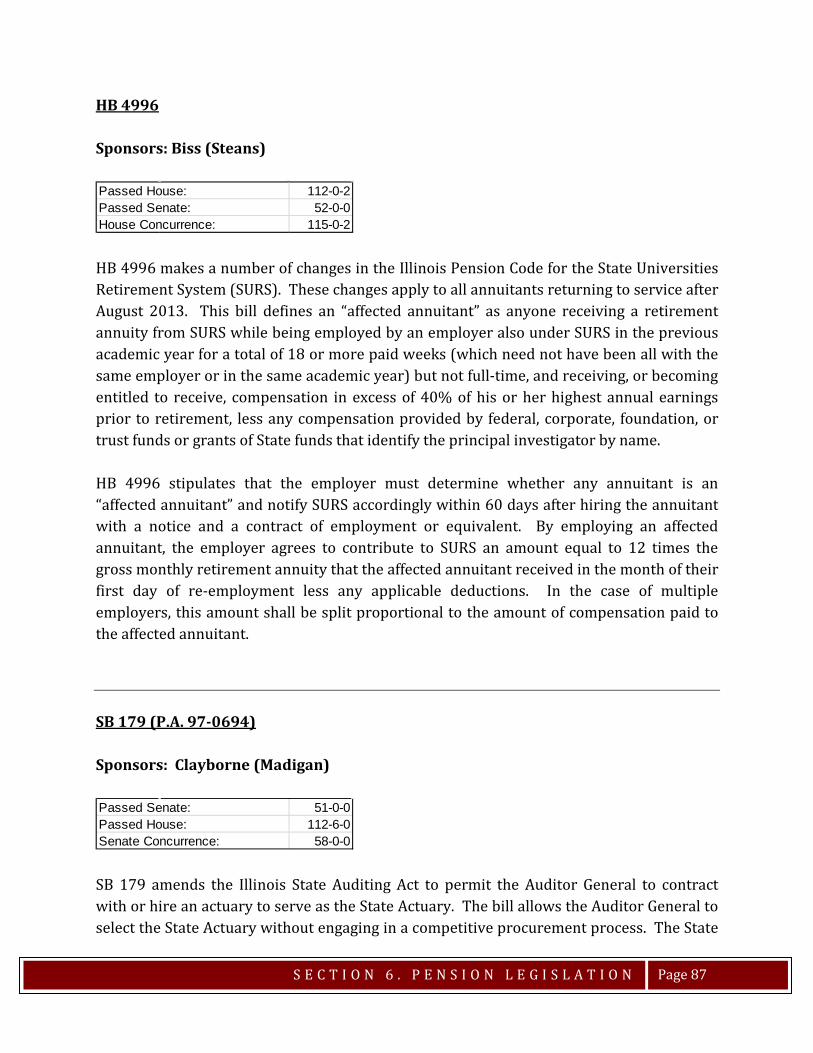
S E C T I O N 6 . P E N S I O N L E G I S L A T I O N
Page 87
HB 4996 Sponsors: Biss (Steans)
HB 4996 makes a number of changes in the Illinois Pension Code for the State Universities Retirement System (SURS). These changes apply to all annuitants returning to service after August 2013. This bill defines an “affected annuitant” as anyone receiving a retirement annuity from SURS while being employed by an employer also under SURS in the previous academic year for a total of 18 or more paid weeks (which need not have been all with the same employer or in the same academic year) but not full-time, and receiving, or becoming entitled to receive, compensation in excess of 40% of his or her highest annual earnings prior to retirement, less any compensation provided by federal, corporate, foundation, or trust funds or grants of State funds that identify the principal investigator by name. HB 4996 stipulates that the employer must determine whether any annuitant is an “affected annuitant” and notify SURS accordingly within 60 days after hiring the annuitant with a notice and a contract of employment or equivalent. By employing an affected annuitant, the employer agrees to contribute to SURS an amount equal to 12 times the gross monthly retirement annuity that the affected annuitant received in the month of their first day of re-employment less any applicable deductions. In the case of multiple employers, this amount shall be split proportional to the amount of compensation paid to the affected annuitant. SB 179 (P.A. 97-0694) Sponsors: Clayborne (Madigan)
SB 179 amends the Illinois State Auditing Act to permit the Auditor General to contract with or hire an actuary to serve as the State Actuary. The bill allows the Auditor General to select the State Actuary without engaging in a competitive procurement process. The State
Passed House: 112-0-2Passed Senate: 52-0-0House Concurrence: 115-0-2
Passed Senate: 51-0-0Passed House: 112-6-0Senate Concurrence: 58-0-0
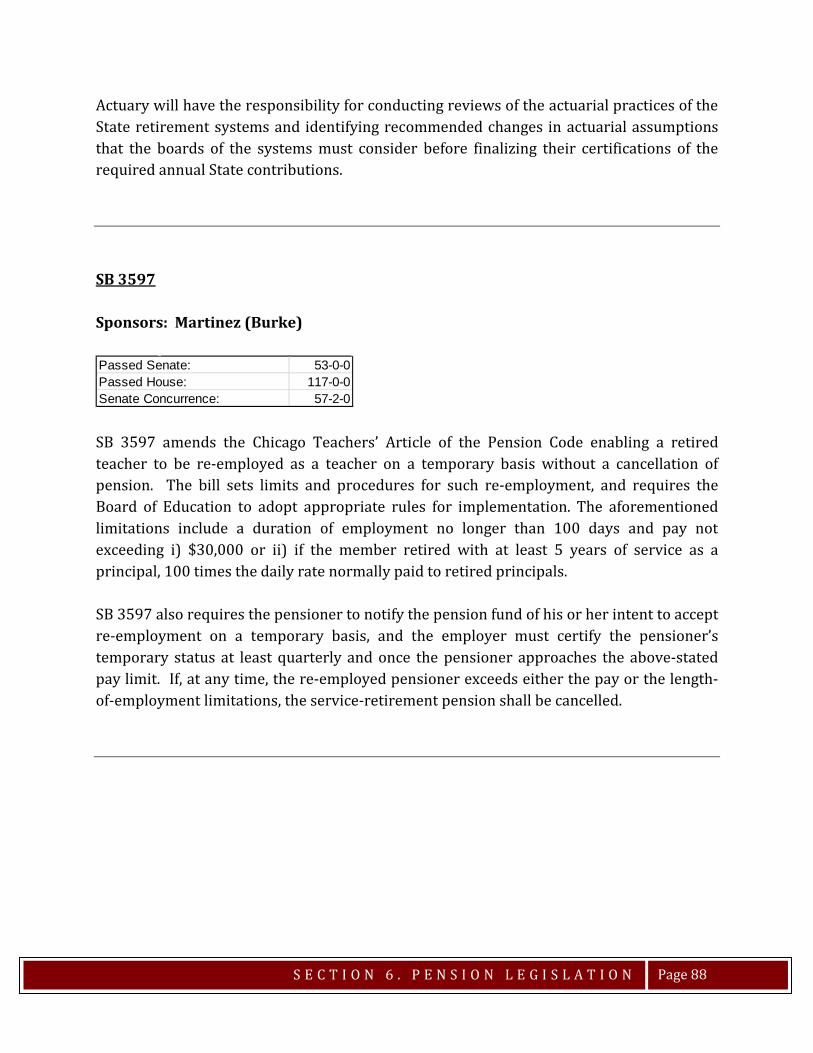
S E C T I O N 6 . P E N S I O N L E G I S L A T I O N
Page 88
Actuary will have the responsibility for conducting reviews of the actuarial practices of the State retirement systems and identifying recommended changes in actuarial assumptions that the boards of the systems must consider before finalizing their certifications of the required annual State contributions. SB 3597 Sponsors: Martinez (Burke)
SB 3597 amends the Chicago Teachers’ Article of the Pension Code enabling a retired teacher to be re-employed as a teacher on a temporary basis without a cancellation of pension. The bill sets limits and procedures for such re-employment, and requires the Board of Education to adopt appropriate rules for implementation. The aforementioned limitations include a duration of employment no longer than 100 days and pay not exceeding i) $30,000 or ii) if the member retired with at least 5 years of service as a principal, 100 times the daily rate normally paid to retired principals. SB 3597 also requires the pensioner to notify the pension fund of his or her intent to accept re-employment on a temporary basis, and the employer must certify the pensioner’s temporary status at least quarterly and once the pensioner approaches the above-stated pay limit. If, at any time, the re-employed pensioner exceeds either the pay or the length-of-employment limitations, the service-retirement pension shall be cancelled.
Passed Senate: 53-0-0Passed House: 117-0-0Senate Concurrence: 57-2-0
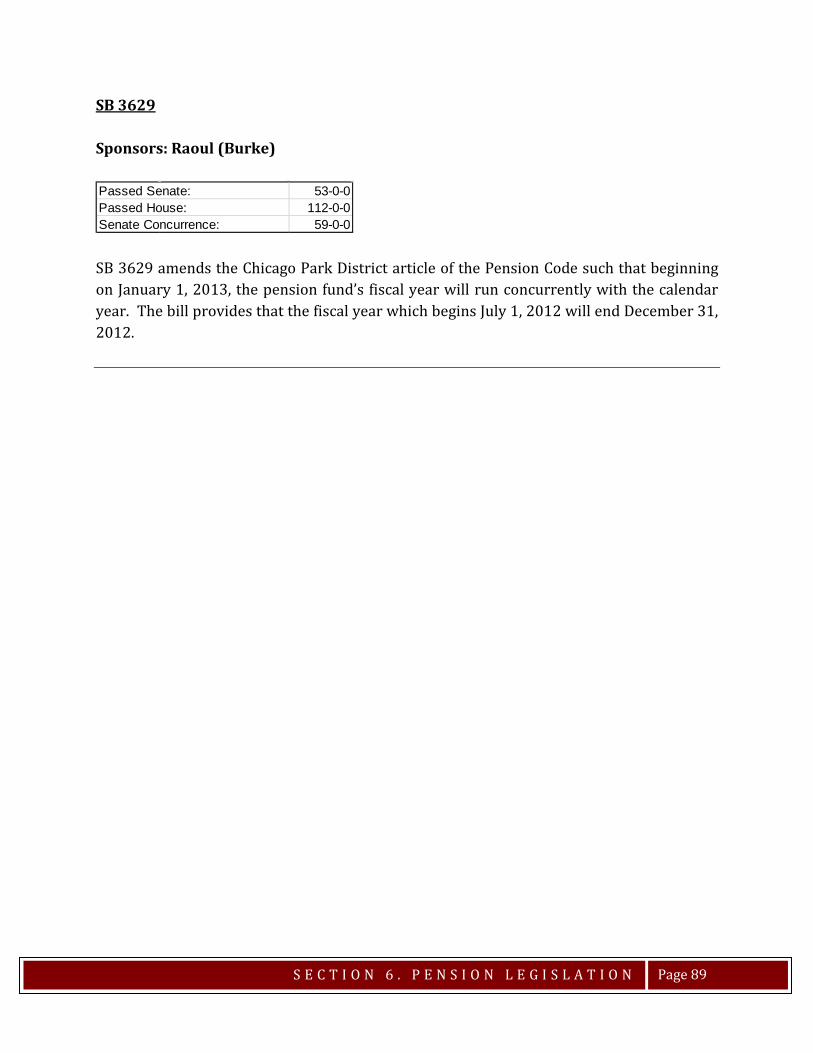
S E C T I O N 6 . P E N S I O N L E G I S L A T I O N
Page 89
SB 3629 Sponsors: Raoul (Burke)
SB 3629 amends the Chicago Park District article of the Pension Code such that beginning on January 1, 2013, the pension fund’s fiscal year will run concurrently with the calendar year. The bill provides that the fiscal year which begins July 1, 2012 will end December 31, 2012.
Passed Senate: 53-0-0Passed House: 112-0-0Senate Concurrence: 59-0-0
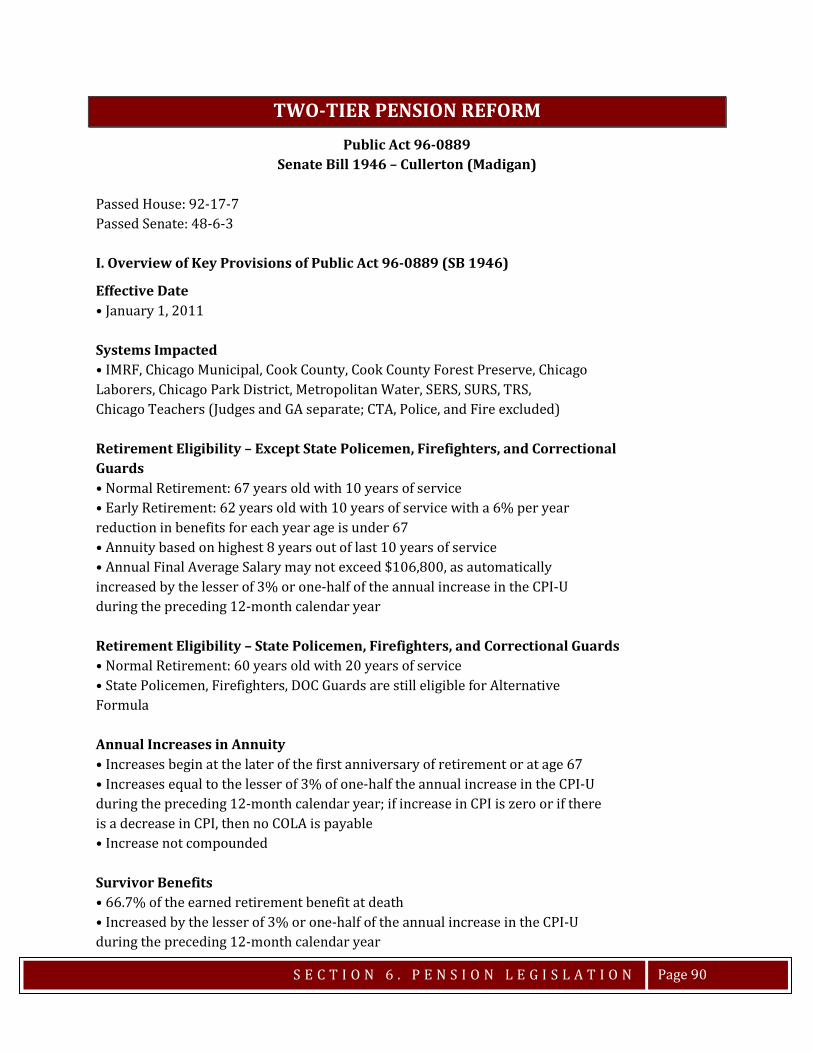
S E C T I O N 6 . P E N S I O N L E G I S L A T I O N
Page 90
TWO-TIER PENSION REFORM Public Act 96-0889
Senate Bill 1946 – Cullerton (Madigan) Passed House: 92-17-7 Passed Senate: 48-6-3 I. Overview of Key Provisions of Public Act 96-0889 (SB 1946)
Effective Date • January 1, 2011 Systems Impacted • IMRF, Chicago Municipal, Cook County, Cook County Forest Preserve, Chicago Laborers, Chicago Park District, Metropolitan Water, SERS, SURS, TRS, Chicago Teachers (Judges and GA separate; CTA, Police, and Fire excluded) Retirement Eligibility – Except State Policemen, Firefighters, and Correctional Guards • Normal Retirement: 67 years old with 10 years of service • Early Retirement: 62 years old with 10 years of service with a 6% per year reduction in benefits for each year age is under 67 • Annuity based on highest 8 years out of last 10 years of service • Annual Final Average Salary may not exceed $106,800, as automatically increased by the lesser of 3% or one-half of the annual increase in the CPI-U during the preceding 12-month calendar year Retirement Eligibility – State Policemen, Firefighters, and Correctional Guards • Normal Retirement: 60 years old with 20 years of service • State Policemen, Firefighters, DOC Guards are still eligible for Alternative Formula Annual Increases in Annuity • Increases begin at the later of the first anniversary of retirement or at age 67 • Increases equal to the lesser of 3% of one-half the annual increase in the CPI-U during the preceding 12-month calendar year; if increase in CPI is zero or if there is a decrease in CPI, then no COLA is payable • Increase not compounded Survivor Benefits • 66.7% of the earned retirement benefit at death • Increased by the lesser of 3% or one-half of the annual increase in the CPI-U during the preceding 12-month calendar year
S E C T I O N 6 . P E N S I O N L E G I S L A T I O N
Page 91
• Increases not compounded “Double Dipping” Prohibited • Prohibition on simultaneously collecting a pension and a salary with public employer. Chicago Teachers’ Extension of Funding Plan • Contributions specified in Fiscal Years 2011 – 2014 • New Goal: CTPF must reach 90% by 2059 (currently 2045) Retirement Eligibility – Judges and General Assembly • Normal Retirement: 67 years old with 8 years of service • Early Retirement: 62 years old with 8 years of service Change in Benefit Formula – Judges and General Assembly • 3% of Final Average Salary for each year of service • Maximum annuity 60% of Final Average Salary • Retirement annuity based on highest 8 out of final 10 years of service Annual Increase in Annuity – Judges and General Assembly • Increases begin after attainment of age 67 • Increases equal to the lesser of 3% or one-half of the annual increase in the CPIU during the preceding 12-month calendar year • Increases compounded Annual Increase in Survivor’s Annuity – Judges and General Assembly • 66.7% of the earned retirement benefit at death • Increased by the lesser of 3% or one-half of the annual increase in the CPI-U during the preceding 12-month calendar year • Increases compounded

S E C T I O N 6 . P E N S I O N L E G I S L A T I O N
Page 92
Police and Fire Pension Reform
P.A. 96-1495 SB 3538 – Link (McCarthy)
Passed Senate: 46-0-0 Passed House: 95-18-0 Senate Concurrence: 46-4-2 Effective Date
• January 1, 2011 Systems Impacted
• Downstate Police, Downstate Fire, Chicago Police, Chicago Fire, IMRF (SLEP) Creation of a Two-Tier System for Firefighters and Police Officers
• Benefits for current police officers and firefighters have not changed. • Changes only apply to police officers and firefighters hired on or after January 1, 2011. • Normal Retirement: 55 years old with 10 years of service. • Early Retirement: 50 years old with 10 years of service, but penalty of ½% for each month
that the police officer or firefighter is younger than 55 years. • Retirement Pension based upon 2.5% of Final Average Salary for a maximum of 75%. • Annuity based on highest 8 years out of last 10 years of service. • Annual Final Average Salary may not exceed $106,800, as automatically increased by the
lesser of 3% or one-half of the annual increase in the CPI-U during the preceding 12-month calendar year.
Annual Increases in Annuity
• Increases begin at age 60 either on the January 1st after police officer/firefighter retires or the first anniversary of pension starting date, whichever is later.
• Increases equal to the lesser of 3% of one-half the annual increase in the CPI-U during the preceding 12-month calendar year; if increase in CPI is zero or if there is a decrease in CPI, then no COLA is payable.
• Increase not compounded Survivor Benefits
• 66.7% of the earned retirement benefit at death • Increased by the lesser of 3% or one-half of the annual increase in the CPI-U during the
preceding 12-month calendar year • Increases not compounded
Municipal Funding Provisions
• Pension funds must be 90% funded by Fiscal Year 2040 • Annual Municipal contributions will be calculated as level percentage of payroll under
“Projected Unit Credit Actuarial Cost Method.” • Comptroller is authorized to redirect municipal monies directly to pension funds if municipal
contributions are insufficient. • Future pension fund studies are authorized to review the condition of pension funds and
potential investment pooling.
S E C T I O N 6 . P E N S I O N L E G I S L A T I O N
Page 93
HISTORICAL PENSION LEGISLATION 88th General Assembly (1993 – 1994) Funding Plan for State-Funded Retirement Systems (P. A. 88-0593) Public Act 88-0593 implemented a funding plan for the five State retirement systems that requires the State to make contributions as a level percent of payroll in fiscal years 2011 through 2045, following a phase in which began in fiscal year 1996. The contributions are required to be sufficient, when added to employee contributions, investment income, and other income, to bring the total assets of the systems to 90% of the actuarial liabilities by fiscal year 2045. Each system is required to certify the amount necessary for the next fiscal year by November 15 of the current fiscal year, for inclusion in the Governor’s budget. For example, the FY 2008 actuarial reports will be released in November 2008, and will contain the actuarially certified contributions for FY 2010. 89th General Assembly (1995 – 1996) Funding Plan for Chicago Teachers’ Pension Fund (P.A. 89-0015) Public Act 89-0015 established a funding plan for the Chicago Teachers’ Pension Fund under which the Chicago Board of Education is required to make a minimum annual contribution to the fund in an amount that will bring the funded ratio up to 90% by the end of Fiscal Year 2045. For fiscal years 1999 through 2010, the Board of Education’s contribution is to be increased in equal annual increments so that by Fiscal Year 2011, the Board of Education is making contributions as a level percentage of payroll each year through FY 2045. 90th General Assembly (1997 – 1998) SERS Formula Increase (P.A. 90-0065) P.A. 90-0065 (HB 0110) implemented a flat rate formula for SERS Regular Formula members covered by Social Security of 1.67% for all years of service. Regular Formula members not covered by Social Security moved to a flat rate formula of 2.2% for all years of service. The Act applied to all members retiring on or after January 1, 1998. Funding Plan for Chicago Teachers’ Pension Fund (P.A. 90-0545) Public Act 90-0548 revised the funding plan outlined in Public Act 89-0015 to stipulate that the Chicago Board of Education need not make pension contributions unless the funded ratio drops below 90%. State Contributions to Chicago Teachers’ Pension Fund (P.A. 90-0582) Public Act 90-582 requires the state to contribute 0.544% of the Chicago Teachers’ Pension Fund’s total teacher payroll when the funded ratio drops below 90%.
S E C T I O N 6 . P E N S I O N L E G I S L A T I O N
Page 94
TRS Formula Increase (P.A. 90-0582) P.A. 90-0582 implemented a retirement formula increase for members of the Teachers’ Retirement System. The Act provided that active teachers would earn creditable service on or after July 1, 1998 at a rate of 2.2% of final average salary for each year of service. The Act also allowed teachers to make contributions to TRS in order to upgrade past service earned prior to the implementation of the flat-rate formula. Chicago Teachers Formula Increase (P.A. 90-582) P.A. 90-582 implemented a retirement formula increase for Chicago Teachers. The Act provided that active teachers would earn creditable service on or after July 1, 1998 at a rate of 2.2% of final average salary for each year of creditable service. The Act allowed Chicago teachers to make contributions to the fund in order to upgrade past service earned prior to the implementation of the new flat-rate formula. Creation of Self-Managed Plan in SURS (P.A. 90-0448) P.A. 90-0448 gave members of the State Universities Retirement System the option to enroll in a Self-Managed Plan in which participants are able to choose from a variety of investment options ranging from mutual funds to annuity contracts. Members who choose the SMP become vested after earning 5 years of service credit. 91st General Assembly (1999 – 2000) “Rule of 85” for SERS (P.A. 91-0927) P.A. 91-0927 created a “Rule of 85” for the State Employees’ Retirement System, wherein an employee is eligible to retire when the employee’s age plus service credit equals 85 years. Downstate Fire Formula Increase (P.A. 91-0466) Prior to the enactment of P.A. 91-0466, Downstate Firefighters received an annuity of 50% of salary for the first 20 years of service, plus 2% of salary for each year of service between 21 and 30 years, plus 1% of salary for each year of service over 30 years. The Act increased the retirement formula to 2.5% of salary for the 21st through 30th year of service. The maximum annuity of 75% of salary was not changed. In effect, the Act allowed the maximum annuity of 75% of salary to be reached in 30 years, instead of 35 years. Downstate Police Formula Increase (P.A. 91-0939) Prior to the enactment of P.A. 94-0939, Downstate Police officers received an annuity of 50% of salary for the first 20 years of service, plus 2% of salary for each year of service between 21 and 30 years, plus 1% of salary for each year of service over 30 years. The Act increased the retirement formula to 2.5% of salary for the 21st through 30th year of service, beginning January 1, 1999. The maximum annuity of 75% of salary was not changed. In effect, the Act allowed the maximum annuity of 75% of salary to be reached in 30 years, instead of 35 years.

S E C T I O N 6 . P E N S I O N L E G I S L A T I O N
Page 95
92nd General Assembly (2001 – 2002) SERS Alternative Formula Increase (P.A. 92-0014) P.A. 92-0014 (HB 0250) changed the retirement formula for alternative formula employees to 2.5% for each year of service for members coordinated with Social Security and 3.0% for each year of service for non-coordinated members. The Act increased the maximum retirement annuity for alternative formula employees to 80% of final average salary. Addition of Highway Maintenance Workers to the SERS Alternative Formula (P.A 92-0257) P.A 92-0257 added state highway maintenance workers to the alternative formula under SERS. Specifically, the Act included persons employed on a full-time basis by the Illinois Department of Transportation in the position of highway maintainer, highway maintenance lead worker, heavy construction equipment operator, and other job titles. The bill also added several positions within the Illinois State Toll Highway Authority such as equipment operator/laborer, welders, sign makers/hangers, and other job titles. SERS Early Retirement Incentive (Public Act 92-0566) Public Act 92-0566 created the 2002 Early Retirement Incentive for certain SERS and TRS members. The ERI allowed members to purchase up to five years of service credit and age enhancement. Eligible members were then required to leave employment between July 1, 2002 and December 31, 2002. Over 11,000 members took advantage of the ERI, and a majority of the participants were eligible to receive benefits immediately following termination.
93rd General Assembly (2003 – 2004) Pension Obligation Bond (P.A. 93-0002) Public Act 93-0002 amended the General Obligation Bond Act to increase bond authorization by $10 billion. These general obligation bonds were designated as a pension funding series. The State used a portion of the bond proceeds to pay part of the FY 2003 State contribution and all of the FY 2004 State contributions to the retirement systems. Of the $10 billion, $7.3 billion was used to reduce the unfunded liabilities of the State-funded retirement systems. Along with the $10 billion increase in bond authorization, Public Act 93-0002 included a provision requiring State contributions to the retirement systems to be reduced by the amount of the debt service (the amount of principal and interest payments) on the bonds. The legislation set the maximum annual employer contribution to each system at the amount that would have been contributed without the bond issuance, minus the total debt service payments for the fiscal year. Effectively, the reduction in retirement contributions is used to pay the debt service on the bonds. Benefit Enhancement for Downstate Fire Pension Funds (P. A. 93-0689) P.A. 93-0689 implemented the following benefit enhancements for Downstate Fire pension funds:
S E C T I O N 6 . P E N S I O N L E G I S L A T I O N
Page 96
• Increased the surviving spouse annuity from 54% of the deceased firefighter’s final salary to 100% of the deceased firefighter’s annuity.
• Increased the minimum retirement annuity from $1,030 per month to $1,159.27 per month over a four-year period for firefighters with 20 or more years of service.
94th General Assembly (2005 – 2006)
Change in Funding Provisions for State Systems (P.A. 94-0004) Public Act 94-0004 changed the funding plan created in 1994 by Public Act 88-0593. The Act set the State contribution levels for FY 2006 and FY 2007, rather than requiring the State to make contributions based on actuarial calculations contained in the pension funding plan under P.A. 88-0593. In addition, the separate funding of the liability created by the 2002 SERS Early Retirement Incentive was eliminated. The following table provides a comparison of the FY 2006 certified contributions and FY 2007 contributions with the State contributions that were required by Public Act 94-0004. The actual appropriations to the Systems were contained in SB 1548 (P.A. 94-0015).
FY 2006 FY 2007
System PA 88-0593 PA 94-0004 Difference PA 88-0593 PA 94-0004 Difference
TRS $1,058.5 $534.6 $523.9 $1,233.1 $735.5 $497.6SERS 690.3 203.8 486.5 832.0 344.2 487.8SURS 324.9 166.6 158.3 391.9 252.1 139.8JRS 38.0 29.2 8.8 44.5 35.2 9.3
GARS 5.5 4.2 1.3 6.3 5.2 1.1Total $2,117.2 $938.4 $1,178.8 $2,507.8 $1,372.3 $1,135.6
Public Act 88-0593 Contributions vs.Public Act 94-0004 Contributions
(in Millions $)
SERS Alternative Formula Changes (P.A. 94-0004) Prior to the enactment of P.A. 94-0004, all employees of the Department of Corrections were covered by the SERS alternative formula. Public Act 94-0004 provides that for employees entering service after July 1, 2005, only Department of Corrections employees who are headquartered at a correctional facility, parole officers, members of an apprehension unit, members of an intelligence unit, and DOC investigators will be covered by the alternative formula. New employees included in other groups currently covered by the alternative formula will continue to be eligible for the SERS alternative formula. SURS Money Purchase Retirement Option Changes ( P.A. 94-0004) Public Act 94-0004 eliminated the money purchase formula for employees who became members of SURS after July 1, 2005. Beginning in FY 2006, the Act requires the
S E C T I O N 6 . P E N S I O N L E G I S L A T I O N
Page 97
Comptroller (rather than the SURS Board of Trustees) to determine the interest rate to be used when crediting interest to the accounts of current employees. Salary Increase Payments For Teachers and State University Personnel (P.A. 94-0004) Public Act 94-0004 provided a mechanism by which the liability associated with salary increases above a certain level may be shifted to the employer (school districts and universities) providing those salary increases. The Act provides that during the years used to determine final average salary, the employer must pay to TRS or SURS an amount equal to the present value of the increase in benefits resulting from salary increases above 6%. The employer contribution required by Public Act 94-0004 must be paid in a lump sum within 30 days of the receipt of the bill from the retirement system. The Act specifies that the retirement system must calculate the contribution amount using the same actuarial assumptions and tables used for the most recent actuarial valuation. The salary increase payment provision for TRS and SURS contained in Public Act 94-0004 does not apply to salaries paid under contracts or collective bargaining agreements entered into, amended, or renewed before the effective date of the Act (June 1, 2005). Teacher Sick Leave Service Credit (P.A. 94-0004) Prior to the enactment of P.A. 94-0004, members of TRS could establish up to 2 years of service credit for unused and uncompensated sick leave without making contributions. Public Act 94-0004 provides that if days granted by an employer are in excess of the normal annual sick leave allotment, the employer is required to contribute to TRS the normal cost of the benefits associated with this excess sick leave. Retention of “Pipeline” Early Retirement Option in TRS (P.A. 94-0004) An Early Retirement Option for members of TRS was created in 1980 and, prior to 2005, had been extended every 5 years since its inception. (Public Act 91-0017 extended the TRS ERO option until June 30, 2005). If an employee exercised the ERO option (i.e. retires before age 60 with less than 34 years of service) employee and employer contributions were required to avoid discount. The employee contribution was 7% of salary for each year less than age 60 or 35 years of service (whichever is less) and the employer contribution was 20% of salary for each year less than age 60. Public Act 92-0582 removed the employee contribution for members with 34 years of service and Public Act 91-0017 removed the employer contribution requirement for employees who retire with 34 years of service. Public Act 94-0004 allowed TRS members to participate in the “pipeline” ERO if the member retired between June 30, 2005 and July 1, 2007. New Early Retirement Option in TRS (P.A. 94-0004) Public Act 94-0004 creates a new ERO effective July 1, 2005. If an employee exercises the new ERO option (retires before age 60) employee and employer contributions are required to avoid discount. The employee contribution is 11.5% of salary for each year less than age 60 or 35 years of service (whichever is less) and the employer contribution is 23.5% of salary for each year less than age 60. In addition, all active TRS members are required to contribute 0.4% of salary towards the cost of ERO. This contribution would be refunded, without interest, if the member does not utilize the ERO, if the member takes a refund from TRS, if the member dies, or if the ERO is terminated.
S E C T I O N 6 . P E N S I O N L E G I S L A T I O N
Page 98
By June 30, 2012 (and every 5 years thereafter), TRS is required to review the System’s ERO experience to determine if the required contributions adequately fund the ERO. The TRS Board of Trustees must submit the results to the Commission on Government Forecasting and Accountability, who must then recommend to the General Assembly (by February 1, 2013) if the required ERO contributions should be adjusted. If the General Assembly does not adjust the required contributions as recommended, the ERO would be terminated at the end of that fiscal year. Extension of Early Retirement Option for Chicago Teachers (P.A. 94-0004) Public Act 91-0017 extended the Early Retirement Option in the Chicago Teachers’ Pension Fund until June 30, 2005. If an employee exercises that option by retiring before age 60 with less than 34 years of service, employee and employer contributions are required to avoid a reduction in annuity. The employee contribution is 7% of salary for each month less than age 60 or 35 years of service (whichever is less), and the employer contribution is 20% of salary for each year less than age 60. No employee or employer contributions are required for members with 34 years of service. Currently, each employer has the authority to determine whether it should provide an ERO for its employees. Public Act 94-0004 extends the ERO option to June 30, 2010. The Act also specifies that the employer may not limit the number of ERO participants to less than 200 (rather than 30% of eligible members). The Act also allows the employer and collective bargaining agent to agree to set the limit higher than 200, and to base the allocation for participation on a basis other than seniority. Application of New Benefits (P.A. 94-0004) Public Act 94-0004 requires every new benefit increase to identify and provide for additional funding at least sufficient to fund the resulting annual increase in cost as it accrues to the System. Unless the funding inadequacy is corrected by the General Assembly, the benefit increase would expire at the end of the fiscal year. In addition, Public Act 94-0004 provides that all benefit increases will expire 5 years after the effective date of the increase, unless an earlier date is specified in the legislation that provides the benefit increase. This provision does not apply to the Chicago Teachers’ Pension Fund. Exemptions to 6% End-of-Career Salary Increase Cap (P.A. 94-1057) P.A. 94-1057 amended both the Downstate Teachers’ and State Universities’ Articles of the Pension Code to exempt the employer (the university or the school district) from paying the increased contribution associated with certain salary increases above 6% granted during the employee’s final average salary period. The Act applies to specifically enumerated salary increases granted between June 1, 2005 and July 1, 2011 as follows:
• Salary increases paid to teachers or university employees who are ten or more years away from retirement.
• Salary increases that result when a teacher is transferred from one employer to another as a result of school consolidation.
• Salary increases paid to teachers or university employees that are earned as a result of summer school or overload work. (Overload work must be for the sole purpose
S E C T I O N 6 . P E N S I O N L E G I S L A T I O N
Page 99
of academic instruction in excess of the standard number of instruction hours, and the overload pay must be necessary for the educational mission).
• Salary increases due to promotion for which a teacher is required to hold a certificate or supervisory endorsement issued by the State Teacher Certification Board. The certification must be different than what was required for the teacher’s previous position, and the position must have existed and been filled by a member for no less than one complete academic year.
• Salary increase due to promotion for which a university employee moves to a higher classification under the State Universities Civil Service System, promotion to a tenure-track faculty position, or promotion to a position recommended on a promotional list created by the Illinois Community College Board.
• Payments to a teacher from the State Board of Education or the State of Illinois over which the school district does not have discretion.
• Salary increases granted to teachers or university employees under the aforementioned conditions after July 1, 2011, but before July 1, 2014, pursuant to a contract or collective bargaining agreement entered into on or after June 1, 2005, but before July 1, 2011.
P.A. 94-1057 also requires both SURS and TRS to file a report with the Governor and General Assembly by January 1, 2007 outlining the number of recalculations performed by school districts or universities, the dollar amount by which each school district or university’s contribution was changed due to the recalculation, and the total amount received from each school district or university as a result of P.A. 94-0004. The Act also requires both SURS and TRS to provide an estimate of the increase in state contributions resulting from the aforementioned end-of-career salary increase exemptions.
CTA Pension Funding Requirements (P.A. 94-0839) P.A. 94-0839 stipulates that, beginning January 1, 2009, the Chicago Transit Authority must make annual contributions to the CTA Pension Fund in order to bring the system’s funded ratio to 90% by Fiscal Year 2058. The Act specifies that contributions will be made as a level percentage of payroll over the years remaining to and including FY 2058. The CTA must then make annual contributions in FY 2059 and thereafter at an amount necessary to maintain a 90% funded ratio.
Separation of CTA Pension Fund Retiree Healthcare and Pension Liabilities (P.A. 94-0839) P.A. 94-0839 requires that pension contributions by the CTA shall not take into account liabilities relating to retiree health care benefits. The Act mandates that the CTA must separate pension funding from retiree healthcare funding by January 1, 2009.
Pension Funding Requirements for Regional Transportation Authority, Metra, and Pace Pension Funds (P.A. 94-0839) P.A. 94-0839 stipulates that the RTA, Metra, and Pace shall have a general duty to make timely contributions to their respective defined benefit pension plans in accordance with the terms of each plan. If any of the aforementioned funds falls below a 90% funded ratio, the employer will be required to contribute at an amount sufficient to bring the funded
S E C T I O N 6 . P E N S I O N L E G I S L A T I O N
Page 100
ratio up to 90% in accordance with an amortization schedule adopted jointly by the employer and the trustee of the pension fund. The amortization schedule may extend for up to 50 years. P.A. 94-0839 further states that if any of the aforementioned employer-sponsored defined benefit plans reaches a 90% funded level, the employer and the trustee of the fund may cancel the amortization schedule and instead make annual contributions sufficient to maintain a 90% funded ratio. RTA Oversight of CTA Pension Funding (P.A. 94-0839) P.A. 94-0839 requires the Regional Transportation Authority to continually review the status of the CTA’s pension contributions. If the RTA determines that the CTA is more than one month overdue in making a pension contribution in accordance with its funding plan, the RTA will be required to pay the amount of the overdue contribution to the CTA pension fund out of state funds otherwise payable to the CTA. Formula Increase for IMRF SLEP Employees (P.A. 94-0712) Prior to the enactment of P.A. 94-0712, the IMRF Sheriff’s Law Enforcement Personnel retirement formula provided an annuity of 2.5% of final earnings for the first 20 years of service, plus 2% of final earnings for the next 10 years of service, plus 1% of final earnings for each year in excess of 30, up to a maximum annuity of 75% of final earnings. The Act changed the SLEP formula for members retiring after July 1, 2004, to 2.5% of final earnings for each year of service and increases the maximum annuity to 80% of final earnings. 95th General Assembly (2007 – 2008) CTA Pension Fund Management Structure (P.A. 95-0708) Prior to the enactment of P.A. 95-0708, the committee responsible for the governance and administration of the CTA Pension Fund was known as the Retirement Allowance Committee. The Act abolished this committee and replaced it with an 11 member Board of Trustees. Five members shall be appointed by the Chicago Transit Board; three members shall be appointed by the labor organization representing the highest number of CTA participants; one member shall be appointed by the labor organization representing the second-largest number of CTA participants, and one member shall be appointed by the employees not represented by a labor organization representing the highest or second-highest number of CTA participants. The final member shall be a professional fiduciary who is an expert in pension plan collective bargaining, and shall be selected by the Regional Transportation Authority Board of Directors. CTA Pension Fund Investment Authority (P.A. 95-0708) P.A. 95-0708 stipulates that the Board of Trustees may cause retirement plan funds to be invested in any type of investment permitted for the investment of moneys held by any of the State pension or retirement systems, any unit of local government or school district, or any agency or instrumentality thereof. The Act states that the board may, by a vote of at least two-thirds of the trustees, place retirement plan funds under the investment management of the Illinois State Board of Investment. CTA Pension Fund Benefit Eligibility (P.A. 95-0708) All individuals who were participants in the CTA Pension Fund prior to the effective date of the Act (Jan. 18, 2008) shall automatically be members of the new retirement fund, and shall continue receiving the same benefits. For all CTA employees hired on or after the
S E C T I O N 6 . P E N S I O N L E G I S L A T I O N
Page 101
effective date, the following conditions with respect to retirement shall be applicable: full retirement benefits at age 64 with 25 years of continuous service, or a reduced retirement benefit at age 55 with 10 years of continuous service. Pension Contribution Rates for CTA Employees (P.A. 95-0708) Beginning January 18, 2008, all participating employees shall contribute 6% of compensation, and the CTA shall contribute 12% of compensation to the Plan. For the period ending December 31, 2040, the amount of debt service on any pension obligation bonds will be treated as a credit against the CTA contribution to the Plan, up to a limit of 6% of compensation. Contribution Increases to CTA Pension Fund (P.A. 95-0708) P.A. 95-0708 makes the following contribution changes: if the funded ratio of the CTA pension fund is projected to fall below 60% for any year before 2040, the Board of Trustees will calculate as a level percentage of payroll the amount of increased contributions necessary to eliminate the shortfall within 10 years. These additional contributions will be required for each year prior to 2040 with one-third of the increase coming from increased employee contributions and two-thirds coming from increased employer contributions, in excess of normal contribution rates. For the period beginning 2040, the minimum contribution to the retirement Plan for each fiscal year shall be an amount sufficient to increase the funded ratio to 90% by the end of 2059. Participating employees will be responsible for one-third of the required additional contribution and the CTA will be responsible for two-thirds of the required additional contribution. Beginning in 2060, the required total contributions will be the amount necessary to keep the funded ratio at 90% each year, and the contribution shall be funded two-thirds by the CTA and one-third by the participating employees. Creation of Health Care Trust for CTA Employees (P.A. 95-0708) P.A. 95-0708 provides the CTA shall take all lawful actions necessary to separate the funding of retiree health benefits from the funding for the pension plan no later than July 1, 2009. A Retiree Health Care Trust shall be established 90 days after the effective date for the purpose of providing retirement health care benefits. The Act also states that the Retiree Health Care Trust shall assume sole responsibility for providing health care benefits to eligible retirees and their dependants and survivors no later than July 1, 2009. CTA Health Care Trust Board of Trustees (P.A. 95-0708) The Trust shall be governed and administered by a Board of Trustees consisting of 7 members. Three members shall be appointed by the Chicago Transit Board; one member shall be appointed by the labor organization representing the highest number of CTA participants; one member shall be appointed by the labor organization representing the second-largest number of CTA participants; and one member shall be appointed by the employees not represented by a labor organization representing the highest or second-highest number of CTA participants. The final member shall be a professional fiduciary who has experience in collectively bargained employee pension health plans, and shall be selected by the Regional Transportation Authority Board of Directors. The Act stipulates that the health care trust will not offer any health insurance plan which provides for more than 90% coverage for in-network services or 70% coverage for out-of-network services after any deductible has been paid.

S E C T I O N 6 . P E N S I O N L E G I S L A T I O N
Page 102
CTA Health Care Trust - Contributions and Investment Authority (P.A. 95-0708) Contributions into the Trust will come from employee contributions totaling no less than 3% of compensation. The Board of Trustees will also have the discretion to require contributions from retirees, dependants and survivors based upon their years of service, levels of coverage or Medicare eligibility, provided that the total of these contributions do not exceed 45% of the total benefit costs. Funds in the Trust may be invested in the manner described above for other retirement plan moneys. In order to be eligible for retiree health care benefits, the retiree must be at least 55 years of age, retire with 10 or more years of service, and satisfy any other rules that the board may establish.

S E C T I O N 6 . P E N S I O N L E G I S L A T I O N
Page 103
Pension Bond Issuance for CTA Pension Plan (P.A. 95-0708) The CTA is authorized to issue $1.3 billion in new bonds for the pension system. After payment of the costs of issuance and necessary deposits related to debt service, the net proceeds of approximately $1.1 billion will go only into the Retirement Plan for Chicago Transit Authority Employees. In addition, the CTA is authorized to issue $639.7 million in new bonds for healthcare funding. After payment of the costs of issuance and necessary deposits related to debt service, the bond sale net proceeds of approximately $528.8 million will go only into the Retiree Health Care Trust. 96th General Assembly (2009 – 2010) Issuance of Pension Obligation Notes (P.A. 96-0043) P.A. 96-0043 mandates the issuance of new pension bonds totaling $3.466 billion. The bond sale proceeds, net of sales expenses, will be used as a portion of the FY 2010 State contributions to the various State pension systems. Specifically, the Act establishes the FY 2010 State pension contributions as follows: (1) TRS - $2,089,268,000, (2) SERS - $723,703,100, (3) SURS - $702,514,000, (4) JRS - $78,832,000, (5) GARS - $10,454,000. The FY 2010 total inflows into each of the 5 systems from all sources will be equal to the GRF portion of the certified amounts for each system. P.A. 96-0043 also establishes that as of June 30, 2008, the actuarial value of each system’s assets will be equal to their market value. In determining the actuarial value of the systems’ assets for fiscal years after June 30, 2008, any unexpected gains or losses from investment returns incurred in a fiscal year will be recognized in equal annual amounts over the 5 year period following that fiscal year. An unexpected gain or loss will be defined as any deviation from the forecasted 8.0% - 8.5% return on invested assets. P.A. 96-0043 contains a statement of legislative intent that all of the operating funds freed up by the bond sale should be used to fund programs and services provided by community-based human services providers to ensure the State continues assisting the most vulnerable citizens. Calculation of Final Average Salary for Annuity Purposes - General Assembly Retirement System (P.A. 96-0207) P.A. 96-0207 provides that for participants who become a member of GARS on or after August 10th, 2009 (the effective date of the Act), retirement annuities will be based on the 48 consecutive months of service within the last 120 months of service in which the total compensation was the highest, or by dividing the total period of service, if less than 48 months, by the number of months of service in that period. Calculation of Final Average Salary for Annuity Purposes - Judges Retirement System (P.A. 96-0207) P.A. 96-0207 provides that for participants who become members of JRS on or after August 10th, 2009 (the effective date of the Act), retirement annuities will be calculated by dividing the total salary of the participant during the period of the 48 consecutive months
S E C T I O N 6 . P E N S I O N L E G I S L A T I O N
Page 104
of service within the last 120 months of service in which the total compensation was the highest, or the total period of service, if less than 48 months, by the number of months of service in that period. Illinois Governmental Ethics Act (P.A. 96-0006) Currently, elected officials and members of certain boards and commissions are required to file verified written statements of economic interests. Public Act 096-0006 amends the Illinois Governmental Ethics Act to add that members of the board of any retirement system, pension fund or investment board established under the Illinois Pension Code will be required to file verified written statements of economic interests only if they are not already required to file such a statement. Creation of Investment Working Group (P.A. 96-0006) Public Act 096-0006 amends the State Treasurer Act to add a new Section titled, “working group; peer cost comparison.” The Treasurer shall convene a working group consisting of representatives from the retirement systems, pension funds, and investment board created under the Illinois Pension Code, persons that provide investment services, and members of the financial industry. The working group shall review the performance of investment managers and consultants providing investment services for the retirement systems, pension funds, and investment board created under the Illinois Pension Code. The group shall develop uniform standards for comparing the costs of investment services and make recommendations to the retirement systems, pension funds, and investment board. The working group shall draft a report, and the Treasurer must submit such report, to the Governor and the General Assembly by January 1, 2011. Expansion of Fiduciary Duties (P.A. 96-0006) Currently, the Illinois Pension Code defines a fiduciary as someone who exercises discretionary authority or discretionary control respecting management of the pension fund or retirement system. Those who render investment advice for a fee or other compensation are acting in a fiduciary capacity pursuant to current law. Public Act 096-0006 amends the Illinois Pension Code to stipulate that rendering advice with respect to the selection of fiduciaries in and of itself constitutes a fiduciary duty. Requirements for Consultants (P.A. 96-0006) Public Act 096-0006 amends the Illinois Pension Code to add a new Section concerning consultants. The new Section states that “consultant” means any person or entity retained or employed by the board of a retirement system, pension fund, or investment board to make recommendations in developing an investment strategy, assist with finding appropriate investment advisers, or monitoring the board’s investments. Reporting Requirements for Emerging Investment Managers (P.A. 96-0006) Public Act 096-0006 requires that each retirement system, pension fund, and investment board, except for Downstate Police and Downstate Fire pension funds, shall submit a report to the Governor and the General Assembly by January 1 of each year. The report shall include all of the adopted policies, including the names and addresses of the emerging investment managers used, percentage of the assets under the investment control of emerging investment managers, the actions it has undertaken to increase the use of emerging investment managers, including encouraging other investment managers to use

S E C T I O N 6 . P E N S I O N L E G I S L A T I O N
Page 105
emerging investment managers as subcontractors when the opportunity arises, and also including specific actions undertaken to increase the use of minority broker-dealers. Prohibited Transactions (P.A. 96-0006) Public Act 096-0006 amends the Pension Code to require that a board member, employee, or consultant with respect to a retirement system, pension fund, or investment board shall not knowingly cause or advise the system, fund, or board to engage in an investment transaction with an investment adviser when the board member, employee, consultant, or their spouse (i) has any direct interest in the income, gains, or profits of the investment adviser through which the investment transaction is made or (ii) has a relationship with that investment adviser that would result in a pecuniary benefit to the board member, employee, consultant, or spouse of such board member, employee, or consultant as a result of the investment transaction. Public Act 096-0006 clarifies that a consultant includes an employee or agent of a consulting firm who has greater than 7.5% ownership of the consulting firm. Any violation of this provision constitutes a Class 4 felony. Investment Advisers and Investment Services for Downstate Police and Downstate Fire Pension Funds (P.A. 96-0006) P.A. 96-0006 modifies the requirements for the procurement of investment advisors and investment services for Downstate Police and Fire pension funds. The Act requires that investment advisers shall be a fiduciary with respect to the pension fund and shall be one of the following:
(1) an investment adviser registered under the federal Investment Advisers Act of 1940 and the Illinois Securities Law of 1953;
(2) a bank or trust company authorized to conduct a trust business in Illinois; (3) a life insurance company authorized to transact business in Illinois; or (4) an investment company as defined and registered under the federal Investment
Company Act of 1940 and registered under the Illinois Securities Law of 1953. Selection and Appointment of Investment Advisors and Consultants (P.A. 96-0006) Public Act 096-0006 creates a new section in the Pension Code concerning investment services for all retirement systems, pension funds, and investment boards, except Downstate Police and Fire pension funds. Pursuant to this new Section, all contracts for investment services shall be awarded by the board using a competitive process that is substantially similar to the process required for the procurement of professional and artistic services under Article 35 of the Illinois Procurement Code. The Act states that each board of trustees shall implement this policy by June 2, 2009. Limitations on Investment Consulting Contracts (P.A. 96-0006) Public Act 096-0006 states that notwithstanding any other provision of law, a retirement system, pension fund, or investment board shall not enter into a contract with a consultant that exceeds 5 years in duration. The Act provides that no contract to provide consulting services may be renewed or extended. At the end of the term of a contract, however, the consultant is eligible to compete for a new contract. No retirement system, pension fund, or investment board shall attempt to avoid or contravene these restrictions by any means.
S E C T I O N 6 . P E N S I O N L E G I S L A T I O N
Page 106
Disclosure of Fees and Commissions by Consultants (P.A. 96-0006) P.A. 96-0006 provides that by June 2, 2009, each investment adviser or consultant currently providing services or subject to an existing contract for the provision of services must disclose to the board of trustees all direct and indirect fees, commissions, penalties, and other compensation paid by or on behalf of the investment adviser or consultant in connection with the provision of those services and shall update that disclosure promptly after a modification of those payments or an additional payment. Investment Transparency (P.A. 96-0006) Public Act 096-0006 amends the Illinois Pension Code to create an additional section concerning investment transparency. The purpose of this new section is to provide for transparency in the investment of retirement or pension fund assets and require the reporting of full and complete information regarding investments by pension funds, retirement systems, and investment boards. A retirement system, pension fund, or investment board subject to the Pension Code and any committees established by such system, fund, or board must comply with the Open Meetings Act. Ethics Training (P.A. 96-0006) Public Act 096-0006 amends the Illinois Pension Code to create a new Section concerning ethics training. All board members of a retirement system, pension fund, or investment board created under this Code must attend ethics training of at least 8 hours per year. The training shall incorporate the following areas: ethics, fiduciary duty, and investment issues and any other curriculum that the board of the retirement system, pension fund, or investment board establishes as being important. Prohibition on Gifts (P.A. 96-0006) Public Act 096-0006 amends the Illinois Pension Code to clarify that no trustee or employee of a retirement system, pension fund, or investment board created under the Illinois Pension Code shall intentionally solicit or accept any gift from any prohibited source. No Monetary Gain on Investments (P.A. 96-0006) Public Act 096-0006 amends the Illinois Pension Code to create a new section stating that no member or employee of the board of trustees of any retirement system, pension fund, or investment board or any spouse of such member or employee shall knowingly have any direct interest in the income, gains, or profits of any investments made on behalf of a retirement system, pension fund, or investment board for which such person is a member or employee, nor receive any pay or emolument for services in connection with any investment. Fraud (P.A. 96-0006) Public Act 096-0006 amends the Illinois Pension Code to create a new Section concerning fraud. Any person who knowingly makes any false statement or falsifies or permits to be falsified any record of a retirement system or pension fund created under this Code or the Illinois State Board of Investment in an attempt to defraud the retirement system, pension fund, or the Illinois State Board of Investment is guilty of a Class 3 felony.
S E C T I O N 6 . P E N S I O N L E G I S L A T I O N
Page 107
Contingent and Placement Fees Prohibited (P.A. 96-0006) Public Act 096-0006 amends the Illinois Pension Code to create a new section concerning the prohibiting of contingent and placement fees. No person or entity shall retain a person or entity to attempt to influence the outcome of an investment decision of or the procurement of investment advice or services of a retirement system, pension fund, or investment board for compensation, contingent in whole or in part upon the decision or procurement. Any person who violates this provision is guilty of a business offense and shall be fined not more than $10,000. In addition, any person convicted of a violation of this provision is prohibited for a period of 3 years from conducting such activities. Approval of Travel or Educational Mission (P.A. 96-0006) Public Act 096-0006 creates a new Section concerning travel and educational missions. The expenses for travel or educational missions of a board member of a retirement system, pension fund, or investment board must be approved by a majority of the board prior to the travel or educational mission. Changes to SERS Board of Directors (P.A. 96-0006) Public Act 96-0006 states that notwithstanding any provision of current law, the term of office of each trustee of the board appointed by the Governor who is sitting on the board is terminated on that effective date of the Act (April 3rd, 2009). Beginning on the 90th day after the effective date of this Act (July 2, 2009), the board shall consist of 13 trustees as follows:
(i) the Comptroller, who shall be the Chairperson; (ii) six persons appointed by the Governor with the advice and consent of the
Senate who may not be members of the system or hold an elective State office and who shall serve for a term of 5 years, except that the terms of the initial appointees under this Act shall be 3 for a term of 3 years and 3 for a term of 5 years;
(iii) four active participants of the system having at least 8 years of creditable service, to be elected from the contributing members of the system;
(iv) two annuitants of the system who have been annuitants for at least one full year, to be elected from and by the annuitants of the system.
Changes to SURS Board of Trustees (P.A. 96-0006) Public Act 096-0006 amends the Illinois Pension Code to add that the terms of all trustees holding office on the effective date of this Act (April 3, 2009) shall terminate on that effective date. The Governor shall make nominations for appointment within 60 days after the effective date of this Act (June 2, 2009). A trustee sitting on the board on April 3, 2009 may not hold over in office for more than 90 days after that effective date. In addition to this, Public Act 096-0006 states that beginning on the 90th day after the effective date of this Act (July 2, 2009), the Board of Trustees shall be constituted as follows:
(i) The Chairperson of the board of Higher Education, who shall act as chairperson of thes Board.
(ii) Four trustees appointed by the Governor with the advice and consent of the Senate who may not be members of the system or hold an elective State office

S E C T I O N 6 . P E N S I O N L E G I S L A T I O N
Page 108
and who shall serve for a term of 6 years, except that the terms of the initial appointees shall be 2 for a term of 3 years and 2 for a term of 6 years.
(iii) Four active participants of the system to be elected from the contributing membership of the system by the contributing members, no more than 2 of which may be from any of the University of Illinois campuses, who shall serve for a term of 6 years, except that the terms of the initial electees shall be 2 for a term of 3 years and 2 for a term of 6 years.
(iv) Two annuitants of the system who have been annuitants for at least one full year, to be elected from and by the annuitants of the system, no more than one of which may be from any of the University of Illinois campuses, who shall serve for a term of 6 years, except that the terms of the initial electees shall be 1 for a term of 3 years and 1 for a term of 6 years.
Termination of TRS Executive Director (P.A. 96-0006) Public Act 096-0006 amends the Illinois Pension Code to add that the secretary and chief executive officer of the Teachers’ Retirement System, known as the Executive Director, holding that position on April 1, 2009 is terminated on July 1, 2009, by operation of law, and shall thereafter no longer hold that position or any other employment with the system. The board is directed to take whatever action is necessary to effectuate this termination. Changes to the TRS Board of Trustees (P.A. 96-0006) Public Act 096-0006 amends the Pension Code to change the composition of the TRS board of trustees. The board shall consist of 13 members, 6 of whom shall be appointed by the governor; 4 active teachers elected by the contributing members, and 2 annuitant members elected by the annuitants of the system. The Superintendent of Education is an ex-officio member who serves as president of the board.
SECTION 7. STATE FUNDED RETIREMENT SYSTEMS
Unfunded Liabilities All State Retirement Systems Combined Teachers’ Retirement System (TRS) State Universities Retirement System (SURS) State Employee’s Retirement System (SERS) General Assembly Retirement System Judges’ Retirement System

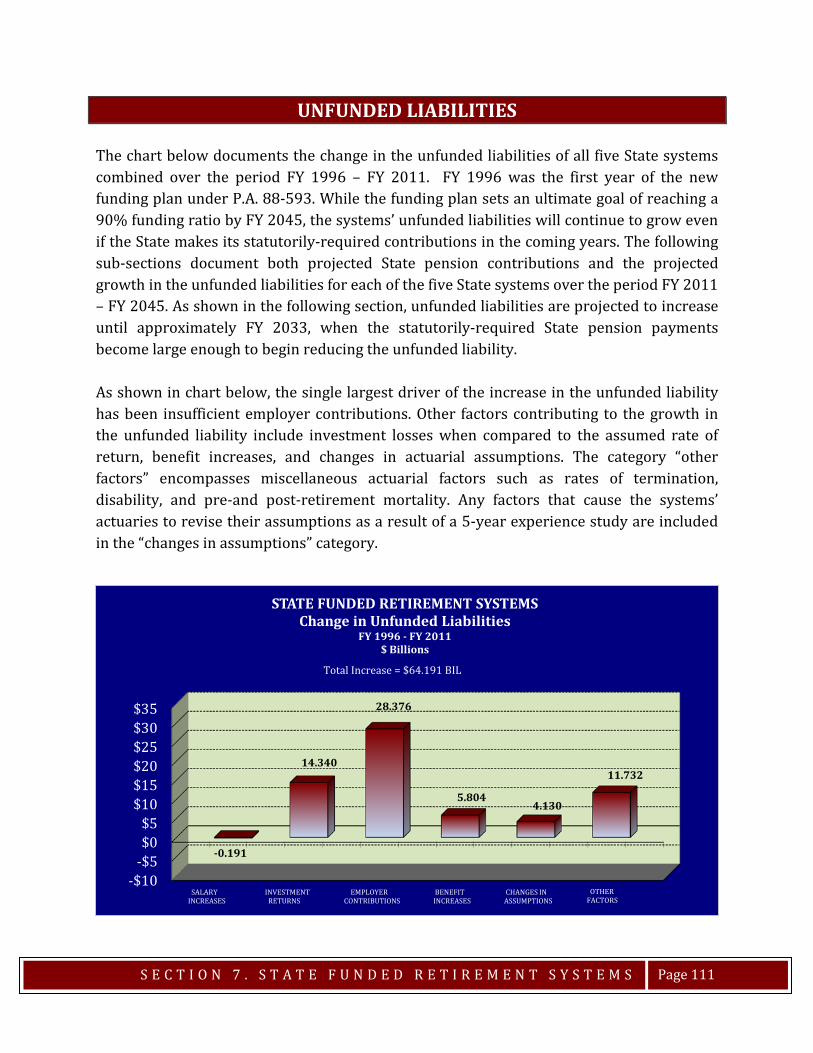
S E C T I O N 7 . S T A T E F U N D E D R E T I R E M E N T S Y S T E M S
Page 111
UNFUNDED LIABILITIES The chart below documents the change in the unfunded liabilities of all five State systems combined over the period FY 1996 – FY 2011. FY 1996 was the first year of the new funding plan under P.A. 88-593. While the funding plan sets an ultimate goal of reaching a 90% funding ratio by FY 2045, the systems’ unfunded liabilities will continue to grow even if the State makes its statutorily-required contributions in the coming years. The following sub-sections document both projected State pension contributions and the projected growth in the unfunded liabilities for each of the five State systems over the period FY 2011 – FY 2045. As shown in the following section, unfunded liabilities are projected to increase until approximately FY 2033, when the statutorily-required State pension payments become large enough to begin reducing the unfunded liability. As shown in chart below, the single largest driver of the increase in the unfunded liability has been insufficient employer contributions. Other factors contributing to the growth in the unfunded liability include investment losses when compared to the assumed rate of return, benefit increases, and changes in actuarial assumptions. The category “other factors” encompasses miscellaneous actuarial factors such as rates of termination, disability, and pre-and post-retirement mortality. Any factors that cause the systems’ actuaries to revise their assumptions as a result of a 5-year experience study are included in the “changes in assumptions” category.
-$10-$5$0$5
$10$15$20$25$30$35
-0.191
14.340
28.376
5.8044.130
11.732
STATE FUNDED RETIREMENT SYSTEMSChange in Unfunded Liabilities
FY 1996 - FY 2011$ Billions
Total Increase = $64.191 BIL
SALARYINCREASES
INVESTMENTRETURNS
EMPLOYERCONTRIBUTIONS
BENEFITINCREASES
CHANGES INASSUMPTIONS
OTHERFACTORS

ALL STATE RETIREMENT SYSTEMS COMBINED
Total Payout 115 Total State Contribution 115 State Contribution FY 2013 – FY 2017 116 State Contribution as a % of Payroll 116 Employee Contribution 117 Funded Ratio 117 Assets 118 Actuarial Liability 118 Unfunded Liability 119

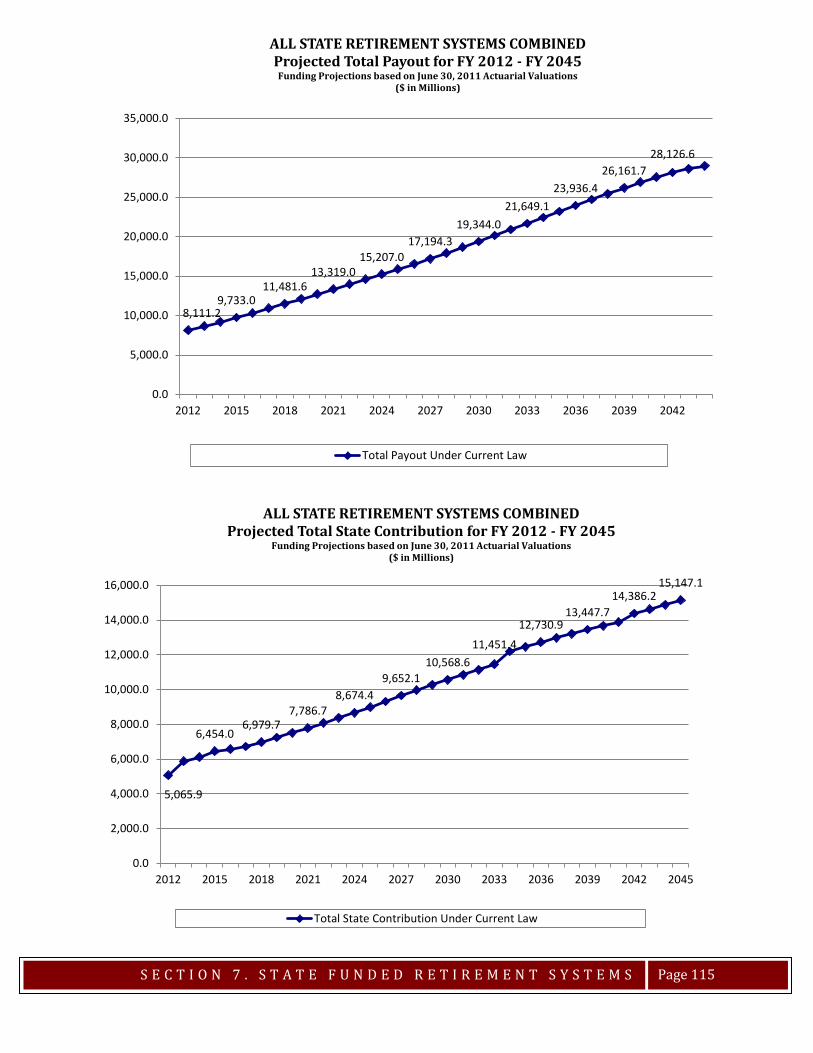
S E C T I O N 7 . S T A T E F U N D E D R E T I R E M E N T S Y S T E M S
Page 115
5,065.9
6,454.06,979.7
7,786.78,674.4
9,652.110,568.6
11,451.412,730.9
13,447.714,386.2
15,147.1
0.0
2,000.0
4,000.0
6,000.0
8,000.0
10,000.0
12,000.0
14,000.0
16,000.0
2012 2015 2018 2021 2024 2027 2030 2033 2036 2039 2042 2045
ALL STATE RETIREMENT SYSTEMS COMBINEDProjected Total State Contribution for FY 2012 - FY 2045
Funding Projections based on June 30, 2011 Actuarial Valuations($ in Millions)
Total State Contribution Under Current Law
8,111.29,733.0
11,481.613,319.0
15,207.017,194.3
19,344.021,649.1
23,936.426,161.7
28,126.6
0.0
5,000.0
10,000.0
15,000.0
20,000.0
25,000.0
30,000.0
35,000.0
2012 2015 2018 2021 2024 2027 2030 2033 2036 2039 2042
ALL STATE RETIREMENT SYSTEMS COMBINEDProjected Total Payout for FY 2012 - FY 2045Funding Projections based on June 30, 2011 Actuarial Valuations
($ in Millions)
Total Payout Under Current Law
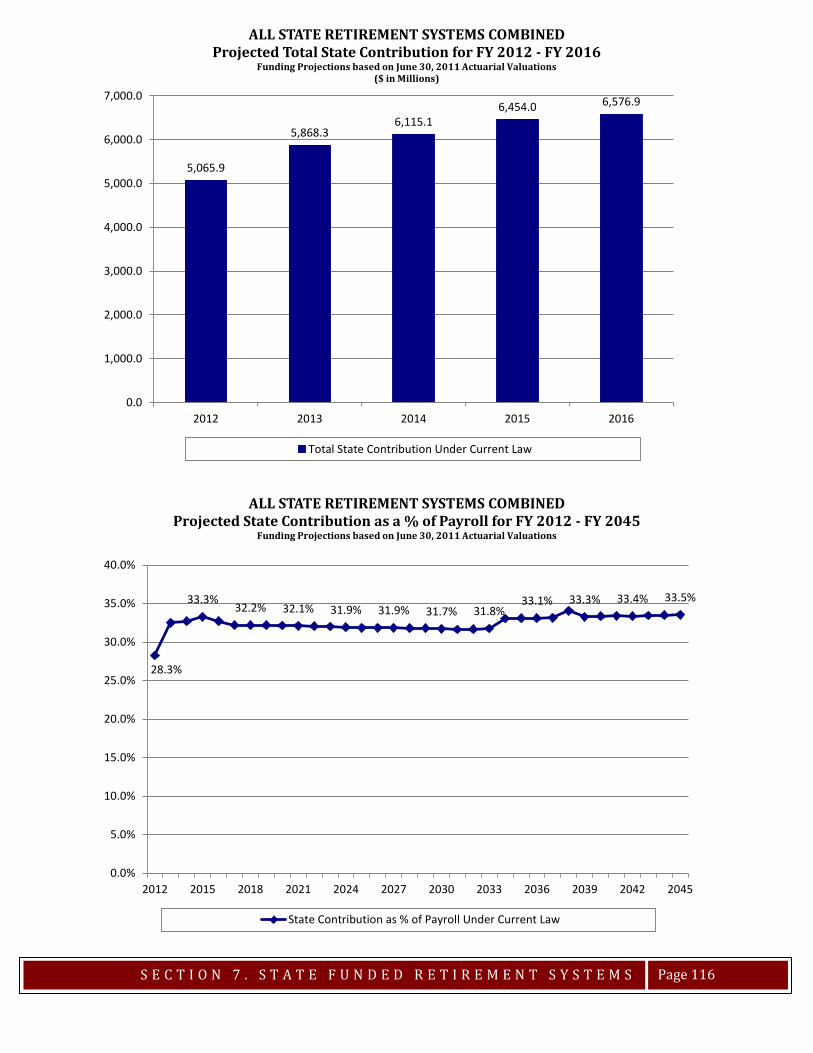
S E C T I O N 7 . S T A T E F U N D E D R E T I R E M E N T S Y S T E M S
Page 116
28.3%
33.3%32.2% 32.1% 31.9% 31.9% 31.7% 31.8%
33.1% 33.3% 33.4% 33.5%
0.0%
5.0%
10.0%
15.0%
20.0%
25.0%
30.0%
35.0%
40.0%
2012 2015 2018 2021 2024 2027 2030 2033 2036 2039 2042 2045
ALL STATE RETIREMENT SYSTEMS COMBINEDProjected State Contribution as a % of Payroll for FY 2012 - FY 2045
Funding Projections based on June 30, 2011 Actuarial Valuations
State Contribution as % of Payroll Under Current Law
5,065.9
5,868.36,115.1
6,454.0 6,576.9
0.0
1,000.0
2,000.0
3,000.0
4,000.0
5,000.0
6,000.0
7,000.0
2012 2013 2014 2015 2016
ALL STATE RETIREMENT SYSTEMS COMBINEDProjected Total State Contribution for FY 2012 - FY 2016
Funding Projections based on June 30, 2011 Actuarial Valuations($ in Millions)
Total State Contribution Under Current Law
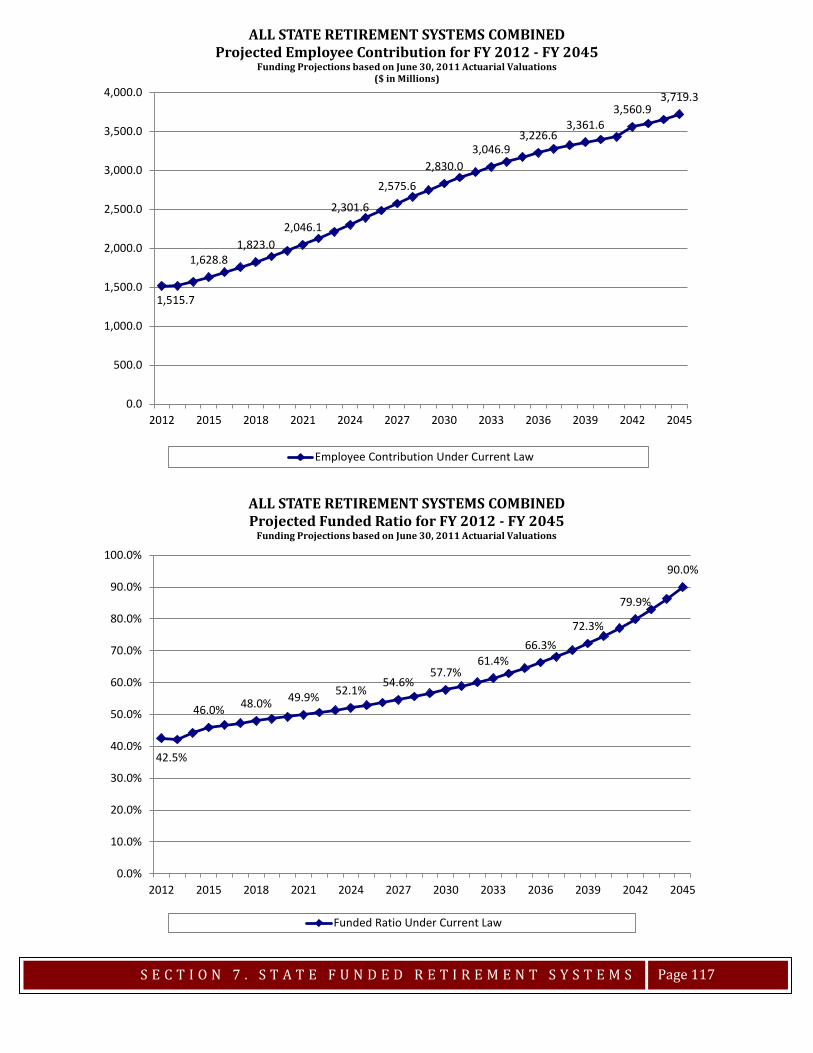
S E C T I O N 7 . S T A T E F U N D E D R E T I R E M E N T S Y S T E M S
Page 117
1,515.7
1,628.81,823.0
2,046.1
2,301.6
2,575.6
2,830.03,046.9
3,226.63,361.6
3,560.93,719.3
0.0
500.0
1,000.0
1,500.0
2,000.0
2,500.0
3,000.0
3,500.0
4,000.0
2012 2015 2018 2021 2024 2027 2030 2033 2036 2039 2042 2045
ALL STATE RETIREMENT SYSTEMS COMBINEDProjected Employee Contribution for FY 2012 - FY 2045
Funding Projections based on June 30, 2011 Actuarial Valuations($ in Millions)
Employee Contribution Under Current Law
42.5%
46.0% 48.0% 49.9% 52.1%54.6%
57.7%61.4%
66.3%72.3%
79.9%
90.0%
0.0%
10.0%
20.0%
30.0%
40.0%
50.0%
60.0%
70.0%
80.0%
90.0%
100.0%
2012 2015 2018 2021 2024 2027 2030 2033 2036 2039 2042 2045
ALL STATE RETIREMENT SYSTEMS COMBINEDProjected Funded Ratio for FY 2012 - FY 2045
Funding Projections based on June 30, 2011 Actuarial Valuations
Funded Ratio Under Current Law
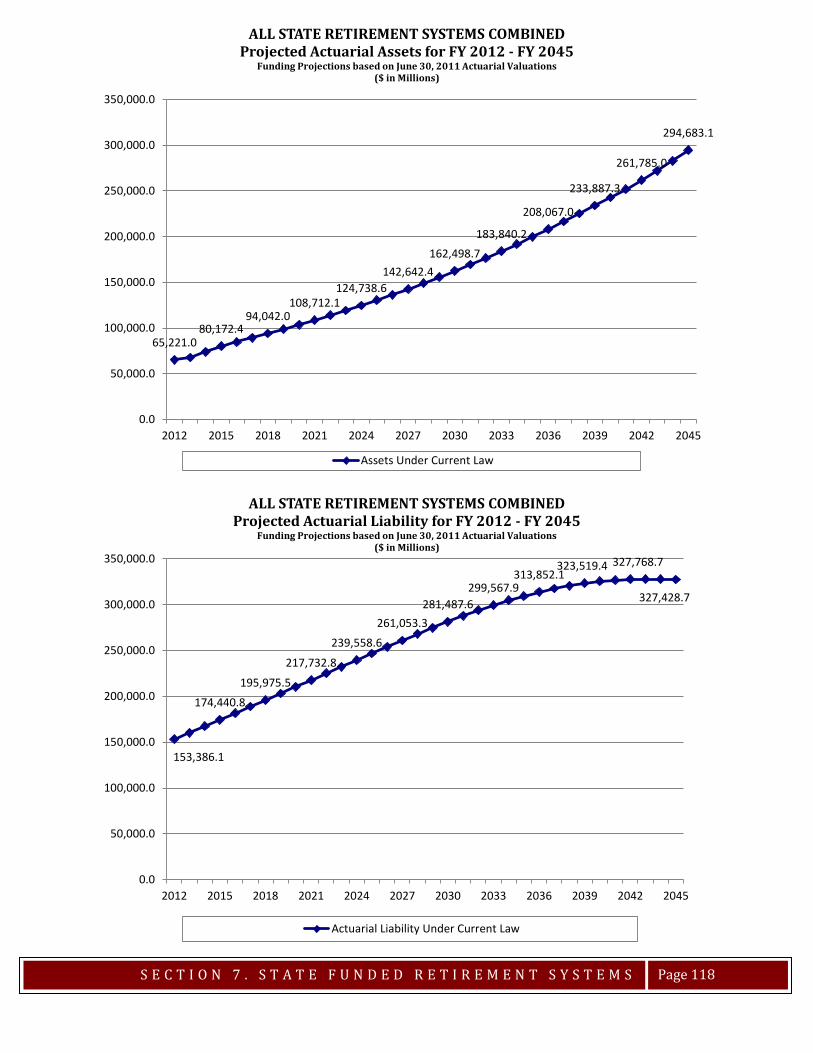
S E C T I O N 7 . S T A T E F U N D E D R E T I R E M E N T S Y S T E M S
Page 118
65,221.080,172.4
94,042.0108,712.1
124,738.6142,642.4
162,498.7183,840.2
208,067.0
233,887.3
261,785.0
294,683.1
0.0
50,000.0
100,000.0
150,000.0
200,000.0
250,000.0
300,000.0
350,000.0
2012 2015 2018 2021 2024 2027 2030 2033 2036 2039 2042 2045
ALL STATE RETIREMENT SYSTEMS COMBINEDProjected Actuarial Assets for FY 2012 - FY 2045
Funding Projections based on June 30, 2011 Actuarial Valuations($ in Millions)
Assets Under Current Law
153,386.1
174,440.8195,975.5
217,732.8
239,558.6261,053.3
281,487.6299,567.9
313,852.1323,519.4 327,768.7
327,428.7
0.0
50,000.0
100,000.0
150,000.0
200,000.0
250,000.0
300,000.0
350,000.0
2012 2015 2018 2021 2024 2027 2030 2033 2036 2039 2042 2045
ALL STATE RETIREMENT SYSTEMS COMBINEDProjected Actuarial Liability for FY 2012 - FY 2045
Funding Projections based on June 30, 2011 Actuarial Valuations($ in Millions)
Actuarial Liability Under Current Law
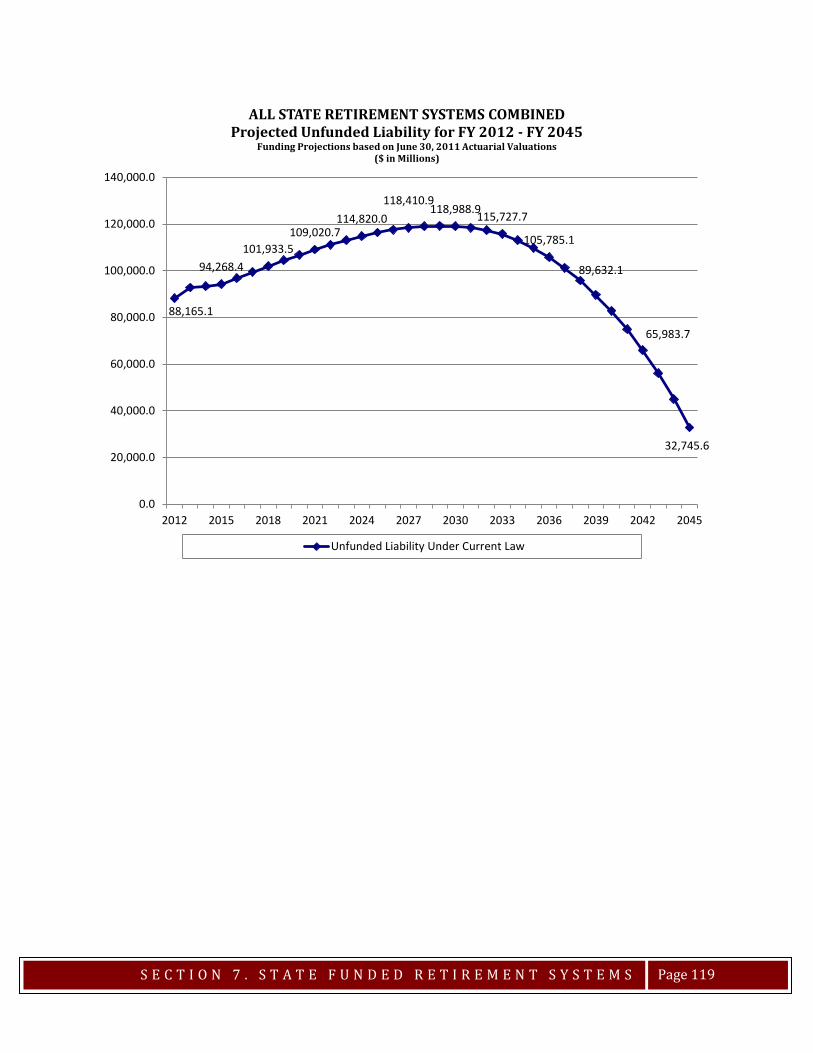
S E C T I O N 7 . S T A T E F U N D E D R E T I R E M E N T S Y S T E M S
Page 119
88,165.1
94,268.4101,933.5
109,020.7114,820.0
118,410.9118,988.9115,727.7
105,785.1
89,632.1
65,983.7
32,745.6
0.0
20,000.0
40,000.0
60,000.0
80,000.0
100,000.0
120,000.0
140,000.0
2012 2015 2018 2021 2024 2027 2030 2033 2036 2039 2042 2045
ALL STATE RETIREMENT SYSTEMS COMBINEDProjected Unfunded Liability for FY 2012 - FY 2045
Funding Projections based on June 30, 2011 Actuarial Valuations($ in Millions)
Unfunded Liability Under Current Law

TEACHER’S RETIREMENT SYSTEM (TRS)
Total Payout 123 Total State Contribution 123 State Contribution FY 2013 – FY 2017 124 State Contribution as a % of Payroll 124 Employee Contribution 125 Funded Ratio 125 Assets 126 Actuarial Liability 126 Unfunded Liability 127

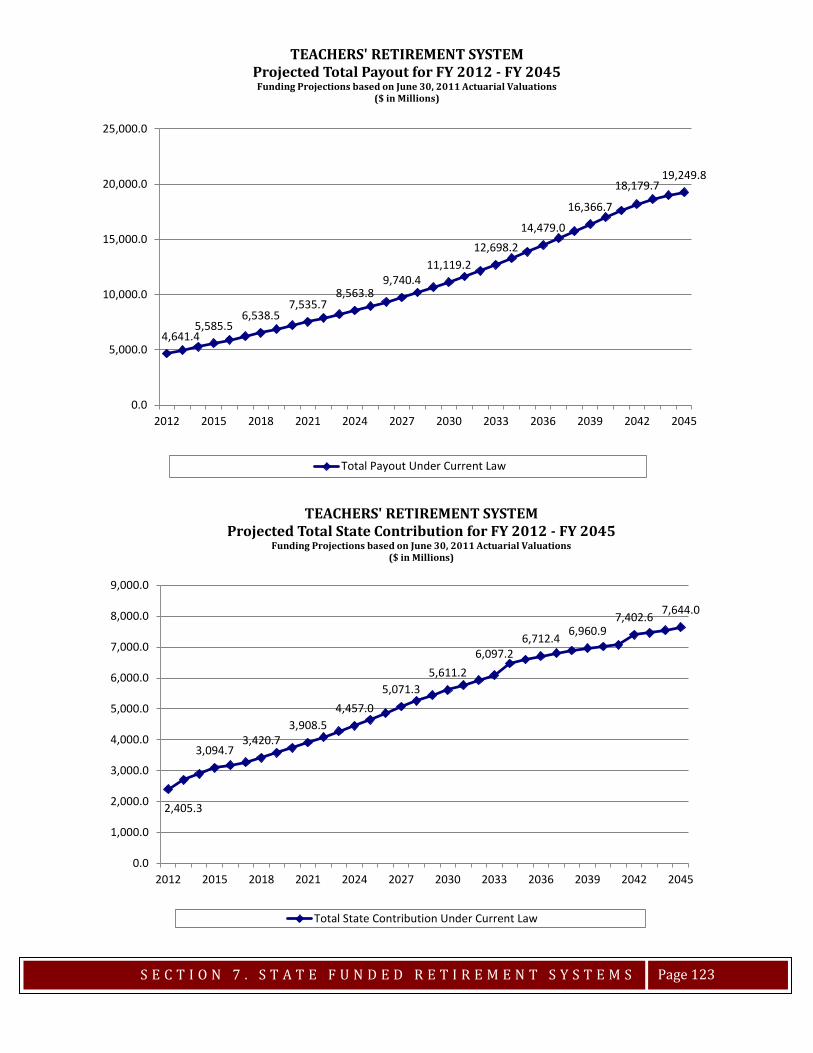
S E C T I O N 7 . S T A T E F U N D E D R E T I R E M E N T S Y S T E M S
Page 123
4,641.45,585.5
6,538.57,535.7
8,563.89,740.4
11,119.212,698.2
14,479.0
16,366.7
18,179.719,249.8
0.0
5,000.0
10,000.0
15,000.0
20,000.0
25,000.0
2012 2015 2018 2021 2024 2027 2030 2033 2036 2039 2042 2045
TEACHERS' RETIREMENT SYSTEMProjected Total Payout for FY 2012 - FY 2045Funding Projections based on June 30, 2011 Actuarial Valuations
($ in Millions)
Total Payout Under Current Law
2,405.3
3,094.73,420.7
3,908.54,457.0
5,071.35,611.2
6,097.26,712.4 6,960.9
7,402.6 7,644.0
0.0
1,000.0
2,000.0
3,000.0
4,000.0
5,000.0
6,000.0
7,000.0
8,000.0
9,000.0
2012 2015 2018 2021 2024 2027 2030 2033 2036 2039 2042 2045
TEACHERS' RETIREMENT SYSTEMProjected Total State Contribution for FY 2012 - FY 2045
Funding Projections based on June 30, 2011 Actuarial Valuations($ in Millions)
Total State Contribution Under Current Law
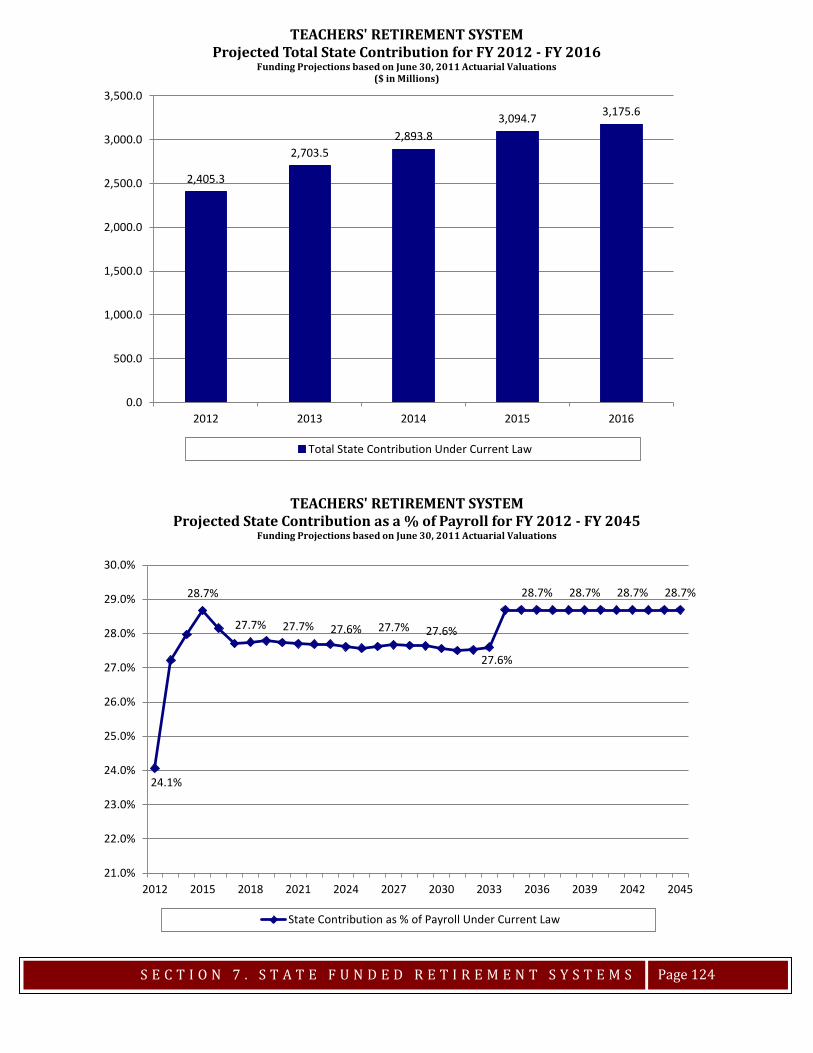
S E C T I O N 7 . S T A T E F U N D E D R E T I R E M E N T S Y S T E M S
Page 124
24.1%
28.7%
27.7% 27.7% 27.6% 27.7% 27.6%
27.6%
28.7% 28.7% 28.7% 28.7%
21.0%
22.0%
23.0%
24.0%
25.0%
26.0%
27.0%
28.0%
29.0%
30.0%
2012 2015 2018 2021 2024 2027 2030 2033 2036 2039 2042 2045
TEACHERS' RETIREMENT SYSTEMProjected State Contribution as a % of Payroll for FY 2012 - FY 2045
Funding Projections based on June 30, 2011 Actuarial Valuations
State Contribution as % of Payroll Under Current Law
2,405.3
2,703.52,893.8
3,094.7 3,175.6
0.0
500.0
1,000.0
1,500.0
2,000.0
2,500.0
3,000.0
3,500.0
2012 2013 2014 2015 2016
TEACHERS' RETIREMENT SYSTEMProjected Total State Contribution for FY 2012 - FY 2016
Funding Projections based on June 30, 2011 Actuarial Valuations($ in Millions)
Total State Contribution Under Current Law
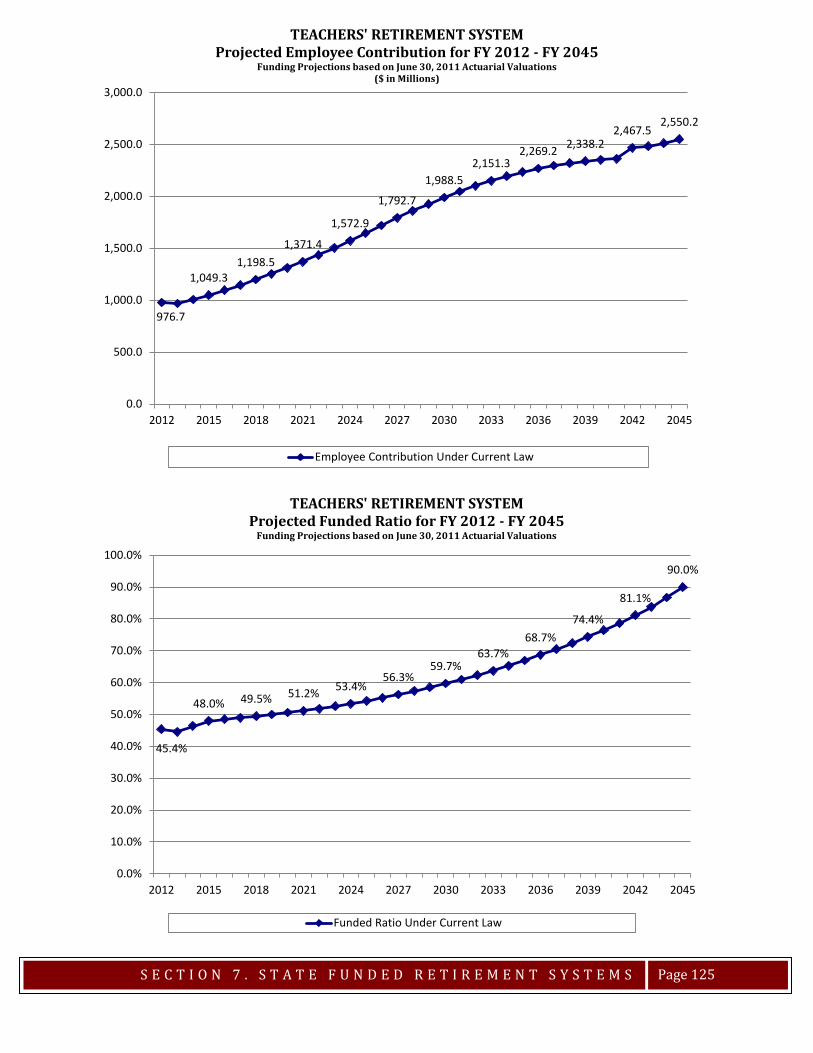
S E C T I O N 7 . S T A T E F U N D E D R E T I R E M E N T S Y S T E M S
Page 125
45.4%
48.0% 49.5% 51.2% 53.4%56.3%
59.7%63.7%
68.7%74.4%
81.1%
90.0%
0.0%
10.0%
20.0%
30.0%
40.0%
50.0%
60.0%
70.0%
80.0%
90.0%
100.0%
2012 2015 2018 2021 2024 2027 2030 2033 2036 2039 2042 2045
TEACHERS' RETIREMENT SYSTEMProjected Funded Ratio for FY 2012 - FY 2045
Funding Projections based on June 30, 2011 Actuarial Valuations
Funded Ratio Under Current Law
976.7
1,049.31,198.5
1,371.4
1,572.9
1,792.7
1,988.52,151.3
2,269.2 2,338.22,467.5
2,550.2
0.0
500.0
1,000.0
1,500.0
2,000.0
2,500.0
3,000.0
2012 2015 2018 2021 2024 2027 2030 2033 2036 2039 2042 2045
TEACHERS' RETIREMENT SYSTEMProjected Employee Contribution for FY 2012 - FY 2045
Funding Projections based on June 30, 2011 Actuarial Valuations($ in Millions)
Employee Contribution Under Current Law
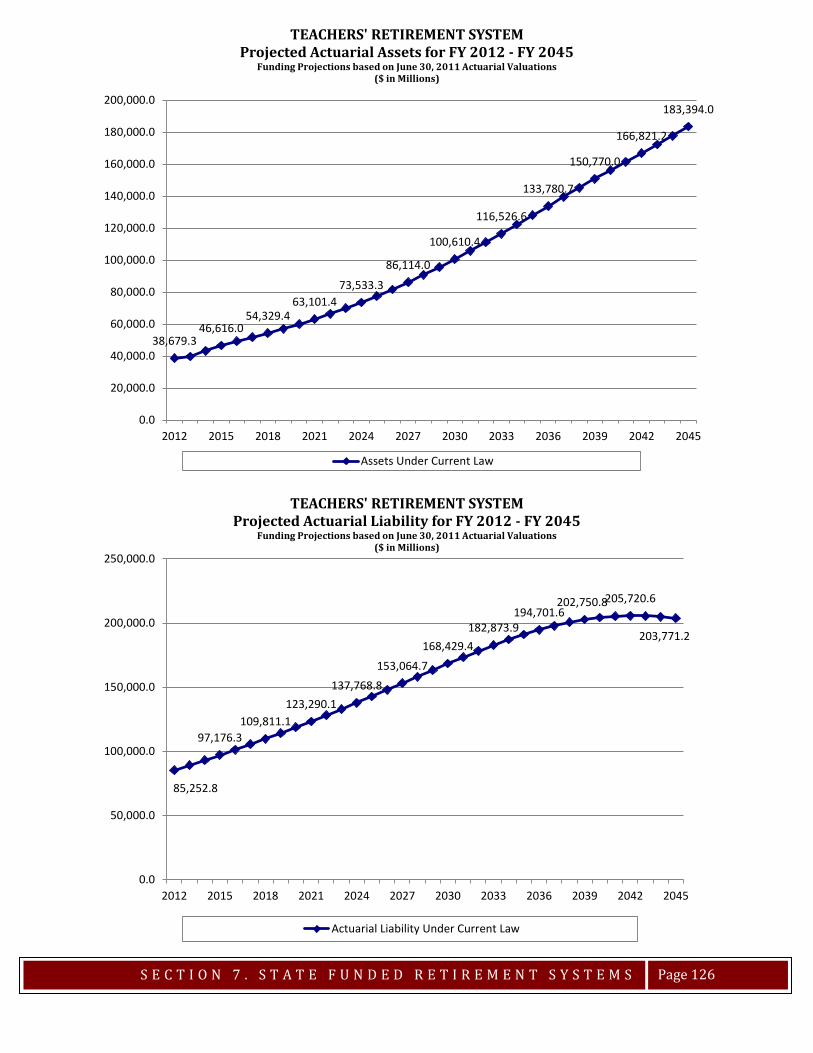
S E C T I O N 7 . S T A T E F U N D E D R E T I R E M E N T S Y S T E M S
Page 126
85,252.8
97,176.3109,811.1
123,290.1137,768.8
153,064.7168,429.4
182,873.9194,701.6
202,750.8205,720.6
203,771.2
0.0
50,000.0
100,000.0
150,000.0
200,000.0
250,000.0
2012 2015 2018 2021 2024 2027 2030 2033 2036 2039 2042 2045
TEACHERS' RETIREMENT SYSTEMProjected Actuarial Liability for FY 2012 - FY 2045
Funding Projections based on June 30, 2011 Actuarial Valuations($ in Millions)
Actuarial Liability Under Current Law
38,679.346,616.0
54,329.463,101.4
73,533.3
86,114.0
100,610.4
116,526.6
133,780.7
150,770.0
166,821.2
183,394.0
0.0
20,000.0
40,000.0
60,000.0
80,000.0
100,000.0
120,000.0
140,000.0
160,000.0
180,000.0
200,000.0
2012 2015 2018 2021 2024 2027 2030 2033 2036 2039 2042 2045
TEACHERS' RETIREMENT SYSTEMProjected Actuarial Assets for FY 2012 - FY 2045
Funding Projections based on June 30, 2011 Actuarial Valuations($ in Millions)
Assets Under Current Law
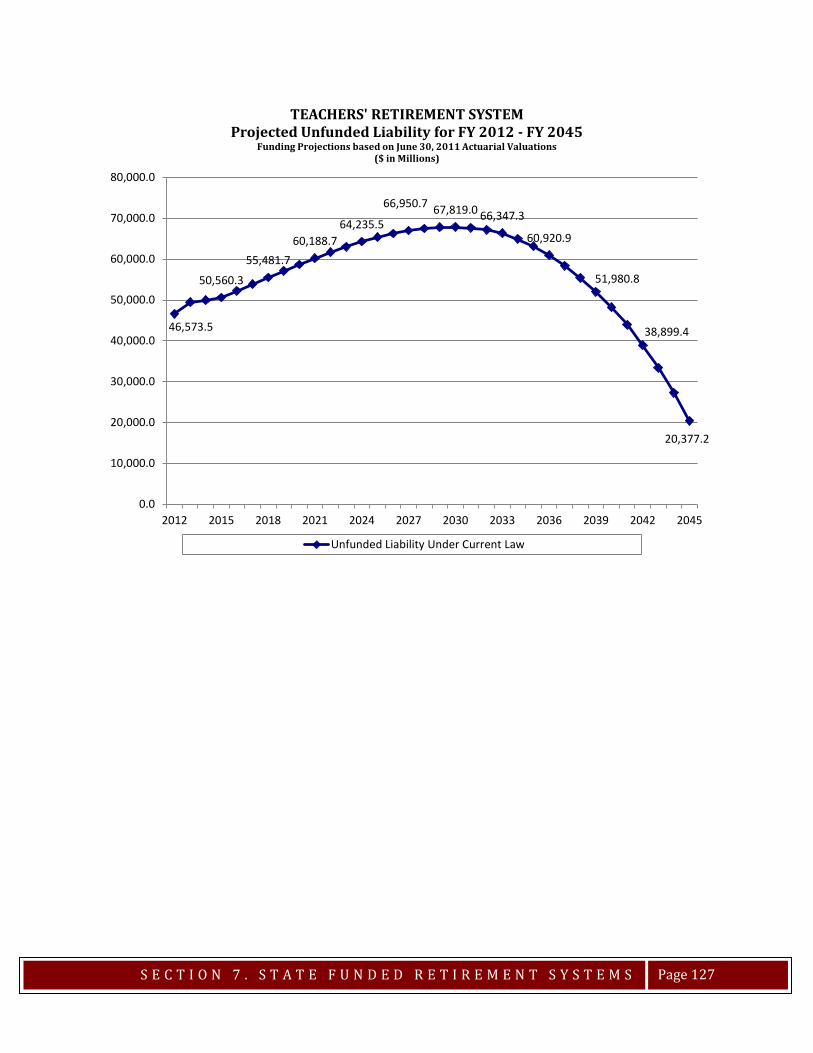
S E C T I O N 7 . S T A T E F U N D E D R E T I R E M E N T S Y S T E M S
Page 127
46,573.5
50,560.3
55,481.760,188.7
64,235.5
66,950.7 67,819.0 66,347.3
60,920.9
51,980.8
38,899.4
20,377.2
0.0
10,000.0
20,000.0
30,000.0
40,000.0
50,000.0
60,000.0
70,000.0
80,000.0
2012 2015 2018 2021 2024 2027 2030 2033 2036 2039 2042 2045
TEACHERS' RETIREMENT SYSTEMProjected Unfunded Liability for FY 2012 - FY 2045
Funding Projections based on June 30, 2011 Actuarial Valuations($ in Millions)
Unfunded Liability Under Current Law


STATE UNIVERSITIES RETIREMENT SYSTEM (SURS)
Total Payout 131 Total State Contribution 131 State Contribution FY 2013 – FY 2017 132 State Contribution as a % of Payroll 132 Employee Contribution 133 Funded Ratio 133 Assets 134 Actuarial Liability 134 Unfunded Liability 135

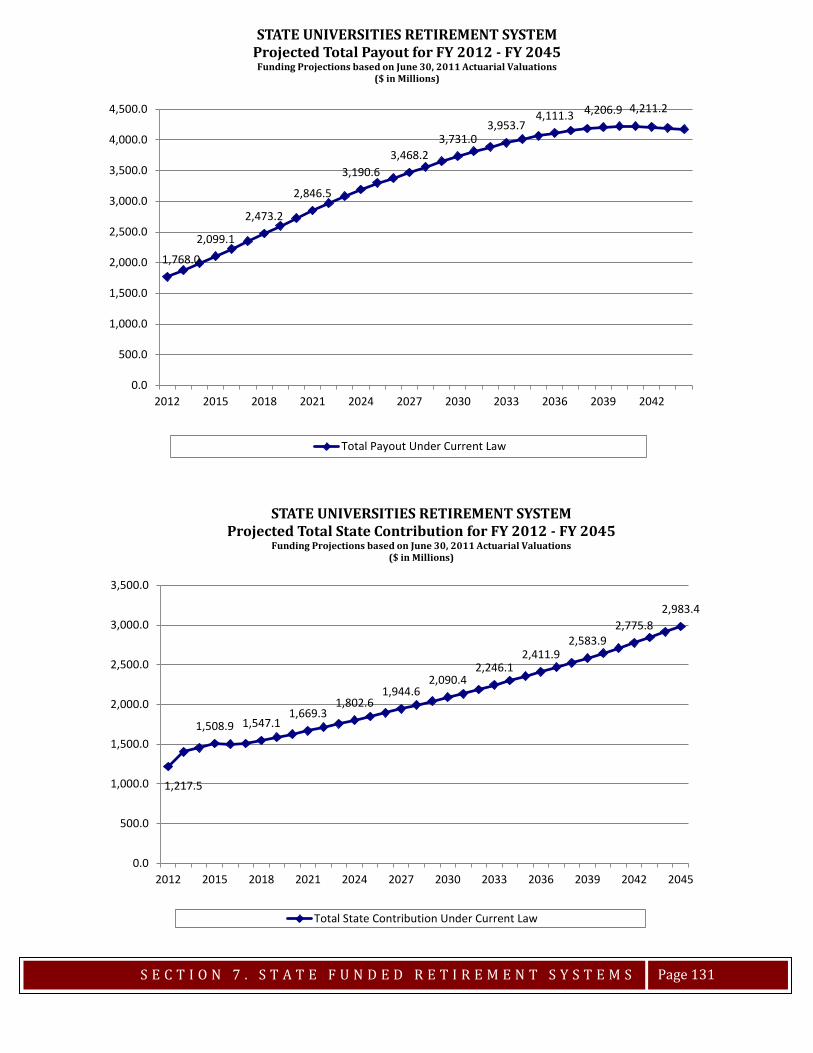
S E C T I O N 7 . S T A T E F U N D E D R E T I R E M E N T S Y S T E M S
Page 131
1,768.0
2,099.1
2,473.2
2,846.5
3,190.63,468.2
3,731.03,953.7
4,111.3 4,206.9 4,211.2
0.0
500.0
1,000.0
1,500.0
2,000.0
2,500.0
3,000.0
3,500.0
4,000.0
4,500.0
2012 2015 2018 2021 2024 2027 2030 2033 2036 2039 2042
STATE UNIVERSITIES RETIREMENT SYSTEMProjected Total Payout for FY 2012 - FY 2045Funding Projections based on June 30, 2011 Actuarial Valuations
($ in Millions)
Total Payout Under Current Law
1,217.5
1,508.9 1,547.11,669.3
1,802.61,944.6
2,090.42,246.1
2,411.92,583.9
2,775.82,983.4
0.0
500.0
1,000.0
1,500.0
2,000.0
2,500.0
3,000.0
3,500.0
2012 2015 2018 2021 2024 2027 2030 2033 2036 2039 2042 2045
STATE UNIVERSITIES RETIREMENT SYSTEMProjected Total State Contribution for FY 2012 - FY 2045
Funding Projections based on June 30, 2011 Actuarial Valuations($ in Millions)
Total State Contribution Under Current Law

S E C T I O N 7 . S T A T E F U N D E D R E T I R E M E N T S Y S T E M S
Page 132
34.8%
40.7%39.2% 39.7% 40.0% 40.3% 40.4% 40.6% 41.0% 41.4% 41.9% 42.4%
0.0%
5.0%
10.0%
15.0%
20.0%
25.0%
30.0%
35.0%
40.0%
45.0%
2012 2015 2018 2021 2024 2027 2030 2033 2036 2039 2042 2045
STATE UNIVERSITIES RETIREMENT SYSTEMProjected State Contribution as a % of Payroll for FY 2012 - FY 2045
Funding Projections based on June 30, 2011 Actuarial Valuations
State Contribution as % of Payroll Under Current Law
1,217.5
1,402.81,456.0
1,508.9 1,501.8
0.0
200.0
400.0
600.0
800.0
1,000.0
1,200.0
1,400.0
1,600.0
2012 2013 2014 2015 2016
STATE UNIVERSITIES RETIREMENT SYSTEMProjected Total State Contribution for FY 2012 - FY 2016
Funding Projections based on June 30, 2011 Actuarial Valuations($ in Millions)
Total State Contribution Under Current Law
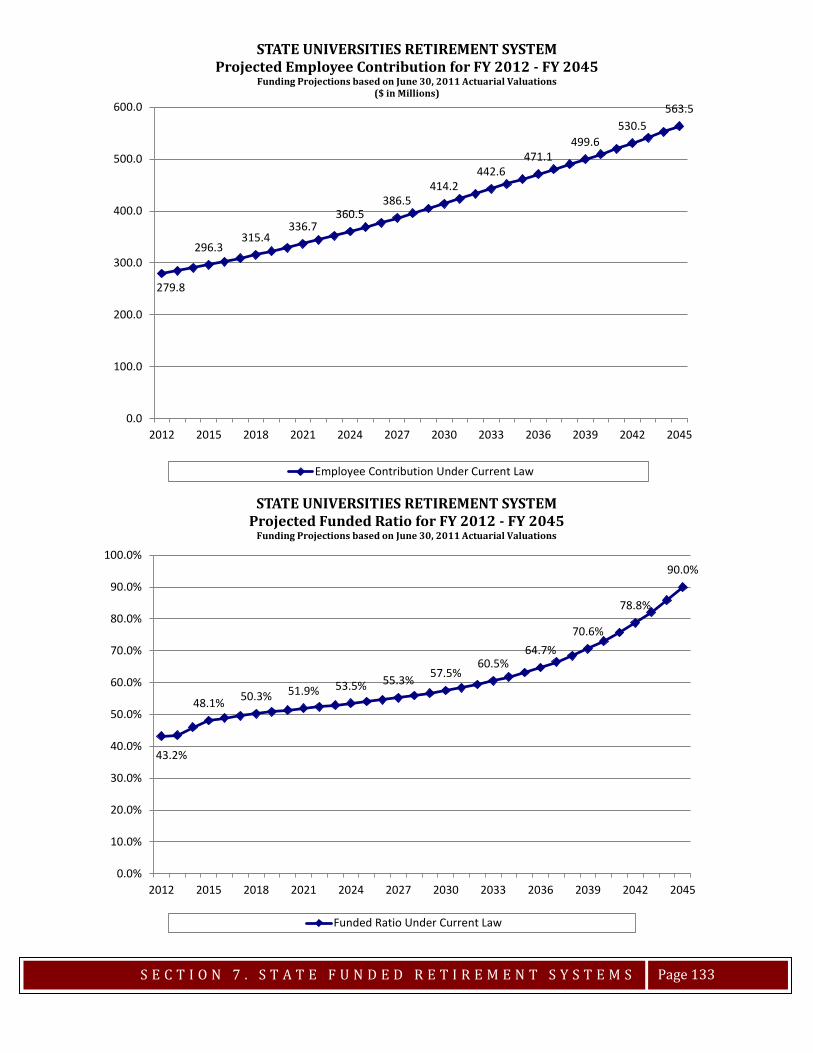
S E C T I O N 7 . S T A T E F U N D E D R E T I R E M E N T S Y S T E M S
Page 133
279.8
296.3315.4
336.7360.5
386.5414.2
442.6471.1
499.6530.5
563.5
0.0
100.0
200.0
300.0
400.0
500.0
600.0
2012 2015 2018 2021 2024 2027 2030 2033 2036 2039 2042 2045
STATE UNIVERSITIES RETIREMENT SYSTEMProjected Employee Contribution for FY 2012 - FY 2045
Funding Projections based on June 30, 2011 Actuarial Valuations($ in Millions)
Employee Contribution Under Current Law
43.2%
48.1% 50.3% 51.9% 53.5% 55.3% 57.5%60.5%
64.7%70.6%
78.8%
90.0%
0.0%
10.0%
20.0%
30.0%
40.0%
50.0%
60.0%
70.0%
80.0%
90.0%
100.0%
2012 2015 2018 2021 2024 2027 2030 2033 2036 2039 2042 2045
STATE UNIVERSITIES RETIREMENT SYSTEMProjected Funded Ratio for FY 2012 - FY 2045
Funding Projections based on June 30, 2011 Actuarial Valuations
Funded Ratio Under Current Law
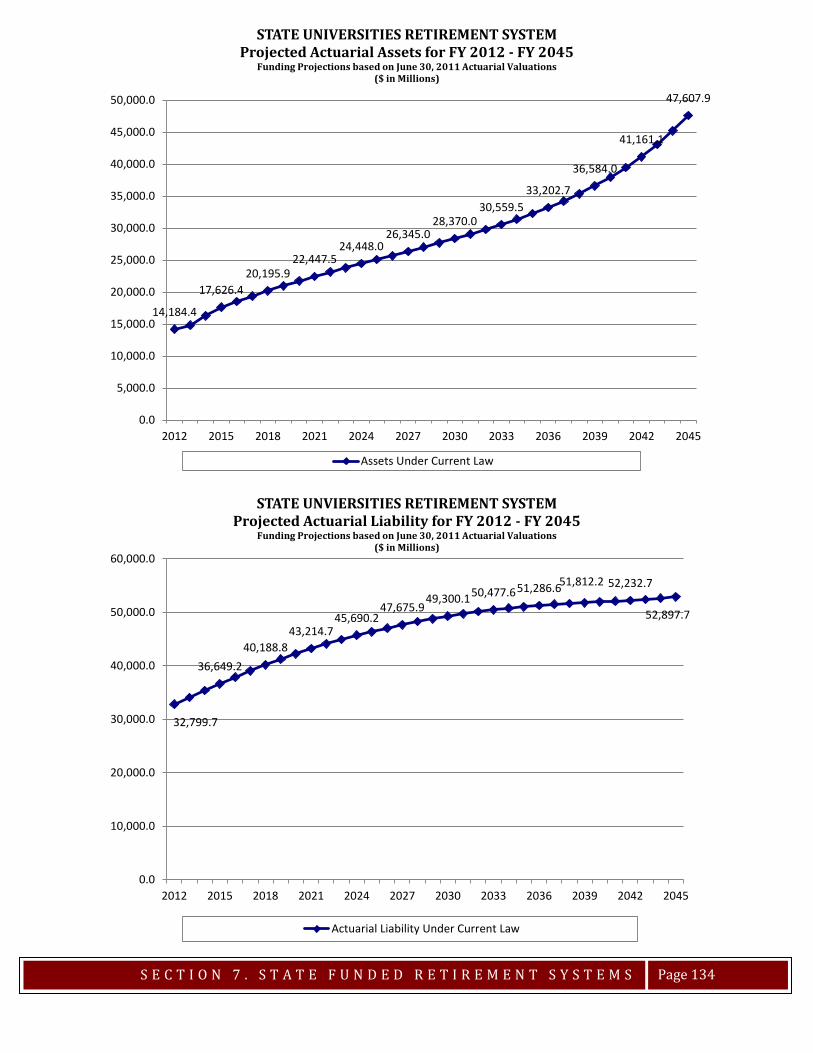
S E C T I O N 7 . S T A T E F U N D E D R E T I R E M E N T S Y S T E M S
Page 134
14,184.4
17,626.420,195.9
22,447.524,448.0
26,345.028,370.0
30,559.533,202.7
36,584.0
41,161.1
47,607.9
0.0
5,000.0
10,000.0
15,000.0
20,000.0
25,000.0
30,000.0
35,000.0
40,000.0
45,000.0
50,000.0
2012 2015 2018 2021 2024 2027 2030 2033 2036 2039 2042 2045
STATE UNIVERSITIES RETIREMENT SYSTEMProjected Actuarial Assets for FY 2012 - FY 2045
Funding Projections based on June 30, 2011 Actuarial Valuations($ in Millions)
Assets Under Current Law
32,799.7
36,649.240,188.8
43,214.745,690.2
47,675.949,300.150,477.651,286.651,812.2 52,232.7
52,897.7
0.0
10,000.0
20,000.0
30,000.0
40,000.0
50,000.0
60,000.0
2012 2015 2018 2021 2024 2027 2030 2033 2036 2039 2042 2045
STATE UNVIERSITIES RETIREMENT SYSTEMProjected Actuarial Liability for FY 2012 - FY 2045
Funding Projections based on June 30, 2011 Actuarial Valuations($ in Millions)
Actuarial Liability Under Current Law

S E C T I O N 7 . S T A T E F U N D E D R E T I R E M E N T S Y S T E M S
Page 135
18,615.3
19,022.8 19,992.9
20,767.2 21,242.2 21,330.9
20,930.1 19,918.1
18,083.9
15,228.2
11,071.6
5,289.8
0.0
5,000.0
10,000.0
15,000.0
20,000.0
25,000.0
2012 2015 2018 2021 2024 2027 2030 2033 2036 2039 2042 2045
STATE UNIVERSITIES RETIREMENT SYSTEMProjected Unfunded Liability for FY 2012 - FY 2045
Funding Projections based on June 30, 2011 Actuarial Valuations($ in Millions)
Unfunded Liability Under Current Law


STATE EMPLOYEES’ RETIREMENT SYSTEM (SERS)
Total Payout 139 Total State Contribution 139 State Contribution FY 2013 – FY 2017 140 State Contribution as a % of Payroll 140 Employee Contribution 141 Funded Ratio 141 Assets 142 Actuarial Liability 142 Unfunded Liability 143


S E C T I O N 7 . S T A T E F U N D E D R E T I R E M E N T S Y S T E M S
Page 139
1,577.01,901.5
2,297.1
2,744.0
3,239.6
3,755.3
4,251.7
4,751.55,105.0
5,359.65,525.2 5,623.7
0.0
1,000.0
2,000.0
3,000.0
4,000.0
5,000.0
6,000.0
2012 2015 2018 2021 2024 2027 2030 2033 2036 2039 2042 2045
STATE EMPLOYEES' RETIREMENT SYSTEMProjected Total Payout for FY 2012 - FY 2045Funding Projections based on June 30, 2011 Actuarial Valuations
($ in Millions)
Total Payout Under Current Law
1,369.0
1,738.01,889.0
2,073.02,265.0
2,472.02,687.0
2,911.0
3,391.03,667.0
3,950.04,238.0
0.0
500.0
1,000.0
1,500.0
2,000.0
2,500.0
3,000.0
3,500.0
4,000.0
4,500.0
2012 2015 2018 2021 2024 2027 2030 2033 2036 2039 2042 2045
STATE EMPLOYEES' RETIREMENT SYSTEMProjected Total State Contribution for FY 2012 - FY 2045
Funding Projections based on June 30, 2011 Actuarial Valuations($ in Millions)
Total State Contribution Under Current Law
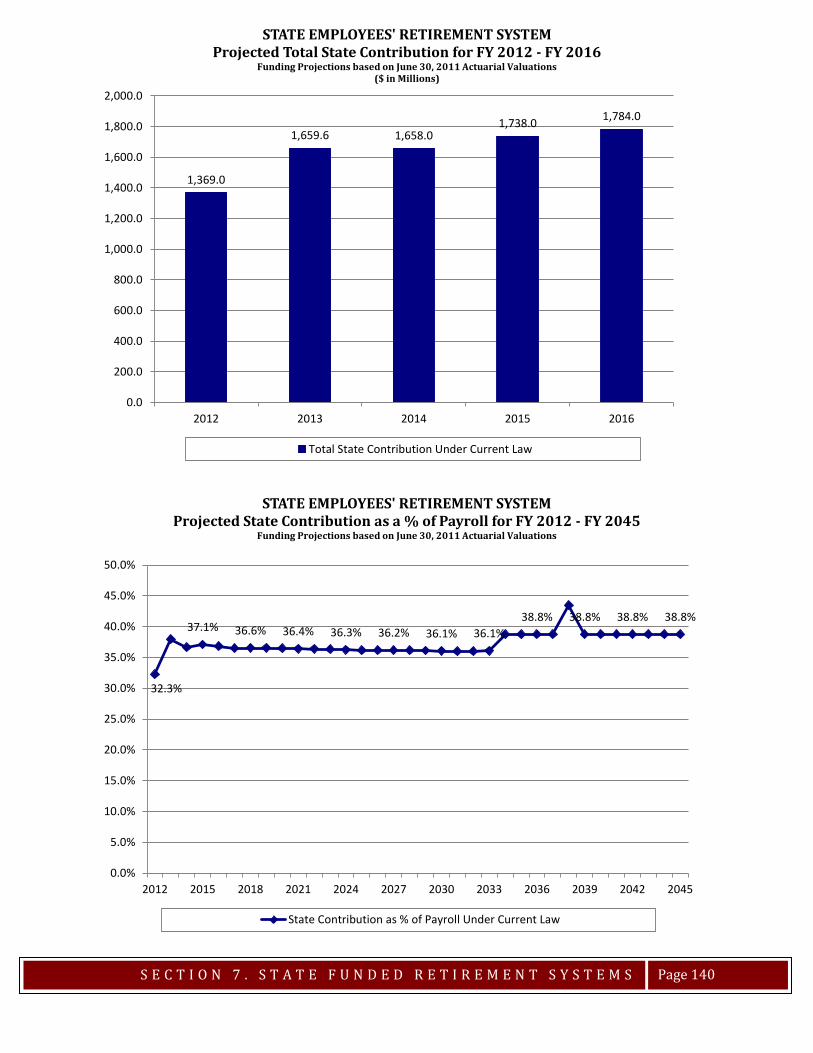
S E C T I O N 7 . S T A T E F U N D E D R E T I R E M E N T S Y S T E M S
Page 140
32.3%
37.1% 36.6% 36.4% 36.3% 36.2% 36.1% 36.1%38.8% 38.8% 38.8% 38.8%
0.0%
5.0%
10.0%
15.0%
20.0%
25.0%
30.0%
35.0%
40.0%
45.0%
50.0%
2012 2015 2018 2021 2024 2027 2030 2033 2036 2039 2042 2045
STATE EMPLOYEES' RETIREMENT SYSTEMProjected State Contribution as a % of Payroll for FY 2012 - FY 2045
Funding Projections based on June 30, 2011 Actuarial Valuations
State Contribution as % of Payroll Under Current Law
1,369.0
1,659.6 1,658.01,738.0 1,784.0
0.0
200.0
400.0
600.0
800.0
1,000.0
1,200.0
1,400.0
1,600.0
1,800.0
2,000.0
2012 2013 2014 2015 2016
STATE EMPLOYEES' RETIREMENT SYSTEMProjected Total State Contribution for FY 2012 - FY 2016
Funding Projections based on June 30, 2011 Actuarial Valuations($ in Millions)
Total State Contribution Under Current Law
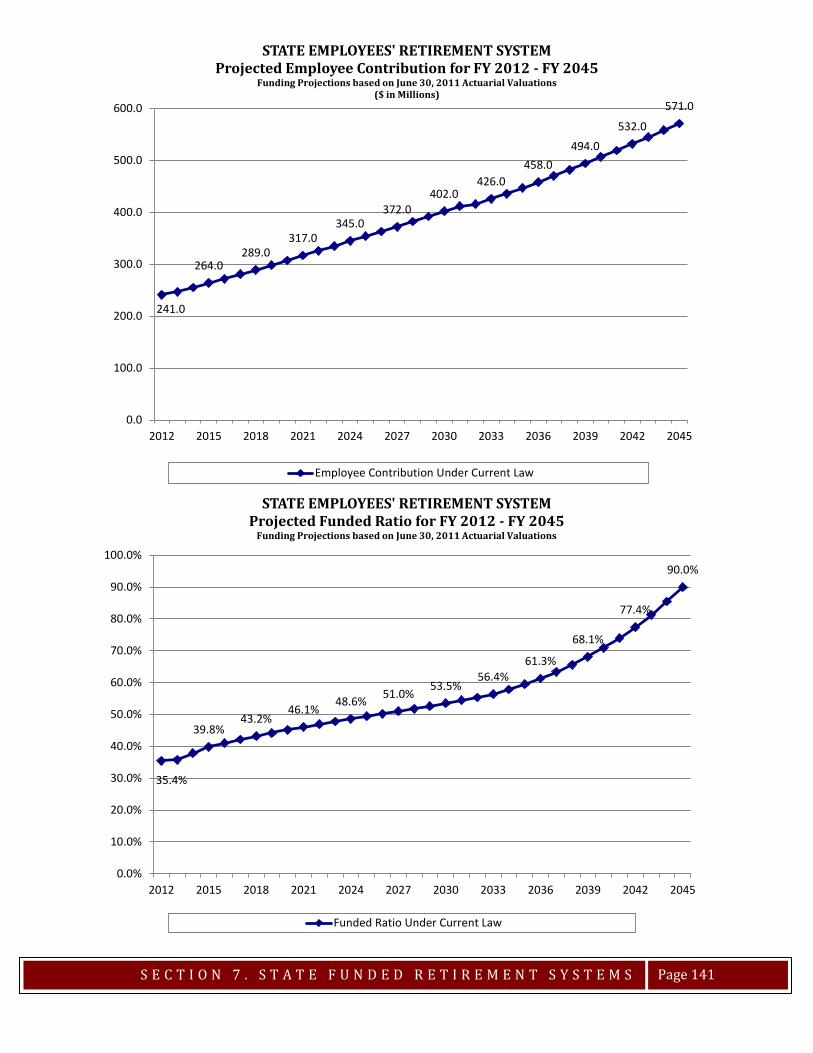
S E C T I O N 7 . S T A T E F U N D E D R E T I R E M E N T S Y S T E M S
Page 141
241.0
264.0289.0
317.0345.0
372.0402.0
426.0458.0
494.0532.0
571.0
0.0
100.0
200.0
300.0
400.0
500.0
600.0
2012 2015 2018 2021 2024 2027 2030 2033 2036 2039 2042 2045
STATE EMPLOYEES' RETIREMENT SYSTEMProjected Employee Contribution for FY 2012 - FY 2045
Funding Projections based on June 30, 2011 Actuarial Valuations($ in Millions)
Employee Contribution Under Current Law
35.4%
39.8%43.2%
46.1%48.6% 51.0%
53.5%56.4%
61.3%
68.1%
77.4%
90.0%
0.0%
10.0%
20.0%
30.0%
40.0%
50.0%
60.0%
70.0%
80.0%
90.0%
100.0%
2012 2015 2018 2021 2024 2027 2030 2033 2036 2039 2042 2045
STATE EMPLOYEES' RETIREMENT SYSTEMProjected Funded Ratio for FY 2012 - FY 2045
Funding Projections based on June 30, 2011 Actuarial Valuations
Funded Ratio Under Current Law
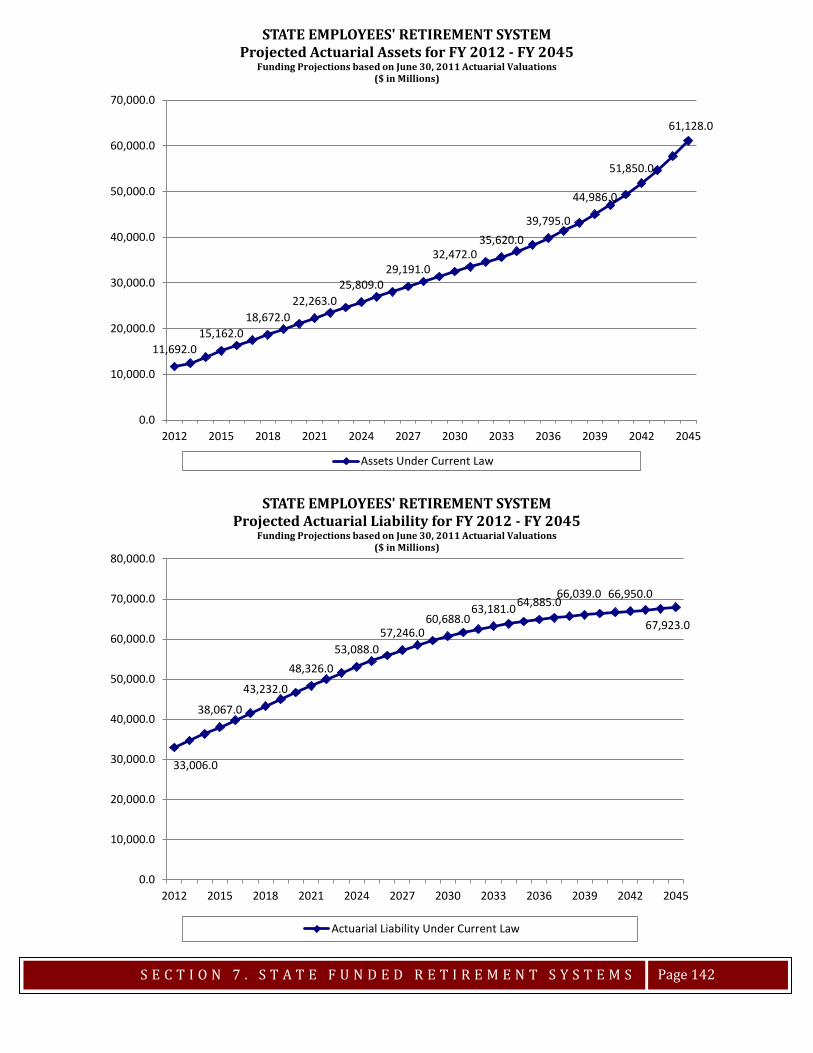
S E C T I O N 7 . S T A T E F U N D E D R E T I R E M E N T S Y S T E M S
Page 142
11,692.015,162.0
18,672.022,263.0
25,809.029,191.0
32,472.035,620.0
39,795.0
44,986.0
51,850.0
61,128.0
0.0
10,000.0
20,000.0
30,000.0
40,000.0
50,000.0
60,000.0
70,000.0
2012 2015 2018 2021 2024 2027 2030 2033 2036 2039 2042 2045
STATE EMPLOYEES' RETIREMENT SYSTEMProjected Actuarial Assets for FY 2012 - FY 2045
Funding Projections based on June 30, 2011 Actuarial Valuations($ in Millions)
Assets Under Current Law
33,006.0
38,067.0
43,232.0
48,326.053,088.0
57,246.060,688.0
63,181.064,885.066,039.0 66,950.0
67,923.0
0.0
10,000.0
20,000.0
30,000.0
40,000.0
50,000.0
60,000.0
70,000.0
80,000.0
2012 2015 2018 2021 2024 2027 2030 2033 2036 2039 2042 2045
STATE EMPLOYEES' RETIREMENT SYSTEMProjected Actuarial Liability for FY 2012 - FY 2045
Funding Projections based on June 30, 2011 Actuarial Valuations($ in Millions)
Actuarial Liability Under Current Law
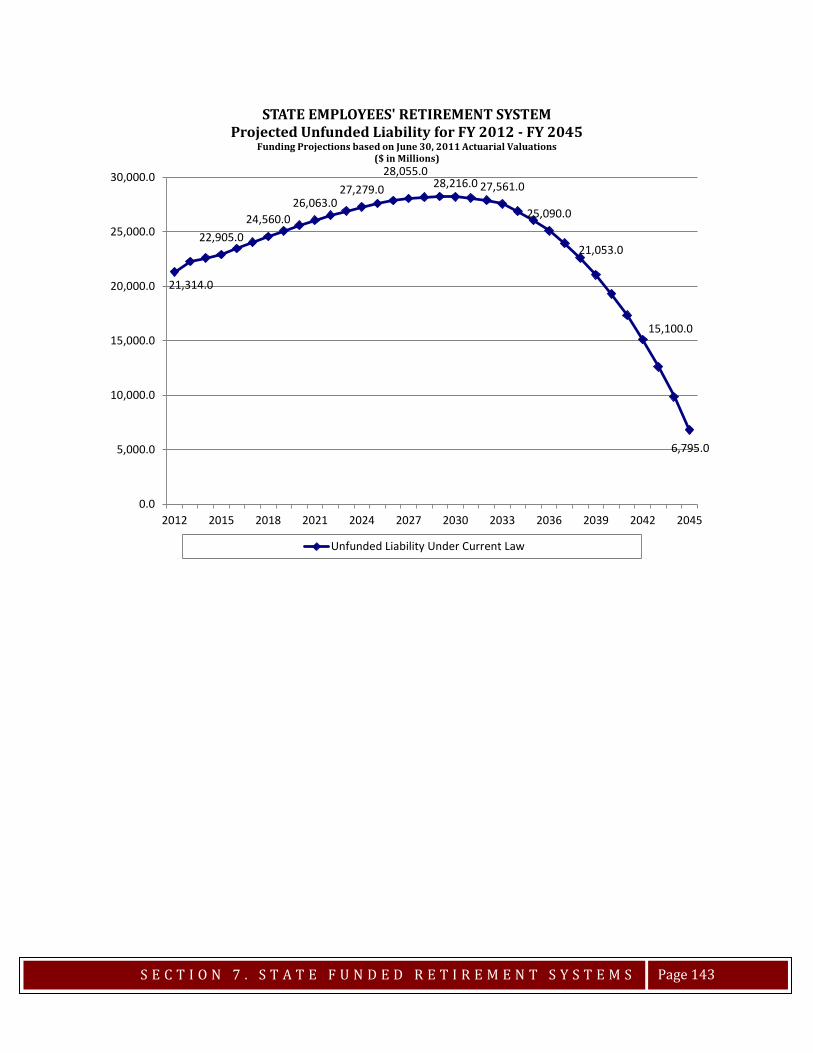
S E C T I O N 7 . S T A T E F U N D E D R E T I R E M E N T S Y S T E M S
Page 143
21,314.0
22,905.024,560.0
26,063.027,279.0
28,055.028,216.0 27,561.0
25,090.0
21,053.0
15,100.0
6,795.0
0.0
5,000.0
10,000.0
15,000.0
20,000.0
25,000.0
30,000.0
2012 2015 2018 2021 2024 2027 2030 2033 2036 2039 2042 2045
STATE EMPLOYEES' RETIREMENT SYSTEMProjected Unfunded Liability for FY 2012 - FY 2045
Funding Projections based on June 30, 2011 Actuarial Valuations($ in Millions)
Unfunded Liability Under Current Law


GENERAL ASSEMBLY RETIREMENT SYSTEM
Total Payout 147 Total State Contribution 147 State Contribution FY 2013 – FY 2017 148 State Contribution as a % of Payroll 148 Employee Contribution 149 Funded Ratio 149 Assets 150 Actuarial Liability 150 Unfunded Liability 151


S E C T I O N 7 . S T A T E F U N D E D R E T I R E M E N T S Y S T E M S
Page 147
18.820.4
22.3 23.024.1
25.3 26.1 26.7 26.7 26.2 25.9 25.6
0.0
5.0
10.0
15.0
20.0
25.0
30.0
2012 2015 2018 2021 2024 2027 2030 2033 2036 2039 2042 2045
GENERAL ASSEMBLY RETIREMENT SYSTEMProjected Total Payout for FY 2012 - FY 2045Funding Projections based on June 30, 2011 Actuarial Valuations
($ in Millions)
Total Payout Under Current Law
10.5
15.316.6
18.119.8
21.523.3
25.527.9
30.533.3
36.3
0.0
5.0
10.0
15.0
20.0
25.0
30.0
35.0
40.0
2012 2015 2018 2021 2024 2027 2030 2033 2036 2039 2042 2045
GENERAL ASSEMBLY RETIREMENT SYSTEMProjected Total State Contribution for FY 2012 - FY 2045
Funding Projections based on June 30, 2011 Actuarial Valuations($ in Millions)
Total State Contribution Under Current Law

S E C T I O N 7 . S T A T E F U N D E D R E T I R E M E N T S Y S T E M S
Page 148
72.4%
96.8% 96.0% 96.3% 96.1% 96.4% 95.5% 95.9% 96.2% 96.2% 96.2% 96.0%
0.0%
20.0%
40.0%
60.0%
80.0%
100.0%
120.0%
2012 2015 2018 2021 2024 2027 2030 2033 2036 2039 2042 2045
GENERAL ASSEMBLY RETIREMENT SYSTEMProjected State Contribution as a % of Payroll for FY 2012 - FY 2045
Funding Projections based on June 30, 2011 Actuarial Valuations
State Contribution as % of Payroll Under Current Law
10.5
14.214.7
15.3 15.7
0.0
2.0
4.0
6.0
8.0
10.0
12.0
14.0
16.0
18.0
2012 2013 2014 2015 2016
GENERAL ASSEMBLY RETIREMENT SYSTEMProjected Total State Contribution for FY 2012 - FY 2016
Funding Projections based on June 30, 2011 Actuarial Valuations($ in Millions)
Total State Contribution Under Current Law
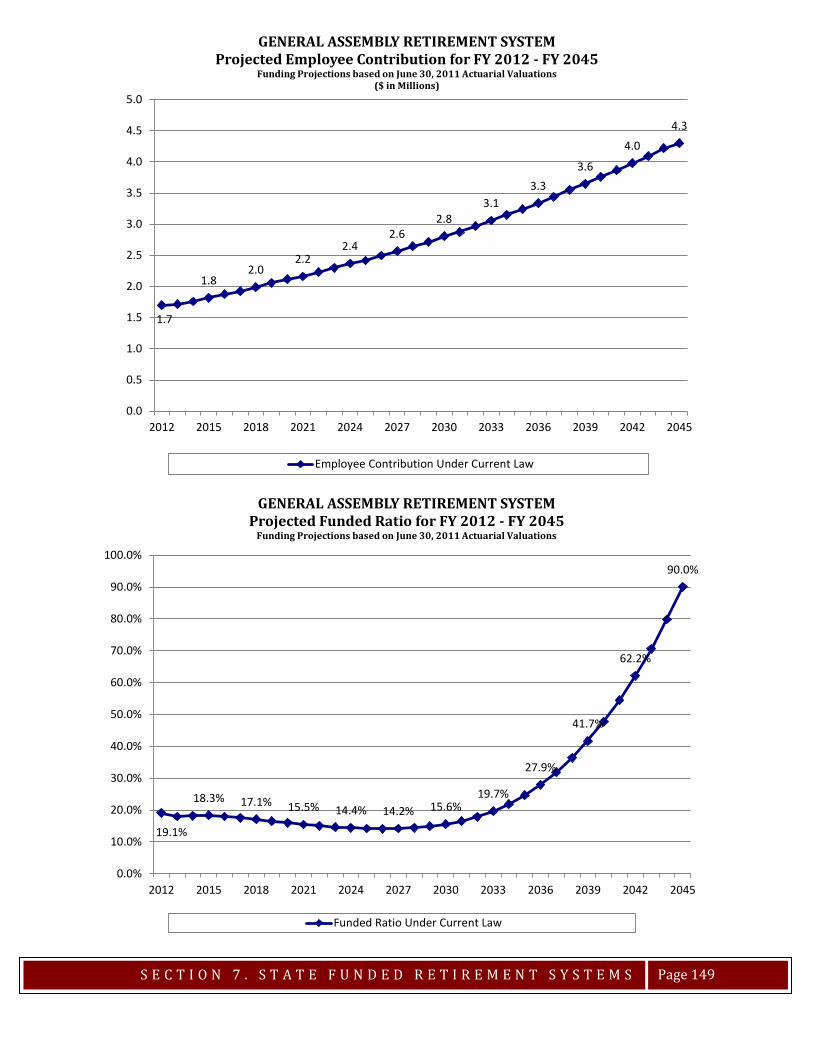
S E C T I O N 7 . S T A T E F U N D E D R E T I R E M E N T S Y S T E M S
Page 149
1.7
1.82.0
2.22.4
2.62.8
3.13.3
3.6
4.0
4.3
0.0
0.5
1.0
1.5
2.0
2.5
3.0
3.5
4.0
4.5
5.0
2012 2015 2018 2021 2024 2027 2030 2033 2036 2039 2042 2045
GENERAL ASSEMBLY RETIREMENT SYSTEMProjected Employee Contribution for FY 2012 - FY 2045
Funding Projections based on June 30, 2011 Actuarial Valuations($ in Millions)
Employee Contribution Under Current Law
19.1%
18.3% 17.1% 15.5% 14.4% 14.2% 15.6%19.7%
27.9%
41.7%
62.2%
90.0%
0.0%
10.0%
20.0%
30.0%
40.0%
50.0%
60.0%
70.0%
80.0%
90.0%
100.0%
2012 2015 2018 2021 2024 2027 2030 2033 2036 2039 2042 2045
GENERAL ASSEMBLY RETIREMENT SYSTEMProjected Funded Ratio for FY 2012 - FY 2045
Funding Projections based on June 30, 2011 Actuarial Valuations
Funded Ratio Under Current Law

S E C T I O N 7 . S T A T E F U N D E D R E T I R E M E N T S Y S T E M S
Page 150
57.5 56.8 54.2 49.8 46.6 45.6 49.561.5
86.3
127.7
190.7
280.3
0.0
50.0
100.0
150.0
200.0
250.0
300.0
2012 2015 2018 2021 2024 2027 2030 2033 2036 2039 2042 2045
GENERAL ASSEMBLY RETIREMENT SYSTEMProjected Actuarial Assets for FY 2012 - FY 2045
Funding Projections based on June 30, 2011 Actuarial Valuations($ in Millions)
Assets Under Current Law
301.6
310.2
316.9
321.4322.9
321.2
317.4
312.9
308.8
306.4 306.8 311.4
290.0
295.0
300.0
305.0
310.0
315.0
320.0
325.0
2012 2015 2018 2021 2024 2027 2030 2033 2036 2039 2042 2045
GENERAL ASSEMBLY RETIREMENT SYSTEMProjected Actuarial Liability for FY 2012 - FY 2045
Funding Projections based on June 30, 2011 Actuarial Valuations($ in Millions)
Actuarial Liability Under CurrentLaw
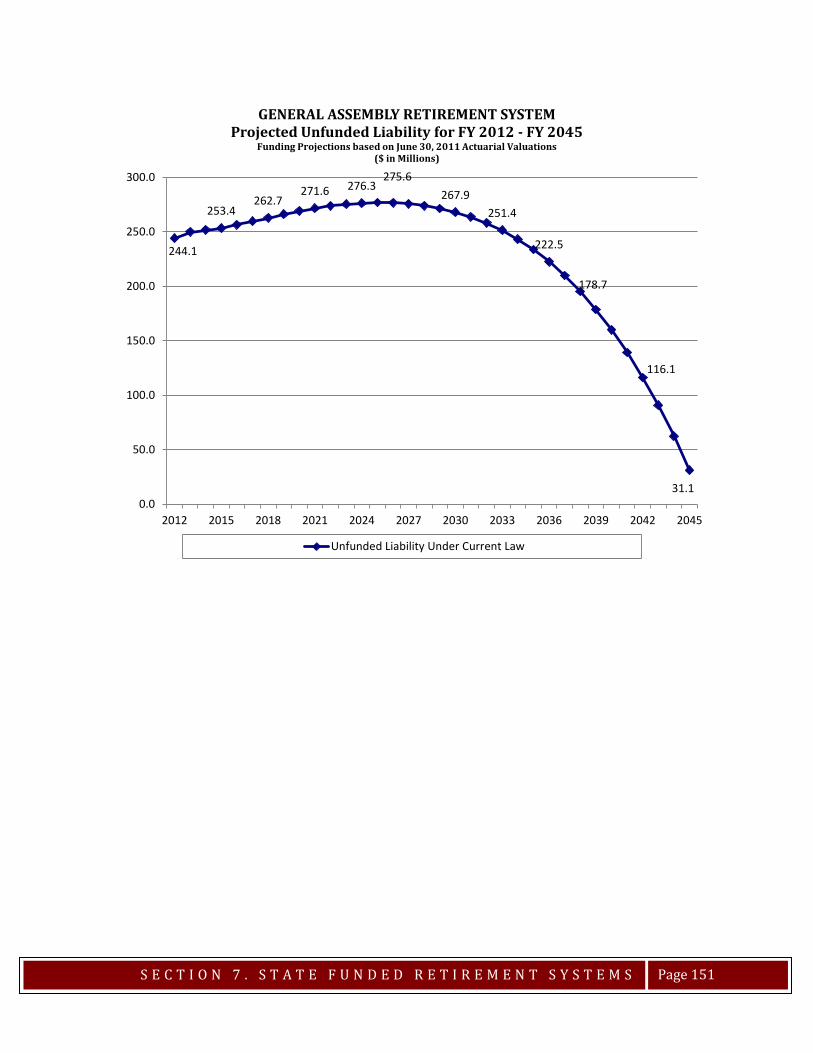
S E C T I O N 7 . S T A T E F U N D E D R E T I R E M E N T S Y S T E M S
Page 151
244.1
253.4262.7
271.6 276.3275.6
267.9251.4
222.5
178.7
116.1
31.10.0
50.0
100.0
150.0
200.0
250.0
300.0
2012 2015 2018 2021 2024 2027 2030 2033 2036 2039 2042 2045
GENERAL ASSEMBLY RETIREMENT SYSTEMProjected Unfunded Liability for FY 2012 - FY 2045
Funding Projections based on June 30, 2011 Actuarial Valuations($ in Millions)
Unfunded Liability Under Current Law

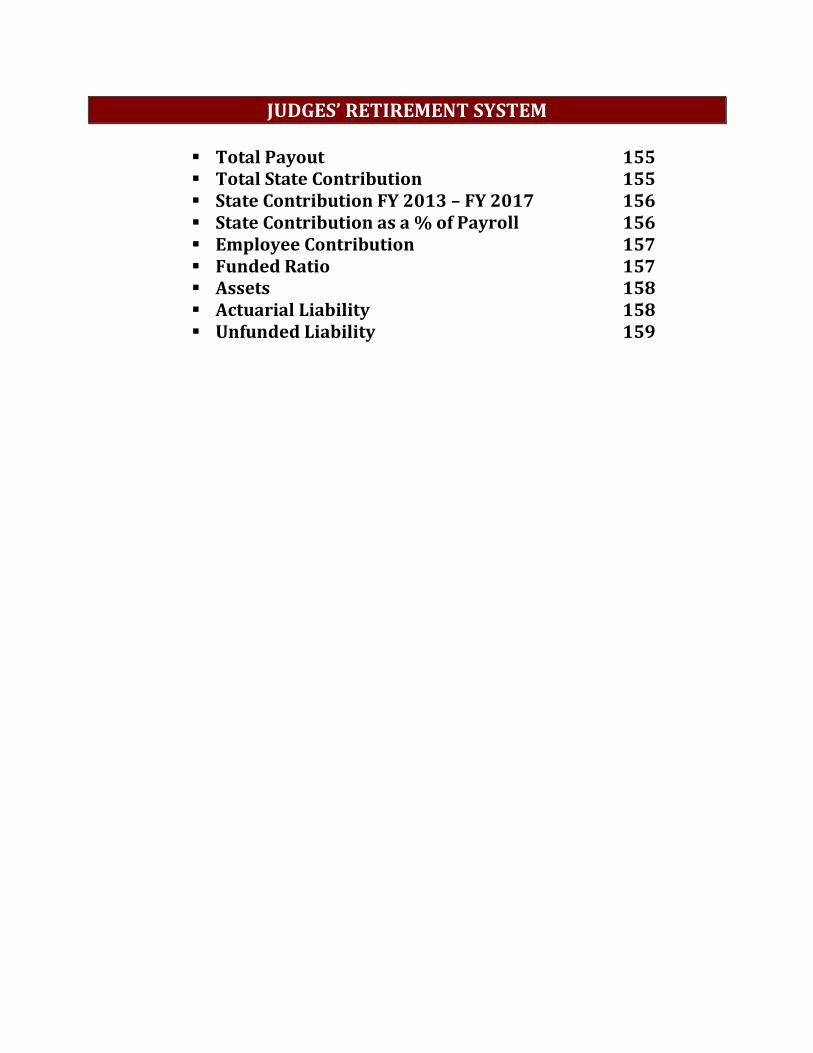
JUDGES’ RETIREMENT SYSTEM
Total Payout 155 Total State Contribution 155 State Contribution FY 2013 – FY 2017 156 State Contribution as a % of Payroll 156 Employee Contribution 157 Funded Ratio 157 Assets 158 Actuarial Liability 158 Unfunded Liability 159

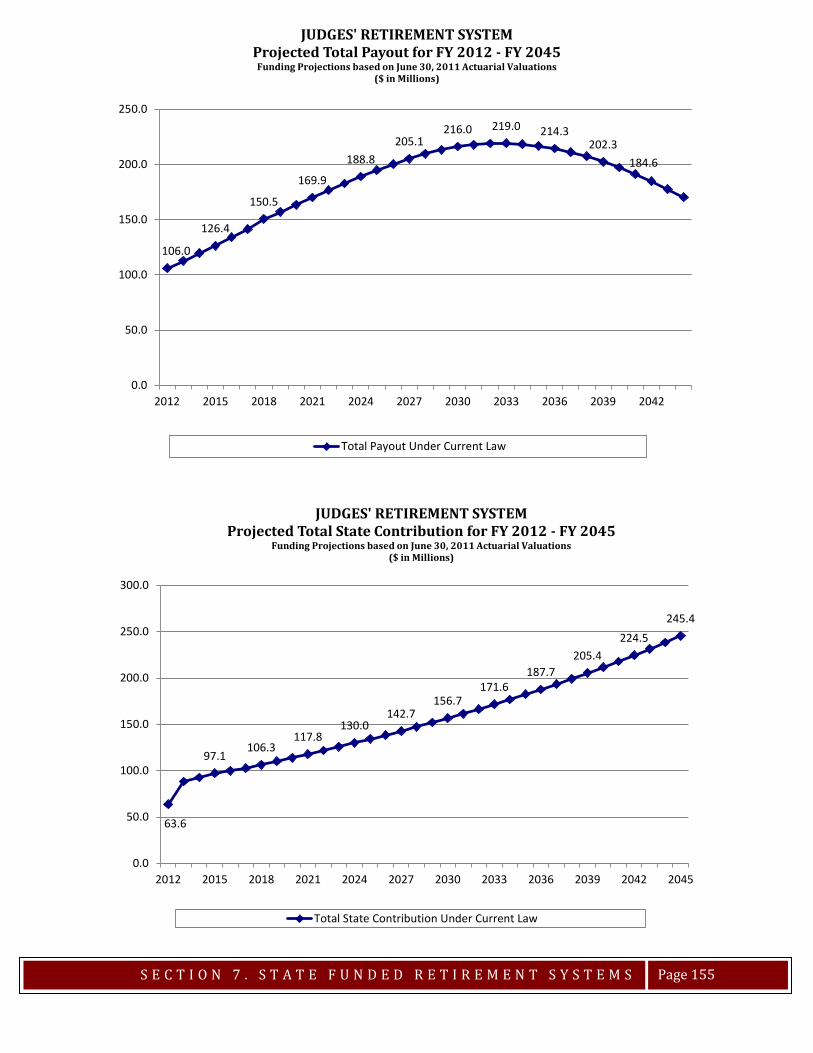
S E C T I O N 7 . S T A T E F U N D E D R E T I R E M E N T S Y S T E M S
Page 155
106.0
126.4
150.5
169.9
188.8205.1
216.0 219.0 214.3202.3
184.6
0.0
50.0
100.0
150.0
200.0
250.0
2012 2015 2018 2021 2024 2027 2030 2033 2036 2039 2042
JUDGES' RETIREMENT SYSTEMProjected Total Payout for FY 2012 - FY 2045Funding Projections based on June 30, 2011 Actuarial Valuations
($ in Millions)
Total Payout Under Current Law
63.6
97.1106.3
117.8130.0
142.7156.7
171.6187.7
205.4224.5
245.4
0.0
50.0
100.0
150.0
200.0
250.0
300.0
2012 2015 2018 2021 2024 2027 2030 2033 2036 2039 2042 2045
JUDGES' RETIREMENT SYSTEMProjected Total State Contribution for FY 2012 - FY 2045
Funding Projections based on June 30, 2011 Actuarial Valuations($ in Millions)
Total State Contribution Under Current Law

S E C T I O N 7 . S T A T E F U N D E D R E T I R E M E N T S Y S T E M S
Page 156
37.3%
50.9% 50.0% 50.0% 50.0% 50.0% 50.0% 50.0% 50.0% 50.0% 50.0% 50.0%
0.0%
10.0%
20.0%
30.0%
40.0%
50.0%
60.0%
2012 2015 2018 2021 2024 2027 2030 2033 2036 2039 2042 2045
JUDGES' RETIREMENT SYSTEMProjected State Contribution as a % of Payroll for FY 2012 - FY 2045
Funding Projections based on June 30, 2011 Actuarial Valuations
State Contribution as % of Payroll Under Current Law
63.6
88.292.6
97.1 99.8
0.0
20.0
40.0
60.0
80.0
100.0
120.0
2012 2013 2014 2015 2016
JUDGES' RETIREMENT SYSTEMProjected Total State Contribution for FY 2012 - FY 2016
Funding Projections based on June 30, 2011 Actuarial Valuations($ in Millions)
Total State Contribution Under Current Law
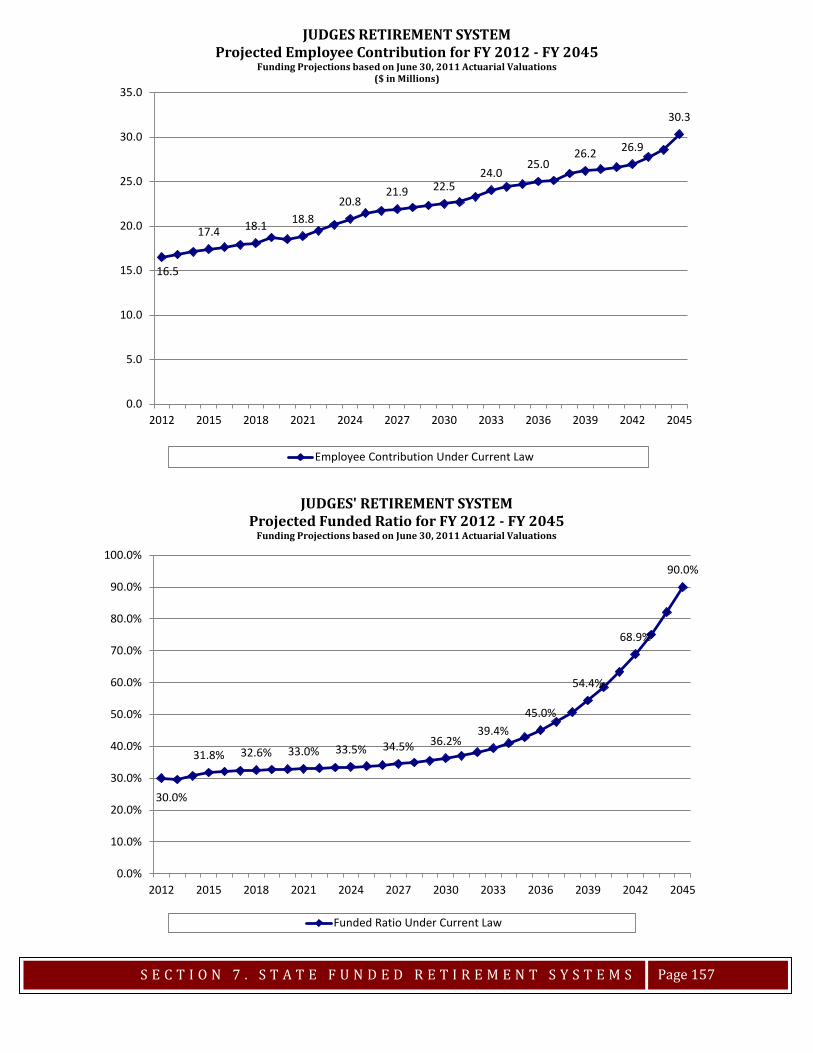
S E C T I O N 7 . S T A T E F U N D E D R E T I R E M E N T S Y S T E M S
Page 157
16.5
17.4 18.1 18.820.8
21.9 22.524.0
25.026.2 26.9
30.3
0.0
5.0
10.0
15.0
20.0
25.0
30.0
35.0
2012 2015 2018 2021 2024 2027 2030 2033 2036 2039 2042 2045
JUDGES RETIREMENT SYSTEMProjected Employee Contribution for FY 2012 - FY 2045
Funding Projections based on June 30, 2011 Actuarial Valuations($ in Millions)
Employee Contribution Under Current Law
30.0%
31.8% 32.6% 33.0% 33.5% 34.5% 36.2%39.4%
45.0%
54.4%
68.9%
90.0%
0.0%
10.0%
20.0%
30.0%
40.0%
50.0%
60.0%
70.0%
80.0%
90.0%
100.0%
2012 2015 2018 2021 2024 2027 2030 2033 2036 2039 2042 2045
JUDGES' RETIREMENT SYSTEMProjected Funded Ratio for FY 2012 - FY 2045
Funding Projections based on June 30, 2011 Actuarial Valuations
Funded Ratio Under Current Law
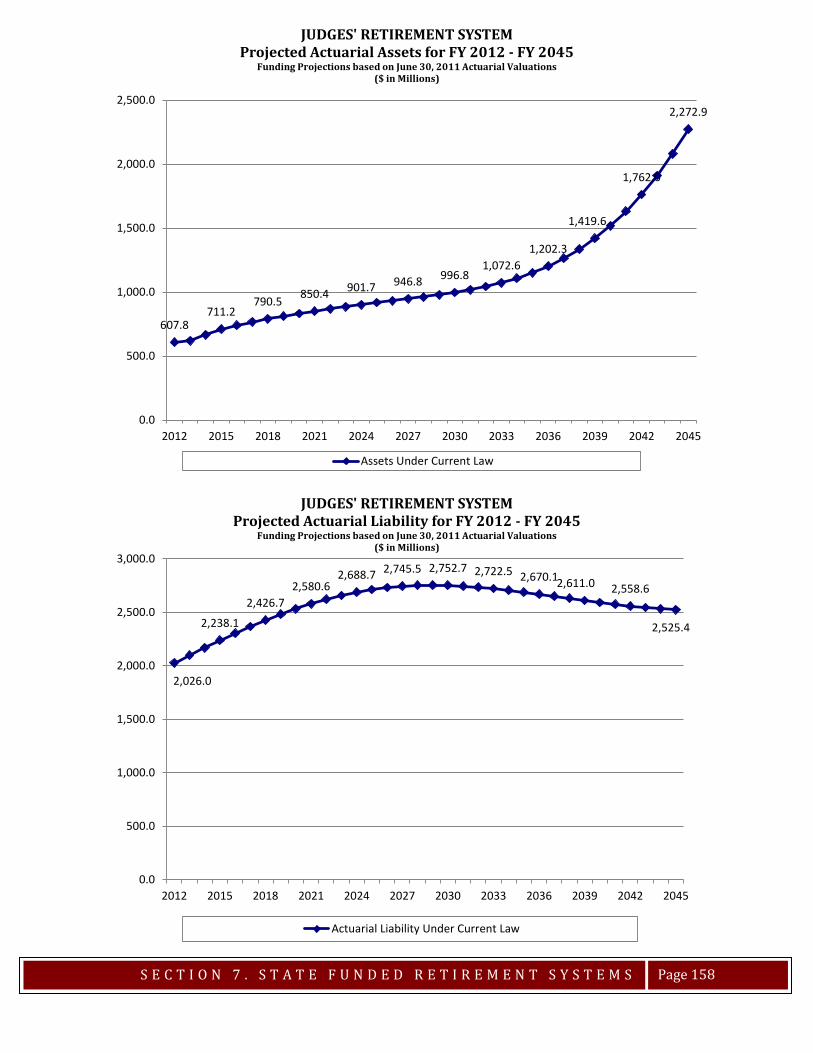
S E C T I O N 7 . S T A T E F U N D E D R E T I R E M E N T S Y S T E M S
Page 158
607.8711.2
790.5 850.4 901.7 946.8 996.81,072.6
1,202.3
1,419.6
1,762.0
2,272.9
0.0
500.0
1,000.0
1,500.0
2,000.0
2,500.0
2012 2015 2018 2021 2024 2027 2030 2033 2036 2039 2042 2045
JUDGES' RETIREMENT SYSTEMProjected Actuarial Assets for FY 2012 - FY 2045
Funding Projections based on June 30, 2011 Actuarial Valuations($ in Millions)
Assets Under Current Law
2,026.0
2,238.1
2,426.72,580.6
2,688.7 2,745.5 2,752.7 2,722.5 2,670.12,611.0 2,558.6
2,525.4
0.0
500.0
1,000.0
1,500.0
2,000.0
2,500.0
3,000.0
2012 2015 2018 2021 2024 2027 2030 2033 2036 2039 2042 2045
JUDGES' RETIREMENT SYSTEMProjected Actuarial Liability for FY 2012 - FY 2045
Funding Projections based on June 30, 2011 Actuarial Valuations($ in Millions)
Actuarial Liability Under Current Law

S E C T I O N 7 . S T A T E F U N D E D R E T I R E M E N T S Y S T E M S
Page 159
1,418.2
1,526.91,636.2
1,730.21,787.0
1,798.71,755.9
1,649.9
1,467.8
1,191.4
796.6
252.5
0.0
200.0
400.0
600.0
800.0
1,000.0
1,200.0
1,400.0
1,600.0
1,800.0
2,000.0
2012 2015 2018 2021 2024 2027 2030 2033 2036 2039 2042 2045
JUDGES' RETIREMENT SYSTEMProjected Unfunded Liability for FY 2012 - FY 2045
Funding Projections based on June 30, 2011 Actuarial Valuations($ in Millions)
Unfunded Liability Under Current Law

SECTION 8. ELEMENTARY & SECONDARY EDUCATION
Funding of Elementary and Secondary Education Education Regional graphs

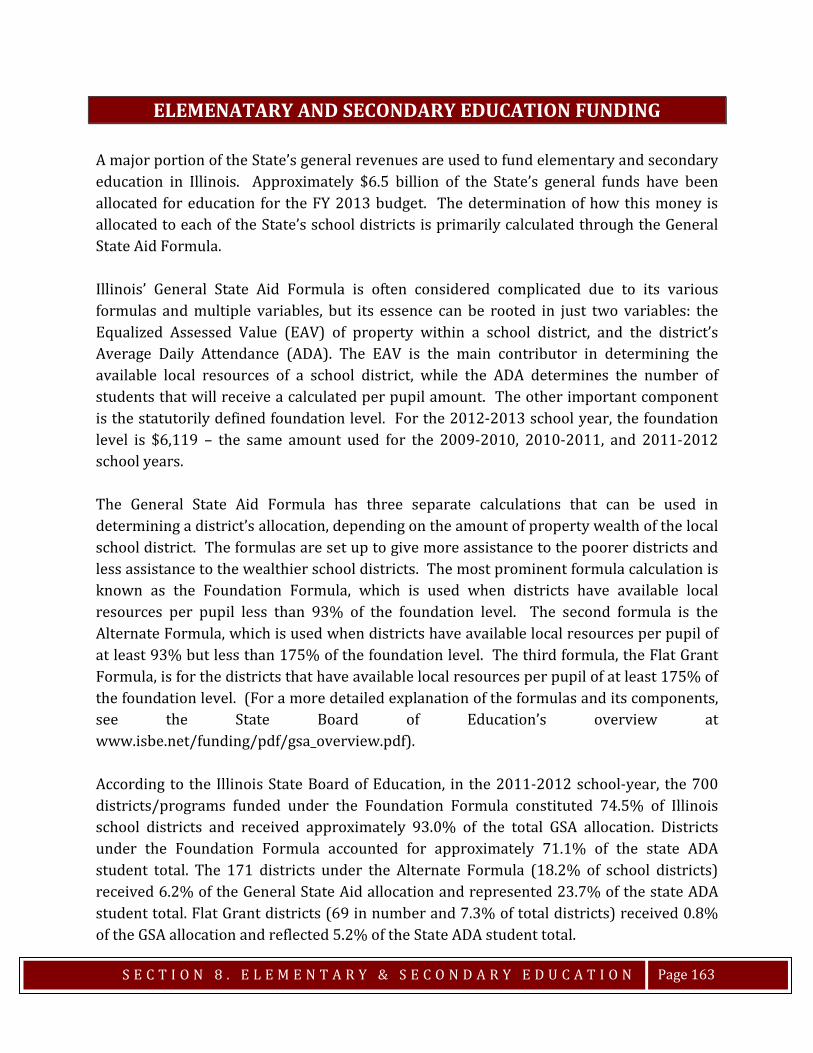
S E C T I O N 8 . E L E M E N T A R Y & S E C O N D A R Y E D U C A T I O N
Page 163
ELEMENATARY AND SECONDARY EDUCATION FUNDING A major portion of the State’s general revenues are used to fund elementary and secondary education in Illinois. Approximately $6.5 billion of the State’s general funds have been allocated for education for the FY 2013 budget. The determination of how this money is allocated to each of the State’s school districts is primarily calculated through the General State Aid Formula. Illinois’ General State Aid Formula is often considered complicated due to its various formulas and multiple variables, but its essence can be rooted in just two variables: the Equalized Assessed Value (EAV) of property within a school district, and the district’s Average Daily Attendance (ADA). The EAV is the main contributor in determining the available local resources of a school district, while the ADA determines the number of students that will receive a calculated per pupil amount. The other important component is the statutorily defined foundation level. For the 2012-2013 school year, the foundation level is $6,119 – the same amount used for the 2009-2010, 2010-2011, and 2011-2012 school years. The General State Aid Formula has three separate calculations that can be used in determining a district’s allocation, depending on the amount of property wealth of the local school district. The formulas are set up to give more assistance to the poorer districts and less assistance to the wealthier school districts. The most prominent formula calculation is known as the Foundation Formula, which is used when districts have available local resources per pupil less than 93% of the foundation level. The second formula is the Alternate Formula, which is used when districts have available local resources per pupil of at least 93% but less than 175% of the foundation level. The third formula, the Flat Grant Formula, is for the districts that have available local resources per pupil of at least 175% of the foundation level. (For a more detailed explanation of the formulas and its components, see the State Board of Education’s overview at www.isbe.net/funding/pdf/gsa_overview.pdf). According to the Illinois State Board of Education, in the 2011-2012 school-year, the 700 districts/programs funded under the Foundation Formula constituted 74.5% of Illinois school districts and received approximately 93.0% of the total GSA allocation. Districts under the Foundation Formula accounted for approximately 71.1% of the state ADA student total. The 171 districts under the Alternate Formula (18.2% of school districts) received 6.2% of the General State Aid allocation and represented 23.7% of the state ADA student total. Flat Grant districts (69 in number and 7.3% of total districts) received 0.8% of the GSA allocation and reflected 5.2% of the State ADA student total.
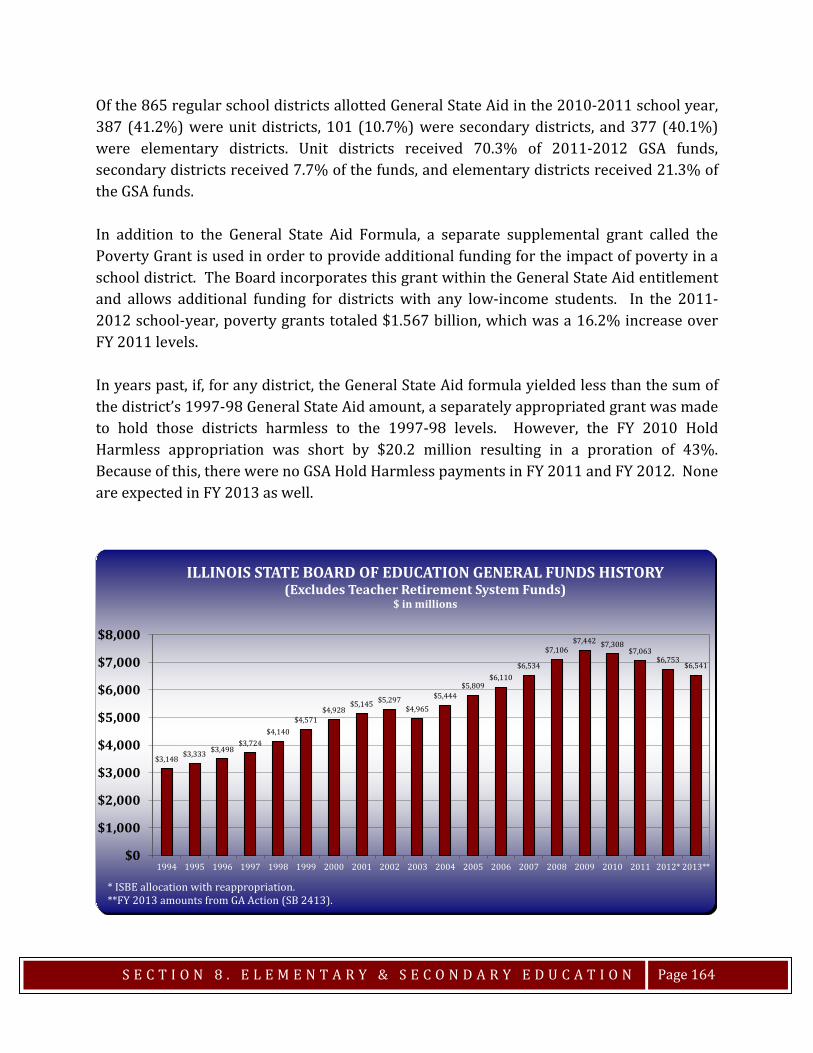
S E C T I O N 8 . E L E M E N T A R Y & S E C O N D A R Y E D U C A T I O N
Page 164
Of the 865 regular school districts allotted General State Aid in the 2010-2011 school year, 387 (41.2%) were unit districts, 101 (10.7%) were secondary districts, and 377 (40.1%) were elementary districts. Unit districts received 70.3% of 2011-2012 GSA funds, secondary districts received 7.7% of the funds, and elementary districts received 21.3% of the GSA funds. In addition to the General State Aid Formula, a separate supplemental grant called the Poverty Grant is used in order to provide additional funding for the impact of poverty in a school district. The Board incorporates this grant within the General State Aid entitlement and allows additional funding for districts with any low-income students. In the 2011-2012 school-year, poverty grants totaled $1.567 billion, which was a 16.2% increase over FY 2011 levels. In years past, if, for any district, the General State Aid formula yielded less than the sum of the district’s 1997-98 General State Aid amount, a separately appropriated grant was made to hold those districts harmless to the 1997-98 levels. However, the FY 2010 Hold Harmless appropriation was short by $20.2 million resulting in a proration of 43%. Because of this, there were no GSA Hold Harmless payments in FY 2011 and FY 2012. None are expected in FY 2013 as well.
$3,148 $3,333 $3,498$3,724
$4,140$4,571
$4,928$5,145 $5,297
$4,965
$5,444$5,809
$6,110$6,534
$7,106$7,442 $7,308
$7,063$6,753
$6,541
$0
$1,000
$2,000
$3,000
$4,000
$5,000
$6,000
$7,000
$8,000
1994 1995 1996 1997 1998 1999 2000 2001 2002 2003 2004 2005 2006 2007 2008 2009 2010 2011 2012* 2013**
ILLINOIS STATE BOARD OF EDUCATION GENERAL FUNDS HISTORY(Excludes Teacher Retirement System Funds)
$ in millions
* ISBE allocation with reappropriation. **FY 2013 amounts from GA Action (SB 2413).
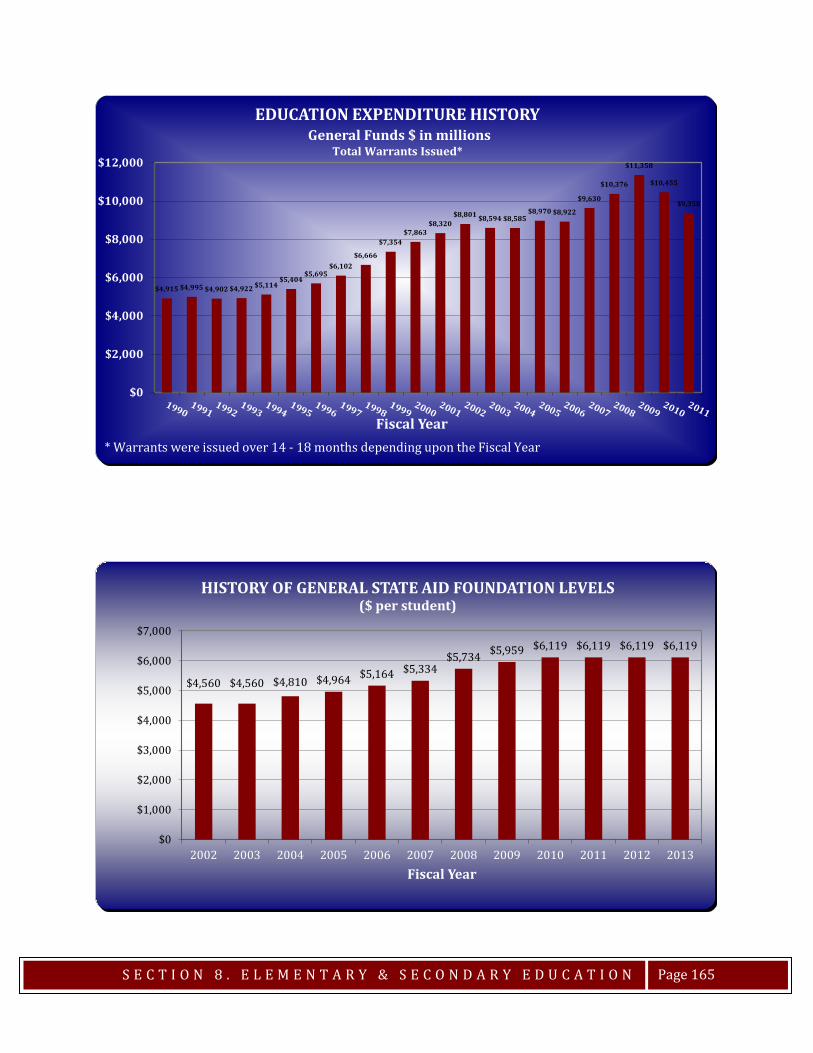
S E C T I O N 8 . E L E M E N T A R Y & S E C O N D A R Y E D U C A T I O N
Page 165
$4,915 $4,995 $4,902 $4,922 $5,114$5,404
$5,695$6,102
$6,666
$7,354$7,863
$8,320$8,801 $8,594 $8,585
$8,970 $8,922
$9,630
$10,376
$11,358
$10,455
$9,358
$0
$2,000
$4,000
$6,000
$8,000
$10,000
$12,000
Fiscal Year
EDUCATION EXPENDITURE HISTORYGeneral Funds $ in millions
Total Warrants Issued*
* Warrants were issued over 14 - 18 months depending upon the Fiscal Year
$4,560 $4,560 $4,810 $4,964 $5,164 $5,334$5,734 $5,959 $6,119 $6,119 $6,119 $6,119
$0
$1,000
$2,000
$3,000
$4,000
$5,000
$6,000
$7,000
2002 2003 2004 2005 2006 2007 2008 2009 2010 2011 2012 2013Fiscal Year
HISTORY OF GENERAL STATE AID FOUNDATION LEVELS($ per student)
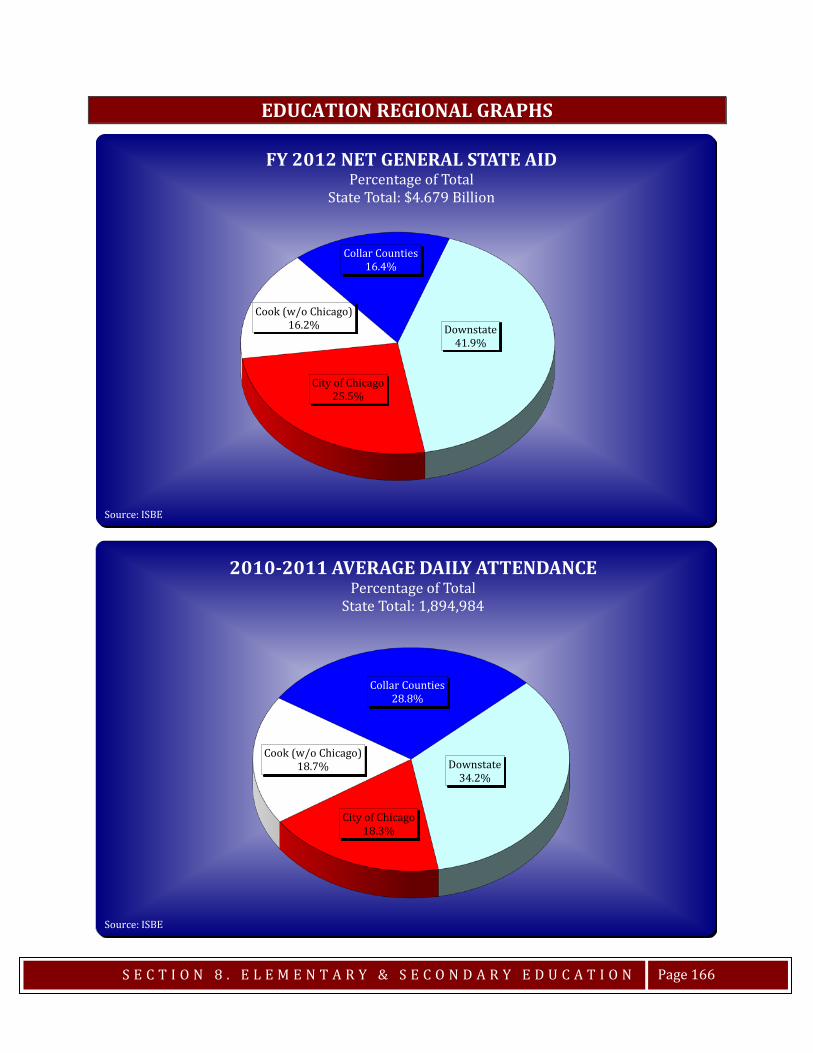
S E C T I O N 8 . E L E M E N T A R Y & S E C O N D A R Y E D U C A T I O N
Page 166
EDUCATION REGIONAL GRAPHS
City of Chicago25.5%
Cook (w/o Chicago)16.2%
Collar Counties16.4%
Downstate41.9%
FY 2012 NET GENERAL STATE AIDPercentage of Total
State Total: $4.679 Billion
Source: ISBE
City of Chicago18.3%
Cook (w/o Chicago)18.7%
Collar Counties28.8%
Downstate34.2%
2010-2011 AVERAGE DAILY ATTENDANCEPercentage of Total
State Total: 1,894,984
Source: ISBE
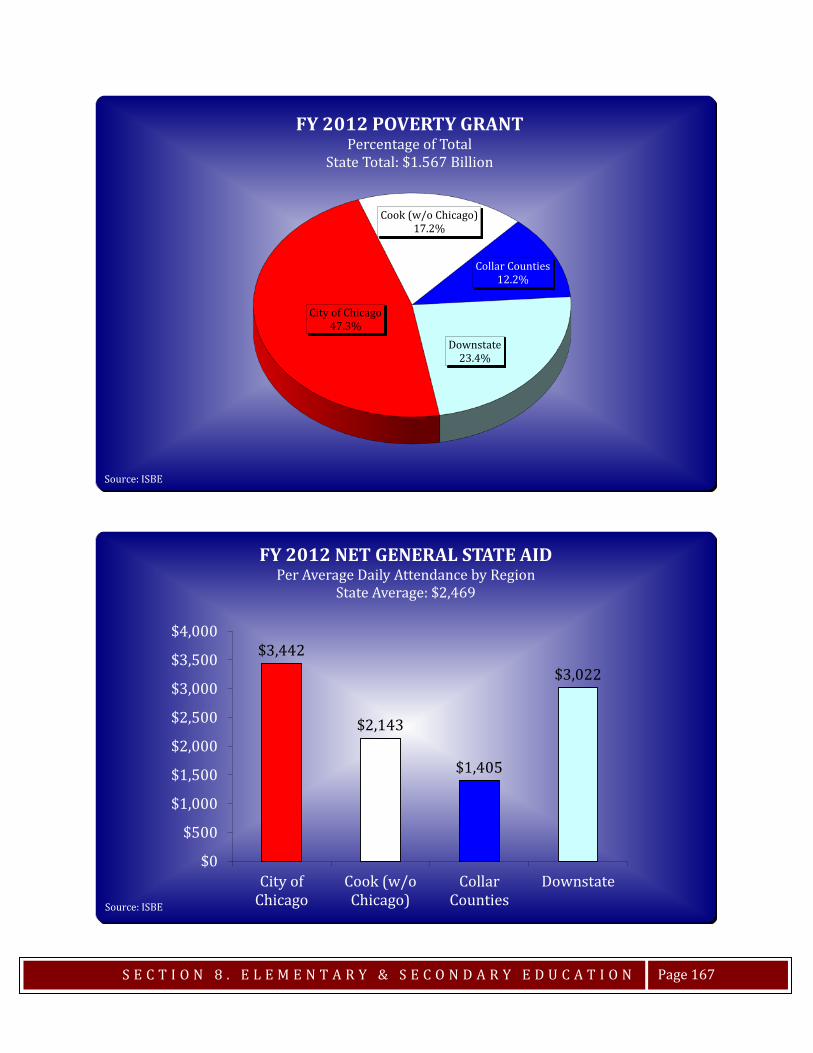
S E C T I O N 8 . E L E M E N T A R Y & S E C O N D A R Y E D U C A T I O N
Page 167
City of Chicago47.3%
Cook (w/o Chicago)17.2%
Collar Counties12.2%
Downstate23.4%
FY 2012 POVERTY GRANT Percentage of Total
State Total: $1.567 Billion
Source: ISBE
$3,442
$2,143
$1,405
$3,022
$0
$500
$1,000
$1,500
$2,000
$2,500
$3,000
$3,500
$4,000
City ofChicago
Cook (w/oChicago)
CollarCounties
Downstate
FY 2012 NET GENERAL STATE AID Per Average Daily Attendance by Region
State Average: $2,469
Source: ISBE


SECTION 9. MEDICAID
Medicaid Requirements Medicaid Enrollment Medicaid Cost per Participant Medicaid Liability Medicaid Funding Medicaid Payment Cycle

S E C T I O N 9 . M E D I C A I D
Page 171
MEDICAID REQUIREMENTS The Illinois Department of Healthcare and Family Services (HFS) is the sole administrator of the State’s Medicaid program. HFS serves as the State’s largest insurer, insuring approximately 2.9 million people. Medicaid is authorized under Title XIX of the Social Security Act. At the State level, the Medical Assistance program (Medicaid and other programs) are guided by Article 5 of the Illinois Public Aid Code. The laws and regulations that govern the Medicaid program are voluminous and complex. The items listed below are the basic requirements the State must follow in offering Medicaid. (1) Operation. The Medicaid program must:
• Operate statewide. • Provide beneficiaries freedom of choice of providers (enroll any willing and
qualified provider). • Provide comparable services to all members of each class of beneficiaries. • Provide transportation to and from a source of medical care. • Be overseen by a single State agency.
(2) Funding and payments. The Medicaid program must: • Fund the State plan. At minimum, 40 percent of the non-federal share must be from
the State funds. • Operate an automated claims processing system. • Require providers to submit claims within 12 months of the date of service. • Pay claims timely. Clean claims for practitioners (including shared health facilities),
hospitals, and nursing facilities—90% within 30 days of receipt; 99% within 90 days of receipt. All other clean claims must be paid within 12 months of receipt.
• Pay for services furnished in another State to the same extent that it would pay for services furnished within its boundaries.
(3) Populations. The Medicaid program must cover categorically needy individuals:
• Families who meet the AFDC eligibility requirements in effect on July 16, 1996. • Children under 6 years of age in families whose income is at or below 133 % of the
federal poverty guideline (FPL). • Children 6 to 19 years of age in families whose income up to 100% of the FPL. • Caretakers (relatives or legal guardians who take care of children under 18 (or 19 if
still in high school) years of age). • Pregnant women in families whose income is at or below 133% of the FPL. • Persons who are aged, blind, or disabled who meet the AABD eligibility
requirements in effect on January 1, 1972. • Individuals and couples who are living in medical institutions and who have
monthly income up to 300% of the federal SSI income standard. • Children for whom adoption assistance or foster care maintenance payments are
made under Title IV-E.
S E C T I O N 9 . M E D I C A I D
Page 172
And certain needs of the following special populations: • Treatment of an emergency medical condition to certain undocumented non-
citizens. • Medicare premiums, deductibles and coinsurance for individuals whose income is
at or below 100% of the FPL. • Medicare premiums for individuals with income greater than 100% but less than
135% of the FPL.
A State need not cover medically needy persons, but if it elects to do so, it must cover: • Pregnant women through a 60-day postpartum period. • Children under age 18 years of age. • Certain newborns for one year. • Certain protected blind persons.
(4) Required services for categorically needy are entitled to the following services.
• Ambulatory services provided by rural health clinics and federally qualified health centers.
• Ambulatory services to presumptively eligible pregnant women. • Early and periodic screening, diagnosis and treatment for individuals under 21
years of age. • Emergency services to non-citizens. • Family planning services and supplies. • Home health, including home health aide, medical supplies, equipment and
appliances, nursing services, physical, occupational and speech therapies, and audiology services.
• Inpatient hospital services (other than those provided in an institution for mental diseases).
• Medical and surgical services performed by a dentist. • Nurse practitioner (pediatric and family only). • Nurse-midwife services. • Nursing facility and home health services for individuals 21 years of age and older. • Outpatient hospital services. • Other laboratory and x-ray services. • Physician services. • Pregnancy-related services and services for other conditions that might complicate
pregnancy.

S E C T I O N 9 . M E D I C A I D
Page 173
MEDICAID ENROLLMENT The chart below examines historical Medicaid enrollment. In FY 2001, the Illinois Medicaid population was 1,522,659. Since that time, the Medicaid population has grown substantially. The most recent enrollment figures from FY 2011 place the Medicaid population at 3,059,990, or more than double the FY 2001 population. The largest population group, accounting for 2,404,449 participants, is Kids/Pregnant Women/Parents. According to State FY 2011 data, this group accounts for $4.3 billion in GRF appropriation. While only representing 8.8 percent of the overall Medicaid population, the elderly, blind and disabled account for 30.8% of overall Medicaid spending. The chart on the following page compares Medicaid population with overall FY 2011 GRF appropriations by population category.
0
500,000
1,000,000
1,500,000
2,000,000
2,500,000
3,000,000
3,500,000
Fiscal Year
HISTORIC MEDICAID ENROLLMENT
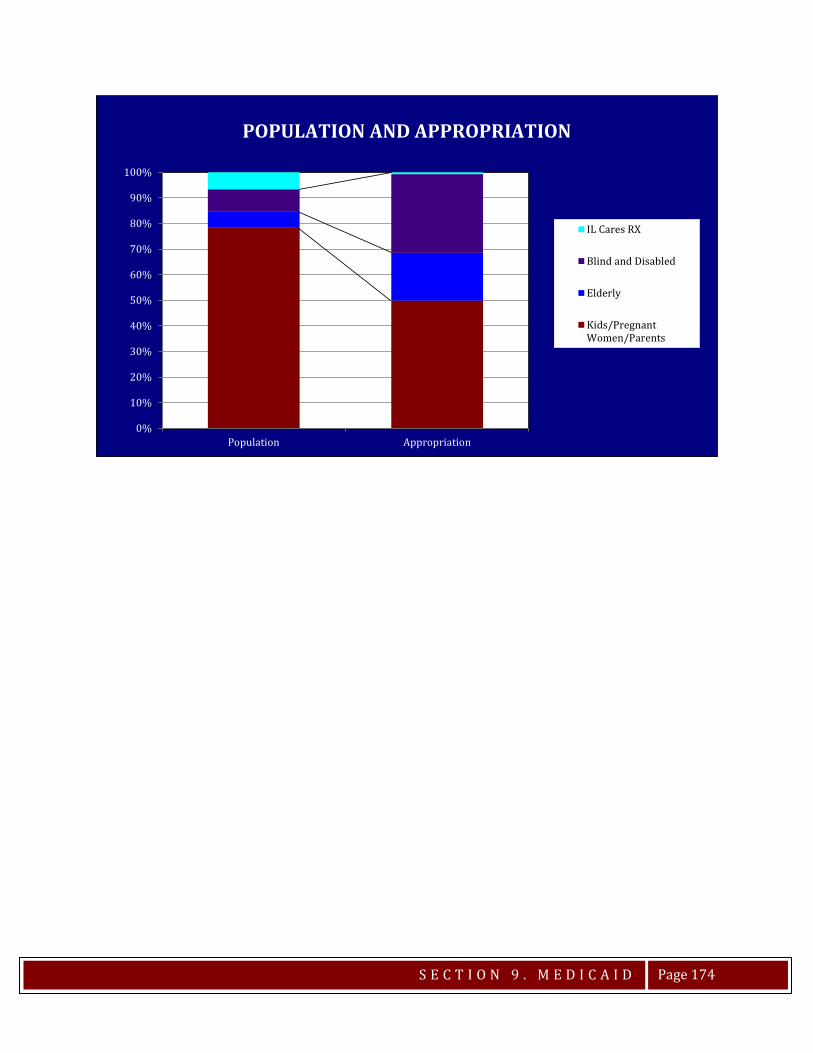
S E C T I O N 9 . M E D I C A I D
Page 174
0%
10%
20%
30%
40%
50%
60%
70%
80%
90%
100%
Population Appropriation
IL Cares RX
Blind and Disabled
Elderly
Kids/PregnantWomen/Parents
POPULATION AND APPROPRIATION

S E C T I O N 9 . M E D I C A I D
Page 175
MEDICAID COST PER PARTICIPANT Based on information provided to the Commission from HFS, it is apparent that the cost per participant for elderly, blind and disabled is expensive. In fact, for the blind and disabled category the cost per participant annually in FY 2011 is $9,904. Likewise, the cost per participant for elderly Medicaid enrollees is $8,908. The table on the following page compares the various population components of Medicaid with their corresponding appropriation amounts to calculate the cost per participant.
Population Group Enrollment Appropriation Cost Per ParticipantElderly 181,593 $1,617,678,000 $8,908 IL Cares Rx 203,878 $62,800,000 $308 Blind/Disabled 270,070 $2,674,740,000 $9,904 Kids/Pregnant Women/Parents 2,404,449 $4,333,283,000 $1,802
Total 3,059,990 $8,688,501,000 $2,839
MEDICAID COST PER PARTICIPANT
Includes only claims based liabilities.
Source: HFSIl Cares Rx is a Prescription limited benefit program.
(FY 2011)
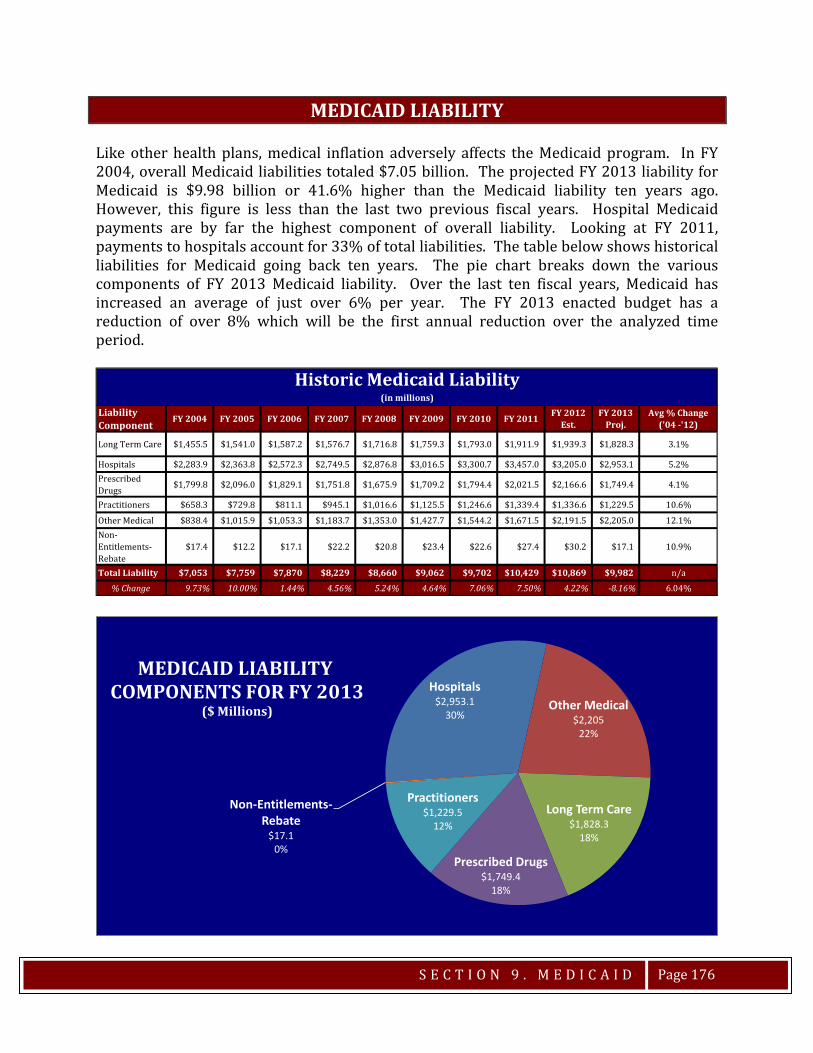
S E C T I O N 9 . M E D I C A I D
Page 176
MEDICAID LIABILITY Like other health plans, medical inflation adversely affects the Medicaid program. In FY 2004, overall Medicaid liabilities totaled $7.05 billion. The projected FY 2013 liability for Medicaid is $9.98 billion or 41.6% higher than the Medicaid liability ten years ago. However, this figure is less than the last two previous fiscal years. Hospital Medicaid payments are by far the highest component of overall liability. Looking at FY 2011, payments to hospitals account for 33% of total liabilities. The table below shows historical liabilities for Medicaid going back ten years. The pie chart breaks down the various components of FY 2013 Medicaid liability. Over the last ten fiscal years, Medicaid has increased an average of just over 6% per year. The FY 2013 enacted budget has a reduction of over 8% which will be the first annual reduction over the analyzed time period.
Hospitals$2,953.1
30%Other Medical
$2,20522%
Long Term Care$1,828.3
18%
Prescribed Drugs$1,749.4
18%
Practitioners$1,229.5
12%
Non-Entitlements-Rebate
$17.10%
MEDICAID LIABILITY COMPONENTS FOR FY 2013
($ Millions)
Liability Component
FY 2004 FY 2005 FY 2006 FY 2007 FY 2008 FY 2009 FY 2010 FY 2011 FY 2012 Est.
FY 2013 Proj.
Avg % Change ('04 -'12)
Long Term Care $1,455.5 $1,541.0 $1,587.2 $1,576.7 $1,716.8 $1,759.3 $1,793.0 $1,911.9 $1,939.3 $1,828.3 3.1%
Hospitals $2,283.9 $2,363.8 $2,572.3 $2,749.5 $2,876.8 $3,016.5 $3,300.7 $3,457.0 $3,205.0 $2,953.1 5.2%Prescribed Drugs $1,799.8 $2,096.0 $1,829.1 $1,751.8 $1,675.9 $1,709.2 $1,794.4 $2,021.5 $2,166.6 $1,749.4 4.1%
Practitioners $658.3 $729.8 $811.1 $945.1 $1,016.6 $1,125.5 $1,246.6 $1,339.4 $1,336.6 $1,229.5 10.6%
Other Medical $838.4 $1,015.9 $1,053.3 $1,183.7 $1,353.0 $1,427.7 $1,544.2 $1,671.5 $2,191.5 $2,205.0 12.1%Non-Entitlements-Rebate
$17.4 $12.2 $17.1 $22.2 $20.8 $23.4 $22.6 $27.4 $30.2 $17.1 10.9%
Total Liability $7,053 $7,759 $7,870 $8,229 $8,660 $9,062 $9,702 $10,429 $10,869 $9,982 n/a% Change 9.73% 10.00% 1.44% 4.56% 5.24% 4.64% 7.06% 7.50% 4.22% -8.16% 6.04%
Historic Medicaid Liability(in millions)
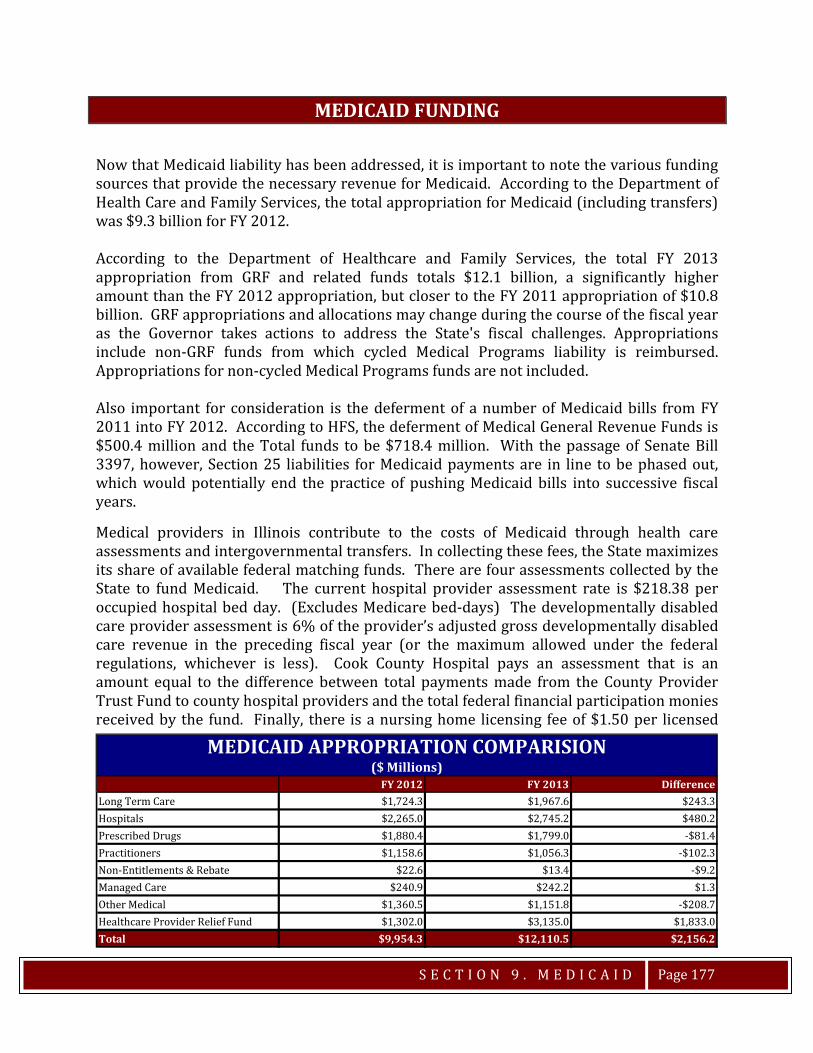
S E C T I O N 9 . M E D I C A I D
Page 177
MEDICAID FUNDING
Now that Medicaid liability has been addressed, it is important to note the various funding sources that provide the necessary revenue for Medicaid. According to the Department of Health Care and Family Services, the total appropriation for Medicaid (including transfers) was $9.3 billion for FY 2012. According to the Department of Healthcare and Family Services, the total FY 2013 appropriation from GRF and related funds totals $12.1 billion, a significantly higher amount than the FY 2012 appropriation, but closer to the FY 2011 appropriation of $10.8 billion. GRF appropriations and allocations may change during the course of the fiscal year as the Governor takes actions to address the State's fiscal challenges. Appropriations include non-GRF funds from which cycled Medical Programs liability is reimbursed. Appropriations for non-cycled Medical Programs funds are not included. Also important for consideration is the deferment of a number of Medicaid bills from FY 2011 into FY 2012. According to HFS, the deferment of Medical General Revenue Funds is $500.4 million and the Total funds to be $718.4 million. With the passage of Senate Bill 3397, however, Section 25 liabilities for Medicaid payments are in line to be phased out, which would potentially end the practice of pushing Medicaid bills into successive fiscal years.
Medical providers in Illinois contribute to the costs of Medicaid through health care assessments and intergovernmental transfers. In collecting these fees, the State maximizes its share of available federal matching funds. There are four assessments collected by the State to fund Medicaid. The current hospital provider assessment rate is $218.38 per occupied hospital bed day. (Excludes Medicare bed-days) The developmentally disabled care provider assessment is 6% of the provider’s adjusted gross developmentally disabled care revenue in the preceding fiscal year (or the maximum allowed under the federal regulations, whichever is less). Cook County Hospital pays an assessment that is an amount equal to the difference between total payments made from the County Provider Trust Fund to county hospital providers and the total federal financial participation monies received by the fund. Finally, there is a nursing home licensing fee of $1.50 per licensed
FY 2012 FY 2013 DifferenceLong Term Care $1,724.3 $1,967.6 $243.3Hospitals $2,265.0 $2,745.2 $480.2Prescribed Drugs $1,880.4 $1,799.0 -$81.4Practitioners $1,158.6 $1,056.3 -$102.3Non-Entitlements & Rebate $22.6 $13.4 -$9.2Managed Care $240.9 $242.2 $1.3Other Medical $1,360.5 $1,151.8 -$208.7Healthcare Provider Relief Fund $1,302.0 $3,135.0 $1,833.0Total $9,954.3 $12,110.5 $2,156.2
MEDICAID APPROPRIATION COMPARISION($ Millions)
S E C T I O N 9 . M E D I C A I D
Page 178
bed day. Illinois also uses intergovernmental transfers (IGT) to support Medicaid services. An IGT is essentially a transfer between government entities. When local and university health care entities transfer funds to the state under an IGT agreement, these funds are used for expanded Medicaid payments supplemented by federal matching funds.
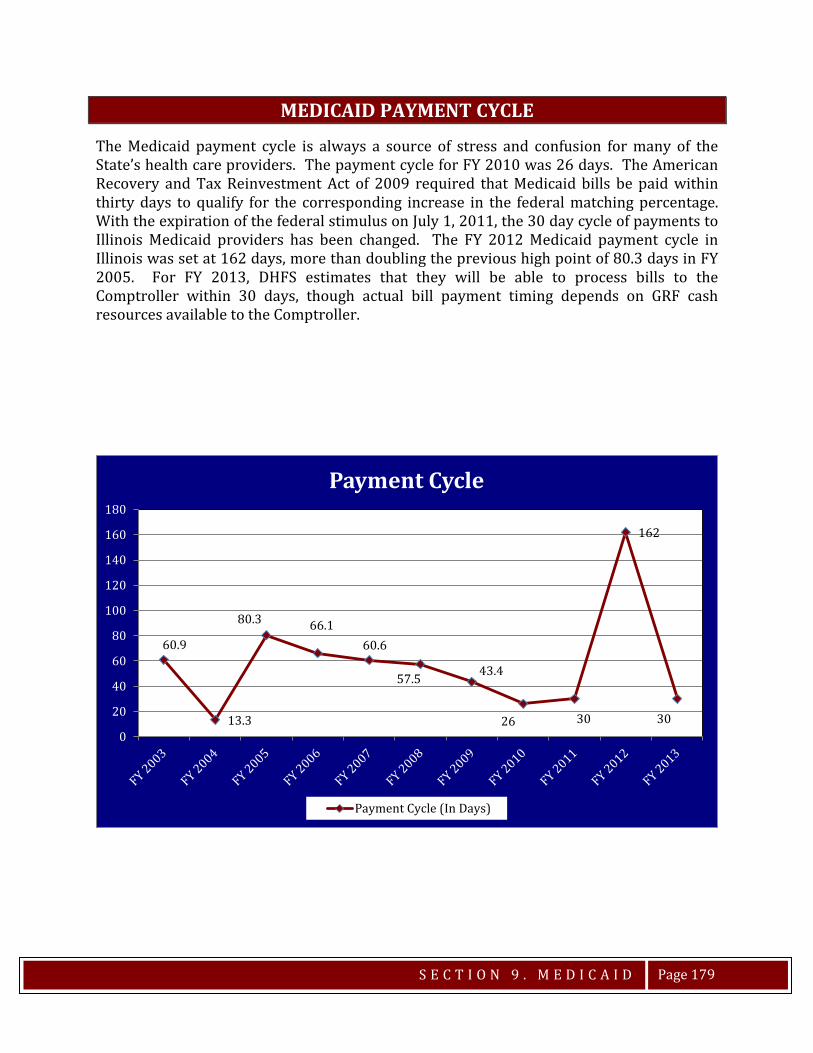
S E C T I O N 9 . M E D I C A I D
Page 179
MEDICAID PAYMENT CYCLE
The Medicaid payment cycle is always a source of stress and confusion for many of the State’s health care providers. The payment cycle for FY 2010 was 26 days. The American Recovery and Tax Reinvestment Act of 2009 required that Medicaid bills be paid within thirty days to qualify for the corresponding increase in the federal matching percentage. With the expiration of the federal stimulus on July 1, 2011, the 30 day cycle of payments to Illinois Medicaid providers has been changed. The FY 2012 Medicaid payment cycle in Illinois was set at 162 days, more than doubling the previous high point of 80.3 days in FY 2005. For FY 2013, DHFS estimates that they will be able to process bills to the Comptroller within 30 days, though actual bill payment timing depends on GRF cash resources available to the Comptroller.
60.9
13.3
80.3 66.160.6
57.5 43.4
26 30
162
300
20
40
60
80
100
120
140
160
180
Payment Cycle
Payment Cycle (In Days)

SECTION 10. DEBT OF THE STATE OF ILLINOIS
Debt of the State of Illinois Pension Obligations Bonds Short Term Borrowing Illinois Credit Ratings History


S E C T I O N 1 0 . D E B T O F T H E S T A T E O F I L L I N O I S
Page 183
DEBT OF THE STATE OF ILLINOIS In FY 2012, the State sold $1.375 billion in General Obligation bonds for capital projects, $1.9 billion in General Obligation Refunding, and $725 million in Build Illinois bonds. Due to low interest rates and a favorable market, the State sold more Build Illinois bonds in FY 2012 than originally planned. Because of these additional sales Build Illinois bond sales in FY 2013 may be less than estimated. Approximately $6.3 billion in G.O. and Build Illinois bonds have been sold for the Governor’s $31 billion Capital Plan.
FY 2012** FY 2012 $ Change % Change FY 2013** $ Change % ChangeBond Sales estimated actuals estimated General Obligation 1,550.0 1,375.0 -175.0 -11.3% 2,000.0 625.0 45.5% Revenue 450.0 725.0 275.0 61.1% 300.0 -425.0 -58.6%Total $2,000.0 $2,100.0 $100.0 5.0% $2,300.0 $200.0 9.5%
Outstanding Principal General Obligation 27,786.0 27,611.0 -175.0 -0.6% 28,085.0 474.0 1.7% Revenue 2,529.8 2,805.0 275.2 10.9% 2,898.0 93.0 3.3%Total $30,315.8 $30,416.0 $100.2 0.3% $30,983.0 $567.0 1.9%Debt Service General Obligation $2,879.5 $2,879.5 0.0 0.0% $2,938.0 58.5 2.0% Revenue $313.4 $313.4 0.0 0.0% $358.0 44.6 14.2%Total $3,192.9 $3,192.9 $0.0 0.0% $3,296.0 $103.1 3.2%
General Revenues^ $33,392.0 $33,797.0 $405.0 1.2% $33,880.0 $83.0 0.2%
G.O. & RevenueDebt Service as %General Revenues 9.56% 9.45% 9.73%
GO Bond Rating Moody's A2 A2 Standard & Poor's A+ A+ Fitch A A
ILLINOIS BONDS AT A GLANCE(in millions)
**CGFA estimates for FY 2013 are based on the Governor’s FY 2013 Budget Request and the latest GOMB Bond Sale Disclosures.^General Revenues estimate shown for FY 2012 and FY 2013 are from CGFA revised estimates.Note: Bond Sales include Pension Bonds, but do not include refunding sales or Short-term borrowing.

S E C T I O N 1 0 . D E B T O F T H E S T A T E O F I L L I N O I S
Page 184
The Illinois Department of Employment Security sold $1.5 billion in Unemployment Bonds in July of 2012. The bonds are independent of the State’s debt program and will be repaid by Illinois’ unemployment insurance fund-building receipts.
(in billions) Authorization Un-Issued Appropriated† Available after appropriations
Capital Facilities $8.900 $1.734 $10.150 -$1.250School Construction $4.216 $0.654 $4.700 -$0.484Anti-Pollution $0.659 $0.112 $0.661 -$0.002Transportation A $5.432 $0.647 $5.395 $0.037Transportation B $4.763 $2.059 $5.772 -$1.009Transportation D $2.249 $0.989 $3.554 -$1.305Coal & Energy Development $0.713 $0.564 $0.220 $0.493
SUBTOTAL $26.933 $6.759 $30.452 -$3.519Pension bonds $17.562 $0.396 $17.562 $0.000Medicaid Funding Series $0.250 $0.004 $0.250 $0.000
TOTAL $44.745 $7.159 $48.264 -$3.519Limit Un-Issued Outstanding Available
G.O. Refunding° $4.839 $0.692 $4.147 $0.692Authorization Un-Issued Appropriated† Available after
appropriationsBuild Illinois $5.703 $1.065 $6.525 -$0.822
Limit Un-Issued Outstanding Available Build IL Refunding Unlimited Unlimited $0.821 Unlimited
Authorization Un-Issued Outstanding Available Civic Center $0.200 $0.157 $0.043 0.157
Limit Un-Issued Outstanding Available Civic Center Refunding Unlimited Unlimited $0.030 Unlimited
Excludes Bond issue premiums.
STATUS OF G.O. AND STATE-ISSUED REVENUE BONDSas of May 31, 2012
Source: Illinois Office of the Comptroller
†Includes cumulative expenditures for prior years up through FY 2012 appropriations and reappropriations.°Refunding is limited only by how much is outstanding at one time. As principal amounts are paid off, those amounts become available for future refundings.
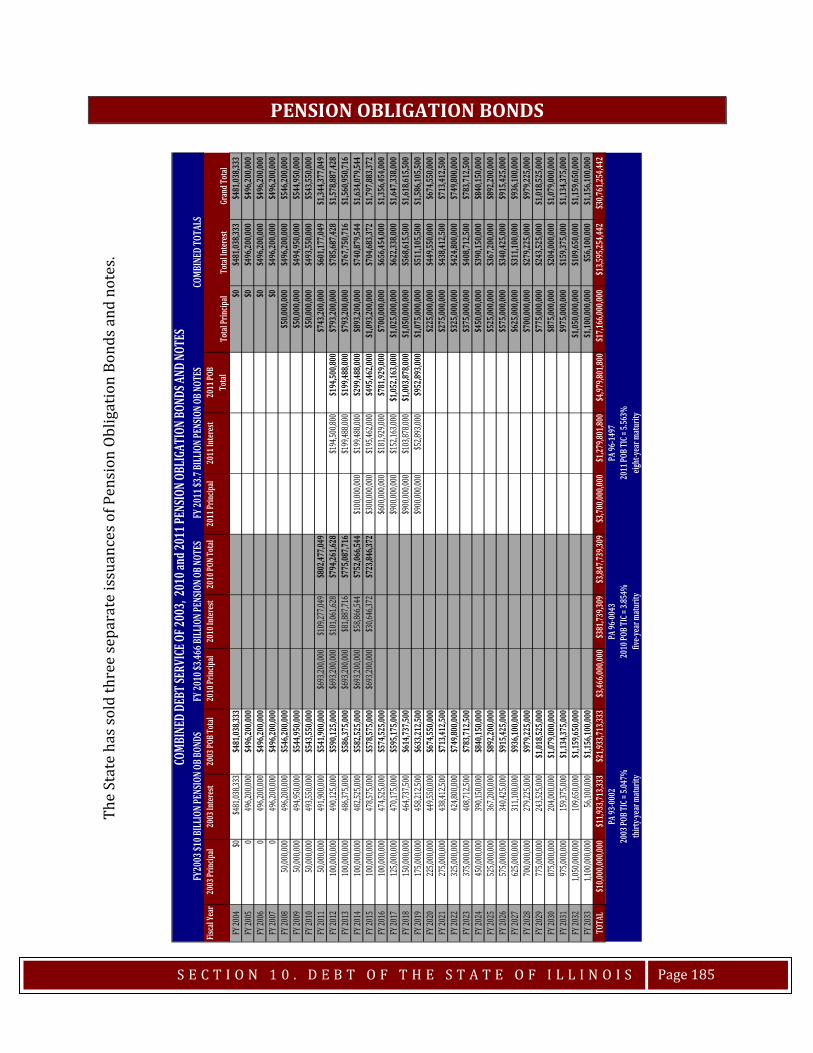
S E C T I O N 1 0 . D E B T O F T H E S T A T E O F I L L I N O I S
Page 185
PENSION OBLIGATION BONDS
2011
Princ
ipal
2011
Inter
est
2011
POB
Total
FY 20
04$0
$4
81,03
8,333
$4
81,03
8,333
$0
$481
,038,3
33$4
81,03
8,333
FY 20
050
496,2
00,00
0$4
96,20
0,000
$0
$496
,200,0
00$4
96,20
0,000
FY 20
060
496,2
00,00
0$4
96,20
0,000
$0
$496
,200,0
00$4
96,20
0,000
FY 20
070
496,2
00,00
0$4
96,20
0,000
$0
$496
,200,0
00$4
96,20
0,000
FY 20
0850
,000,0
0049
6,200
,000
$546
,200,0
00
$50,0
00,00
0$4
96,20
0,000
$546
,200,0
00FY
2009
50,00
0,000
494,9
50,00
0$5
44,95
0,000
$5
0,000
,000
$494
,950,0
00$5
44,95
0,000
FY 20
1050
,000,0
0049
3,550
,000
$543
,550,0
00
$50,0
00,00
0$4
93,55
0,000
$543
,550,0
00FY
2011
50,00
0,000
491,9
00,00
0$5
41,90
0,000
$6
93,20
0,000
$109
,277,0
49$8
02,47
7,049
$743
,200,0
00$6
01,17
7,049
$1,34
4,377
,049
FY 20
1210
0,000
,000
490,1
25,00
0$5
90,12
5,000
$6
93,20
0,000
$101
,061,6
28$7
94,26
1,628
$194
,500,8
00$1
94,50
0,800
$793
,200,0
00$7
85,68
7,428
$1,57
8,887
,428
FY 20
1310
0,000
,000
486,3
75,00
0$5
86,37
5,000
$6
93,20
0,000
$81,8
87,71
6$7
75,08
7,716
$199
,488,0
00$1
99,48
8,000
$793
,200,0
00$7
67,75
0,716
$1,56
0,950
,716
FY 20
1410
0,000
,000
482,5
25,00
0$5
82,52
5,000
$6
93,20
0,000
$58,8
66,54
4$7
52,06
6,544
$100
,000,0
00$1
99,48
8,000
$299
,488,0
00$8
93,20
0,000
$740
,879,5
44$1
,634,0
79,54
4FY
2015
100,0
00,00
047
8,575
,000
$578
,575,0
00
$693
,200,0
00$3
0,646
,372
$723
,846,3
72$3
00,00
0,000
$195
,462,0
00$4
95,46
2,000
$1,09
3,200
,000
$704
,683,3
72$1
,797,8
83,37
2FY
2016
100,0
00,00
047
4,525
,000
$574
,525,0
00
$600
,000,0
00$1
81,92
9,000
$781
,929,0
00$7
00,00
0,000
$656
,454,0
00$1
,356,4
54,00
0FY
2017
125,0
00,00
047
0,175
,000
$595
,175,0
00
$900
,000,0
00$1
52,16
3,000
$1,05
2,163
,000
$1,02
5,000
,000
$622
,338,0
00$1
,647,3
38,00
0FY
2018
150,0
00,00
046
4,737
,500
$614
,737,5
00
$900
,000,0
00$1
03,87
8,000
$1,00
3,878
,000
$1,05
0,000
,000
$568
,615,5
00$1
,618,6
15,50
0FY
2019
175,0
00,00
045
8,212
,500
$633
,212,5
00
$900
,000,0
00$5
2,893
,000
$952
,893,0
00$1
,075,0
00,00
0$5
11,10
5,500
$1,58
6,105
,500
FY 20
2022
5,000
,000
449,5
50,00
0$6
74,55
0,000
$2
25,00
0,000
$449
,550,0
00$6
74,55
0,000
FY 20
2127
5,000
,000
438,4
12,50
0$7
13,41
2,500
$2
75,00
0,000
$438
,412,5
00$7
13,41
2,500
FY 20
2232
5,000
,000
424,8
00,00
0$7
49,80
0,000
$3
25,00
0,000
$424
,800,0
00$7
49,80
0,000
FY 20
2337
5,000
,000
408,7
12,50
0$7
83,71
2,500
$3
75,00
0,000
$408
,712,5
00$7
83,71
2,500
FY 20
2445
0,000
,000
390,1
50,00
0$8
40,15
0,000
$4
50,00
0,000
$390
,150,0
00$8
40,15
0,000
FY 20
2552
5,000
,000
367,2
00,00
0$8
92,20
0,000
$5
25,00
0,000
$367
,200,0
00$8
92,20
0,000
FY 20
2657
5,000
,000
340,4
25,00
0$9
15,42
5,000
$5
75,00
0,000
$340
,425,0
00$9
15,42
5,000
FY 20
2762
5,000
,000
311,1
00,00
0$9
36,10
0,000
$6
25,00
0,000
$311
,100,0
00$9
36,10
0,000
FY 20
2870
0,000
,000
279,2
25,00
0$9
79,22
5,000
$7
00,00
0,000
$279
,225,0
00$9
79,22
5,000
FY 20
2977
5,000
,000
243,5
25,00
0$1
,018,5
25,00
0 $7
75,00
0,000
$243
,525,0
00$1
,018,5
25,00
0FY
2030
875,0
00,00
020
4,000
,000
$1,07
9,000
,000
$875
,000,0
00$2
04,00
0,000
$1,07
9,000
,000
FY 20
3197
5,000
,000
159,3
75,00
0$1
,134,3
75,00
0 $9
75,00
0,000
$159
,375,0
00$1
,134,3
75,00
0FY
2032
1,050
,000,0
0010
9,650
,000
$1,15
9,650
,000
$1,05
0,000
,000
$109
,650,0
00$1
,159,6
50,00
0FY
2033
1,100
,000,0
0056
,100,0
00$1
,156,1
00,00
0 $1
,100,0
00,00
0$5
6,100
,000
$1,15
6,100
,000
TOTA
L$1
0,000
,000,0
00
$11,9
33,71
3,333
$2
1,933
,713,3
33
$3,46
6,000
,000
$381
,739,3
09
$3,84
7,739
,309
$3,70
0,000
,000
$1,27
9,801
,800
$4,97
9,801
,800
$17,1
66,00
0,000
$13,5
95,25
4,442
$30,7
61,25
4,442
2011
POB T
IC = 5
.563%
PA 93
-0002
PA 96
-0043
PA 96
-1497
thirt
y-yea
r matu
rity
five-y
ear m
aturit
yeig
ht-ye
ar m
aturit
y
2010
Princ
ipal
2010
Inter
est
2010
PON T
otal
FY20
03 $1
0 BILL
ION P
ENSIO
N OB B
ONDS
Fisca
l Yea
r
2003
POB T
IC = 5
.047%
2010
POB T
IC = 3
.854%
2003
Princ
ipal
2003
Inter
est
2003
POB T
otal
FY 20
10 $3
.466 B
ILLIO
N PEN
SION O
B NOT
ESFY
2011
$3.7
BILL
ION P
ENSIO
N OB N
OTES
COMB
INED
DEBT
SERV
ICE OF
2003
, 201
0 and
2011
PENS
ION O
BLIG
ATIO
N BON
DS AN
D NOT
ES Total
Princ
ipal
Total
Inter
est
COMB
INED
TOTA
LS
Gran
d Tota
l
The
Stat
e ha
s sol
d th
ree
sepa
rate
issu
ance
s of P
ensi
on O
blig
atio
n Bo
nds a
nd n
otes
.
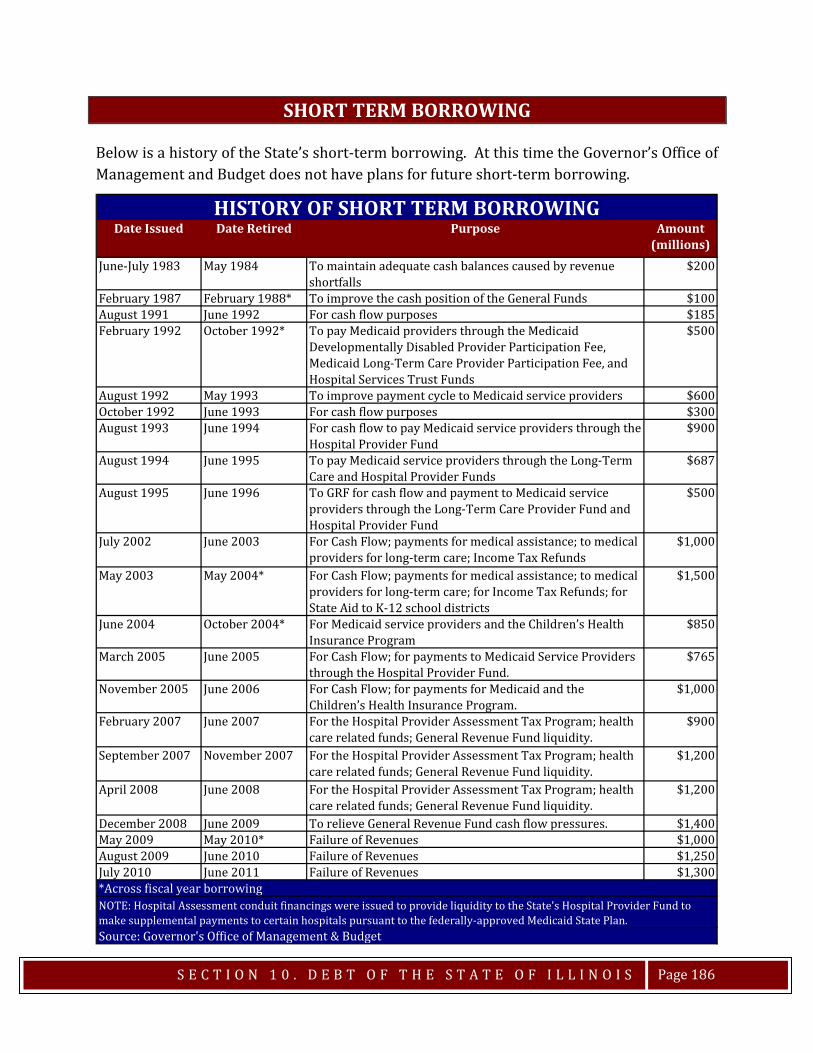
S E C T I O N 1 0 . D E B T O F T H E S T A T E O F I L L I N O I S
Page 186
SHORT TERM BORROWING
Below is a history of the State’s short-term borrowing. At this time the Governor’s Office of Management and Budget does not have plans for future short-term borrowing.
Date Issued Date Retired Purpose Amount (millions)
June-July 1983 May 1984 To maintain adequate cash balances caused by revenue shortfalls
$200
February 1987 February 1988* To improve the cash position of the General Funds $100 August 1991 June 1992 For cash flow purposes $185 February 1992 October 1992* To pay Medicaid providers through the Medicaid
Developmentally Disabled Provider Participation Fee, Medicaid Long-Term Care Provider Participation Fee, and Hospital Services Trust Funds
$500
August 1992 May 1993 To improve payment cycle to Medicaid service providers $600 October 1992 June 1993 For cash flow purposes $300 August 1993 June 1994 For cash flow to pay Medicaid service providers through the
Hospital Provider Fund$900
August 1994 June 1995 To pay Medicaid service providers through the Long-Term Care and Hospital Provider Funds
$687
August 1995 June 1996 To GRF for cash flow and payment to Medicaid service providers through the Long-Term Care Provider Fund and Hospital Provider Fund
$500
July 2002 June 2003 For Cash Flow; payments for medical assistance; to medical providers for long-term care; Income Tax Refunds
$1,000
May 2003 May 2004* For Cash Flow; payments for medical assistance; to medical providers for long-term care; for Income Tax Refunds; for State Aid to K-12 school districts
$1,500
June 2004 October 2004* For Medicaid service providers and the Children’s Health Insurance Program
$850
March 2005 June 2005 For Cash Flow; for payments to Medicaid Service Providers through the Hospital Provider Fund.
$765
November 2005 June 2006 For Cash Flow; for payments for Medicaid and the Children’s Health Insurance Program.
$1,000
February 2007 June 2007 For the Hospital Provider Assessment Tax Program; health care related funds; General Revenue Fund liquidity.
$900
September 2007 November 2007 For the Hospital Provider Assessment Tax Program; health care related funds; General Revenue Fund liquidity.
$1,200
April 2008 June 2008 For the Hospital Provider Assessment Tax Program; health care related funds; General Revenue Fund liquidity.
$1,200
December 2008 June 2009 To relieve General Revenue Fund cash flow pressures. $1,400 May 2009 May 2010* Failure of Revenues $1,000 August 2009 June 2010 Failure of Revenues $1,250 July 2010 June 2011 Failure of Revenues $1,300
HISTORY OF SHORT TERM BORROWING
Source: Governor's Office of Management & Budget
*Across fiscal year borrowingNOTE: Hospital Assessment conduit financings were issued to provide liquidity to the State's Hospital Provider Fund to make supplemental payments to certain hospitals pursuant to the federally-approved Medicaid State Plan.
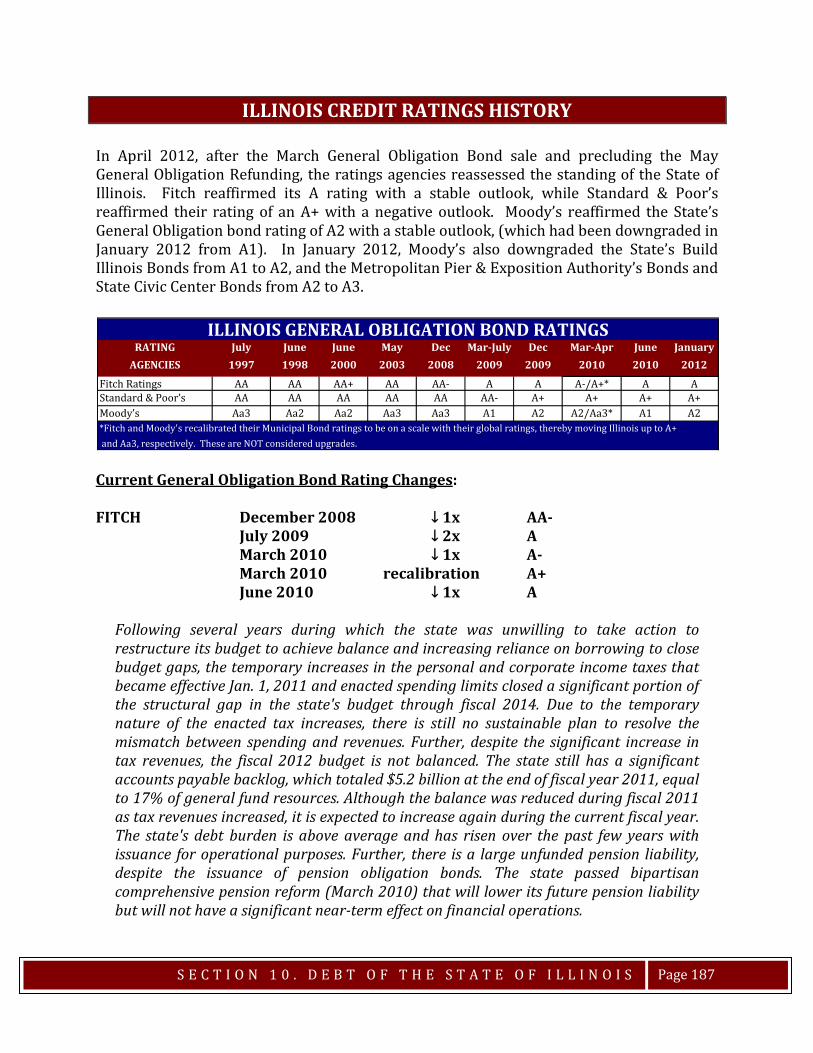
S E C T I O N 1 0 . D E B T O F T H E S T A T E O F I L L I N O I S
Page 187
ILLINOIS CREDIT RATINGS HISTORY In April 2012, after the March General Obligation Bond sale and precluding the May General Obligation Refunding, the ratings agencies reassessed the standing of the State of Illinois. Fitch reaffirmed its A rating with a stable outlook, while Standard & Poor’s reaffirmed their rating of an A+ with a negative outlook. Moody’s reaffirmed the State’s General Obligation bond rating of A2 with a stable outlook, (which had been downgraded in January 2012 from A1). In January 2012, Moody’s also downgraded the State’s Build Illinois Bonds from A1 to A2, and the Metropolitan Pier & Exposition Authority’s Bonds and State Civic Center Bonds from A2 to A3.
Current General Obligation Bond Rating Changes: FITCH December 2008 ↓ 1x AA-
July 2009 ↓ 2x A March 2010 ↓ 1x A- March 2010 recalibration A+ June 2010 ↓ 1x A
Following several years during which the state was unwilling to take action to restructure its budget to achieve balance and increasing reliance on borrowing to close budget gaps, the temporary increases in the personal and corporate income taxes that became effective Jan. 1, 2011 and enacted spending limits closed a significant portion of the structural gap in the state's budget through fiscal 2014. Due to the temporary nature of the enacted tax increases, there is still no sustainable plan to resolve the mismatch between spending and revenues. Further, despite the significant increase in tax revenues, the fiscal 2012 budget is not balanced. The state still has a significant accounts payable backlog, which totaled $5.2 billion at the end of fiscal year 2011, equal to 17% of general fund resources. Although the balance was reduced during fiscal 2011 as tax revenues increased, it is expected to increase again during the current fiscal year. The state's debt burden is above average and has risen over the past few years with issuance for operational purposes. Further, there is a large unfunded pension liability, despite the issuance of pension obligation bonds. The state passed bipartisan comprehensive pension reform (March 2010) that will lower its future pension liability but will not have a significant near-term effect on financial operations.
RATING July June June May Dec Mar-July Dec Mar-Apr June JanuaryAGENCIES 1997 1998 2000 2003 2008 2009 2009 2010 2010 2012
Fitch Ratings AA AA AA+ AA AA- A A A-/A+* A AStandard & Poor’s AA AA AA AA AA AA- A+ A+ A+ A+Moody’s Aa3 Aa2 Aa2 Aa3 Aa3 A1 A2 A2/Aa3* A1 A2*Fitch and Moody's recalibrated their Municipal Bond ratings to be on a scale with their global ratings, thereby moving Illinois up to A+ and Aa3, respectively. These are NOT considered upgrades.
ILLINOIS GENERAL OBLIGATION BOND RATINGS
S E C T I O N 1 0 . D E B T O F T H E S T A T E O F I L L I N O I S
Page 188
S&P March 2009 ↓ 1x AA- December 2009 ↓ 1x A+
The negative outlook reflects what we view as the state's large accumulated deficit and improved but still elusive structural budget balance despite significant revenue enhancement for the current financial plan period. The accumulated deficit continues to pressure the state's overall financial condition and liquidity in our view. If Illinois does not make meaningful changes to further align revenue and spending and address its accumulated deficit (accounts payable and general fund liabilities) for fiscal years 2012 and 2013, we could lower the rating this year. The outlook also reflects ongoing weakness in the state's pension funds and the possibility that it might issue a significant amount of additional debt as part of its effort to address the large accumulated budget deficit. A downgrade could also be triggered if pension funding levels continue to deteriorate or debt levels increase significantly, which would pressure the state's near-term financial performance. If pension funding levels stabilize and revenues and expenditures are successfully aligned in the next year, thereby stabilizing Illinois' finances, we could revise the outlook to stable. We do not believe there is upside potential to the rating in the next year given the range of budget and liability challenges the state faces.
MOODY’S April 2009 ↓ 1x A1
December 2009 ↓ 1x A2 April 2010 recalibration Aa3 June 2010 ↓ 1x A1 January 2012 ↓ 1x A2
The downgrade of the state's long-term debt follows a legislative session in which the state took no steps to implement lasting solutions to its severe pension under-funding or to its chronic bill payment delays. Failure to address these challenges undermines near- to intermediate-term prospects for fiscal recovery. It remains to be seen whether the state has the political willingness to impose durable policies leading to fiscal strength, though in the recent past it has reached consensus on difficult decisions, such as temporary income tax increases enacted last year that stabilized state finances and reduced the state's need for non-recurring budgetary measures. Illinois retains the sovereign revenue and spending powers common to all U.S. state governments. These powers, along with Illinois' legal provisions giving G.O. debt service priority over other state spending, support the move to a stable outlook.

S E C T I O N 1 0 . D E B T O F T H E S T A T E O F I L L I N O I S
Page 189
Current Build Illinois Bond Rating Changes FITCH April 2010 ↑ 1x AA+ MOODY’S October 2009 ↓ 1x A1
December 2009 ↓ 1x A2 April 2010 recalibration Aa3 June 2010 ↓ 1x A1 January 2012 ↓1x A2
We have also downgraded to A2 from A1 the rated portion of the state's $2.47 billion of outstanding Build Illinois sales tax revenue bonds, and to A3 from A2 $2.48 billion of Metropolitan Pier and Exposition Authority and $73 million of Civic Center Program bonds.
Rating Dec Mar-Apr June JanuaryAgencies 2009 2010* 2010 2012
Fitch Ratings AA AA AA AA+ AA+ AA+Standard & Poor’s AAA AAA AAA AAA AAA AAAMoody’s Aa3 A1 A2 Aa3 A1 A2*Fitch and Moody's Recalibration.
Apr/July 2009
Oct 2009
BUILD ILLINOIS BOND RATINGS


SECTION 11. SPECIAL FUND TRANSFERS
Special Fund Transfer Summary FY 2012 Consolidated Service Transfers FY 2011 Interfund Borrowing FY 2010 Special Fund Transfers FY 2009 Special Fund Transfers FY 2008 Special Fund Transfers FY 2007 Special Fund Transfers FY 2006 Special Fund Transfers FY 2005 Special Fund Transfers FY 2004 Special Fund Transfers FY 2003 Special Fund Transfers

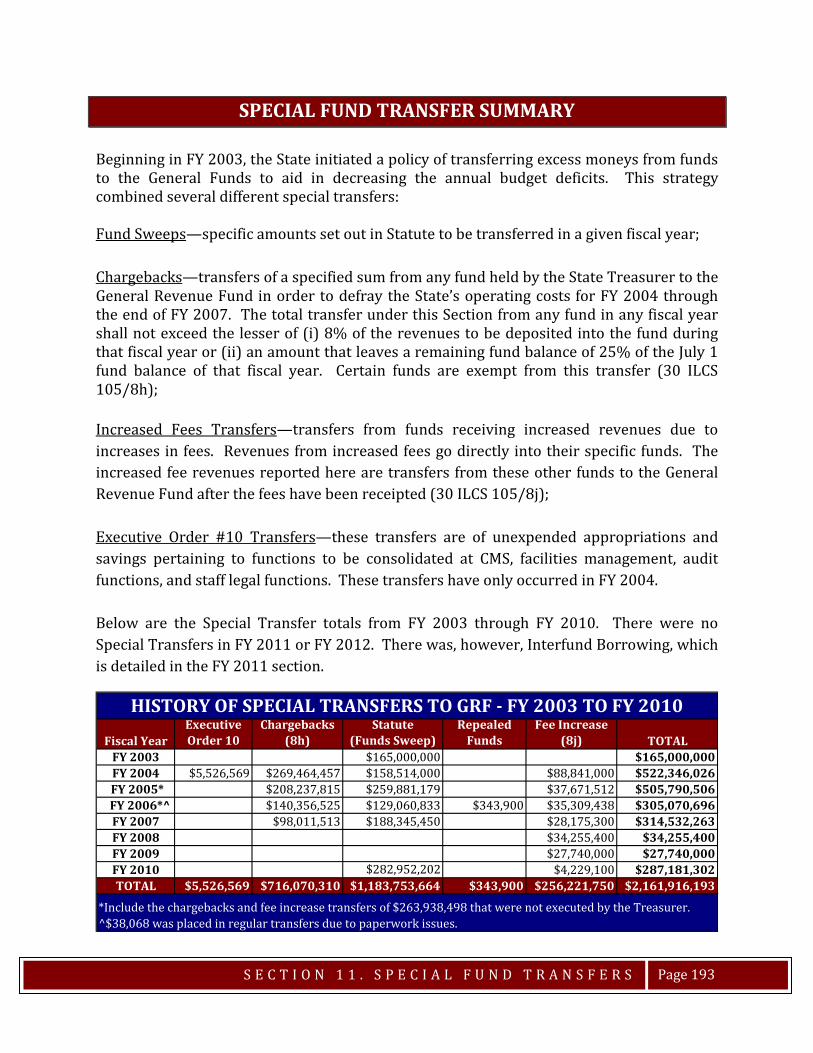
S E C T I O N 1 1 . S P E C I A L F U N D T R A N S F E R S
Page 193
SPECIAL FUND TRANSFER SUMMARY Beginning in FY 2003, the State initiated a policy of transferring excess moneys from funds to the General Funds to aid in decreasing the annual budget deficits. This strategy combined several different special transfers: Fund Sweeps—specific amounts set out in Statute to be transferred in a given fiscal year; Chargebacks—transfers of a specified sum from any fund held by the State Treasurer to the General Revenue Fund in order to defray the State’s operating costs for FY 2004 through the end of FY 2007. The total transfer under this Section from any fund in any fiscal year shall not exceed the lesser of (i) 8% of the revenues to be deposited into the fund during that fiscal year or (ii) an amount that leaves a remaining fund balance of 25% of the July 1 fund balance of that fiscal year. Certain funds are exempt from this transfer (30 ILCS 105/8h); Increased Fees Transfers—transfers from funds receiving increased revenues due to increases in fees. Revenues from increased fees go directly into their specific funds. The increased fee revenues reported here are transfers from these other funds to the General Revenue Fund after the fees have been receipted (30 ILCS 105/8j); Executive Order #10 Transfers—these transfers are of unexpended appropriations and savings pertaining to functions to be consolidated at CMS, facilities management, audit functions, and staff legal functions. These transfers have only occurred in FY 2004. Below are the Special Transfer totals from FY 2003 through FY 2010. There were no Special Transfers in FY 2011 or FY 2012. There was, however, Interfund Borrowing, which is detailed in the FY 2011 section.
Fiscal YearExecutive Order 10
Chargebacks (8h)
Statute (Funds Sweep)
Repealed Funds
Fee Increase (8j) TOTAL
FY 2003 $165,000,000 $165,000,000FY 2004 $5,526,569 $269,464,457 $158,514,000 $88,841,000 $522,346,026
FY 2005* $208,237,815 $259,881,179 $37,671,512 $505,790,506 FY 2006*^ $140,356,525 $129,060,833 $343,900 $35,309,438 $305,070,696
FY 2007 $98,011,513 $188,345,450 $28,175,300 $314,532,263FY 2008 $34,255,400 $34,255,400FY 2009 $27,740,000 $27,740,000FY 2010 $282,952,202 $4,229,100 $287,181,302TOTAL $5,526,569 $716,070,310 $1,183,753,664 $343,900 $256,221,750 $2,161,916,193
^$38,068 was placed in regular transfers due to paperwork issues.*Include the chargebacks and fee increase transfers of $263,938,498 that were not executed by the Treasurer.
HISTORY OF SPECIAL TRANSFERS TO GRF - FY 2003 TO FY 2010
S E C T I O N 1 1 . S P E C I A L F U N D T R A N S F E R S
Page 194
Approximately $264 million of chargebacks and increased fee transfers in FY 2005 and FY 2006 were blocked by the Treasurer’s Office awaiting the settlement of several court cases on the constitutionality of these transfers. Public Act 94-774 allowed $250 million of these pending transfers to GRF to be redirected in equal shares to the Hospital Provider Fund, Long-term Care Provider Fund, and Drug Rebate Fund. Due to the block by the Treasurer’s Office, the Comptroller was not allowed to use these amounts until they were released. The Public Act forced the transfer to GRF, and then the Comptroller’s Office transferred the $250 million out of GRF (1/3 to each) to the three above-mentioned funds. The following sections detail annual Special Transfer totals for FY 2012 back through FY 2003 by Fund.
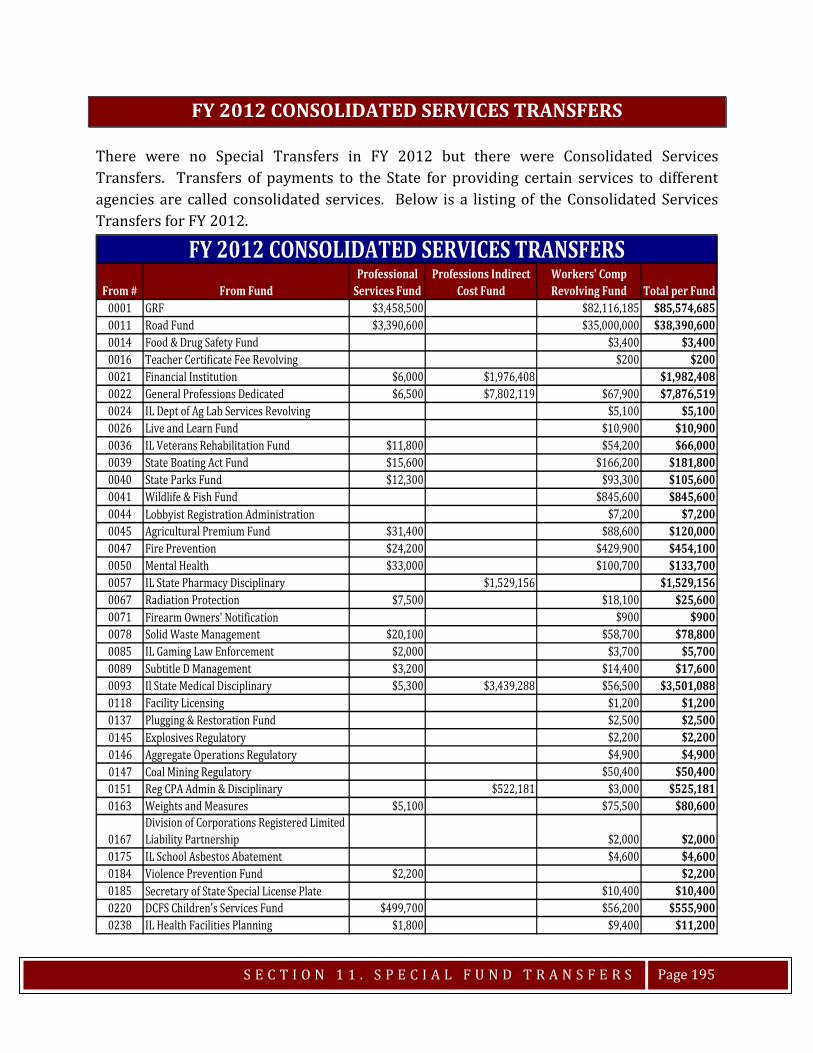
S E C T I O N 1 1 . S P E C I A L F U N D T R A N S F E R S
Page 195
FY 2012 CONSOLIDATED SERVICES TRANSFERS There were no Special Transfers in FY 2012 but there were Consolidated Services Transfers. Transfers of payments to the State for providing certain services to different agencies are called consolidated services. Below is a listing of the Consolidated Services Transfers for FY 2012.
From # From FundProfessional
Services FundProfessions Indirect
Cost FundWorkers' Comp Revolving Fund Total per Fund
0001 GRF $3,458,500 $82,116,185 $85,574,6850011 Road Fund $3,390,600 $35,000,000 $38,390,6000014 Food & Drug Safety Fund $3,400 $3,4000016 Teacher Certificate Fee Revolving $200 $2000021 Financial Institution $6,000 $1,976,408 $1,982,4080022 General Professions Dedicated $6,500 $7,802,119 $67,900 $7,876,5190024 IL Dept of Ag Lab Services Revolving $5,100 $5,1000026 Live and Learn Fund $10,900 $10,9000036 IL Veterans Rehabilitation Fund $11,800 $54,200 $66,0000039 State Boating Act Fund $15,600 $166,200 $181,8000040 State Parks Fund $12,300 $93,300 $105,6000041 Wildlife & Fish Fund $845,600 $845,6000044 Lobbyist Registration Administration $7,200 $7,2000045 Agricultural Premium Fund $31,400 $88,600 $120,0000047 Fire Prevention $24,200 $429,900 $454,1000050 Mental Health $33,000 $100,700 $133,7000057 IL State Pharmacy Disciplinary $1,529,156 $1,529,1560067 Radiation Protection $7,500 $18,100 $25,6000071 Firearm Owners' Notification $900 $9000078 Solid Waste Management $20,100 $58,700 $78,8000085 IL Gaming Law Enforcement $2,000 $3,700 $5,7000089 Subtitle D Management $3,200 $14,400 $17,6000093 Il State Medical Disciplinary $5,300 $3,439,288 $56,500 $3,501,0880118 Facility Licensing $1,200 $1,2000137 Plugging & Restoration Fund $2,500 $2,5000145 Explosives Regulatory $2,200 $2,2000146 Aggregate Operations Regulatory $4,900 $4,9000147 Coal Mining Regulatory $50,400 $50,4000151 Reg CPA Admin & Disciplinary $522,181 $3,000 $525,1810163 Weights and Measures $5,100 $75,500 $80,600
0167Division of Corporations Registered Limited Liability Partnership $2,000 $2,000
0175 IL School Asbestos Abatement $4,600 $4,6000184 Violence Prevention Fund $2,200 $2,2000185 Secretary of State Special License Plate $10,400 $10,4000220 DCFS Children's Services Fund $499,700 $56,200 $555,9000238 IL Health Facilities Planning $1,800 $9,400 $11,200
FY 2012 CONSOLIDATED SERVICES TRANSFERS
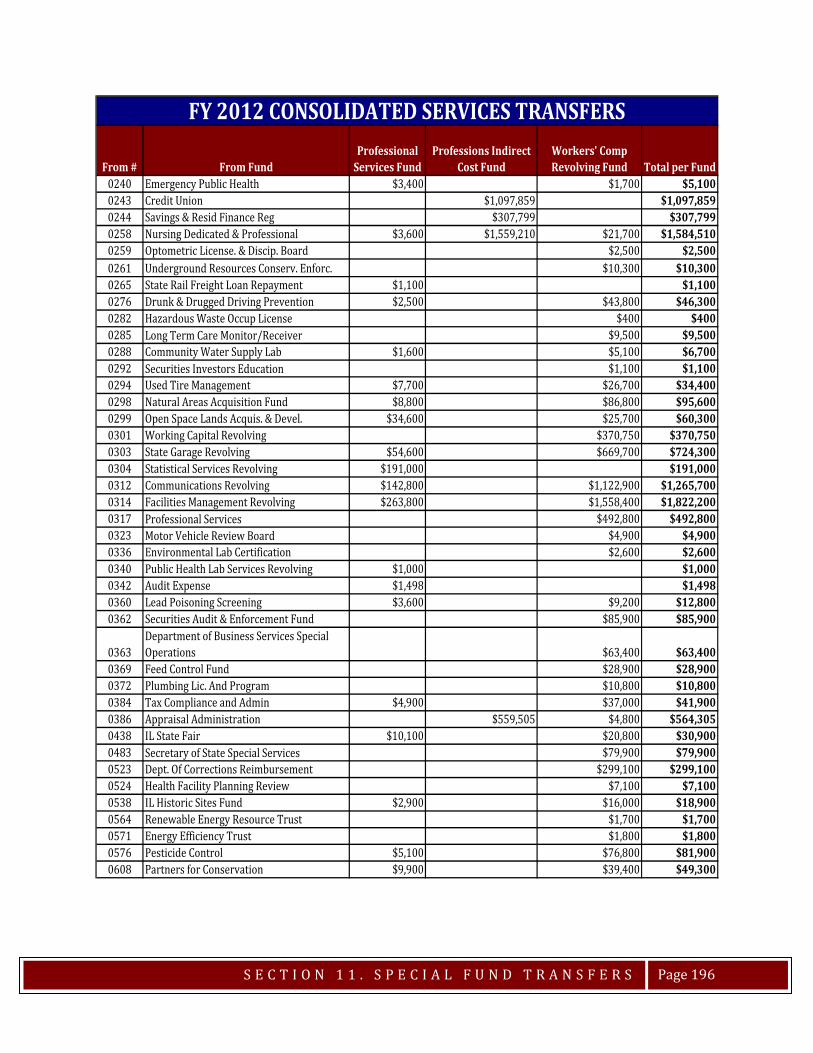
S E C T I O N 1 1 . S P E C I A L F U N D T R A N S F E R S
Page 196
From # From FundProfessional
Services FundProfessions Indirect
Cost FundWorkers' Comp Revolving Fund Total per Fund
0240 Emergency Public Health $3,400 $1,700 $5,1000243 Credit Union $1,097,859 $1,097,8590244 Savings & Resid Finance Reg $307,799 $307,7990258 Nursing Dedicated & Professional $3,600 $1,559,210 $21,700 $1,584,5100259 Optometric License. & Discip. Board $2,500 $2,5000261 Underground Resources Conserv. Enforc. $10,300 $10,3000265 State Rail Freight Loan Repayment $1,100 $1,1000276 Drunk & Drugged Driving Prevention $2,500 $43,800 $46,3000282 Hazardous Waste Occup License $400 $4000285 Long Term Care Monitor/Receiver $9,500 $9,5000288 Community Water Supply Lab $1,600 $5,100 $6,7000292 Securities Investors Education $1,100 $1,1000294 Used Tire Management $7,700 $26,700 $34,4000298 Natural Areas Acquisition Fund $8,800 $86,800 $95,6000299 Open Space Lands Acquis. & Devel. $34,600 $25,700 $60,3000301 Working Capital Revolving $370,750 $370,7500303 State Garage Revolving $54,600 $669,700 $724,3000304 Statistical Services Revolving $191,000 $191,0000312 Communications Revolving $142,800 $1,122,900 $1,265,7000314 Facilities Management Revolving $263,800 $1,558,400 $1,822,2000317 Professional Services $492,800 $492,8000323 Motor Vehicle Review Board $4,900 $4,9000336 Environmental Lab Certification $2,600 $2,6000340 Public Health Lab Services Revolving $1,000 $1,0000342 Audit Expense $1,498 $1,4980360 Lead Poisoning Screening $3,600 $9,200 $12,8000362 Securities Audit & Enforcement Fund $85,900 $85,900
0363Department of Business Services Special Operations $63,400 $63,400
0369 Feed Control Fund $28,900 $28,9000372 Plumbing Lic. And Program $10,800 $10,8000384 Tax Compliance and Admin $4,900 $37,000 $41,9000386 Appraisal Administration $559,505 $4,800 $564,3050438 IL State Fair $10,100 $20,800 $30,9000483 Secretary of State Special Services $79,900 $79,9000523 Dept. Of Corrections Reimbursement $299,100 $299,1000524 Health Facility Planning Review $7,100 $7,1000538 IL Historic Sites Fund $2,900 $16,000 $18,9000564 Renewable Energy Resource Trust $1,700 $1,7000571 Energy Efficiency Trust $1,800 $1,8000576 Pesticide Control $5,100 $76,800 $81,9000608 Partners for Conservation $9,900 $39,400 $49,300
FY 2012 CONSOLIDATED SERVICES TRANSFERS
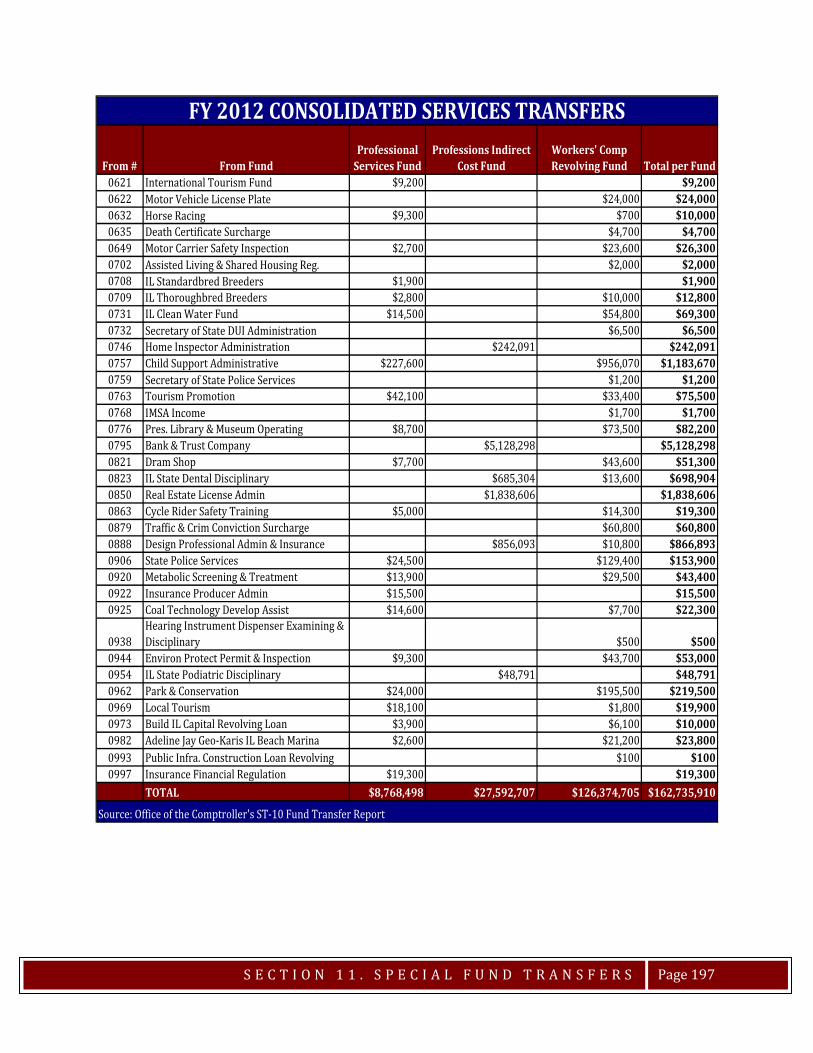
S E C T I O N 1 1 . S P E C I A L F U N D T R A N S F E R S
Page 197
From # From FundProfessional
Services FundProfessions Indirect
Cost FundWorkers' Comp Revolving Fund Total per Fund
0621 International Tourism Fund $9,200 $9,2000622 Motor Vehicle License Plate $24,000 $24,0000632 Horse Racing $9,300 $700 $10,0000635 Death Certificate Surcharge $4,700 $4,7000649 Motor Carrier Safety Inspection $2,700 $23,600 $26,3000702 Assisted Living & Shared Housing Reg. $2,000 $2,0000708 IL Standardbred Breeders $1,900 $1,9000709 IL Thoroughbred Breeders $2,800 $10,000 $12,8000731 IL Clean Water Fund $14,500 $54,800 $69,3000732 Secretary of State DUI Administration $6,500 $6,5000746 Home Inspector Administration $242,091 $242,0910757 Child Support Administrative $227,600 $956,070 $1,183,6700759 Secretary of State Police Services $1,200 $1,2000763 Tourism Promotion $42,100 $33,400 $75,5000768 IMSA Income $1,700 $1,7000776 Pres. Library & Museum Operating $8,700 $73,500 $82,2000795 Bank & Trust Company $5,128,298 $5,128,2980821 Dram Shop $7,700 $43,600 $51,3000823 IL State Dental Disciplinary $685,304 $13,600 $698,9040850 Real Estate License Admin $1,838,606 $1,838,6060863 Cycle Rider Safety Training $5,000 $14,300 $19,3000879 Traffic & Crim Conviction Surcharge $60,800 $60,8000888 Design Professional Admin & Insurance $856,093 $10,800 $866,8930906 State Police Services $24,500 $129,400 $153,9000920 Metabolic Screening & Treatment $13,900 $29,500 $43,4000922 Insurance Producer Admin $15,500 $15,5000925 Coal Technology Develop Assist $14,600 $7,700 $22,300
0938Hearing Instrument Dispenser Examining & Disciplinary $500 $500
0944 Environ Protect Permit & Inspection $9,300 $43,700 $53,0000954 IL State Podiatric Disciplinary $48,791 $48,7910962 Park & Conservation $24,000 $195,500 $219,5000969 Local Tourism $18,100 $1,800 $19,9000973 Build IL Capital Revolving Loan $3,900 $6,100 $10,0000982 Adeline Jay Geo-Karis IL Beach Marina $2,600 $21,200 $23,8000993 Public Infra. Construction Loan Revolving $100 $1000997 Insurance Financial Regulation $19,300 $19,300
TOTAL $8,768,498 $27,592,707 $126,374,705 $162,735,910
Source: Office of the Comptroller's ST-10 Fund Transfer Report
FY 2012 CONSOLIDATED SERVICES TRANSFERS
S E C T I O N 1 1 . S P E C I A L F U N D T R A N S F E R S
Page 198
FY 2011 INTERFUND BORROWING There were no Special Transfers in FY 2011. Instead, the Legislature gave the Governor permission to borrow from other funds. Public Act 96-0958 allowed the Governor to use Interfund Borrowing from July 1, 2010 through January 9, 2011. Public Act 96-1500, signed into law January 18, 2011, extended the use of Interfund Borrowing until June 30, 2011. Borrowing from any fund must be paid back within 18 months of the date borrowed. The last of the borrowing occurred in March of 2011, when $142 million was transferred from various funds to the General Revenue Fund through Interfund Borrowing. Final Interfund Borrowing transfers equaled $496 million. Approximately $363.5 million has been paid back as of June 30, 2012. Fifty-six of the 172 funds are paid back in full, and interest has been paid on 37 funds. After payments back, the outstanding amount remaining to be paid back equals $132 million. On the following pages is a break out by fund of the amounts borrowed, amounts paid back, and interest paid to date. A break-down of consolidated services transfers for FY 2011 is also included.
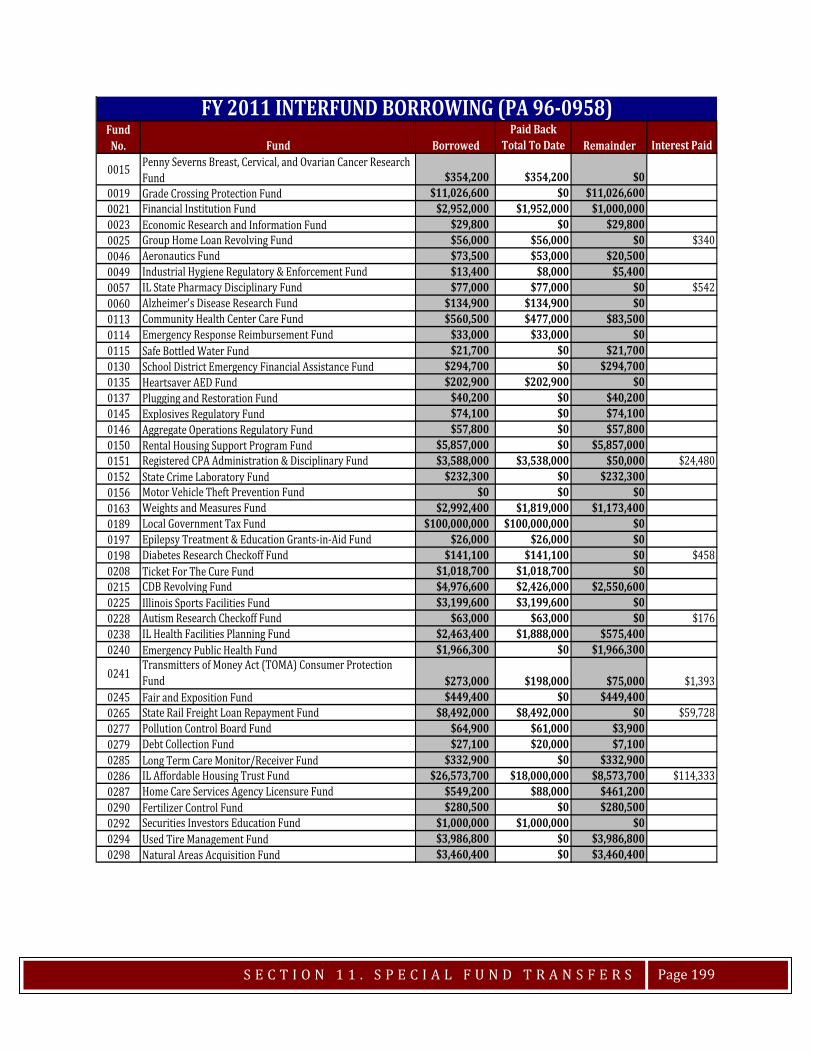
S E C T I O N 1 1 . S P E C I A L F U N D T R A N S F E R S
Page 199
Fund No. Fund Borrowed
Paid Back Total To Date Remainder Interest Paid
0015 Penny Severns Breast, Cervical, and Ovarian Cancer Research Fund $354,200 $354,200 $0
0019 Grade Crossing Protection Fund $11,026,600 $0 $11,026,6000021 Financial Institution Fund $2,952,000 $1,952,000 $1,000,0000023 Economic Research and Information Fund $29,800 $0 $29,8000025 Group Home Loan Revolving Fund $56,000 $56,000 $0 $3400046 Aeronautics Fund $73,500 $53,000 $20,5000049 Industrial Hygiene Regulatory & Enforcement Fund $13,400 $8,000 $5,4000057 IL State Pharmacy Disciplinary Fund $77,000 $77,000 $0 $5420060 Alzheimer's Disease Research Fund $134,900 $134,900 $00113 Community Health Center Care Fund $560,500 $477,000 $83,5000114 Emergency Response Reimbursement Fund $33,000 $33,000 $00115 Safe Bottled Water Fund $21,700 $0 $21,7000130 School District Emergency Financial Assistance Fund $294,700 $0 $294,7000135 Heartsaver AED Fund $202,900 $202,900 $00137 Plugging and Restoration Fund $40,200 $0 $40,2000145 Explosives Regulatory Fund $74,100 $0 $74,1000146 Aggregate Operations Regulatory Fund $57,800 $0 $57,8000150 Rental Housing Support Program Fund $5,857,000 $0 $5,857,0000151 Registered CPA Administration & Disciplinary Fund $3,588,000 $3,538,000 $50,000 $24,4800152 State Crime Laboratory Fund $232,300 $0 $232,3000156 Motor Vehicle Theft Prevention Fund $0 $0 $00163 Weights and Measures Fund $2,992,400 $1,819,000 $1,173,4000189 Local Government Tax Fund $100,000,000 $100,000,000 $00197 Epilepsy Treatment & Education Grants-in-Aid Fund $26,000 $26,000 $00198 Diabetes Research Checkoff Fund $141,100 $141,100 $0 $4580208 Ticket For The Cure Fund $1,018,700 $1,018,700 $00215 CDB Revolving Fund $4,976,600 $2,426,000 $2,550,6000225 Illinois Sports Facilities Fund $3,199,600 $3,199,600 $00228 Autism Research Checkoff Fund $63,000 $63,000 $0 $1760238 IL Health Facilities Planning Fund $2,463,400 $1,888,000 $575,4000240 Emergency Public Health Fund $1,966,300 $0 $1,966,300
0241Transmitters of Money Act (TOMA) Consumer Protection Fund $273,000 $198,000 $75,000 $1,393
0245 Fair and Exposition Fund $449,400 $0 $449,4000265 State Rail Freight Loan Repayment Fund $8,492,000 $8,492,000 $0 $59,7280277 Pollution Control Board Fund $64,900 $61,000 $3,9000279 Debt Collection Fund $27,100 $20,000 $7,1000285 Long Term Care Monitor/Receiver Fund $332,900 $0 $332,9000286 IL Affordable Housing Trust Fund $26,573,700 $18,000,000 $8,573,700 $114,3330287 Home Care Services Agency Licensure Fund $549,200 $88,000 $461,2000290 Fertilizer Control Fund $280,500 $0 $280,5000292 Securities Investors Education Fund $1,000,000 $1,000,000 $00294 Used Tire Management Fund $3,986,800 $0 $3,986,8000298 Natural Areas Acquisition Fund $3,460,400 $0 $3,460,400
FY 2011 INTERFUND BORROWING (PA 96-0958)

S E C T I O N 1 1 . S P E C I A L F U N D T R A N S F E R S
Page 200
Fund No. Fund Borrowed
Paid Back Total To Date Remainder Interest Paid
0299 Open Space Lands Acquisition & Development Fund $38,439,100 $15,000,000 $23,439,1000306 I-FLY Fund $45,000 $45,000 $00310 Tax Recovery Fund $408,000 $408,000 $00316 IL Prescription Drug Discount Program Fund $256,000 $256,000 $00326 African-American HIV/AIDS Response Fund $1,415,000 $1,415,000 $00327 Tattoo and Body Piercing Establishment Registration Fund $102,500 $0 $102,5000334 Ambulance Revolving Loan Fund $3,302,000 $3,302,000 $0 $20,1320336 Environmental Laboratory Certification Fund $102,000 $0 $102,0000341 Provider Inquiry Trust Fund $490,600 $0 $490,6000356 Law Enforcement Camera Grant Fund $3,048,600 $2,622,000 $426,600 $18,1050360 Lead Poisoning Screening, Prevention, and Abatement Fund $1,102,500 $0 $1,102,5000362 Securities Audit and Enforcement Fund $2,000,000 $2,000,000 $0 $11,6750369 Feed Control Fund $202,000 $0 $202,0000370 Tanning Facility Permit Fund $95,900 $0 $95,9000375 Natural Heritage Fund $75,500 $74,000 $1,5000378 Insurance Premium Tax Refund Fund $567,000 $567,000 $00384 Tax Compliance Administration Fund $12,804,900 $8,555,000 $4,249,9000386 Appraisal Administration Fund $839,000 $814,000 $25,0000387 Small Business Environmental Assistance Fund $22,700 $0 $22,7000388 Regulatory Evaluation and Basic Enforcement Fund $52,000 $0 $52,0000389 Sexual Assault Services Fund $102,600 $0 $102,6000390 IL Habitat Endowment Trust Fund $11,600,000 $11,600,000 $0 $8,2470398 EMS Assistance Fund $140,600 $0 $140,6000406 Comprehensive Regional Planning Fund $150,000 $150,000 $00417 State College and University Trust Fund $107,200 $0 $107,2000418 University Grant Fund $51,500 $27,000 $24,5000424 IL Power Agency Trust Fund $24,331,100 $24,300,000 $31,100 $168,9930425 Illinois Power Agency Operations Fund $3,321,500 $0 $3,321,5000429 Multiple Sclerosis Research Fund $1,928,100 $927,000 $1,001,100 $6,4360430 Livestock Management Facilities Fund $56,800 $50,000 $6,8000435 Charitable Trust Stabilization Fund $2,136,095 $2,003,395 $132,700 $12,8830437 Quality of Life Endowment Fund $2,116,000 $2,116,000 $0 $13,9200438 Illinois State Fair Fund $177,100 $0 $177,1000445 Sex Offender Investigation Fund $68,800 $57,000 $11,8000446 Employee Classification Fund $15,000 $15,000 $00449 Interpreters for the Deaf Fund $117,600 $21,000 $96,600 $1480469 Autoimmune Disease Research Fund $44,000 $44,000 $0 $1310474 Human Services Priority Capital Program Fund $1,648,000 $1,648,000 $0 $11,5910478 Predatory Lending Database Program Fund $650,000 $550,000 $100,000
0480Secretary of State Identification Security and Theft Prevention Fund $5,000,000 $5,000,000 $0
0504 Wildlife Prairie Park Fund $46,000 $46,000 $0 $2790510 IL Fire Fighters' Memorial Fund $3,061,100 $3,000,000 $61,1000514 State Asset Forfeiture Fund $549,100 $0 $549,1000517 Police Training Board Services Fund $7,200 $0 $7,200
FY 2011 INTERFUND BORROWING (PA 96-0958)

S E C T I O N 1 1 . S P E C I A L F U N D T R A N S F E R S
Page 201
Fund No. Fund Borrowed
Paid Back Total To Date Remainder Interest Paid
0518 Fire Service and Small Equipment Fund $81,900 $0 $81,9000528 Domestic Violence Abuser Services Fund $28,900 $0 $28,9000534 IL Workers' Compensation Commission Operations Fund $11,107,000 $11,107,000 $00535 Sex Offender Registration Fund $74,300 $69,000 $5,3000537 State Offender DNA Identification System Fund $641,500 $0 $641,5000548 Drycleaner Environmental Response Trust Fund $948,100 $0 $948,1000552 Workforce, Technology, and Economic Development Fund $60,800 $0 $60,8000555 Good Samaritan Energy Trust Fund $28,500 $0 $28,5000559 Downstate Transit Improvement Fund $17,000,000 $17,000,000 $00562 Pawnbroker Regulation Fund $29,000 $29,000 $00564 Renewable Energy Resources Trust Fund $2,617,700 $2,617,700 $00567 Charter Schools Revolving Loan Fund $3,800 $0 $3,8000569 School Technology Revolving Loan Fund $2,413,800 $1,334,000 $1,079,800 $8,2190570 Illinois and Michigan Canal Fund $83,900 $81,000 $2,9000571 Energy Efficiency Trust Fund $1,375,000 $750,000 $625,0000576 Pesticide Control Fund $2,627,700 $1,000,000 $1,627,7000582 DCFS Special Purposes Trust Fund $222,100 $102,000 $120,1000588 September 11th Fund $238,200 $202,000 $36,2000589 Transportation Safety Highway Hire-back Fund $157,200 $0 $157,2000605 Temporary Relocation Expenses Revolving Grant Fund $599,100 $150,000 $449,1000608 Partners for Conservation Fund $3,489,600 $0 $3,489,6000611 Fund for Illinois' Future $2,021,900 $0 $2,021,9000613 Wireless Carrier Reimbursement Fund $6,665,500 $1,416,000 $5,249,5000621 International Tourism Fund $5,243,200 $2,714,000 $2,529,2000623 Special Olympics IL Fund $23,000 $23,000 $00626 Prostate Cancer Research Fund $25,000 $25,000 $00635 Death Certificate Surcharge Fund $1,053,000 $0 $1,053,0000637 State Police Wireless Service Emergency Fund $2,725,200 $2,136,000 $589,2000638 IL Adoption Registry & Medical Information Exchange Fund $4,000 $4,000 $00643 Auction Recovery Fund $288,000 $288,000 $0 $2,0260652 Over Dimensional Load Police Escort Fund $19,100 $0 $19,1000654 Healthy Smiles Fund $22,600 $22,600 $00660 Academic Quality Assurance Fund $344,400 $153,000 $191,4000661 Private College Academic Quality Assurance Fund $67,800 $50,000 $17,8000669 Airport Land Loan Revolving Fund $90,000 $90,000 $0 $6330675 Electronics Recycling Fund $26,800 $0 $26,8000678 FY09 Budget Relief Fund $14,000,000 $14,000,000 $00697 Roadside Memorial Fund $163,000 $94,000 $69,0000702 Assisted Living and Shared Housing Regulatory Fund $122,400 $0 $122,4000705 State Police Whistleblower Reward and Protection Fund $11,048,800 $4,404,000 $6,644,8000706 Hunger Relief Fund $98,400 $98,400 $0 $2730714 Spinal Cord Injury Paralysis Cure Research Trust Fund $597,600 $558,000 $39,6000725 Illinois Military Family Relief Fund $224,400 $224,400 $00731 IL Clean Water Fund $1,650,000 $1,326,000 $324,000 $8,258
FY 2011 INTERFUND BORROWING (PA 96-0958)

S E C T I O N 1 1 . S P E C I A L F U N D T R A N S F E R S
Page 202
Fund No. Fund Borrowed
Paid Back Total To Date Remainder Interest Paid
0738 Alternative Compliance Market Account Fund $352,200 $202,000 $150,200 $1,4210740 Medicaid Buy-In Program Revolving Fund $761,300 $442,000 $319,300 $2,9130744 IL Animal Abuse Fund $8,400 $5,000 $3,4000746 Home Inspector Admin Fund $373,000 $248,000 $125,000 $1,6810750 Real Estate Audit Fund $151,000 $151,000 $0 $1,0620753 IL Future Teacher Corps Scholarship Fund $173,200 $99,000 $74,2000754 IL AgriFIRST Program Fund $203,100 $202,000 $1,1000764 Pet Population Control Fund $40,700 $0 $40,7000774 Oil Spill Response Fund $34,000 $14,000 $20,000 $820776 Presidential Library and Museum Operating Fund $1,420,600 $0 $1,420,6000777 Crisis Nursery Fund $42,500 $42,500 $00778 Dept. of Human Rights Training & Development Fund $15,000 $15,000 $00784 Performance-enhancing Substance Testing Fund $55,000 $0 $55,0000790 Private Sewage Disposal Program Fund $82,600 $0 $82,6000794 Metro-East Public Transportation Fund $91,000 $91,000 $00795 Bank and Trust Company Fund $8,000,000 $8,000,000 $0 $51,2290797 Dept. of Human Rights Special Fund $136,000 $136,000 $00823 Illinois State Dental Disciplinary Fund $1,400,000 $1,400,000 $0 $9,7270830 Dept. of Aging State Projects Fund $53,000 $53,000 $00836 IL Power Agency Renewable Energy Resources Fund $6,710,000 $6,710,000 $00840 Hazardous Waste Research Fund $150,600 $0 $150,6000845 Environmental Protection Trust Fund $1,940,800 $1,557,000 $383,8000849 Real Estate Research and Education Fund $241,000 $241,000 $0 $1,6950865 Domestic Violence Shelter and Service Fund $355,800 $0 $355,8000866 Snowmobile Trail Establishment Fund $29,500 $29,500 $00878 Drug Traffic Prevention Fund $128,200 $48,000 $80,2000888 Design Professionals Admin and Investigation Fund $318,000 $318,000 $0 $2,0270906 State Police Services Fund $3,157,500 $0 $3,157,5000910 Youth Drug Abuse Prevention Fund $14,400 $0 $14,4000922 Insurance Producer Administration Fund $10,788,400 $3,590,000 $7,198,4000927 Illinois National Guard Armory Construction Fund $4,300 $0 $4,3000930 Senior Citizens Real Estate Deferred Tax Revolving Fund $1,554,500 $0 $1,554,5000940 Self-Insurers Security Fund $10,000,000 $10,000,000 $0 $60,530
0942 Low-level Radioactive Waste Facility Development and Operation Fund $720,100 $514,000 $206,100 $3,291
0954 Illinois State Podiatric Disciplinary Fund $30,000 $0 $30,0000963 Vehicle Inspection Fund $18,982,300 $18,060,000 $922,3000973 Illinois Capital Revolving Loan Fund $6,166,300 $0 $6,166,3000974 Illinois Equity Fund $540,000 $0 $540,0000975 Large Business Attraction Fund $610,400 $0 $610,4000993 Public Infrastructure Construction Loan Revolving Fund $11,496,600 $11,471,000 $25,600 $69,7620997 Insurance Financial Regulation Fund $7,515,800 $5,890,000 $1,625,800
Total $496,011,595 $363,535,895 $132,475,700 $698,817
FY 2011 INTERFUND BORROWING (PA 96-0958)
Source: Governor's Office of Management and Budget - Interfund Borrowing Quarterly Reports
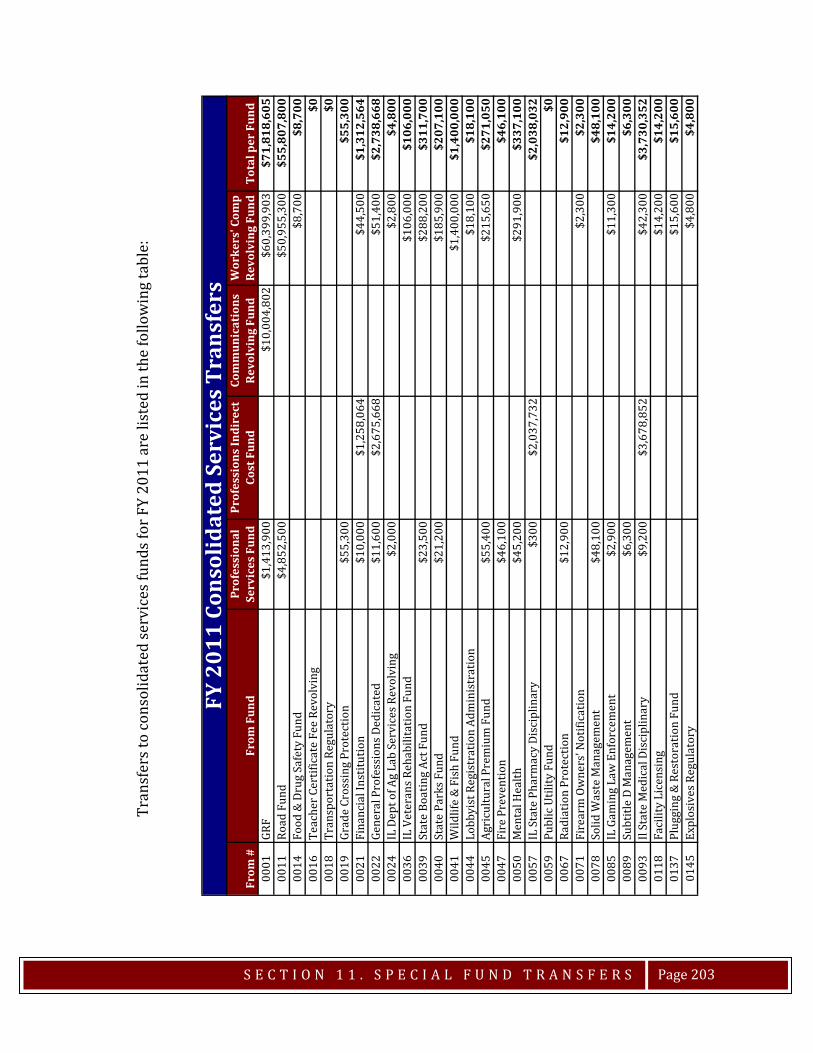
S E C T I O N 1 1 . S P E C I A L F U N D T R A N S F E R S
Page 203
From
#Fr
om F
und
Prof
essi
onal
Se
rvic
es F
und
Prof
essi
ons
Indi
rect
Co
st F
und
Com
mun
icat
ions
Re
volv
ing
Fund
Wor
kers
' Com
p Re
volv
ing
Fund
Tota
l per
Fun
d00
01GR
F$1
,413
,900
$10,
004,
802
$60,
399,
903
$71,
818,
605
0011
Road
Fun
d$4
,852
,500
$50,
955,
300
$55,
807,
800
0014
Food
& D
rug
Safe
ty F
und
$8,7
00$8
,700
0016
Teac
her C
ertif
icat
e Fe
e Re
volv
ing
$000
18Tr
ansp
orta
tion
Regu
lato
ry$0
0019
Grad
e Cr
ossi
ng P
rote
ctio
n$5
5,30
0$5
5,30
000
21Fi
nanc
ial I
nstit
utio
n$1
0,00
0$1
,258
,064
$44,
500
$1,3
12,5
6400
22Ge
nera
l Pro
fess
ions
Ded
icat
ed$1
1,60
0$2
,675
,668
$51,
400
$2,7
38,6
6800
24IL
Dep
t of A
g La
b Se
rvic
es R
evol
ving
$2,0
00$2
,800
$4,8
0000
36IL
Vet
eran
s Reh
abili
tatio
n Fu
nd$1
06,0
00$1
06,0
0000
39St
ate
Boat
ing
Act F
und
$23,
500
$288
,200
$311
,700
0040
Stat
e Pa
rks F
und
$21,
200
$185
,900
$207
,100
0041
Wild
life
& F
ish
Fund
$1,4
00,0
00$1
,400
,000
0044
Lobb
yist
Reg
istr
atio
n Ad
min
istr
atio
n$1
8,10
0$1
8,10
000
45Ag
ricu
ltura
l Pre
miu
m F
und
$55,
400
$215
,650
$271
,050
0047
Fire
Pre
vent
ion
$46,
100
$46,
100
0050
Men
tal H
ealth
$45,
200
$291
,900
$337
,100
0057
IL S
tate
Pha
rmac
y Di
scip
linar
y$3
00$2
,037
,732
$2,0
38,0
3200
59Pu
blic
Util
ity F
und
$000
67Ra
diat
ion
Prot
ectio
n$1
2,90
0$1
2,90
000
71Fi
rear
m O
wne
rs' N
otifi
catio
n$2
,300
$2,3
0000
78So
lid W
aste
Man
agem
ent
$48,
100
$48,
100
0085
IL G
amin
g La
w E
nfor
cem
ent
$2,9
00$1
1,30
0$1
4,20
000
89Su
btitl
e D
Man
agem
ent
$6,3
00$6
,300
0093
Il St
ate
Med
ical
Dis
cipl
inar
y$9
,200
$3,6
78,8
52$4
2,30
0$3
,730
,352
0118
Faci
lity
Lice
nsin
g$1
4,20
0$1
4,20
001
37Pl
uggi
ng &
Res
tora
tion
Fund
$15,
600
$15,
600
0145
Expl
osiv
es R
egul
ator
y$4
,800
$4,8
00
FY 2
011
Cons
olid
ated
Ser
vice
s Tr
ansf
ers
Tran
sfer
s to
cons
olid
ated
serv
ices
fund
s for
FY
2011
are
list
ed in
the
follo
win
g ta
ble:
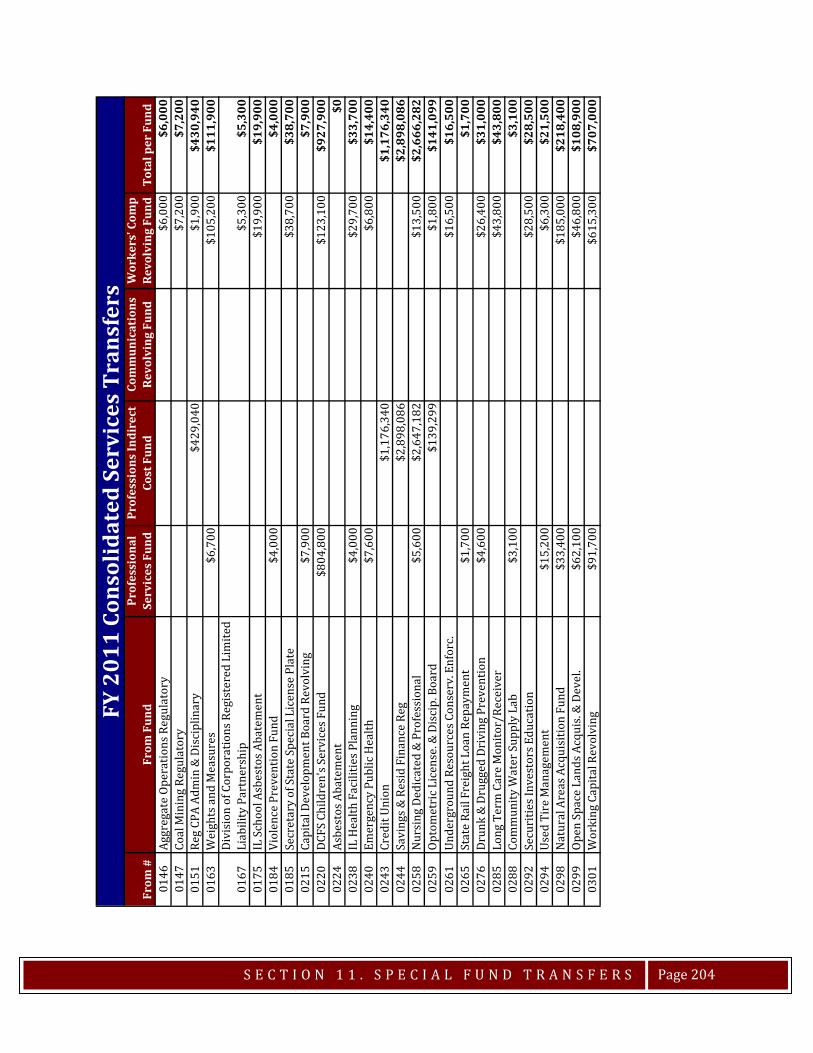
S E C T I O N 1 1 . S P E C I A L F U N D T R A N S F E R S
Page 204
From
#Fr
om F
und
Prof
essi
onal
Se
rvic
es F
und
Prof
essi
ons
Indi
rect
Co
st F
und
Com
mun
icat
ions
Re
volv
ing
Fund
Wor
kers
' Com
p Re
volv
ing
Fund
Tota
l per
Fun
d01
46Ag
greg
ate
Oper
atio
ns R
egul
ator
y$6
,000
$6,0
0001
47Co
al M
inin
g Re
gula
tory
$7,2
00$7
,200
0151
Reg
CPA
Adm
in &
Dis
cipl
inar
y$4
29,0
40$1
,900
$430
,940
0163
Wei
ghts
and
Mea
sure
s$6
,700
$105
,200
$111
,900
0167
Divi
sion
of C
orpo
ratio
ns R
egis
tere
d Li
mite
d Li
abili
ty P
artn
ersh
ip$5
,300
$5,3
0001
75IL
Sch
ool A
sbes
tos A
bate
men
t$1
9,90
0$1
9,90
001
84Vi
olen
ce P
reve
ntio
n Fu
nd$4
,000
$4,0
0001
85Se
cret
ary
of S
tate
Spe
cial
Lic
ense
Pla
te$3
8,70
0$3
8,70
002
15Ca
pita
l Dev
elop
men
t Boa
rd R
evol
ving
$7,9
00$7
,900
0220
DCFS
Chi
ldre
n's S
ervi
ces F
und
$804
,800
$123
,100
$927
,900
0224
Asbe
stos
Aba
tem
ent
$002
38IL
Hea
lth F
acili
ties P
lann
ing
$4,0
00$2
9,70
0$3
3,70
002
40Em
erge
ncy
Publ
ic H
ealth
$7,6
00$6
,800
$14,
400
0243
Cred
it Un
ion
$1,1
76,3
40$1
,176
,340
0244
Savi
ngs &
Res
id F
inan
ce R
eg$2
,898
,086
$2,8
98,0
8602
58N
ursi
ng D
edic
ated
& P
rofe
ssio
nal
$5,6
00$2
,647
,182
$13,
500
$2,6
66,2
8202
59Op
tom
etri
c Lic
ense
. & D
isci
p. B
oard
$139
,299
$1,8
00$1
41,0
9902
61Un
derg
roun
d Re
sour
ces C
onse
rv. E
nfor
c.$1
6,50
0$1
6,50
002
65St
ate
Rail
Frei
ght L
oan
Repa
ymen
t$1
,700
$1,7
0002
76Dr
unk
& D
rugg
ed D
rivi
ng P
reve
ntio
n$4
,600
$26,
400
$31,
000
0285
Long
Ter
m C
are
Mon
itor/
Rece
iver
$43,
800
$43,
800
0288
Com
mun
ity W
ater
Sup
ply
Lab
$3,1
00$3
,100
0292
Secu
ritie
s Inv
esto
rs E
duca
tion
$28,
500
$28,
500
0294
Used
Tir
e M
anag
emen
t$1
5,20
0$6
,300
$21,
500
0298
Nat
ural
Are
as A
cqui
sitio
n Fu
nd$3
3,40
0$1
85,0
00$2
18,4
0002
99Op
en S
pace
Lan
ds A
cqui
s. &
Dev
el.
$62,
100
$46,
800
$108
,900
0301
Wor
king
Cap
ital R
evol
ving
$91,
700
$615
,300
$707
,000
FY 2
011
Cons
olid
ated
Ser
vice
s Tr
ansf
ers
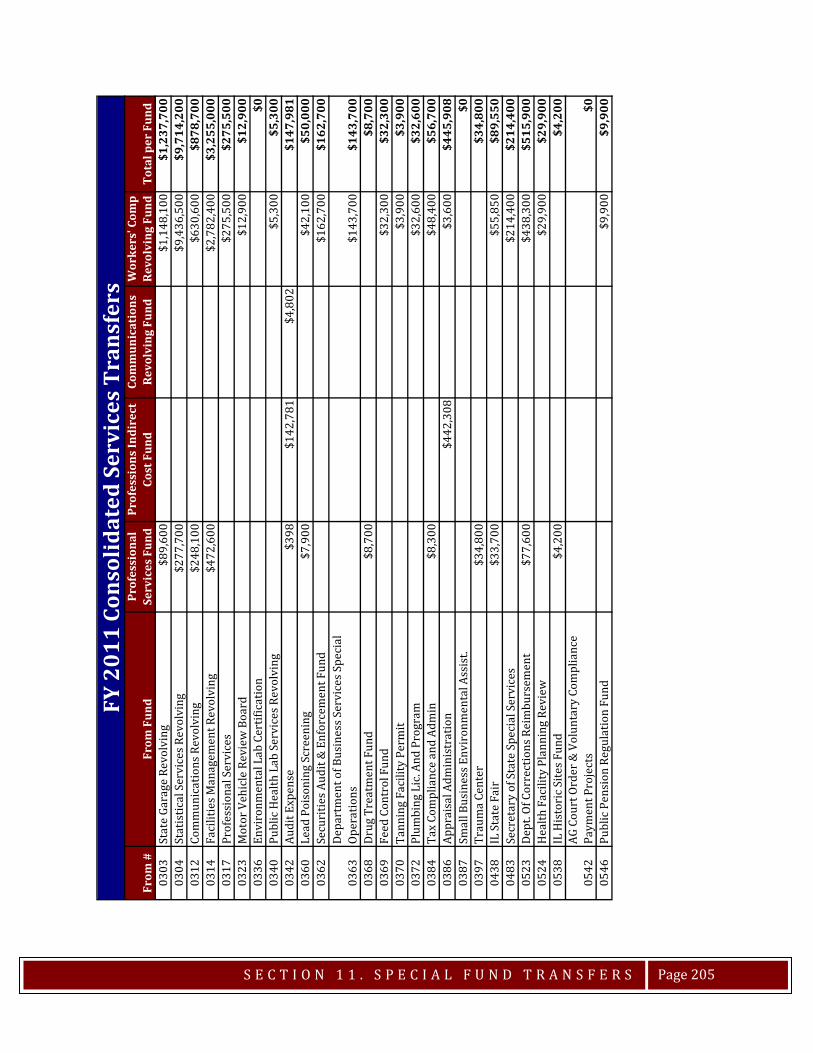
S E C T I O N 1 1 . S P E C I A L F U N D T R A N S F E R S
Page 205
From
#Fr
om F
und
Prof
essi
onal
Se
rvic
es F
und
Prof
essi
ons
Indi
rect
Co
st F
und
Com
mun
icat
ions
Re
volv
ing
Fund
Wor
kers
' Com
p Re
volv
ing
Fund
Tota
l per
Fun
d03
03St
ate
Gara
ge R
evol
ving
$89,
600
$1,1
48,1
00$1
,237
,700
0304
Stat
istic
al S
ervi
ces R
evol
ving
$277
,700
$9,4
36,5
00$9
,714
,200
0312
Com
mun
icat
ions
Rev
olvi
ng
$248
,100
$630
,600
$878
,700
0314
Faci
litie
s Man
agem
ent R
evol
ving
$472
,600
$2,7
82,4
00$3
,255
,000
0317
Prof
essi
onal
Ser
vice
s$2
75,5
00$2
75,5
0003
23M
otor
Veh
icle
Rev
iew
Boa
rd$1
2,90
0$1
2,90
003
36En
viro
nmen
tal L
ab C
ertif
icat
ion
$003
40Pu
blic
Hea
lth L
ab S
ervi
ces R
evol
ving
$5,3
00$5
,300
0342
Audi
t Exp
ense
$398
$142
,781
$4,8
02$1
47,9
8103
60Le
ad P
oiso
ning
Scr
eeni
ng$7
,900
$42,
100
$50,
000
0362
Secu
ritie
s Aud
it &
Enf
orce
men
t Fun
d$1
62,7
00$1
62,7
00
0363
Depa
rtm
ent o
f Bus
ines
s Ser
vice
s Spe
cial
Op
erat
ions
$143
,700
$143
,700
0368
Drug
Tre
atm
ent F
und
$8,7
00$8
,700
0369
Feed
Con
trol
Fun
d$3
2,30
0$3
2,30
003
70Ta
nnin
g Fa
cilit
y Pe
rmit
$3,9
00$3
,900
0372
Plum
bing
Lic
. And
Pro
gram
$32,
600
$32,
600
0384
Tax
Com
plia
nce
and
Adm
in$8
,300
$48,
400
$56,
700
0386
Appr
aisa
l Adm
inis
trat
ion
$442
,308
$3,6
00$4
45,9
0803
87Sm
all B
usin
ess E
nvir
onm
enta
l Ass
ist.
$003
97Tr
aum
a Ce
nter
$34,
800
$34,
800
0438
IL S
tate
Fai
r$3
3,70
0$5
5,85
0$8
9,55
004
83Se
cret
ary
of S
tate
Spe
cial
Ser
vice
s$2
14,4
00$2
14,4
0005
23De
pt. O
f Cor
rect
ions
Rei
mbu
rsem
ent
$77,
600
$438
,300
$515
,900
0524
Hea
lth F
acili
ty P
lann
ing
Revi
ew$2
9,90
0$2
9,90
005
38IL
His
tori
c Site
s Fun
d$4
,200
$4,2
00
0542
AG C
ourt
Ord
er &
Vol
unta
ry C
ompl
ianc
e Pa
ymen
t Pro
ject
s$0
0546
Publ
ic P
ensi
on R
egul
atio
n Fu
nd$9
,900
$9,9
00
FY 2
011
Cons
olid
ated
Ser
vice
s Tr
ansf
ers
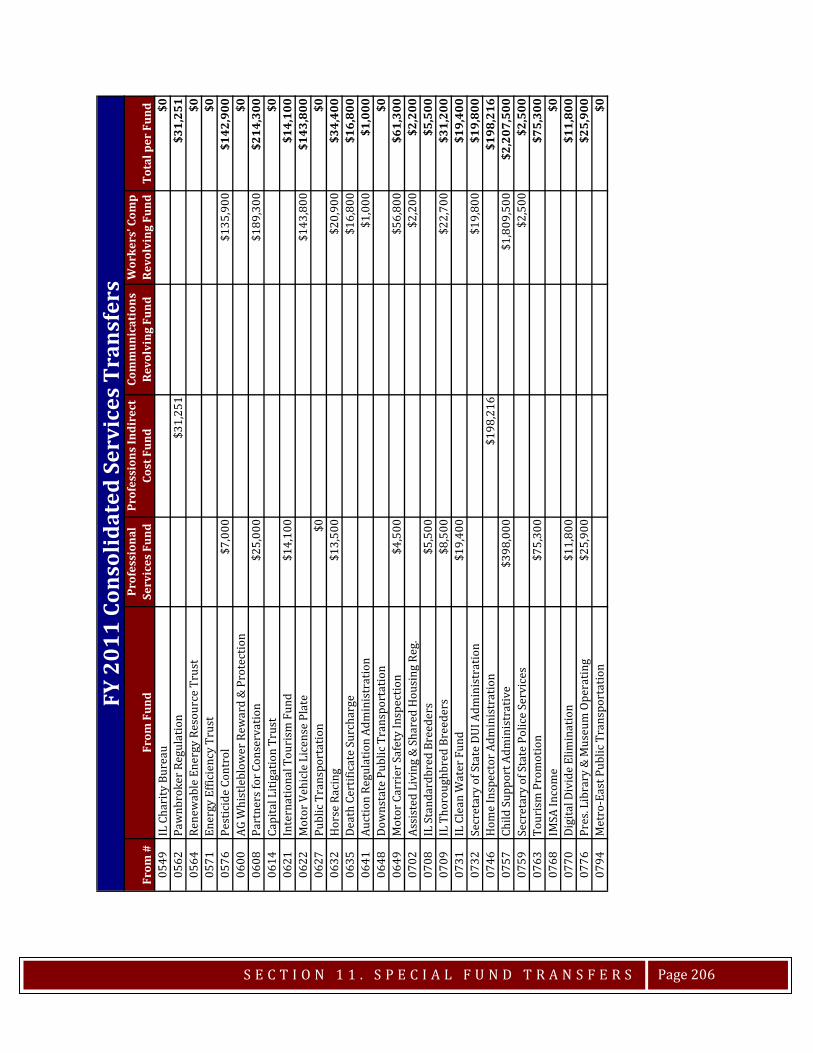
S E C T I O N 1 1 . S P E C I A L F U N D T R A N S F E R S
Page 206
From
#Fr
om F
und
Prof
essi
onal
Se
rvic
es F
und
Prof
essi
ons
Indi
rect
Co
st F
und
Com
mun
icat
ions
Re
volv
ing
Fund
Wor
kers
' Com
p Re
volv
ing
Fund
Tota
l per
Fun
d05
49IL
Cha
rity
Bur
eau
$005
62Pa
wnb
roke
r Reg
ulat
ion
$31,
251
$31,
251
0564
Rene
wab
le E
nerg
y Re
sour
ce T
rust
$005
71En
ergy
Effi
cien
cy T
rust
$005
76Pe
stic
ide
Cont
rol
$7,0
00$1
35,9
00$1
42,9
0006
00AG
Whi
stle
blow
er R
ewar
d &
Pro
tect
ion
$006
08Pa
rtne
rs fo
r Con
serv
atio
n$2
5,00
0$1
89,3
00$2
14,3
0006
14Ca
pita
l Liti
gatio
n Tr
ust
$006
21In
tern
atio
nal T
ouri
sm F
und
$14,
100
$14,
100
0622
Mot
or V
ehic
le L
icen
se P
late
$143
,800
$143
,800
0627
Publ
ic T
rans
port
atio
n$0
$006
32H
orse
Rac
ing
$13,
500
$20,
900
$34,
400
0635
Deat
h Ce
rtifi
cate
Sur
char
ge$1
6,80
0$1
6,80
006
41Au
ctio
n Re
gula
tion
Adm
inis
trat
ion
$1,0
00$1
,000
0648
Dow
nsta
te P
ublic
Tra
nspo
rtat
ion
$006
49M
otor
Car
rier
Saf
ety
Insp
ectio
n$4
,500
$56,
800
$61,
300
0702
Assi
sted
Liv
ing
& S
hare
d H
ousi
ng R
eg.
$2,2
00$2
,200
0708
IL S
tand
ardb
red
Bree
ders
$5,5
00$5
,500
0709
IL T
horo
ughb
red
Bree
ders
$8,5
00$2
2,70
0$3
1,20
007
31IL
Cle
an W
ater
Fun
d$1
9,40
0$1
9,40
007
32Se
cret
ary
of S
tate
DUI
Adm
inis
trat
ion
$19,
800
$19,
800
0746
Hom
e In
spec
tor A
dmin
istr
atio
n$1
98,2
16$1
98,2
1607
57Ch
ild S
uppo
rt A
dmin
istr
ativ
e$3
98,0
00$1
,809
,500
$2,2
07,5
0007
59Se
cret
ary
of S
tate
Pol
ice
Serv
ices
$2,5
00$2
,500
0763
Tour
ism
Pro
mot
ion
$75,
300
$75,
300
0768
IMSA
Inco
me
$007
70Di
gita
l Div
ide
Elim
inat
ion
$11,
800
$11,
800
0776
Pres
. Lib
rary
& M
useu
m O
pera
ting
$25,
900
$25,
900
0794
Met
ro-E
ast P
ublic
Tra
nspo
rtat
ion
$0
FY 2
011
Cons
olid
ated
Ser
vice
s Tr
ansf
ers

S E C T I O N 1 1 . S P E C I A L F U N D T R A N S F E R S
Page 207
From
#Fr
om F
und
Prof
essi
onal
Se
rvic
es F
und
Prof
essi
ons
Indi
rect
Co
st F
und
Com
mun
icat
ions
Re
volv
ing
Fund
Wor
kers
' Com
p Re
volv
ing
Fund
Tota
l per
Fun
d07
95Ba
nk &
Tru
st C
ompa
ny$5
,492
,480
$5,4
92,4
8008
21Dr
am S
hop
$12,
700
$57,
200
$69,
900
0823
IL S
tate
Den
tal D
isci
plin
ary
$594
,144
$9,5
00$6
03,6
4408
50Re
al E
stat
e Li
cens
e Ad
min
$130
,216
$130
,216
0863
Cycl
e Ri
der S
afet
y Tr
aini
ng$7
,100
$12,
200
$19,
300
0879
Traf
fic &
Cri
m C
onvi
ctio
n Su
rcha
rge
$128
,900
$128
,900
0888
Desi
gn P
rofe
ssio
nal A
dmin
& In
sura
nce
$527
,200
$7,3
00$5
34,5
0009
06St
ate
Polic
e Se
rvic
es$4
3,60
0$3
35,7
00$3
79,3
0009
20M
etab
olic
Scr
eeni
ng &
Tre
atm
ent
$23,
900
$81,
600
$105
,500
0922
Insu
ranc
e Pr
oduc
er A
dmin
$16,
800
$77,
000
$93,
800
0925
Coal
Tec
hnol
ogy
Deve
lop
Assi
st$4
3,70
0$4
3,70
0
0938
Hea
ring
Inst
rum
ent D
ispe
nser
Exa
min
ing
&
Disc
iplin
ary
$1,9
00$1
,900
0942
Low
-Lev
el R
adio
activ
e W
aste
Fac
ility
De
velo
pmen
t & O
pera
tion
Fund
$009
44En
viro
n Pr
otec
t Per
mit
& In
spec
tion
$21,
600
$21,
600
0954
IL S
tate
Pod
iatr
ic D
isci
plin
ary
$269
,092
$269
,092
0962
Park
& C
onse
rvat
ion
$38,
100
$361
,500
$399
,600
0969
Loca
l Tou
rism
$31,
800
$31,
800
0973
Build
IL C
apita
l Rev
olvi
ng L
oan
$5,8
00$5
,800
0975
Larg
e Bu
sine
ss A
ttra
ctio
n$3
00$3
0009
82Ad
elin
e Ja
y Ge
o-Ka
ris I
L Be
ach
Mar
ina
$5,0
00$4
2,80
0$4
7,80
009
93Pu
blic
Infr
a. C
onst
ruct
ion
Loan
Rev
olvi
ng$0
0997
Insu
ranc
e Fi
nanc
ial R
egul
atio
n$2
3,00
0$1
08,0
00$1
31,0
00TO
TAL
$9,8
14,2
98$2
4,76
7,95
1$1
0,00
9,60
4$1
34,5
40,3
03$1
79,1
32,1
56So
urce
: Offi
ce o
f the
Com
ptro
ller's
ST-
10 F
und
Tran
sfer
Rep
ort
FY 2
011
Cons
olid
ated
Ser
vice
s Tr
ansf
ers
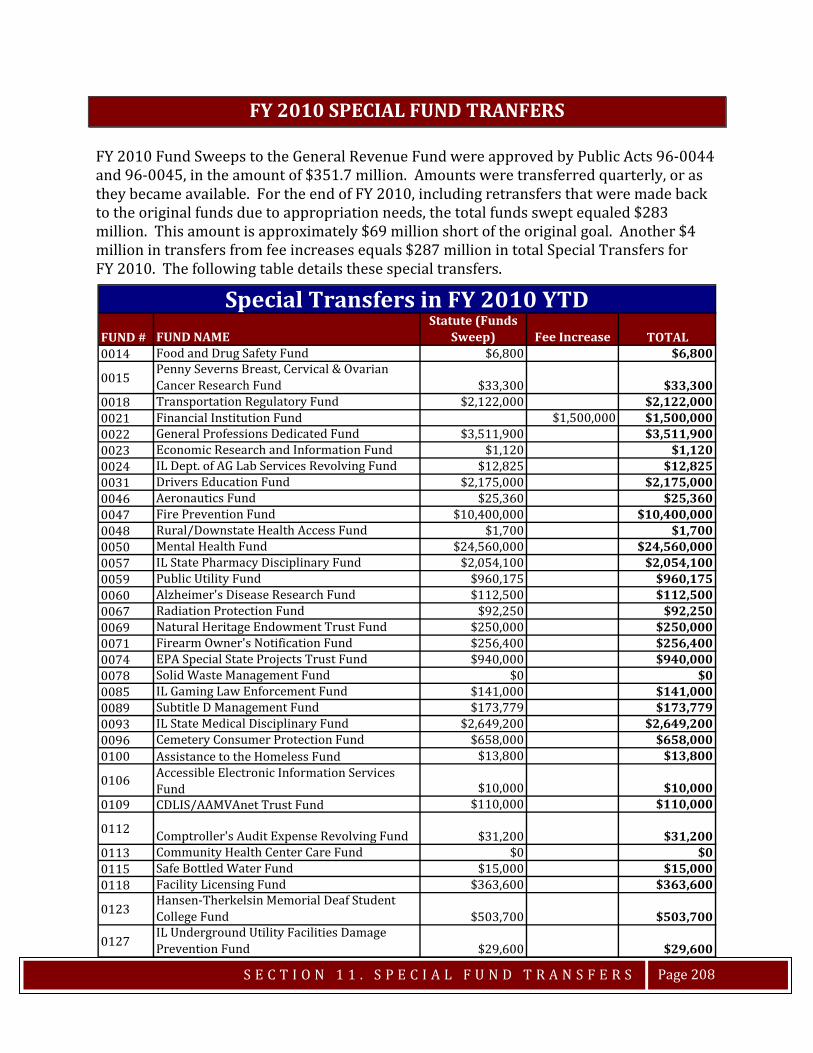
S E C T I O N 1 1 . S P E C I A L F U N D T R A N S F E R S
Page 208
FY 2010 SPECIAL FUND TRANFERS FY 2010 Fund Sweeps to the General Revenue Fund were approved by Public Acts 96-0044 and 96-0045, in the amount of $351.7 million. Amounts were transferred quarterly, or as they became available. For the end of FY 2010, including retransfers that were made back to the original funds due to appropriation needs, the total funds swept equaled $283 million. This amount is approximately $69 million short of the original goal. Another $4 million in transfers from fee increases equals $287 million in total Special Transfers for FY 2010. The following table details these special transfers.
FUND # FUND NAMEStatute (Funds
Sweep) Fee Increase TOTAL0014 Food and Drug Safety Fund $6,800 $6,800
0015Penny Severns Breast, Cervical & Ovarian Cancer Research Fund $33,300 $33,300
0018 Transportation Regulatory Fund $2,122,000 $2,122,0000021 Financial Institution Fund $1,500,000 $1,500,0000022 General Professions Dedicated Fund $3,511,900 $3,511,9000023 Economic Research and Information Fund $1,120 $1,1200024 IL Dept. of AG Lab Services Revolving Fund $12,825 $12,8250031 Drivers Education Fund $2,175,000 $2,175,0000046 Aeronautics Fund $25,360 $25,3600047 Fire Prevention Fund $10,400,000 $10,400,0000048 Rural/Downstate Health Access Fund $1,700 $1,7000050 Mental Health Fund $24,560,000 $24,560,0000057 IL State Pharmacy Disciplinary Fund $2,054,100 $2,054,1000059 Public Utility Fund $960,175 $960,1750060 Alzheimer's Disease Research Fund $112,500 $112,5000067 Radiation Protection Fund $92,250 $92,2500069 Natural Heritage Endowment Trust Fund $250,000 $250,0000071 Firearm Owner's Notification Fund $256,400 $256,4000074 EPA Special State Projects Trust Fund $940,000 $940,0000078 Solid Waste Management Fund $0 $00085 IL Gaming Law Enforcement Fund $141,000 $141,0000089 Subtitle D Management Fund $173,779 $173,7790093 IL State Medical Disciplinary Fund $2,649,200 $2,649,2000096 Cemetery Consumer Protection Fund $658,000 $658,0000100 Assistance to the Homeless Fund $13,800 $13,800
0106 Accessible Electronic Information Services Fund $10,000 $10,000
0109 CDLIS/AAMVAnet Trust Fund $110,000 $110,000
0112 Comptroller's Audit Expense Revolving Fund $31,200 $31,2000113 Community Health Center Care Fund $0 $00115 Safe Bottled Water Fund $15,000 $15,0000118 Facility Licensing Fund $363,600 $363,600
0123Hansen-Therkelsin Memorial Deaf Student College Fund $503,700 $503,700
0127IL Underground Utility Facilities Damage Prevention Fund $29,600 $29,600
Special Transfers in FY 2010 YTD
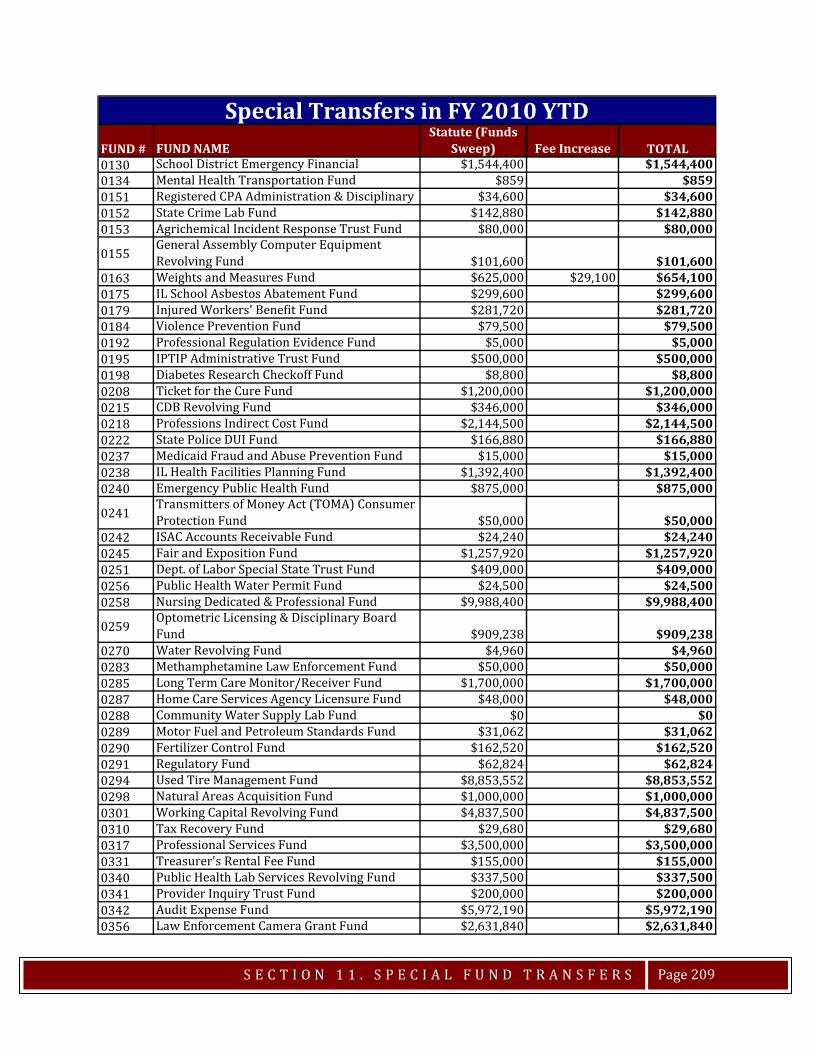
S E C T I O N 1 1 . S P E C I A L F U N D T R A N S F E R S
Page 209
FUND # FUND NAMEStatute (Funds
Sweep) Fee Increase TOTAL0130 School District Emergency Financial $1,544,400 $1,544,4000134 Mental Health Transportation Fund $859 $8590151 Registered CPA Administration & Disciplinary $34,600 $34,6000152 State Crime Lab Fund $142,880 $142,8800153 Agrichemical Incident Response Trust Fund $80,000 $80,000
0155General Assembly Computer Equipment Revolving Fund $101,600 $101,600
0163 Weights and Measures Fund $625,000 $29,100 $654,1000175 IL School Asbestos Abatement Fund $299,600 $299,6000179 Injured Workers' Benefit Fund $281,720 $281,7200184 Violence Prevention Fund $79,500 $79,5000192 Professional Regulation Evidence Fund $5,000 $5,0000195 IPTIP Administrative Trust Fund $500,000 $500,0000198 Diabetes Research Checkoff Fund $8,800 $8,8000208 Ticket for the Cure Fund $1,200,000 $1,200,0000215 CDB Revolving Fund $346,000 $346,0000218 Professions Indirect Cost Fund $2,144,500 $2,144,5000222 State Police DUI Fund $166,880 $166,8800237 Medicaid Fraud and Abuse Prevention Fund $15,000 $15,0000238 IL Health Facilities Planning Fund $1,392,400 $1,392,4000240 Emergency Public Health Fund $875,000 $875,000
0241Transmitters of Money Act (TOMA) Consumer Protection Fund $50,000 $50,000
0242 ISAC Accounts Receivable Fund $24,240 $24,2400245 Fair and Exposition Fund $1,257,920 $1,257,9200251 Dept. of Labor Special State Trust Fund $409,000 $409,0000256 Public Health Water Permit Fund $24,500 $24,5000258 Nursing Dedicated & Professional Fund $9,988,400 $9,988,400
0259Optometric Licensing & Disciplinary Board Fund $909,238 $909,238
0270 Water Revolving Fund $4,960 $4,9600283 Methamphetamine Law Enforcement Fund $50,000 $50,0000285 Long Term Care Monitor/Receiver Fund $1,700,000 $1,700,0000287 Home Care Services Agency Licensure Fund $48,000 $48,0000288 Community Water Supply Lab Fund $0 $00289 Motor Fuel and Petroleum Standards Fund $31,062 $31,0620290 Fertilizer Control Fund $162,520 $162,5200291 Regulatory Fund $62,824 $62,8240294 Used Tire Management Fund $8,853,552 $8,853,5520298 Natural Areas Acquisition Fund $1,000,000 $1,000,0000301 Working Capital Revolving Fund $4,837,500 $4,837,5000310 Tax Recovery Fund $29,680 $29,6800317 Professional Services Fund $3,500,000 $3,500,0000331 Treasurer's Rental Fee Fund $155,000 $155,0000340 Public Health Lab Services Revolving Fund $337,500 $337,5000341 Provider Inquiry Trust Fund $200,000 $200,0000342 Audit Expense Fund $5,972,190 $5,972,1900356 Law Enforcement Camera Grant Fund $2,631,840 $2,631,840
Special Transfers in FY 2010 YTD
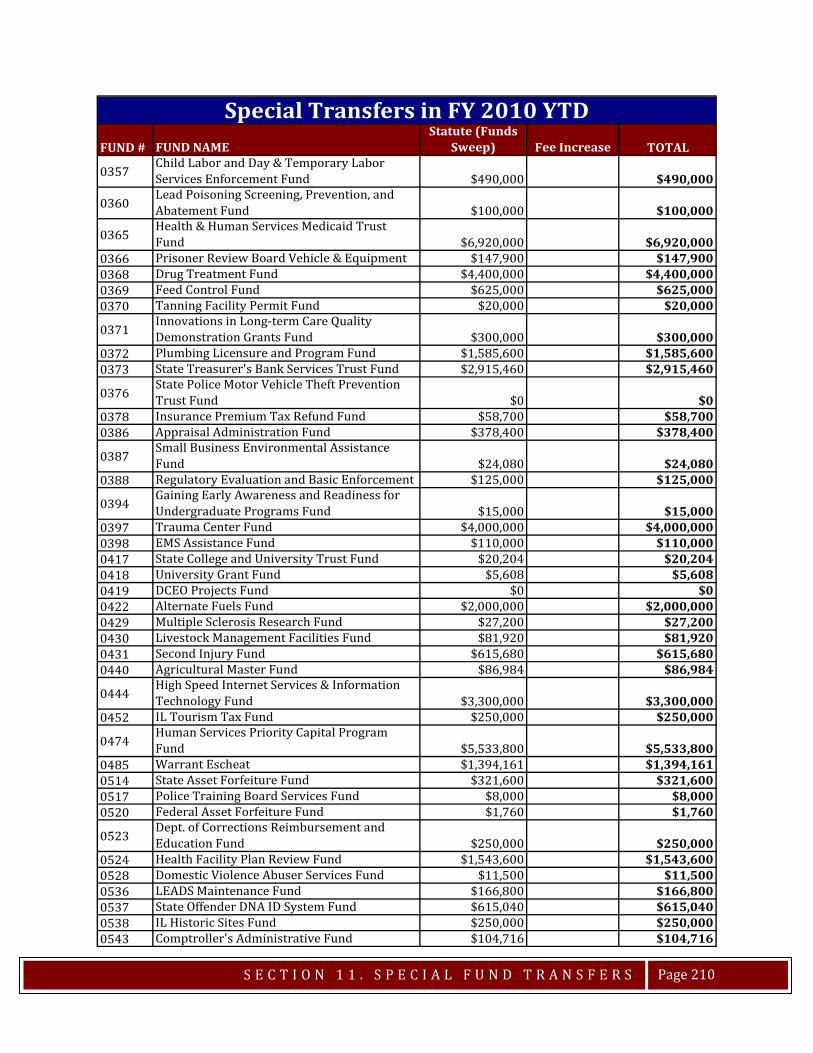
S E C T I O N 1 1 . S P E C I A L F U N D T R A N S F E R S
Page 210
FUND # FUND NAMEStatute (Funds
Sweep) Fee Increase TOTAL
0357Child Labor and Day & Temporary Labor Services Enforcement Fund $490,000 $490,000
0360Lead Poisoning Screening, Prevention, and Abatement Fund $100,000 $100,000
0365Health & Human Services Medicaid Trust Fund $6,920,000 $6,920,000
0366 Prisoner Review Board Vehicle & Equipment $147,900 $147,9000368 Drug Treatment Fund $4,400,000 $4,400,0000369 Feed Control Fund $625,000 $625,0000370 Tanning Facility Permit Fund $20,000 $20,000
0371Innovations in Long-term Care Quality Demonstration Grants Fund $300,000 $300,000
0372 Plumbing Licensure and Program Fund $1,585,600 $1,585,6000373 State Treasurer's Bank Services Trust Fund $2,915,460 $2,915,460
0376State Police Motor Vehicle Theft Prevention Trust Fund $0 $0
0378 Insurance Premium Tax Refund Fund $58,700 $58,7000386 Appraisal Administration Fund $378,400 $378,400
0387Small Business Environmental Assistance Fund $24,080 $24,080
0388 Regulatory Evaluation and Basic Enforcement $125,000 $125,000
0394Gaining Early Awareness and Readiness for Undergraduate Programs Fund $15,000 $15,000
0397 Trauma Center Fund $4,000,000 $4,000,0000398 EMS Assistance Fund $110,000 $110,0000417 State College and University Trust Fund $20,204 $20,2040418 University Grant Fund $5,608 $5,6080419 DCEO Projects Fund $0 $00422 Alternate Fuels Fund $2,000,000 $2,000,0000429 Multiple Sclerosis Research Fund $27,200 $27,2000430 Livestock Management Facilities Fund $81,920 $81,9200431 Second Injury Fund $615,680 $615,6800440 Agricultural Master Fund $86,984 $86,984
0444High Speed Internet Services & Information Technology Fund $3,300,000 $3,300,000
0452 IL Tourism Tax Fund $250,000 $250,000
0474Human Services Priority Capital Program Fund $5,533,800 $5,533,800
0485 Warrant Escheat $1,394,161 $1,394,1610514 State Asset Forfeiture Fund $321,600 $321,6000517 Police Training Board Services Fund $8,000 $8,0000520 Federal Asset Forfeiture Fund $1,760 $1,760
0523Dept. of Corrections Reimbursement and Education Fund $250,000 $250,000
0524 Health Facility Plan Review Fund $1,543,600 $1,543,6000528 Domestic Violence Abuser Services Fund $11,500 $11,5000536 LEADS Maintenance Fund $166,800 $166,8000537 State Offender DNA ID System Fund $615,040 $615,0400538 IL Historic Sites Fund $250,000 $250,0000543 Comptroller's Administrative Fund $104,716 $104,716
Special Transfers in FY 2010 YTD
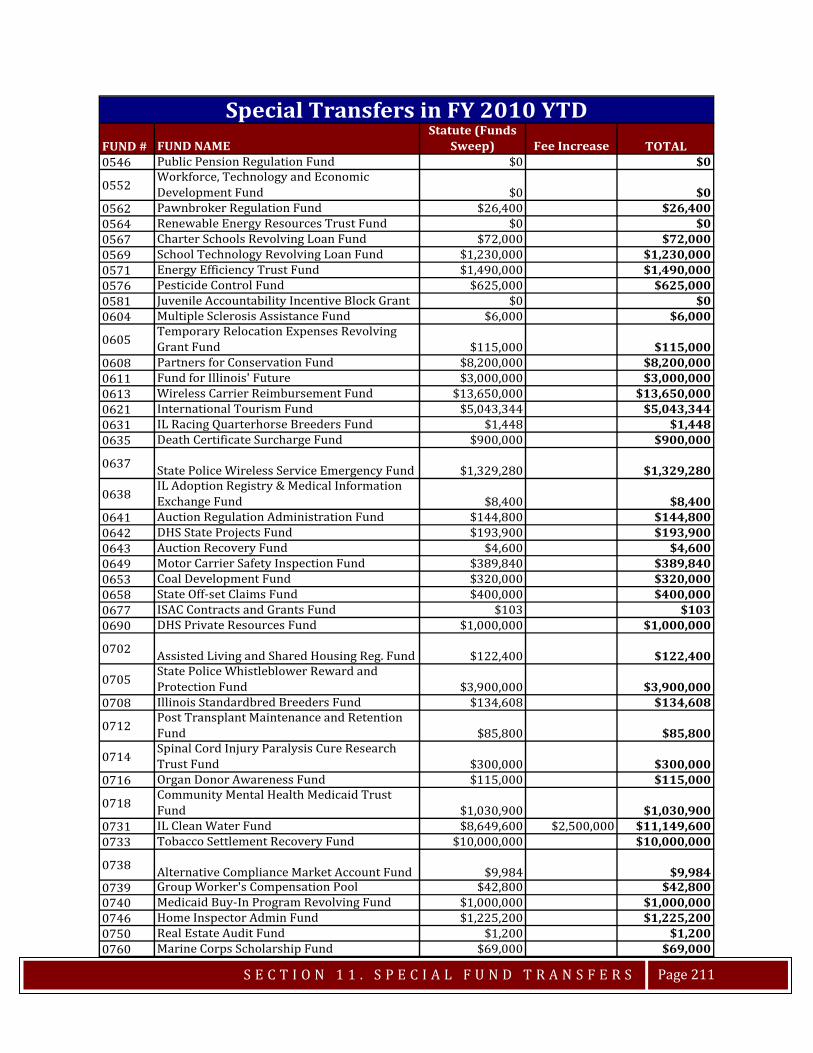
S E C T I O N 1 1 . S P E C I A L F U N D T R A N S F E R S
Page 211
FUND # FUND NAMEStatute (Funds
Sweep) Fee Increase TOTAL0546 Public Pension Regulation Fund $0 $0
0552Workforce, Technology and Economic Development Fund $0 $0
0562 Pawnbroker Regulation Fund $26,400 $26,4000564 Renewable Energy Resources Trust Fund $0 $00567 Charter Schools Revolving Loan Fund $72,000 $72,0000569 School Technology Revolving Loan Fund $1,230,000 $1,230,0000571 Energy Efficiency Trust Fund $1,490,000 $1,490,0000576 Pesticide Control Fund $625,000 $625,0000581 Juvenile Accountability Incentive Block Grant $0 $00604 Multiple Sclerosis Assistance Fund $6,000 $6,000
0605Temporary Relocation Expenses Revolving Grant Fund $115,000 $115,000
0608 Partners for Conservation Fund $8,200,000 $8,200,0000611 Fund for Illinois' Future $3,000,000 $3,000,0000613 Wireless Carrier Reimbursement Fund $13,650,000 $13,650,0000621 International Tourism Fund $5,043,344 $5,043,3440631 IL Racing Quarterhorse Breeders Fund $1,448 $1,4480635 Death Certificate Surcharge Fund $900,000 $900,000
0637 State Police Wireless Service Emergency Fund $1,329,280 $1,329,280
0638IL Adoption Registry & Medical Information Exchange Fund $8,400 $8,400
0641 Auction Regulation Administration Fund $144,800 $144,8000642 DHS State Projects Fund $193,900 $193,9000643 Auction Recovery Fund $4,600 $4,6000649 Motor Carrier Safety Inspection Fund $389,840 $389,8400653 Coal Development Fund $320,000 $320,0000658 State Off-set Claims Fund $400,000 $400,0000677 ISAC Contracts and Grants Fund $103 $1030690 DHS Private Resources Fund $1,000,000 $1,000,000
0702 Assisted Living and Shared Housing Reg. Fund $122,400 $122,400
0705State Police Whistleblower Reward and Protection Fund $3,900,000 $3,900,000
0708 Illinois Standardbred Breeders Fund $134,608 $134,608
0712Post Transplant Maintenance and Retention Fund $85,800 $85,800
0714Spinal Cord Injury Paralysis Cure Research Trust Fund $300,000 $300,000
0716 Organ Donor Awareness Fund $115,000 $115,000
0718Community Mental Health Medicaid Trust Fund $1,030,900 $1,030,900
0731 IL Clean Water Fund $8,649,600 $2,500,000 $11,149,6000733 Tobacco Settlement Recovery Fund $10,000,000 $10,000,000
0738 Alternative Compliance Market Account Fund $9,984 $9,9840739 Group Worker's Compensation Pool $42,800 $42,8000740 Medicaid Buy-In Program Revolving Fund $1,000,000 $1,000,0000746 Home Inspector Admin Fund $1,225,200 $1,225,2000750 Real Estate Audit Fund $1,200 $1,2000760 Marine Corps Scholarship Fund $69,000 $69,000
Special Transfers in FY 2010 YTD
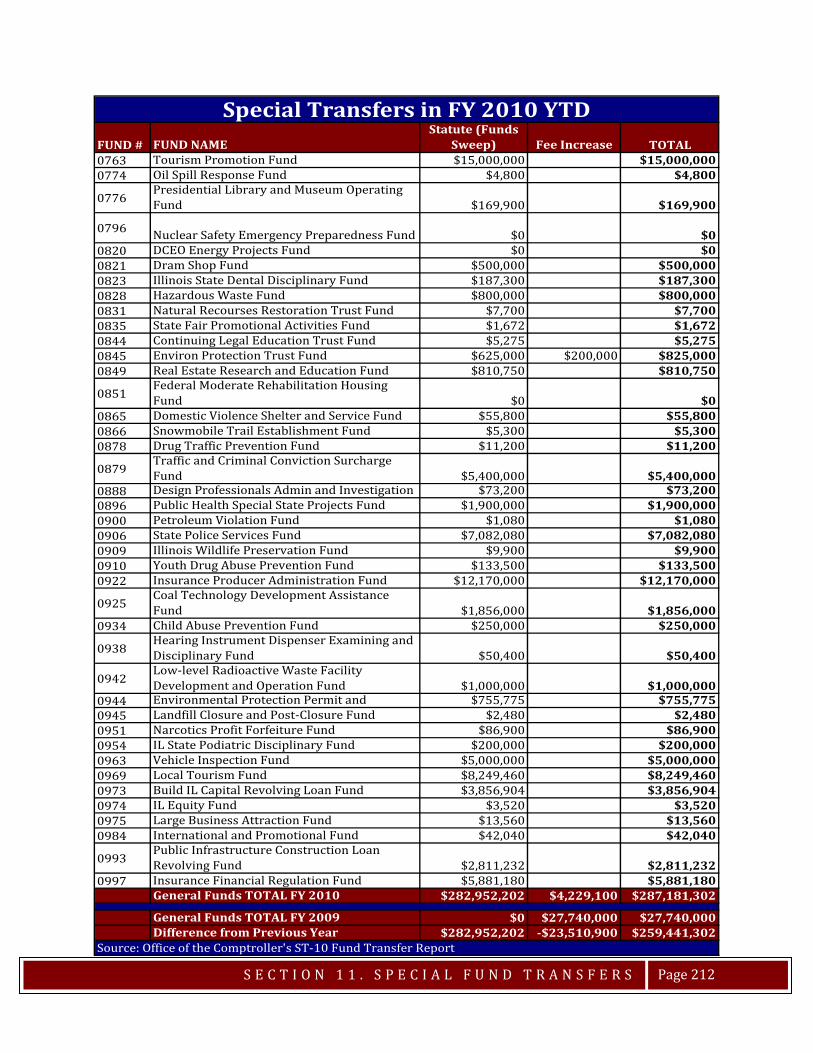
S E C T I O N 1 1 . S P E C I A L F U N D T R A N S F E R S
Page 212
FUND # FUND NAMEStatute (Funds
Sweep) Fee Increase TOTAL0763 Tourism Promotion Fund $15,000,000 $15,000,0000774 Oil Spill Response Fund $4,800 $4,800
0776Presidential Library and Museum Operating Fund $169,900 $169,900
0796 Nuclear Safety Emergency Preparedness Fund $0 $00820 DCEO Energy Projects Fund $0 $00821 Dram Shop Fund $500,000 $500,0000823 Illinois State Dental Disciplinary Fund $187,300 $187,3000828 Hazardous Waste Fund $800,000 $800,0000831 Natural Recourses Restoration Trust Fund $7,700 $7,7000835 State Fair Promotional Activities Fund $1,672 $1,6720844 Continuing Legal Education Trust Fund $5,275 $5,2750845 Environ Protection Trust Fund $625,000 $200,000 $825,0000849 Real Estate Research and Education Fund $810,750 $810,750
0851Federal Moderate Rehabilitation Housing Fund $0 $0
0865 Domestic Violence Shelter and Service Fund $55,800 $55,8000866 Snowmobile Trail Establishment Fund $5,300 $5,3000878 Drug Traffic Prevention Fund $11,200 $11,200
0879Traffic and Criminal Conviction Surcharge Fund $5,400,000 $5,400,000
0888 Design Professionals Admin and Investigation $73,200 $73,2000896 Public Health Special State Projects Fund $1,900,000 $1,900,0000900 Petroleum Violation Fund $1,080 $1,0800906 State Police Services Fund $7,082,080 $7,082,0800909 Illinois Wildlife Preservation Fund $9,900 $9,9000910 Youth Drug Abuse Prevention Fund $133,500 $133,5000922 Insurance Producer Administration Fund $12,170,000 $12,170,000
0925Coal Technology Development Assistance Fund $1,856,000 $1,856,000
0934 Child Abuse Prevention Fund $250,000 $250,000
0938Hearing Instrument Dispenser Examining and Disciplinary Fund $50,400 $50,400
0942Low-level Radioactive Waste Facility Development and Operation Fund $1,000,000 $1,000,000
0944 Environmental Protection Permit and $755,775 $755,7750945 Landfill Closure and Post-Closure Fund $2,480 $2,4800951 Narcotics Profit Forfeiture Fund $86,900 $86,9000954 IL State Podiatric Disciplinary Fund $200,000 $200,0000963 Vehicle Inspection Fund $5,000,000 $5,000,0000969 Local Tourism Fund $8,249,460 $8,249,4600973 Build IL Capital Revolving Loan Fund $3,856,904 $3,856,9040974 IL Equity Fund $3,520 $3,5200975 Large Business Attraction Fund $13,560 $13,5600984 International and Promotional Fund $42,040 $42,040
0993Public Infrastructure Construction Loan Revolving Fund $2,811,232 $2,811,232
0997 Insurance Financial Regulation Fund $5,881,180 $5,881,180General Funds TOTAL FY 2010 $282,952,202 $4,229,100 $287,181,302
General Funds TOTAL FY 2009 $0 $27,740,000 $27,740,000Difference from Previous Year $282,952,202 -$23,510,900 $259,441,302
Special Transfers in FY 2010 YTD
Source: Office of the Comptroller's ST-10 Fund Transfer Report
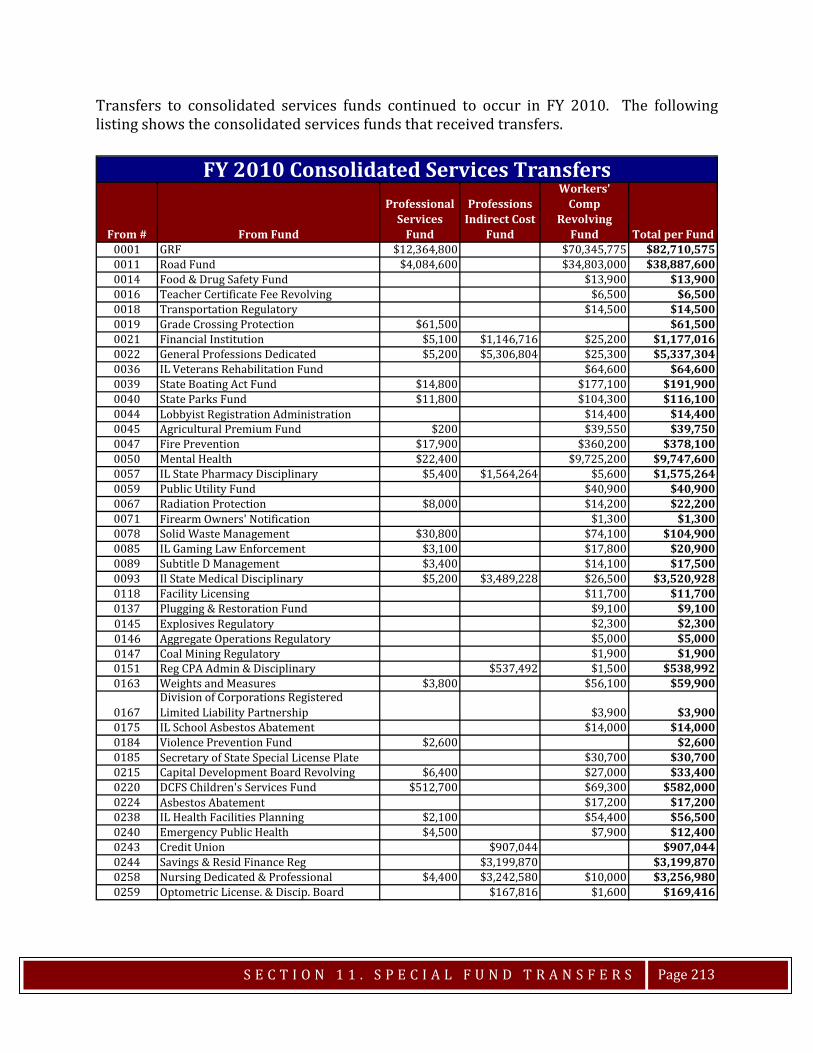
S E C T I O N 1 1 . S P E C I A L F U N D T R A N S F E R S
Page 213
Transfers to consolidated services funds continued to occur in FY 2010. The following listing shows the consolidated services funds that received transfers.
From # From Fund
Professional Services
Fund
Professions Indirect Cost
Fund
Workers' Comp
Revolving Fund Total per Fund
0001 GRF $12,364,800 $70,345,775 $82,710,5750011 Road Fund $4,084,600 $34,803,000 $38,887,6000014 Food & Drug Safety Fund $13,900 $13,9000016 Teacher Certificate Fee Revolving $6,500 $6,5000018 Transportation Regulatory $14,500 $14,5000019 Grade Crossing Protection $61,500 $61,5000021 Financial Institution $5,100 $1,146,716 $25,200 $1,177,0160022 General Professions Dedicated $5,200 $5,306,804 $25,300 $5,337,3040036 IL Veterans Rehabilitation Fund $64,600 $64,6000039 State Boating Act Fund $14,800 $177,100 $191,9000040 State Parks Fund $11,800 $104,300 $116,1000044 Lobbyist Registration Administration $14,400 $14,4000045 Agricultural Premium Fund $200 $39,550 $39,7500047 Fire Prevention $17,900 $360,200 $378,1000050 Mental Health $22,400 $9,725,200 $9,747,6000057 IL State Pharmacy Disciplinary $5,400 $1,564,264 $5,600 $1,575,2640059 Public Utility Fund $40,900 $40,9000067 Radiation Protection $8,000 $14,200 $22,2000071 Firearm Owners' Notification $1,300 $1,3000078 Solid Waste Management $30,800 $74,100 $104,9000085 IL Gaming Law Enforcement $3,100 $17,800 $20,9000089 Subtitle D Management $3,400 $14,100 $17,5000093 Il State Medical Disciplinary $5,200 $3,489,228 $26,500 $3,520,9280118 Facility Licensing $11,700 $11,7000137 Plugging & Restoration Fund $9,100 $9,1000145 Explosives Regulatory $2,300 $2,3000146 Aggregate Operations Regulatory $5,000 $5,0000147 Coal Mining Regulatory $1,900 $1,9000151 Reg CPA Admin & Disciplinary $537,492 $1,500 $538,9920163 Weights and Measures $3,800 $56,100 $59,900
0167Division of Corporations Registered Limited Liability Partnership $3,900 $3,900
0175 IL School Asbestos Abatement $14,000 $14,0000184 Violence Prevention Fund $2,600 $2,6000185 Secretary of State Special License Plate $30,700 $30,7000215 Capital Development Board Revolving $6,400 $27,000 $33,4000220 DCFS Children's Services Fund $512,700 $69,300 $582,0000224 Asbestos Abatement $17,200 $17,2000238 IL Health Facilities Planning $2,100 $54,400 $56,5000240 Emergency Public Health $4,500 $7,900 $12,4000243 Credit Union $907,044 $907,0440244 Savings & Resid Finance Reg $3,199,870 $3,199,8700258 Nursing Dedicated & Professional $4,400 $3,242,580 $10,000 $3,256,9800259 Optometric License. & Discip. Board $167,816 $1,600 $169,416
FY 2010 Consolidated Services Transfers

S E C T I O N 1 1 . S P E C I A L F U N D T R A N S F E R S
Page 214
From # From Fund
Professional Services
Fund
Professions Indirect Cost
Fund
Workers' Comp
Revolving Fund Total per Fund
0261 Underground Resources Conserv. Enforc. $11,500 $11,5000265 State Rail Freight Loan Repayment $3,000 $3,0000276 Drunk & Drugged Driving Prevention $2,500 $18,200 $20,7000285 Long Term Care Monitor/Receiver $35,400 $35,4000288 Community Water Supply Lab $1,900 $5,600 $7,5000292 Securities Investors Education $2,000 $2,0000294 Used Tire Management $10,300 $32,400 $42,7000298 Natural Areas Acquisition Fund $15,700 $101,200 $116,9000299 Open Space Lands Acquis. & Devel. $26,200 $28,400 $54,6000301 Working Capital Revolving $54,500 $244,550 $299,0500303 State Garage Revolving $60,200 $896,800 $957,0000304 Statistical Servs Revolving $170,300 $1,000,000 $1,170,3000312 Communications Revolving $165,900 $1,432,800 $1,598,7000314 Facilities Management Revolving $270,500 $270,5000317 Professional Services $483,600 $483,6000323 Motor Vehicle Review Board $15,000 $15,0000336 Environmental Lab Certification $3,000 $3,0000340 Public Health Lab Services Revolving $2,500 $2,500 $5,0000342 Audit Expense $594 $5940360 Lead Poisoning Screening $4,400 $28,200 $32,6000362 Securities Audit & Enforcement Fund $258,400 $258,400
0363Department of Business Services Special Operations $111,900 $111,900
0368 Drug Treatment Fund $6,000 $6,0000369 Feed Control Fund $20,800 $20,8000370 Tanning Facility Permit $5,400 $5,4000372 Plumbing Lic. And Program $24,400 $24,4000384 Tax Compliance and Admin $3,200 $27,200 $30,4000386 Appraisal Administration $309,344 $2,400 $311,7440387 Small Business Environmental Assistance $2,200 $2,2000397 Trauma Center $24,100 $24,1000438 IL State Fair $23,550 $23,5500483 Secretary of State Special Services $317,600 $317,6000523 Dept. Of Corrections Reimbursement $62,700 $324,500 $387,2000524 Health Facility Planning Review $31,200 $31,2000538 IL Historic Sites Fund $3,600 $11,500 $15,100
0542Attorney General Court Order & Voluntary Compliance Payment Projects $18,500 $18,500
0546 Public Pension Regulation Fund $5,600 $5,6000549 IL Charity Bureau $11,400 $11,4000562 Pawnbroker Regulation $237,344 $237,3440564 Renewable Energy Resource Trust $6,700 $6,7000571 Energy Efficiency Trust $3,600 $3,6000576 Pesticide Control $4,000 $28,400 $32,4000600 AG Whistleblower Reward & Protection $14,200 $14,200
FY 2010 Consolidated Services Transfers
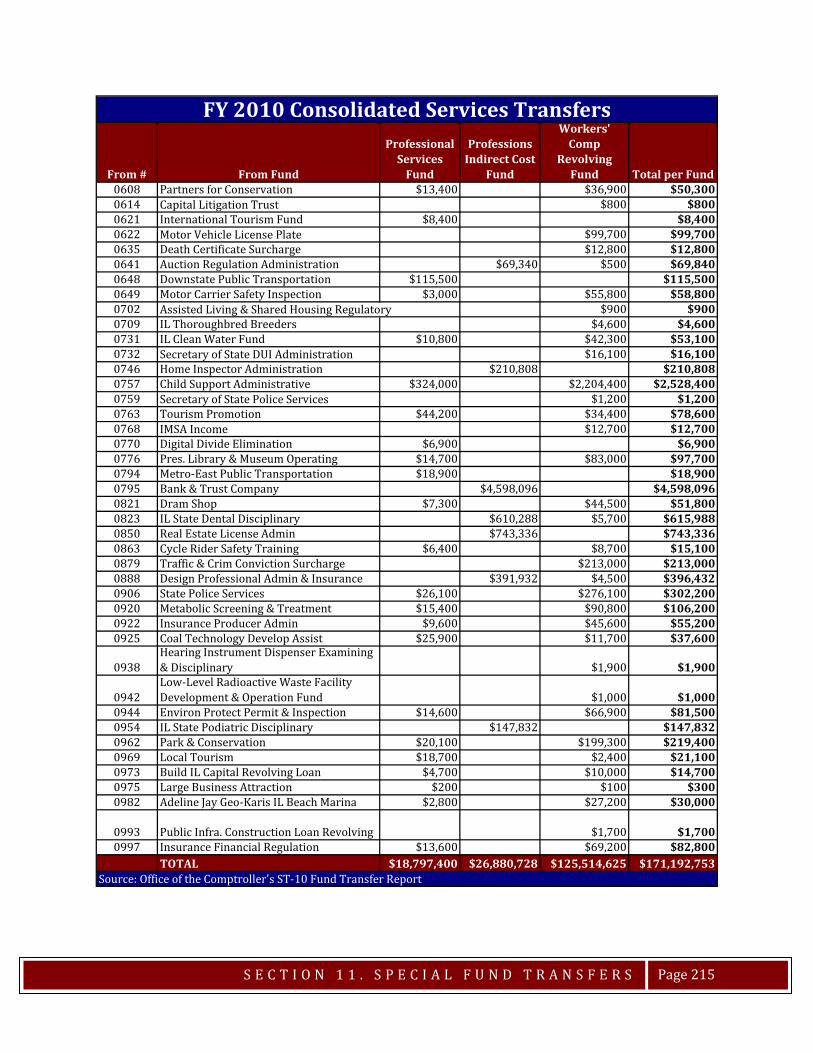
S E C T I O N 1 1 . S P E C I A L F U N D T R A N S F E R S
Page 215
From # From Fund
Professional Services
Fund
Professions Indirect Cost
Fund
Workers' Comp
Revolving Fund Total per Fund
0608 Partners for Conservation $13,400 $36,900 $50,3000614 Capital Litigation Trust $800 $8000621 International Tourism Fund $8,400 $8,4000622 Motor Vehicle License Plate $99,700 $99,7000635 Death Certificate Surcharge $12,800 $12,8000641 Auction Regulation Administration $69,340 $500 $69,8400648 Downstate Public Transportation $115,500 $115,5000649 Motor Carrier Safety Inspection $3,000 $55,800 $58,8000702 Assisted Living & Shared Housing Regulatory $900 $9000709 IL Thoroughbred Breeders $4,600 $4,6000731 IL Clean Water Fund $10,800 $42,300 $53,1000732 Secretary of State DUI Administration $16,100 $16,1000746 Home Inspector Administration $210,808 $210,8080757 Child Support Administrative $324,000 $2,204,400 $2,528,4000759 Secretary of State Police Services $1,200 $1,2000763 Tourism Promotion $44,200 $34,400 $78,6000768 IMSA Income $12,700 $12,7000770 Digital Divide Elimination $6,900 $6,9000776 Pres. Library & Museum Operating $14,700 $83,000 $97,7000794 Metro-East Public Transportation $18,900 $18,9000795 Bank & Trust Company $4,598,096 $4,598,0960821 Dram Shop $7,300 $44,500 $51,8000823 IL State Dental Disciplinary $610,288 $5,700 $615,9880850 Real Estate License Admin $743,336 $743,3360863 Cycle Rider Safety Training $6,400 $8,700 $15,1000879 Traffic & Crim Conviction Surcharge $213,000 $213,0000888 Design Professional Admin & Insurance $391,932 $4,500 $396,4320906 State Police Services $26,100 $276,100 $302,2000920 Metabolic Screening & Treatment $15,400 $90,800 $106,2000922 Insurance Producer Admin $9,600 $45,600 $55,2000925 Coal Technology Develop Assist $25,900 $11,700 $37,600
0938Hearing Instrument Dispenser Examining & Disciplinary $1,900 $1,900
0942Low-Level Radioactive Waste Facility Development & Operation Fund $1,000 $1,000
0944 Environ Protect Permit & Inspection $14,600 $66,900 $81,5000954 IL State Podiatric Disciplinary $147,832 $147,8320962 Park & Conservation $20,100 $199,300 $219,4000969 Local Tourism $18,700 $2,400 $21,1000973 Build IL Capital Revolving Loan $4,700 $10,000 $14,7000975 Large Business Attraction $200 $100 $3000982 Adeline Jay Geo-Karis IL Beach Marina $2,800 $27,200 $30,000
0993 Public Infra. Construction Loan Revolving $1,700 $1,7000997 Insurance Financial Regulation $13,600 $69,200 $82,800
TOTAL $18,797,400 $26,880,728 $125,514,625 $171,192,753
FY 2010 Consolidated Services Transfers
Source: Office of the Comptroller's ST-10 Fund Transfer Report
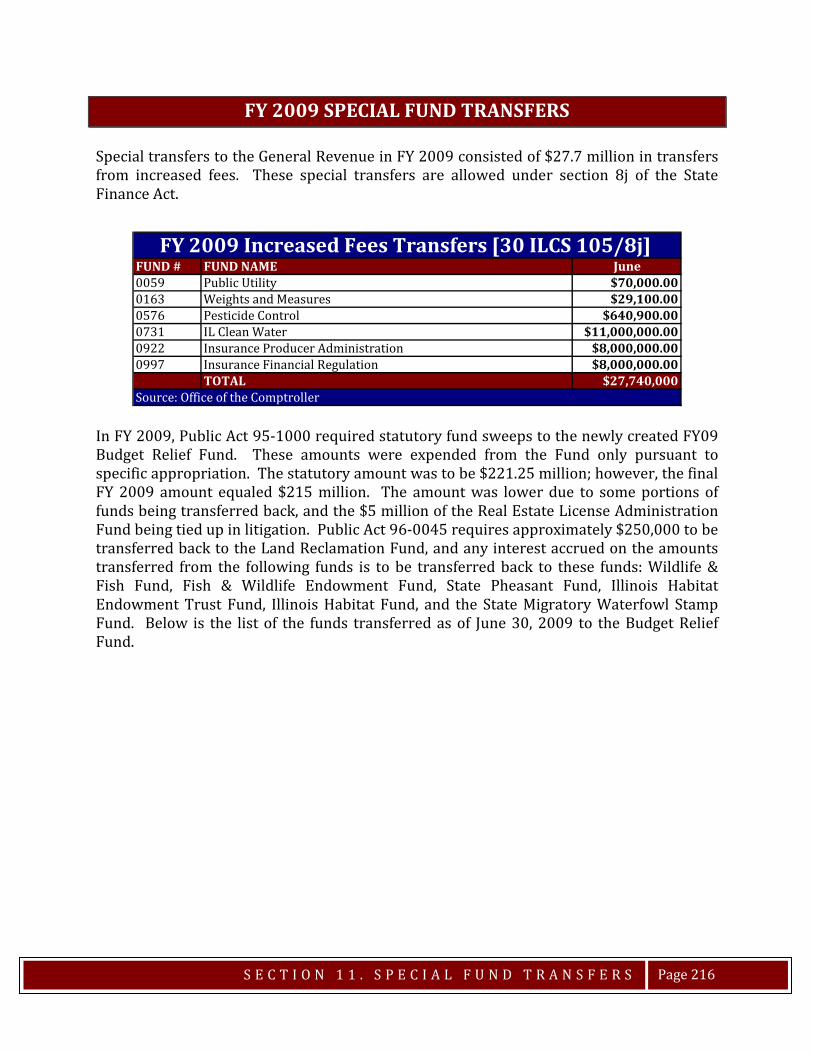
S E C T I O N 1 1 . S P E C I A L F U N D T R A N S F E R S
Page 216
FY 2009 SPECIAL FUND TRANSFERS Special transfers to the General Revenue in FY 2009 consisted of $27.7 million in transfers from increased fees. These special transfers are allowed under section 8j of the State Finance Act.
In FY 2009, Public Act 95-1000 required statutory fund sweeps to the newly created FY09 Budget Relief Fund. These amounts were expended from the Fund only pursuant to specific appropriation. The statutory amount was to be $221.25 million; however, the final FY 2009 amount equaled $215 million. The amount was lower due to some portions of funds being transferred back, and the $5 million of the Real Estate License Administration Fund being tied up in litigation. Public Act 96-0045 requires approximately $250,000 to be transferred back to the Land Reclamation Fund, and any interest accrued on the amounts transferred from the following funds is to be transferred back to these funds: Wildlife & Fish Fund, Fish & Wildlife Endowment Fund, State Pheasant Fund, Illinois Habitat Endowment Trust Fund, Illinois Habitat Fund, and the State Migratory Waterfowl Stamp Fund. Below is the list of the funds transferred as of June 30, 2009 to the Budget Relief Fund.
FUND # FUND NAME June0059 Public Utility $70,000.000163 Weights and Measures $29,100.000576 Pesticide Control $640,900.000731 IL Clean Water $11,000,000.000922 Insurance Producer Administration $8,000,000.000997 Insurance Financial Regulation $8,000,000.00
TOTAL $27,740,000
FY 2009 Increased Fees Transfers [30 ILCS 105/8j]
Source: Office of the Comptroller
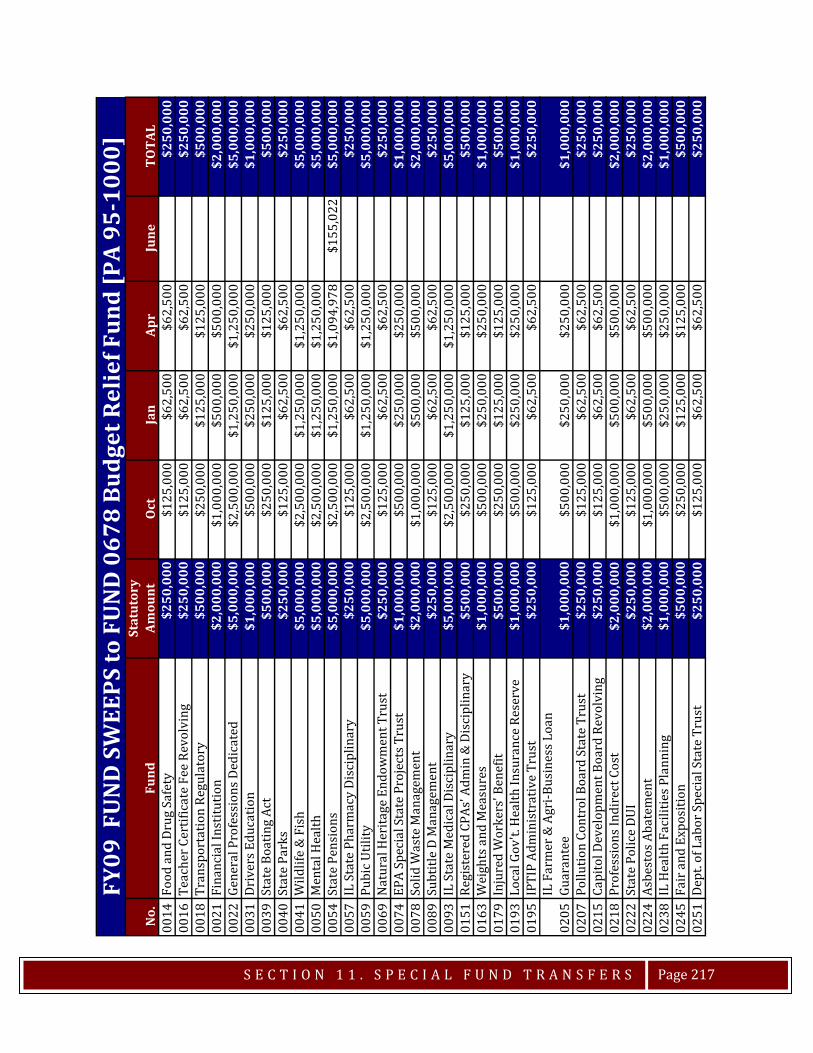
S E C T I O N 1 1 . S P E C I A L F U N D T R A N S F E R S
Page 217
No.
Fund
Stat
utor
y Am
ount
Oct
Jan
Apr
June
TOTA
L00
14Fo
od a
nd D
rug
Safe
ty
$250
,000
$125
,000
$62,
500
$62,
500
$250
,000
0016
Teac
her C
ertif
icat
e Fe
e Re
volv
ing
$250
,000
$125
,000
$62,
500
$62,
500
$250
,000
0018
Tran
spor
tatio
n Re
gula
tory
$500
,000
$250
,000
$125
,000
$125
,000
$500
,000
0021
Fina
ncia
l Ins
titut
ion
$2,0
00,0
00$1
,000
,000
$500
,000
$500
,000
$2,0
00,0
0000
22Ge
nera
l Pro
fess
ions
Ded
icat
ed
$5,0
00,0
00$2
,500
,000
$1,2
50,0
00$1
,250
,000
$5,0
00,0
0000
31D
rive
rs E
duca
tion
$1,0
00,0
00$5
00,0
00$2
50,0
00$2
50,0
00$1
,000
,000
0039
Stat
e Bo
atin
g Ac
t$5
00,0
00$2
50,0
00$1
25,0
00$1
25,0
00$5
00,0
0000
40St
ate
Park
s $2
50,0
00$1
25,0
00$6
2,50
0$6
2,50
0$2
50,0
0000
41W
ildlif
e &
Fis
h$5
,000
,000
$2,5
00,0
00$1
,250
,000
$1,2
50,0
00$5
,000
,000
0050
Men
tal H
ealth
$5,0
00,0
00$2
,500
,000
$1,2
50,0
00$1
,250
,000
$5,0
00,0
0000
54St
ate
Pens
ions
$5,0
00,0
00$2
,500
,000
$1,2
50,0
00$1
,094
,978
$155
,022
$5,0
00,0
0000
57IL
Sta
te P
harm
acy
Dis
cipl
inar
y $2
50,0
00$1
25,0
00$6
2,50
0$6
2,50
0$2
50,0
0000
59Pu
bic
Utili
ty
$5,0
00,0
00$2
,500
,000
$1,2
50,0
00$1
,250
,000
$5,0
00,0
0000
69N
atur
al H
erita
ge E
ndow
men
t Tru
st$2
50,0
00$1
25,0
00$6
2,50
0$6
2,50
0$2
50,0
0000
74EP
A Sp
ecia
l Sta
te P
roje
cts T
rust
$1,0
00,0
00$5
00,0
00$2
50,0
00$2
50,0
00$1
,000
,000
0078
Solid
Was
te M
anag
emen
t $2
,000
,000
$1,0
00,0
00$5
00,0
00$5
00,0
00$2
,000
,000
0089
Subt
itle
D M
anag
emen
t $2
50,0
00$1
25,0
00$6
2,50
0$6
2,50
0$2
50,0
0000
93IL
Sta
te M
edic
al D
isci
plin
ary
$5,0
00,0
00$2
,500
,000
$1,2
50,0
00$1
,250
,000
$5,0
00,0
0001
51Re
gist
ered
CPA
s' A
dmin
& D
isci
plin
ary
$500
,000
$250
,000
$125
,000
$125
,000
$500
,000
0163
Wei
ghts
and
Mea
sure
s $1
,000
,000
$500
,000
$250
,000
$250
,000
$1,0
00,0
0001
79In
jure
d W
orke
rs' B
enef
it$5
00,0
00$2
50,0
00$1
25,0
00$1
25,0
00$5
00,0
0001
93Lo
cal G
ov't.
Hea
lth In
sura
nce
Rese
rve
$1,0
00,0
00$5
00,0
00$2
50,0
00$2
50,0
00$1
,000
,000
0195
IPTI
P Ad
min
istr
ativ
e Tr
ust
$250
,000
$125
,000
$62,
500
$62,
500
$250
,000
0205
IL F
arm
er &
Agr
i-Bus
ines
s Loa
n Gu
aran
tee
$1,0
00,0
00$5
00,0
00$2
50,0
00$2
50,0
00$1
,000
,000
0207
Pollu
tion
Cont
rol B
oard
Sta
te T
rust
$250
,000
$125
,000
$62,
500
$62,
500
$250
,000
0215
Capi
tol D
evel
opm
ent B
oard
Rev
olvi
ng$2
50,0
00$1
25,0
00$6
2,50
0$6
2,50
0$2
50,0
0002
18Pr
ofes
sion
s Ind
irec
t Cos
t $2
,000
,000
$1,0
00,0
00$5
00,0
00$5
00,0
00$2
,000
,000
0222
Stat
e Po
lice
DUI
$2
50,0
00$1
25,0
00$6
2,50
0$6
2,50
0$2
50,0
0002
24As
best
os A
bate
men
t $2
,000
,000
$1,0
00,0
00$5
00,0
00$5
00,0
00$2
,000
,000
0238
IL H
ealth
Fac
ilitie
s Pla
nnin
g$1
,000
,000
$500
,000
$250
,000
$250
,000
$1,0
00,0
0002
45Fa
ir a
nd E
xpos
ition
$5
00,0
00$2
50,0
00$1
25,0
00$1
25,0
00$5
00,0
0002
51D
ept.
of L
abor
Spe
cial
Sta
te T
rust
$2
50,0
00$1
25,0
00$6
2,50
0$6
2,50
0$2
50,0
00
FY09
FU
ND
SW
EEPS
to F
UN
D 0
678
Budg
et R
elie
f Fun
d [P
A 95
-100
0]
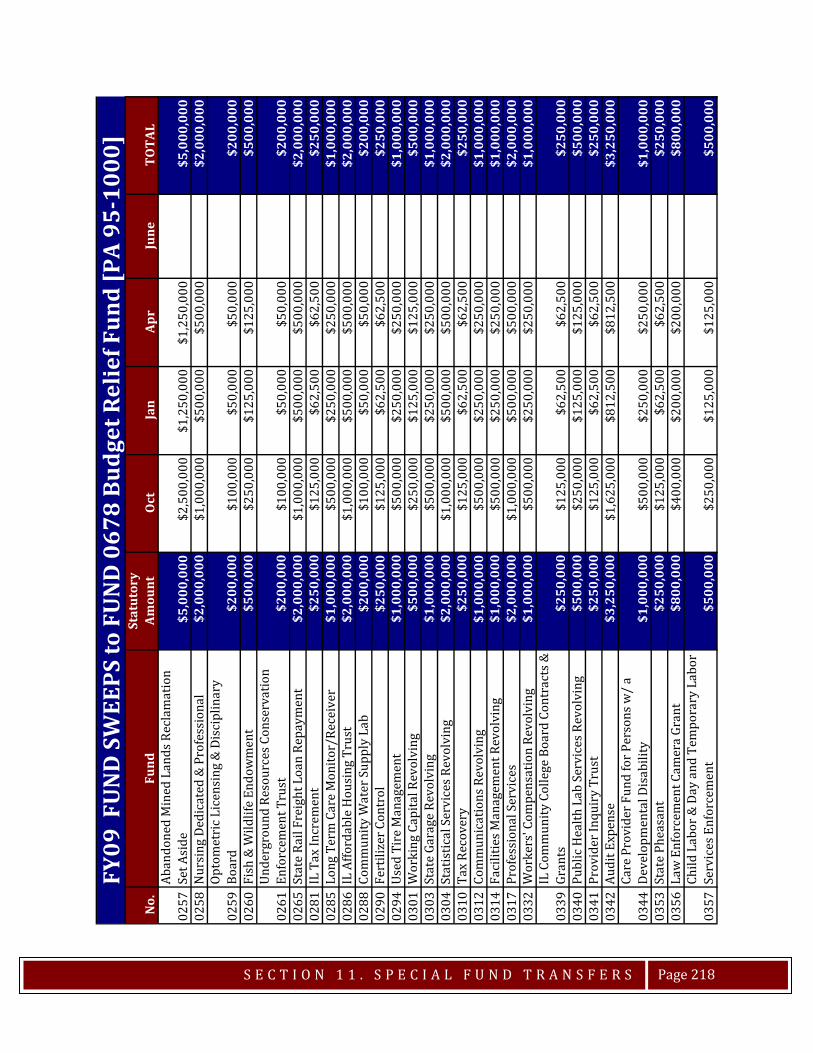
S E C T I O N 1 1 . S P E C I A L F U N D T R A N S F E R S
Page 218
No.
Fund
Stat
utor
y Am
ount
Oct
Jan
Apr
June
TOTA
L
0257
Aban
done
d M
ined
Lan
ds R
ecla
mat
ion
Set A
side
$5,0
00,0
00$2
,500
,000
$1,2
50,0
00$1
,250
,000
$5,0
00,0
0002
58N
ursi
ng D
edic
ated
& P
rofe
ssio
nal
$2,0
00,0
00$1
,000
,000
$500
,000
$500
,000
$2,0
00,0
00
0259
Opto
met
ric L
icen
sing
& D
isci
plin
ary
Boar
d$2
00,0
00$1
00,0
00$5
0,00
0$5
0,00
0$2
00,0
0002
60Fi
sh &
Wild
life
Endo
wm
ent
$500
,000
$250
,000
$125
,000
$125
,000
$500
,000
0261
Unde
rgro
und
Reso
urce
s Con
serv
atio
n En
forc
emen
t Tru
st$2
00,0
00$1
00,0
00$5
0,00
0$5
0,00
0$2
00,0
0002
65St
ate
Rail
Frei
ght L
oan
Repa
ymen
t$2
,000
,000
$1,0
00,0
00$5
00,0
00$5
00,0
00$2
,000
,000
0281
IL T
ax In
crem
ent
$250
,000
$125
,000
$62,
500
$62,
500
$250
,000
0285
Long
Ter
m C
are
Mon
itor/
Rece
iver
$1
,000
,000
$500
,000
$250
,000
$250
,000
$1,0
00,0
0002
86IL
Affo
rdab
le H
ousi
ng T
rust
$2,0
00,0
00$1
,000
,000
$500
,000
$500
,000
$2,0
00,0
0002
88Co
mm
unity
Wat
er S
uppl
y La
b $2
00,0
00$1
00,0
00$5
0,00
0$5
0,00
0$2
00,0
0002
90Fe
rtili
zer C
ontr
ol$2
50,0
00$1
25,0
00$6
2,50
0$6
2,50
0$2
50,0
0002
94Us
ed T
ire
Man
agem
ent
$1,0
00,0
00$5
00,0
00$2
50,0
00$2
50,0
00$1
,000
,000
0301
Wor
king
Cap
ital R
evol
ving
$500
,000
$250
,000
$125
,000
$125
,000
$500
,000
0303
Stat
e Ga
rage
Rev
olvi
ng
$1,0
00,0
00$5
00,0
00$2
50,0
00$2
50,0
00$1
,000
,000
0304
Stat
istic
al S
ervi
ces R
evol
ving
$2
,000
,000
$1,0
00,0
00$5
00,0
00$5
00,0
00$2
,000
,000
0310
Tax
Reco
very
$2
50,0
00$1
25,0
00$6
2,50
0$6
2,50
0$2
50,0
0003
12Co
mm
unic
atio
ns R
evol
ving
$1
,000
,000
$500
,000
$250
,000
$250
,000
$1,0
00,0
0003
14Fa
cilit
ies M
anag
emen
t Rev
olvi
ng
$1,0
00,0
00$5
00,0
00$2
50,0
00$2
50,0
00$1
,000
,000
0317
Prof
essi
onal
Ser
vice
s $2
,000
,000
$1,0
00,0
00$5
00,0
00$5
00,0
00$2
,000
,000
0332
Wor
kers
' Com
pens
atio
n Re
volv
ing
$1,0
00,0
00$5
00,0
00$2
50,0
00$2
50,0
00$1
,000
,000
0339
IL C
omm
unity
Col
lege
Boa
rd C
ontr
acts
&
Gran
ts$2
50,0
00$1
25,0
00$6
2,50
0$6
2,50
0$2
50,0
0003
40Pu
blic
Hea
lth L
ab S
ervi
ces R
evol
ving
$500
,000
$250
,000
$125
,000
$125
,000
$500
,000
0341
Prov
ider
Inqu
iry
Trus
t$2
50,0
00$1
25,0
00$6
2,50
0$6
2,50
0$2
50,0
0003
42Au
dit E
xpen
se
$3,2
50,0
00$1
,625
,000
$812
,500
$812
,500
$3,2
50,0
00
0344
Care
Pro
vide
r Fun
d fo
r Per
sons
w/
a De
velo
pmen
tal D
isab
ility
$1,0
00,0
00$5
00,0
00$2
50,0
00$2
50,0
00$1
,000
,000
0353
Stat
e Ph
easa
nt$2
50,0
00$1
25,0
00$6
2,50
0$6
2,50
0$2
50,0
0003
56La
w E
nfor
cem
ent C
amer
a Gr
ant
$800
,000
$400
,000
$200
,000
$200
,000
$800
,000
0357
Child
Lab
or &
Day
and
Tem
pora
ry L
abor
Se
rvic
es E
nfor
cem
ent
$500
,000
$250
,000
$125
,000
$125
,000
$500
,000
FY09
FU
ND
SW
EEPS
to F
UN
D 0
678
Budg
et R
elie
f Fun
d [P
A 95
-100
0]
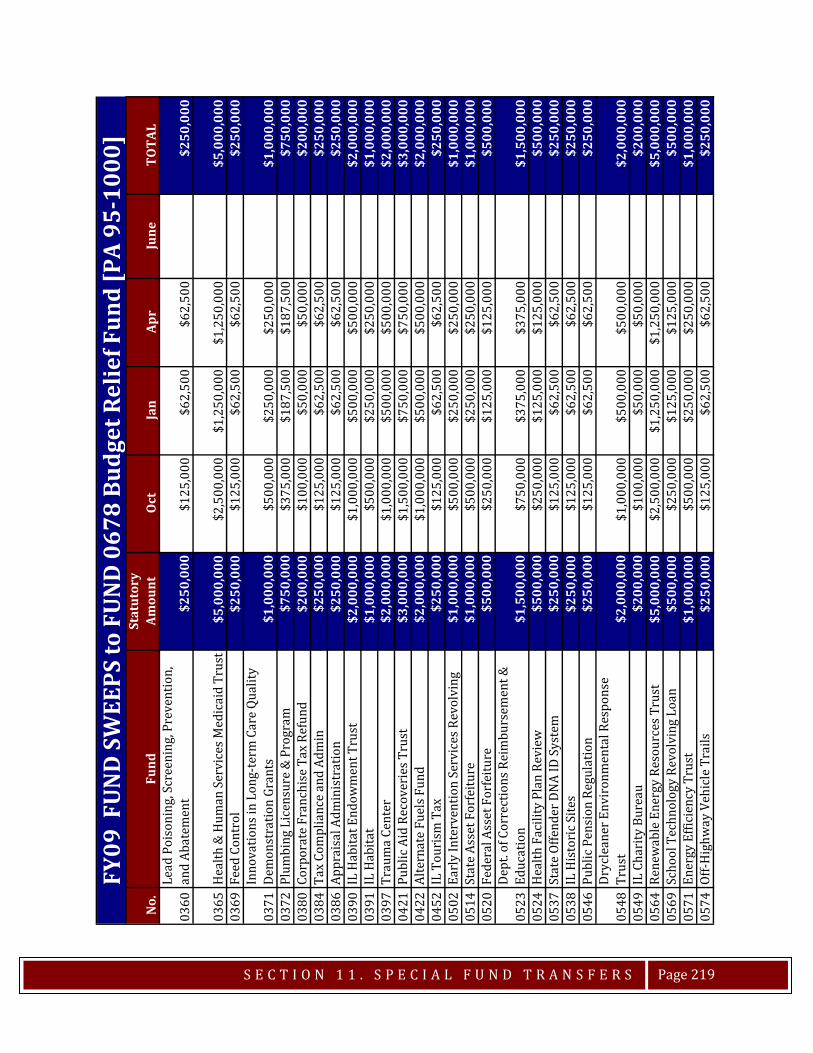
S E C T I O N 1 1 . S P E C I A L F U N D T R A N S F E R S
Page 219
No.
Fund
Stat
utor
y Am
ount
Oct
Jan
Apr
June
TOTA
L
0360
Lead
Poi
soni
ng, S
cree
ning
, Pre
vent
ion,
an
d Ab
atem
ent
$250
,000
$125
,000
$62,
500
$62,
500
$250
,000
0365
Hea
lth &
Hum
an S
ervi
ces M
edic
aid
Trus
t$5
,000
,000
$2,5
00,0
00$1
,250
,000
$1,2
50,0
00$5
,000
,000
0369
Feed
Con
trol
$250
,000
$125
,000
$62,
500
$62,
500
$250
,000
0371
Inno
vatio
ns in
Lon
g-te
rm C
are
Qual
ity
Dem
onst
ratio
n Gr
ants
$1,0
00,0
00$5
00,0
00$2
50,0
00$2
50,0
00$1
,000
,000
0372
Plum
bing
Lic
ensu
re &
Pro
gram
$750
,000
$375
,000
$187
,500
$187
,500
$750
,000
0380
Corp
orat
e Fr
anch
ise
Tax
Refu
nd$2
00,0
00$1
00,0
00$5
0,00
0$5
0,00
0$2
00,0
0003
84Ta
x Co
mpl
ianc
e an
d Ad
min
$2
50,0
00$1
25,0
00$6
2,50
0$6
2,50
0$2
50,0
0003
86Ap
prai
sal A
dmin
istr
atio
n $2
50,0
00$1
25,0
00$6
2,50
0$6
2,50
0$2
50,0
0003
90IL
Hab
itat E
ndow
men
t Tru
st$2
,000
,000
$1,0
00,0
00$5
00,0
00$5
00,0
00$2
,000
,000
0391
IL H
abita
t$1
,000
,000
$500
,000
$250
,000
$250
,000
$1,0
00,0
0003
97Tr
aum
a Ce
nter
$2
,000
,000
$1,0
00,0
00$5
00,0
00$5
00,0
00$2
,000
,000
0421
Publ
ic A
id R
ecov
erie
s Tru
st
$3,0
00,0
00$1
,500
,000
$750
,000
$750
,000
$3,0
00,0
0004
22Al
tern
ate
Fuel
s Fun
d$2
,000
,000
$1,0
00,0
00$5
00,0
00$5
00,0
00$2
,000
,000
0452
IL T
ouri
sm T
ax$2
50,0
00$1
25,0
00$6
2,50
0$6
2,50
0$2
50,0
0005
02Ea
rly
Inte
rven
tion
Serv
ices
Rev
olvi
ng$1
,000
,000
$500
,000
$250
,000
$250
,000
$1,0
00,0
0005
14St
ate
Asse
t For
feitu
re
$1,0
00,0
00$5
00,0
00$2
50,0
00$2
50,0
00$1
,000
,000
0520
Fede
ral A
sset
For
feitu
re$5
00,0
00$2
50,0
00$1
25,0
00$1
25,0
00$5
00,0
00
0523
Dept
. of C
orre
ctio
ns R
eim
burs
emen
t &
Educ
atio
n$1
,500
,000
$750
,000
$375
,000
$375
,000
$1,5
00,0
0005
24H
ealth
Fac
ility
Pla
n Re
view
$5
00,0
00$2
50,0
00$1
25,0
00$1
25,0
00$5
00,0
0005
37St
ate
Offe
nder
DN
A ID
Sys
tem
$250
,000
$125
,000
$62,
500
$62,
500
$250
,000
0538
IL H
isto
ric S
ites
$250
,000
$125
,000
$62,
500
$62,
500
$250
,000
0546
Publ
ic P
ensi
on R
egul
atio
n $2
50,0
00$1
25,0
00$6
2,50
0$6
2,50
0$2
50,0
00
0548
Dryc
lean
er E
nvir
onm
enta
l Res
pons
e Tr
ust
$2,0
00,0
00$1
,000
,000
$500
,000
$500
,000
$2,0
00,0
0005
49IL
Cha
rity
Bur
eau
$200
,000
$100
,000
$50,
000
$50,
000
$200
,000
0564
Rene
wab
le E
nerg
y Re
sour
ces T
rust
$5,0
00,0
00$2
,500
,000
$1,2
50,0
00$1
,250
,000
$5,0
00,0
0005
69Sc
hool
Tec
hnol
ogy
Revo
lvin
g Lo
an$5
00,0
00$2
50,0
00$1
25,0
00$1
25,0
00$5
00,0
0005
71En
ergy
Effi
cien
cy T
rust
$1,0
00,0
00$5
00,0
00$2
50,0
00$2
50,0
00$1
,000
,000
0574
Off-H
ighw
ay V
ehic
le T
rails
$250
,000
$125
,000
$62,
500
$62,
500
$250
,000
FY09
FUN
D S
WEE
PS to
FUN
D 0
678
Budg
et R
elie
f Fun
d [P
A 95
-100
0]
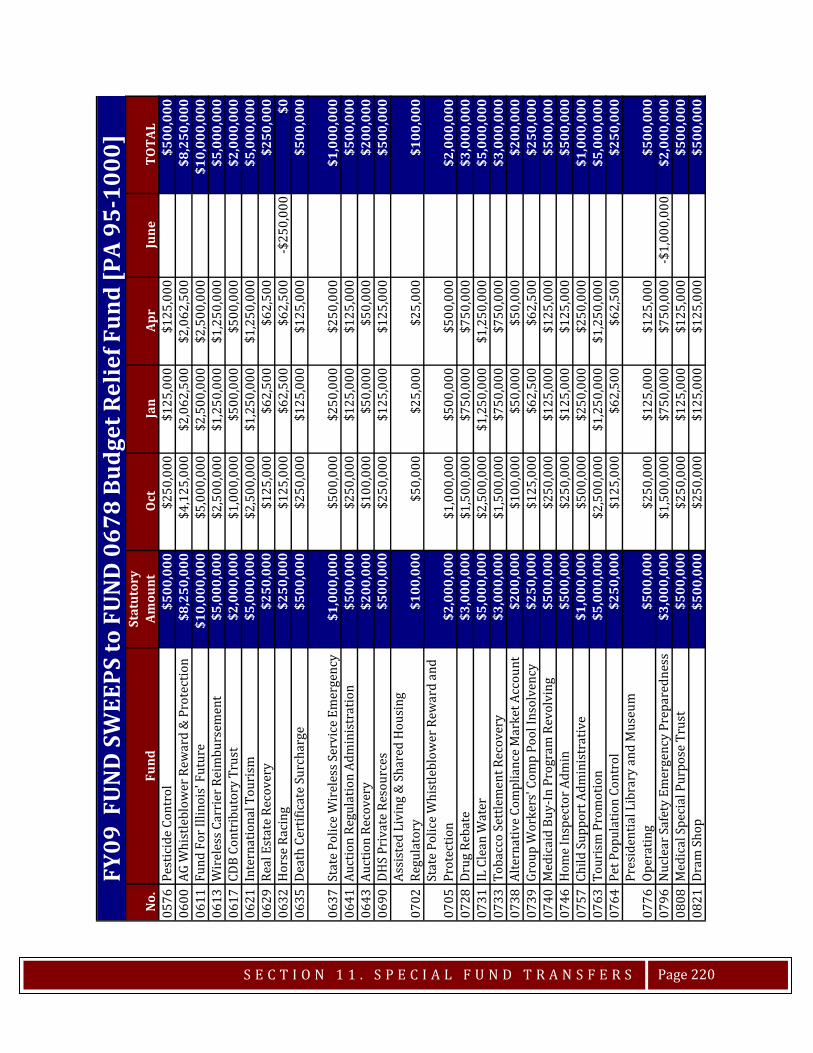
S E C T I O N 1 1 . S P E C I A L F U N D T R A N S F E R S
Page 220
No.
Fund
Stat
utor
y Am
ount
Oct
Jan
Apr
June
TOTA
L05
76Pe
stic
ide
Cont
rol
$500
,000
$250
,000
$125
,000
$125
,000
$500
,000
0600
AG W
hist
lebl
ower
Rew
ard
& P
rote
ctio
n $8
,250
,000
$4,1
25,0
00$2
,062
,500
$2,0
62,5
00$8
,250
,000
0611
Fund
For
Illin
ois'
Fut
ure
$10,
000,
000
$5,0
00,0
00$2
,500
,000
$2,5
00,0
00$1
0,00
0,00
006
13W
irel
ess C
arri
er R
eim
burs
emen
t $5
,000
,000
$2,5
00,0
00$1
,250
,000
$1,2
50,0
00$5
,000
,000
0617
CDB
Cont
ribu
tory
Tru
st$2
,000
,000
$1,0
00,0
00$5
00,0
00$5
00,0
00$2
,000
,000
0621
Inte
rnat
iona
l Tou
rism
$5
,000
,000
$2,5
00,0
00$1
,250
,000
$1,2
50,0
00$5
,000
,000
0629
Real
Est
ate
Reco
very
$2
50,0
00$1
25,0
00$6
2,50
0$6
2,50
0$2
50,0
0006
32H
orse
Rac
ing
$250
,000
$125
,000
$62,
500
$62,
500
-$25
0,00
0$0
0635
Deat
h Ce
rtifi
cate
Sur
char
ge
$500
,000
$250
,000
$125
,000
$125
,000
$500
,000
0637
Stat
e Po
lice
Wir
eles
s Ser
vice
Em
erge
ncy
$1,0
00,0
00$5
00,0
00$2
50,0
00$2
50,0
00$1
,000
,000
0641
Auct
ion
Regu
latio
n Ad
min
istr
atio
n$5
00,0
00$2
50,0
00$1
25,0
00$1
25,0
00$5
00,0
0006
43Au
ctio
n Re
cove
ry
$200
,000
$100
,000
$50,
000
$50,
000
$200
,000
0690
DHS
Priv
ate
Reso
urce
s$5
00,0
00$2
50,0
00$1
25,0
00$1
25,0
00$5
00,0
00
0702
Assi
sted
Liv
ing
& S
hare
d H
ousi
ng
Regu
lato
ry$1
00,0
00$5
0,00
0$2
5,00
0$2
5,00
0$1
00,0
00
0705
Stat
e Po
lice
Whi
stle
blow
er R
ewar
d an
d Pr
otec
tion
$2,0
00,0
00$1
,000
,000
$500
,000
$500
,000
$2,0
00,0
0007
28Dr
ug R
ebat
e$3
,000
,000
$1,5
00,0
00$7
50,0
00$7
50,0
00$3
,000
,000
0731
IL C
lean
Wat
er$5
,000
,000
$2,5
00,0
00$1
,250
,000
$1,2
50,0
00$5
,000
,000
0733
Toba
cco
Sett
lem
ent R
ecov
ery
$3,0
00,0
00$1
,500
,000
$750
,000
$750
,000
$3,0
00,0
0007
38Al
tern
ativ
e Co
mpl
ianc
e M
arke
t Acc
ount
$200
,000
$100
,000
$50,
000
$50,
000
$200
,000
0739
Grou
p W
orke
rs' C
omp
Pool
Inso
lven
cy$2
50,0
00$1
25,0
00$6
2,50
0$6
2,50
0$2
50,0
0007
40M
edic
aid
Buy-
In P
rogr
am R
evol
ving
$5
00,0
00$2
50,0
00$1
25,0
00$1
25,0
00$5
00,0
0007
46H
ome
Insp
ecto
r Adm
in
$500
,000
$250
,000
$125
,000
$125
,000
$500
,000
0757
Child
Sup
port
Adm
inis
trat
ive
$1,0
00,0
00$5
00,0
00$2
50,0
00$2
50,0
00$1
,000
,000
0763
Tour
ism
Pro
mot
ion
$5,0
00,0
00$2
,500
,000
$1,2
50,0
00$1
,250
,000
$5,0
00,0
0007
64Pe
t Pop
ulat
ion
Cont
rol
$250
,000
$125
,000
$62,
500
$62,
500
$250
,000
0776
Pres
iden
tial L
ibra
ry a
nd M
useu
m
Oper
atin
g $5
00,0
00$2
50,0
00$1
25,0
00$1
25,0
00$5
00,0
0007
96N
ucle
ar S
afet
y Em
erge
ncy
Prep
ared
ness
$3,0
00,0
00$1
,500
,000
$750
,000
$750
,000
-$1,
000,
000
$2,0
00,0
0008
08M
edic
al S
peci
al P
urpo
se T
rust
$500
,000
$250
,000
$125
,000
$125
,000
$500
,000
0821
Dram
Sho
p $5
00,0
00$2
50,0
00$1
25,0
00$1
25,0
00$5
00,0
00
FY09
FUN
D S
WEE
PS to
FUN
D 0
678
Budg
et R
elie
f Fun
d [P
A 95
-100
0]
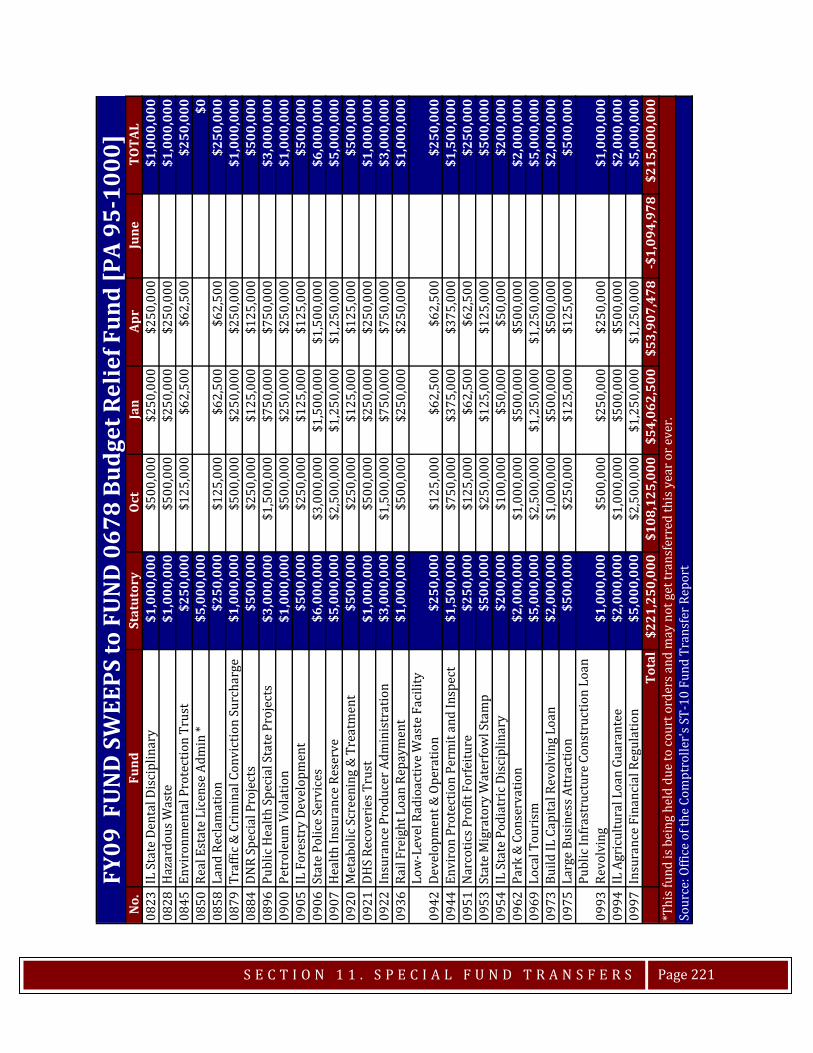
S E C T I O N 1 1 . S P E C I A L F U N D T R A N S F E R S
Page 221
No.
Fund
Stat
utor
y O
ctJa
nAp
rJu
neTO
TAL
0823
IL S
tate
Den
tal D
isci
plin
ary
$1,0
00,0
00$5
00,0
00$2
50,0
00$2
50,0
00$1
,000
,000
0828
Haz
ardo
us W
aste
$1,0
00,0
00$5
00,0
00$2
50,0
00$2
50,0
00$1
,000
,000
0845
Envi
ronm
enta
l Pro
tect
ion
Trus
t$2
50,0
00$1
25,0
00$6
2,50
0$6
2,50
0$2
50,0
0008
50Re
al E
stat
e Li
cens
e Ad
min
*$5
,000
,000
$008
58La
nd R
ecla
mat
ion
$250
,000
$125
,000
$62,
500
$62,
500
$250
,000
0879
Traf
fic &
Cri
min
al C
onvi
ctio
n Su
rcha
rge
$1,0
00,0
00$5
00,0
00$2
50,0
00$2
50,0
00$1
,000
,000
0884
DNR
Spec
ial P
roje
cts
$500
,000
$250
,000
$125
,000
$125
,000
$500
,000
0896
Publ
ic H
ealth
Spe
cial
Sta
te P
roje
cts
$3,0
00,0
00$1
,500
,000
$750
,000
$750
,000
$3,0
00,0
0009
00Pe
trol
eum
Vio
latio
n$1
,000
,000
$500
,000
$250
,000
$250
,000
$1,0
00,0
0009
05IL
For
estr
y De
velo
pmen
t$5
00,0
00$2
50,0
00$1
25,0
00$1
25,0
00$5
00,0
0009
06St
ate
Polic
e Se
rvic
es
$6,0
00,0
00$3
,000
,000
$1,5
00,0
00$1
,500
,000
$6,0
00,0
0009
07H
ealth
Insu
ranc
e Re
serv
e $5
,000
,000
$2,5
00,0
00$1
,250
,000
$1,2
50,0
00$5
,000
,000
0920
Met
abol
ic S
cree
ning
& T
reat
men
t$5
00,0
00$2
50,0
00$1
25,0
00$1
25,0
00$5
00,0
0009
21DH
S Re
cove
ries
Tru
st
$1,0
00,0
00$5
00,0
00$2
50,0
00$2
50,0
00$1
,000
,000
0922
Insu
ranc
e Pr
oduc
er A
dmin
istr
atio
n $3
,000
,000
$1,5
00,0
00$7
50,0
00$7
50,0
00$3
,000
,000
0936
Rail
Frei
ght L
oan
Repa
ymen
t$1
,000
,000
$500
,000
$250
,000
$250
,000
$1,0
00,0
00
0942
Low
-Lev
el R
adio
activ
e W
aste
Fac
ility
De
velo
pmen
t & O
pera
tion
$250
,000
$125
,000
$62,
500
$62,
500
$250
,000
0944
Envi
ron
Prot
ectio
n Pe
rmit
and
Insp
ect
$1,5
00,0
00$7
50,0
00$3
75,0
00$3
75,0
00$1
,500
,000
0951
Nar
cotic
s Pro
fit F
orfe
iture
$250
,000
$125
,000
$62,
500
$62,
500
$250
,000
0953
Stat
e M
igra
tory
Wat
erfo
wl S
tam
p$5
00,0
00$2
50,0
00$1
25,0
00$1
25,0
00$5
00,0
0009
54IL
Sta
te P
odia
tric
Dis
cipl
inar
y $2
00,0
00$1
00,0
00$5
0,00
0$5
0,00
0$2
00,0
0009
62Pa
rk &
Con
serv
atio
n$2
,000
,000
$1,0
00,0
00$5
00,0
00$5
00,0
00$2
,000
,000
0969
Loca
l Tou
rism
$5,0
00,0
00$2
,500
,000
$1,2
50,0
00$1
,250
,000
$5,0
00,0
0009
73Bu
ild IL
Cap
ital R
evol
ving
Loa
n$2
,000
,000
$1,0
00,0
00$5
00,0
00$5
00,0
00$2
,000
,000
0975
Larg
e Bu
sine
ss A
ttrac
tion
$500
,000
$250
,000
$125
,000
$125
,000
$500
,000
0993
Publ
ic In
fras
truc
ture
Con
stru
ctio
n Lo
an
Revo
lvin
g$1
,000
,000
$500
,000
$250
,000
$250
,000
$1,0
00,0
0009
94IL
Agr
icul
tura
l Loa
n Gu
aran
tee
$2,0
00,0
00$1
,000
,000
$500
,000
$500
,000
$2,0
00,0
0009
97In
sura
nce
Fina
ncia
l Reg
ulat
ion
$5,0
00,0
00$2
,500
,000
$1,2
50,0
00$1
,250
,000
$5,0
00,0
00To
tal
$221
,250
,000
$108
,125
,000
$54,
062,
500
$53,
907,
478
-$1,
094,
978
$215
,000
,000
*Thi
s fun
d is
bei
ng h
eld
due
to co
urt o
rder
s and
may
not
get
tran
sfer
red
this
yea
r or e
ver.
Sour
ce: O
ffice
of t
he C
ompt
rolle
r's S
T-10
Fun
d Tr
ansf
er R
epor
t
FY09
FUN
D S
WEE
PS to
FUN
D 0
678
Budg
et R
elie
f Fun
d [P
A 95
-100
0]

S E C T I O N 1 1 . S P E C I A L F U N D T R A N S F E R S
Page 222
In FY 2009, transfers were made to consolidated services funds from various state funds. The following listing shows those transfers.
From # From Fund
Professional Services
Fund
Professions Indirect Cost
FundWorkers' Comp Revolving Fund Total per Fund
0001 GRF $6,696,600 $34,411,237 $41,107,8370011 Road Fund $342,700 $33,959,000 $34,301,7000014 Food & Drug Safety Fund $5,600 $5,6000016 Teacher Certificate Fee Revolving $6,700 $6,7000018 Transportation Regulatory $7,400 $7,4000021 Financial Institution $2,100 $1,370,463 $36,400 $1,408,9630022 General Professions Dedicated $2,000 $5,783,628 $33,600 $5,819,2280036 IL Veterans Rehabilitation Fund $13,900 $144,300 $158,2000039 State Boating Act Fund $6,700 $191,600 $198,3000040 State Parks Fund $7,300 $109,700 $117,0000044 Lobbyist Registration Admin $15,350 $15,3500045 Agricultural Premium Fund $14,900 $131,700 $146,6000047 Fire Prevention $22,800 $459,367 $482,1670050 Mental Health $87,200 $9,725,200 $9,812,4000057 IL State Pharmacy Disciplinary $1,800 $1,518,186 $8,200 $1,528,1860059 Public Utility Fund $23,700 $23,7000067 Radiation Protection $19,300 $26,200 $45,5000071 Firearm Owner's Notification $3,833 $3,8330072 Underground Storage Tank $31,100 $31,1000078 Solid Waste Management $12,200 $33,400 $45,6000085 IL Gaming Law Enforcement $1,400 $15,900 $17,3000089 Subtitle D Management $1,400 $5,000 $6,4000093 IL State Medical Disciplinary $4,200 $3,632,173 $37,100 $3,673,4730118 Facility Licensing $6,300 $6,300
0128Youth Alcoholism & Substance Abuse Prevention Fund $2,800 $2,800
0129 State Gaming $1,626 $1,6260137 Plugging & Restoration Fund $7,700 $7,7000145 Explosives Regulatory $2,700 $2,7000146 Aggregate Operation Regulatory $6,400 $6,4000147 Coal Mining Regulatory $5,800 $5,8000151 Registered CPA Administration & Disciplinary $770,755 $2,100 $772,8550163 Weights and Measures $1,600 $76,900 $78,5000167 Division of Corp Regis LLP $4,850 $4,8500175 IL School Asbestos Abatement $8,900 $8,9000184 Violence Prevention Fund $1,100 $1,1000185 SOS Special License Plate $30,450 $30,4500215 Capital Development Board Revolving $2,800 $24,000 $26,8000220 DCFS Children's Services Fund $293,500 $63,900 $357,4000222 State Police DUI $1,400 $1,4000238 IL Health Facilities Planning $1,000 $1,0000240 Emergency Public Health $2,200 $2,200
FY 2009 Consolidated Services Transfers
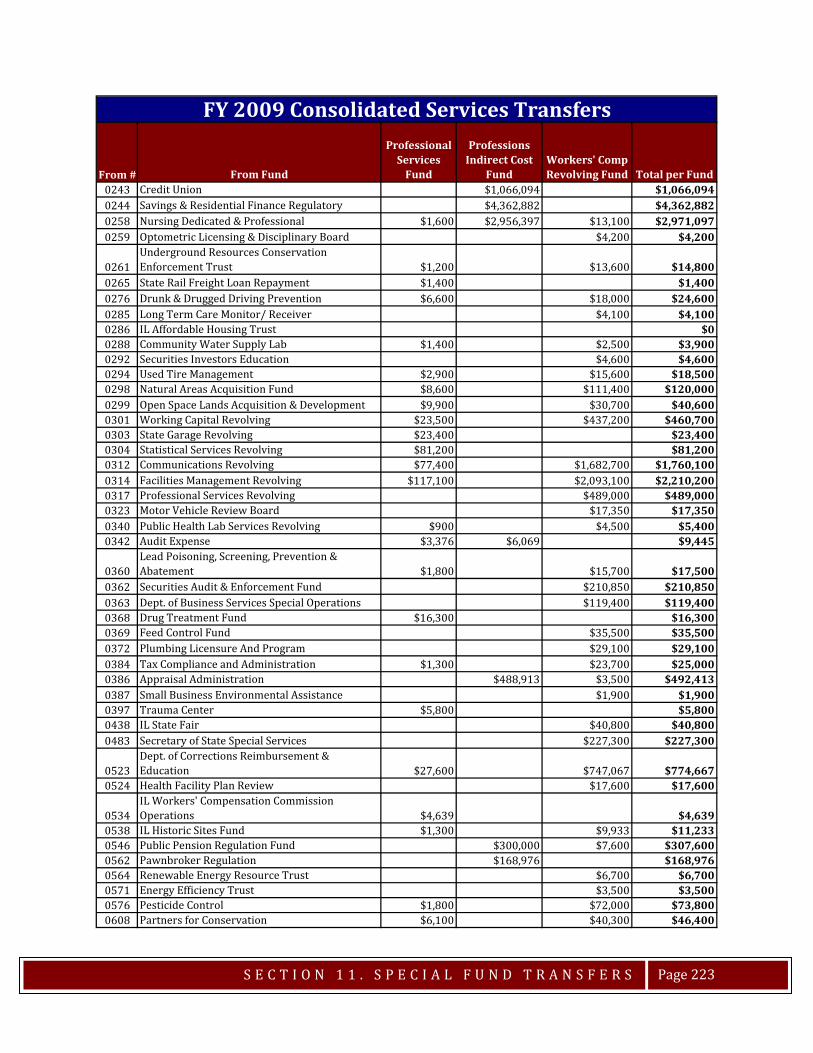
S E C T I O N 1 1 . S P E C I A L F U N D T R A N S F E R S
Page 223
From # From Fund
Professional Services
Fund
Professions Indirect Cost
FundWorkers' Comp Revolving Fund Total per Fund
0243 Credit Union $1,066,094 $1,066,0940244 Savings & Residential Finance Regulatory $4,362,882 $4,362,8820258 Nursing Dedicated & Professional $1,600 $2,956,397 $13,100 $2,971,0970259 Optometric Licensing & Disciplinary Board $4,200 $4,200
0261Underground Resources Conservation Enforcement Trust $1,200 $13,600 $14,800
0265 State Rail Freight Loan Repayment $1,400 $1,4000276 Drunk & Drugged Driving Prevention $6,600 $18,000 $24,6000285 Long Term Care Monitor/ Receiver $4,100 $4,1000286 IL Affordable Housing Trust $00288 Community Water Supply Lab $1,400 $2,500 $3,9000292 Securities Investors Education $4,600 $4,6000294 Used Tire Management $2,900 $15,600 $18,5000298 Natural Areas Acquisition Fund $8,600 $111,400 $120,0000299 Open Space Lands Acquisition & Development $9,900 $30,700 $40,6000301 Working Capital Revolving $23,500 $437,200 $460,7000303 State Garage Revolving $23,400 $23,4000304 Statistical Services Revolving $81,200 $81,2000312 Communications Revolving $77,400 $1,682,700 $1,760,1000314 Facilities Management Revolving $117,100 $2,093,100 $2,210,2000317 Professional Services Revolving $489,000 $489,0000323 Motor Vehicle Review Board $17,350 $17,3500340 Public Health Lab Services Revolving $900 $4,500 $5,4000342 Audit Expense $3,376 $6,069 $9,445
0360Lead Poisoning, Screening, Prevention & Abatement $1,800 $15,700 $17,500
0362 Securities Audit & Enforcement Fund $210,850 $210,8500363 Dept. of Business Services Special Operations $119,400 $119,4000368 Drug Treatment Fund $16,300 $16,3000369 Feed Control Fund $35,500 $35,5000372 Plumbing Licensure And Program $29,100 $29,1000384 Tax Compliance and Administration $1,300 $23,700 $25,0000386 Appraisal Administration $488,913 $3,500 $492,4130387 Small Business Environmental Assistance $1,900 $1,9000397 Trauma Center $5,800 $5,8000438 IL State Fair $40,800 $40,8000483 Secretary of State Special Services $227,300 $227,300
0523Dept. of Corrections Reimbursement & Education $27,600 $747,067 $774,667
0524 Health Facility Plan Review $17,600 $17,600
0534IL Workers' Compensation Commission Operations $4,639 $4,639
0538 IL Historic Sites Fund $1,300 $9,933 $11,2330546 Public Pension Regulation Fund $300,000 $7,600 $307,6000562 Pawnbroker Regulation $168,976 $168,9760564 Renewable Energy Resource Trust $6,700 $6,7000571 Energy Efficiency Trust $3,500 $3,5000576 Pesticide Control $1,800 $72,000 $73,8000608 Partners for Conservation $6,100 $40,300 $46,400
FY 2009 Consolidated Services Transfers

S E C T I O N 1 1 . S P E C I A L F U N D T R A N S F E R S
Page 224
From # From Fund
Professional Services
Fund
Professions Indirect Cost
FundWorkers' Comp Revolving Fund Total per Fund
0614 Capital Litigation $6,700 $6,7000621 International Tourism Fund $3,200 $3,2000622 Motor Vehicle License Plate $92,750 $92,7500627 Public Transportation Fund $183,000 $183,0000632 Horse Racing $4,200 $16,900 $21,1000635 Death Certificate Surcharge $10,400 $10,4000641 Auction Regulation Administration $113,173 $113,1730648 Downstate Public Transportation $42,500 $42,5000649 Motor Carrier Safety Inspection $1,200 $44,700 $45,9000708 IL Standard Breeders $900 $9000709 IL Thoroughbred Breeders $1,400 $13,000 $14,4000731 IL Clean Water Fund $4,700 $15,700 $20,4000732 Secretary of State DUI Admin. $18,600 $18,6000746 Home Inspector Administration $354,517 $354,5170757 Child Support Administrative $767 $7670763 Tourism Promotion $22,500 $32,200 $54,7000768 IL Math & Science Academy Income $5,500 $5,5000770 Digital Divide Elimination $2,700 $2,7000776 Presidential Library & Museum Operating $6,500 $98,100 $104,6000794 Metro-East Public Transportation $48,100 $48,1000795 Bank & Trust Company $4,466,312 $4,466,3120821 Dram Shop $2,400 $40,100 $42,5000823 IL State Dental Disciplinary $827,080 $6,800 $833,8800850 Real Estate License Administration $1,498,125 $1,498,1250863 Cycle Rider Safety Training $8,900 $8,9000879 Traffic & Criminal Conviction Surcharge $12,500 $12,500
0888Design Professionals Administration & Investigation $648,214 $5,600 $653,814
0906 State Police Services $11,400 $248,500 $259,9000910 Youth Drug Abuse Prevention $1,300 $1,3000920 Metabolic Screening & Treatment $5,200 $71,500 $76,7000922 Insurance Producer Administration $4,200 $6,245,698 $68,600 $6,318,4980925 Coal Technology Development Assistance $13,800 $10,200 $24,000
0938Hearing Instrument Dispenser Examining & Disciplinary $1,600 $1,600
0942Low-Level Radioactive Waste Facility Devel. & Operation Fund $2,000 $1,000 $3,000
0944 Environmental Protection Permit & Inspection $7,000 $28,100 $35,1000954 IL State Podiatric Disciplinary $168,349 $168,3490962 Park & Conservation $9,200 $232,500 $241,7000969 Local Tourism $7,500 $2,300 $9,8000973 Build IL Capital Revolving Loan $2,100 $8,000 $10,1000975 Large Business Attraction $1,500 $1,700 $3,2000982 Adeline Jay Geo-Karis IL Beach Marina $6,200 $29,400 $35,6000997 Insurance Financial Regulation $6,000 $5,011,618 $104,200 $5,121,818
TOTAL $8,383,215 $41,757,622 $87,441,630 $137,582,467
FY 2009 Consolidated Services Transfers
Source: Office of the Comptroller's ST-10 Fund Transfer Report

S E C T I O N 1 1 . S P E C I A L F U N D T R A N S F E R S
Page 225
FY 2008 SPECIAL FUND TRANSFERS Special Transfers to the General Revenue Fund in FY 2008 consisted of $34 million of Increased Fees Transfers, transferred in June. No fund sweeps were approved for FY 2008 and the authority for chargebacks ended in FY 2007. Below is a detailed list of the transfers.
In FY 2008, transfers of funds from different agencies for consolidated services provided by the State continued to the following funds: Professional Services Fund, Professions Indirect Cost Fund, and the Workers’ Compensation Revolving Fund. Following is a breakdown by fund of the FY 2008 transfers.
FUND # FUND NAME June0021 Financial Institution Fund $1,500,0000059 Public Utility Fund $831,3000163 Weights and Measures Fund $29,1000290 Fertilizer Control Fund $95,0000294 Used Tire Management Fund $5,100,0000386 Appraisal Administration Fund $600,0000731 Illinois Clean Water Fund $9,900,0000922 Insurance Producer Administration Fund $8,000,0000944 Environmental Protection Permit & Inspection Fund $200,0000997 Insurance Financial Regulation Fund $8,000,000
TOTAL $34,255,400
FY 2008 Increased Fees Transfers [30 ILCS 105/8j]
Source: Office of the Comptroller
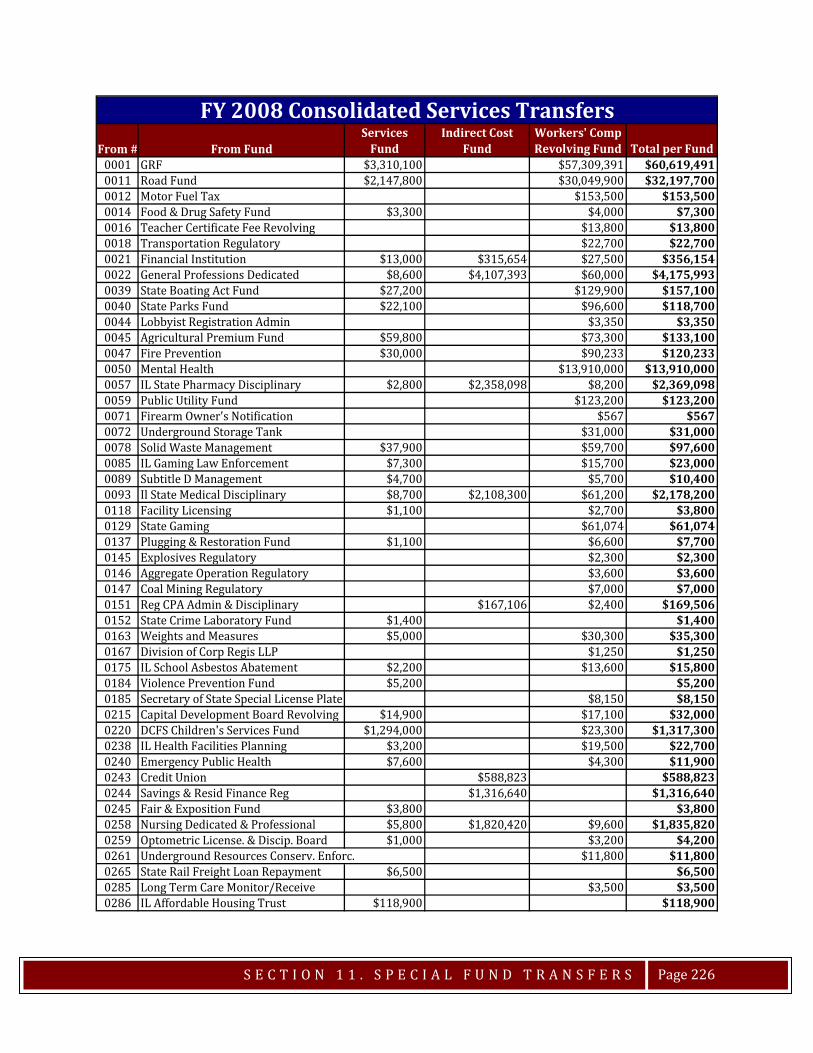
S E C T I O N 1 1 . S P E C I A L F U N D T R A N S F E R S
Page 226
From # From Fund
Services
Fund
Indirect Cost
FundWorkers' Comp Revolving Fund Total per Fund
0001 GRF $3,310,100 $57,309,391 $60,619,4910011 Road Fund $2,147,800 $30,049,900 $32,197,7000012 Motor Fuel Tax $153,500 $153,5000014 Food & Drug Safety Fund $3,300 $4,000 $7,3000016 Teacher Certificate Fee Revolving $13,800 $13,8000018 Transportation Regulatory $22,700 $22,7000021 Financial Institution $13,000 $315,654 $27,500 $356,1540022 General Professions Dedicated $8,600 $4,107,393 $60,000 $4,175,9930039 State Boating Act Fund $27,200 $129,900 $157,1000040 State Parks Fund $22,100 $96,600 $118,7000044 Lobbyist Registration Admin $3,350 $3,3500045 Agricultural Premium Fund $59,800 $73,300 $133,1000047 Fire Prevention $30,000 $90,233 $120,2330050 Mental Health $13,910,000 $13,910,0000057 IL State Pharmacy Disciplinary $2,800 $2,358,098 $8,200 $2,369,0980059 Public Utility Fund $123,200 $123,2000071 Firearm Owner's Notification $567 $5670072 Underground Storage Tank $31,000 $31,0000078 Solid Waste Management $37,900 $59,700 $97,6000085 IL Gaming Law Enforcement $7,300 $15,700 $23,0000089 Subtitle D Management $4,700 $5,700 $10,4000093 Il State Medical Disciplinary $8,700 $2,108,300 $61,200 $2,178,2000118 Facility Licensing $1,100 $2,700 $3,8000129 State Gaming $61,074 $61,0740137 Plugging & Restoration Fund $1,100 $6,600 $7,7000145 Explosives Regulatory $2,300 $2,3000146 Aggregate Operation Regulatory $3,600 $3,6000147 Coal Mining Regulatory $7,000 $7,0000151 Reg CPA Admin & Disciplinary $167,106 $2,400 $169,5060152 State Crime Laboratory Fund $1,400 $1,4000163 Weights and Measures $5,000 $30,300 $35,3000167 Division of Corp Regis LLP $1,250 $1,2500175 IL School Asbestos Abatement $2,200 $13,600 $15,8000184 Violence Prevention Fund $5,200 $5,2000185 Secretary of State Special License Plate $8,150 $8,1500215 Capital Development Board Revolving $14,900 $17,100 $32,0000220 DCFS Children's Services Fund $1,294,000 $23,300 $1,317,3000238 IL Health Facilities Planning $3,200 $19,500 $22,7000240 Emergency Public Health $7,600 $4,300 $11,9000243 Credit Union $588,823 $588,8230244 Savings & Resid Finance Reg $1,316,640 $1,316,6400245 Fair & Exposition Fund $3,800 $3,8000258 Nursing Dedicated & Professional $5,800 $1,820,420 $9,600 $1,835,8200259 Optometric License. & Discip. Board $1,000 $3,200 $4,2000261 Underground Resources Conserv. Enforc. $11,800 $11,8000265 State Rail Freight Loan Repayment $6,500 $6,5000285 Long Term Care Monitor/Receive $3,500 $3,5000286 IL Affordable Housing Trust $118,900 $118,900
FY 2008 Consolidated Services Transfers
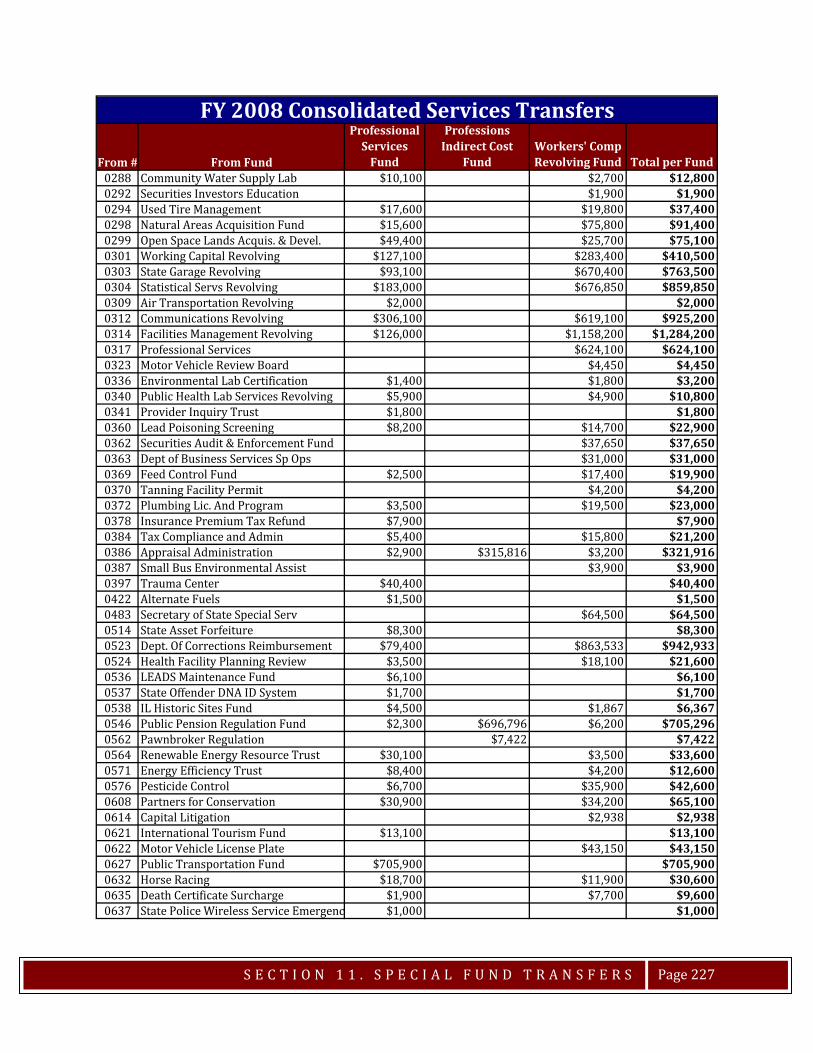
S E C T I O N 1 1 . S P E C I A L F U N D T R A N S F E R S
Page 227
From # From Fund
Professional Services
Fund
Professions Indirect Cost
FundWorkers' Comp Revolving Fund Total per Fund
0288 Community Water Supply Lab $10,100 $2,700 $12,8000292 Securities Investors Education $1,900 $1,9000294 Used Tire Management $17,600 $19,800 $37,4000298 Natural Areas Acquisition Fund $15,600 $75,800 $91,4000299 Open Space Lands Acquis. & Devel. $49,400 $25,700 $75,1000301 Working Capital Revolving $127,100 $283,400 $410,5000303 State Garage Revolving $93,100 $670,400 $763,5000304 Statistical Servs Revolving $183,000 $676,850 $859,8500309 Air Transportation Revolving $2,000 $2,0000312 Communications Revolving $306,100 $619,100 $925,2000314 Facilities Management Revolving $126,000 $1,158,200 $1,284,2000317 Professional Services $624,100 $624,1000323 Motor Vehicle Review Board $4,450 $4,4500336 Environmental Lab Certification $1,400 $1,800 $3,2000340 Public Health Lab Services Revolving $5,900 $4,900 $10,8000341 Provider Inquiry Trust $1,800 $1,8000360 Lead Poisoning Screening $8,200 $14,700 $22,9000362 Securities Audit & Enforcement Fund $37,650 $37,6500363 Dept of Business Services Sp Ops $31,000 $31,0000369 Feed Control Fund $2,500 $17,400 $19,9000370 Tanning Facility Permit $4,200 $4,2000372 Plumbing Lic. And Program $3,500 $19,500 $23,0000378 Insurance Premium Tax Refund $7,900 $7,9000384 Tax Compliance and Admin $5,400 $15,800 $21,2000386 Appraisal Administration $2,900 $315,816 $3,200 $321,9160387 Small Bus Environmental Assist $3,900 $3,9000397 Trauma Center $40,400 $40,4000422 Alternate Fuels $1,500 $1,5000483 Secretary of State Special Serv $64,500 $64,5000514 State Asset Forfeiture $8,300 $8,3000523 Dept. Of Corrections Reimbursement $79,400 $863,533 $942,9330524 Health Facility Planning Review $3,500 $18,100 $21,6000536 LEADS Maintenance Fund $6,100 $6,1000537 State Offender DNA ID System $1,700 $1,7000538 IL Historic Sites Fund $4,500 $1,867 $6,3670546 Public Pension Regulation Fund $2,300 $696,796 $6,200 $705,2960562 Pawnbroker Regulation $7,422 $7,4220564 Renewable Energy Resource Trust $30,100 $3,500 $33,6000571 Energy Efficiency Trust $8,400 $4,200 $12,6000576 Pesticide Control $6,700 $35,900 $42,6000608 Partners for Conservation $30,900 $34,200 $65,1000614 Capital Litigation $2,938 $2,9380621 International Tourism Fund $13,100 $13,1000622 Motor Vehicle License Plate $43,150 $43,1500627 Public Transportation Fund $705,900 $705,9000632 Horse Racing $18,700 $11,900 $30,6000635 Death Certificate Surcharge $1,900 $7,700 $9,6000637 State Police Wireless Service Emergenc $1,000 $1,000
FY 2008 Consolidated Services Transfers

S E C T I O N 1 1 . S P E C I A L F U N D T R A N S F E R S
Page 228
From # From Fund
Professional Services
Fund
Professions Indirect Cost
FundWorkers' Comp Revolving Fund Total per Fund
0641 Auction Regulation Administration $10,821 $1,100 $11,9210648 Downstate Public Transportation $112,700 $112,7000649 Motor Carrier Safety Inspection $6,600 $34,200 $40,8000705 State Police Whistleblower Reward/Pro $1,900 $1,9000708 IL Standard Breeders $4,400 $4,4000709 IL Thoroughbred Breeders $6,700 $5,200 $11,9000711 State Lottery $117,200 $117,2000731 IL Clean Water Fund $17,700 $19,700 $37,4000732 Secretary of State DUI Adminis $4,400 $4,4000746 Home Inspector Administration $228,565 $228,5650757 Child Support Administrative $435,100 $510,333 $945,4330763 Tourism Promotion $88,600 $57,100 $145,7000768 IL Math & Science Acad Income $2,600 $2,6000770 Digital Divide Elimination $11,700 $11,7000776 Pres. Library & Museum Operating $4,700 $28,700 $33,4000795 Bank & Trust Company $3,825,000 $3,825,0000802 Personal Property Tax Replacement $61,200 $61,2000821 Dram Shop $11,400 $28,700 $40,1000823 IL State Dental Disciplinary $2,000 $413,559 $5,500 $421,0590840 Hazardous Waste Research $1,300 $1,3000850 Real Estate License Admin $419,543 $419,5430863 Cycle Rider Safety Training $2,100 $6,200 $8,3000879 Traffic & Crim Conviction Surcharge $32,600 $102,400 $135,0000888 Design Professional Admin & Insurance $2,000 $105,344 $4,300 $111,6440906 State Police Services $47,300 $225,400 $272,7000920 Metabolic Screening & Treatment $16,000 $50,500 $66,5000922 Insurance Producer Admin $31,100 $4,575,000 $61,100 $4,667,2000925 Coal Technology Develop Assist $43,900 $18,800 $62,7000938 Hearing Instrument Dispen Exam $1,100 $1,1000944 Environ Protect Permit & Inspection $32,300 $33,100 $65,4000954 IL State Podiatric Disciplinary $167,807 $167,8070962 Park & Conservation $41,300 $164,200 $205,5000969 Local Tourism $34,700 $4,300 $39,0000973 Build IL Capital Revolving Loan $10,700 $17,100 $27,8000974 IL Equity $1,900 $1,9000975 Large Business Attraction $5,600 $3,100 $8,7000982 IL Beach Marina $23,600 $23,6000984 International & Promotional Fund $1,500 $1,5000993 Public Infra. Construction Loan Revolvi $3,100 $3,1000997 Insurance Financial Regulation $42,800 $3,438,254 $85,300 $3,566,354
TOTAL $10,142,600 $26,986,361 $109,571,285 $146,700,246
FY 2008 Consolidated Services Transfers
Source: Office of the Comptroller's ST-10 Fund Transfer Report

S E C T I O N 1 1 . S P E C I A L F U N D T R A N S F E R S
Page 229
FY 2007 SPECIAL FUND TRANSFERS Public Act 94-0839 made more changes to the statutes controlling special transfers. It eliminated the mandatory repayment from selected fund sweeps to the GRF if there is insufficient money coming into the fund. The Act removed 16 funds from the sweeps lists due to legal issues prohibiting their diversion to GRF, and prohibits chargebacks from the newly created Pension Stabilization Fund. June had a final flurry of transfers from fee increases and chargebacks, with this being the last year that chargebacks are allowed by law. Special transfers to the General Revenue Fund for FY 2007 included approximately $188 million in fund sweeps, $98 million in chargebacks, and $28 million of increased fee revenue transfers. Total special transfers for FY 2007 equal $315 million, an increase of $9.5 million (3.1%) over FY 2006.
FUND # FUND NAME ChargebacksStatute (Funds
Sweep) Fee Increase TOTAL0014 Food & Drug Safety $111,300 $421,000 $532,3000019 Grade Crossing Protection $2,160,000 $4,000,000 $6,160,0000021 Financial Institution $577,100 $1,981,000 $2,558,1000022 General Professions Dedicated $768,600 $5,000,000 $5,768,6000023 Economic Research and Information $3,600 $25,000 $28,6000024 IL Dept. of Ag. Laboratory Services $62,400 $0 $62,4000031 Drivers Education $900,000 $900,0000039 State Boating Act $1,400,000 $1,400,0000040 State Parks $893,900 $1,046,000 $1,939,9000044 Lobbyist Registration Administration $51,000 $100,000 $151,0000045 Agricultural Premium $2,041,400 $2,041,4000057 IL State Pharmacy Disciplinary $140,400 $3,000,000 $3,140,4000059 Public Utility $2,045,400 $440,000 $70,000 $2,555,4000071 Firearm Owner's Notification $17,900 $17,9000078 Solid Waste Management $200,000 $728,600 $928,6000085 Illinois Gaming Law Enforcement $311,980 $652,000 $963,9800089 Subtitle D Management $300,000 $300,0000109 CDLIS/AAMVA Net Trust $86,400 $86,4000111 Toxic Pollution Prevention $1,400 $1,4000113 Community Health Center Care $19,500 $100,000 $119,5000115 Safe Bottled Water $1,400 $1,4000118 Facility Licensing $45,900 $45,900
0130School District Emergency Financial Assistance $55,900 $1,325,000 $1,380,900
0137 Plugging & Restoration $41,900 $41,9000145 Explosives Regulatory $23,000 $23,0000146 Aggregate Operation Regulatory $33,000 $33,0000147 Coal Mining Regulatory $50,000 $50,000
0151Registered CPA Administration & Disciplinary $124,400 $1,000,000 $1,124,400
Special Transfers in FY 2007 [PA 94-0839]

S E C T I O N 1 1 . S P E C I A L F U N D T R A N S F E R S
Page 230
FUND # FUND NAME ChargebacksStatute (Funds
Sweep) Fee Increase TOTAL0152 State Crime Laboratory $66,500 $66,5000153 Agrichemical Incident Response Trust $200,000 $200,0000163 Weights and Measures $271,500 $600,000 $29,100 $900,6000167 Registered Limited Liability Partnership $416,250 $416,2500175 Illinois School Asbestos Abatement $51,000 $51,0000184 Violence Prevention $45,000 $45,0000193 Local Government Health Insurance Reserve $1,000,000 $1,000,0000195 IPTIP Administrative Trust $700,000 $700,0000215 Capital Development Board Revolving $320,225 $320,2250218 Professions Indirect Cost $500,000 $500,0000222 State Police DUI $93,700 $150,000 $243,7000224 Asbestos Abatement $500,000 $500,0000238 IL Health Facilities Planning $237,400 $237,4000240 Emergency Public Health $275,500 $300,000 $575,5000245 Fair & Exposition $132,900 $200,000 $332,9000246 State Police Vehicle $144,000 $144,0000251 Dept. of Labor Special State Trust $162,000 $162,0000258 Nurse Dedicated & Professional $3,000,000 $3,000,000
0259Optometric Licensing & Disciplinary Committee $12,200 $12,200
0261Underground Resource Conservation Enforcement $54,600 $100,000 $154,600
0262 Mandatory Arbitration $906,000 $906,0000276 Drunk & Drugged Driving Prevention $147,800 $147,8000278 Income Tax Refund $44,000,000 $44,000,0000285 Long-Term Care Monitor/Receiver $141,300 $300,000 $441,3000288 Community Water Supply Lab $200,000 $200,0000290 Fertilizer Control $46,200 $95,000 $141,2000292 Securities Investors Education $176,000 $176,0000294 Used Tire Management $1,000,000 $5,000,000 $6,000,0000298 Natural Areas Acquisition $1,459,600 $5,000,000 $6,459,600
0299Open Space Lands Acquisition and Development $3,408,800 $3,408,800
0301 Working Capital Revolving $580,000 $580,0000303 State Garage Revolving $691,300 $691,3000304 Statistical Services Revolving $2,000,000 $231,600 $2,231,6000308 Paper and Printing Revolving $9,900 $9,9000309 Air Transportation Revolving $100,000 $100,0000310 Tax Recovery $150,000 $150,0000312 Communications Revolving $1,500,000 $1,076,800 $2,576,8000314 Facilities Management Revolving $111,900 $111,9000317 Professional Services $1,064,800 $1,064,8000323 Motor Vehicle Review Board $18,600 $82,500 $101,1000331 Treasurer's Rental Fee $100,000 $100,0000332 Workers Compensation Revolving $530,800 $530,8000340 Public Health Services Revolving $62,300 $62,300
Special Transfers in FY 2007 [PA 94-0839]
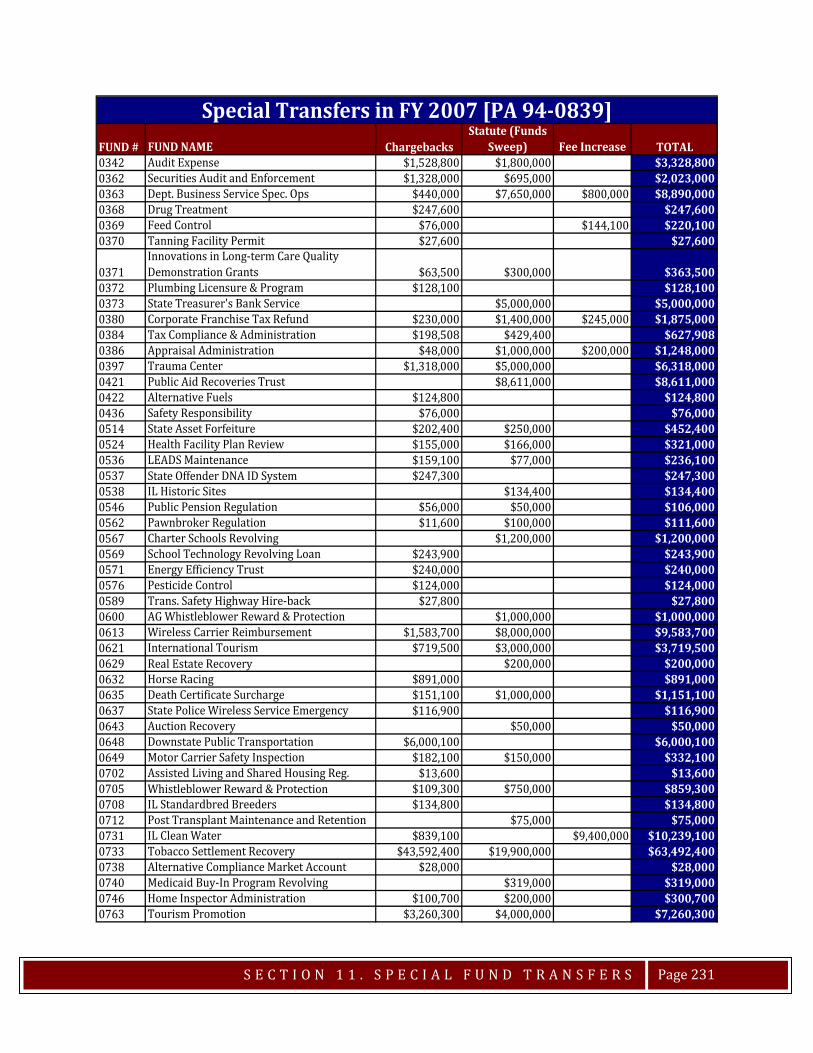
S E C T I O N 1 1 . S P E C I A L F U N D T R A N S F E R S
Page 231
FUND # FUND NAME ChargebacksStatute (Funds
Sweep) Fee Increase TOTAL0342 Audit Expense $1,528,800 $1,800,000 $3,328,8000362 Securities Audit and Enforcement $1,328,000 $695,000 $2,023,0000363 Dept. Business Service Spec. Ops $440,000 $7,650,000 $800,000 $8,890,0000368 Drug Treatment $247,600 $247,6000369 Feed Control $76,000 $144,100 $220,1000370 Tanning Facility Permit $27,600 $27,600
0371Innovations in Long-term Care Quality Demonstration Grants $63,500 $300,000 $363,500
0372 Plumbing Licensure & Program $128,100 $128,1000373 State Treasurer's Bank Service $5,000,000 $5,000,0000380 Corporate Franchise Tax Refund $230,000 $1,400,000 $245,000 $1,875,0000384 Tax Compliance & Administration $198,508 $429,400 $627,9080386 Appraisal Administration $48,000 $1,000,000 $200,000 $1,248,0000397 Trauma Center $1,318,000 $5,000,000 $6,318,0000421 Public Aid Recoveries Trust $8,611,000 $8,611,0000422 Alternative Fuels $124,800 $124,8000436 Safety Responsibility $76,000 $76,0000514 State Asset Forfeiture $202,400 $250,000 $452,4000524 Health Facility Plan Review $155,000 $166,000 $321,0000536 LEADS Maintenance $159,100 $77,000 $236,1000537 State Offender DNA ID System $247,300 $247,3000538 IL Historic Sites $134,400 $134,4000546 Public Pension Regulation $56,000 $50,000 $106,0000562 Pawnbroker Regulation $11,600 $100,000 $111,6000567 Charter Schools Revolving $1,200,000 $1,200,0000569 School Technology Revolving Loan $243,900 $243,9000571 Energy Efficiency Trust $240,000 $240,0000576 Pesticide Control $124,000 $124,0000589 Trans. Safety Highway Hire-back $27,800 $27,8000600 AG Whistleblower Reward & Protection $1,000,000 $1,000,0000613 Wireless Carrier Reimbursement $1,583,700 $8,000,000 $9,583,7000621 International Tourism $719,500 $3,000,000 $3,719,5000629 Real Estate Recovery $200,000 $200,0000632 Horse Racing $891,000 $891,0000635 Death Certificate Surcharge $151,100 $1,000,000 $1,151,1000637 State Police Wireless Service Emergency $116,900 $116,9000643 Auction Recovery $50,000 $50,0000648 Downstate Public Transportation $6,000,100 $6,000,1000649 Motor Carrier Safety Inspection $182,100 $150,000 $332,1000702 Assisted Living and Shared Housing Reg. $13,600 $13,6000705 Whistleblower Reward & Protection $109,300 $750,000 $859,3000708 IL Standardbred Breeders $134,800 $134,8000712 Post Transplant Maintenance and Retention $75,000 $75,0000731 IL Clean Water $839,100 $9,400,000 $10,239,1000733 Tobacco Settlement Recovery $43,592,400 $19,900,000 $63,492,4000738 Alternative Compliance Market Account $28,000 $28,0000740 Medicaid Buy-In Program Revolving $319,000 $319,0000746 Home Inspector Administration $100,700 $200,000 $300,7000763 Tourism Promotion $3,260,300 $4,000,000 $7,260,300
Special Transfers in FY 2007 [PA 94-0839]
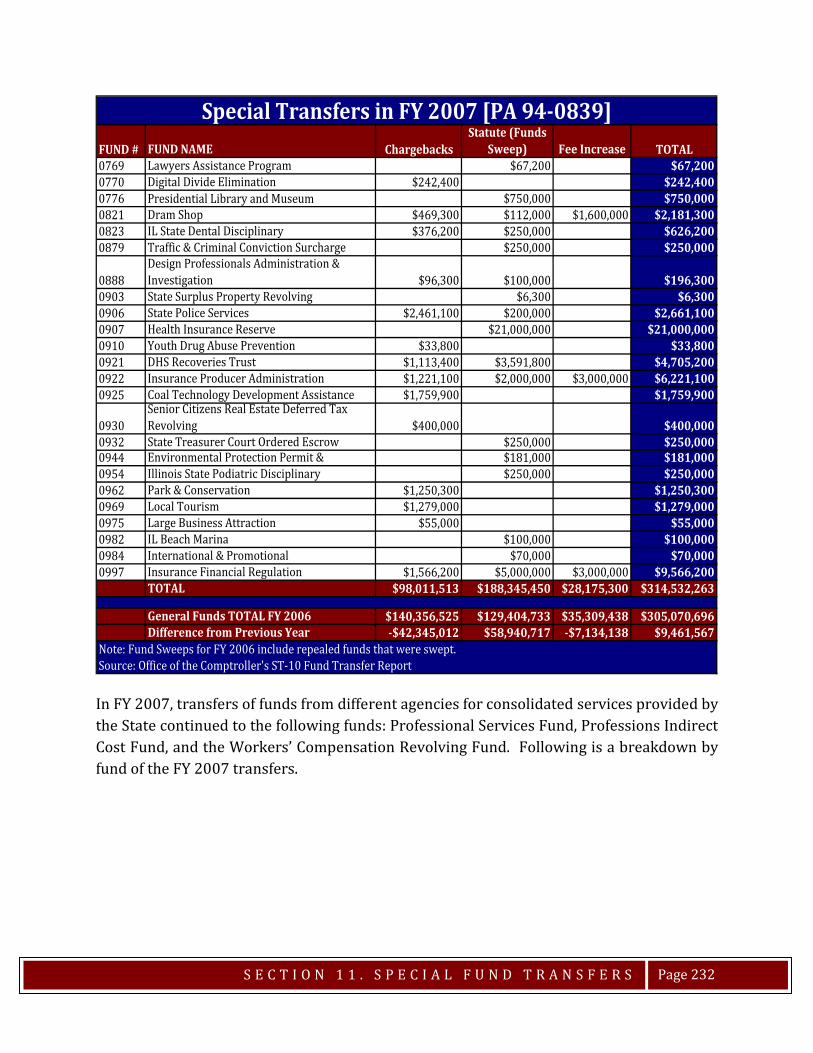
S E C T I O N 1 1 . S P E C I A L F U N D T R A N S F E R S
Page 232
In FY 2007, transfers of funds from different agencies for consolidated services provided by the State continued to the following funds: Professional Services Fund, Professions Indirect Cost Fund, and the Workers’ Compensation Revolving Fund. Following is a breakdown by fund of the FY 2007 transfers.
FUND # FUND NAME ChargebacksStatute (Funds
Sweep) Fee Increase TOTAL0769 Lawyers Assistance Program $67,200 $67,2000770 Digital Divide Elimination $242,400 $242,4000776 Presidential Library and Museum $750,000 $750,0000821 Dram Shop $469,300 $112,000 $1,600,000 $2,181,3000823 IL State Dental Disciplinary $376,200 $250,000 $626,2000879 Traffic & Criminal Conviction Surcharge $250,000 $250,000
0888Design Professionals Administration & Investigation $96,300 $100,000 $196,300
0903 State Surplus Property Revolving $6,300 $6,3000906 State Police Services $2,461,100 $200,000 $2,661,1000907 Health Insurance Reserve $21,000,000 $21,000,0000910 Youth Drug Abuse Prevention $33,800 $33,8000921 DHS Recoveries Trust $1,113,400 $3,591,800 $4,705,2000922 Insurance Producer Administration $1,221,100 $2,000,000 $3,000,000 $6,221,1000925 Coal Technology Development Assistance $1,759,900 $1,759,900
0930Senior Citizens Real Estate Deferred Tax Revolving $400,000 $400,000
0932 State Treasurer Court Ordered Escrow $250,000 $250,0000944 Environmental Protection Permit & $181,000 $181,0000954 Illinois State Podiatric Disciplinary $250,000 $250,0000962 Park & Conservation $1,250,300 $1,250,3000969 Local Tourism $1,279,000 $1,279,0000975 Large Business Attraction $55,000 $55,0000982 IL Beach Marina $100,000 $100,0000984 International & Promotional $70,000 $70,0000997 Insurance Financial Regulation $1,566,200 $5,000,000 $3,000,000 $9,566,200
TOTAL $98,011,513 $188,345,450 $28,175,300 $314,532,263
General Funds TOTAL FY 2006 $140,356,525 $129,404,733 $35,309,438 $305,070,696Difference from Previous Year -$42,345,012 $58,940,717 -$7,134,138 $9,461,567
Note: Fund Sweeps for FY 2006 include repealed funds that were swept.
Special Transfers in FY 2007 [PA 94-0839]
Source: Office of the Comptroller's ST-10 Fund Transfer Report
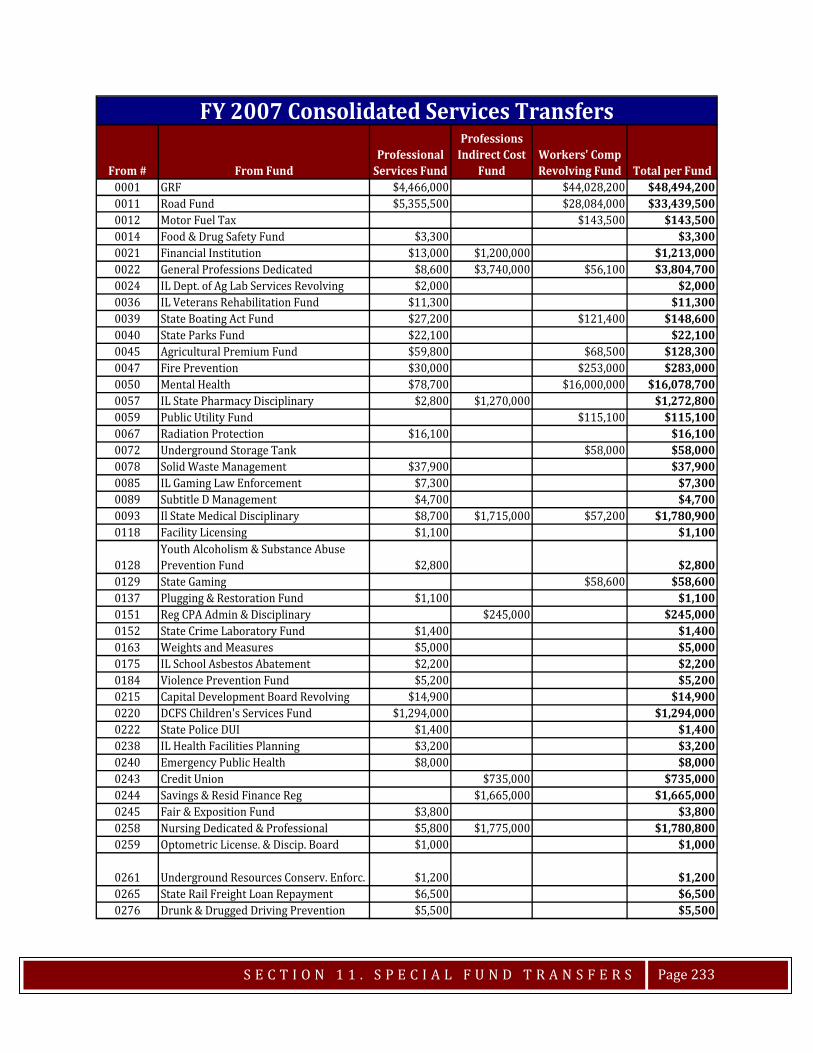
S E C T I O N 1 1 . S P E C I A L F U N D T R A N S F E R S
Page 233
From # From FundProfessional
Services Fund
Professions Indirect Cost
FundWorkers' Comp Revolving Fund Total per Fund
0001 GRF $4,466,000 $44,028,200 $48,494,2000011 Road Fund $5,355,500 $28,084,000 $33,439,5000012 Motor Fuel Tax $143,500 $143,5000014 Food & Drug Safety Fund $3,300 $3,3000021 Financial Institution $13,000 $1,200,000 $1,213,0000022 General Professions Dedicated $8,600 $3,740,000 $56,100 $3,804,7000024 IL Dept. of Ag Lab Services Revolving $2,000 $2,0000036 IL Veterans Rehabilitation Fund $11,300 $11,3000039 State Boating Act Fund $27,200 $121,400 $148,6000040 State Parks Fund $22,100 $22,1000045 Agricultural Premium Fund $59,800 $68,500 $128,3000047 Fire Prevention $30,000 $253,000 $283,0000050 Mental Health $78,700 $16,000,000 $16,078,7000057 IL State Pharmacy Disciplinary $2,800 $1,270,000 $1,272,8000059 Public Utility Fund $115,100 $115,1000067 Radiation Protection $16,100 $16,1000072 Underground Storage Tank $58,000 $58,0000078 Solid Waste Management $37,900 $37,9000085 IL Gaming Law Enforcement $7,300 $7,3000089 Subtitle D Management $4,700 $4,7000093 Il State Medical Disciplinary $8,700 $1,715,000 $57,200 $1,780,9000118 Facility Licensing $1,100 $1,100
0128Youth Alcoholism & Substance Abuse Prevention Fund $2,800 $2,800
0129 State Gaming $58,600 $58,6000137 Plugging & Restoration Fund $1,100 $1,1000151 Reg CPA Admin & Disciplinary $245,000 $245,0000152 State Crime Laboratory Fund $1,400 $1,4000163 Weights and Measures $5,000 $5,0000175 IL School Asbestos Abatement $2,200 $2,2000184 Violence Prevention Fund $5,200 $5,2000215 Capital Development Board Revolving $14,900 $14,9000220 DCFS Children's Services Fund $1,294,000 $1,294,0000222 State Police DUI $1,400 $1,4000238 IL Health Facilities Planning $3,200 $3,2000240 Emergency Public Health $8,000 $8,0000243 Credit Union $735,000 $735,0000244 Savings & Resid Finance Reg $1,665,000 $1,665,0000245 Fair & Exposition Fund $3,800 $3,8000258 Nursing Dedicated & Professional $5,800 $1,775,000 $1,780,8000259 Optometric License. & Discip. Board $1,000 $1,000
0261 Underground Resources Conserv. Enforc. $1,200 $1,2000265 State Rail Freight Loan Repayment $6,500 $6,5000276 Drunk & Drugged Driving Prevention $5,500 $5,500
FY 2007 Consolidated Services Transfers
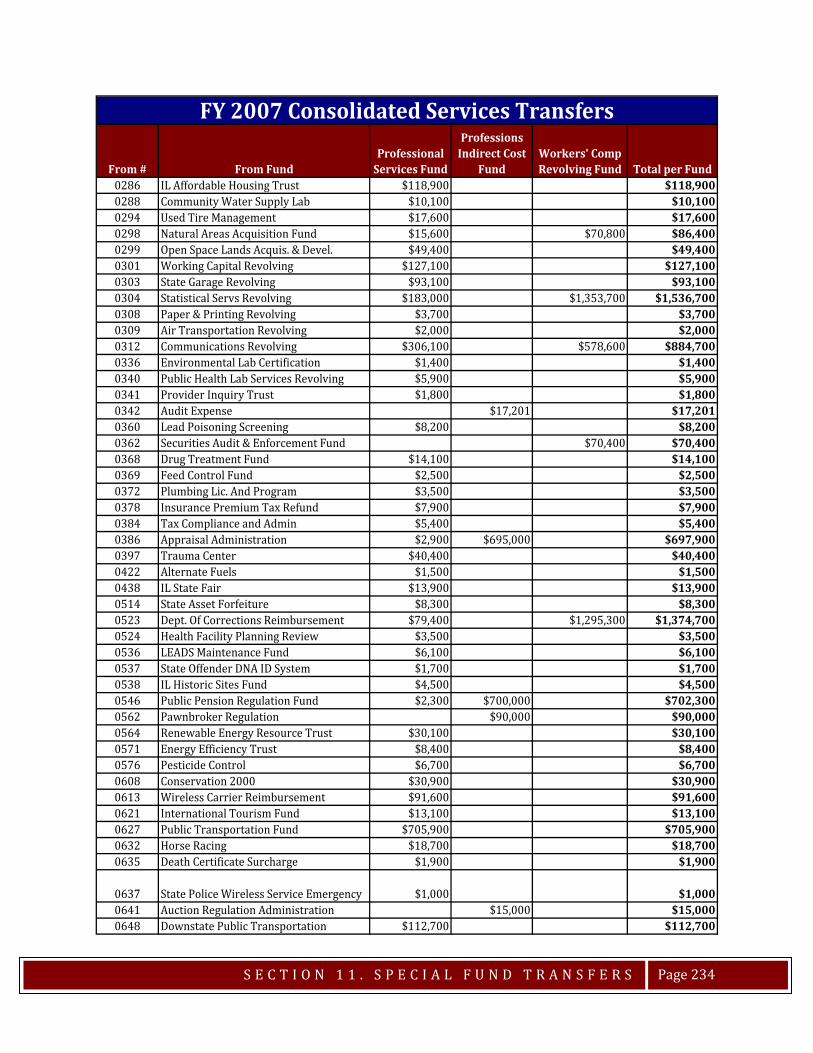
S E C T I O N 1 1 . S P E C I A L F U N D T R A N S F E R S
Page 234
From # From FundProfessional
Services Fund
Professions Indirect Cost
FundWorkers' Comp Revolving Fund Total per Fund
0286 IL Affordable Housing Trust $118,900 $118,9000288 Community Water Supply Lab $10,100 $10,1000294 Used Tire Management $17,600 $17,6000298 Natural Areas Acquisition Fund $15,600 $70,800 $86,4000299 Open Space Lands Acquis. & Devel. $49,400 $49,4000301 Working Capital Revolving $127,100 $127,1000303 State Garage Revolving $93,100 $93,1000304 Statistical Servs Revolving $183,000 $1,353,700 $1,536,7000308 Paper & Printing Revolving $3,700 $3,7000309 Air Transportation Revolving $2,000 $2,0000312 Communications Revolving $306,100 $578,600 $884,7000336 Environmental Lab Certification $1,400 $1,4000340 Public Health Lab Services Revolving $5,900 $5,9000341 Provider Inquiry Trust $1,800 $1,8000342 Audit Expense $17,201 $17,2010360 Lead Poisoning Screening $8,200 $8,2000362 Securities Audit & Enforcement Fund $70,400 $70,4000368 Drug Treatment Fund $14,100 $14,1000369 Feed Control Fund $2,500 $2,5000372 Plumbing Lic. And Program $3,500 $3,5000378 Insurance Premium Tax Refund $7,900 $7,9000384 Tax Compliance and Admin $5,400 $5,4000386 Appraisal Administration $2,900 $695,000 $697,9000397 Trauma Center $40,400 $40,4000422 Alternate Fuels $1,500 $1,5000438 IL State Fair $13,900 $13,9000514 State Asset Forfeiture $8,300 $8,3000523 Dept. Of Corrections Reimbursement $79,400 $1,295,300 $1,374,7000524 Health Facility Planning Review $3,500 $3,5000536 LEADS Maintenance Fund $6,100 $6,1000537 State Offender DNA ID System $1,700 $1,7000538 IL Historic Sites Fund $4,500 $4,5000546 Public Pension Regulation Fund $2,300 $700,000 $702,3000562 Pawnbroker Regulation $90,000 $90,0000564 Renewable Energy Resource Trust $30,100 $30,1000571 Energy Efficiency Trust $8,400 $8,4000576 Pesticide Control $6,700 $6,7000608 Conservation 2000 $30,900 $30,9000613 Wireless Carrier Reimbursement $91,600 $91,6000621 International Tourism Fund $13,100 $13,1000627 Public Transportation Fund $705,900 $705,9000632 Horse Racing $18,700 $18,7000635 Death Certificate Surcharge $1,900 $1,900
0637 State Police Wireless Service Emergency $1,000 $1,0000641 Auction Regulation Administration $15,000 $15,0000648 Downstate Public Transportation $112,700 $112,700
FY 2007 Consolidated Services Transfers
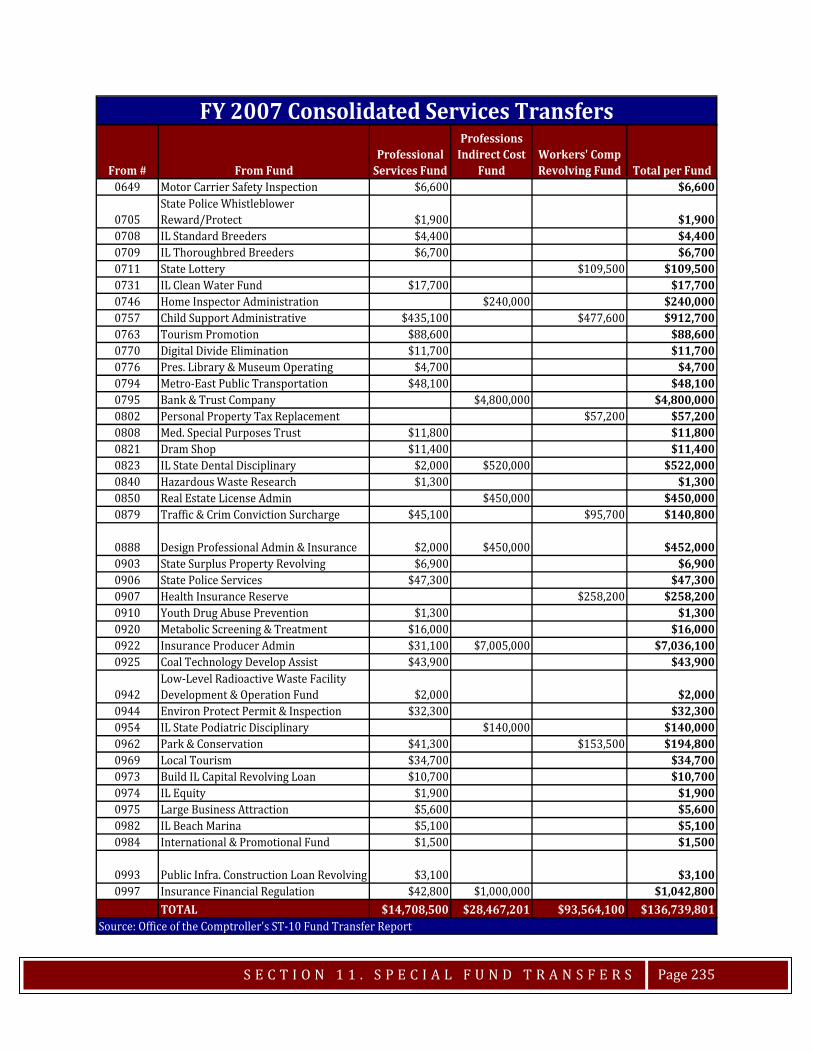
S E C T I O N 1 1 . S P E C I A L F U N D T R A N S F E R S
Page 235
From # From FundProfessional
Services Fund
Professions Indirect Cost
FundWorkers' Comp Revolving Fund Total per Fund
0649 Motor Carrier Safety Inspection $6,600 $6,600
0705State Police Whistleblower Reward/Protect $1,900 $1,900
0708 IL Standard Breeders $4,400 $4,4000709 IL Thoroughbred Breeders $6,700 $6,7000711 State Lottery $109,500 $109,5000731 IL Clean Water Fund $17,700 $17,7000746 Home Inspector Administration $240,000 $240,0000757 Child Support Administrative $435,100 $477,600 $912,7000763 Tourism Promotion $88,600 $88,6000770 Digital Divide Elimination $11,700 $11,7000776 Pres. Library & Museum Operating $4,700 $4,7000794 Metro-East Public Transportation $48,100 $48,1000795 Bank & Trust Company $4,800,000 $4,800,0000802 Personal Property Tax Replacement $57,200 $57,2000808 Med. Special Purposes Trust $11,800 $11,8000821 Dram Shop $11,400 $11,4000823 IL State Dental Disciplinary $2,000 $520,000 $522,0000840 Hazardous Waste Research $1,300 $1,3000850 Real Estate License Admin $450,000 $450,0000879 Traffic & Crim Conviction Surcharge $45,100 $95,700 $140,800
0888 Design Professional Admin & Insurance $2,000 $450,000 $452,0000903 State Surplus Property Revolving $6,900 $6,9000906 State Police Services $47,300 $47,3000907 Health Insurance Reserve $258,200 $258,2000910 Youth Drug Abuse Prevention $1,300 $1,3000920 Metabolic Screening & Treatment $16,000 $16,0000922 Insurance Producer Admin $31,100 $7,005,000 $7,036,1000925 Coal Technology Develop Assist $43,900 $43,900
0942Low-Level Radioactive Waste Facility Development & Operation Fund $2,000 $2,000
0944 Environ Protect Permit & Inspection $32,300 $32,3000954 IL State Podiatric Disciplinary $140,000 $140,0000962 Park & Conservation $41,300 $153,500 $194,8000969 Local Tourism $34,700 $34,7000973 Build IL Capital Revolving Loan $10,700 $10,7000974 IL Equity $1,900 $1,9000975 Large Business Attraction $5,600 $5,6000982 IL Beach Marina $5,100 $5,1000984 International & Promotional Fund $1,500 $1,500
0993 Public Infra. Construction Loan Revolving $3,100 $3,1000997 Insurance Financial Regulation $42,800 $1,000,000 $1,042,800
TOTAL $14,708,500 $28,467,201 $93,564,100 $136,739,801
FY 2007 Consolidated Services Transfers
Source: Office of the Comptroller's ST-10 Fund Transfer Report
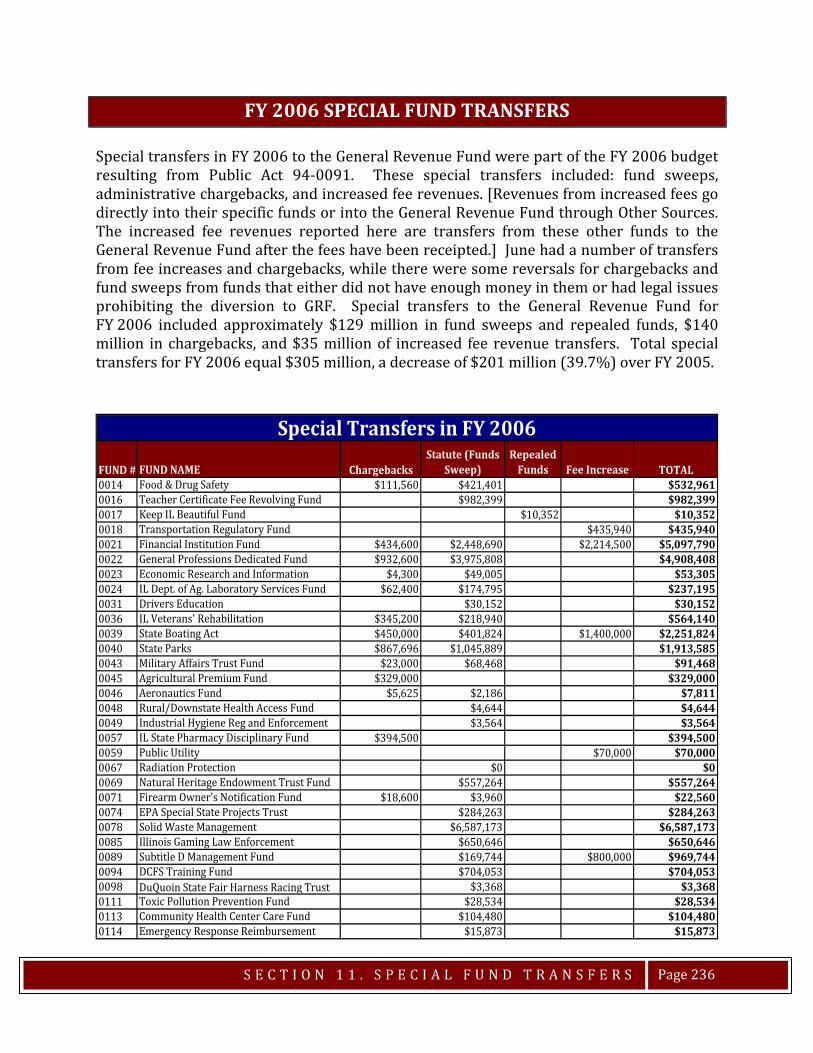
S E C T I O N 1 1 . S P E C I A L F U N D T R A N S F E R S
Page 236
FY 2006 SPECIAL FUND TRANSFERS Special transfers in FY 2006 to the General Revenue Fund were part of the FY 2006 budget resulting from Public Act 94-0091. These special transfers included: fund sweeps, administrative chargebacks, and increased fee revenues. [Revenues from increased fees go directly into their specific funds or into the General Revenue Fund through Other Sources. The increased fee revenues reported here are transfers from these other funds to the General Revenue Fund after the fees have been receipted.] June had a number of transfers from fee increases and chargebacks, while there were some reversals for chargebacks and fund sweeps from funds that either did not have enough money in them or had legal issues prohibiting the diversion to GRF. Special transfers to the General Revenue Fund for FY 2006 included approximately $129 million in fund sweeps and repealed funds, $140 million in chargebacks, and $35 million of increased fee revenue transfers. Total special transfers for FY 2006 equal $305 million, a decrease of $201 million (39.7%) over FY 2005.
FUND # FUND NAME ChargebacksStatute (Funds
Sweep)Repealed
Funds Fee Increase TOTAL0014 Food & Drug Safety $111,560 $421,401 $532,9610016 Teacher Certificate Fee Revolving Fund $982,399 $982,3990017 Keep IL Beautiful Fund $10,352 $10,3520018 Transportation Regulatory Fund $435,940 $435,9400021 Financial Institution Fund $434,600 $2,448,690 $2,214,500 $5,097,7900022 General Professions Dedicated Fund $932,600 $3,975,808 $4,908,4080023 Economic Research and Information $4,300 $49,005 $53,3050024 IL Dept. of Ag. Laboratory Services Fund $62,400 $174,795 $237,1950031 Drivers Education $30,152 $30,1520036 IL Veterans' Rehabilitation $345,200 $218,940 $564,1400039 State Boating Act $450,000 $401,824 $1,400,000 $2,251,8240040 State Parks $867,696 $1,045,889 $1,913,5850043 Military Affairs Trust Fund $23,000 $68,468 $91,4680045 Agricultural Premium Fund $329,000 $329,0000046 Aeronautics Fund $5,625 $2,186 $7,8110048 Rural/Downstate Health Access Fund $4,644 $4,6440049 Industrial Hygiene Reg and Enforcement $3,564 $3,5640057 IL State Pharmacy Disciplinary Fund $394,500 $394,5000059 Public Utility $70,000 $70,0000067 Radiation Protection $0 $00069 Natural Heritage Endowment Trust Fund $557,264 $557,2640071 Firearm Owner's Notification Fund $18,600 $3,960 $22,5600074 EPA Special State Projects Trust $284,263 $284,2630078 Solid Waste Management $6,587,173 $6,587,1730085 Illinois Gaming Law Enforcement $650,646 $650,6460089 Subtitle D Management Fund $169,744 $800,000 $969,7440094 DCFS Training Fund $704,053 $704,0530098 DuQuoin State Fair Harness Racing Trust $3,368 $3,3680111 Toxic Pollution Prevention Fund $28,534 $28,5340113 Community Health Center Care Fund $104,480 $104,4800114 Emergency Response Reimbursement $15,873 $15,873
Special Transfers in FY 2006
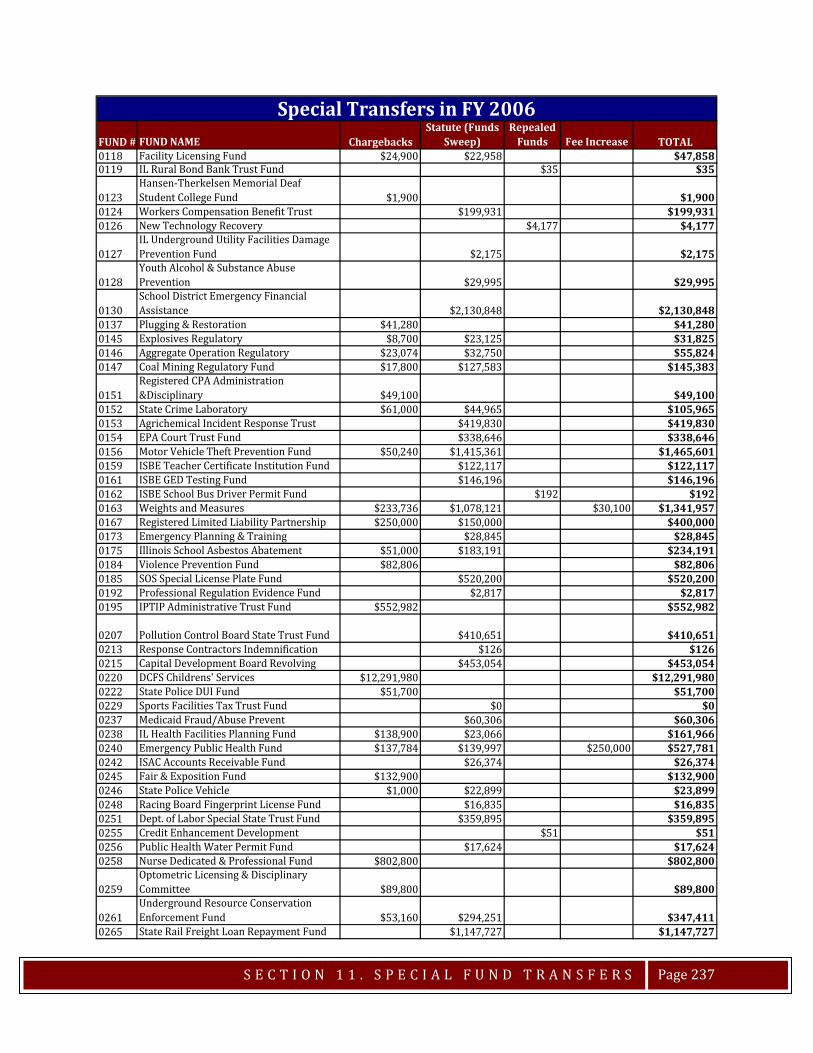
S E C T I O N 1 1 . S P E C I A L F U N D T R A N S F E R S
Page 237
FUND # FUND NAME ChargebacksStatute (Funds
Sweep)Repealed
Funds Fee Increase TOTAL0118 Facility Licensing Fund $24,900 $22,958 $47,8580119 IL Rural Bond Bank Trust Fund $35 $35
0123Hansen-Therkelsen Memorial Deaf Student College Fund $1,900 $1,900
0124 Workers Compensation Benefit Trust $199,931 $199,9310126 New Technology Recovery $4,177 $4,177
0127IL Underground Utility Facilities Damage Prevention Fund $2,175 $2,175
0128Youth Alcohol & Substance Abuse Prevention $29,995 $29,995
0130School District Emergency Financial Assistance $2,130,848 $2,130,848
0137 Plugging & Restoration $41,280 $41,2800145 Explosives Regulatory $8,700 $23,125 $31,8250146 Aggregate Operation Regulatory $23,074 $32,750 $55,8240147 Coal Mining Regulatory Fund $17,800 $127,583 $145,383
0151Registered CPA Administration &Disciplinary $49,100 $49,100
0152 State Crime Laboratory $61,000 $44,965 $105,9650153 Agrichemical Incident Response Trust $419,830 $419,8300154 EPA Court Trust Fund $338,646 $338,6460156 Motor Vehicle Theft Prevention Fund $50,240 $1,415,361 $1,465,6010159 ISBE Teacher Certificate Institution Fund $122,117 $122,1170161 ISBE GED Testing Fund $146,196 $146,1960162 ISBE School Bus Driver Permit Fund $192 $1920163 Weights and Measures $233,736 $1,078,121 $30,100 $1,341,9570167 Registered Limited Liability Partnership $250,000 $150,000 $400,0000173 Emergency Planning & Training $28,845 $28,8450175 Illinois School Asbestos Abatement $51,000 $183,191 $234,1910184 Violence Prevention Fund $82,806 $82,8060185 SOS Special License Plate Fund $520,200 $520,2000192 Professional Regulation Evidence Fund $2,817 $2,8170195 IPTIP Administrative Trust Fund $552,982 $552,982
0207 Pollution Control Board State Trust Fund $410,651 $410,6510213 Response Contractors Indemnification $126 $1260215 Capital Development Board Revolving $453,054 $453,0540220 DCFS Childrens' Services $12,291,980 $12,291,9800222 State Police DUI Fund $51,700 $51,7000229 Sports Facilities Tax Trust Fund $0 $00237 Medicaid Fraud/Abuse Prevent $60,306 $60,3060238 IL Health Facilities Planning Fund $138,900 $23,066 $161,9660240 Emergency Public Health Fund $137,784 $139,997 $250,000 $527,7810242 ISAC Accounts Receivable Fund $26,374 $26,3740245 Fair & Exposition Fund $132,900 $132,9000246 State Police Vehicle $1,000 $22,899 $23,8990248 Racing Board Fingerprint License Fund $16,835 $16,8350251 Dept. of Labor Special State Trust Fund $359,895 $359,8950255 Credit Enhancement Development $51 $510256 Public Health Water Permit Fund $17,624 $17,6240258 Nurse Dedicated & Professional Fund $802,800 $802,800
0259Optometric Licensing & Disciplinary Committee $89,800 $89,800
0261Underground Resource Conservation Enforcement Fund $53,160 $294,251 $347,411
0265 State Rail Freight Loan Repayment Fund $1,147,727 $1,147,727
Special Transfers in FY 2006
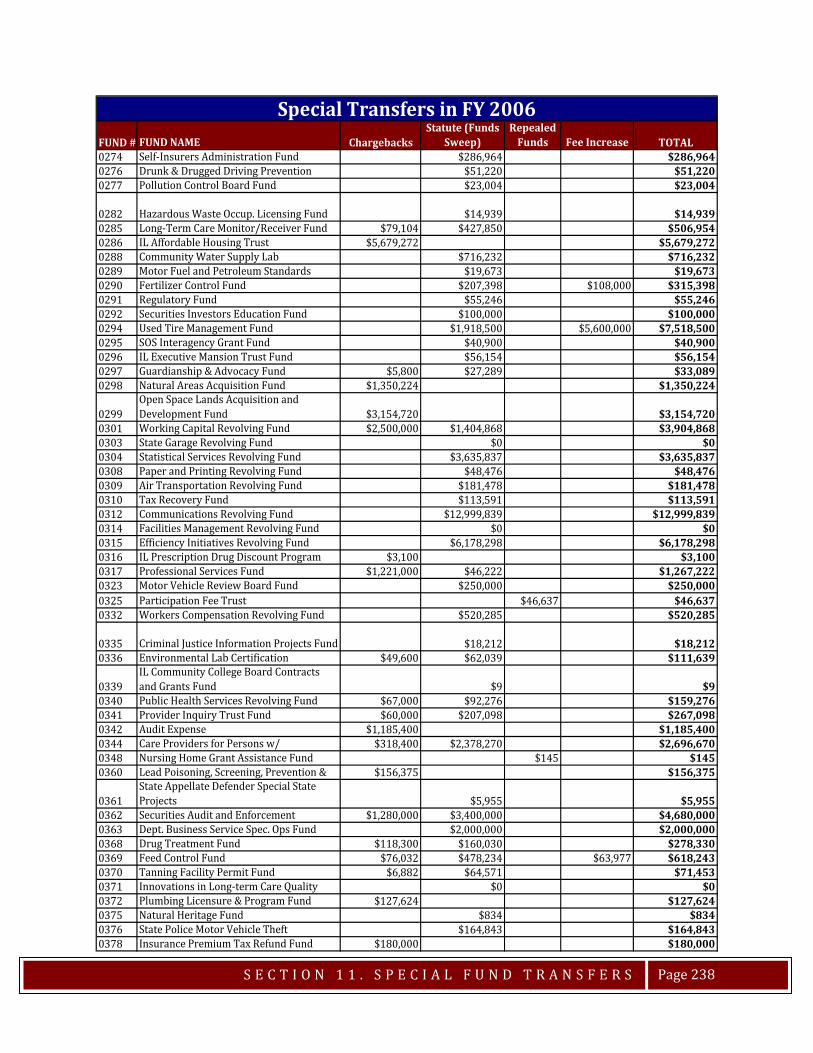
S E C T I O N 1 1 . S P E C I A L F U N D T R A N S F E R S
Page 238
FUND # FUND NAME ChargebacksStatute (Funds
Sweep)Repealed
Funds Fee Increase TOTAL0274 Self-Insurers Administration Fund $286,964 $286,9640276 Drunk & Drugged Driving Prevention $51,220 $51,2200277 Pollution Control Board Fund $23,004 $23,004
0282 Hazardous Waste Occup. Licensing Fund $14,939 $14,9390285 Long-Term Care Monitor/Receiver Fund $79,104 $427,850 $506,9540286 IL Affordable Housing Trust $5,679,272 $5,679,2720288 Community Water Supply Lab $716,232 $716,2320289 Motor Fuel and Petroleum Standards $19,673 $19,6730290 Fertilizer Control Fund $207,398 $108,000 $315,3980291 Regulatory Fund $55,246 $55,2460292 Securities Investors Education Fund $100,000 $100,0000294 Used Tire Management Fund $1,918,500 $5,600,000 $7,518,5000295 SOS Interagency Grant Fund $40,900 $40,9000296 IL Executive Mansion Trust Fund $56,154 $56,1540297 Guardianship & Advocacy Fund $5,800 $27,289 $33,0890298 Natural Areas Acquisition Fund $1,350,224 $1,350,224
0299Open Space Lands Acquisition and Development Fund $3,154,720 $3,154,720
0301 Working Capital Revolving Fund $2,500,000 $1,404,868 $3,904,8680303 State Garage Revolving Fund $0 $00304 Statistical Services Revolving Fund $3,635,837 $3,635,8370308 Paper and Printing Revolving Fund $48,476 $48,4760309 Air Transportation Revolving Fund $181,478 $181,4780310 Tax Recovery Fund $113,591 $113,5910312 Communications Revolving Fund $12,999,839 $12,999,8390314 Facilities Management Revolving Fund $0 $00315 Efficiency Initiatives Revolving Fund $6,178,298 $6,178,2980316 IL Prescription Drug Discount Program $3,100 $3,1000317 Professional Services Fund $1,221,000 $46,222 $1,267,2220323 Motor Vehicle Review Board Fund $250,000 $250,0000325
Participation Fee Trust $46,637 $46,637
0332 Workers Compensation Revolving Fund $520,285 $520,285
0335 Criminal Justice Information Projects Fund $18,212 $18,2120336 Environmental Lab Certification $49,600 $62,039 $111,639
0339IL Community College Board Contracts and Grants Fund $9 $9
0340 Public Health Services Revolving Fund $67,000 $92,276 $159,2760341 Provider Inquiry Trust Fund $60,000 $207,098 $267,0980342 Audit Expense $1,185,400 $1,185,4000344 Care Providers for Persons w/ $318,400 $2,378,270 $2,696,6700348 Nursing Home Grant Assistance Fund $145 $1450360 Lead Poisoning, Screening, Prevention & $156,375 $156,375
0361State Appellate Defender Special State Projects $5,955 $5,955
0362 Securities Audit and Enforcement $1,280,000 $3,400,000 $4,680,0000363 Dept. Business Service Spec. Ops Fund $2,000,000 $2,000,0000368 Drug Treatment Fund $118,300 $160,030 $278,3300369 Feed Control Fund $76,032 $478,234 $63,977 $618,2430370 Tanning Facility Permit Fund $6,882 $64,571 $71,4530371 Innovations in Long-term Care Quality $0 $00372 Plumbing Licensure & Program Fund $127,624 $127,6240375 Natural Heritage Fund $834 $8340376 State Police Motor Vehicle Theft $164,843 $164,8430378 Insurance Premium Tax Refund Fund $180,000 $180,000
Special Transfers in FY 2006
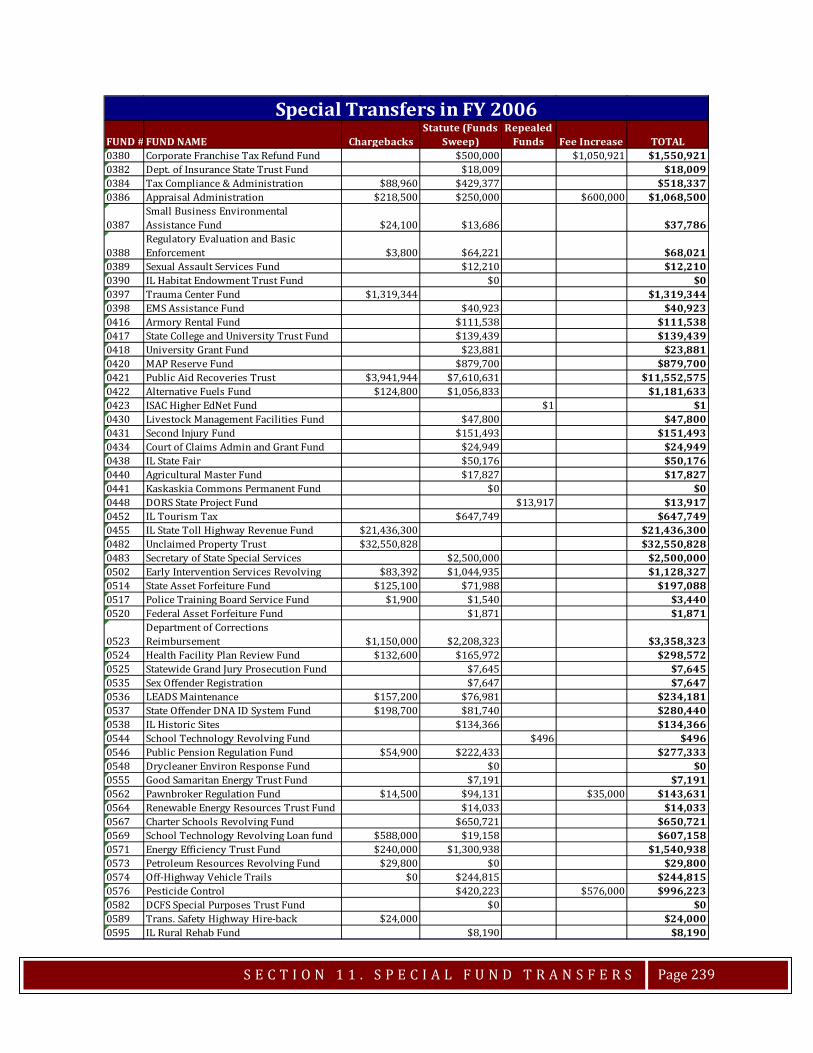
S E C T I O N 1 1 . S P E C I A L F U N D T R A N S F E R S
Page 239
FUND # FUND NAME ChargebacksStatute (Funds
Sweep)Repealed
Funds Fee Increase TOTAL0380 Corporate Franchise Tax Refund Fund $500,000 $1,050,921 $1,550,9210382 Dept. of Insurance State Trust Fund $18,009 $18,0090384 Tax Compliance & Administration $88,960 $429,377 $518,3370386 Appraisal Administration $218,500 $250,000 $600,000 $1,068,500
0387Small Business Environmental Assistance Fund $24,100 $13,686 $37,786
0388Regulatory Evaluation and Basic Enforcement $3,800 $64,221 $68,021
0389 Sexual Assault Services Fund $12,210 $12,2100390 IL Habitat Endowment Trust Fund $0 $00397 Trauma Center Fund $1,319,344 $1,319,3440398 EMS Assistance Fund $40,923 $40,9230416 Armory Rental Fund $111,538 $111,5380417 State College and University Trust Fund $139,439 $139,4390418 University Grant Fund $23,881 $23,8810420 MAP Reserve Fund $879,700 $879,7000421 Public Aid Recoveries Trust $3,941,944 $7,610,631 $11,552,5750422 Alternative Fuels Fund $124,800 $1,056,833 $1,181,6330423 ISAC Higher EdNet Fund $1 $10430 Livestock Management Facilities Fund $47,800 $47,8000431 Second Injury Fund $151,493 $151,4930434 Court of Claims Admin and Grant Fund $24,949 $24,9490438 IL State Fair $50,176 $50,1760440 Agricultural Master Fund $17,827 $17,8270441 Kaskaskia Commons Permanent Fund $0 $00448 DORS State Project Fund $13,917 $13,9170452 IL Tourism Tax $647,749 $647,7490455 IL State Toll Highway Revenue Fund $21,436,300 $21,436,3000482 Unclaimed Property Trust $32,550,828 $32,550,8280483 Secretary of State Special Services $2,500,000 $2,500,0000502 Early Intervention Services Revolving $83,392 $1,044,935 $1,128,3270514 State Asset Forfeiture Fund $125,100 $71,988 $197,0880517 Police Training Board Service Fund $1,900 $1,540 $3,4400520 Federal Asset Forfeiture Fund $1,871 $1,871
0523Department of Corrections Reimbursement $1,150,000 $2,208,323 $3,358,323
0524 Health Facility Plan Review Fund $132,600 $165,972 $298,5720525 Statewide Grand Jury Prosecution Fund $7,645 $7,6450535 Sex Offender Registration $7,647 $7,6470536 LEADS Maintenance $157,200 $76,981 $234,1810537 State Offender DNA ID System Fund $198,700 $81,740 $280,4400538 IL Historic Sites $134,366 $134,3660544 School Technology Revolving Fund $496 $4960546 Public Pension Regulation Fund $54,900 $222,433 $277,3330548 Drycleaner Environ Response Fund $0 $00555 Good Samaritan Energy Trust Fund $7,191 $7,1910562 Pawnbroker Regulation Fund $14,500 $94,131 $35,000 $143,6310564 Renewable Energy Resources Trust Fund $14,033 $14,0330567 Charter Schools Revolving Fund $650,721 $650,7210569 School Technology Revolving Loan fund $588,000 $19,158 $607,1580571 Energy Efficiency Trust Fund $240,000 $1,300,938 $1,540,9380573 Petroleum Resources Revolving Fund $29,800 $0 $29,8000574 Off-Highway Vehicle Trails $0 $244,815 $244,8150576 Pesticide Control $420,223 $576,000 $996,2230582 DCFS Special Purposes Trust Fund $0 $00589 Trans. Safety Highway Hire-back $24,000 $24,0000595 IL Rural Rehab Fund $8,190 $8,190
Special Transfers in FY 2006

S E C T I O N 1 1 . S P E C I A L F U N D T R A N S F E R S
Page 240
FUND # FUND NAME ChargebacksStatute (Funds
Sweep)Repealed
Funds Fee Increase TOTAL0610 Energy Assistance Contribution $258,585 $258,5850614 Capital Litigation Fund $2,447,983 $2,447,9830621 International Tourism Fund $589,770 $589,770
0628 IL Building Commission Revolving Fund $1,398 $1,3980629 Real Estate Recovery Fund $7,174 $7,1740632 Horse Racing $907,264 $907,2640634 IL Aquaculture Develop Fund $1 $10635 Death Certificate Surcharge $150,544 $1,134,341 $1,284,8850637 State Police Wireless Service Emergency $118,800 $118,8000641 Auction Regulation Administration $51,000 $51,0000642 DHS State Projects Fund $89,917 $89,9170643 Auction Recovery Fund $5,178 $5,1780648 Downstate Public Transportation $5,771,800 $5,771,8000649 Motor Carrier Safety Inspection $161,600 $147,477 $309,0770650 Municipal Economic Development Fund $26,400 $26,4000651 Watershed Park Fund $19,786 $19,7860658 State Off-set Claims Fund $0 $00669 Airport Land Loan Revolving Fund $5,920 $1,669,970 $1,675,8900672 Homelessness Prevention Fund $3,697 $3,6970677 ISAC Contracts and Grants Fund $5,589 $5,5890684 DCFS Refugee Assistance Fund $328 $3280688 IEMA State Projects Fund $13 $130702 Assisted Living and Shared Housing Reg $9,900 $24,493 $34,3930703 State Whistleblower Reward & Protection $1,592 $1,5920705 Whistleblower Reward & Protection Fund $168,600 $199,699 $368,2990708 IL Standardbred Breeders Fund $134,800 $134,8000709 IL Thoroughbred Breeders Fund $192,512 $192,5120712 Post Transplant Maintenance and $75,100 $75,1000720 Family Care Fund $22,585 $22,5850728 Drug Rebate Fund $17,315,821 $17,315,8210729 IL Century Network Special Purposes $3,889 $3,8890731 IL Clean Water Fund $1,835,796 $9,400,000 $11,235,7960738 Alternative Compliance Market Account $8,000 $53,120 $61,120
0739Group Worker's Compensation Pool Insolvency $136,547 $136,547
0740 Medicaid Buy-In Program Revolving $318,894 $318,894
0745State's Attorneys Appellate Prosecutor's County $70,101 $70,101
0746 Home Inspector Administration Fund $22,100 $244,503 $266,6030753 IL Future Teachers Corps Scholarship $4,836 $4,8360757 Child Support Administrative $1,117,266 $1,117,2660762 Local Initiative Fund $0 $00763 Tourism Promotion $3,152,700 $3,152,7000769 Lawyers Assistance Program Fund $0 $00770 Digital Divide Elimination Fund $401,200 $401,2000774 Oil Spill Response Fund $167,547 $167,5470776 Presidential Library and Museum Fund $727,250 $727,2500794 Metro-East Public Transportation Fund $742,700 $742,7000808 Medical Special Purpose Trust Fund $930,668 $930,6680821 Dram Shop $110,554 $675,000 $785,5540823 IL State Dental Disciplinary Fund $21,500 $21,5000830 Dept. of Aging State Projects Fund $10,059 $10,0590831 Natural Recourses Restoration Trust $13,400 $63,002 $76,4020835 State Fair Promotional Activities Fund $8,734 $8,7340840 Hazardous Waste Research Fund $31,520 $125,209 $156,729
Special Transfers in FY 2006
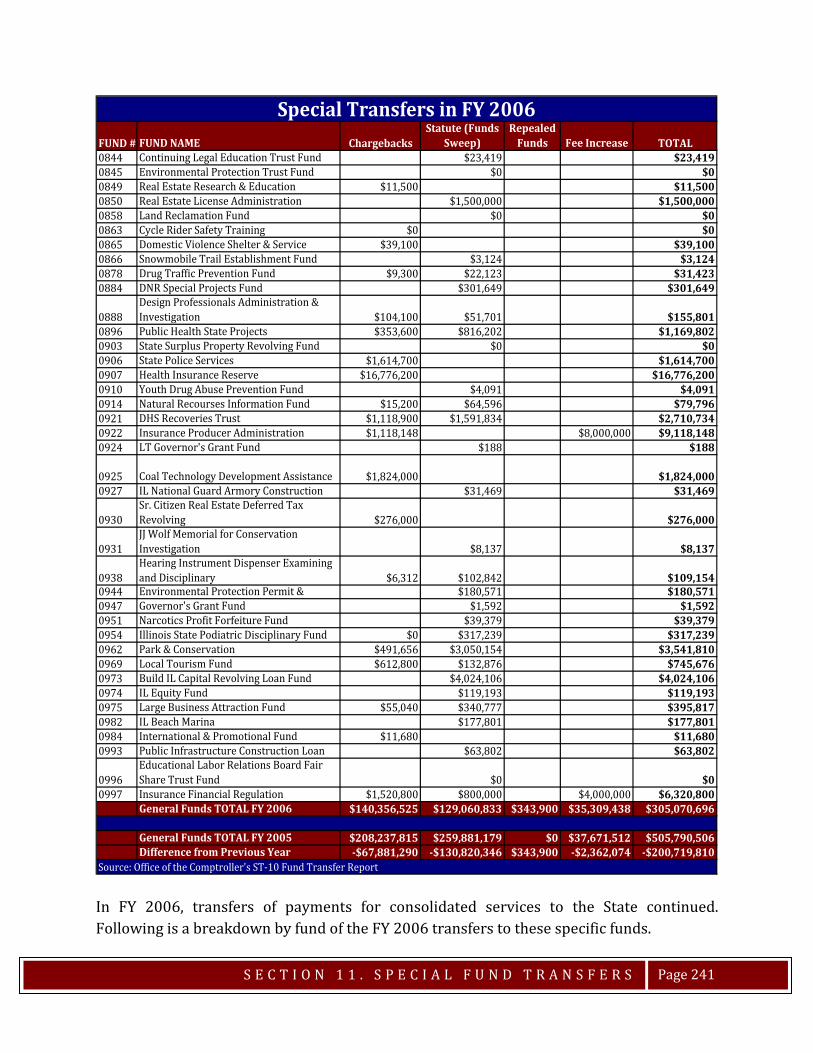
S E C T I O N 1 1 . S P E C I A L F U N D T R A N S F E R S
Page 241
In FY 2006, transfers of payments for consolidated services to the State continued. Following is a breakdown by fund of the FY 2006 transfers to these specific funds.
FUND # FUND NAME ChargebacksStatute (Funds
Sweep)Repealed
Funds Fee Increase TOTAL0844 Continuing Legal Education Trust Fund $23,419 $23,4190845 Environmental Protection Trust Fund $0 $00849 Real Estate Research & Education $11,500 $11,5000850 Real Estate License Administration $1,500,000 $1,500,0000858 Land Reclamation Fund $0 $00863 Cycle Rider Safety Training $0 $00865 Domestic Violence Shelter & Service $39,100 $39,1000866 Snowmobile Trail Establishment Fund $3,124 $3,1240878 Drug Traffic Prevention Fund $9,300 $22,123 $31,4230884 DNR Special Projects Fund $301,649 $301,649
0888Design Professionals Administration & Investigation $104,100 $51,701 $155,801
0896 Public Health State Projects $353,600 $816,202 $1,169,8020903 State Surplus Property Revolving Fund $0 $00906 State Police Services $1,614,700 $1,614,7000907 Health Insurance Reserve $16,776,200 $16,776,2000910 Youth Drug Abuse Prevention Fund $4,091 $4,0910914 Natural Recourses Information Fund $15,200 $64,596 $79,7960921 DHS Recoveries Trust $1,118,900 $1,591,834 $2,710,7340922 Insurance Producer Administration $1,118,148 $8,000,000 $9,118,1480924 LT Governor's Grant Fund $188 $188
0925 Coal Technology Development Assistance $1,824,000 $1,824,0000927 IL National Guard Armory Construction $31,469 $31,469
0930Sr. Citizen Real Estate Deferred Tax Revolving $276,000 $276,000
0931JJ Wolf Memorial for Conservation Investigation $8,137 $8,137
0938Hearing Instrument Dispenser Examining and Disciplinary $6,312 $102,842 $109,154
0944 Environmental Protection Permit & $180,571 $180,5710947 Governor's Grant Fund $1,592 $1,5920951 Narcotics Profit Forfeiture Fund $39,379 $39,3790954 Illinois State Podiatric Disciplinary Fund $0 $317,239 $317,2390962 Park & Conservation $491,656 $3,050,154 $3,541,8100969 Local Tourism Fund $612,800 $132,876 $745,6760973 Build IL Capital Revolving Loan Fund $4,024,106 $4,024,1060974 IL Equity Fund $119,193 $119,1930975 Large Business Attraction Fund $55,040 $340,777 $395,8170982 IL Beach Marina $177,801 $177,8010984 International & Promotional Fund $11,680 $11,6800993 Public Infrastructure Construction Loan $63,802 $63,802
0996Educational Labor Relations Board Fair Share Trust Fund $0 $0
0997 Insurance Financial Regulation $1,520,800 $800,000 $4,000,000 $6,320,800General Funds TOTAL FY 2006 $140,356,525 $129,060,833 $343,900 $35,309,438 $305,070,696
General Funds TOTAL FY 2005 $208,237,815 $259,881,179 $0 $37,671,512 $505,790,506Difference from Previous Year -$67,881,290 -$130,820,346 $343,900 -$2,362,074 -$200,719,810
Source: Office of the Comptroller's ST-10 Fund Transfer Report
Special Transfers in FY 2006
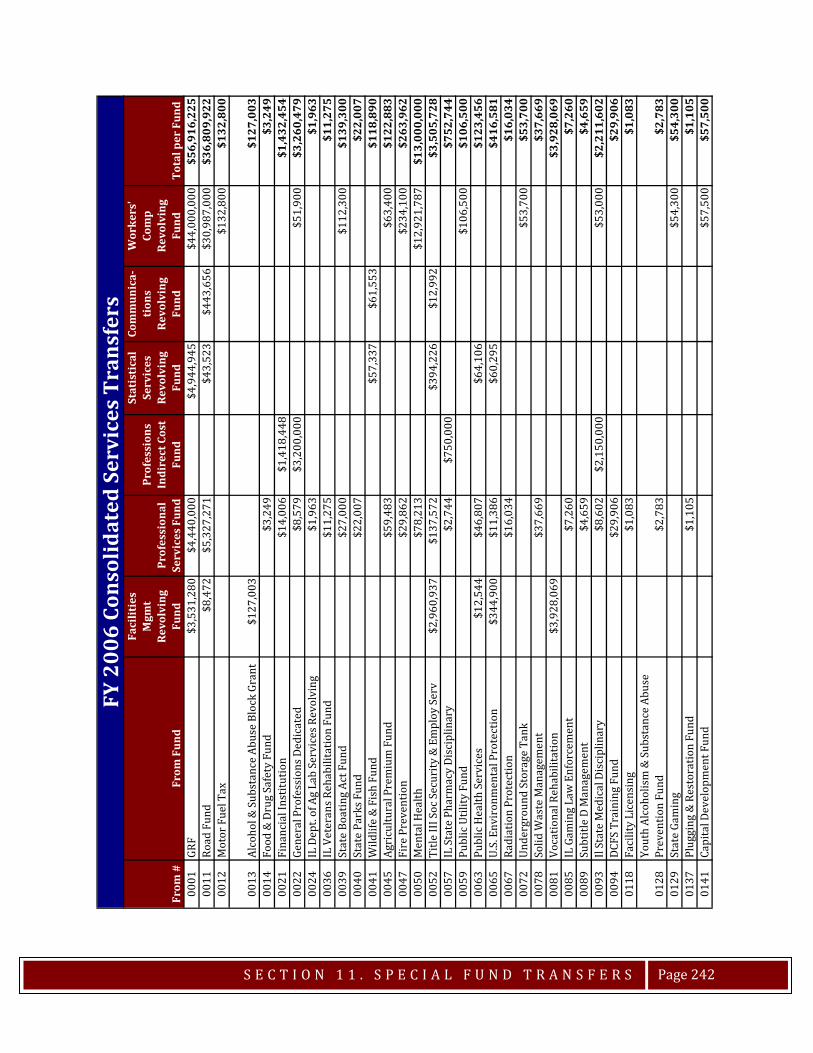
S E C T I O N 1 1 . S P E C I A L F U N D T R A N S F E R S
Page 242
From
#Fr
om F
und
Faci
litie
s M
gmt
Revo
lvin
g Fu
ndPr
ofes
sion
al
Serv
ices
Fun
d
Prof
essi
ons
Indi
rect
Cos
t Fu
nd
Stat
isti
cal
Serv
ices
Re
volv
ing
Fund
Com
mun
ica-
ti
ons
Revo
lvin
g Fu
nd
Wor
kers
' Co
mp
Revo
lvin
g Fu
ndTo
tal p
er F
und
0001
GRF
$3,5
31,2
80$4
,440
,000
$4,9
44,9
45$4
4,00
0,00
0$5
6,91
6,22
500
11Ro
ad F
und
$8,4
72$5
,327
,271
$43,
523
$443
,656
$30,
987,
000
$36,
809,
922
0012
Mot
or F
uel T
ax$1
32,8
00$1
32,8
00
0013
Alco
hol &
Sub
stan
ce A
buse
Blo
ck G
rant
$127
,003
$127
,003
0014
Food
& D
rug
Safe
ty F
und
$3,2
49$3
,249
0021
Fina
ncia
l Ins
titut
ion
$14,
006
$1,4
18,4
48$1
,432
,454
0022
Gene
ral P
rofe
ssio
ns D
edic
ated
$8,5
79$3
,200
,000
$51,
900
$3,2
60,4
7900
24IL
Dep
t. of
Ag
Lab
Serv
ices
Rev
olvi
ng$1
,963
$1,9
6300
36IL
Vet
eran
s Reh
abili
tatio
n Fu
nd$1
1,27
5$1
1,27
500
39St
ate
Boat
ing
Act F
und
$27,
000
$112
,300
$139
,300
0040
Stat
e Pa
rks F
und
$22,
007
$22,
007
0041
Wild
life
& F
ish
Fund
$57,
337
$61,
553
$118
,890
0045
Agri
cultu
ral P
rem
ium
Fun
d$5
9,48
3$6
3,40
0$1
22,8
8300
47Fi
re P
reve
ntio
n$2
9,86
2$2
34,1
00$2
63,9
6200
50M
enta
l Hea
lth$7
8,21
3$1
2,92
1,78
7$1
3,00
0,00
000
52Ti
tle II
I Soc
Sec
urity
& E
mpl
oy S
erv
$2,9
60,9
37$1
37,5
72$3
94,2
26$1
2,99
2$3
,505
,728
0057
IL S
tate
Pha
rmac
y Di
scip
linar
y$2
,744
$750
,000
$752
,744
0059
Publ
ic U
tility
Fun
d$1
06,5
00$1
06,5
0000
63Pu
blic
Hea
lth S
ervi
ces
$12,
544
$46,
807
$64,
106
$123
,456
0065
U.S.
Env
iron
men
tal P
rote
ctio
n$3
44,9
00$1
1,38
6$6
0,29
5$4
16,5
8100
67Ra
diat
ion
Prot
ectio
n$1
6,03
4$1
6,03
400
72Un
derg
roun
d St
orag
e Ta
nk$5
3,70
0$5
3,70
000
78So
lid W
aste
Man
agem
ent
$37,
669
$37,
669
0081
Voca
tiona
l Reh
abili
tatio
n$3
,928
,069
$3,9
28,0
6900
85IL
Gam
ing
Law
Enf
orce
men
t$7
,260
$7,2
6000
89Su
btitl
e D
Man
agem
ent
$4,6
59$4
,659
0093
Il St
ate
Med
ical
Dis
cipl
inar
y$8
,602
$2,1
50,0
00$5
3,00
0$2
,211
,602
0094
DCFS
Tra
inin
g Fu
nd$2
9,90
6$2
9,90
601
18Fa
cilit
y Li
cens
ing
$1,0
83$1
,083
0128
Yout
h Al
coho
lism
& S
ubst
ance
Abu
se
Prev
entio
n Fu
nd$2
,783
$2,7
8301
29St
ate
Gam
ing
$54,
300
$54,
300
0137
Plug
ging
& R
esto
ratio
n Fu
nd$1
,105
$1,1
0501
41Ca
pita
l Dev
elop
men
t Fun
d$5
7,50
0$5
7,50
0
FY 2
006
Cons
olid
ated
Ser
vice
s Tr
ansf
ers
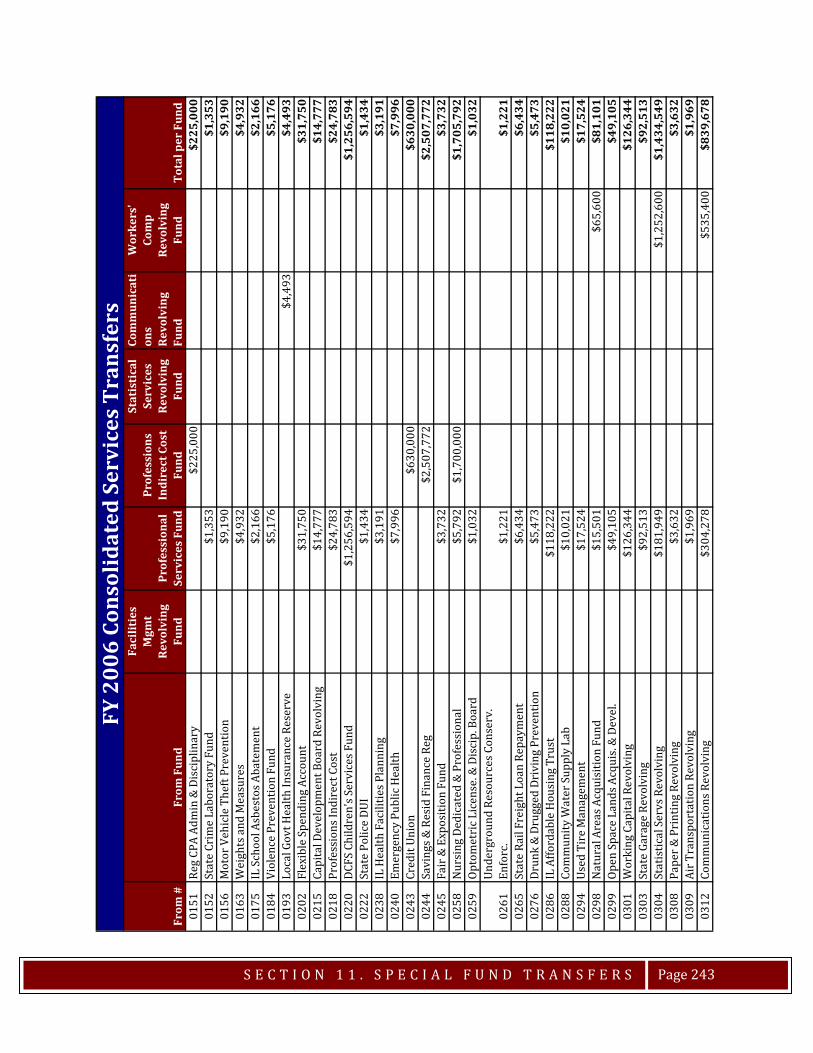
S E C T I O N 1 1 . S P E C I A L F U N D T R A N S F E R S
Page 243
From
#Fr
om F
und
Faci
litie
s M
gmt
Revo
lvin
g Fu
ndPr
ofes
sion
al
Serv
ices
Fun
d
Prof
essi
ons
Indi
rect
Cos
t Fu
nd
Stat
isti
cal
Serv
ices
Re
volv
ing
Fund
Com
mun
icat
ion
s Re
volv
ing
Fund
Wor
kers
' Co
mp
Revo
lvin
g Fu
ndTo
tal p
er F
und
0151
Reg
CPA
Adm
in &
Dis
cipl
inar
y$2
25,0
00$2
25,0
0001
52St
ate
Crim
e La
bora
tory
Fun
d$1
,353
$1,3
5301
56M
otor
Veh
icle
The
ft Pr
even
tion
$9,1
90$9
,190
0163
Wei
ghts
and
Mea
sure
s$4
,932
$4,9
3201
75IL
Sch
ool A
sbes
tos A
bate
men
t$2
,166
$2,1
6601
84Vi
olen
ce P
reve
ntio
n Fu
nd$5
,176
$5,1
7601
93Lo
cal G
ovt H
ealth
Insu
ranc
e Re
serv
e$4
,493
$4,4
9302
02Fl
exib
le S
pend
ing
Acco
unt
$31,
750
$31,
750
0215
Capi
tal D
evel
opm
ent B
oard
Rev
olvi
ng$1
4,77
7$1
4,77
702
18Pr
ofes
sion
s Ind
irec
t Cos
t$2
4,78
3$2
4,78
302
20DC
FS C
hild
ren'
s Ser
vice
s Fun
d$1
,256
,594
$1,2
56,5
9402
22St
ate
Polic
e DU
I$1
,434
$1,4
3402
38IL
Hea
lth F
acili
ties P
lann
ing
$3,1
91$3
,191
0240
Emer
genc
y Pu
blic
Hea
lth$7
,996
$7,9
9602
43Cr
edit
Unio
n$6
30,0
00$6
30,0
0002
44Sa
ving
s & R
esid
Fin
ance
Reg
$2,5
07,7
72$2
,507
,772
0245
Fair
& E
xpos
ition
Fun
d$3
,732
$3,7
3202
58N
ursi
ng D
edic
ated
& P
rofe
ssio
nal
$5,7
92$1
,700
,000
$1,7
05,7
9202
59Op
tom
etri
c Lic
ense
. & D
isci
p. B
oard
$1,0
32$1
,032
0261
Unde
rgro
und
Reso
urce
s Con
serv
. En
forc
.$1
,221
$1,2
2102
65St
ate
Rail
Frei
ght L
oan
Repa
ymen
t$6
,434
$6,4
3402
76Dr
unk
& D
rugg
ed D
rivi
ng P
reve
ntio
n$5
,473
$5,4
7302
86IL
Affo
rdab
le H
ousi
ng T
rust
$118
,222
$118
,222
0288
Com
mun
ity W
ater
Sup
ply
Lab
$10,
021
$10,
021
0294
Used
Tir
e M
anag
emen
t$1
7,52
4$1
7,52
402
98N
atur
al A
reas
Acq
uisi
tion
Fund
$15,
501
$65,
600
$81,
101
0299
Open
Spa
ce L
ands
Acq
uis.
& D
evel
.$4
9,10
5$4
9,10
503
01W
orki
ng C
apita
l Rev
olvi
ng$1
26,3
44$1
26,3
4403
03St
ate
Gara
ge R
evol
ving
$92,
513
$92,
513
0304
Stat
istic
al S
ervs
Rev
olvi
ng$1
81,9
49$1
,252
,600
$1,4
34,5
4903
08Pa
per &
Pri
ntin
g Re
volv
ing
$3,6
32$3
,632
0309
Air T
rans
port
atio
n Re
volv
ing
$1,9
69$1
,969
0312
Com
mun
icat
ions
Rev
olvi
ng
$304
,278
$535
,400
$839
,678
FY 2
006
Cons
olid
ated
Ser
vice
s Tr
ansf
ers
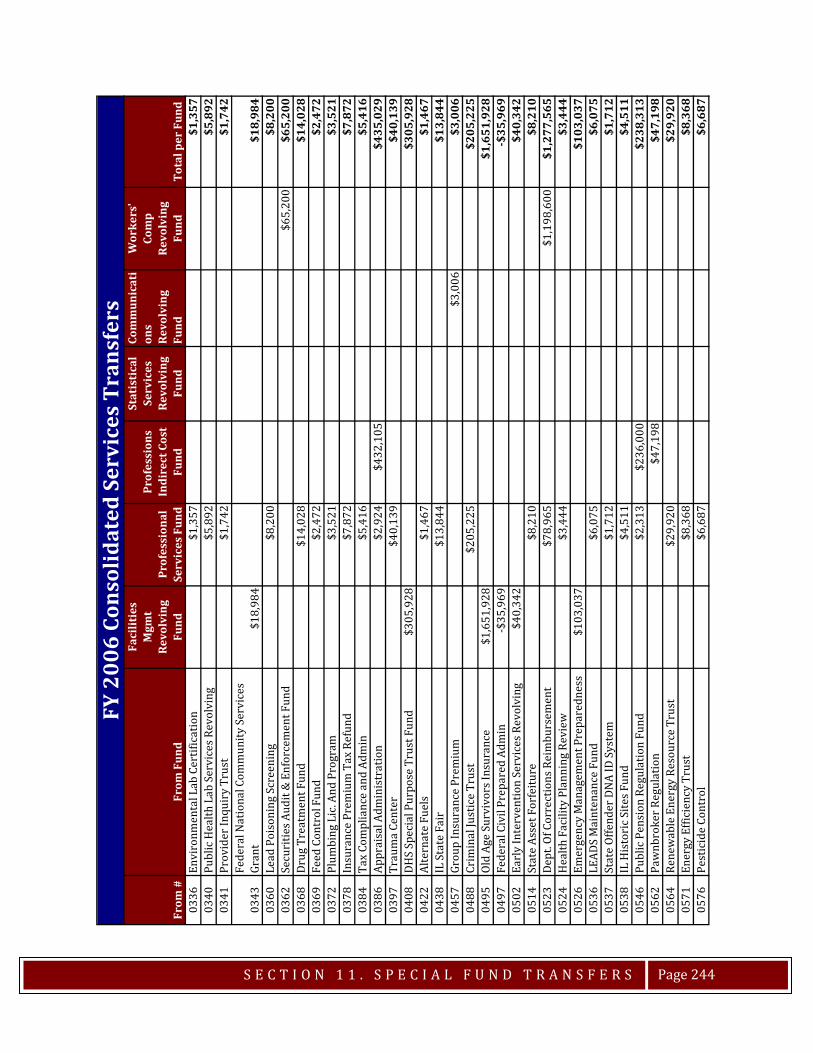
S E C T I O N 1 1 . S P E C I A L F U N D T R A N S F E R S
Page 244
From
#Fr
om F
und
Faci
litie
s M
gmt
Revo
lvin
g Fu
ndPr
ofes
sion
al
Serv
ices
Fun
d
Prof
essi
ons
Indi
rect
Cos
t Fu
nd
Stat
isti
cal
Serv
ices
Re
volv
ing
Fund
Com
mun
icat
ion
s Re
volv
ing
Fund
Wor
kers
' Co
mp
Revo
lvin
g Fu
ndTo
tal p
er F
und
0336
Envi
ronm
enta
l Lab
Cer
tific
atio
n$1
,357
$1,3
5703
40Pu
blic
Hea
lth L
ab S
ervi
ces R
evol
ving
$5,8
92$5
,892
0341
Prov
ider
Inqu
iry
Trus
t$1
,742
$1,7
42
0343
Fede
ral N
atio
nal C
omm
unity
Ser
vice
s Gr
ant
$18,
984
$18,
984
0360
Lead
Poi
soni
ng S
cree
ning
$8,2
00$8
,200
0362
Secu
ritie
s Aud
it &
Enf
orce
men
t Fun
d$6
5,20
0$6
5,20
003
68Dr
ug T
reat
men
t Fun
d$1
4,02
8$1
4,02
803
69Fe
ed C
ontr
ol F
und
$2,4
72$2
,472
0372
Plum
bing
Lic
. And
Pro
gram
$3,5
21$3
,521
0378
Insu
ranc
e Pr
emiu
m T
ax R
efun
d$7
,872
$7,8
7203
84Ta
x Co
mpl
ianc
e an
d Ad
min
$5,4
16$5
,416
0386
Appr
aisa
l Adm
inis
trat
ion
$2,9
24$4
32,1
05$4
35,0
2903
97Tr
aum
a Ce
nter
$40,
139
$40,
139
0408
DHS
Spec
ial P
urpo
se T
rust
Fun
d$3
05,9
28$3
05,9
2804
22Al
tern
ate
Fuel
s$1
,467
$1,4
6704
38IL
Sta
te F
air
$13,
844
$13,
844
0457
Grou
p In
sura
nce
Prem
ium
$3,0
06$3
,006
0488
Crim
inal
Just
ice
Trus
t$2
05,2
25$2
05,2
2504
95Ol
d Ag
e Su
rviv
ors I
nsur
ance
$1,6
51,9
28$1
,651
,928
0497
Fede
ral C
ivil
Prep
ared
Adm
in-$
35,9
69-$
35,9
6905
02Ea
rly
Inte
rven
tion
Serv
ices
Rev
olvi
ng$4
0,34
2$4
0,34
205
14St
ate
Asse
t For
feitu
re$8
,210
$8,2
1005
23De
pt. O
f Cor
rect
ions
Rei
mbu
rsem
ent
$78,
965
$1,1
98,6
00$1
,277
,565
0524
Hea
lth F
acili
ty P
lann
ing
Revi
ew$3
,444
$3,4
4405
26Em
erge
ncy
Man
agem
ent P
repa
redn
ess
$103
,037
$103
,037
0536
LEAD
S M
aint
enan
ce F
und
$6,0
75$6
,075
0537
Stat
e Of
fend
er D
NA
ID S
yste
m
$1,7
12$1
,712
0538
IL H
isto
ric S
ites F
und
$4,5
11$4
,511
0546
Publ
ic P
ensi
on R
egul
atio
n Fu
nd$2
,313
$236
,000
$238
,313
0562
Paw
nbro
ker R
egul
atio
n$4
7,19
8$4
7,19
805
64Re
new
able
Ene
rgy
Reso
urce
Tru
st$2
9,92
0$2
9,92
005
71En
ergy
Effi
cien
cy T
rust
$8,3
68$8
,368
0576
Pest
icid
e Co
ntro
l$6
,687
$6,6
87
FY 2
006
Cons
olid
ated
Ser
vice
s Tr
ansf
ers
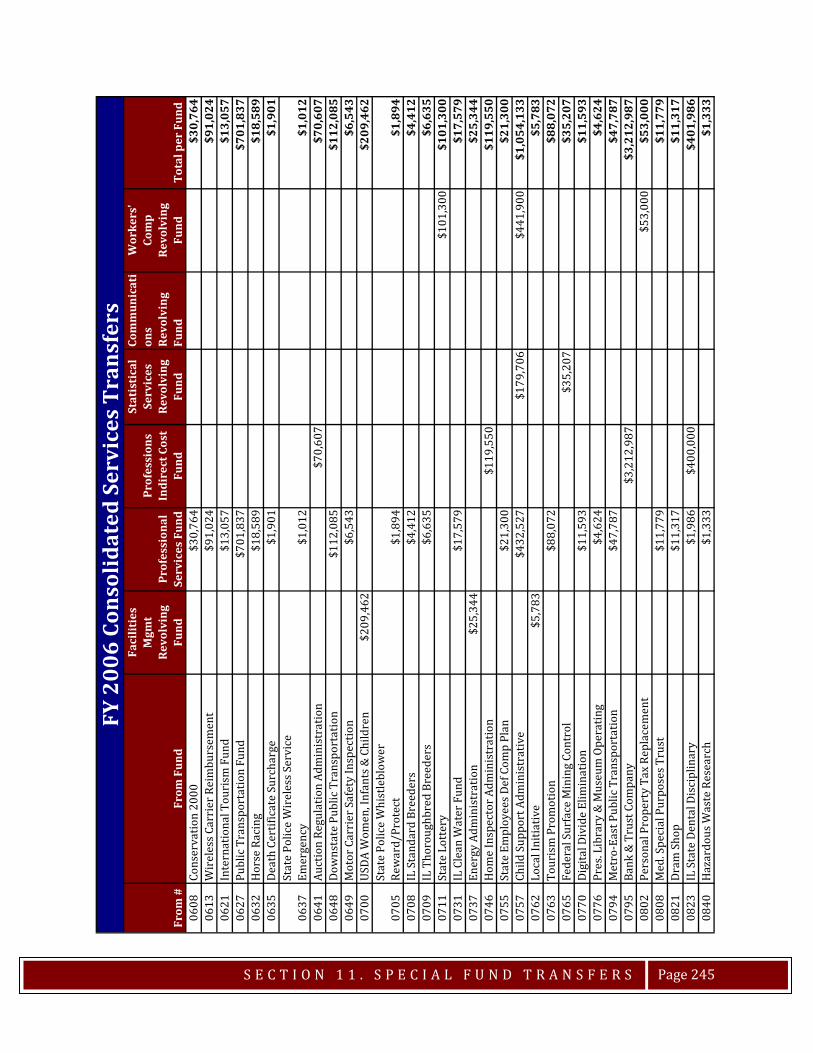
S E C T I O N 1 1 . S P E C I A L F U N D T R A N S F E R S
Page 245
From
#Fr
om F
und
Faci
litie
s M
gmt
Revo
lvin
g Fu
ndPr
ofes
sion
al
Serv
ices
Fun
d
Prof
essi
ons
Indi
rect
Cos
t Fu
nd
Stat
isti
cal
Serv
ices
Re
volv
ing
Fund
Com
mun
icat
ion
s Re
volv
ing
Fund
Wor
kers
' Co
mp
Revo
lvin
g Fu
ndTo
tal p
er F
und
0608
Cons
erva
tion
2000
$30,
764
$30,
764
0613
Wir
eles
s Car
rier
Rei
mbu
rsem
ent
$91,
024
$91,
024
0621
Inte
rnat
iona
l Tou
rism
Fun
d$1
3,05
7$1
3,05
706
27Pu
blic
Tra
nspo
rtat
ion
Fund
$701
,837
$701
,837
0632
Hor
se R
acin
g$1
8,58
9$1
8,58
906
35De
ath
Cert
ifica
te S
urch
arge
$1,9
01$1
,901
0637
Stat
e Po
lice
Wir
eles
s Ser
vice
Em
erge
ncy
$1,0
12$1
,012
0641
Auct
ion
Regu
latio
n Ad
min
istr
atio
n$7
0,60
7$7
0,60
706
48Do
wns
tate
Pub
lic T
rans
port
atio
n$1
12,0
85$1
12,0
8506
49M
otor
Car
rier
Saf
ety
Insp
ectio
n$6
,543
$6,5
4307
00US
DA W
omen
, Inf
ants
& C
hild
ren
$209
,462
$209
,462
0705
Stat
e Po
lice
Whi
stle
blow
er
Rew
ard/
Prot
ect
$1,8
94$1
,894
0708
IL S
tand
ard
Bree
ders
$4,4
12$4
,412
0709
IL T
horo
ughb
red
Bree
ders
$6,6
35$6
,635
0711
Stat
e Lo
tter
y$1
01,3
00$1
01,3
0007
31IL
Cle
an W
ater
Fun
d$1
7,57
9$1
7,57
907
37En
ergy
Adm
inis
trat
ion
$25,
344
$25,
344
0746
Hom
e In
spec
tor A
dmin
istr
atio
n$1
19,5
50$1
19,5
5007
55St
ate
Empl
oyee
s Def
Com
p Pl
an$2
1,30
0$2
1,30
007
57Ch
ild S
uppo
rt A
dmin
istr
ativ
e$4
32,5
27$1
79,7
06$4
41,9
00$1
,054
,133
0762
Loca
l Ini
tiativ
e$5
,783
$5,7
8307
63To
uris
m P
rom
otio
n$8
8,07
2$8
8,07
207
65Fe
dera
l Sur
face
Min
ing
Cont
rol
$35,
207
$35,
207
0770
Digi
tal D
ivid
e El
imin
atio
n$1
1,59
3$1
1,59
307
76Pr
es. L
ibra
ry &
Mus
eum
Ope
ratin
g$4
,624
$4,6
2407
94M
etro
-Eas
t Pub
lic T
rans
port
atio
n$4
7,78
7$4
7,78
707
95Ba
nk &
Tru
st C
ompa
ny$3
,212
,987
$3,2
12,9
8708
02Pe
rson
al P
rope
rty
Tax
Repl
acem
ent
$53,
000
$53,
000
0808
Med
. Spe
cial
Pur
pose
s Tru
st$1
1,77
9$1
1,77
908
21Dr
am S
hop
$11,
317
$11,
317
0823
IL S
tate
Den
tal D
isci
plin
ary
$1,9
86$4
00,0
00$4
01,9
8608
40H
azar
dous
Was
te R
esea
rch
$1,3
33$1
,333
FY 2
006
Cons
olid
ated
Ser
vice
s Tr
ansf
ers
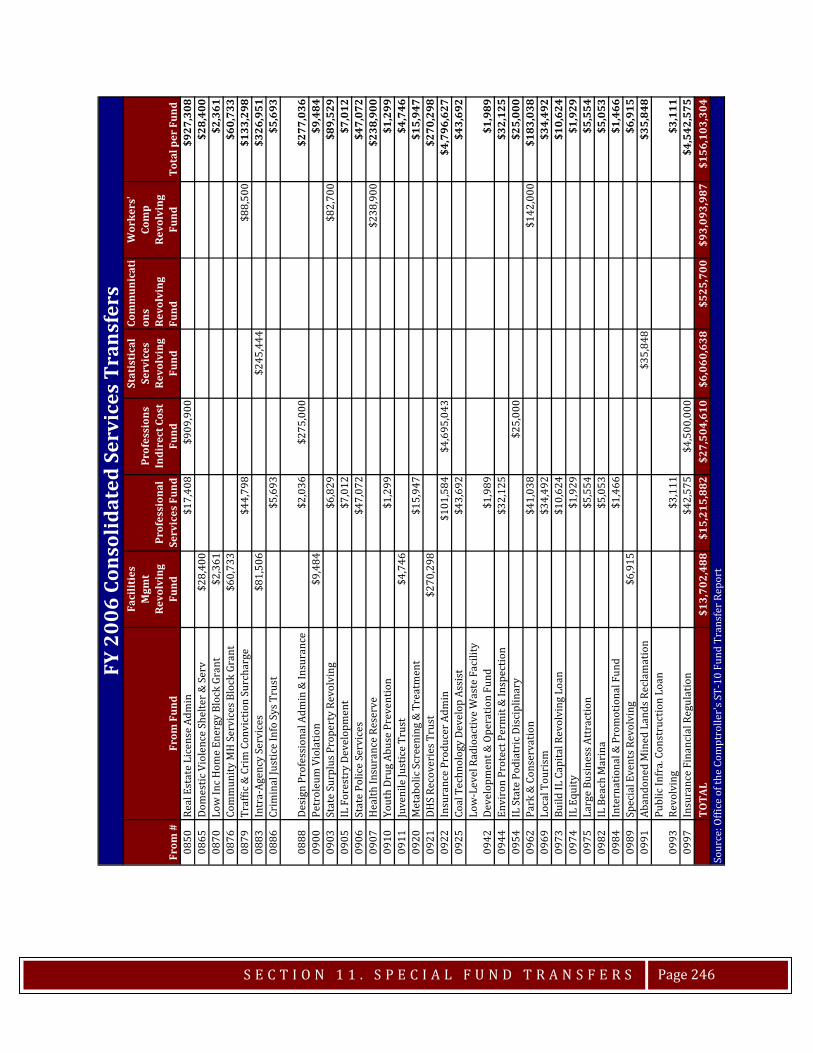
S E C T I O N 1 1 . S P E C I A L F U N D T R A N S F E R S
Page 246
From
#Fr
om F
und
Faci
litie
s M
gmt
Revo
lvin
g Fu
ndPr
ofes
sion
al
Serv
ices
Fun
d
Prof
essi
ons
Indi
rect
Cos
t Fu
nd
Stat
isti
cal
Serv
ices
Re
volv
ing
Fund
Com
mun
icat
ion
s Re
volv
ing
Fund
Wor
kers
' Co
mp
Revo
lvin
g Fu
ndTo
tal p
er F
und
0850
Real
Est
ate
Lice
nse
Adm
in$1
7,40
8$9
09,9
00$9
27,3
0808
65Do
mes
tic V
iole
nce
Shel
ter &
Ser
v$2
8,40
0$2
8,40
008
70Lo
w In
c Hom
e En
ergy
Blo
ck G
rant
$2,3
61$2
,361
0876
Com
mun
ity M
H S
ervi
ces B
lock
Gra
nt$6
0,73
3$6
0,73
308
79Tr
affic
& C
rim
Con
vict
ion
Surc
harg
e$4
4,79
8$8
8,50
0$1
33,2
9808
83In
tra-
Agen
cy S
ervi
ces
$81,
506
$245
,444
$326
,951
0886
Crim
inal
Just
ice
Info
Sys
Tru
st$5
,693
$5,6
93
0888
Desi
gn P
rofe
ssio
nal A
dmin
& In
sura
nce
$2,0
36$2
75,0
00$2
77,0
3609
00Pe
trol
eum
Vio
latio
n$9
,484
$9,4
8409
03St
ate
Surp
lus P
rope
rty
Revo
lvin
g$6
,829
$82,
700
$89,
529
0905
IL F
ores
try
Deve
lopm
ent
$7,0
12$7
,012
0906
Stat
e Po
lice
Serv
ices
$47,
072
$47,
072
0907
Hea
lth In
sura
nce
Rese
rve
$238
,900
$238
,900
0910
Yout
h Dr
ug A
buse
Pre
vent
ion
$1,2
99$1
,299
0911
Juve
nile
Just
ice
Trus
t$4
,746
$4,7
4609
20M
etab
olic
Scr
eeni
ng &
Tre
atm
ent
$15,
947
$15,
947
0921
DHS
Reco
veri
es T
rust
$270
,298
$270
,298
0922
Insu
ranc
e Pr
oduc
er A
dmin
$101
,584
$4,6
95,0
43$4
,796
,627
0925
Coal
Tec
hnol
ogy
Deve
lop
Assi
st$4
3,69
2$4
3,69
2
0942
Low
-Lev
el R
adio
activ
e W
aste
Fac
ility
De
velo
pmen
t & O
pera
tion
Fund
$1,9
89$1
,989
0944
Envi
ron
Prot
ect P
erm
it &
Insp
ectio
n$3
2,12
5$3
2,12
509
54IL
Sta
te P
odia
tric
Dis
cipl
inar
y$2
5,00
0$2
5,00
009
62Pa
rk &
Con
serv
atio
n$4
1,03
8$1
42,0
00$1
83,0
3809
69Lo
cal T
ouri
sm$3
4,49
2$3
4,49
209
73Bu
ild IL
Cap
ital R
evol
ving
Loa
n$1
0,62
4$1
0,62
409
74IL
Equ
ity$1
,929
$1,9
2909
75La
rge
Busi
ness
Att
ract
ion
$5,5
54$5
,554
0982
IL B
each
Mar
ina
$5,0
53$5
,053
0984
Inte
rnat
iona
l & P
rom
otio
nal F
und
$1,4
66$1
,466
0989
Spec
ial E
vent
s Rev
olvi
ng$6
,915
$6,9
1509
91Ab
ando
ned
Min
ed L
ands
Rec
lam
atio
n$3
5,84
8$3
5,84
8
0993
Publ
ic In
fra.
Con
stru
ctio
n Lo
an
Revo
lvin
g$3
,111
$3,1
1109
97In
sura
nce
Fina
ncia
l Reg
ulat
ion
$42,
575
$4,5
00,0
00$4
,542
,575
TOTA
L$1
3,70
2,48
8$1
5,21
5,88
2$2
7,50
4,61
0$6
,060
,638
$525
,700
$93,
093,
987
$156
,103
,304
FY 2
006
Cons
olid
ated
Ser
vice
s Tr
ansf
ers
Sour
ce: O
ffice
of t
he C
ompt
rolle
r's S
T-10
Fun
d Tr
ansf
er R
epor
t
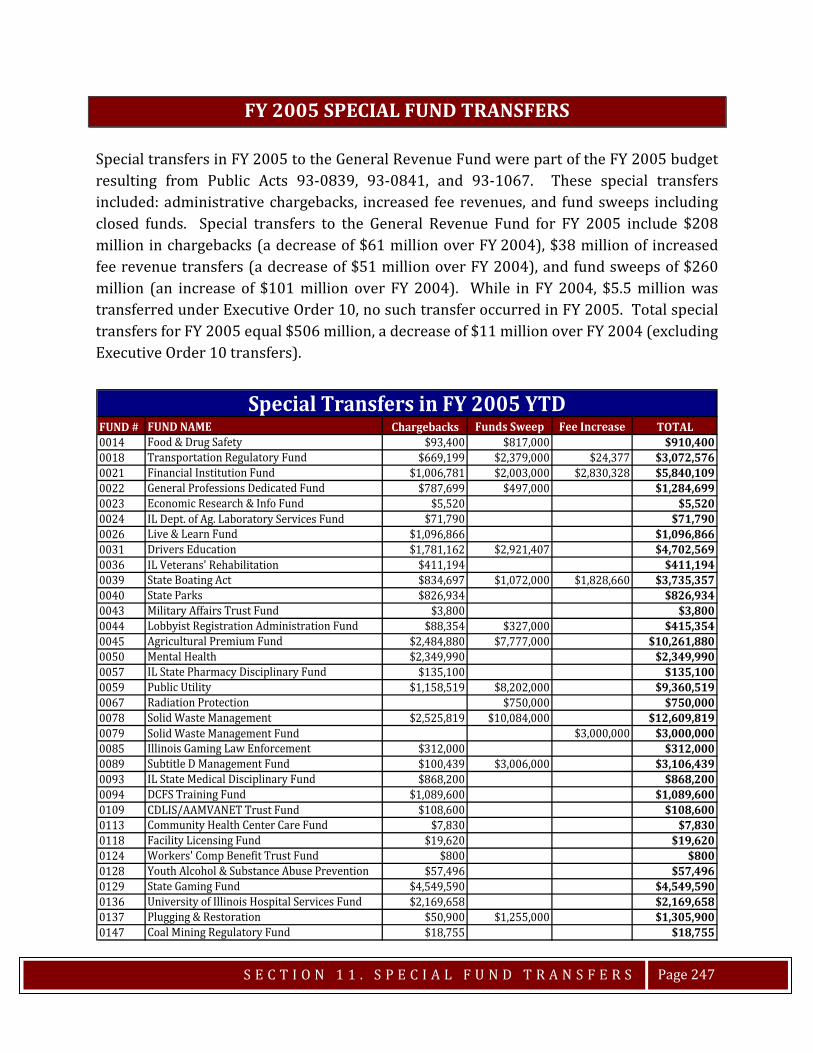
S E C T I O N 1 1 . S P E C I A L F U N D T R A N S F E R S
Page 247
FY 2005 SPECIAL FUND TRANSFERS Special transfers in FY 2005 to the General Revenue Fund were part of the FY 2005 budget resulting from Public Acts 93-0839, 93-0841, and 93-1067. These special transfers included: administrative chargebacks, increased fee revenues, and fund sweeps including closed funds. Special transfers to the General Revenue Fund for FY 2005 include $208 million in chargebacks (a decrease of $61 million over FY 2004), $38 million of increased fee revenue transfers (a decrease of $51 million over FY 2004), and fund sweeps of $260 million (an increase of $101 million over FY 2004). While in FY 2004, $5.5 million was transferred under Executive Order 10, no such transfer occurred in FY 2005. Total special transfers for FY 2005 equal $506 million, a decrease of $11 million over FY 2004 (excluding Executive Order 10 transfers).
FUND # FUND NAME Chargebacks Funds Sweep Fee Increase TOTAL0014 Food & Drug Safety $93,400 $817,000 $910,4000018 Transportation Regulatory Fund $669,199 $2,379,000 $24,377 $3,072,5760021 Financial Institution Fund $1,006,781 $2,003,000 $2,830,328 $5,840,1090022 General Professions Dedicated Fund $787,699 $497,000 $1,284,6990023 Economic Research & Info Fund $5,520 $5,5200024 IL Dept. of Ag. Laboratory Services Fund $71,790 $71,7900026 Live & Learn Fund $1,096,866 $1,096,8660031 Drivers Education $1,781,162 $2,921,407 $4,702,5690036 IL Veterans' Rehabilitation $411,194 $411,1940039 State Boating Act $834,697 $1,072,000 $1,828,660 $3,735,3570040 State Parks $826,934 $826,9340043 Military Affairs Trust Fund $3,800 $3,8000044 Lobbyist Registration Administration Fund $88,354 $327,000 $415,3540045 Agricultural Premium Fund $2,484,880 $7,777,000 $10,261,8800050 Mental Health $2,349,990 $2,349,9900057 IL State Pharmacy Disciplinary Fund $135,100 $135,1000059 Public Utility $1,158,519 $8,202,000 $9,360,5190067 Radiation Protection $750,000 $750,0000078 Solid Waste Management $2,525,819 $10,084,000 $12,609,8190079 Solid Waste Management Fund $3,000,000 $3,000,0000085 Illinois Gaming Law Enforcement $312,000 $312,0000089 Subtitle D Management Fund $100,439 $3,006,000 $3,106,4390093 IL State Medical Disciplinary Fund $868,200 $868,2000094 DCFS Training Fund $1,089,600 $1,089,6000109 CDLIS/AAMVANET Trust Fund $108,600 $108,6000113 Community Health Center Care Fund $7,830 $7,8300118 Facility Licensing Fund $19,620 $19,6200124 Workers' Comp Benefit Trust Fund $800 $8000128 Youth Alcohol & Substance Abuse Prevention $57,496 $57,4960129 State Gaming Fund $4,549,590 $4,549,5900136 University of Illinois Hospital Services Fund $2,169,658 $2,169,6580137 Plugging & Restoration $50,900 $1,255,000 $1,305,9000147 Coal Mining Regulatory Fund $18,755 $18,755
Special Transfers in FY 2005 YTD
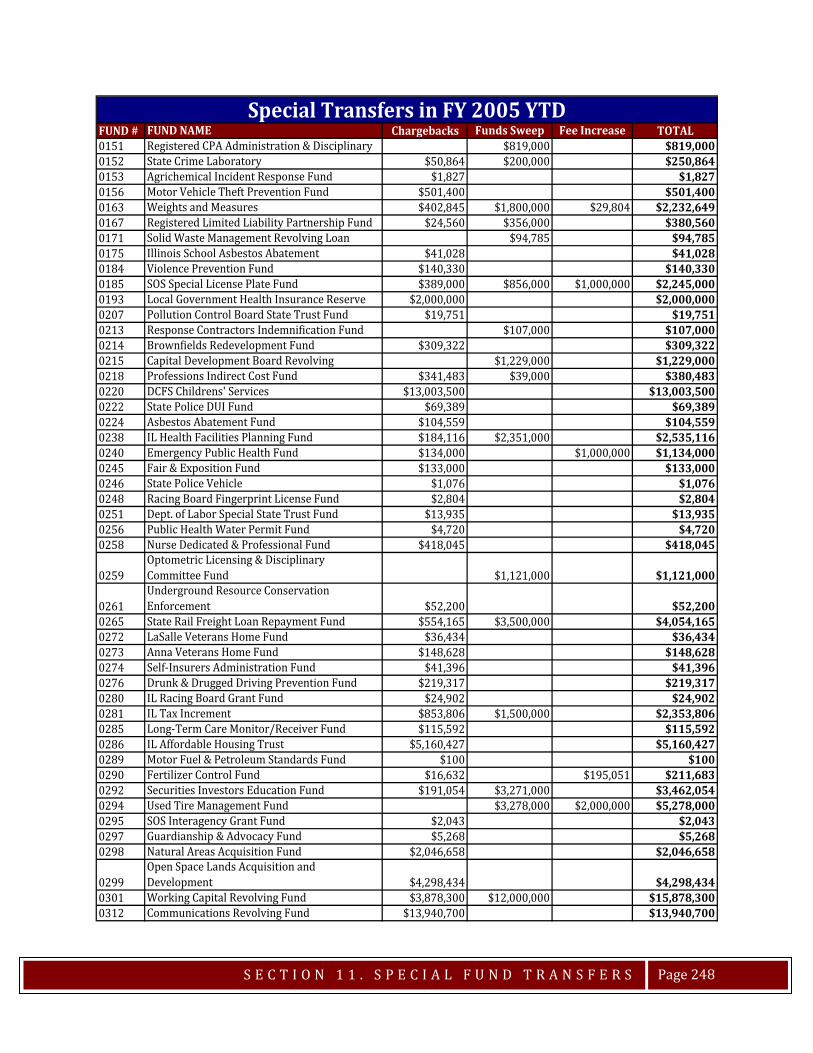
S E C T I O N 1 1 . S P E C I A L F U N D T R A N S F E R S
Page 248
FUND # FUND NAME Chargebacks Funds Sweep Fee Increase TOTAL0151 Registered CPA Administration & Disciplinary $819,000 $819,0000152 State Crime Laboratory $50,864 $200,000 $250,8640153 Agrichemical Incident Response Fund $1,827 $1,8270156 Motor Vehicle Theft Prevention Fund $501,400 $501,4000163 Weights and Measures $402,845 $1,800,000 $29,804 $2,232,6490167 Registered Limited Liability Partnership Fund $24,560 $356,000 $380,5600171 Solid Waste Management Revolving Loan $94,785 $94,7850175 Illinois School Asbestos Abatement $41,028 $41,0280184 Violence Prevention Fund $140,330 $140,3300185 SOS Special License Plate Fund $389,000 $856,000 $1,000,000 $2,245,0000193 Local Government Health Insurance Reserve $2,000,000 $2,000,0000207 Pollution Control Board State Trust Fund $19,751 $19,7510213 Response Contractors Indemnification Fund $107,000 $107,0000214 Brownfields Redevelopment Fund $309,322 $309,3220215 Capital Development Board Revolving $1,229,000 $1,229,0000218 Professions Indirect Cost Fund $341,483 $39,000 $380,4830220 DCFS Childrens' Services $13,003,500 $13,003,5000222 State Police DUI Fund $69,389 $69,3890224 Asbestos Abatement Fund $104,559 $104,5590238 IL Health Facilities Planning Fund $184,116 $2,351,000 $2,535,1160240 Emergency Public Health Fund $134,000 $1,000,000 $1,134,0000245 Fair & Exposition Fund $133,000 $133,0000246 State Police Vehicle $1,076 $1,0760248 Racing Board Fingerprint License Fund $2,804 $2,8040251 Dept. of Labor Special State Trust Fund $13,935 $13,9350256 Public Health Water Permit Fund $4,720 $4,7200258 Nurse Dedicated & Professional Fund $418,045 $418,045
0259Optometric Licensing & Disciplinary Committee Fund $1,121,000 $1,121,000
0261Underground Resource Conservation Enforcement $52,200 $52,200
0265 State Rail Freight Loan Repayment Fund $554,165 $3,500,000 $4,054,1650272 LaSalle Veterans Home Fund $36,434 $36,4340273 Anna Veterans Home Fund $148,628 $148,6280274 Self-Insurers Administration Fund $41,396 $41,3960276 Drunk & Drugged Driving Prevention Fund $219,317 $219,3170280 IL Racing Board Grant Fund $24,902 $24,9020281 IL Tax Increment $853,806 $1,500,000 $2,353,8060285 Long-Term Care Monitor/Receiver Fund $115,592 $115,5920286 IL Affordable Housing Trust $5,160,427 $5,160,4270289 Motor Fuel & Petroleum Standards Fund $100 $1000290 Fertilizer Control Fund $16,632 $195,051 $211,6830292 Securities Investors Education Fund $191,054 $3,271,000 $3,462,0540294 Used Tire Management Fund $3,278,000 $2,000,000 $5,278,0000295 SOS Interagency Grant Fund $2,043 $2,0430297 Guardianship & Advocacy Fund $5,268 $5,2680298 Natural Areas Acquisition Fund $2,046,658 $2,046,658
0299Open Space Lands Acquisition and Development $4,298,434 $4,298,434
0301 Working Capital Revolving Fund $3,878,300 $12,000,000 $15,878,3000312 Communications Revolving Fund $13,940,700 $13,940,700
Special Transfers in FY 2005 YTD
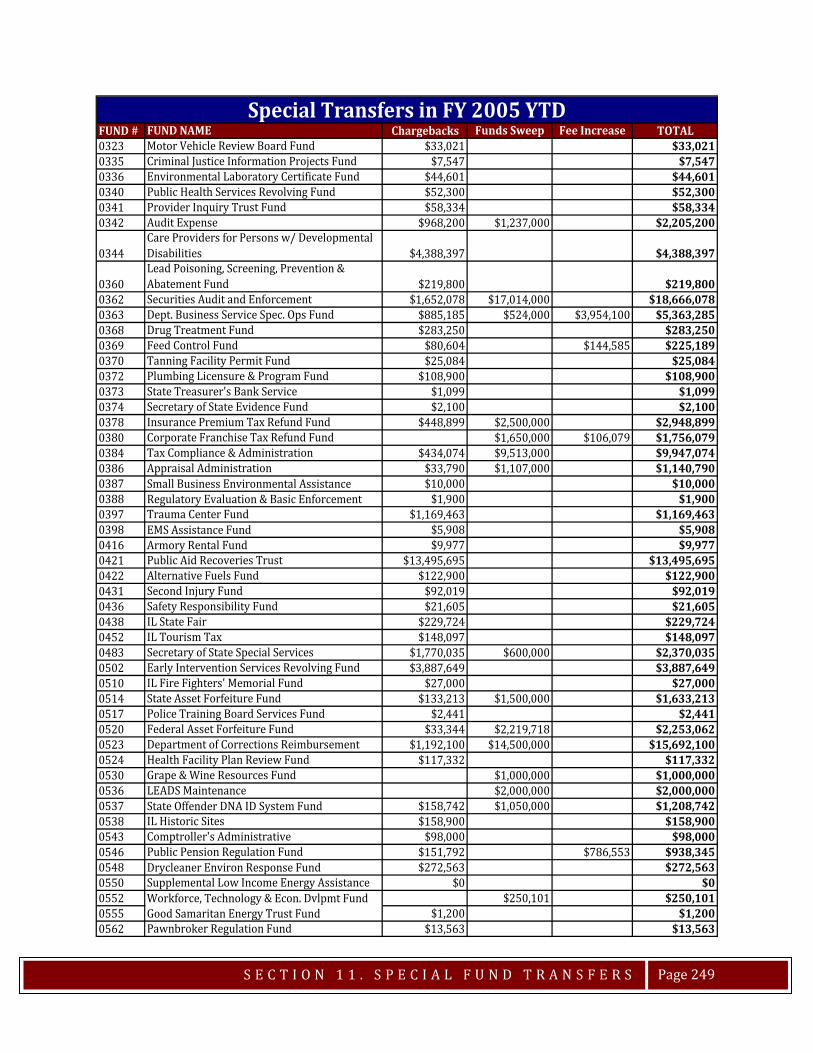
S E C T I O N 1 1 . S P E C I A L F U N D T R A N S F E R S
Page 249
FUND # FUND NAME Chargebacks Funds Sweep Fee Increase TOTAL0323 Motor Vehicle Review Board Fund $33,021 $33,0210335 Criminal Justice Information Projects Fund $7,547 $7,5470336 Environmental Laboratory Certificate Fund $44,601 $44,6010340 Public Health Services Revolving Fund $52,300 $52,3000341 Provider Inquiry Trust Fund $58,334 $58,3340342 Audit Expense $968,200 $1,237,000 $2,205,200
0344Care Providers for Persons w/ Developmental Disabilities $4,388,397 $4,388,397
0360Lead Poisoning, Screening, Prevention & Abatement Fund $219,800 $219,800
0362 Securities Audit and Enforcement $1,652,078 $17,014,000 $18,666,0780363 Dept. Business Service Spec. Ops Fund $885,185 $524,000 $3,954,100 $5,363,2850368 Drug Treatment Fund $283,250 $283,2500369 Feed Control Fund $80,604 $144,585 $225,1890370 Tanning Facility Permit Fund $25,084 $25,0840372 Plumbing Licensure & Program Fund $108,900 $108,9000373 State Treasurer's Bank Service $1,099 $1,0990374 Secretary of State Evidence Fund $2,100 $2,1000378 Insurance Premium Tax Refund Fund $448,899 $2,500,000 $2,948,8990380 Corporate Franchise Tax Refund Fund $1,650,000 $106,079 $1,756,0790384 Tax Compliance & Administration $434,074 $9,513,000 $9,947,0740386 Appraisal Administration $33,790 $1,107,000 $1,140,7900387 Small Business Environmental Assistance $10,000 $10,0000388 Regulatory Evaluation & Basic Enforcement $1,900 $1,9000397 Trauma Center Fund $1,169,463 $1,169,4630398 EMS Assistance Fund $5,908 $5,9080416 Armory Rental Fund $9,977 $9,9770421 Public Aid Recoveries Trust $13,495,695 $13,495,6950422 Alternative Fuels Fund $122,900 $122,9000431 Second Injury Fund $92,019 $92,0190436 Safety Responsibility Fund $21,605 $21,6050438 IL State Fair $229,724 $229,7240452 IL Tourism Tax $148,097 $148,0970483 Secretary of State Special Services $1,770,035 $600,000 $2,370,0350502 Early Intervention Services Revolving Fund $3,887,649 $3,887,6490510 IL Fire Fighters' Memorial Fund $27,000 $27,0000514 State Asset Forfeiture Fund $133,213 $1,500,000 $1,633,2130517 Police Training Board Services Fund $2,441 $2,4410520 Federal Asset Forfeiture Fund $33,344 $2,219,718 $2,253,0620523 Department of Corrections Reimbursement $1,192,100 $14,500,000 $15,692,1000524 Health Facility Plan Review Fund $117,332 $117,3320530 Grape & Wine Resources Fund $1,000,000 $1,000,0000536 LEADS Maintenance $2,000,000 $2,000,0000537 State Offender DNA ID System Fund $158,742 $1,050,000 $1,208,7420538 IL Historic Sites $158,900 $158,9000543 Comptroller's Administrative $98,000 $98,0000546 Public Pension Regulation Fund $151,792 $786,553 $938,3450548 Drycleaner Environ Response Fund $272,563 $272,5630550 Supplemental Low Income Energy Assistance $0 $00552 Workforce, Technology & Econ. Dvlpmt Fund $250,101 $250,1010555 Good Samaritan Energy Trust Fund $1,200 $1,2000562 Pawnbroker Regulation Fund $13,563 $13,563
Special Transfers in FY 2005 YTD

S E C T I O N 1 1 . S P E C I A L F U N D T R A N S F E R S
Page 250
FUND # FUND NAME Chargebacks Funds Sweep Fee Increase TOTAL0564 Renewable Energy Resources Trust Fund $44,947 $5,932,847 $5,977,7940569 School Technology Revolving Loan fund $586,020 $586,0200571 Energy Efficiency Trust Fund $431,391 $3,040,000 $3,471,3910573 Petroleum Resources Revolving Fund $33,700 $33,7000576 Pesticide Control $38,899 $633,475 $672,3740589 Transportation Safety Highway Hire-Back $3,362 $3,3620608 Conservation 2000 $7,439,000 $7,439,0000612 Wireless Service Emergency Fund $253,973 $253,9730621 International Tourism Fund $1,146,682 $1,146,6820622 Motor Vehicle License Plate Fund $1,028,100 $1,028,1000629 Real Estate Recovery Fund $1,000 $1,0000632 Horse Racing $2,500,000 $2,500,0000634 IL Aquaculture Develop Fund $1,067,020 $1,067,0200635 Death Certificate Surcharge $134,756 $134,7560637 State Police Wireless Service Emergency Fund $169,741 $700,000 $869,7410641 Auction Regulation Administration $4,210 $4,2100642 DHS State Projects Fund $211,424 $211,4240643 Auction Recovery Fund $100 $1000648 Downstate Public Transportation $5,200,467 $5,200,4670649 Motor Carrier Safety Inspection $217,277 $217,2770650 Municipal Economic Development Fund $14,796 $14,7960664 Student Loan Operation Fund $6,307,918 $6,307,9180669 Airport Land Loan Revolving Fund $212 $2120685 Rate Adjustment $11,600 $11,6000702 Assisted Living & Shared Housing Regulatory $4,000 $4,0000703 State Whistleblower Reward & Protection $750,000 $750,0000705 Whistleblower Reward & Protection Fund $120,102 $500,000 $620,1020708 IL Standardbred Breeders Fund $167,487 $167,4870709 IL Thoroughbred Breeders Fund $192,600 $192,6000712 Post Transplant Maintenance Fund $300 $3000714 Spinal Cord Injury Paralysis Fund $9,400 $9,4000720 Family Care Fund $164,964 $164,9640728 Drug Rebate Fund $6,757,347 $6,757,3470731 IL Clean Water Fund $1,495,100 $11,000,000 $12,495,1000732 SOS DUI Administration Fund $167,699 $582,000 $749,6990733 Tobacco Settlement Recovery $23,984,800 $19,300,000 $43,284,8000738 Alternative Compliance Market Account $3,879 $3,8790740 Medicaid Buy In Program Revolving Fund $33,109 $33,1090743 Statewide Economic Development Fund $4,329,246 $4,329,2460746 Home Inspector Administration $39,400 $39,4000758 Secretary of State Police DUI Fund $2,400 $2,4000759 Secretary of State Police Services Fund $3,600 $3,6000763 Tourism Promotion $5,751,567 $5,751,5670770 Digital Divide Elimination Fund $405,223 $405,223
0771Digital Divide Elimination Infrastructure (No. Approp) $800,000 $800,000
0776 Presidential Library and Museum Fund $500,000 $500,0000782 State Parking Facility Maintenance Fund $3,900 $3,9000795 Bank & Trust Company $1,204,710 $1,204,7100808 Medical Special Purpose Trust Fund $641,629 $967,000 $1,608,6290821 Dram Shop $215,839 $1,517,000 $981,000 $2,713,8390823 IL State Dental Disciplinary Fund $235,500 $235,500
Special Transfers in FY 2005 YTD
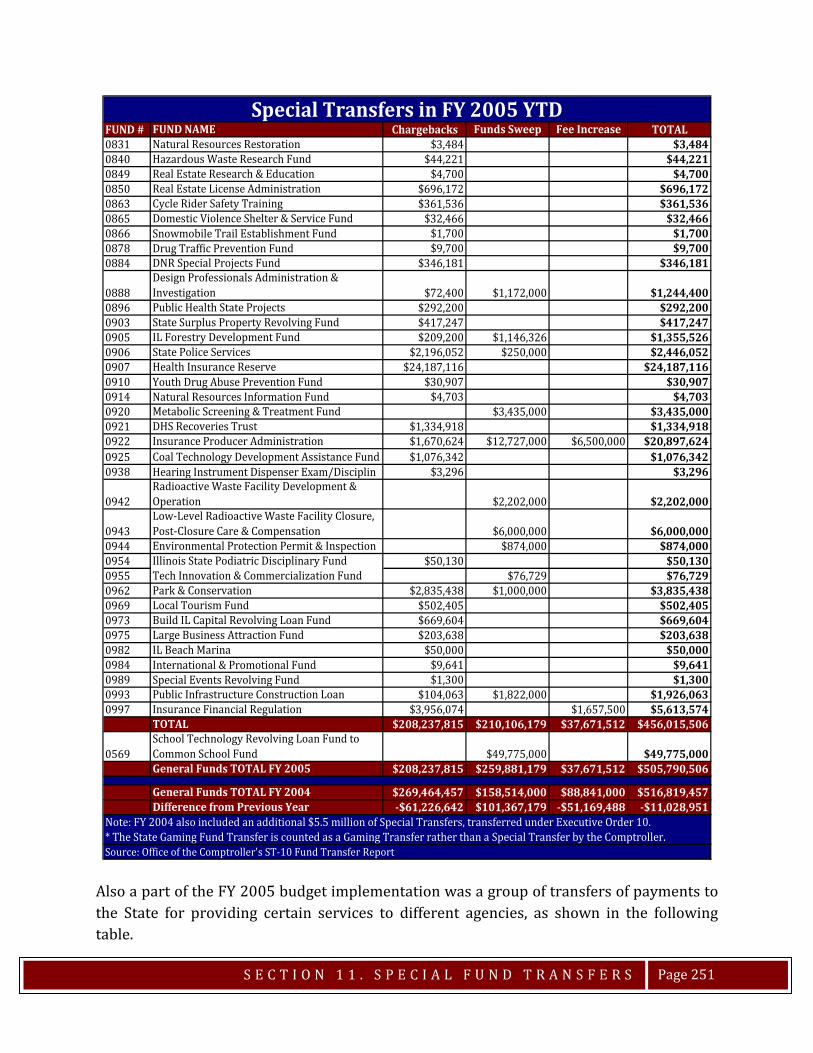
S E C T I O N 1 1 . S P E C I A L F U N D T R A N S F E R S
Page 251
Also a part of the FY 2005 budget implementation was a group of transfers of payments to the State for providing certain services to different agencies, as shown in the following table.
FUND # FUND NAME Chargebacks Funds Sweep Fee Increase TOTAL0831 Natural Resources Restoration $3,484 $3,4840840 Hazardous Waste Research Fund $44,221 $44,2210849 Real Estate Research & Education $4,700 $4,7000850 Real Estate License Administration $696,172 $696,1720863 Cycle Rider Safety Training $361,536 $361,5360865 Domestic Violence Shelter & Service Fund $32,466 $32,4660866 Snowmobile Trail Establishment Fund $1,700 $1,7000878 Drug Traffic Prevention Fund $9,700 $9,7000884 DNR Special Projects Fund $346,181 $346,181
0888Design Professionals Administration & Investigation $72,400 $1,172,000 $1,244,400
0896 Public Health State Projects $292,200 $292,2000903 State Surplus Property Revolving Fund $417,247 $417,2470905 IL Forestry Development Fund $209,200 $1,146,326 $1,355,5260906 State Police Services $2,196,052 $250,000 $2,446,0520907 Health Insurance Reserve $24,187,116 $24,187,1160910 Youth Drug Abuse Prevention Fund $30,907 $30,9070914 Natural Resources Information Fund $4,703 $4,7030920 Metabolic Screening & Treatment Fund $3,435,000 $3,435,0000921 DHS Recoveries Trust $1,334,918 $1,334,9180922 Insurance Producer Administration $1,670,624 $12,727,000 $6,500,000 $20,897,6240925 Coal Technology Development Assistance Fund $1,076,342 $1,076,3420938 Hearing Instrument Dispenser Exam/Disciplin $3,296 $3,296
0942Radioactive Waste Facility Development & Operation $2,202,000 $2,202,000
0943Low-Level Radioactive Waste Facility Closure, Post-Closure Care & Compensation $6,000,000 $6,000,000
0944 Environmental Protection Permit & Inspection $874,000 $874,0000954 Illinois State Podiatric Disciplinary Fund $50,130 $50,1300955 Tech Innovation & Commercialization Fund $76,729 $76,7290962 Park & Conservation $2,835,438 $1,000,000 $3,835,4380969 Local Tourism Fund $502,405 $502,4050973 Build IL Capital Revolving Loan Fund $669,604 $669,6040975 Large Business Attraction Fund $203,638 $203,6380982 IL Beach Marina $50,000 $50,0000984 International & Promotional Fund $9,641 $9,6410989 Special Events Revolving Fund $1,300 $1,3000993 Public Infrastructure Construction Loan $104,063 $1,822,000 $1,926,0630997 Insurance Financial Regulation $3,956,074 $1,657,500 $5,613,574
TOTAL $208,237,815 $210,106,179 $37,671,512 $456,015,506
0569School Technology Revolving Loan Fund to Common School Fund $49,775,000 $49,775,000General Funds TOTAL FY 2005 $208,237,815 $259,881,179 $37,671,512 $505,790,506
General Funds TOTAL FY 2004 $269,464,457 $158,514,000 $88,841,000 $516,819,457Difference from Previous Year -$61,226,642 $101,367,179 -$51,169,488 -$11,028,951
Source: Office of the Comptroller's ST-10 Fund Transfer Report * The State Gaming Fund Transfer is counted as a Gaming Transfer rather than a Special Transfer by the Comptroller.Note: FY 2004 also included an additional $5.5 million of Special Transfers, transferred under Executive Order 10.
Special Transfers in FY 2005 YTD
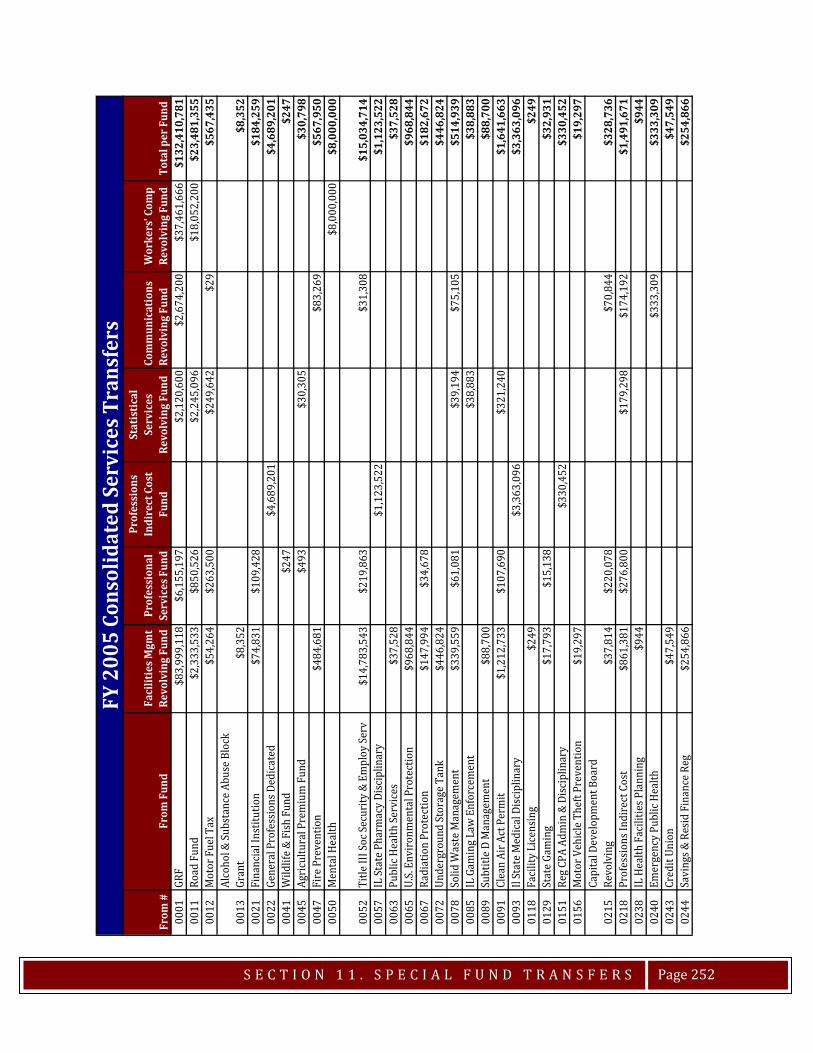
S E C T I O N 1 1 . S P E C I A L F U N D T R A N S F E R S
Page 252
From
#Fr
om F
und
Faci
litie
s Mgm
t Re
volv
ing
Fund
Prof
essi
onal
Se
rvic
es F
und
Prof
essi
ons
Indi
rect
Cos
t Fu
nd
Stat
istic
al
Serv
ices
Re
volv
ing
Fund
Com
mun
icat
ions
Re
volv
ing
Fund
Wor
kers
' Com
p Re
volv
ing
Fund
Tota
l per
Fun
d00
01GR
F$8
3,99
9,11
8$6
,155
,197
$2,1
20,6
00$2
,674
,200
$37,
461,
666
$132
,410
,781
0011
Road
Fun
d$2
,333
,533
$850
,526
$2,2
45,0
96$1
8,05
2,20
0$2
3,48
1,35
500
12M
otor
Fue
l Tax
$54,
264
$263
,500
$249
,642
$29
$567
,435
0013
Alco
hol &
Subs
tanc
e Abu
se B
lock
Gr
ant
$8,3
52$8
,352
0021
Fina
ncia
l Ins
titut
ion
$74,
831
$109
,428
$184
,259
0022
Gene
ral P
rofe
ssio
ns D
edic
ated
$4,6
89,2
01$4
,689
,201
0041
Wild
life &
Fish
Fun
d$2
47$2
4700
45Ag
ricul
tura
l Pre
miu
m F
und
$493
$30,
305
$30,
798
0047
Fire
Pre
vent
ion
$484
,681
$83,
269
$567
,950
0050
Men
tal H
ealth
$8,0
00,0
00$8
,000
,000
0052
Title
III S
oc Se
curit
y &
Empl
oy Se
rv$1
4,78
3,54
3$2
19,8
63$3
1,30
8$1
5,03
4,71
400
57IL
Stat
e Pha
rmac
y Di
scip
linar
y$1
,123
,522
$1,1
23,5
2200
63Pu
blic
Hea
lth Se
rvic
es$3
7,52
8$3
7,52
800
65U.
S. En
viro
nmen
tal P
rote
ctio
n$9
68,8
44$9
68,8
4400
67Ra
diat
ion
Prot
ectio
n$1
47,9
94$3
4,67
8$1
82,6
7200
72Un
derg
roun
d St
orag
e Tan
k$4
46,8
24$4
46,8
2400
78So
lid W
aste
Man
agem
ent
$339
,559
$61,
081
$39,
194
$75,
105
$514
,939
0085
IL G
amin
g Law
Enf
orce
men
t$3
8,88
3$3
8,88
300
89Su
btitl
e D M
anag
emen
t$8
8,70
0$8
8,70
000
91Cl
ean
Air A
ct P
erm
it$1
,212
,733
$107
,690
$321
,240
$1,6
41,6
6300
93Il
Stat
e Med
ical
Disc
iplin
ary
$3,3
63,0
96$3
,363
,096
0118
Faci
lity
Lice
nsin
g$2
49$2
4901
29St
ate G
amin
g$1
7,79
3$1
5,13
8$3
2,93
101
51Re
g CPA
Adm
in &
Disc
iplin
ary
$330
,452
$330
,452
0156
Mot
or V
ehic
le T
heft
Prev
entio
n$1
9,29
7$1
9,29
7
0215
Capi
tal D
evel
opm
ent B
oard
Re
volv
ing
$37,
814
$220
,078
$70,
844
$328
,736
0218
Prof
essio
ns In
dire
ct C
ost
$861
,381
$276
,800
$179
,298
$174
,192
$1,4
91,6
7102
38IL
Hea
lth F
acili
ties P
lann
ing
$944
$944
0240
Emer
genc
y Pu
blic
Hea
lth$3
33,3
09$3
33,3
0902
43Cr
edit
Unio
n$4
7,54
9$4
7,54
902
44Sa
ving
s & R
esid
Fin
ance
Reg
$254
,866
$254
,866
FY 2
005
Cons
olid
ated
Ser
vice
s Tra
nsfe
rs

S E C T I O N 1 1 . S P E C I A L F U N D T R A N S F E R S
Page 253
From
#Fr
om F
und
Faci
litie
s Mgm
t Re
volv
ing
Fund
Prof
essi
onal
Se
rvic
es F
und
Prof
essi
ons
Indi
rect
Cos
t Fu
nd
Stat
istic
al
Serv
ices
Re
volv
ing
Fund
Com
mun
icat
ions
Re
volv
ing
Fund
Wor
kers
' Com
p Re
volv
ing
Fund
Tota
l per
Fun
d
0258
Nurs
ing D
edic
ated
& P
rofe
ssio
nal
$2,4
31,4
41$2
,431
,441
0270
Wat
er R
evol
ving
$605
,700
$10,
862
$88,
225
$704
,787
0281
IL T
ax In
crem
ent
$53,
304
$53,
304
0288
Com
mun
ity W
ater
Supp
ly L
ab$1
53,5
70$1
53,5
7002
94Us
ed T
ire M
anag
emen
t$1
17,0
00$4
7,52
3$1
64,5
2302
97Gu
ardi
ansh
ip &
Adv
ocac
y$1
,068
$1,0
6803
03St
ate G
arag
e Rev
olvi
ng$5
78,0
06$5
78,0
0603
04St
atist
ical
Serv
s Rev
olvi
ng$2
,350
,370
$127
,033
$2,4
77,4
0303
12Co
mm
unic
atio
ns R
evol
ving
$1
,535
,722
$1,5
35,7
2203
60Le
ad P
oiso
ning
Scre
enin
g$7
1,66
0$7
1,66
003
72Pl
umbi
ng L
icen
sure
& P
rogr
am$2
1,81
8$2
1,81
803
86Ap
prai
sal A
dmin
istra
tion
$33,
995
$84,
552
$118
,547
0421
Publ
ic A
id R
ecov
erie
s Tru
st$8
49,8
99$8
49,8
9904
88Cr
imin
al Ju
stic
e Tru
st$6
7,97
7$9
2,40
1$1
60,3
7804
97Fe
dera
l Civ
il Pr
epar
ed A
dmin
$38,
791
$50,
024
$88,
815
0514
Stat
e Ass
et F
orfe
iture
$250
,000
$250
,000
0523
Dept
. Of C
orre
ctio
ns R
eim
burs
emen
t$4
,710
,201
$4,7
10,2
0105
24He
alth
Fac
ility
Pla
nnin
g Rev
iew
$441
$441
0526
Emer
genc
y M
anag
emen
t Pr
epar
edne
ss$2
42,8
62$2
42,8
6205
50Su
pple
men
tal L
ow In
com
e Ene
rgy
$37,
857
$37,
857
0562
Paw
nbro
ker R
egul
atio
n$6
,684
$6,6
8405
81Ju
veni
le A
cct I
ncen
tive B
lock
$21,
241
$21,
241
0608
Cons
erva
tion
2000
$29,
400
$29,
400
0619
Quin
cy V
eter
an H
ome
$3,1
07$3
,107
0632
Hors
e Rac
ing
$14,
192
$78,
190
$44,
359
$136
,741
0641
Auct
ion
Regu
latio
n Ad
min
.$2
8,47
1$2
8,47
107
11St
ate L
otte
ry$5
71,2
95$1
99,2
24$6
82,2
30$1
,452
,749
0725
IL M
ilita
ry F
amily
Rel
ief
$300
,000
$300
,000
0726
Fede
ral I
ndus
tria
l Ser
vice
s$2
,323
$2,3
2307
31IL
Cle
an W
ater
Fun
d$5
92,1
01$1
37,2
05$5
4,28
1$7
83,5
8707
36BH
E St
ate P
roje
cts
$9,1
80,8
71$9
,180
,871
FY 2
005
Cons
olid
ated
Ser
vice
s Tra
nsfe
rs

S E C T I O N 1 1 . S P E C I A L F U N D T R A N S F E R S
Page 254
From
#Fr
om F
und
Faci
litie
s Mgm
t Re
volv
ing
Fund
Prof
essi
onal
Se
rvic
es F
und
Prof
essi
ons
Indi
rect
Cos
t Fu
nd
Stat
istic
al
Serv
ices
Re
volv
ing
Fund
Com
mun
icat
ions
Re
volv
ing
Fund
Wor
kers
' Com
p Re
volv
ing
Fund
Tota
l per
Fun
d07
46Ho
me
Insp
ecto
r Adm
inis
trat
ion
$17,
333
$17,
333
0755
Stat
e Em
ploy
ees D
ef C
omp
Plan
$35,
829
$35,
829
0757
Child
Sup
port
Adm
inis
trat
ive
$7,6
00,6
83$2
34,0
13$7
,834
,696
0762
Loca
l Ini
tiativ
e$6
3,65
2$6
3,65
207
63To
uris
m P
rom
otio
n$1
01,4
92$6
,814
$252
,243
$360
,549
0795
Bank
& T
rust
Com
pany
$782
,295
$200
,214
$982
,509
0796
Nuc S
afet
y Em
erg
Prep
ared
ness
$814
,384
$25,
652
$102
,492
$942
,528
0802
Pers
onal
Pro
pert
y Ta
x Rep
lace
men
t$1
48,3
14$1
48,3
1408
21Dr
am S
hop
$3,5
59$4
3,34
2$4
6,90
108
23IL
Sta
te D
enta
l Dis
cipl
inar
y$8
01,5
69$8
01,5
6908
28Ha
zard
ous W
aste
$476
,268
$476
,268
0850
Real
Est
ate
Lice
nse
Adm
in$2
42,1
18$2
42,1
1808
65Do
mes
tic V
iole
nce
Shel
ter &
Ser
v$1
9,38
4$1
9,38
408
70Lo
w In
c Hom
e En
ergy
Blo
ck G
rant
$90,
062
$90,
062
0879
Traf
fic &
Crim
Con
vict
ion
Surc
harg
e$3
9,33
0$3
9,33
008
83In
tra-
Agen
cy S
ervi
ces
$346
,065
$346
,065
0886
Crim
inal
Just
ice
Info
Sys
Tru
st$9
5,39
2$9
5,39
2
0888
Desi
gn P
rofe
ssio
nal A
dmin
&
Insu
ranc
e$3
50,0
00$3
50,0
0009
00Pe
trol
eum
Vio
latio
n$5
7,92
0$5
7,92
009
03St
ate
Surp
lus P
rope
rty
Revo
lvin
g$5
3,13
7$5
3,13
709
07He
alth
Insu
ranc
e Re
serv
e$7
44,3
42$6
6,57
7$8
10,9
1909
22In
sura
nce
Prod
ucer
Adm
in$4
92,2
31$1
74,6
72$6
66,9
0309
25Co
al T
echn
olog
y De
velo
p As
sist
$204
,391
$204
,391
0944
Envi
ron
Prot
ect P
erm
it &
Insp
ectio
n$4
12,0
86$8
,473
$109
,145
$101
,706
$631
,410
0954
IL S
tate
Pod
iatr
ic D
isci
plin
ary
$127
,555
$127
,555
0962
Park
& C
onse
rvat
ion
$31,
088
$31,
088
0963
Vehi
cle
Insp
ectio
n$4
93,4
99$4
93,4
9909
89Sp
ecia
l Eve
nts R
evol
ving
$80,
516
$80,
516
0997
Insu
ranc
e Fi
nanc
ial R
egul
atio
n$4
80,8
56$1
68,3
27$6
0,91
9$7
10,1
02TO
TAL
$127
,938
,597
$10,
145,
468
$13,
216,
836
$6,8
39,2
31$1
3,21
4,98
3$6
8,22
4,06
7$2
39,5
79,1
82So
urce
: Offi
ce o
f the
Com
ptro
ller's
ST-
10 F
und
Tran
sfer
Rep
ort
FY 2
005
Cons
olid
ated
Ser
vice
s Tra
nsfe
rs
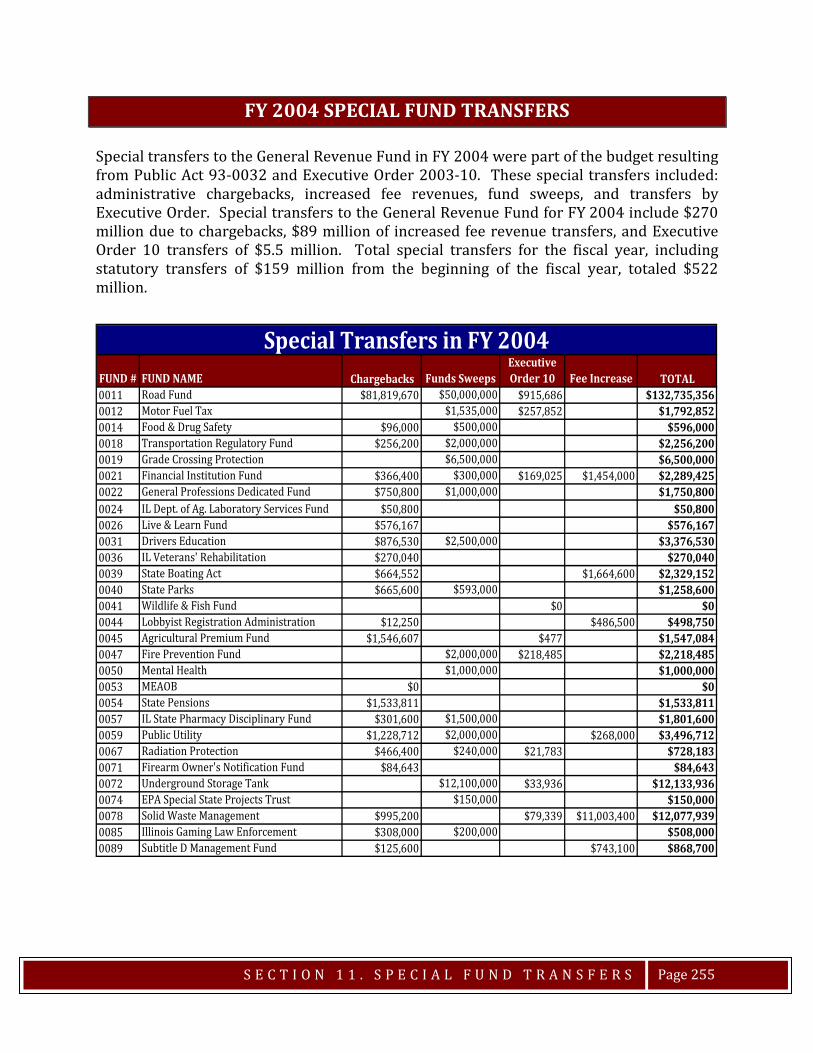
S E C T I O N 1 1 . S P E C I A L F U N D T R A N S F E R S
Page 255
FY 2004 SPECIAL FUND TRANSFERS
Special transfers to the General Revenue Fund in FY 2004 were part of the budget resulting from Public Act 93-0032 and Executive Order 2003-10. These special transfers included: administrative chargebacks, increased fee revenues, fund sweeps, and transfers by Executive Order. Special transfers to the General Revenue Fund for FY 2004 include $270 million due to chargebacks, $89 million of increased fee revenue transfers, and Executive Order 10 transfers of $5.5 million. Total special transfers for the fiscal year, including statutory transfers of $159 million from the beginning of the fiscal year, totaled $522 million.
FUND # FUND NAME Chargebacks Funds SweepsExecutive Order 10 Fee Increase TOTAL
0011 Road Fund $81,819,670 $50,000,000 $915,686 $132,735,3560012 Motor Fuel Tax $1,535,000 $257,852 $1,792,8520014 Food & Drug Safety $96,000 $500,000 $596,0000018 Transportation Regulatory Fund $256,200 $2,000,000 $2,256,2000019 Grade Crossing Protection $6,500,000 $6,500,0000021 Financial Institution Fund $366,400 $300,000 $169,025 $1,454,000 $2,289,4250022 General Professions Dedicated Fund $750,800 $1,000,000 $1,750,8000024 IL Dept. of Ag. Laboratory Services Fund $50,800 $50,8000026 Live & Learn Fund $576,167 $576,1670031 Drivers Education $876,530 $2,500,000 $3,376,5300036 IL Veterans' Rehabilitation $270,040 $270,0400039 State Boating Act $664,552 $1,664,600 $2,329,1520040 State Parks $665,600 $593,000 $1,258,6000041 Wildlife & Fish Fund $0 $00044 Lobbyist Registration Administration $12,250 $486,500 $498,7500045 Agricultural Premium Fund $1,546,607 $477 $1,547,0840047 Fire Prevention Fund $2,000,000 $218,485 $2,218,4850050 Mental Health $1,000,000 $1,000,0000053 MEAOB $0 $00054 State Pensions $1,533,811 $1,533,8110057 IL State Pharmacy Disciplinary Fund $301,600 $1,500,000 $1,801,6000059 Public Utility $1,228,712 $2,000,000 $268,000 $3,496,7120067 Radiation Protection $466,400 $240,000 $21,783 $728,1830071 Firearm Owner's Notification Fund $84,643 $84,6430072 Underground Storage Tank $12,100,000 $33,936 $12,133,9360074 EPA Special State Projects Trust $150,000 $150,0000078 Solid Waste Management $995,200 $79,339 $11,003,400 $12,077,9390085 Illinois Gaming Law Enforcement $308,000 $200,000 $508,0000089 Subtitle D Management Fund $125,600 $743,100 $868,700
Special Transfers in FY 2004

S E C T I O N 1 1 . S P E C I A L F U N D T R A N S F E R S
Page 256
FUND # FUND NAME Chargebacks Funds SweepsExecutive Order 10 Fee Increase TOTAL
0091 Clean Air Act (CAA) Permit Fund $104,772 $104,7720093 IL State Medical Disciplinary Fund $201,200 $1,500,000 $1,701,2000094 DCFS Training Fund $1,120,000 $1,120,0000096 Cemetery Consumer Protection Fund $11,575 $11,5750113 Community Health Center Care Fund $32,000 $32,0000126 New Technology Recovery $1,000,000 $1,000,0000129 State Gaming Fund $2,274,795 $8,360 $2,283,155
0130School District Emergency Financial Assistance $441,646 $441,646
0137 Plugging & Restoration $46,400 $120,000 $166,4000145 Explosives Regulatory $4,000 $4,0000146 Aggregate Operation Regulatory $22,800 $10,000 $32,8000147 Coal Mining Regulatory Fund $15,750 $80,000 $95,750
0151Registered CPA Administration & Disciplinary $75,600 $1,000,000 $1,075,600
0152 State Crime Laboratory $250,000 $250,0000156 Motor Vehicle Theft Prevention Fund $494,240 $250,000 $5,800 $750,0400163 Weights and Measures $181,600 $30,000 $211,6000167 Registered Limited Liability Partnership $7,000 $7,000
0171 Solid Waste Management Revolving Loan $2,000,000 $2,000,0000173 Emergency Planning & Training $50,000 $50,0000175 Illinois School Asbestos Abatement $52,000 $400,000 $452,0000184 Violence Prevention Fund $99,079 $99,0790185 SOS Special License Plate Fund $1,525,000 $1,525,000
0193Local Government Health Insurance Reserve $2,052,900 $2,052,900
0195 IPTIP Administrative Trust Fund $135,639 $135,6390203 Teacher's Health Insurance Security $4,517,917 $4,517,917
0205Illinois Farmer & Agri-business Loan Guarantee $1,500,000 $1,500,000
0207 Pollution Control Board State Trust $36,258 $36,2580214 Brownfields Redevelopment Fund $168,000 $168,0000215 Capital Development Board Revolving $500,000 $234,020 $734,0200218 Professions Indirect Cost Fund $170,741 $555,927 $726,6680220 DCFS Childrens' Services $9,727,445 $1,000,000 $10,727,4450222 State Police DUI Fund $22,250 $100,000 $122,2500223 DMH/DD Accounts Receivable Fund $62,720 $62,7200224 Asbestos Abatement Fund $106,250 $106,2500237 Medicaid Fraud/Abuse Prevent $350,000 $350,0000238 IL Health Facilities Planning Fund $88,000 $88,0000243 Credit Union $280,000 $500,000 $68,724 $921,800 $1,770,524
0244 Savings & Residential Finance Regulatory $389,600 $850,000 $8,302 $1,247,9020245 Fair & Exposition Fund $132,880 $500,000 $632,8800246 State Police Vehicle $101,000 $101,0000248 Racing Board Fingerprint License Fund $6,019 $6,0190251 Dept. of Labor Special State Trust Fund $59,974 $59,9740257 AML Reclamation Set Aside Fund $59,000 $90,000 $149,0000258 Nurse Dedicated & Professional Fund $553,600 $553,600
0259Optometric Licensing & Disciplinary Committee Fund $75,600 $75,600
Special Transfers in FY 2004
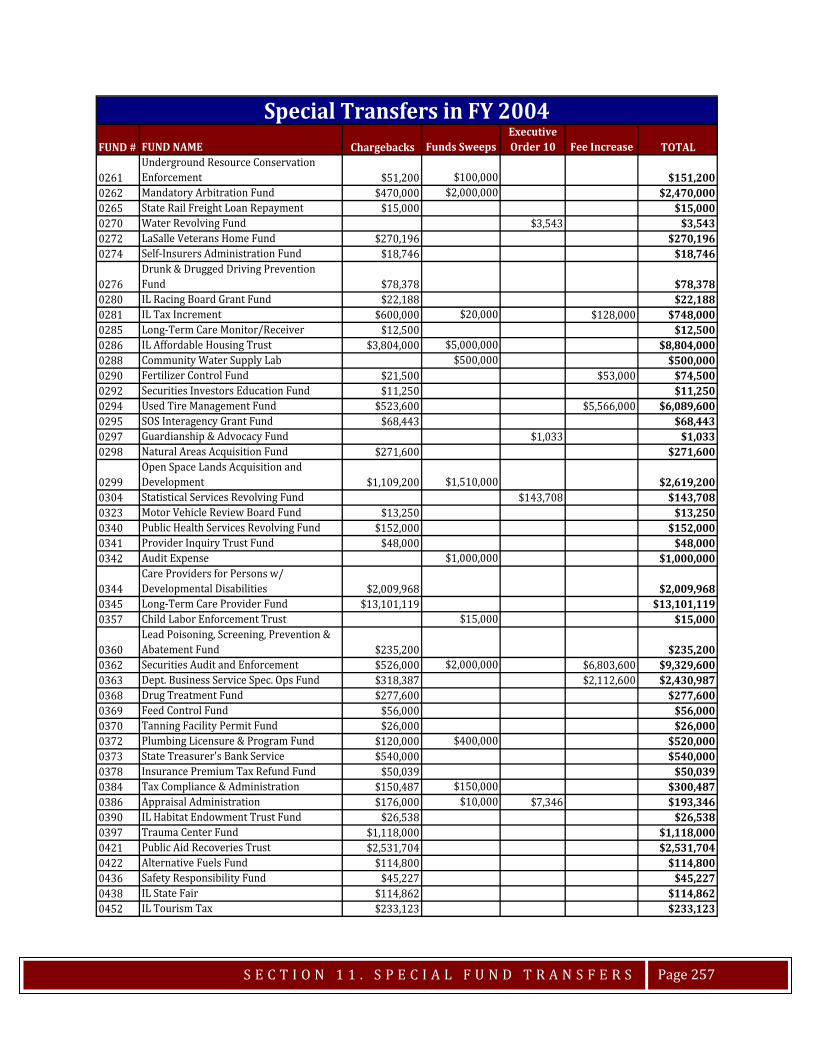
S E C T I O N 1 1 . S P E C I A L F U N D T R A N S F E R S
Page 257
FUND # FUND NAME Chargebacks Funds SweepsExecutive Order 10 Fee Increase TOTAL
0261Underground Resource Conservation Enforcement $51,200 $100,000 $151,200
0262 Mandatory Arbitration Fund $470,000 $2,000,000 $2,470,0000265 State Rail Freight Loan Repayment $15,000 $15,0000270 Water Revolving Fund $3,543 $3,5430272 LaSalle Veterans Home Fund $270,196 $270,1960274 Self-Insurers Administration Fund $18,746 $18,746
0276Drunk & Drugged Driving Prevention Fund $78,378 $78,378
0280 IL Racing Board Grant Fund $22,188 $22,1880281 IL Tax Increment $600,000 $20,000 $128,000 $748,0000285 Long-Term Care Monitor/Receiver $12,500 $12,5000286 IL Affordable Housing Trust $3,804,000 $5,000,000 $8,804,0000288 Community Water Supply Lab $500,000 $500,0000290 Fertilizer Control Fund $21,500 $53,000 $74,5000292 Securities Investors Education Fund $11,250 $11,2500294 Used Tire Management Fund $523,600 $5,566,000 $6,089,6000295 SOS Interagency Grant Fund $68,443 $68,4430297 Guardianship & Advocacy Fund $1,033 $1,0330298 Natural Areas Acquisition Fund $271,600 $271,600
0299Open Space Lands Acquisition and Development $1,109,200 $1,510,000 $2,619,200
0304 Statistical Services Revolving Fund $143,708 $143,7080323 Motor Vehicle Review Board Fund $13,250 $13,2500340 Public Health Services Revolving Fund $152,000 $152,0000341 Provider Inquiry Trust Fund $48,000 $48,0000342 Audit Expense $1,000,000 $1,000,000
0344Care Providers for Persons w/ Developmental Disabilities $2,009,968 $2,009,968
0345 Long-Term Care Provider Fund $13,101,119 $13,101,1190357 Child Labor Enforcement Trust $15,000 $15,000
0360Lead Poisoning, Screening, Prevention & Abatement Fund $235,200 $235,200
0362 Securities Audit and Enforcement $526,000 $2,000,000 $6,803,600 $9,329,6000363 Dept. Business Service Spec. Ops Fund $318,387 $2,112,600 $2,430,9870368 Drug Treatment Fund $277,600 $277,6000369 Feed Control Fund $56,000 $56,0000370 Tanning Facility Permit Fund $26,000 $26,0000372 Plumbing Licensure & Program Fund $120,000 $400,000 $520,0000373 State Treasurer's Bank Service $540,000 $540,0000378 Insurance Premium Tax Refund Fund $50,039 $50,0390384 Tax Compliance & Administration $150,487 $150,000 $300,4870386 Appraisal Administration $176,000 $10,000 $7,346 $193,3460390 IL Habitat Endowment Trust Fund $26,538 $26,5380397 Trauma Center Fund $1,118,000 $1,118,0000421 Public Aid Recoveries Trust $2,531,704 $2,531,7040422 Alternative Fuels Fund $114,800 $114,8000436 Safety Responsibility Fund $45,227 $45,2270438 IL State Fair $114,862 $114,8620452 IL Tourism Tax $233,123 $233,123
Special Transfers in FY 2004
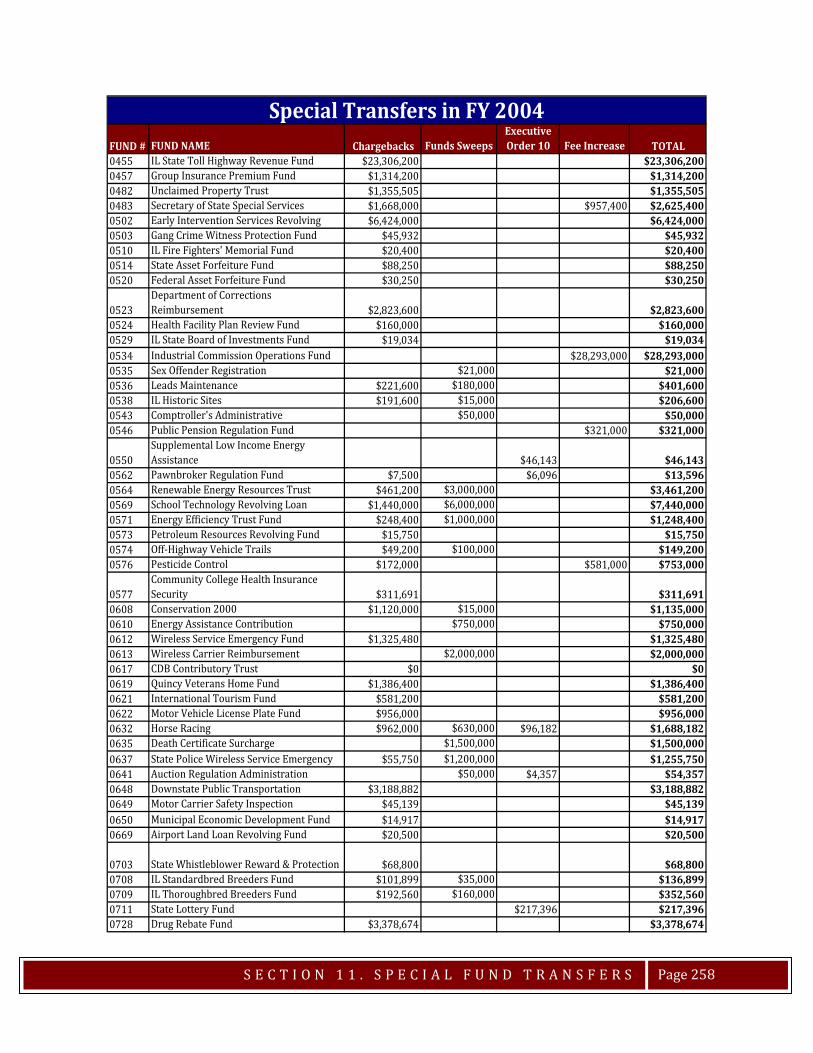
S E C T I O N 1 1 . S P E C I A L F U N D T R A N S F E R S
Page 258
FUND # FUND NAME Chargebacks Funds SweepsExecutive Order 10 Fee Increase TOTAL
0455 IL State Toll Highway Revenue Fund $23,306,200 $23,306,2000457 Group Insurance Premium Fund $1,314,200 $1,314,2000482 Unclaimed Property Trust $1,355,505 $1,355,5050483 Secretary of State Special Services $1,668,000 $957,400 $2,625,4000502 Early Intervention Services Revolving $6,424,000 $6,424,0000503 Gang Crime Witness Protection Fund $45,932 $45,9320510 IL Fire Fighters' Memorial Fund $20,400 $20,4000514 State Asset Forfeiture Fund $88,250 $88,2500520 Federal Asset Forfeiture Fund $30,250 $30,250
0523Department of Corrections Reimbursement $2,823,600 $2,823,600
0524 Health Facility Plan Review Fund $160,000 $160,0000529 IL State Board of Investments Fund $19,034 $19,0340534 Industrial Commission Operations Fund $28,293,000 $28,293,0000535 Sex Offender Registration $21,000 $21,0000536 Leads Maintenance $221,600 $180,000 $401,6000538 IL Historic Sites $191,600 $15,000 $206,6000543 Comptroller's Administrative $50,000 $50,0000546 Public Pension Regulation Fund $321,000 $321,000
0550Supplemental Low Income Energy Assistance $46,143 $46,143
0562 Pawnbroker Regulation Fund $7,500 $6,096 $13,5960564 Renewable Energy Resources Trust $461,200 $3,000,000 $3,461,2000569 School Technology Revolving Loan $1,440,000 $6,000,000 $7,440,0000571 Energy Efficiency Trust Fund $248,400 $1,000,000 $1,248,4000573 Petroleum Resources Revolving Fund $15,750 $15,7500574 Off-Highway Vehicle Trails $49,200 $100,000 $149,2000576 Pesticide Control $172,000 $581,000 $753,000
0577Community College Health Insurance Security $311,691 $311,691
0608 Conservation 2000 $1,120,000 $15,000 $1,135,0000610 Energy Assistance Contribution $750,000 $750,0000612 Wireless Service Emergency Fund $1,325,480 $1,325,4800613 Wireless Carrier Reimbursement $2,000,000 $2,000,0000617 CDB Contributory Trust $0 $00619 Quincy Veterans Home Fund $1,386,400 $1,386,4000621 International Tourism Fund $581,200 $581,2000622 Motor Vehicle License Plate Fund $956,000 $956,0000632 Horse Racing $962,000 $630,000 $96,182 $1,688,1820635 Death Certificate Surcharge $1,500,000 $1,500,0000637 State Police Wireless Service Emergency $55,750 $1,200,000 $1,255,7500641 Auction Regulation Administration $50,000 $4,357 $54,3570648 Downstate Public Transportation $3,188,882 $3,188,8820649 Motor Carrier Safety Inspection $45,139 $45,1390650 Municipal Economic Development Fund $14,917 $14,9170669 Airport Land Loan Revolving Fund $20,500 $20,500
0703 State Whistleblower Reward & Protection $68,800 $68,8000708 IL Standardbred Breeders Fund $101,899 $35,000 $136,8990709 IL Thoroughbred Breeders Fund $192,560 $160,000 $352,5600711 State Lottery Fund $217,396 $217,3960728 Drug Rebate Fund $3,378,674 $3,378,674
Special Transfers in FY 2004
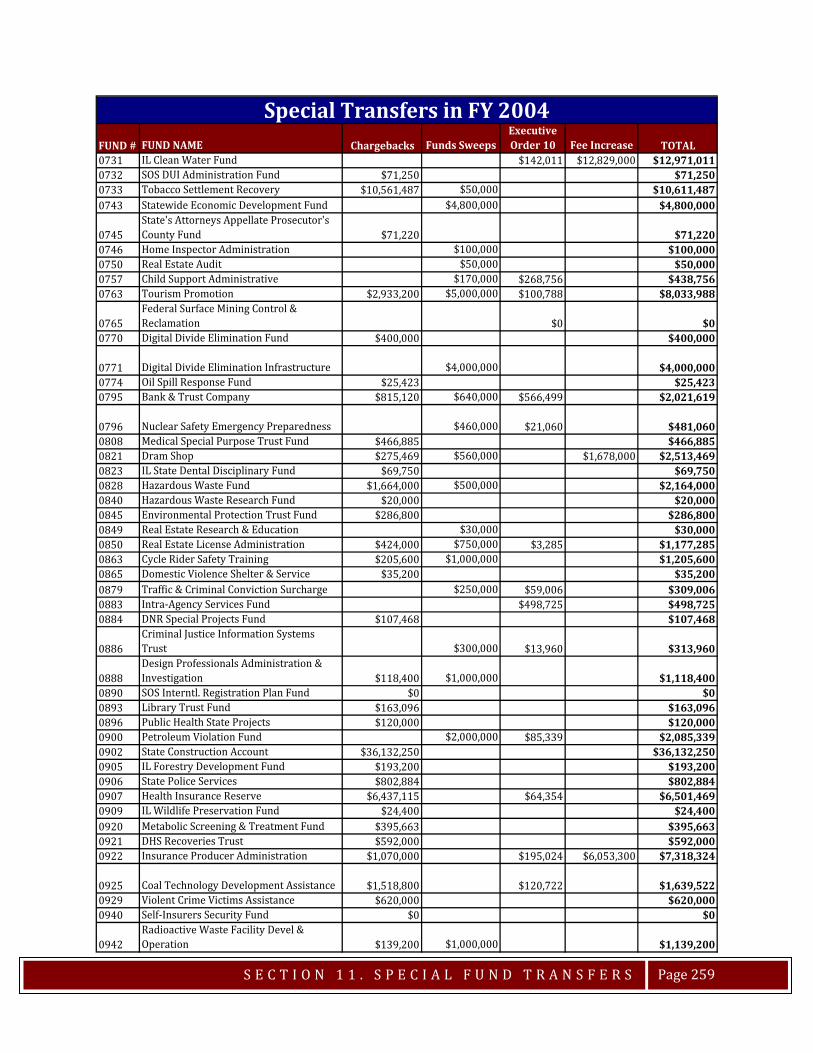
S E C T I O N 1 1 . S P E C I A L F U N D T R A N S F E R S
Page 259
FUND # FUND NAME Chargebacks Funds SweepsExecutive Order 10 Fee Increase TOTAL
0731 IL Clean Water Fund $142,011 $12,829,000 $12,971,0110732 SOS DUI Administration Fund $71,250 $71,2500733 Tobacco Settlement Recovery $10,561,487 $50,000 $10,611,4870743 Statewide Economic Development Fund $4,800,000 $4,800,000
0745State's Attorneys Appellate Prosecutor's County Fund $71,220 $71,220
0746 Home Inspector Administration $100,000 $100,0000750 Real Estate Audit $50,000 $50,0000757 Child Support Administrative $170,000 $268,756 $438,7560763 Tourism Promotion $2,933,200 $5,000,000 $100,788 $8,033,988
0765Federal Surface Mining Control & Reclamation $0 $0
0770 Digital Divide Elimination Fund $400,000 $400,000
0771 Digital Divide Elimination Infrastructure $4,000,000 $4,000,0000774 Oil Spill Response Fund $25,423 $25,4230795 Bank & Trust Company $815,120 $640,000 $566,499 $2,021,619
0796 Nuclear Safety Emergency Preparedness $460,000 $21,060 $481,0600808 Medical Special Purpose Trust Fund $466,885 $466,8850821 Dram Shop $275,469 $560,000 $1,678,000 $2,513,4690823 IL State Dental Disciplinary Fund $69,750 $69,7500828 Hazardous Waste Fund $1,664,000 $500,000 $2,164,0000840 Hazardous Waste Research Fund $20,000 $20,0000845 Environmental Protection Trust Fund $286,800 $286,8000849 Real Estate Research & Education $30,000 $30,0000850 Real Estate License Administration $424,000 $750,000 $3,285 $1,177,2850863 Cycle Rider Safety Training $205,600 $1,000,000 $1,205,6000865 Domestic Violence Shelter & Service $35,200 $35,2000879 Traffic & Criminal Conviction Surcharge $250,000 $59,006 $309,0060883 Intra-Agency Services Fund $498,725 $498,7250884 DNR Special Projects Fund $107,468 $107,468
0886Criminal Justice Information Systems Trust $300,000 $13,960 $313,960
0888Design Professionals Administration & Investigation $118,400 $1,000,000 $1,118,400
0890 SOS Interntl. Registration Plan Fund $0 $00893 Library Trust Fund $163,096 $163,0960896 Public Health State Projects $120,000 $120,0000900 Petroleum Violation Fund $2,000,000 $85,339 $2,085,3390902 State Construction Account $36,132,250 $36,132,2500905 IL Forestry Development Fund $193,200 $193,2000906 State Police Services $802,884 $802,8840907 Health Insurance Reserve $6,437,115 $64,354 $6,501,4690909 IL Wildlife Preservation Fund $24,400 $24,4000920 Metabolic Screening & Treatment Fund $395,663 $395,6630921 DHS Recoveries Trust $592,000 $592,0000922 Insurance Producer Administration $1,070,000 $195,024 $6,053,300 $7,318,324
0925 Coal Technology Development Assistance $1,518,800 $120,722 $1,639,5220929 Violent Crime Victims Assistance $620,000 $620,0000940 Self-Insurers Security Fund $0 $0
0942Radioactive Waste Facility Devel & Operation $139,200 $1,000,000 $1,139,200
Special Transfers in FY 2004

S E C T I O N 1 1 . S P E C I A L F U N D T R A N S F E R S
Page 260
FUND # FUND NAME Chargebacks Funds SweepsExecutive Order 10 Fee Increase TOTAL
0944Environmental Protection Permit & Inspect $333,600 $141 $333,741
0945 Landfill Closure & Post-Close $250,000 $250,0000962 Park & Conservation $1,000,000 $1,000,0000969 Local Tourism Fund $497,335 $497,3350973 Build IL Capital Revolving Loan Fund $5,000,000 $5,000,0000975 Large Business Attraction Fund $136,400 $500,000 $636,4000978 Deferred Lottery Prize Winners Trust $340,380 $340,3800980 Manteno Veterans Home $803,600 $803,6000982 IL Beach Marina $171,384 $171,3840993 Public Infrastructure Construction Loan $101,200 $101,200
0994IL Agri Loan Guarantee (RAL Loan Guarantee) $2,500,000 $2,500,000
0997 Insurance Financial Regulation $500,000 $920,000 $178,607 $5,368,700 $6,967,307TOTAL $269,464,457 $158,514,000 $5,526,569 $88,841,000 $522,346,026
Special Transfers in FY 2004
Source: Office of the Comptroller's ST-10 Fund Transfer Report
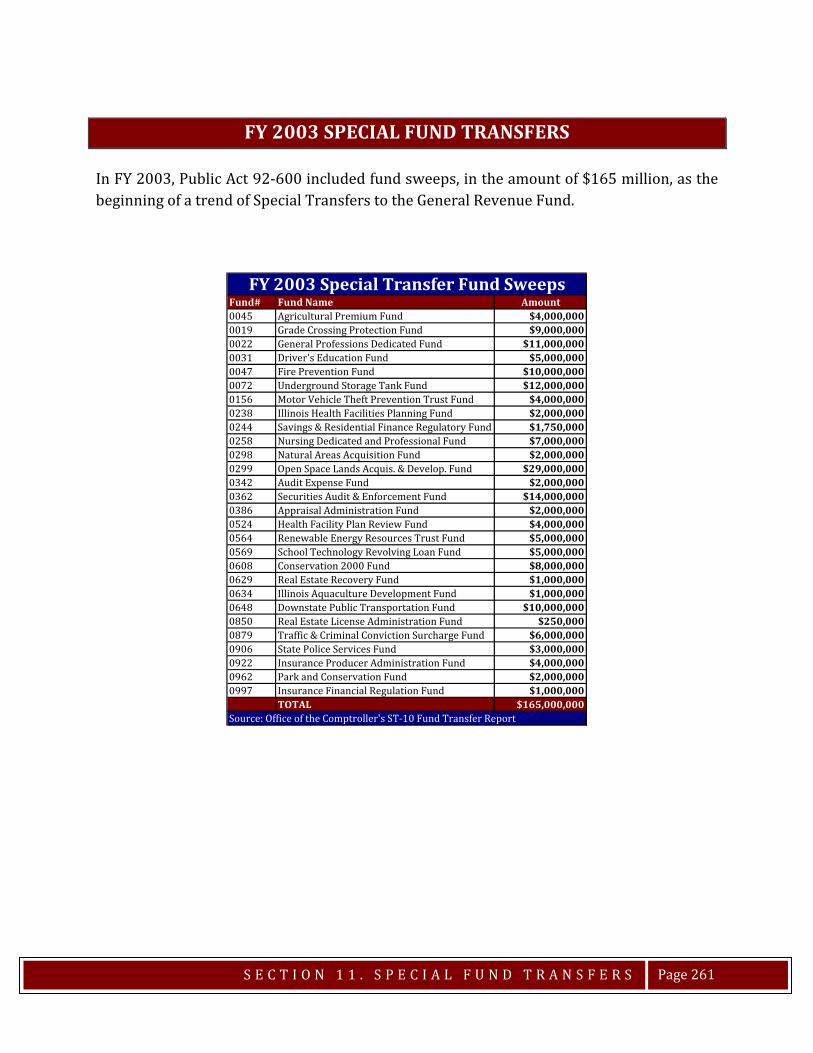
S E C T I O N 1 1 . S P E C I A L F U N D T R A N S F E R S
Page 261
FY 2003 SPECIAL FUND TRANSFERS
In FY 2003, Public Act 92-600 included fund sweeps, in the amount of $165 million, as the beginning of a trend of Special Transfers to the General Revenue Fund.
Fund# Fund Name Amount0045 Agricultural Premium Fund $4,000,0000019 Grade Crossing Protection Fund $9,000,0000022 General Professions Dedicated Fund $11,000,0000031 Driver's Education Fund $5,000,0000047 Fire Prevention Fund $10,000,0000072 Underground Storage Tank Fund $12,000,0000156 Motor Vehicle Theft Prevention Trust Fund $4,000,0000238 Illinois Health Facilities Planning Fund $2,000,0000244 Savings & Residential Finance Regulatory Fund $1,750,0000258 Nursing Dedicated and Professional Fund $7,000,0000298 Natural Areas Acquisition Fund $2,000,0000299 Open Space Lands Acquis. & Develop. Fund $29,000,0000342 Audit Expense Fund $2,000,0000362 Securities Audit & Enforcement Fund $14,000,0000386 Appraisal Administration Fund $2,000,0000524 Health Facility Plan Review Fund $4,000,0000564 Renewable Energy Resources Trust Fund $5,000,0000569 School Technology Revolving Loan Fund $5,000,0000608 Conservation 2000 Fund $8,000,0000629 Real Estate Recovery Fund $1,000,0000634 Illinois Aquaculture Development Fund $1,000,0000648 Downstate Public Transportation Fund $10,000,0000850 Real Estate License Administration Fund $250,0000879 Traffic & Criminal Conviction Surcharge Fund $6,000,0000906 State Police Services Fund $3,000,0000922 Insurance Producer Administration Fund $4,000,0000962 Park and Conservation Fund $2,000,0000997 Insurance Financial Regulation Fund $1,000,000
TOTAL $165,000,000Source: Office of the Comptroller's ST-10 Fund Transfer Report
FY 2003 Special Transfer Fund Sweeps

S E C T I O N 1 1 . S P E C I A L F U N D T R A N S F E R S
Page 262

SECTION 12. GLOSSARY & DESCRIPTION OF FUNDS
Glossary Description of Funds


S E C T I O N 1 2 . G L O S S A R Y & D E S C R I P T I O N O F F U N D S
Page 265
GLOSSARY Activity Measure - information or data used to count the delivery of state services; for instance, the number of people served and the number of cases closed.
Actuarial Accrued Liability - The value, using actuarial methods and assumptions, placed on the obligations of a pension fund for outgoings, including expenses expected to fall on the fund after the date to which the calculations relate.
Actuarial Assumptions - Factors which actuaries use in estimating the cost of funding a defined benefit pension plan. Examples include: the rate of return on plan investments; mortality rates; and the rates at which plan participants are expected to leave the system because of retirement, disability, termination, etc.
Actuarial Cost Methods - An actuarial method which defines the allocation of pension costs (and contributions) over a member's working career. All standard actuarial cost methods are comprised of two components: normal cost and the actuarial accrued liability. An actuarial cost method determines the incidence of pension costs, not the ultimate cost of a pension plan; that cost is determined by the actual benefits paid less the actual investment income.
Actuarial Gain or Loss - Experience of the plan, from one year to the next, which differs from that assumed results in an actuarial gain or loss. For example, an actuarial gain would occur if assets earned 10 percent for a given year since the assumed interest rate in the valuation is 8 percent.
Actuarial Present Value - The value of an amount or series of amounts payable or receivable at various times, determined as of a given date by the application of a particular set of actuarial assumptions (i.e. interest rate, rate of salary increases, mortality, etc.).
Actuarial Valuation - Actuarial valuations are technical reports providing full disclosure of the financial and funding status of retirement systems.
Actuarial Value of Assets - The value of pension plan investments and other property used by the actuary for the purpose of an actuarial valuation.
All Funds - every fund appropriated to or spent by an agency.
Amortization - Paying off an interest bearing liability by gradual reduction through a series of installments, as opposed to paying it off by one lump sum payment.
Annual Required Employer Contribution (ARC) - Represents the amount that an employer must report as its annual obligation to the pension fund. The ARC, expressed
S E C T I O N 1 2 . G L O S S A R Y & D E S C R I P T I O N O F F U N D S
Page 266
either as a dollar amount or a percentage of payroll, has two components: the annual normal cost and the annual amortization payment of the UAAL.
Annualize - to provide full year funding in the next fiscal year when a program is started or a person is hired part way through the current fiscal year.
Annuitant - One who receives periodic payments from the retirement system. This term includes service and disability retirees, and their survivors.
Annuity - A series of periodic payments, usually for life, payable monthly or at other specified intervals.
Appropriation - spending authority from a specific fund given by the General Assembly and approved by the Governor for a specific amount, purpose and time period.
Assessments - a levy imposed for a specific purpose, typically the medical assessment program under which the Department of Public Aid levies a fee on long-term care and other providers to help fund Medicaid liability.
Asset - Anything that has a financial value. Examples include: buildings, equipment, shares, etc.
Asset Smoothing - A mechanism that spreads out, or smoothes, annual investment returns over a designated periods of time in order to minimize volatility.
Assumed Interest Rate - The rate of interest, or growth rate, to determine the value of an annuity contract and, therefore, the periodic income payment which can be provided to the annuitant.
Attrition - a natural reduction in caseload or staff; for example, from retirement or resignation.
Available Fund Balance - the total amount of money in a fund at a particular point in time, typically at the beginning of a month or the year.
Basis of Accounting – the method of accounting used to track and report state revenues and expenditures; for example, cash, budgetary or accrual.
Beneficiary - The person designated to receive benefits under an employee benefit plan in the event of the death of the person covered by the plan.
Bond Fund - a fund that receives proceeds from the sale of bonds to be used for capital projects.
Bond Rating - an assessment of the credit risk with respect to a specific bond issue.
S E C T I O N 1 2 . G L O S S A R Y & D E S C R I P T I O N O F F U N D S
Page 267
Bond Retirement and Interest Fund - a fund used to repay principal and interest on bonds or other debt obligations, typically spent pursuant to a continuing and irrevocable appropriation.
Budgetary Balance - available cash balance on June 30, minus lapse period spending for the fiscal year just ended.
Build Illinois - a state economic development and public infrastructure program begun in 1986 and primarily funded by dedicated state sales tax revenue bonds.
Capital - buildings, structures, equipment and land. Acquisition, development, construction and improvement of capital are typically funded through bond funds.
Case Management - monitoring and oversight of the delivery of services, which may include coordination of all services to a client.
Caseload - the number of clients being served at a point in time, sometimes used in the context of clients per staff.
Cash Flow - the amount of cash available for use during a period of time, calculated by subtracting spending from the sum of the receipts and the beginning balance.
Census - population measure, typically of clients in a facility or program.
Certificate of Participation - similar to bonds or other debt instruments, a security issued by the state or a third party that gives the holder a share of the stream of annual appropriated lease payments made by the state.
Client - a person or family receiving services, typically from a human service agency.
Commodities - line item for consumable items used in connection with current agency operations; for instance, household, medical or office supplies; food for those in institutions; coal, bottled and natural gas; and equipment costing less than $100.
Common School Fund - one of four funds that comprise the state general funds. It is used to fund Elementary and Secondary Education. If revenues to the fund from the lottery, bingo, public utility, cigarette and sales taxes and from investment income, among others, are insufficient to make monthly general state aid payments, the Common School Fund receives automatic transfers from the General Revenue Fund.
Consent Decree - an agreement between both parties in a lawsuit that binds them and determines their rights and obligations. While made under sanction of the court, it does not bind the court, and it is not a judicial sentence.
Continuing Appropriation - statutory authority for the Comptroller and Treasurer to spend funds in the event the legislature fails to appropriate or appropriates an
S E C T I O N 1 2 . G L O S S A R Y & D E S C R I P T I O N O F F U N D S
Page 268
insufficient amount for a specified purpose. Examples of continuing appropriations are for debt service on state bonds or payments to the state retirement systems.
Contractual Services - line item for services provided by a non-state employee or vendor including, utilities; medical services for those in institutions; professional, technical or artistic consulting; and property and equipment rental.
Death Benefit - A benefit payable by reason of a member's death. The benefit can be in the form of a lump sum, an annuity or a refund of the member's contributions.
Debt Service - payment of principal, interest and other obligations associated with the retirement of debt.
Dedicated Funds - revenues assessed and collected for a specific state program.
Deferred Annuity - An annuity for which payments do not commence until a designated time in the future.
Deferred Compensation - Considerations for employment that are not payable until after the regular pay period. The most common form of deferred compensation are pension plans, but private employers may also offer bonuses, incentive clauses, etc.
Defined Benefit Plan (DB) - A pension plan providing a definite benefit formula for calculating benefit amounts - such as a flat amount per year of service; a percentage of salary; or a percentage of salary, times years of service.
Defined Contribution Plan (DC) - A pension plan in which the contributions are made to an individual account for each employee. The retirement benefit is dependent upon the account balance at retirement. The balance depends upon amounts contributed during the employee's participation in the plan and the investment experience on those contributions.
Disability Retirement - A termination of employment involving the payment of a retirement allowance as a result of an accident or sickness occurring before a participant is eligible for normal retirement.
Divisions - organizational units within agencies designated as such for programmatic or administrative convenience.
Education Assistance Fund - one of four funds that comprise the state general funds. It is used to fund Elementary, Secondary and Higher Education. It receives 7.3 percent of the state income tax net of refunds, as well as wagering taxes paid to the state by riverboat casinos.
S E C T I O N 1 2 . G L O S S A R Y & D E S C R I P T I O N O F F U N D S
Page 269
Electronic Data Processing - line item for lease or purchase of computer or other data processing equipment and related services including supplies, services and personnel.
Employee Retirement Contributions Paid by State (Pension Pick-Up) - line item for payment of an employee's required contribution to the State Employees' Retirement System, which an agency has chosen or contracted to make on behalf of the employee.
Entitlement - program benefits that must be provided in a timely fashion to those who meet eligibility criteria and that may not be taken away without due process.
Equipment - line item for non-consumable items of tangible personal property used in connection with current agency operations; for instance office furniture, vehicles or machinery, and scientific or other major instruments and apparatus.
Executive Branch - distinguished from the legislative and judicial branches of state government, it is charged with the detail of carrying out and effectuating the law through the day-to-day operations and activities of state government. The Governor, as chief executive officer of the state, is responsible for the operation and administration of state agencies.
Executive Order - a decree or mandate issued by the Governor for the purpose of interpreting or implementing a provision of the law. Executive orders often are used to reorganize and assign functions among executive agencies, create advisory and special commissions and boards or direct state agencies regarding policy.
Expenditure - state spending. Agencies submit vouchers to the Comptroller's Office, which prepares a state check (warrant) and maintains accounting records. Warrants are presented to the Treasurer, who maintains and invests state funds.
Federal Aid - funding provided by the federal government.
Fiduciary - (1) Indicates the relationship of trust and confidence where one person (the fiduciary) holds or controls property for the benefit of another person; (2) anyone who exercises power and control, management or disposition with regard to a fund's assets, or who has authority to do so or who has authority or responsibility in the plan's administration. Fiduciaries must discharge their duties solely in the interest of the participants and their beneficiaries, and are accountable for any actions which may be construed by the courts as breaching that trust.
Fiscal Year - Illinois state government's fiscal year is July 1 through June 30. This is the period during which obligations are incurred, encumbrances are made and appropriations are expended. The federal government's fiscal year is October 1 through September 30.
S E C T I O N 1 2 . G L O S S A R Y & D E S C R I P T I O N O F F U N D S
Page 270
Full Faith and Credit - a pledge or promise to repay general obligation debt; typically includes all of an issuer's taxing powers.
Full-Time Equivalent - a calculated measure of full-time employment for comparison purposes, in which each full-time employee works 37.5 hours per week for 52 weeks per year.
Fund - an account established to hold money for specific programs, activities or objectives.
Funded Ratio - The ratio of a plan’s current assets to the present value of earned pensions. There are several acceptable methods of measuring a plan’s assets and liabilities. In financial reporting of public pension plans, funded status is reported using consistent measures by all governmental entities. According to the Government Accounting Standards Board (GASB), the funded ratio equals the actuarial value of assets divided by the actuarial accrued liability.
General Accounting Standards Board (GASB) - This governmental agency sets the accounting standards for state and local government operations.
General Funds - (usually lower-case) refers to the following group of funds, inclusively: the General Revenue Fund, the Education Assistance Fund, the Common School Fund, and the General Revenue -Common School Special Account Fund.
General Obligation Bonds - bonds issued for capital purposes as direct legal obligations secured by general tax revenues and guaranteed by the full faith and credit of the state.
General Revenue -Common School Special Account Fund - one of four funds that comprise the state general funds. It is used for accounting purposes to receive 25 percent of state sales tax and subsequently transfer these moneys to the Common School Fund.
General Revenue Fund - the largest of four funds that comprise the state general funds. It receives the majority of undedicated tax revenues, mostly income and sales taxes, for use generally to operate and administer state programs.
General State Aid - an unrestricted formula-driven grant that comprises the largest portion of state assistance to local school districts. The amount of funds a district receives depends on its financial need measured by three factors: its average daily attendance, its equalized assessed valuation of property and its local tax measured by its statutory tax rate.
Grant - an award or contribution to be used either for a specific or a general purpose, typically with no repayment provision.

S E C T I O N 1 2 . G L O S S A R Y & D E S C R I P T I O N O F F U N D S
Page 271
Group Insurance - line item for life and health insurance program for all state employees, retirees and their dependents.
Headcount - a statement of the number of employees for some period of time, typically either the actual number of staff working or a calculated full-time equivalent.
Highway Fund - a fund that receives special dedicated revenues related to transportation; for example, the motor fuel tax or federal highway trust funds, to be used to support the construction and maintenance of transportation facilities and activities.
Hiring Lag – the savings in personal services and benefits associated with the time period between an employee leaving the job and a replacement being hired.
Illinois FIRST - a $12 billion, multi-year public works initiative begun in 1999 and funded by a combination of local, state and federal resources.
Income Tax Surcharge - a temporary increase of 0.5 percent in the state personal income tax and 0.8 percent in the corporate income tax established in July 1989 to fund education, local governments and property tax relief. Subsequently, in July 1991, one-half of the surcharge was made permanent and dedicated to education. The remaining one-half was made permanent in July 1993.
Individual Retirement Account (IRA) - A retirement account to which an individual can make annual tax-deductible contributions according to annual limits that are specified by the Internal Revenue Service.
Infant Mortality - measure of infant deaths during the first year of life per 1000 live births.
Judicial Branch - distinguished from the legislative and executive branches of state government, it is charged with interpreting and applying laws.
Lapse - the portion of an appropriation that is not spent during the authorized period, typically the fiscal year, including the lapse period.
Lapse Period - the two-month period following the fiscal year (July 1 to August 31) when agencies can liquidate liabilities incurred before the end of that fiscal year (June 30). Public Act 89-511, effective in fiscal year 1997, reduced the lapse period from three months to two months. Legislation has expanded the lapse period an additional three months in FY 2010, FY 2011, and FY 2012.
Lapse Period Spending - spending that occurs during the lapse period from the previous year's appropriation.

S E C T I O N 1 2 . G L O S S A R Y & D E S C R I P T I O N O F F U N D S
Page 272
Legislative Branch - distinguished from the judicial and executive branches of state government, it is charged with making and enacting the law, including appropriations.
Legislative Transfer - reallocation of appropriation amounts among line items by the General Assembly during the fiscal year. Distinguished from a two- percent transfer, which may be accomplished by the executive branch without participation of the legislative branch.
Line Item - specific purpose of an appropriation; for instance, personal services, retirement, printing or travel.
Liquidate - to settle or pay a debt or to convert assets into cash.
Local Government Distributive Fund - receives 1/10 of the income tax proceeds to the general funds, via a transfer, for distribution to units of local government based on population. Funds may be used for any purpose.
Lump Sum - appropriation line for a general program purpose without specific line items identified.
Managed Care - the process of coordinating and controlling all services provided to a client to assure efficient and effective results.
Mandate - a law or regulation that generally should be followed, whether or not funding is provided. The State Mandates Act permits certain regulations and laws to be ignored if funding is not provided.
Match - contribution to program required to receive a program grant, may be either money, "hard match", or services, "soft match".
Medicaid - public assistance financed jointly by the state and federal governments to provide medical care for individuals who meet certain eligibility criteria.
Moral Obligation - a duty that is not binding or enforceable by law, typically debt service on bonds issued by others that the state agrees to consider funding if the issuer is unable to pay. There is no legal guarantee the state will make such payments.
Normal Cost - Computed differently under different funding methods, the normal cost generally represents the portion of the cost of projected benefits allocated to the current plan year. The employer normal cost equals the total normal cost of the plan reduced by employee contributions.
Other Funds - all state and federal funds except the four general funds.

S E C T I O N 1 2 . G L O S S A R Y & D E S C R I P T I O N O F F U N D S
Page 273
Other Operations - administrative non-grant expenses of state agencies except salaries and payments for fringe benefits; for example, contractual services, travel, printing and telecommunications.
Pension - A series of periodic payments, usually for life, payable monthly or at other specified intervals. The term is frequently used to describe the part of a retirement allowance financed by employer contributions.
Pension Benefit Obligation (PBO) - The portion of the Actuarial Present Value of future benefits attributable to service credit that has been earned to date (past service).
Per Diem - by the day. An amount of so much for each day.
Performance Measure - information or data used to determine the quality and outcomes of state services; for instance, the number of people who receive jobs following job counseling and employment services or the number of people who remain off drugs following treatment services.
Personal Services - line item for salary payments to employees. Phase-In -staged expenditure pattern, such as initiating a program, hiring employees or opening an institution over time (see Annualize).
Pilot Program - tentative model for future full scale development, typically a program operated in a limited area or targeted to a limited population to analyze its effectiveness before expanding its scope.
Position Title - name and description of a job.
Present Value - The current worth of an amount or series of amounts payable in the future, after discounting each amount at an assumed rate of interest and adjusting for the probability of its payment or receipt.
Printing - line item for contractual services, materials and supplies used to produce and print information; for example, letterhead stationery, annual reports and forms.
Program Area - major organizational categories of state government, including education, human services, public safety, environment and business regulations, economic development and infrastructure and government services.
Rate of Return - The ratio of money gained or lost on an investment relative to the amount of money invested.
Real Rate of Return - The rate of return above inflation.
S E C T I O N 1 2 . G L O S S A R Y & D E S C R I P T I O N O F F U N D S
Page 274
Reappropriation - an unspent appropriation that continues into the next fiscal year, typically for a capital or other multi-year project or liability.
Recommended - Governor's budget requests presented to the General Assembly for its approval.
Refunding Bonds - bonds issued to refinance other outstanding bonds, which generally were originally issued at higher interest rates.
Refunds - line item for return of funds to the rightful owner, typically return of overpaid taxes or fees.
Repair and Maintenance - line item for upkeep, restoration and improvement of equipment and facilities in connection with current agency operations.
Reserve - portion of appropriation intentionally set aside and not spent, either to increase lapse or as a contingency for increased liabilities in other line items.
Resources - all assets available for use by agencies, whether appropriated or not.
Retirement - line item for employer's share of contributions to the state retirement system.
Revenues - receipts from taxes, fees, assessments, grants and other payments used to fund programs.
Revolving Fund - receives intergovernmental payments charged for providing central operational services, such as computer, purchasing, state garage and telecommunications.
Road Fund - receives motor fuel tax and other transportation-related revenues for use to operate the Department of Transportation, Illinois State Police and the Secretary of State's Office and to build and maintain roads, bridges and other transportation facilities.
Social Security - line item for employer's share of contributions to the Federal Insurance Contributions Act (PICA) tax.
Special State Funds - all state funds except the general funds, bond-financed funds, debt service funds and state trust funds.
State Agency - government organization created by statute to administer and implement particular legislation.
Statute - a law enacted by the General Assembly and approved by the Governor.
S E C T I O N 1 2 . G L O S S A R Y & D E S C R I P T I O N O F F U N D S
Page 275
Substitute Care - a program to place children away from their families in foster homes or residential facilities.
Supplemental Appropriation - additional spending authority given by the General Assembly during the fiscal year, following passage of the initial budget.
Transfer - reallocation of resources, typically movement of money from one fund to another or shift of appropriation authority among line items by the legislative or the executive branch.
Trust Fund - receives revenues assessed and collected for a specific state program.
Two Percent Transfer - reallocation of appropriation amounts by the Governor during the fiscal year. Limited to two percent of an agency's appropriation by fund for specific operations lines. Distinguished from a legislative transfer, which requires approval by the legislative branch.
Unfunded Actuarial Accrued Liability (UAAL) - The excess, if any, of the Actuarial Accrued Liability over the Actuarial Value of Assets. In other words, the present value of benefits earned to date that are not covered by current plan assets.
Unfunded Liability - The excess, if any, of the pension benefit obligation over the valuation assets. This is the portion of all benefits earned to date that are not covered by plan assets.
Valuation Rate of Return - The expected rate of return on new money invested in the future, and the rate at which future liabilities and assets are discounted back to the valuation date.
Voids - checks (warrants) that are not cashed.
Voucher - document requesting payment submitted to the Comptroller, who then writes and issues a warrant.
Warrant - check issued by the Comptroller to a third party who cashes it with the Treasurer.
Zero Coupon Bonds - bonds without interest coupons for semi-annual payment. Interest accrues over the life of the bond and is paid on maturity along with the principal.
S E C T I O N 1 2 . G L O S S A R Y & D E S C R I P T I O N O F F U N D S
Page 276
DESCRIPTION OF FUNDS There are approximately 650 funds in the Illinois accounting system. These funds are separated into two categories --Appropriated and Non-Appropriated Funds.
The Appropriated Funds category is further broken into eight fund groups: General, Highway, Special State, Bond Financed, Debt Service, Federal Trust, Revolving and State Trust Funds. The Non- Appropriated Funds category is composed primarily of Federal and State Trust Funds, and includes a few Special State Funds.
General Funds receive the major portion of tax revenues and pay for the regular operating and administrative expenses of most state agencies. Components of the general funds are the General Revenue Fund, the Education Assistance Fund, the Common School Fund and the General Revenue-Common School Special Account Fund.
Highway Funds receive and distribute special assessments related to transportation, such as the motor fuel tax, and support the construction and maintenance of transportation facilities and activities of the state.
University Funds receive revenues such as fees, tuition and excess income from auxiliary enterprises at state universities and colleges, including related foundations and associations. Prior to fiscal year 1998, the General Assembly appropriated these funds for the support, operation and improvement of state-supported institutions of higher education. Starting in fiscal year 1998, the university funds became locally held funds and, together with other funds administered by the universities, are not subject to appropriation.
Special State Funds are designated in Section 5 of the Finance Act as special funds in the State Treasury and not elsewhere classified. They represent a segregation of accounts restricted to the revenues and expenditures of a specific source.
Bond Financed Funds receive and administer the proceeds of various state bond issues.
Debt Service Funds account for the resources obtained and accumulated to pay interest and principal on debt obligations.
Federal Trust Funds are established pursuant to grants and contracts between state agencies and the federal government. The funds are administered for specific purposes established by the terms of the grants and contracts.
Revolving Funds finance the operations of state agencies that render services to other state agencies on a cost reimbursement basis. Appropriation of these funds is dependent upon intra-governmental service requirements and appropriations of other state agencies.
State Trust Funds are established by statute or under statutory authority for specific purposes. Other Trust Funds receive and account for resources for subsequent disbursement to a designated recipient. Escrow funds are an example of an Other Trust Fund.

BACKGROUND The Commission on Government Forecasting and Accountability (CGFA), a bipartisan, joint legislative commission, provides the General Assembly with information relevant to the Illinois economy, taxes and other sources of revenue and debt obligations of the State. The Commission's specific responsibilities include:
1) Preparation of annual revenue estimates with periodic updates; 2) Analysis of the fiscal impact of revenue bills; 3) Preparation of "State Debt Impact Notes" on legislation which would appropriate bond
funds or increase bond authorization; 4) Periodic assessment of capital facility plans; 5) Annual estimates of public pension funding requirements and preparation of pension
impact notes; 6) Annual estimates of the liabilities of the State's group health insurance program and
approval of contract renewals promulgated by the Department of Central Management Services;
7) Administration of the State Facility Closure Act.
The Commission also has a mandate to report to the General Assembly ". . . on economic trends in relation to long-range planning and budgeting; and to study and make such recommendations as it deems appropriate on local and regional economic and fiscal policies and on federal fiscal policy as it may affect Illinois. . . ." This results in several reports on various economic issues throughout the year. The Commission publishes several reports each year. In addition to a Monthly Briefing, the Commission publishes the "Revenue Estimate and Economic Outlook" which describes and projects economic conditions and their impact on State revenues. The “Bonded Indebtedness Report" examines the State's debt position as well as other issues directly related to conditions in the financial markets. The “Financial Conditions of the Illinois Public Retirement Systems” provides an overview of the funding condition of the State’s retirement systems. Also published are an Annual Fiscal Year Budget Summary; Report on the Liabilities of the State Employees’ Group Insurance Program; and Report of the Cost and Savings of the State Employees’ Early Retirement Incentive Program. The Commission also publishes each year special topic reports that have or could have an impact on the economic well-being of Illinois. All reports are available on the Commission’s website. These reports are available from: Commission on Government Forecasting and Accountability 703 Stratton Office Building Springfield, Illinois 62706 (217) 782-5320 (217) 782-3513 (FAX)
http://www.ilga.gov/commission/cgfa2006/home.aspx
Related Documents