United States Department of Agriculture FY 2019 BUDGET SUMMARY

Welcome message from author
This document is posted to help you gain knowledge. Please leave a comment to let me know what you think about it! Share it to your friends and learn new things together.
Transcript
United States Department of Agriculture
FY 2019
BUDGET SUMMARY

i
CONTENTS
PREFACE ........................................................................................................................................ iii
OVERVIEW ....................................................................................................................................... 1
HIGHLIGHTS BY GOAL .................................................................................................................... 3
MISSION AREA/AGENCY DETAILS: FARM PRODUCTION AND CONSERVATION:
Farm Service Agency ............................................................................................................. 14 Risk Management Agency ..................................................................................................... 21 Natural Resources Conservation Service ............................................................................... 23 Farm Production and Conservation Business Center ............................................................. 27
TRADE AND FOREIGN AGRICULTURAL AFFAIRS: Foreign Agricultural Service .................................................................................................. 28
RURAL DEVELOPMENT: Rural Utilities Service ............................................................................................................ 35 Rural Housing Service ........................................................................................................... 37 Rural Business-Cooperative Service ...................................................................................... 39 Rural Development Salaries and Expenses ............................................................................ 40
FOOD, NUTRITION, AND CONSUMER SERVICES: Food and Nutrition Service .................................................................................................... 42
FOOD SAFETY: Food Safety and Inspection Service ....................................................................................... 48
NATURAL RESOURCES AND ENVIRONMENT: Forest Service ......................................................................................................................... 50
MARKETING AND REGULATORY PROGRAMS: Animal and Plant Health Inspection Service ......................................................................... 55 Agricultural Marketing Service .............................................................................................. 59
RESEARCH, EDUCATION, AND ECONOMICS: Agricultural Research Service ................................................................................................ 64 National Institute of Food and Agriculture ............................................................................ 67 Economic Research Service ................................................................................................... 69 National Agricultural Statistics Service ................................................................................. 69
DEPARTMENTAL STAFF OFFICES ..................................................................................................... 70
OFFICE OF CIVIL RIGHTS ................................................................................................................. 73
OFFICE OF INSPECTOR GENERAL ..................................................................................................... 74

2019 USDA BUDGET SUMMARY ii
APPENDIX: Staff Years by Agency ................................................................................................................ 75 Budget Authority by Agency ...................................................................................................... 76 Program Level by Agency .......................................................................................................... 78 Outlays by Agency ...................................................................................................................... 80 Discretionary Outlays by Agency ............................................................................................... 81 User Fee Proposals ...................................................................................................................... 82 Budget-Related Proposals ........................................................................................................... 83
PREFACE iii
PREFACE
This publication summarizes the fiscal year (FY) 2019 Budget for the U.S. Department of Agriculture (USDA). Throughout this publication any reference to the “Budget” is with regard to the 2019 Budget, unless otherwise noted. All references to years refer to fiscal year, except where specifically noted. The budgetary tables throughout this document show actual amounts for 2017, estimates based upon the annualized continuing resolution for 2018, and the President’s Budget for 2019.
The performance tables throughout this document, unless otherwise noted, show target levels for 2018 and 2019 and a baseline amount for target comparison. Performance goals reflect performance levels at ongoing funding levels and do not include the effect of supplemental appropriations. Performance target levels are estimates and subject to change.
Throughout this publication, the “2014 Farm Bill” is used to refer to the Agricultural Act of 2014. Most programs funded by the 2014 Farm Bill are not funded after 2018. Amounts shown in 2019 for Farm Bill programs reflect those confirmed in the baseline.
Pursuant to the Balanced Budget and Emergency Deficit Control Act of 1985, sequestration is included in the numbers for mandatory programs in all years. The sequestration rate for 2017 is 6.9 percent; 2018 is 6.6 percent; and 2019 is 6.2 percent.
DOCUMENT ORGANIZATION
The Budget Summary is organized into three sections: • Overview – provides an overview of USDA’s funding. • Budget Highlights – describes key budget proposals and changes in budget authority and
outlays. • Mission Area and Agency Details – summarizes agency funding, programs, and performance
goals.
BUDGET AND PERFORMANCE PLAN TERMS: Budget Authority (BA): Authority to commit funds of the Federal Treasury. Congress provides this authority through annual appropriations acts and substantive legislation, which authorizes direct spending. The President's budget requests the Congress to appropriate or otherwise provide an amount of budget authority sufficient to carry out recommended government programs.
Obligations: Commitments of Government funds that are legally binding. In order for USDA to make a valid obligation, it must have a sufficient amount of BA to cover the obligation.
Outlays: Cash disbursements from the Federal Treasury to satisfy a valid obligation.
Program Level (PL): The gross value of all financial assistance USDA provides to the public. This assistance may be in the form of grants, guaranteed or direct loans, cost-sharing, professional services, such as research or technical assistance activities, or in-kind benefits, such as commodities.
Performance Goal: The target level of performance at a specified time or period expressed as a tangible, measurable outcome against which actual achievement can be compared, including a goal expressed as a quantitative standard, value, or rate. A performance goal comprises a performance measure with targets and timeframes.
2019 USDA BUDGET SUMMARY iv
Performance Measures: Indicators, statistics, or metrics used to gauge program performance. Program performance measures include outcome, output, and efficiency measures.
DATA DISPLAY – ZERO TREATMENT
Amounts in text and tables throughout this document are calculated with the greatest level of precision (decimal places) available and rounded for display purposes. Therefore, amounts in tables and charts may not add to displayed totals due to rounding. Also due to rounding, amounts in this document may appear to be marginally different than those shown in the President’s Budget, which is developed in millions.
In tables throughout this document, amounts equal to zero (0) are displayed as dashes (-). Amounts less than 0.5 and greater than zero are rounded and shown as a zero (0). This display treatment is used to prevent the masking of non-zero amounts that do not round up to one (1).
DATA DISPLAY – SCALE
The Budget is most often depicted or described using budget authority as the scale of measurement. However, there are some cases when other measures or scales are used, so the reader should be aware of the context. Also, note that the budget authority tables contained in this document reflect operating levels.
OTHER PUBLICATIONS
The 2017 Annual Performance Report and 2018 Annual Performance Plan, which provides performance information concerning USDA achievements in 2017 and plans for 2018, can be found at: http://www.obpa.usda.gov.
The 2019 Cuts, Consolidations, and Savings Volume of the President’s Budget identifies the lower-priority program activities per the GPRA Modernization Act. The public can access the volume at: http://www.whitehouse.gov/omb/budget.
CONTACT INFORMATION
Questions may be directed to the Office of Budget and Program Analysis via e-mail at [email protected] or telephone at (202) 720-6176.

OVERVIEW 1
OVERVIEW
MISSION STATEMENT
USDA provides leadership on food, agriculture, natural resources, rural development, nutrition, and related issues based on sound public policy, scientific evidence, and efficient management.
2019 FUNDING OVERVIEW
Under current law, the 2019 request for discretionary budget authority to fund programs and operating expenses is about $18 billion, approximately $5.8 billion less than 2018. This includes funding for Special Supplemental Nutrition Program for Women, Infants, and Children (WIC), Rural Development, Forest Service, food safety, research, and conservation activities.
Funding for mandatory programs is estimated to be $122 billion, $1.7 billion greater than 2018.
Figure OV-1. USDA Budget Authority
Under current law, USDA’s total outlays for 2019 are estimated at $140 billion. Outlays for mandatory programs are $117 billion, 84 percent of total outlays. Mandatory programs provide services required by law, but are not funded through annual appropriations acts. Mandatory outlays include crop insurance, nutrition assistance programs, farm commodity and trade programs, and a number of conservation programs. The remaining $23 billion, or 16 percent, of outlays are for discretionary programs such as; WIC, food safety, rural development loans and grants, research and education, soil and water conservation technical assistance, animal and plant health, management of national forests, wildland fire, other Forest Service activities, and domestic and international marketing assistance.
160 140 $137
$144 $24
$139
$18 120 $25
100 80
60 $111 $120 $122
40 20 0
2017 2018 2019
Mandatory Discretionary
$ B
illio
ns

2019 USDA BUDGET SUMMARY 2
Figure OV-2. USDA Outlays
160 $146
140 $140
$128 $25 $23
120 $24
100 80
60 $121
$104 $117
40 20 0
2017 2018 2019
Mandatory Discretionary
$ B
illio
ns
Forestry 4%
Nutrition Assistance 71%
Farm, Conservation, and Commodity
Programs 22%
All Other* 3%
Figure OV-3. 2019 Outlays (All Other includes Rural Development, Research, Food Safety, Marketing and Regulatory, and Departmental Management.)
HIGHLIGHTS BY GOAL 3
HIGHLIGHTS BY GOAL
The Budget supports achievement of USDA’s seven strategic goals.
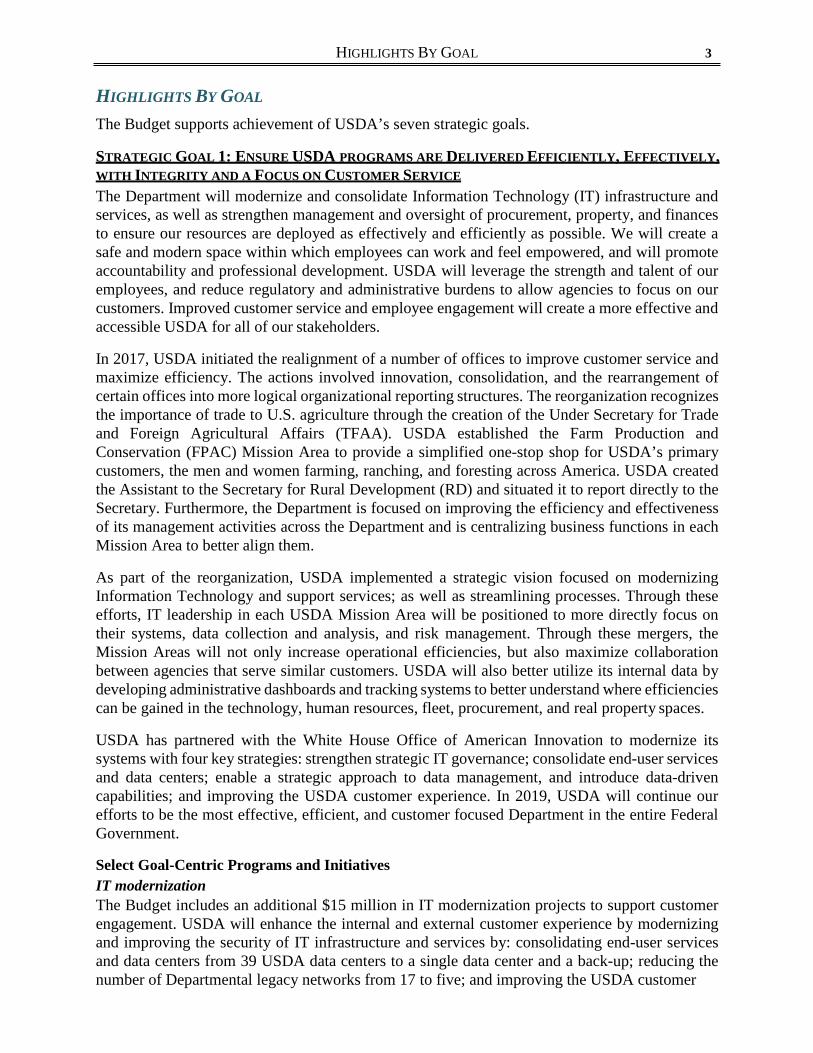
STRATEGIC GOAL 1: ENSURE USDA PROGRAMS ARE DELIVERED EFFICIENTLY, EFFECTIVELY, WITH INTEGRITY AND A FOCUS ON CUSTOMER SERVICE
The Department will modernize and consolidate Information Technology (IT) infrastructure and services, as well as strengthen management and oversight of procurement, property, and finances to ensure our resources are deployed as effectively and efficiently as possible. We will create a safe and modern space within which employees can work and feel empowered, and will promote accountability and professional development. USDA will leverage the strength and talent of our employees, and reduce regulatory and administrative burdens to allow agencies to focus on our customers. Improved customer service and employee engagement will create a more effective and accessible USDA for all of our stakeholders.
In 2017, USDA initiated the realignment of a number of offices to improve customer service and maximize efficiency. The actions involved innovation, consolidation, and the rearrangement of certain offices into more logical organizational reporting structures. The reorganization recognizes the importance of trade to U.S. agriculture through the creation of the Under Secretary for Trade and Foreign Agricultural Affairs (TFAA). USDA established the Farm Production and Conservation (FPAC) Mission Area to provide a simplified one-stop shop for USDA’s primary customers, the men and women farming, ranching, and foresting across America. USDA created the Assistant to the Secretary for Rural Development (RD) and situated it to report directly to the Secretary. Furthermore, the Department is focused on improving the efficiency and effectiveness of its management activities across the Department and is centralizing business functions in each Mission Area to better align them.
As part of the reorganization, USDA implemented a strategic vision focused on modernizing Information Technology and support services; as well as streamlining processes. Through these efforts, IT leadership in each USDA Mission Area will be positioned to more directly focus on their systems, data collection and analysis, and risk management. Through these mergers, the Mission Areas will not only increase operational efficiencies, but also maximize collaboration between agencies that serve similar customers. USDA will also better utilize its internal data by developing administrative dashboards and tracking systems to better understand where efficiencies can be gained in the technology, human resources, fleet, procurement, and real property spaces.
USDA has partnered with the White House Office of American Innovation to modernize its systems with four key strategies: strengthen strategic IT governance; consolidate end-user services and data centers; enable a strategic approach to data management, and introduce data-driven capabilities; and improving the USDA customer experience. In 2019, USDA will continue our efforts to be the most effective, efficient, and customer focused Department in the entire Federal Government.
Select Goal-Centric Programs and Initiatives IT modernization The Budget includes an additional $15 million in IT modernization projects to support customer engagement. USDA will enhance the internal and external customer experience by modernizing and improving the security of IT infrastructure and services by: consolidating end-user services and data centers from 39 USDA data centers to a single data center and a back-up; reducing the number of Departmental legacy networks from 17 to five; and improving the USDA customer
2019 USDA BUDGET SUMMARY 4
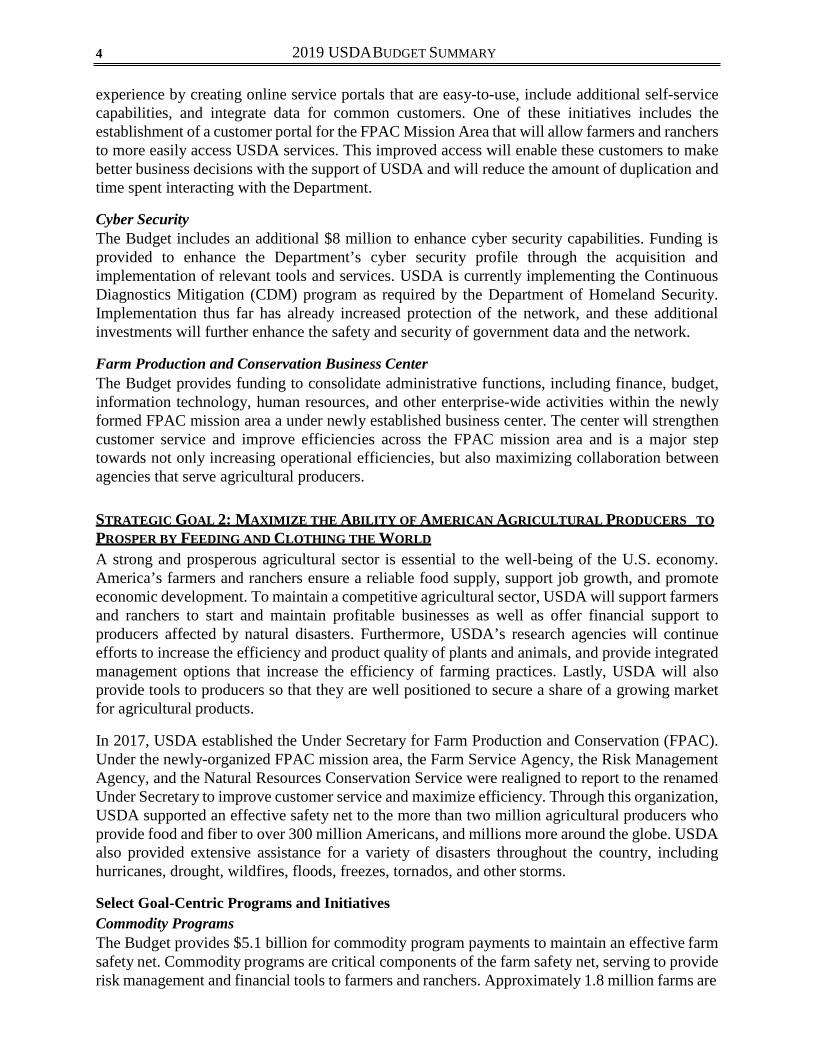
experience by creating online service portals that are easy-to-use, include additional self-service capabilities, and integrate data for common customers. One of these initiatives includes the establishment of a customer portal for the FPAC Mission Area that will allow farmers and ranchers to more easily access USDA services. This improved access will enable these customers to make better business decisions with the support of USDA and will reduce the amount of duplication and time spent interacting with the Department.
Cyber Security The Budget includes an additional $8 million to enhance cyber security capabilities. Funding is provided to enhance the Department’s cyber security profile through the acquisition and implementation of relevant tools and services. USDA is currently implementing the Continuous Diagnostics Mitigation (CDM) program as required by the Department of Homeland Security. Implementation thus far has already increased protection of the network, and these additional investments will further enhance the safety and security of government data and the network.
Farm Production and Conservation Business Center The Budget provides funding to consolidate administrative functions, including finance, budget, information technology, human resources, and other enterprise-wide activities within the newly formed FPAC mission area a under newly established business center. The center will strengthen customer service and improve efficiencies across the FPAC mission area and is a major step towards not only increasing operational efficiencies, but also maximizing collaboration between agencies that serve agricultural producers.
STRATEGIC GOAL 2: MAXIMIZE THE ABILITY OF AMERICAN AGRICULTURAL PRODUCERS TO PROSPER BY FEEDING AND CLOTHING THE WORLD
A strong and prosperous agricultural sector is essential to the well-being of the U.S. economy. America’s farmers and ranchers ensure a reliable food supply, support job growth, and promote economic development. To maintain a competitive agricultural sector, USDA will support farmers and ranchers to start and maintain profitable businesses as well as offer financial support to producers affected by natural disasters. Furthermore, USDA’s research agencies will continue efforts to increase the efficiency and product quality of plants and animals, and provide integrated management options that increase the efficiency of farming practices. Lastly, USDA will also provide tools to producers so that they are well positioned to secure a share of a growing market for agricultural products.
In 2017, USDA established the Under Secretary for Farm Production and Conservation (FPAC). Under the newly-organized FPAC mission area, the Farm Service Agency, the Risk Management Agency, and the Natural Resources Conservation Service were realigned to report to the renamed Under Secretary to improve customer service and maximize efficiency. Through this organization, USDA supported an effective safety net to the more than two million agricultural producers who provide food and fiber to over 300 million Americans, and millions more around the globe. USDA also provided extensive assistance for a variety of disasters throughout the country, including hurricanes, drought, wildfires, floods, freezes, tornados, and other storms.
Select Goal-Centric Programs and Initiatives Commodity Programs The Budget provides $5.1 billion for commodity program payments to maintain an effective farm safety net. Commodity programs are critical components of the farm safety net, serving to provide risk management and financial tools to farmers and ranchers. Approximately 1.8 million farms are
HIGHLIGHTS BY GOAL 5
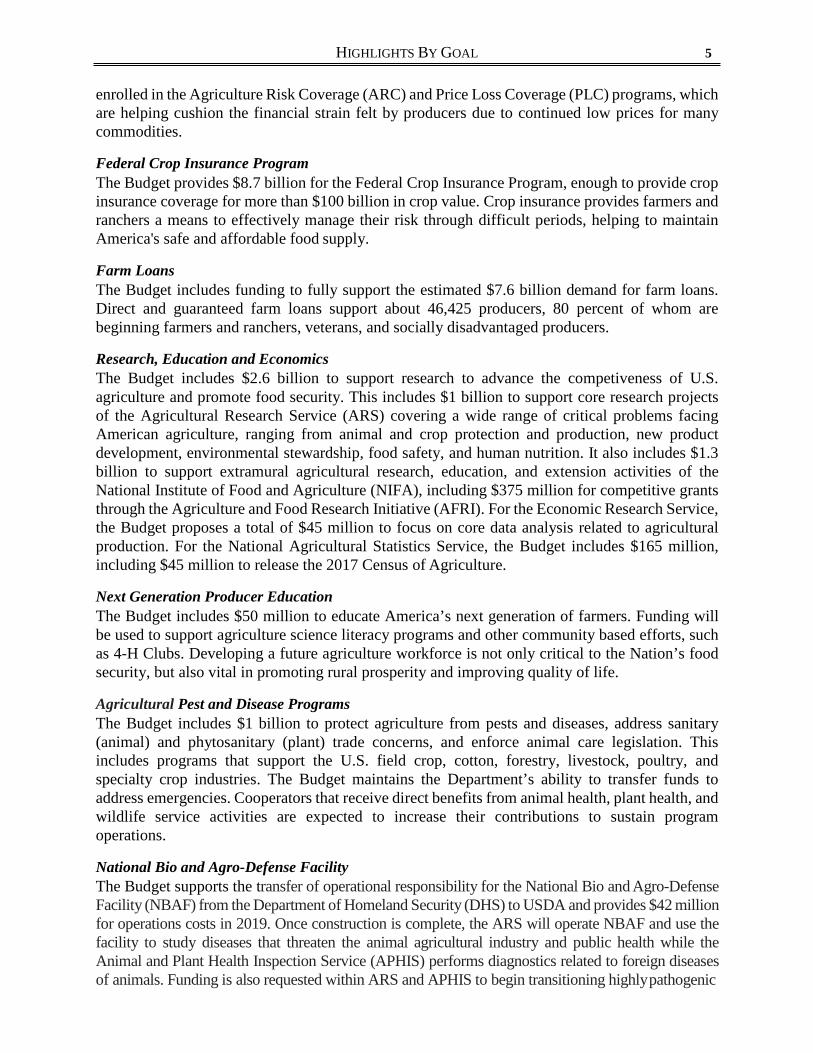
enrolled in the Agriculture Risk Coverage (ARC) and Price Loss Coverage (PLC) programs, which are helping cushion the financial strain felt by producers due to continued low prices for many commodities.
Federal Crop Insurance Program The Budget provides $8.7 billion for the Federal Crop Insurance Program, enough to provide crop insurance coverage for more than $100 billion in crop value. Crop insurance provides farmers and ranchers a means to effectively manage their risk through difficult periods, helping to maintain America's safe and affordable food supply.
Farm Loans The Budget includes funding to fully support the estimated $7.6 billion demand for farm loans. Direct and guaranteed farm loans support about 46,425 producers, 80 percent of whom are beginning farmers and ranchers, veterans, and socially disadvantaged producers.
Research, Education and Economics The Budget includes $2.6 billion to support research to advance the competiveness of U.S. agriculture and promote food security. This includes $1 billion to support core research projects of the Agricultural Research Service (ARS) covering a wide range of critical problems facing American agriculture, ranging from animal and crop protection and production, new product development, environmental stewardship, food safety, and human nutrition. It also includes $1.3 billion to support extramural agricultural research, education, and extension activities of the National Institute of Food and Agriculture (NIFA), including $375 million for competitive grants through the Agriculture and Food Research Initiative (AFRI). For the Economic Research Service, the Budget proposes a total of $45 million to focus on core data analysis related to agricultural production. For the National Agricultural Statistics Service, the Budget includes $165 million, including $45 million to release the 2017 Census of Agriculture.
Next Generation Producer Education The Budget includes $50 million to educate America’s next generation of farmers. Funding will be used to support agriculture science literacy programs and other community based efforts, such as 4-H Clubs. Developing a future agriculture workforce is not only critical to the Nation’s food security, but also vital in promoting rural prosperity and improving quality of life.
Agricultural Pest and Disease Programs The Budget includes $1 billion to protect agriculture from pests and diseases, address sanitary (animal) and phytosanitary (plant) trade concerns, and enforce animal care legislation. This includes programs that support the U.S. field crop, cotton, forestry, livestock, poultry, and specialty crop industries. The Budget maintains the Department’s ability to transfer funds to address emergencies. Cooperators that receive direct benefits from animal health, plant health, and wildlife service activities are expected to increase their contributions to sustain program operations.
National Bio and Agro-Defense Facility The Budget supports the transfer of operational responsibility for the National Bio and Agro-Defense Facility (NBAF) from the Department of Homeland Security (DHS) to USDA and provides $42 million for operations costs in 2019. Once construction is complete, the ARS will operate NBAF and use the facility to study diseases that threaten the animal agricultural industry and public health while the Animal and Plant Health Inspection Service (APHIS) performs diagnostics related to foreign diseases of animals. Funding is also requested within ARS and APHIS to begin transitioning highly pathogenic

2019 USDA BUDGET SUMMARY 6
animal disease work from the obsolete facilities at the Plum Island Animal Disease Center to NBAF. Funding is also requested within ARS and APHIS to begin transitioning highly pathogenic animal disease work from the obsolete facilities at the Plum Island Animal Disease Center to NBAF.
National Bioengineered Food Disclosure Standard The Budget provides $1 million to establish the National Bioengineered Food Disclosure Standard. Public Law 114-216 requires USDA to put in place a national mandatory system for disclosing the presence of bioengineered material. The requirements of the disclosure are being developed through rulemaking.
Fraudulent Organic Imports The Budget includes an increase of $3 million to protect against fraudulent organic imports. Funding will be used to implement information technology enhancements at ports of entry. These improvements will aid in the identification of imports that have been fraudulently labeled as organic.
STRATEGIC GOAL 3: PROMOTE AMERICAN AGRICULTURAL PRODUCTS AND EXPORTS
Expanding international marketing opportunities for U.S. farmers and exporters is a critical source of business and income growth across rural America. It is essential for USDA to continue efforts to promote American agricultural exports, develop international standards, remove trade barriers by monitoring and enforcing existing trade agreements, and negotiate new trade agreements that benefit the U.S. agricultural economy.
In 2015, American farmers and ranchers relied upon exports for 19 percent of farm income. In fiscal year 2016, agricultural exports totaled about $130 billion, making the United States the world’s top agricultural exporter. USDA scored significant trade victories during 2017, including the reentry of U.S. beef to China after a 13-year hiatus; Chinese market access for U.S. rice for the first time ever; easing of regulations on U.S. citrus into the European Union; gaining approval for new biotech varieties in China; resumption of U.S. distillers dried grains into Vietnam and China; reentry of U.S. chipping potatoes into Japan; and lifting of South Korea’s ban on imports of U.S. poultry. In 2019, USDA will enhance its efforts to break down trade barriers and increase agricultural exports.
As part of the reorganization in 2017, the U.S. Codex Alimentarius Office was transferred from the Food Safety and Inspection Service (FSIS) to the Under Secretary TFAA. The U.S. Codex Office is an interagency partnership that engages stakeholders in the development of international governmental and non-governmental food standards. The focus of the Codex Office aligns better with the mission of TFAA. The Under Secretary for Food Safety will continue to be the U.S. Codex Office Policy Committee Chair and the Office will continue to advocate science based codex policies.
Select Goal-Centric Programs and Initiatives International Markets for U.S. Agricultural Exports The Budget includes $433 million to reduce trade barriers that disadvantage U.S. agricultural exports and to open new markets for U.S. farm products. An increase of $10 million is proposed to strengthen monitoring and enforcement of existing trade agreements, support trade-related technical assistance, and respond to urgent situations when trade is disrupted. The value of agricultural exports resulting from participation in foreign food and agricultural trade shows is expected to reach $1.75 billion.
HIGHLIGHTS BY GOAL 7
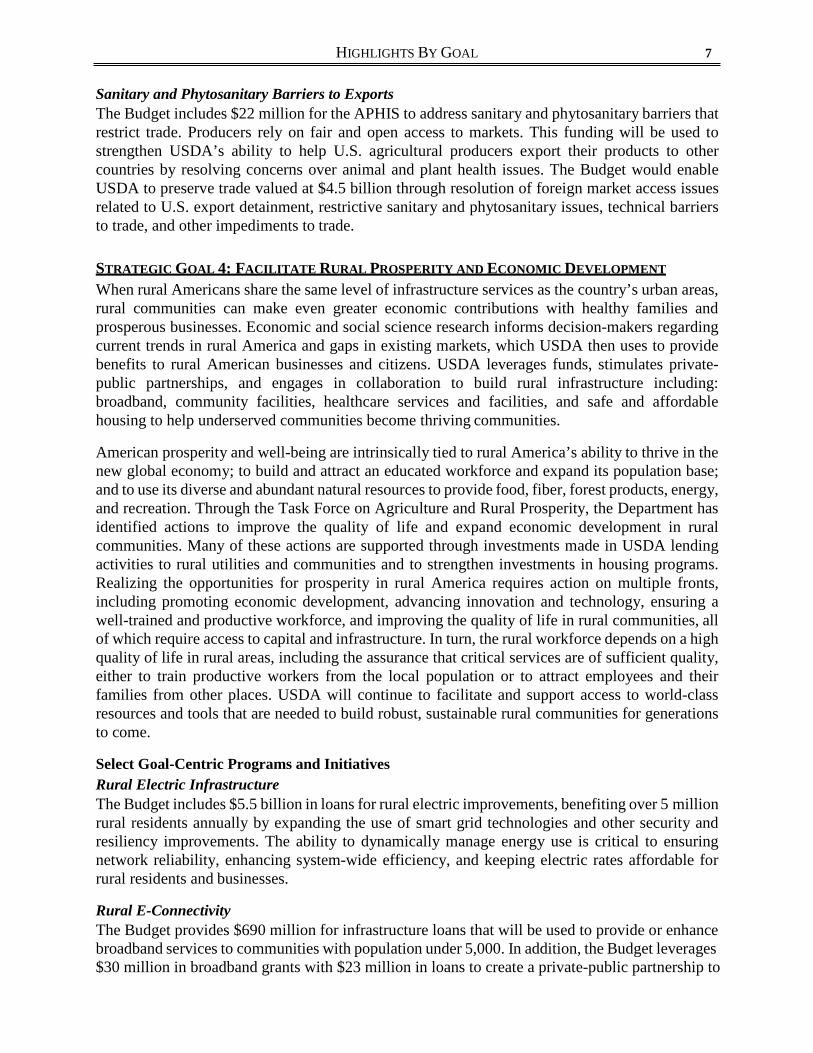
Sanitary and Phytosanitary Barriers to Exports The Budget includes $22 million for the APHIS to address sanitary and phytosanitary barriers that restrict trade. Producers rely on fair and open access to markets. This funding will be used to strengthen USDA’s ability to help U.S. agricultural producers export their products to other countries by resolving concerns over animal and plant health issues. The Budget would enable USDA to preserve trade valued at $4.5 billion through resolution of foreign market access issues related to U.S. export detainment, restrictive sanitary and phytosanitary issues, technical barriers to trade, and other impediments to trade.
STRATEGIC GOAL 4: FACILITATE RURAL PROSPERITY AND ECONOMIC DEVELOPMENT
When rural Americans share the same level of infrastructure services as the country’s urban areas, rural communities can make even greater economic contributions with healthy families and prosperous businesses. Economic and social science research informs decision-makers regarding current trends in rural America and gaps in existing markets, which USDA then uses to provide benefits to rural American businesses and citizens. USDA leverages funds, stimulates private- public partnerships, and engages in collaboration to build rural infrastructure including: broadband, community facilities, healthcare services and facilities, and safe and affordable housing to help underserved communities become thriving communities.
American prosperity and well-being are intrinsically tied to rural America’s ability to thrive in the new global economy; to build and attract an educated workforce and expand its population base; and to use its diverse and abundant natural resources to provide food, fiber, forest products, energy, and recreation. Through the Task Force on Agriculture and Rural Prosperity, the Department has identified actions to improve the quality of life and expand economic development in rural communities. Many of these actions are supported through investments made in USDA lending activities to rural utilities and communities and to strengthen investments in housing programs. Realizing the opportunities for prosperity in rural America requires action on multiple fronts, including promoting economic development, advancing innovation and technology, ensuring a well-trained and productive workforce, and improving the quality of life in rural communities, all of which require access to capital and infrastructure. In turn, the rural workforce depends on a high quality of life in rural areas, including the assurance that critical services are of sufficient quality, either to train productive workers from the local population or to attract employees and their families from other places. USDA will continue to facilitate and support access to world-class resources and tools that are needed to build robust, sustainable rural communities for generations to come.
Select Goal-Centric Programs and Initiatives Rural Electric Infrastructure The Budget includes $5.5 billion in loans for rural electric improvements, benefiting over 5 million rural residents annually by expanding the use of smart grid technologies and other security and resiliency improvements. The ability to dynamically manage energy use is critical to ensuring network reliability, enhancing system-wide efficiency, and keeping electric rates affordable for rural residents and businesses.
Rural E-Connectivity The Budget provides $690 million for infrastructure loans that will be used to provide or enhance broadband services to communities with population under 5,000. In addition, the Budget leverages $30 million in broadband grants with $23 million in loans to create a private-public partnership to
2019 USDA BUDGET SUMMARY 8
expand high speed e-connectivity to rural Americans. It also includes $24 million for distance learning and telemedicine loans. Electronic connectivity is fundamental for economic development, innovation, advancements in technology, workforce readiness, and an improved quality of life. As of 2014, 39 percent of the rural population lacked access to broadband at speeds necessary for advanced telecommunications and data transfer capability. The e-connectivity gap not only prevents rural Americans from participating in the global marketplace, but also limits urban Americans from accessing innovations and products from rural America.
Water and Waste Disposal Infrastructure The Budget includes funding to support $1.2 billion in direct loans to improve and expand the water and waste disposal facilities in rural America. Safe drinking water and sanitary waste disposal systems are vital to achieving a high quality of life and are essential to many rural residents. For 2019, USDA will provide improved services to nearly 1.5 million rural residents.
Community Infrastructure The Budget includes $3.5 billion to support the Community Facilities Direct Loan Program for investment in critical community infrastructure, such as healthcare, safety, and educational facilities. Improved access to mental and behavioral care are vital to address the nationwide opioid crisis and other substance abuse in rural communities. Planned investments will allow over 5 million rural residents to receive access to improved healthcare and safety facilities, including hospitals and mental health clinics.
Rural Housing Infrastructure The Budget includes funding to support $24 billion in funding to enable approximately 164,000 families to enjoy homeownership through the Single Family Housing Guaranteed Loan Program. The Budget also provides $250 million for multi-family guaranteed loans to support the development of more than 8,000 units for very low, low, and moderate-income rural residents. USDA works with other public and private partners to better leverage its investment in housing; in 2017, approximately $4 was invested by partners for every USDA dollar invested. To help very low- and low-income households afford their rental payments, the Budget includes $1.3 billion to maintain rental assistance payments, enough to fund about 274,000 contracts.
STRATEGIC GOAL 5: STRENGTHEN THE STEWARDSHIP OF PRIVATE LANDS THROUGH TECHNOLOGY AND RESEARCH
The world population is expected reach 9.7 billion by 2050. Feeding this population will require adoption of new science and technologies and the implementation of science-based conservation plans to sustainably increase agricultural production. To ensure U.S. private working lands and public agricultural landscapes are conserved the Department will provide technical and financial assistance using the latest technology and research available. New and improved practices result from fundamental and applied research that facilitates our understanding of the complex interactions between human systems and the environment, and transferring the resulting knowledge into the hands of producers and land managers through information, tools, and decision support.
In 2017, USDA and its partners helped more than 680,000 land managers invest in their operations. This work resulted in conservation plans for 27 million acres of working lands – an area the size of Tennessee. For 2019, USDA will continue to provide significant resources to support conservation practices and measures that will improve stewardship of our natural resources.
HIGHLIGHTS BY GOAL 9
Select Goal-Centric Programs and Initiatives Farm Bill Conservation Programs The Budget includes $2.2 billion for the Conservation Reserve Program (CRP) to protect close to 24 million acres of environmentally sensitive cropland and grassland. In addition, $1.6 billion is included for the Environmental Quality Incentives Program (EQIP) and $250 million for the Agricultural Conservation Easement Program.
STRATEGIC GOAL 6: ENSURE PRODUCTIVE AND SUSTAINABLE USE OF OUR NATIONAL FOREST SYSTEM LANDS
The Nation’s forests and grasslands are a fundamental part of the American landscape, and are a legacy that the Forest Service holds in trust for present and future generations. Forests provide clean air and water, forest and rangeland products, mineral and energy resources, jobs, quality habitat for fish and wildlife, recreational opportunities, and memorable experiences. The Forest Service plays a critical role in making America’s forests and grasslands resilient to threats and disturbances while mitigating wildfire risk. The Department also manages the National forests and grasslands to ensure that they are healthy and sustainable, while also allowing rural communities to access and benefit from economic opportunities that our Nation’s forests offer. This work is complemented by USDA’s research in forestry, ecology, and economics to ensure world-class science guides effective policies and management practices.
Select Goal-Centric Programs and Initiatives Reducing the Risk of Wildfires The Budget includes $2.5 billion to mitigate wildfire risk. The Budget supports the Forest Service’s activities that protect life, property and natural resources on National Forest System (NFS) lands, other federal lands, and an additional 20 million acres of non-federal lands under agreements. The Budget supports treatment of hazardous fuels within highest priority areas. The Budget also fully funds the 10-year average for Suppression and enables Preparedness to fully cover firefighter base 8 salary hours. The Budget also proposes to amend the Balanced Budget and Emergency Deficit Control Act to establish a separate annual cap adjustment for wildfire suppression operations, similar to how unanticipated funding needs for other natural disasters are addressed. The Budget provides $228 million to support an aviation fleet that meets wildland fire response requirements, including up to 18 airtankers and 108 helicopters.
Forest Health The Budget includes an investment of $1.3 billion to improve the health and resilience of National forests, ensuring that our National forests and grasslands continue to provide clean air and water, forest and rangeland products, mineral and energy resources, quality habitat for fish and wildlife, recreational opportunities, and jobs. With $390 million for Hazardous Fuels Reduction and $341 million for Forest Products, among other programs, the agency will accomplish a timber output of 3.7 billion board feet, 2.1 million acres of restoration, and improve 14 watersheds. The Budget also proposes $85.9 million to address the greatest emerging threats to forest health on and off Forest Service land.
Recreational Opportunities in National Forests The Budget includes $240 million to increase recreational opportunities in National forests. USDA supports the economic health of rural communities through improved access to National forests by supporting outdoor recreational opportunities. The Budget will prioritize permitting for outfitters and guides, maintaining and growing strong collaborations with partners and volunteer
2019 USDA BUDGET SUMMARY 10
groups, and working to address the recreational needs of today's public, who want year-round activities on NFS lands.
Law Enforcement on National Forest System Lands The Budget includes $129 million, an increase of $3 million, to enable marijuana eradication and grow site clean-up and reclamation.
STRATEGIC GOAL 7: PROVIDE ALL AMERICANS ACCESS TO A SAFE, NUTRITIOUS, AND SECURE FOOD SUPPLY
A plentiful supply of safe and nutritious food is essential to the healthy development of every child in America and to the well-being and productivity of every family. USDA works to help prevent foodborne illness and protect public health as well as aid access to safe, nutritious, and balanced meals and promote a healthy diet.
USDA’s nutrition assistance programs help ensure food security by providing access to a nutritious diet with emphasis on those facing particular need due to unemployment, recession, disaster, age, or disability. These programs also work to promote well-being by providing assistance to help ensure access to a diet consistent with the Dietary Guidelines for Americans.
USDA supports and protects the Nation’s agricultural system and the consumers it serves by safeguarding the quality and wholesomeness of meat, poultry, and egg products. USDA has collaborated extensively with other Federal partners to safeguard the food supply, prevent foodborne illnesses and improve consumers’ knowledge about the food they eat. USDA will continue to focus on preventing product contamination and foodborne illness and modernizing systems and approaches to safeguard the food Americans serve their families every single day.
Select Goal-Centric Programs and Initiatives Safeguards the Nation's Food Supply The Budget includes more than $1 billion to fully fund the costs necessary to support over 8,100 personnel located at over 6,400 processing and slaughter establishments for meat, poultry, and egg products in the U.S. These personnel act as frontline inspectors and investigators and provide surveillance to protect the Nation's food supply and further the mission of FSIS.
Nutrition Assistance The Budget includes funding to support estimated participation levels under current law, including $73.2 billion for the Supplemental Nutrition Assistance Program (SNAP), $23.1 billion for Child Nutrition Programs, and $5.8 billion for the Special Supplemental Nutrition Program for Women, Infants, and Children (WIC). In 2019, estimated participation levels are: 40.8 million per month for SNAP, 30.7 million per day for the National School Lunch Program, and 6.9 million per month for WIC.
2020 Dietary Guidelines for Americans (DGA) The Budget includes $12 million to develop the 2020 DGA for which USDA is the lead agency. Starting with the 2020 DGA, the scope will be expanded to include guidance for pregnant women, toddlers, and infants.
HIGHLIGHTS BY GOAL 11
PROGRAM REFORMS
The 2019 President’s Budget includes legislative proposals to reform programs to better target Federal dollars, while contributing to deficit reduction efforts. The Budget also reduces and eliminates programs that do not support USDA’s core mission or are a lower priority.
Reform the Food Safety Net While Promoting Work The Budget includes a bold new approach to nutrition assistance that combines the use of traditional SNAP Electronic Benefit Transfer (EBT) cards with a USDA Foods Box that contains 100 percent American grown products. In addition, the Budget focuses on innovative administrative reforms on outcome-based employment strategies. This expands on previous proposals to strengthen expectations for work among able-bodied adults that will lead to self- sufficiency, reserves benefits for those most in need, promotes efficiency in State operations, and improves program integrity. Specifically, the USDA Foods Box proposal within SNAP has the potential to reduce waste, fraud, and abuse by limiting opportunities for benefits to be misused or trafficked. Combined, these reforms will save American taxpayers over $200 billion over ten years, while maintaining a commitment to ensuring all Americans have access to food and being good stewards of taxpayer dollars.
Prioritizing Waste, Fraud, and Abuse in SNAP The Budget proposes a legislative change requiring mandatory State use of the National Accuracy Clearinghouse (NAC) in administering SNAP. The NAC will eliminate dual SNAP participation nationwide. The Budget also proposes the elimination of State performance bonuses. USDA conducted a nationwide review of the accuracy of State reported error data and found widespread underreporting of payment errors, which suggests that bonuses provided States with incentives to underreport.
Target Commodity Programs and Crop Insurance The Budget proposes legislation to optimize and improve crop insurance and commodity programs in a way that maintains a strong safety net while also achieving savings, reducing subsidies to higher income farmers, and reducing payments made to private sector insurance companies. The Budget includes a set of proposals, including those that would reduce the average premium subsidy for crop insurance from 62 percent to 48 percent and limit commodity and crop insurance subsidies to those producers that have an Adjusted Gross Income of $500,000 or less. Additionally, the Budget proposes reductions to subsidies provided to participating insurance companies by capping underwriting gains at 12 percent, which will ensure that the companies receive a more reasonable rate of return given the risks associated with their participation in the crop insurance program. The Budget proposes to eliminate an unnecessary and separate payment limit for peanut producers and limit eligibility for commodity subsidies to one manager per farm. In total, these reforms are expected to save more than $33 billion over 10 years.
Streamline Conservation Programs The Budget proposes legislation to streamline Federal conservation efforts to focus on programs that protect environmentally sensitive land and increase conservation practice implementation. Funding for the EQIP would be increased $60 million per year, while the Conservation Stewardship Program and the Regional Conservation and Partnership Program would be terminated. Proposals are also included to target enrollment and incentive payments for CRP. In total, these reforms are expected to save more than $14 billion over 10 years.
2019 USDA BUDGET SUMMARY 12
Comprehensive Solution to Wildfire Funding The Budget supports a legislative solution to address the way the Forest Service funds wildland firefighting so that the agency is not routinely borrowing money from prevention programs to combat ongoing wildfires. For example, in 2017, Forest Service wildfire suppression spending reached a record $2.4 billion, necessitating transfers of $527 million from other programs. Historically, these transfers have been repaid in subsequent appropriations; however, fire borrowing impedes the missions of land management agencies to reduce the risk of catastrophic fire and restore and maintain healthy functioning ecosystems. To resolve concerns about the sufficiency of land management and funding wildfire suppression, the Budget responsibly funds 100 percent of the rolling 10-year average cost for wildfire suppression in the Departments of Agriculture and the Interior within discretionary budget caps. Similar to how unanticipated funding needs for other natural disasters are addressed, the Budget proposes a separate fund that will include an annual cap adjustment appropriation for wildfire suppression to ensure that adequate resources are available to fight wildland fires, protect communities, and safeguard human life during the most severe wildland fire seasons.
Modernize Inspection Activities The Budget includes proposed legislation to charge a user fee to cover certain inspection, regulatory, and oversight activities. The proposals range from inspection of meat, poultry, and egg products to enforcement of animal welfare requirements. The Budget also proposes user fees for grain standardization and a Packers and Stockyards license fee to cover program costs. Fee proposals to help offset the cost of biotechnology and veterinary biologic regulation are also included in the Budget. The Budget proposes a user fee to recover the cost of providing Agricultural Quarantine and Inspection (AQI) services within the U.S. and its Territories, which is consistent with how AQI activities are funded for passengers and cargo originating outside of the U.S. Legislation will be proposed to use assessments to cover the Marketing Order and Agreements Federal administrative costs. In total, these reforms are expected to save about $7.1 billion over 10 years.
Elimination of Lower Priority Programs The Budget includes proposals to eliminate several programs to reduce spending, including the Rural Business-Cooperative Service programs, the Single Family Housing Direct Loan program, water and waste grants, the McGovern-Dole International Food for Education Program, Food for Progress, school equipment grants, among others. The Budget includes a proposal to eliminate the Commodity Supplemental Food Program and transfer program participants to SNAP. Also included is a proposal to transfer the responsibility for Siluriformes inspection back to the Food and Drug Administration.

FARM PRODUCTION AND CONSERVATION 13
FARM PRODUCTION AND CONSERVATION
MISSION
As part of the USDA reorganization in May 2017, the Farm Production and Conservation (FPAC) mission area was formed to focus on domestic agricultural issues. Locating the Farm Service Agency (FSA), the Risk Management Agency (RMA), and the Natural Resources Conservation Service (NRCS) under one mission area provides a simplified one-stop shop for USDA’s primary customers, the men and women farming, ranching, and managing forests across America. FSA, RMA and NRCS implement programs designed to mitigate the significant risks of farming through crop insurance, conservation programs and technical assistance, and commodity, lending, and disaster programs.
When American farmers are financially healthy, they not only support themselves and their families, but also their employees, local equipment dealers, farm service suppliers and the rural communities where they live and do business. In 2015, U.S. farms produced more than $425 billion in gross output and purchased more than $225 billion in inputs. That has a big impact on rural America and also the national economy. In 2015, 21 million full- and part-time jobs, or 11 percent of total U.S. employment, were related to the agricultural and food sectors.
In 2017, FSA provided over $7.9 billion in Agriculture Risk Coverage (ARC) and Price Loss Coverage (PLC) financial assistance to producers for the 2015 crop year. ARC and PLC are an important part of the farm safety net, providing assistance during crop revenue or commodity downturns.
FSA continues to provide tools for America’s farmers to be good stewards of the land. The Conservation Reserve Program (CRP) has protected and conserved environmentally sensitive land since 1985. In 2017, USDA enrolled 390,000 acres under general signup, and approved 1.2 million acres under continuous signups and 511,000 acres in the CRP grasslands program.
FSA farm loan programs provide an important safety net for producers, by providing a source of credit when they are temporarily unable to obtain credit from commercial sources. The majority of FSA’s direct and guaranteed farm ownership and operating loans are targeted to underserved populations such as beginning farmers and socially disadvantaged producers, who generally have had a more difficult time obtaining credit to maintain and expand their operations. In 2017, FSA made available $7.7 billion through direct and guaranteed loans.
Crop insurance is designed to allow farmers and ranchers to effectively manage their risk through difficult periods, helping to maintain America's food supply and the sustainability of small, limited resource, socially disadvantaged and other underserved farmers. In crop year 2017, the Federal crop insurance program provided protection for more than $100 billion in agricultural production.
NRCS works in partnership with private landowners, communities, local governments, and other stakeholders to promote the sustainable use and safeguard the productivity of the Nation’s private working lands. The agency provides conservation planning, technical assistance, and financial assistance to farmers, ranchers and foresters to help them conserve, enhance and protect natural resources. In addition, NRCS works with these partners to leverage resources and innovative ideas to make the landscape and critical infrastructure more resilient. In 2017, conservationists assisted in developing conservation plans on 27 million acres of private land.
2019 USDA BUDGET SUMMARY 14
In October 2017, the FPAC Business Center (FBC) was formed to consolidate enterprise-wide back-office functions within the newly formed FPAC mission area. FBC will be responsible for financial management, budgeting, human resources, information technology, acquisitions/ procurement, customer experience, internal controls, risk management, strategic and annual planning, and other mission-wide activities in support of the customers and employees of FSA, NRCS, and RMA.
FARM SERVICE AGENCY
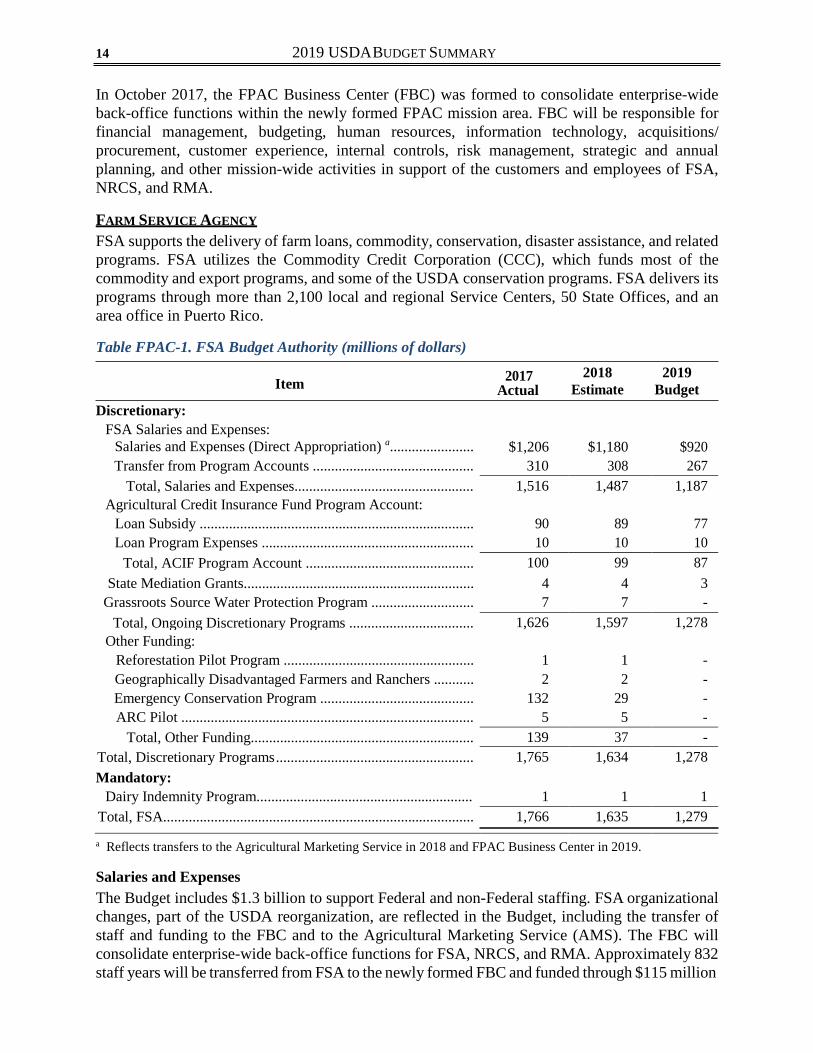
FSA supports the delivery of farm loans, commodity, conservation, disaster assistance, and related programs. FSA utilizes the Commodity Credit Corporation (CCC), which funds most of the commodity and export programs, and some of the USDA conservation programs. FSA delivers its programs through more than 2,100 local and regional Service Centers, 50 State Offices, and an area office in Puerto Rico.
Table FPAC-1. FSA Budget Authority (millions of dollars)
Discretionary: FSA Salaries and Expenses:
Item 2017 Actual
2018 Estimate
2019 Budget
Salaries and Expenses (Direct Appropriation) a....................... $1,206 $1,180 $920 Transfer from Program Accounts ............................................ 310 308 267
Total, Salaries and Expenses................................................. 1,516 1,487 1,187 Agricultural Credit Insurance Fund Program Account:
Loan Subsidy ........................................................................... 90 89 77 Loan Program Expenses .......................................................... 10 10 10
Total, ACIF Program Account .............................................. 100 99 87 State Mediation Grants............................................................... 4 4 3
Grassroots Source Water Protection Program ............................ 7 7 - Total, Ongoing Discretionary Programs .................................. 1,626 1,597 1,278
Other Funding: Reforestation Pilot Program .................................................... 1 1 - Geographically Disadvantaged Farmers and Ranchers ........... 2 2 - Emergency Conservation Program .......................................... 132 29 - ARC Pilot ................................................................................ 5 5 -
Total, Other Funding............................................................. 139 37 - Total, Discretionary Programs ...................................................... 1,765 1,634 1,278 Mandatory:
Dairy Indemnity Program...........................................................
1
1
1 Total, FSA..................................................................................... 1,766 1,635 1,279
a Reflects transfers to the Agricultural Marketing Service in 2018 and FPAC Business Center in 2019.
Salaries and Expenses The Budget includes $1.3 billion to support Federal and non-Federal staffing. FSA organizational changes, part of the USDA reorganization, are reflected in the Budget, including the transfer of staff and funding to the FBC and to the Agricultural Marketing Service (AMS). The FBC will consolidate enterprise-wide back-office functions for FSA, NRCS, and RMA. Approximately 832 staff years will be transferred from FSA to the newly formed FBC and funded through $115 million
FARM PRODUCTION AND CONSERVATION 15
in direct appropriations and a $16 million transfer from the Agricultural Credit Insurance Fund (ACIF). Additionally, the international commodity procurement and U.S. Warehouse Act functions were transferred to AMS, along with 139 staff years and $18.2 million to administer these functions.
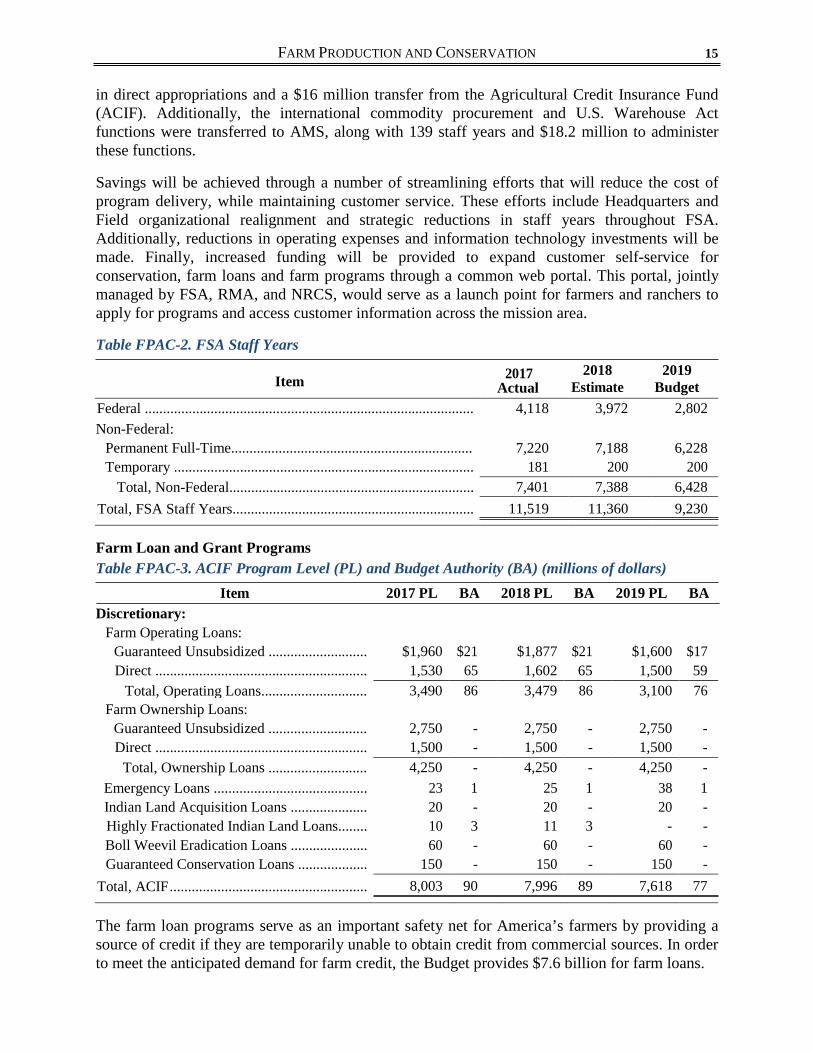
Savings will be achieved through a number of streamlining efforts that will reduce the cost of program delivery, while maintaining customer service. These efforts include Headquarters and Field organizational realignment and strategic reductions in staff years throughout FSA. Additionally, reductions in operating expenses and information technology investments will be made. Finally, increased funding will be provided to expand customer self-service for conservation, farm loans and farm programs through a common web portal. This portal, jointly managed by FSA, RMA, and NRCS, would serve as a launch point for farmers and ranchers to apply for programs and access customer information across the mission area.
Table FPAC-2. FSA Staff Years
Item 2017 Actual
2018 Estimate
2019 Budget
Federal .......................................................................................... 4,118 3,972 2,802 Non-Federal:
Permanent Full-Time..................................................................
7,220
7,188
6,228 Temporary .................................................................................. 181 200 200
Total, Non-Federal................................................................... 7,401 7,388 6,428 Total, FSA Staff Years.................................................................. 11,519 11,360 9,230
Farm Loan and Grant Programs Table FPAC-3. ACIF Program Level (PL) and Budget Authority (BA) (millions of dollars)
Item 2017 PL BA 2018 PL BA 2019 PL BA
Discretionary: Farm Operating Loans:
Guaranteed Unsubsidized ........................... $1,960 $21 $1,877 $21 $1,600 $17 Direct .......................................................... 1,530 65 1,602 65 1,500 59
Total, Operating Loans............................. 3,490 86 3,479 86 3,100 76 Farm Ownership Loans:
Guaranteed Unsubsidized ........................... 2,750 - 2,750 - 2,750 - Direct .......................................................... 1,500 - 1,500 - 1,500 -
Total, Ownership Loans ........................... 4,250 - 4,250 - 4,250 - Emergency Loans .......................................... 23 1 25 1 38 1 Indian Land Acquisition Loans ..................... 20 - 20 - 20 - Highly Fractionated Indian Land Loans........ 10 3 11 3 - - Boll Weevil Eradication Loans ..................... 60 - 60 - 60 - Guaranteed Conservation Loans ................... 150 - 150 - 150 -
Total, ACIF ...................................................... 8,003 90 7,996 89 7,618 77
The farm loan programs serve as an important safety net for America’s farmers by providing a source of credit if they are temporarily unable to obtain credit from commercial sources. In order to meet the anticipated demand for farm credit, the Budget provides $7.6 billion for farm loans.

2019 USDA BUDGET SUMMARY 16
The Budget supports an estimated 46,425 farmers and ranchers by financing operating expenses and providing opportunities to acquire a farm or keep an existing one. The availability of farm operating loans provides farmers with short-term credit to finance the costs of continuing or improving their farming operations, such as purchasing seed, fertilizer, livestock, feed, equipment, and other supplies. For farm operating loans, the Budget provides $1.5 billion for direct loans and $1.6 billion for guaranteed loans. The requested loan levels will serve an estimated 32,561 farmers, 26,785 of whom will receive direct loans and 5,776 will receive guaranteed loans. For farm ownership loans, the Budget includes funding to support $1.5 billion in direct loans and $2.75 billion for guaranteed loans. These loan levels will provide 13,864 people with the opportunity to either acquire their own farm or keep an existing one; 8,241 borrowers will receive direct loans and 5,623 will receive guaranteed loans.
The Budget includes $38 million loan level for emergency (EM) loans. Demand for EM loans is difficult to predict; funding is requested to ensure that support is available in the event of a natural disaster. The Budget requests a loan level of $20 million for Indian Land Acquisition loans, the same as 2018. No funding is requested for the Highly Fractionated Indian Loan program. The loan level funding for boll weevil eradication remains at $60 million, the same as 2018.
Funding for State mediation grants is proposed at $3.2 million. These grants are made to States to support certified programs that provide alternative dispute resolution.
USDA strives to continually increase service to our customers. A key performance measure reflecting customer service in the direct farm loan program is shown in table FPC-4.
Table FPC-4. Key Performance Measure (KPM) – Average Number of Days to process Direct Loans
Key Performance Measure
Baseline 2018
Target 2019
Target
Average number of days to process direct loans 31 31 30
Commodity Credit Corporation Table FPAC-5. CCC Budget Authority (millions of dollars)
Item 2017 Actual
2018 Estimate
2019 Budget
Mandatory: Commodity Credit Corporation Fund ........................................ $7,062 $8,450 $11,349 Tobacco Trust Fund ................................................................... 3 - -
Total, Current Law........................................................................ 7,065 8,450 11,349 Proposed Legislation a ................................................................ - - -1,031
Total, CCC .................................................................................... 7,065 8,450 10,318 a The Budget includes proposals for changes to certain programs above.
Commodity Programs The commodity programs provide risk management and financial tools to farmers and ranchers. These programs, including the Agriculture Risk Coverage (ARC), Price Loss Coverage (PLC), and Margin Protection Program for Dairy (MPP), provide protection against adverse market fluctuations; hence, outlays for many of these programs vary significantly from year to year as market conditions change. Total CCC net outlays (Table FPAC-6) in 2019 are approximately $2.6 billion lower than 2018 under current law, primarily due to lower outlays for ARC and PLC. The

FARM PRODUCTION AND CONSERVATION 17
estimated outlays for ARC and PLC for 2019 are based on changes in the projected marketing year average commodity prices.
Table FPAC-6. CCC Net Outlays (millions of dollars)
Item 2017 Actual
2018 Estimate
2019 Budget
Commodity Programs: Direct Payments ......................................................................... $4 - - Loan Deficiency Payments......................................................... 52 $7 $22 Agriculture Risk Coverage/Price Loss Coverage....................... 7,945 7,556 4,965 Dairy Margin Protection Program .............................................. 0 31 57 Other........................................................................................... 124 172 49 Subtotal, Commodity Payments .............................................. 8,126 7,766 5,094
Disaster....................................................................................... 401 464 487 Noninsured Crop Disaster Assistance Program ......................... 157 150 150 Biomass Crop Assistance Program (BCAP) .............................. 5 - - All Other..................................................................................... -41 475 489
Total, CCC Commodity Programs........................................... 8,648 8,855 6,220 Conservation Programs:
Conservation Reserve Program ............................................... 1,882 2,128 2,220 Emergency Forestry Conservation Reserve Program .............. 5 2 2
Total, Conservation Programs............................................... 1,886 2,130 2,222 Export Programs:
Quality Samples Program ........................................................ 1 3 3 Market Access Program (MAP) .............................................. 200 200 200 Foreign Market Development (Cooperator) Program a............ 33 35 - Technical Assistance for Specialty Crops Program a............... 9 9 -
Total, Export Programs ......................................................... 243 246 203 Total CCC Fund............................................................................ 10,778 11,231 8,644 Other CCC Activities:
CCC Export Loans (including Liquidating Account) ................ 23 25 12 Pima Agriculture Cotton Trust Fund a........................................ 15 16 - Agricultural Wool Apparel Manufacturers Trust Fund.............. 27 28 30 Farm Storage Facility Loans ...................................................... 11 11 -
Total, Other CCC Programs.......................................................... 76 80 42 Total, Current Law........................................................................ 10,854 11,311 8,686
Proposed Legislation b ................................................................ - - -1,031 Total, CCC .................................................................................... 10,854 11,311 7,655 a Not confirmed in the baseline for 2019. b The Budget includes proposals for changes to certain programs above.
ARC and PLC provides assistance only when commodity revenue or price downturns occur. Under ARC, producers were given the choice to elect ARC–County (ARC-CO) or ARC-Individual (ARC-IC). ARC-CO offers revenue protection on a county basis. ARC-IC offers revenue protection on an individual farm basis. Farm operators were required to make a one-time election of ARC and/or PLC for each of their covered commodities through the 2018 crop year. Producers were able to elect PLC or ARC-CO on a commodity-by-commodity basis, but ARC-IC had to be
2019 USDA BUDGET SUMMARY 18
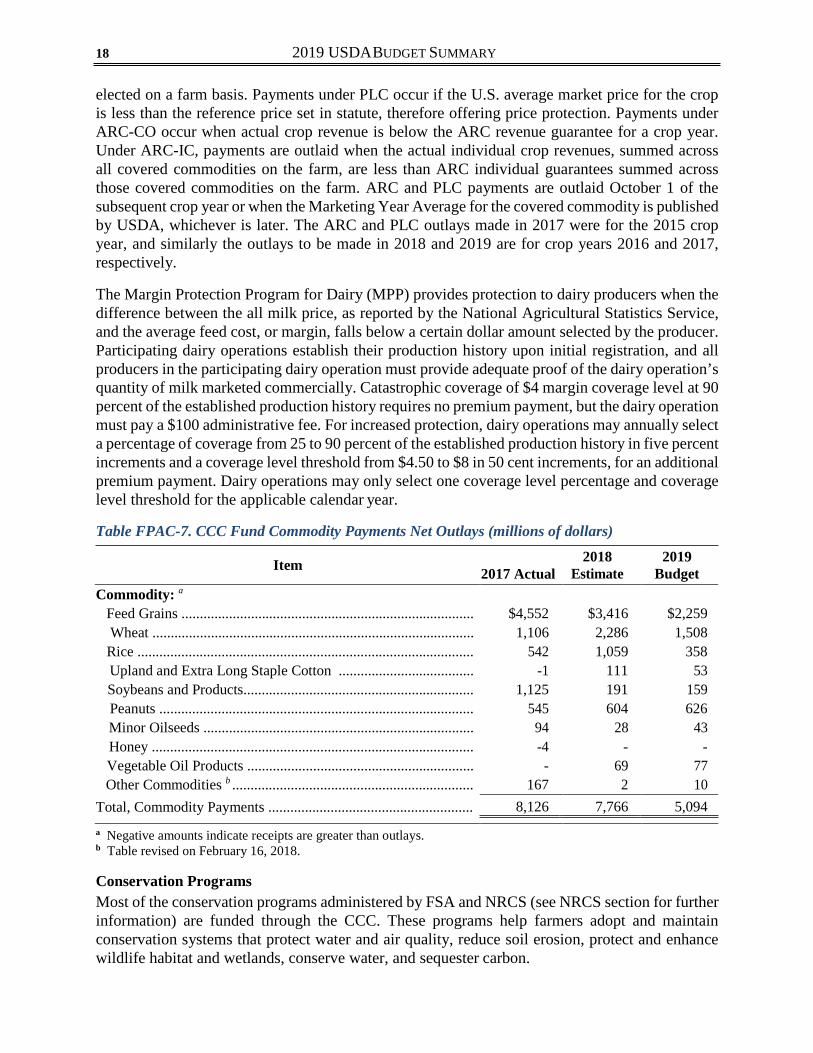
elected on a farm basis. Payments under PLC occur if the U.S. average market price for the crop is less than the reference price set in statute, therefore offering price protection. Payments under ARC-CO occur when actual crop revenue is below the ARC revenue guarantee for a crop year. Under ARC-IC, payments are outlaid when the actual individual crop revenues, summed across all covered commodities on the farm, are less than ARC individual guarantees summed across those covered commodities on the farm. ARC and PLC payments are outlaid October 1 of the subsequent crop year or when the Marketing Year Average for the covered commodity is published by USDA, whichever is later. The ARC and PLC outlays made in 2017 were for the 2015 crop year, and similarly the outlays to be made in 2018 and 2019 are for crop years 2016 and 2017, respectively.
The Margin Protection Program for Dairy (MPP) provides protection to dairy producers when the difference between the all milk price, as reported by the National Agricultural Statistics Service, and the average feed cost, or margin, falls below a certain dollar amount selected by the producer. Participating dairy operations establish their production history upon initial registration, and all producers in the participating dairy operation must provide adequate proof of the dairy operation’s quantity of milk marketed commercially. Catastrophic coverage of $4 margin coverage level at 90 percent of the established production history requires no premium payment, but the dairy operation must pay a $100 administrative fee. For increased protection, dairy operations may annually select a percentage of coverage from 25 to 90 percent of the established production history in five percent increments and a coverage level threshold from $4.50 to $8 in 50 cent increments, for an additional premium payment. Dairy operations may only select one coverage level percentage and coverage level threshold for the applicable calendar year.
Table FPAC-7. CCC Fund Commodity Payments Net Outlays (millions of dollars)
Item
2017 Actual 2018
Estimate 2019
Budget
Commodity: a Feed Grains ................................................................................ $4,552 $3,416 $2,259 Wheat ........................................................................................ 1,106 2,286 1,508 Rice ............................................................................................ 542 1,059 358 Upland and Extra Long Staple Cotton ..................................... -1 111 53 Soybeans and Products............................................................... 1,125 191 159 Peanuts ...................................................................................... 545 604 626 Minor Oilseeds .......................................................................... 94 28 43 Honey ........................................................................................ -4 - - Vegetable Oil Products .............................................................. - 69 77 Other Commodities b .................................................................. 167 2 10
Total, Commodity Payments ........................................................ 8,126 7,766 5,094 a Negative amounts indicate receipts are greater than outlays. b Table revised on February 16, 2018.
Conservation Programs Most of the conservation programs administered by FSA and NRCS (see NRCS section for further information) are funded through the CCC. These programs help farmers adopt and maintain conservation systems that protect water and air quality, reduce soil erosion, protect and enhance wildlife habitat and wetlands, conserve water, and sequester carbon.
FARM PRODUCTION AND CONSERVATION 19
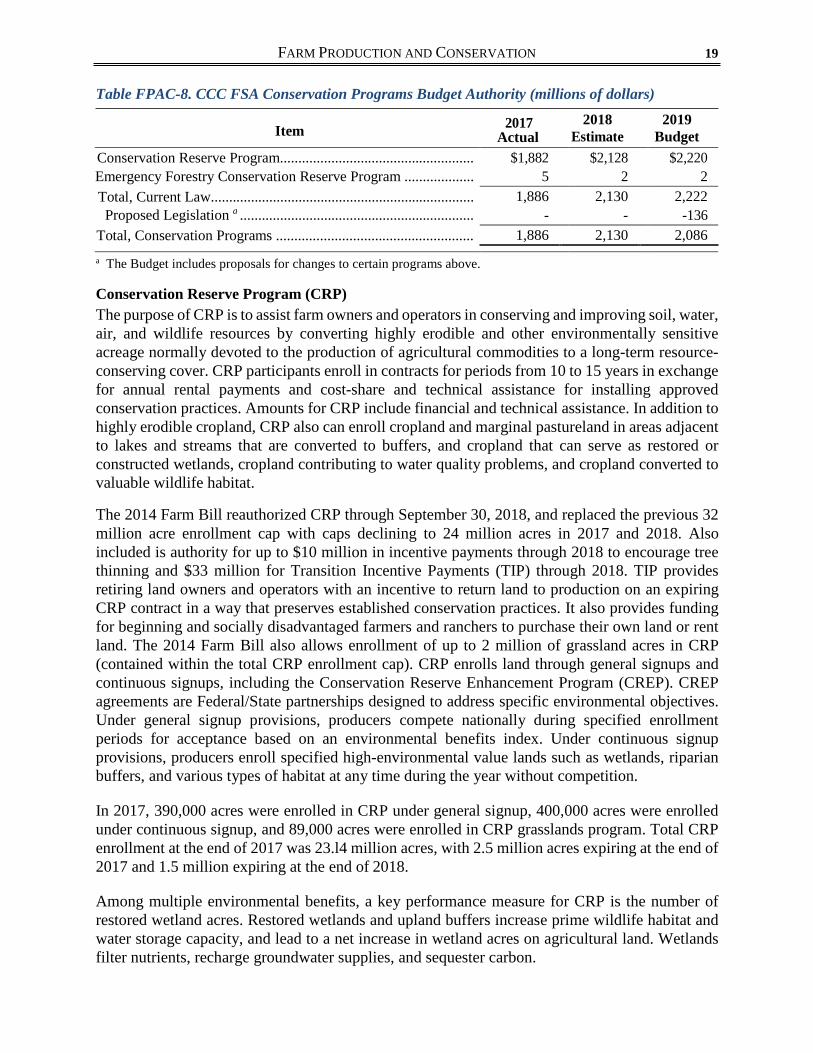
Table FPAC-8. CCC FSA Conservation Programs Budget Authority (millions of dollars)
Item 2017 Actual
2018 Estimate
2019 Budget
Conservation Reserve Program..................................................... $1,882 $2,128 $2,220 Emergency Forestry Conservation Reserve Program ................... 5 2 2 Total, Current Law........................................................................ 1,886 2,130 2,222 Proposed Legislation a ................................................................ - - -136
Total, Conservation Programs ...................................................... 1,886 2,130 2,086 a The Budget includes proposals for changes to certain programs above.
Conservation Reserve Program (CRP) The purpose of CRP is to assist farm owners and operators in conserving and improving soil, water, air, and wildlife resources by converting highly erodible and other environmentally sensitive acreage normally devoted to the production of agricultural commodities to a long-term resource- conserving cover. CRP participants enroll in contracts for periods from 10 to 15 years in exchange for annual rental payments and cost-share and technical assistance for installing approved conservation practices. Amounts for CRP include financial and technical assistance. In addition to highly erodible cropland, CRP also can enroll cropland and marginal pastureland in areas adjacent to lakes and streams that are converted to buffers, and cropland that can serve as restored or constructed wetlands, cropland contributing to water quality problems, and cropland converted to valuable wildlife habitat.
The 2014 Farm Bill reauthorized CRP through September 30, 2018, and replaced the previous 32 million acre enrollment cap with caps declining to 24 million acres in 2017 and 2018. Also included is authority for up to $10 million in incentive payments through 2018 to encourage tree thinning and $33 million for Transition Incentive Payments (TIP) through 2018. TIP provides retiring land owners and operators with an incentive to return land to production on an expiring CRP contract in a way that preserves established conservation practices. It also provides funding for beginning and socially disadvantaged farmers and ranchers to purchase their own land or rent land. The 2014 Farm Bill also allows enrollment of up to 2 million of grassland acres in CRP (contained within the total CRP enrollment cap). CRP enrolls land through general signups and continuous signups, including the Conservation Reserve Enhancement Program (CREP). CREP agreements are Federal/State partnerships designed to address specific environmental objectives. Under general signup provisions, producers compete nationally during specified enrollment periods for acceptance based on an environmental benefits index. Under continuous signup provisions, producers enroll specified high-environmental value lands such as wetlands, riparian buffers, and various types of habitat at any time during the year without competition.
In 2017, 390,000 acres were enrolled in CRP under general signup, 400,000 acres were enrolled under continuous signup, and 89,000 acres were enrolled in CRP grasslands program. Total CRP enrollment at the end of 2017 was 23.l4 million acres, with 2.5 million acres expiring at the end of 2017 and 1.5 million expiring at the end of 2018.
Among multiple environmental benefits, a key performance measure for CRP is the number of restored wetland acres. Restored wetlands and upland buffers increase prime wildlife habitat and water storage capacity, and lead to a net increase in wetland acres on agricultural land. Wetlands filter nutrients, recharge groundwater supplies, and sequester carbon.
FARM PRODUCTION AND CONSERVATION 21
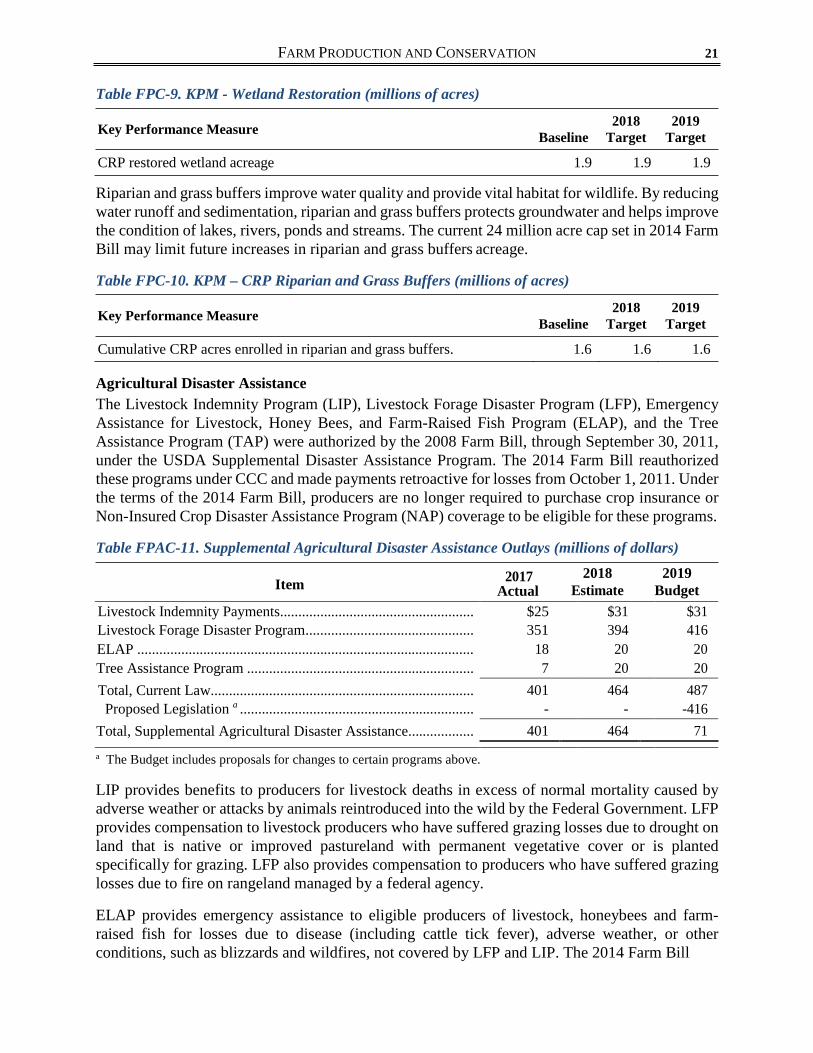
Table FPC-9. KPM - Wetland Restoration (millions of acres)
Key Performance Measure
2019 Target
CRP restored wetland acreage 1.9 1.9 1.9
Riparian and grass buffers improve water quality and provide vital habitat for wildlife. By reducing water runoff and sedimentation, riparian and grass buffers protects groundwater and helps improve the condition of lakes, rivers, ponds and streams. The current 24 million acre cap set in 2014 Farm Bill may limit future increases in riparian and grass buffers acreage.
Table FPC-10. KPM – CRP Riparian and Grass Buffers (millions of acres)
Key Performance Measure Baseline 2018
Target 2019
Target
Cumulative CRP acres enrolled in riparian and grass buffers. 1.6 1.6 1.6
Agricultural Disaster Assistance The Livestock Indemnity Program (LIP), Livestock Forage Disaster Program (LFP), Emergency Assistance for Livestock, Honey Bees, and Farm-Raised Fish Program (ELAP), and the Tree Assistance Program (TAP) were authorized by the 2008 Farm Bill, through September 30, 2011, under the USDA Supplemental Disaster Assistance Program. The 2014 Farm Bill reauthorized these programs under CCC and made payments retroactive for losses from October 1, 2011. Under the terms of the 2014 Farm Bill, producers are no longer required to purchase crop insurance or Non-Insured Crop Disaster Assistance Program (NAP) coverage to be eligible for these programs.
Table FPAC-11. Supplemental Agricultural Disaster Assistance Outlays (millions of dollars)
Item 2017 Actual
2018 Estimate
2019 Budget
Baseline
2018 Target
Livestock Indemnity Payments..................................................... $25 $31 $31 Livestock Forage Disaster Program .............................................. 351 394 416 ELAP ............................................................................................ 18 20 20 Tree Assistance Program .............................................................. 7 20 20 Total, Current Law........................................................................ 401 464 487 Proposed Legislation a ................................................................ - - -416
Total, Supplemental Agricultural Disaster Assistance.................. 401 464 71 a The Budget includes proposals for changes to certain programs above.
LIP provides benefits to producers for livestock deaths in excess of normal mortality caused by adverse weather or attacks by animals reintroduced into the wild by the Federal Government. LFP provides compensation to livestock producers who have suffered grazing losses due to drought on land that is native or improved pastureland with permanent vegetative cover or is planted specifically for grazing. LFP also provides compensation to producers who have suffered grazing losses due to fire on rangeland managed by a federal agency.
ELAP provides emergency assistance to eligible producers of livestock, honeybees and farm- raised fish for losses due to disease (including cattle tick fever), adverse weather, or other conditions, such as blizzards and wildfires, not covered by LFP and LIP. The 2014 Farm Bill

2019 USDA BUDGET SUMMARY 20
capped funding for ELAP at $20 million for 2012 and each subsequent fiscal year, to remain available until expended.
TAP provides financial assistance to qualifying orchardists and nursery tree growers to replant or rehabilitate eligible trees, bushes, and vines damaged by natural disasters.
Proposed Legislation The Budget includes several legislative proposals to better target commodity and conservation assistance, and to eliminate all funding for two CCC programs to fund other Administration priorities. The legislative proposals: (1) limit commodity and conservation payments to participants that have an Adjusted Gross Income (AGI) of $500,000 or less; (2) eliminate commodity certificates; (3) eliminate the separate $125,000 payment limit for peanuts; (4) make Marketing Assistance Loans (MALs) forfeitures subject to the $125,000 payment limit; (5) limit all farms to one manager that can qualify as actively engaged; (6) target enrollment in CRP to environmentally sensitive areas, limit the enrollment of whole farm fields and eliminate all funding for signing incentive payment (SIPs) and practice incentive payments ( PIPs), with the exception of the Conservation Reserve Enhancement Program; (7) limit CRP annual rental payments to 80 percent of the average county rental rates as determined by National Agriculture Statistics Service (NASS); (8) eliminate all funding for the Economic Adjustment Assistance Program (EAAP) for Upland Cotton Users; and (9) eliminate all funding for the Livestock Forage Disaster Program (LFP). See Appendix for details.
RISK MANAGEMENT AGENCY Table FPAC-12. RMA Budget Authority (millions of dollars)
Item 2017 Actual
2018 Estimate
2019 Budget
Discretionary: RMA Salaries and Expenses Appropriations ............................. $75 $75 $38 Offsetting Collections a............................................................... - - 20 Mandatory Transfers:
Federal Crop Insurance Act (FCIA) Initiatives ....................... 9 9 9 Total, Discretionary Programs ...................................................... 84 84 67 Mandatory:
Delivery and Other Administrative Expenses b ..........................
1,489
1,355
1,355 Federal Crop Insurance Act (FCIA) Initiatives .......................... 61 72 64 Gross Indemnities c ..................................................................... 4,596 10,128 9,783 Underwriting Gains d .................................................................. 2,594 1,101 1,121 Farm Bill: Agricultural Management Assistance ....................... 3 4 - Other FCIC Activities ................................................................ 20 20 -
Subtotal, Crop Insurance Program Level................................. 8,763 12,680 12,323 Less: Producer Premium and Administration Fees .................... -3,677 -3,786 -3,639
Total, Mandatory Programs e......................................................... 5,086 8,894 8,684 Total, RMA ................................................................................... 5,170 8,978 8,751 a The first $20 million of the amounts collected pursuant to 7 U.S.C. 1508(b)(5) and 7 U.S.C. 1508(c)(10) shall be
credited to the discretionary account. b Reimbursements to private companies. c The amount of premium subsidy paid by the Federal government is not reflected in the table above. The Budget
for the Federal Crop Insurance Program assumes a crop year loss ratio (gross indemnities/total premium) of 1.0

2019 USDA BUDGET SUMMARY 22
for 2019. However, the fiscal year loss ratio could be higher or lower than 1.0 due to differences in the timing of certain cash flows (see discussion below on estimated indemnities).
d Payments to private insurance companies. The 2019 underwriting gains reflect a projected 1.0 loss ratio for the 2018 crop year.
e The Budget includes proposals for the crop insurance program. Savings from these proposals do not begin until 2020. No budget authority impact is estimated for 2019.
Discretionary Funding – Salaries and Expenses Discretionary funds for the Federal crop insurance program cover most of Federal salaries and related expenses to manage the program. The Budget includes $38 million in discretionary appropriations for these costs. In addition, RMA will seek to utilize up to $20 million in crop insurance administrative fees, currently paid by participating producers, which will be spent directly from the Federal Crop Insurance Fund for RMA Salaries and Expenses. Further, the Federal Crop Insurance Act authorizes the transfer of up to $9 million each fiscal year from mandatory funding to the RMA Salaries and Expenses (S&E) account for program compliance and integrity reviews.
Organizational changes, part of the USDA reorganization announced in 2017, are reflected in the Budget, including the transfer of staff and funding to the FPAC Business Center (FBC). FBC will consolidate enterprise-wide back-office functions of the FSA, NRCS and RMA. Approximately 82 staff years will be transferred from RMA to the newly formed FBC and funded through $17 million in direct appropriations. FBC will also receive staff and funding from FSA, RMA, and NRCS. See the FBC section for further details.
Mandatory Funding The Federal crop insurance program provides a safety net that protects producers from a wide range of risks caused by natural disasters, as well as the risk of price fluctuations. Currently, about 80 percent of risk protection is provided by “revenue insurance,” which protects against losses due to low yields, low prices, or a combination of low yields and prices.
Federal crop insurance is delivered to producers through private insurance companies that share in the risk of loss and opportunity for gain. The companies are reimbursed for their delivery expenses and receive underwriting gains in years of favorable loss experience. The costs associated with the Federal crop insurance programs include premium subsidies, indemnity payments (in excess of producer paid premiums), underwriting gains paid to private companies, reimbursements to private companies for delivery expenses and other authorized expenditures.
A key performance measure for the Federal crop insurance program is the normalized value of risk protection provided by Federal Crop Insurance Corporation (FCIC) sponsored insurance – shown in table FPC-13 on a crop year basis. The value of FCIC risk protection is the actual dollar insurance liability for a given crop year. However, this value is strongly influenced by commodity price swings or trends. The normalized value of risk protection uses a five-year baseline to smooth variations caused by these trends. The baseline model uses the most recent crop insurance data, and other USDA market conditions data, to develop normalized value projections for major crops. For the 2017 crop year, the Federal crop insurance program provided about $106.0 billion in risk protection or about $74.6 billion in (normalized) risk protection. The 2018 and 2019 crop year targets reflect projections from the baseline model as described above.
Actual indemnities for 2017 reflect crop year 2016 losses that were paid out in 2017, plus the portion of crop year 2017 losses paid out in 2017. As of January 1, 2018, the loss ratio for crop
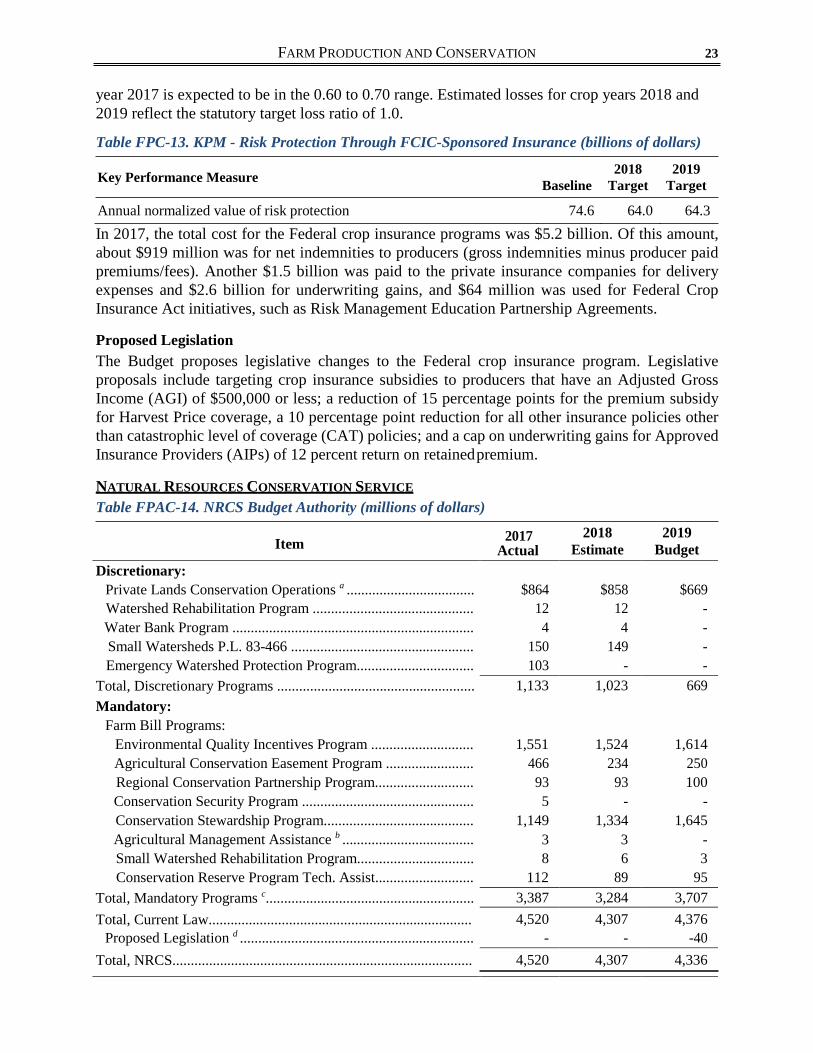
FARM PRODUCTION AND CONSERVATION 23
year 2017 is expected to be in the 0.60 to 0.70 range. Estimated losses for crop years 2018 and 2019 reflect the statutory target loss ratio of 1.0.
Table FPC-13. KPM - Risk Protection Through FCIC-Sponsored Insurance (billions of dollars)
Key Performance Measure
Baseline 2018
Target 2019
Target
Annual normalized value of risk protection 74.6 64.0 64.3 In 2017, the total cost for the Federal crop insurance programs was $5.2 billion. Of this amount, about $919 million was for net indemnities to producers (gross indemnities minus producer paid premiums/fees). Another $1.5 billion was paid to the private insurance companies for delivery expenses and $2.6 billion for underwriting gains, and $64 million was used for Federal Crop Insurance Act initiatives, such as Risk Management Education Partnership Agreements.
Proposed Legislation The Budget proposes legislative changes to the Federal crop insurance program. Legislative proposals include targeting crop insurance subsidies to producers that have an Adjusted Gross Income (AGI) of $500,000 or less; a reduction of 15 percentage points for the premium subsidy for Harvest Price coverage, a 10 percentage point reduction for all other insurance policies other than catastrophic level of coverage (CAT) policies; and a cap on underwriting gains for Approved Insurance Providers (AIPs) of 12 percent return on retained premium.
NATURAL RESOURCES CONSERVATION SERVICE Table FPAC-14. NRCS Budget Authority (millions of dollars)
Item 2017 Actual
2018 Estimate
2019 Budget
Discretionary: Private Lands Conservation Operations a ...................................
$864
$858
$669
Watershed Rehabilitation Program ............................................ 12 12 - Water Bank Program .................................................................. 4 4 - Small Watersheds P.L. 83-466 .................................................. 150 149 - Emergency Watershed Protection Program................................ 103 - -
Total, Discretionary Programs ...................................................... 1,133 1,023 669 Mandatory:
Farm Bill Programs: Environmental Quality Incentives Program ............................ 1,551 1,524 1,614 Agricultural Conservation Easement Program ........................ 466 234 250 Regional Conservation Partnership Program........................... 93 93 100 Conservation Security Program ............................................... 5 - - Conservation Stewardship Program......................................... 1,149 1,334 1,645 Agricultural Management Assistance b .................................... 3 3 - Small Watershed Rehabilitation Program................................ 8 6 3 Conservation Reserve Program Tech. Assist........................... 112 89 95
Total, Mandatory Programs c......................................................... 3,387 3,284 3,707 Total, Current Law........................................................................ 4,520 4,307 4,376
Proposed Legislation d ................................................................ - - -40 Total, NRCS.................................................................................. 4,520 4,307 4,336

2019 USDA BUDGET SUMMARY 24
a The Budget shows total staff resources necessary to implement the private lands conservation programs in the
retitled Private Lands Conservation Operations (PLCO) account. PLCO includes the total for discretionary technical assistance and associated science and technology programs provided through the previously-titled Conservation Operations account in addition to the total technical assistance necessary to implement Farm Bill programs. For comparability, both discretionary and mandatory funds are shown for 2017 through 2019.
b NRCS is authorized to receive 50 percent of total AMA funding and the rest is provided to RMA and FSA. c The amounts for Total Mandatory Programs include the Technical Assistance funding levels listed on FPAC-15
table. d The Budget includes proposals for changes to certain programs above.
Private Lands Conservation Operations (PLCO) The Budget proposes to retitle the Conservation Operations account to Private Lands Conservation Operations. PLCO would consolidate the discretionary and mandatory technical assistance (TA) funding necessary for the agency to support its core mission of delivering conservation to America’s private working lands. The total proposed funding for PLCO for 2019 is about $1.5 billion. This includes $669 million of discretionary funding, of which $576 million is for the Conservation Technical Assistance Program, and $92 million is for Soil Survey, Snow Survey, and Plant Materials Centers. A total of $850 million in mandatory TA is estimated to be needed to support Farm Bill conservation program implementation.
Table FPAC-15. PLCO Budget Authority (millions of dollars)
Item 2017 Actual
2018 Estimate
2019 Budget
Discretionary: Conservation Technical Assistance............................................ $759 $754 $576 Soil Surveys................................................................................ 81 80 74 Snow Surveys ............................................................................. 9 9 9 Plant Materials............................................................................ 9 9 9 Watershed Projects ..................................................................... 6 6
Total, Discretionary Programs ...................................................... 864 858 669 Mandatory:
Farm Bill Programs (Technical Assistance): a
Environmental Quality Incentives Program ............................ 420 413 382 Agricultural Conservation Easement Program ........................ 97 79 71 Regional Conservation Partnership Program........................... 39 37 19 Conservation Security Program ............................................... 1 - - Conservation Stewardship Program......................................... 234 272 290 Agricultural Management Assistance b .................................... 1 1 - Conservation Reserve Program Tech. Assist........................... 112 89 89
Total, Mandatory Programs .......................................................... 904 890 850 Total, PLCO.................................................................................. 1,768 1,748 1,519 a The Budget proposes to show total staff resources necessary to implement the private lands conservation program
in the retitled Private Lands Conservation Operations (PLCO) account. PLCO includes the total for discretionary technical assistance and associated science and technology programs provided through the previously-titled Conservation Operations account in addition to the total technical assistance necessary to implement Farm Bill programs.
b NRCS is authorized to receive 50 percent of total AMA funding and the rest is provided to RMA and FSA.
NRCS organizational changes, part of the USDA reorganization announced in 2017, are reflected in the 2019 Budget, including the transfer of staff and funding to the FPAC Business Center (FBC).
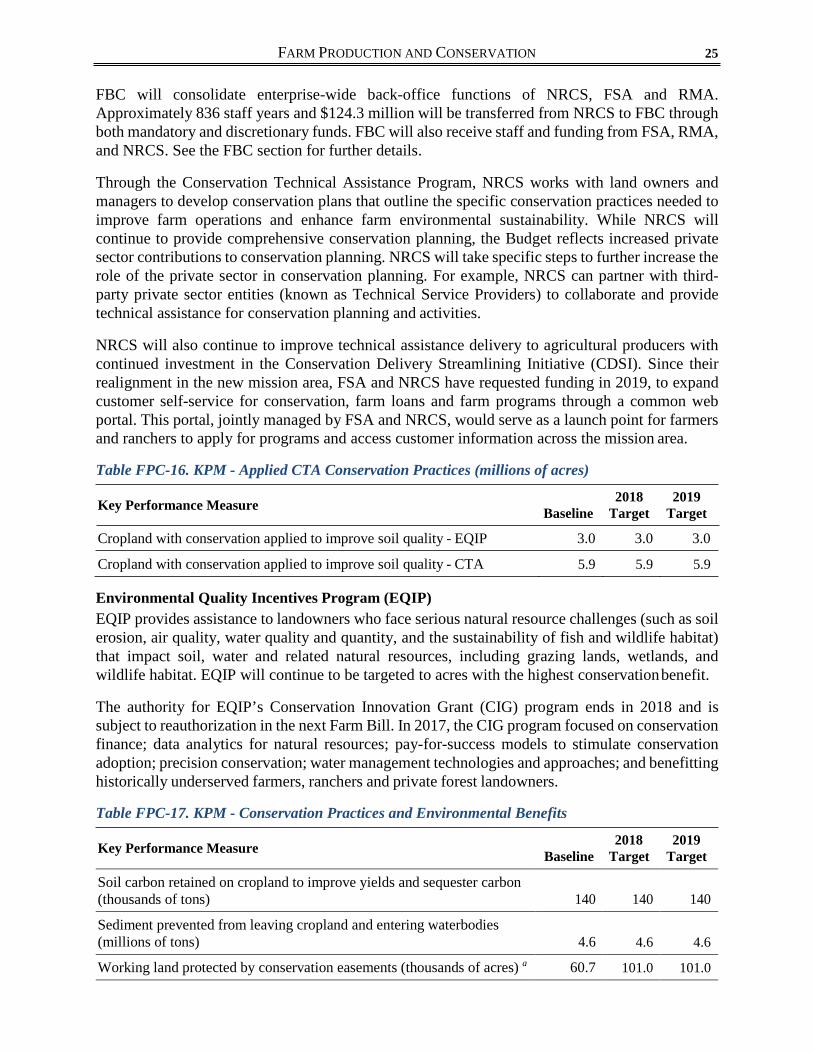
FARM PRODUCTION AND CONSERVATION 25
FBC will consolidate enterprise-wide back-office functions of NRCS, FSA and RMA. Approximately 836 staff years and $124.3 million will be transferred from NRCS to FBC through both mandatory and discretionary funds. FBC will also receive staff and funding from FSA, RMA, and NRCS. See the FBC section for further details.
Through the Conservation Technical Assistance Program, NRCS works with land owners and managers to develop conservation plans that outline the specific conservation practices needed to improve farm operations and enhance farm environmental sustainability. While NRCS will continue to provide comprehensive conservation planning, the Budget reflects increased private sector contributions to conservation planning. NRCS will take specific steps to further increase the role of the private sector in conservation planning. For example, NRCS can partner with third- party private sector entities (known as Technical Service Providers) to collaborate and provide technical assistance for conservation planning and activities.
NRCS will also continue to improve technical assistance delivery to agricultural producers with continued investment in the Conservation Delivery Streamlining Initiative (CDSI). Since their realignment in the new mission area, FSA and NRCS have requested funding in 2019, to expand customer self-service for conservation, farm loans and farm programs through a common web portal. This portal, jointly managed by FSA and NRCS, would serve as a launch point for farmers and ranchers to apply for programs and access customer information across the mission area.
Table FPC-16. KPM - Applied CTA Conservation Practices (millions of acres)
Key Performance Measure
Baseline 2018
Target 2019
Target
Cropland with conservation applied to improve soil quality - EQIP 3.0 3.0 3.0
Cropland with conservation applied to improve soil quality - CTA 5.9 5.9 5.9
Environmental Quality Incentives Program (EQIP) EQIP provides assistance to landowners who face serious natural resource challenges (such as soil erosion, air quality, water quality and quantity, and the sustainability of fish and wildlife habitat) that impact soil, water and related natural resources, including grazing lands, wetlands, and wildlife habitat. EQIP will continue to be targeted to acres with the highest conservation benefit.
The authority for EQIP’s Conservation Innovation Grant (CIG) program ends in 2018 and is subject to reauthorization in the next Farm Bill. In 2017, the CIG program focused on conservation finance; data analytics for natural resources; pay-for-success models to stimulate conservation adoption; precision conservation; water management technologies and approaches; and benefitting historically underserved farmers, ranchers and private forest landowners.
Table FPC-17. KPM - Conservation Practices and Environmental Benefits
Key Performance Measure 2018 2019 Baseline Target Target
Soil carbon retained on cropland to improve yields and sequester carbon (thousands of tons)
140
140
140
Sediment prevented from leaving cropland and entering waterbodies (millions of tons)
4.6
4.6
4.6
Working land protected by conservation easements (thousands of acres) a 60.7 101.0 101.0
2019 USDA BUDGET SUMMARY 26
a Performance under the Agricultural Conservation Easement Program (ACEP) experiences a lag of approximately
2 years due to the time required to identify, prioritize, and close real estate transactions. Accordingly, performance targets for 2019 reflects funding levels provided in 2017.
Agricultural Conservation Easement Program (ACEP) ACEP has two components: agricultural land easements, under which NRCS assists eligible entities to protect agricultural land by limiting non-agricultural land uses; and wetland reserve easements, under which NRCS provides technical and financial assistance to landowners to restore, protect and enhance wetlands through the purchase of wetlands reserve easements. NRCS continues to maintain existing easements and contracts formed under the previous programs.
ACEP’s land easement component helps farmers and ranchers keep their land in agriculture while protecting grazing uses and related conservation values by conserving grassland, including rangeland, pastureland and shrubland. The wetland easement component supports habitat for fish and wildlife, including threatened and endangered species, reducing flooding, protecting biological diversity, and providing opportunities for educational, scientific and limited recreational activities. The program fosters public-private partnerships with landowners, Indian Tribes, State and local governments, and nongovernmental organizations through the use of cooperative agreements (agricultural land easements) and long term easements or 30-year contracts (wetland easements).
Regional Conservation Partnership Program (RCPP) Producers receive technical and financial assistance through RCPP while NRCS and its partners help producers install and maintain conservation activities. These projects may focus on water quality and quantity, soil erosion, wildlife habitat, drought mitigation, flood control, and other regional priorities. Partners include producer associations, State or local governments, Indian Tribes, non-governmental organizations, and institutions of higher education.
Conservation Stewardship Program (CSP) CSP encourages participants to undertake new conservation activities in addition to maintaining and managing existing conservation activities. CSP operates under an annual limitation on new acres enrolled, and the 2014 Farm Bill extended the authority for CSP through 2018 with an annual enrollment cap of 10 million acres. CSP addresses natural resource concerns including soil quality, soil erosion, water quantity and quality, air quality, plant and animal resources, and energy efficiency.
Proposed Legislation The Budget proposes legislative changes to NRCS conservation programs. Specifically, the Budget proposed the increase funding for EQIP by $60 million per year and also proposes to limit participation in NRCS programs to participants that have an Adjusted Gross Income (AGI) of $500,000 or less as well as changes to streamline conservation programs such as elimination of the CSP and the funding for the RCPP. The Administration supports the goals of the RCPP and will evaluate alternative mechanisms such as legislative flexibility that would allow public-private partnership approaches to conservation work.
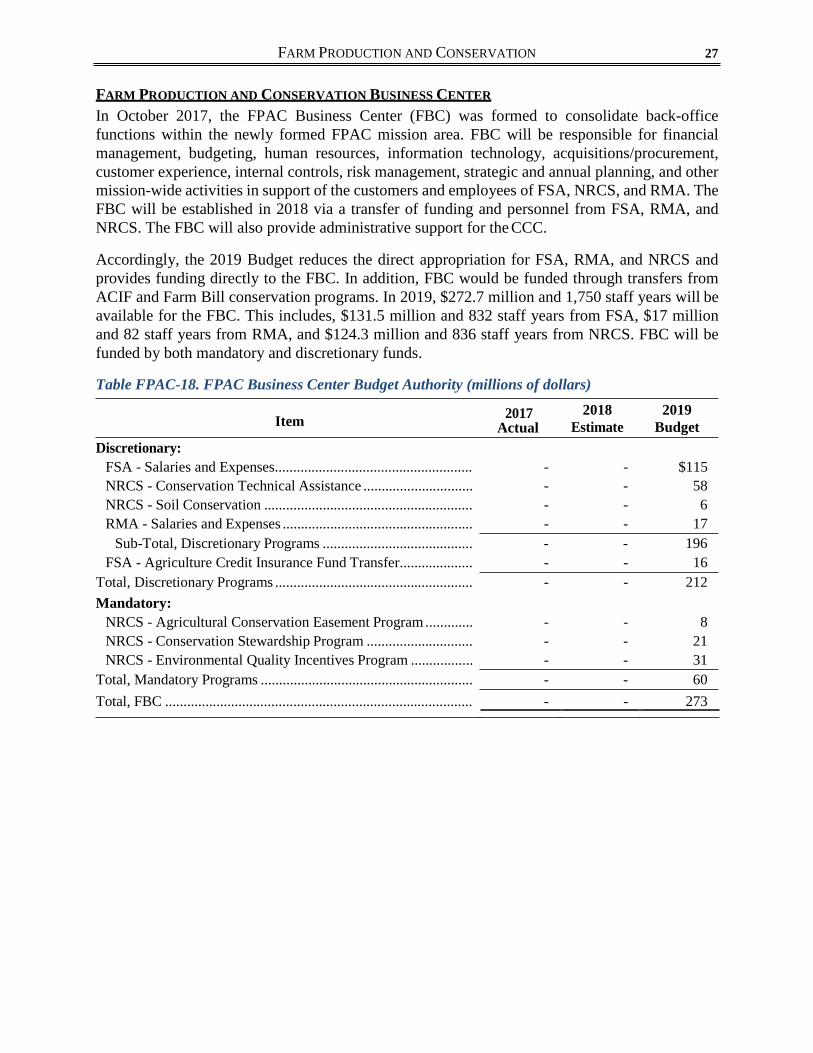
FARM PRODUCTION AND CONSERVATION 27
FARM PRODUCTION AND CONSERVATION BUSINESS CENTER
In October 2017, the FPAC Business Center (FBC) was formed to consolidate back-office functions within the newly formed FPAC mission area. FBC will be responsible for financial management, budgeting, human resources, information technology, acquisitions/procurement, customer experience, internal controls, risk management, strategic and annual planning, and other mission-wide activities in support of the customers and employees of FSA, NRCS, and RMA. The FBC will be established in 2018 via a transfer of funding and personnel from FSA, RMA, and NRCS. The FBC will also provide administrative support for the CCC.
Accordingly, the 2019 Budget reduces the direct appropriation for FSA, RMA, and NRCS and provides funding directly to the FBC. In addition, FBC would be funded through transfers from ACIF and Farm Bill conservation programs. In 2019, $272.7 million and 1,750 staff years will be available for the FBC. This includes, $131.5 million and 832 staff years from FSA, $17 million and 82 staff years from RMA, and $124.3 million and 836 staff years from NRCS. FBC will be funded by both mandatory and discretionary funds.
Table FPAC-18. FPAC Business Center Budget Authority (millions of dollars)
Discretionary:
Item 2017 Actual
2018 Estimate
2019 Budget
FSA - Salaries and Expenses...................................................... - - $115 NRCS - Conservation Technical Assistance .............................. - - 58 NRCS - Soil Conservation ......................................................... - - 6 RMA - Salaries and Expenses .................................................... - - 17
Sub-Total, Discretionary Programs ......................................... - - 196 FSA - Agriculture Credit Insurance Fund Transfer.................... - - 16
Total, Discretionary Programs ...................................................... - - 212 Mandatory:
NRCS - Agricultural Conservation Easement Program ............. - - 8 NRCS - Conservation Stewardship Program ............................. - - 21 NRCS - Environmental Quality Incentives Program ................. - - 31
Total, Mandatory Programs .......................................................... - - 60 Total, FBC .................................................................................... - - 273
2019 USDA BUDGET SUMMARY 28
TRADE AND FOREIGN AGRICULTURAL AFFAIRS
MISSION
Agricultural trade is essential for the vitality of the U.S. agricultural sector and the economy as a whole. Agricultural exports account for 20 percent of the value of farm income, and make a critical contribution to the prosperity of local and regional economies across rural America through increased sales and higher commodity prices. Every $1 billion worth of agricultural exports supports an estimated 8,100 jobs and $1.28 billion in economic activity. In FY 2017, U.S. farm and food exports reached $140.5 billion, the third highest total on record. U.S. agricultural exports have continued to outpace U.S. agricultural imports since 1960, generating a surplus in U.S. agricultural trade. Agricultural exports in 2018 are expected to reach $140 billion.
The Trade and Foreign Agricultural Affairs mission area (TFAA), established by the Secretary in May, 2017, works to reduce trade barriers that impede or disadvantage U.S. agricultural exports and to open new markets for U.S. farm products. The mission area includes the activities of the Foreign Agricultural Service (FAS).
Recent U.S. successes in international trade include easing the entry of U.S. citrus into the EU market, an agreement with Argentina that allows U.S. pork entry for the first time since 1992, the return of American beef to China after a hiatus that began in 2004, an agreement that provides market access for U.S. rice exports to China for the first time, and the cancellation of the 2014 ban on U.S. poultry and poultry products to South Korea.
As part of the reorganization in 2017, the U.S. Codex Alimentarius Office was transferred from the Food Safety and Inspection Service to TFAA. The U.S. Codex Alimentarius Office is an interagency partnership that engages stakeholders in the development of international governmental and non-governmental food standards. The focus of the Codex Office aligns better with the mission of TFAA. The Under Secretary for Food Safety will continue to be the U.S. Codex Office Policy Committee Chair and the Office will continue to advocate science based codex policies.
FOREIGN AGRICULTURAL SERVICE
FAS administers a variety of programs that are designed to facilitate access to international markets and thereby help to support a competitive U.S. agricultural system. FAS also carries out activities that promote productive agricultural systems in developing countries and contribute to increased trade and enhanced global food security. Working bilaterally and with international organizations, FAS encourages the development of transparent and science-based regulatory systems that allow for the safe development and use of agricultural goods derived from new technologies. FAS works with other USDA agencies, the Office of the United States Trade Representative, and others in the Federal government to monitor and negotiate new trade agreements and enforce existing trade agreements. The United States has free trade agreements (FTA) with 20 countries around the world that expand export opportunities for U.S. food and agricultural producers.

TRADE AND FOREIGN AGRICULTURAL AFFAIRS 29
Table TFAA-1. FAS Budget Authority (millions of dollars)
Item 2017 Actual
2018 Estimate
2019 Budget
Discretionary: FAS Salaries and Expenses:
Salaries and Expenses (Direct Appropriation)......................... $197 $195 $193 Transfer from CCC Export Credit Program Account .............. 6 6 6
Total, FAS Salaries and Expenses ........................................ 203 201 199 Foreign Food Assistance:
McGovern-Dole International Food for Education Program a . 202 200 - P.L. 480 Title II Donations ...................................................... 1,600 1,589 -
P.L. 480 Title I Program Account: Transfer to FSA S&E ......... 0 0 0 Total, Discretionary Programs ...................................................... 2,004 1,991 200 Mandatory:
Quality Samples Program........................................................... 1 3 3 Foreign Food Assistance:
Food for Progress - CCC Funded ............................................ 166 166 166 Bill Emerson Humanitarian Trust b.......................................... - - -
Farm Bill Market Development Programs: Market Access Program........................................................... 188 200 200 Emerging Markets Program..................................................... 8 10 - Foreign Market Development (Cooperator) Program c............ 32 35 - Technical Assistance for Specialty Crops Program c ............... 8 9 - Pima Agriculture Cotton Trust Funds c .................................... 15 16 - Agricultural Wool Trust Fund ................................................. 27 28 30
Total, Farm Bill Market Development Programs.................. 278 298 230 Total, Mandatory Programs .......................................................... 445 467 399 Total, Current Law........................................................................ 2,449 2,458 599
Proposed Legislation d ................................................................ - - -166 Total, FAS..................................................................................... 2,449 2,458 433 a In 2017 and 2018, $5 million can be used for local and regional procurement. b Assets of the Trust can be released any time the Administrator of the U.S. Agency for International Development
determines that P.L. 480 Title II funding for emergency needs is inadequate to meet those needs in any fiscal year. c Not confirmed in the baseline for 2019. d The Budget includes proposals for changes to certain programs above.
CCC Export Credit Guarantee Programs (GSM-102) Table TFAA-2. FAS CCC Export Credit Programs Program Level (PL) and Budget Authority (BA) (millions of dollars)
Item 2017 PL BA 2018 PL BA 2019 PL BA GSM-102 Guarantees................................... $1,582 - $5,000 - $5,000 - Facilities Financing Guarantees ................... - - 500 - 500 - Total, CCC Export Credit ............................ 1,582 - 5,500 - 5,500 -
The CCC export credit guarantee programs, administered by FAS in conjunction with FSA, provide payment guarantees for the commercial financing of U.S. agricultural exports. These
2019 USDA BUDGET SUMMARY 30
programs facilitate exports to buyers in countries where credit is necessary to maintain or increase U.S. sales.
The Budget includes an overall program level of $5.5 billion for CCC export credit guarantees in 2019. This estimate reflects the level of sales expected to be registered under the export credit guarantee programs. However, the actual level of programming could vary from this estimate, depending upon program demand, market conditions, and other relevant factors during the course of the year. Of the total program level for export credit guarantees expected to be issued by CCC in 2019, $5 billion will be made available under the GSM-102 program, which provides guarantees on commercial export credit extended with short-term repayment terms (18 months).
The Budget also includes an estimated program level of $500 million for facility financing guarantees. Under this activity, CCC provides guarantees to facilitate the financing of goods and services exported from the United States to improve or establish agriculture-related facilities in emerging markets. By supporting such facilities, these guarantees enhance sales of U.S. agricultural products to countries where demand is constricted due to inadequate storage, processing, or handling capabilities.
Quality Samples Program (QSP) Under QSP, CCC provides funding to assist private entities to furnish samples of U.S. agricultural products to foreign importers in order to overcome trade and marketing obstacles. The program, which is carried out under the authority of the CCC Charter Act, provides foreign importers with a better understanding and appreciation of the characteristics of U.S. agricultural products.
Market Development Programs FAS administers a number of programs, in partnership with private sector cooperator organizations, which support the development, maintenance, and expansion of commercial export markets for U.S. agricultural commodities and products. In 2017, nearly 1,000 U.S. companies and organizations participated in 20 USDA endorsed trade shows in 14 countries. On-site sales totaled an estimated $300 million and the estimated total value of agricultural exports resulting from participation in foreign food and agricultural trade shows in 2017 was $2.35 billion.
Market Access Program (MAP) Under MAP, CCC funds are used to reimburse participating organizations for a portion of the cost of carrying out overseas marketing and promotional activities, such as consumer promotions. MAP participants include nonprofit agricultural trade organizations, State-regional trade groups, cooperatives, and private companies that qualify as small businesses. MAP has a brand promotion component that provides export promotion funding to small companies and thereby helps expand the number of small and medium-sized entities that export.
Emerging Markets Program (EMP) EMP authorizes CCC funding to be made available to carry out technical assistance activities that promote the export of U.S. agricultural products and address technical barriers to trade in emerging markets. Many types of technical assistance activities are eligible for funding, including feasibility studies, market research, industry sector assessments, specialized training, and business workshops.
Foreign Market Development (Cooperator) Program This program provides cost-share assistance to nonprofit commodity and agricultural trade associations to support overseas market development activities that are designed to remove long-
TRADE AND FOREIGN AGRICULTURAL AFFAIRS 31
term impediments to increased U.S. trade. These activities include technical assistance, trade servicing, and market research. Unlike MAP, Cooperator Program activities are carried out on a generic commodity basis and do not include brand-name or consumer promotions.
Technical Assistance for Specialty Crops (TASC) Program TASC is designed to address unique barriers that prohibit or threaten the export of U.S. specialty crops. Under the program, grants are provided to assist U.S. organizations in activities designed to overcome sanitary, phytosanitary, or technical barriers to trade.
Foreign Food Assistance USDA supports global food security through in-country capacity building, basic and applied research, improved market information, statistics and analysis, as well as food assistance. FAS contributes to these efforts by carrying out a variety of food aid programs that support economic growth and development in recipient countries.
McGovern-Dole International Food for Education and Child Nutrition Program The program provides for the donation of U.S. agricultural commodities and associated financial and technical assistance to carry out preschool and school feeding programs in foreign countries. Maternal, infant, and child nutrition programs also are authorized under the program. The Budget proposes to eliminate the program as part of the Administration’s effort to reprioritize Federal spending so that it advances the safety and security of the American people.
International Food Aid Assistance provided under the authority of P.L. 480 is a primary means by which the United States provides foreign food assistance. Title I provides for sales of U.S. agricultural commodities governments and private entities of developing countries through concessional financing agreements, and donations through Food for Progress grant agreements. Title II provides emergency and development food assistance in foreign countries.
P.L. 480 Title II P.L. 480 Title II grants fund emergency and development food aid programs authorized under Title II of the Food for Peace Act (P.L. 83-480). Funding for Title II is appropriated to the USDA and is administered by the U.S. Agency for International Development (USAID). There is no request for P.L. 480 Title II as part of an Administration effort to streamline foreign assistance, prioritize funding, and use funding as effectively and efficiently as possible.
Food for Progress The Food for Progress Act of 1985 authorizes U.S. agricultural commodities to be provided to developing countries and emerging democracies that have made commitments to introduce and expand free enterprise in their agricultural economies. Food for Progress agreements can be entered into with foreign governments, private organizations, nonprofit agricultural organizations, cooperatives, or intergovernmental organizations. Agreements currently provide for the commodities to be supplied on grant terms. The Food for Progress authorizing statute provides for the use of CCC funding for commodity procurement, transportation, and associated non- commodity costs for the program.
Bill Emerson Humanitarian Trust The Bill Emerson Humanitarian Trust (the Trust) is a commodity and/or monetary reserve designed to ensure that the United States can meet its international food assistance commitments under P.L. 480 Title II. The Trust’s assets can be released any time the Administrator of the United
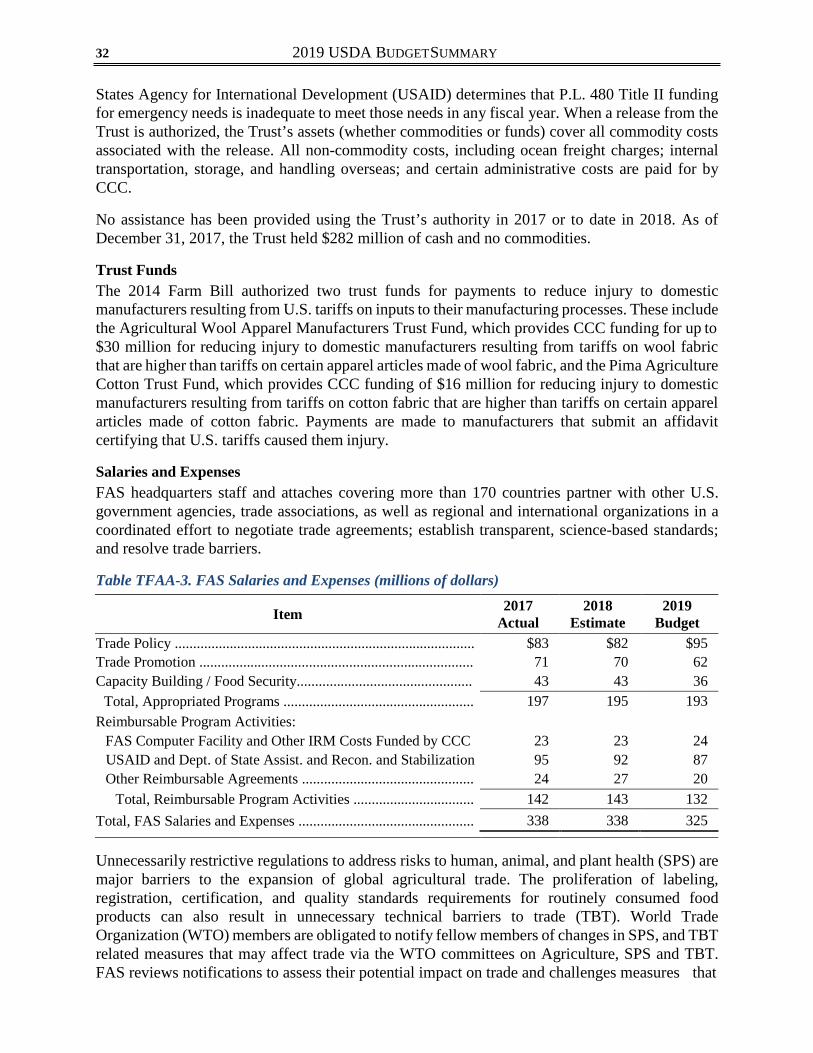
2019 USDA BUDGET SUMMARY 32
States Agency for International Development (USAID) determines that P.L. 480 Title II funding for emergency needs is inadequate to meet those needs in any fiscal year. When a release from the Trust is authorized, the Trust’s assets (whether commodities or funds) cover all commodity costs associated with the release. All non-commodity costs, including ocean freight charges; internal transportation, storage, and handling overseas; and certain administrative costs are paid for by CCC.
No assistance has been provided using the Trust’s authority in 2017 or to date in 2018. As of December 31, 2017, the Trust held $282 million of cash and no commodities.
Trust Funds The 2014 Farm Bill authorized two trust funds for payments to reduce injury to domestic manufacturers resulting from U.S. tariffs on inputs to their manufacturing processes. These include the Agricultural Wool Apparel Manufacturers Trust Fund, which provides CCC funding for up to $30 million for reducing injury to domestic manufacturers resulting from tariffs on wool fabric that are higher than tariffs on certain apparel articles made of wool fabric, and the Pima Agriculture Cotton Trust Fund, which provides CCC funding of $16 million for reducing injury to domestic manufacturers resulting from tariffs on cotton fabric that are higher than tariffs on certain apparel articles made of cotton fabric. Payments are made to manufacturers that submit an affidavit certifying that U.S. tariffs caused them injury.
Salaries and Expenses FAS headquarters staff and attaches covering more than 170 countries partner with other U.S. government agencies, trade associations, as well as regional and international organizations in a coordinated effort to negotiate trade agreements; establish transparent, science-based standards; and resolve trade barriers.
Table TFAA-3. FAS Salaries and Expenses (millions of dollars)
Item 2017 Actual
2018 Estimate
2019 Budget
Trade Policy .................................................................................. $83 $82 $95 Trade Promotion ........................................................................... 71 70 62 Capacity Building / Food Security................................................ 43 43 36
Total, Appropriated Programs .................................................... 197 195 193 Reimbursable Program Activities:
FAS Computer Facility and Other IRM Costs Funded by CCC 23 23 24 USAID and Dept. of State Assist. and Recon. and Stabilization 95 92 87 Other Reimbursable Agreements ............................................... 24 27 20
Total, Reimbursable Program Activities ................................. 142 143 132 Total, FAS Salaries and Expenses ................................................ 338 338 325
Unnecessarily restrictive regulations to address risks to human, animal, and plant health (SPS) are major barriers to the expansion of global agricultural trade. The proliferation of labeling, registration, certification, and quality standards requirements for routinely consumed food products can also result in unnecessary technical barriers to trade (TBT). World Trade Organization (WTO) members are obligated to notify fellow members of changes in SPS, and TBT related measures that may affect trade via the WTO committees on Agriculture, SPS and TBT. FAS reviews notifications to assess their potential impact on trade and challenges measures that
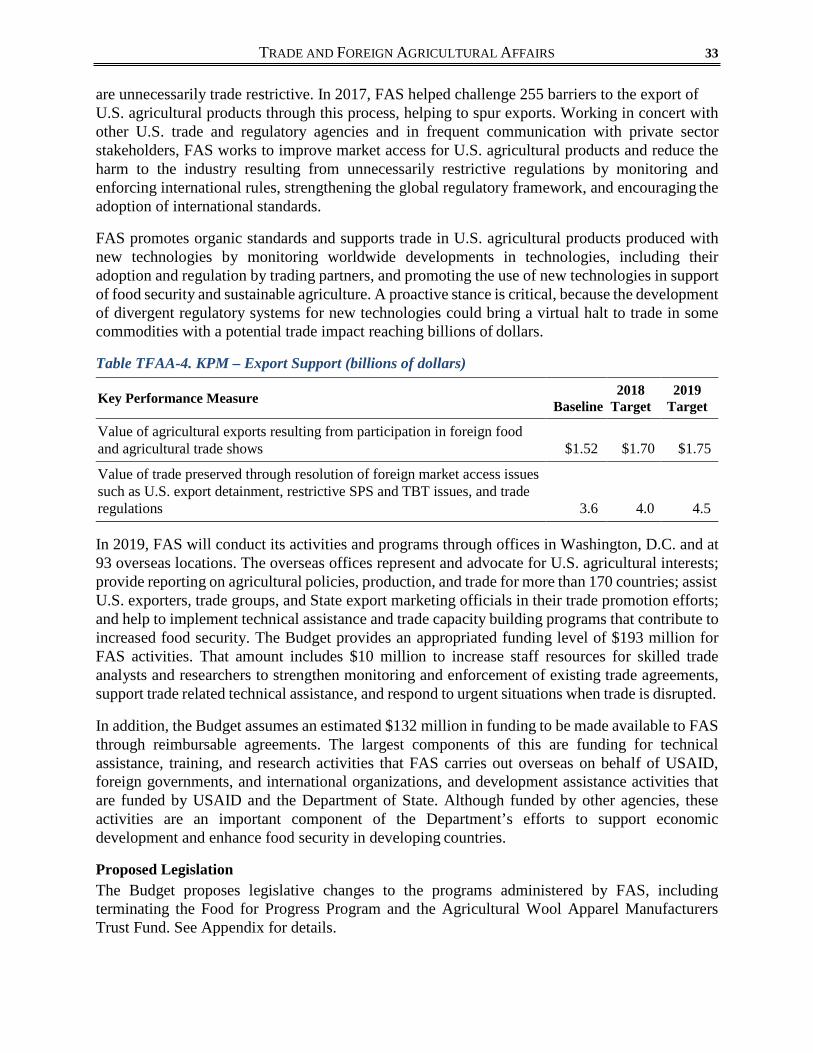
TRADE AND FOREIGN AGRICULTURAL AFFAIRS 33
are unnecessarily trade restrictive. In 2017, FAS helped challenge 255 barriers to the export of U.S. agricultural products through this process, helping to spur exports. Working in concert with other U.S. trade and regulatory agencies and in frequent communication with private sector stakeholders, FAS works to improve market access for U.S. agricultural products and reduce the harm to the industry resulting from unnecessarily restrictive regulations by monitoring and enforcing international rules, strengthening the global regulatory framework, and encouraging the adoption of international standards.
FAS promotes organic standards and supports trade in U.S. agricultural products produced with new technologies by monitoring worldwide developments in technologies, including their adoption and regulation by trading partners, and promoting the use of new technologies in support of food security and sustainable agriculture. A proactive stance is critical, because the development of divergent regulatory systems for new technologies could bring a virtual halt to trade in some commodities with a potential trade impact reaching billions of dollars.
Table TFAA-4. KPM – Export Support (billions of dollars)
Key Performance Measure Baseline
2018 Target
2019 Target
Value of agricultural exports resulting from participation in foreign food and agricultural trade shows
$1.52
$1.70
$1.75
Value of trade preserved through resolution of foreign market access issues such as U.S. export detainment, restrictive SPS and TBT issues, and trade regulations
3.6
4.0
4.5
In 2019, FAS will conduct its activities and programs through offices in Washington, D.C. and at 93 overseas locations. The overseas offices represent and advocate for U.S. agricultural interests; provide reporting on agricultural policies, production, and trade for more than 170 countries; assist U.S. exporters, trade groups, and State export marketing officials in their trade promotion efforts; and help to implement technical assistance and trade capacity building programs that contribute to increased food security. The Budget provides an appropriated funding level of $193 million for FAS activities. That amount includes $10 million to increase staff resources for skilled trade analysts and researchers to strengthen monitoring and enforcement of existing trade agreements, support trade related technical assistance, and respond to urgent situations when trade is disrupted.
In addition, the Budget assumes an estimated $132 million in funding to be made available to FAS through reimbursable agreements. The largest components of this are funding for technical assistance, training, and research activities that FAS carries out overseas on behalf of USAID, foreign governments, and international organizations, and development assistance activities that are funded by USAID and the Department of State. Although funded by other agencies, these activities are an important component of the Department’s efforts to support economic development and enhance food security in developing countries.
Proposed Legislation The Budget proposes legislative changes to the programs administered by FAS, including terminating the Food for Progress Program and the Agricultural Wool Apparel Manufacturers Trust Fund. See Appendix for details.

2019 USDA BUDGET SUMMARY 34
RURAL DEVELOPMENT
MISSION
Rural Development (RD) provides financial and technical assistance to rural communities, residents, businesses, and private and public entities for a broad range of purposes that bring prosperity and better living to rural America. These programs are grouped within three agencies: (1) the Rural Business-Cooperative Service (RBS) provides assistance for the development of business and industry, including small businesses, and renewable energy and energy improvement projects; (2) the Rural Utilities Service (RUS) provides assistance for water and waste disposal, rural electric and telecommunications, including broadband access; and (3) the Rural Housing Service (RHS) provides assistance for home ownership, multi-family housing, and essential community facilities such as healthcare and public safety infrastructure.
USDA assistance through these program will increase availability of high-speed e-connectivity, strengthen community infrastructure, advance education opportunities, modernize healthcare, strengthen utility infrastructure, support workforce training and veterans’ employment to enhance quality of life in the rural communities. RD programs will also expand stakeholder participation and involvement of local, tribal and state governments in the contribution to rural prosperity.
The type of assistance offered includes direct and guaranteed loans, grants, and other payments. Several programs require or encourage recipients to contribute their own resources or obtain third- party financing to support the total cost of projects, thereby leveraging government support with private sector financing.
Direct and guaranteed loans subsidy costs depends on a number of factors, including default rates, the prevailing interest rates, whether the interest rate is subsidized by the government, and whether there are fees. The loan programs all have administrative costs as well. In the tables, the budget authority for each program reflects the subsidy cost to the government to support the loan level. Several of the loan programs operate at a very low or negative subsidy rate. These less costly loan programs provide the bulk of the financial assistance in RD’s loan portfolio.

RURAL DEVELOPMENT 35
RURAL UTILITIES SERVICE
In many areas of rural America, families and communities lack access to the modern utility infrastructure, such as reliable electric power, high-speed broadband, and clean drinking water that is often taken for granted in more urban and suburban areas. RUS focuses on a number of efforts, including expansion of broadband access and seeking commercial investment, to modernize utility infrastructure projects through increased public-private partnership activities.
Table RD-1. RUS Program Level (PL) and Budget Authority (BA) (millions of dollars)
Item 2017 PL BA 2018 PL BA 2019 PL BA Discretionary:
Electric Programs: Direct Loans................................................ $5,500 - $5,500 - $5,500 - Direct Loans, modifications a...................... - $14 - $14 - - Rural Energy Saving Program .................... 55 8 57 8 - - Guaranteed Loans ....................................... 750 - 750 - - -
Telecommunications Programs: Treasury Loans ........................................... 345 3 345 3 173 $1 Direct FFB .................................................. 345 - 345 - 517 -
Distance Learning and Telemedicine Grants 27 27 26 26 24 24 Broadband Programs:
Direct Loans................................................ 27 5 27 4 23 5 Grants.......................................................... 35 35 34 34 30 30
High Energy Costs Grants............................. 10 10 10 10 - - Water and Waste Disposal Programs:
Direct Loans................................................ 1,200 52 1,200 52 1,200 - Guaranteed Loans ....................................... 50 0 52 0 - - Grants.......................................................... 509 509 505 505 - - Subtotal, Water and Waste b ..................... 1,759 561 1,757 557 1,200 -
Subtotal, RUS Programs................................ 8,852 662 8,851 657 7,467 59 Salaries and Expenses................................. 33 33 33 33 64 64
Total, Current Law........................................... 8,885 695 8,884 690 7,531 123 Proposed Legislation c ................................... - - - - -129 -129
Total, RUS ....................................................... 8,885 695 8,884 690 7,402 -6 a Modifications loan level is up to $600 million which are within the $5.5 billion program level. b The total does not reflect $51 million in Water and Waste unobligated balances proposed to be cancelled in 2019. c The Budget includes proposals for changes to certain programs above.
Electric and Telecommunications Programs The Electric and Telecommunications programs administered by RUS provide loans to establish, expand, and modernize vital components of the infrastructure of rural America. RUS programs leverage private sector investments as well as fill credit gaps that still exist for some rural areas and borrowers.
Electric Loan Program The Budget requests $5.5 billion for electric loans to construct, acquire, and improve electric infrastructure including renewable energy, electric transmission, distribution, smart grid technology, energy efficiency, grid resiliency, and security enhancements.
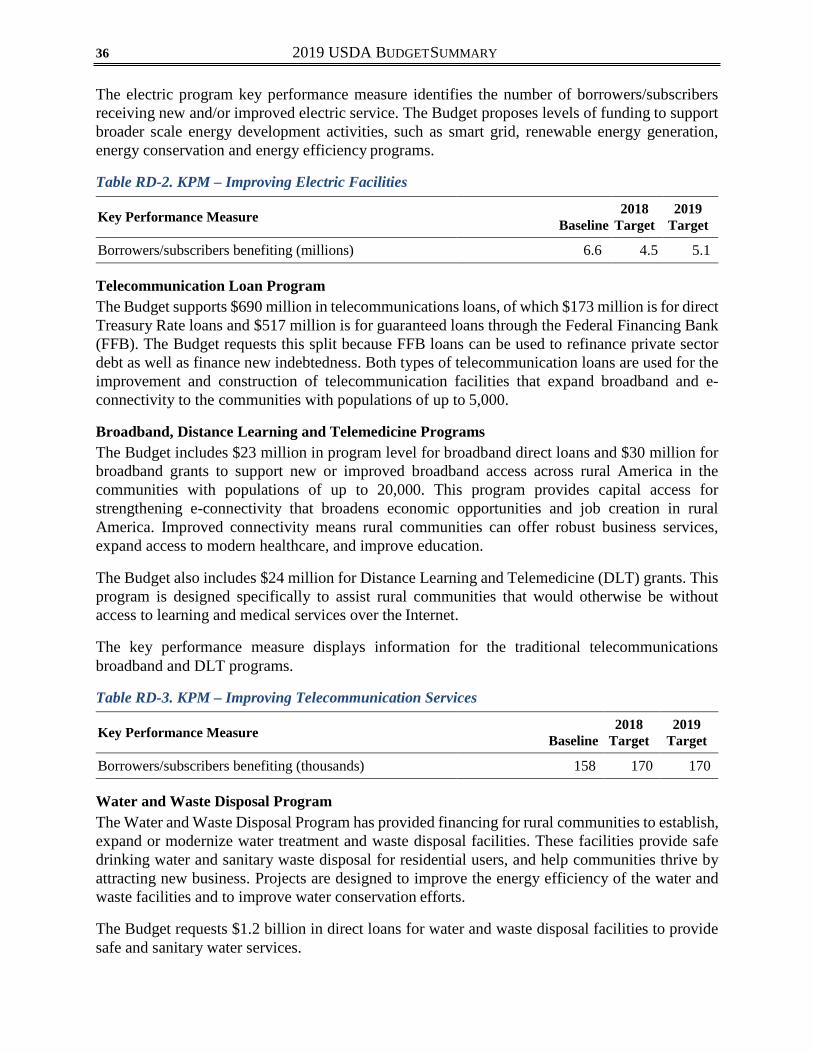
2019 USDA BUDGET SUMMARY 36
The electric program key performance measure identifies the number of borrowers/subscribers receiving new and/or improved electric service. The Budget proposes levels of funding to support broader scale energy development activities, such as smart grid, renewable energy generation, energy conservation and energy efficiency programs.
Table RD-2. KPM – Improving Electric Facilities
Key Performance Measure Baseline
2018 Target
2019 Target
Borrowers/subscribers benefiting (millions) 6.6 4.5 5.1
Telecommunication Loan Program The Budget supports $690 million in telecommunications loans, of which $173 million is for direct Treasury Rate loans and $517 million is for guaranteed loans through the Federal Financing Bank (FFB). The Budget requests this split because FFB loans can be used to refinance private sector debt as well as finance new indebtedness. Both types of telecommunication loans are used for the improvement and construction of telecommunication facilities that expand broadband and e-connectivity to the communities with populations of up to 5,000.
Broadband, Distance Learning and Telemedicine Programs The Budget includes $23 million in program level for broadband direct loans and $30 million for broadband grants to support new or improved broadband access across rural America in the communities with populations of up to 20,000. This program provides capital access for strengthening e-connectivity that broadens economic opportunities and job creation in rural America. Improved connectivity means rural communities can offer robust business services, expand access to modern healthcare, and improve education.
The Budget also includes $24 million for Distance Learning and Telemedicine (DLT) grants. This program is designed specifically to assist rural communities that would otherwise be without access to learning and medical services over the Internet.
The key performance measure displays information for the traditional telecommunications broadband and DLT programs.
Table RD-3. KPM – Improving Telecommunication Services
Key Performance Measure Baseline
2018 Target
2019 Target
Borrowers/subscribers benefiting (thousands) 158 170 170
Water and Waste Disposal Program The Water and Waste Disposal Program has provided financing for rural communities to establish, expand or modernize water treatment and waste disposal facilities. These facilities provide safe drinking water and sanitary waste disposal for residential users, and help communities thrive by attracting new business. Projects are designed to improve the energy efficiency of the water and waste facilities and to improve water conservation efforts.
The Budget requests $1.2 billion in direct loans for water and waste disposal facilities to provide safe and sanitary water services.

RURAL DEVELOPMENT 37
The Budget also proposes to raise the population limit from 10,000 to 20,000 to allow more rural communities be eligible for the Water and Waste Disposal loans.
Financing is available only to those communities with low median household income levels. Priority is given to public entities serving areas with populations less than 5,500 and applying for loans to restore a deteriorating water system or to improve, enlarge or modify an inadequate waste facility.
Proposed Legislation The Budget proposes the elimination of interest payments to the Electric and Telecommunications Cushion of Credit account.
RURAL HOUSING SERVICE
Table RD-4. RHS Program Level (PL) and Budget Authority (BA) (millions of dollars)
Item 2017 PL BA 2018 PL BA 2019 PL BA Discretionary:
Single Family Housing (Sec. 502): Direct Loans............................................. $1,000 $68 $1,000 $67 - - Guaranteed Loans .................................... 24,000 - 24,000 - $24,000 -
Multi Family Housing: Direct Loans (Sec. 515) ........................... 35 10 39 10 - - Guaranteed Loans (Sec. 538)................... 230 - 230 - 250 -
Very Low-Income Repair (Sec. 504): Direct Loans............................................. 26 4 30 4 - - Grants....................................................... 29 29 29 29 - -
Farm Labor Housing Grants (Sec. 516) ..... 8 8 8 8 - - Farm Labor Housing Loans (Sec. 514) ...... 24 7 26 7 - - All Other Direct Loans ............................... 20 1 25 1 10 - Grants and Payments:
Rental Assistance/Vouchers (Sec. 521) ... 1,405 1,405 1,395 1,395 1,351 $1,351 Mutual and Self-Help (Sec. 523) ............. 30 30 30 30 - - Multi-Family Housing Revitalization...... 37 22 41 22 - - Multi-Family Housing Rev., Pilot Project 1 1 1 1 - - Multi-Family Housing Voucher Program 19 19 19 19 - - Rural Housing Preservation ..................... 5 5 5 5 - -
Community Facilities Programs: Direct Loans a........................................... 2,600 - 2,600 - 3,500 - Guaranteed Loans .................................... 148 3 101 3 - - Grants....................................................... 44 44 43 43 - -
Subtotal, RHS Programs............................. 29,662 1,656 29,623 1,645 29,111 1,351 Salaries and Expenses.............................. 412 412 409 409 392 392
Total, RHS .................................................... 30,074 2,068 30,033 2,055 29,503 1,743 a The total does not reflect $3 million in Community Facilities Direct subsidy unobligated balances proposed to be
cancelled in 2019.

2019 USDA BUDGET SUMMARY 38
Single Family Loan Program The Single Family Housing programs support homeownership opportunities to low-income families in rural areas. Guaranteed loans are limited to families with incomes less than 115 percent of area median income. The interest rate on guaranteed loans is negotiated between the borrower and the private lender. Both direct and guaranteed loans are means-tested.
The Budget proposes to eliminate the Single Family Housing direct loan program as the focus instead will be on creating homeownership opportunities through the guaranteed program. The Budget provides a $24 billion loan level for the guaranteed single family housing program. This level is expected to provide approximately 164,000 homeownership opportunities. The Budget also includes $10 million in program level for single family housing credit sales of acquired property.
Multi-Family Housing Programs The Multi-Family Housing program (direct and guaranteed portfolio) provides financing for rental housing projects and rental assistance payments for the low-income tenants of those projects. The portfolio currently includes about 14,500 projects which provide 453,000 total housing units. Approximately 651,000 limited-income individuals, many of whom are elderly, with an average annual income of about $13,181 reside in approximately 426,600 direct portfolio units.
The Budget requests $1.351 billion for rental assistance payments to fully fund all contract renewals, ensuring that the residents living in USDA-financed multi-family housing properties can continue to benefit from these grants and vouchers. Of this total, $1.331 billion is for rental assistance payments. Most Section 515 projects that are financed with direct loans receive rental assistance payments. These payments are made to the project sponsors and are used to reduce the rents of occupants to no more than 30 percent of the family income. For those tenants living in projects leaving the Section 515 program, the Budget also includes $20 million for the multi- family housing voucher program. The Budget proposes to eliminate the multi-family housing preservation and revitalization programs and the voucher program will be consolidated with the Rental Assistance program account.
The Budget proposes to require tenants utilizing rental assistance to contribute a minimum rent of $50 per month, unless the tenant qualifies for a hardship exemption as determined by the Secretary. USDA’s hardship exemptions will be in line with the Department of Housing and Urban Development’s hardship exemptions.
Section 538 guaranteed loans for multi-family housing would be funded at $250 million, which will be the main focus of new construction in 2019. The Budget proposes to eliminate the multi- family housing direct loan program and the farm labor housing program.
Community Facilities Loan Program Community Facilities loans provide funding for a wide range of essential community facilities to rural communities with populations of 20,000 or less, with priority given to healthcare, public safety, and education facilities.
The Budget provides $3.5 billion in program level funding for Community Facilities direct loans. Funding is provided for direct rather than guaranteed loans and grants due to the higher subsidy cost of the guaranteed program.
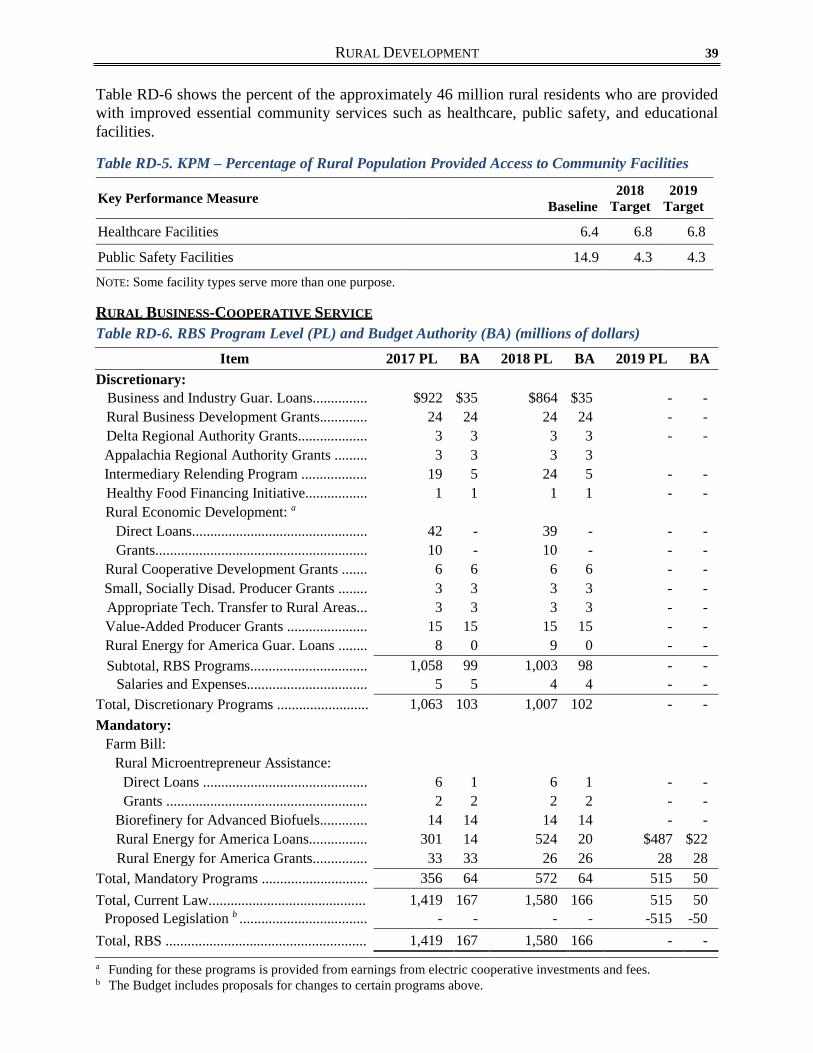
RURAL DEVELOPMENT 39
Table RD-6 shows the percent of the approximately 46 million rural residents who are provided with improved essential community services such as healthcare, public safety, and educational facilities.
Table RD-5. KPM – Percentage of Rural Population Provided Access to Community Facilities
Key Performance Measure Baseline
2018 Target
2019 Target
Healthcare Facilities 6.4 6.8 6.8
Public Safety Facilities 14.9 4.3 4.3
NOTE: Some facility types serve more than one purpose.
RURAL BUSINESS-COOPERATIVE SERVICE Table RD-6. RBS Program Level (PL) and Budget Authority (BA) (millions of dollars)
Item 2017 PL BA 2018 PL BA 2019 PL BA Discretionary:
Business and Industry Guar. Loans............... $922 $35 $864 $35 - - Rural Business Development Grants............. 24 24 24 24 - - Delta Regional Authority Grants................... 3 3 3 3 - - Appalachia Regional Authority Grants ......... 3 3 3 3 Intermediary Relending Program .................. 19 5 24 5 - - Healthy Food Financing Initiative................. 1 1 1 1 - - Rural Economic Development: a
Direct Loans................................................ 42 - 39 - - - Grants.......................................................... 10 - 10 - - -
Rural Cooperative Development Grants ....... 6 6 6 6 - - Small, Socially Disad. Producer Grants ........ 3 3 3 3 - - Appropriate Tech. Transfer to Rural Areas... 3 3 3 3 - - Value-Added Producer Grants ...................... 15 15 15 15 - - Rural Energy for America Guar. Loans ........ 8 0 9 0 - - Subtotal, RBS Programs................................ 1,058 99 1,003 98 - -
Salaries and Expenses................................. 5 5 4 4 - - Total, Discretionary Programs ......................... 1,063 103 1,007 102 - - Mandatory:
Farm Bill: Rural Microentrepreneur Assistance:
Direct Loans ............................................. 6 1 6 1 - - Grants ....................................................... 2 2 2 2 - -
Biorefinery for Advanced Biofuels............. 14 14 14 14 - - Rural Energy for America Loans................ 301 14 524 20 $487 $22 Rural Energy for America Grants............... 33 33 26 26 28 28
Total, Mandatory Programs ............................. 356 64 572 64 515 50 Total, Current Law........................................... 1,419 167 1,580 166 515 50
Proposed Legislation b ................................... - - - - -515 -50 Total, RBS ....................................................... 1,419 167 1,580 166 - - a Funding for these programs is provided from earnings from electric cooperative investments and fees. b The Budget includes proposals for changes to certain programs above.
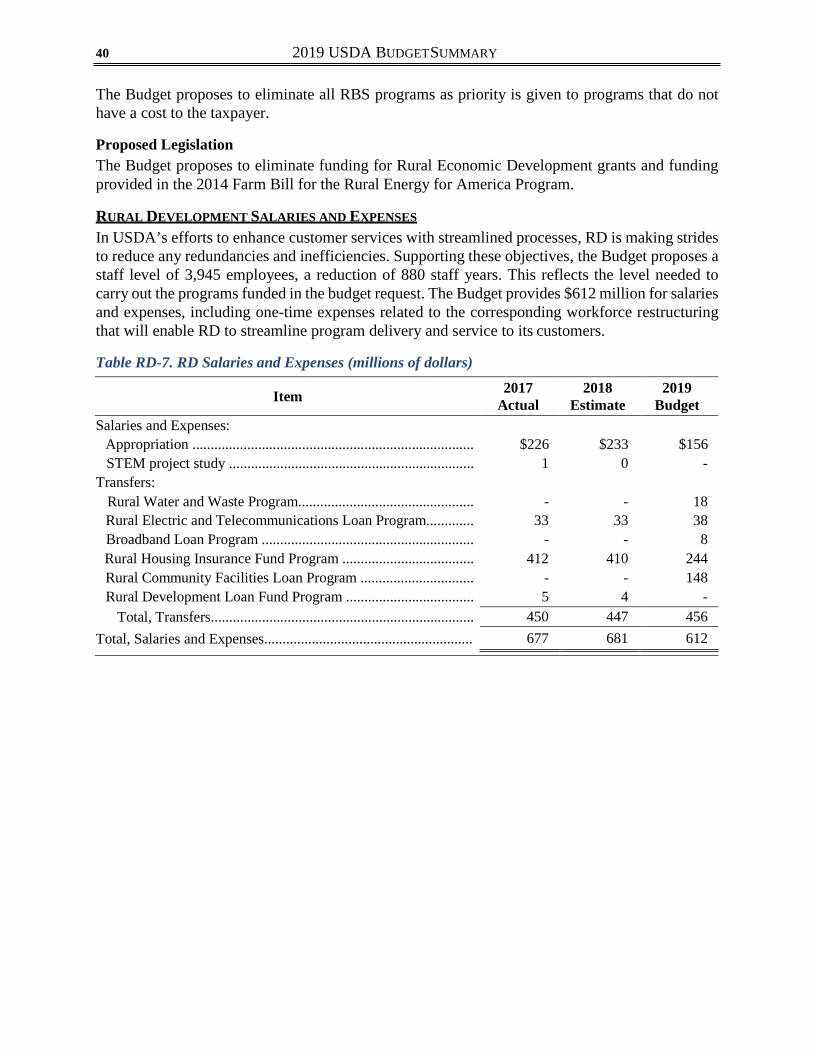
2019 USDA BUDGET SUMMARY 40
The Budget proposes to eliminate all RBS programs as priority is given to programs that do not have a cost to the taxpayer.
Proposed Legislation The Budget proposes to eliminate funding for Rural Economic Development grants and funding provided in the 2014 Farm Bill for the Rural Energy for America Program.
RURAL DEVELOPMENT SALARIES AND EXPENSES
In USDA’s efforts to enhance customer services with streamlined processes, RD is making strides to reduce any redundancies and inefficiencies. Supporting these objectives, the Budget proposes a staff level of 3,945 employees, a reduction of 880 staff years. This reflects the level needed to carry out the programs funded in the budget request. The Budget provides $612 million for salaries and expenses, including one-time expenses related to the corresponding workforce restructuring that will enable RD to streamline program delivery and service to its customers.
Table RD-7. RD Salaries and Expenses (millions of dollars)
Item 2017 Actual
2018 Estimate
2019 Budget
Salaries and Expenses: Appropriation ............................................................................. $226 $233 $156 STEM project study ................................................................... 1 0 -
Transfers: Rural Water and Waste Program................................................ - - 18 Rural Electric and Telecommunications Loan Program............. 33 33 38 Broadband Loan Program .......................................................... - - 8 Rural Housing Insurance Fund Program .................................... 412 410 244 Rural Community Facilities Loan Program ............................... - - 148 Rural Development Loan Fund Program ................................... 5 4 -
Total, Transfers........................................................................ 450 447 456 Total, Salaries and Expenses......................................................... 677 681 612
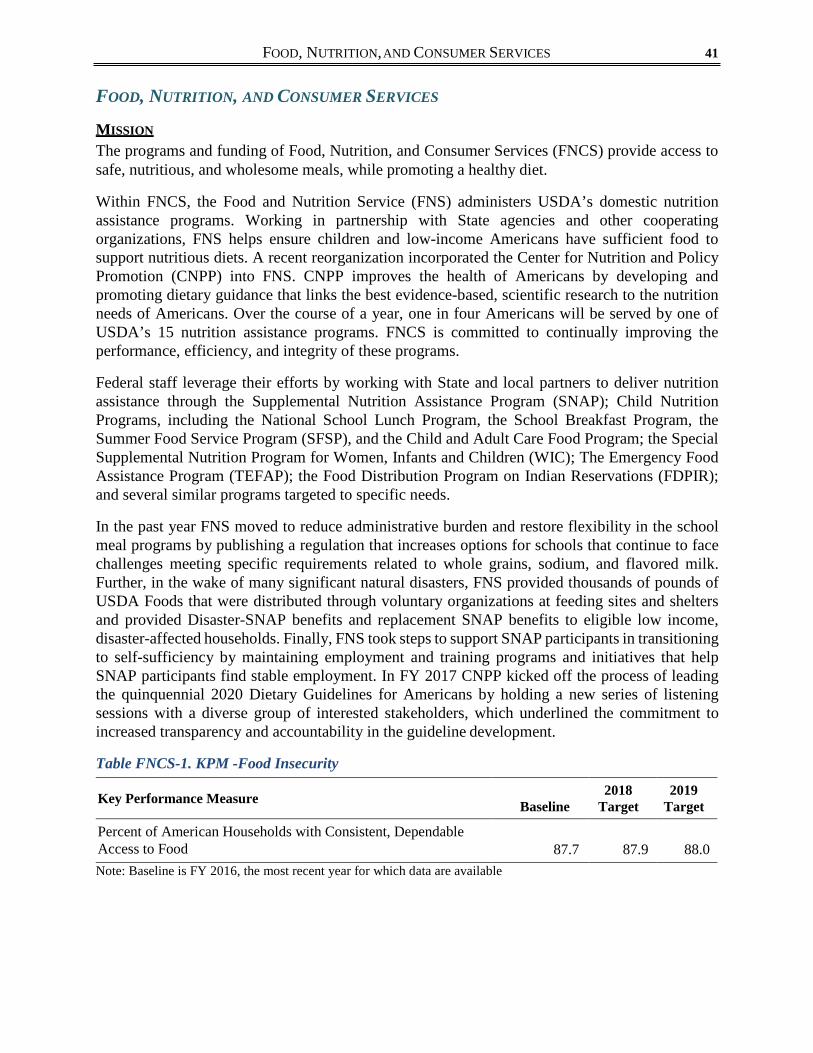
FOOD, NUTRITION, AND CONSUMER SERVICES 41
FOOD, NUTRITION, AND CONSUMER SERVICES
MISSION
The programs and funding of Food, Nutrition, and Consumer Services (FNCS) provide access to safe, nutritious, and wholesome meals, while promoting a healthy diet.
Within FNCS, the Food and Nutrition Service (FNS) administers USDA’s domestic nutrition assistance programs. Working in partnership with State agencies and other cooperating organizations, FNS helps ensure children and low-income Americans have sufficient food to support nutritious diets. A recent reorganization incorporated the Center for Nutrition and Policy Promotion (CNPP) into FNS. CNPP improves the health of Americans by developing and promoting dietary guidance that links the best evidence-based, scientific research to the nutrition needs of Americans. Over the course of a year, one in four Americans will be served by one of USDA’s 15 nutrition assistance programs. FNCS is committed to continually improving the performance, efficiency, and integrity of these programs.
Federal staff leverage their efforts by working with State and local partners to deliver nutrition assistance through the Supplemental Nutrition Assistance Program (SNAP); Child Nutrition Programs, including the National School Lunch Program, the School Breakfast Program, the Summer Food Service Program (SFSP), and the Child and Adult Care Food Program; the Special Supplemental Nutrition Program for Women, Infants and Children (WIC); The Emergency Food Assistance Program (TEFAP); the Food Distribution Program on Indian Reservations (FDPIR); and several similar programs targeted to specific needs.
In the past year FNS moved to reduce administrative burden and restore flexibility in the school meal programs by publishing a regulation that increases options for schools that continue to face challenges meeting specific requirements related to whole grains, sodium, and flavored milk. Further, in the wake of many significant natural disasters, FNS provided thousands of pounds of USDA Foods that were distributed through voluntary organizations at feeding sites and shelters and provided Disaster-SNAP benefits and replacement SNAP benefits to eligible low income, disaster-affected households. Finally, FNS took steps to support SNAP participants in transitioning to self-sufficiency by maintaining employment and training programs and initiatives that help SNAP participants find stable employment. In FY 2017 CNPP kicked off the process of leading the quinquennial 2020 Dietary Guidelines for Americans by holding a new series of listening sessions with a diverse group of interested stakeholders, which underlined the commitment to increased transparency and accountability in the guideline development.
Table FNCS-1. KPM -Food Insecurity
Key Performance Measure Baseline
2018 Target
2019 Target
Percent of American Households with Consistent, Dependable Access to Food
87.7
87.9
88.0
Note: Baseline is FY 2016, the most recent year for which data are available

2019 USDA BUDGET SUMMARY 42
FOOD AND NUTRITION SERVICE
The Budget provides funding for the major nutrition assistance programs, accounting for projected program participation and food cost inflation. It seeks to prevent and reduce food insecurity and to improve the nutritional status of recipients.
To support FNS’ work to identify and eliminate fraud, waste, and abuse, the Budget provides resources for program integrity efforts in all of the major programs, including SNAP, WIC, and the Child Nutrition Programs.
FNS will continue efforts to promote healthy eating in part by the use and promotion of MyPlate and the Dietary Guidelines for Americans. CNPP works in collaboration with the Department of Health and Human Services on the Dietary Guidelines for Americans to promote health and prevent chronic disease.
Table FNCS-2. FNS Budget Authority (millions of dollars)
Item 2017 Actual
2018 Estimate
2019 Budget
Discretionary: Special Supplemental Nutrition Program (WIC) a...................... $6,350 $6,313 $5,750 Commodity Assistance Program:
Commodity Supplemental Food Program ............................... 236 238 - The Emergency Food Assistance Program (TEFAP), Soup
Kitchens, Food Banks.........................................................
59
59
54 Farmers' Market Nutrition Program......................................... 19 19 - Pacific Island Assistance and Disaster Assistance................... 1 1 1 Nutrition Services Incentive Program b.................................... 3 3 -
Total, Commodity Assistance Program ................................ 318 320 55 Nutrition Programs Administration............................................ 171 170 161
Total, Discretionary Programs ...................................................... 6,839 6,803 5,966 Mandatory:
WIC: Universal Product Database ............................................. 1 1 1 Supplemental Nutrition Assistance Program (SNAP)................ 78,481 73,613 73,218 Child Nutrition Programs (CNP)................................................ 22,794 24,244 23,147 Permanent Appropriations.......................................................... 187 190 193 Farm Bill:
Seniors Farmers' Market Nutrition Program............................ 21 21 21 Total, Mandatory Programs .......................................................... 101,484 98,069 96,580 Total, Current Law........................................................................ 108,323 104,872 102,546
Proposed Legislation c ................................................................ - - -17,169 Total, FNS..................................................................................... 108,323 104,872 85,377 a Does not reflect $850 million in unobligated balances cancelled in 2017 and 2018 and $215 million in 2019. b Funds are transferred from the Department of Health and Human Services, Administration on Aging. Funds for
2019 will be determined at a later date. c The 2019 Budget includes proposals for changes to certain programs above.

FOOD, NUTRITION, AND CONSUMER SERVICES 43
Figure FNCS-1. FNS Budget Authority
Supplemental Nutrition Assistance Program (SNAP) SNAP will continue to respond to economic need. In 2019, participation is estimated to fall to an average level of 40.8 million participants per month from 42.2 million in 2018. The participation rate among eligible SNAP recipients was 83 percent in 2015, unchanged from 2014. While SNAP continues to respond to economic need, FNS will work to provide better customer service to participants by providing States flexibility to test new ways to administer programs.
SNAP Employment & Training (E&T) is a State administered program designed to help participants move towards self-sufficiency. States have flexibility in designing E&T programs that meet the needs of their participants and local economy. In an effort to promote self-sufficiency, the Budget supports E&T activities that engage able-bodied adults in education and skills-based training and encourages State and local innovations in training, case management, and program design that promotes self-sufficiency and achieves long-term stability in employment.
Table FNCS-3. KPM – SNAP E&T Participation
90 80 $78
$74 $73
70 60 50 40 30
$23 $24 $23
20 10 $6.4 $6.3 $5.8
0 WIC
2017
CNP
2018
SNAP
2019
$Bill
ions
Key Performance Measure
Baseline
2018 Target
2019 Target
Percentage of SNAP Employment & Training participants engaged in education and skills-based training
33
35
40
NOTE: Baseline is FY 2016, the most recent year for which data are available.
FDPIR provides food packages to Indian Tribal Organizations to improve nutrition and provide culturally appropriate sustenance. The Budget fully funds FDPIR food and administrative costs with a request of $153 million. The program is projected to serve 95,000 participants a month in 2019, down from 104,000 in 2018.

2019 USDA BUDGET SUMMARY 44
Child Nutrition Programs Through subsidies for meals that meet program standards, the National School Lunch Program, School Breakfast Program, Summer Food Service Program, Child and Adult Care Food Program, Fresh Fruit and Vegetable Program, and Special Milk Program assist State and local governments and private non-profit organizations in ensuring that children in schools and child care – and adults in adult day care programs – receive meals that meet their nutritional needs, foster healthy eating habits, reduce the number of overweight and obese children, and safeguard their health. The Budget funds the Child Nutrition Programs through new appropriations and prior year balances, at a level that will support anticipated increases in participation and food cost inflation. The Budget projects serving 5.25 billion lunches and snacks (an increase of 55.6 million, or 1.1 percent, over the current estimate for 2018) and 2.61 billion breakfasts in schools, 2.21 billion meals in child and adult care centers, and 156.2 million meals through Summer Food Service Program.
Table FNCS-4. KPM - National School Lunch Program (NSLP) Participation
Key Performance Measure Baseline
2018 Target
2019 Target
Annual percentage of eligible children participating in NSLP 58 59 59
Whereas more than 22 million children receive free or reduced price meals on school days, about one in six, or approximately 3.8 million children, receive free meals when school is not in session. USDA has been working to reduce food insecurity and hunger among school children in the summer. In 2017, 151.9 million meals were served during summer, including lunches and breakfasts served in the Summer Food Service Program as well as in schools through the Seamless Summer Option.
As part of this effort to reduce child food insecurity during the summer months, the Department is continuing to conduct the Summer Electronic Benefit Transfer (Summer EBT) demonstration projects. The projects have shown that providing a food benefit or an electronic debit card during the summer to low-income households with school-aged children can reduce severe food insecurity among children and improve children’s diets. To help address the large number of low- income children at risk of food insecurity during the summer, the Budget provides about $23 million to pilot new projects in summer 2019.
Farm to School initiatives are funded at $8.5 million, with $3.5 million for the Farm to School Team and $5 million provided annually under Section 18 of the Richard B. Russell National School Lunch Act for Farm to School grants. These grants ensure continued support of local and regional food systems by facilitating linkages between schools and their local food producers.
WIC WIC helps improve the health and nutritional intake of low-income pregnant, breastfeeding and postpartum women, infants and children up to their fifth birthday. WIC serves about half of all babies in the United States. It provides participants with benefits, redeemable at certified WIC retailers, for foods dense in nutrients known to be lacking in the diets of eligible groups. The program also provides nutrition education, breastfeeding counseling, and referrals to critical health and social services.
The Budget includes $5.75 billion for WIC to serve all eligible participants projected to seek WIC benefits. The WIC program has been experiencing lower-than-expected participation rates, due to continued flat or declining birth rates – particularly among mothers under the age of 30. WIC has
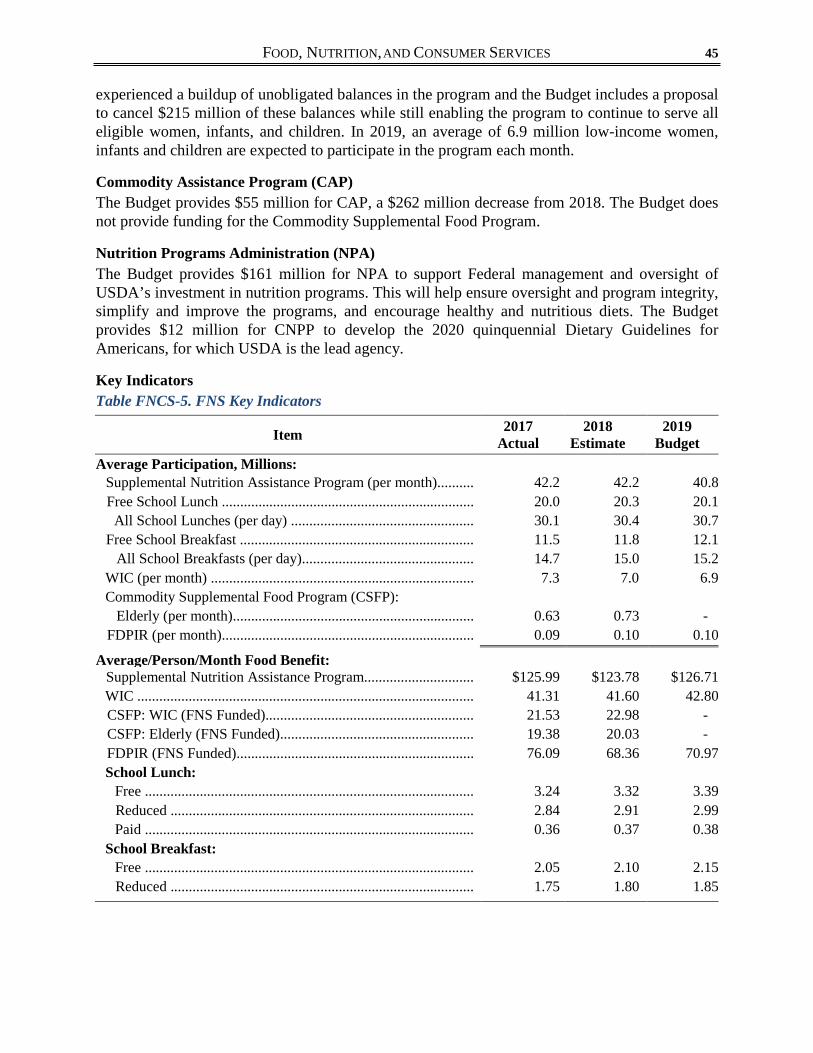
FOOD, NUTRITION, AND CONSUMER SERVICES 45
experienced a buildup of unobligated balances in the program and the Budget includes a proposal to cancel $215 million of these balances while still enabling the program to continue to serve all eligible women, infants, and children. In 2019, an average of 6.9 million low-income women, infants and children are expected to participate in the program each month.
Commodity Assistance Program (CAP) The Budget provides $55 million for CAP, a $262 million decrease from 2018. The Budget does not provide funding for the Commodity Supplemental Food Program.
Nutrition Programs Administration (NPA) The Budget provides $161 million for NPA to support Federal management and oversight of USDA’s investment in nutrition programs. This will help ensure oversight and program integrity, simplify and improve the programs, and encourage healthy and nutritious diets. The Budget provides $12 million for CNPP to develop the 2020 quinquennial Dietary Guidelines for Americans, for which USDA is the lead agency.
Key Indicators Table FNCS-5. FNS Key Indicators
Item 2017 Actual
2018 Estimate
2019 Budget
Average Participation, Millions: Supplemental Nutrition Assistance Program (per month).......... 42.2 42.2 40.8 Free School Lunch ..................................................................... 20.0 20.3 20.1
All School Lunches (per day) .................................................. 30.1 30.4 30.7 Free School Breakfast ................................................................ 11.5 11.8 12.1
All School Breakfasts (per day)............................................... 14.7 15.0 15.2 WIC (per month) ........................................................................ 7.3 7.0 6.9 Commodity Supplemental Food Program (CSFP):
Elderly (per month).................................................................. 0.63 0.73 - FDPIR (per month)..................................................................... 0.09 0.10 0.10
Average/Person/Month Food Benefit: Supplemental Nutrition Assistance Program.............................. $125.99 $123.78 $126.71 WIC ............................................................................................ 41.31 41.60 42.80 CSFP: WIC (FNS Funded)......................................................... 21.53 22.98 - CSFP: Elderly (FNS Funded)..................................................... 19.38 20.03 - FDPIR (FNS Funded)................................................................. 76.09 68.36 70.97 School Lunch:
Free .......................................................................................... 3.24 3.32 3.39 Reduced ................................................................................... 2.84 2.91 2.99 Paid .......................................................................................... 0.36 0.37 0.38
School Breakfast: Free .......................................................................................... 2.05 2.10 2.15 Reduced ................................................................................... 1.75 1.80 1.85

2019 USDA BUDGET SUMMARY 46
Figure FNCS-2. People Served Through Nutrition Assistance Programs
Proposed Legislation The Budget includes a bold new approach to nutrition assistance that combines the use of traditional SNAP Electronic Benefit Transfer cards with a USDA Foods Box that contains 100- percent American grown products. In addition, the Budget focuses on innovative administrative reforms on outcome-based employment strategies. This expands on previous proposals to strengthen expectations for work among able-bodied adults that will lead to self–sufficiency, reserves benefits for those most in need, promotes efficiency in State operations, and improves program integrity. Specifically, the USDA Foods Box proposal within SNAP has the potential to reduce waste, fraud, and abuse by limiting opportunities for benefits to be misused or trafficked.
50 45 42.2 42.2 40 8 40 35
30.1 30.4 30.7 30 25 20 15 10 7.3 7.0 6.9
5 0
WIC School Lunch SNAP
2017 2018 2019
Peop
le S
erve
d (M
illio
ns)
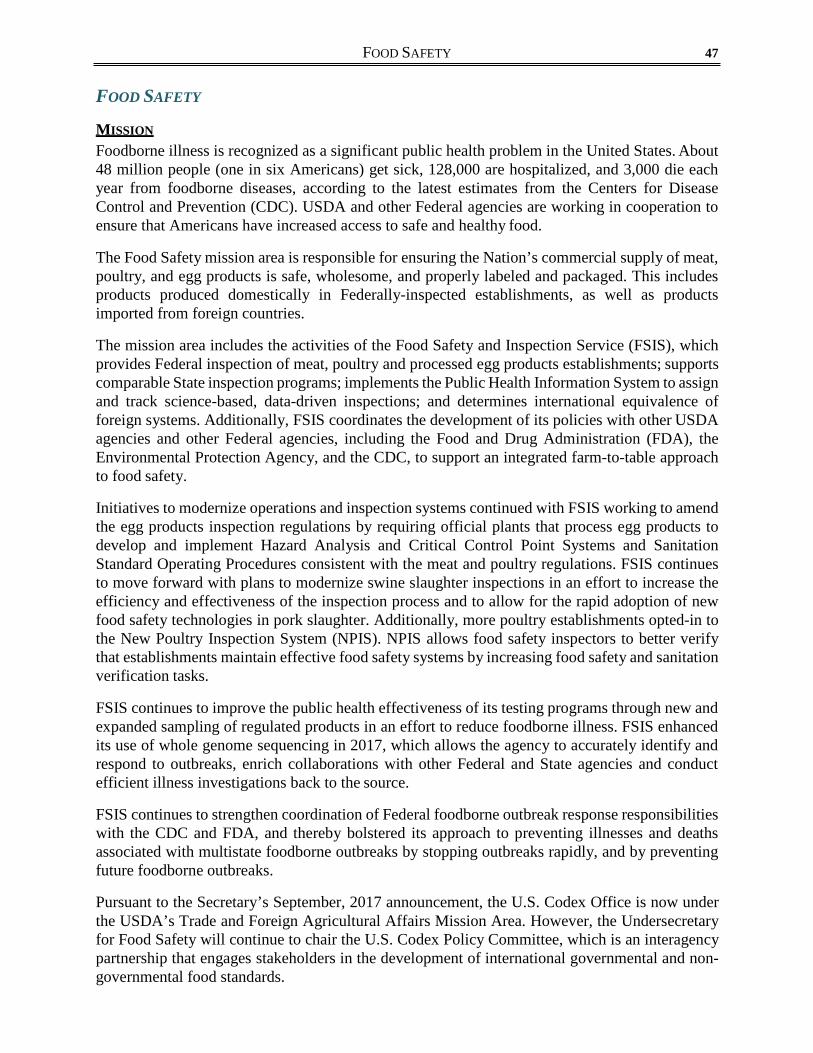
FOOD SAFETY 47
FOOD SAFETY
MISSION
Foodborne illness is recognized as a significant public health problem in the United States. About 48 million people (one in six Americans) get sick, 128,000 are hospitalized, and 3,000 die each year from foodborne diseases, according to the latest estimates from the Centers for Disease Control and Prevention (CDC). USDA and other Federal agencies are working in cooperation to ensure that Americans have increased access to safe and healthy food.
The Food Safety mission area is responsible for ensuring the Nation’s commercial supply of meat, poultry, and egg products is safe, wholesome, and properly labeled and packaged. This includes products produced domestically in Federally-inspected establishments, as well as products imported from foreign countries.
The mission area includes the activities of the Food Safety and Inspection Service (FSIS), which provides Federal inspection of meat, poultry and processed egg products establishments; supports comparable State inspection programs; implements the Public Health Information System to assign and track science-based, data-driven inspections; and determines international equivalence of foreign systems. Additionally, FSIS coordinates the development of its policies with other USDA agencies and other Federal agencies, including the Food and Drug Administration (FDA), the Environmental Protection Agency, and the CDC, to support an integrated farm-to-table approach to food safety.
Initiatives to modernize operations and inspection systems continued with FSIS working to amend the egg products inspection regulations by requiring official plants that process egg products to develop and implement Hazard Analysis and Critical Control Point Systems and Sanitation Standard Operating Procedures consistent with the meat and poultry regulations. FSIS continues to move forward with plans to modernize swine slaughter inspections in an effort to increase the efficiency and effectiveness of the inspection process and to allow for the rapid adoption of new food safety technologies in pork slaughter. Additionally, more poultry establishments opted-in to the New Poultry Inspection System (NPIS). NPIS allows food safety inspectors to better verify that establishments maintain effective food safety systems by increasing food safety and sanitation verification tasks.
FSIS continues to improve the public health effectiveness of its testing programs through new and expanded sampling of regulated products in an effort to reduce foodborne illness. FSIS enhanced its use of whole genome sequencing in 2017, which allows the agency to accurately identify and respond to outbreaks, enrich collaborations with other Federal and State agencies and conduct efficient illness investigations back to the source.
FSIS continues to strengthen coordination of Federal foodborne outbreak response responsibilities with the CDC and FDA, and thereby bolstered its approach to preventing illnesses and deaths associated with multistate foodborne outbreaks by stopping outbreaks rapidly, and by preventing future foodborne outbreaks.
Pursuant to the Secretary’s September, 2017 announcement, the U.S. Codex Office is now under the USDA’s Trade and Foreign Agricultural Affairs Mission Area. However, the Undersecretary for Food Safety will continue to chair the U.S. Codex Policy Committee, which is an interagency partnership that engages stakeholders in the development of international governmental and non- governmental food standards.
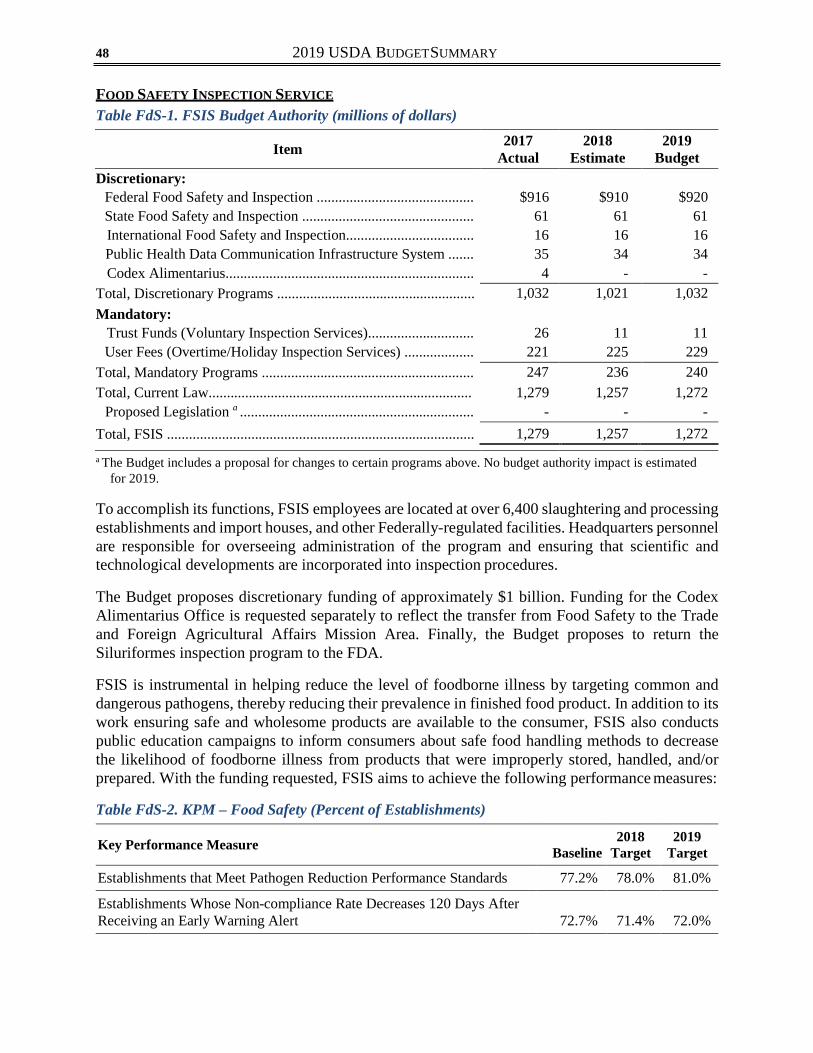
2019 USDA BUDGET SUMMARY 48
FOOD SAFETY INSPECTION SERVICE
Table FdS-1. FSIS Budget Authority (millions of dollars)
Item 2017 Actual
2018 Estimate
2019 Budget
Discretionary: Federal Food Safety and Inspection ........................................... $916 $910 $920 State Food Safety and Inspection ............................................... 61 61 61 International Food Safety and Inspection................................... 16 16 16 Public Health Data Communication Infrastructure System ....... 35 34 34 Codex Alimentarius.................................................................... 4 - -
Total, Discretionary Programs ...................................................... 1,032 1,021 1,032 Mandatory:
Trust Funds (Voluntary Inspection Services)............................. 26 11 11 User Fees (Overtime/Holiday Inspection Services) ................... 221 225 229
Total, Mandatory Programs .......................................................... 247 236 240 Total, Current Law........................................................................ 1,279 1,257 1,272
Proposed Legislation a ................................................................ - - - Total, FSIS .................................................................................... 1,279 1,257 1,272 a The Budget includes a proposal for changes to certain programs above. No budget authority impact is estimated
for 2019.
To accomplish its functions, FSIS employees are located at over 6,400 slaughtering and processing establishments and import houses, and other Federally-regulated facilities. Headquarters personnel are responsible for overseeing administration of the program and ensuring that scientific and technological developments are incorporated into inspection procedures.
The Budget proposes discretionary funding of approximately $1 billion. Funding for the Codex Alimentarius Office is requested separately to reflect the transfer from Food Safety to the Trade and Foreign Agricultural Affairs Mission Area. Finally, the Budget proposes to return the Siluriformes inspection program to the FDA.
FSIS is instrumental in helping reduce the level of foodborne illness by targeting common and dangerous pathogens, thereby reducing their prevalence in finished food product. In addition to its work ensuring safe and wholesome products are available to the consumer, FSIS also conducts public education campaigns to inform consumers about safe food handling methods to decrease the likelihood of foodborne illness from products that were improperly stored, handled, and/or prepared. With the funding requested, FSIS aims to achieve the following performance measures:
Table FdS-2. KPM – Food Safety (Percent of Establishments)
Key Performance Measure Baseline
2018 Target
2019 Target
Establishments that Meet Pathogen Reduction Performance Standards 77.2% 78.0% 81.0%
Establishments Whose Non-compliance Rate Decreases 120 Days After Receiving an Early Warning Alert
72.7%
71.4%
72.0%

FOOD SAFETY 49
User Fees and Trust Funds FSIS estimates it will collect $240 million in 2019 through existing user fee and trust fund activities for providing overtime, holiday, and voluntary inspection services.
Proposed Legislation FSIS is proposing a user fee to cover all domestic inspection, import re-inspection, and most of the central operations costs for Federal, State, and International inspection programs for meat, poultry, and egg products. The fee would not cover Federal functions such as investigation, enforcement, risk analysis, and emergency response. FSIS would implement this user fee beginning in 2020.
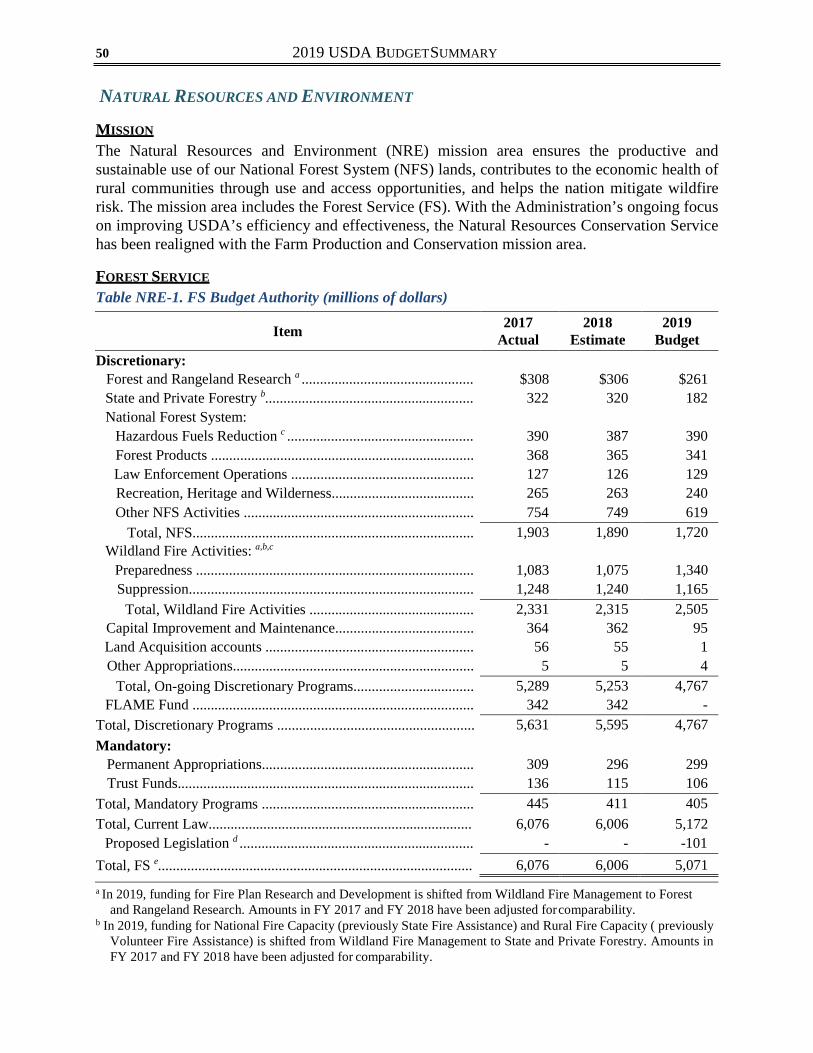
2019 USDA BUDGET SUMMARY 50
NATURAL RESOURCES AND ENVIRONMENT
MISSION
The Natural Resources and Environment (NRE) mission area ensures the productive and sustainable use of our National Forest System (NFS) lands, contributes to the economic health of rural communities through use and access opportunities, and helps the nation mitigate wildfire risk. The mission area includes the Forest Service (FS). With the Administration’s ongoing focus on improving USDA’s efficiency and effectiveness, the Natural Resources Conservation Service has been realigned with the Farm Production and Conservation mission area.
FOREST SERVICE Table NRE-1. FS Budget Authority (millions of dollars)
Item 2017 Actual
2018 Estimate
2019 Budget
Discretionary: Forest and Rangeland Research a ............................................... $308 $306 $261 State and Private Forestry b......................................................... 322 320 182 National Forest System:
Hazardous Fuels Reduction c ................................................... 390 387 390 Forest Products ........................................................................ 368 365 341 Law Enforcement Operations .................................................. 127 126 129 Recreation, Heritage and Wilderness....................................... 265 263 240 Other NFS Activities ............................................................... 754 749 619
Total, NFS............................................................................. 1,903 1,890 1,720 Wildland Fire Activities: a,b,c
Preparedness ............................................................................ 1,083 1,075 1,340 Suppression.............................................................................. 1,248 1,240 1,165
Total, Wildland Fire Activities ............................................. 2,331 2,315 2,505 Capital Improvement and Maintenance...................................... 364 362 95 Land Acquisition accounts ......................................................... 56 55 1 Other Appropriations.................................................................. 5 5 4
Total, On-going Discretionary Programs................................. 5,289 5,253 4,767 FLAME Fund ............................................................................. 342 342 -
Total, Discretionary Programs ...................................................... 5,631 5,595 4,767 Mandatory:
Permanent Appropriations.......................................................... 309 296 299 Trust Funds................................................................................. 136 115 106
Total, Mandatory Programs .......................................................... 445 411 405 Total, Current Law........................................................................ 6,076 6,006 5,172
Proposed Legislation d ................................................................ - - -101 Total, FS e...................................................................................... 6,076 6,006 5,071 a In 2019, funding for Fire Plan Research and Development is shifted from Wildland Fire Management to Forest
and Rangeland Research. Amounts in FY 2017 and FY 2018 have been adjusted for comparability. b In 2019, funding for National Fire Capacity (previously State Fire Assistance) and Rural Fire Capacity ( previously
Volunteer Fire Assistance) is shifted from Wildland Fire Management to State and Private Forestry. Amounts in FY 2017 and FY 2018 have been adjusted for comparability.
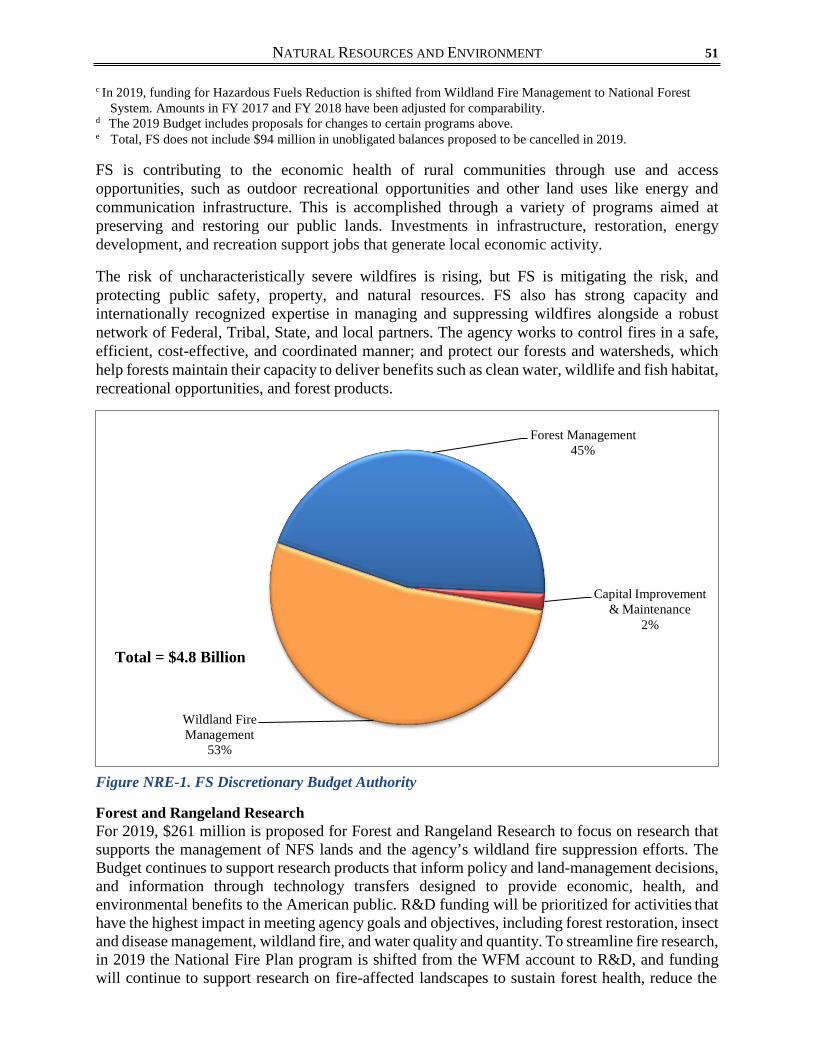
NATURAL RESOURCES AND ENVIRONMENT 51
c In 2019, funding for Hazardous Fuels Reduction is shifted from Wildland Fire Management to National Forest
System. Amounts in FY 2017 and FY 2018 have been adjusted for comparability. d The 2019 Budget includes proposals for changes to certain programs above. e Total, FS does not include $94 million in unobligated balances proposed to be cancelled in 2019.
FS is contributing to the economic health of rural communities through use and access opportunities, such as outdoor recreational opportunities and other land uses like energy and communication infrastructure. This is accomplished through a variety of programs aimed at preserving and restoring our public lands. Investments in infrastructure, restoration, energy development, and recreation support jobs that generate local economic activity.
The risk of uncharacteristically severe wildfires is rising, but FS is mitigating the risk, and protecting public safety, property, and natural resources. FS also has strong capacity and internationally recognized expertise in managing and suppressing wildfires alongside a robust network of Federal, Tribal, State, and local partners. The agency works to control fires in a safe, efficient, cost-effective, and coordinated manner; and protect our forests and watersheds, which help forests maintain their capacity to deliver benefits such as clean water, wildlife and fish habitat, recreational opportunities, and forest products.
Forest Management 45%
Capital Improvement & Maintenance
2%
Total = $4.8 Billion
Wildland Fire Management
53%
Figure NRE-1. FS Discretionary Budget Authority
Forest and Rangeland Research For 2019, $261 million is proposed for Forest and Rangeland Research to focus on research that supports the management of NFS lands and the agency’s wildland fire suppression efforts. The Budget continues to support research products that inform policy and land-management decisions, and information through technology transfers designed to provide economic, health, and environmental benefits to the American public. R&D funding will be prioritized for activities that have the highest impact in meeting agency goals and objectives, including forest restoration, insect and disease management, wildland fire, and water quality and quantity. To streamline fire research, in 2019 the National Fire Plan program is shifted from the WFM account to R&D, and funding will continue to support research on fire-affected landscapes to sustain forest health, reduce the
2019 USDA BUDGET SUMMARY 52
risk of damaging wildland fires, and ensure firefighter safety. The Budget provides $75 million for Forest Inventory and Analysis to strengthen the collection, coordination, and assessment of field inventory data, and create a robust landscape scale inventory and analysis effort in all 50 States and U.S. Territories.
State and Private Forestry (S&PF) For 2019, $182 million is proposed for S&PF programs, including about $85.9 million to address the greatest emerging threats to forest health on and off NFS land. Through S&PF programs, FS addresses forest health concerns across more than 750 million acres of Federal, State, and private lands, creating a more connected forest landscape. The Budget continues to support the productivity and health of private working lands through the $19.5 million commitment to the Working Forest Lands program (previously Forest Stewardship). This program assists non- industrial private forest landowners to enhance and sustain their forest resources, and maintain local forest product markets. The Budget proposes to shift the funding of National Fire Capacity (previously State Fire Assistance) ($65.9 million) and Rural Fire Capacity (previously Volunteer Fire Assistance) ($11 million) from WFM. These two programs will continue to build state and local fire capacity to protect non-federal forestlands threatened by wildfire.
National Forest System (NFS) The Forest Service manages over 193 million acres of public land in 44 States and Puerto Rico, collectively known as the NFS. The Budget proposes to fund NFS at $1.7 billion, prioritizing programs designed to increase the health and resilience of the national forests and grasslands, while also meeting the multiple use requirements for the resources on our Nation's forests and grasslands. The Budget ensures that our national forests and grasslands continue to provide clean air and water, forest and rangeland products, mineral and energy resources, quality habitat for fish and wildlife, recreational opportunities, and jobs.
Hazardous Fuels, Forest Products, Vegetation and Watershed, and Wildlife and Fisheries programs work together efficiently to restore healthy, resilient landscapes and create safer communities. Forest Products generate over 43,000 jobs and about $3.2 billion of gross domestic product annually. With $390 million dedicated to Hazardous Fuels Reduction (a $2.6 million increase over FY 2018), and $341 million for Forest Products, among other programs, the agency will accomplish a timber output of 3.7 billion board feet, restore 2.1 million acres, treat 3.4 million acres for hazardous fuels, and improve 14 watersheds.
The Budget proposes to eliminate the Integrated Resources Restoration pilot in Regions 1 (Northern), 3 (Southwestern), and 4 (Intermountain). The Budget requests that funding for the Hazardous Fuels program be moved from the Wildland Fire Management account to the NFS program, as the majority of Hazardous Fuels work takes place on NFS or adjacent lands.
The Budget also continues to support use and access opportunities on NFS land. Acknowledging that outdoor recreation supports about 143,000 full and part-time jobs, and contributes close to $10.3 billion to the Gross Domestic Product, the Budget supports recreation at $240 million. The agency will prioritize permitting for outfitters and guides, maintaining and growing strong collaborations with partners and volunteer groups, and working to address the recreational needs of today’s public, who want year-round activities on NFS lands.
The agency will also continue to improve its permitting processes to promote other critical land uses on NFS lands such as energy, utility, and communication infrastructure, as these uses provide approximately $30 billion annually to the Gross Domestic Product, support 120,000 private sector
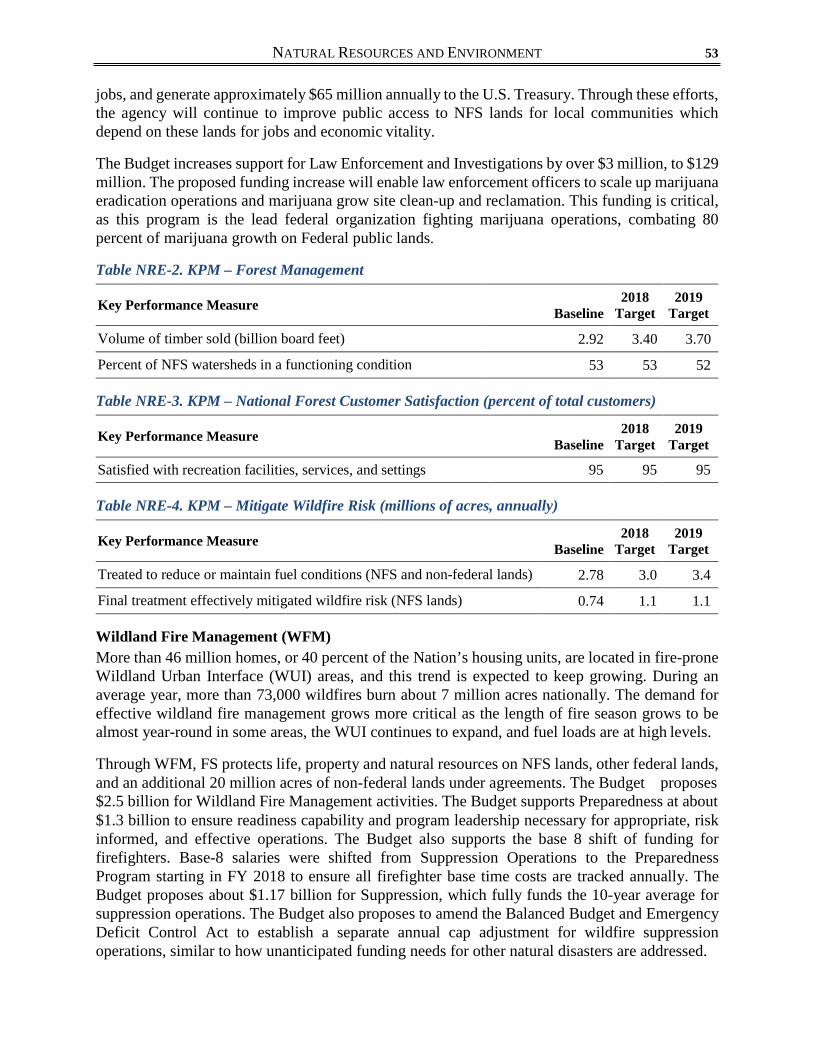
NATURAL RESOURCES AND ENVIRONMENT 53
jobs, and generate approximately $65 million annually to the U.S. Treasury. Through these efforts, the agency will continue to improve public access to NFS lands for local communities which depend on these lands for jobs and economic vitality.
The Budget increases support for Law Enforcement and Investigations by over $3 million, to $129 million. The proposed funding increase will enable law enforcement officers to scale up marijuana eradication operations and marijuana grow site clean-up and reclamation. This funding is critical, as this program is the lead federal organization fighting marijuana operations, combating 80 percent of marijuana growth on Federal public lands.
Table NRE-2. KPM – Forest Management
Key Performance Measure Baseline
2018 Target
2019 Target
Volume of timber sold (billion board feet) 2.92 3.40 3.70
Percent of NFS watersheds in a functioning condition 53 53 52
Table NRE-3. KPM – National Forest Customer Satisfaction (percent of total customers)
Key Performance Measure Baseline
2018 Target
2019 Target
Satisfied with recreation facilities, services, and settings 95 95 95
Table NRE-4. KPM – Mitigate Wildfire Risk (millions of acres, annually)
Key Performance Measure Baseline
2018 Target
2019 Target
Treated to reduce or maintain fuel conditions (NFS and non-federal lands) 2.78 3.0 3.4
Final treatment effectively mitigated wildfire risk (NFS lands) 0.74 1.1 1.1
Wildland Fire Management (WFM) More than 46 million homes, or 40 percent of the Nation’s housing units, are located in fire-prone Wildland Urban Interface (WUI) areas, and this trend is expected to keep growing. During an average year, more than 73,000 wildfires burn about 7 million acres nationally. The demand for effective wildland fire management grows more critical as the length of fire season grows to be almost year-round in some areas, the WUI continues to expand, and fuel loads are at high levels.
Through WFM, FS protects life, property and natural resources on NFS lands, other federal lands, and an additional 20 million acres of non-federal lands under agreements. The Budget proposes $2.5 billion for Wildland Fire Management activities. The Budget supports Preparedness at about $1.3 billion to ensure readiness capability and program leadership necessary for appropriate, risk informed, and effective operations. The Budget also supports the base 8 shift of funding for firefighters. Base-8 salaries were shifted from Suppression Operations to the Preparedness Program starting in FY 2018 to ensure all firefighter base time costs are tracked annually. The Budget proposes about $1.17 billion for Suppression, which fully funds the 10-year average for suppression operations. The Budget also proposes to amend the Balanced Budget and Emergency Deficit Control Act to establish a separate annual cap adjustment for wildfire suppression operations, similar to how unanticipated funding needs for other natural disasters are addressed.
2019 USDA BUDGET SUMMARY 54
The Budget also supports aviation at $228 million total. The Budget provides funding for an aviation fleet that meets wildland fire response requirements, including up to 18 air tankers and 108 helicopters. 2018 will mark the last year the agency will support the HC-130H program that was authorized within the 2014 National Defense Authorization Act. The agency has determined the HC-130H program is no longer necessary because private industry is capable of fulfilling the agency’s required large air tanker needs. The agency will seek the support of the appropriate Congressional committees to terminate the agency-owned HC-130H program in 2019.
The Budget proposes to shift the funding of National Fire Capacity (previously State Fire Assistance) ($65.9 million) and Rural Fire Capacity (previously Volunteer Fire Assistance) ($11 million) from WFM to State and Private Forestry. These two programs will continue to build state and local fire capacity to protect non-federal forestlands threatened by wildfire. In addition, in 2019 the National Fire Capacity program is shifted to the Forest and Rangeland Research account, and funding will continue to support research on fire-affected landscapes to sustain forest health, reduce the risk of damaging wildland fires, and ensure firefighter safety.
Capital Improvement and Maintenance (CIM) The Forest Service provides public access to national forests for recreation; facilities for fire and forest research; and infrastructure for businesses and industries. CIM funds construction and maintenance of infrastructure on the NFS, including buildings, recreation sites, facilities, roads, and trails. FS currently manages over 372,000 miles of roads, 157,000 miles of trails, 6,200 bridges, 460 agency owned dams, 39,000 buildings, 27,000 recreation sites, and 9,543 water/wastewater systems. The Roads program ensures the productive and sustainable use of NFS lands for many purposes, including hunting, fishing, and hiking, use by first responders in emergencies, timber harvests, mining, and access to rural communities. For 2019, total funding for this work is proposed at about $95 million.
Land Acquisition The Budget proposes $1 million for the acquisition and donation of lands, waters, and related interests within the NFS to further agency goals for restoration, outdoor recreation and public access, habitat for wildlife, and to protect water quality. While the agency will continue to operate under several specific land acquisition authorities, the main Land Acquisition fund is proposed for elimination because the agency will focus on the maintenance of existing NFS lands in FY 2019.
Proposed Legislation The Budget supports a legislative solution to address the way FS funds wildland firefighting so that the agency is not routinely borrowing money from prevention programs to combat ongoing wildfires. Currently, the Suppression program is funded at a growing, rolling ten-year average of discretionary appropriations, but the Budget supports a solution that treats wildfires the same as other disasters, which are covered by emergency funds.
The Budget requests the reauthorization of the authority to collect recreation revenue for use in providing quality recreation facilities and supporting land management operations (Federal Lands Recreation Enhancement Act). The Budget also seeks the reauthorization of the expired authority to convey administrative sites that the agency no longer needs while retaining the sales proceeds to maintain infrastructure safety and customer service (Forest Service Facility Realignment and Enhancement Act).
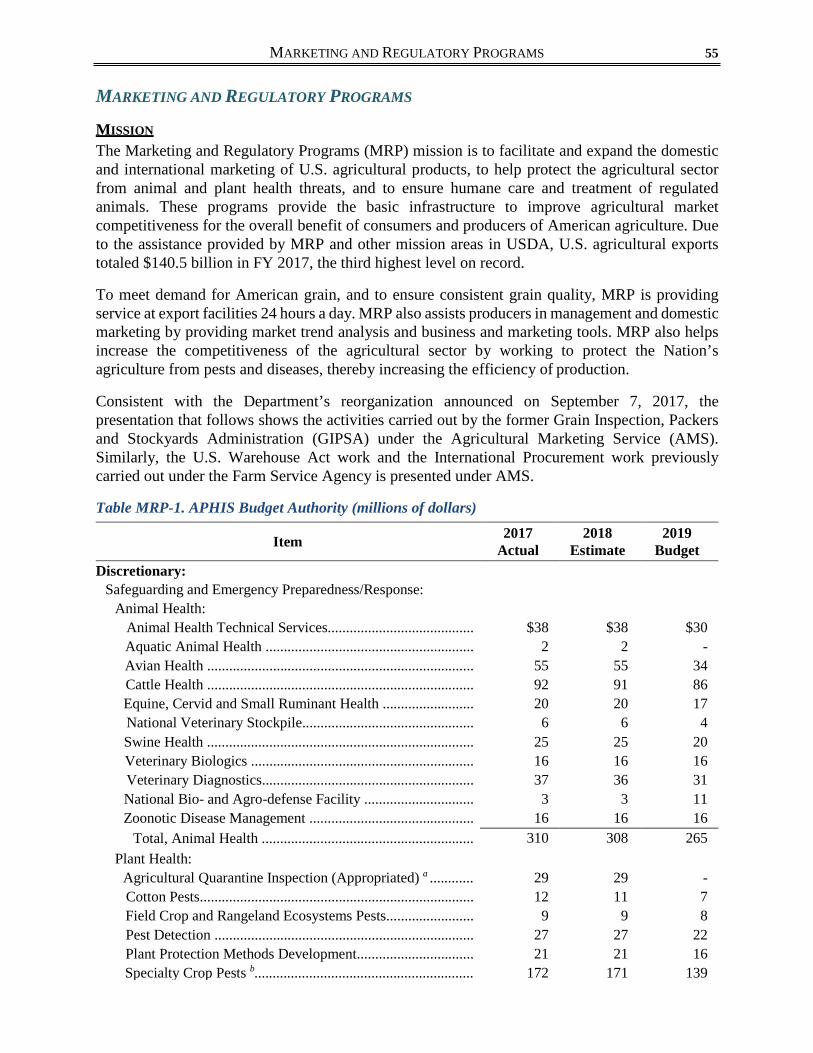
MARKETING AND REGULATORY PROGRAMS 55
MARKETING AND REGULATORY PROGRAMS
MISSION
The Marketing and Regulatory Programs (MRP) mission is to facilitate and expand the domestic and international marketing of U.S. agricultural products, to help protect the agricultural sector from animal and plant health threats, and to ensure humane care and treatment of regulated animals. These programs provide the basic infrastructure to improve agricultural market competitiveness for the overall benefit of consumers and producers of American agriculture. Due to the assistance provided by MRP and other mission areas in USDA, U.S. agricultural exports totaled $140.5 billion in FY 2017, the third highest level on record.
To meet demand for American grain, and to ensure consistent grain quality, MRP is providing service at export facilities 24 hours a day. MRP also assists producers in management and domestic marketing by providing market trend analysis and business and marketing tools. MRP also helps increase the competitiveness of the agricultural sector by working to protect the Nation’s agriculture from pests and diseases, thereby increasing the efficiency of production.
Consistent with the Department’s reorganization announced on September 7, 2017, the presentation that follows shows the activities carried out by the former Grain Inspection, Packers and Stockyards Administration (GIPSA) under the Agricultural Marketing Service (AMS). Similarly, the U.S. Warehouse Act work and the International Procurement work previously carried out under the Farm Service Agency is presented under AMS.
Table MRP-1. APHIS Budget Authority (millions of dollars)
Item 2017 Actual
2018 Estimate
2019 Budget
Discretionary: Safeguarding and Emergency Preparedness/Response:
Animal Health: Animal Health Technical Services........................................ $38 $38 $30 Aquatic Animal Health ......................................................... 2 2 - Avian Health ......................................................................... 55 55 34 Cattle Health ......................................................................... 92 91 86 Equine, Cervid and Small Ruminant Health ......................... 20 20 17 National Veterinary Stockpile............................................... 6 6 4 Swine Health ......................................................................... 25 25 20 Veterinary Biologics ............................................................. 16 16 16 Veterinary Diagnostics.......................................................... 37 36 31 National Bio- and Agro-defense Facility .............................. 3 3 11 Zoonotic Disease Management ............................................. 16 16 16
Total, Animal Health .......................................................... 310 308 265 Plant Health:
Agricultural Quarantine Inspection (Appropriated) a ............ 29 29 - Cotton Pests........................................................................... 12 11 7 Field Crop and Rangeland Ecosystems Pests........................ 9 9 8 Pest Detection ....................................................................... 27 27 22 Plant Protection Methods Development................................ 21 21 16 Specialty Crop Pests b............................................................ 172 171 139
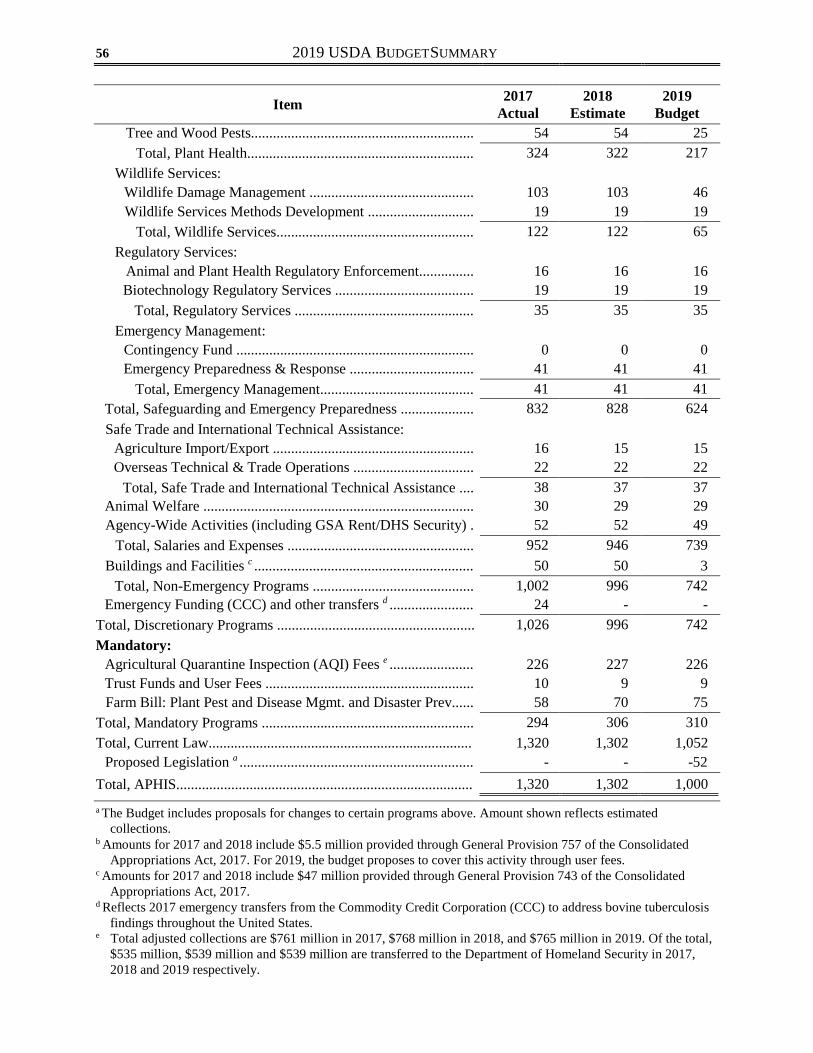
2019 USDA BUDGET SUMMARY 56
Item 2017 Actual
2018 Estimate
2019 Budget
Tree and Wood Pests............................................................. 54 54 25 Total, Plant Health.............................................................. 324 322 217
Wildlife Services: Wildlife Damage Management ............................................. 103 103 46 Wildlife Services Methods Development ............................. 19 19 19
Total, Wildlife Services...................................................... 122 122 65 Regulatory Services:
Animal and Plant Health Regulatory Enforcement............... 16 16 16 Biotechnology Regulatory Services ...................................... 19 19 19
Total, Regulatory Services ................................................. 35 35 35 Emergency Management:
Contingency Fund ................................................................. 0 0 0 Emergency Preparedness & Response .................................. 41 41 41
Total, Emergency Management.......................................... 41 41 41 Total, Safeguarding and Emergency Preparedness .................... 832 828 624 Safe Trade and International Technical Assistance:
Agriculture Import/Export ....................................................... 16 15 15 Overseas Technical & Trade Operations ................................. 22 22 22
Total, Safe Trade and International Technical Assistance .... 38 37 37 Animal Welfare .......................................................................... 30 29 29 Agency-Wide Activities (including GSA Rent/DHS Security) . 52 52 49
Total, Salaries and Expenses ................................................... 952 946 739 Buildings and Facilities c ............................................................ 50 50 3
Total, Non-Emergency Programs ............................................ 1,002 996 742 Emergency Funding (CCC) and other transfers d ....................... 24 - -
Total, Discretionary Programs ...................................................... 1,026 996 742 Mandatory:
Agricultural Quarantine Inspection (AQI) Fees e ....................... 226 227 226 Trust Funds and User Fees ......................................................... 10 9 9 Farm Bill: Plant Pest and Disease Mgmt. and Disaster Prev...... 58 70 75
Total, Mandatory Programs .......................................................... 294 306 310 Total, Current Law........................................................................ 1,320 1,302 1,052
Proposed Legislation a ................................................................ - - -52 Total, APHIS................................................................................. 1,320 1,302 1,000 a The Budget includes proposals for changes to certain programs above. Amount shown reflects estimated
collections. b Amounts for 2017 and 2018 include $5.5 million provided through General Provision 757 of the Consolidated
Appropriations Act, 2017. For 2019, the budget proposes to cover this activity through user fees. c Amounts for 2017 and 2018 include $47 million provided through General Provision 743 of the Consolidated
Appropriations Act, 2017. d Reflects 2017 emergency transfers from the Commodity Credit Corporation (CCC) to address bovine tuberculosis
findings throughout the United States. e Total adjusted collections are $761 million in 2017, $768 million in 2018, and $765 million in 2019. Of the total,
$535 million, $539 million and $539 million are transferred to the Department of Homeland Security in 2017, 2018 and 2019 respectively.
MARKETING AND REGULATORY PROGRAMS 57
APHIS works cooperatively with State and local agencies, private groups, and foreign governments to protect the Nation’s agriculture. The Budget includes discretionary funding of $742 million, of which $739 million is for programmatic operations and $3 million for the Buildings and Facilities account.
Table MRP-2. KPM – Federal Emergency Response
Key Performance Measure Baseline
2018 Target
2019 Target
Maximum number of hours to mobilize resources once it is determined a Federal emergency response is needed to manage an agricultural outbreak
24
24
24
Safeguarding and Emergency Preparedness/Response The Budget includes discretionary appropriations of $624 million for safeguarding and emergency preparedness and response. These safeguarding and emergency programs, specifically for animal health and specialty crops, protect $193 billion of livestock, poultry, and specialty crops on an annual basis.
To combat any sudden, urgent and unforeseen pest and disease outbreaks, the Secretary retains authority to transfer funds from the CCC or other USDA accounts. The Budget provides technical and financial support to help control or eradicate a variety of animal and plant health threats:
Animal Health The Budget includes a total of $265 million for Animal Health, which includes an increase to enable the transfer of science programs from Plum Island Animal Disease Center to the National Bio and Agro-defense Facility. The Budget proposes decreases to the Federal funding for all livestock and poultry health efforts as well as disease traceability efforts. The Budget also proposes to eliminate Federal contributions for the Cervid Health Program, as well as the Federal role in Aquatic Animal Health activities. In collaboration with industry and States, APHIS has established the framework for managing animal health needs in the aquaculture industry. This framework can be used by industry to establish voluntary programs, and by State and local governments to maintain or enhance aquatic animal health. APHIS will continue working with States and other stakeholders to leverage resources in addressing the highest priority animal health issues.
Plant Health The Budget includes $217 million for Plant Health. The Budget proposes a new discretionary user fee to fund domestic Agricultural Quarantine and Inspection (AQI) activities in a similar manner as AQI activities conducted for cargo and passengers originating from outside of the U.S. The Budget proposes decreases to the Federal share of funding for specific plant pest and disease programs and plant survey efforts. APHIS will continue working with States and other stakeholders to leverage resources in addressing the highest priority plant health issues. The Budget also proposes reductions for internal plant methods development of tools and technologies. The Agency will adjust its rate at which it develops trapping, identification, and survey technologies while maintaining focus on tools to manage or eradicate high priority invasive pest threats.
Wildlife Services The Budget includes a total of $65 million for Wildlife Services. The Budget proposes to reduce the Federal share of funding for programs that provide localized benefits. Under the Budget, the Wildlife Damage Management program will continue to provide education and technical
2019 USDA BUDGET SUMMARY 58
assistance; however, cooperators requesting direct control assistance will need to cover the operational program costs. In addition, while the national rabies management and feral swine programs will maintain core activities with Federal funding, cooperators will need to cover costs associated with enhanced activities or local projects outside of these programs’ core activities.
Regulatory Services The Budget includes $35 million for Regulatory Services, which will maintain current services. This includes funding for the Animal and Plant Health Regulatory Enforcement program, which promotes the integrity of APHIS programs by providing effective investigative and enforcement services. This also funds Biotechnology Regulatory Services activities at the current level. In 2017, USDA completed three petitions meeting the goal for determinations of nonregulated status.
Emergency Management The Budget includes $41 million for Emergency Management. This continues the enhanced emergency preparedness efforts initiated following the Avian Influenza outbreak of 2015.
Safe Trade and International Technical Assistance The Budget maintains the level of funding for Safe Trade and International Technical Assistance activities at $37 million. APHIS will continue to support activities to facilitate safe U.S. agricultural trade. In 2016, APHIS efforts to eliminate trade barriers and to ensure that trade decisions are based on science resulted in the retention, opening or expansion of markets worth $2.6 billion for U.S. agricultural producers.
Animal Welfare The Budget maintains the level of funding for Animal Welfare activities at $29 million. APHIS will continue to support activities related to the protection of animal species covered under the Animal Welfare Act and the Horse Protection Act.
Buildings and Facilities The Budget includes $3 million in funding for general repairs and maintenance.
User Fees for Agricultural Quarantine and Inspection In addition to discretionary funding, APHIS currently collects mandatory user fees to cover costs related to agricultural quarantine and inspection activities that occur at ports of entry. A portion of these collections are provided to the Department of Homeland Security’s Customs and Border Protection (CBP) to conduct front line inspections at points of entry. With retained funding, APHIS supports international trade by assessing the plant and animal health risks associated with such trade. APHIS also develops regulations to protect agricultural health; inspects and quarantines imported plant propagative materials; trains agricultural inspectors and detector dog teams; and provides the scientific support necessary to carry out these activities as well as those carried out by CBP.
Proposed Legislation The Budget proposes to authorize the collection of user fees for certain Animal Welfare, Veterinary Biologics, and for Biotechnology Regulatory Services activities. The proposed user fees will place a portion of the costs of providing these services on the recipient rather than the U.S. taxpayer. The Budget proposes domestic Agricultural Quarantine and Inspection activities be funded in a manner similar to activities conducted for cargo and passengers originating from outside of the U.S.

MARKETING AND REGULATORY PROGRAMS 59
AGRICULTURAL MARKETING SERVICE Table MRP-3. AMS Budget Authority (millions of dollars)
Item 2017 Actual
2018 Estimate
2019 Budget
Discretionary: Marketing Services:
Market News............................................................................ $34 $33 $29 Egg Surveillance and Standardization ..................................... 8 8 7 Market Protection and Promotion............................................ 32 32 34 National Bioengineered Food Disclosure Standard................. 1 1 1 Transportation and Market Development ................................ 10 11 7 Packers and Stockyards ........................................................... 23 23 23 Grain Regulatory a.................................................................... 20 20 - US Warehouse Act .................................................................. 7 5 5 International Food Procurement Program................................ 4 13 13
Total, Marketing Services ..................................................... 139 146 119 Payments to States and Possessions ........................................... 1 1 1
Total, Discretionary Programs ...................................................... 140 147 120 Mandatory:
Funds for Strengthening Markets, Income, and Supply (Section 32):
Commodity Program Expenses ............................................... 786 784 733 Section 32 Administrative Funds:
Marketing Orders and Agreements ....................................... 21 21 20 Commodity Purchase Services.............................................. 35 35 36 Total, Section 32 Administrative Funds ............................. 56 56 56
Total, Section 32 Funds ........................................................... 842 840 789 User Fees:
Perishable Agricultural Commodities Act ............................... 12 11 11 Commodity Grading Services.................................................. 158 160 160 Inspection and Weighing Services........................................... 52 55 80 Warehouse Examinations ........................................................ - - 4
Total, User Fee Funded Programs......................................... 222 226 255 Trust Funds:
Wool Research, Development and Promotion......................... 2 2 2 Farm Bill:
Specialty Crop Block Grants ................................................... 67 79 85 Farmers Market and Local Food Promotion Program ............. 28 28 -
Total, Farm Bill Programs..................................................... 95 107 85 Total, Mandatory Programs .......................................................... 1,161 1,175 1,131 Total, Current Law........................................................................ 1,301 1,322 1,251
Proposed Legislation .................................................................. - - -43 Total, AMS ................................................................................... 1,301 1,322 1,208 a For 2019, the Budget proposes to cover this activity through user fees.

2019 USDA BUDGET SUMMARY 60
AMS’ mission is to facilitate the competitive and efficient marketing of agricultural products in domestic and international markets, while ensuring fair trading practices. AMS programs aid producers in meeting the changing demands of consumers, and domestic and international marketing practices. The Budget proposes discretionary funding of $119 million.
AMS administers a variety of programs that enhance the marketing and distribution of agricultural products. Activities include the collection, analysis, and dissemination of market information; surveillance of shell egg handling operations; development of commodity grade standards; protection of producers from unfair marketing practices; statistical sampling and analysis of commodities for pesticide residues; development and enforcement of organic standards; and research and technical assistance aimed at improving efficiency of food marketing and distribution.
USDA has recently undertaken some reorganizations involving AMS to streamline inspection, grading, and procurement programs. These changes will improve the integrity and efficiency of customer service delivery. Moving the Packers and Stockyards Program, the U.S. Warehouse Act appropriated activities, and the Warehouse Examinations to the AMS extends the existing fair market practices offered by the Agency. Consolidating commodity food procurement activities by joining international procurement from the FSA with AMS’s domestic procurement programs creates efficiencies in USDA's acquisition of commodities. Merging the Grain Regulatory Program, and the Inspection and Weighing Services activities into AMS allows customers to find grading and inspection services in one place. The merger and program transfers will create a unified USDA presence for those marketing agricultural commodities and involved in the procurement for USDA nutrition assistance programs.
Marketing Services Market News The Budget proposes $29 million for Market News to support data collection and reporting of commodity information. This work provides timely, accurate, and unbiased price, quality, and sales information on cotton, dairy, fruits, vegetables, specialty crops, livestock, grain, and poultry, including organic commodities.
Egg Surveillance and Standardization The Budget funds the Egg Surveillance and Standardization at $7 million. The Shell Egg Surveillance Program inspects registered shell egg facilities and monitors the disposition of restricted eggs to limit the number of restricted eggs in consumer channels. The program prevents eggs not meeting minimum U.S. standards from entering the consumer marketplace.
Market Protection and Promotion-Federal Seed Act Program The Budget provides $2 million for the Federal Seed Act Program. This program promotes fair competition in the seed trade, by among other requirements, ensuring seed is accurately labeled.
Market Protection and Promotion-Country of Origin Labeling The Budget provides $4 million for the Country of Origin Labeling program. The program requires retailers to notify their customers of the country of origin of covered commodities, and that the method of production for fish and shellfish be noted at the final point of sale.
Market Protection and Promotion-Pesticide Data Program The Budget provides $15 million for the Pesticide Data Program, which is the main supplier of data regarding actual levels of pesticide residues on commodities. The program works collaboratively with the Environmental Protection Agency and the Centers for Disease Control

MARKETING AND REGULATORY PROGRAMS 61
and Prevention to target residue data collection related to high risk commodities and vulnerable populations.
Market Protection and Promotion-National Organic Program The Budget provides $12 million for the National Organic Program, which works to meet consumer demand for organically-produced goods by supporting the development, maintenance, and enforcement of national standards governing the production and handling of organic agricultural products. Improved enforcement and traceability will be implemented through technology investments and improvements using a $3 million budget increase.
National Bioengineered Food Disclosure Standard The Budget requests $1 million for the National Bioengineered Food Disclosure Standard. Public Law 114-216 requires USDA to put in place a national mandatory system for disclosing the presence of bioengineered material in foods and ingredients. The requirements of the disclosure are being developed through rulemaking.
Transportation and Market Development The Budget requests $7 million for Transportation and Market Development, which conducts research and outreach related to grain shipping and supply chains. The program connects agricultural producers with high value market opportunities through its national market directories.
Packers and Stockyards The Budget provides $23 million for the Packers and Stockyards program, which regulates and monitors the activities of livestock, meat, and poultry market participants to support fair practices. The program also reviews the financial records of these entities.
Grain Regulatory The Grain Regulatory program, commonly referred to as the Federal Grain Inspection Service, establishes the official U.S. standards and quality assessment methods for grain and related products, and regulates handling practices to ensure compliance with the United States Grain Standards Act (USGSA) and the Agricultural Marketing Act of 1946. Inspection and weighing services are currently user-fee funded and are described in the User Fee section. Legislation is included to fund additional activities through user fees.
U.S. Warehouse Act The United States Warehouse Act (USWA) authorizes the licensing of operators who store agricultural products and a separate licensing for qualified persons to sample, inspect, weigh, and grade agricultural products. The USWA authorizes the application of user fees to cover the costs of administering the Act, including unannounced warehouse examinations to encourage compliance. Warehouses engaged in export food aid operations are required to be licensed. These activities are funded by a combination of user fee collections and appropriated funds.
International Food Procurement The Budget requests $13 million for International Food Procurement programs. Commodities such as grains, legumes/pulses, and oil products are acquired for overseas use.
Payments to States and Possessions The Budget requests $1 million for the program Federal-State Marketing Improvement Program (FSMIP). Under FSMIP, AMS provides matching funds to State Departments of Agriculture for
2019 USDA BUDGET SUMMARY 62
projects aimed at improving marketing efficiency, reducing marketing costs for producers, and lowering food costs for consumers.
Section 32 Funds Section 32 of the Act of August 24, 1935, authorizes the appropriation for each fiscal year of an amount equal to 30 percent of the gross receipts from duties collected under customs laws of the United States during the preceding calendar year. These funds are used to encourage domestic consumption of perishable commodities that are not eligible for price support from USDA, and encourage the export of agricultural products, including: purchases of commodities and removal of surplus commodities from the marketplace for distribution to Federal nutrition assistance programs such as the National School Lunch Program and diversion programs that bring production in line with demand. Section 32 funds are also used to finance the administrative costs associated with the purchase of commodities and developing the specifications used for food procurement throughout the Federal government. The Budget requests $36 million for administration of commodity purchasing.
Marketing Orders and Agreements help stabilize market prices and the supply of milk and certain specialty crops. The Orders are administered locally by marketing order committees and market administrators. Local activities are funded through assessments on regulated handlers. To finance Federal oversight activities for marketing orders and agreements at the national level in FY 2019, $20 million will be used.
User Fee Programs AMS operates select programs through license fees and user fees. The Commodity Grading Services program provides voluntary commodity grading and classing services for dairy products, fresh and processed fruits and vegetables, meat and meat products, poultry, eggs, tobacco, and cotton. AMS also offers certification services to verify contract specifications on quantity and quality, acceptance and condition inspection services for all agricultural commodities upon request, and export certification services for a number of commodities. AMS’ audit verification services review production and quality control systems, and verify industry marketing claims. In addition, AMS enforces the Perishable Agricultural Commodities Act which prohibits unfair and fraudulent practices in the marketing of perishable agricultural commodities by regulating shippers, distributors, and retailers. Full and prompt payment for fresh fruits and vegetables is a key objective of the program. The Grain Inspection and Weighing user fees provide for the mandatory inspection and weighing of grain at export ports and the inspection and weighing of grain at domestic locations. AMS is required to conduct or delegate inspection and weighing, and to supervise such activities. The Warehouse Examinations license fee provides for unannounced examinations to encourage compliance with licensing terms under the USWA.
Proposed Legislation The Budget proposes the authority to collect a fee from the Marketing Orders and Agreements programs to recover the full cost of the agency’s oversight of these programs. The industries that substantially benefit from Marketing Orders and Agreements should pay for the oversight of these programs, with the collections being provided to the U.S. Treasury. The Budget proposes the authority to collect a license fee for Packers and Stockyards. Collections from these two fees will provide receipts to the U.S. Treasury. The Budget also proposes the authority to collect a discretionary user fee for Grain Regulatory programs, to allow the full cost of grain programs to be paid by the industry beneficiaries.

RESEARCH, EDUCATION, AND ECONOMICS 63
RESEARCH, EDUCATION, AND ECONOMICS
MISSION
USDA supports a variety of research topics to address complex challenges that require multi- faceted approaches through in-house research and in partnership with land-grant institutions and others. USDA brings together expertise from animal science, veterinary medicine, food safety, nutrition, wildlife, plant science, economics, ecology, biotechnology, and other agricultural and health disciplines to develop innovative approaches to today’s challenges.
REE responsibilities are carried out by four agencies: (1) the Agricultural Research Service (ARS) conducts intramural research in natural and biological sciences; (2) the National Institute of Food and Agriculture (NIFA) partners with land-grant and non-land grant colleges and universities in carrying out extramural research, higher education, and extension activities; (3) the Economic Research Service (ERS) performs intramural economic and social science research; and (4) the National Agricultural Statistics Service (NASS) conducts the Census of Agriculture and provides the official, current statistics on agricultural production and indicators for the economic and environmental welfare of the farm sector. REE made important investments in FY 2017 to advance U.S. agriculture. ARS produced breakthroughs in rubber production from guayule, a southwestern shrub, allowing passenger tires to be produced with 100-percent guayule rubber and opening the door for a U.S.-based natural rubber production industry. NIFA-supported researchers identified a gene that confers resistance to new virulent races of UG99, a cause of stem rust that threats global wheat production. NASS used, for the first time, a satellite with cloud penetrating capability to provide real-time assessments of areas impacted by Hurricanes Harvey, Irma, and Maria. ERS reported that a 10-percent increase in demand for U.S. agricultural exports would increase total employment in all sectors of the U.S. economy by about 41,500 jobs, above and beyond the approximately 1.1 million jobs currently supported by U.S. agricultural exports.
ERS 2%
ARS 41% Total = $2.5 Billion
NIFA 51%
NASS 6%
Figure REE-1. REE Discretionary Budget Authority

2019 USDA BUDGET SUMMARY 64
AGRICULTURAL RESEARCH SERVICE
ARS is the USDA’s chief scientific, in-house research agency. ARS conducts research to solve technical problems of broad scope and high national priority, and provides access to scientific information. The research covers a wide range of critical problems affecting American agriculture and the Nation as a whole, ranging from animal and crop protection and production to human nutrition, food safety, and natural resources conservation. ARS employs 6,500 employees and carries out 690 research projects at 90 research locations throughout the Nation and in several foreign countries. ARS includes the National Arboretum and the National Agricultural Library, the Nation's major information resource on food, agriculture, and natural resource sciences.
Table REE-1. ARS Budget Authority (millions of dollars)
Item 2017 Actual
2018 Estimate
2019 Budget
Discretionary: Product Quality/Value Added .................................................... $102 $100 $65 Livestock Production.................................................................. 89 89 74 Crop Production ......................................................................... 226 224 205 Food Safety ................................................................................ 112 112 98 Livestock Protection................................................................... 94 93 89 Crop Protection .......................................................................... 198 196 155 Human Nutrition ........................................................................ 87 87 45 Environmental Stewardship ....................................................... 217 215 194
Total, Research Programs ........................................................ 1,125 1,116 925 National Agricultural Library..................................................... 24 24 22 Repair and Maintenance............................................................. 20 20 20 Buildings and Facilities .............................................................. 100 99 - NBAF Operations and Maintenance .......................................... - - 42 NBAF Research Equipment ....................................................... - - 11
Total, Discretionary Programs ...................................................... 1,269 1,258 1,019 Mandatory:
Trust Funds................................................................................. 28 28 28 Total, ARS .................................................................................... 1,297 1,286 1,047
The Budget includes discretionary funding of $1 billion for ARS research programs, with an emphasis on basic research and efforts to support the transfer of research and development products to industry to promote the Nation’s economic growth through innovation. The Budget includes the proposed termination of lower-priority and extramural research projects and closure of 20 laboratories, locations, or worksites. The Budget also includes an increase of $42 million to take ownership of the National Bio and Agro-Defense Facility, a state-of-the-art biocontainment facility for the study of foreign, emerging, and zoonotic animal diseases that pose a threat to United States animal agriculture and public health, which will replace the Plum Island Animal Disease Center.
Product Quality/Value Added The Budget includes $65 million for this program. ARS has active research programs directed toward: (1) improving the efficiency and reducing the cost for the conversion of agricultural products into biobased products and biofuels; (2) developing new and improved products for

RESEARCH, EDUCATION, AND ECONOMICS 65
domestic and foreign markets; and (3) providing higher quality, healthy foods that satisfy consumer needs in the United States and abroad.
Livestock Production The Budget includes $74 million for this program. ARS’ livestock production program is directed toward: (1) safeguarding and utilizing animal genetic resources, associated genetic and genomic databases, and bioinformatic tools; (2) developing a basic understanding of the physiology of livestock and poultry; and (3) developing information, tools, and technologies that can be used to improve animal production systems. The research is heavily focused on the development and application of genomics technologies to increase the efficiency and product quality of beef, dairy, swine, poultry, aquaculture, and sheep systems.
Crop Production The Budget includes $205 million for this program. ARS’ crop production program focuses on developing and improving ways to reduce crop losses while protecting and ensuring a safe and affordable food supply. The research program concentrates on effective production strategies that are environmentally friendly, safe to consumers, and compatible with sustainable and profitable crop production systems. Research activities are directed at safeguarding and utilizing plant genetic resources and their associated genetic, genomic, and bioinformatic databases that facilitate selection of varieties and/or germplasm with significantly improved traits.
Food Safety The Budget includes $98 million for this program. Ensuring that the United States has the highest levels of affordable, safe food requires that the food system be protected at each stage from production through processing and consumption from pathogens, toxins, and chemical contaminants that cause diseases in humans. ARS’ current food safety research is designed to yield science-based knowledge on the safe production, storage, processing, and handling of plant and animal products, and on the detection and control of toxin producing and/or pathogenic bacteria and fungi, parasites, chemical contaminants, and plant toxins.
Livestock Protection The Budget includes a total of $89 million for this program. ARS’ animal health program is directed at protecting and ensuring the safety of the Nation’s agriculture and food supply through improved disease detection, prevention, control, and treatment. Basic and applied research approaches are used to solve animal health problems, with emphasis on methods and procedures to control animal diseases.
Crop Protection The Budget includes $155 million to support these activities. ARS research on crop protection is directed to understand pest and disease transmission mechanisms, and identify and apply new technologies that increase understanding of virulence factors and host defense mechanisms.
Human Nutrition The Budget includes $45 million for this program. As excessive consumption replaces diseases related to malnutrition as a primary public health concern in the United States, the ARS human nutrition research program has increasingly focused on research studying the maintenance of health throughout the lifespan along with prevention of obesity and chronic diseases via food- based recommendations.
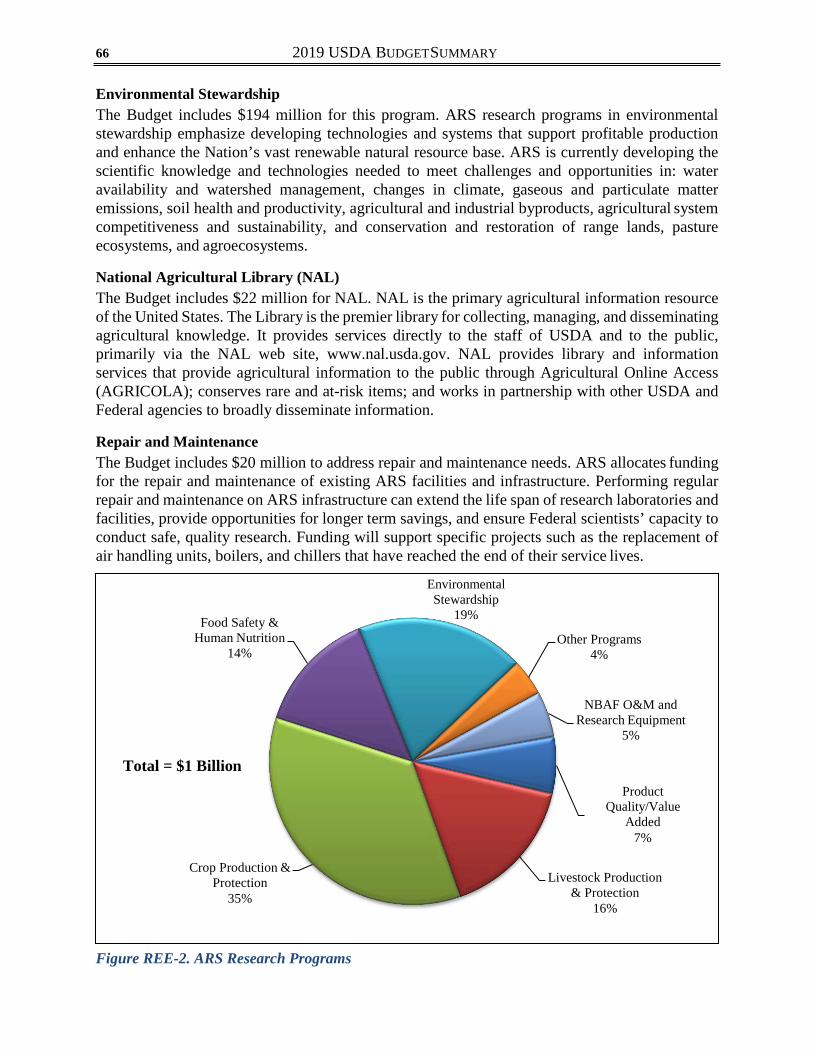
2019 USDA BUDGET SUMMARY 66
Environmental Stewardship The Budget includes $194 million for this program. ARS research programs in environmental stewardship emphasize developing technologies and systems that support profitable production and enhance the Nation’s vast renewable natural resource base. ARS is currently developing the scientific knowledge and technologies needed to meet challenges and opportunities in: water availability and watershed management, changes in climate, gaseous and particulate matter emissions, soil health and productivity, agricultural and industrial byproducts, agricultural system competitiveness and sustainability, and conservation and restoration of range lands, pasture ecosystems, and agroecosystems.
National Agricultural Library (NAL) The Budget includes $22 million for NAL. NAL is the primary agricultural information resource of the United States. The Library is the premier library for collecting, managing, and disseminating agricultural knowledge. It provides services directly to the staff of USDA and to the public, primarily via the NAL web site, www.nal.usda.gov. NAL provides library and information services that provide agricultural information to the public through Agricultural Online Access (AGRICOLA); conserves rare and at-risk items; and works in partnership with other USDA and Federal agencies to broadly disseminate information.
Repair and Maintenance The Budget includes $20 million to address repair and maintenance needs. ARS allocates funding for the repair and maintenance of existing ARS facilities and infrastructure. Performing regular repair and maintenance on ARS infrastructure can extend the life span of research laboratories and facilities, provide opportunities for longer term savings, and ensure Federal scientists’ capacity to conduct safe, quality research. Funding will support specific projects such as the replacement of air handling units, boilers, and chillers that have reached the end of their service lives.
Food Safety & Human Nutrition
14%
Environmental Stewardship
19%
Other Programs 4%
NBAF O&M and Research Equipment
5%
Total = $1 Billion Product
Quality/Value Added
7%
Crop Production & Protection
35% Livestock Production
& Protection 16%
Figure REE-2. ARS Research Programs
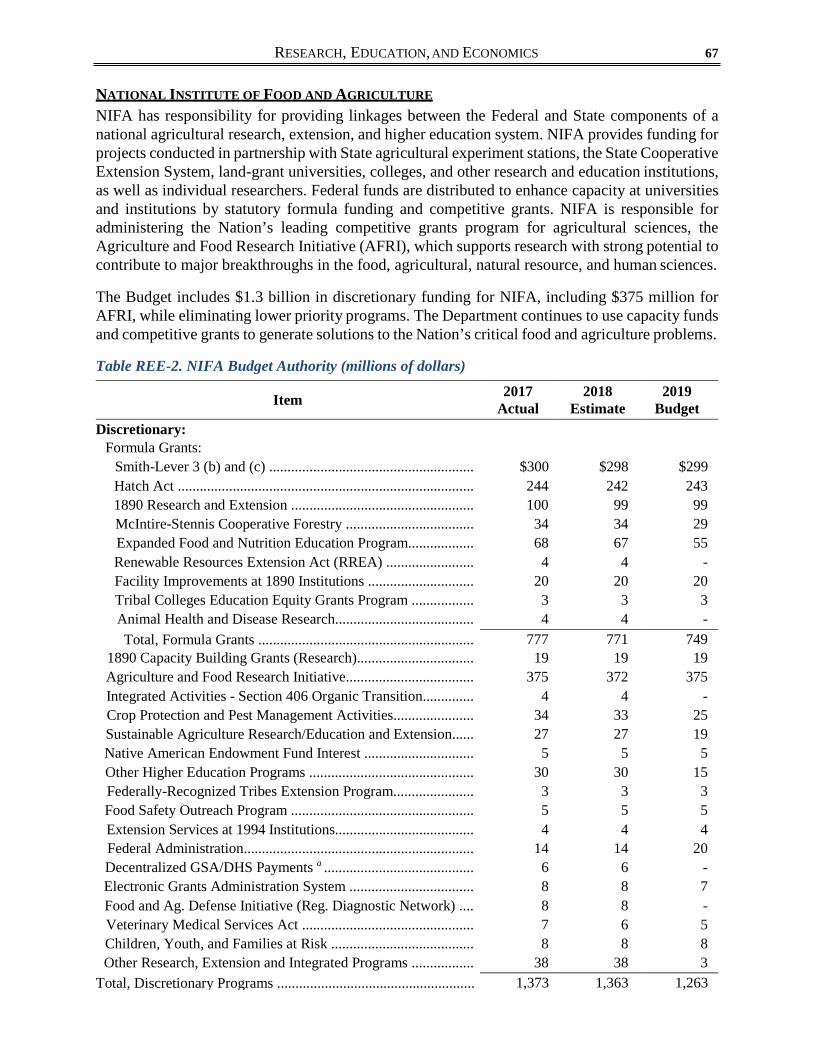
RESEARCH, EDUCATION, AND ECONOMICS 67
NATIONAL INSTITUTE OF FOOD AND AGRICULTURE
NIFA has responsibility for providing linkages between the Federal and State components of a national agricultural research, extension, and higher education system. NIFA provides funding for projects conducted in partnership with State agricultural experiment stations, the State Cooperative Extension System, land-grant universities, colleges, and other research and education institutions, as well as individual researchers. Federal funds are distributed to enhance capacity at universities and institutions by statutory formula funding and competitive grants. NIFA is responsible for administering the Nation’s leading competitive grants program for agricultural sciences, the Agriculture and Food Research Initiative (AFRI), which supports research with strong potential to contribute to major breakthroughs in the food, agricultural, natural resource, and human sciences.
The Budget includes $1.3 billion in discretionary funding for NIFA, including $375 million for AFRI, while eliminating lower priority programs. The Department continues to use capacity funds and competitive grants to generate solutions to the Nation’s critical food and agriculture problems.
Table REE-2. NIFA Budget Authority (millions of dollars)
Item 2017 Actual
2018 Estimate
2019 Budget
Discretionary: Formula Grants:
Smith-Lever 3 (b) and (c) ........................................................ $300 $298 $299 Hatch Act ................................................................................. 244 242 243 1890 Research and Extension .................................................. 100 99 99 McIntire-Stennis Cooperative Forestry ................................... 34 34 29 Expanded Food and Nutrition Education Program.................. 68 67 55 Renewable Resources Extension Act (RREA) ........................ 4 4 - Facility Improvements at 1890 Institutions ............................. 20 20 20 Tribal Colleges Education Equity Grants Program ................. 3 3 3 Animal Health and Disease Research...................................... 4 4 - Total, Formula Grants ........................................................... 777 771 749
1890 Capacity Building Grants (Research)................................ 19 19 19 Agriculture and Food Research Initiative................................... 375 372 375 Integrated Activities - Section 406 Organic Transition.............. 4 4 - Crop Protection and Pest Management Activities...................... 34 33 25 Sustainable Agriculture Research/Education and Extension...... 27 27 19 Native American Endowment Fund Interest .............................. 5 5 5 Other Higher Education Programs ............................................. 30 30 15 Federally-Recognized Tribes Extension Program...................... 3 3 3 Food Safety Outreach Program .................................................. 5 5 5 Extension Services at 1994 Institutions...................................... 4 4 4 Federal Administration............................................................... 14 14 20 Decentralized GSA/DHS Payments a ......................................... 6 6 - Electronic Grants Administration System .................................. 8 8 7 Food and Ag. Defense Initiative (Reg. Diagnostic Network) .... 8 8 - Veterinary Medical Services Act ............................................... 7 6 5 Children, Youth, and Families at Risk ....................................... 8 8 8 Other Research, Extension and Integrated Programs ................. 38 38 3
Total, Discretionary Programs ...................................................... 1,373 1,363 1,263

2019 USDA BUDGET SUMMARY 68
Item 2017 Actual
2018 Estimate
2019 Budget
Mandatory: Native American Endowment Fund ........................................... 12 12 12 Farm Bill:
Biomass Research and Development....................................... 3 - - Organic Agriculture Research and Education Initiative .......... 19 19 - Beginning Farmer and Rancher Development Program.......... 19 19 - Specialty Crop Research Initiative .......................................... 51 51 80 Emergency Citrus Research and Extension Program .............. 23 23 - Food Insecurity Nutrition Incentive Program .......................... 19 23 - Agricultural Risk Management Education Program................ 5 5 5 Biodiesel Fuel Education Program b ........................................ 1 1 - Community Food Projects c ..................................................... 9 9 9
Total, Farm Bill Programs..................................................... 148 150 94 Total, Mandatory Programs .......................................................... 160 162 106 Total, NIFA................................................................................... 1,533 1,525 1,369 a Beginning in 2019, GSA rent payments will be included within the Federal Administration total. b Funding authority delegated to the Office of the Chief Economist and administered by NIFA. c Funding authority delegated to the Food and Nutrition Service and administered by NIFA.
Formula (Capacity) Programs The Budget includes $749 million for these programs. NIFA has a number of programs that provide grants to the States on the basis of statutory formulas. These formula grants provide long- term, sustainable support needed to grow the capacity for agricultural research, education, and extension activities at land-grant institutions and State agricultural experiment stations. These programs include Hatch Act, Smith-Lever 3(b) and 3(c), 1890s research and extension, McIntire- Stennis Cooperative Forestry, and other grants.
Agriculture and Food Research Initiative (AFRI) The Budget includes $375 million for AFRI. AFRI is the Nation’s premier competitive, peer- reviewed research program for fundamental and applied sciences in agriculture. It is broad in scope with programs ranging from fundamental science to farm management and community issues. AFRI programs are aligned with six Farm Bill Priority Areas: 1) plant health and production and plant products; 2) animal health and production and animal products; 3) food safety, nutrition, and health; 4) bioenergy, natural resources, and environment; 5) agriculture systems and technology; and 6) agriculture economics and rural communities.
Minority-Serving Institution Programs The Budget includes $170 million for these programs. NIFA has a number of programs dedicated to strengthening research and extension capacity at minority-serving institutions and the ability of these institutions to continue their effective programming. These include research, extension, and facilities programs at the 1890s institutions; education and extension grants for Tribal colleges (including the Federally Recognized Tribes Extension Program) and Hispanic-serving institutions; and education grants for Alaska Native-Serving, Native Hawaiian-Serving institutions, and Insular Areas institutions. These programs support minority-serving institutions in reaching underrepresented students interested in entering the food and agricultural workforce.
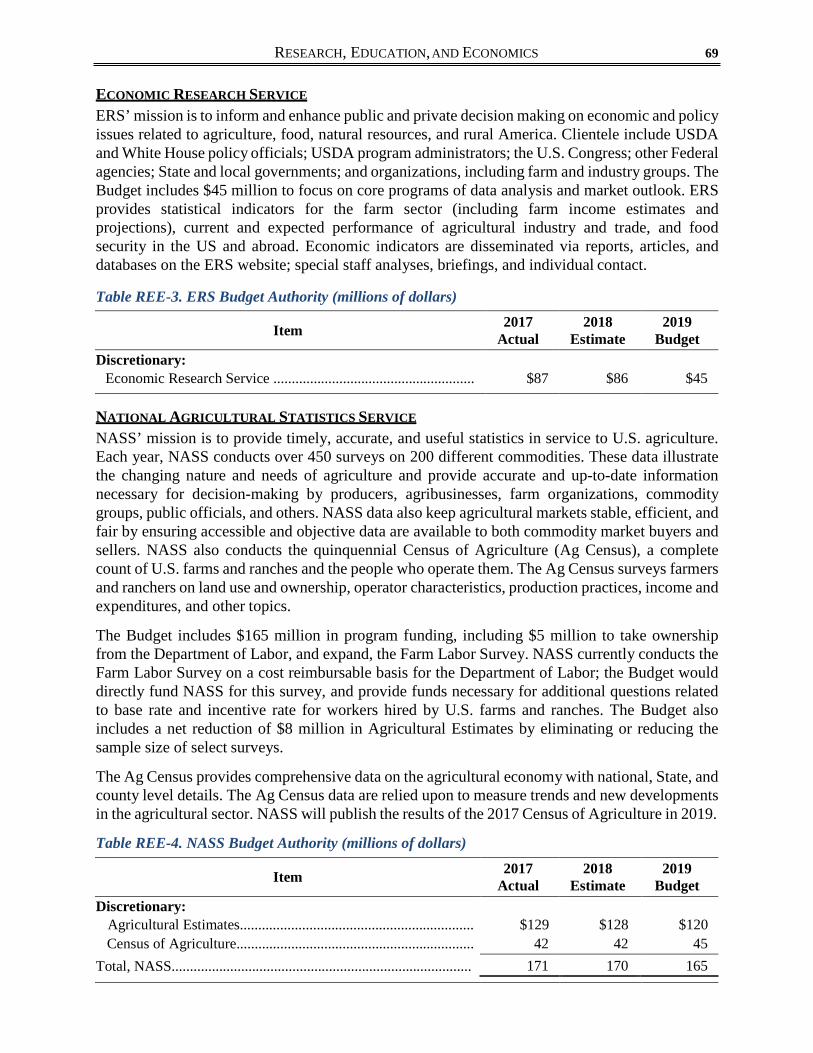
RESEARCH, EDUCATION, AND ECONOMICS 69
ECONOMIC RESEARCH SERVICE
ERS’ mission is to inform and enhance public and private decision making on economic and policy issues related to agriculture, food, natural resources, and rural America. Clientele include USDA and White House policy officials; USDA program administrators; the U.S. Congress; other Federal agencies; State and local governments; and organizations, including farm and industry groups. The Budget includes $45 million to focus on core programs of data analysis and market outlook. ERS provides statistical indicators for the farm sector (including farm income estimates and projections), current and expected performance of agricultural industry and trade, and food security in the US and abroad. Economic indicators are disseminated via reports, articles, and databases on the ERS website; special staff analyses, briefings, and individual contact.
Table REE-3. ERS Budget Authority (millions of dollars)
Item 2017 Actual
2018 Estimate
2019 Budget
Discretionary: Economic Research Service ....................................................... $87 $86 $45
NATIONAL AGRICULTURAL STATISTICS SERVICE
NASS’ mission is to provide timely, accurate, and useful statistics in service to U.S. agriculture. Each year, NASS conducts over 450 surveys on 200 different commodities. These data illustrate the changing nature and needs of agriculture and provide accurate and up-to-date information necessary for decision-making by producers, agribusinesses, farm organizations, commodity groups, public officials, and others. NASS data also keep agricultural markets stable, efficient, and fair by ensuring accessible and objective data are available to both commodity market buyers and sellers. NASS also conducts the quinquennial Census of Agriculture (Ag Census), a complete count of U.S. farms and ranches and the people who operate them. The Ag Census surveys farmers and ranchers on land use and ownership, operator characteristics, production practices, income and expenditures, and other topics.
The Budget includes $165 million in program funding, including $5 million to take ownership from the Department of Labor, and expand, the Farm Labor Survey. NASS currently conducts the Farm Labor Survey on a cost reimbursable basis for the Department of Labor; the Budget would directly fund NASS for this survey, and provide funds necessary for additional questions related to base rate and incentive rate for workers hired by U.S. farms and ranches. The Budget also includes a net reduction of $8 million in Agricultural Estimates by eliminating or reducing the sample size of select surveys.
The Ag Census provides comprehensive data on the agricultural economy with national, State, and county level details. The Ag Census data are relied upon to measure trends and new developments in the agricultural sector. NASS will publish the results of the 2017 Census of Agriculture in 2019.
Table REE-4. NASS Budget Authority (millions of dollars)
Item 2017 Actual
2018 Estimate
2019 Budget
Discretionary: Agricultural Estimates................................................................ $129 $128 $120 Census of Agriculture................................................................. 42 42 45
Total, NASS.................................................................................. 171 170 165
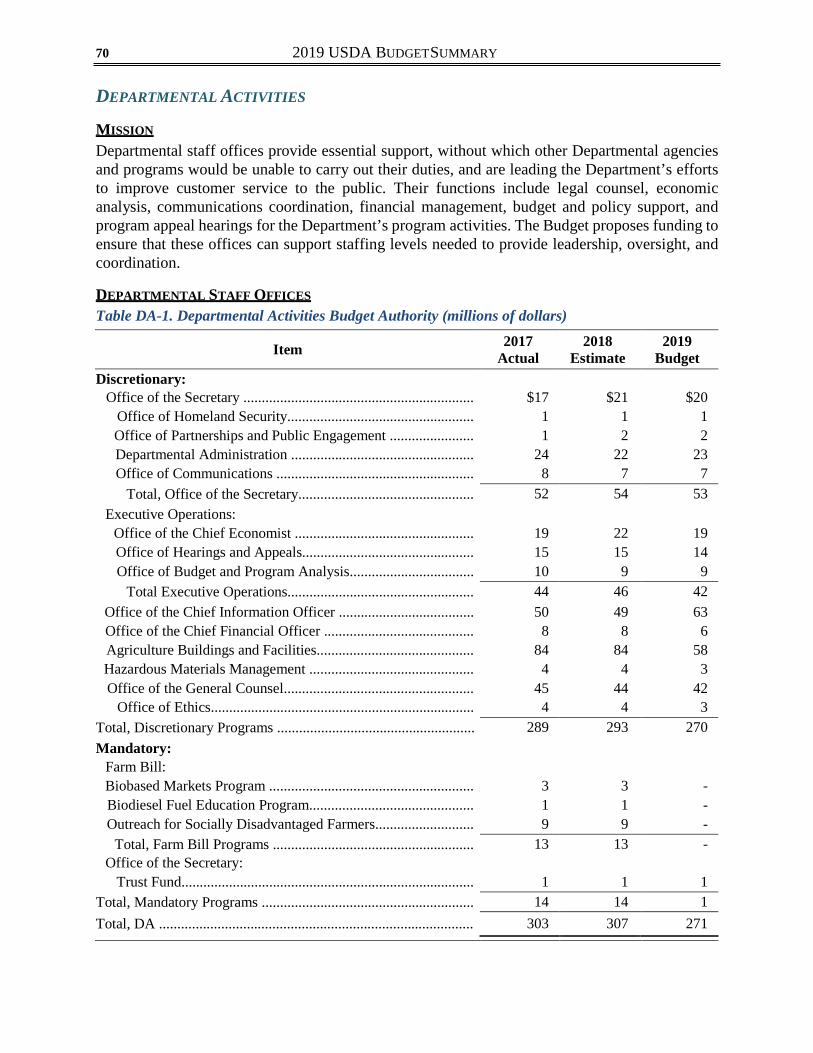
2019 USDA BUDGET SUMMARY 70
DEPARTMENTAL ACTIVITIES
MISSION
Departmental staff offices provide essential support, without which other Departmental agencies and programs would be unable to carry out their duties, and are leading the Department’s efforts to improve customer service to the public. Their functions include legal counsel, economic analysis, communications coordination, financial management, budget and policy support, and program appeal hearings for the Department’s program activities. The Budget proposes funding to ensure that these offices can support staffing levels needed to provide leadership, oversight, and coordination.
DEPARTMENTAL STAFF OFFICES Table DA-1. Departmental Activities Budget Authority (millions of dollars)
Item 2017 Actual
2018 Estimate
2019 Budget
Discretionary: Office of the Secretary ............................................................... $17 $21 $20
Office of Homeland Security................................................... 1 1 1 Office of Partnerships and Public Engagement ....................... 1 2 2 Departmental Administration .................................................. 24 22 23 Office of Communications ...................................................... 8 7 7
Total, Office of the Secretary................................................ 52 54 53 Executive Operations:
Office of the Chief Economist ................................................. 19 22 19 Office of Hearings and Appeals............................................... 15 15 14 Office of Budget and Program Analysis.................................. 10 9 9
Total Executive Operations................................................... 44 46 42 Office of the Chief Information Officer ..................................... 50 49 63 Office of the Chief Financial Officer ......................................... 8 8 6 Agriculture Buildings and Facilities........................................... 84 84 58 Hazardous Materials Management ............................................. 4 4 3 Office of the General Counsel.................................................... 45 44 42
Office of Ethics........................................................................ 4 4 3 Total, Discretionary Programs ...................................................... 289 293 270 Mandatory:
Farm Bill: Biobased Markets Program ........................................................ 3 3 - Biodiesel Fuel Education Program............................................. 1 1 - Outreach for Socially Disadvantaged Farmers........................... 9 9 -
Total, Farm Bill Programs ....................................................... 13 13 - Office of the Secretary:
Trust Fund................................................................................ 1 1 1 Total, Mandatory Programs .......................................................... 14 14 1 Total, DA ...................................................................................... 303 307 271
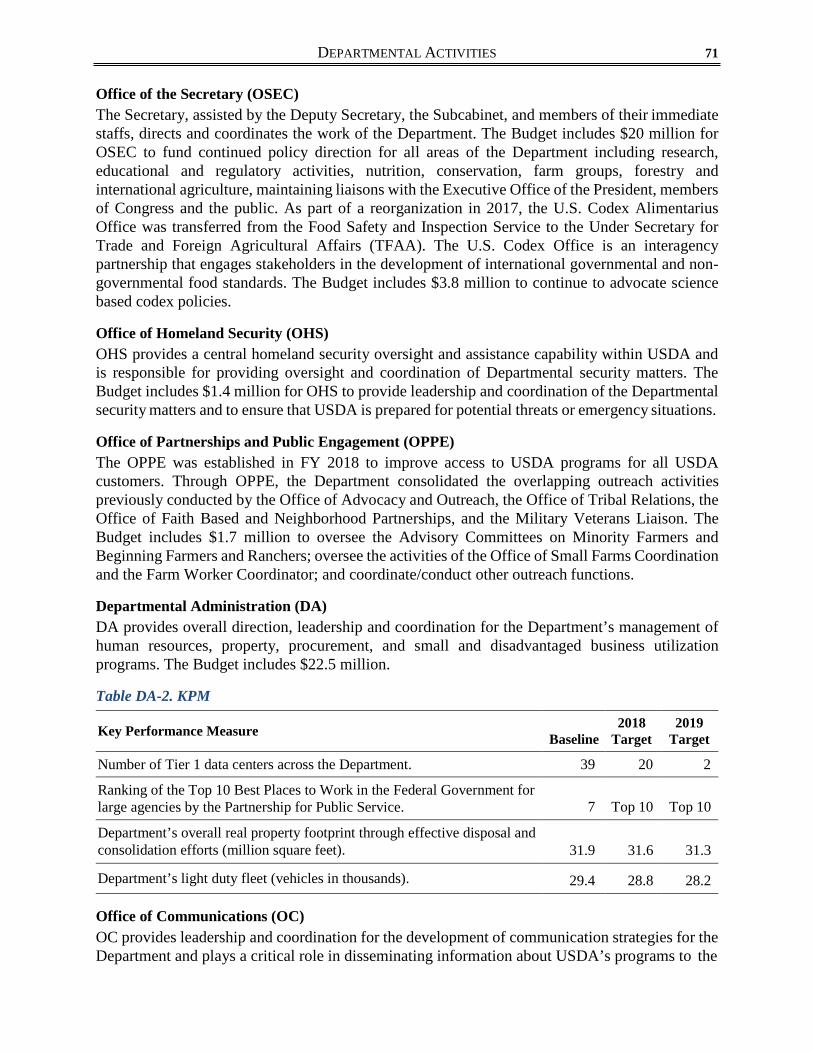
DEPARTMENTAL ACTIVITIES 71
Office of the Secretary (OSEC) The Secretary, assisted by the Deputy Secretary, the Subcabinet, and members of their immediate staffs, directs and coordinates the work of the Department. The Budget includes $20 million for OSEC to fund continued policy direction for all areas of the Department including research, educational and regulatory activities, nutrition, conservation, farm groups, forestry and international agriculture, maintaining liaisons with the Executive Office of the President, members of Congress and the public. As part of a reorganization in 2017, the U.S. Codex Alimentarius Office was transferred from the Food Safety and Inspection Service to the Under Secretary for Trade and Foreign Agricultural Affairs (TFAA). The U.S. Codex Office is an interagency partnership that engages stakeholders in the development of international governmental and non- governmental food standards. The Budget includes $3.8 million to continue to advocate science based codex policies.
Office of Homeland Security (OHS) OHS provides a central homeland security oversight and assistance capability within USDA and is responsible for providing oversight and coordination of Departmental security matters. The Budget includes $1.4 million for OHS to provide leadership and coordination of the Departmental security matters and to ensure that USDA is prepared for potential threats or emergency situations.
Office of Partnerships and Public Engagement (OPPE) The OPPE was established in FY 2018 to improve access to USDA programs for all USDA customers. Through OPPE, the Department consolidated the overlapping outreach activities previously conducted by the Office of Advocacy and Outreach, the Office of Tribal Relations, the Office of Faith Based and Neighborhood Partnerships, and the Military Veterans Liaison. The Budget includes $1.7 million to oversee the Advisory Committees on Minority Farmers and Beginning Farmers and Ranchers; oversee the activities of the Office of Small Farms Coordination and the Farm Worker Coordinator; and coordinate/conduct other outreach functions.
Departmental Administration (DA) DA provides overall direction, leadership and coordination for the Department’s management of human resources, property, procurement, and small and disadvantaged business utilization programs. The Budget includes $22.5 million.
Table DA-2. KPM
Key Performance Measure Baseline
2018 Target
2019 Target
Number of Tier 1 data centers across the Department. 39 20 2
Ranking of the Top 10 Best Places to Work in the Federal Government for large agencies by the Partnership for Public Service.
7
Top 10
Top 10
Department’s overall real property footprint through effective disposal and consolidation efforts (million square feet).
31.9
31.6
31.3
Department’s light duty fleet (vehicles in thousands). 29.4 28.8 28.2
Office of Communications (OC) OC provides leadership and coordination for the development of communication strategies for the Department and plays a critical role in disseminating information about USDA’s programs to the
2019 USDA BUDGET SUMMARY 72
general public. The Budget includes $7.3 million for OC to continue to develop effective communications strategies that increase the visibility and the transparency of USDA programs.
Office of the Chief Economist (OCE) OCE advises the Secretary and Department officials on the economic implications of Department policies, programs, associated regulations and proposed legislation; and serves as the focal point for the Department’s economic intelligence, analysis and review related to domestic and international food and agriculture markets. OCE also provides advice and analysis on bioenergy, global climate change, environmental services markets, sustainable development, agricultural labor, and new uses of agricultural products. The Budget includes $19.5 million for OCE.
Office of Hearings and Appeals (OHA) OHA, formerly the National Appeals Division, conducts evidentiary administrative appeal hearings and reviews arising from program operations of the Service Center Agencies, which include the Rural Development mission area, the Farm Service Agency, the Risk Management Agency, and the Natural Resources Conservation Service. OHA is also responsible for the regulatory hearing and administrative proceedings conducted by the Administrative Law Judges and the Judicial Officer. In 2017, administrative adjudication functions were transferred from Departmental Administration to Office of Hearings and Appeals. Amounts in 2017 and 2018 have been adjusted for comparability. The Budget includes $14.2 million for OHA to carry out these functions.
Office of Budget and Program Analysis (OBPA) OBPA provides analyses and information to the Secretary and other senior policy officials to support informed decision-making regarding the Department’s programs and policies; and budget, legislative, and regulatory actions. The Budget includes $8.6 million for OBPA for the continued delivery of analyses and support to USDA policy officials.
Office of the Chief Information Officer (OCIO) OCIO provides policy guidance, leadership and coordination for the Department's information management, technology investment and cyber security activities in support of USDA program delivery. The Budget includes $62.5 million for OCIO to fund ongoing activities and to increase efforts for cybersecurity enhancements. Included in the request is an increase of $8.3 million to enhance the Department’s cyber security profile through the acquisition and implementation of relevant tools and services. This increase will allow USDA to implement Department-wide security enhancements to protect the network. In addition, the Budget includes $5 million for IT modernization initiatives. USDA is partnering with the White House Office of American Innovation to modernize its systems, such as consolidating end-user support services and data centers, and migrating data and functions to the cloud, which will improve IT service and reliability for both the internal and external USDA customer.
Office of the Chief Financial Officer (OCFO) OCFO provides overall direction and leadership in the development of financial management policies and systems and produces the Department’s consolidated financial statements. OCFO also oversees the provision of administrative accounting, payroll, and related systems for USDA and other agencies through operation of the National Finance Center. The Budget includes $5.5 million to support these activities.
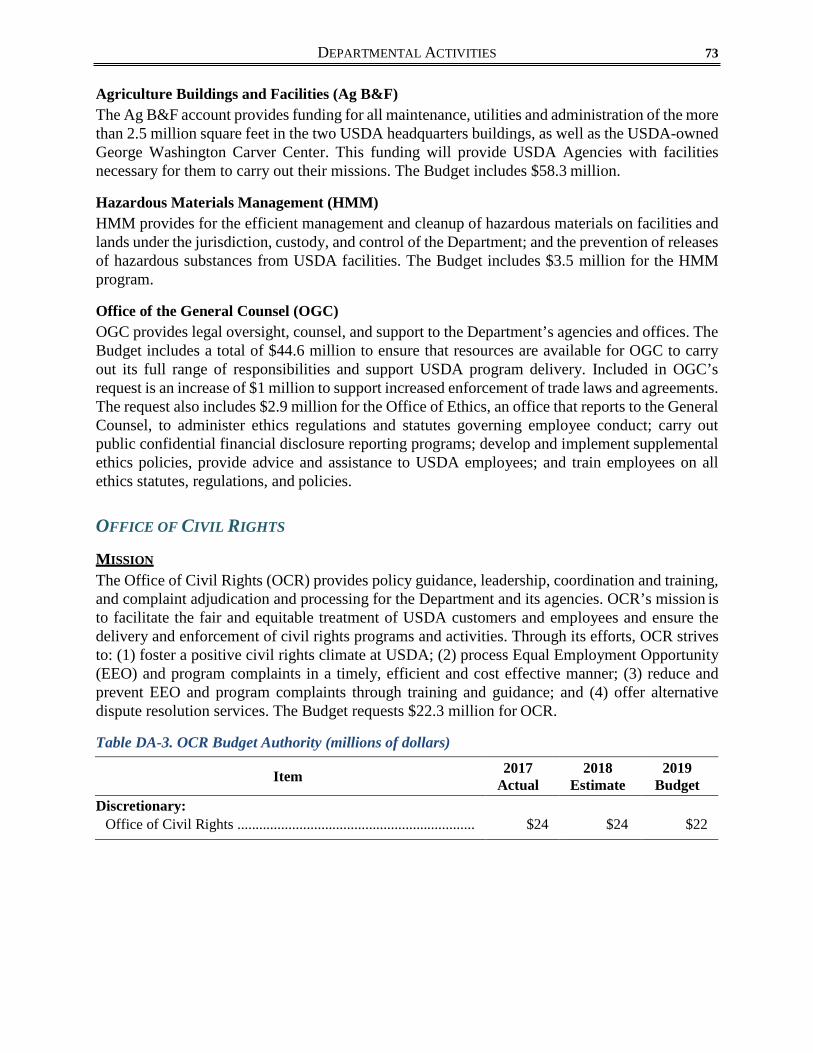
DEPARTMENTAL ACTIVITIES 73
Agriculture Buildings and Facilities (Ag B&F) The Ag B&F account provides funding for all maintenance, utilities and administration of the more than 2.5 million square feet in the two USDA headquarters buildings, as well as the USDA-owned George Washington Carver Center. This funding will provide USDA Agencies with facilities necessary for them to carry out their missions. The Budget includes $58.3 million.
Hazardous Materials Management (HMM) HMM provides for the efficient management and cleanup of hazardous materials on facilities and lands under the jurisdiction, custody, and control of the Department; and the prevention of releases of hazardous substances from USDA facilities. The Budget includes $3.5 million for the HMM program.
Office of the General Counsel (OGC) OGC provides legal oversight, counsel, and support to the Department’s agencies and offices. The Budget includes a total of $44.6 million to ensure that resources are available for OGC to carry out its full range of responsibilities and support USDA program delivery. Included in OGC’s request is an increase of $1 million to support increased enforcement of trade laws and agreements. The request also includes $2.9 million for the Office of Ethics, an office that reports to the General Counsel, to administer ethics regulations and statutes governing employee conduct; carry out public confidential financial disclosure reporting programs; develop and implement supplemental ethics policies, provide advice and assistance to USDA employees; and train employees on all ethics statutes, regulations, and policies.
OFFICE OF CIVIL RIGHTS
MISSION
The Office of Civil Rights (OCR) provides policy guidance, leadership, coordination and training, and complaint adjudication and processing for the Department and its agencies. OCR’s mission is to facilitate the fair and equitable treatment of USDA customers and employees and ensure the delivery and enforcement of civil rights programs and activities. Through its efforts, OCR strives to: (1) foster a positive civil rights climate at USDA; (2) process Equal Employment Opportunity (EEO) and program complaints in a timely, efficient and cost effective manner; (3) reduce and prevent EEO and program complaints through training and guidance; and (4) offer alternative dispute resolution services. The Budget requests $22.3 million for OCR.
Table DA-3. OCR Budget Authority (millions of dollars)
Item 2017 Actual
2018 Estimate
2019 Budget
Discretionary: Office of Civil Rights ................................................................. $24 $24 $22
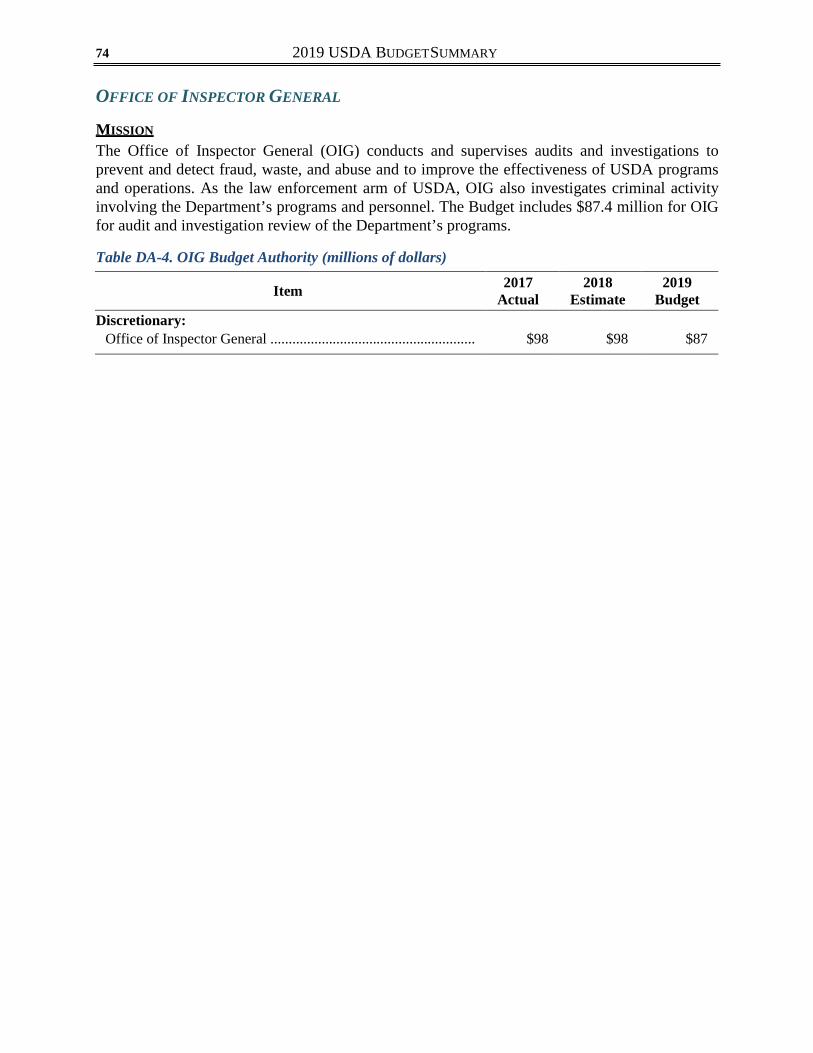
2019 USDA BUDGET SUMMARY 74
OFFICE OF INSPECTOR GENERAL
MISSION
The Office of Inspector General (OIG) conducts and supervises audits and investigations to prevent and detect fraud, waste, and abuse and to improve the effectiveness of USDA programs and operations. As the law enforcement arm of USDA, OIG also investigates criminal activity involving the Department’s programs and personnel. The Budget includes $87.4 million for OIG for audit and investigation review of the Department’s programs.
Table DA-4. OIG Budget Authority (millions of dollars)
Item 2017 Actual
2018 Estimate
2019 Budget
Discretionary: Office of Inspector General ........................................................ $98 $98 $87

APPENDIX 75
APPENDIX NOTE: Appendix tables do not include proposed legislation.
Table APP-1. Staff Years
Mission Area / Agency 2017 Actual
2018 Estimate
2019 Budget
Farm Production and Conservation: Farm Service Agency ................................................................................. 4,118 3,972 2,802 Risk Management Agency.......................................................................... 474 476 394
Natural Resources Conservation Service .................................................... 10,124 10,800 9,964 FPAC Business Center ............................................................................... - - 1,750
Trade and Foreign Agricultural Affairs: Foreign Agricultural Service ...................................................................... 1,014 1,027 971
Rural Development: Rural Development ..................................................................................... 4,807 4,825 3,945
Food, Nutrition, and Consumer Services: Food and Nutrition Service......................................................................... 1,574 1,557 1,557
Food Safety: Food Safety and Inspection Service............................................................ 9,355 9,165 9,335
Natural Resources and Environment: Forest Service ............................................................................................. 32,427 32,427 27,777
Marketing and Regulatory Programs: Animal and Plant Health Inspection Service .............................................. 7,615 7,957 7,109 Agricultural Marketing Service .................................................................. 2,711 3,535 3,635 Grain Inspection, Packers and Stockyards Administration ......................... 681 - -
Research, Education, and Economics: Agricultural Research Service .................................................................... 6,483 6,483 5,644 National Institute of Food and Agriculture ................................................. 358 368 345 Economic Research Service........................................................................ 331 330 148 National Agricultural Statistics Service ...................................................... 973 1,022 982
Departmental Activities: Office of the Secretary and Assistant Secretaries ....................................... 97 116 107 Office of Homeland Security and Emergency Coordination ...................... 49 52 52 Office of Partnerships and Public Engagement .......................................... 40 43 43 Departmental Administration ..................................................................... 349 394 398 Office of Communications.......................................................................... 62 70 71 Agriculture Buildings and Facilities ........................................................... 87 92 92 Hazardous Materials Management ............................................................. 4 4 4 Office of the Chief Economist .................................................................... 53 64 64 Office of Hearings and Appeals.................................................................. 78 90 85 Office of Budget and Program Analysis ..................................................... 48 47 45 Office of Chief Information Officer ........................................................... 987 1,106 1,118 Office of Chief Financial Officer................................................................ 1,524 1,637 1,635 Office of the General Counsel .................................................................... 265 258 242
Office of Ethics ........................................................................................ 21 20 15 Office of Civil Rights ................................................................................. 134 126 114 Office of Inspector General ........................................................................
Subtotal, USDA Federal Staffing ............................................................... 475 482 432
87,318 88,545 80,875 FSA, Non-Federal Staffing .........................................................................
Total, U.S. Department of Agriculture ...................................................... 7,401 7,388 6,428
94,719 95,933 87,303

2019 USDA BUDGET SUMMARY 76
Table APP-2. Budget Authority (millions of dollars)
Mission Area / Agency / Funding Category 2017 Actual
2018 Estimate
2019 Budget
Farm Production and Conservation: Farm Service Agency:
Discretionary Programs ........................................................................... $1,634 $1,605 $1,278 Discretionary Emergency Programs ........................................................ 132 29 - Mandatory Programs................................................................................ 1 1 1 Commodity Credit Corporation Programs (mandatory) .......................... 7,065 8,450 11,349
Total, Farm Service Agency ................................................................. 8,831 10,085 12,628 Risk Management Agency:
Discretionary Programs ........................................................................... 84 84 67 Mandatory Programs................................................................................ 5,086 8,894 8,684
Total, Risk Management Agency.......................................................... 5,170 8,978 8,751 Natural Resources Conservation Service:
Discretionary Programs ........................................................................... 1,030 1,023 669 Discretionary Emergency Programs ........................................................ 103 - - Mandatory CCC Programs....................................................................... 3,387 3,284 3,707 Total, Natural Resources Conservation Service .................................... 4,520 4,307 4,376
FPAC Business Center: Discretionary Programs ........................................................................... - - 212 Mandatory Programs................................................................................ - - 60
Total, FPAC Business Center ............................................................... - - 273 Total, Farm Production and Conservation .................................................. 18,521 23,370 26,027
Trade and Foreign Agricultural Affairs: Foreign Agricultural Service:
Discretionary Programs (excluding P.L. 480).......................................... 404 402 200 P.L. 480 (discretionary) ........................................................................... 1,600 1,589 - Mandatory Market Development Programs ............................................. 278 298 230 Other Mandatory Programs...................................................................... 167 169 169
Total, Trade and Foreign Agricultural Affairs ............................................ 2,449 2,458 599 Rural Development:
Rural Utilities Service: Discretionary Programs ........................................................................... 695 690 123
Rural Housing Service: Discretionary Programs ........................................................................... 2,068 2,055 1,743
Rural Business - Cooperative Service: Discretionary Programs ........................................................................... 103 102 - Mandatory Programs................................................................................ 64 64 50
Total, Rural Business - Cooperative Service......................................... 167 166 50 Salaries and Expenses:
Discretionary Programs ........................................................................... 226 233 156 Total, Rural Development.......................................................................... 3,156 3,144 2,073
Food, Nutrition, and Consumer Services: Food and Nutrition Service:
Discretionary Programs ........................................................................... 6,839 6,803 5,966 Mandatory Programs................................................................................ 101,484 98,069 96,580
Total, Food, Nutrition, and Consumer Services.......................................... 108,323 104,872 102,546

APPENDIX 77
Mission Area / Agency / Funding Category 2017
Actual 2018
Estimate 2019
Budget Food Safety:
Food Safety and Inspection Service: Discretionary Programs ........................................................................... 1,032 1,021 1,032 Mandatory Programs................................................................................ 247 236 240
Total, Food Safety ...................................................................................... 1,279 1,257 1,272 Natural Resources and Environment:
Forest Service: Discretionary Programs ........................................................................... 5,631 5,595 4,767 Mandatory Programs................................................................................ 445 411 405
Total, Natural Resources and Environment ................................................... 6,076 6,006 5,172 Marketing and Regulatory Programs:
Animal and Plant Health Inspection Service: Discretionary Programs ........................................................................... 1,002 996 742 Discretionary Emergency Programs ........................................................ 24 - - Mandatory Programs................................................................................ 294 306 310
Total, Animal and Plant Health Inspection Service .............................. 1,320 1,302 1,052 Agricultural Marketing Service:
Discretionary Programs ........................................................................... 140 147 120 Mandatory Programs................................................................................ 1,161 1,175 1,131
Total, Agricultural Marketing Service .................................................. 1,301 1,322 1,251 Total, Marketing and Regulatory Programs................................................... 2,621 2,624 2,303 Research, Education, and Economics:
Agricultural Research Service: Discretionary Programs ........................................................................... 1,269 1,258 1,019 Mandatory Programs................................................................................ 28 28 28
Total, Agricultural Research Service .................................................... 1,297 1,286 1,047 National Institute of Food and Agriculture:
Discretionary Programs ........................................................................... 1,373 1,363 1,263 Mandatory Programs................................................................................ 160 162 106 Total, National Institute of Food and Agriculture ................................. 1,533 1,525 1,369
Economic Research Service: Discretionary Programs ........................................................................... 87 86 45
National Agricultural Statistics Service: Discretionary Programs ........................................................................... 171 170 165
Total, Research, Education, and Economics................................................. 3,088 3,067 2,626 Departmental Activities:
Discretionary Programs .............................................................................. 314 317 292 Mandatory Programs .................................................................................. 14 14 1
Subtotal, Departmental Activities.................................................................. 328 331 293 Office of Inspector General:
Discretionary Programs ........................................................................... 98 98 87 Total, Departmental Activities....................................................................... 426 429 380 Subtotal, USDA ............................................................................................. 145,939 147,227 142,998
Offsetting Receipts, Rescissions & Other Adjustments.............................. -9,392 -3,621 -3,569 Total, U.S. Department of Agriculture ...................................................... 136,547 143,606 139,429

2019 USDA BUDGET SUMMARY 78
Table APP-3. Program Level (millions of dollars)
Mission Area / Agency / Program 2017 Actual
2018 Estimate
2019 Budget
Farm Production and Conservation: Farm Service Agency:
Farm Loan and Grant Programs............................................................... $8,003 $7,996 $7,618 Conservation Programs ............................................................................ 1,886 2,130 2,222 Commodity Programs .............................................................................. 17,830 16,564 19,345 Commodity Credit Corporation Export Programs ................................... 5,936 6,376 6,329 Salaries and Expenses .............................................................................. 1,516 1,487 1,187 Other Programs ........................................................................................ 48 44 30
Total, Farm Service Agency ................................................................. 35,219 34,597 36,731 Risk Management Agency:
Salaries and Expenses .............................................................................. 84 84 67 Crop Insurance Fund................................................................................ 8,763 12,680 12,323
Total, Risk Management Agency.......................................................... 8,847 12,764 12,390 Natural Resources Conservation Service:
Private Lands Conservation Operations (Discretionary).......................... 864 858 669 Farm Security and Rural Investment Programs ....................................... 3,387 3,284 3,707 All Other .................................................................................................. 269 165 -
Total, Natural Resources Conservation Service 4,520 4,307 4,376 FPAC Business Center:
Discretionary Programs ........................................................................... - - 212 Mandatory Programs................................................................................ - - 60
Total, FPAC Business Center - - 273 Total, Farm Production and Conservation .................................................. 48,586 51,668 53,770
Trade and Foreign Agricultural Affairs: Foreign Agricultural Service:
Export Credit Guarantees......................................................................... 1,582 5,500 5,500 Market Development Programs ............................................................... 279 301 233 Foreign Food Assistance.......................................................................... 1,968 1,955 166 Salaries and Expenses .............................................................................. 203 201 199
Total, Trade and Foreign Agricultural Affairs ............................................ 4,032 7,957 6,098 Rural Development:
Rural Utilities Service: Loans and Grants ..................................................................................... 8,885 8,884 7,531
Rural Housing Service: Loans and Grants ..................................................................................... 30,074 30,033 29,503
Rural Business - Cooperative Service: Loans and Grants ..................................................................................... 1,419 1,580 515
Salaries and Expenses: 226 233 156 Total, Rural Development.......................................................................... 40,604 40,730 37,705
Food, Nutrition, and Consumer Services: Food and Nutrition Service:
Supplemental Nutrition Assistance Program ........................................... 78,481 73,613 73,218 Child Nutrition Programs......................................................................... 22,981 24,434 23,340 Women, Infants and Children (WIC)....................................................... 6,351 6,314 5,751 All Other .................................................................................................. 510 511 237
Total, Food, Nutrition, and Consumer Services.......................................... 108,323 104,872 102,546

APPENDIX 79
Mission Area / Agency / Program 2017
Actual 2018
Estimate 2019
Budget Food Safety:
Food Safety and Inspection Service......................................................... 1,279 1,257 1,272 Natural Resources and Environment:
Forest Service: National Forest System ............................................................................ 1,903 1,890 1,720 Forest and Rangeland Research ............................................................... 308 306 261 State and Private Forestry ........................................................................ 322 320 182 Wildland Fire Activities........................................................................... 2,331 2,315 2,505 Capital Improvement and Maintenance ................................................... 364 362 95 Land Acquisition...................................................................................... 56 55 1 All Other .................................................................................................. 347 347 4
Total, Discretionary Accounts .............................................................. 5,631 5,595 4,767 Mandatory................................................................................................ 445 411 405
Total, Natural Resources and Environment ................................................... 6,076 6,006 5,172 Marketing and Regulatory Programs:
Animal and Plant Health Inspection Service: Salaries and Expenses .............................................................................. 952 946 739 Emergency Funding ................................................................................. 24 - -
Mandatory................................................................................................ 294 306 310 Buildings and Facilities............................................................................ 50 50 3
Total, Animal and Plant Health Inspection Service .............................. 1,320 1,302 1,052 Agricultural Marketing Service:
Section 32 Funds...................................................................................... 842 840 789 All Other .................................................................................................. 459 482 462
Total, Agricultural Marketing Service .................................................. 1,301 1,322 1,251 Grain Inspection, Packers and Stockyards Administration - - -
Total, Marketing and Regulatory Programs................................................... 2,621 2,624 2,303 Research, Education, and Economics:
Agricultural Research Service .................................................................... 1,297 1,286 1,047 National Institute of Food and Agriculture ................................................. 1,533 1,525 1,369 Economic Research Service........................................................................ 87 86 45 National Agricultural Statistics Service ...................................................... 171 170 165
Total, Research, Education, and Economics................................................. 3,088 3,067 2,626 Departmental Activities:
Office of the Secretary................................................................................ 52 54 53 Office of Civil Rights ................................................................................. 24 24 22 Office of Inspector General. ....................................................................... 98 98 87 All Other Staff Offices................................................................................ 252 253 218
Total, Departmental Activities....................................................................... 426 429 380 Subtotal, USDA ............................................................................................. 215,034 218,610 211,873
Offsetting Receipts, Rescissions & Other Adjustments.............................. -9,392 -3,621 -3,569 Total, U.S. Department of Agriculture ...................................................... 205,642 214,989 208,304
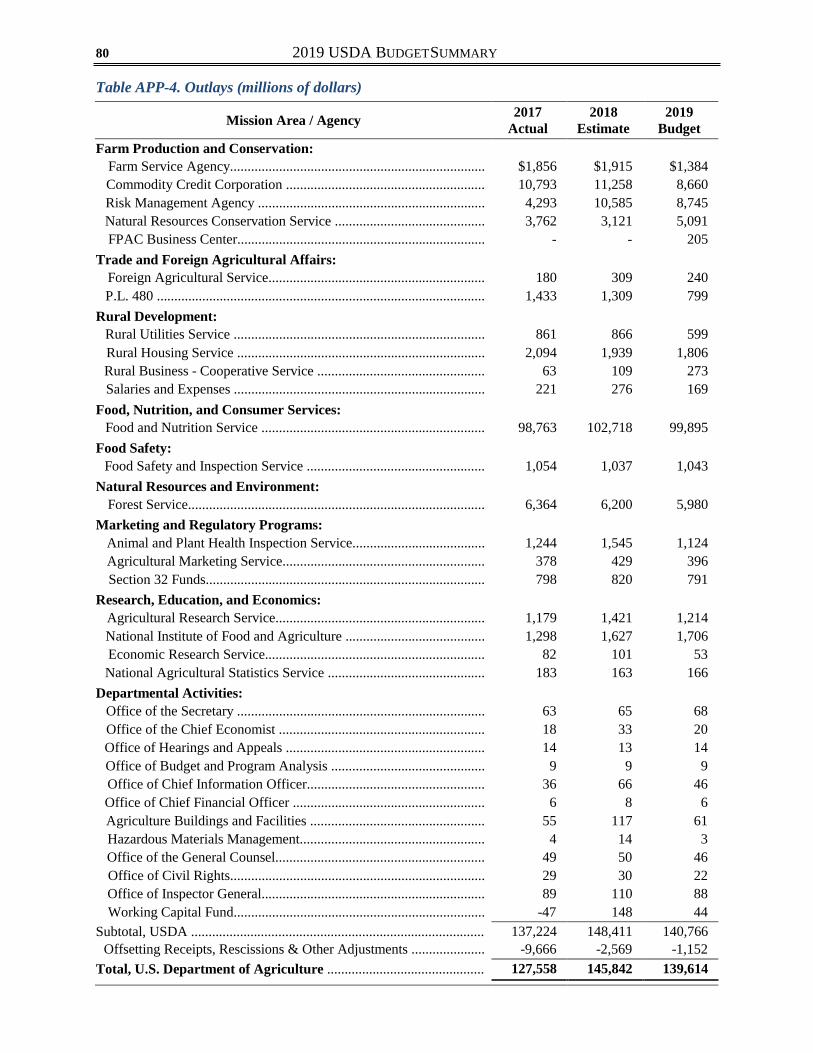
2019 USDA BUDGET SUMMARY 80
Table APP-4. Outlays (millions of dollars)
Mission Area / Agency 2017 Actual
2018 Estimate
2019 Budget
Farm Production and Conservation: Farm Service Agency......................................................................... $1,856 $1,915 $1,384 Commodity Credit Corporation ......................................................... 10,793 11,258 8,660 Risk Management Agency ................................................................. 4,293 10,585 8,745 Natural Resources Conservation Service ........................................... 3,762 3,121 5,091 FPAC Business Center....................................................................... - - 205
Trade and Foreign Agricultural Affairs: Foreign Agricultural Service.............................................................. 180 309 240 P.L. 480 .............................................................................................. 1,433 1,309 799
Rural Development: Rural Utilities Service ........................................................................ 861 866 599 Rural Housing Service ....................................................................... 2,094 1,939 1,806 Rural Business - Cooperative Service ................................................ 63 109 273 Salaries and Expenses ........................................................................ 221 276 169
Food, Nutrition, and Consumer Services: Food and Nutrition Service ................................................................ 98,763 102,718 99,895
Food Safety: Food Safety and Inspection Service ................................................... 1,054 1,037 1,043
Natural Resources and Environment: Forest Service..................................................................................... 6,364 6,200 5,980
Marketing and Regulatory Programs: Animal and Plant Health Inspection Service...................................... 1,244 1,545 1,124 Agricultural Marketing Service.......................................................... 378 429 396 Section 32 Funds................................................................................ 798 820 791
Research, Education, and Economics: Agricultural Research Service............................................................ 1,179 1,421 1,214 National Institute of Food and Agriculture ........................................ 1,298 1,627 1,706 Economic Research Service............................................................... 82 101 53 National Agricultural Statistics Service ............................................. 183 163 166
Departmental Activities: Office of the Secretary ....................................................................... 63 65 68 Office of the Chief Economist ........................................................... 18 33 20 Office of Hearings and Appeals ......................................................... 14 13 14 Office of Budget and Program Analysis ............................................ 9 9 9 Office of Chief Information Officer................................................... 36 66 46 Office of Chief Financial Officer ....................................................... 6 8 6 Agriculture Buildings and Facilities .................................................. 55 117 61 Hazardous Materials Management..................................................... 4 14 3 Office of the General Counsel............................................................ 49 50 46 Office of Civil Rights......................................................................... 29 30 22 Office of Inspector General................................................................ 89 110 88 Working Capital Fund........................................................................ -47 148 44
Subtotal, USDA .................................................................................... 137,224 148,411 140,766 Offsetting Receipts, Rescissions & Other Adjustments ..................... -9,666 -2,569 -1,152
Total, U.S. Department of Agriculture ............................................. 127,558 145,842 139,614

APPENDIX 81
Table APP-5. Discretionary Outlays (millions of dollars)
Mission Area / Agency 2017 Actual
2018 Estimate
2019 Budget
Farm Production and Conservation: Farm Service Agency......................................................................... $1,642 $1,753 $1,443 Risk Management Agency ................................................................. 87 63 37 Natural Resources Conservation Service ........................................... 846 985 776 FPAC Business Center....................................................................... - - 157
Trade and Foreign Agricultural Affairs: Foreign Agricultural Service.............................................................. 179 292 239 P.L. 480 .............................................................................................. 1,688 1,494 1,014
Rural Development: Rural Utilities Service ........................................................................ 579 583 761 Rural Housing Service ....................................................................... 1,829 1,874 2,176 Rural Business - Cooperative Service ................................................ 104 125 259 Salaries and Expenses ........................................................................ 221 276 169
Food, Nutrition, and Consumer Services: Food and Nutrition Service ................................................................ 6,194 6,235 5,939
Food Safety: Food Safety and Inspection Service ................................................... 1,028 1,026 1,032
Natural Resources and Environment: Forest Service..................................................................................... 5,791 5,584 5,354
Marketing and Regulatory Programs: Animal and Plant Health Inspection Service...................................... 952 1,136 814 Agricultural Marketing Service.......................................................... 119 155 130
Research, Education, and Economics: Agricultural Research Service............................................................ 1,154 1,393 1,186 National Institute of Food and Agriculture ........................................ 1,182 1,453 1,534 Economic Research Service............................................................... 82 101 53 National Agricultural Statistics Service ............................................. 183 163 166
Departmental Activities: Office of the Secretary ....................................................................... 50 51 54 Office of the Chief Economist ........................................................... 17 32 19 Office of Hearings and Appeals ......................................................... 14 13 14 Office of Budget and Program Analysis ............................................ 9 9 9 Office of Chief Information Officer................................................... 36 66 46 Office of Chief Financial Officer ....................................................... 6 8 6 Agriculture Buildings and Facilities .................................................. 55 117 61 Hazardous Materials Management..................................................... 4 14 3 Office of the General Counsel............................................................ 49 50 46 Office of Civil Rights......................................................................... 29 30 22 Office of Inspector General................................................................ 89 110 88 Working Capital Fund........................................................................ -47 148 44
Subtotal, USDA .................................................................................... 24,171 25,339 23,651 Offsetting Receipts, Rescissions & Other Adjustments ..................... -429 -681 -762
Total, U.S. Department of Agriculture ............................................. 23,742 24,658 22,889

2019 USDA BUDGET SUMMARY 82
Table APP-6. User Fee Proposals (dollars in millions)
Mission Area / Agency / Proposal 2019 BA
2019 Outlays
Food Safety:
Food Safety and Inspection Service:
Establish a user fee to cover all domestic inspection and import re- inspection and most of the central operations costs for Federal, State, and International inspection programs for meat, poultry, and egg products. The fee would not cover Federal functions such as investigation, enforcement, risk analysis, and emergency response. This user fee would be implemented in 2020. Total collections are estimated to be $5.9 billion over 10 years. ...........................................................................................
0
0
Marketing and Regulatory Programs:
Agricultural Marketing Service:
Establish a user fee for the Marketing Orders and Agreements programs to recover the full cost of the agency’s oversight of these programs. Total collections estimated to be $200 million over 10 years. ..........................
-20
-20
Collect a user fee to recover the full cost of the Grain Regulatory Program. The fee would cover programs including grain standardization, quality, assessment, market integrity protection, and compliance. Total collections are estimated to be $200 million over 10 years. ....................
0
0
Collect a license fee for those covered by the Packers and Stockyards Act. The proposed license fee would be assessed on livestock market agencies, dealers, stockyards, packers, live poultry dealers, and swine contractors. Market participants are protected from the adverse effects of anticompetitive and unfair business practices in meat and poultry marketing and distribution. Total collections are estimated to be $230 million over 10 years. ..............................................................................
-23
-23
Animal and Plant Health Inspection Service:
Prescribe, adjust and collect fees to cover the costs incurred for activities in relation to the review, maintenance and inspections connected to licensing activities associated with the Animal Welfare program, Virus- Serum-Toxin (VST) program, and the Biotechnology Regulatory Services (BRS). The estimated fees would result in receipts of $23 million, which include $9 million for animal care, $10 million for veterinary biologics, and $4 million for BRS. Total collections estimated to be $230 million over 10 years..............................................................
-23
-23 Establish a user fee for domestic agricultural quarantines and inspections. Total collections estimated to be $326 million over 10 years.
-29
-29
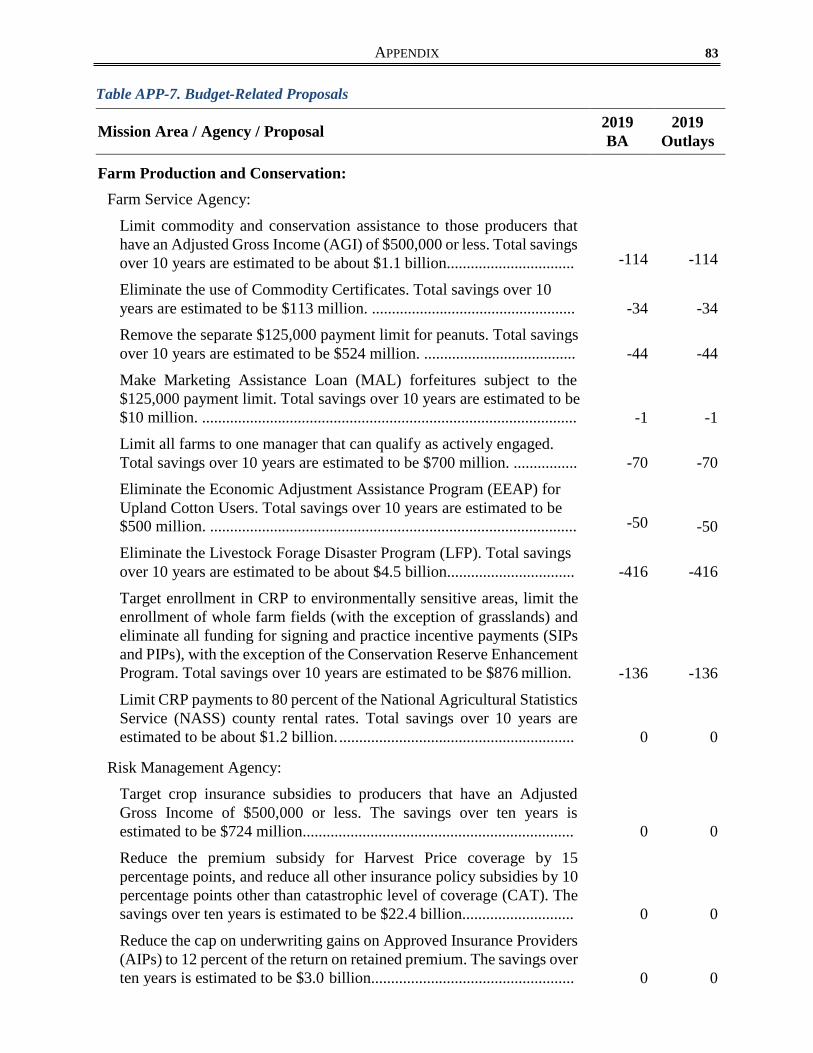
APPENDIX 83
Table APP-7. Budget-Related Proposals
Mission Area / Agency / Proposal 2019 BA
2019 Outlays
Farm Production and Conservation:
Farm Service Agency:
Limit commodity and conservation assistance to those producers that have an Adjusted Gross Income (AGI) of $500,000 or less. Total savings over 10 years are estimated to be about $1.1 billion................................
-114
-114
Eliminate the use of Commodity Certificates. Total savings over 10 years are estimated to be $113 million. ...................................................
-34
-34
Remove the separate $125,000 payment limit for peanuts. Total savings over 10 years are estimated to be $524 million. ......................................
-44
-44
Make Marketing Assistance Loan (MAL) forfeitures subject to the $125,000 payment limit. Total savings over 10 years are estimated to be $10 million. ..............................................................................................
-1
-1 Limit all farms to one manager that can qualify as actively engaged. Total savings over 10 years are estimated to be $700 million. ................
-70
-70
Eliminate the Economic Adjustment Assistance Program (EEAP) for Upland Cotton Users. Total savings over 10 years are estimated to be $500 million. ............................................................................................
-50
-50 Eliminate the Livestock Forage Disaster Program (LFP). Total savings over 10 years are estimated to be about $4.5 billion................................
-416
-416
Target enrollment in CRP to environmentally sensitive areas, limit the enrollment of whole farm fields (with the exception of grasslands) and eliminate all funding for signing and practice incentive payments (SIPs and PIPs), with the exception of the Conservation Reserve Enhancement Program. Total savings over 10 years are estimated to be $876 million.
-136
-136 Limit CRP payments to 80 percent of the National Agricultural Statistics Service (NASS) county rental rates. Total savings over 10 years are estimated to be about $1.2 billion. ...........................................................
0
0
Risk Management Agency:
Target crop insurance subsidies to producers that have an Adjusted Gross Income of $500,000 or less. The savings over ten years is estimated to be $724 million....................................................................
0
0
Reduce the premium subsidy for Harvest Price coverage by 15 percentage points, and reduce all other insurance policy subsidies by 10 percentage points other than catastrophic level of coverage (CAT). The savings over ten years is estimated to be $22.4 billion............................
0
0
Reduce the cap on underwriting gains on Approved Insurance Providers (AIPs) to 12 percent of the return on retained premium. The savings over ten years is estimated to be $3.0 billion...................................................
0
0
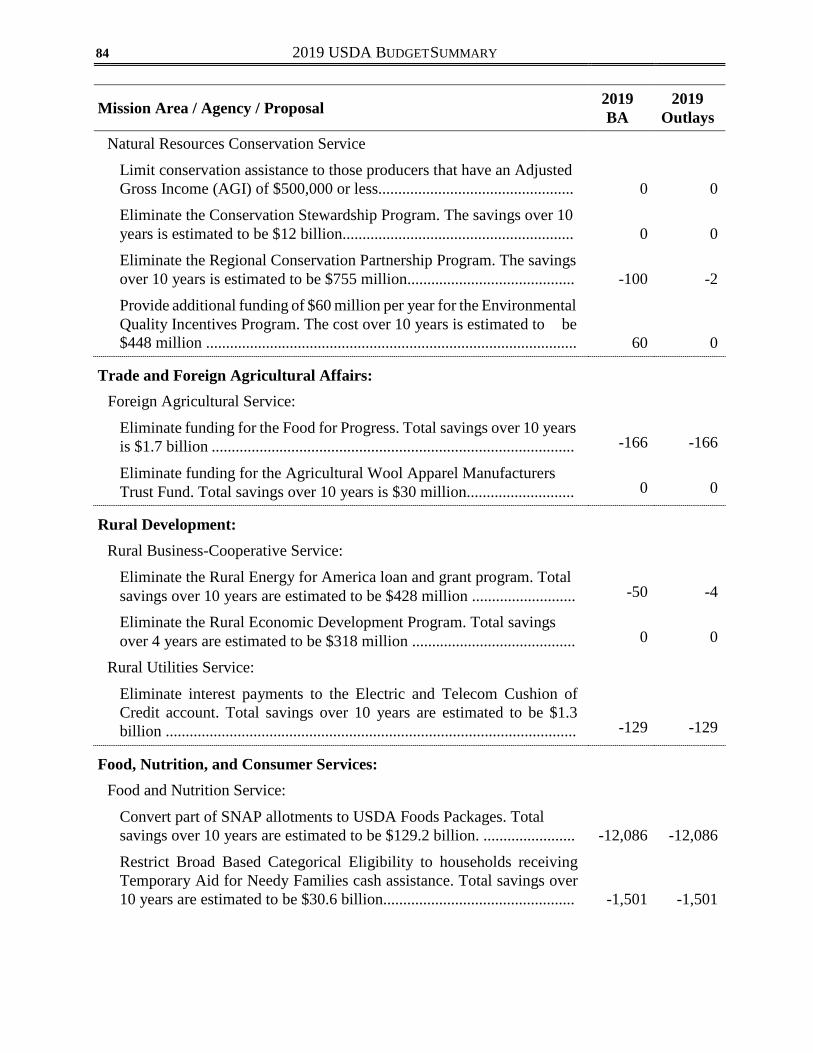
2019 USDA BUDGET SUMMARY 84
Mission Area / Agency / Proposal 2019 BA
2019 Outlays
Natural Resources Conservation Service
Limit conservation assistance to those producers that have an Adjusted Gross Income (AGI) of $500,000 or less.................................................
0
0
Eliminate the Conservation Stewardship Program. The savings over 10 years is estimated to be $12 billion..........................................................
0
0
Eliminate the Regional Conservation Partnership Program. The savings over 10 years is estimated to be $755 million..........................................
-100
-2
Provide additional funding of $60 million per year for the Environmental Quality Incentives Program. The cost over 10 years is estimated to be $448 million .............................................................................................
60
0
Trade and Foreign Agricultural Affairs:
Foreign Agricultural Service:
Eliminate funding for the Food for Progress. Total savings over 10 years is $1.7 billion ...........................................................................................
-166
-166
Eliminate funding for the Agricultural Wool Apparel Manufacturers Trust Fund. Total savings over 10 years is $30 million...........................
0
0
Rural Development:
Rural Business-Cooperative Service:
Eliminate the Rural Energy for America loan and grant program. Total savings over 10 years are estimated to be $428 million ..........................
-50
-4
Eliminate the Rural Economic Development Program. Total savings over 4 years are estimated to be $318 million .........................................
0
0
Rural Utilities Service:
Eliminate interest payments to the Electric and Telecom Cushion of Credit account. Total savings over 10 years are estimated to be $1.3 billion .......................................................................................................
-129
-129
Food, Nutrition, and Consumer Services:
Food and Nutrition Service:
Convert part of SNAP allotments to USDA Foods Packages. Total savings over 10 years are estimated to be $129.2 billion. .......................
-12,086
-12,086
Restrict Broad Based Categorical Eligibility to households receiving Temporary Aid for Needy Families cash assistance. Total savings over 10 years are estimated to be $30.6 billion................................................
-1,501
-1,501
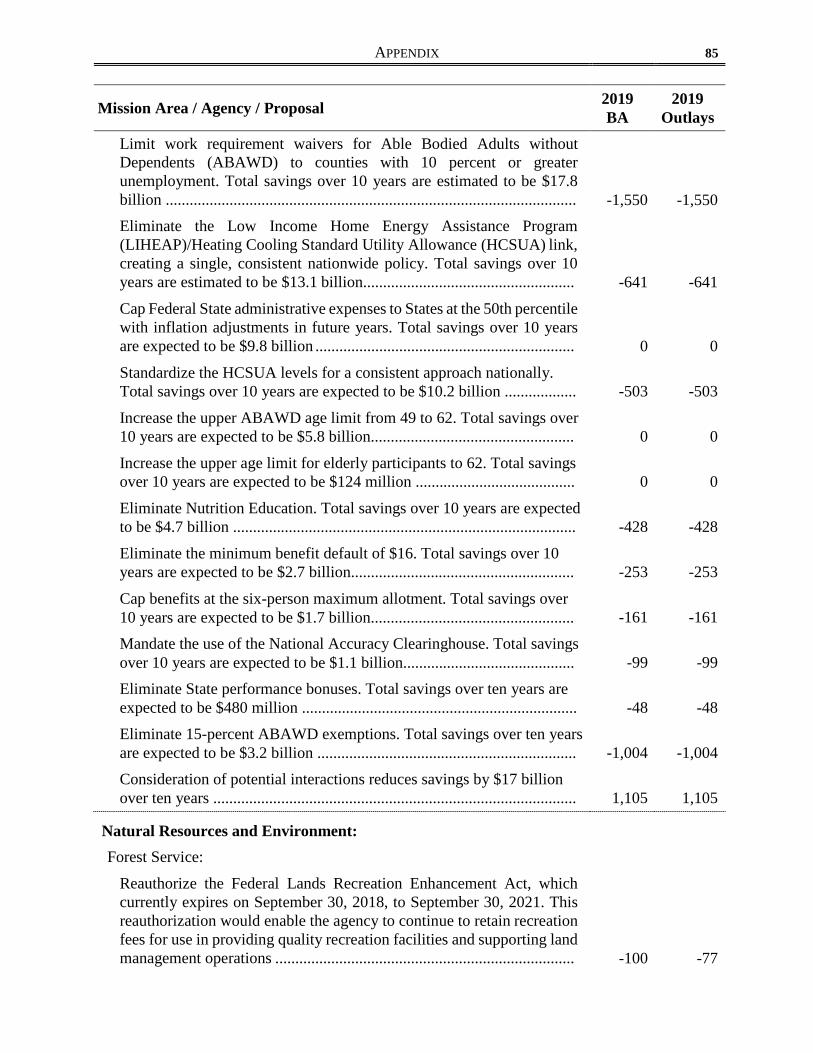
APPENDIX 85
Mission Area / Agency / Proposal 2019 BA
2019 Outlays
Limit work requirement waivers for Able Bodied Adults without Dependents (ABAWD) to counties with 10 percent or greater unemployment. Total savings over 10 years are estimated to be $17.8 billion .......................................................................................................
-1,550
-1,550 Eliminate the Low Income Home Energy Assistance Program (LIHEAP)/Heating Cooling Standard Utility Allowance (HCSUA) link, creating a single, consistent nationwide policy. Total savings over 10 years are estimated to be $13.1 billion.....................................................
-641
-641
Cap Federal State administrative expenses to States at the 50th percentile with inflation adjustments in future years. Total savings over 10 years are expected to be $9.8 billion .................................................................
0
0
Standardize the HCSUA levels for a consistent approach nationally. Total savings over 10 years are expected to be $10.2 billion ..................
-503
-503
Increase the upper ABAWD age limit from 49 to 62. Total savings over 10 years are expected to be $5.8 billion...................................................
0
0
Increase the upper age limit for elderly participants to 62. Total savings over 10 years are expected to be $124 million ........................................
0
0
Eliminate Nutrition Education. Total savings over 10 years are expected to be $4.7 billion ......................................................................................
-428
-428
Eliminate the minimum benefit default of $16. Total savings over 10 years are expected to be $2.7 billion........................................................
-253
-253
Cap benefits at the six-person maximum allotment. Total savings over 10 years are expected to be $1.7 billion...................................................
-161
-161
Mandate the use of the National Accuracy Clearinghouse. Total savings over 10 years are expected to be $1.1 billion...........................................
-99
-99
Eliminate State performance bonuses. Total savings over ten years are expected to be $480 million .....................................................................
-48
-48
Eliminate 15-percent ABAWD exemptions. Total savings over ten years are expected to be $3.2 billion .................................................................
-1,004
-1,004
Consideration of potential interactions reduces savings by $17 billion over ten years ...........................................................................................
1,105
1,105
Natural Resources and Environment:
Forest Service:
Reauthorize the Federal Lands Recreation Enhancement Act, which currently expires on September 30, 2018, to September 30, 2021. This reauthorization would enable the agency to continue to retain recreation fees for use in providing quality recreation facilities and supporting land management operations ...........................................................................
-100
-77
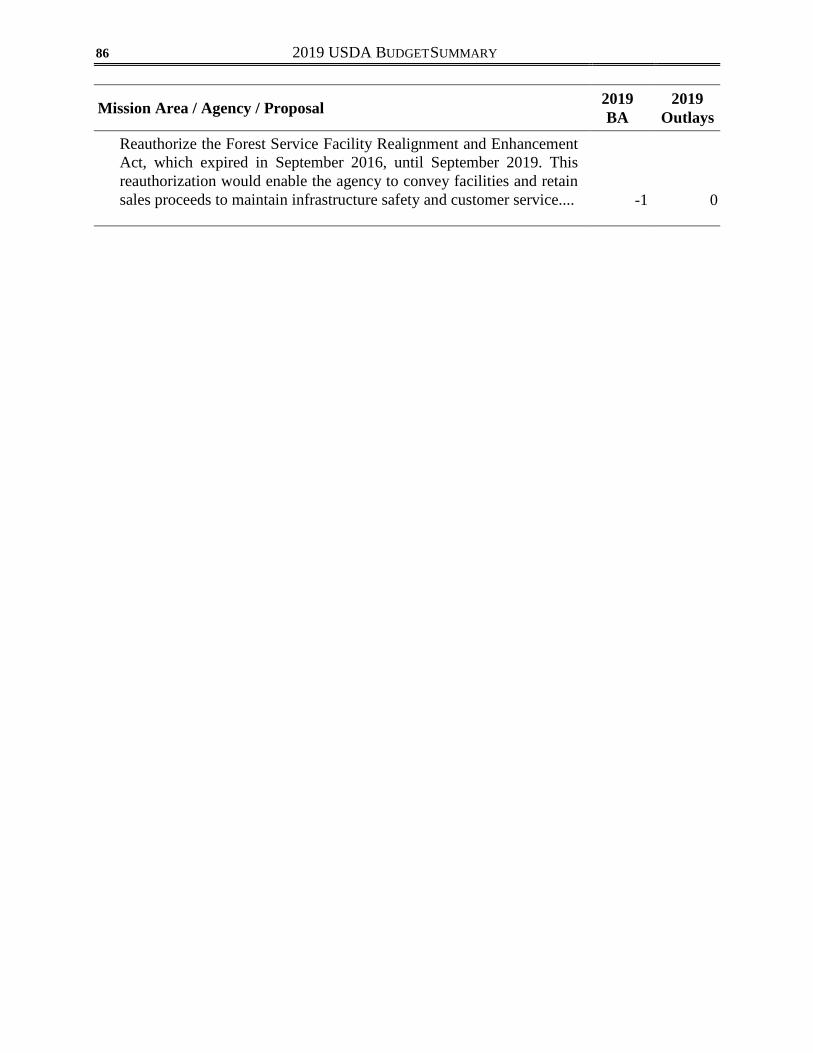
2019 USDA BUDGET SUMMARY 86
Mission Area / Agency / Proposal 2019 BA
2019 Outlays
Reauthorize the Forest Service Facility Realignment and Enhancement Act, which expired in September 2016, until September 2019. This reauthorization would enable the agency to convey facilities and retain sales proceeds to maintain infrastructure safety and customer service....
-1
0

APPENDIX 85
United States Department of Agriculture
Related Documents