U.S. Consumer Product Safety Commission Fiscal Year 2018 Annual Performance Report March 18, 2019 CPSC Stands for Safety

Welcome message from author
This document is posted to help you gain knowledge. Please leave a comment to let me know what you think about it! Share it to your friends and learn new things together.
Transcript
U .S . Consumer Product Safety Commiss ion
Fiscal Year 2018 Annual Performance Report
March 18, 2019
CPSC Stands for Safety

An electronic version of this document is available at:
www.cpsc.gov/about-cpsc/agency-reports/performance-and-budget
About this Report This document is the U.S. Consumer Product Safety Commission’s (CPSC’s) FY 2018 Annual Performance Report (APR). It is submitted in conjunction with the CPSC’s FY 2020 Performance Budget Request (PBR) to Congress. An electronic version of this report is available on the agency’s website at: www.cpsc.gov/about-cpsc/agency-reports/performance-and-budget.
The FY 2018 APR satisfies the annual performance reporting requirements of the GPRA Modernization Act of 2010 (GPRAMA), as well as Office of Management and Budget (OMB) Circular No. A-11 (Preparation, Submission, and Execution of the Budget).
The FY 2018 APR provides information on results achieved by CPSC programs during FY 2018 and progress made toward performance targets established for key performance measures. The performance measures indicate progress toward Strategic Goals and Strategic Objectives contained in the CPSC’s Strategic Plan. Highlights of performance, as well as challenges, are presented.
Overview of the Agency The U.S. Consumer Product Safety Commission (CPSC) is an independent federal regulatory agency, created in 1972 by the Consumer Product Safety Act (CPSA). In addition to the CPSA, as amended by the Consumer Product Safety Improvement Act of 2008 (CPSIA), and Public Law No. 112-28, the CPSC also administers other laws, such as the Federal Hazardous Substances Act, the Flammable Fabrics Act, the Poison Prevention Packaging Act, the Refrigerator Safety Act, the Virginia Graeme Baker Pool and Spa Safety Act, the Children’s Gasoline Burn Prevention Act, the Drywall Safety Act of 2012, and the Child Nicotine Poisoning Prevention Act.
The CPSC has jurisdiction over thousands of types of consumer products used in and around the home, in recreation, and in schools, from children’s toys to portable gas generators and toasters. Although the CPSC’s regulatory purview is quite broad, a number of product categories fall outside the CPSC’s jurisdiction.1
1 Product categories, such as automobiles and boats; alcohol, tobacco, and firearms; foods, drugs, cosmetics, and medical devices; and pesticides,
are regulated by other federal agencies.
Message from the Acting Chairman
The U.S. Consumer Product Safety Commission’s FY 2018 Annual Performance Report (APR) is a comprehensive report on performance results achieved by our programs during the FY 2018 reporting period of October 1, 2017 through September 30, 2018. The agency’s mission is to protect the public against unreasonable risks of injury associated with consumer products. I am pleased to have the opportunity to report these results as well as staff’s accomplishments in FY 2018.
I can provide reasonable assurance that the performance data contained in this report are accurate and reliable. In FY 2018, the CPSC conducted a review to verify and validate the completeness, accuracy, and reliability of performance information. That review found that FY 2018 reported data for the performance measures were reasonably complete, accurate, and reliable.
I look forward to continuing to work with my fellow Commissioners and the CPSC staff in setting agency priorities and achieving meaningful results in the year ahead.
Sincerely,
Ann Marie Buerkle Acting Chairman March 18, 2019
Table of Contents
Agency and Mission Information CPSC Organizational Structure .................................................................................................................................................................. 1 Strategic Plan Summary .................................................................................................................................................................................. 2
Performance Results
Performance Summary: An Overview ................................................................................................................................................... 4 CPSC Key Performance Measures: FY 2018 Results Summary ......................................................................................... .5 Performance Summary by Strategic Goal
Strategic Goal 1: Workforce …………………………………………… ................................................................................ …………7 Strategic Goal 2: Prevention …………………………………………… ............................................................................... …………9 Strategic Goal 3: Response …………………………………………… ............................................................................... …………12 Strategic Goal 4: Communication …………………………………………… ................................................................ …………14
Other Information
Agency Priorities and Management Challenges ....................................................................................................................... 16 Cross-Agency Collaborations .................................................................................................................................................................. 17 Evaluation and Research.............................................................................................................................................................................. 20
Appendices
Appendix A: CPSC Performance: Data Limitations, Verification & Validation .................................................. 22
Appendix B: Changes to FY 2018 Performance Measures ............................................................................................... 23
Appendix C: Detailed Information on FY 2018 Performance Measures................................................................ 25
Appendix D: Acronyms ................................................................................................................................................................................ 56
2 0 1 8 AP R | M a r c h 2 0 1 9 A g e n c y a n d M i s s i o n I n f o r m a t i o n
C P S C | 1
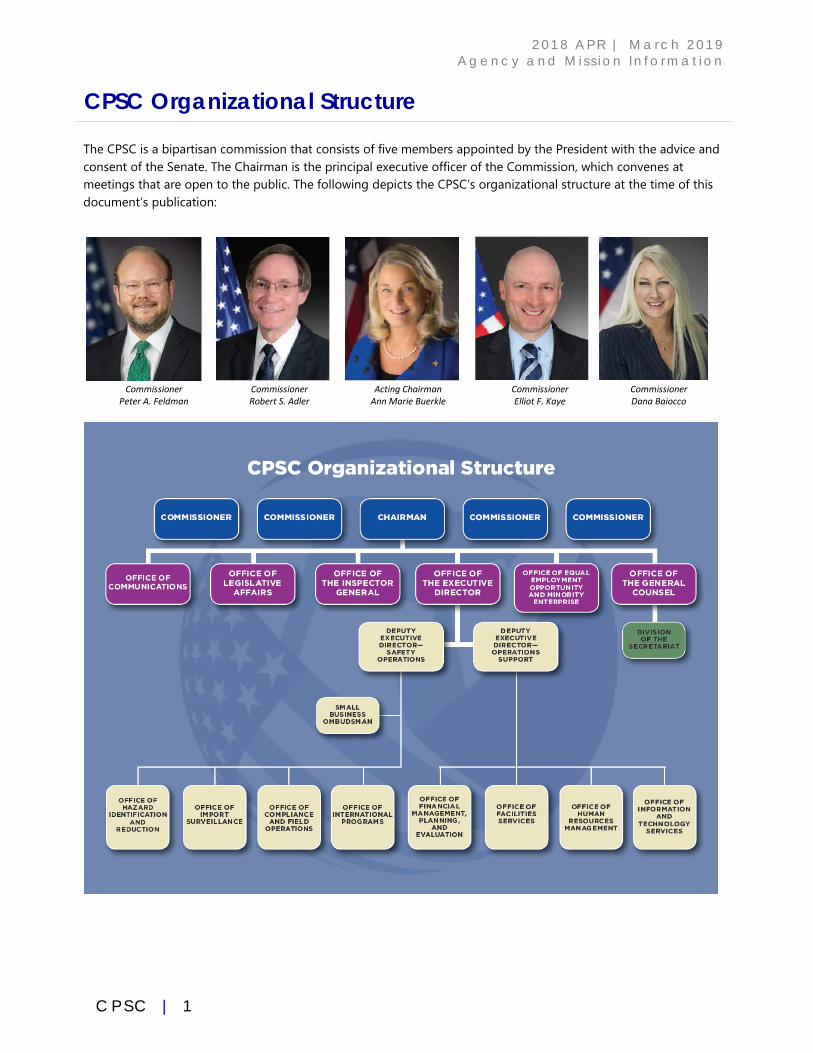
CPSC Organizational Structure
The CPSC is a bipartisan commission that consists of five members appointed by the President with the advice and consent of the Senate. The Chairman is the principal executive officer of the Commission, which convenes at meetings that are open to the public. The following depicts the CPSC’s organizational structure at the time of this document’s publication:
Commissioner
Peter A. Feldman Commissioner Robert S. Adler
Acting Chairman Ann Marie Buerkle
Commissioner Elliot F. Kaye
Commissioner Dana Baiocco
2 0 1 8 AP R | M a r c h 2 0 1 9 A g e n c y a n d M i s s i o n I n f o r m a t i o n
C P S C | 2
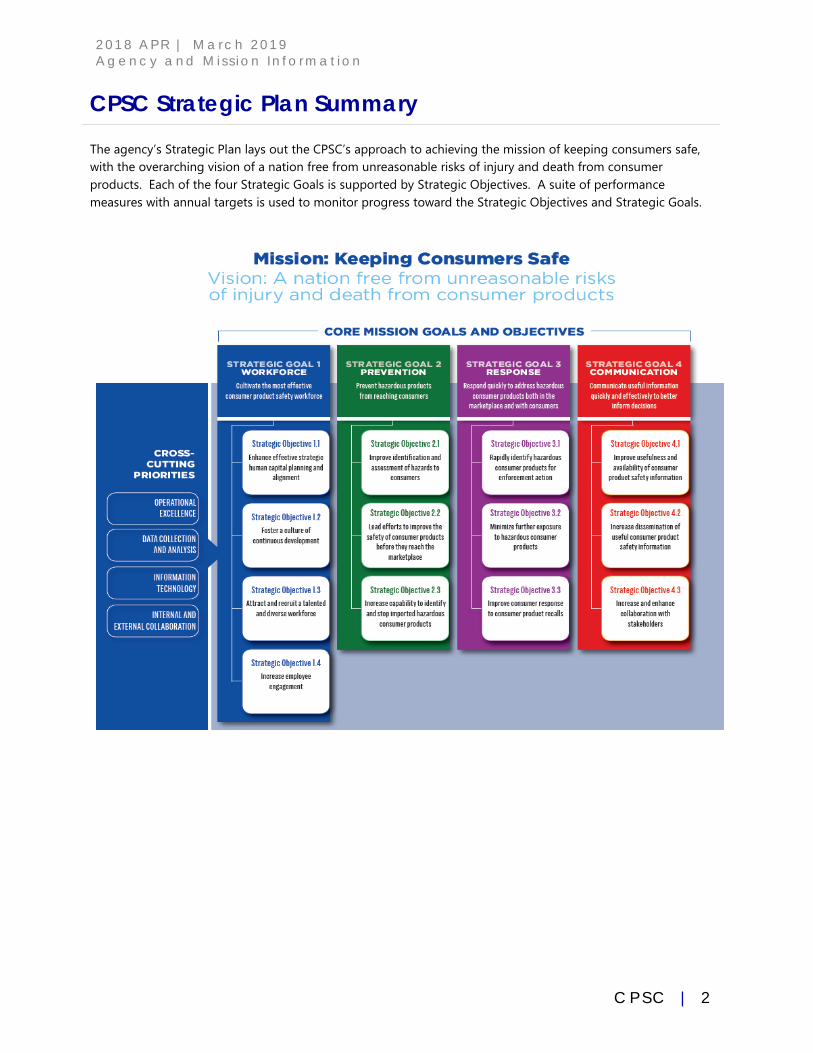
CPSC Strategic Plan Summary
The agency’s Strategic Plan lays out the CPSC’s approach to achieving the mission of keeping consumers safe, with the overarching vision of a nation free from unreasonable risks of injury and death from consumer products. Each of the four Strategic Goals is supported by Strategic Objectives. A suite of performance measures with annual targets is used to monitor progress toward the Strategic Objectives and Strategic Goals.

2 0 1 8 AP R | M a r c h 2 0 1 9 P e r f o r m a n c e R e s u l t s
C P S C | 3
This page intentionally left blank.
2 0 1 8 AP R | M a r c h 2 0 1 9 P e r f o r m a n c e R e s u l t s
C P S C | 4
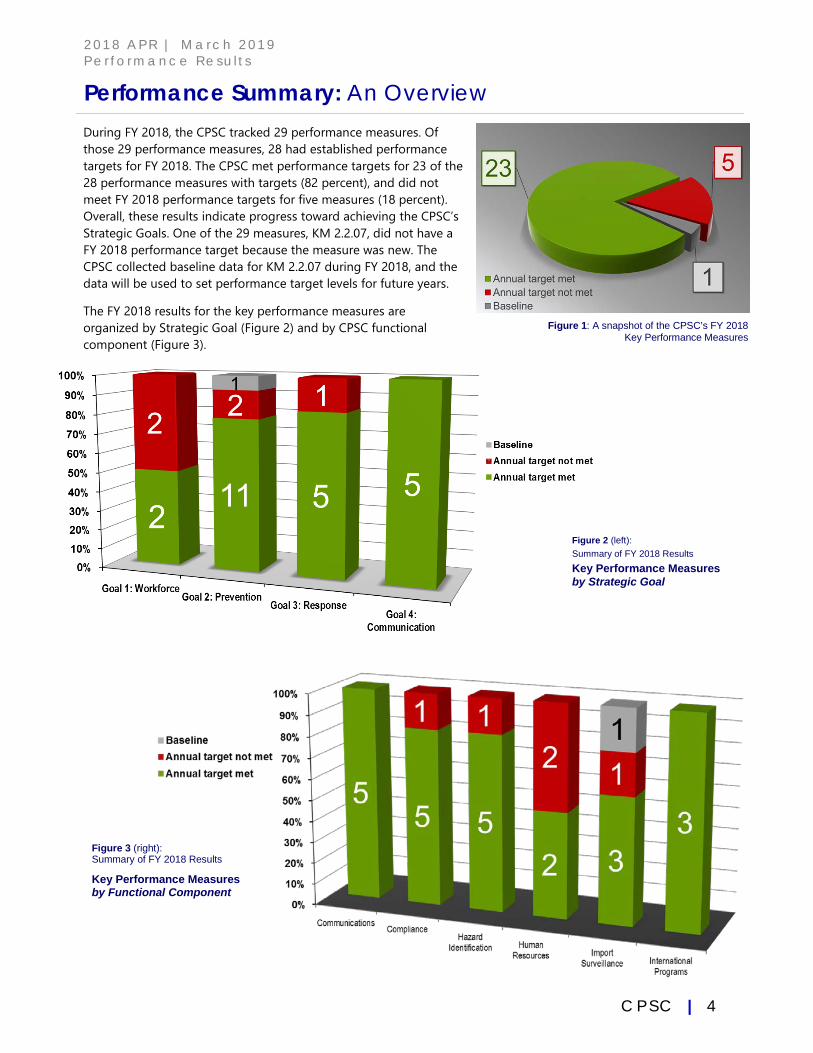
Performance Summary: An Overview
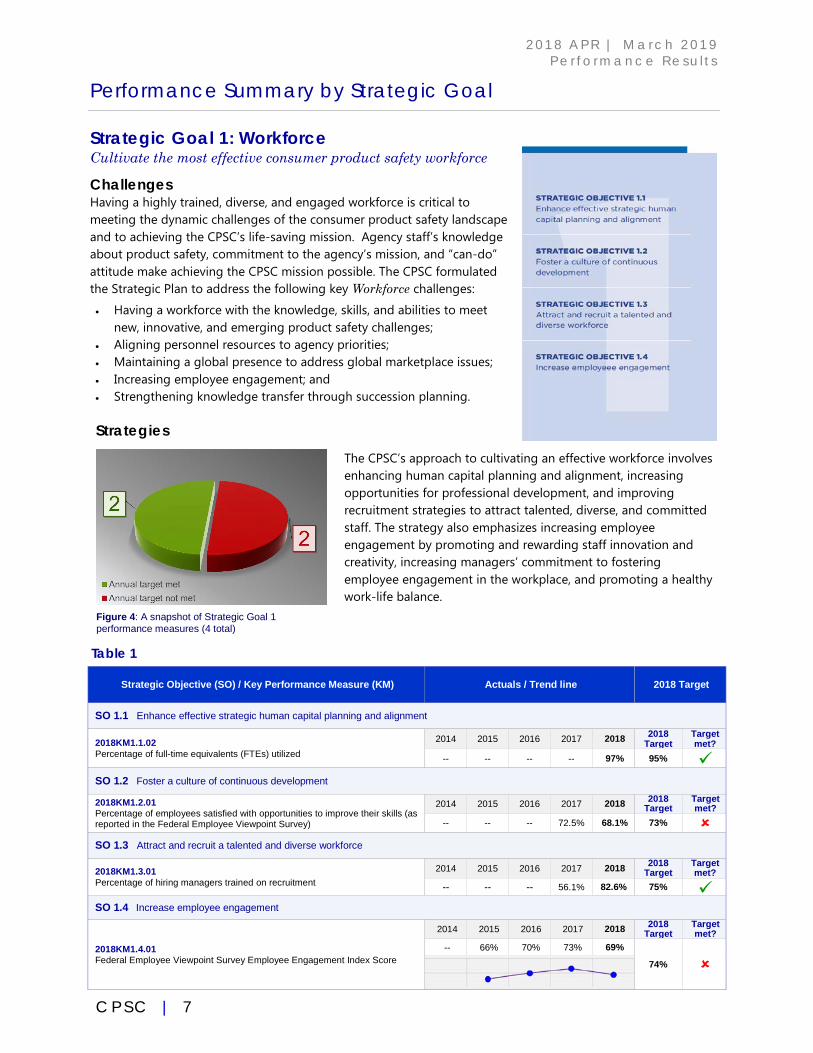
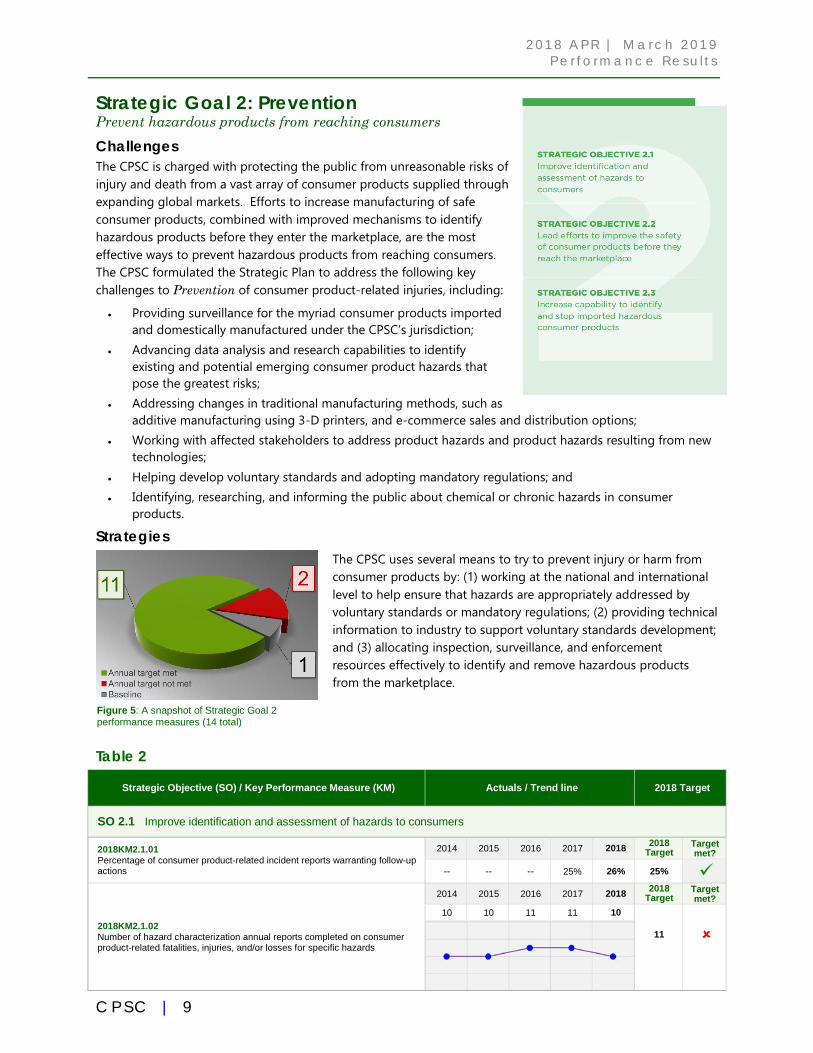
During FY 2018, the CPSC tracked 29 performance measures. Of those 29 performance measures, 28 had established performance targets for FY 2018. The CPSC met performance targets for 23 of the 28 performance measures with targets (82 percent), and did not meet FY 2018 performance targets for five measures (18 percent). Overall, these results indicate progress toward achieving the CPSC’s Strategic Goals. One of the 29 measures, KM 2.2.07, did not have a FY 2018 performance target because the measure was new. The CPSC collected baseline data for KM 2.2.07 during FY 2018, and the data will be used to set performance target levels for future years.
The FY 2018 results for the key performance measures are organized by Strategic Goal (Figure 2) and by CPSC functional component (Figure 3).
Figure 1: A snapshot of the CPSC’s FY 2018 Key Performance Measures
Figure 3 (right): Summary of FY 2018 Results
Key Performance Measures by Functional Component
Figure 2 (left): Summary of FY 2018 Results Key Performance Measures by Strategic Goal
2 0 1 8 AP R | M a r c h 2 0 1 9 P e r f o r m a n c e R e s u l t s
C P S C | 5
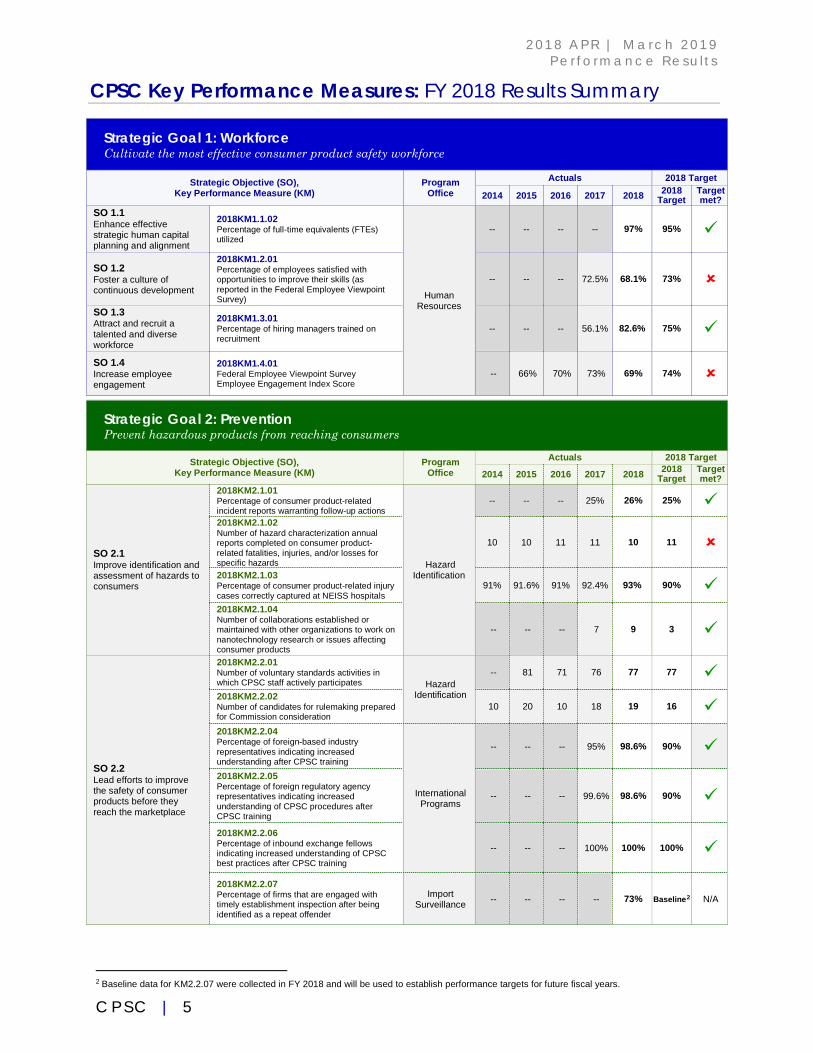
CPSC Key Performance Measures: FY 2018 Results Summary
Strategic Goal 1: Workforce Cultivate the most effective consumer product safety workforce
Strategic Objective (SO), Key Performance Measure (KM)
Program Office
Actuals 2018 Target
2014 2015 2016 2017 2018 2018 Target
Target met?
SO 1.1 Enhance effective strategic human capital planning and alignment
2018KM1.1.02 Percentage of full-time equivalents (FTEs) utilized
Human Resources
-- -- -- -- 97% 95%
SO 1.2 Foster a culture of continuous development
2018KM1.2.01 Percentage of employees satisfied with opportunities to improve their skills (as reported in the Federal Employee Viewpoint Survey)
-- -- -- 72.5% 68.1% 73%
SO 1.3 Attract and recruit a talented and diverse workforce
2018KM1.3.01 Percentage of hiring managers trained on recruitment
-- -- -- 56.1% 82.6% 75%
SO 1.4 Increase employee engagement
2018KM1.4.01 Federal Employee Viewpoint Survey Employee Engagement Index Score
-- 66% 70% 73% 69% 74%
Strategic Goal 2: Prevention Prevent hazardous products from reaching consumers
Strategic Objective (SO), Key Performance Measure (KM)
Program Office
Actuals 2018 Target
2014 2015 2016 2017 2018 2018 Target
Target met?
SO 2.1 Improve identification and assessment of hazards to consumers
2018KM2.1.01 Percentage of consumer product-related incident reports warranting follow-up actions
Hazard Identification
-- -- -- 25% 26% 25% 2018KM2.1.02 Number of hazard characterization annual reports completed on consumer product-related fatalities, injuries, and/or losses for specific hazards
10 10 11 11 10 11
2018KM2.1.03 Percentage of consumer product-related injury cases correctly captured at NEISS hospitals
91% 91.6% 91% 92.4% 93% 90% 2018KM2.1.04 Number of collaborations established or maintained with other organizations to work on nanotechnology research or issues affecting consumer products
-- -- -- 7 9 3
SO 2.2 Lead efforts to improve the safety of consumer products before they reach the marketplace
2018KM2.2.01 Number of voluntary standards activities in which CPSC staff actively participates Hazard
Identification
-- 81 71 76 77 77 2018KM2.2.02 Number of candidates for rulemaking prepared for Commission consideration
10 20 10 18 19 16 2018KM2.2.04 Percentage of foreign-based industry representatives indicating increased understanding after CPSC training
International Programs
-- -- -- 95% 98.6% 90% 2018KM2.2.05 Percentage of foreign regulatory agency representatives indicating increased understanding of CPSC procedures after CPSC training
-- -- -- 99.6% 98.6% 90%
2018KM2.2.06 Percentage of inbound exchange fellows indicating increased understanding of CPSC best practices after CPSC training
-- -- -- 100% 100% 100%
2018KM2.2.07 Percentage of firms that are engaged with timely establishment inspection after being identified as a repeat offender
Import Surveillance -- -- -- -- 73% Baseline2 N/A
2 Baseline data for KM2.2.07 were collected in FY 2018 and will be used to establish performance targets for future fiscal years.
2 0 1 8 AP R | M a r c h 2 0 1 9 P e r f o r m a n c e R e s u l t s
C P S C | 6
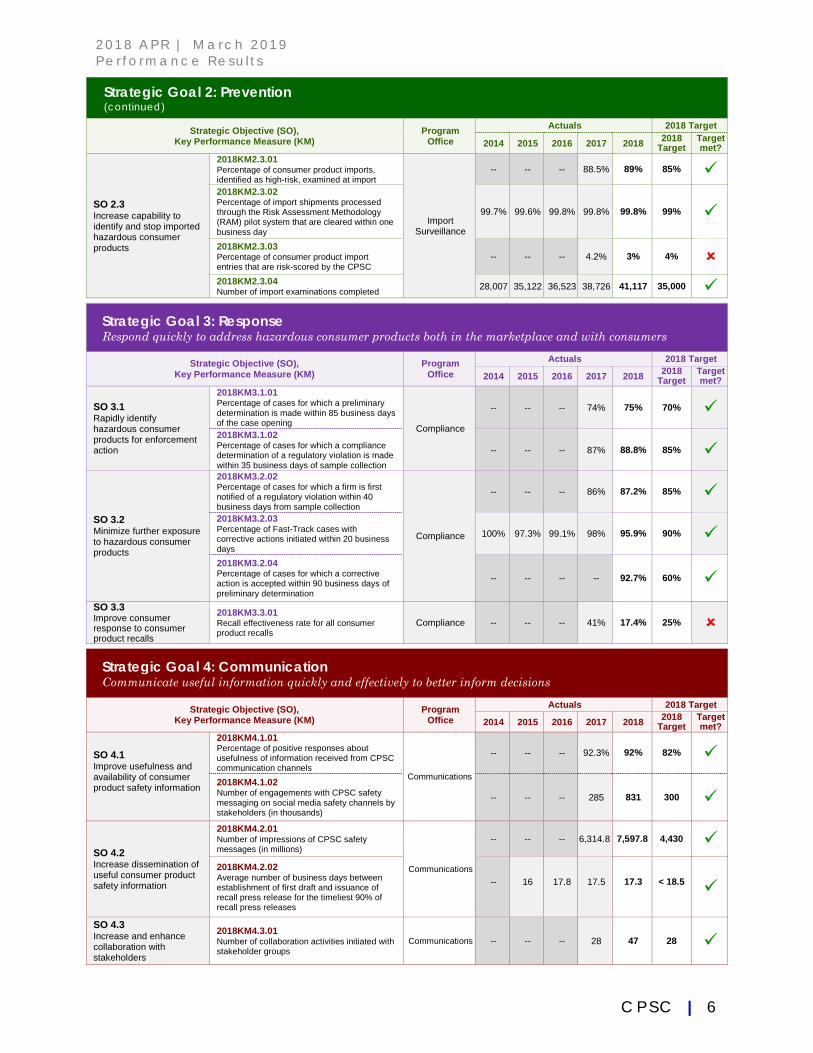
Strategic Goal 2: Prevention (continued)
Strategic Objective (SO), Key Performance Measure (KM)
Program Office
Actuals 2018 Target 2014 2015 2016 2017 2018 2018
Target Target met?
SO 2.3 Increase capability to identify and stop imported hazardous consumer products
2018KM2.3.01 Percentage of consumer product imports, identified as high-risk, examined at import
Import Surveillance
-- -- -- 88.5% 89% 85% 2018KM2.3.02 Percentage of import shipments processed through the Risk Assessment Methodology (RAM) pilot system that are cleared within one business day
99.7% 99.6% 99.8% 99.8% 99.8% 99%
2018KM2.3.03 Percentage of consumer product import entries that are risk-scored by the CPSC
-- -- -- 4.2% 3% 4% 2018KM2.3.04 Number of import examinations completed 28,007 35,122 36,523 38,726 41,117 35,000
Strategic Goal 3: Response Respond quickly to address hazardous consumer products both in the marketplace and with consumers
Strategic Objective (SO), Key Performance Measure (KM)
Program Office
Actuals 2018 Target 2014 2015 2016 2017 2018 2018
Target Target met?
SO 3.1 Rapidly identify hazardous consumer products for enforcement action
2018KM3.1.01 Percentage of cases for which a preliminary determination is made within 85 business days of the case opening Compliance
-- -- -- 74% 75% 70% 2018KM3.1.02 Percentage of cases for which a compliance determination of a regulatory violation is made within 35 business days of sample collection
-- -- -- 87% 88.8% 85%
SO 3.2 Minimize further exposure to hazardous consumer products
2018KM3.2.02 Percentage of cases for which a firm is first notified of a regulatory violation within 40 business days from sample collection
Compliance
-- -- -- 86% 87.2% 85% 2018KM3.2.03 Percentage of Fast-Track cases with corrective actions initiated within 20 business days
100% 97.3% 99.1% 98% 95.9% 90% 2018KM3.2.04 Percentage of cases for which a corrective action is accepted within 90 business days of preliminary determination
-- -- -- -- 92.7% 60%
SO 3.3 Improve consumer response to consumer product recalls
2018KM3.3.01 Recall effectiveness rate for all consumer product recalls
Compliance -- -- -- 41% 17.4% 25%
Strategic Goal 4: Communication Communicate useful information quickly and effectively to better inform decisions
Strategic Objective (SO), Key Performance Measure (KM)
Program Office
Actuals 2018 Target 2014 2015 2016 2017 2018 2018
Target Target met?
SO 4.1 Improve usefulness and availability of consumer product safety information
2018KM4.1.01 Percentage of positive responses about usefulness of information received from CPSC communication channels
Communications
-- -- -- 92.3% 92% 82% 2018KM4.1.02 Number of engagements with CPSC safety messaging on social media safety channels by stakeholders (in thousands)
-- -- -- 285 831 300
SO 4.2 Increase dissemination of useful consumer product safety information
2018KM4.2.01 Number of impressions of CPSC safety messages (in millions)
Communications
-- -- -- 6,314.8 7,597.8 4,430 2018KM4.2.02 Average number of business days between establishment of first draft and issuance of recall press release for the timeliest 90% of recall press releases
--
16
17.8
17.5
17.3
< 18.5
SO 4.3 Increase and enhance collaboration with stakeholders
2018KM4.3.01 Number of collaboration activities initiated with stakeholder groups
Communications -- -- -- 28 47 28
2 0 1 8 AP R | M a r c h 2 0 1 9 P e r f o r m a n c e R e s u l t s
C P S C | 7
Performance Summary by Strategic Goal
Strategic Goal 1: Workforce Cultivate the most effective consumer product safety workforce
Challenges Having a highly trained, diverse, and engaged workforce is critical to meeting the dynamic challenges of the consumer product safety landscape and to achieving the CPSC’s life-saving mission. Agency staff’s knowledge about product safety, commitment to the agency’s mission, and “can-do” attitude make achieving the CPSC mission possible. The CPSC formulated the Strategic Plan to address the following key Workforce challenges:
• Having a workforce with the knowledge, skills, and abilities to meet new, innovative, and emerging product safety challenges;
• Aligning personnel resources to agency priorities; • Maintaining a global presence to address global marketplace issues; • Increasing employee engagement; and • Strengthening knowledge transfer through succession planning. Strategies
The CPSC’s approach to cultivating an effective workforce involves enhancing human capital planning and alignment, increasing opportunities for professional development, and improving recruitment strategies to attract talented, diverse, and committed staff. The strategy also emphasizes increasing employee engagement by promoting and rewarding staff innovation and creativity, increasing managers’ commitment to fostering employee engagement in the workplace, and promoting a healthy work-life balance.
Table 1 Strategic Objective (SO) / Key Performance Measure (KM) Actuals / Trend line 2018 Target
SO 1.1 Enhance effective strategic human capital planning and alignment
2018KM1.1.02 Percentage of full-time equivalents (FTEs) utilized
2014 2015 2016 2017 2018 2018 Target
Target met?
-- -- -- -- 97% 95% SO 1.2 Foster a culture of continuous development
2018KM1.2.01 Percentage of employees satisfied with opportunities to improve their skills (as reported in the Federal Employee Viewpoint Survey)
2014 2015 2016 2017 2018 2018 Target
Target met?
-- -- -- 72.5% 68.1% 73% SO 1.3 Attract and recruit a talented and diverse workforce
2018KM1.3.01 Percentage of hiring managers trained on recruitment
2014 2015 2016 2017 2018 2018 Target
Target met?
-- -- -- 56.1% 82.6% 75% SO 1.4 Increase employee engagement
2018KM1.4.01 Federal Employee Viewpoint Survey Employee Engagement Index Score
2014 2015 2016 2017 2018 2018 Target
Target met?
-- 66% 70% 73% 69%
74%
Figure 4: A snapshot of Strategic Goal 1 performance measures (4 total)
2 0 1 8 AP R | M a r c h 2 0 1 9 P e r f o r m a n c e R e s u l t s
C P S C | 8
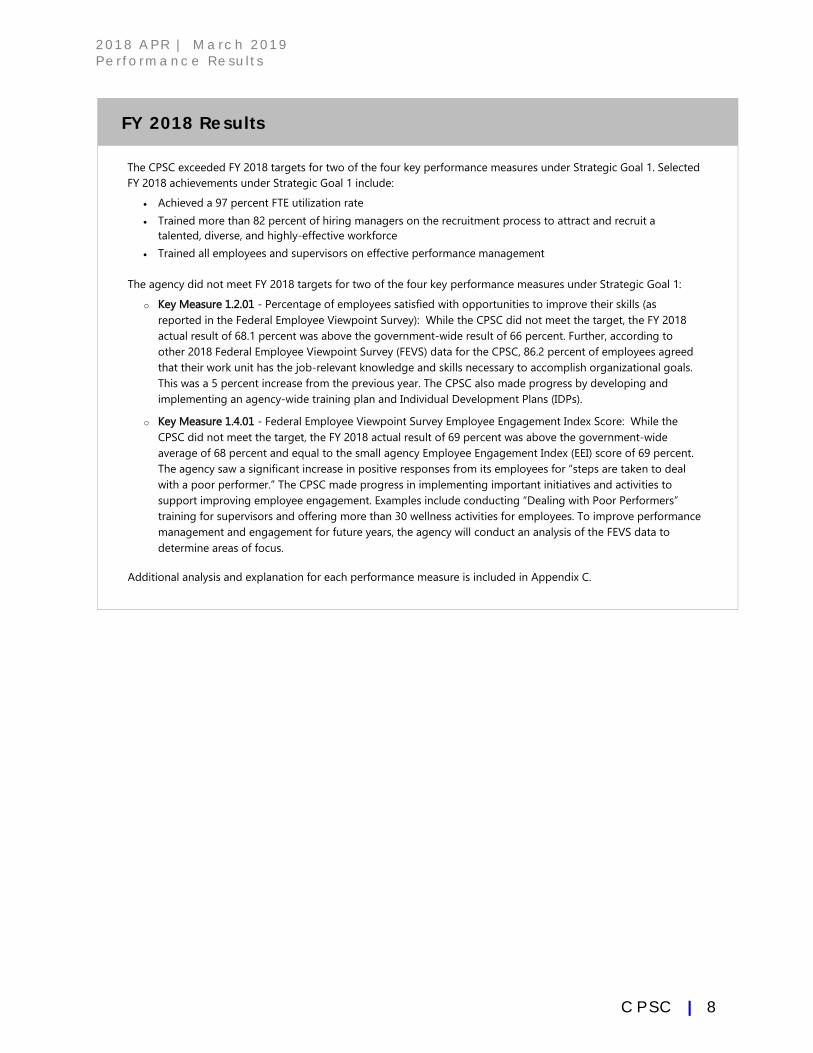
FY 2018 Results
The CPSC exceeded FY 2018 targets for two of the four key performance measures under Strategic Goal 1. Selected FY 2018 achievements under Strategic Goal 1 include:
• Achieved a 97 percent FTE utilization rate • Trained more than 82 percent of hiring managers on the recruitment process to attract and recruit a
talented, diverse, and highly-effective workforce
• Trained all employees and supervisors on effective performance management
The agency did not meet FY 2018 targets for two of the four key performance measures under Strategic Goal 1:
o Key Measure 1.2.01 - Percentage of employees satisfied with opportunities to improve their skills (as reported in the Federal Employee Viewpoint Survey): While the CPSC did not meet the target, the FY 2018 actual result of 68.1 percent was above the government-wide result of 66 percent. Further, according to other 2018 Federal Employee Viewpoint Survey (FEVS) data for the CPSC, 86.2 percent of employees agreed that their work unit has the job-relevant knowledge and skills necessary to accomplish organizational goals. This was a 5 percent increase from the previous year. The CPSC also made progress by developing and implementing an agency-wide training plan and Individual Development Plans (IDPs).
o Key Measure 1.4.01 - Federal Employee Viewpoint Survey Employee Engagement Index Score: While the CPSC did not meet the target, the FY 2018 actual result of 69 percent was above the government-wide average of 68 percent and equal to the small agency Employee Engagement Index (EEI) score of 69 percent. The agency saw a significant increase in positive responses from its employees for “steps are taken to deal with a poor performer.” The CPSC made progress in implementing important initiatives and activities to support improving employee engagement. Examples include conducting “Dealing with Poor Performers” training for supervisors and offering more than 30 wellness activities for employees. To improve performance management and engagement for future years, the agency will conduct an analysis of the FEVS data to determine areas of focus.
Additional analysis and explanation for each performance measure is included in Appendix C.
2 0 1 8 AP R | M a r c h 2 0 1 9 P e r f o r m a n c e R e s u l t s
C P S C | 9
Strategic Goal 2: Prevention Prevent hazardous products from reaching consumers Challenges The CPSC is charged with protecting the public from unreasonable risks of injury and death from a vast array of consumer products supplied through expanding global markets. Efforts to increase manufacturing of safe consumer products, combined with improved mechanisms to identify hazardous products before they enter the marketplace, are the most effective ways to prevent hazardous products from reaching consumers. The CPSC formulated the Strategic Plan to address the following key challenges to Prevention of consumer product-related injuries, including:
• Providing surveillance for the myriad consumer products imported and domestically manufactured under the CPSC’s jurisdiction;
• Advancing data analysis and research capabilities to identify existing and potential emerging consumer product hazards that pose the greatest risks;
• Addressing changes in traditional manufacturing methods, such as additive manufacturing using 3-D printers, and e-commerce sales and distribution options;
• Working with affected stakeholders to address product hazards and product hazards resulting from new technologies;
• Helping develop voluntary standards and adopting mandatory regulations; and
• Identifying, researching, and informing the public about chemical or chronic hazards in consumer products.
Strategies The CPSC uses several means to try to prevent injury or harm from consumer products by: (1) working at the national and international level to help ensure that hazards are appropriately addressed by voluntary standards or mandatory regulations; (2) providing technical information to industry to support voluntary standards development; and (3) allocating inspection, surveillance, and enforcement resources effectively to identify and remove hazardous products from the marketplace.
Table 2
Strategic Objective (SO) / Key Performance Measure (KM) Actuals / Trend line 2018 Target
SO 2.1 Improve identification and assessment of hazards to consumers
2018KM2.1.01 Percentage of consumer product-related incident reports warranting follow-up actions
2014 2015 2016 2017 2018 2018 Target
Target met?
-- -- -- 25% 26% 25%
2018KM2.1.02 Number of hazard characterization annual reports completed on consumer product-related fatalities, injuries, and/or losses for specific hazards
2014 2015 2016 2017 2018 2018 Target
Target met?
10 10 11 11 10
11
Figure 5: A snapshot of Strategic Goal 2 performance measures (14 total)
2 0 1 8 AP R | M a r c h 2 0 1 9 P e r f o r m a n c e R e s u l t s
C P S C | 1 0
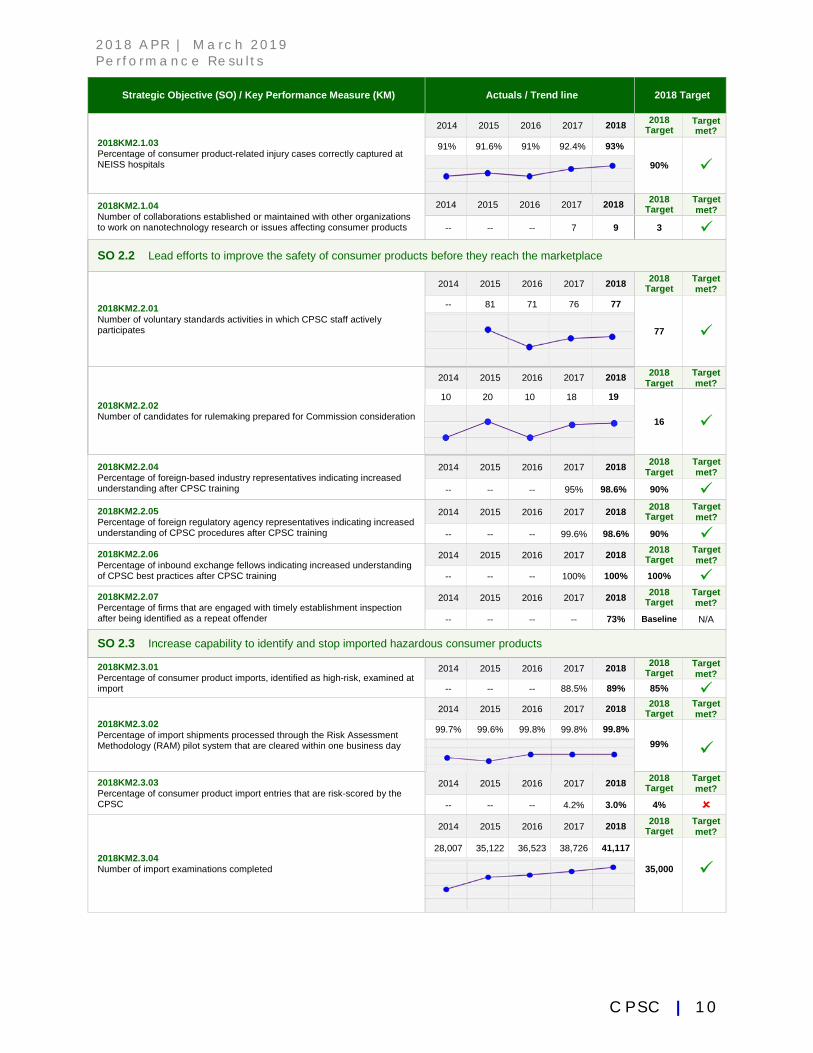
Strategic Objective (SO) / Key Performance Measure (KM) Actuals / Trend line 2018 Target
2018KM2.1.03 Percentage of consumer product-related injury cases correctly captured at NEISS hospitals
2014 2015 2016 2017 2018 2018 Target
Target met?
91% 91.6% 91% 92.4% 93%
90%
2018KM2.1.04 Number of collaborations established or maintained with other organizations to work on nanotechnology research or issues affecting consumer products
2014 2015 2016 2017 2018 2018 Target
Target met?
-- -- -- 7 9 3
SO 2.2 Lead efforts to improve the safety of consumer products before they reach the marketplace
2018KM2.2.01 Number of voluntary standards activities in which CPSC staff actively participates
2014 2015 2016 2017 2018 2018 Target
Target met?
-- 81 71 76 77
77
2018KM2.2.02 Number of candidates for rulemaking prepared for Commission consideration
2014 2015 2016 2017 2018 2018 Target
Target met?
10 20 10 18 19
16
2018KM2.2.04 Percentage of foreign-based industry representatives indicating increased understanding after CPSC training
2014 2015 2016 2017 2018 2018 Target
Target met?
-- -- -- 95% 98.6% 90% 2018KM2.2.05 Percentage of foreign regulatory agency representatives indicating increased understanding of CPSC procedures after CPSC training
2014 2015 2016 2017 2018 2018 Target
Target met?
-- -- -- 99.6% 98.6% 90% 2018KM2.2.06 Percentage of inbound exchange fellows indicating increased understanding of CPSC best practices after CPSC training
2014 2015 2016 2017 2018 2018 Target
Target met?
-- -- -- 100% 100% 100% 2018KM2.2.07 Percentage of firms that are engaged with timely establishment inspection after being identified as a repeat offender
2014 2015 2016 2017 2018 2018 Target
Target met?
-- -- -- -- 73% Baseline N/A
SO 2.3 Increase capability to identify and stop imported hazardous consumer products
2018KM2.3.01 Percentage of consumer product imports, identified as high-risk, examined at import
2014 2015 2016 2017 2018 2018 Target
Target met?
-- -- -- 88.5% 89% 85% 2018KM2.3.02 Percentage of import shipments processed through the Risk Assessment Methodology (RAM) pilot system that are cleared within one business day
2014 2015 2016 2017 2018 2018 Target
Target met?
99.7% 99.6% 99.8% 99.8% 99.8%
99% 2018KM2.3.03 Percentage of consumer product import entries that are risk-scored by the CPSC
2014 2015 2016 2017 2018 2018 Target
Target met?
-- -- -- 4.2% 3.0% 4%
2018KM2.3.04 Number of import examinations completed
2014 2015 2016 2017 2018 2018 Target
Target met?
28,007 35,122 36,523 38,726 41,117
35,000
2 0 1 8 AP R | M a r c h 2 0 1 9 P e r f o r m a n c e R e s u l t s
C P S C | 1 1
FY 2018 Results
For FY 2018, the CPSC tracked 14 key performance measures under Strategic Goal 2. Of the 13 performance measures with established targets for FY 2018, the CPSC met or exceeded targets for 11 measures. One additional measure was designated as “baseline” and did not have a FY 2018 performance target. Selected FY 2018 achievements under Strategic Goal 2 include:
• Screened more than 41,000 different imported consumer products at U.S. ports of entry
• Collaborated with manufacturers and other stakeholders to improve the safety of products with advanced technology, including Internet of Things (IoT), wearable, and high-energy battery-focused products. Conducted an informative public hearing on IoT safety issues and hazards in May 2018. Also collaborated on safety information and standards with the Battery Safety Council, the Lithium Battery Interagency Coordination Group, CTIA (which represents the U.S. wireless communications industry), industry groups, and voluntary standards developers. Published a report on work on high-energy battery-related work in February 2018.
• Actively participated in 77 voluntary standards activities, collaborating with industry leaders, consumer advocates, and other stakeholders to improve consensus voluntary standards across a wide range of consumer products
• Exhibited, conducted training, and met with hundreds of toy industry visitors at the 2018 Hong Kong Toy and Games Fair. The Fair was the largest toy industry event in Asia and the second largest in the world, with 121 countries represented, 2,000 exhibitors, and more than 45,000 buyers. The CPSC’s training session at the Fair, which was attended by more than 75 toy manufacturers and suppliers, focused on critical toy safety issues and new safety requirements.
The agency did not meet FY 2018 targets for two of the 14 key performance measures under Strategic Goal 2:
o Key Measure 2.1.02 - Number of hazard characterization annual reports completed on consumer product-related fatalities, injuries, and/or losses for specific hazards: The carbon monoxide (CO) fatality report, scheduled for completion in FY 2018, was delayed due to staffing shortages. The report was completed in the first quarter of FY 2019.
o Key Measure 2.3.03 - Percentage of consumer product import entries that are risk-scored by the CPSC: The CPSC did not meet the FY 2018 target, which was informed by baseline data that were collected in FY 2017. In FY 2018, however, the CPSC learned that those baseline data contained errors, and the target had been set with incomplete information. Also, fluctuating import volume under CPSC’s jurisdiction, which is outside agency control, greatly affects this key measure’s denominator. As such, the agency plans to discontinue this performance measure in FY 2020.
Additional analysis and explanation for each performance measure is included in Appendix C.
2 0 1 8 AP R | M a r c h 2 0 1 9 P e r f o r m a n c e R e s u l t s
C P S C | 1 2
Strategic Goal 3: Response Respond quickly to address hazardous consumer products both in the marketplace and with consumers
Challenges The CPSC learns about potential consumer product hazards from many sources, including incident reports, consumer complaints, the agency’s Hotline (1-800-638-2772), www.SaferProducts.gov, Internet reports, and company reports. Additionally, field staff investigates reports of incidents and injuries; conducts inspections of manufacturers, importers, and retailers; and identifies potential regulatory violations and product hazards. When potential product defects are identified, the CPSC must act quickly to address the most hazardous consumer products that have made their way into the marketplace or into the hands of consumers. The CPSC formulated the Strategic Plan to address the following key Response challenges:
• Addressing trends in retailing and e-commerce, such as the prevalence of online sellers or other direct manufacturer-to-consumer marketing, as well as sales through third party platform providers;
• Working within a global supply chain, which creates complex monitoring challenges; • Collecting, integrating, and analyzing data to identify high-risk hazards for appropriate action; and • Improving the monitoring and effectiveness of consumer product recalls.
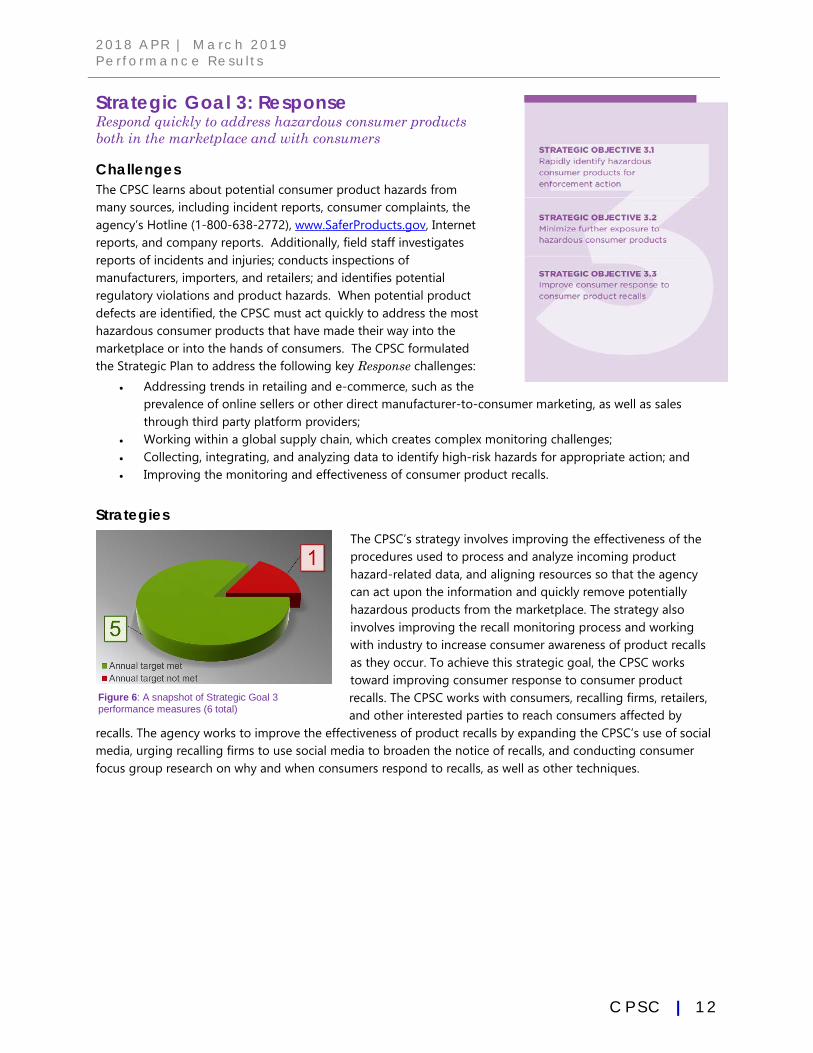
Strategies The CPSC’s strategy involves improving the effectiveness of the procedures used to process and analyze incoming product hazard-related data, and aligning resources so that the agency can act upon the information and quickly remove potentially hazardous products from the marketplace. The strategy also involves improving the recall monitoring process and working with industry to increase consumer awareness of product recalls as they occur. To achieve this strategic goal, the CPSC works toward improving consumer response to consumer product recalls. The CPSC works with consumers, recalling firms, retailers, and other interested parties to reach consumers affected by
recalls. The agency works to improve the effectiveness of product recalls by expanding the CPSC’s use of social media, urging recalling firms to use social media to broaden the notice of recalls, and conducting consumer focus group research on why and when consumers respond to recalls, as well as other techniques.
Figure 6: A snapshot of Strategic Goal 3 performance measures (6 total)
2 0 1 8 AP R | M a r c h 2 0 1 9 P e r f o r m a n c e R e s u l t s
C P S C | 1 3
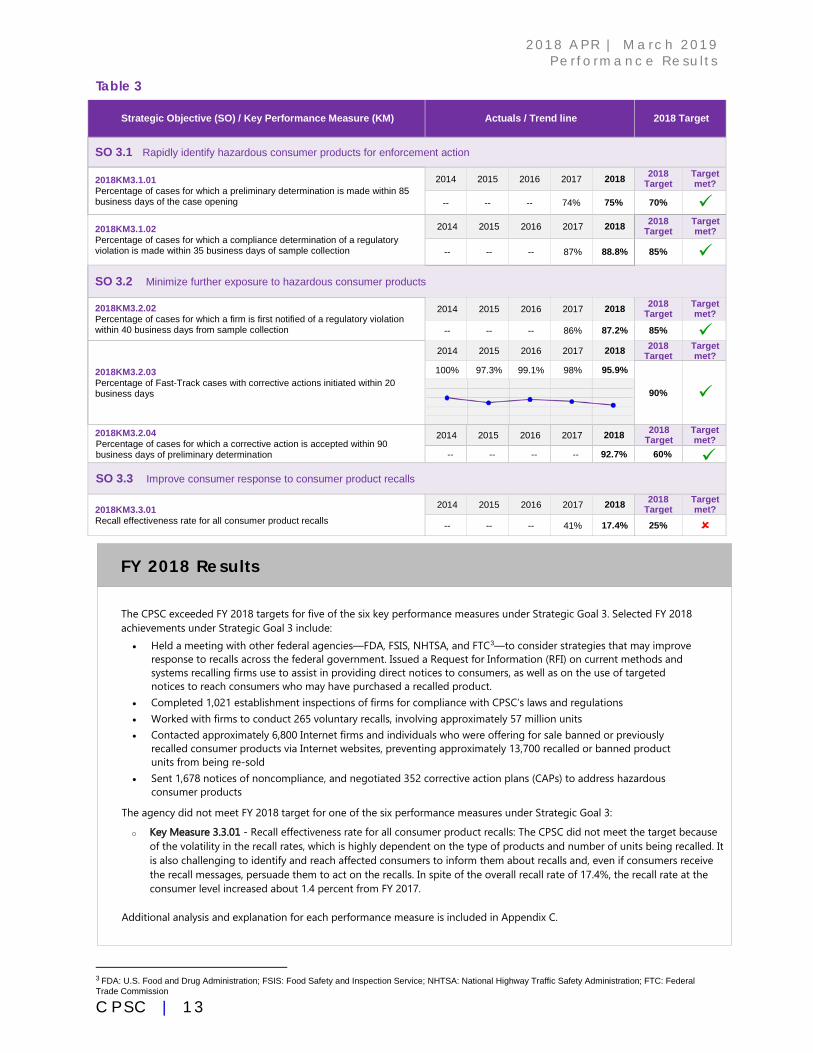
Table 3
Strategic Objective (SO) / Key Performance Measure (KM) Actuals / Trend line 2018 Target
SO 3.1 Rapidly identify hazardous consumer products for enforcement action
2018KM3.1.01 Percentage of cases for which a preliminary determination is made within 85 business days of the case opening
2014 2015 2016 2017 2018 2018 Target
Target met?
-- -- -- 74% 75% 70% 2018KM3.1.02 Percentage of cases for which a compliance determination of a regulatory violation is made within 35 business days of sample collection
2014 2015 2016 2017 2018 2018 Target
Target met?
-- -- -- 87% 88.8% 85%
SO 3.2 Minimize further exposure to hazardous consumer products
2018KM3.2.02 Percentage of cases for which a firm is first notified of a regulatory violation within 40 business days from sample collection
2014 2015 2016 2017 2018 2018 Target
Target met?
-- -- -- 86% 87.2% 85%
2018KM3.2.03 Percentage of Fast-Track cases with corrective actions initiated within 20 business days
2014 2015 2016 2017 2018 2018 Target
Target met?
100% 97.3% 99.1% 98% 95.9%
90%
2018KM3.2.04 Percentage of cases for which a corrective action is accepted within 90 business days of preliminary determination
2014 2015 2016 2017 2018 2018 Target
Target met?
-- -- -- -- 92.7% 60% SO 3.3 Improve consumer response to consumer product recalls
2018KM3.3.01 Recall effectiveness rate for all consumer product recalls
2014 2015 2016 2017 2018 2018 Target
Target met?
-- -- -- 41% 17.4% 25%
FY 2018 Results
The CPSC exceeded FY 2018 targets for five of the six key performance measures under Strategic Goal 3. Selected FY 2018 achievements under Strategic Goal 3 include:
• Held a meeting with other federal agencies—FDA, FSIS, NHTSA, and FTC3—to consider strategies that may improve response to recalls across the federal government. Issued a Request for Information (RFI) on current methods and systems recalling firms use to assist in providing direct notices to consumers, as well as on the use of targeted notices to reach consumers who may have purchased a recalled product.
• Completed 1,021 establishment inspections of firms for compliance with CPSC’s laws and regulations
• Worked with firms to conduct 265 voluntary recalls, involving approximately 57 million units
• Contacted approximately 6,800 Internet firms and individuals who were offering for sale banned or previously recalled consumer products via Internet websites, preventing approximately 13,700 recalled or banned product units from being re-sold
• Sent 1,678 notices of noncompliance, and negotiated 352 corrective action plans (CAPs) to address hazardous consumer products
The agency did not meet FY 2018 target for one of the six performance measures under Strategic Goal 3:
o Key Measure 3.3.01 - Recall effectiveness rate for all consumer product recalls: The CPSC did not meet the target because of the volatility in the recall rates, which is highly dependent on the type of products and number of units being recalled. It is also challenging to identify and reach affected consumers to inform them about recalls and, even if consumers receive the recall messages, persuade them to act on the recalls. In spite of the overall recall rate of 17.4%, the recall rate at the consumer level increased about 1.4 percent from FY 2017.
Additional analysis and explanation for each performance measure is included in Appendix C.
3 FDA: U.S. Food and Drug Administration; FSIS: Food Safety and Inspection Service; NHTSA: National Highway Traffic Safety Administration; FTC: Federal Trade Commission
2 0 1 8 AP R | M a r c h 2 0 1 9 P e r f o r m a n c e R e s u l t s
C P S C | 1 4
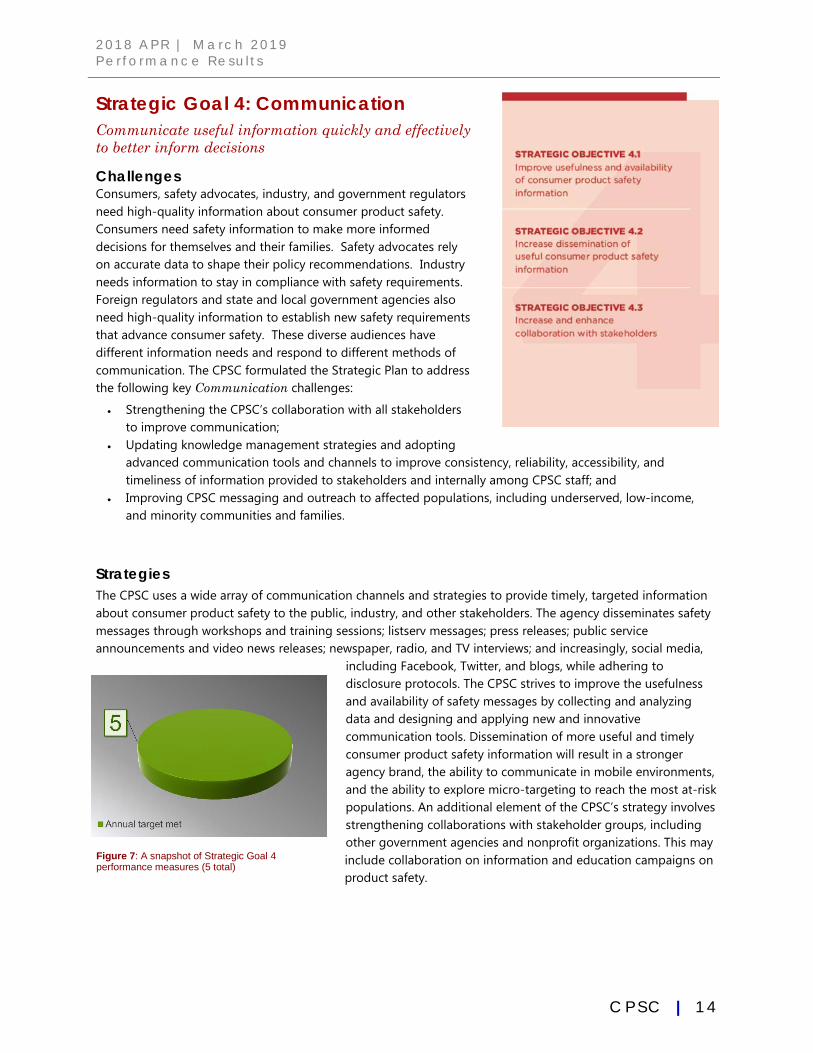
Strategic Goal 4: Communication Communicate useful information quickly and effectively to better inform decisions
Challenges Consumers, safety advocates, industry, and government regulators need high-quality information about consumer product safety. Consumers need safety information to make more informed decisions for themselves and their families. Safety advocates rely on accurate data to shape their policy recommendations. Industry needs information to stay in compliance with safety requirements. Foreign regulators and state and local government agencies also need high-quality information to establish new safety requirements that advance consumer safety. These diverse audiences have different information needs and respond to different methods of communication. The CPSC formulated the Strategic Plan to address the following key Communication challenges:
• Strengthening the CPSC’s collaboration with all stakeholders to improve communication;
• Updating knowledge management strategies and adopting advanced communication tools and channels to improve consistency, reliability, accessibility, and timeliness of information provided to stakeholders and internally among CPSC staff; and
• Improving CPSC messaging and outreach to affected populations, including underserved, low-income, and minority communities and families.
Strategies The CPSC uses a wide array of communication channels and strategies to provide timely, targeted information about consumer product safety to the public, industry, and other stakeholders. The agency disseminates safety messages through workshops and training sessions; listserv messages; press releases; public service announcements and video news releases; newspaper, radio, and TV interviews; and increasingly, social media,
including Facebook, Twitter, and blogs, while adhering to disclosure protocols. The CPSC strives to improve the usefulness and availability of safety messages by collecting and analyzing data and designing and applying new and innovative communication tools. Dissemination of more useful and timely consumer product safety information will result in a stronger agency brand, the ability to communicate in mobile environments, and the ability to explore micro-targeting to reach the most at-risk populations. An additional element of the CPSC’s strategy involves strengthening collaborations with stakeholder groups, including other government agencies and nonprofit organizations. This may include collaboration on information and education campaigns on product safety.
Figure 7: A snapshot of Strategic Goal 4 performance measures (5 total)
2 0 1 8 AP R | M a r c h 2 0 1 9 P e r f o r m a n c e R e s u l t s
C P S C | 1 5
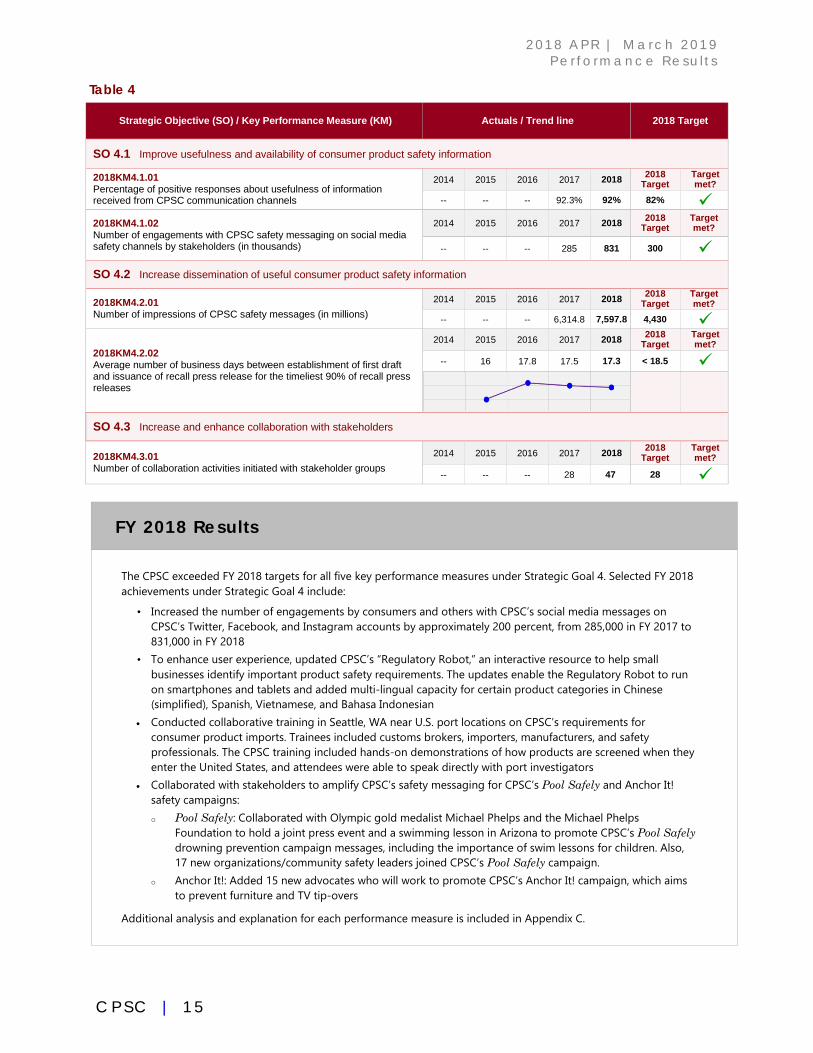
Table 4 Strategic Objective (SO) / Key Performance Measure (KM) Actuals / Trend line 2018 Target
SO 4.1 Improve usefulness and availability of consumer product safety information
2018KM4.1.01 Percentage of positive responses about usefulness of information received from CPSC communication channels
2014 2015 2016 2017 2018 2018 Target
Target met?
-- -- -- 92.3% 92% 82% 2018KM4.1.02 Number of engagements with CPSC safety messaging on social media safety channels by stakeholders (in thousands)
2014 2015 2016 2017 2018 2018 Target
Target met?
-- -- -- 285 831 300 SO 4.2 Increase dissemination of useful consumer product safety information
2018KM4.2.01 Number of impressions of CPSC safety messages (in millions)
2014 2015 2016 2017 2018 2018 Target
Target met?
-- -- -- 6,314.8 7,597.8 4,430
2018KM4.2.02 Average number of business days between establishment of first draft and issuance of recall press release for the timeliest 90% of recall press releases
2014 2015 2016 2017 2018 2018 Target
Target met?
-- 16 17.8 17.5 17.3 < 18.5
SO 4.3 Increase and enhance collaboration with stakeholders
2018KM4.3.01 Number of collaboration activities initiated with stakeholder groups
2014 2015 2016 2017 2018 2018 Target
Target met?
-- -- -- 28 47 28
FY 2018 Results
The CPSC exceeded FY 2018 targets for all five key performance measures under Strategic Goal 4. Selected FY 2018 achievements under Strategic Goal 4 include:
• Increased the number of engagements by consumers and others with CPSC’s social media messages on CPSC’s Twitter, Facebook, and Instagram accounts by approximately 200 percent, from 285,000 in FY 2017 to 831,000 in FY 2018
• To enhance user experience, updated CPSC’s “Regulatory Robot,” an interactive resource to help small businesses identify important product safety requirements. The updates enable the Regulatory Robot to run on smartphones and tablets and added multi-lingual capacity for certain product categories in Chinese (simplified), Spanish, Vietnamese, and Bahasa Indonesian
• Conducted collaborative training in Seattle, WA near U.S. port locations on CPSC’s requirements for consumer product imports. Trainees included customs brokers, importers, manufacturers, and safety professionals. The CPSC training included hands-on demonstrations of how products are screened when they enter the United States, and attendees were able to speak directly with port investigators
• Collaborated with stakeholders to amplify CPSC’s safety messaging for CPSC’s Pool Safely and Anchor It! safety campaigns:
o Pool Safely: Collaborated with Olympic gold medalist Michael Phelps and the Michael Phelps Foundation to hold a joint press event and a swimming lesson in Arizona to promote CPSC’s Pool Safely drowning prevention campaign messages, including the importance of swim lessons for children. Also, 17 new organizations/community safety leaders joined CPSC’s Pool Safely campaign.
o Anchor It!: Added 15 new advocates who will work to promote CPSC’s Anchor It! campaign, which aims to prevent furniture and TV tip-overs
Additional analysis and explanation for each performance measure is included in Appendix C.
2 0 1 8 AP R | M a r c h 2 0 1 9 O t h e r I n f o r m a t i o n
C P S C | 1 6
Agency Priorities & Management Challenges
Agency Priority: Focus on Risk The CPSC will prioritize its resources on the products with the highest consumer product safety risks. The CPSC will accomplish this by using data to guide decisions and policy; working with standards development organizations to develop voluntary standards; assessing mandatory standard-setting activities; and revisiting the efficacy of existing regulations, when necessary. To advance data-based decision making, the CPSC will invest in analytical tools and technology and expand its data sources.
Agency Priority: Import Surveillance The CPSC will continue to support import surveillance by operating, maintaining, and developing the Risk Assessment Methodology (RAM) system to identify and stop noncompliant imported products from entering the U.S. marketplace. The CPSC will accomplish this by allocating full-time staff to conduct inspections and clear compliant cargo quickly at the highest-volume ports of entry, and by analyzing the ways in which e-commerce is evolving the global supply chain.
Agency Priority: Collaboration, Education, and Outreach The CPSC will emphasize collaboration, education, and outreach by engaging all stakeholders through forums, advisory groups, seminars, webinars, technical stakeholder-to-government discussions,
and workshops. In addition, the CPSC will continue to emphasize and expand the work of the agency’s Small Business Ombudsman, use information and insight gained from workshops (e.g., Recall Effectiveness and Internet of Things [IoT]), proactively engage industry and international stakeholders at all levels, and provide information and education to consumers to enable informed decision making. The CPSC will collaborate with other federal agencies and industry through research and sharing data to leverage the broader stakeholder community to advance consumer product safety.
Agency Priority: Data-Driven
The CPSC will seek to expand the data analysis tools, sources, and types of analysis used to identify and assess hazards and inform solutions to address them. The CPSC will accomplish this by augmenting analytical and trend-assessment protocols and making better use of retailer reports. These efforts will expand and improve the CPSC’s capabilities to identify and analyze emerging hazards and reinforce the data-driven nature of the agency’s work.
Management Challenges Management challenges identified by the CPSC’s Inspector General are detailed on pp. 56–64 of the FY 2018 Agency Financial Report (AFR), which can be found at: www.cpsc.gov/about-cpsc/agency-reports/performance-and-budget.
2 0 1 8 AP R | M a r c h 2 0 1 9 O t h e r I n f o r m a t i o n
C P S C | 1 7
Cross-Agency Collaboration
Collaboration with CDC and other Federal Agencies on Data Collection through NEISS The CPSC collaborates with several federal agencies to collect information about injuries treated in hospital emergency rooms through the National Electronic Injury Surveillance System (NEISS). This unique system provides statistically valid national estimates of injuries from a probability sample of hospital emergency rooms. Because NEISS includes data on consumer product-related injuries, it provides a critically important component of the CPSC’s data-driven approach to identifying emerging trends and consumer product hazards. NEISS data are available to anyone with an Internet connection at: www.cpsc.gov/en/research--statistics/NEISS-injury-data.
The CPSC has also collaborated with other federal agencies to collect data through NEISS on additional injuries not related to consumer products. FY 2018 examples include:
• Centers for Disease Control and Prevention (CDC): The CPSC collaborated with the CDC to collect additional CDC-defined data on non-consumer product-related injuries through NEISS. These comprehensive data on all trauma-related injuries (not just consumer product-related injuries) make up the nonfatal injury data component of the CDC’s Web-based Injury Statistics Query and Reporting System4 (WISQARS),TM an interactive, online database used by researchers, public health professionals, and the public.
• National Center for Injury Prevention and Control (NCIPC): The CPSC collaborated with NCIPC, a sub-agency of CDC, to conduct special NEISS studies of data on nonfatal injuries associated with interpersonal violence and assaults, firearms, and self-inflicted violence.
• National Institute for Occupational Safety and Health (NIOSH): The CPSC collaborated with NIOSH, a sub-agency of CDC, to collect data on nonfatal occupational injuries through NEISS.
4 www.cdc.gov/injury/wisqars/index.html
The data can be accessed through NIOSH’s online database—Work-Related Injury Statistics Query System (Work-RISQS).5
• National Highway Traffic Safety Administration (NHTSA): The CPSC collaborated with NHTSA to collect data on non-crash injuries through NEISS.
Collaboration with CBP on Import Surveillance The CPSC has collaborated successfully with U.S. Customs and Border Protection (CBP) to improve surveillance and screening of imported consumer products. Section 222 of the CPSIA directed the CPSC to create a Risk Assessment Methodology (RAM) to identify products imported into the United States that are most likely to violate consumer product safety statutes and regulations or that contain a defect that constitutes a substantial product hazard. The CPSC uses a RAM system, which integrates data collected by CBP with data used in CPSC systems, to identify high-risk imports that might violate a CPSC statute or regulation. The CPSC has port investigators that are stationed at U.S. ports of entry to identify and interdict noncompliant consumer products from entering the United States; the CPSC investigators are co-located with CBP officers at the ports. In addition, the CPSC collaborates with CBP at the Commercial Targeting and Analysis Center (CTAC), which serves as a central location for coordinating targeting efforts with CBP in support of agency enforcement plans.
Collaboration with NNCO, EPA, and NIOSH on Nanotechnology In FY 2018, the CPSC continued collaboration with other federal agencies on nanotechnology research. After more than a decade of sustained international investment of many billions of dollars, nanotechnology research and development (R&D) is rapidly being commercialized into consumer products, including products for children. There is a critical need for focused research on consumer product applications of nanomaterials and their potential risks to consumers.
5 wwwn.cdc.gov/wisards/workrisqs
2 0 1 8 AP R | M a r c h 2 0 1 9 O t h e r I n f o r m a t i o n
C P S C | 1 8
National Nanotechnology Initiative (NNI)
The CPSC has been involved in a number of specific collaborative activities with the U.S. federal government’s NNI. Given the CPSC’s size and budget, partnering has been a key element to achieving mission success.
• NNCO: In FY 2018, the CPSC continued its collaboration on nanotechnology with the National Nanotechnology Coordination Office (NNCO), the primary point of contact for the NNI. The CPSC’s collaborative activities have produced more than 40 reports and publications, as well as voluntary standards resulting from CPSC-funded research that addresses nanomaterial hazards in consumer products.
3-D Printing
The CPSC has collaborated with the U.S. Environmental Protection Agency (EPA) and NIOSH to address potential health risks associated with the use of emerging 3-D printing technology to manufacture consumer products. Technical improvements and cost reductions have made 3-D printing technology more widely available, and it can be used to manufacture products for children and the home. However, printing filaments used in certain 3-D printers contain nanomaterials. The CPSC collaborated with the following agencies in FY 2018 to study potential health hazards associated with nanomaterials in 3-D printing filaments:
• EPA: The CPSC established an Interagency Agreement (IAA) with the EPA to conduct research to provide quantitative information on the composition and release of organic and inorganic chemicals and materials from printer filaments, waste, and printed objects.
• NIOSH: The CPSC established an IAA with NIOSH to conduct a study on the effects of printer emissions on pulmonary and/or cardiovascular function.
6 www.poolsafely.gov/about-us/grants-vgbfy18
Collaboration with Federal Agencies on Shared Services Shared Services in FY 2018: The CPSC’s operating model is designed around the use of shared services to lower costs, improve service delivery, and benefit from economies of scale not necessarily available to a small agency. The CPSC leveraged the following shared services in FY 2018:
• Financial Management System and Operations: Financial accounting system (Oracle) and accounting services from the Enterprise Services Center (ESC) of the U.S. Department of Transportation (DOT)
• Payroll: Payroll and related human resource (HR) system services from the U.S. Department of the Interior (DOI)
• Acquisition: Supplementary procurement operating capacity from the Program Support Center (PSC) of the U.S. Department of Health and Human Services (HHS)
• Grants Management: Grants management services from the Denali Commission to manage the Pool Safely Grant Program6 (PSGP), in accordance with the Virginia Graeme Baker Pool and Spa Safety Act (VGB Act)
• Information Systems Security Line of Business (ISSLoB) Services: ISSLoB services, as part of continued implementation of OMB’s 2005 ISSLoB initiative from the U.S. Department of Justice (DOJ) (one of OMB’s designated Shared Services Centers [SSC] for ISSLoB Certification and Accreditation [C&A] services)
• Federal Information Security Management Act (FISMA) Requirements: Security Assessment and Authorization (SA&A) services from DOI for the CPSC’s information systems, as part of compliance with FISMA
• Federal Docket Management System (FDMS): Shared services from the EPA for implementation, use, operation, and management of the FDMS. The FDMS is the centralized electronic docket management system for federal agency users. It services a wide array of routinely performed regulatory activities to the public through www.Regulations.gov, which is the publicly
2 0 1 8 AP R | M a r c h 2 0 1 9 O t h e r I n f o r m a t i o n
C P S C | 1 9
facing website of FDMS that offers citizens the opportunity to search, view, download, and submit comments on federal notices and rules.
Shared Services in FY 2019: In FY 2018, the CPSC established an IAA with the U.S. Department of the Treasury’s Administrative Resource Center (ARC) within the Bureau of the Fiscal Service. The IAA will replace agreements for the following shared services leveraged by the CPSC in FY 2018:
• Financial Management System and Operations – Financial accounting systems (Oracle) and accounting services provided by ESC
• Payroll – Payroll and related HR system services provided by DOI
• Acquisition – Supplementary procurement operating capacity provided by HHS
The shared services will be deployed by ARC during FY 2019. The CPSC expects this replacement shared services agreement, when fully implemented, to result in cost savings totaling more than $3 million over 5 years.
2 0 1 8 AP R | M a r c h 2 0 1 9 O t h e r I n f o r m a t i o n
C P S C | 2 0
Evaluation and Research
Key Performance Measures The CPSC has identified a core set of 29 key performance measures that describe progress in implementing the Strategic Plan. The key performance measures are tools for monitoring and reporting progress toward the agency’s strategic goals and strategic objectives, and they facilitate using evidence in agency management and resource decisions. The key performance measures are supplemented by additional operating performance measures, which track lower-level project and program outcomes and outputs, and are used for internal management and decision-making. Additional internal milestones are set and monitored to track implementation progress.
Strategic Data Review Meetings The CPSC implements a number of different mechanisms to review financial and performance information and to manage programs during the fiscal year. The Office of the Chief Financial Officer (CFO) produces a monthly report for senior managers’ use, which summarizes the status of the agency’s financial resources and human capital. Financial data presented in the report include the current fiscal year’s annual funding level, cumulative allowances, cumulative funds obligated, and expended obligations, as well as information on onboard staffing levels. Another helpful agency practice has been conducting a Mid-Year review process, during which the annual operating budget and program plans are examined for potential adjustments, based on new information or emerging priorities of the agency.
The agency also conducts periodic Strategic Data Reviews (SDRs). The SDRs are strategic, data-driven planning and performance progress reviews attended by the CPSC’s senior managers. The SDRs provide a forum for managers to focus on annual planning to achieve performance goals and strategic objectives, as well as to refresh program priorities and funding requirements. Forward-looking planning decisions are informed by assessment of progress toward performance measure targets and achievement of agency performance goals and strategic objectives, as well as review of relevant evaluation information. Managers discuss constraints or problems, and
identify any needed modifications to programs going forward. Program risks are also discussed, and mitigation strategies are developed.
Evaluation and Research The CPSC uses research, analysis, and program assessments to make informed management decisions, drive improvements in program delivery and effectiveness, and update future strategies and program formulation. The CPSC’s Office of the Inspector General (OIG) conducts audits, evaluations, reviews, and investigations relating to the agency’s programs and operations. The U.S. Government Accountability Office (GAO) also conducts performance audits and analyses, and makes recommendations to help improve the CPSC’s practices, policies, and programs. In addition, the CPSC performs targeted reviews of internal controls to determine if processes should be modified to strengthen and improve operations. Finally, the CPSC conducts research and reviews and assesses the effectiveness and efficiency of specific programs supporting the strategic goals in the Strategic Plan as appropriate. Examples include the following:
“Anchor It!” Survey: In FY 2018, the CPSC initiated work on a survey to evaluate the effectiveness of the “Anchor It!” national public education campaign. The campaign is intended to provide public safety messaging and outreach to increase consumer awareness of actions consumers can take in their homes to prevent child deaths and injuries due to furniture and TV tip-overs. Pending OMB approval, the survey will involve a highly-varied national sample of at least 600 consumers.
Recall Monitoring Casework Review: In FY 2018, the CPSC conducted an analysis of casework activity associated with consumer product recalls and the Corrective Action Plan (CAP) monitoring process. This review of the recall process was undertaken in attempt to streamline efforts, achieve operational efficiencies, and address priority recalls. The review resulted in the establishment of a new process to triage incoming reports and identified areas of improvement for current processes.
E-filing Study: In FY 2017, the CPSC completed a pilot e-filing study that involved working closely
2 0 1 8 AP R | M a r c h 2 0 1 9 O t h e r I n f o r m a t i o n
C P S C | 2 1
with volunteer importers and CBP to develop and test processes and procedures for handling electronic filing data that could potentially enhance the CPSC’s targeting of noncompliant and hazardous consumer product imports. The next phase of the e-filing project, the Certificate of Compliance Study, was completed in FY 2018. The Certificate Study found that shipments where a certificate of compliance did not accompany the shipment or was not provided within a timely manner were much more likely to be noncompliant. The study also found that certain data contained on certificates of compliance may be useful for targeting and enforcement efforts if made available before importation. Results of the study indicate that the CPSC’s electronic collection of routine data from importers, in advance of importation, may enable the agency to improve its targeting and enforcement at ports and better protect consumers.7
E-commerce Study: In FY 2018, the agency initiated research on defining the scope of e-commerce with respect to CPSC’s jurisdiction and mission. With the rapid expansion of the digital marketplace, there has been a significant global shift from the traditional consumer product distribution chain (e.g., retail stores) to an e-commerce platform. Results from the e-commerce evaluative study will help inform potential development of protocols that could achieve more effective identification, enforcement, and deterrence of trade violations in the e-commerce environment.
Human Factors-Related Research: As a data-driven agency, the CPSC strives to improve the quality and specificity of hazard information and improve analytic capabilities. When appropriate, the CPSC conducts research on how consumers actually use or interact with specific products, to better understand exposure to safety hazards. Information from these research efforts, which can include consumer surveys, contributes to work on development of product safety standards.
• A recent example is a national survey to learn more about young children’s potential exposure to chemical and mechanical safety hazards on playgrounds that have surfacing material made
from recycled tires. This research project has been underway since FY 2017 and is expected to be completed in FY 2019.
• Another example is the CPSC’s use of data on human strength to inform the agency’s activities related to consumer products that are intended for children. In FY 2018, the agency initiated a Child Strength Study, a multiyear research effort to update and expand CPSC’s current data on strength of children of ages 0 to 5 years old.
Cost of Injury Calculation: In FY 2018, the agency initiated work to explore the possibility of using data from the Medical Expenditure Panel Survey (MEPS)8 to assign dollar values to the lost quality of life caused by injuries. The estimates would be based on multiple years of data from the Household Questionnaire section of the MEPS and could potentially be used to measure the degree to which survey respondents’ everyday activities and physical and mental conditions are affected by injuries. The final report is expected by FY 2020. Results from the report will contribute to CPSC’s rulemaking activities. If successful, this task would provide a more up-to-date valuation method aligned with current practices in regulatory analysis.
The CPSC is committed to using the findings from research and evaluation to improve programs and strategies, and make progress toward strategic goals and strategic objectives.
Importance of Data and Evidence in Determining Program Priorities As a data-driven agency, the CPSC regularly collects and analyzes a wide range of data from multiple sources that is relevant to its mission. The CPSC uses that information to shape program strategies and select priorities. For example, the CPSC systematically reviews and analyzes data on injury and death incidents related to consumer products to develop the CPSC’s hazard-mitigation strategies. The CPSC receives data from NEISS, death certificates, Medical Examiner and Coroners Alert Project (MECAP) reports, incident reports, and www.SaferProducts.gov.
7 U.S. Consumer Product Safety Commission (2018, August 28). eFiling Certificate of Compliance Study Assessment. Retrieved from www.cpsc.gov/s3fs-public/eFiling-Certificate-Study-Evaluation-Report-FINAL.pdf?dP0Vwp55DJO.iSQIBsPqTg07umCLIcKr
8 The MEPS is a survey conducted by the Agency for Healthcare Research and Quality (AHRQ), which is one of the 12 agencies within the HHS.
2 0 1 8 AP R | M a r c h 2 0 1 9 A p p e n d i c e s
C P S C | 2 2
Appendix A CPSC Performance: Data Limitations, Verification & Validation
Verification & Validation of Performance Data The CPSC requires complete, accurate, and reliable performance data to assess agency progress toward its strategic objectives and performance goals, and to make good management decisions. The CPSC’s approach to verification and validation (V&V) of performance data, intended to improve accuracy and reliability, is based upon the following:
(1) The agency develops performance measures through its strategic planning and annual performance planning processes.
(2) The CPSC’s functional components follow a standard reporting procedure to document detailed information for each performance measure in an internal agency database. This information includes, but is not limited to:
• performance measure definition • rationale for the performance measure • source of the data • data collection and computation methods • data limitations
(3) The agency’s functional components are responsible for assessing the completeness, consistency, timeliness, and quality of the data for their key performance measures, as well as identifying any data limitations. Managers of major functional components responsible for reporting key measures certify that procedures for ensuring performance data quality have been followed, and that the reported results are reasonably complete, accurate, and reliable.
(4) In addition to the self-assessments and certification statements completed by functional components, year-end results for key performance measures are reviewed by the
Office of Financial Management, Planning, and Evaluation (EXFM) and approved by management before they are published in agency documents. Furthermore, EXFM also conducts an in-depth V&V review of each key performance measure within a 2-year cycle, following established operating procedures. In FY 2018, EXFM independently assessed 15 key performance measures out of 29 from across the agency’s functional components for quality and accuracy of the year-end reported performance results.
(5) The CPSC also conducts periodic Strategic Data Review (SDR) meetings, where managers of major functional components analyze progress toward performance measure targets and broader progress toward achieving the agency’s strategic objectives and performance goals. Program risks are also discussed, and mitigation strategies are developed.
(6) Managers of major functional components within the CPSC also submit annual statements of assurance on the operating effectiveness of general and program-level internal controls for their areas of responsibility. Those statements of assurance identify any known deficiencies or weaknesses in program-level internal controls where they exist, including any issues with the quality of program data.
These procedures help to provide assurance that performance data reported by the agency are sufficiently complete, accurate, and reliable, as appropriate to intended use, and that internal controls are maintained and functioning, as intended.
2 0 1 8 AP R | M a r c h 2 0 1 9 A p p e n d i c e s
C P S C | 2 3
Appendix B Changes to FY 2018 Performance Measures
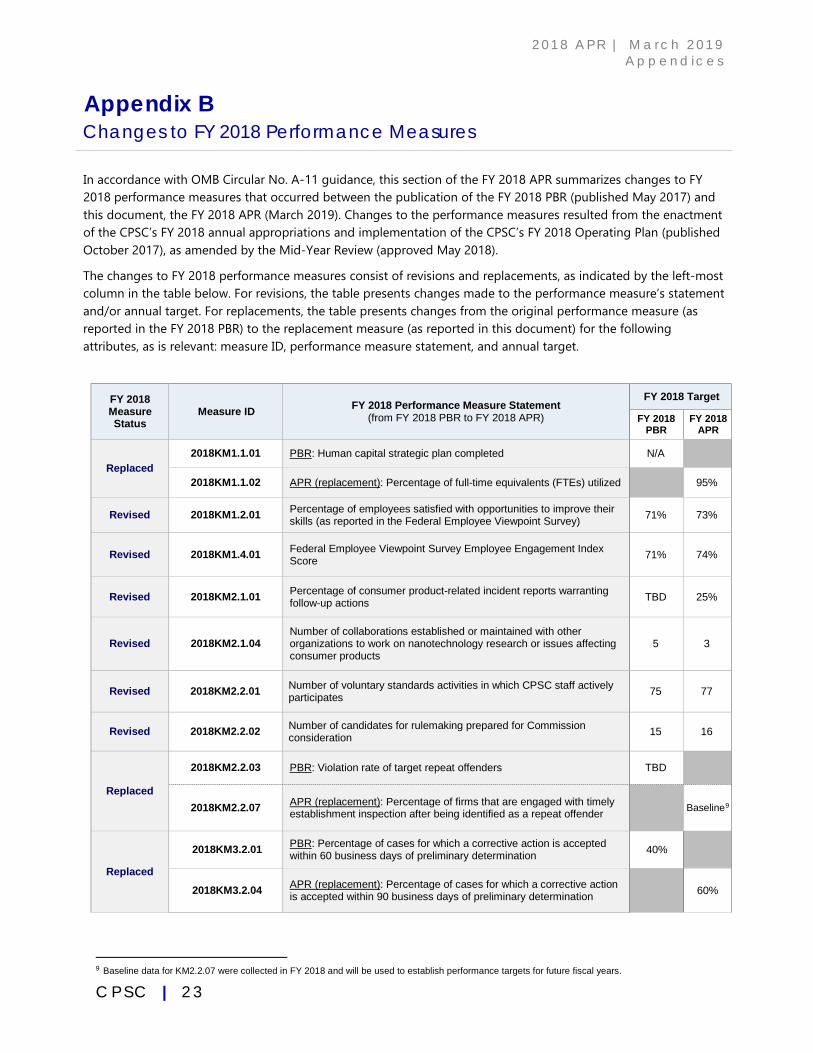
In accordance with OMB Circular No. A-11 guidance, this section of the FY 2018 APR summarizes changes to FY 2018 performance measures that occurred between the publication of the FY 2018 PBR (published May 2017) and this document, the FY 2018 APR (March 2019). Changes to the performance measures resulted from the enactment of the CPSC’s FY 2018 annual appropriations and implementation of the CPSC’s FY 2018 Operating Plan (published October 2017), as amended by the Mid-Year Review (approved May 2018).
The changes to FY 2018 performance measures consist of revisions and replacements, as indicated by the left-most column in the table below. For revisions, the table presents changes made to the performance measure’s statement and/or annual target. For replacements, the table presents changes from the original performance measure (as reported in the FY 2018 PBR) to the replacement measure (as reported in this document) for the following attributes, as is relevant: measure ID, performance measure statement, and annual target.
FY 2018 Measure Status
Measure ID FY 2018 Performance Measure Statement (from FY 2018 PBR to FY 2018 APR)
FY 2018 Target
FY 2018 PBR
FY 2018 APR
Replaced 2018KM1.1.01 PBR: Human capital strategic plan completed N/A
2018KM1.1.02 APR (replacement): Percentage of full-time equivalents (FTEs) utilized 95%
Revised 2018KM1.2.01 Percentage of employees satisfied with opportunities to improve their skills (as reported in the Federal Employee Viewpoint Survey) 71% 73%
Revised 2018KM1.4.01 Federal Employee Viewpoint Survey Employee Engagement Index Score 71% 74%
Revised 2018KM2.1.01 Percentage of consumer product-related incident reports warranting follow-up actions TBD 25%
Revised 2018KM2.1.04 Number of collaborations established or maintained with other organizations to work on nanotechnology research or issues affecting consumer products
5 3
Revised 2018KM2.2.01 Number of voluntary standards activities in which CPSC staff actively participates 75 77
Revised 2018KM2.2.02 Number of candidates for rulemaking prepared for Commission consideration 15 16
Replaced
2018KM2.2.03 PBR: Violation rate of target repeat offenders TBD
2018KM2.2.07 APR (replacement): Percentage of firms that are engaged with timely establishment inspection after being identified as a repeat offender Baseline9
Replaced
2018KM3.2.01 PBR: Percentage of cases for which a corrective action is accepted within 60 business days of preliminary determination 40%
2018KM3.2.04 APR (replacement): Percentage of cases for which a corrective action is accepted within 90 business days of preliminary determination 60%
9 Baseline data for KM2.2.07 were collected in FY 2018 and will be used to establish performance targets for future fiscal years.
2 0 1 8 AP R | M a r c h 2 0 1 9 A p p e n d i c e s
C P S C | 2 4
FY 2018 Measure Status
Measure ID FY 2018 Performance Measure Statement (from FY 2018 PBR to FY 2018 APR)
FY 2018 Target
FY 2018 PBR
FY 2018 APR
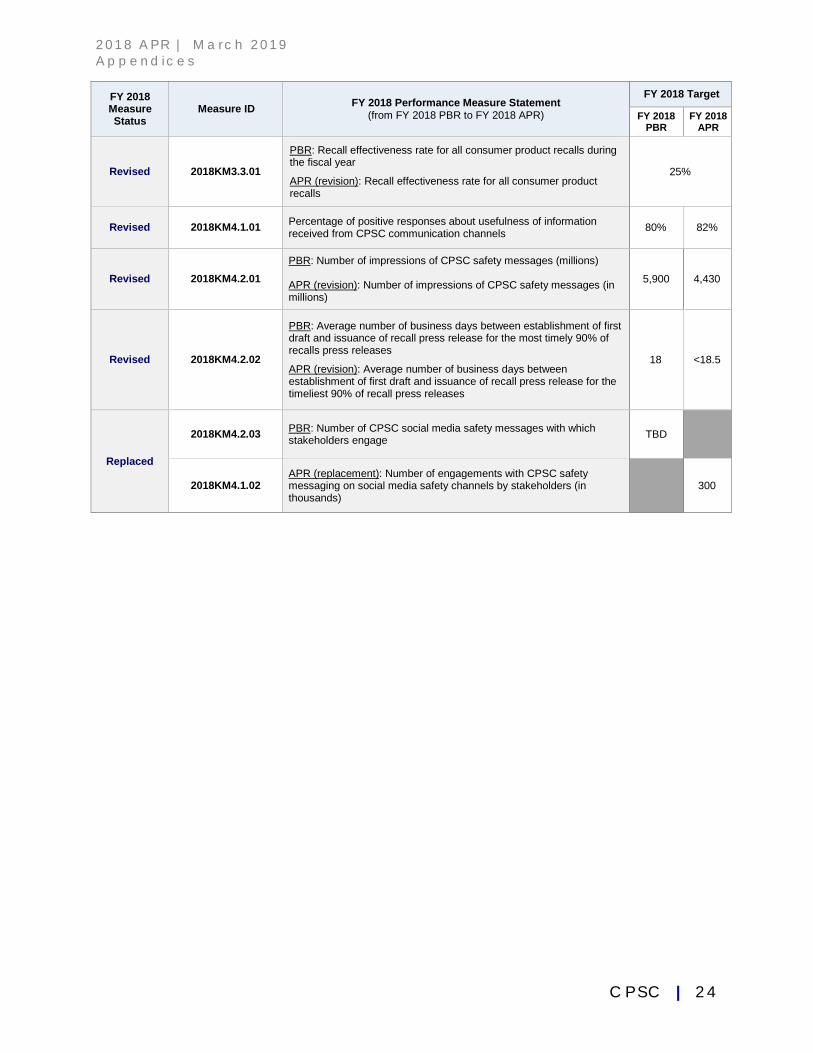
Revised 2018KM3.3.01
PBR: Recall effectiveness rate for all consumer product recalls during the fiscal year
APR (revision): Recall effectiveness rate for all consumer product recalls
25%
Revised 2018KM4.1.01 Percentage of positive responses about usefulness of information received from CPSC communication channels 80% 82%
Revised 2018KM4.2.01 PBR: Number of impressions of CPSC safety messages (millions) APR (revision): Number of impressions of CPSC safety messages (in millions)
5,900 4,430
Revised 2018KM4.2.02
PBR: Average number of business days between establishment of first draft and issuance of recall press release for the most timely 90% of recalls press releases
APR (revision): Average number of business days between establishment of first draft and issuance of recall press release for the timeliest 90% of recall press releases
18 <18.5
Replaced
2018KM4.2.03 PBR: Number of CPSC social media safety messages with which stakeholders engage TBD
2018KM4.1.02 APR (replacement): Number of engagements with CPSC safety messaging on social media safety channels by stakeholders (in thousands)
300
2 0 1 8 AP R | M a r c h 2 0 1 9 A p p e n d i c e s
C P S C | 2 5
Appendix C Detailed Information on FY 2018 Performance Measures
This section presents detailed information on the 29 key performance measures for FY 2018. The CPSC’s FY 2018 Operating Plan, as amended by the Mid-Year Review in May 2018, includes FY 2018 performance measures and annual targets, used for tracking progress toward achieving the strategic goals and strategic objectives outlined in the agency’s strategic plan.
Navigation: The performance measures are organized by strategic goal. For each performance measure, this appendix shows key information from the data fields listed in the CPSC’s centralized Performance Management Database (PMD). Each quarter, the CPSC’s functional components are responsible for reporting actual progress for each performance measure in the PMD. The following are the data fields listed in this appendix for each performance measure:
Name of Data Field Description
Control ID A unique identifier assigned to each performance measure.
Program The CPSC’s functional component that is responsible for the performance measure.
Strategic Goal The strategic goal from the CPSC’s Strategic Plan associated with the performance measure.
Strategic Objective The strategic objective from the CPSC’s Strategic Plan associated with the performance measure.
Performance Measure Statement
A measurable value that indicates the state or level of the targeted result.
Definition of Performance Measure
A clear description of the indicator, with enough specificity that different individuals can collect and report the same information for the measure.
Rationale for Performance Measure
A description of why the performance measure was selected; how it tracks progress toward the associated strategic objective; and how the information will be useful for management.
2014–2018 Actuals; Target met?
FY 2018 target and historical actual values for the performance measure and indication of whether the FY 2018 target was met.
2 0 1 8 AP R | M a r c h 2 0 1 9 A p p e n d i c e s
C P S C | 2 6
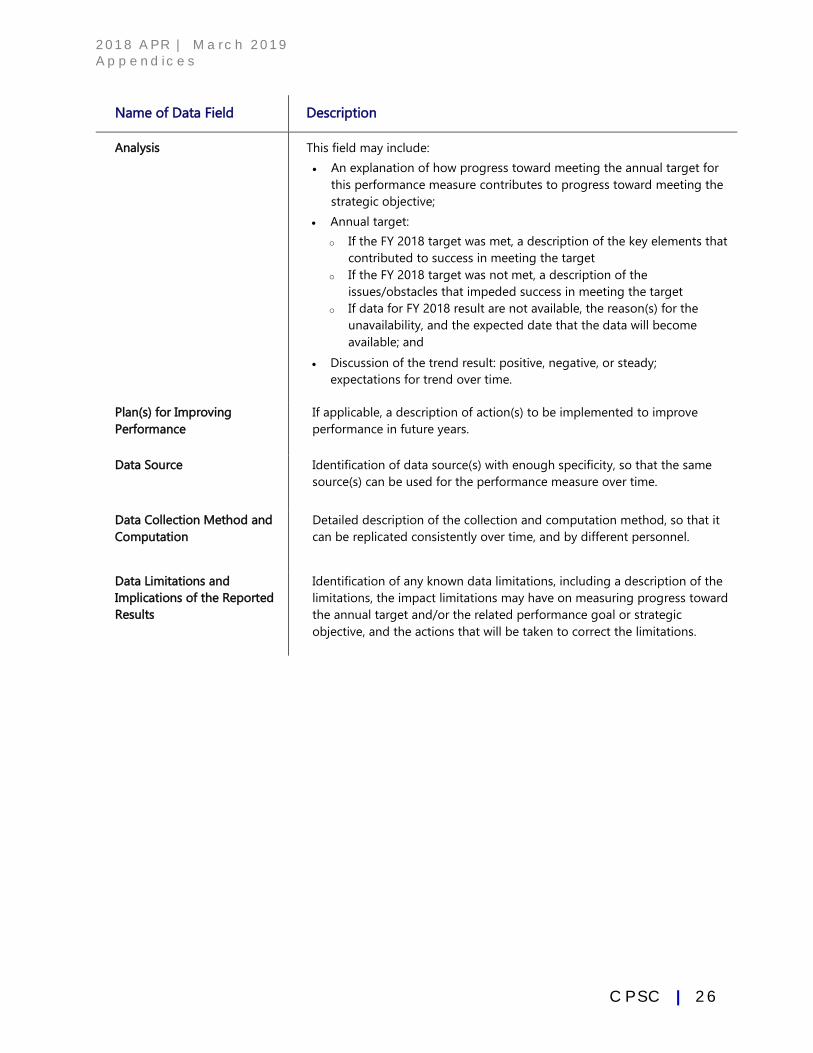
Name of Data Field Description
Analysis This field may include:
• An explanation of how progress toward meeting the annual target for this performance measure contributes to progress toward meeting the strategic objective;
• Annual target:
o If the FY 2018 target was met, a description of the key elements that contributed to success in meeting the target
o If the FY 2018 target was not met, a description of the issues/obstacles that impeded success in meeting the target
o If data for FY 2018 result are not available, the reason(s) for the unavailability, and the expected date that the data will become available; and
• Discussion of the trend result: positive, negative, or steady; expectations for trend over time.
Plan(s) for Improving Performance
If applicable, a description of action(s) to be implemented to improve performance in future years.
Data Source Identification of data source(s) with enough specificity, so that the same source(s) can be used for the performance measure over time.
Data Collection Method and Computation
Detailed description of the collection and computation method, so that it can be replicated consistently over time, and by different personnel.
Data Limitations and Implications of the Reported Results
Identification of any known data limitations, including a description of the limitations, the impact limitations may have on measuring progress toward the annual target and/or the related performance goal or strategic objective, and the actions that will be taken to correct the limitations.
2 0 1 8 AP R | M a r c h 2 0 1 9 A p p e n d i c e s
C P S C | 2 7
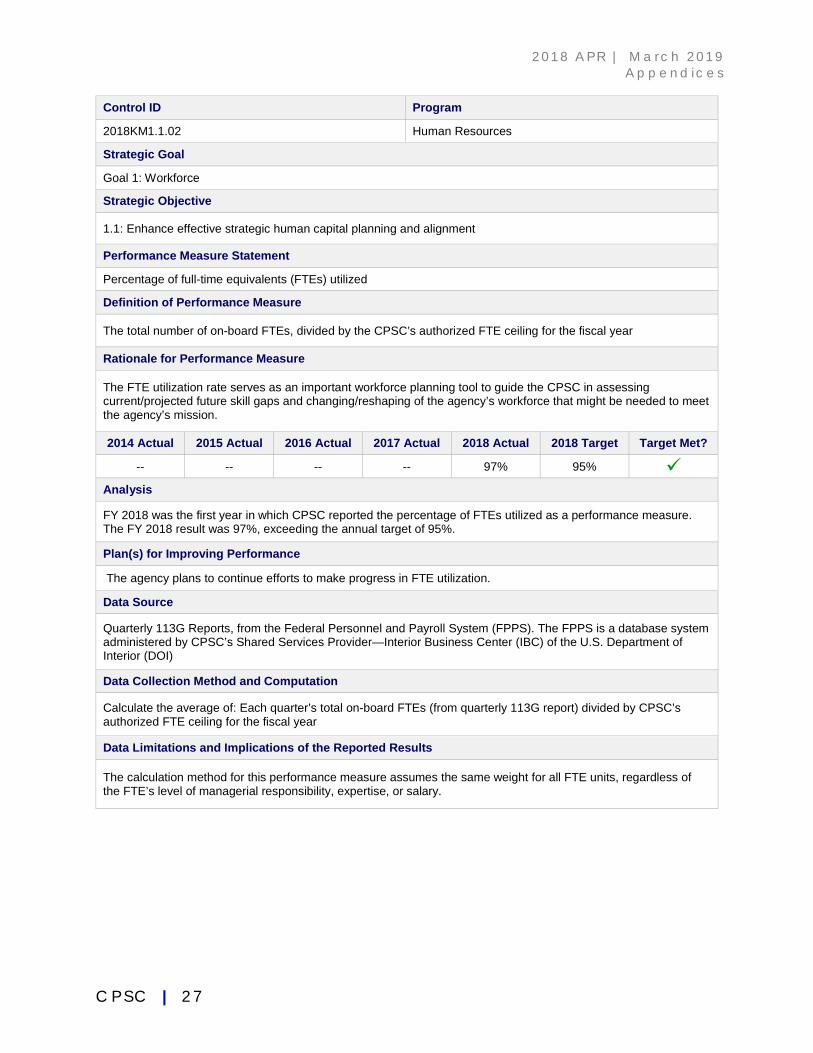
Control ID Program
2018KM1.1.02 Human Resources
Strategic Goal
Goal 1: Workforce
Strategic Objective
1.1: Enhance effective strategic human capital planning and alignment
Performance Measure Statement
Percentage of full-time equivalents (FTEs) utilized
Definition of Performance Measure
The total number of on-board FTEs, divided by the CPSC’s authorized FTE ceiling for the fiscal year
Rationale for Performance Measure
The FTE utilization rate serves as an important workforce planning tool to guide the CPSC in assessing current/projected future skill gaps and changing/reshaping of the agency’s workforce that might be needed to meet the agency’s mission.
2014 Actual 2015 Actual 2016 Actual 2017 Actual 2018 Actual 2018 Target Target Met?
-- -- -- -- 97% 95%
Analysis
FY 2018 was the first year in which CPSC reported the percentage of FTEs utilized as a performance measure. The FY 2018 result was 97%, exceeding the annual target of 95%.
Plan(s) for Improving Performance
The agency plans to continue efforts to make progress in FTE utilization.
Data Source
Quarterly 113G Reports, from the Federal Personnel and Payroll System (FPPS). The FPPS is a database system administered by CPSC’s Shared Services Provider—Interior Business Center (IBC) of the U.S. Department of Interior (DOI)
Data Collection Method and Computation
Calculate the average of: Each quarter’s total on-board FTEs (from quarterly 113G report) divided by CPSC’s authorized FTE ceiling for the fiscal year
Data Limitations and Implications of the Reported Results
The calculation method for this performance measure assumes the same weight for all FTE units, regardless of the FTE’s level of managerial responsibility, expertise, or salary.
2 0 1 8 AP R | M a r c h 2 0 1 9 A p p e n d i c e s
C P S C | 2 8
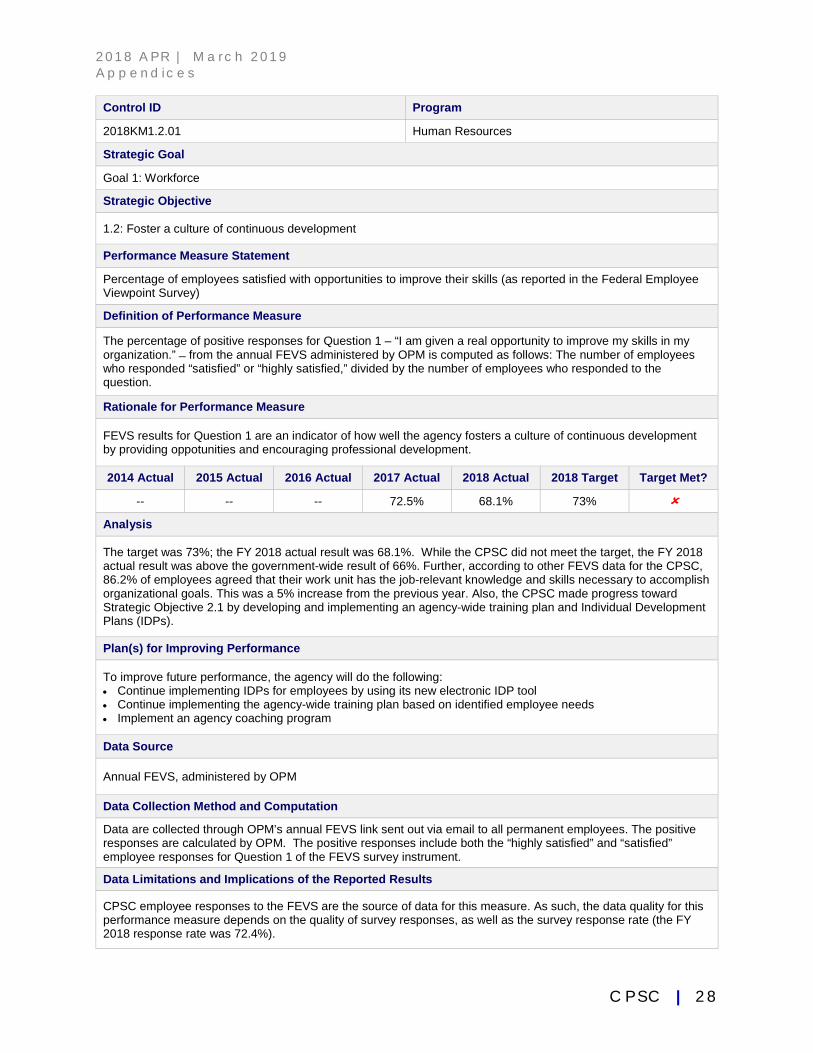
Control ID Program
2018KM1.2.01 Human Resources
Strategic Goal
Goal 1: Workforce
Strategic Objective
1.2: Foster a culture of continuous development
Performance Measure Statement
Percentage of employees satisfied with opportunities to improve their skills (as reported in the Federal Employee Viewpoint Survey)
Definition of Performance Measure
The percentage of positive responses for Question 1 – “I am given a real opportunity to improve my skills in my organization.” ̶ from the annual FEVS administered by OPM is computed as follows: The number of employees who responded “satisfied” or “highly satisfied,” divided by the number of employees who responded to the question.
Rationale for Performance Measure
FEVS results for Question 1 are an indicator of how well the agency fosters a culture of continuous development by providing oppotunities and encouraging professional development.
2014 Actual 2015 Actual 2016 Actual 2017 Actual 2018 Actual 2018 Target Target Met?
-- -- -- 72.5% 68.1% 73%
Analysis
The target was 73%; the FY 2018 actual result was 68.1%. While the CPSC did not meet the target, the FY 2018 actual result was above the government-wide result of 66%. Further, according to other FEVS data for the CPSC, 86.2% of employees agreed that their work unit has the job-relevant knowledge and skills necessary to accomplish organizational goals. This was a 5% increase from the previous year. Also, the CPSC made progress toward Strategic Objective 2.1 by developing and implementing an agency-wide training plan and Individual Development Plans (IDPs).
Plan(s) for Improving Performance
To improve future performance, the agency will do the following: • Continue implementing IDPs for employees by using its new electronic IDP tool • Continue implementing the agency-wide training plan based on identified employee needs • Implement an agency coaching program
Data Source
Annual FEVS, administered by OPM
Data Collection Method and Computation
Data are collected through OPM’s annual FEVS link sent out via email to all permanent employees. The positive responses are calculated by OPM. The positive responses include both the “highly satisfied” and “satisfied” employee responses for Question 1 of the FEVS survey instrument.
Data Limitations and Implications of the Reported Results
CPSC employee responses to the FEVS are the source of data for this measure. As such, the data quality for this performance measure depends on the quality of survey responses, as well as the survey response rate (the FY 2018 response rate was 72.4%).
2 0 1 8 AP R | M a r c h 2 0 1 9 A p p e n d i c e s
C P S C | 2 9
Control ID Program
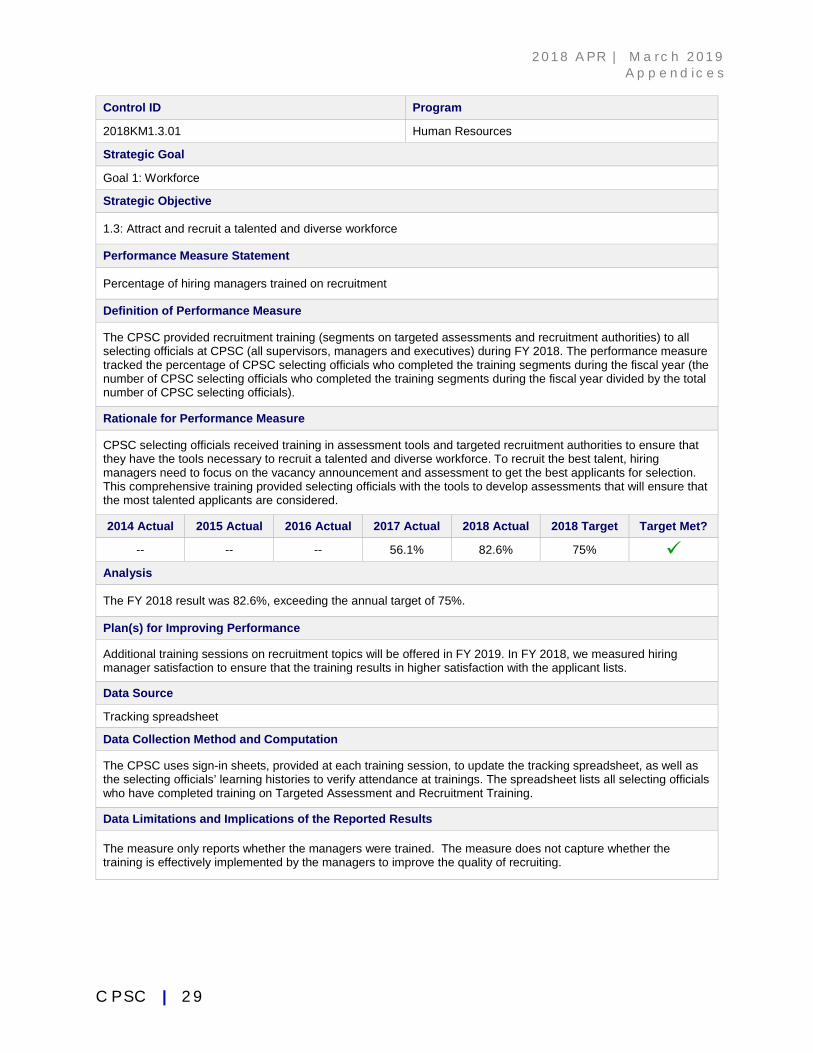
2018KM1.3.01 Human Resources
Strategic Goal
Goal 1: Workforce
Strategic Objective
1.3: Attract and recruit a talented and diverse workforce
Performance Measure Statement
Percentage of hiring managers trained on recruitment
Definition of Performance Measure
The CPSC provided recruitment training (segments on targeted assessments and recruitment authorities) to all selecting officials at CPSC (all supervisors, managers and executives) during FY 2018. The performance measure tracked the percentage of CPSC selecting officials who completed the training segments during the fiscal year (the number of CPSC selecting officials who completed the training segments during the fiscal year divided by the total number of CPSC selecting officials).
Rationale for Performance Measure
CPSC selecting officials received training in assessment tools and targeted recruitment authorities to ensure that they have the tools necessary to recruit a talented and diverse workforce. To recruit the best talent, hiring managers need to focus on the vacancy announcement and assessment to get the best applicants for selection. This comprehensive training provided selecting officials with the tools to develop assessments that will ensure that the most talented applicants are considered.
2014 Actual 2015 Actual 2016 Actual 2017 Actual 2018 Actual 2018 Target Target Met?
-- -- -- 56.1% 82.6% 75%
Analysis
The FY 2018 result was 82.6%, exceeding the annual target of 75%.
Plan(s) for Improving Performance
Additional training sessions on recruitment topics will be offered in FY 2019. In FY 2018, we measured hiring manager satisfaction to ensure that the training results in higher satisfaction with the applicant lists.
Data Source
Tracking spreadsheet
Data Collection Method and Computation
The CPSC uses sign-in sheets, provided at each training session, to update the tracking spreadsheet, as well as the selecting officials’ learning histories to verify attendance at trainings. The spreadsheet lists all selecting officials who have completed training on Targeted Assessment and Recruitment Training.
Data Limitations and Implications of the Reported Results
The measure only reports whether the managers were trained. The measure does not capture whether the training is effectively implemented by the managers to improve the quality of recruiting.
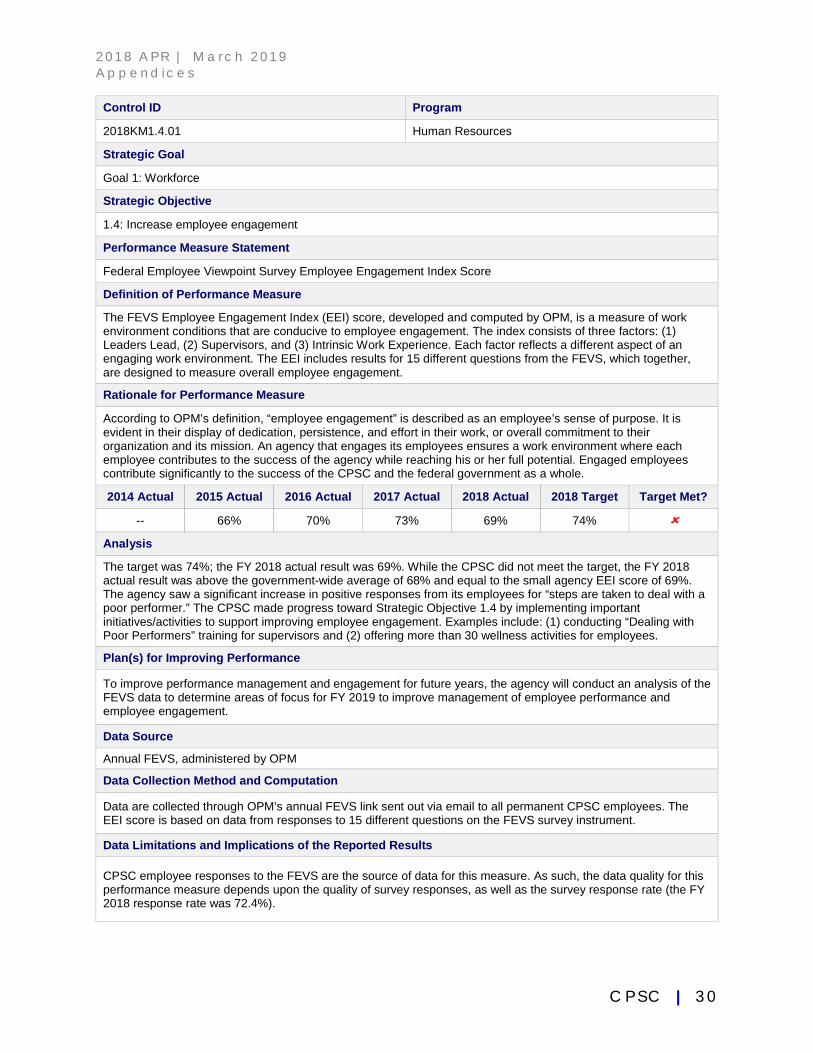
2 0 1 8 AP R | M a r c h 2 0 1 9 A p p e n d i c e s
C P S C | 3 0
Control ID Program
2018KM1.4.01 Human Resources
Strategic Goal
Goal 1: Workforce
Strategic Objective
1.4: Increase employee engagement
Performance Measure Statement
Federal Employee Viewpoint Survey Employee Engagement Index Score
Definition of Performance Measure
The FEVS Employee Engagement Index (EEI) score, developed and computed by OPM, is a measure of work environment conditions that are conducive to employee engagement. The index consists of three factors: (1) Leaders Lead, (2) Supervisors, and (3) Intrinsic Work Experience. Each factor reflects a different aspect of an engaging work environment. The EEI includes results for 15 different questions from the FEVS, which together, are designed to measure overall employee engagement.
Rationale for Performance Measure
According to OPM’s definition, “employee engagement” is described as an employee’s sense of purpose. It is evident in their display of dedication, persistence, and effort in their work, or overall commitment to their organization and its mission. An agency that engages its employees ensures a work environment where each employee contributes to the success of the agency while reaching his or her full potential. Engaged employees contribute significantly to the success of the CPSC and the federal government as a whole.
2014 Actual 2015 Actual 2016 Actual 2017 Actual 2018 Actual 2018 Target Target Met?
-- 66% 70% 73% 69% 74% Analysis
The target was 74%; the FY 2018 actual result was 69%. While the CPSC did not meet the target, the FY 2018 actual result was above the government-wide average of 68% and equal to the small agency EEI score of 69%. The agency saw a significant increase in positive responses from its employees for “steps are taken to deal with a poor performer.” The CPSC made progress toward Strategic Objective 1.4 by implementing important initiatives/activities to support improving employee engagement. Examples include: (1) conducting “Dealing with Poor Performers” training for supervisors and (2) offering more than 30 wellness activities for employees.
Plan(s) for Improving Performance
To improve performance management and engagement for future years, the agency will conduct an analysis of the FEVS data to determine areas of focus for FY 2019 to improve management of employee performance and employee engagement.
Data Source
Annual FEVS, administered by OPM
Data Collection Method and Computation
Data are collected through OPM’s annual FEVS link sent out via email to all permanent CPSC employees. The EEI score is based on data from responses to 15 different questions on the FEVS survey instrument.
Data Limitations and Implications of the Reported Results
CPSC employee responses to the FEVS are the source of data for this measure. As such, the data quality for this performance measure depends upon the quality of survey responses, as well as the survey response rate (the FY 2018 response rate was 72.4%).
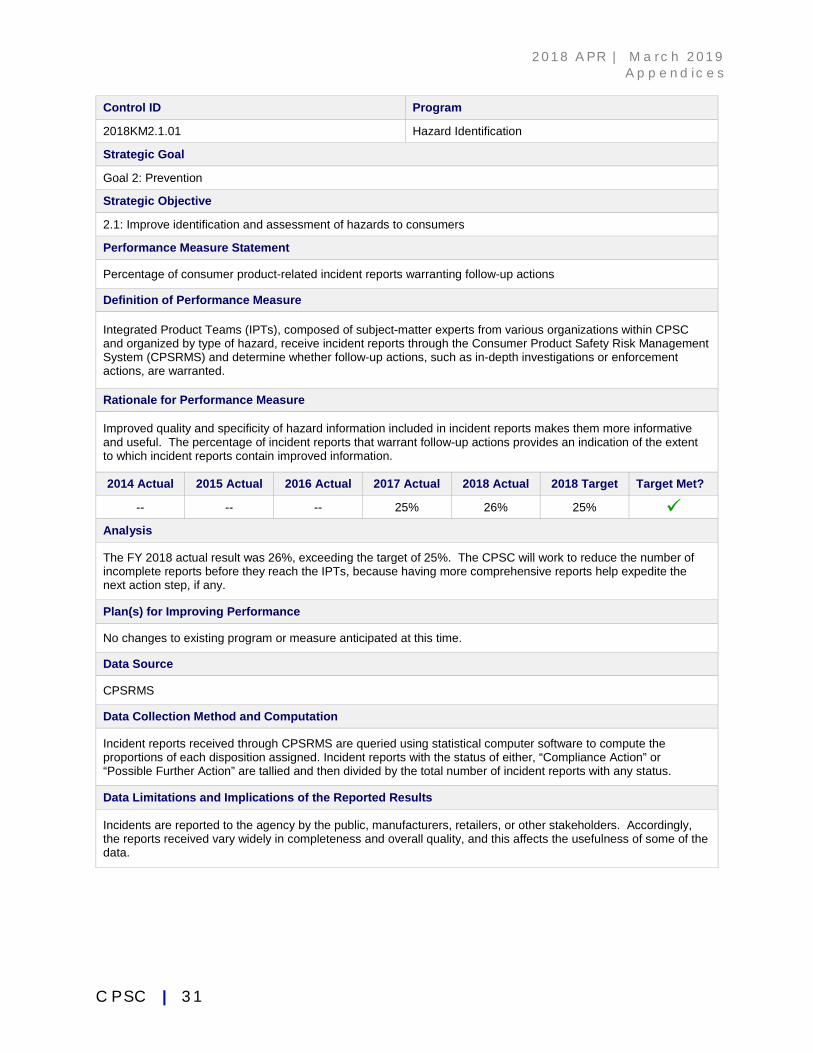
2 0 1 8 AP R | M a r c h 2 0 1 9 A p p e n d i c e s
C P S C | 3 1
Control ID Program
2018KM2.1.01 Hazard Identification
Strategic Goal
Goal 2: Prevention
Strategic Objective
2.1: Improve identification and assessment of hazards to consumers
Performance Measure Statement
Percentage of consumer product-related incident reports warranting follow-up actions
Definition of Performance Measure
Integrated Product Teams (IPTs), composed of subject-matter experts from various organizations within CPSC and organized by type of hazard, receive incident reports through the Consumer Product Safety Risk Management System (CPSRMS) and determine whether follow-up actions, such as in-depth investigations or enforcement actions, are warranted.
Rationale for Performance Measure
Improved quality and specificity of hazard information included in incident reports makes them more informative and useful. The percentage of incident reports that warrant follow-up actions provides an indication of the extent to which incident reports contain improved information.
2014 Actual 2015 Actual 2016 Actual 2017 Actual 2018 Actual 2018 Target Target Met?
-- -- -- 25% 26% 25%
Analysis
The FY 2018 actual result was 26%, exceeding the target of 25%. The CPSC will work to reduce the number of incomplete reports before they reach the IPTs, because having more comprehensive reports help expedite the next action step, if any.
Plan(s) for Improving Performance
No changes to existing program or measure anticipated at this time.
Data Source
CPSRMS
Data Collection Method and Computation
Incident reports received through CPSRMS are queried using statistical computer software to compute the proportions of each disposition assigned. Incident reports with the status of either, “Compliance Action” or “Possible Further Action” are tallied and then divided by the total number of incident reports with any status.
Data Limitations and Implications of the Reported Results
Incidents are reported to the agency by the public, manufacturers, retailers, or other stakeholders. Accordingly, the reports received vary widely in completeness and overall quality, and this affects the usefulness of some of the data.
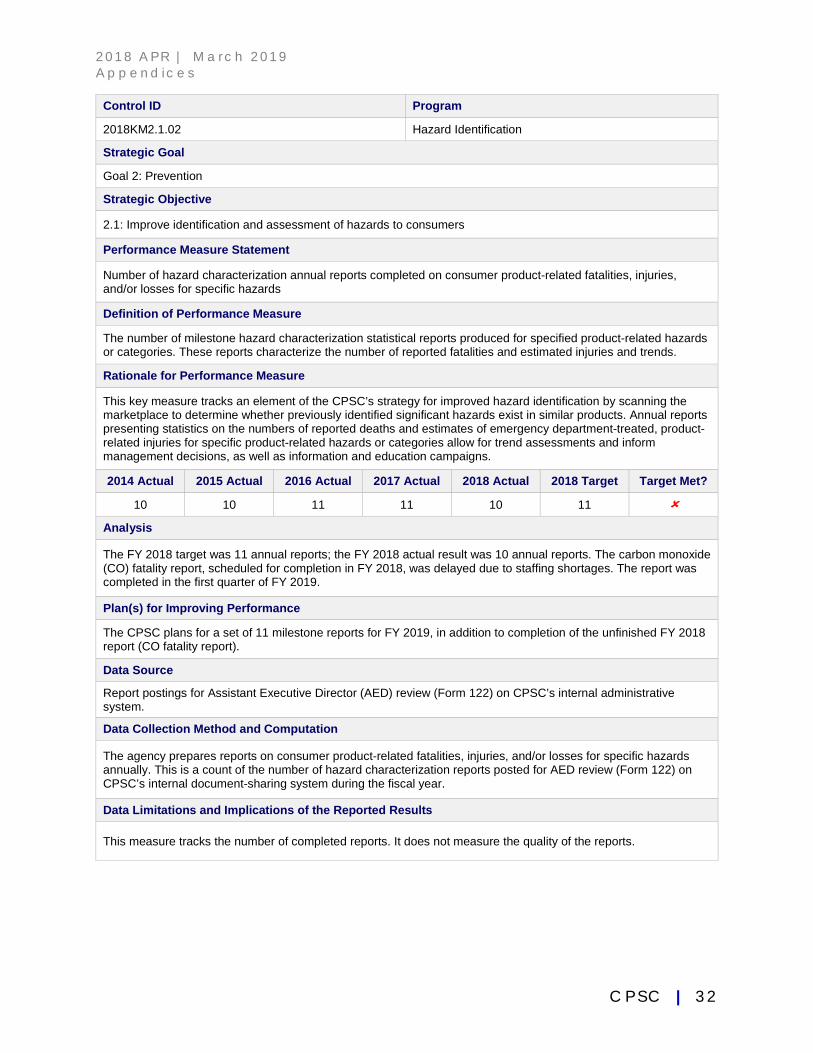
2 0 1 8 AP R | M a r c h 2 0 1 9 A p p e n d i c e s
C P S C | 3 2
Control ID Program
2018KM2.1.02 Hazard Identification
Strategic Goal
Goal 2: Prevention
Strategic Objective
2.1: Improve identification and assessment of hazards to consumers
Performance Measure Statement
Number of hazard characterization annual reports completed on consumer product-related fatalities, injuries, and/or losses for specific hazards
Definition of Performance Measure
The number of milestone hazard characterization statistical reports produced for specified product-related hazards or categories. These reports characterize the number of reported fatalities and estimated injuries and trends.
Rationale for Performance Measure
This key measure tracks an element of the CPSC’s strategy for improved hazard identification by scanning the marketplace to determine whether previously identified significant hazards exist in similar products. Annual reports presenting statistics on the numbers of reported deaths and estimates of emergency department-treated, product-related injuries for specific product-related hazards or categories allow for trend assessments and inform management decisions, as well as information and education campaigns.
2014 Actual 2015 Actual 2016 Actual 2017 Actual 2018 Actual 2018 Target Target Met?
10 10 11 11 10 11
Analysis
The FY 2018 target was 11 annual reports; the FY 2018 actual result was 10 annual reports. The carbon monoxide (CO) fatality report, scheduled for completion in FY 2018, was delayed due to staffing shortages. The report was completed in the first quarter of FY 2019.
Plan(s) for Improving Performance
The CPSC plans for a set of 11 milestone reports for FY 2019, in addition to completion of the unfinished FY 2018 report (CO fatality report).
Data Source
Report postings for Assistant Executive Director (AED) review (Form 122) on CPSC’s internal administrative system.
Data Collection Method and Computation
The agency prepares reports on consumer product-related fatalities, injuries, and/or losses for specific hazards annually. This is a count of the number of hazard characterization reports posted for AED review (Form 122) on CPSC’s internal document-sharing system during the fiscal year.
Data Limitations and Implications of the Reported Results
This measure tracks the number of completed reports. It does not measure the quality of the reports.
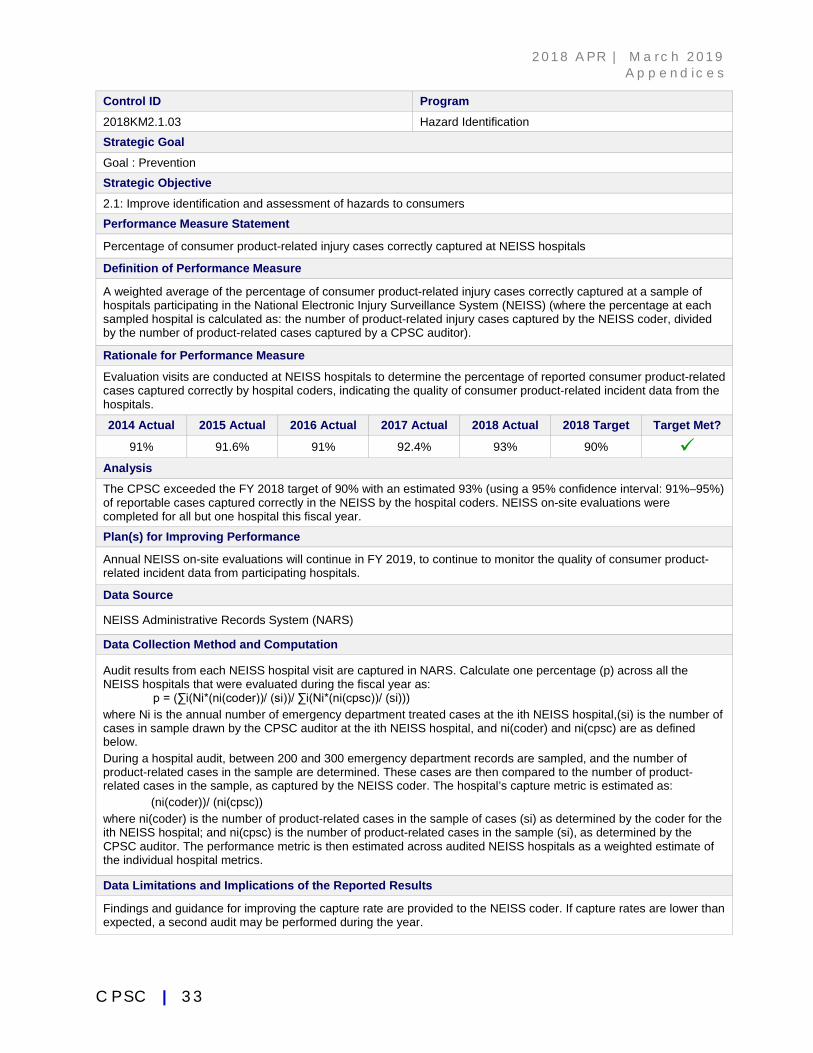
2 0 1 8 AP R | M a r c h 2 0 1 9 A p p e n d i c e s
C P S C | 3 3
Control ID Program 2018KM2.1.03 Hazard Identification
Strategic Goal Goal : Prevention
Strategic Objective 2.1: Improve identification and assessment of hazards to consumers
Performance Measure Statement
Percentage of consumer product-related injury cases correctly captured at NEISS hospitals
Definition of Performance Measure
A weighted average of the percentage of consumer product-related injury cases correctly captured at a sample of hospitals participating in the National Electronic Injury Surveillance System (NEISS) (where the percentage at each sampled hospital is calculated as: the number of product-related injury cases captured by the NEISS coder, divided by the number of product-related cases captured by a CPSC auditor).
Rationale for Performance Measure
Evaluation visits are conducted at NEISS hospitals to determine the percentage of reported consumer product-related cases captured correctly by hospital coders, indicating the quality of consumer product-related incident data from the hospitals.
2014 Actual 2015 Actual 2016 Actual 2017 Actual 2018 Actual 2018 Target Target Met?
91% 91.6% 91% 92.4% 93% 90% Analysis The CPSC exceeded the FY 2018 target of 90% with an estimated 93% (using a 95% confidence interval: 91%–95%) of reportable cases captured correctly in the NEISS by the hospital coders. NEISS on-site evaluations were completed for all but one hospital this fiscal year.
Plan(s) for Improving Performance
Annual NEISS on-site evaluations will continue in FY 2019, to continue to monitor the quality of consumer product-related incident data from participating hospitals.
Data Source
NEISS Administrative Records System (NARS)
Data Collection Method and Computation
Audit results from each NEISS hospital visit are captured in NARS. Calculate one percentage (p) across all the NEISS hospitals that were evaluated during the fiscal year as: p = (∑i(Ni*(ni(coder))/ (si))/ ∑i(Ni*(ni(cpsc))/ (si))) where Ni is the annual number of emergency department treated cases at the ith NEISS hospital,(si) is the number of cases in sample drawn by the CPSC auditor at the ith NEISS hospital, and ni(coder) and ni(cpsc) are as defined below. During a hospital audit, between 200 and 300 emergency department records are sampled, and the number of product-related cases in the sample are determined. These cases are then compared to the number of product-related cases in the sample, as captured by the NEISS coder. The hospital’s capture metric is estimated as:
(ni(coder))/ (ni(cpsc)) where ni(coder) is the number of product-related cases in the sample of cases (si) as determined by the coder for the ith NEISS hospital; and ni(cpsc) is the number of product-related cases in the sample (si), as determined by the CPSC auditor. The performance metric is then estimated across audited NEISS hospitals as a weighted estimate of the individual hospital metrics.
Data Limitations and Implications of the Reported Results
Findings and guidance for improving the capture rate are provided to the NEISS coder. If capture rates are lower than expected, a second audit may be performed during the year.
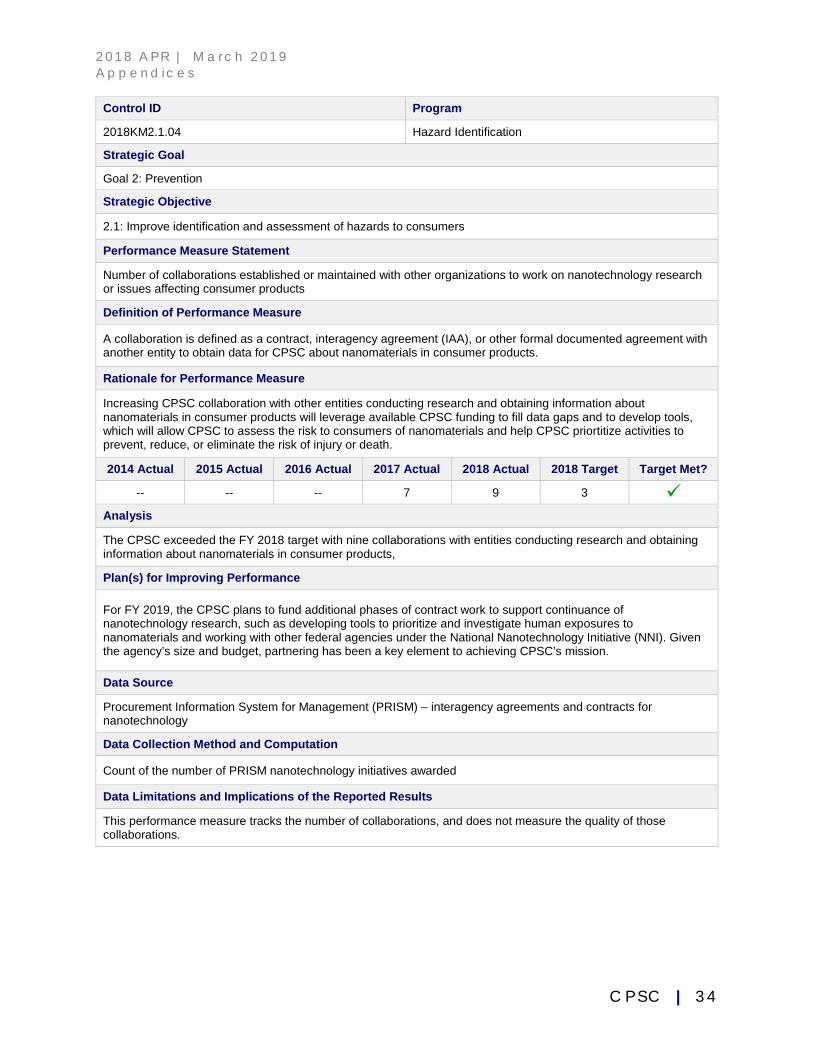
2 0 1 8 AP R | M a r c h 2 0 1 9 A p p e n d i c e s
C P S C | 3 4
Control ID Program
2018KM2.1.04 Hazard Identification
Strategic Goal
Goal 2: Prevention
Strategic Objective
2.1: Improve identification and assessment of hazards to consumers
Performance Measure Statement
Number of collaborations established or maintained with other organizations to work on nanotechnology research or issues affecting consumer products
Definition of Performance Measure
A collaboration is defined as a contract, interagency agreement (IAA), or other formal documented agreement with another entity to obtain data for CPSC about nanomaterials in consumer products.
Rationale for Performance Measure
Increasing CPSC collaboration with other entities conducting research and obtaining information about nanomaterials in consumer products will leverage available CPSC funding to fill data gaps and to develop tools, which will allow CPSC to assess the risk to consumers of nanomaterials and help CPSC priortitize activities to prevent, reduce, or eliminate the risk of injury or death.
2014 Actual 2015 Actual 2016 Actual 2017 Actual 2018 Actual 2018 Target Target Met?
-- -- -- 7 9 3 Analysis
The CPSC exceeded the FY 2018 target with nine collaborations with entities conducting research and obtaining information about nanomaterials in consumer products,
Plan(s) for Improving Performance
For FY 2019, the CPSC plans to fund additional phases of contract work to support continuance of nanotechnology research, such as developing tools to prioritize and investigate human exposures to nanomaterials and working with other federal agencies under the National Nanotechnology Initiative (NNI). Given the agency’s size and budget, partnering has been a key element to achieving CPSC’s mission.
Data Source
Procurement Information System for Management (PRISM) – interagency agreements and contracts for nanotechnology
Data Collection Method and Computation
Count of the number of PRISM nanotechnology initiatives awarded
Data Limitations and Implications of the Reported Results
This performance measure tracks the number of collaborations, and does not measure the quality of those collaborations.
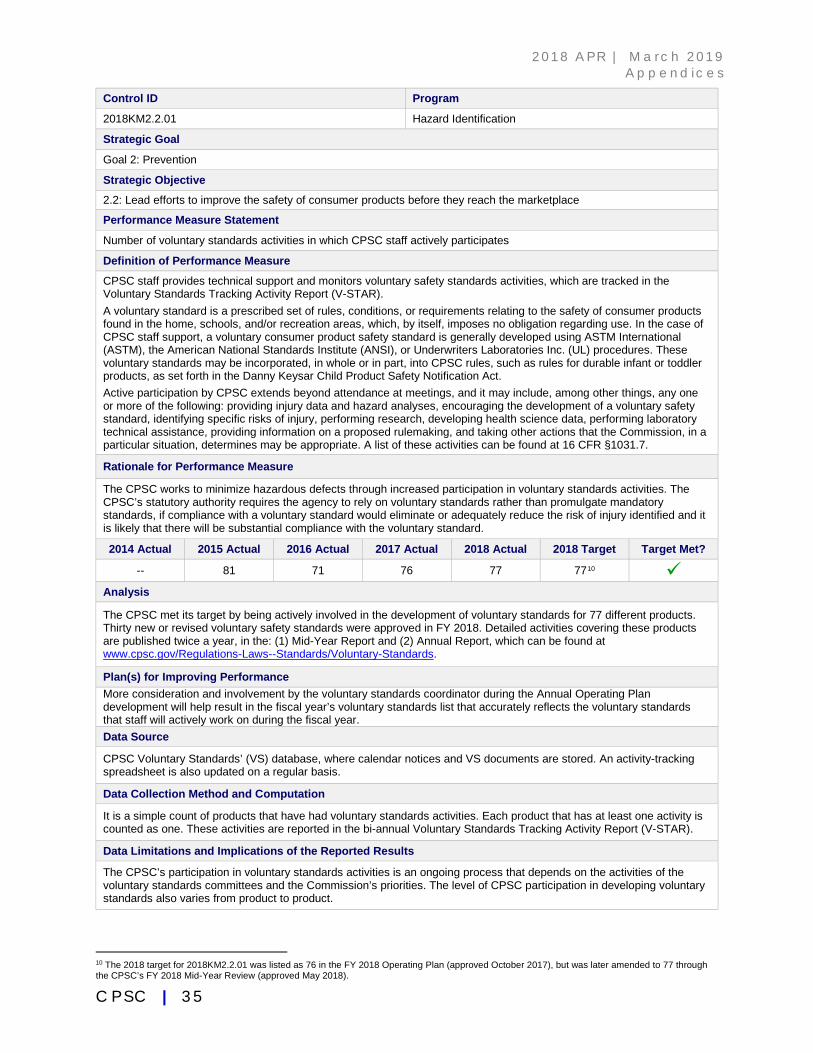
2 0 1 8 AP R | M a r c h 2 0 1 9 A p p e n d i c e s
C P S C | 3 5
Control ID Program
2018KM2.2.01 Hazard Identification
Strategic Goal
Goal 2: Prevention
Strategic Objective
2.2: Lead efforts to improve the safety of consumer products before they reach the marketplace
Performance Measure Statement
Number of voluntary standards activities in which CPSC staff actively participates
Definition of Performance Measure
CPSC staff provides technical support and monitors voluntary safety standards activities, which are tracked in the Voluntary Standards Tracking Activity Report (V-STAR). A voluntary standard is a prescribed set of rules, conditions, or requirements relating to the safety of consumer products found in the home, schools, and/or recreation areas, which, by itself, imposes no obligation regarding use. In the case of CPSC staff support, a voluntary consumer product safety standard is generally developed using ASTM International (ASTM), the American National Standards Institute (ANSI), or Underwriters Laboratories Inc. (UL) procedures. These voluntary standards may be incorporated, in whole or in part, into CPSC rules, such as rules for durable infant or toddler products, as set forth in the Danny Keysar Child Product Safety Notification Act. Active participation by CPSC extends beyond attendance at meetings, and it may include, among other things, any one or more of the following: providing injury data and hazard analyses, encouraging the development of a voluntary safety standard, identifying specific risks of injury, performing research, developing health science data, performing laboratory technical assistance, providing information on a proposed rulemaking, and taking other actions that the Commission, in a particular situation, determines may be appropriate. A list of these activities can be found at 16 CFR §1031.7.
Rationale for Performance Measure
The CPSC works to minimize hazardous defects through increased participation in voluntary standards activities. The CPSC’s statutory authority requires the agency to rely on voluntary standards rather than promulgate mandatory standards, if compliance with a voluntary standard would eliminate or adequately reduce the risk of injury identified and it is likely that there will be substantial compliance with the voluntary standard.
2014 Actual 2015 Actual 2016 Actual 2017 Actual 2018 Actual 2018 Target Target Met?
-- 81 71 76 77 7710 Analysis
The CPSC met its target by being actively involved in the development of voluntary standards for 77 different products. Thirty new or revised voluntary safety standards were approved in FY 2018. Detailed activities covering these products are published twice a year, in the: (1) Mid-Year Report and (2) Annual Report, which can be found at www.cpsc.gov/Regulations-Laws--Standards/Voluntary-Standards.
Plan(s) for Improving Performance More consideration and involvement by the voluntary standards coordinator during the Annual Operating Plan development will help result in the fiscal year’s voluntary standards list that accurately reflects the voluntary standards that staff will actively work on during the fiscal year. Data Source
CPSC Voluntary Standards’ (VS) database, where calendar notices and VS documents are stored. An activity-tracking spreadsheet is also updated on a regular basis.
Data Collection Method and Computation
It is a simple count of products that have had voluntary standards activities. Each product that has at least one activity is counted as one. These activities are reported in the bi-annual Voluntary Standards Tracking Activity Report (V-STAR).
Data Limitations and Implications of the Reported Results
The CPSC’s participation in voluntary standards activities is an ongoing process that depends on the activities of the voluntary standards committees and the Commission’s priorities. The level of CPSC participation in developing voluntary standards also varies from product to product.
10 The 2018 target for 2018KM2.2.01 was listed as 76 in the FY 2018 Operating Plan (approved October 2017), but was later amended to 77 through the CPSC’s FY 2018 Mid-Year Review (approved May 2018).
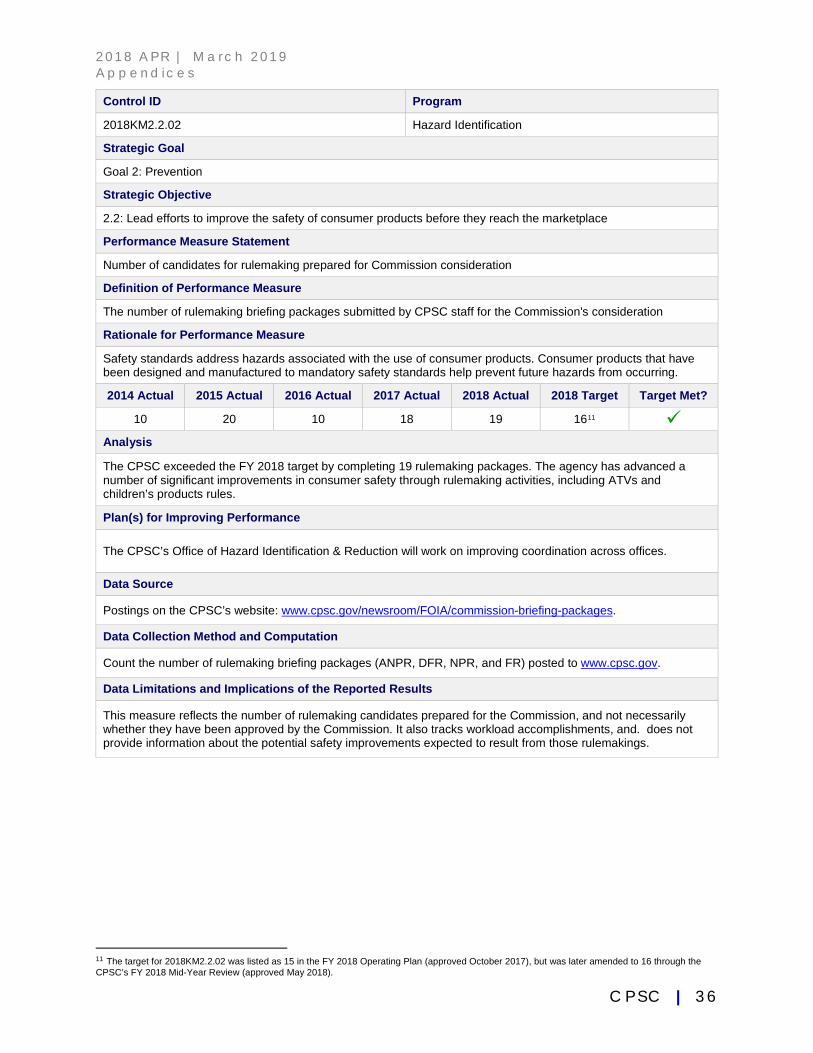
2 0 1 8 AP R | M a r c h 2 0 1 9 A p p e n d i c e s
C P S C | 3 6
Control ID Program
2018KM2.2.02 Hazard Identification
Strategic Goal
Goal 2: Prevention
Strategic Objective
2.2: Lead efforts to improve the safety of consumer products before they reach the marketplace
Performance Measure Statement
Number of candidates for rulemaking prepared for Commission consideration
Definition of Performance Measure
The number of rulemaking briefing packages submitted by CPSC staff for the Commission's consideration
Rationale for Performance Measure
Safety standards address hazards associated with the use of consumer products. Consumer products that have been designed and manufactured to mandatory safety standards help prevent future hazards from occurring.
2014 Actual 2015 Actual 2016 Actual 2017 Actual 2018 Actual 2018 Target Target Met?
10 20 10 18 19 1611
Analysis
The CPSC exceeded the FY 2018 target by completing 19 rulemaking packages. The agency has advanced a number of significant improvements in consumer safety through rulemaking activities, including ATVs and children’s products rules.
Plan(s) for Improving Performance
The CPSC’s Office of Hazard Identification & Reduction will work on improving coordination across offices.
Data Source
Postings on the CPSC’s website: www.cpsc.gov/newsroom/FOIA/commission-briefing-packages.
Data Collection Method and Computation
Count the number of rulemaking briefing packages (ANPR, DFR, NPR, and FR) posted to www.cpsc.gov.
Data Limitations and Implications of the Reported Results
This measure reflects the number of rulemaking candidates prepared for the Commission, and not necessarily whether they have been approved by the Commission. It also tracks workload accomplishments, and. does not provide information about the potential safety improvements expected to result from those rulemakings.
11 The target for 2018KM2.2.02 was listed as 15 in the FY 2018 Operating Plan (approved October 2017), but was later amended to 16 through the CPSC’s FY 2018 Mid-Year Review (approved May 2018).
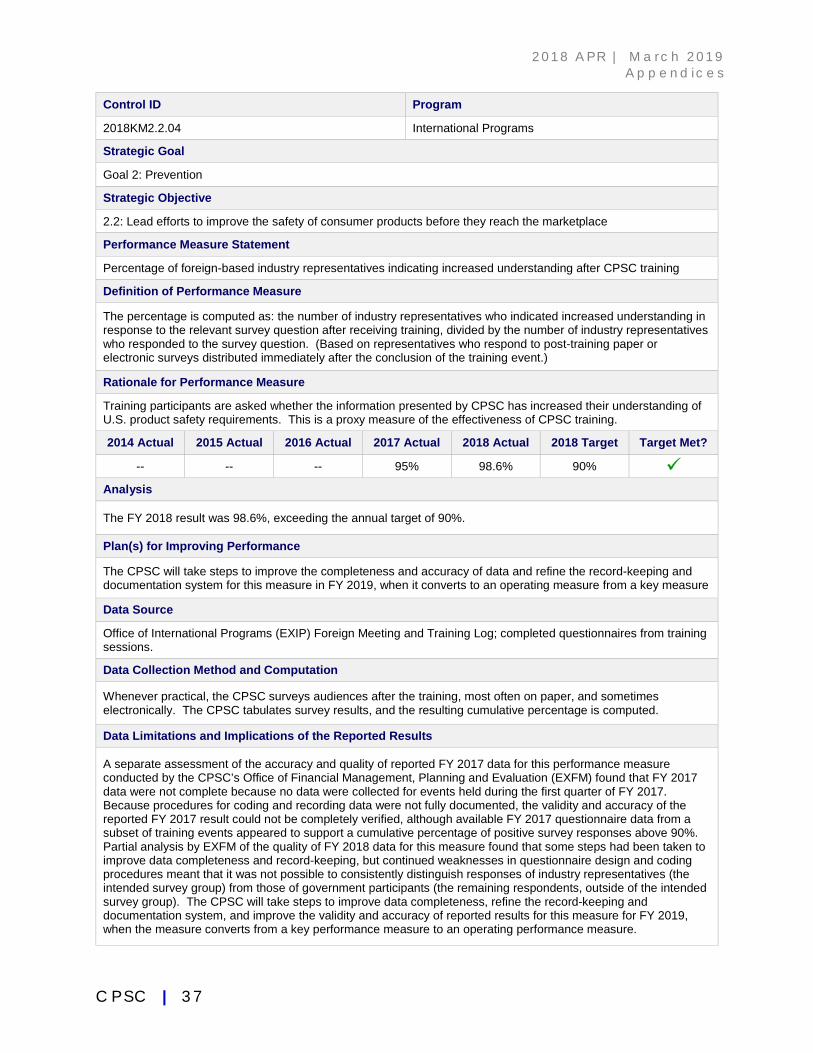
2 0 1 8 AP R | M a r c h 2 0 1 9 A p p e n d i c e s
C P S C | 3 7
Control ID Program
2018KM2.2.04 International Programs
Strategic Goal
Goal 2: Prevention
Strategic Objective
2.2: Lead efforts to improve the safety of consumer products before they reach the marketplace
Performance Measure Statement
Percentage of foreign-based industry representatives indicating increased understanding after CPSC training
Definition of Performance Measure
The percentage is computed as: the number of industry representatives who indicated increased understanding in response to the relevant survey question after receiving training, divided by the number of industry representatives who responded to the survey question. (Based on representatives who respond to post-training paper or electronic surveys distributed immediately after the conclusion of the training event.)
Rationale for Performance Measure
Training participants are asked whether the information presented by CPSC has increased their understanding of U.S. product safety requirements. This is a proxy measure of the effectiveness of CPSC training.
2014 Actual 2015 Actual 2016 Actual 2017 Actual 2018 Actual 2018 Target Target Met?
-- -- -- 95% 98.6% 90%
Analysis
The FY 2018 result was 98.6%, exceeding the annual target of 90%.
Plan(s) for Improving Performance
The CPSC will take steps to improve the completeness and accuracy of data and refine the record-keeping and documentation system for this measure in FY 2019, when it converts to an operating measure from a key measure
Data Source
Office of International Programs (EXIP) Foreign Meeting and Training Log; completed questionnaires from training sessions.
Data Collection Method and Computation
Whenever practical, the CPSC surveys audiences after the training, most often on paper, and sometimes electronically. The CPSC tabulates survey results, and the resulting cumulative percentage is computed.
Data Limitations and Implications of the Reported Results
A separate assessment of the accuracy and quality of reported FY 2017 data for this performance measure conducted by the CPSC’s Office of Financial Management, Planning and Evaluation (EXFM) found that FY 2017 data were not complete because no data were collected for events held during the first quarter of FY 2017. Because procedures for coding and recording data were not fully documented, the validity and accuracy of the reported FY 2017 result could not be completely verified, although available FY 2017 questionnaire data from a subset of training events appeared to support a cumulative percentage of positive survey responses above 90%. Partial analysis by EXFM of the quality of FY 2018 data for this measure found that some steps had been taken to improve data completeness and record-keeping, but continued weaknesses in questionnaire design and coding procedures meant that it was not possible to consistently distinguish responses of industry representatives (the intended survey group) from those of government participants (the remaining respondents, outside of the intended survey group). The CPSC will take steps to improve data completeness, refine the record-keeping and documentation system, and improve the validity and accuracy of reported results for this measure for FY 2019, when the measure converts from a key performance measure to an operating performance measure.
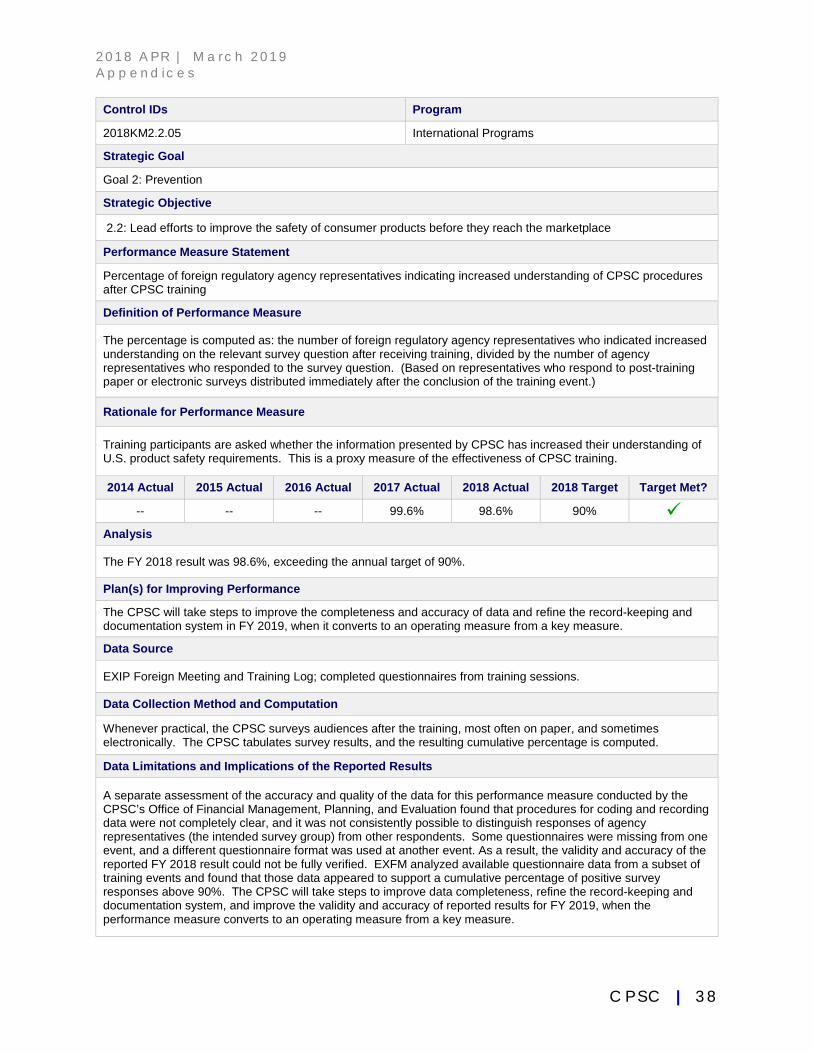
2 0 1 8 AP R | M a r c h 2 0 1 9 A p p e n d i c e s
C P S C | 3 8
Control IDs Program
2018KM2.2.05 International Programs
Strategic Goal
Goal 2: Prevention
Strategic Objective
2.2: Lead efforts to improve the safety of consumer products before they reach the marketplace Performance Measure Statement
Percentage of foreign regulatory agency representatives indicating increased understanding of CPSC procedures after CPSC training
Definition of Performance Measure
The percentage is computed as: the number of foreign regulatory agency representatives who indicated increased understanding on the relevant survey question after receiving training, divided by the number of agency representatives who responded to the survey question. (Based on representatives who respond to post-training paper or electronic surveys distributed immediately after the conclusion of the training event.)
Rationale for Performance Measure
Training participants are asked whether the information presented by CPSC has increased their understanding of U.S. product safety requirements. This is a proxy measure of the effectiveness of CPSC training.
2014 Actual 2015 Actual 2016 Actual 2017 Actual 2018 Actual 2018 Target Target Met?
-- -- -- 99.6% 98.6% 90% Analysis
The FY 2018 result was 98.6%, exceeding the annual target of 90%.
Plan(s) for Improving Performance
The CPSC will take steps to improve the completeness and accuracy of data and refine the record-keeping and documentation system in FY 2019, when it converts to an operating measure from a key measure.
Data Source
EXIP Foreign Meeting and Training Log; completed questionnaires from training sessions.
Data Collection Method and Computation
Whenever practical, the CPSC surveys audiences after the training, most often on paper, and sometimes electronically. The CPSC tabulates survey results, and the resulting cumulative percentage is computed.
Data Limitations and Implications of the Reported Results
A separate assessment of the accuracy and quality of the data for this performance measure conducted by the CPSC’s Office of Financial Management, Planning, and Evaluation found that procedures for coding and recording data were not completely clear, and it was not consistently possible to distinguish responses of agency representatives (the intended survey group) from other respondents. Some questionnaires were missing from one event, and a different questionnaire format was used at another event. As a result, the validity and accuracy of the reported FY 2018 result could not be fully verified. EXFM analyzed available questionnaire data from a subset of training events and found that those data appeared to support a cumulative percentage of positive survey responses above 90%. The CPSC will take steps to improve data completeness, refine the record-keeping and documentation system, and improve the validity and accuracy of reported results for FY 2019, when the performance measure converts to an operating measure from a key measure.
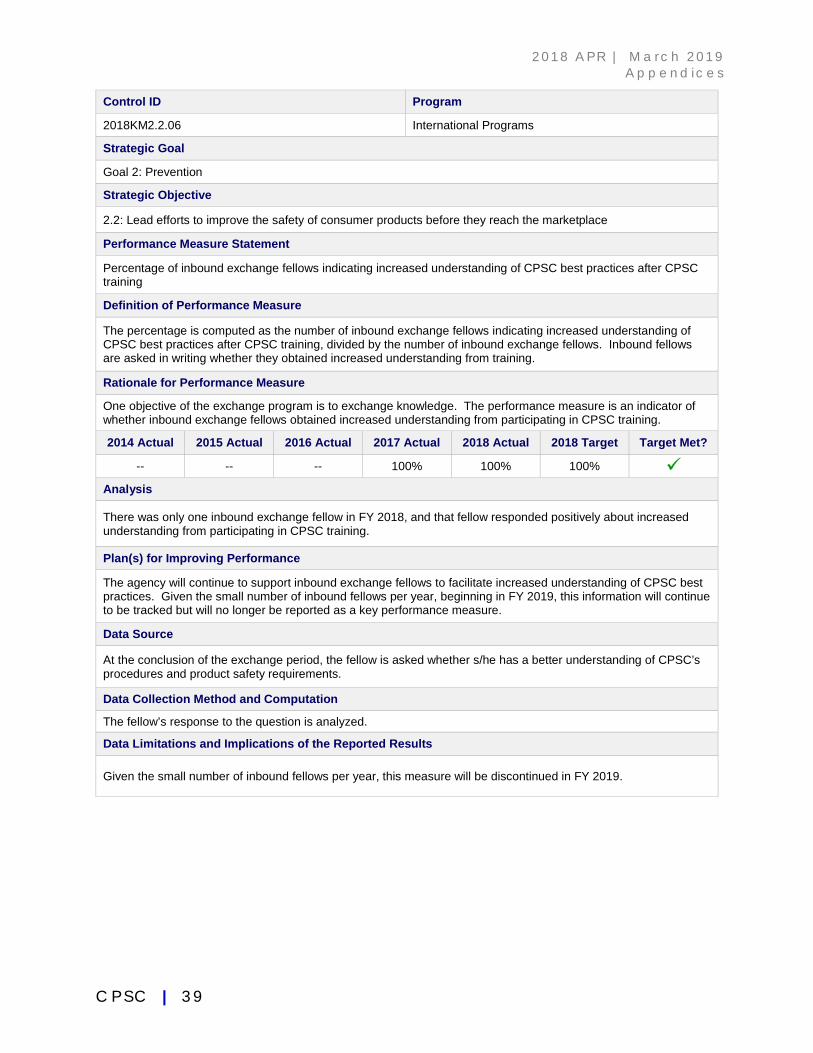
2 0 1 8 AP R | M a r c h 2 0 1 9 A p p e n d i c e s
C P S C | 3 9
Control ID Program
2018KM2.2.06 International Programs
Strategic Goal
Goal 2: Prevention
Strategic Objective
2.2: Lead efforts to improve the safety of consumer products before they reach the marketplace Performance Measure Statement
Percentage of inbound exchange fellows indicating increased understanding of CPSC best practices after CPSC training
Definition of Performance Measure
The percentage is computed as the number of inbound exchange fellows indicating increased understanding of CPSC best practices after CPSC training, divided by the number of inbound exchange fellows. Inbound fellows are asked in writing whether they obtained increased understanding from training.
Rationale for Performance Measure
One objective of the exchange program is to exchange knowledge. The performance measure is an indicator of whether inbound exchange fellows obtained increased understanding from participating in CPSC training.
2014 Actual 2015 Actual 2016 Actual 2017 Actual 2018 Actual 2018 Target Target Met?
-- -- -- 100% 100% 100% Analysis
There was only one inbound exchange fellow in FY 2018, and that fellow responded positively about increased understanding from participating in CPSC training.
Plan(s) for Improving Performance
The agency will continue to support inbound exchange fellows to facilitate increased understanding of CPSC best practices. Given the small number of inbound fellows per year, beginning in FY 2019, this information will continue to be tracked but will no longer be reported as a key performance measure.
Data Source
At the conclusion of the exchange period, the fellow is asked whether s/he has a better understanding of CPSC’s procedures and product safety requirements.
Data Collection Method and Computation
The fellow’s response to the question is analyzed.
Data Limitations and Implications of the Reported Results
Given the small number of inbound fellows per year, this measure will be discontinued in FY 2019.
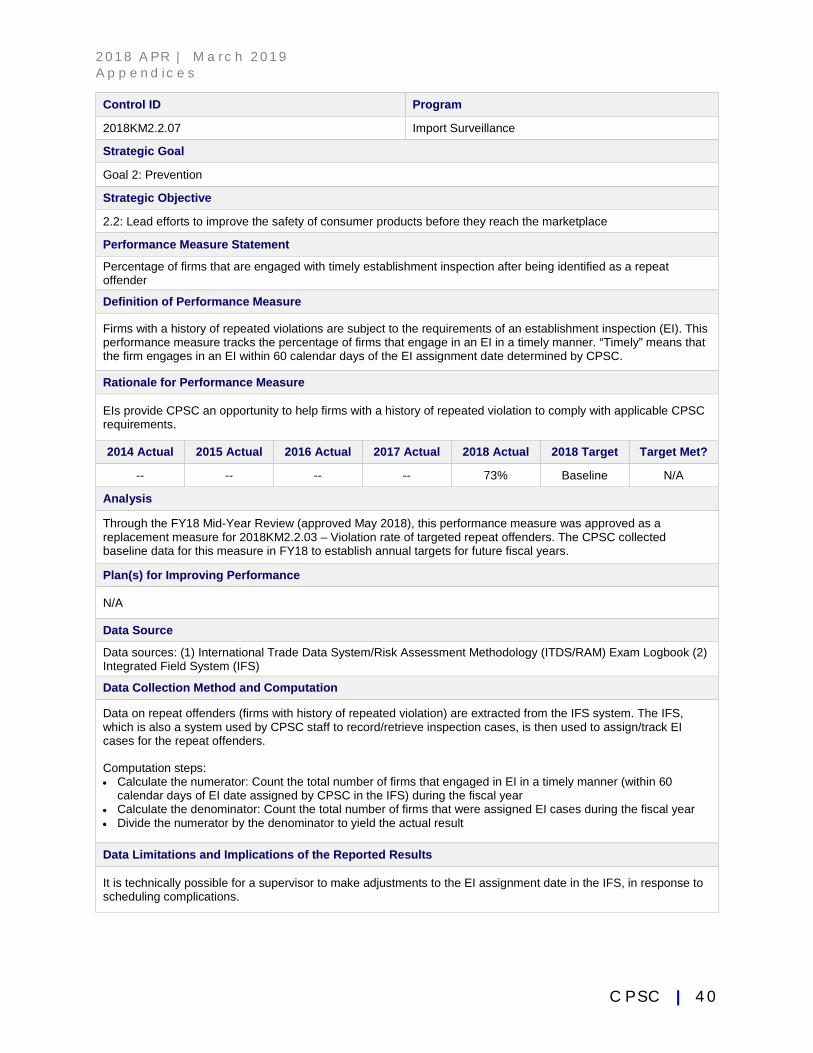
2 0 1 8 AP R | M a r c h 2 0 1 9 A p p e n d i c e s
C P S C | 4 0
Control ID Program
2018KM2.2.07 Import Surveillance
Strategic Goal
Goal 2: Prevention
Strategic Objective
2.2: Lead efforts to improve the safety of consumer products before they reach the marketplace
Performance Measure Statement
Percentage of firms that are engaged with timely establishment inspection after being identified as a repeat offender
Definition of Performance Measure
Firms with a history of repeated violations are subject to the requirements of an establishment inspection (EI). This performance measure tracks the percentage of firms that engage in an EI in a timely manner. “Timely” means that the firm engages in an EI within 60 calendar days of the EI assignment date determined by CPSC.
Rationale for Performance Measure
EIs provide CPSC an opportunity to help firms with a history of repeated violation to comply with applicable CPSC requirements.
2014 Actual 2015 Actual 2016 Actual 2017 Actual 2018 Actual 2018 Target Target Met?
-- -- -- -- 73% Baseline N/A
Analysis
Through the FY18 Mid-Year Review (approved May 2018), this performance measure was approved as a replacement measure for 2018KM2.2.03 – Violation rate of targeted repeat offenders. The CPSC collected baseline data for this measure in FY18 to establish annual targets for future fiscal years.
Plan(s) for Improving Performance
N/A
Data Source
Data sources: (1) International Trade Data System/Risk Assessment Methodology (ITDS/RAM) Exam Logbook (2) Integrated Field System (IFS)
Data Collection Method and Computation
Data on repeat offenders (firms with history of repeated violation) are extracted from the IFS system. The IFS, which is also a system used by CPSC staff to record/retrieve inspection cases, is then used to assign/track EI cases for the repeat offenders.
Computation steps: • Calculate the numerator: Count the total number of firms that engaged in EI in a timely manner (within 60
calendar days of EI date assigned by CPSC in the IFS) during the fiscal year • Calculate the denominator: Count the total number of firms that were assigned EI cases during the fiscal year • Divide the numerator by the denominator to yield the actual result
Data Limitations and Implications of the Reported Results
It is technically possible for a supervisor to make adjustments to the EI assignment date in the IFS, in response to scheduling complications.
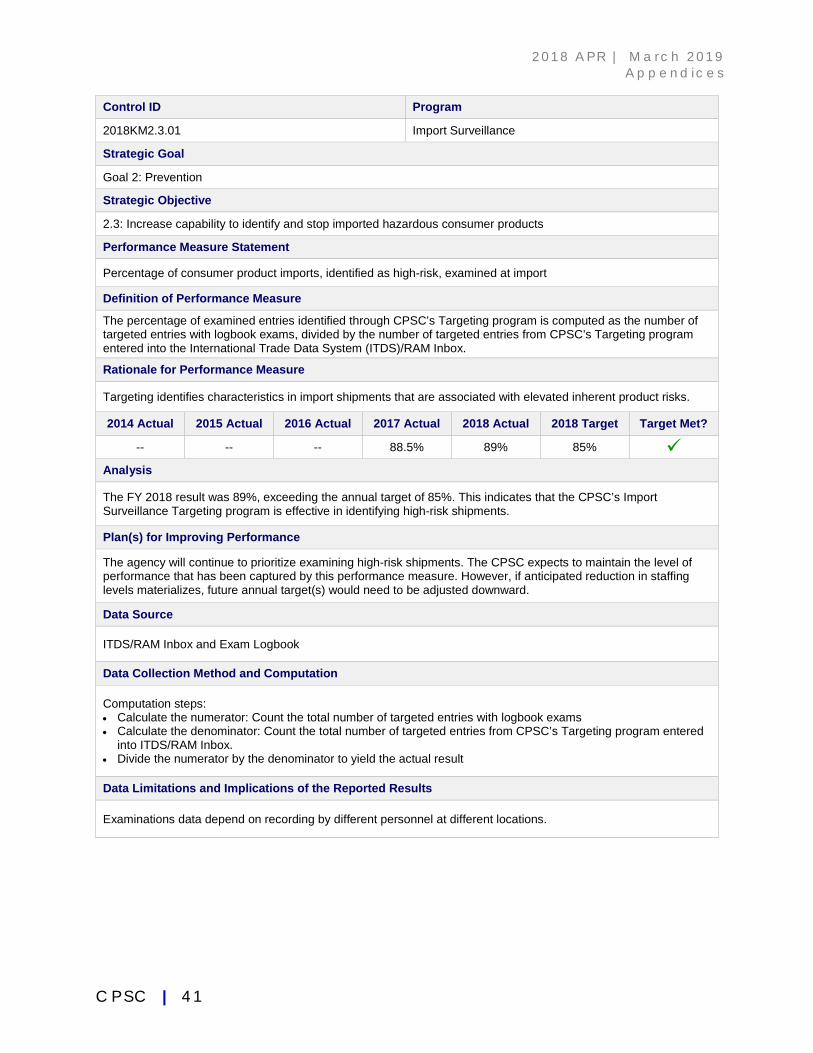
2 0 1 8 AP R | M a r c h 2 0 1 9 A p p e n d i c e s
C P S C | 4 1
Control ID Program
2018KM2.3.01 Import Surveillance
Strategic Goal
Goal 2: Prevention
Strategic Objective
2.3: Increase capability to identify and stop imported hazardous consumer products
Performance Measure Statement
Percentage of consumer product imports, identified as high-risk, examined at import
Definition of Performance Measure
The percentage of examined entries identified through CPSC’s Targeting program is computed as the number of targeted entries with logbook exams, divided by the number of targeted entries from CPSC’s Targeting program entered into the International Trade Data System (ITDS)/RAM Inbox.
Rationale for Performance Measure
Targeting identifies characteristics in import shipments that are associated with elevated inherent product risks.
2014 Actual 2015 Actual 2016 Actual 2017 Actual 2018 Actual 2018 Target Target Met?
-- -- -- 88.5% 89% 85% Analysis
The FY 2018 result was 89%, exceeding the annual target of 85%. This indicates that the CPSC’s Import Surveillance Targeting program is effective in identifying high-risk shipments.
Plan(s) for Improving Performance
The agency will continue to prioritize examining high-risk shipments. The CPSC expects to maintain the level of performance that has been captured by this performance measure. However, if anticipated reduction in staffing levels materializes, future annual target(s) would need to be adjusted downward.
Data Source
ITDS/RAM Inbox and Exam Logbook
Data Collection Method and Computation
Computation steps: • Calculate the numerator: Count the total number of targeted entries with logbook exams • Calculate the denominator: Count the total number of targeted entries from CPSC’s Targeting program entered
into ITDS/RAM Inbox. • Divide the numerator by the denominator to yield the actual result
Data Limitations and Implications of the Reported Results
Examinations data depend on recording by different personnel at different locations.
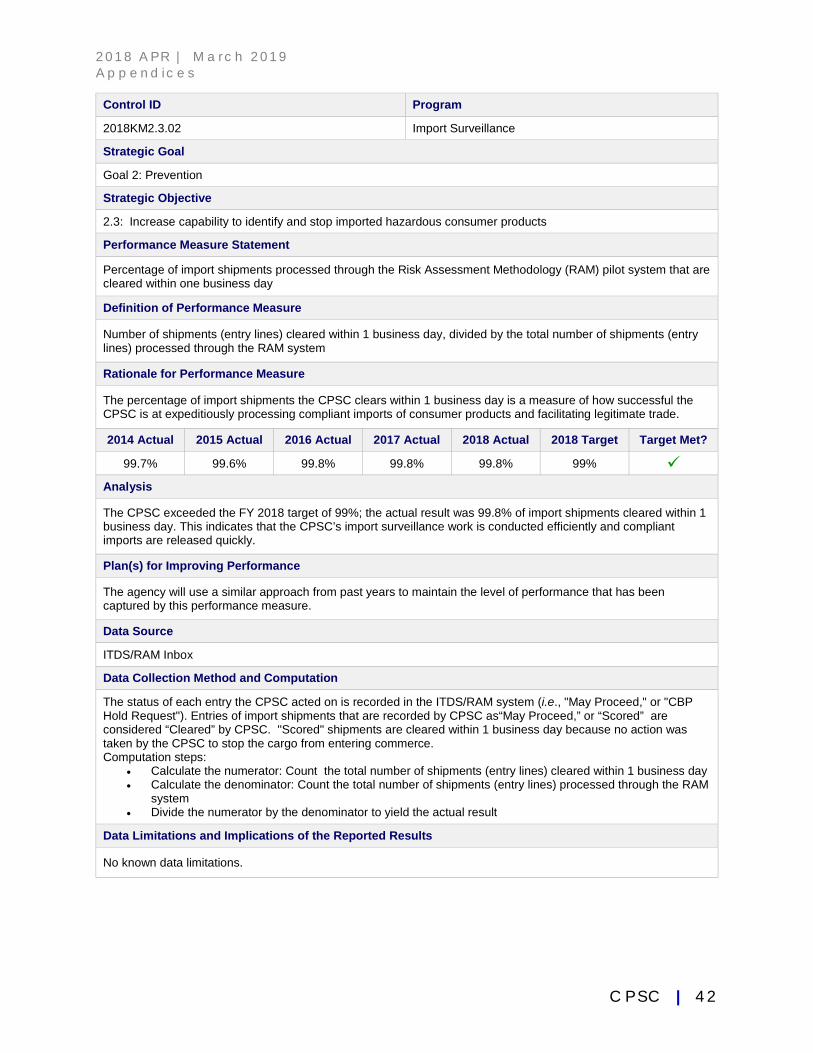
2 0 1 8 AP R | M a r c h 2 0 1 9 A p p e n d i c e s
C P S C | 4 2
Control ID Program
2018KM2.3.02 Import Surveillance
Strategic Goal
Goal 2: Prevention
Strategic Objective
2.3: Increase capability to identify and stop imported hazardous consumer products
Performance Measure Statement
Percentage of import shipments processed through the Risk Assessment Methodology (RAM) pilot system that are cleared within one business day
Definition of Performance Measure
Number of shipments (entry lines) cleared within 1 business day, divided by the total number of shipments (entry lines) processed through the RAM system
Rationale for Performance Measure
The percentage of import shipments the CPSC clears within 1 business day is a measure of how successful the CPSC is at expeditiously processing compliant imports of consumer products and facilitating legitimate trade.
2014 Actual 2015 Actual 2016 Actual 2017 Actual 2018 Actual 2018 Target Target Met?
99.7% 99.6% 99.8% 99.8% 99.8% 99% Analysis
The CPSC exceeded the FY 2018 target of 99%; the actual result was 99.8% of import shipments cleared within 1 business day. This indicates that the CPSC’s import surveillance work is conducted efficiently and compliant imports are released quickly.
Plan(s) for Improving Performance
The agency will use a similar approach from past years to maintain the level of performance that has been captured by this performance measure.
Data Source
ITDS/RAM Inbox
Data Collection Method and Computation
The status of each entry the CPSC acted on is recorded in the ITDS/RAM system (i.e., "May Proceed," or "CBP Hold Request"). Entries of import shipments that are recorded by CPSC as“May Proceed,” or “Scored” are considered “Cleared” by CPSC. "Scored" shipments are cleared within 1 business day because no action was taken by the CPSC to stop the cargo from entering commerce. Computation steps:
• Calculate the numerator: Count the total number of shipments (entry lines) cleared within 1 business day • Calculate the denominator: Count the total number of shipments (entry lines) processed through the RAM
system • Divide the numerator by the denominator to yield the actual result
Data Limitations and Implications of the Reported Results
No known data limitations.
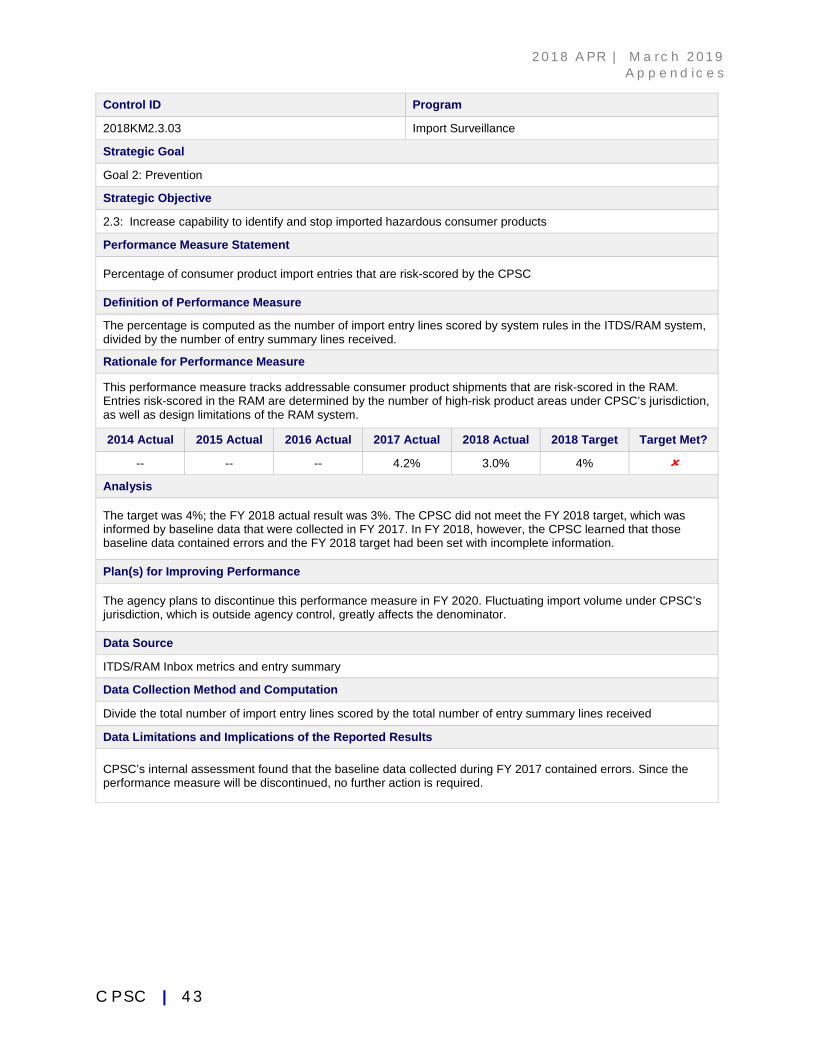
2 0 1 8 AP R | M a r c h 2 0 1 9 A p p e n d i c e s
C P S C | 4 3
Control ID Program
2018KM2.3.03 Import Surveillance
Strategic Goal
Goal 2: Prevention
Strategic Objective
2.3: Increase capability to identify and stop imported hazardous consumer products
Performance Measure Statement
Percentage of consumer product import entries that are risk-scored by the CPSC
Definition of Performance Measure
The percentage is computed as the number of import entry lines scored by system rules in the ITDS/RAM system, divided by the number of entry summary lines received.
Rationale for Performance Measure
This performance measure tracks addressable consumer product shipments that are risk-scored in the RAM. Entries risk-scored in the RAM are determined by the number of high-risk product areas under CPSC’s jurisdiction, as well as design limitations of the RAM system.
2014 Actual 2015 Actual 2016 Actual 2017 Actual 2018 Actual 2018 Target Target Met?
-- -- -- 4.2% 3.0% 4%
Analysis
The target was 4%; the FY 2018 actual result was 3%. The CPSC did not meet the FY 2018 target, which was informed by baseline data that were collected in FY 2017. In FY 2018, however, the CPSC learned that those baseline data contained errors and the FY 2018 target had been set with incomplete information.
Plan(s) for Improving Performance
The agency plans to discontinue this performance measure in FY 2020. Fluctuating import volume under CPSC’s jurisdiction, which is outside agency control, greatly affects the denominator.
Data Source
ITDS/RAM Inbox metrics and entry summary
Data Collection Method and Computation
Divide the total number of import entry lines scored by the total number of entry summary lines received
Data Limitations and Implications of the Reported Results
CPSC’s internal assessment found that the baseline data collected during FY 2017 contained errors. Since the performance measure will be discontinued, no further action is required.
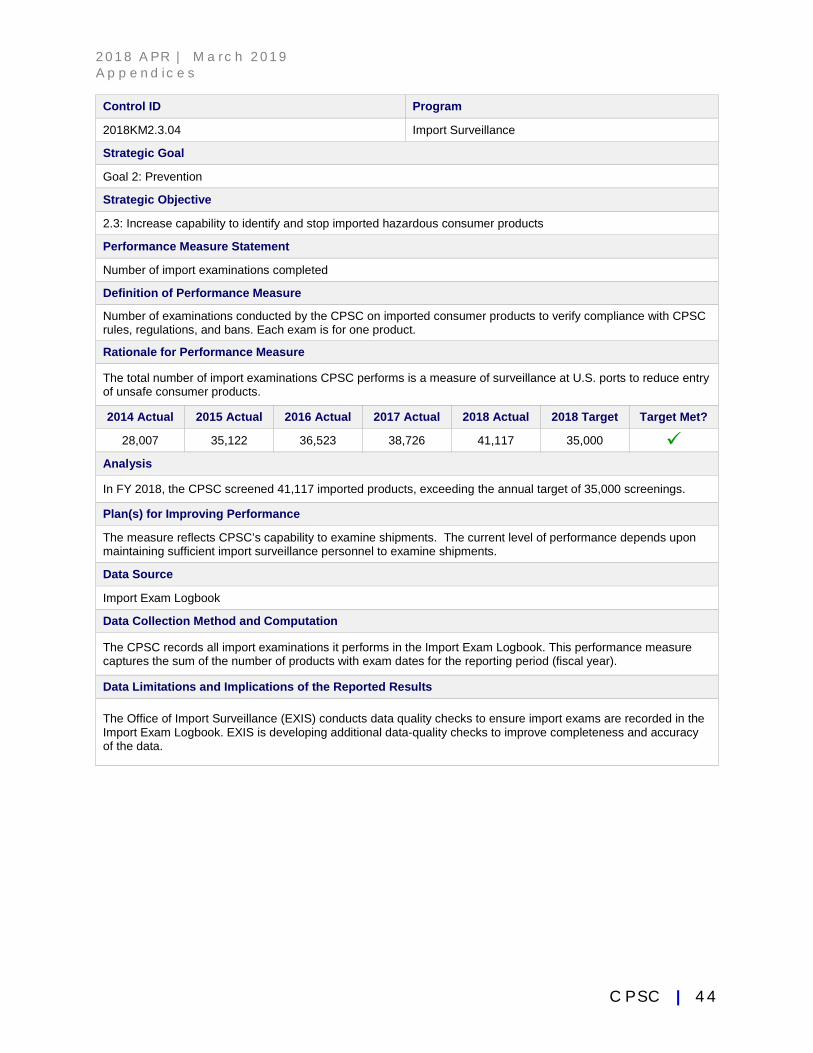
2 0 1 8 AP R | M a r c h 2 0 1 9 A p p e n d i c e s
C P S C | 4 4
Control ID Program
2018KM2.3.04 Import Surveillance
Strategic Goal
Goal 2: Prevention
Strategic Objective
2.3: Increase capability to identify and stop imported hazardous consumer products
Performance Measure Statement
Number of import examinations completed
Definition of Performance Measure
Number of examinations conducted by the CPSC on imported consumer products to verify compliance with CPSC rules, regulations, and bans. Each exam is for one product.
Rationale for Performance Measure
The total number of import examinations CPSC performs is a measure of surveillance at U.S. ports to reduce entry of unsafe consumer products.
2014 Actual 2015 Actual 2016 Actual 2017 Actual 2018 Actual 2018 Target Target Met?
28,007 35,122 36,523 38,726 41,117 35,000
Analysis
In FY 2018, the CPSC screened 41,117 imported products, exceeding the annual target of 35,000 screenings.
Plan(s) for Improving Performance
The measure reflects CPSC’s capability to examine shipments. The current level of performance depends upon maintaining sufficient import surveillance personnel to examine shipments.
Data Source
Import Exam Logbook
Data Collection Method and Computation
The CPSC records all import examinations it performs in the Import Exam Logbook. This performance measure captures the sum of the number of products with exam dates for the reporting period (fiscal year).
Data Limitations and Implications of the Reported Results
The Office of Import Surveillance (EXIS) conducts data quality checks to ensure import exams are recorded in the Import Exam Logbook. EXIS is developing additional data-quality checks to improve completeness and accuracy of the data.
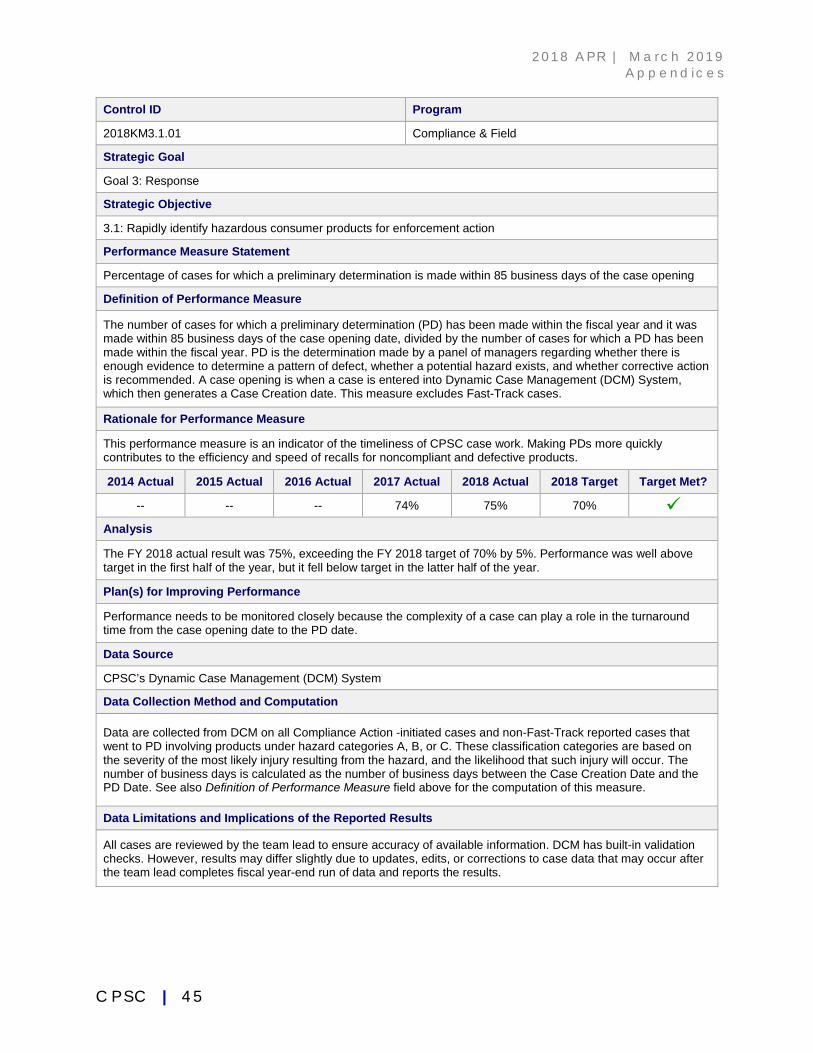
2 0 1 8 AP R | M a r c h 2 0 1 9 A p p e n d i c e s
C P S C | 4 5
Control ID Program
2018KM3.1.01 Compliance & Field
Strategic Goal
Goal 3: Response
Strategic Objective
3.1: Rapidly identify hazardous consumer products for enforcement action
Performance Measure Statement
Percentage of cases for which a preliminary determination is made within 85 business days of the case opening
Definition of Performance Measure
The number of cases for which a preliminary determination (PD) has been made within the fiscal year and it was made within 85 business days of the case opening date, divided by the number of cases for which a PD has been made within the fiscal year. PD is the determination made by a panel of managers regarding whether there is enough evidence to determine a pattern of defect, whether a potential hazard exists, and whether corrective action is recommended. A case opening is when a case is entered into Dynamic Case Management (DCM) System, which then generates a Case Creation date. This measure excludes Fast-Track cases.
Rationale for Performance Measure
This performance measure is an indicator of the timeliness of CPSC case work. Making PDs more quickly contributes to the efficiency and speed of recalls for noncompliant and defective products.
2014 Actual 2015 Actual 2016 Actual 2017 Actual 2018 Actual 2018 Target Target Met?
-- -- -- 74% 75% 70%
Analysis
The FY 2018 actual result was 75%, exceeding the FY 2018 target of 70% by 5%. Performance was well above target in the first half of the year, but it fell below target in the latter half of the year.
Plan(s) for Improving Performance
Performance needs to be monitored closely because the complexity of a case can play a role in the turnaround time from the case opening date to the PD date.
Data Source
CPSC’s Dynamic Case Management (DCM) System
Data Collection Method and Computation
Data are collected from DCM on all Compliance Action -initiated cases and non-Fast-Track reported cases that went to PD involving products under hazard categories A, B, or C. These classification categories are based on the severity of the most likely injury resulting from the hazard, and the likelihood that such injury will occur. The number of business days is calculated as the number of business days between the Case Creation Date and the PD Date. See also Definition of Performance Measure field above for the computation of this measure.
Data Limitations and Implications of the Reported Results
All cases are reviewed by the team lead to ensure accuracy of available information. DCM has built-in validation checks. However, results may differ slightly due to updates, edits, or corrections to case data that may occur after the team lead completes fiscal year-end run of data and reports the results.
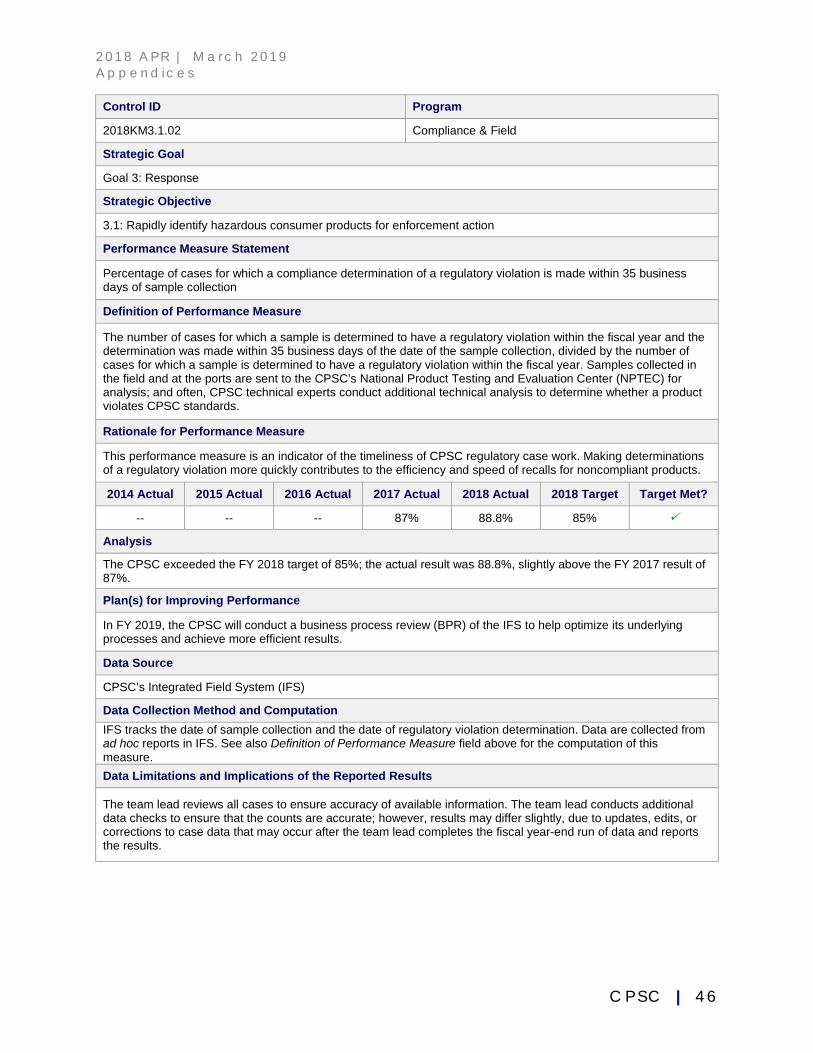
2 0 1 8 AP R | M a r c h 2 0 1 9 A p p e n d i c e s
C P S C | 4 6
Control ID Program
2018KM3.1.02 Compliance & Field
Strategic Goal
Goal 3: Response
Strategic Objective
3.1: Rapidly identify hazardous consumer products for enforcement action
Performance Measure Statement
Percentage of cases for which a compliance determination of a regulatory violation is made within 35 business days of sample collection
Definition of Performance Measure
The number of cases for which a sample is determined to have a regulatory violation within the fiscal year and the determination was made within 35 business days of the date of the sample collection, divided by the number of cases for which a sample is determined to have a regulatory violation within the fiscal year. Samples collected in the field and at the ports are sent to the CPSC’s National Product Testing and Evaluation Center (NPTEC) for analysis; and often, CPSC technical experts conduct additional technical analysis to determine whether a product violates CPSC standards.
Rationale for Performance Measure
This performance measure is an indicator of the timeliness of CPSC regulatory case work. Making determinations of a regulatory violation more quickly contributes to the efficiency and speed of recalls for noncompliant products.
2014 Actual 2015 Actual 2016 Actual 2017 Actual 2018 Actual 2018 Target Target Met?
-- -- -- 87% 88.8% 85%
Analysis
The CPSC exceeded the FY 2018 target of 85%; the actual result was 88.8%, slightly above the FY 2017 result of 87%.
Plan(s) for Improving Performance
In FY 2019, the CPSC will conduct a business process review (BPR) of the IFS to help optimize its underlying processes and achieve more efficient results.
Data Source
CPSC’s Integrated Field System (IFS)
Data Collection Method and Computation IFS tracks the date of sample collection and the date of regulatory violation determination. Data are collected from ad hoc reports in IFS. See also Definition of Performance Measure field above for the computation of this measure. Data Limitations and Implications of the Reported Results
The team lead reviews all cases to ensure accuracy of available information. The team lead conducts additional data checks to ensure that the counts are accurate; however, results may differ slightly, due to updates, edits, or corrections to case data that may occur after the team lead completes the fiscal year-end run of data and reports the results.
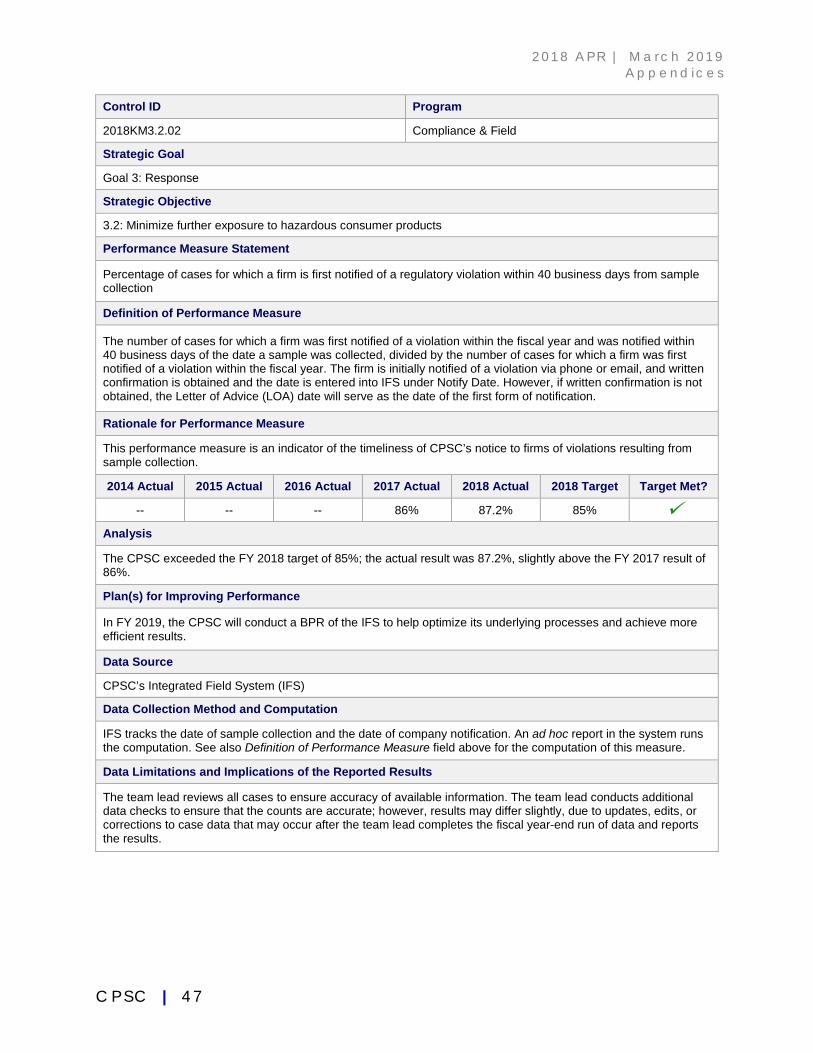
2 0 1 8 AP R | M a r c h 2 0 1 9 A p p e n d i c e s
C P S C | 4 7
Control ID Program
2018KM3.2.02 Compliance & Field
Strategic Goal
Goal 3: Response
Strategic Objective
3.2: Minimize further exposure to hazardous consumer products
Performance Measure Statement
Percentage of cases for which a firm is first notified of a regulatory violation within 40 business days from sample collection
Definition of Performance Measure
The number of cases for which a firm was first notified of a violation within the fiscal year and was notified within 40 business days of the date a sample was collected, divided by the number of cases for which a firm was first notified of a violation within the fiscal year. The firm is initially notified of a violation via phone or email, and written confirmation is obtained and the date is entered into IFS under Notify Date. However, if written confirmation is not obtained, the Letter of Advice (LOA) date will serve as the date of the first form of notification.
Rationale for Performance Measure
This performance measure is an indicator of the timeliness of CPSC’s notice to firms of violations resulting from sample collection.
2014 Actual 2015 Actual 2016 Actual 2017 Actual 2018 Actual 2018 Target Target Met?
-- -- -- 86% 87.2% 85%
Analysis
The CPSC exceeded the FY 2018 target of 85%; the actual result was 87.2%, slightly above the FY 2017 result of 86%.
Plan(s) for Improving Performance
In FY 2019, the CPSC will conduct a BPR of the IFS to help optimize its underlying processes and achieve more efficient results.
Data Source
CPSC’s Integrated Field System (IFS)
Data Collection Method and Computation
IFS tracks the date of sample collection and the date of company notification. An ad hoc report in the system runs the computation. See also Definition of Performance Measure field above for the computation of this measure.
Data Limitations and Implications of the Reported Results
The team lead reviews all cases to ensure accuracy of available information. The team lead conducts additional data checks to ensure that the counts are accurate; however, results may differ slightly, due to updates, edits, or corrections to case data that may occur after the team lead completes the fiscal year-end run of data and reports the results.
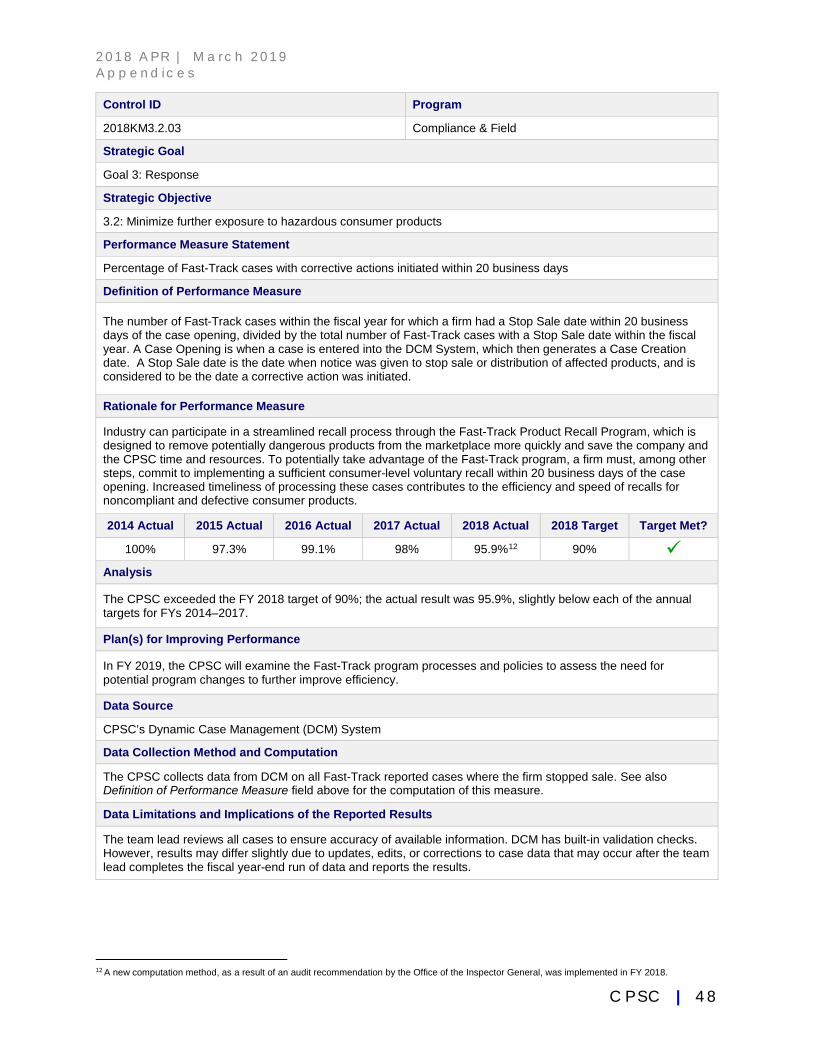
2 0 1 8 AP R | M a r c h 2 0 1 9 A p p e n d i c e s
C P S C | 4 8
Control ID Program
2018KM3.2.03 Compliance & Field
Strategic Goal
Goal 3: Response
Strategic Objective
3.2: Minimize further exposure to hazardous consumer products
Performance Measure Statement
Percentage of Fast-Track cases with corrective actions initiated within 20 business days
Definition of Performance Measure
The number of Fast-Track cases within the fiscal year for which a firm had a Stop Sale date within 20 business days of the case opening, divided by the total number of Fast-Track cases with a Stop Sale date within the fiscal year. A Case Opening is when a case is entered into the DCM System, which then generates a Case Creation date. A Stop Sale date is the date when notice was given to stop sale or distribution of affected products, and is considered to be the date a corrective action was initiated.
Rationale for Performance Measure
Industry can participate in a streamlined recall process through the Fast-Track Product Recall Program, which is designed to remove potentially dangerous products from the marketplace more quickly and save the company and the CPSC time and resources. To potentially take advantage of the Fast-Track program, a firm must, among other steps, commit to implementing a sufficient consumer-level voluntary recall within 20 business days of the case opening. Increased timeliness of processing these cases contributes to the efficiency and speed of recalls for noncompliant and defective consumer products.
2014 Actual 2015 Actual 2016 Actual 2017 Actual 2018 Actual 2018 Target Target Met?
100% 97.3% 99.1% 98% 95.9%12 90%
Analysis
The CPSC exceeded the FY 2018 target of 90%; the actual result was 95.9%, slightly below each of the annual targets for FYs 2014–2017.
Plan(s) for Improving Performance
In FY 2019, the CPSC will examine the Fast-Track program processes and policies to assess the need for potential program changes to further improve efficiency.
Data Source
CPSC’s Dynamic Case Management (DCM) System
Data Collection Method and Computation
The CPSC collects data from DCM on all Fast-Track reported cases where the firm stopped sale. See also Definition of Performance Measure field above for the computation of this measure.
Data Limitations and Implications of the Reported Results
The team lead reviews all cases to ensure accuracy of available information. DCM has built-in validation checks. However, results may differ slightly due to updates, edits, or corrections to case data that may occur after the team lead completes the fiscal year-end run of data and reports the results.
12 A new computation method, as a result of an audit recommendation by the Office of the Inspector General, was implemented in FY 2018.
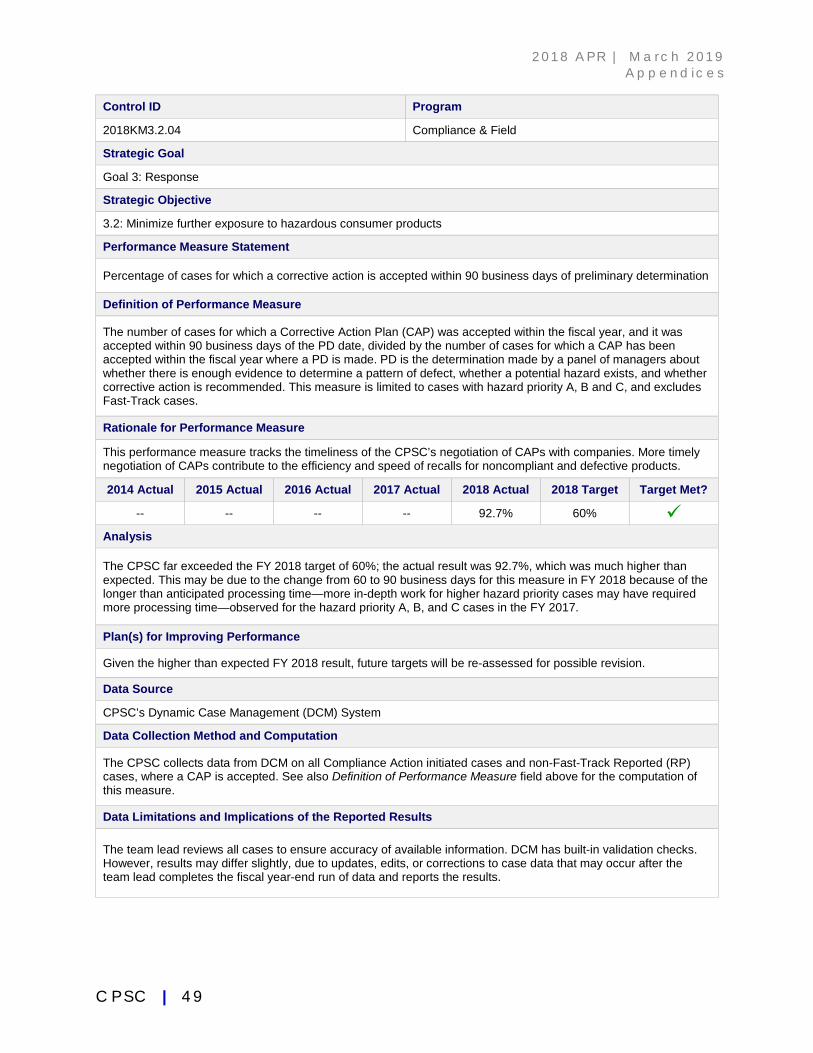
2 0 1 8 AP R | M a r c h 2 0 1 9 A p p e n d i c e s
C P S C | 4 9
Control ID Program
2018KM3.2.04 Compliance & Field
Strategic Goal
Goal 3: Response
Strategic Objective
3.2: Minimize further exposure to hazardous consumer products
Performance Measure Statement
Percentage of cases for which a corrective action is accepted within 90 business days of preliminary determination
Definition of Performance Measure
The number of cases for which a Corrective Action Plan (CAP) was accepted within the fiscal year, and it was accepted within 90 business days of the PD date, divided by the number of cases for which a CAP has been accepted within the fiscal year where a PD is made. PD is the determination made by a panel of managers about whether there is enough evidence to determine a pattern of defect, whether a potential hazard exists, and whether corrective action is recommended. This measure is limited to cases with hazard priority A, B and C, and excludes Fast-Track cases.
Rationale for Performance Measure
This performance measure tracks the timeliness of the CPSC’s negotiation of CAPs with companies. More timely negotiation of CAPs contribute to the efficiency and speed of recalls for noncompliant and defective products.
2014 Actual 2015 Actual 2016 Actual 2017 Actual 2018 Actual 2018 Target Target Met?
-- -- -- -- 92.7% 60%
Analysis
The CPSC far exceeded the FY 2018 target of 60%; the actual result was 92.7%, which was much higher than expected. This may be due to the change from 60 to 90 business days for this measure in FY 2018 because of the longer than anticipated processing time—more in-depth work for higher hazard priority cases may have required more processing time—observed for the hazard priority A, B, and C cases in the FY 2017.
Plan(s) for Improving Performance
Given the higher than expected FY 2018 result, future targets will be re-assessed for possible revision.
Data Source
CPSC’s Dynamic Case Management (DCM) System
Data Collection Method and Computation
The CPSC collects data from DCM on all Compliance Action initiated cases and non-Fast-Track Reported (RP) cases, where a CAP is accepted. See also Definition of Performance Measure field above for the computation of this measure.
Data Limitations and Implications of the Reported Results
The team lead reviews all cases to ensure accuracy of available information. DCM has built-in validation checks. However, results may differ slightly, due to updates, edits, or corrections to case data that may occur after the team lead completes the fiscal year-end run of data and reports the results.
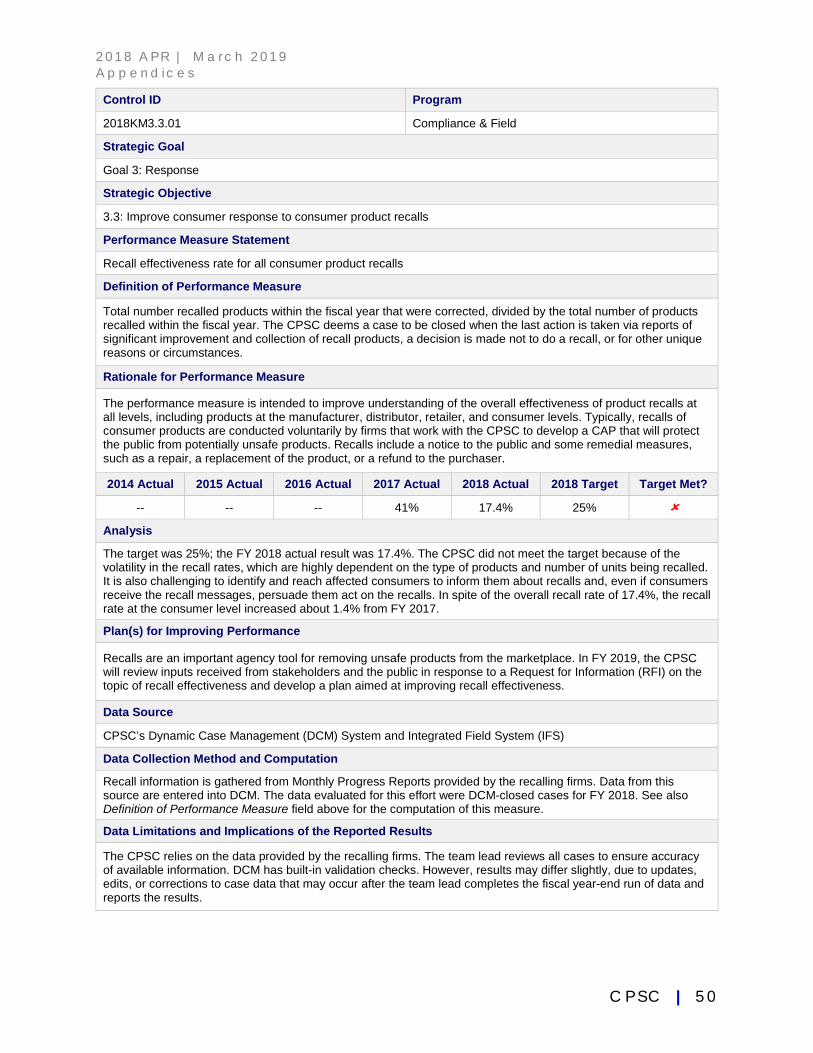
2 0 1 8 AP R | M a r c h 2 0 1 9 A p p e n d i c e s
C P S C | 5 0
Control ID Program
2018KM3.3.01 Compliance & Field
Strategic Goal
Goal 3: Response
Strategic Objective
3.3: Improve consumer response to consumer product recalls
Performance Measure Statement
Recall effectiveness rate for all consumer product recalls
Definition of Performance Measure
Total number recalled products within the fiscal year that were corrected, divided by the total number of products recalled within the fiscal year. The CPSC deems a case to be closed when the last action is taken via reports of significant improvement and collection of recall products, a decision is made not to do a recall, or for other unique reasons or circumstances.
Rationale for Performance Measure
The performance measure is intended to improve understanding of the overall effectiveness of product recalls at all levels, including products at the manufacturer, distributor, retailer, and consumer levels. Typically, recalls of consumer products are conducted voluntarily by firms that work with the CPSC to develop a CAP that will protect the public from potentially unsafe products. Recalls include a notice to the public and some remedial measures, such as a repair, a replacement of the product, or a refund to the purchaser.
2014 Actual 2015 Actual 2016 Actual 2017 Actual 2018 Actual 2018 Target Target Met?
-- -- -- 41% 17.4% 25% Analysis
The target was 25%; the FY 2018 actual result was 17.4%. The CPSC did not meet the target because of the volatility in the recall rates, which are highly dependent on the type of products and number of units being recalled. It is also challenging to identify and reach affected consumers to inform them about recalls and, even if consumers receive the recall messages, persuade them act on the recalls. In spite of the overall recall rate of 17.4%, the recall rate at the consumer level increased about 1.4% from FY 2017.
Plan(s) for Improving Performance
Recalls are an important agency tool for removing unsafe products from the marketplace. In FY 2019, the CPSC will review inputs received from stakeholders and the public in response to a Request for Information (RFI) on the topic of recall effectiveness and develop a plan aimed at improving recall effectiveness.
Data Source
CPSC’s Dynamic Case Management (DCM) System and Integrated Field System (IFS)
Data Collection Method and Computation
Recall information is gathered from Monthly Progress Reports provided by the recalling firms. Data from this source are entered into DCM. The data evaluated for this effort were DCM-closed cases for FY 2018. See also Definition of Performance Measure field above for the computation of this measure.
Data Limitations and Implications of the Reported Results
The CPSC relies on the data provided by the recalling firms. The team lead reviews all cases to ensure accuracy of available information. DCM has built-in validation checks. However, results may differ slightly, due to updates, edits, or corrections to case data that may occur after the team lead completes the fiscal year-end run of data and reports the results.
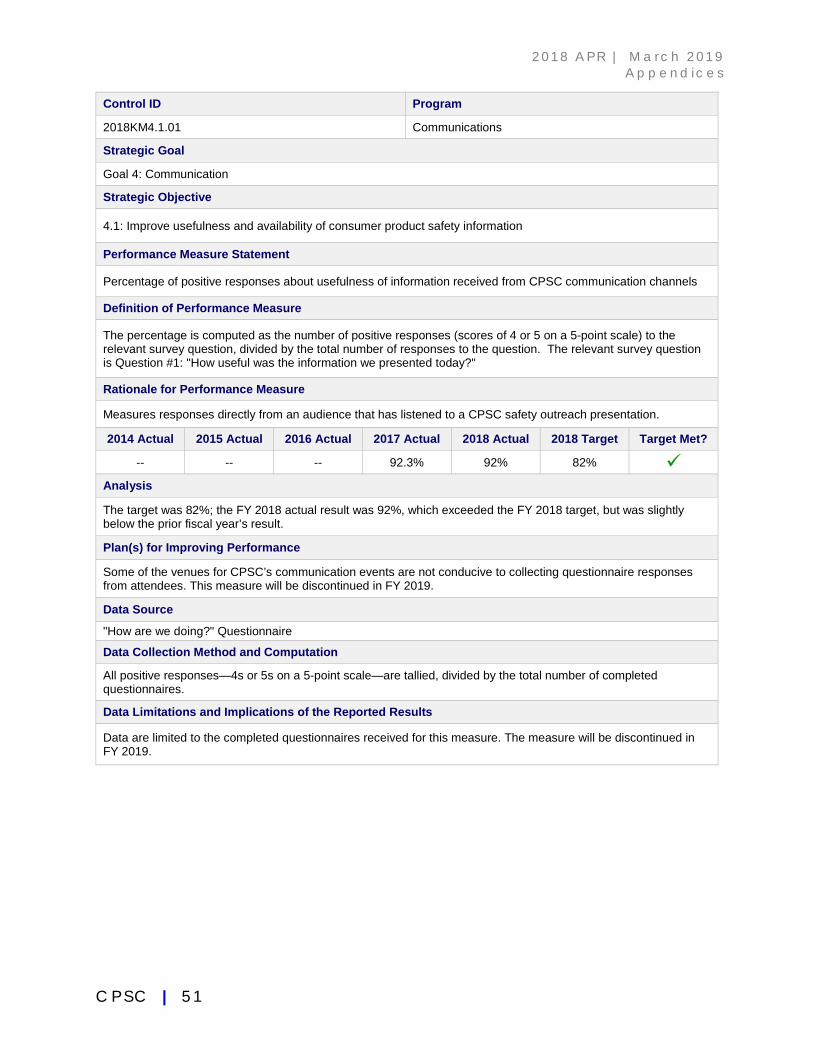
2 0 1 8 AP R | M a r c h 2 0 1 9 A p p e n d i c e s
C P S C | 5 1
Control ID Program
2018KM4.1.01 Communications
Strategic Goal
Goal 4: Communication
Strategic Objective
4.1: Improve usefulness and availability of consumer product safety information
Performance Measure Statement
Percentage of positive responses about usefulness of information received from CPSC communication channels
Definition of Performance Measure
The percentage is computed as the number of positive responses (scores of 4 or 5 on a 5-point scale) to the relevant survey question, divided by the total number of responses to the question. The relevant survey question is Question #1: "How useful was the information we presented today?"
Rationale for Performance Measure
Measures responses directly from an audience that has listened to a CPSC safety outreach presentation.
2014 Actual 2015 Actual 2016 Actual 2017 Actual 2018 Actual 2018 Target Target Met?
-- -- -- 92.3% 92% 82%
Analysis
The target was 82%; the FY 2018 actual result was 92%, which exceeded the FY 2018 target, but was slightly below the prior fiscal year’s result.
Plan(s) for Improving Performance
Some of the venues for CPSC’s communication events are not conducive to collecting questionnaire responses from attendees. This measure will be discontinued in FY 2019.
Data Source
"How are we doing?" Questionnaire
Data Collection Method and Computation
All positive responses—4s or 5s on a 5-point scale—are tallied, divided by the total number of completed questionnaires.
Data Limitations and Implications of the Reported Results
Data are limited to the completed questionnaires received for this measure. The measure will be discontinued in FY 2019.
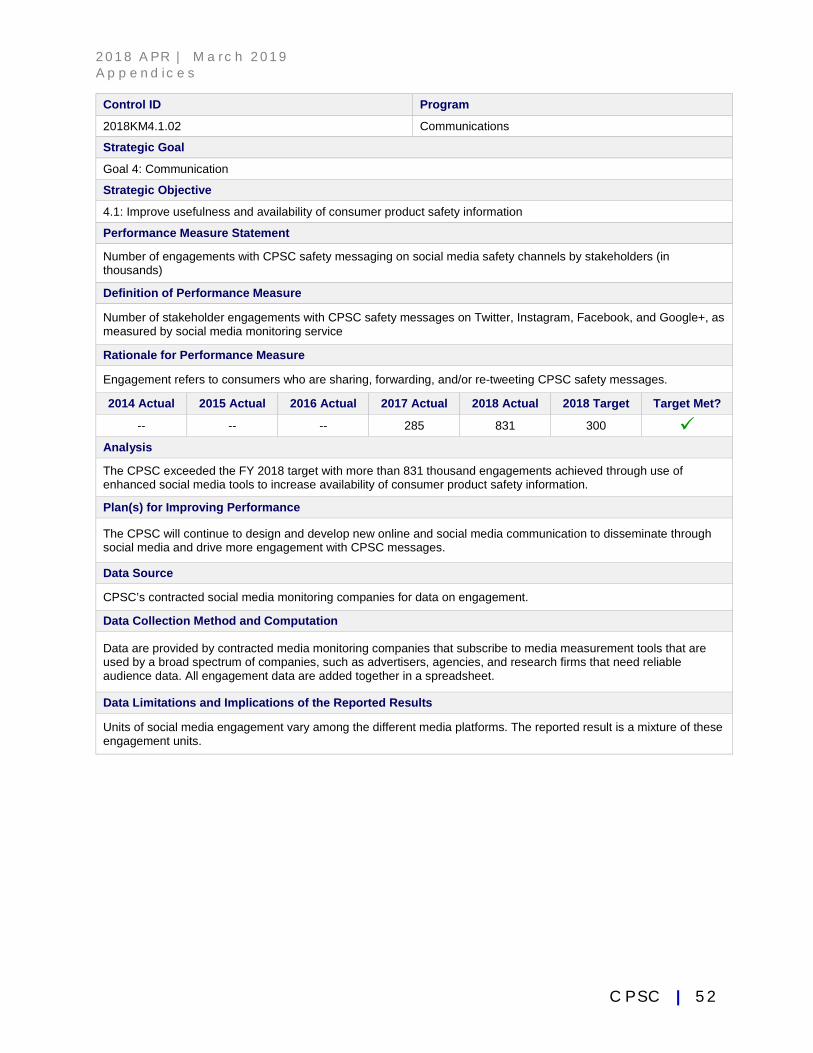
2 0 1 8 AP R | M a r c h 2 0 1 9 A p p e n d i c e s
C P S C | 5 2
Control ID Program
2018KM4.1.02 Communications
Strategic Goal
Goal 4: Communication
Strategic Objective
4.1: Improve usefulness and availability of consumer product safety information
Performance Measure Statement
Number of engagements with CPSC safety messaging on social media safety channels by stakeholders (in thousands)
Definition of Performance Measure
Number of stakeholder engagements with CPSC safety messages on Twitter, Instagram, Facebook, and Google+, as measured by social media monitoring service
Rationale for Performance Measure
Engagement refers to consumers who are sharing, forwarding, and/or re-tweeting CPSC safety messages.
2014 Actual 2015 Actual 2016 Actual 2017 Actual 2018 Actual 2018 Target Target Met?
-- -- -- 285 831 300 Analysis
The CPSC exceeded the FY 2018 target with more than 831 thousand engagements achieved through use of enhanced social media tools to increase availability of consumer product safety information.
Plan(s) for Improving Performance
The CPSC will continue to design and develop new online and social media communication to disseminate through social media and drive more engagement with CPSC messages.
Data Source
CPSC’s contracted social media monitoring companies for data on engagement.
Data Collection Method and Computation
Data are provided by contracted media monitoring companies that subscribe to media measurement tools that are used by a broad spectrum of companies, such as advertisers, agencies, and research firms that need reliable audience data. All engagement data are added together in a spreadsheet.
Data Limitations and Implications of the Reported Results
Units of social media engagement vary among the different media platforms. The reported result is a mixture of these engagement units.
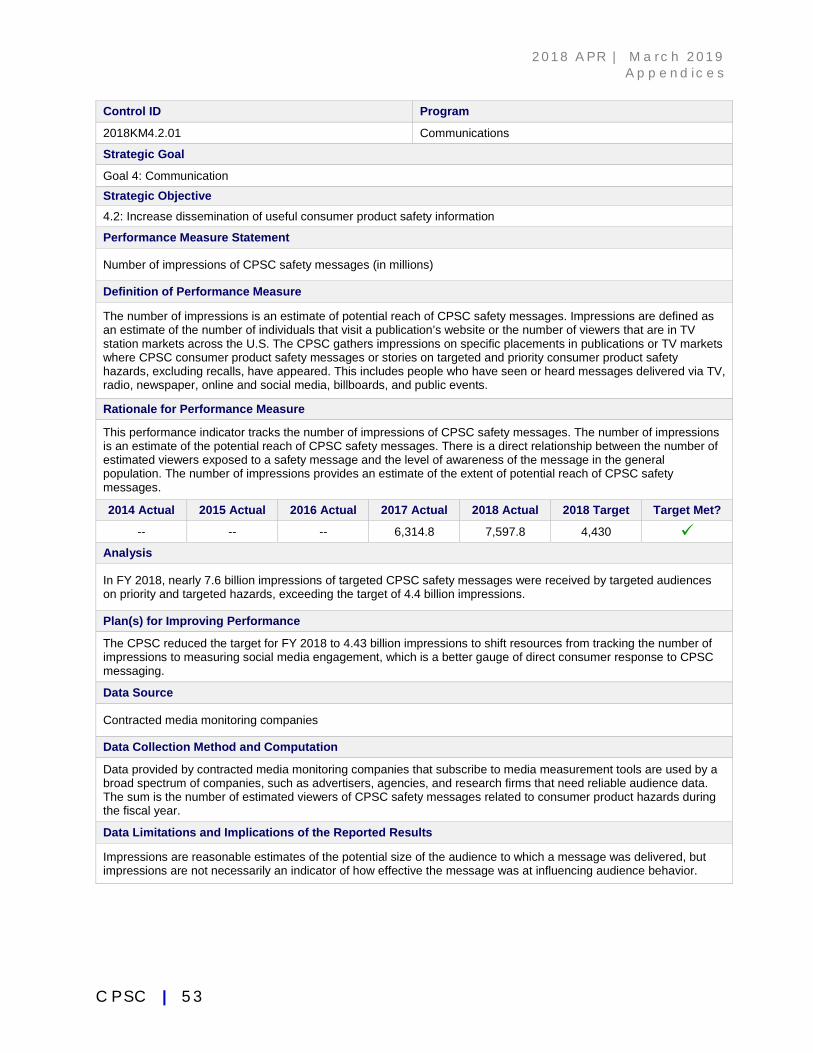
2 0 1 8 AP R | M a r c h 2 0 1 9 A p p e n d i c e s
C P S C | 5 3
Control ID Program
2018KM4.2.01 Communications
Strategic Goal
Goal 4: Communication
Strategic Objective 4.2: Increase dissemination of useful consumer product safety information
Performance Measure Statement
Number of impressions of CPSC safety messages (in millions)
Definition of Performance Measure
The number of impressions is an estimate of potential reach of CPSC safety messages. Impressions are defined as an estimate of the number of individuals that visit a publication’s website or the number of viewers that are in TV station markets across the U.S. The CPSC gathers impressions on specific placements in publications or TV markets where CPSC consumer product safety messages or stories on targeted and priority consumer product safety hazards, excluding recalls, have appeared. This includes people who have seen or heard messages delivered via TV, radio, newspaper, online and social media, billboards, and public events.
Rationale for Performance Measure
This performance indicator tracks the number of impressions of CPSC safety messages. The number of impressions is an estimate of the potential reach of CPSC safety messages. There is a direct relationship between the number of estimated viewers exposed to a safety message and the level of awareness of the message in the general population. The number of impressions provides an estimate of the extent of potential reach of CPSC safety messages.
2014 Actual 2015 Actual 2016 Actual 2017 Actual 2018 Actual 2018 Target Target Met?
-- -- -- 6,314.8 7,597.8 4,430 Analysis
In FY 2018, nearly 7.6 billion impressions of targeted CPSC safety messages were received by targeted audiences on priority and targeted hazards, exceeding the target of 4.4 billion impressions.
Plan(s) for Improving Performance
The CPSC reduced the target for FY 2018 to 4.43 billion impressions to shift resources from tracking the number of impressions to measuring social media engagement, which is a better gauge of direct consumer response to CPSC messaging.
Data Source
Contracted media monitoring companies
Data Collection Method and Computation
Data provided by contracted media monitoring companies that subscribe to media measurement tools are used by a broad spectrum of companies, such as advertisers, agencies, and research firms that need reliable audience data. The sum is the number of estimated viewers of CPSC safety messages related to consumer product hazards during the fiscal year.
Data Limitations and Implications of the Reported Results
Impressions are reasonable estimates of the potential size of the audience to which a message was delivered, but impressions are not necessarily an indicator of how effective the message was at influencing audience behavior.
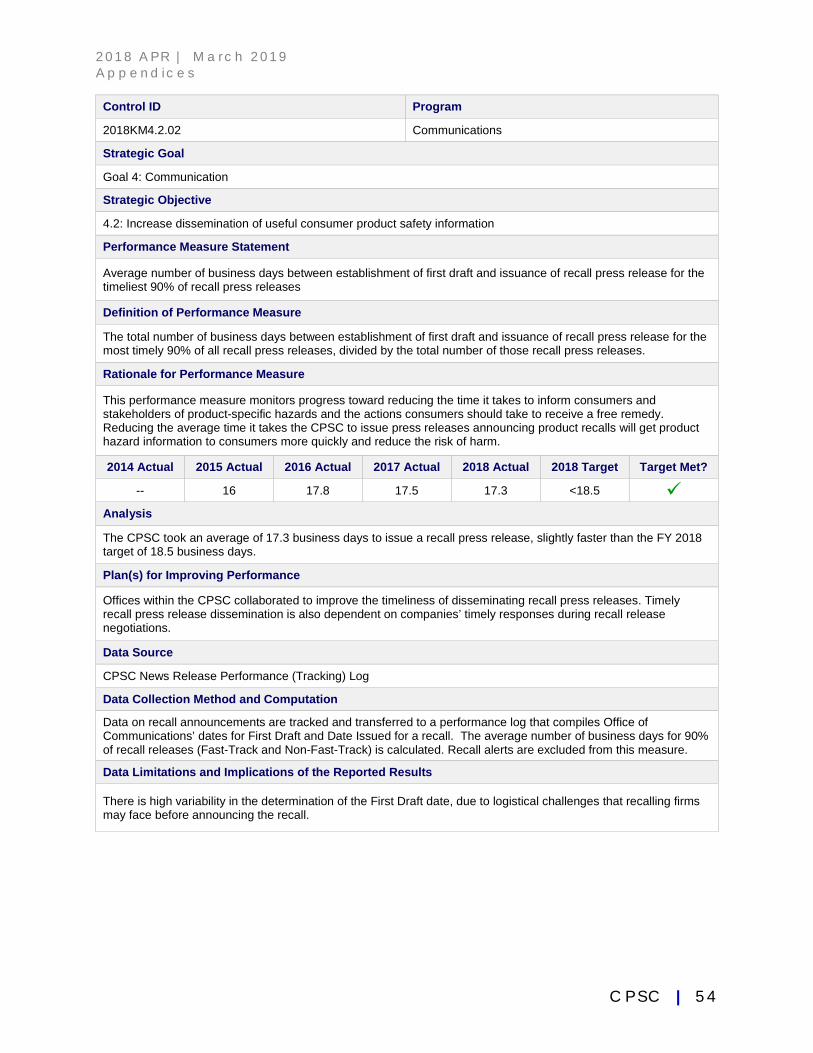
2 0 1 8 AP R | M a r c h 2 0 1 9 A p p e n d i c e s
C P S C | 5 4
Control ID Program
2018KM4.2.02 Communications
Strategic Goal
Goal 4: Communication
Strategic Objective
4.2: Increase dissemination of useful consumer product safety information
Performance Measure Statement
Average number of business days between establishment of first draft and issuance of recall press release for the timeliest 90% of recall press releases
Definition of Performance Measure
The total number of business days between establishment of first draft and issuance of recall press release for the most timely 90% of all recall press releases, divided by the total number of those recall press releases.
Rationale for Performance Measure
This performance measure monitors progress toward reducing the time it takes to inform consumers and stakeholders of product-specific hazards and the actions consumers should take to receive a free remedy. Reducing the average time it takes the CPSC to issue press releases announcing product recalls will get product hazard information to consumers more quickly and reduce the risk of harm.
2014 Actual 2015 Actual 2016 Actual 2017 Actual 2018 Actual 2018 Target Target Met?
-- 16 17.8 17.5 17.3 <18.5 Analysis
The CPSC took an average of 17.3 business days to issue a recall press release, slightly faster than the FY 2018 target of 18.5 business days.
Plan(s) for Improving Performance
Offices within the CPSC collaborated to improve the timeliness of disseminating recall press releases. Timely recall press release dissemination is also dependent on companies’ timely responses during recall release negotiations.
Data Source
CPSC News Release Performance (Tracking) Log
Data Collection Method and Computation
Data on recall announcements are tracked and transferred to a performance log that compiles Office of Communications’ dates for First Draft and Date Issued for a recall. The average number of business days for 90% of recall releases (Fast-Track and Non-Fast-Track) is calculated. Recall alerts are excluded from this measure.
Data Limitations and Implications of the Reported Results
There is high variability in the determination of the First Draft date, due to logistical challenges that recalling firms may face before announcing the recall.
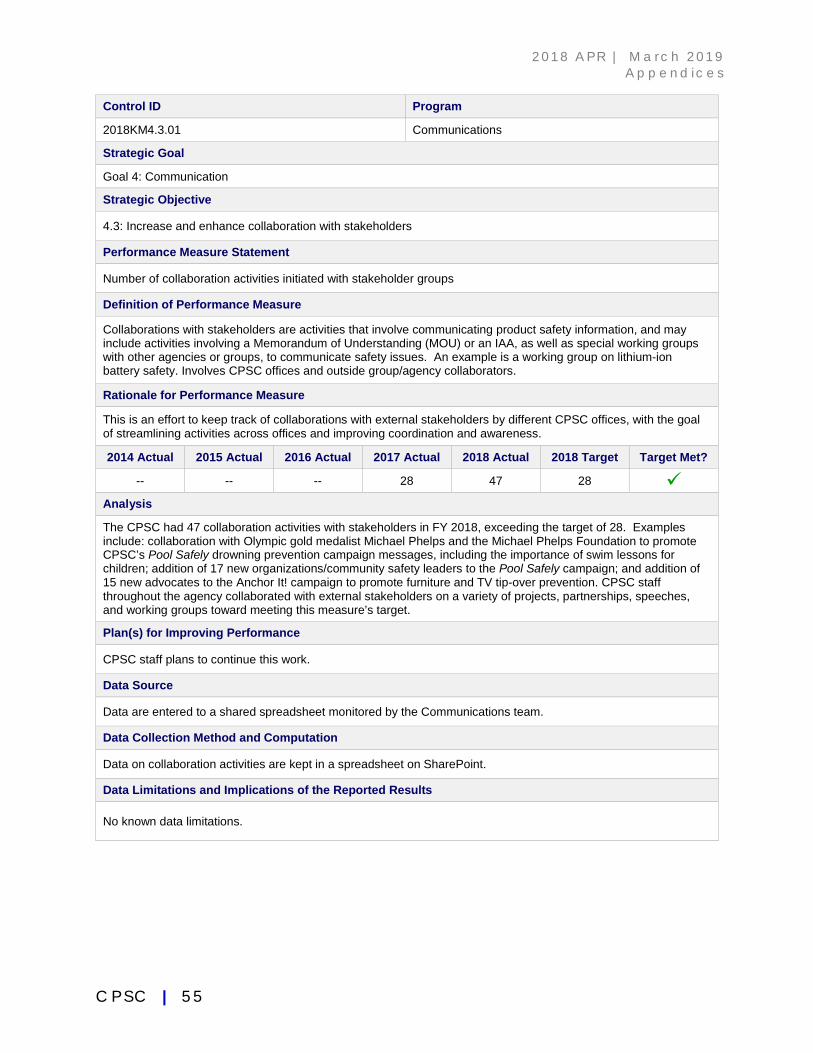
2 0 1 8 AP R | M a r c h 2 0 1 9 A p p e n d i c e s
C P S C | 5 5
Control ID Program
2018KM4.3.01 Communications
Strategic Goal
Goal 4: Communication
Strategic Objective
4.3: Increase and enhance collaboration with stakeholders
Performance Measure Statement
Number of collaboration activities initiated with stakeholder groups
Definition of Performance Measure
Collaborations with stakeholders are activities that involve communicating product safety information, and may include activities involving a Memorandum of Understanding (MOU) or an IAA, as well as special working groups with other agencies or groups, to communicate safety issues. An example is a working group on lithium-ion battery safety. Involves CPSC offices and outside group/agency collaborators.
Rationale for Performance Measure
This is an effort to keep track of collaborations with external stakeholders by different CPSC offices, with the goal of streamlining activities across offices and improving coordination and awareness.
2014 Actual 2015 Actual 2016 Actual 2017 Actual 2018 Actual 2018 Target Target Met?
-- -- -- 28 47 28 Analysis
The CPSC had 47 collaboration activities with stakeholders in FY 2018, exceeding the target of 28. Examples include: collaboration with Olympic gold medalist Michael Phelps and the Michael Phelps Foundation to promote CPSC’s Pool Safely drowning prevention campaign messages, including the importance of swim lessons for children; addition of 17 new organizations/community safety leaders to the Pool Safely campaign; and addition of 15 new advocates to the Anchor It! campaign to promote furniture and TV tip-over prevention. CPSC staff throughout the agency collaborated with external stakeholders on a variety of projects, partnerships, speeches, and working groups toward meeting this measure’s target.
Plan(s) for Improving Performance
CPSC staff plans to continue this work.
Data Source
Data are entered to a shared spreadsheet monitored by the Communications team.
Data Collection Method and Computation
Data on collaboration activities are kept in a spreadsheet on SharePoint.
Data Limitations and Implications of the Reported Results
No known data limitations.
2 0 1 8 AP R | M a r c h 2 0 1 9 A p p e n d i c e s
C P S C | 5 6
Appendix D: Acronyms
APR Annual Performance Report CAP Corrective Action Plan CBP U.S. Customs and Border Protection CDC U.S. Centers for Disease Control and Prevention CFR Code of Federal Regulations CPSC U.S. Consumer Product Safety Commission CPSIA Consumer Product Safety Improvement Act
CPSRMS Consumer Product Safety Risk Assessment Management System CTAC Commercial Targeting and Analysis Center DCM Dynamic Case Management System EEI Employee Engagement Index ESC Enterprise Services Center EXFM Office of Financial Management, Planning, and Evaluation EXIP Office of International Programs FEVS Federal Employee Viewpoint Survey FTE Full-time Equivalent FY Fiscal Year HHS U.S. Department of Health and Human Services IAA Interagency Agreement IDP Individual Development Plan IFS Integrated Field System ISSLoB Information Systems Security Line of Business ITDS International Trade Data System NEISS National Electronic Injury Surveillance System NNCO National Nanotechnology Coordination Office NNI National Nanotechnology Initiative OCM Office of Communications OMB Office of Management and Budget PBR Performance Budget Request PD Preliminary Determination RAM Risk Assessment Methodology SDR Strategic Data Review

2 0 1 8 AP R | M a r c h 2 0 1 9 A p p e n d i c e s
U.S. Consumer Product Safety Commission Bethesda, MD 20814
Related Documents