FY 2017 OREGON TRANSPORTATION NEEDS AND ISSUES FINAL REPORT

Welcome message from author
This document is posted to help you gain knowledge. Please leave a comment to let me know what you think about it! Share it to your friends and learn new things together.
Transcript

FY 2017 OREGON TRANSPORTATION NEEDS AND ISSUES
FINAL REPORT


FY 2017 OREGON TRANSPORTATION NEEDS AND ISSUES SURVEY
Summary of Statewide Results
SPR-043
by
Tony Knudson
Oregon Department of Transportation Research Section 555 13th St. NE
Salem, OR 97301
for
Oregon Department of Transportation Research Section 555 13th St. NE
Salem, OR 97301
December 2017


i
Technical Report Documentation Page
1. Report No.FHWA-OR-PR-17-02
2. Government Accession No. 3. Recipient’s Catalog No.
4. Title and Subtitle
FY 2017 Oregon Transportation Needs and Issues Survey
5. Report DateDecember 2016
6. Performing Organization Code
7. Author(s)Tony Knudson
8. Performing Organization Report No.
9. Performing Organization Name and Address
Oregon Department of TransportationResearch Section555 13th St. NESalem, OR 97301
10. Work Unit No. (TRAIS)
11. Contract or Grant No.SPR 043RS 500-161
12. Sponsoring Agency Name and Address
Oregon Department of TransportationResearch Section555 13th St. NESalem, OR 97301
13. Type of Report and Period Covered
Summary Report
14. Sponsoring Agency Code
15. Supplementary Notes
16. Abstract
The Oregon Transportation Needs and Issues Survey was first conducted in 1993 and has been done roughly every two years. The latest survey was completed in Autumn 2016 (State fiscal year (FY) 2017). This report summarizes the results of the FY 2017 survey. For some reoccurring questions, results are also compared to past surveys.
17. Key Words PUBLIC OPINION, CUSTOMER SATISFACTION, TRANSPORTATION PLANNING, TAXES, TOLLS
18. Distribution Statement
Copies available from NTIS, and online at http://www.oregon.gov/ODOT/TD/TP_RES/
19. Security Classification (of this report)Unclassified
20. Security Classification (of this page)Unclassified
21. No. of Pages78
22. Price
Technical Report Form DOT F 1700.7 (8-72) Reproduction of completed page authorized Printed on recycled paper


ii
SI* (MODERN METRIC) CONVERSION FACTORS APPROXIMATE CONVERSIONS TO SI UNITS APPROXIMATE CONVERSIONS FROM SI UNITS
Symbol When You Know Multiply By To Find Symbol Symbol When You Know Multiply By To Find Symbol
LENGTH LENGTH in inches 25.4 millimeters mm mm millimeters 0.039 Inches in ft feet 0.305 meters m m meters 3.28 feet ft yd yards 0.914 meters m m meters 1.09 yards yd mi miles 1.61 kilometers km km kilometers 0.621 miles mi
AREA AREA in2 square inches 645.2 millimeters squared mm2 mm2 millimeters squared 0.0016 square inches in2
ft2 square feet 0.093 meters squared m2 m2 meters squared 10.764 square feet ft2 yd2 square yards 0.836 meters squared m2 m2 meters squared 1.196 square yards yd2 ac acres 0.405 hectares ha ha hectares 2.47 acres ac mi2 square miles 2.59 kilometers squared km2 km2 kilometers squared 0.386 square miles mi2
VOLUME VOLUME fl oz fluid ounces 29.57 milliliters ml ml milliliters 0.034 fluid ounces fl oz gal gallons 3.785 liters L L liters 0.264 gallons gal ft3 cubic feet 0.028 meters cubed m3 m3 meters cubed 35.315 cubic feet ft3 yd3 cubic yards 0.765 meters cubed m3 m3 meters cubed 1.308 cubic yards yd3
NOTE: Volumes greater than 1000 L shall be shown in m3.
MASS MASS oz ounces 28.35 grams g g grams 0.035 ounces oz lb pounds 0.454 kilograms kg kg kilograms 2.205 pounds lb T short tons (2000 lb) 0.907 megagrams Mg Mg megagrams 1.102 short tons (2000 lb) T
TEMPERATURE (exact) TEMPERATURE (exact)
°F Fahrenheit (F-32)/1.8 Celsius °C °C Celsius 1.8C+32 Fahrenheit °F
*SI is the symbol for the International System of Measurement

iii

iv
ACKNOWLEDGEMENTS
The author wishes to thank the members of the Needs and Issues Steering Committee, who provided the oversight and guidance for this project:
• Tony Knudson, ODOT Research Section (chair) • Travis Brouwer, ODOT Chief of Staff • Tom Fuller, ODOT Communications • Ken Franklin, ODOT Highway Division • Dinah VanDerHyde, ODOT Public Transit Division • Bob Melbo, ODOT Rail Division • Amanda Pietz, ODOT Transportation Development Division • Collen O’Hogan, ODOT Transportation Safety Division • Kathryn Ryan, ODOT Driver and Motor Vehicles Division • Phillip Kase, ODOT Office of the Director • Maureen Bock, ODOT OReGO Program Manager • Carley Francis, RUC Program Manager
In addition, the author would like to acknowledge Virginia Lesser and Lydia Newton of the Oregon State University Survey Research Center for their contribution and expertise in designing and conducting the survey and compiling the data.
DISCLAIMER
This document is disseminated under the sponsorship of the Oregon Department of Transportation and the United States Department of Transportation in the interest of information exchange. The State of Oregon and the United States Government assume no liability of its contents or use thereof. The contents of this report reflect the view of the author who is solely responsible for the facts and accuracy of the material presented. The contents do not necessarily reflect the official views of the Oregon Department of Transportation or the United States Department of Transportation. The State of Oregon and the United States Government do not endorse products of manufacturers. Trademarks or manufacturers’ names appear herein only because they are considered essential to the object of this document. This report does not constitute a standard, specification, or regulation.

v
vi
FY 2013 OREGON TRANSPORTATION NEEDS AND ISSUES SURVEY: SUMMARY OF STATEWIDE RESULTS
TABLE OF CONTENTS
1.0 INTRODUCTION............................................................................................................. 1
1.1 BACKGROUND AND PURPOSE OF THE SURVEY ................................................................. 1 1.2 METHODOLOGY ............................................................................................................... 1
1.2.1 Weighting ............................................................................................................................................... 2 1.3 ORGANIZATION OF THE RESULTS ..................................................................................... 2
2.0 SURVEY FINDINGS........................................................................................................ 3
2.1 FUNDING .......................................................................................................................... 3 2.1.1 Fuel Taxes .............................................................................................................................................. 3 2.1.2 Toll Roads .............................................................................................................................................. 5 2.1.3 Mileage Fees .......................................................................................................................................... 6
2.2 SPENDING ........................................................................................................................ 8 2.3 SATISFACTION WITH ODOT SERVICES .......................................................................... 10 2.4 PUBLIC TRANSPORTATION ............................................................................................. 11 2.5 HIGHWAY ...................................................................................................................... 13
2.5.1 Highway and Bridge Conditions Compared to Other States ............................................................... 13 2.5.2 Highway and Bridge Conditions Compared to Ten Years Ago ........................................................... 14 2.5.3 Construction and Work Zones ............................................................................................................. 14 2.5.4 Traffic Congestion ............................................................................................................................... 15
2.6 RAIL ............................................................................................................................... 17 2.7 DRIVER AND MOTOR VEHICLE (DMV) SERVICES .......................................................... 18 2.8 TRAVEL CHOICES AND BEHAVIOR ................................................................................. 20
2.8.1 Perceptions of Safety Using Various Modes of Transportation ........................................................... 20 2.8.2 Travel Behavior ................................................................................................................................... 22 2.8.3 Perceptions of Climate Change ........................................................................................................... 24
2.9 OVERALL AGENCY PERFORMANCE ................................................................................ 25 2.10 TRAVELER INFORMATION .............................................................................................. 27
3.0 OPINION TRENDS 2006-2016 ..................................................................................... 31
3.1 SATISFACTION WITH ODOT SERVICES AND ACTIVITIES ................................................ 31 3.2 FUNDING ........................................................................................................................ 33 3.3 OVERALL AGENCY PERFORMANCE ................................................................................ 35 3.4 CONGESTION TRENDS .................................................................................................... 36 3.5 PERCENT LICENSED DRIVERS ........................................................................................ 37 3.6 SAFETY TRENDS ............................................................................................................. 38
4.0 RESPONDENTS’ COMMENTS ................................................................................... 40
5.0 CONCLUSION ............................................................................................................... 41
APPENDIX A: RESPONDENT DEMOGRAPHICS .............................................................. 43
APPENDIX B: FY 2017 SURVEY INSTRUMENT .................................................................. 2

vii
LIST OF FIGURES
Figure 1.1: ODOT Regions............................................................................................................................................ 1 Figure 2.1: Value and adequacy of the Oregon gas tax ................................................................................................. 3 Figure 2.2: Perceived value of gas tax by region ........................................................................................................... 4 Figure 2.3: Perceived adequacy of gas tax by region .................................................................................................... 5 Figure 2.4: Most fair method to increase funding and attitudes towards tolls ............................................................... 6 Figure 2.5: Attitudes towards potential mileage based usage fees ................................................................................. 7 Figure 2.6: Attitudes towards charging all vehicles a user fee by region ...................................................................... 8 Figure 2.7: Importance of where ODOT funds are spent .............................................................................................. 9 Figure 2.8: Level of satisfaction with ODOT services ................................................................................................ 11 Figure 2.9: Ridership percentages for public transportation options ........................................................................... 12 Figure 2.10: Satisfaction with public transportation options ....................................................................................... 12 Figure 2.11: ODOT's roads and bridges compared to other states ............................................................................... 13 Figure 2.12: Condition of ODOT's roads and bridges compared to ten years ago ...................................................... 14 Figure 2.13: Levels of satisfaction with construction and work zones ........................................................................ 15 Figure 2.14: Seriousness of traffic congestion and importance of expanding or maintaining highways ..................... 16 Figure 2.15: Attitudes towards congestion by area ...................................................................................................... 16 Figure 2.16: Preferences for expanding or preserving the highways by area .............................................................. 17 Figure 2.17: Reasons for not using Amtrak Cascades in the last three years .............................................................. 18 Figure 2.18: Use of and satisfaction with DMV services ............................................................................................ 19 Figure 2.19: Attitudes toward current and future DMV services ................................................................................. 20 Figure 2.20: Perceived level of safety for vehicles, bikes, pedestrians, and facilities ................................................. 21 Figure 2.21: Attitudes towards ODOT's efforts to make night driving safer ............................................................... 22 Figure 2.22: Commuter (work or school) mode choice ............................................................................................... 23 Figure 2.23: Commuting behavior change factors ....................................................................................................... 24 Figure 2.24: Attitudes towards transportation's effect on climate change ................................................................... 25 Figure 2.25: Rating of ODOT's overall performance .................................................................................................. 26 Figure 2.26: Attitude towards ODOT's overall performance by region ....................................................................... 27 Figure 2.27: Respondents' choices for first source of traveler information ................................................................. 28 Figure 2.28: Traveler information sources respondents want to have available .......................................................... 29 Figure 3.1: Opinion of ODOT services (FY 2007 – FY 2017) .................................................................................... 32 Figure 3.2: Satisfaction with DMV Services (FY 2007 – FY 2017) ........................................................................... 33 Figure 3.3: Opinon of gas tax adequacy and value over time (FY 2007 – FY 2017) .................................................. 34 Figure 3.4: Importance of ODOT funding trend (FY 2007 – FY 2017) ...................................................................... 35 Figure 3.5: Rating of ODOT's overall performance trend (FY 2007 – FY 2017) ........................................................ 36 Figure 3.6: Congestion and funding expansion trend (FY 2007 – FY 2017) ............................................................... 37 Figure 3.7: Percentage of respondents who have a driver's license trend (FY 2007 – FY 2017) ................................ 38 Figure 3.8: Perception of safety for driving, biking, buses, and walking trends (FY 2007 – FY 2017) ...................... 39 Figure 4.1: Word cloud of survey respondents’ comments ......................................................................................... 40 Figure 0.1: Respondents’ age and gender ...................................................................................................................... 1

1
1.0 INTRODUCTION
1.1 BACKGROUND AND PURPOSE OF THE SURVEY
The Oregon Department of Transportation (ODOT) collects data from Oregon residents through the Transportation Needs and Issues Survey to:
• assess perceptions about the transportation system;
• determine how the system is used; and
• identify transportation-related concerns.
The survey was first conducted in FY 1993 and has been done roughly every two years. For each iteration, ODOT has contracted with a survey research center. In FY 1993, 1994, and 1995 ODOT worked with the Gallup Organization; in FY 1998, 2001, 2003, and 2005 ODOT contracted with the Oregon Survey Research Laboratory at the University of Oregon; and the most recent surveys for fiscal years 2007, 2009, 2011, 2013, 2015 and 2017, ODOT worked with the Oregon State University Survey Research Center.
All of the surveys conducted through 2009 used a random digit dialing telephone survey method to achieve a sample of approximately 1,000 Oregon residents. In 2007 and 2009, with the growing popularity of caller identification and the increase in cell phone-only households, supplemental mail and web versions of the survey were also distributed. Analysis of the survey results from 2009 showed a potential bias in the telephone data, and it was determined that the phone survey mode should be discontinued. Therefore, since FY 2011, only web and mail survey modes were sent to over 5,000 households.
1.2 METHODOLOGY
The FY 2017 needs and issues survey consisted of 56 questions, which represented 114 variables (Appendix B). Questions were selected by a project steering committee, which was comprised of representatives from each ODOT Division. The majority of questions have appeared on past needs and issues surveys, some dating as far back as 1996.
The FY 2017 survey was conducted by mail and web. Only adults (age 18 and over) were eligible to take the survey. The survey consisted of a stratified random sample, targeting a proportionate number of responses per ODOT Region (Figure 1.1). The sample size was selected in order to obtain 350 completed surveys per region, which is similar to past surveys. For the web mode, mailed letters introduced the survey and contained a personal access code and instructions for logging onto the survey website.
Figure 1.1: ODOT Regions

2
A total of 1,949 surveys were completed: 469 via the Web, and 1,480 by paper. Households in the mail group were contacted using the United States Post Office (USPS) and received paper questionnaire copies only, whereas households in the mail/web group were also recruited using the USPS, but were asked in the first and second postcards to complete the questionnaire online. The third and fourth contacts with this group contained paper questionnaires just like the mail group. Data from each survey mode (mail and web) were compiled and given a unique identification code. All data were then combined, cleaned, and weighted. The adjusted response rate was 26.2%, a slight increase over the FY 2015 survey. Region 4 had the best adjusted response rate of 27.6%. Region 1 had the best response rate to the web survey (28.5%).
1.2.1 Weighting
The sampling design was a stratified random sample. Therefore, the statewide weighted analyses for these data incorporate sampling weights to reflect the variable selection probabilities within each region. In addition to the sampling weight, a weighting was included to account for household nonresponse which varied slightly by region. Finally, a post-stratification adjustment was done to account for the imbalance due to differential nonresponse across demographic variables. The demographic variables obtained from the completed sample were compared to the latest available data from the 2014 American Community Survey population values for Oregon. As in the past three surveys, age and education for the sample data appeared to be more out of line than other demographic variables with respect to population values (comparisons were made using chi-square tests). In addition, the responses to questions from the questionnaire showed differences across age and education levels. Therefore, these two variables were used to adjust the sample post-stratification.
1.3 ORGANIZATION OF THE RESULTS
The survey results are organized into two sections. Section 2.0 summarizes findings from the FY 2017 survey, and Section 3.0 presents trend analyses of select questions that have also been asked in preceding years. Section 4.0 displays a word cloud of respondents’ comments.

3
2.0 SURVEY FINDINGS
This section of the report presents noteworthy results from the FY 2017 Oregon Transportation Needs and Issues Survey. Results are organized according to topic, such as satisfaction with ODOT services, transportation modes, spending, and funding. Some of the demographics of the respondents can be found in (Appendix A). Except where noted, those respondents who responded “no answer” were dropped from the analysis. The frequencies that are now reported are based on the respondents who had an opinion on the question. Due to rounding, not all percentages will sum to 100%.
2.1 FUNDING
2.1.1 Fuel Taxes The Oregon DOT uses several revenue sources to fund the transportation system, with the gasoline tax being one of the predominant funding sources. The money collected through state gasoline taxes and motor vehicle registration fees goes to build and maintain highways, streets, roads, bridges, and roadside rest areas. Respondents were asked if they felt they were getting a good value for their money from the gasoline tax. They were also asked if the funds collected were adequate for Oregon’s transportation needs (Figure 2.1).
Figure 2.1: Value and adequacy of the Oregon gas tax
4
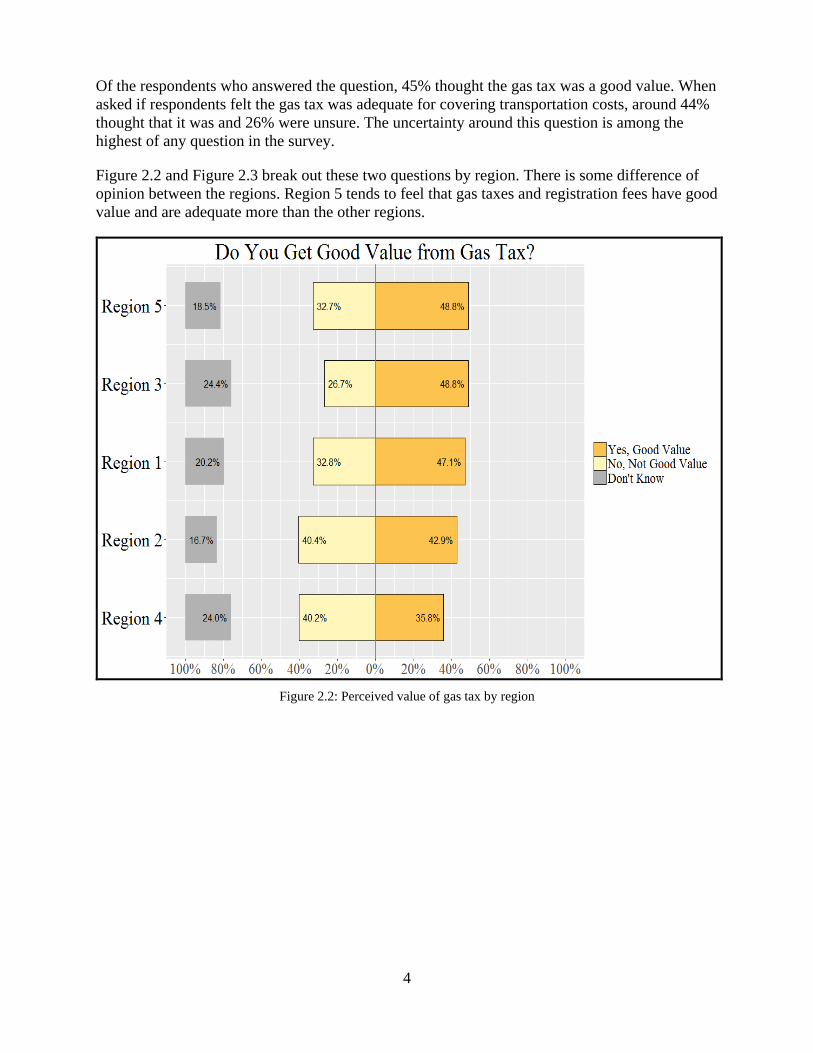
Of the respondents who answered the question, 45% thought the gas tax was a good value. When asked if respondents felt the gas tax was adequate for covering transportation costs, around 44% thought that it was and 26% were unsure. The uncertainty around this question is among the highest of any question in the survey.
Figure 2.2 and Figure 2.3 break out these two questions by region. There is some difference of opinion between the regions. Region 5 tends to feel that gas taxes and registration fees have good value and are adequate more than the other regions.
Figure 2.2: Perceived value of gas tax by region

5
Figure 2.3: Perceived adequacy of gas tax by region
2.1.2 Toll Roads Respondents were also asked, “If more funds had to be raised for transportation projects within the state, which method do you feel would be most fair: increasing the gasoline tax to pay for the facilities; OR charging users of certain facilities a toll that would fund the cost of building and maintaining the facilities; OR increasing vehicle registration fees” (Figure 2.4). Respondents didn’t really favor one method more than another; this question also had a large percentage of respondents who didn’t have a strong opinion.
When asked if they would favor or oppose a road or bridge toll to reduce congestion in their area, 57% of respondents were somewhat or strongly opposed.

6
Figure 2.4: Most fair method to increase funding and attitudes towards tolls
2.1.3 Mileage Fees Oregonians were also asked whether they would support or oppose a mileage based usage fee imposed on electric vehicles, hybrid vehicles, all vehicles or new vehicles built after 2020. Figure 2.5 indicates that Oregonians have more support for a mileage fee on electric vehicles, (51%) than on all vehicles (26%).

7
Figure 2.5: Attitudes towards potential mileage based usage fees
When breaking out these questions by region, there were only a few percentage points of variation in the responses, except for the question of charging all vehicles a user fee. There we see in Figure 2.6 that Region 1 supports the all vehicle fee more than the other regions by over ten percentage points.

8
Figure 2.6: Attitudes towards charging all vehicles a user fee by region
2.2 SPENDING
In addition to funding questions, the survey asked a series of questions to gauge public opinion on spending. The survey provided a list of several expenditure categories (e.g. reducing congestion, increasing bus services between cities, and protecting fish and wildlife habitat), and respondents were asked to rate the importance of spending for each category as “very important,” “somewhat important,” or “not at all important.” The results are shown in (Figure 2.7).

9
Figure 2.7: Importance of where ODOT funds are spent
The highest proportions of satisfaction from respondents were found in the following areas of spending:
• The highest percent of very important responses was with spending funds on maintaining current highways, roads, and bridges (81%), followed by conserving and protecting clean air and water (70%), then reducing traffic congestion (61%).
• The highest percent of important overall (percent very and somewhat important) responses was with spending funds on maintaining current highways, roads, and bridges (99%), improving safety features on roadways (94%), and reducing traffic congestion (92%).
• The highest percent of not at all important responses was with funding to add sidewalks and bike lanes to existing streets (21%), and Amtrak rail service between cities (20%).

10
2.3 SATISFACTION WITH ODOT SERVICES
Survey questions regarding satisfaction with agency services were organized as follows: “very satisfied,” “somewhat satisfied,” “not very satisfied,” and “not at all satisfied”. The very or somewhat satisfaction ratings will be combined to indicate overall satisfaction.
Respondents were prompted to indicate their level of satisfaction with select ODOT services. Results from these questions are highlighted below, and comparison results are shown in Figure 2.8.
Within the satisfaction categories, the following are notable:
• Bridge conditions (smoothness, quietness, durability, and appearance) were found more satisfactory by 76% of respondents, while 68% were satisfied with pavement conditions.
• People were most satisfied with the safety of Oregon highways (such as guardrails, hazard signs, lighting, lane width, warning signs, pavement stripes, shoulder width, and fog lines), which earned an 85% satisfaction rating, and least satisfied about ODOT’s efforts to improve the overall transportation system, including railroads, buses, and transit, which earned a 56% satisfaction rating.
• Respondents were the most dissatisfied with ODOT’s expansion and improvement of highways, roads and bridges to meet state residents’ needs with a 34% unsatisfactory rating.

11
Figure 2.8: Level of satisfaction with ODOT services
2.4 PUBLIC TRANSPORTATION
A series of questions was asked regarding the use and satisfaction with select public transportation services. Respondents were first asked if they had used van pool/rideshare, community bus, and/or services for seniors and individuals with disabilities during the month prior to the survey (Figure 2.9). Only those who had used one or more of the services were asked about their level of satisfaction (Figure 2.10). Of people who had used transportation services:
• 3.7% used seniors and individuals with disabilities services. 88% were satisfied.
• 4.5% used vanpool/rideshare services. 74% were satisfied.
• 18% used the local community bus service. 83% were satisfied.

12
Figure 2.9: Ridership percentages for public transportation options
Figure 2.10: Satisfaction with public transportation options
13
2.5 HIGHWAY
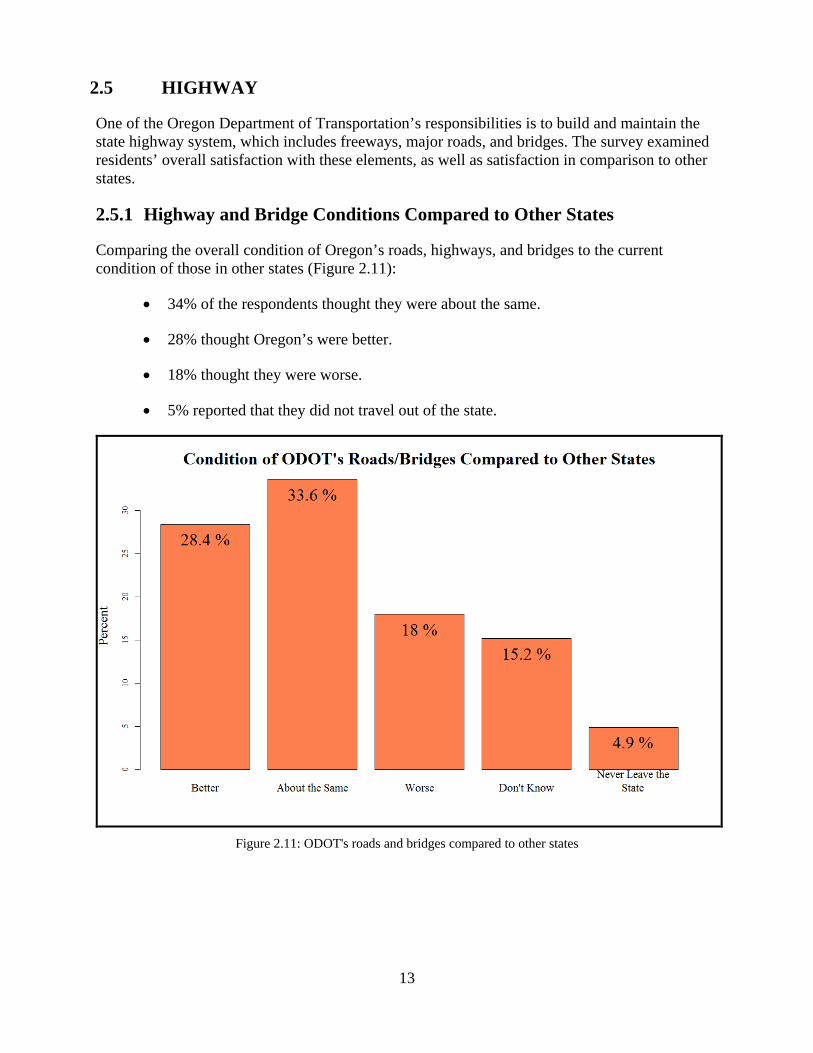
One of the Oregon Department of Transportation’s responsibilities is to build and maintain the state highway system, which includes freeways, major roads, and bridges. The survey examined residents’ overall satisfaction with these elements, as well as satisfaction in comparison to other states.
2.5.1 Highway and Bridge Conditions Compared to Other States
Comparing the overall condition of Oregon’s roads, highways, and bridges to the current condition of those in other states (Figure 2.11):
• 34% of the respondents thought they were about the same.
• 28% thought Oregon’s were better.
• 18% thought they were worse.
• 5% reported that they did not travel out of the state.
Figure 2.11: ODOT's roads and bridges compared to other states

14
2.5.2 Highway and Bridge Conditions Compared to Ten Years Ago
Comparing the overall condition of Oregon’s roads, highways, and bridges to their condition ten years ago (Figure 2.12):
• 40% thought they were about the same.
• 20% thought they were better.
• 25% thought they were worse.
Figure 2.12: Condition of ODOT's roads and bridges compared to ten years ago
2.5.3 Construction and Work Zones
Several questions were asked regarding satisfaction with the impact of road construction and safety in construction work zones. The results from these questions are shown in Figure 2.13.
Within the satisfaction categories, the highest proportions of respondents were found within the following areas:
• Respondents were most satisfied with the overall safety of work zones on major Oregon highways, with 88% responding favorably.

15
• The highest percent of those least satisfied overall (percent not very and not at all satisfied) was with the amount of time it takes to complete roadway construction on major Oregon highways, with 38% responding negatively.
Figure 2.13: Levels of satisfaction with construction and work zones
2.5.4 Traffic Congestion Respondents were asked to rate the seriousness of traffic congestion in their community and whether it was more important to expand roads to reduce congestion or preserve and maintain roads we currently have (Figure 2.14). For the state as a whole:
• 14% did not think that it was a problem.
• 32% thought it was a minor problem.
• 31% saw it as a somewhat serious issue.
• 22% thought that their local traffic congestion was a very serious problem.
• A majority of Oregonians (52%) felt it was more important to preserve and maintain current roads.
There was an 11 percentage point increase over the FY 2015 survey in people who thought traffic congestion was a very serious problem. These results varied the most between Portland

16
and other areas of the state (Figure 2.15). Portland metro residents who felt traffic congestion was very serious (35%), was higher than any other area, this is almost twice as many as in the FY 2015 survey.
Figure 2.14: Seriousness of traffic congestion and importance of expanding or maintaining highways
Figure 2.15: Attitudes towards congestion by area
17
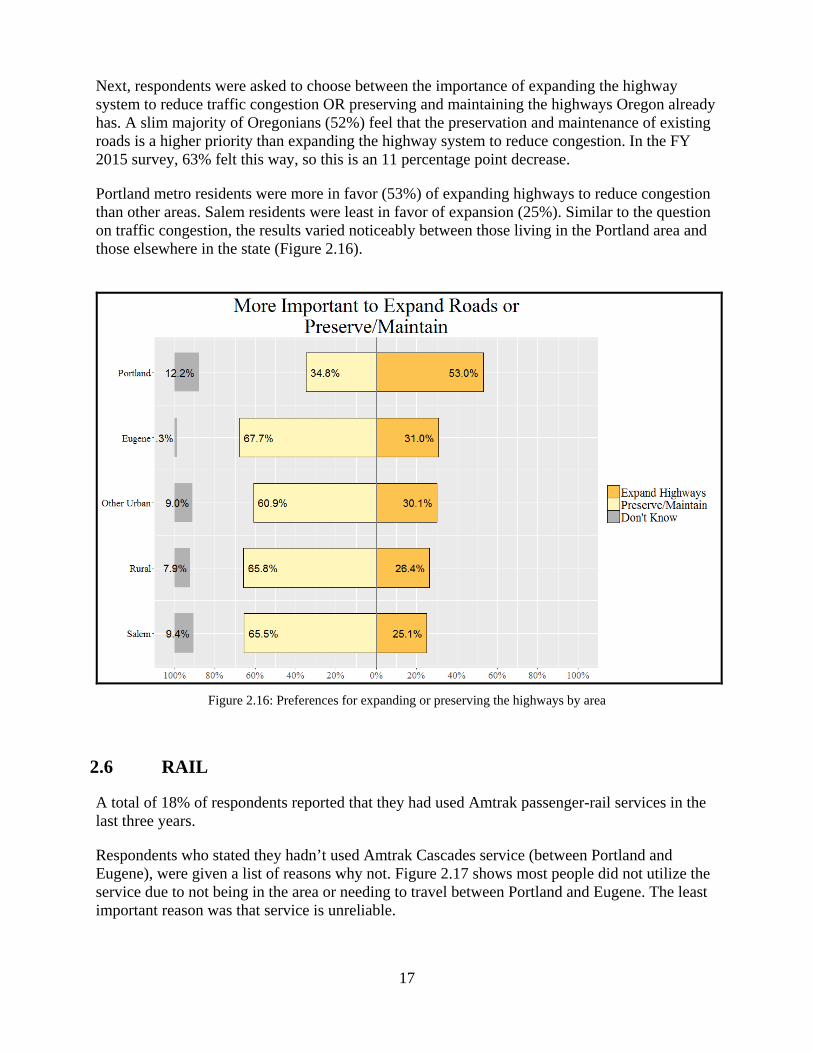
Next, respondents were asked to choose between the importance of expanding the highway system to reduce traffic congestion OR preserving and maintaining the highways Oregon already has. A slim majority of Oregonians (52%) feel that the preservation and maintenance of existing roads is a higher priority than expanding the highway system to reduce congestion. In the FY 2015 survey, 63% felt this way, so this is an 11 percentage point decrease.
Portland metro residents were more in favor (53%) of expanding highways to reduce congestion than other areas. Salem residents were least in favor of expansion (25%). Similar to the question on traffic congestion, the results varied noticeably between those living in the Portland area and those elsewhere in the state (Figure 2.16).
Figure 2.16: Preferences for expanding or preserving the highways by area
2.6 RAIL
A total of 18% of respondents reported that they had used Amtrak passenger-rail services in the last three years.
Respondents who stated they hadn’t used Amtrak Cascades service (between Portland and Eugene), were given a list of reasons why not. Figure 2.17 shows most people did not utilize the service due to not being in the area or needing to travel between Portland and Eugene. The least important reason was that service is unreliable.

18
Figure 2.17: Reasons for not using Amtrak Cascades in the last three years
2.7 DRIVER AND MOTOR VEHICLE (DMV) SERVICES
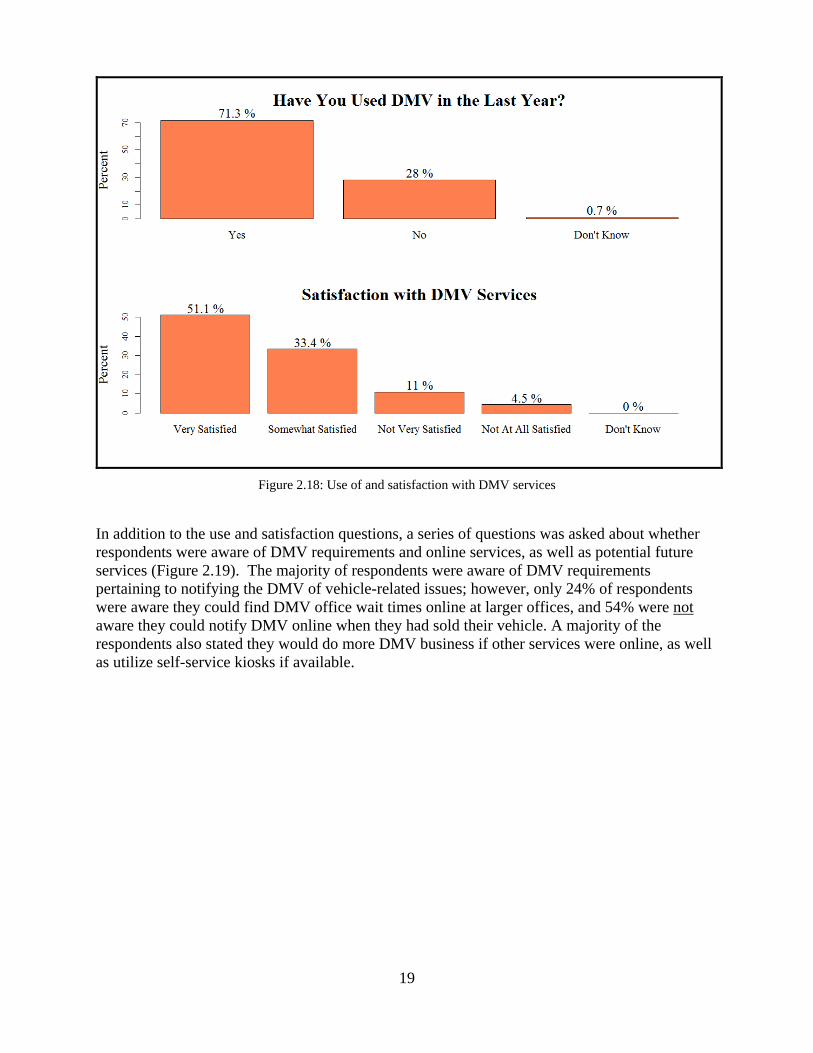
Of the people surveyed, 71% had used a DMV service (licenses, registrations, etc.) in the year prior. Of those people, 85% were satisfied (either somewhat or very) with the service they received (Figure 2.18).
19
Figure 2.18: Use of and satisfaction with DMV services
In addition to the use and satisfaction questions, a series of questions was asked about whether respondents were aware of DMV requirements and online services, as well as potential future services (Figure 2.19). The majority of respondents were aware of DMV requirements pertaining to notifying the DMV of vehicle-related issues; however, only 24% of respondents were aware they could find DMV office wait times online at larger offices, and 54% were not aware they could notify DMV online when they had sold their vehicle. A majority of the respondents also stated they would do more DMV business if other services were online, as well as utilize self-service kiosks if available.

20
Figure 2.19: Attitudes toward current and future DMV services
2.8 TRAVEL CHOICES AND BEHAVIOR
2.8.1 Perceptions of Safety Using Various Modes of Transportation
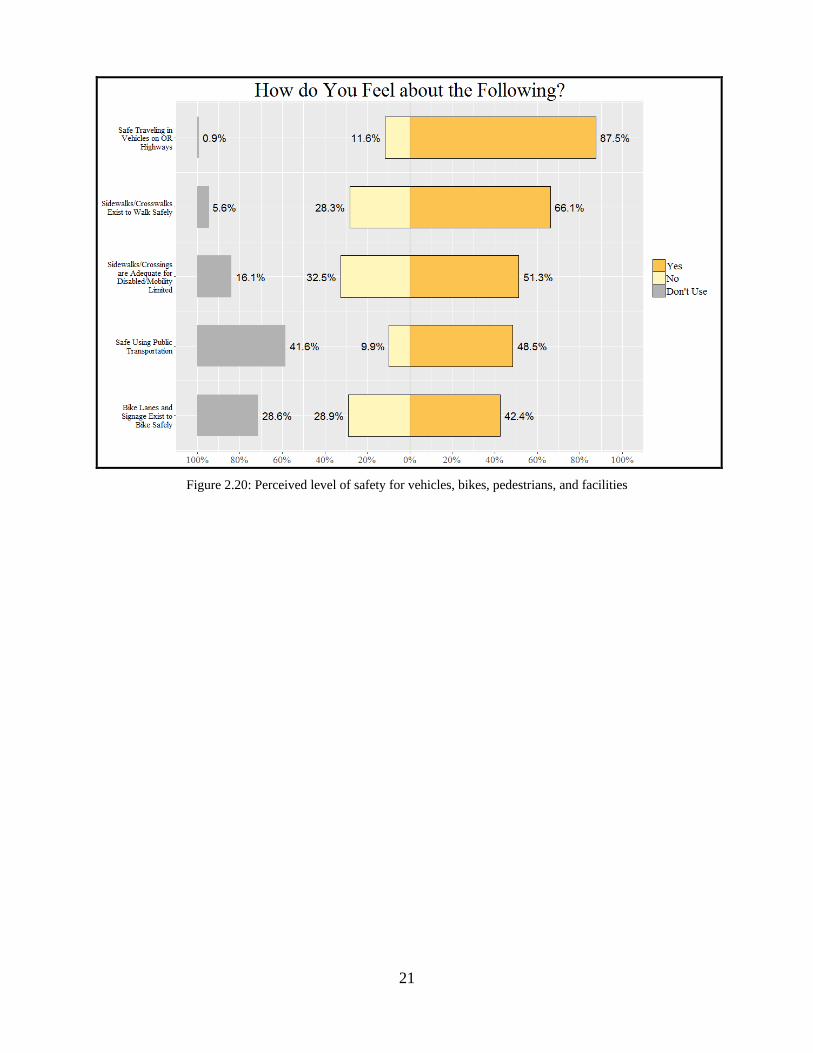
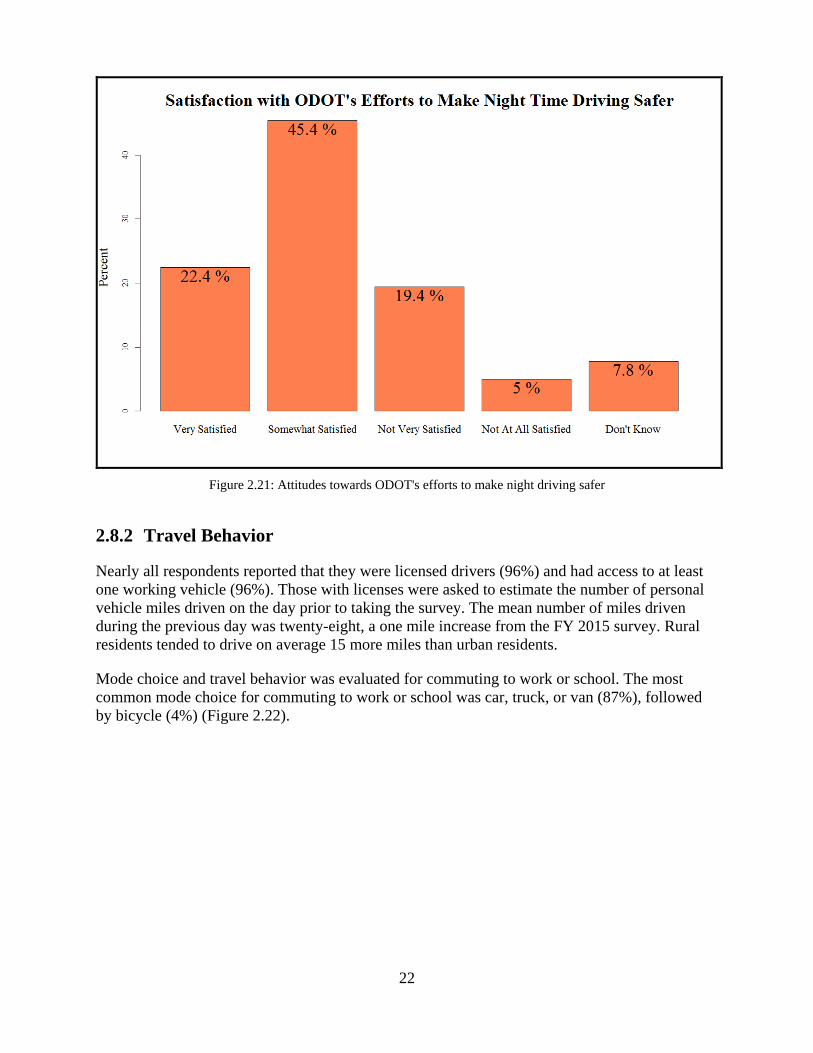
The perceived level of safety using various modes (automobile, public transit, walking, and biking) was evaluated. For each mode, respondents were given the choice of: “yes” (I feel safe), “no” (I do not feel safe) or “I don’t drive/I don’t use [auto/public transit/walk/bike].” The results from these questions are shown in Figure 2.20. People felt most safe driving cars (88%) and least safe bicycling (42%). Figure 2.21 indicates 68% of Oregonians are satisfied with ODOT’s efforts to make night time driving safer.
21
Figure 2.20: Perceived level of safety for vehicles, bikes, pedestrians, and facilities
22
Figure 2.21: Attitudes towards ODOT's efforts to make night driving safer
2.8.2 Travel Behavior
Nearly all respondents reported that they were licensed drivers (96%) and had access to at least one working vehicle (96%). Those with licenses were asked to estimate the number of personal vehicle miles driven on the day prior to taking the survey. The mean number of miles driven during the previous day was twenty-eight, a one mile increase from the FY 2015 survey. Rural residents tended to drive on average 15 more miles than urban residents.
Mode choice and travel behavior was evaluated for commuting to work or school. The most common mode choice for commuting to work or school was car, truck, or van (87%), followed by bicycle (4%) (Figure 2.22).

23
Figure 2.22: Commuter (work or school) mode choice
Commuting alone was the predominant mode choice among all income groups. Of those commuting by car, truck, or van, most (77%) traveled alone, while 18% carpooled. 66% of respondents reported commuting at peak hours (between 3 p.m. and 6 p.m.). This percentage is essentially unchanged from the previous two surveys. The average commute distance was 12 miles and took 24 minutes.
Respondents were asked whether or not they would change how or when they travel to work or school, based on changes to the transportation system (Figure 2.23). The majority of people (53%) said they definitely or possibly would change their behavior if new tolls became required for roadways or bridges they currently use. About 43% of people responded that they would or might change if public transit options such as rail or bus-lines were added or improved in their area. When asked if they might change their commuting habits if biking or walking facilities (bike-lanes, sidewalks) were added or improved in their area, 66% of respondents said they would not.

24
Figure 2.23: Commuting behavior change factors
2.8.3 Perceptions of Climate Change
ODOT is part of an integrated statewide effort to help the state meet its 2050 goal of reducing greenhouse gases. 75% strongly or somewhat agreed that transportation policies and choices can affect climate change (Figure 2.24).

25
Figure 2.24: Attitudes towards transportation's effect on climate change
2.9 OVERALL AGENCY PERFORMANCE
Respondents were asked to rate ODOT’s overall performance: excellent, good, fair, or poor. The majority of Oregonians thought that ODOT was doing a good or excellent job (60%) (Figure 2.25). Although only 8.1% of respondents rated ODOT’s overall performance as poor, this was a four percentage point increase from the FY 2013 survey and is slightly less than the FY 2015 survey.

26
Figure 2.25: Rating of ODOT's overall performance
Figure 2.26 shows how each region feels about the overall job ODOT is doing. Region 3 gave ODOT the highest marks (74%), while Region 2 gave the lowest opinion with (54%).

27
Figure 2.26: Attitude towards ODOT's overall performance by region
2.10 TRAVELER INFORMATION
For information about traffic conditions, weather conditions, road construction, and road closures, Oregonians use the internet first, specifically giving smart phone application as their first choice for traveler information with 28% reporting its use (Figure 2.27), and 26% using TripCheck. Also popular were roadway electronic signs (12%) and TV channels (11%).

28
Figure 2.27: Respondents' choices for first source of traveler information
When asked which forms of communication respondents would like to have available, the top source was electronic signs/boards along highways (80%), followed by TripCheck.com (74%), and then smart phone apps (72%) as shown in Figure 2.28.

29
Figure 2.28: Traveler information sources respondents want to have available

30
31
3.0 OPINION TRENDS 2006-2016
The following section examines how Oregonian’s opinions of the transportation system have varied of over time. Although some survey questions date back to earlier iterations, the trend analysis uses FY 2007 data forward, as these surveys included comparable mail and web modes. In FY 2007 and FY 2009, the survey was also conducted by phone, but the phone data were not used in this analysis, as the phone survey mode was discontinued after FY 2009. The data presented below is weighted, and responses of “No Answer” have been dropped from the calculation.
3.1 SATISFACTION WITH ODOT SERVICES AND ACTIVITIES
The Transportation Needs and Issues Survey consistently asks a large number of questions about the level of satisfaction with a variety of ODOT services. Figure 3.1 shows the percentage of respondents who indicated they were “very satisfied” or “somewhat satisfied” with the particular activity in each year. It highlights four questions in which there appears to be large differences between the years.
In three cases, “Improving the overall transportation system,” “Expanding and improving the highways,” and “Addressing the environmental impacts of the transportation system,” the trend was flat or positive, and the last two surveys show a decrease in respondents’ satisfaction. For satisfaction with enforcing work zone speeds and also bridge conditions, after falling in the last survey, the satisfaction has increased.

32
Figure 3.1: Opinion of ODOT services (FY 2007 – FY 2017)
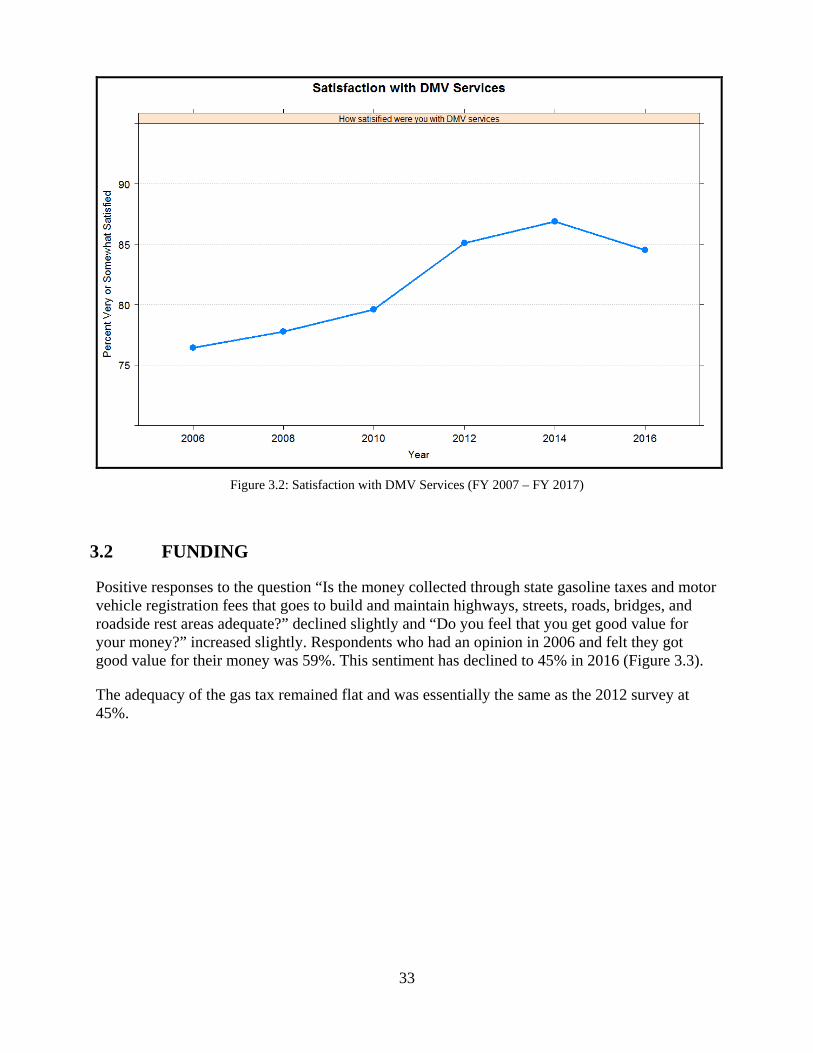
Respondents who had used DMV services in the past year were asked how satisfied they were with how the DMV provides driver licenses and other services. Figure 3.2 shows that satisfaction with DMV services after growing the last few surveys has dropped off slightly.
33
Figure 3.2: Satisfaction with DMV Services (FY 2007 – FY 2017)
3.2 FUNDING
Positive responses to the question “Is the money collected through state gasoline taxes and motor vehicle registration fees that goes to build and maintain highways, streets, roads, bridges, and roadside rest areas adequate?” declined slightly and “Do you feel that you get good value for your money?” increased slightly. Respondents who had an opinion in 2006 and felt they got good value for their money was 59%. This sentiment has declined to 45% in 2016 (Figure 3.3).
The adequacy of the gas tax remained flat and was essentially the same as the 2012 survey at 45%.

34
Figure 3.3: Opinon of gas tax adequacy and value over time (FY 2007 – FY 2017)
Respondents were asked where ODOT should spend its transportation funds and rated several funding options as “important,” “somewhat important,” or “not at all important.” Most questions were flat over the five surveys, but two showed some changes or trends since FY 2007.
“Expanding and improving highways and bridges” continued to increase in importance from 2010, as did “Funding for traffic congestion reduction.” (Figure 3.4).

35
Figure 3.4: Importance of ODOT funding trend (FY 2007 – FY 2017)
3.3 OVERALL AGENCY PERFORMANCE
Each Transportation Needs and Issues Survey has asked, “Overall, how good a job do you think the Oregon Department of Transportation is doing – excellent, good, fair, or poor?” Responses to the question have stayed fairly consistent over time, with the majority of people responding that they thought ODOT was doing either an “excellent” or “good” job. Figure 3.5 shows how responses have varied since the 2006 survey. The percentage who believed ODOT was doing an “excellent” or “good” job has declined an average of about 0.8 percentage points per year since 2006.

36
Figure 3.5: Rating of ODOT's overall performance trend (FY 2007 – FY 2017)
3.4 CONGESTION TRENDS
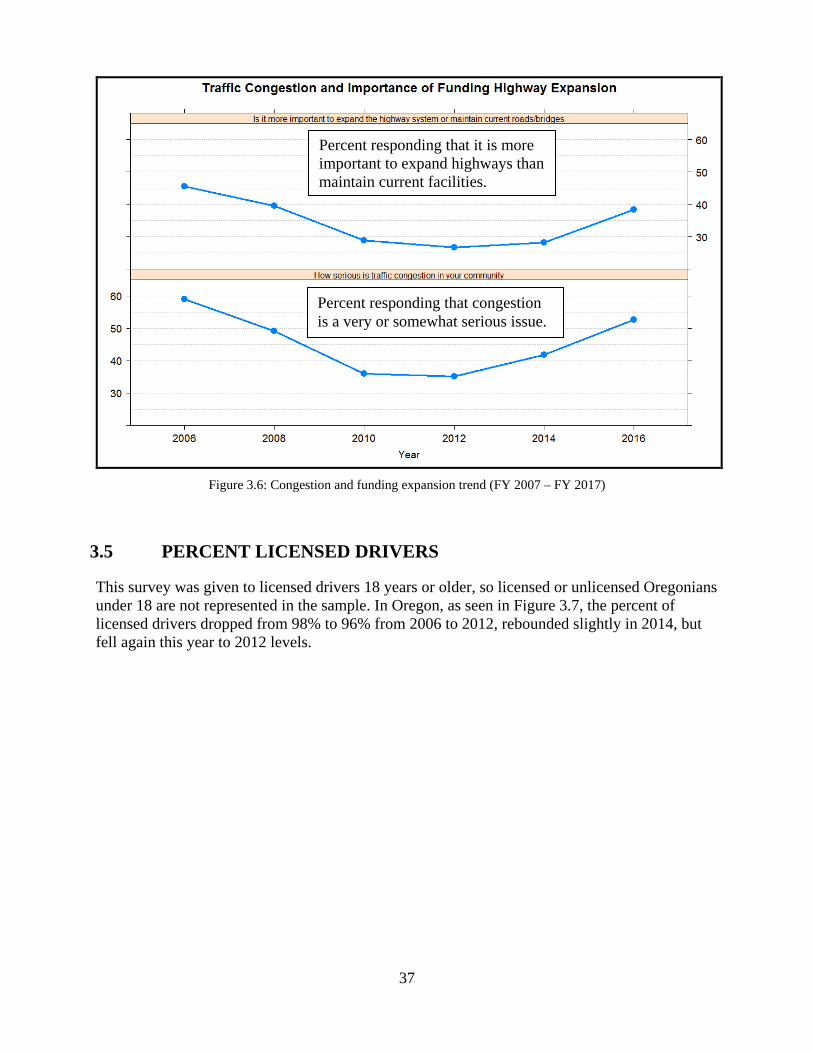
After declining for several years, the percentage of respondents who felt traffic congestion in their community was very or somewhat serious increased for the second straight year as seen in Figure 3.6. That figure also shows a slight increase again, after years of decreases, in the percentage of respondents who feel it is more important to expand highways than to maintain current roads.
37
Figure 3.6: Congestion and funding expansion trend (FY 2007 – FY 2017)
3.5 PERCENT LICENSED DRIVERS
This survey was given to licensed drivers 18 years or older, so licensed or unlicensed Oregonians under 18 are not represented in the sample. In Oregon, as seen in Figure 3.7, the percent of licensed drivers dropped from 98% to 96% from 2006 to 2012, rebounded slightly in 2014, but fell again this year to 2012 levels.
Percent responding that it is more important to expand highways than maintain current facilities.
Percent responding that congestion is a very or somewhat serious issue.

38
Figure 3.7: Percentage of respondents who have a driver's license trend (FY 2007 – FY 2017)
3.6 SAFETY TRENDS
Figure 3.8 shows trends in perceived safety for driving, riding on the bus, bicycling, and walking for respondents who had used the particular travel mode. Though all are mostly flat, bicycling and driving are in modest decline while walking and riding the bus are showing slight upturns. Feeling safe while using public transportation shows the greatest increase in perceived safety in the last two surveys.

39
Figure 3.8: Perception of safety for driving, biking, buses, and walking trends (FY 2007 – FY 2017)

40
4.0 RESPONDENTS’ COMMENTS
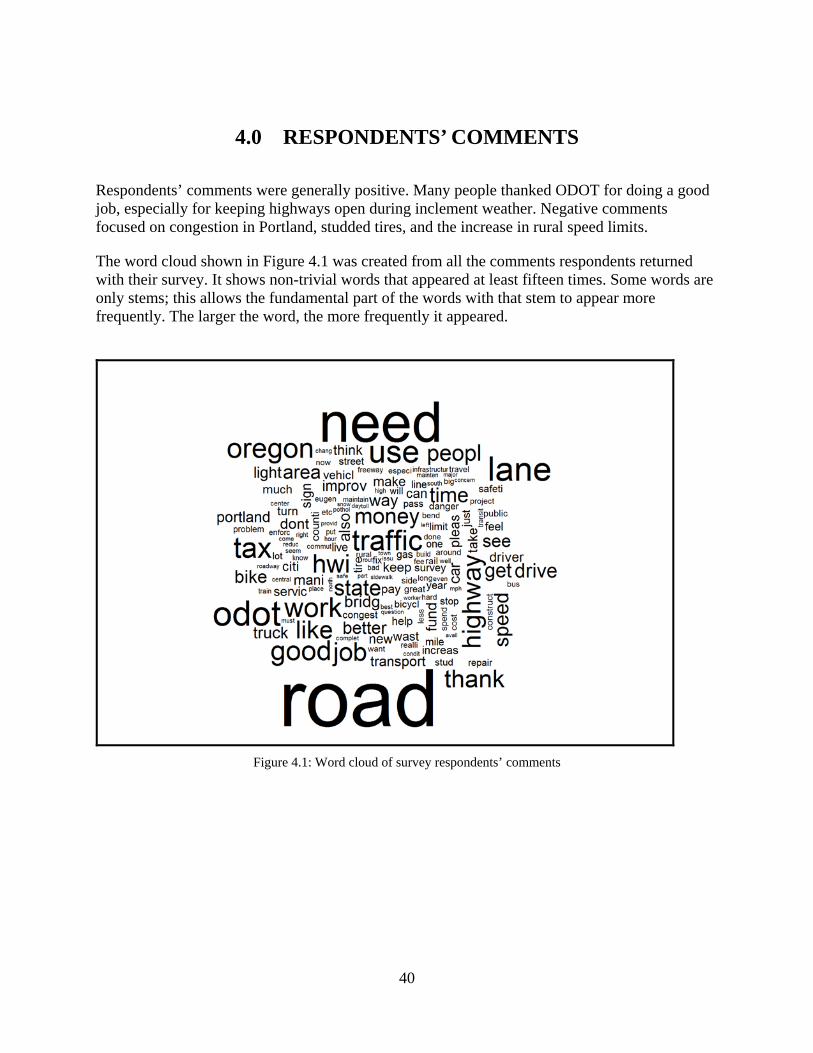
Respondents’ comments were generally positive. Many people thanked ODOT for doing a good job, especially for keeping highways open during inclement weather. Negative comments focused on congestion in Portland, studded tires, and the increase in rural speed limits.
The word cloud shown in Figure 4.1 was created from all the comments respondents returned with their survey. It shows non-trivial words that appeared at least fifteen times. Some words are only stems; this allows the fundamental part of the words with that stem to appear more frequently. The larger the word, the more frequently it appeared.
Figure 4.1: Word cloud of survey respondents’ comments

41
5.0 CONCLUSION
The Transportation Needs and Issues Survey is conducted to assess the opinions of Oregonians regarding the state transportation system. The FY 2017 survey was the 13th iteration of survey in this series.
The FY 2017 survey results were fairly consistent with past needs and issues surveys and reflected mixed opinions. Similar to recent surveys was the ongoing and growing desire of Oregonians to prioritize the maintenance of the system over its expansion; however, there continues to be an increase in concerns about congestion.
A majority of Oregonians felt ODOT was doing an excellent or good job overall, but that overall rating has continued to decline. There has also been a steady decline over the years in the number of respondents who feel they get good value from the gas tax and license/registration fees they pay. There is quite a bit of uncertainty about whether current funding is adequate to maintain the roads and the type of alternative funding that would be beneficial in the future with more electric and hybrid cars on the road.
The 2017 Transportation Needs and Issues Survey was scientifically conducted to gauge the opinions of adult Oregonians on many aspects of the transportation system managed by ODOT. As such, the results of this survey can be said to have a reasonable probability that they are representative of the views of Oregonians. It is a well-known fact in survey research, however, that how a question is posed, as well as what questions are asked, can make a difference in people’s responses. Thus it is advisable that the reader consider the results of this survey in concert with other information on people’s views, rather than taking these results as the final word on how people view the transportation system and ODOT’s role in managing it.

42

APPENDIX A: RESPONDENT DEMOGRAPHICS

A-1
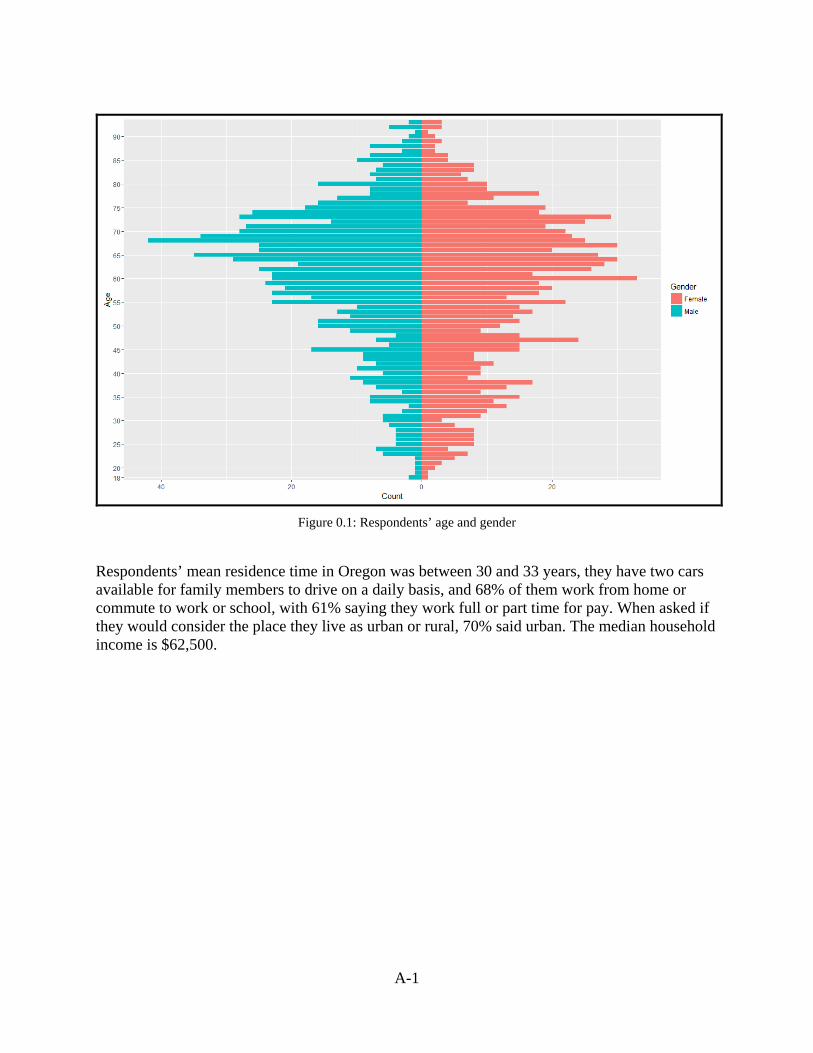
Figure 0.1: Respondents’ age and gender
Respondents’ mean residence time in Oregon was between 30 and 33 years, they have two cars available for family members to drive on a daily basis, and 68% of them work from home or commute to work or school, with 61% saying they work full or part time for pay. When asked if they would consider the place they live as urban or rural, 70% said urban. The median household income is $62,500.

APPENDIX B: FY 2017 SURVEY INSTRUMENT


Photo courtesy of Oregon State University Archives: “Heceta Head,” Gifford Photographic Collection, P218:RG
Oregon Transportation Needs
and Issues Survey
2016
To be completed by the adult (age 18 or over) who has had the most recent birthday in your household.
Information about this study is in the letter you received.
Please return your completed survey in the postage-paid envelope to:
Oregon State University Survey Research Center 239 Weniger Hall
Corvallis, OR 97331-8574

B-1
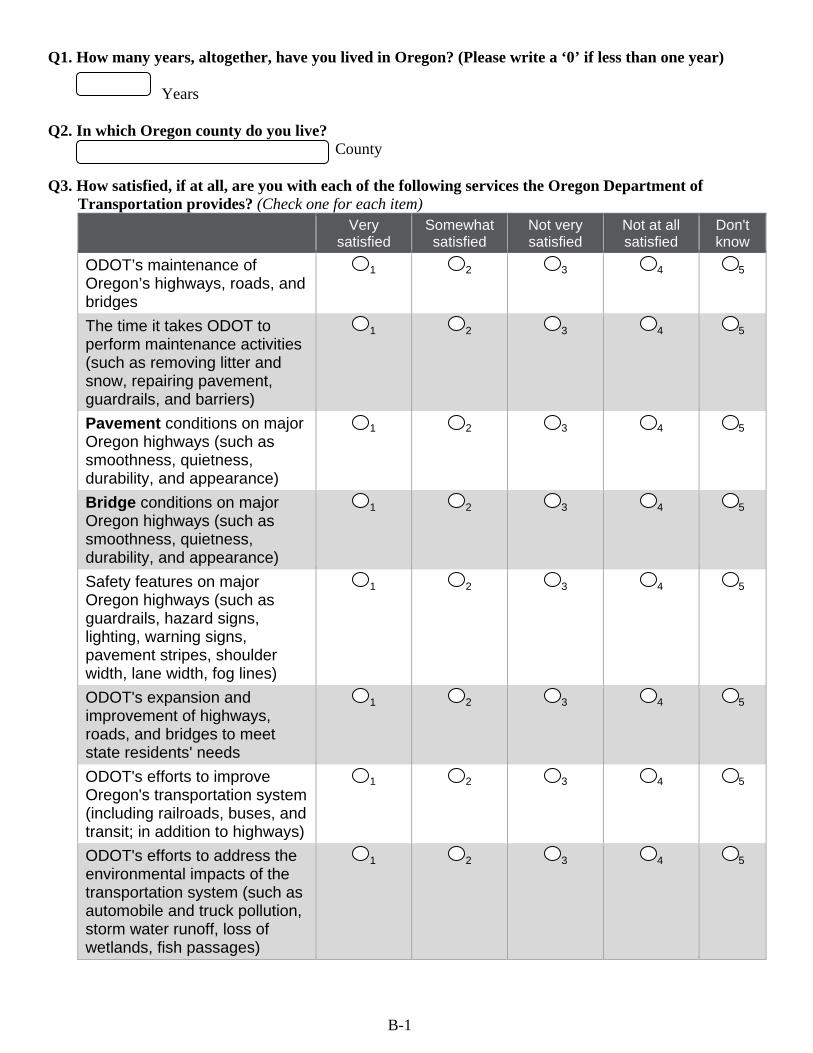
Q1. How many years, altogether, have you lived in Oregon? (Please write a ‘0’ if less than one year) Years Q2. In which Oregon county do you live? County Q3. How satisfied, if at all, are you with each of the following services the Oregon Department of
Transportation provides? (Check one for each item) Very
satisfied Somewhat satisfied
Not very satisfied
Not at all satisfied
Don't know
ODOT’s maintenance of Oregon’s highways, roads, and bridges
1 2 3 4 5
The time it takes ODOT to perform maintenance activities (such as removing litter and snow, repairing pavement, guardrails, and barriers)
1 2 3 4 5
Pavement conditions on major Oregon highways (such as smoothness, quietness, durability, and appearance)
1 2 3 4 5
Bridge conditions on major Oregon highways (such as smoothness, quietness, durability, and appearance)
1 2 3 4 5
Safety features on major Oregon highways (such as guardrails, hazard signs, lighting, warning signs, pavement stripes, shoulder width, lane width, fog lines)
1 2 3 4 5
ODOT's expansion and improvement of highways, roads, and bridges to meet state residents' needs
1 2 3 4 5
ODOT's efforts to improve Oregon's transportation system (including railroads, buses, and transit; in addition to highways)
1 2 3 4 5
ODOT's efforts to address the environmental impacts of the transportation system (such as automobile and truck pollution, storm water runoff, loss of wetlands, fish passages)
1 2 3 4 5
B-2
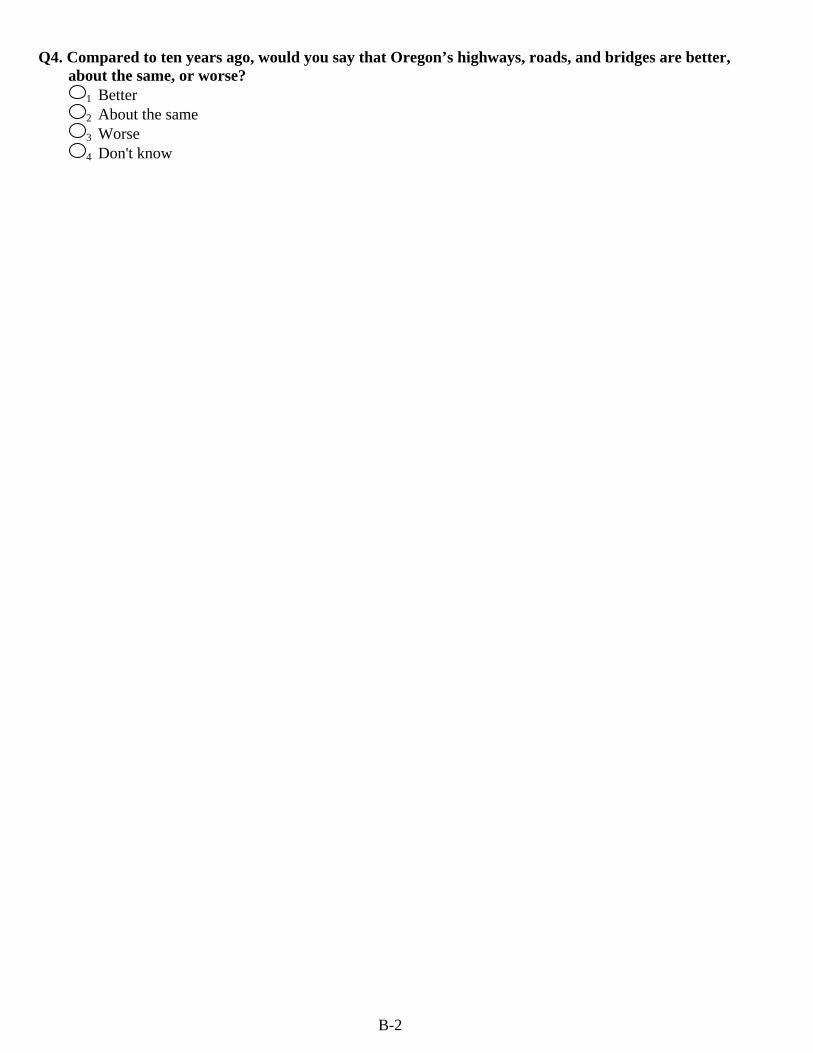
Q4. Compared to ten years ago, would you say that Oregon’s highways, roads, and bridges are better, about the same, or worse?
1 Better 2 About the same 3 Worse 4 Don't know

B-3
Q5. How would you compare the current overall condition of Oregon's highways, roads, and bridges to the current condition of those in other states? Would you say Oregon's are better, about the same, or worse?
1 Better 2 About the same 3 Worse 4 Don't know 5 Never travel out of state
Q6. How satisfied, if at all, are you with each of the following aspects of construction on all major
highways in Oregon, either freeways or highways? (Check one for each item) Very
satisfied Somewhat satisfied
Not very satisfied
Not at all satisfied
Don't know
The enforcement of reduced speeds and other traffic laws in work zones on major highways.
1 2 3 4 5
The overall safety of the work zones on major Oregon highways. This could include warning signs, directional signs, highway markers, or other traffic control.
1 2 3 4 5
The amount of time it takes to complete roadway construction on major Oregon highways.
1 2 3 4 5
Q7. How satisfied, if at all, are you with ODOT's efforts to minimize how work zones affect your travel on
major Oregon highways (such as work zone information, traffic enforcement, safety, delay, and the speed of road repair)?
1 Very satisfied 2 Somewhat satisfied 3 Not very satisfied 4 Not at all satisfied 5 Don't know
Q8. How satisfied, if at all, are you with ODOT's efforts to make night-time driving safer under all
weather conditions by improving lane markings, signage, and lighting? 1 Very satisfied 2 Somewhat satisfied 3 Not very satisfied 4 Not at all satisfied 5 Don't know
Q9. Overall, how good a job do you think the Oregon Department of Transportation is doing: excellent,
good, fair, or poor? 1 Excellent 2 Good 3 Fair 4 Poor 5 Don't know
B-4
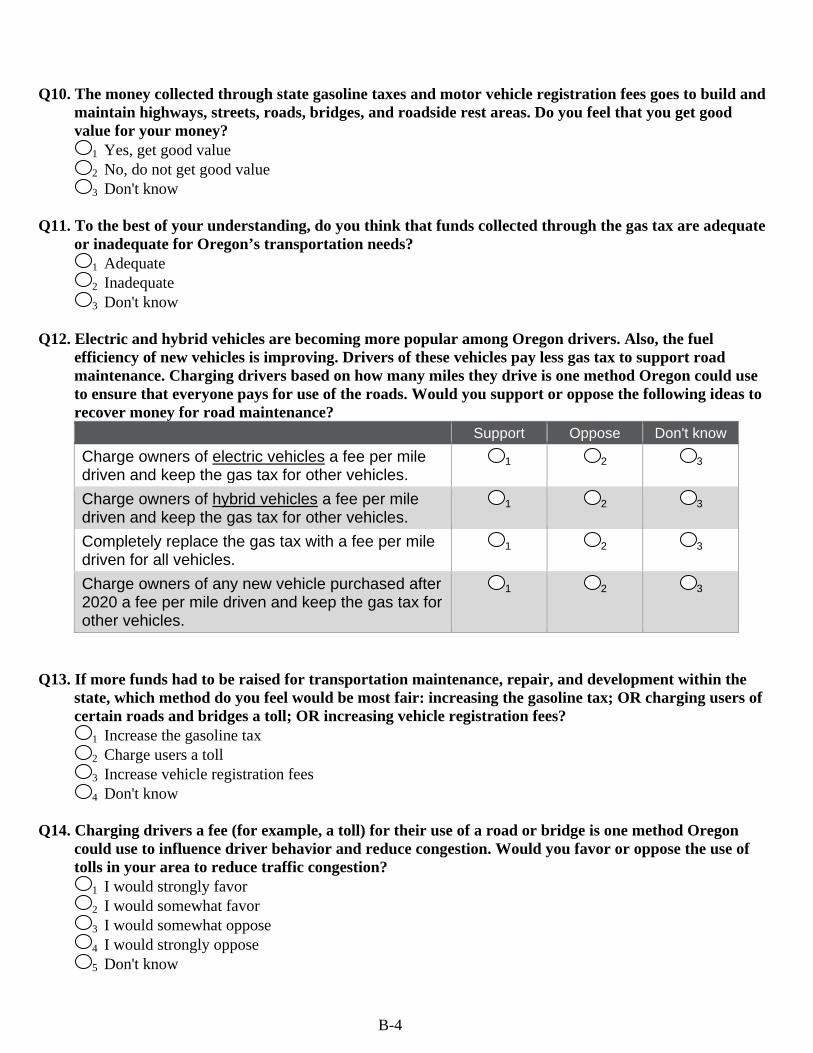
Q10. The money collected through state gasoline taxes and motor vehicle registration fees goes to build and
maintain highways, streets, roads, bridges, and roadside rest areas. Do you feel that you get good value for your money?
1 Yes, get good value 2 No, do not get good value 3 Don't know
Q11. To the best of your understanding, do you think that funds collected through the gas tax are adequate
or inadequate for Oregon’s transportation needs? 1 Adequate 2 Inadequate 3 Don't know
Q12. Electric and hybrid vehicles are becoming more popular among Oregon drivers. Also, the fuel
efficiency of new vehicles is improving. Drivers of these vehicles pay less gas tax to support road maintenance. Charging drivers based on how many miles they drive is one method Oregon could use to ensure that everyone pays for use of the roads. Would you support or oppose the following ideas to recover money for road maintenance?
Support Oppose Don't know Charge owners of electric vehicles a fee per mile driven and keep the gas tax for other vehicles.
1 2 3
Charge owners of hybrid vehicles a fee per mile driven and keep the gas tax for other vehicles.
1 2 3
Completely replace the gas tax with a fee per mile driven for all vehicles.
1 2 3
Charge owners of any new vehicle purchased after 2020 a fee per mile driven and keep the gas tax for other vehicles.
1 2 3
Q13. If more funds had to be raised for transportation maintenance, repair, and development within the
state, which method do you feel would be most fair: increasing the gasoline tax; OR charging users of certain roads and bridges a toll; OR increasing vehicle registration fees?
1 Increase the gasoline tax 2 Charge users a toll 3 Increase vehicle registration fees 4 Don't know
Q14. Charging drivers a fee (for example, a toll) for their use of a road or bridge is one method Oregon
could use to influence driver behavior and reduce congestion. Would you favor or oppose the use of tolls in your area to reduce traffic congestion?
1 I would strongly favor 2 I would somewhat favor 3 I would somewhat oppose 4 I would strongly oppose 5 Don't know
B-5
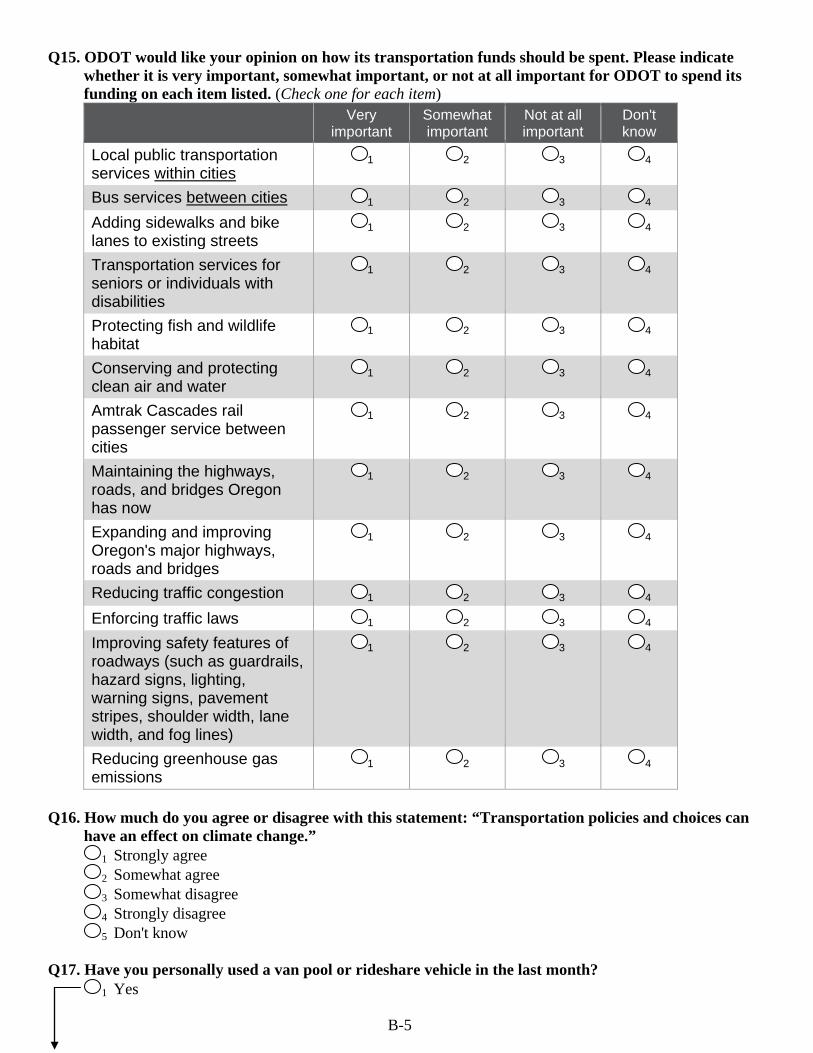
Q15. ODOT would like your opinion on how its transportation funds should be spent. Please indicate whether it is very important, somewhat important, or not at all important for ODOT to spend its funding on each item listed. (Check one for each item)
Very important
Somewhat important
Not at all important
Don't know
Local public transportation services within cities
1 2 3 4
Bus services between cities 1 2 3 4 Adding sidewalks and bike lanes to existing streets
1 2 3 4
Transportation services for seniors or individuals with disabilities
1 2 3 4
Protecting fish and wildlife habitat
1 2 3 4
Conserving and protecting clean air and water
1 2 3 4
Amtrak Cascades rail passenger service between cities
1 2 3 4
Maintaining the highways, roads, and bridges Oregon has now
1 2 3 4
Expanding and improving Oregon's major highways, roads and bridges
1 2 3 4
Reducing traffic congestion 1 2 3 4 Enforcing traffic laws 1 2 3 4 Improving safety features of roadways (such as guardrails, hazard signs, lighting, warning signs, pavement stripes, shoulder width, lane width, and fog lines)
1 2 3 4
Reducing greenhouse gas emissions
1 2 3 4
Q16. How much do you agree or disagree with this statement: “Transportation policies and choices can
have an effect on climate change.” 1 Strongly agree 2 Somewhat agree 3 Somewhat disagree 4 Strongly disagree 5 Don't know
Q17. Have you personally used a van pool or rideshare vehicle in the last month?
1 Yes
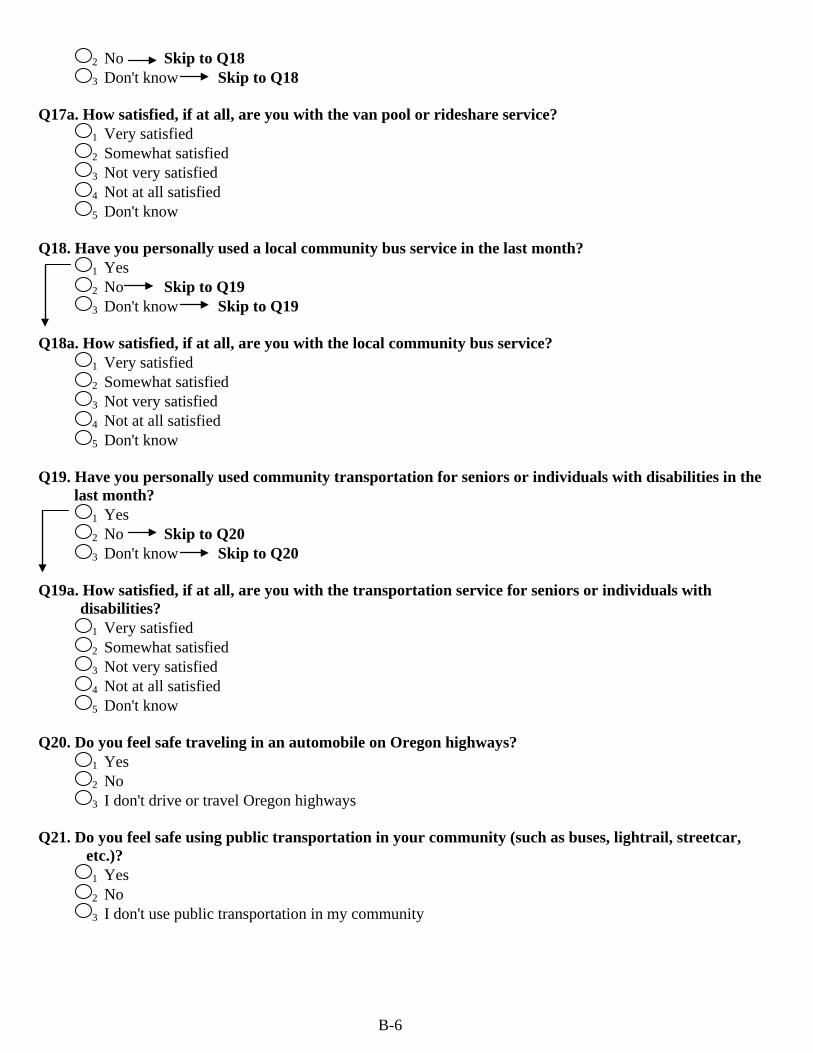
B-6
2 No Skip to Q18 3 Don't know Skip to Q18
Q17a. How satisfied, if at all, are you with the van pool or rideshare service?
1 Very satisfied 2 Somewhat satisfied 3 Not very satisfied 4 Not at all satisfied 5 Don't know
Q18. Have you personally used a local community bus service in the last month?
1 Yes 2 No Skip to Q19 3 Don't know Skip to Q19
Q18a. How satisfied, if at all, are you with the local community bus service?
1 Very satisfied 2 Somewhat satisfied 3 Not very satisfied 4 Not at all satisfied 5 Don't know
Q19. Have you personally used community transportation for seniors or individuals with disabilities in the
last month? 1 Yes 2 No Skip to Q20 3 Don't know Skip to Q20
Q19a. How satisfied, if at all, are you with the transportation service for seniors or individuals with
disabilities? 1 Very satisfied 2 Somewhat satisfied 3 Not very satisfied 4 Not at all satisfied 5 Don't know
Q20. Do you feel safe traveling in an automobile on Oregon highways?
1 Yes 2 No 3 I don't drive or travel Oregon highways
Q21. Do you feel safe using public transportation in your community (such as buses, lightrail, streetcar,
etc.)? 1 Yes 2 No 3 I don't use public transportation in my community

B-7
Q22. Do you feel you have the necessary sidewalks, crosswalks and crossing signals to walk safely in your community?
1 Yes 2 No 3 I don't walk in my community
Q23. Do you feel you have the necessary bike lanes, pavement markings and signage to bicycle safely in
your community? 1 Yes 2 No 3 I don't ride a bike in my community
Q24. Do you feel your community sidewalks are free of obstructions and are adequately constructed for
people who use assistive mobility devices such as walkers, wheelchairs, canes, scooters, etc.? 1 Yes 2 No 3 Don't know
Q25. How serious of a problem is traffic congestion in your community: very serious, somewhat serious, a
minor problem, or no problem at all? 1 Very serious 2 Somewhat serious 3 A minor problem 4 No problem at all 5 Don't know
Q26. Do you think it is more important for ODOT to expand the highway system to reduce traffic
congestion OR to preserve and maintain the highways Oregon already has? 1 Expand highway system 2 Preserve and maintain 3 Don't know
Q27. The Driver and Motor Vehicle Services Division of ODOT (also known as DMV), provides driver
licenses, vehicle registrations and other services. Have you used any DMV services in the past year?
1 Yes 2 No Skip to Q32 on page 8 3 Don't know Skip to Q32 on page 8
Q28. How satisfied, if at all, are you with the way the DMV provides driver licenses and other services?
1 Very satisfied 2 Somewhat satisfied 3 Not very satisfied 4 Not at all satisfied

B-8
Q29. Before receiving this survey, were you aware that you could do each of the following online at the DMV Website (www.Oregondmv.com)?
Yes, was aware No, was not aware Renew your vehicle registration 1 2 Change your address 1 2 Notify DMV that you sold your vehicle 1 2 View wait times for several of the larger offices
1 2
Q30. Would you do more business with DMV online if additional services, more than what is listed in Q29,
were available? 1 Yes 2 No 3 Don't know/not applicable
Q31. Would you use self-service kiosks to purchase DMV products, such as vehicle registration tags, if
those were available? 1 Yes 2 No 3 Don't know/not applicable
Q32. Have you used the Amtrak Cascades train service to start or end a trip in Oregon anytime within the
last three years?
1 Don’t know Skip to Q33 on page 9 2 Yes Skip to Q32b on page 9 3 No
Q32a. Please indicate whether or not each of the following is a reason for not using the Amtrak
Cascades service.
A reason Not a
reason I don’t live in the part of the state with Amtrak Cascades service (between Portland and Eugene).
1 2
Using Amtrak Cascades does not fit my needs. 1 2 The location of the station is inconvenient for me. 1 2 It costs too much. 1 2 The service is unreliable. 1 2 The service is not frequent enough to meet my schedule. 1 2 I am not familiar with Amtrak Cascades train service in Oregon.
1 2
Since you have not used Amtrak Cascades in the last 3 years, please skip now to Question 33 on page 9.

B-9
Q32b. For many years, northbound Amtrak trains left Eugene at 5:30 and 9:00 in the morning and
southbound trains departed Portland at 6:15 and 9:10 at night. In January 2014 the schedule was rearranged to provide morning and evening trains in both directions from Eugene and Portland. How have these schedule changes affected your use of Amtrak?
1 Use has increased 2 Use has decreased 3 No change in use Skip to Q33 4 Don't know Skip to Q33
Q32c. Why has your ridership increased, what is the most important reason?
Q32d. Why has your ridership decreased, what is the most important reason?

B-10
Q33. When you need information about traffic conditions, weather conditions, road construction, road
closures, and transit information, what source of travel information do you use first? (Select one) 1 Electronic signs or reader boards along the highway 2 Radio broadcasts 3 Information centers at parks and rest areas 4 Tripcheck.com for live conditions through online video cameras 5 Other internet site 6 Smart Phone application 7 Free (1-800) or the 511 informational telephone number 8 A TV channel 9 Don't know 10 Other (describe _________________________)
Q34. Please indicate whether or not you would like to have available to you each of the following forms of
travel information. Yes No Don't know
Electronic signs or reader boards along the highway
1 2 3
Radio broadcasts 1 2 3 Information centers at parks and rest areas
1 2 3
Tripcheck.com for live conditions through online video cameras
1 2 3
Other internet sites 1 2 3 Smart Phone application 1 2 3 Free (1-800) or the 511 informational telephone number
1 2 3
A TV channel 1 2 3 Google transit directions 1 2 3 Transit information on Tripcheck.com
1 2 3
Other (describe_____________)
1 2 3
The following and final questions are for statistical purposes only. They allow your responses to be grouped with those of others with similar backgrounds. Please remember that all the information you provide will remain strictly confidential. Q35. Are you a licensed driver?
1 Yes 2 No Skip to Q38

B-11
Q36. How many miles did you drive a personal vehicle yesterday, apart from any driving you did while on the job? Include any miles you drove to and from work, but do not include miles driven as part of your job. If you are not sure, please give your best estimate.
Miles Q37. Please indicate the day of the week you are filling out this questionnaire.
1 Monday 3 Wednesday 5 Friday 7 Sunday 2 Tuesday 4 Thursday 6 Saturday
Q38. How many licensed drivers are living in your household (include yourself if applicable)? Licensed drivers in household Q39. How many motor vehicles (such as cars, vans, light trucks, and motorcycles) are available for
members of your household to drive on a daily basis? Include borrowed vehicles but only include vehicles which operate.
Vehicles available in household Q40. Have you used studded snow traction tires on one or more of your vehicles in the last 12 months?
1 Yes 2 No 3 Not applicable Q41. Do you usually work from home, are not employed outside the home, or do you commute to work or
school? 1 Work from home Skip to Q47 on page 11 2 Not employed outside the home or retired Skip to Q47 on page 11 3 Commute to work or school
Q42. How do you usually get to work or school? (Select one)
1 Car, truck or van Q42a. How many people, including yourself, typically ride with you to work or school in this car, truck, or van?
People
2 Public bus 3 Railroad, lightrail, MAX, or streetcar 4 Taxi or Uber 5 Motorcycle or scooter 6 Bicycle 7 Walk 8 Other (describe ____________________)
Q43. On average, how many minutes does it usually take you to get to work or school? Minutes
Q44. On average, how many miles do you travel to get to work or school? Miles

B-12
Q45. Does your commute to or from work or school typically occur between 3pm and 6pm?
1 Yes 2 No
Q46. Please indicate whether or not you would change how or when you travel to work or school if any of
the following changed for you. Definitely would
change Possibly would
change Would not
change Don't know
New tolls became required for roadways or bridges that you currently use
1 2 3 4
Biking or walking facilities (bike lanes, sidewalks) were added or improved in your area
1 2 3 4
Public transit options were added or improved in your area such as rail or bus lines
1 2 3 4
Q47. How many adults, age 18 or older, including yourself, live in your household? Include all adults
living there half-time or more. Adults in household Q48. How many dependents were you responsible for during 2015? Dependents include any qualifying
child or relative for whom you paid at least 1/2 of their expenses. A qualifying child must have lived with you at least 6 months out of the 2015 year.
Dependents in 2015
Q49. Would you consider the place you live as urban (within city limits) or rural? 1 Urban, suburban (within city limits) 2 Rural 3 Other (describe ____________________) 4 Don't know
Q50. How old were you on your last birthday? Years Q51. What is your gender?
1 Male 2 Female 3 Transgender
B-13
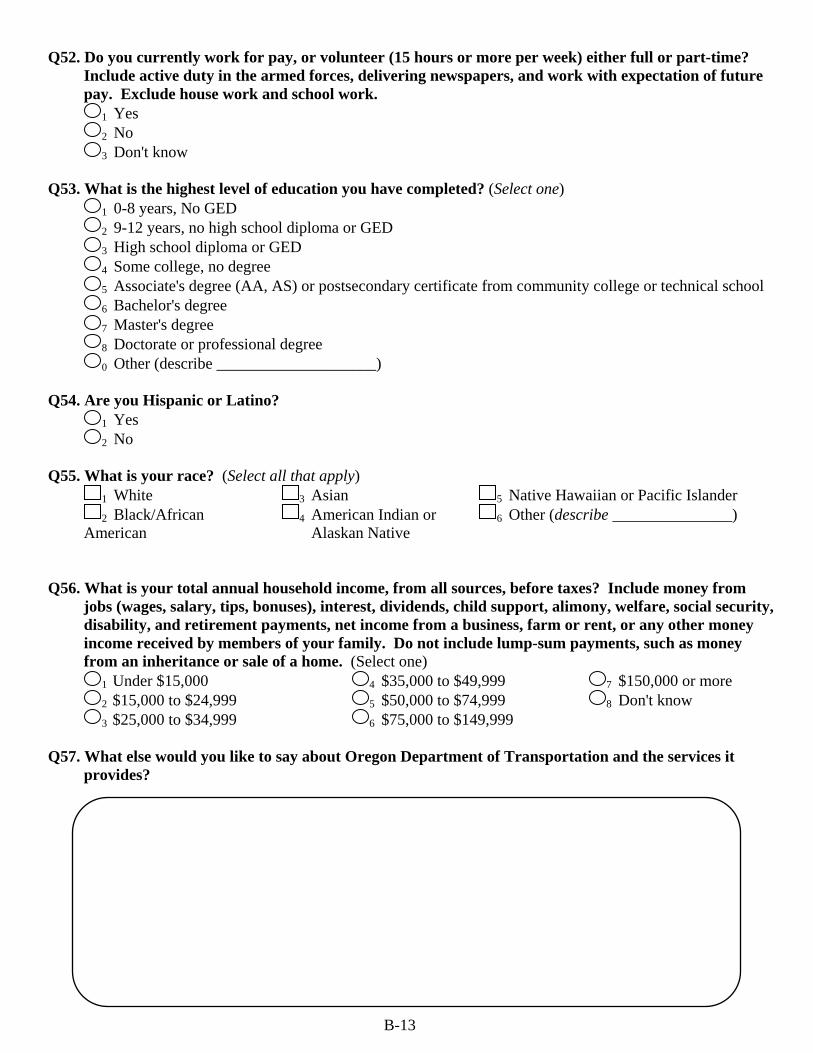
Q52. Do you currently work for pay, or volunteer (15 hours or more per week) either full or part-time? Include active duty in the armed forces, delivering newspapers, and work with expectation of future pay. Exclude house work and school work.
1 Yes 2 No 3 Don't know
Q53. What is the highest level of education you have completed? (Select one)
1 0-8 years, No GED 2 9-12 years, no high school diploma or GED 3 High school diploma or GED 4 Some college, no degree 5 Associate's degree (AA, AS) or postsecondary certificate from community college or technical school 6 Bachelor's degree 7 Master's degree 8 Doctorate or professional degree 0 Other (describe ____________________)
Q54. Are you Hispanic or Latino?
1 Yes 2 No
Q55. What is your race? (Select all that apply)
1 White 3 Asian 5 Native Hawaiian or Pacific Islander 2 Black/African
American
4 American Indian or Alaskan Native
6 Other (describe _______________)
Q56. What is your total annual household income, from all sources, before taxes? Include money from
jobs (wages, salary, tips, bonuses), interest, dividends, child support, alimony, welfare, social security, disability, and retirement payments, net income from a business, farm or rent, or any other money income received by members of your family. Do not include lump-sum payments, such as money from an inheritance or sale of a home. (Select one)
1 Under $15,000 4 $35,000 to $49,999 7 $150,000 or more 2 $15,000 to $24,999 5 $50,000 to $74,999 8 Don't know 3 $25,000 to $34,999 6 $75,000 to $149,999
Q57. What else would you like to say about Oregon Department of Transportation and the services it
provides?

B-14
Thank you for your help! Please return your survey in the prepaid envelope provided.
Related Documents


