2016 Preliminary results 7 March 2017

Welcome message from author
This document is posted to help you gain knowledge. Please leave a comment to let me know what you think about it! Share it to your friends and learn new things together.
Transcript

2016 Preliminary results7 March 2017

22
Today’s agenda
2016 Highlights
2016 Financial results
2017 Outlook and guidance
Strategic updates
Q & A
1
2
3
4
5

33
Paul Geddes - CEO

4
2016 Highlights
Making insurance much easier and better value for our customers
Great Retailer
Smart and
Efficient
Lead & Disrupt
1. See glossary on slide 65 for definitions
+200kAdditional Motor and Home own brand policies
9.4%Motor premium
growth
Direct Line
No.1 most preferred brand
Partners3 year extensions agreed with RBS (Home) and
Nationwide (Travel)
CostsUnderlying costs flat; absorbed Flood Re levy
Claims3 new garages; 19
in total. 75k repairs in 2016
6.4%
Direct Line for Business policy
growth
Telematics
4 year extension with PSA; ‘Just add fuel’, & ‘Simplydrive’
ADSWorking with MOVE_UK and
Tesla on connected cars
91.8% COR
20.2% RoTE
97.7% COR
14.2% RoTE
Regular dividend growth
Reported
Pre-Ogden
Reported
165% SCR
5.8%

55
2016 Financial results
John Reizenstein - CFO

6
• GWP of £3,274.1m, up 3.9% versus prior year
• Ongoing operating profit increased by 11.1% to £578.6m (reported £403.5m)
• COR of 91.8% is 2.2ppts better than 2015 (reported 97.7%); normalised for major weather 93.5%
• Total costs of £923.7m. Excluding impairments, underlying costs in line with 2015 after absorbing Flood Re costs and supporting growth
• RoTE of 20.2%, ahead of the 15% target (reported 14.2%)
• Significant increase in operating profit in Home and Commercial principally due to weather partially offset by reduction in Motor and RoPL
Observations (£m unless stated)2016
Reported2016 Pre-Ogden
2015
Ongoing operations1
Gross written premium 3,274.1 3,274.1 3,152.4
Underwriting profit 70.1 245.2 175.2
Instalment and other income 165.3 165.3 150.8
Investment return 168.1 168.1 194.7
Operating profit – ongoing operations 403.5 578.6 520.7
Profit before tax – continuing operations 353.0 570.3 507.5
Profit after tax 278.8 452.6 580.4
Of which Ongoing operations 293.0 433.1 385.3
Combined operating ratio1 97.7% 91.8% 94.0%
Total costs1 923.7 923.7 884.7
RoTE1 14.2% 20.2% 18.5%
1
2
3
1. See glossary on slide 65 for definition
Operating profit – ongoing operations
(£m)
2016 Headline
2016 Pre Ogden
2015
Motor 149.1 299.4 338.0
Home 166.7 166.7 109.9
Rescue and other personal lines 45.9 45.9 52.0
Commercial 41.8 66.6 20.8
5
4
2
5
1
Strong results in competitive markets
4
3
66

7
Ogden Summary – minimal impact on 2017
1. Of which £150.3m Motor, £24.8m Commercial and £42.2m Run-off
2. Of which, £139.8m Motor, £23.1m Commercial and £42.2m Run-off
3. £10.5m Motor, £1.7m Commercial
4. Figures are estimated and based on partial internal model (PIM) output for 31 December 2016
Profit and Loss
2016 Financial year 2017 Financial year and beyond
Balance sheet
Solvency 24
£217.3m1 Reduction in profit before tax
• £205.1m2 Prior year impact
• £12.2m3 Current year impact
Reserve strength maintained
Reduction in retained earnings
No impact expected
No impact expected
£0.19bn reduction in Own Funds
£0.08bn increase to Solvency capital requirement (SCR)
Small net impact from:
• Lower PY releases partly offset by
• Removal of lower discount provision in CY
Impact of moving from 1.5% to -0.75%
Small earned effect in 2017
N.B. no further Ogden rate change risk assumed

8
Continued growth in own brands and direct policies
Key own brands in force policy (IFP) growth
1.3% 1.5%
8.3%7.9%
5.3%
2.3%
7.4%
6.4%Fewer in force policies, but mix improved
• Strong new business growth in Motor,particularly in Direct Line, accelerating own brands growth to 5.3%. Total Motor IFPs grew by 4.5%
• 2.3% growth in Home own brands supported by good performance across direct and PCW channels. Small reduction in total Home IFPs due to partnerships
• Green Flag IFPs grew 7.4%, overall Rescue volumes impacted by partnerships
• Commercial IFPs increased by 3.1% supported by continued strong growth in DL4B of 6.4%
Motor own brands
Home own brands
Direct Line for Business (DL4B)
Green Flag
Observations
Group in force policy (IFP) movements
2016 Movement
2015 Movement
-1.4%
1.0%
-3.1%-2.4%
7.2%
-1.6%
4.5%
-1.2%
-4.9%
3.1%
Motor
Home
Commercial
RoPLTotal

9
3.9% Premium growth driven by Motor
Group gross written premium (GWP)
Key own brands gross written premiums (GWP)
GWP growth largely due to Motor
• Motor GWP increased by 9.4% largely due to price increases and IFP growth, particularly across own brands
• Home premiums reduced by 3.7% in 2016 mainly due to partnerships
• Home own brands premiums were 0.9% lower than 2015 although some signs of premium stability in Q4 2016
• Rescue GWP broadly stable. Strong growth in Green Flag direct (+11.0%) offset by lower partnership and linked volumes
• Commercial grew GWP 3.0% due to strong growth in DL4B which grew premiums by 7.7%
Observations
4.7%
-1.9%
11.6%
3.3%
9.3%
-0.9%
11.0%
7.7%
Motor own brands
Home own brands
Direct Line for Business (DL4B)
Green Flag
1.7%
4.8%
-3.6%
6.0%
-0.3%
3.9%
9.4%
-3.7%
1.7%3.0%
Motor
Home
Commercial
RoPL
2016 Movement
2015 Movement
Total

10
59.5%55.0%
10.9%
11.5%
23.6%25.3%
Underwriting discipline reflected in COR
2015 2016
94.0%c. 93.0% normalised1
Combined operating ratio Loss ratio analysis
Expense and commission ratio analysis
2015 2016Current year loss ratio
Prior year releases
Home major weather
59.5%
55.0%
2.5pts
0.7pts
2015 2016
34.5%36.8%
Expense
ratio
Commission
ratio
Loss
ratio
10.9% 11.5%
23.6% 25.3%
1.3pts
23.6% 23.2%
-4.5pts
1. Normalised for Home and Commercial weather
Commission ratio
Expense ratio
91.8%c. 93.5% normalised1
25.3%
1.3% 0.8%
Flood Re levy
Impairment of intangibles
Pre-Ogden

11
Motor – improved current year profitability
Motor COR increased by 2.7pts to 95.1%
• Improvement in current year loss ratio reflects improved trading
• Lower contribution from prior year releases (£263m in 2016 versus £267m in 2015)
• Expense ratio higher due to impairments, underlying expense ratio 0.9ppts better than 2015
• Underwriting profit of £65.5m, £30m lower than 2015 due to impairments
92.4%
95.1%+0.6pts
+1.8pts
-0.9pts
2015 COR
2016 COR
Current year
loss ratio
Prior year
releases
Expense ratio Commission
ratio
-1.7ptsIntangible
asset
impairment £39.3m
2016 83.3% (19.6%) 28.2% 3.2% 95.1%
2015 85.0% (21.4%) 26.2% 2.6% 92.4%
2015 2016
Underwriting profit £95.5m £65.5m
Instalment and
other income £103.6m £117.0m
Investment return £138.9m £116.9m
Operating profit £338.0m £299.4m
+2.9pts
Pre-Ogden

12
Motor – disciplined underwriting
Claims by peril vs. expectationsPremiums and policy growth
• Average written premiums increased by 6.3% in 2016
• Improvement in margin due to a combination of price increases and lower risk mix
• 4.5% increase in IFPs as a result of strong new business growth and stable retention during 2016
1. Average incepted written premium (new business and renewals). Excludes IPT
2. Risk and business mix reflects the expected level of claims from the portfolio. It measures the estimated movement based on risk models used in that period and is revised when risk models are
updated
2015 2016
AVP change1 +5.2% +6.3%
Risk and business mix2
IFP growth +1.0% +4.5%
GWP growth +4.8% +9.4%
Frequency Severity Frequency Severity
Large BI
Small BI
Damage
30 June 2016 31 December 2016
Overall claims inflation at the top end of the long-term range of 3-5%
Pre-Ogden

13
60%
65%
70%
75%
80%
85%
90%
95%
100%
2011 2012 2013 2014 2015 2016
Motor - conservative reserving leading to prior year releases
At the end of 2014
At the end of 2015At the end of 2011
At the end of 2012
At the end of 2013
1. Group view based on management best estimate, net of reinsurance, includes claims handling costs and add-ons
2. Reinsurance is on a treaty year basis. Cover renews 1 January and is unlimited. Unlimited amount of cover reinstatements
3. Partial placement on lower layers up to £5m
At the end of 2016
Motor booked loss ratio development (net1)
Prior year releases 1H 16 2H16 2016 2015
£m 134.0 129.3 263.3 266.8
% NEP 20.6% 18.8% 19.7% 21.4%
£3m £3m £3m3 £1m3 £1m £1m
Excess of Loss reinsurance deductible2 (1 January renewal)
Pre-Ogden

14
Home – results helped by benign weather
92.2%
85.0%
-1.0pts
-4.3pts
-8.5pts
2015 COR
2016 COR
Current year
loss ratio
Prior year
releases
Expense
ratio
Commission
ratio
+2.0pts
+1.7pts
Home COR improvement largely due to weather
• 2.0pt increase in current year attritional loss ratio to 47.8% due to higher claims inflation
• Higher contribution from prior years; £76m in 2016 versus £42m in 2015
• Weather related costs of £18m in 2016 (2015: £90m)
• Expense ratio increase as a result of the £24m Flood Re levy in Q2 2016 (2.9ppts)
• Underwriting profit of £122.5m, £56.9m ahead of 2015
Weather
events
Flood Re
levy
£24m
2016 47.8% (9.3%) 2.2% 21.7% 22.6% 85.0%
2015 45.8% (5.0%) 10.7% 19.8% 20.9% 92.2%
2015 2016
Underwriting profit £65.6m £122.5m
Instalment and
other income £23.8m £24.3m
Investment return £20.5m £19.9m
Operating profit £109.9m £166.7m
+2.9pts

15
Home – pricing to optimise own brand portfolio
Own brands premiums and policy growth
2015 2016
AVP change1 -3.6% -3.9%
Risk and business mix2
IFP growth +1.5% +2.3%
GWP movement -1.9% -0.9%
1. Average incepted written premium (new business and renewals). Excludes IPT
2. Risk and business mix reflects the expected level of claims form the portfolio. It measures the estimated movement based on risk models used in that period and is revised when risk models are
updated
• Own brand average written premiums 3.9% lower in 2016 largely reflecting changes in channel and tenure as PCWs continued to grow market share
• Following a long period of price deflation, the home market began to stabilise in 2016
• Increased own brands new business prices in Q4 and retention remained strong throughout the year
• Underlying claims inflation increased in H2 2016 leading to some pressure on margins

16
RoPL – results driven by Rescue
91.2%
93.3%+0.8pts
-0.8pts-0.4pts
2015 COR
2016 COR
Current year
loss ratio
Prior year
releases
Expense ratio Commission
ratio
+2.5pts
RoPL COR increased by 2.1pts to 93.3%
• Increase in current year loss ratio due to an adjustment to Pet earned premiums
• Higher contribution from prior year releases (£17.5m in 2016 versus £13.6m in 2015)
• Lower expense ratio due to phasing of marketing spend in Rescue
• Underwriting profit of £26.6m was £7.3m lower than 2015
• Rescue COR increased by 1.1pts to 83.4%
2016 66.0% (4.4%) 24.5% 7.2% 93.3% 83.4%
2015 63.5% (3.6%) 24.9% 6.4% 91.2% 82.3%
Rescue
2015 2016
Underwriting profit £33.9m £26.6m
Instalment and
other income £14.3m £15.4m
Investment return £3.8m £3.9m
Operating profit £52.0m £45.9m

17
Commercial – improved underlying profitability
104.5%
93.2%
-0.1pts-3.3pts
+1.7pts
2015 COR 2016 CORCurrent year
loss ratio
Prior year
releases
Expense ratio Commission
ratio
-9.6pts
Commercial COR improved by 11.3pts to 93.2%
• Normalising for weather and large losses, COR would have been c. 3ppts better than 2015
• 9.6pt improvement in current year loss ratio mainly due to better weather related claims experience and c.1ppt of underlying improvement in the attritional loss ratio
• Higher contribution from prior year releases (£72.9m in 2016 versus £56.6m in 2015)
• Expense ratio increase due to timing of marketing spend and one-off costs
• Underwriting profit of £30.6m in 2016 versus a loss in 2015
2016 65.9% (16.1%) 23.9% 19.5% 93.2%
2015 75.5% (12.8%) 22.2% 19.6% 104.5%
2015 2016
Underwriting profit / (loss)
(£19.8m) £30.6m
Instalment and
other income £9.1m £8.6m
Investment return £31.5m £27.4m
Operating profit £20.8m £66.6m
Pre-Ogden
18
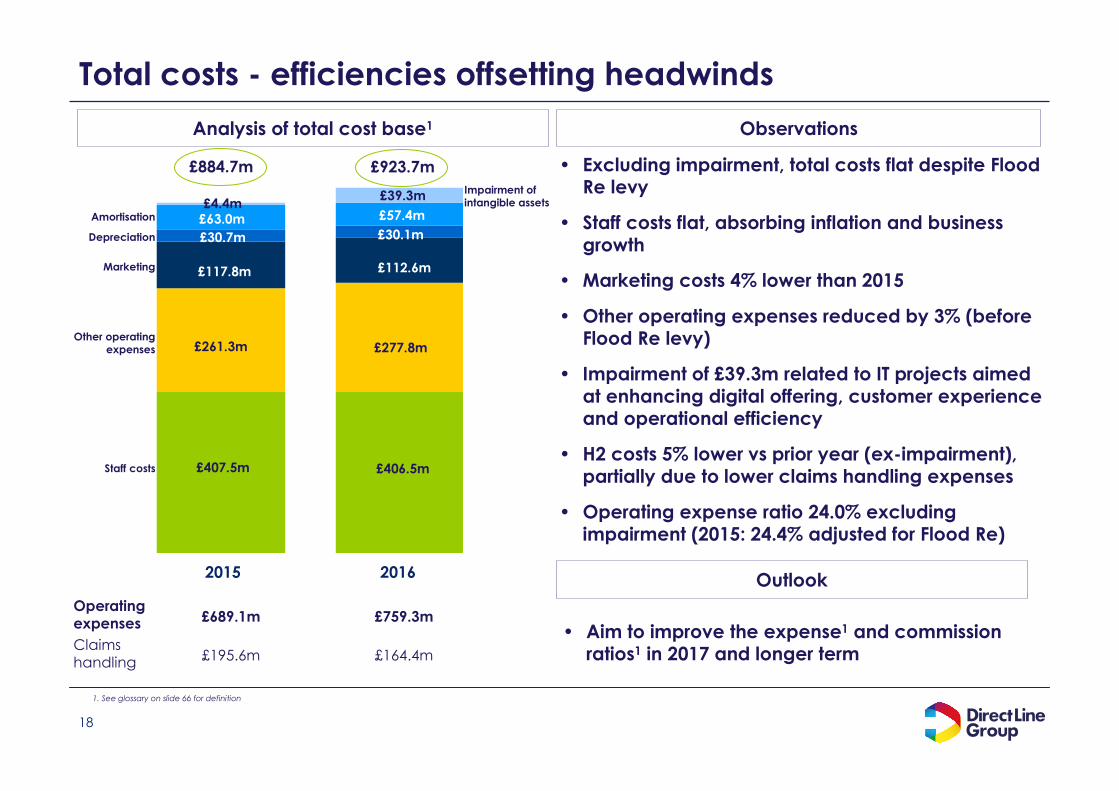
Total costs - efficiencies offsetting headwinds
Staff costs
£39.3m
2015 2016
£884.7m
Analysis of total cost base1 Observations
• Excluding impairment, total costs flat despite Flood Re levy
• Staff costs flat, absorbing inflation and business growth
• Marketing costs 4% lower than 2015
• Other operating expenses reduced by 3% (before Flood Re levy)
• Impairment of £39.3m related to IT projects aimed at enhancing digital offering, customer experience and operational efficiency
• H2 costs 5% lower vs prior year (ex-impairment), partially due to lower claims handling expenses
• Operating expense ratio 24.0% excluding impairment (2015: 24.4% adjusted for Flood Re)
£923.7m
£57.4m
£39.3m
£30.1m
£112.6m
£406.5m
£277.8m
£63.0m£4.4m
£30.7m
£117.8m
£407.5m
£261.3mOther operating
expenses
Marketing
Depreciation
Amortisation
Impairment of intangible assets
Outlook
• Aim to improve the expense1 and commission ratios1 in 2017 and longer term
Operating expenses £689.1m £759.3m
Claims handling £195.6m £164.4m
1. See glossary on slide 66 for definition

19
• 3.5% reduction in AUM in 2016 reflects dividends paid and lower claims
• Income yield of 2.5% in 2016, in line with management guidance
• Net realised and unrealised gains lower in 2016 primarily due to lower unrealised property gains
7,051
6,819
6,581
2.5%2.4%2.4%
2.9%2.9%2.6%
5,000
5,500
6,000
6,500
7,000
7,500
2014 2015 2016
0.0%
1.0%
2.0%
3.0%
4.0%
5.0%
5.1%
1.2%5.0%
16.9%
5.2%
60.4%
6.2%
Cash and cash equivalents
Lower investment return, reflecting lower gains
Investment assets by type
Investment return – Ongoing operations
31 Dec 16: £6,581m
1. Investment income excluding net gains divided by average AUM based on opening and closing balance for total Group
2. Investment return including unrealised and realised gains and losses, divided by average AUM based on opening and closing balance for total Group
Investment property
Sovereign
Infrastructure
High yield
Investment grade incl. private placements
Credit
CRE loans
AUM and investment yields
£m 2016 2015
Investment income 164.5 165.6
Net realised and unrealised gains 3.6 29.1
Of which unrealised property
gains4.1 24.2
Total 168.1 194.7
Return yield2Income yield1
Observations
AUM £m

20
Investments outlook
Income yield
31 Dec 16Target
allocation1Current holding
Income yield
Interest rate duration (years)
Investment grade
(incl private placements)
62.0% 60.4% 2.6% 2.4
High yield 6.0% 6.2% 4.8% 1.2
Credit 68.0% 66.6% 2.8% 2.3
Sovereign 8.0% 5.2% 2.3% 1.4
Total debt securities
76.0% 71.8% 2.8% 2.3
Infrastructure debt 6.0% 5.1% 2.4% -
Commercial real estate loans2
3.0% 1.2% 2.6% -
Investment
property6.0% 5.0% 5.1% -
Cash and cash
equivalents9.0% 16.9% 0.4% 0.0
Total 100.0% 100.0% 2.5% 1.63
Observations
1. Strategic asset benchmarks for the Group
2. Commercial real estate loans commenced 27 June 2016
3. Weighted average life c. 14 years
• ALM driven investment strategy
• Exited securitised credit during Q3 2016
• 69.9% of debt securities rated ‘A’ or above
• Diversified investment property portfolio with no exposure to sub-prime
• AFS unrealised gains, net of tax of £92.1m
Outlook
• Continue to work towards target asset allocations
• Based on current market conditions, investment income yield expected to be 2.4% in 2017

21
Ongoing operating profit reconciliation
• Run-off segment profit £68.8m driven by positive prior year development from large bodily injury (reported £26.6m)
• Restructuring and other one-off costs of £39.9m reflecting building impairment costs
• Finance costs in relation to Tier 2 fixed rate debt; continue to benefit from swap to floating rate
• Profit after tax of £452.6m is 13.3% higher than prior year (excluding profit from discontinued). Reported £278.8m
Observations
(£m unless stated)2016
Reported2016 Pre Ogden
2015
Operating profit – ongoing operations
403.5 578.6 520.7
Run-off 26.6 68.8 73.1
Restructuring and other one-
off costs(39.9) (39.9) (48.7)
Operating profit – continuing operations
390.2 607.5 545.1
Finance costs (37.2) (37.2) (37.6)
Profit before tax – continuing operations
353.0 570.3 507.5
Tax (74.2) (117.7) (108.3)
Profit from discontinued, net of tax1
- - 181.2
Profit after tax 278.8 452.6 580.4
EPS – diluted (pence)1 21.2 n/a 26.6
Operating profit
1. See glossary on slide 66 for definition
2. Adjusted diluted earnings per share includes ongoing operations and excludes discontinued operations, the Run-off segment, restructuring and other on-off costs and the gain on disposal of
subsidiary (using UK standard tax rate 2016: 20.00%; 2015 20.25%)
1
2
1
2
Outlook
• Over the four year period 2015-2018, the Group expects cumulative restructuring and other one-off costs to continue to be substantially offset by operating profit from the Run-off segment
3
3
4
4

22
Development of capital coverage
0%
20%
40%
60%
80%
100%
120%
140%
160%
180%
200%
30 June 2016
Solvency II capital coverage post dividends1
140% - 180% Target range
184%
Observations
Solvency capital requirement (SCR)
Capital above SCR
1. Figures are estimated and based on partial internal model (PIM) output for 31 December 2016
31 Dec 2016 pre-Ogden
31 Dec 2016 post-Ogden
• Capital coverage of 165% post dividend, above the mid-point of the range of the Group’s risk appetite range
• Ogden impact of 24ppts (£0.19bn reduction in Own Funds, £0.08bn increase in SCR)
• Internal model approved by the PRA in June 2016
• The Group’s partial internal model (PIM) is used to determine the solvency capital requirement (SCR)
• The Group seeks to hold capital in the range 140% to 180% of the SCR
£1.34bn
£1.19bn
£1.42bn
£0.92bn
£1.37bn
£1.14bn
165%
189%

2323
Movement in own funds
Mark to
market
movement
Capital
expenditure
Dividends 31 December 20162
£2.47bn
(£0.09bn)
73%
Own funds reduced by £0.13bn in 2016
• £0.49m of capital generated during the year largely offset by capital expenditure and capital distributions
• Change in the Ogden discount rate led to a reduction in own funds of £0.19bn
£2.34bn
1. Change in risk margin as a result of moving from standard formula basis to Group PIM at 1 January 2016
2. Figures are estimated and based on partial internal model (PIM) output for 31 December 2016
(£0.19bn)(£0.12bn)
(£0.34bn)
£0.12bn
£0.49bn
1 January 2016 Ogden
impact
Capital
generation
Change in
risk margin
basis1

24
Dividends
Dividends Commentary
• 5.4% growth in final dividend to 9.7 pence per share.
• 5.8% growth in total regular dividends in 2016 and 8.8% growth including specials and excluding proceeds from sale of International
• Over 120% of profit after tax distributed in 2016
• Total dividends since IPO of over £1.8bn, or 72.1% of IPO share price
Date Event
16 March 2017 Ex-dividend date
17 March 2017 Record date
18 May 2017 Payment date
1. 2012 pro-forma interim dividend
4.0 4.2 4.4 4.6 4.9
8.0 8.4 8.8 9.2 9.7
10.010.0
4.0
8.88.0
27.5
2012 2013 2014 2015 2016
Special – from one-off events
Special final dividend
Special interim dividend
Regular final dividend
Regular interim dividend
2012 2013 2014 2015 2016
12.0p1 20.6p 27.2p 50.1p 24.6p

25
• Grew premiums and improved current year profitability
• Additional costs associated with Flood Re levy and new business
growth offset by improved efficiency
• Robust investment result given financial market volatility
• Absorbed impact from lower Ogden discount rate while
maintaining solvency above mid-point of range, 165%
• Attractive total dividend of 24.6p in 2016
Financial highlights summary
1
2
3
4
5
Making insurance much easier and better value for our customers

2626
2017 Outlook and guidance

27
2017 Outlook by segment
Motor
£1,539m
95.1%
£834m
85.0%
£401m
93.3%
£500m
93.2%
Rescue & other
personal lines
Home
Commercial
2017 Outlook2016 GWP and COR (pre-Ogden)
• Maintain underwriting discipline against a competitive backdrop and changes in the market
• Aim to continue to improve current year profitability
• Prior year releases to remain significant in the short term and are likely to fall over time as current year profitability is expected to improve
• Continue to further enhance the Green Flag customer experience
• Further enhancements in Pet and Travel to enhance service and propositions whilst improving pricing capability
• Prior year releases are expected to be significantly lower as creditor business runs-off
• DL4B: Continue to invest propositions aimed at growing share in Commercial direct
• NIG: Consolidate position in market while investing in operations to deliver effortless trading to brokers
• Aim to be strong in key channels and achieve target returns
• Nationwide termination date currently being reviewed and may result in a later migration
• Home weather load c. £65m in 2017 reflecting lower volumes

28
2017 Guidance
Investment income yield1
RoTE1
1. See glossary on slide 65 for definition
2. Assuming normal annual level of claims from major weather events and no change to the Ogden discount rate
2.4%2.5%2.4%2.4%
2.1%2.0%
20142012 2013 2015 2016 2017 guidance
20.2%18.5%
16.8%16.0%
13.4%
20142012 2013 2015 2016 Ongoing target
>15.0%
COR1
99.2%
96.1% 95.0%94.0%
91.8%
20142012 2013 2015 2016 2017 target2
93% - 95%
14.2%
97.7%
Reported
Observations
• The Group aims to reduce the expense ratio1 in 2017 and thereafter
• The Group also aims to deliver a lower commission ratio in 20172
• Targeting 2017 COR in the range 93% - 95% for Ongoing operations2
• Investment income yield expected to be 2.4% in 2017
• The Group’s 15% RoTE target remains ongoing

2929
Strategic update
Paul Geddes - CEO

30
Great retailer – key pillar of our strategy
Make insurance much easier and better value
for our customers
Great retailer
Smart & efficient
manufacturer
Lead & disrupt
the market
Data & technology
Culture & capability
Capital & risk management
1 2 3
4
5
6
Long-term ambition: Sustainable growth and at
least 15% RoTE
Compelling brands, propositions and
customer experience to meet diverse, long-term
customer needs

31
Our multi-brand retail strategy and the journey so far
2010 2011 2012 2013 2014 2015 2016 2017
Profitable business but declining brand
Stable, profitable PCW business
Re-boot Direct Line
Re-tool all brands:
Pricing
Claims
Costs
Optimise offer to win on PCWs
32
Q2 Q3 Q4 Q1 Q2 Q3 Q4 Q1 Q2 Q3 Q4 2016
Year End2014 2015 2016
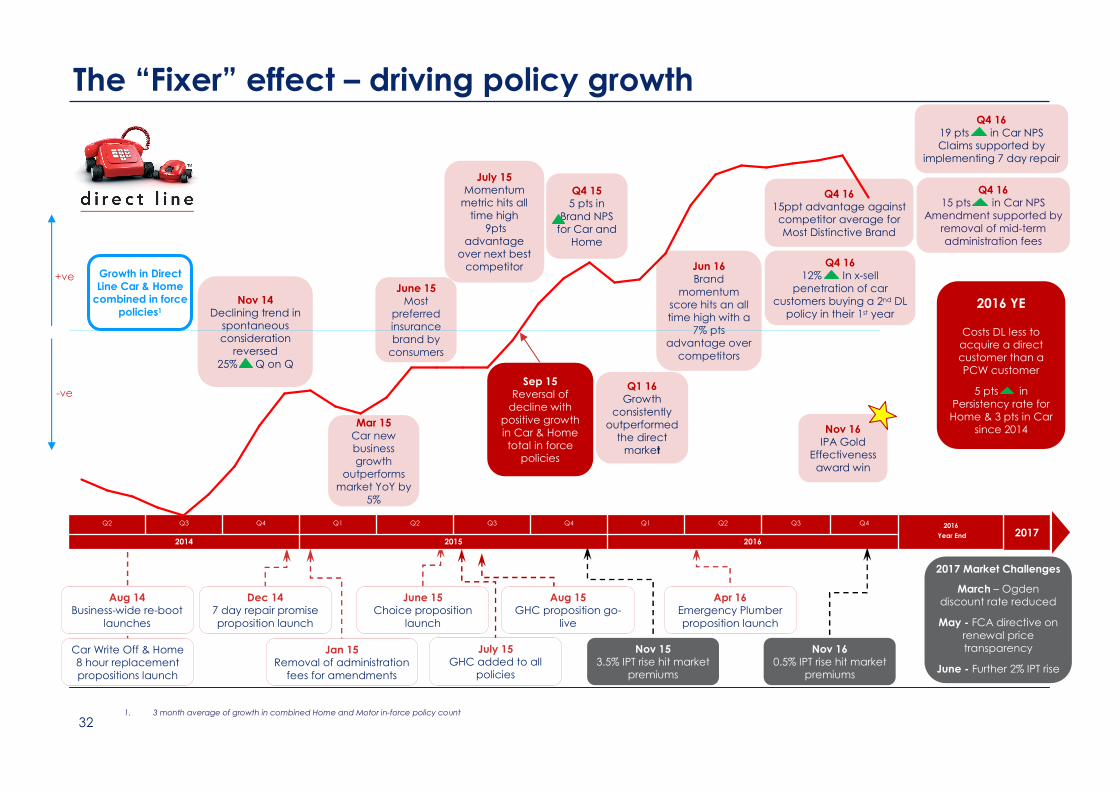
Aug 14Business-wide re-boot
launches
Car Write Off & Home 8 hour replacement
propositions launch
Dec 147 day repair promise
proposition launch
Jan 15Removal of administration
fees for amendments
June 15Choice proposition
launch
Apr 16Emergency Plumber
proposition launch
Sep 15Reversal of decline with
positive growth in Car & Home total in force
policies
Mar 15Car new business growth
outperforms market YoY by
5%
July 15Momentum metric hits all
time high
9pts advantage
over next best competitor
June 15Most
preferred insurance brand by
consumers
Jun 16Brand
momentum score hits an all time high with a
7% pts advantage over
competitors
Q4 1615ppt advantage against competitor average for
Most Distinctive Brand
Nov 153.5% IPT rise hit market
premiums
Nov 14Declining trend in
spontaneous consideration
reversed
25% Q on Q
Q1 16Growth
consistently outperformed
the direct market
2017 Market Challenges
March – Ogden discount rate reduced
May - FCA directive on
renewal price transparency
June - Further 2% IPT rise
Nov 160.5% IPT rise hit market
premiums
2017
Aug 15GHC proposition go-
live
Nov 16IPA Gold
Effectiveness
award win
Growth in Direct Line Car & Home combined in force
policies1
July 15GHC added to all
policies
Q4 1615 pts in Car NPS
Amendment supported by
removal of mid-term administration fees
Q4 1619 pts in Car NPS Claims supported by
implementing 7 day repair
Q4 1612% In x-sell
penetration of car customers buying a 2nd DL
policy in their 1st year
Q4 155 pts in
Brand NPS for Car and
Home
The “Fixer” effect – driving policy growth
+ve
-ve
1. 3 month average of growth in combined Home and Motor in-force policy count
2016 YE
Costs DL less to acquire a direct customer than a PCW customer
5 pts in
Persistency rate for Home & 3 pts in Car
since 2014

33
Direct Line: first we recognised the value of our customers
Re-invest additional customer value in
proposition and service
More valuable customers
• Better product holding
• Better Loss Ratio
• Higher persistency
More customer value
• Strongest brand
• Direct relationship
• Superior service and proposition

34
Reinvesting to share the value with customers
Better Marketing
• Replacement essential household items ready to send in 8 hours
• 7 day car repair proposition
• Cash or replacement items on essential household items
• Guaranteed Hire Car as standard
• Emergency Plumber in 3 hours
• Onward taxi to continue journey after an accident
Better Insurance Better Experience
• Innovative training of contact centre teams
• Social media support teams
• New mobile optimised websites
• Digital claims apps
• Claims tracking portal
Better Value
• Removal of mid-term amendment fees
• Improved price competitiveness
• Dramatic new “Fixer” campaign
• Integrated digital marketing
• Pipeline of world-first initiatives e.g. Fleetlights, Shotgun

35
Direct Line: this approach is hard to replicate
Source: Monthly Hall and Partners Brand and Ad Tracking – November 16. Rolling 4 week to 12 week period
e.g. 7 day car repair proposition
� Customers share photos and videos of damage in portal for early parts ordering
� Our own retail network = Direct repairs fast-tracked
� UK’s no.2 repair network, no.1 insurer-owned
� 19 state of the art repair centres and growing
� 75,000 own repairs and purchasing scale, technology insight and online repair tracking shared with networks
Vertical integration and scale = propositions that are hard to copy:
� No.1 Most Preferred Brand
�#1 Delivers on Promises
�#1 Easy to deal with
�#1 Gets things sorted
�#1 Right price for me
�#1 Acts in others interests
�#1 Brand momentum
� Award winning marketing, digital, social, customer experience
� 4.5 million quotes from our own websites and call centres
Brand investment and direct model = we can market propositions to customers

36
2014 2015 2016
+5%
+31
Driving strong financial metrics
Direct Line PersistencyDirect Line Home and Motor New
Business Sales
Jan 14 Jul 14 Jan 15 Jul 15 Jan 16 Jul 16
Home
Motor
4%
5%
Improved marketing effectiveness
5,000
5,100
5,200
5,300
5,400
5,500
2013 2014 2015 2016
In-force policies 000s
100
120
140
160
180
200
Marketing spend £m
In-force policies (lhs) Marketing spend (rhs)
• New business sales accelerated as reboot benefits gain traction with consumers
• Persistency levels increase from already high levels
• Consistent drive to increase marketing efficiency and effectiveness
%

37
Direct Line: completing the virtuous circle
More valuable customers
• Better product holding
• Better Loss Ratio
• Higher persistency
Re-invest additional customer value in
proposition and service
More customer value
• Strongest brand
• Direct relationship
• Superior service and proposition
Retain existing attractive customers and attract
new ones
Better prices
Lower acquisition
costs

38
Great Retailer – key pillar of our strategy
Make insurance much easier and better value
for our customers
Great retailer
Smart & efficient
manufacturer
Lead & disrupt
the market
Data & technology
Culture & capability
Capital & risk management
1 2 3
4
5
6
Long-term ambition: Sustainable growth and at
least 15% RoTE
Maximise existing growth opportunities while creating and driving future areas of value
39
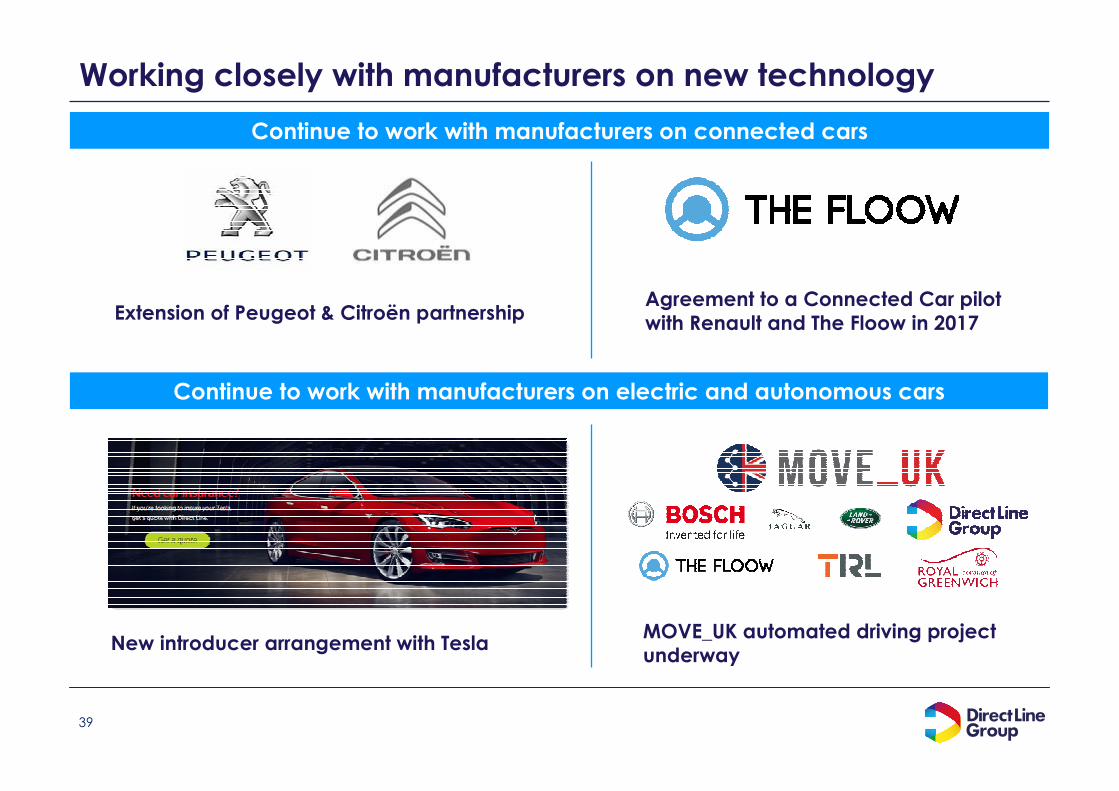
Working closely with manufacturers on new technology
Agreement to a Connected Car pilot with Renault and The Floow in 2017
New introducer arrangement with TeslaMOVE_UK automated driving project underway
Extension of Peugeot & Citroën partnership
Continue to work with manufacturers on electric and autonomous cars
Continue to work with manufacturers on connected cars

40
Our 2017 priorities build on 2016 performance
Great retailer
Smart &
efficientmanufacturer
Lead & disrupt
the market
•Continue to
differentiate the
Direct Line
brand
•Leverage
‘Direct’
capabilities
across
Commercial
direct
•Maintain
competitiveness
on PCWs
•Improve
efficiency while
investing in
systems and
capability
•Continue to
develop a
market leading
partner
proposition
•Invest in claims
and application
fraud
•Further develop
telematics
proposition
•Leverage direct
capability to
disrupt the SME
market
•Engage with
third parties to
leverage
capabilities in
new technology
Data & technology
Culture & capability
Capital & risk
management
•Further embed
the use of SII
internal model
for decision
making in the
business
•Build
competitive
advantage from
strong risk
management
and encourage
ownership
•Improve level,
performance,
and cost
effectiveness of
our current IT
systems
•Continue to
develop and
build new IT
system
•Expand the
diversity of the
talent pool
•Sustain high
performance
and
engagement
while building
capability for
the future
1 2 3 4 5 6
Compelling brands, propositions and
customer experience to meet diverse, long term customer needs
Efficiency and flexibility to deliver better claims and customer service at
lower cost
Maximise existing growth opportunities while creating and driving future areas
of value
Harness the power of technology and scale of our data
Unlock and accelerate our people potential
Sound foundation of capital and risk management

41
• Multi-year investment driving strong performance
• Strong solvency at 165% supported by strong reserves
• Targeting Ongoing Combined Ratio 93%-95%1 in 2017
• Targeting >15% RoTE and sustainable growth
• Well positioned; multi-brand, multi-channel strategy to win in
disrupted markets
Key messages
1
2
3
4
5
Making insurance much easier and better value for our customers
1. Assuming normal annual claims from weather events and no change to the Ogden discount rate
4242
Q&A

4343
Appendix

44
Improvement in current year underwriting performance
Loss ratio analysis - ongoing operations
2015 2016
£18m
-0.7pts
69.4%
13.0%
3.1% 59.5%
68.7%
14.3%
0.6% 55.0%
£0m
1. Home claims from major weather event, including inland and coastal flooding and storms
£430m
£379m
Prior year
developm’t
Home major
weather
events1
2015
current year
attritional
Prior year
developm’t
Home major
weather
events1
2015
reported
2016 pre
Ogden
2016
current year
attritional
£90m
60.9%
2016 Reported

45
Instalment and other operating income
Observations
• Instalment and other operating income increased by 9.6% to £165.3m in 2016
• Instalment income increased by £7.0m due to higher Motor volumes
(£m) 2016 2015
Instalment income 107.1 100.1
Other operating income 58.2 50.7
Total – ongoing operations 165.3 150.8
(£m) 2016 2015
Vehicle replacement referral
income14.1 12.5
Revenue from vehicle recovery and repair services
19.3 15.5
Other income 24.8 22.7
Other operating income 58.2 50.7
Breakdown of instalment and other operating income

46
11.9%
0.5%
11.1%
6.9%
5.0%
6.6%
18.4%2.1%
37.5%
8.7% 6.1%
45.5%
18.3%
21.4%
Investment portfolio: debt securities
Debt securities credit quality
AAA
AA+ to AA-
A+ to A-
BBB+ to BBB-
BB+ and below
Debt securities by industry sector
Communications
Consumer goods
Energy
Financial
Local Government
Sovereign - UK
Utilities
Supranational
Other

47
Reinsurance
(£m) 2013/14 2014/15 2015/16 2016/17
Limit 1,300 1,400 1,350 1,250
Deductible 150 150 150 150
Motor excess of loss reinsurance
Property catastrophe reinsurance
1. Partial placement on lower layers up to £5m
• Cover renews on 1 January
• Retained deductible is £1m (indexed)
• Cover is unlimited in size and has an unlimited amount of cover reinstatements
• Placed 100% on a traditional, uncapitalised basis
• Placed with a panel of 16 reinsurers who are at least ‘A+’ rated
• Cover renews on 1 July
• Retained deductible is £150 million
• Cover is £1.25 billion, equivalent to a 1 in 200 year modelled loss
• Cover has one full reinstatement
• Placed with a panel of 77 reinsurers who are all at least ‘A-’ rated
(£m) 2010 2011 2012 2013 2014 2015 2016 2017
Limit Unlimited
Deductible 10 3 3 31 11 1 1 1

4848
Bridge of shareholders’ equity under IFRS to Solvency II own funds1
Share-holders’equity
Goodwill
& intan-
gibles
Other asset
and liability
adjust-
ments
Change
in
valuation
of
technical
provisions
Fore-
seeable
dividends
Tier 1capital
£2.52bn
(£0.51bn)
73%
• Goodwill and intangibles have zero value under SII
• Property, loans and subordinated liabilities are measured at fair value
• Technical provisions includes discounted actuarial best estimate (ABE) plus a risk margin
• Foreseeable dividends are included in the Tier 1 calculation
1. Figures are estimated and based on partial internal model (PIM) output for 31 December 2016
2. Eligible Tier 2 is the Group’s subordinated debt
3. Eligible Tier 3 is the Group’s deferred tax asset
(£0.04bn)(£0.16bn)
(£0.13bn)
£1.68bn
£2.34bn
£1.42bn
SCROwn funds
£0.62bn £0.04bn
Eligible
Tier 2
capital2
Eligible
Tier 3
capital3
£0.93bn surplus

49
SCR by risk type
(£m) 31 Dec 2016 Comments
Non-life u/w risk 899
- Premium risk 246Weighted towards Motor
category
- Reserve risk 418 Includes run-off book
- Catastrophe risk 212 Home and Commercial mainly
- Other underwriting 23 Risk margin volatility
Default risk 10 Mainly credit risk from RI
Market risk 271Largest element is spread
followed by interest
Operational risk 210
UKI SCR 1,390
Sub Group SCR 31
Solvency Capital Requirement (SCR)
1,422
Default risk
Underwriting risk
Operational risk
Market risk
All figs stated post
diversification
19%
1%
65%
15%
1. Figures are estimated and based on partial internal model (PIM) output for 31 December 2016
Underwriting risk is the largest elementSplit of SCR by risk type1

5050
Sensitivity analysis – modest sensitivity to financial market moves1,2
158
157
156
156
157
151
165
100 110 120 130 140 150 160 170 180 190 200
One-off cat loss based on
extensive flooding of the Thames
One-off cat loss
equivalent to 1990 storm
Motor premium rate reduction of 10%
Motor BI deterioration equivalent to 2008 and
2009 accident years
100bp increase in
credit spreads
100bp decrease in
interest rates
31 December 2016 solvency position1
Insurance
Market
• Sensitivities selected to show a range of impacts on base case solvency ratio
• Main risk types –insurance risk and market risk
• Modest exposure to market risks
140% - 180% Target range
1. Figures are estimated and based on partial internal model (PIM) output for 31 December 2016
2. Sensitivities estimated based on assessed impact of scenarios as at 31 December 2016, applied to the Group’s solvency ratio at 31 December 2016
%

51
NAV and TNAV per share
Book value and TNAV
Movement in tangible net asset value
Net income
31 Dec 2015
Movement in AFS reserves
Other
2,105
8
2,463
87
279
£m
31 Dec 2016 pre FY dividend
Dividends paid
2,013
451
• Total unrealised AFS reserves of £92.1m (net of tax) as at 31 December 2016
TNAV per share
147.4p
153.8p
31 Dec 2016
Pence 31 Dec 16 31 Dec 15
Net asset value per share 184.7 192.2
Tangible net asset value per share
147.4 153.8
+17.0%
-4.2%

52
Motor
(£m unless stated)2016
Reported2016 Pre-Ogden
2015
In-force policies (000s) 3,873 3,873 3,707
Own brand in-force policies (000s) 3,642 3,642 3,459
Partnerships in-force policies (000s) 231 231 248
Gross written premium 1,539.1 1,539.1 1,406.7
Net earned premium 1,337.1 1,337.1 1,249.3
Loss ratio – current year 84.1% 83.3% 85.0%
Loss ratio – prior years (9.2%) (19.6%) (21.4%)
Loss ratio 74.9% 63.7% 63.6%
Commission ratio 3.2% 3.2% 2.6%
Expense ratio 28.2% 28.2% 26.2%
Combined operating ratio 106.3% 95.1% 92.4%
Underwriting profit / (loss) (84.8) 65.5 95.5
Of which prior year releases 123.5 263.3 266.8
Instalment and other income 117.0 117.0 103.6
Investment return 116.9 116.9 138.9
Operating profit 149.1 299.4 338.0
Results Observations
1
IFPs grew by 4.5% with own brands up 5.3% offset by a reduction in partners
9.4% growth in GWP with own brands up 9.3%
NEP growth as premium growth starting to earn through
Current year loss ratio improved by 1.7ppts
Lower yet still significant prior year releases in 2016
Combined operating ratio of 95.1%, 2.7ppts higher than prior year primarily reflecting a higher expense ratio due impairment
Operating profit of £299.4m, £38.6m lower than prior year mainly as a result of higher intangible asset impairments
2
1
2
5
3
3
6
4
5
6
4
7
7

53
Small BI claims trends
RTA Portal1 claims notifications forms by working day (indexed to Jan 12)Ja
n-1
2
Jun
-12
De
c- 1
2
Jun
-13
De
c- 1
3
Jun
-14
De
c- 1
4
Jun
-15
De
c- 1
5
Jun
-16
De
c- 1
6
Industry2
Direct Line Group volume adjusted
1. Source MOJ Portal Statistics Executive Dashboard June 2015 – RTA Motor
2. Industry with estimated adjustment to remove exited and re-submitted claims March, September & October 2014 due to transfers between organisations
100

54
Home
(£m unless stated) 2016 2015
In-force policies (000s) 3,378 3,418
Own brand in-force policies (000s) 1,759 1,719
Partnerships in-force policies (000s) 1,619 1,699
Gross written premium 834.4 866.3
Net earned premium 816.3 845.0
Loss ratio – current year attritional 47.8% 45.8%
Major weather 2.2% 10.7%
Loss ratio – current year incl. weather 50.0% 56.5%
Loss ratio – prior years (9.3%) (5.0%)
Loss ratio 40.7% 51.5%
Commission ratio 22.6% 20.9%
Expense ratio 21.7% 19.8%
Combined operating ratio 85.0% 92.2%
Underwriting profit / (loss) 122.5 65.6
Of which prior year releases 75.9 41.9
Instalment and other income 24.3 23.8
Investment return 19.9 20.5
Operating profit 166.7 109.9
Results Observations
IFPs 1.2% lower than 2015. Own brand IFPsgrew 2.3%
GWP down 3.7% lower primarily due to partnerships. Own brands reduced by 0.9%
Current year attritional loss ratio was 2.0ppts higher than 2015
£18m of weather related claims in 2016, lower than expected normal annual level
Combined operating ratio improved by 7.2 ppts to 85.0%
Operating profit improved by £56.8m reflecting lower claims from major weather events
1
2
1
2
3
5
4
5
3
4
6
6

55
Rescue FY 16 FY 15
In-force policies (000s) 3,646 3,932
Gross written premium 163.1 163.3
Combined operating ratio 83.4% 82.3%
Operating profit 42.8 42.2
GWP remained broadly stable compared with 2015, IFPs down 7.3% due to partners
COR increased 1.1ppts with a higher loss ratio
Operating profit was similar to the prior year
IFPs 4.9% lower, mainly due to lower
partner volumes
1.7% growth in GWP versus prior year due
to Travel partnerships pricing
Operating profit reduction in 2016 mainly
due to one-off premium adjustment in Pet
Rescue and other personal lines
Rescue and other personal lines1 FY 16 FY 15
In-force policies (000s) 7,880 8,288
Gross written premium 400.8 394.1
Net earned premium 394.4 386.4
Combined operating ratio 93.3% 91.2%
Underwriting profit 26.6 33.9
Of which prior year
releases/(increases)17.5 13.6
Operating profit 45.9 52.0
Results Observations
2
3
1
2
1
3
1
3
2
1
3
2
.
1. ROPL is made up of a number of products, including Rescue, Pet, Travel and Creditor
(£m unless stated)
Results Observations

56
Commercial
(£m unless stated)2016
Reported2016 Pre-Ogden
2015
In-force policies (000s) 675 675 655
Direct Line for Business 433 433 407
NIG and other 242 242 248
Gross written premium 499.8 499.8 485.3
Net earned premium 452.8 452.8 440.1
Loss ratio – current year 66.3% 65.9% 75.5%
Loss ratio – prior years (11.0%) (16.1%) (12.8%)
Loss ratio 55.3% 49.8% 62.7%
Commission ratio 19.5% 19.5% 19.6%
Expense ratio 23.9% 23.9% 22.2%
Combined operating ratio 98.7% 93.2% 104.5%
Underwriting profit/(loss) 5.8 30.6 (19.8)
Of which prior year releases 49.8 72.9 56.6
Instalment and other income 8.6 8.6 9.1
Investment return 27.4 27.4 31.5
Operating profit 41.8 66.6 20.8
Results Observations
1
3
5
2
3.1% growth in total IFPs and 6.4% growth in DL4B IFPs
GWP increased by 3.0%, with DL4B GWP increased by 7.7ppts
Current year loss ratio improved by 11.3ppts reflecting better claims experience
Prior year releases increased by £16.3m
Combined operating ratio improved to 93.2%
COR normalised for weather and other large losses was approximately 96%
Operating profit increased to £66.6m
1
2
3
44
5
6
6

57
(£m)2016
Reported2016 Pre-Ogden
2015
Ongoing operating
profit403.5 578.6 520.7
Less: Finance costs (37.2) (37.2) (37.6)
Profit before tax 366.3 541.4 483.1
Less: tax1 (73.3) (108.3) (97.8)
Profit after tax 293.0 433.1 385.3
Tangible equity b/f 2,105.2 2,105.2 2,052.02
Tangible equity c/f 2,012.6 2,186.4 2,105.2
Average tangible equity
2,058.9 2,145.8 2,078.6
Return on tangible equity
14.2% 20.2% 18.5%
RoTE calculation
1. UK standard tax rate of 20.00% (2015: 20.25%)
2. Tangible equity for the Group less disposal group net assets of £241.0m
RoTE calculation Adjusted EPS calculation
(£m)2016
Reported2015
Ongoing operating profit 403.5 520.7
Less: Finance costs (37.2) (37.6)
Profit before tax 366.3 483.1
Less: tax1 (73.3) (97.8)
Profit after tax 293.0 385.3
Weighted average number of ordinary shares
1,368.7 1,431.2
EPS – Adjusted basic (pence) 20.4 27.9
Weighted average number of ordinary shares (diluted)
1,381.8 1,449.0
EPS – Adjusted diluted (pence) 21.2 26.6

58
Segmental performance – 2016
(£m) Motor Home
Rescue and
other personal
lines
Commercial Total ongoing Run-off Total Group
GWP 1,539.1 834.4 400.8 499.8 3,274.1 - 3,274.1
Net earned premium 1,337.1 816.3 394.4 452.8 3,000.6 - 3,000.6
Net insurance claims (1,001.7) (332.0) (242.9) (250.5)) (1,827.2) 23.4 (1,803.8)
Commission expenses (42.9) (184.4) (28.4) (88.3) (344.0) - (344.0)
Operating expenses (377.3) (177.4) (96.5) (108.1) (759.3) (0.2) (759.5)
Underwriting result (84.8) 122.5 26.6 5.8 70.1 - -
Investment return 116.9 19.9 3.9 27.4 168.1 3.4 171.5
Instalment and other operating
income117.0 24.3 15.4 8.6 165.3 - 165.3
Operating profit/(loss) 149.1 166.7 45.9 41.8 403.5 26.6 430.1
Restructuring and other one off
costs- - - - - - (39.9)
Operating profit - - - - - - 390.2
Finance costs - - - - - - (37.2)
Profit before tax - - - - - - 353.0
Loss ratio – current year 84.1% 50.0% 66.0% 66.3% 69.8% - -
Loss ratio – prior year (9.2%) (9.3%) (4.4%) (11.0%) (8.9%) - -
Commission ratio 3.2% 22.6% 7.2% 19.5% 11.5% - -
Expense ratio 28.2% 21.7% 24.5% 23.9% 25.3% - -
Combined operating ratio 106.3% 85.0% 93.3% 98.7% 97.7% - -

59
Segmental performance – 2016
(£m) Motor Home
Rescue and
other personal
lines
Commercial Total ongoing Run-off Total Group
GWP 1,539.1 834.4 400.8 499.8 3,274.1 3,274.1
Net earned premium 1,337.1 816.3 394.4 452.8 3,000.6 3,000.6
Net insurance claims (851.4) (332.0) (242.9) (225.8) (1,652.1) 65.6 (1,586.5)
Commission expenses (42.9) (184.4) (28.4) (88.3) (344.0) - (344.0)
Operating expenses (377.3) (177.4) (96.5) (108.1) (759.3) (0.2) (759.5)
Underwriting result 65.5 122.5 26.6 30.6 245.2 65.4 310.6
Investment return 116.9 19.9 3.9 27.4 168.1 3.4 171.5
Instalment and other operating
income117.0 24.3 15.4 8.6 165.3 - 165.3
Operating profit/(loss) 299.4 166.7 45.9 66.6 578.6 68.8 647.4
Restructuring and other one off
costs- - - - - - (39.9)
Operating profit - - - - - - 607.5
Finance costs - - - - - - (37.2)
Profit before tax - - - - - - 570.3
Loss ratio – current year 83.3% 50.0% 66.0% 65.9% 69.3% - -
Loss ratio – prior year (19.6%) (9.3%) (4.4%) (16.1%) (14.3%) - -
Commission ratio 3.2% 22.6% 7.2% 19.5% 11.5% - -
Expense ratio 28.2% 21.7% 24.5% 23.9% 25.3% - -
Combined operating ratio 95.1% 85.0% 93.3% 93.2% 91.8% - -
Pre-Ogden

60
Segmental performance – 2015
(£m) Motor Home
Rescue and
other personal
lines
Commercial Total ongoing Run-off Total Group
GWP 1,406.7 866.3 394.1 485.3 3,152.4 0.1 3,152.5
Net earned premium 1,249.3 845.0 386.4 440.1 2,920.8 0.1 2,920.9
Net insurance claims (794.8) (435.1) (231.6) (275.8) (1,737.3) 70.4 1,666.9
Commission expenses (31.9) (176.7) (24.5) (86.1) (319.2) (0.1) (319.3)
Operating expenses (327.1) (167.6) (96.4) (98.0) (689.1) (0.7) (689.8)
Underwriting result 95.5 65.6 33.9 (19.8) 175.2 - -
Investment return 138.9 20.5 3.8 31.5 194.7 3.4 198.1
Instalment and other operating
income103.6 23.8 14.3 9.1 150.8 - 150.8
Operating profit/(loss) 338.0 109.9 52.0 20.8 520.7 73.1 593.8
Restructuring and other one off
costs- - - - - - (48.7)
Operating profit - - - - - - 545.1
Finance costs - - - - - - (37.6)
Profit before tax - - - - - - 507.5
Loss ratio – current year 85.0% 56.5% 63.5% 75.5% 72.5% - -
Loss ratio – prior year (21.4%) (5.0%) (3.6%) (12.8%) (13.0%) - -
Commission ratio 2.6% 20.9% 6.4% 19.6% 10.9% - -
Expense ratio 26.2% 19.8% 24.9% 22.2% 23.6% - -
Combined operating ratio 92.4% 92.2% 91.2% 104.5% 94.0% - -

61
Segmental performance – 2014
(£m) Motor HomeRescue & other
personal linesCommercial Total ongoing Run-off Total Group
GWP 1,342.0 898.6 371.8 487.0 3,099.4 (0.4) 3,099.0
Net earned premium 1,295.9 875.3 369.1 446.8 2,987.1 (0.4) 2,986.7
Net insurance claims (868.1) (444.3) (211.9) (255.3) (1,779.6) 52.2 (1,727.4)
Commission expenses (41.4) (190.3) (34.5) (87.8) (354.0) - (354.0)
Operating expenses (336.6) (177.2) (93.1) (98.5) (705.4) (1.0) (706.4)
Underwriting result 49.8 63.5 29.6 5.2 148.1 - -
Investment return 144.8 25.7 6.1 34.0 210.6 4.5 215.1
Instalment and other operating
income102.5 24.7 12.3 7.8 147.3 - 147.3
Operating profit/(loss) 297.1 113.9 48.0 47.0 506.0 55.3 561.3
Restructuring and other one off
costs- - - - - - (69.6)
Operating profit - - - - - - 491.7
Finance costs - - - - - - (37.2)
Gain on disposal of subsidiary 2.3
Profit before tax - - - - - - 456.8
Loss ratio – current year 88.5% 56.5% 61.7% 69.2% 70.8% - -
Loss ratio – prior year (21.5%) (5.7%) (4.3%) (12.1%) (11.1%) - -
Commission ratio 3.2% 21.7% 9.4% 19.7% 11.8% - -
Expense ratio 26.0% 20.2% 25.2% 22.0% 23.6% - -
Combined operating ratio 96.2% 92.7% 92.0% 98.8% 95.0% - -

62
Segmental performance – 2013
(£m) Motor HomeRescue & other
personal linesCommercial Total ongoing Run-off Total Group
GWP 1,421.1 943.1 383.4 474.5 3,222.1 7.9 3,230.0
Net earned premium 1,444.8 908.9 365.8 434.6 3,154.1 2.7 3,156.8
Net insurance claims (940.2) (490.4) (219.8) (270.6) (1,921.0) 50.1 (1,870.9)
Commission expenses (36.3) (177.9) (27.3) (92.2) (333.7) (0.8) (334.5)
Operating expenses (370.2) (184.4) (90.8) (101.4) (746.8) (1.4) (748.2)
Underwriting result 98.1 56.2 27.9 (29.6) 152.6 - -
Investment return 122.8 24.1 8.2 29.6 184.7 13.0 197.7
Instalment and other operating
income126.8 25.9 10.4 9.5 172.6 - 172.6
Operating profit/(loss) 347.7 106.2 46.5 9.5 509.9 63.6 573.5
Restructuring and other one off
costs- - - - - - (140.5)
Operating profit - - - - - - 433.0
Gain on disposal of subsidiary - - - - - - (37.7)
Gain on disposal of subsidiary 12.0
Profit before tax - - - - - - 407.3
Loss ratio – current year 85.3% 58.7% 62.5% 74.1% 71.3% - -
Loss ratio – prior year (20.2%) (4.8%) (2.4%) (11.8%) (10.4%) - -
Commission ratio 2.5% 19.6% 7.5% 21.2% 10.6% - -
Expense ratio 25.6% 20.3% 24.8% 23.3% 23.7% - -
Combined operating ratio 93.2% 93.8% 92.4% 106.8% 95.2% - -

63
Balance sheet overview
(£m)31 Dec 2016 Reported
31 Dec 2015
Assets
Goodwill and other intangible assets 508.9 524.8
Financial investments 5,147.0 5,614.6
Cash and cash equivalents 1,166.1 963.7
Assets held for sale 3.8 5.1
Other assets 3,295.9 2,848.4
Total assets 10,121.7 9,956.6
Liabilities
Subordinated liabilities 539.6 521.1
Insurance liabilities and unearned premium reserve 6,214.5 6,001.1
Borrowings 55.3 61.3
Other liabilities 790.8 743.1
Total liabilities 7,600.2 7,326.6
Equity 2,521.5 2,630.0
Net asset value per share (pence)1 184.7 192.2
Net tangible asset value per share (pence)2 147.4 153.8
1. Net assets divided by closing number of ordinary shares 1,365.1million
2. Tangible net assets divided by closing number of ordinary shares 1,365.1million

64
UK regulatory themes
InsuranceDistribution Directive & General Data Protection Regulation
• The Insurance Distribution Directive (IDD) and General Data Protection Regulation (GDPR) have both been agreed by EU member states
and published in the Official Journal. There is a 2-year implementation period for transposing them into member state law/regulation with both of these due in H1 2018.
• The key elements of the IDD impacting DLG are the introduction of an Insurance Product Information Document (IPID), disclosure of remuneration, product oversight and governance requirements, and continuing professional development.
• The main articles of the GDPR that will impact DLG relate to consent for profiling of sensitive data of anyone other than the policyholder, the
use of criminal offences in pricing and underwriting, and data portability. DLG is lobbying UK Government for insurers to be able to continue using criminal offences.
DfT consideration of ECJ judgment on Vnuk vsZavarovalnica
• The Department for Transport (DfT) is seeking views on options for amending domestic law on motor insurance following the judgment from European Court of Justice in a case known as Vnuk.
• At present, the Road Traffic Act (RTA) requires compulsory motor insurance to be in place for vehicles intended for or adapted for road use or in a public place – not private land – which means that it is not compliant with the EU Motor Directive, as highlighted by Vnuk.
• DfT is seeking views on whether to amend the RTA to reflect the Vnuk ruling or to wait for the EC to amend the Directive in due course (which
is anticipated in 2017). DfT is also consulting on derogating certain vehicles, which removes the requirement for mandatory insurance and any claims would be covered by the Motor Insurers’ Bureau (MIB), which is funded by insurers.
MoJ review of Ogden discount rate
• The Lord Chancellor announced a change in the discount rate (applied to personal injury claims which are settled with lump sum payments)
from 2.5% down to negative 0.75%.
• Claimant compensation for the most serious and long-term injuries settled from 20th March 2017 will benefit from an increased payment• The Government will review the framework under which the rate is set to ensure it remains fit for purpose in the future.
MoJ whiplash reforms
• Consultation to lower the number and cost of whiplash claims. First part of the Government response confirms they will: • introduce a tariff of damages for whiplash claims that last up to 24 months which would see major reductions in costs;
• raise the small claims limit for RTA related personal injury claims from £1,000 to £5,000 and to £2000 for all other personal injury claims; and
• ban offers to settle whiplash claims without medical evidence.
• A number of other proposals are still being considered and the Government is keen to implement all changes as a package in late 2018.
• A detailed review of regulations for automated driving technologies is in train.
• The focus of the review is to ensure the UK is at the forefront of the testing and development of the technologies that will ultimately realise
the goal of driverless vehicles. • The Government will review and amend domestic regulations by summer 2017 to accommodate driverless technology.
DfT Pathway to Driverless cars
FCA add-ons, renewal disclosures and value measures
• The FCA banned ‘opt out selling’ for all add on products sold with insurance and made rules requiring that consumers make ‘active elections’ to renew add-ons that were previously free of charge. These changes were implemented in 2016.
• A pilot ‘scorecard’ publishing measures of product value is underway with firms required to provide details of claims frequency, claims acceptance and average claims payment for Home Buildings and Contents, Home Emergency, Key Cover (as an add-on only) and
Personal Accident (as an add-on only). Figures for the year ending 31st August 2016 have recently been published on the FCA website.
• The requirement to disclose last year’s premium on renewal documents as well as statements on shopping around for cover are due to be implemented in April 2017.

65
Glossary of terms
The ratio of Solvency II own funds to the solvency capital requirement.Capital coverage ratio
Term Definition
Adjusted diluted earnings per shareAdjusted diluted earnings per share is calculated by dividing the adjusted profit after tax of Ongoing operations by the weighted
average number of Ordinary Shares during the period adjusted for dilutive potential Ordinary Shares.
Adjusted profit after taxProfit after tax is adjusted to exclude discontinued operations, the Run-off segment and restructuring and other one-off costs, and is
stated after charging tax (using the UK standard tax rate of 20.0%; 2015: 20.25%).
Combined operating ratio (“COR”)The combined operating ratio is the sum of the loss, commission and expense ratios. The ratio measures the amount of claims costs,
commission and expenses compared to net earned premium generated. A ratio of less than 100% indicates profitable underwriting.
Commission ratio The ratio of commission expense divided by net earned premium.
Current-year attritional loss ratioThe loss ratio for the current accident year, excluding the movement of claims reserves relating to previous accident years and claims
costs relating to major weather events in the Home division.
Earnings per share The amount of the Group’s profit allocated to each Ordinary Share of the Company.
Expense ratio The ratio of operating expenses divided by net earned premium.
Investment income yield
The annualised income earned from the investment portfolio, recognised through the income statement during the period and divided
by the average assets under management. This excludes unrealised and realised gains and losses, impairments and fair-value
adjustments. The average assets under management derives from the period’s opening and closing balances for the total Group.
Investment returnThe income earned from the investment portfolio, including unrealised and realised gains and losses, impairments and fair value
adjustments.

66
Glossary of terms
The annualised return earned from the investment portfolio, recognised through the income statement during the period divided by the
average assets under management. This includes unrealised and realised gains and losses, impairments and fair-value adjustments. The
average assets under management derives from the period’s opening and closing balances for the total Group.
Investment return yield
Total costs comprise operating expenses and claims handling expenses for Ongoing operations.Total costs
The profit or loss from operational activities excluding investment return and other operating income. It is calculated as net earned premium less net insurance claims and total expenses.Underwriting result (profit or loss)
Term Definition
Loss ratio Net insurance claims divided by net earned premium.
Ongoing operationsOngoing operations comprise the Group’s ongoing divisions: Motor, Home, Rescue and other personal lines, and Commercial. It excludes discontinued operations, the Run-off segment, and restructuring and other one-off costs.
Operating profit The pre-tax profit that the Group’s activities generate, including insurance and investments activity, but excluding finance costs.
Return on tangible equity (“RoTE”)Return on tangible equity is annualised adjusted profit after tax from Ongoing operations divided by the Group’s average shareholders’
equity less goodwill and other intangible assets.
Solvency II
The capital adequacy regime for the European insurance industry, which became effective on 1 January 2016. It establishes revised capital requirements and risk management standards. It sets out capital requirements appropriate systems of governance and disclosure requirements.

6767
Investor relations contacts
Louise Calver
Investor Relations Manager
T: +44 (0)1651 832877
Investor relations app
Andy Broadfield
Director of Investor Relations
T: +44 (0)1651 831022

6868
General disclaimer
Forward-looking statements
Certain information contained in this document, including any information as to the Group’s strategy, plans or future financial or operating
performance, constitutes “forward-looking statements”. These forward-looking statements may be identified by the use of forward-looking
terminology, including the terms “aims”, “anticipates”, “aspire”, “believes”, “continue”, “could”, “estimates”, “expects”, “guidance”, “intends”,
“may”, “mission”, “outlook”, “plans”, “predicts”, “projects”, “seeks”, “should”, “strategy”, “targets” or “will” or, in each case, their negative or other
variations or comparable terminology, or by discussions of strategy, plans, objectives, goals, future events or intentions. These forward-looking
statements include all matters that are not historical facts. They appear in a number of places throughout this document and include statements
regarding the intentions, beliefs or current expectations of the Directors concerning, among other things: the Group’s results of operations, financial
condition, prospects, growth, strategies and the industry in which the Group operates. Examples of forward-looking statements include financial
targets which are contained in this document specifically with respect to return on tangible equity, risk-based capital coverage ratio, the Group’s
combined operating ratio, prior-year reserve releases, cost reduction, investment income yield, net realised and unrealised gains, results from the run-
off segment, restructuring and other one-off costs, and risk appetite range. By their nature, all forward-looking statements involve risk and
uncertainties because they relate to events and depend on circumstances that may or may not occur in the future or are beyond the Group’s
control.
Forward-looking statements are not guarantees of future performance. The Group’s actual results of operations, financial condition and the
development of the business sector in which the Group operates may differ materially from those suggested by the forward-looking statements
contained in this document, for example directly or indirectly as a result of, but not limited to, UK domestic and global economic business conditions,
the result of the referendum on the UK’s withdrawal from the European Union, market-related risks such as fluctuations in interest rates and exchange
rates, the policies and actions of regulatory authorities (including changes related to capital and solvency requirements or the Ogden discount rate),
the impact of competition, currency changes, inflation and deflation, the timing impact and other uncertainties of future acquisitions, disposals, joint
ventures or combinations within relevant industries, as well as the impact of tax and other legislation and other regulation in the jurisdictions in which
the Group and its affiliates operate. In addition, even if the Group’s actual results of operations, financial condition and the development of the
business sector in which the Group operates are consistent with the forward-looking statements contained in this document, those results or
developments may not be indicative of results or developments in subsequent periods.
The forward-looking statements contained in this document reflect knowledge and information available as of the date of preparation of this
document. The Group and the Directors expressly disclaim any obligations or undertaking to update or revise publicly any forward-looking
statements, whether as a result of new information, future events or otherwise, unless required to do so by applicable law or regulation. Nothing in this
document should be construed as a profit forecast.
Inside Information
Prior to publication, this document combined inside information for the purposes of Article 7 of the European Union Regulation 596/2014.
Related Documents


![· Gift]Awards/MemoriaIs Expense Legal Services Food/Beverage Expense Polling Expense Printing Expense Salaries/Wages/Contract Labor Solicitation/Fundraising Expense](https://static.cupdf.com/doc/110x72/5c5ef74209d3f2515c8cf3a9/-giftawardsmemoriais-expense-legal-services-foodbeverage-expense-polling-expense.jpg)
