U.S. Forest Service FY 2009 Aviation Safety Summary

Welcome message from author
This document is posted to help you gain knowledge. Please leave a comment to let me know what you think about it! Share it to your friends and learn new things together.
Transcript

U.S. Forest Service
FY 2009 Aviation Safety Summary

2
Table of Contents
NOTE: Formulas used: Industry standard “per 100,000 hours flown” Accident Rate = Number of accidents divided by the number of hours flown multiplied by 100,000. Fatal Accident Rate = Number of fatal accidents divided by the number of hours flown multiplied by 100,000.
Fatality Rate = Number of fatalities divided by the number of hours flown multiplied by 100,000.
This report is available on-line at: http://www.fs.fed.us/fire/av_safety/fy_safety_reports/index.html
Executive Summary 3
Aviation Safety Accomplishments 5
Statistical Summary 7
USFS Owned and/or Operated Statistics 14
Fixed-Wing Statistics 16
Airtanker Statistics 18
Helicopter Statistics 21
SAFECOM Summary 23
Mishap Summary 33

3
Executive Summary
In FY 2009 the U.S. Forest Service experienced a below average mishap rate, however, the attainment of zero aviation accident/incident occurrence is our ultimate goal. The Forest Service Aviation Risk Management program is based on the philosophy that all aircraft mishaps are preventable and that mishap prevention is an inherent function of management.
Risk Management Program Objective: The objectives of Aviation Risk Management and Training Systems are in keeping with the most modern approaches to the safe management of complex systems. The Forest Service incorporates Safety Management Systems (SMS) in it’s aviation program. Safety Management Systems achieve high standards of efficiency and effectiveness within the four primary components which include: Policy is management commitment, responsibility and accountability for the pro-
gram and the appointment of key safety personnel. Forest Service manuals are be-ing revised using principle centered management for guidance of aviation opera-tions.
Risk Management identifies hazards and applies risk assessment and mitigation processes.
Assurance is the process of monitoring controls that also includes aviation accident prevention, review and analysis of historical data, accident investigation, error analysis, and corrective action plans.
Promotion includes training for pilots, crews, managers, support personnel and end-users. Other communications, awards and lessons learned help to maintain safety awareness.
Interagency Cooperation to Reduce Aviation Mishaps
Success in aviation safety is a result of coordinated efforts with cooperators and vendors who provide approximately 90% of all Forest Service aviation services. The Forest Service is the leading federal agency working with the FAA on imple-
menting Safety Management Systems that target a reduction in the number of acci-dents experienced by aircraft vendors that service our natural resource missions.
Interagency Aviation Program Risk Assessments have been completed for fire sup-pression operation of Airtankers, SEATS, Aerial Supervision, and Helicopters and for FS aviation operations in Infra-Red, Forest Health Protection and the Rocky Mountain Research Station programs.
A Strategic Risk Assessment was completed on the Type I Helicopter Program. Contracts were awarded to complete Strategic Risk Assessments on the Rappel and Aerial Supervision programs in 2010.

4
Mishap Trends:
The Branch of Aviation Risk Management monitors safety data, hazard reports and mis-haps in its effort to identify hazardous trends. The Aviation Accident Database supports accident trend analysis, and the identification of Human Factors issues. The SAFECOM system is a proactive method that monitors and corrects safety issues and shares lessons learned on a daily basis.
All three of the Forest Service aviation related accidents in 2009 occurred on fire-fighting activities, including an airtanker ferry flight, helicopter water drop and rap-pel proficiency mission.
There were four Incidents With Potential (IWP) all of which were also supporting fire suppression activities (3 helicopter and 1 airtanker).
The FS had 441 SAFECOM reports; as a leading indicator of incidents and hazards this is 32% below the average of 699 reports.
There were a total of 74 incidents and 120 hazards reported in the SAFECOM system for 2009.
The current accident rate of 5.21 is slightly below the average of 5.89; however, over the past ten years the trend line is on a slight increase (pg 8).
The current fatality rate is 6.95, which is above the 10-year average of 4.45.
Forest Service Owned and/or Operated aircraft (O/O) have not had an accident in 6 years, the last accident occurred in December of 2003. There have not been any fatali-ties in O/O aircraft for 14 years.
Fixed wing contract operations have generally remained the same for the past ten years with an average of one accident a year, however, there were no accidents in 2009.
Airtankers accounted for 7.8% of the flight hours in 2009 and 33.3% of the accidents.
Airtankers accounted for 8% of the flight hours over the last 10 years and 14% of all the accidents.
Helicopters accounted for 46% of the flight hours in 2009 and 66.6% of the accidents.
Helicopters accounted for 47.9% of the flight hours over the past 10 years and 59% of all the accidents.
The number of reported helicopter dropped (11) and dragged (19) loads accounted for 41% of the incident reports in 2009 compared to 54% in 2008 and 42% in 2007.
Executive Summary

5
Accomplishments achieved in aviation safety in FY 2009 include the following: Safety Promotion:
Published 4 Interagency Aviation Safety Alerts Published 2 Interagency Technical Bulletins Published 3 Interagency Aviation Lessons Learned Published 8 Interagency Accident Prevention Bulletins Produced 2 FS Safety Alerts Produced 4 Monthly SAFECOM Summaries Produced one Interagency Airward Newsletter SAFECOM Working Group launched online SAFECOM Survey SAFECOM Working Group added function to upload picture and pdf files to SAFECOM SAFECOM Working Group produced SAFECOM Training Module Redesigned Forest Service Aviation Safety web pages to reflect Safety Management System
philosophy Developed Aviation Safety Management System web pages with the Wildland Fire Lessons
Learned Center Coordinated investigations on 3 Forest Service accidents, and 4 incidents with potential Promoted Safety Management Systems (SMS) with BLM and AMD Updated program risk assessments for Infrared, Rope Assisted Deployment System
(RADS), and Emergency Human Extraction Longline (EHELL) Contracted and completed Strategic Risk Assessment for Type I Helicopters Initiated Strategic Risk Assessment for Rappel program Policy/Procedure Recommendations Assisted in fire and aviation policy rewrite implementing Doctrine Completed 5720 doctrinal rewrite Produced draft Safety Management Systems Guide Assisted with contract modifications to include safety criteria Assisted with contract evaluation to assess safety criteria Incorporated ARB action items into training programs and aviation contracts Assisted in revision review of Interagency guides including Redbook, IHOG, Rappel guide,
etc. Produced the Interagency Risk Assessment Workbook
Aviation Safety Accomplishments

6
Aviation Safety Accomplishments
Training Training is managed through a system of resources including basic Interagency aviation courses, university level education, and NWCG sanctioned skills based training for all FS aviation users. The FS sponsored an FAA Safety Management Systems (SMS) course for all FS avia-
tion personnel and as well as interagency partners. (85 attendees) Sponsored 27 scholarships each for six System Safety Leadership and Aviation Manage-
ment (SSLAM) modules through UC Davis To date 49 Forest Service personnel have completed the SSLAM Certificate Program,
which also meets the requirement for issuance of the ICAP Federaql Aviation Safety Officer Certificate
Interagency Aviation Training (IAT): Forest Service employees completed 12,457 on-line courses, 1,627 classroom courses and 817 courses at an ACE conference for a total of 14,901 courses
Coordinated/funded projects with DOI for Interagency Aviation Training (IAT) pro-gram, including on-line computer based training and contracted course development
One Aviation Centered & Education (ACE) training session was held in Boise Interagency Aviation Training (IAT) provided 74 “A courses” including 25 online
courses with the remainder being classroom instruction of basic safety courses to over 9,600 FS employees to date
Assisted R-3 in coordinating an IAT week long training session in Albuquerque. Assisted FHP in presenting two IAT week long training sessions in Portland, OR and
Salt Fork, OH. Coordinated USFS ACE instructor assignments. Presented Controlled Flight into Terrain (CFIT) course for NAFA and SSLAM Presented A-200 Aviation Mishap Reviews at several Helicopter Crewmember, Helicop-
ter Manager and Helibase Manager Courses Conducted three IAT instructor classes qualifying 10 new FS Instructors
7
Statistical Summary The USFS flew 57,536 hours in FY 2009 which is well below the 10-year average of 83,105. There were 3 accidents and 4 “Incidents With Potential” (IWP). The accident rate for FY 2009 is 5.21, which is slightly below the 10-year average of 5.89. Unfortunately there were 4 fatalities, 3 involved in the airtanker accident and one rappel accident. The primary mission of Forest Service Aviation is to support the natural resource programs through a variety of means, including, but not limited to: Aerial delivery of firefighters by parachute, rappel rope, or on site landing Air tactical command and control Surveillance, reconnaissance, and intelligence gathering Infrared detection & mapping Aerial delivery of fire retardant and water Passenger transport for firefighting and resource missions Administrative flights Research Forest rehabilitation Forest Health Protection (aerial surveys, application and photography) Law enforcement Aerial photography Approximately 180 employees at the Washington Office, Regional Offices and Forest lev-els administer the Forest Service aviation program. The national staff is located in Wash-ington D.C. and at the National Interagency Fire Center in Boise, Idaho. The vast major-ity of aviation personnel are located at nine regional operations centers around the United States, providing day-to-day operational oversight and program guidance. The Forest Service annually operates approximately 650 aircraft. These include govern-ment owned and leased, but mostly contracted aircraft. The Forest Service owns and oper-ates 27 aircraft (24 fixed-wing and 3 helicopters) and leases/operates 13 aerial supervision fixed wing aircraft. Several state agencies and county municipalities operate aircraft under the Federal Excess Personal Property (FEPP) program which is managed by the Forest Service. These aircraft are not included in these statistics or mishap data.
8
USFS Aircraft Accident Rates 1999 to 2008
*SEAT – flight hours for SEAT aircraft on USFS lands were obtained from the DOI, Aviation Management Directorate
Statistical Summary
3.583.12
8
4.46
8.17
4.07
11.91
4.69
5.214.96
0
2
4
6
8
10
12
14
2000
2001
2002
2003
2004
2005
2006
2007
2008
2009a
cc
ide
nt
rate
Accident Rate Trendline
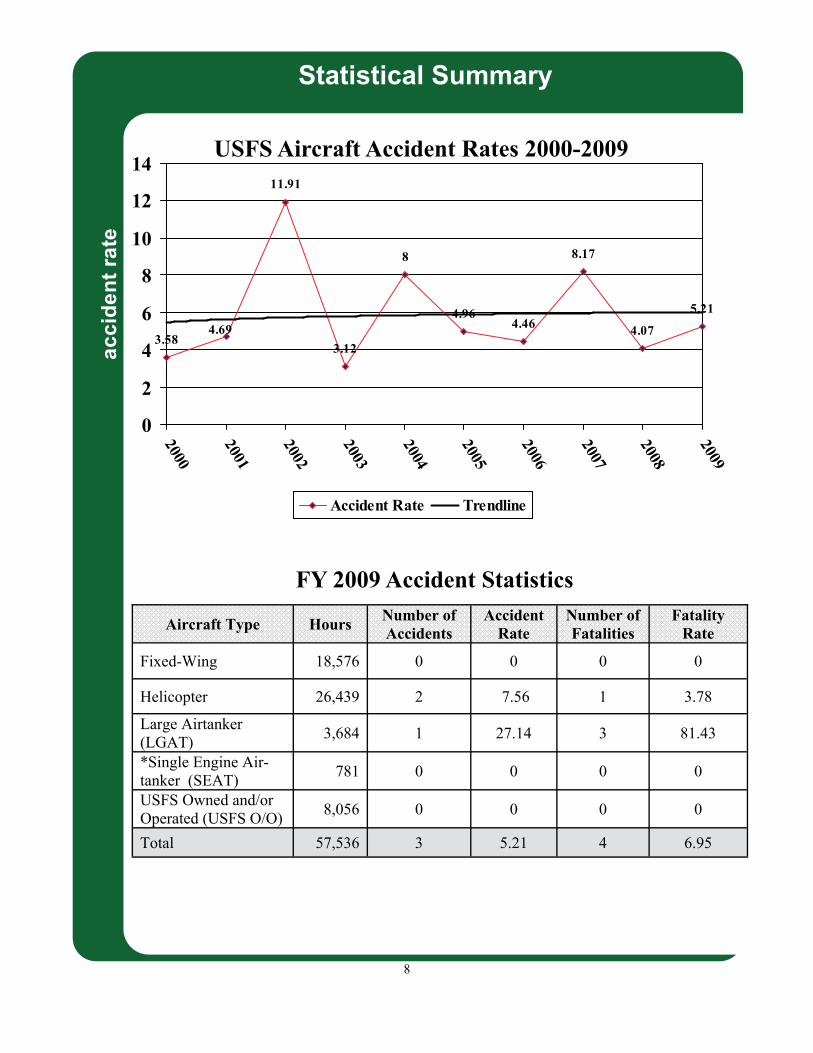
FY 2009 Accident Statistics
Aircraft Type Hours Number of Accidents
Accident Rate
Number of Fatalities
Fatality Rate
Fixed-Wing 18,576 0 0 0 0
Helicopter 26,439 2 7.56 1 3.78
Large Airtanker (LGAT)
3,684 1 27.14 3 81.43
*Single Engine Air-tanker (SEAT)
781 0 0 0 0
USFS Owned and/or Operated (USFS O/O)
8,056 0 0 0 0
Total 57,536 3 5.21 4 6.95
USFS Aircraft Accident Rates 2000-2009

9
Statistical Summary
FY 2009 Flight Hour Percentages
32.3%46.0%
6.4% 14.0%1.4%
Fixed-Wing Helicopter LGAT USFS O/O SEAT
10 Year Average of Flight Hour Percentages2000-2009
33.5%
47.9%
7.0% 10.6%
1.0%
Fixed-Wing Helicopter LGAT USFS O/O SEAT

10
Statistical Summary
Comparison of Average vs 2009
10 Year Average 2009 Comparison
Hours flown 83,105 57,536 -25,569
Number of Accidents 4.9 3 -1.9
Number of Fatalities 3.7 4 .3
Accident Rate 5.89 5.21 -.68
Fatality Rate 4.45 6.95 2.5
83,105
57,536
0
20,000
40,000
60,000
80,000
100,000
Average Actual
Average vs Actual Hours Flown for FY 2009
6.95
4.4543.7
5.21
5.89
3
4.9
0
1
2
3
4
5
6
7
Number of Accidents Accident Rate Number of Fatalities Fatality Rate
Average vs Actual for FY 2009
Average Actual
11
Statistical Summary
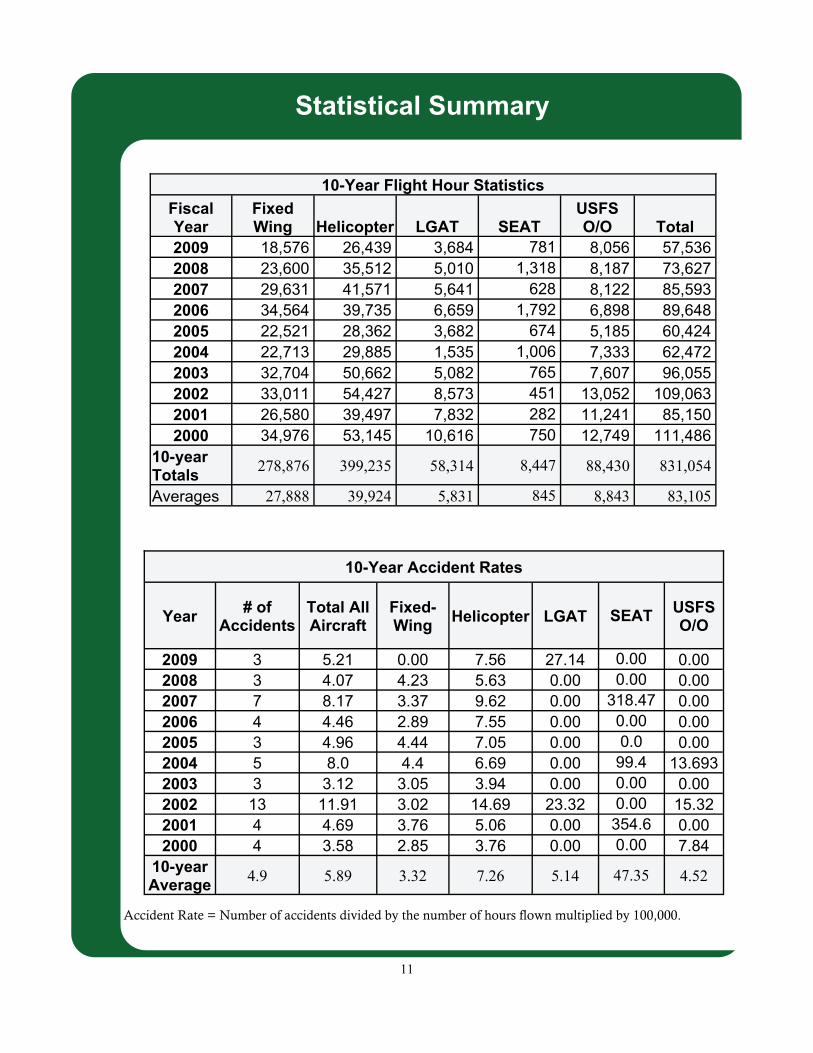
10-Year Flight Hour Statistics
Fiscal Year
Fixed Wing Helicopter LGAT SEAT
USFS O/O Total
2009 18,576 26,439 3,684 781 8,056 57,536 2008 23,600 35,512 5,010 1,318 8,187 73,627 2007 29,631 41,571 5,641 628 8,122 85,593 2006 34,564 39,735 6,659 1,792 6,898 89,648 2005 22,521 28,362 3,682 674 5,185 60,424 2004 22,713 29,885 1,535 1,006 7,333 62,472 2003 32,704 50,662 5,082 765 7,607 96,055 2002 33,011 54,427 8,573 451 13,052 109,063 2001 26,580 39,497 7,832 282 11,241 85,150 2000 34,976 53,145 10,616 750 12,749 111,486
10-year Totals
278,876 399,235 58,314 8,447 88,430 831,054
Averages 27,888 39,924 5,831 845 8,843 83,105
10-Year Accident Rates
Year # of
Accidents Total All Aircraft
Fixed-Wing
Helicopter LGAT SEAT USFS O/O
2008 3 4.07 4.23 5.63 0.00 0.00 0.00 2007 7 8.17 3.37 9.62 0.00 318.47 0.00 2006 4 4.46 2.89 7.55 0.00 0.00 0.00 2005 3 4.96 4.44 7.05 0.00 0.0 0.00 2004 5 8.0 4.4 6.69 0.00 99.4 13.693 2003 3 3.12 3.05 3.94 0.00 0.00 0.00 2002 13 11.91 3.02 14.69 23.32 0.00 15.32 2001 4 4.69 3.76 5.06 0.00 354.6 0.00 2000 4 3.58 2.85 3.76 0.00 0.00 7.84
10-year Average
4.9 5.89 3.32 7.26 5.14 47.35 4.52
2009 3 5.21 0.00 7.56 27.14 0.00 0.00
Accident Rate = Number of accidents divided by the number of hours flown multiplied by 100,000.
12
Statistical Summary
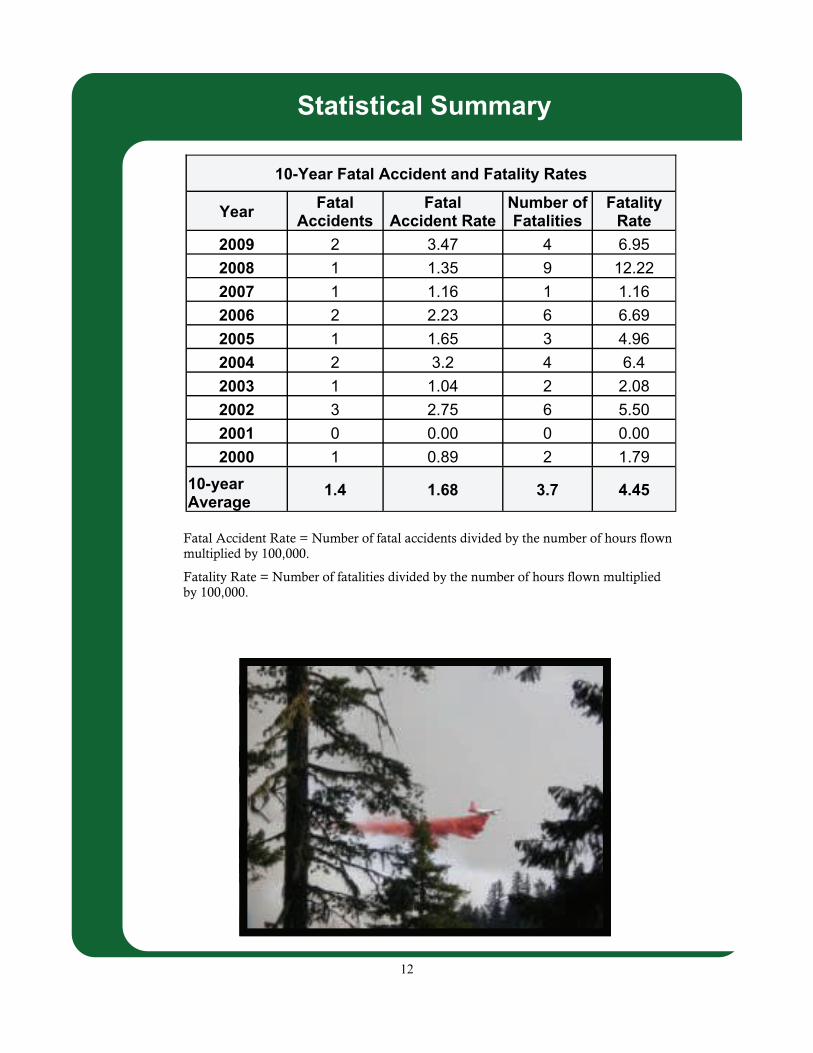
10-Year Fatal Accident and Fatality Rates
Year Fatal
Accidents Fatal
Accident Rate Number of Fatalities
Fatality Rate
2009 2 3.47 4 6.95
2008 1 1.35 9 12.22
2007 1 1.16 1 1.16
2006 2 2.23 6 6.69
2005 1 1.65 3 4.96
2004 2 3.2 4 6.4
2003 1 1.04 2 2.08
2002 3 2.75 6 5.50
2001 0 0.00 0 0.00
2000 1 0.89 2 1.79
10-year Average
1.4 1.68 3.7 4.45
Fatal Accident Rate = Number of fatal accidents divided by the number of hours flown multiplied by 100,000.
Fatality Rate = Number of fatalities divided by the number of hours flown multiplied by 100,000.
13
Statistical Summary
67
85
60
45
34 3226
17
28
17
41.1
0102030405060708090
1961-1965
1966-1970
1971-1975
1976-1980
1981-1985
1986-1990
1991-1995
1996-2000
2001-2005
*2006-2010
1961-2008 Average
Total Number of Accidents for all aircraft(5-Year Increments)
35
30
40
19
15
11
19
8
15
2021.2
0
5
10
15
20
25
30
35
40
1961-1965
1966-1970
1971-1975
1976-1980
1981-1985
1986-1990
1991-1995
1996-2000
2001-2005
*2006-2010
1961-2008 Average
Total Number of Fatalities for all aircraft(5-Year Increments)
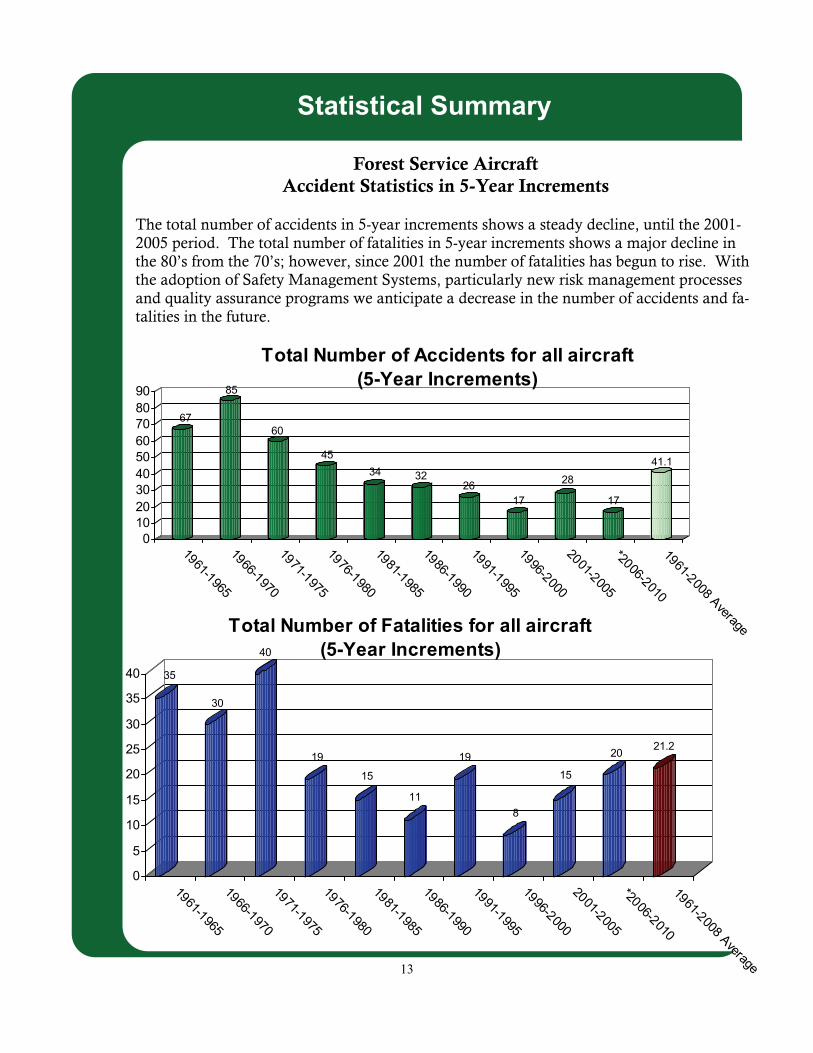
Forest Service Aircraft Accident Statistics in 5-Year Increments
The total number of accidents in 5-year increments shows a steady decline, until the 2001-2005 period. The total number of fatalities in 5-year increments shows a major decline in the 80’s from the 70’s; however, since 2001 the number of fatalities has begun to rise. With the adoption of Safety Management Systems, particularly new risk management processes and quality assurance programs we anticipate a decrease in the number of accidents and fa-talities in the future.
14
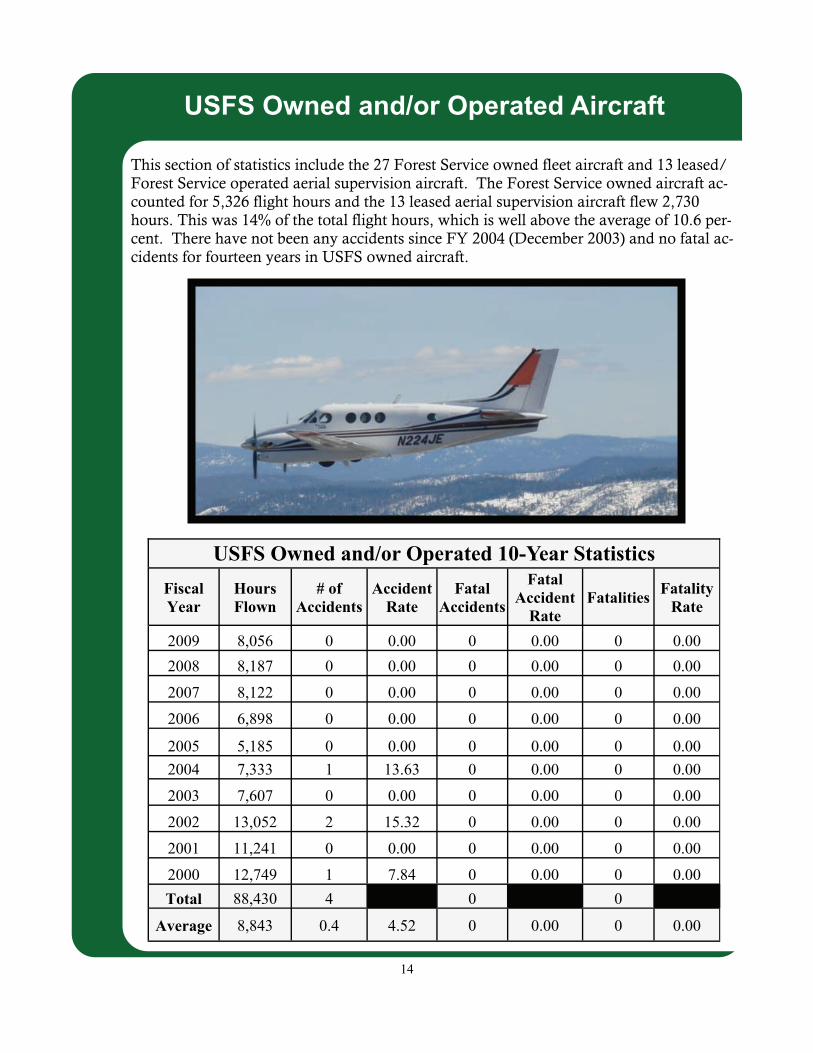
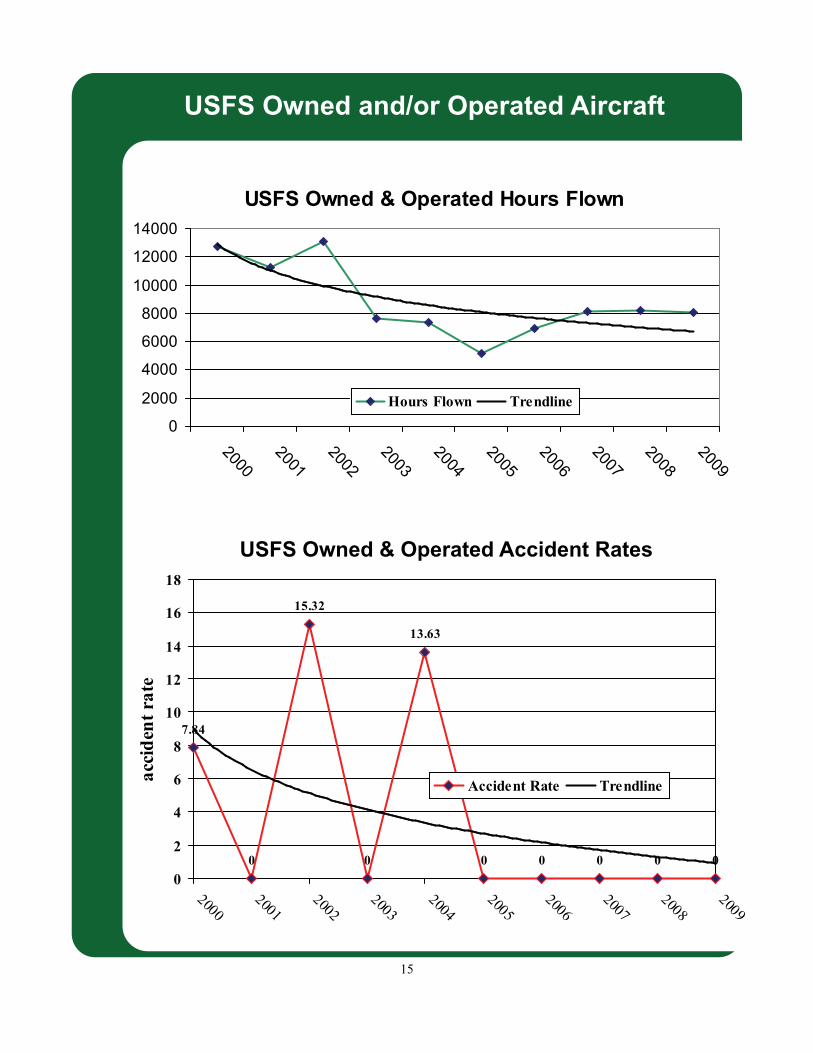
USFS Owned and/or Operated Aircraft This section of statistics include the 27 Forest Service owned fleet aircraft and 13 leased/Forest Service operated aerial supervision aircraft. The Forest Service owned aircraft ac-counted for 5,326 flight hours and the 13 leased aerial supervision aircraft flew 2,730 hours. This was 14% of the total flight hours, which is well above the average of 10.6 per-cent. There have not been any accidents since FY 2004 (December 2003) and no fatal ac-cidents for fourteen years in USFS owned aircraft.
USFS Owned and/or Operated 10-Year Statistics
Fiscal Year
Hours Flown
# of Accidents
Accident Rate
Fatal Accidents
Fatal Accident
Rate Fatalities
Fatality Rate
2009 8,056 0 0.00 0 0.00 0 0.00
2008 8,187 0 0.00 0 0.00 0 0.00
2007 8,122 0 0.00 0 0.00 0 0.00
2006 6,898 0 0.00 0 0.00 0 0.00
2005 5,185 0 0.00 0 0.00 0 0.00
2004 7,333 1 13.63 0 0.00 0 0.00
2003 7,607 0 0.00 0 0.00 0 0.00
2002 13,052 2 15.32 0 0.00 0 0.00
2001 11,241 0 0.00 0 0.00 0 0.00
2000 12,749 1 7.84 0 0.00 0 0.00
Total 88,430 4 0 0
Average 8,843 0.4 4.52 0 0.00 0 0.00
15
USFS Owned and/or Operated Aircraft
USFS Owned & Operated Hours Flown
0
2000
4000
6000
8000
10000
12000
14000
2000
2001
2002
2003
2004
2005
2006
2007
2008
2009
Hours Flown Trendline
7.84
0
13.63
0 0 0
15.32
0 00
0
2
4
6
8
10
12
14
16
18
20002001
20022003
20042005
20062007
20082009
acci
den
t ra
te
Accident Rate Trendline
USFS Owned & Operated Accident Rates

16
Fixed-Wing Aircraft (contract)
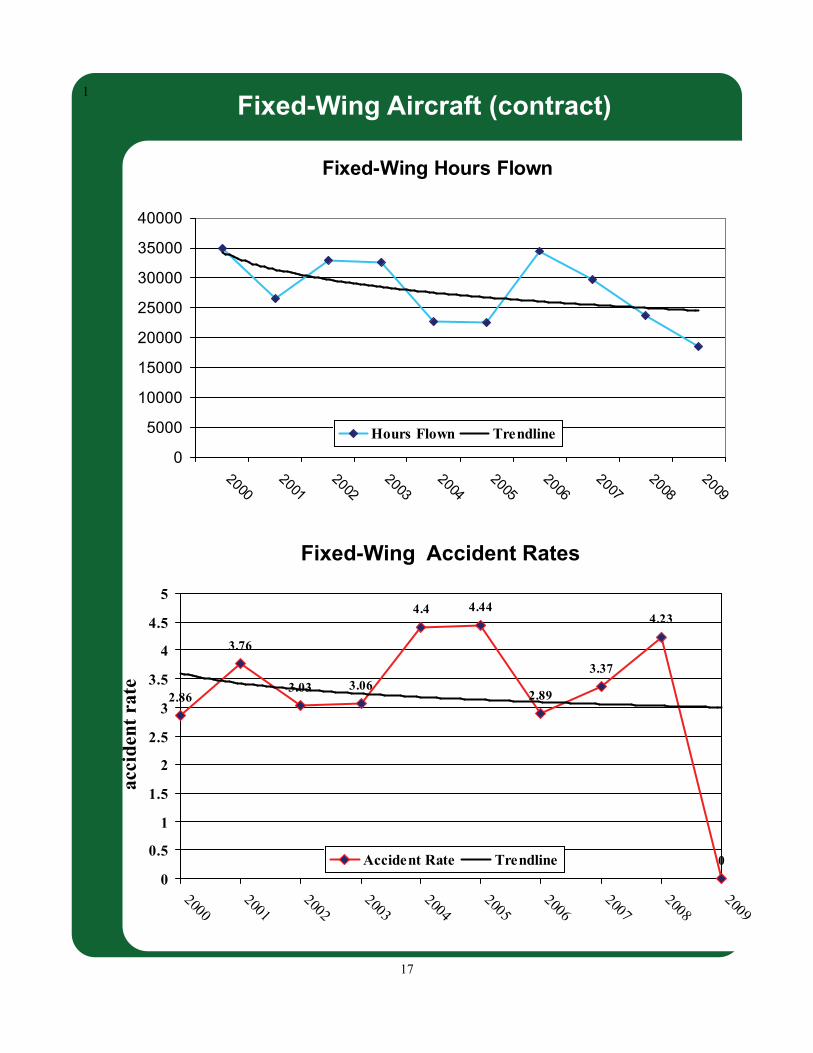
Fixed-Wing contract aircraft accounted for 32.3% of the total hours flown in FY 2009; the 10-year average is 33.5 percent. There were 18,576 hours flown in FY 2009, which is well below the 10-year average of 27,888. This was the first year contract fixed-wing aircraft did not have an accident in the past 10 years.
Fixed-Wing 10-Year Statistics
Fiscal Year
Hours Flown
Accidents Accident
Rate Fatal
Accidents
Fatal Accident
Rate Fatalities
Fatality Rate
2009 18,576 0 0.00 0 0.00 0 0.00 2008 23,600 1 4.23 0 0.00 0 0.00 2007 29,631 1 3.37 0 0.00 0 0.00 2006 34,564 1 2.89 0 0.00 0 0.00 2005 22,521 1 4.44 0 0.00 0 0.00 2004 22,713 1 4.40 1 4.40 3 13.2 2003 32,704 1 3.06 0 0.00 0 0.00 2002 33,011 1 3.03 0 0.00 0 0.00 2001 26,580 1 3.76 0 0.00 0 0.00 2000 34,976 1 2.86 1 2.86 2 5.72 Total 278,876 9 2 5
Average 27,888 0.9 3.22 0.2 0.71 0.5 1.79
17
1
Fixed-Wing Aircraft (contract)
Fixed-Wing Hours Flown
0
5000
10000
15000
20000
25000
30000
35000
40000
20002001
20022003
20042005
20062007
20082009
Hours Flown Trendline
Fixed-Wing Accident Rates
2.863.06
2.89
3.37
4.234.4
3.03
3.76
0
4.44
0
0.5
1
1.5
2
2.5
3
3.5
4
4.5
5
20002001
20022003
20042005
20062007
20082009
acci
dent
rat
e
Accident Rate Trendline
18
Airtankers (contract)
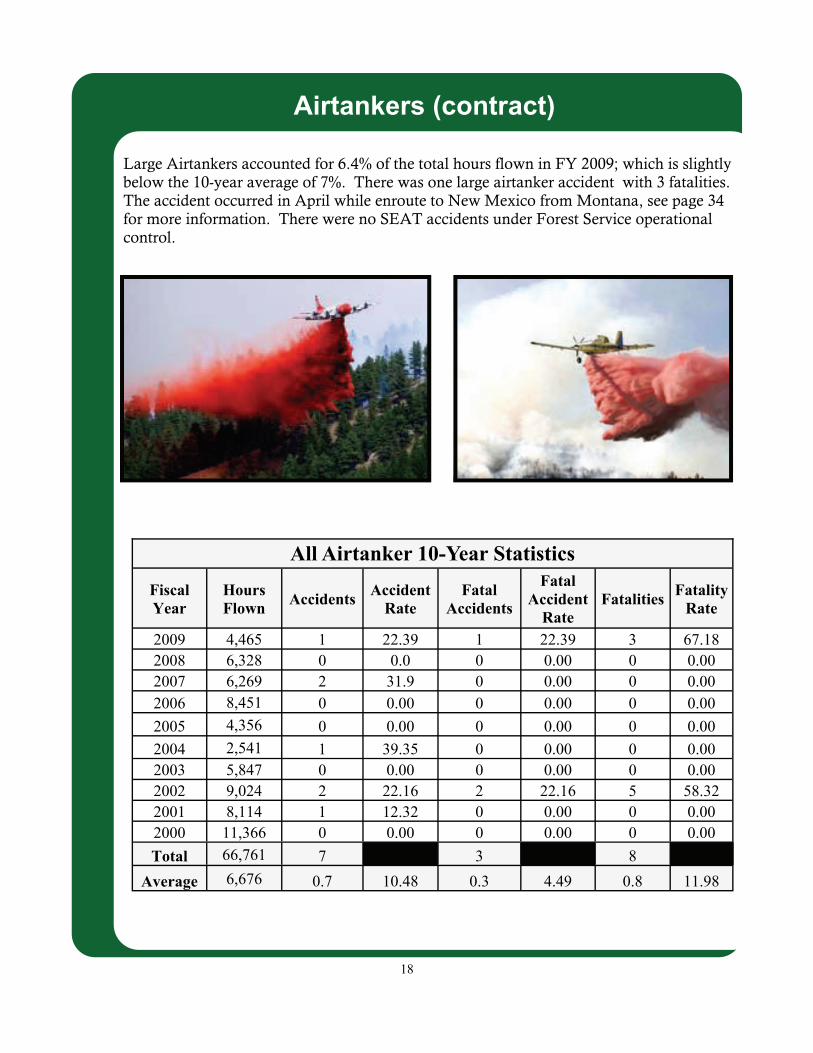
Large Airtankers accounted for 6.4% of the total hours flown in FY 2009; which is slightly below the 10-year average of 7%. There was one large airtanker accident with 3 fatalities. The accident occurred in April while enroute to New Mexico from Montana, see page 34 for more information. There were no SEAT accidents under Forest Service operational control.
All Airtanker 10-Year Statistics
Fiscal Year
Hours Flown
Accidents Accident
Rate Fatal
Accidents
Fatal Accident
Rate Fatalities
Fatality Rate
2008 6,328 0 0.0 0 0.00 0 0.00 2007 6,269 2 31.9 0 0.00 0 0.00 2006 8,451 0 0.00 0 0.00 0 0.00
2005 4,356 0 0.00 0 0.00 0 0.00
2004 2,541 1 39.35 0 0.00 0 0.00 2003 5,847 0 0.00 0 0.00 0 0.00 2002 9,024 2 22.16 2 22.16 5 58.32 2001 8,114 1 12.32 0 0.00 0 0.00 2000 11,366 0 0.00 0 0.00 0 0.00
Total 66,761 7 3 8
Average 6,676 0.7 10.48 0.3 4.49 0.8 11.98
2009 4,465 1 22.39 1 22.39 3 67.18

19
Airtankers (contract)
Large Airtanker 10-Year Statistics
Fiscal Year
Hours Flown
Accidents Accident
Rate Fatal
Accidents
Fatal Accident
Rate Fatalities
Fatality Rate
2008 5,010 0 0.00 0 0.00 0 0.00 2007 5,641 0 0.00 0 0.00 0 0.00 2006 6,659 0 0.00 0 0.00 0 0.00 2005 3,682 0 0.00 0 0.00 0 0.00 2004 1,535 0 0.00 0 0.00 0 0.00 2003 5,082 0 0.00 0 0.00 0 0.00 2002 8,573 2 23.33 2 23.33 5 58.32 2001 7,832 0 0.00 0 0.00 0 0.00 2000 10,616 0 0.00 0 0.00 0 0.00 Total 58,314 3 3 8
Average 5,831 0.3 5.14 0.3 5.14 0.8 13.71
2009 3,684 1 27.14 1 27.14 3 81.43
Single Engine Airtanker 10-Year Statistics
Fiscal Year
Hours Flown
Accidents Accident
Rate Fatal
Accidents
Fatal Accident
Rate Fatalities
Fatality Rate
2008 1,318 0 0.00 0 0.00 0 0.00 2007 628 2 318.47 0 0.00 0 0.00 2006 1,792 0 0.0 0 0.00 0 0.00 2005 674 0 0.0 0 0.00 0 0.00 2004 1,006 1 99.4 0 0.00 0 0.00 2003 765 0 0.0 0 0.00 0 0.00 2002 451 0 0.0 0 0.00 0 0.00 2001 282 1 354.6 0 0.00 0 0.00 2000 750 0 0.0 0 0.00 0 0.00 Total 8,447 4 0 0
Average 845 0.4 47.35 0 0.00 0 0.00
2009 781 0 0.00 0 0.00 0 0.00
20
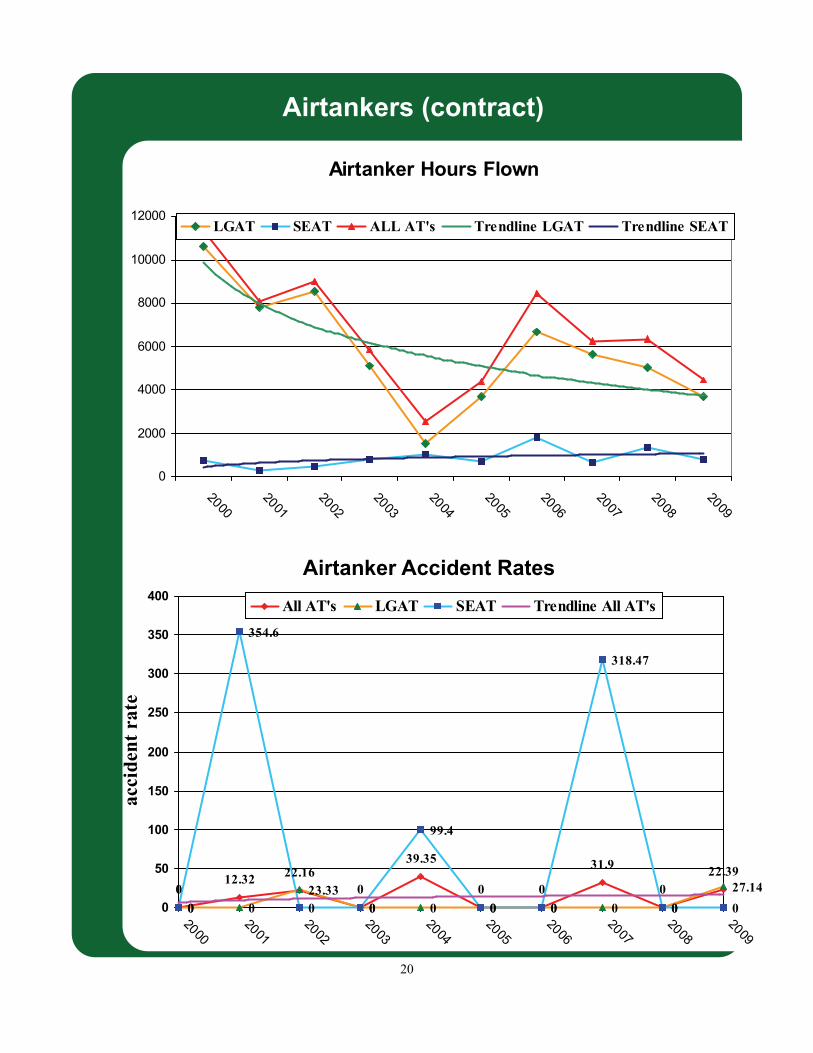
Airtankers (contract)
Airtanker Hours Flown
0
2000
4000
6000
8000
10000
12000
2000
2001
2002
2003
2004
2005
2006
2007
2008
2009
LGAT SEAT ALL AT's Trendline LGAT Trendline SEAT
0 0
39.35
0
31.9
0
0 023.33
0 0 0 0 0 0
27.14
0
354.6
0 0
99.4
0 0
318.47
0 0
22.1612.3222.39
0
0
50
100
150
200
250
300
350
400
20002001
20022003
20042005
20062007
20082009
acci
dent
rat
e
All AT's LGAT SEAT Trendline All AT's
Airtanker Accident Rates

21
Helicopters (contract)
Helicopters accounted for 46% of the flight hours in FY 2009, which is below the 10-year average of 47.9%. There were 2 helicopter accidents, a Type I helicopter and fatal rappel accident, see pages 35 & 36 for more information. There have been a minimum of 2 heli-copter accidents yearly for the past 10 years and at least one fatal accident for the past 8 years.
Helicopter 10-Year Statistics
Fiscal Year
Hours Flown
Accidents Accident
Rate Fatal
Accidents
Fatal Accident
Rate Fatalities
Fatality Rate
2009 26,439 2 7.56 1 3.78 1 3.78
2008 35,512 2 5.63 1 2.81 9 25.34
2007 41,571 4 9.62 1 2.40 1 2.40
2006 39,735 3 7.55 2 5.03 6 15.01
2005 28,362 2 7.05 1 3.52 3 10.57
2004 29,885 2 6.69 1 3.34 1 3.34
2003 50,662 2 3.95 1 1.97 2 3.95
2002 54,427 8 14.70 1 1.84 1 1.84
2001 39,497 2 5.06 0 0.00 0 0.00
2000 53,145 2 3.76 0 0.00 0 0.00
Total 399,235 29 9 24
Average 39,923 2.9 7.26 0.9 2.25 2.4 6.01

22
Helicopters (contract)
3.76 3.95
6.697.55
9.62
5.63
14.7
5.06
7.567.05
0
2
4
6
8
10
12
14
16
2000
2001
2002
2003
2004
2005
2006
2007
2008
2009
acci
dent
rat
e
Accident Rate Trendline
Helicopter Hours Flown
0
10000
20000
30000
40000
50000
60000
2000
2001
2002
2003
2004
2005
2006
2007
2008
2009
Hours Flown Trendline
Helicopter Accident Rates

23
SAFECOM Summary
The SAFECOM system satisfies Federal Aviation Regulations requirements for incident reporting, but more importantly, it provides management and front line supervisors with near real time trend information. Armed with data on emerging safety and effectiveness challenges, operators and management can take appropriate actions before a mishap oc-curs. There were a total of 830 SAFECOMs (441 Forest Service, 287 DOI, 98 State and 4 Other/Unknown) submitted to the Interagency SAFECOM database. The following charts trend the Forest Service SAFECOM data submitted to the Inter-agency SAFECOM database online at http://www.safecom.gov/. In FY 2009 there were 441 Forest Service SAFECOMs submitted, which is well below the 10-year average of 699. The most reported SAFECOMs in FY 2009 were communications (49), engine (43), elec-trical (42), pilot action (24), instrument (21), dragged load (19), and chip light (19). In an analysis of the past five years, all but pilot action, instrument and dragged loads were in the top reported. We saw a decrease in the number of dropped loads, precautionary landings and policy deviation SAFECOMs in 2009.
Yearly Forest Service SAFECOM Totals
YEAR Number of SAFECOM’s
2009 441
2008 594
2007 620
2006 753
2005 516
2004 494
2003 887
2002 962
2001 773
2000 949
Total 6,989
10 YR Average 699
24
SAFECOM Summary
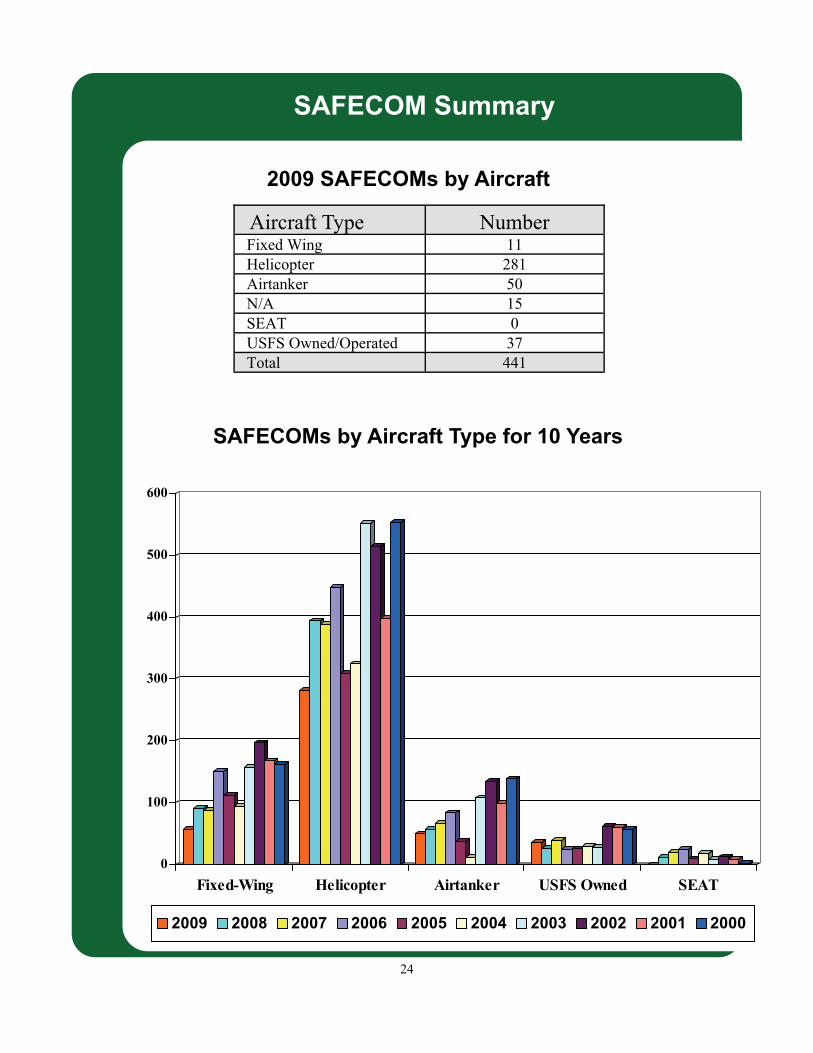
2009 SAFECOMs by Aircraft
Aircraft Type Number Fixed Wing 11 Helicopter 281 Airtanker 50 N/A 15 SEAT 0 USFS Owned/Operated 37 Total 441
SAFECOMs by Aircraft Type for 10 Years
0
100
200
300
400
500
600
Fixed-Wing Helicopter Airtanker USFS Owned SEAT
2009 2008 2007 2006 2005 2004 2003 2002 2001 2000
25
SAFECOM Summary
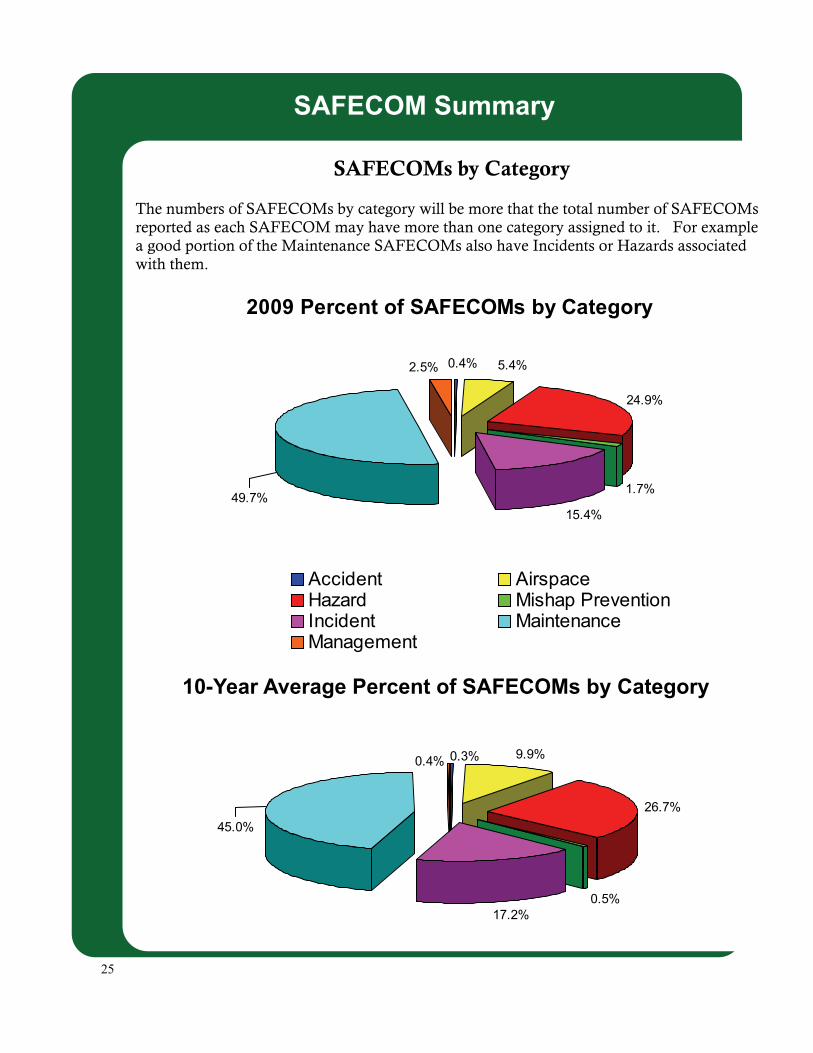
SAFECOMs by Category
The numbers of SAFECOMs by category will be more that the total number of SAFECOMs reported as each SAFECOM may have more than one category assigned to it. For example a good portion of the Maintenance SAFECOMs also have Incidents or Hazards associated with them.
2009 Percent of SAFECOMs by Category
1.7%
15.4%
5.4%
24.9%
49.7%
2.5% 0.4%
Accident AirspaceHazard Mishap PreventionIncident MaintenanceManagement
9.9%
0.5%17.2%
0.3%0.4%
45.0%
26.7%
10-Year Average Percent of SAFECOMs by Category

26
SAFECOM Summary
Airspace SAFECOMs by sub-category
2009 Percent of Airspace SAFECOMs
6.9%
10.3%
13.8%
24.1%
17.2%3.4%
24.1%
Conflict Congestion IntrusionNear Mid-Air Other ProceduresRoute Deviation
10-Year Average Percent of Airspace SAFECOMs
6.0%8.1%
2.7%
54.4%
9.6%1.1% 18.1%
There were a total of 26 Airspace SAFECOMs reported this year, significantly below the 10-year average of 75. The most notable difference is number of intrusions, there were only 7 re-ported this year and the 10-year average is 41.

27
SAFECOM Summary
Hazard SAFECOMs by sub-category
Communication issues are the most reported hazard, accounting for almost half of the Hazard SAFECOMs. Frequency management and verbal communications accounted for several of the communication SAFECOMs. Below are charts indicating the top 5 Hazard SAFECOMs reported and the total number of Hazard SAFECOMs reported for the last 10-years.
49
9
24
1612
0
5
10
15
20
25
30
35
40
45
50
Communications Flight Following Pilot Action Policy Deviation Preflight Action
2009 Top 5 Hazards reported
Total number of Hazards reported by year
120139
193
245
144 137
235
275
248
283
0
50
100
150
200
250
300
2009 2008 2007 2006 2005 2004 2003 2002 2001 2000
28
SAFECOM Summary
Incident SAFECOMs by sub-category
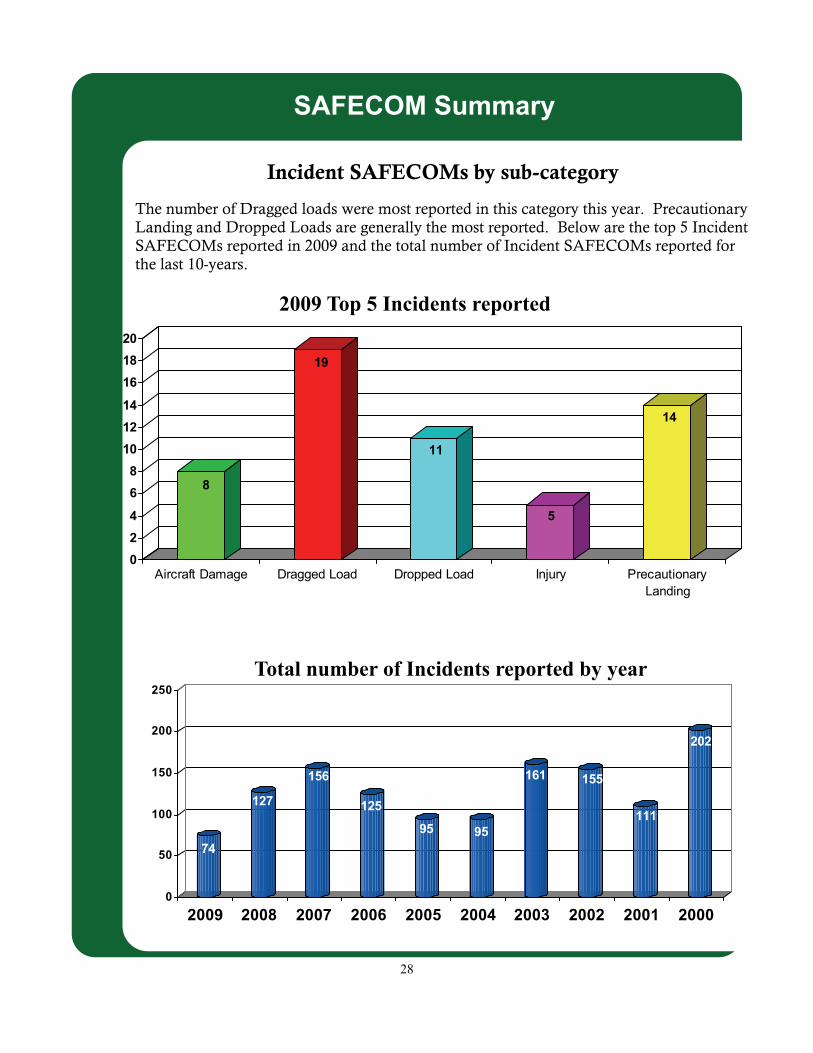
The number of Dragged loads were most reported in this category this year. Precautionary Landing and Dropped Loads are generally the most reported. Below are the top 5 Incident SAFECOMs reported in 2009 and the total number of Incident SAFECOMs reported for the last 10-years.
8
19
11
5
14
0
2
4
6
8
10
12
14
16
18
20
Aircraft Damage Dragged Load Dropped Load Injury PrecautionaryLanding
74
127
156
125
95 95
161 155
111
202
0
50
100
150
200
250
2009 2008 2007 2006 2005 2004 2003 2002 2001 2000
2009 Top 5 Incidents reported
Total number of Incidents reported by year
29
SAFECOM Summary
Maintenance SAFECOMs by sub-category
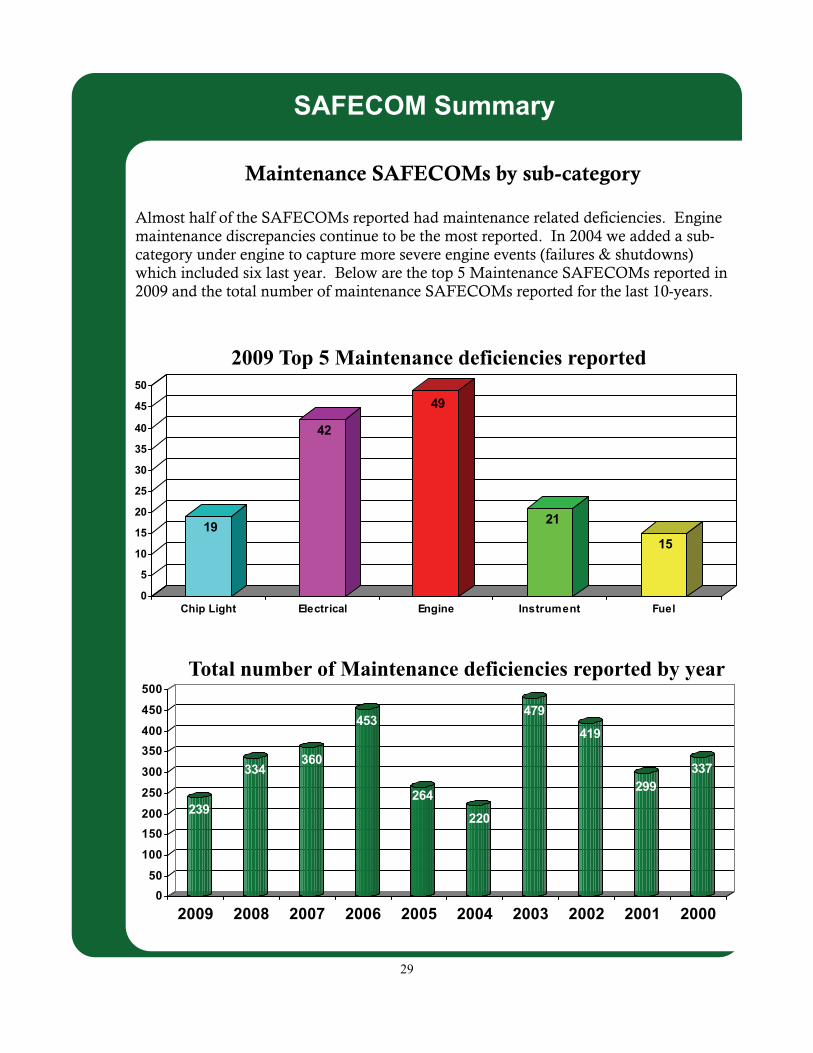
Almost half of the SAFECOMs reported had maintenance related deficiencies. Engine maintenance discrepancies continue to be the most reported. In 2004 we added a sub-category under engine to capture more severe engine events (failures & shutdowns) which included six last year. Below are the top 5 Maintenance SAFECOMs reported in 2009 and the total number of maintenance SAFECOMs reported for the last 10-years.
19
42
49
21
15
0
5
10
15
20
25
30
35
40
45
50
Chip Light Electrical Engine Instrument Fuel
239
334360
453
264
220
479
419
299337
0
50
100
150
200
250
300
350
400
450
500
2009 2008 2007 2006 2005 2004 2003 2002 2001 2000
2009 Top 5 Maintenance deficiencies reported
Total number of Maintenance deficiencies reported by year
30
SAFECOM Summary
0
2
4
6
8
10
12
14
2009 2008 2007 2006 2005 2004
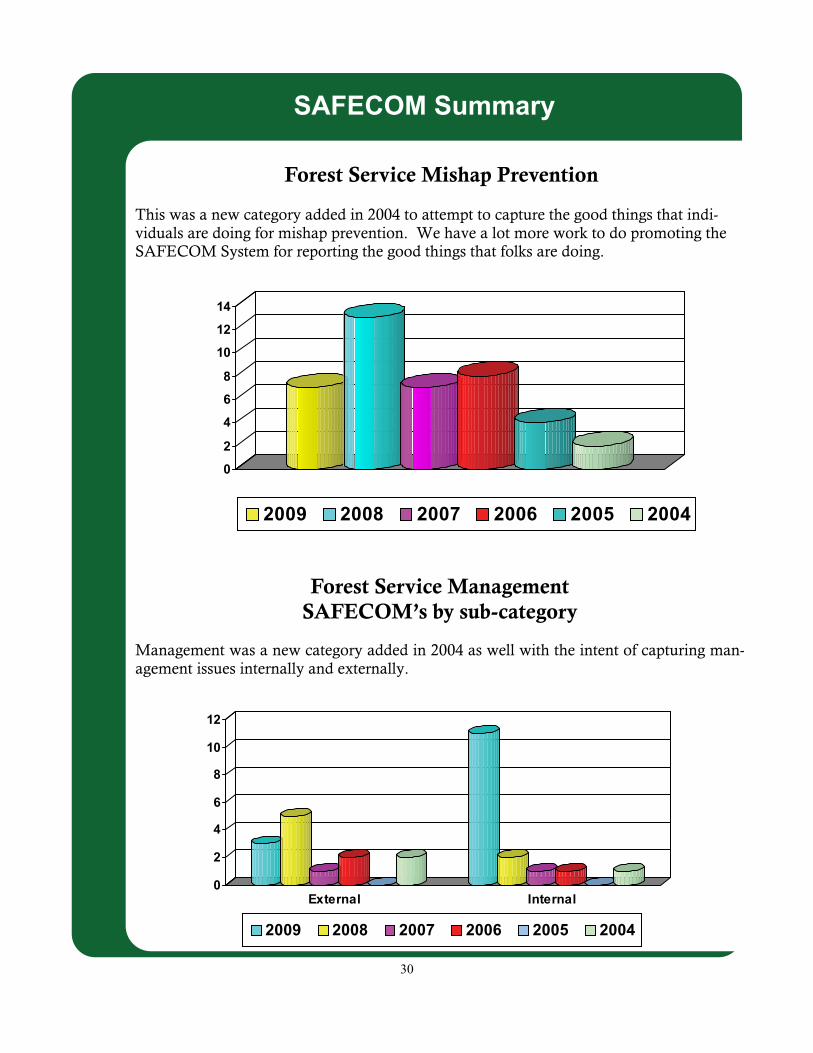
Forest Service Management SAFECOM’s by sub-category
Management was a new category added in 2004 as well with the intent of capturing man-agement issues internally and externally.
0
2
4
6
8
10
12
External Internal
2009 2008 2007 2006 2005 2004
Forest Service Mishap Prevention This was a new category added in 2004 to attempt to capture the good things that indi-viduals are doing for mishap prevention. We have a lot more work to do promoting the SAFECOM System for reporting the good things that folks are doing.

31
SAFECOM Summary
FY 2009 SAFECOMs by Region
Percent of SAFECOMs by Region
R-315%
R-410%
R-530%
R-87%
R-103%
R-91%
R-625%
WO1% R-2
4%
R-14%
FY 2009 SAFECOMs by Aircraft Type and Region
Region Fixed-Wing
Helicopter Airtanker SEAT USFS Owned
N/A Total
Region 1 6 4 2 0 3 1 16 Region 2 1 11 2 0 3 1 18 Region 3 9 29 16 0 12 0 66 Region 4 3 32 2 0 5 2 44 Region 5 15 93 19 0 3 5 132 Region 6 17 75 7 0 8 2 109 Region 8 3 26 1 0 1 1 32 Region 9 1 2 0 0 0 0 3 Region 10 7 8 0 0 0 0 15
NEA 0 0 0 0 0 0 0 WO 1 1 1 0 0 3 6 Total 63 281 50 0 35 15 441

32
SAFECOM Summary
The numbers of SAFECOM’s by category are more than the total number of SAFECOMs reported as each SAFECOM can have more than one category assigned to it.
SAFECOMs by Region
FY 2009 SAFECOMs by Category and Region
Region Accident Airspace Hazard Incident Maint
. Mgt.
Mishap
Prevention Total
R-1 0 0 6 3 9 0 0 18
R-2 0 0 7 1 11 0 2 21
R-3 0 5 12 5 46 1 0 69
R-4 0 3 13 17 10 0 0 43
R-5 2 11 47 19 63 3 2 147
R-6 0 6 15 23 74 5 1 124
R-8 0 1 13 5 12 1 1 33
R-9 0 0 1 0 2 0 1 4
R-10 0 0 4 1 10 1 0 16
NEA 0 0 0 0 0 0 0 0
WO 0 0 2 0 2 1 1 6
Total 2 26 120 74 239 12 8 481
33
Mishap Summary
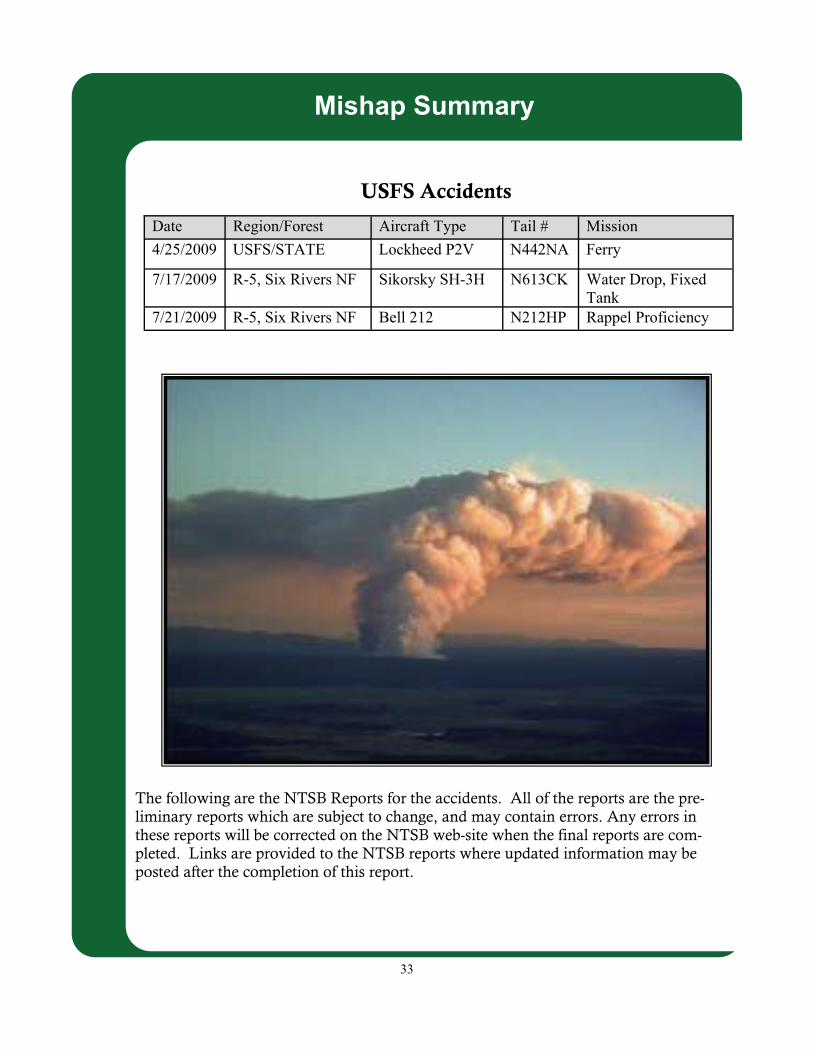
Date Region/Forest Aircraft Type Tail # Mission
4/25/2009 USFS/STATE Lockheed P2V N442NA Ferry
7/17/2009 R-5, Six Rivers NF Sikorsky SH-3H N613CK Water Drop, Fixed Tank
7/21/2009 R-5, Six Rivers NF Bell 212 N212HP Rappel Proficiency
USFS Accidents
The following are the NTSB Reports for the accidents. All of the reports are the pre-liminary reports which are subject to change, and may contain errors. Any errors in these reports will be corrected on the NTSB web-site when the final reports are com-pleted. Links are provided to the NTSB reports where updated information may be posted after the completion of this report.
34
Mishap Summary - Accidents
NTSB Identification: WPR09GA216 14 CFR Public Use
Accident occurred Saturday, April 25, 2009 in Stockton, UT Aircraft: LOCKHEED P2V-7, registration: N442NA
Injuries: 3 Fatal. This is preliminary information, subject to change, and may contain errors. Any errors in
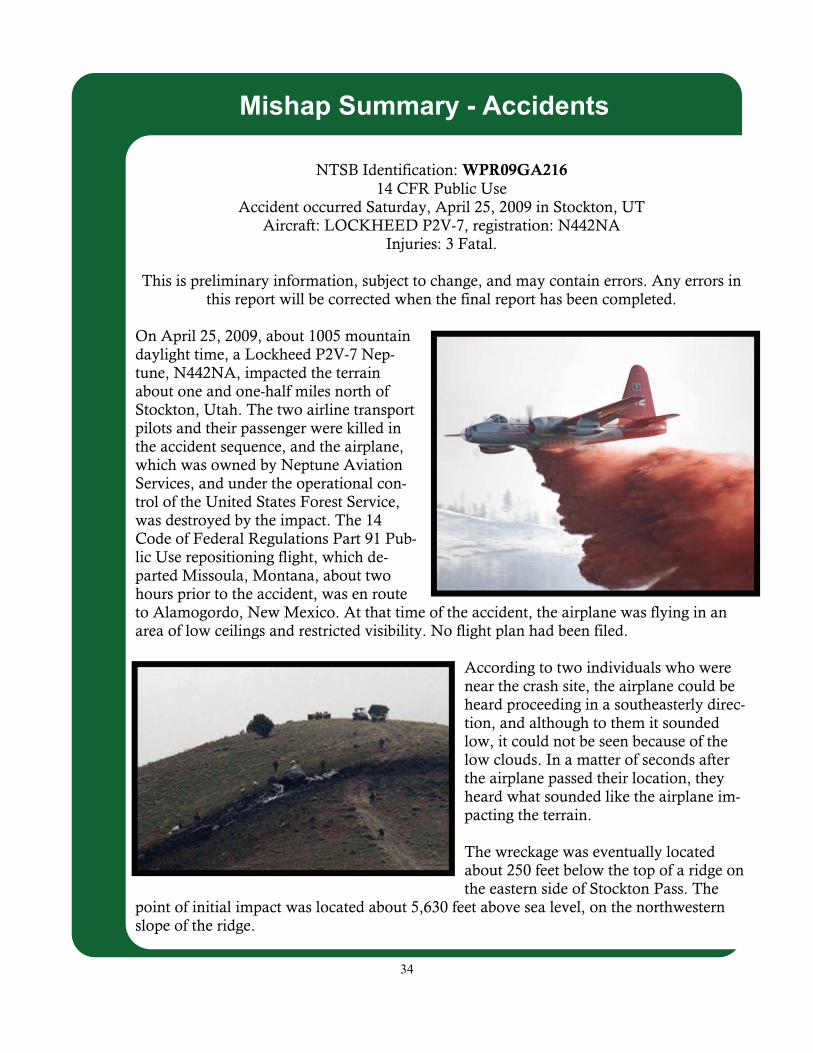
this report will be corrected when the final report has been completed. On April 25, 2009, about 1005 mountain daylight time, a Lockheed P2V-7 Nep-tune, N442NA, impacted the terrain about one and one-half miles north of Stockton, Utah. The two airline transport pilots and their passenger were killed in the accident sequence, and the airplane, which was owned by Neptune Aviation Services, and under the operational con-trol of the United States Forest Service, was destroyed by the impact. The 14 Code of Federal Regulations Part 91 Pub-lic Use repositioning flight, which de-parted Missoula, Montana, about two hours prior to the accident, was en route to Alamogordo, New Mexico. At that time of the accident, the airplane was flying in an area of low ceilings and restricted visibility. No flight plan had been filed.
According to two individuals who were near the crash site, the airplane could be heard proceeding in a southeasterly direc-tion, and although to them it sounded low, it could not be seen because of the low clouds. In a matter of seconds after the airplane passed their location, they heard what sounded like the airplane im-pacting the terrain. The wreckage was eventually located about 250 feet below the top of a ridge on the eastern side of Stockton Pass. The
point of initial impact was located about 5,630 feet above sea level, on the northwestern slope of the ridge.
35
Mishap Summary - Accidents
NTSB Identification: WPR09TA353 14 CFR Public Use
Accident occurred Friday, July 17, 2009 in Willow Creek, CA Aircraft: Croman SH-3H, registration: N613CK
Injuries: 1 Serious, 1 Minor. This is preliminary information, subject to change, and may contain errors. Any errors in
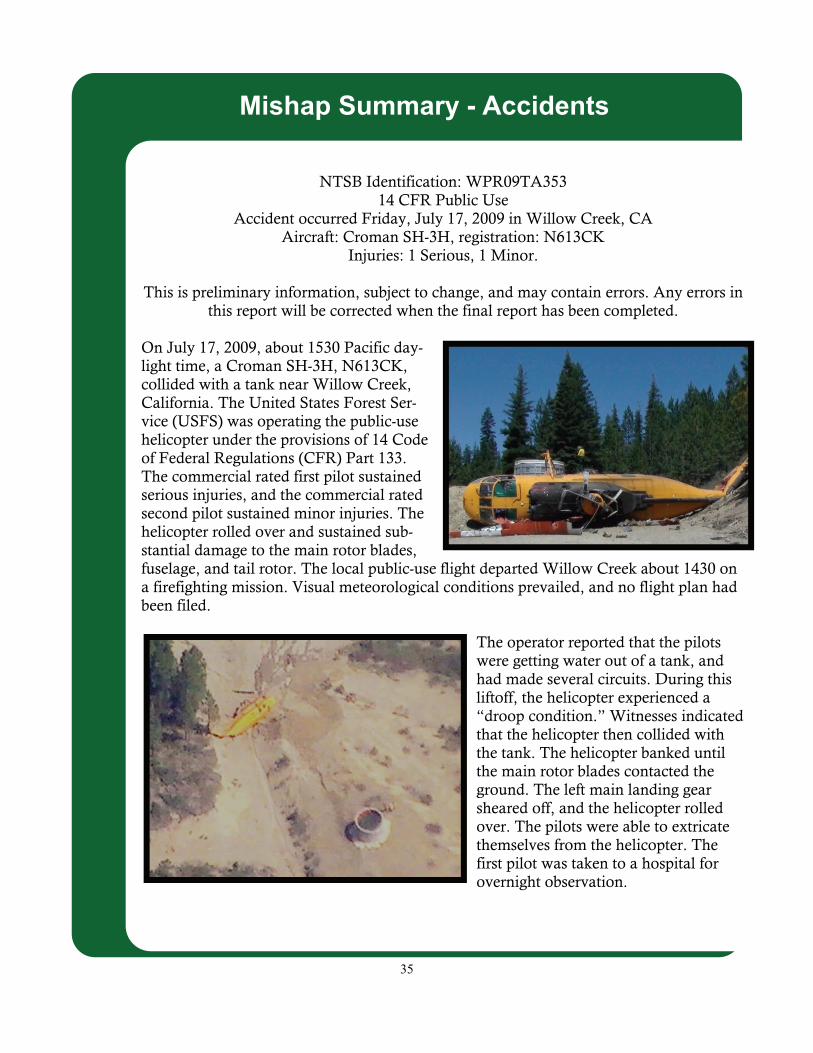
this report will be corrected when the final report has been completed. On July 17, 2009, about 1530 Pacific day-light time, a Croman SH-3H, N613CK, collided with a tank near Willow Creek, California. The United States Forest Ser-vice (USFS) was operating the public-use helicopter under the provisions of 14 Code of Federal Regulations (CFR) Part 133. The commercial rated first pilot sustained serious injuries, and the commercial rated second pilot sustained minor injuries. The helicopter rolled over and sustained sub-stantial damage to the main rotor blades, fuselage, and tail rotor. The local public-use flight departed Willow Creek about 1430 on a firefighting mission. Visual meteorological conditions prevailed, and no flight plan had been filed.
The operator reported that the pilots were getting water out of a tank, and had made several circuits. During this liftoff, the helicopter experienced a “droop condition.” Witnesses indicated that the helicopter then collided with the tank. The helicopter banked until the main rotor blades contacted the ground. The left main landing gear sheared off, and the helicopter rolled over. The pilots were able to extricate themselves from the helicopter. The first pilot was taken to a hospital for overnight observation.

36
Mishap Summary - Accidents
NTSB Identification: WPR09TA356 14 CFR Public Use
Accident occurred Tuesday, July 21, 2009 in Willow Creek, CA Aircraft: BELL 212, registration: N212HP
Injuries: 1 Fatal, 5 Uninjured.
This is preliminary information, subject to change, and may contain errors. Any errors in this report will be corrected when the final report has been completed.
On July 21, 2009, at 1010 Pacific daylight time, a helitack firefighter was killed during an un-arrested descent from a Bell 212 helicopter, N212HP, near Willow Creek, California. The airline transport pilot, spotter and 3 remaining rappellers were not injured. The helicopter was being operated under contract to the United States Forest Service by Heli-1 Corporation, Reno, Nevada, as a visual flight rules (VFR) public use flight under Title 14, Code of Federal Regulations (CFR) Part 91, when the accident occurred. Visual meteorological conditions prevailed for the local flight. The flight originated from a helibase at Willow Creek at 1004; no flight plan was filed for the training flight. A representative from the US forest Service reported that the rappeller was positioned on the skid when the accident occurred. The helicopter was in a stabilized hover at 200-feet above ground level (AGL). The helicopter was not damaged and no mechanical malfunction or failure was reported.
Not actual accident aircraft
37
Mishap Summary - Incidents With Potential
USFS Incidents with Potential
KAMAX Rotor Damage, Umpqua NF, July 31, 2009
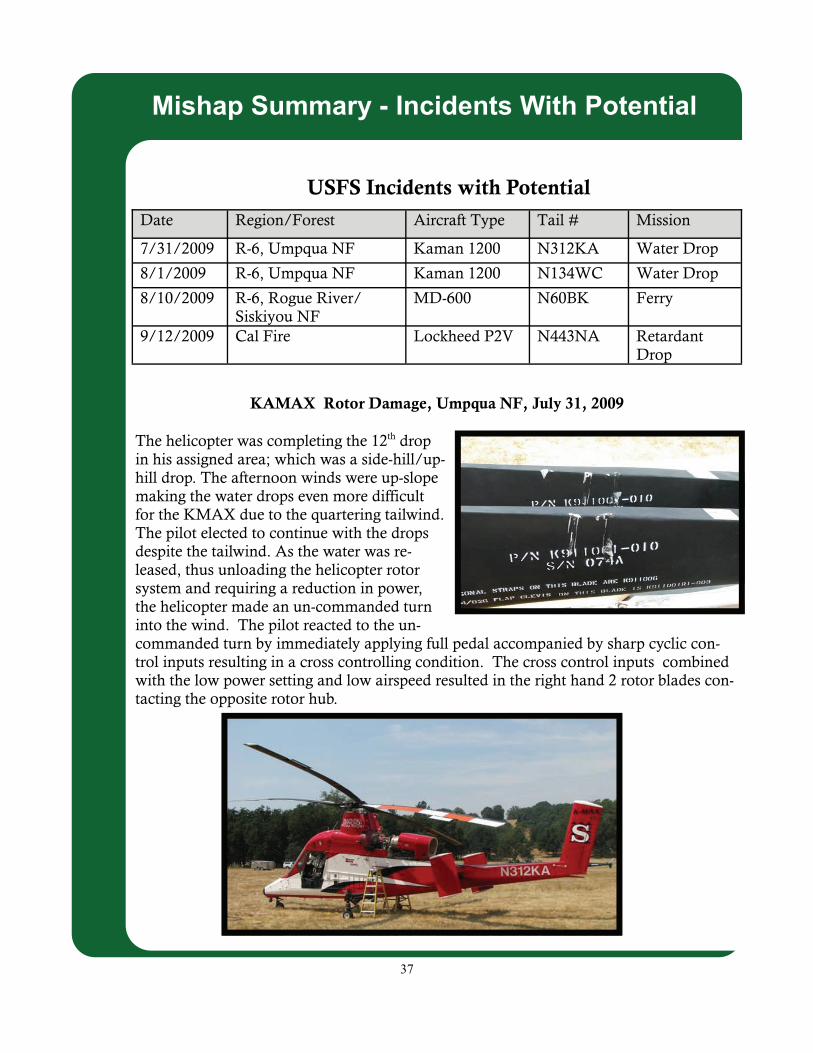
The helicopter was completing the 12th drop in his assigned area; which was a side-hill/up-hill drop. The afternoon winds were up-slope making the water drops even more difficult for the KMAX due to the quartering tailwind. The pilot elected to continue with the drops despite the tailwind. As the water was re-leased, thus unloading the helicopter rotor system and requiring a reduction in power, the helicopter made an un-commanded turn into the wind. The pilot reacted to the un-commanded turn by immediately applying full pedal accompanied by sharp cyclic con-trol inputs resulting in a cross controlling condition. The cross control inputs combined with the low power setting and low airspeed resulted in the right hand 2 rotor blades con-tacting the opposite rotor hub.
Date Region/Forest Aircraft Type Tail # Mission
7/31/2009 R-6, Umpqua NF Kaman 1200 N312KA Water Drop
8/1/2009 R-6, Umpqua NF Kaman 1200 N134WC Water Drop
8/10/2009 R-6, Rogue River/Siskiyou NF
MD-600 N60BK Ferry
9/12/2009 Cal Fire Lockheed P2V N443NA Retardant Drop

38
KMAX Rotor Blade Strike, Umpqua NF, August 1, 2009
The KMAX arrived at the Williams Creek Helibase to begin work on the Williams Creek Fire. The Air Attack (ATGS) as-signed to the fire would request helicopter support when visibility allowed for bucket work. Due to the winds, smoke and fire behavior helicopter activity was limited to the late afternoon hours. At 1610, the KMAX was dispatched to perform water bucket support. The dip site had been established on the Umpqua River next to Highway 138. Dip site monitors were in place however they did not have positive contact with the helicopters. This dip site was being used by the KMAX and 2 Boeing BV-107’s, all bucket aircraft utilizing varying lengths of longlines. The incident dip site had been in use for 3 days prior to the incident.
The KMAX was using a 150 foot long line and had been into the dip site at least 12 times totaling approximately 1 hour of flight time. On this dip the pilot noticed that the bucket did not fill completely due to the depth of the river at his selected dip point. The pilot repositioned the helicopter rear-ward to a deeper location in the river in an effort to fill the bucket completely. In doing so the pilot failed to notice a tree to the right rear of the helicopter; the rotor blades con-tacted tree limbs. Upon noticing debris in the air and settling on the water at the dip point the pilot realized his blades had con-
tacted a tree. He then emptied the bucket, told Air Attack of the incident and preceded to the nearest possible landing area to inspect the rotor blades for damage. The KMAX performance charts used in the interagency load calculation process are part of a FAA approved revision specific to interagency requirements to reflect a minimum specification engine. This revision was interpreted incorrectly by the pilot resulting in an erroneous load calculation. The pilot used pressure altitude instead of density altitude on figure S1-8 (Power Required OGE Hover 104% Nr) resulting in an incorrect entry in line 7b of the load calculation (approximately 400 lbs more than allowed). The load calcula-tion was not a factor in this incident.
Mishap Summary - Incidents With Potential

39
MD-600 Windshield Damage, Rogue River/Siskiyou NF, August 10, 2009 The Helicopter was on a Call When Need (CWN) contract administered from the Pacific Northwest Regional Office in Redmond, Oregon. This helicopter is fairly new with only 1727 hours of flight time logged at the time of the incident. While arriving at the helibase the right front wind-shield shattered into pieces and those pieces blew inside the aircraft with great force. At the time the helicopter was in a slight flair preparing to land at the airport and was traveling at an approximate airspeed of 100 knots. The pilot heard a loud bang as the right side windscreen imploded. The pilot’s first reaction was to check his aircraft instruments and see if the helicopter was operating properly. Upon seeing the proper instrument indications, the pilot’s next reaction was to secure the right front seat cushion, which had come loose due to rotor wash in the cockpit. As the pilot secured the seat cushion he landed the helicopter on the end of the runway to ensure there were no other problems; satisfied the pilot air tax-ied the helicopter along the airstrip to his parking area at the helibase. After the helicopter was shut down and notifications were made the aircraft was searched for damage from top to bottom, inside and out. The shattered plexiglass scared and cut much of the right side interior, even scars in the backseat area. The pilot was flying from the left side with the left side door off and stopped many of the larger pieces of plexiglass from exiting the aircraft through his door. No other damage was found on the outside of the helicopter or the rotor blades. The aircraft was being operated within the Aircraft Flight Manual parameters and this was not the reason the plexiglass windshield failed. The pieces of the windshield were assembled in their approximate locations and examined for impact damage or any revealing evidence that would explain the windshield failure. It was discovered that the bottom edge of the windshield had no glue residue on it as would have been the case if it had been properly glued into position at the time the aircraft was manufactured. Once the windshield was examined the aircraft windshield frame was ex-amined confirming the absence of glue. Additionally, stress cracks were discovered along the bottom of the aircraft windshield frame indicating movement where there should have been none. The Fact Finding Team concluded that the plexiglass was not properly secured in position when the helicopter was manufactured; this allowed slight movement of the bottom of the plexiglass, which over time stressed the plexiglass to the point of failure. The MD repair manual confirmed that the windshield should have been glued all the way around when installed. We were very lucky that no one was sitting in the right front seat of this aircraft!
Mishap Summary - Incidents With Potential

40
P2V, T-43 Fresno Tanker Base, Cal Fire Retardant Drop, September 12, 2009 After the takeoff roll was completed and aircraft became airborne the crew noticed that it took a slightly different amount of normal trim to maintain straight and level otherwise all indications were normal Two of the company mechanics were returning to the base and going through the gate to the tanker base. The mechanic driving was working the buttons on the touch pad and did not notice T-43 taking off. The mechanic riding was watching T-43 take off and he wit-nessed a flash about 8 feet in diameter just before aircraft rotation. He described it as a “split second flash, it was gone just as quick as it came”. The tower did not report seeing anything nor did anyone else on the ramp. This led the mechanic to wonder what he had seen and thought it must have been nothing. This particular mechanic had also been sick recently and was not feeling very well. He had asked multiple people if they had seen what he had, no one did so that is as far as he took it. When the aircraft returned from the fire the cowling was displaced and looked as if it had come unlatched in flight. The crew chief notified Maintenance Control and a company investigation team was as-sembled and dispatched to the aircraft. The team consisted of Neptune Aviations Director of Flight, Director of Maintenance, Ground Safety, and Jet shop manager. The RASM was initially notified of the event, but not to the severity of the explosion and cowling damage. The RASM and WO were not notified for several days of the severity after the event. The company had already changed out the engine and had it shipped back to their base before the agency could investigate. A SAFECOM was never submitted
Mishap Summary - Incidents With Potential
41
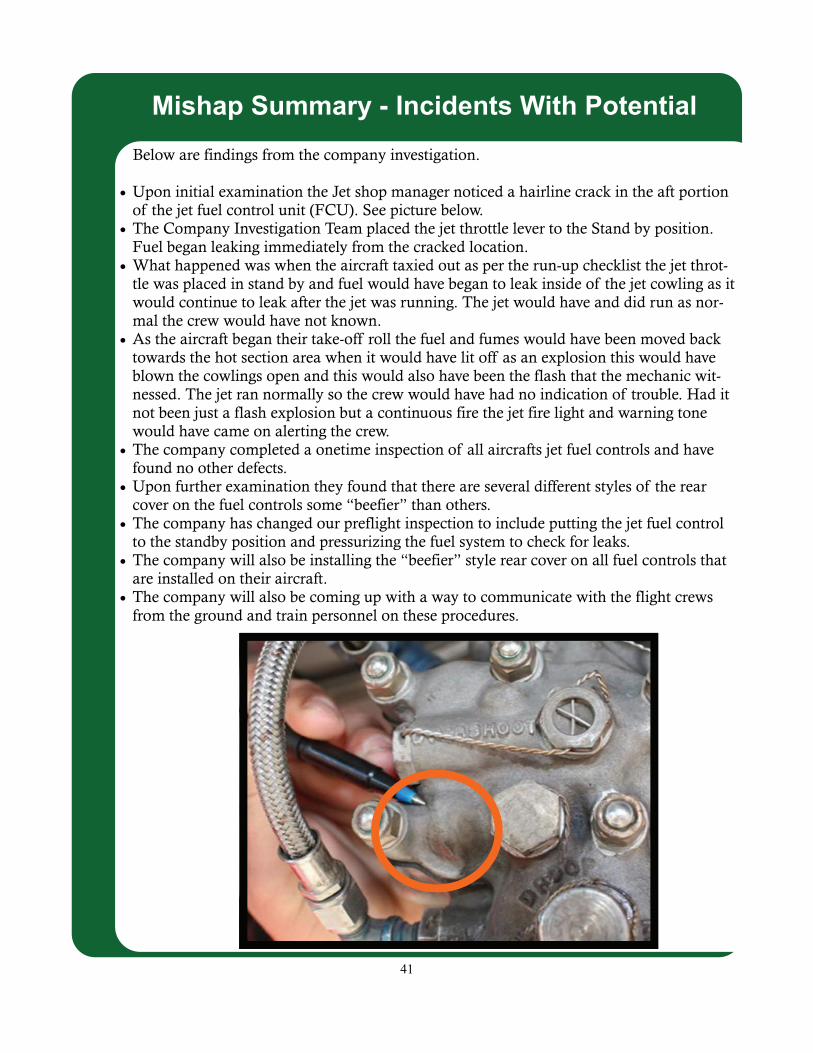
Below are findings from the company investigation. Upon initial examination the Jet shop manager noticed a hairline crack in the aft portion
of the jet fuel control unit (FCU). See picture below. The Company Investigation Team placed the jet throttle lever to the Stand by position.
Fuel began leaking immediately from the cracked location. What happened was when the aircraft taxied out as per the run-up checklist the jet throt-
tle was placed in stand by and fuel would have began to leak inside of the jet cowling as it would continue to leak after the jet was running. The jet would have and did run as nor-mal the crew would have not known.
As the aircraft began their take-off roll the fuel and fumes would have been moved back towards the hot section area when it would have lit off as an explosion this would have blown the cowlings open and this would also have been the flash that the mechanic wit-nessed. The jet ran normally so the crew would have had no indication of trouble. Had it not been just a flash explosion but a continuous fire the jet fire light and warning tone would have came on alerting the crew.
The company completed a onetime inspection of all aircrafts jet fuel controls and have found no other defects.
Upon further examination they found that there are several different styles of the rear cover on the fuel controls some “beefier” than others.
The company has changed our preflight inspection to include putting the jet fuel control to the standby position and pressurizing the fuel system to check for leaks.
The company will also be installing the “beefier” style rear cover on all fuel controls that are installed on their aircraft.
The company will also be coming up with a way to communicate with the flight crews from the ground and train personnel on these procedures.
Mishap Summary - Incidents With Potential
Related Documents