FY 2009-2020 Strategic Business Plan Orange County Great Park Corporation

Welcome message from author
This document is posted to help you gain knowledge. Please leave a comment to let me know what you think about it! Share it to your friends and learn new things together.
Transcript

ocgp.orgocgp.orgocgp.orgFY 2009-2020 Strategic Business PlanOrange County Great Park Corporation

200920092009Board of DirectorsOrange County Great Park Corporation
Larry Agran, Chair Michael Pinto, Vice-Chair Steven Choi
Sukhee Kang William G. Kogerman Beth Krom
Miguel Pulido James “Walkie” Ray Christina Shea

Table of ContentsOrange County Great Park Corporation
EXECUTIVE SUMMARY......................................................................................................................... 4OVERVIEW...................................................................................................................................... 4SUMMARY OF SOURCES AND USES OF FUNDS ............................................................................... 5
HISTORY ............................................................................................................................................ 7EL TORO MARINE BASE HISTORY & HERITAGE................................................................................... 7FROM AIRPORT TO A GREAT PARK.................................................................................................... 8SALE AND TRANSFER OF MCAS EL TORO......................................................................................... 9DEPARTMENT OF THE NAVY ENVIRONMENTAL CLEANUP................................................................ 10DESIGNING THE GREAT PARK ........................................................................................................ 11
CORPORATE STRUCTURE & GOVERNANCE........................................................................................ 12MEASURE R................................................................................................................................... 13MISSION STATEMENT.................................................................................................................... 14GUIDING PRINCIPLES .................................................................................................................... 14
AMENDED DEVELOPMENT AGREEMENT ............................................................................................ 18DENSITY BONUS........................................................................................................................... 19
FINANCIAL ASSUMPTIONS ............................................................................................................... 20REVENUE SOURCES.......................................................................................................................... 23
INTEREST INCOME........................................................................................................................ 24PROPERTY LEASE REVENUES........................................................................................................... 24GOLF COURSE FEES ...................................................................................................................... 25PREVIEW PARK / OTHER ................................................................................................................ 25EVENT PARKING............................................................................................................................ 25SPONSORSHIPS ............................................................................................................................ 26SPORTS PARK REVENUE ................................................................................................................. 26GRANTS ....................................................................................................................................... 26DEVELOPMENT AGREEMENT FEES AND CFD .................................................................................. 28AMENDED AND RESTATED DEVELOPMENT AGREEMENT ................................................................. 29TAX INCREMENT FUNDS................................................................................................................ 29PURCHASE, SALE & FINANCING AGREEMENT................................................................................ 30
REDEVELOPMENT AGENCY REVENUE CONSIDERATIONS ................................................................... 32TAX INCREMENT BONDING CAPACITY AND TIMING ......................................................................... 35
BOND ISSUANCE & TIMING.......................................................................................................... 35BOND ISSUE CALCULATION CONSIDERATIONS.............................................................................. 36
CAPITAL EXPENDITURES..................................................................................................................... 38WESTERN SECTOR PARK DEVELOPMENT PLAN................................................................................ 39PARK DEVELOPMENT CONSULTING................................................................................................ 42PROJECT STAFF SALARIES............................................................................................................... 42
OPERATIONS & MAINTENANCE AND G&A EXPENSES ....................................................................... 43GENERAL & ADMINISTRATIVE......................................................................................................... 45OPERATIONS & MAINTENANCE .................................................................................................... 47
BUSINESS PLAN SUMMARY............................................................................................................... 51CASH FLOW ANALYSIS STRESS TEST .............................................................................................. 51CONCLUSION .............................................................................................................................. 53
APPENDICES .................................................................................................................................... 54APPENDIX A: PRICE POINT AND MARKET ABSORPTION STUDY UPDATES.......................................... 54APPENDIX B: HERITAGE FIELDS TAX INCREMENT REVENUE PROJECTIONS......................................... 90APPENDIX C: FISCAL IMPACT OF CIRQUE DU SOLEIL........................................................................ 92 APPENDIX D: CONTRACT SERVICES & CIP EXPENDITURES SUMMARY ............................................. 102
- 3 -

Executive SummaryOrange County Great Park Corporation
“The purpose of the Orange County Great Park Corporation is to develop and operate, preserve and protect the Orange County Great Park for the benefit and enjoyment of all its visitors, those of today and those of the future.”
OverviewThe purpose of the Strategic Business Plan for the Orange County Great Park is to assist the Board of Directors in analyzing the impacts of the policies and priorities adopted for the development of the Orange County Great Park. As a blueprint for the future, the plan outlines the Great Park’s goals for development of the park over the next ten years and assesses its financial capacity to achieve these goals.
Assumptions upon which the plan is based include existing contracts, prior Board direction, and available funding. Consistent with the City of Irvine business planning process, no funds have been included unless they were both measurable and reasonably believed to be available.
The original business plan for the Great Park was adopted by the Board in December 2004, an interim plan was presented to the Board in March 2007, and a 10-year cash flow analysis was presented to the Board in April and updated in October 2009.
Although not specifically addressed in this business plan, the Great Park project also presents a regional economic benefit. With the recent approval of the Western Sector Park Development Plan, the conclusion of the successful summer program events, and the approval of the lease agreement with Cirque du Soleil, the Great Park is beginning to demonstrate its potential as a regional economic engine. The Economic and Fiscal Impact of Cirque du Soleil presented by Economics Research Associates discusses some of these economic impacts. (Appendix C). Cirque du Soleil will generate approximately $2.4 million in Orange County each season and over the course of eight seasons, total countywide expenditures will be $19.2 million. The presence of Cirque at the Great Park is expected to generate 270 jobs per season in Orange County and revenues for the City’s general fund of $88,000 per season for a total of $700,000 over all eight seasons.
- 4 -

Executive SummaryOrange County Great Park Corporation
Summary of Sources and Uses of FundsThe following is a summary of the sources and uses of funds for Fiscal Years 2009-2019. Existing funds and revenues consist primarily of Development Fees paid by Heritage Fields, interest earnings, and revenues from lease agreements. Future revenues include payments from Heritage Fields from the Amended and Restated Development Agreement, as well as re-payment of the Purchase, Sale, and Financing agreement loan between the City and the Irvine Redevelopment Agency.
Expenditures consist primarily of capital costs related to development of the Western Sector Park Development Plan – Phase I approved by the Board of Directors in October 2009 and by the Irvine City Council in November 2009, as well as administrative costs and on-going maintenance and operations to support the developed park.
The following graph depicts the Great Park’s estimated beginning cash position for each fiscal year beginning in Fiscal Year 2009-2010.
The graph above notes revenue sources in the years and amounts estimated to be received with further detail provided throughout this document. Expenditures are benchmarked off the Fiscal Year 2009-2010 budget and increase in general at 3% per year. In Fiscal Year
- 5 -

Executive SummaryOrange County Great Park Corporation
2011-2012, general and administrative costs are assumed to decrease by 25% due primarily to a reduction in staff. Operations costs and staffing are increased as components of the Western Sector Park Development Plan are completed and are also escalated at 3% per year. The blue diamond on the graph shows an anticipated bond issuance of $30 million by the Irvine Redevelopment Agency (RDA) in Fiscal Year 2015-2016. Because RDA bond proceeds are entirely under the control of the RDA, they are not included in the cash flow. It is anticipated, however, that such funds will be used for improvements within the Great Park.
The graph illustrates that the Western Sector Park Development Plan at $65.5 million can be built and that the developed Great Park can be maintained within current funding constraints.
- 6 -

HistoryOrange County Great Park Corporation
El Toro Marine Base History and HeritageThe property upon which the Orange County Great Park resides has a long and varied history. In the early 1800s, under Spanish ownership, it was used as grazing land for cattle and horses. In 1860, the land was purchased by James Irvine Sr. as part of a 107,000 acre acquisition. Irvine began experimenting with farming and the land was ultimately used for many years to produce black and lima beans.
Following the bombing of Pearl Harbor in 1942, the Navy began the process of finding land suitable for constructing five Marine Corps air bases in Southern California. Among the sites selected were the El Toro bean fields. In an attempt to protect his highly successful crops, Irvine offered other sites on his ranch, including the land now occupied by the Orange County Airport, for $1 per acre.
Ultimately, the Navy selected Irvine’s El Toro farm as the preferred location because it sat in a valley at the base of the Saddleback Mountains, it was fog-free most of the year, and it was adjacent to a main rail line. It was also near the Long Beach seaport which was used to ferry troops to assignments overseas. Irvine was paid a total of $100,000 for 4,000 acres of land and on August 3, 1942, construction began on MCAS El Toro.
By January of 1943, construction crews had completed five asphalt runways, 27 miles of paved highways, hangars, barracks and bachelor officer quarters. On March 17, 1943, MCAS El Toro was officially commissioned. In 1950, the base was selected as a permanent Master Jet Station and center of support for the operation and combat readiness of Fleet Marine Forces in the Pacific. During the 1960s, El Toro played an important role in military operations related to the Vietnam War. Over a period of ten years, thousands of military personnel supporting the First Marine Aircraft Wing departed for Vietnam from El Toro. In addition, at the end of the war in May 1975, El Toro served as the arrival site for over 50,000 Vietnamese refugees as part of what was known as Operation New Freedom. In peacetime, the base served as a training facility.
- 7 -
James Irvine, Sr.

HistoryOrange County Great Park Corporation
In 1991, the Third Marine Aircraft Wing out of El Toro was deployed to support Operation Desert Storm. It became the third largest airwing in Marine Corp history and was the first aviation unit ready for gulf war combat operations in Southwest Asia. Upon conclusion of the war, El Toro marines were then deployed to the Philippines, Bangladesh, and Somalia for humanitarian rescue efforts.
During the 1990’s, the Federal Base Realignment and Closure Commission identified military bases throughout the nation that were slated for closure for a variety of reasons, and included by Congressional action was MCAS El Toro.
The El Toro base was officially closed on July 2, 1999. The County of Orange was designated the Local Redevelopment Authority (LRA) for development of a Community Reuse Plan to guide future development of the former base.
From Airport to a Great ParkThe County, acting in its capacity as the LRA, determined that the best use for the former El Toro Marine base was an international airport. In 1994, Orange County voters narrowly approved Measure A that zoned the property for use as an international airport.
With the passage of Measure A, a multi-year legal and political battle ensued to determine the ultimate use of the decommissioned base property. This battle ended on March 5, 2002 when 58% of Orange County voters approved Measure W, the Orange County Central Park and Nature Preserve Initiative.
Measure W effectively overturned Measure A and amended the County General Plan to create a major central park at the former MCAS El Toro site. The day after Measure W was approved by voters, the Department of the Navy surprised the County by announcing that the disposal of the former base would be accomplished by means of a public sale.
Among the first steps in the sale process, the Navy issued its Record of Decision (ROD) on April 23, 2002 as required under the National Environmental Policy Act. The ROD
- 8 -
MCAS El Toro Closing Ceremony, July 2, 1999
HistoryOrange County Great Park Corporation
announced the Navy’s formal decision to dispose of the site, consistent with the Defense Base Closure and Realignment Act of 1990 (BRAC).
The City of Irvine responded immediately to the Navy’s decision by beginning to create the Great Park Plan for El Toro. In April 2002, representatives from the Navy and City staff met to ensure mutual interests would be met in the land use plan being developed for the property. On May 27, 2003, the Irvine City Council certified a Final Environmental Impact Report and adopted a General Plan Amendment and Zone Change to create the land use policy and legislative structure to guide the development of the Orange County Great Park.
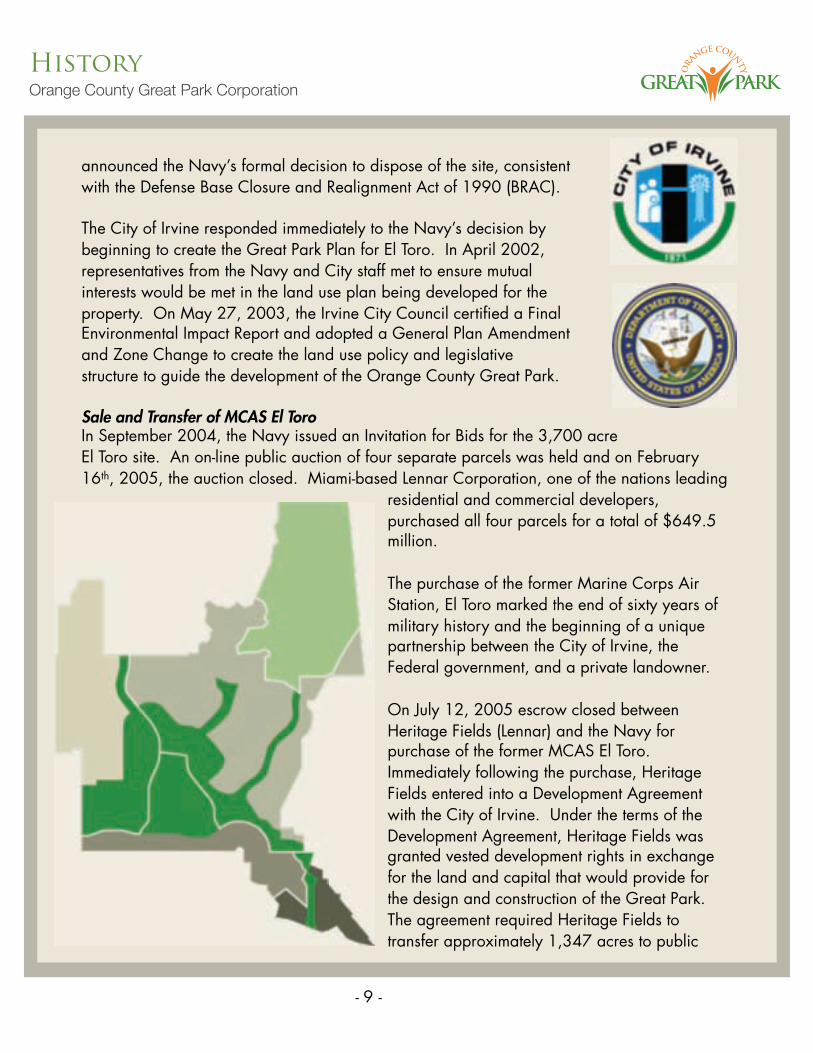
Sale and Transfer of MCAS El ToroIn September 2004, the Navy issued an Invitation for Bids for the 3,700 acre El Toro site. An on-line public auction of four separate parcels was held and on February 16th, 2005, the auction closed. Miami-based Lennar Corporation, one of the nations leading
residential and commercial developers, purchased all four parcels for a total of $649.5 million.
The purchase of the former Marine Corps Air Station, El Toro marked the end of sixty years of military history and the beginning of a unique partnership between the City of Irvine, the Federal government, and a private landowner.
On July 12, 2005 escrow closed between Heritage Fields (Lennar) and the Navy for purchase of the former MCAS El Toro. Immediately following the purchase, Heritage Fields entered into a Development Agreement with the City of Irvine. Under the terms of the Development Agreement, Heritage Fields was granted vested development rights in exchange for the land and capital that would provide for the design and construction of the Great Park. The agreement required Heritage Fields to transfer approximately 1,347 acres to public
- 9 -

HistoryOrange County Great Park Corporation
ownership and contribute $200 million dollars towards the development of the Great Park. An additional $201 million dollars was agreed to be provided through a Community Facilities District (CFD) bond sale secured by the property. CFD bonds will provide funding for public infrastructure and facilities such as roads and utility connections. Remaining capacity in the CFD, if any, was available to assist in the development of the Great Park. The terms of the 2005 Development Agreement were changed in 2009 when the City Council approved an Amended and Restated Development Agreement (ARDA) with Heritage Fields. The 2009 ARDA is discussed later in this plan.
Department of the Navy/Environmental CleanupAt the time of sale, certain portions of the property were deemed not immediately suitable for transfer in fee to Heritage Fields or the City of Irvine because they were potentially contaminated from on-station operations at the military base. The U.S. Environmental Protection Agency (EPA) had placed the base on the National Priorities List in 1990 due to the discovery of a groundwater plume containing volatile organic compounds. In addition to the plume, there were also sites containing underground storage tanks, aboveground storage tanks, solid waste management units, PCB transformer, landfills and other miscellaneous locations of concern.
Because responsibility for the environmental clean-up of these parcels remains with the Department of the Navy, these portions of the property were transferred as Leases in Furtherance of Conveyance (LIFOC) rather than through a grant deed. Approximately 40% of the property transferred to the City of Irvine for the Great Park through the Development Agreement is LIFOC property. As property is cleaned, and a Finding of Suitability to transfer (FOST) is made, the property is deeded to Heritage Fields and then to the City. Since signing of the Development Agreement, several areas have been successfully cleaned and have either been deeded to the City or are in the process of obtaining the necessary regulatory approvals. The Navy estimated that some areas could take up to 30 years to be ready. However, the City is not prohibited from developing areas held as LIFOC property, but must ask and receive written permission from the Navy prior to disturbing the land. Development in LIFOC areas may occur only after all regulatory approvals have been granted.
- 10 -

HistoryOrange County Great Park Corporation
Designing the Great ParkAfter an eight-month international design competition was conducted in 2005, the Great Park selected landscape architect Ken Smith and his collaborating partners to design the Park. Collectively known as The Great Park Design Studio, Smith’s collaborators include Mia Lehrer of Mia Lehrer + Associates, Enrique Norton of Ten Arquitectos, Steven Handel of Green Shield Ecology, Buro Happold consulting engineers, Fuscoe Engineering, and the construction and design management firm, Gafcon.
Designers met with residents, community leaders, veterans, environmental organizations, and artists to enhance the competition plan into a Master Plan for the Park. Generated from these meetings were key elements of the Park, such as the sports park, performance area, great lawn, trails, botanical gardens, lake, canyon, agua chinon, cultural terrace, and bosque. Together, these features will fulfill the Park’s function as a great social and recreational gathering place.
A portion of the park is already open to the public. The Great Park Balloon, donated by Heritage Fields, takes visitors 400 feet aloft for a bird’s-eye view of the park, opened July 2007 and the balloon’s surrounding Preview Park opened in July 2008. An extension to the preview park was completed July 2009.
- 11 -
Master Designer Ken Smith
Corporate Structure and GovernanceOrange County Great Park Corporation
Corporate Structure and GovernanceThe Great Park Corporation is a duly authorized Corporation in the State of California pursuant to Articles of Incorporation filed on July 7, 2003 and amended in 2004.
On July 13, 2005, the Orange County Great Park Corporation received its determination letter from the Department of the Treasury as a tax exempt organization under section 501 (c) 3 of the Internal Revenue Code. It is further classified as a Public Charity under 509 (a) 3 of the Internal Revenue Code. This status provides that the organization must be operated solely for the benefit of, or in connection with, the supported organization. In the case of the Great Park Corporation, the supported organization is the City of Irvine.
On April 26, 2006, the Irvine City Council adopted a resolution clarifying the organizational structure, roles and responsibilities of both the City of Irvine and the Orange County Great Park Corporation relative to the design, construction, operation, and maintenance of the Park.
The resolution provides the following:• The Orange County Great Park Corporation Board of Directors consists of five
members of the Irvine City Council and four appointed directors.• Employees serving the Corporation are employees of the City of Irvine, working within
the City’s organizational structure (i.e. as a distinct operating department of the City) and functioning under the general direction and supervision of the City Manager.
• Funds for the development of the Park are managed by the City of Irvine in a separate City fund.
• Operations and maintenance of the Park shall be based on a self-sustaining budget.• The Great Park Board of Directors
o May develop policies for presentation for City Council adoption.o Is responsible for direction and oversight with respect to planning, designing,
and constructing the Park.o Is responsible for ensuring that applicable policy guidelines and design
principles are implemented.o Will oversee construction of the Park and will provide recommendations to the
City Council for approval of all contracts and change orders.• The Irvine City Council
o Must initiate and approve all land use modifications.o Has final authority over all financial matters, including contracts for construction,
operation and maintenance of the Park.o Is responsible for the management, dispensation and investment of funds
available for the Park.
- 12 -

Corporate Structure and GovernanceOrange County Great Park Corporation
Measure R: Orange County Great Park Ratification and Implementation ActOn November 8, 2008, a local ordinance, known as Measure R, was passed by a majority of Irvine voters. Known as the Orange County Great Park Ratification and Implementation Act, the purpose of the ordinance is to clarify the respective roles and responsibilities of the City of Irvine and the Corporation with regard to the Park project. The ordinance also clarified the manner in which funding for, construction and on-going maintenance of the Park is to be managed. The main provisions of this ordinance are summarized below:
The Corporation Board is responsible for:• adopting policies concerning planning, designing, constructing, operating, and
maintaining the public portions of the Park;• ensuring that policy guidelines and design principles are implemented;• providing direction with respect to planning, designing, and constructing the Park; and• overseeing construction of the Park;
Corporation staff is responsible for:• initiating fund development and fostering relationships with public and private partners
to construct and operate the Park; and• interfacing directly with the design team, program manager, construction contractors,
and utility and regulatory agencies.
The City of Irvine is responsible for:• initiating and approving land use modifications;• managing all financial matters, including contracts for professional and maintenance
services related to the Park; and• managing all funds related to development of the Park, including accounting for all
Park related expenditures and investing portions of the funds not needed for immediate use in accordance with the City’s investment policy.
Other pertinent provisions of the ordinance memorialize that all revenues and expenditures related to the Park will be managed by the City in a separate fund; the operation and maintenance of the Park will be based on self-sustaining budgets; existing residents and businesses of Irvine will be protected from paying for Park operations and maintenance; and the City will not use General Funds for the planning, construction, operation, or maintenance of the Park.
- 13 -

Corporate Structure and GovernanceOrange County Great Park Corporation
Mission StatementEarly in the Great Park’s history, the Board of Directors adopted a Mission Statement and a set of guiding principals as the foundation and direction for the organization. “The purpose of the Orange County Great Park Corporation is to develop and operate, preserve and protect the Orange County Great Park for the benefit and enjoyment of all its visitors, those of today and those of the future.”
Guiding PrinciplesCommunications – Provide timely and accurate information to the countywide constituency to assess their needs and interests as they relate to the Great Park and to ensure these needs and interests are reflected in the planning and development of the park.
• Provide regional outreach and distribution of Great Park materials, administer surveys and conduct symposiums in order to inform, assess the needs, and educate residents of Orange County.
• Encourage patronage of all venues, expand public awareness, marketing programs, branding and build stakeholders, to assure that the Park remains a lively and integral part of the community and State for years to come.
• Provide on-going needs assessments to assure the uses are applicable over time.
Design and Infrastructure – Create realistic development standards and guidelines to ensure that the program for the Orange County Great Park serves the needs and interests of all areas of the County.
• Adopt plans that inspire and excite.• Emphasize quality.• Create a positive identity unique to the Great Park and surrounding region.• Continually consider the property as a single site to assure a continuity and balance
among site uses and adjacent areas with particular attention given to the design of the property’s edge treatments.
• Develop a program that promotes countywide utilization of the Park.• Commit to a master plan as a living document that can be phased, with flexibility to
allow for adjustments over time.• Promote and serve multiple functions including the integration of passive and active
recreation, open space, work and living environments.
- 14 -

Corporate Structure and GovernanceOrange County Great Park Corporation
• Incorporate universal design and accessibility standards that provide opportunities for all park visitors to experience the park environment to the fullest extent.
• Incorporate guidelines for flexible transportation systems connecting all areas of the Great Park and accessibility to the Park with minimum impact to air quality.
• Implement a pedestrian friendly design.• Implement green building principles.• Incorporate sustainability principles to include water use and reuse throughout the
entire property, energy and resource conservation and resource conservation.
Environmental – Ensure that consideration is given to creating a park environment that is sustainable and energy efficient and that protects the long-term viability of the park’s natural resources.
• Create stewards of the Great Park who understand, support, and contribute to sustainability on every level.
• Promote sustainability through building practices that maximize use of the existing built environment, take full advantage of energy efficiency and viable alternative energy resources, incorporate designs and materials that enhance occupant well-being and protect the long-term viability of natural resources.
• Establish programs that promote energy efficiency, energy resources, and renewables, and minimizing peak demand throughout the Park’s infrastructure, built environment and on-going activities.
• Support a sustainable transportation system by creating alternatives to private vehicles that provide mobility to those who live, work, and visit the Park.
• Protect existing natural resources and restore degraded resources, while increasing native habitats, limiting resource intensive habitats, and establishing a connection between park habitats and regional ecosystems.
In addition, twelve sustainability objectives have been developed to serve as a guide in the design and operation of the Park:
1. Biodiversity: provide ecological habitats and corridors to reflect the local natural heritage and enhance biodiversity in the region.
2. Water: protect and conserve natural and potable water resources.3. Land: remediate contaminated areas and develop healthy living soil.4. Energy: reduce the use of fossil fuels and the emission of greenhouse gases.
- 15 -

Corporate Structure and GovernanceOrange County Great Park Corporation
5. Materials: minimize the impact of construction materials and the generation of waste.
6. Air Quality: Improve air quality of internal and external environments.7. Heritage: instill a sense of place that references the history of the site and the region.8. Well-Being: protect and improve the health and productivity of those who visit and
work in the Park.9. Connection to Nature: provide opportunities to experience nature and environmental
education in the greater Orange County area.10. Inclusion: provide park experiences that match the cultural and recreational
expectations of all visitors. Encourage community participation and civic engagement.
11. Transit-Oriented: provide a development with less polluting transportation choices and connections within and beyond the Park.
12. Monitoring: Incorporate ongoing measurements and monitoring of key sustainability targets.
Finance – Ensure the fiscal stability of the Orange County Great Park.• Protect the ability of the Orange County Great Park to conduct its business by ensuring
that policy and planning decisions are not controlled by financial problems or emergencies.
• Develop operational principles that minimize overhead costs and financial risks.• Enhance planning capability by developing accurate information on design and
development costs.• Employ revenue policies that prevent undue or unbalanced reliance on certain
revenues and which provide adequate funds to operate the desired programs.• Ensure the legal use of all Great Park funds through a good system of financial security
and controls.• Assure budget and financial policies and practices remain sound throughout the years
by providing independent, outside oversight.
Property Management – Maximize the property’s potential as a world-class park and its value as a long-term asset for the Great Park.
- 16 -

Corporate Structure and GovernanceOrange County Great Park Corporation
• Manage assets and direct development in a manner that achieves the near term goals of the Great Park without compromising the ability to meet the needs of future generations.
• Provide broad access to social, cultural, educational and recreational opportunities for all segments of the community.
• Generate revenue through appropriate asset management and leasing opportunities to fund sufficient Great Park reserves dedicated for future repair and replacement of facilities.
• Adopt and implement a comprehensive security plan to protect people and property and to prevent disorder and deterioration.
• Create a sense of place which invites and encourages people countywide to gather at the Great Park.
- 17 -

Amended Development AgreementOrange County Great Park Corporation
Amended & Restated Development Agreement On August 11, 2009, the City Council approved an Amended and Restated Development Agreement that updates the mutual relationship between the City and Heritage Fields.
The main components of this agreement affecting the Great Park are as follows:
• Heritage Fields will fund up to $40 million over a five year period towards joint backbone infrastructure and construction needs, including runway demolition in the Great Park.
• Heritage Fields will contribute $18 million over a 5 year period beginning in Fiscal Year 2009-2010 towards maintenance and operations of the Great Park.
• Beginning in Fiscal Year 2014-2015, Heritage Fields will contribute up to a maximum of $9.5 million per year for park maintenance on an “as-needed” basis. Items that qualify as maintenance expenditures for these funds are specified in the Agreement, and include work such as landscaping, grass and turf, open space, agriculture, water features, buildings and facilities, parking and drainage facilities. Items that are not considered eligible include work to maintain or manage a lake, canyon, the balloon attraction, and special event programming.
• The Great Park Special Fund will receive $9 million over 9 years in public-benefit fees that would have come from City-dedicated golf fees had a golf course been constructed. These fees will be used to develop and maintain the Park. The new agreement releases Heritage Fields from its original commitment to retain a golf course on the site.
• Heritage Fields will transfer 130.5 acres of land to the City within the Lifelong Learning District to be developed as part of the Great Park, and an additional one-half acre for the nearby 5-acre site dedicated for a new police facility.
• Responsibility for cost overruns related to backbone infrastructure development shifts from the City to Heritage Fields.
• Heritage Fields will have design lead on most of the backbone infrastructure development, based on criteria established in the revised agreement.
• The current designation of 173 acres of agricultural land in the Lifelong Learning District was removed.
• Land uses that would support the Great Park, such as a hotel, restaurants, small-scale retail, institutional, and educational uses will be allowed.
- 18 -

Amended Development AgreementOrange County Great Park Corporation
Density BonusOn August 11, 2009, the Irvine City Council approved the Density Bonus Agreement for Heritage Fields, which is based on the permitted development capacity of 3,625 units approved in the Amended Overlay Plan. The Master Affordable Housing Plan proposed that 399, or 11%, of the homes in the project be permanently affordable to households at or below 50% of area median income (very low-income) and 145 homes, or 4%, be permanently affordable at moderate-income. State density bonus law requires that a City shall grant a 35% density bonus if the developer provides 11% very low-income units.
In the case of Heritage Fields, the bonus translates into 1,269 additional units. These additional units are incorporated into the calculations of future tax increment that may be used for Great Park development.
With the addition of density bonus units, 4,894 homes can be constructed at The Great Park. Commercial development capacity is as follows: Institutional, 2,138,000 square feet; Commercial Recreation, 708,000 square feet; Medical & Science and Research & Development, 2,600,000 square feet; Community Commercial and Retail, 300,000 square feet; Auto, 102,000 square feet; and Office, 75,000 square feet.
- 19 -
Financial AssumptionsOrange County Great Park Corporation
Strategic Business Plan Financial AssumptionsOn October 26, 2006 the Orange County Great Park Board of Directors approved the Preliminary Master Plan for the Great Park. Shortly thereafter a dedicated effort to complete schematic design drawings for the entire Great Park began. This effort culminated in the presentation and approval of the Great Park Comprehensive Park Design by the Board of Directors on February 19, 2009. The original business plan for the Great Park was adopted by the Board in December 2004, an interim plan was presented to the Board in March 2007, and a 10-year cash flow analysis was presented to the Board in April and updated in October 2009.
In April, 2009, staff presented a cash flow analysis to the Great Park Board with a recommendation that the Board establish a budget parameter of $61.16 million for the development of the Western Sector Park Development Plan, Phase I. Based on the assumptions contained within the cash flow analysis, $61.16 million was determined to be the maximum amount that could be spent on capital development and still maintain fiscal sustainability. The board approved staff’s recommendation.
Following the close of Fiscal Year 2008-2009 and approval of the Amended and Restated Development Agreement between the City of Irvine and Heritage Fields, LLC in August 2009, an updated cash flow analysis was developed. The update included modifications for changes in market and economic conditions. Following the updated cash flow analysis, staff recommended, and the Board and City Council approved, a total budget of $65.5 million for the Western Sector Park Development Plan -- Phase I.
- 20 -

Financial AssumptionsOrange County Great Park Corporation
Cash Flow Model General Assumptions Include:1. A beginning Available Fund Balance at July 1, 2009 of $128.7 million calculated as
follows:
All Great Park FundsInception through June 30, 2009
Revenues:Revenues: Development Agreement Fees Development Agreement Fees $200,000,000 Lease, Interest, & Other Revenues Lease, Interest, & Other Revenues $35,657,941
Revenue Total $235,657,941
Purchase, Sale and Financing Agreement Contribution Purchase, Sale and Financing Agreement Contribution $134,000,000 Total All Sources $369,657,941
Expenditures & Transfers-Out:Expenditures & Transfers-Out:Capital Improvement Projects, Contract $81,922,157
Services, & Special EventsOther Expenditures1 $22,319,747Other Department Charges $168,364Transfers-Out: To the General Fund $200,000 Total All Expenditures & Transfers-Out $104,610,268
Fund Balance at June 30, 2009Fund Balance at June 30, 2009 $265,047,673Reservation of Fund Balance - RDA Loan ReceivableReservation of Fund Balance - RDA Loan Receivable ($134,000,000)Carryover and Year-End AppropriationCarryover and Year-End Appropriation ($1,432,004)CIP ReconciliationCIP Reconciliation ($963,942)Adjusted Fund Balance at July 1, 2009Adjusted Fund Balance at July 1, 2009 $128,651,727
1. Other Expenditures includes Staff Salaries, Supplies, Internal Services, Training & Business Expenses, Utilities, Capital Equipment (not part of CIP Projects), Miscellaneous, and Corporation Start-up Costs
- 21 -
Financial AssumptionsOrange County Great Park Corporation
A detailed breakdown of expenditures for Capital Projects and Contract Services from inception to June 30, 2009, is provided in Appendix D.
2. Revenues and Expenditures as adopted in the FY 2009-2010 Great Park Budget are used as the base year for future projections.
3. Revenues are projected over a 10-year period and include revenues from existing leases, interest earnings and changes related to the Amended Development Agreement approved in August 2009.
4. Expenditures are projected over a 10-year period and include all existing maintenance and operations for all completed Great Park Components.
5. Capital Projects in the amount of $15.7 million that were in process at the end of Fiscal Year 2008-2009 will continue into Fiscal Year 2009-2010 and include the following:
• Site Prep & Demo $ 3.5 million• GPDS Schematic Design $ 6.0 million• Phase 1C Preview Park $ 1.0 million• 2009 Capital Improvement Project $ 4.0 million• Backbone Infrastructure CIP $ 1.2 million
$ 15.7 million
6. The tax increment forecast is based on an updated analysis of residential and non-residential price points and market absorption of the Great Park Neighborhoods development that was updated in the Summer of 2009.
7. The Great Park Board approved Western Sector Park Development Plan is included at $65.5 million
8. The Great Park Special Fund maintains a cash balance of at least $10 million in every year of the 10-year projection period.
9. A base assumption of this business plan is that the RDA Board will choose to utilize tax increment bond proceeds to fund future development of the Great Park.
- 22 -

Revenue SourcesOrange County Great Park Corporation
Revenue SourcesConsistent with the City of Irvine’s strategic planning process, only funding sources which are both measurable and available are included in the strategic plan. Revenues include lease revenues for operating on Great Park property, interest earnings, revenues provided through the Amended and Restated Development agreement, and repayment of the Purchase Sale and Financing Agreement Loan. A discussion of potential grant funds is included, as well as background information on the forecast of available tax increment. It should be noted that apart from the repayment of the Purchase, Sale and Financing Agreement loan, the tax increment that flows into the Irvine Redevelopment Agency (RDA) is not a Great Park revenue source. The Board of the RDA controls tax increment allocation.
Table 1 and Table 2 depict a summary of the revenues from FY 2009-2010 through FY 2019-2020 in 5-year increments. A detailed discussion of each revenue item follows these tables.
Detailed Revenues and Expenditures from 2009-19
Table 1FY 2009-2015 Revenues
- 23 -
Adj. Budget 1 2 3 4 5
Revenues & Fund Balance Esc. 2009-10 2010-11 2011-12 2012-13 2013-14 2014-15
Beginning Available Fund Balance $128,651,727 $78,905,845 $28,443,022 $18,102,245 $14,327,240 $11,423,688
Interest 3% 3,130,000 2,167,000 785,000 462,000 381,000 365,000
Agricultural Lease 3% 100,000 103,000 106,090 109,273 112,551 115,927
RV Storage 3% 1,818,000 1,872,540 1,928,716 1,986,578 2,046,175 2,107,560
Runway Access 3% 450,000 463,500 477,405 491,727 506,479 521,673
Green Waste 3% 500,000 515,000 530,450 546,364 562,754 579,637
Heritage Fields Contribution Calc 300,000 0 0 0 0 0
Golf Course Fees Calc 0 0 0 0 0 0
Preview Park/Other 3% 68,594 180,206 185,612 191,181 196,916 202,823
Event Parking 3% 168,000 173,040 178,231 183,578 189,085 194,758
Sponsorships 0% 250,000 250,000 250,000 250,000 250,000 250,000
Sports Park Revenues 3% 0 0 25,000 25,750 26,523 27,318
HF/CFD Guaranteed Amount Calc 0 0 9,000,000 4,000,000 5,000,000 8,410,000
DA - Public Benefit Fee §10.1 Calc 300,000 300,000 300,000 1,200,000 1,200,000 1,200,000
RDA $134 Million Loan Repayment (Tax Increment)RDA $134 Million Loan Repayment (Tax Increment) 0 0 0 2,900,000 4,700,000 6,700,000
Total Revenues $7,084,594 $6,024,286 $13,766,505 $12,346,450 $15,171,483 $20,674,698

Revenue SourcesOrange County Great Park Corporation
Table 2FY 2015-120 Revenues
Revenue Assumptions
Interest IncomeCash balances for the Great Park are held in a separate fund at the City of Irvine for the development of the Great Park. Available amounts are invested by the City Treasurer in the City’s Operating Portfolio. The business plan assumes a 3.0% rate-of-return on the annual average balance in the portfolio.
Property Lease RevenuesThe Great Park currently receives revenue from four separate ground leases; a land lease for the storage of recreational vehicles (RVs); a land lease for runway access; a property lease for use as a green waste facility; and, a land lease for farming activities. Combined, all leases generate approximately $2.8 million per year, with an assumed annual escalation factor of 3%. The goal of the Great Park is to keep these leases active as long as possible to continue to generate funds for future park construction and operations. The lease revenue is currently estimated to continue for the entire 10-year period of the business plan.
- 24 -
6 7 8 9 10
Revenues & Fund Balance Esc. 2015-16 2016-17 2017-18 2018-19 2019-20
Beginning Available Fund Balance $13,296,685 $15,818,991 $15,184,544 $15,139,330 $14,609,955
Interest 3% 430,000 458,000 448,000 440,000 436,000
Agricultural Lease 3% 119,405 122,987 126,677 130,477 134,392
RV Storage 3% 2,170,787 2,235,911 2,302,988 2,372,078 2,443,240
Runway Access 3% 537,324 553,443 570,047 587,148 604,762
Green Waste 3% 597,026 614,937 633,385 652,387 671,958
Heritage Fields Contribution Calc 0 0 0 0 0
Golf Course Fees Calc 0 0 0 0 0
Preview Park/Other 3% 208,908 215,175 221,631 228,280 235,128
Event Parking 3% 200,601 206,619 212,817 219,202 225,778
Sponsorships 0% 250,000 250,000 250,000 250,000 250,000
Sports Park Revenues 3% 28,138 28,982 29,851 30,747 31,669
HF/CFD Guaranteed Amount Calc 8,562,000 9,553,000 9,722,000 10,692,000 11,013,000
DA - Public Benefit Fee §10.1 Calc 1,500,000 1,500,000 1,500,000 0 0
RDA $134 Million Loan Repayment (Tax Increment)RDA $134 Million Loan Repayment (Tax Increment) 6,800,000 3,700,000 4,500,000 6,100,000 7,700,000
Total Revenues $21,404,189 $19,439,054 $20,517,396 $21,702,318 $23,745,927
Revenue SourcesOrange County Great Park Corporation
Golf Course FeesThe 2005 Development Agreement between the City and Heritage Fields included two golf courses, an 18 hole course that already existed on the former base (closed in 2006) and a new 27 hole course that was to be built by Heritage Fields. Golf Course Rounds Fee revenues were included in the original agreement. The Amended and Restated Development Agreement removed Heritage Fields’ obligation to construct these golf courses and in exchange, Heritage Fields will pay the City $9 million over 9 years in Public Benefit Fees. These fees are assumed to be deposited into the Great Park Fund beginning in FY 2009-2010, in accordance with the Amended and Restated Development Agreement.
Preview Park/OtherThe unique nature of the Preview Park and facilities located within it, such as Hangar 244, make it an attractive venue for private entities to rent for events such as corporate meetings, parties and private celebrations. The plan includes revenue assumptions for rentals for these purposes by companies and individuals. These arrangements are handled through the Great Park’s facilities contractor, AMCI. Revenues are shared on a basis of 60% to the City and 40% to AMCI. AMCI’s compensation is based on its role in negotiating rates and helping renters with any necessary permits or other site requirements. Preview Park event fees are estimated to generate approximately $69,000 per year. This amount increases to approximately $180,000 in FY 2010-11 as the site becomes a popular destination for rental activities (with an annual escalation factor of 3%).
Event ParkingIn April 2009, the Great Park Board recommended the implementation of parking fees for certain events held at the Great Park. The Board took this action in order to be consistent with one of the Guiding Principles of “promoting personal, regional, and global health by reducing vehicular traffic.” The fees are intended to encourage carpooling which would in turn reduce traffic and minimize parking needs. The City Council approved the application of parking fees on May 12, 2009. Parking fees for Fiscal Year 2009-2010 are set at a per vehicle amount not to exceed $8.00 per vehicle and are charged only for specific special events. Parking fees are estimated to generate approximately $168,000 per year (with an annual escalation factor of 3%).
SponsorshipsThe Corporation has set an aggressive goal of obtaining up to $250,000 annually in the form of sponsorships. This funding could come from a combination of existing partners such as the Great Park Conservancy, and future sponsors. This amount will likely increase over time as the programs gain broader market recognition and as fundraising campaigns are
- 25 -

Revenue SourcesOrange County Great Park Corporation
launched, however the Business Plan conservatively projects that the amount of $250,000 is maintained throughout the 10-year projection period.
Sports Park RevenueIn October, 2009, the Great Park Board approved the Western Sector Park Development Plan – Phase I, which includes the construction of three dedicated soccer fields at the Great Park. Using comparable revenue projections for similar facilities currently owned and operated by the City, the Great Park has projected annual revenues of approximately $25,000 (with an annual escalation factor of 3%) beginning in FY 2011-12.
GrantsThe Great Park has a multitude of programs that are likely to be eligible for Federal and State funds. For most grant programs, it is necessary to have identified a project, established a schedule and total project cost, and have some level of design completed. As projects within the Great Park become more well-defined, it will become increasingly easier to apply for grant opportunities. Grants currently under consideration include the following:
Hangar 244: Department of Housing and Urban DevelopmentOn May 27, 2008, Senator Barbara Boxer visited the Orange County Great Park. After receiving a briefing from Master Designer Ken Smith and members of the Orange County Great Park Board of Directors the Senator announced her plans to support federal funding for Great Park projects. One of the projects Senator Boxer supported was the refurbishment of Hangar 244, a 65 year-old historic aircraft hangar.
On March 11, 2009, President Obama signed into law the Department of Housing and Urban Development Appropriations Act, 2009. This act provided the Orange County Great Park a grant award in the amount of $475,000 for improvements to the Orange County Great Park Hangar 244. Senator Boxer’s support, as the Chair of the Environment and Public Works Committee, was essential to this award.
Funds from this grant will be incorporated into the business plan when the timing of the award is known.
- 26 -

Revenue SourcesOrange County Great Park Corporation
Wildlife Corridor: Proposition 84 and Measure M-2 Bond Funding and Mitigation BankingThe Wildlife Conservation Board, through Proposition 84, has $4 billion in grant funding available in FY 2009-2010. The Wildlife Conservation Board intends to apply for $3 million in grant funding and is developing a project proposal. A meeting with leadership officials at the Department of Fish and Game will be sought to educate them on the vision of the Wildlife Corridor and its regional benefits to Orange County and beyond.
Funding through Measure M-2 Environmental Mitigation is also potentially available for this project. A call for projects occurred in May 2009, and Corporation consultants helped develop and present the project during a public meeting in June 2009 to respond to this call for projects. The consultant also submitted the appropriate paperwork to OCTA. Additional advocacy efforts include garnering support for the Great Park Wildlife Corridor from the Irvine Ranch Conservancy, the Resource Agencies, and Members of the 2020 OCTA committee who will be making recommendations to the OCTA Board for funding consideration. Great Park staff has initiated a dialogue with the Army Corps of Engineers and the California Department of Fish and Game to investigate the opportunity to create a mitigation bank as part of the development of the wildlife corridor. If the creation of a mitigation bank is successful, habitat that we build and maintain for wildlife corridor movement may be “purchased” by public and private entities that need mitigation credit for their development projects. There would be no actual sale of land but rather a sale of mitigation credits (at fair market value) and a commitment to maintain the mitigation bank area is perpetuity.
Sports Park: Proposition 84 Parks FundingThrough Proposition 84, $400 million in unallocated funds is available. Great Park consultants will submit an application in the amount of $5 million and will secure a meeting with leadership officials at the Department of Parks and Recreation to educate them on the vision of the Sports Park and its regional benefits to Orange County and beyond. The application deadline is March 1, 2010. Five public meetings must be completed by the time of submission.
Water Infrastructure: Clean Drinking Water Fund (Federal Stimulus Program), Water Use Efficiency Program, and Integrated Regional Water ManagementThrough the State Water Resources Control Board Clean Water Fund, $280 million is available in FY 2009-2010. Great Park consultants submitted a pre-application in April 2009 for the Bee Creek Canyon and Recycled Water Line projects. Both were included in the State Board’s Project Priority List (PPL). Staff is preparing financial assistance applications for each project. Once these applications are complete, the State Board Staff will rank the
- 27 -

Revenue SourcesOrange County Great Park Corporation
projects by priority against other projects on the Board’s Project Priority List. Funding will be based on immediate need and benefits created by the project.
Through the Department of Water Resources Water Use Efficiency Program, $35 million is available in early 2010. Great Park consultants recommend that the Corporation submit an application for $500,000 in the first quarter of 2010.
Through the Department of Water Resources (DWR) Integrated Regional Water Management program, $114 million is available specifically for the Santa Ana Watershed region. There will be an opportunity to submit projects once a call for projects occurs. All projects submitted throughout the Santa Ana Region will be included in a comprehensive plan being put together by the Santa Ana Watershed Project Authority (SAWPA). Once grant criteria is released by DWR, Great Park projects will be reviewed for submittal.
Development Agreement FeesThe 2005 Development Agreement executed between Heritage Fields and the City of Irvine provided that Heritage Fields would pay a total of $200 million to the City as development fees over a period of two years. The entirety of the $200 million has been received by the City of Irvine and has been deposited in the Great Park Special Fund.
Community Facilities DistrictHeritage Fields, in both the original and the Amended and Restated Development Agreement agreed to the formation of a Community Facilities District (CFD) to fund the design and construction of joint backbone infrastructure. CFD financings, used since 1980, are a method of financing public improvements and certain services by imposing a “special tax” on real property within a defined geographic area. The purpose of a CFD is to place the cost burden for new infrastructure solely on the developing property and not on existing residents. Bond issuance and administration of the Community Facilities District will be separately recorded in City of Irvine financial statements. Amounts included in this strategic business plan related to the formation of the CFD are anticipated to be reimbursed by the district.
In addition to CFD bond proceeds which are used for the development of joint backbone infrastructure, the Amended and Restated Development Agreement (ARDA) also provides for a portion of the Special Tax to be used for operations and maintenance of the Park, as discussed below.
- 28 -

Revenue SourcesOrange County Great Park Corporation
Amended and Restated Development Agreement (ARDA) RevenuesThe ARDA between Heritage Fields and the City of Irvine provides that Great Park Special Fund will receive $18 million for maintenance and operations support of the Great Park over a 5 year period beginning Fiscal Year 2009-2010. However, there is a provision in the ARDA that delays the start of these payments until the conclusion of any legal challenges to the approved ARDA. Based on the lawsuit filed by Forest Lawn in the fall of 2009, staff has conservatively assumed that no payments from this revenue source will occur in the first two years of the business plan forecast. Payments are then assumed to “catch up” starting in Fiscal Year 2011-2012 and will be completed within a 3 year period ending in Fiscal Year 2013-2014. The catch-up payment assumption is consistent with language approved in the ARDA.
Beginning in FY 2014-15, through an allocation of the special tax provision of the CFD, Heritage Fields (or the existing property owner) will contribute up to a maximum of $9.5 million per year for park maintenance and operations on an “as-needed” basis. Items that qualify as maintenance expenditures for these funds are specified in the Agreement and include work such as landscaping, grass and turf, open space, agriculture, water features, buildings and facilities, parking and drainage facilities for a park as envisioned in 2005, before the Master Plan for the Great Park was approved. Facilities that are not considered eligible for the maintenance and operations support from the CFD include the lake, canyon, the balloon attraction, and special event programming.
In addition to maintenance and operations support, under terms of the ARDA, Heritage Fields has agreed to pay $9.0 million over a 9 year period for fees in lieu of the golf course rounds fees in the original Development Agreement. These Public Benefit Fee payments are expected to commence in Fiscal Year 2009-2010. There is no delay or catch-up provision associated with the Public Benefit Fee payments.
Tax Increment Funds
Activation of the Redevelopment Agency On April 27, 1999, the City of Irvine activated the Irvine Redevelopment Agency (RDA) and on March 8, 2005 adopted the Redevelopment Plan for the Orange County Great Park Redevelopment Project Area. The second action made development of the Great Park eligible for funding with tax increment revenue, should the RDA Board approve such use of tax increment revenue.
- 29 -
Revenue SourcesOrange County Great Park Corporation
Tax increment is revenue that redevelopment agencies recieve to fund redevelopment projects. When a redevelopment project area is adopted, the current assessed value of all properties within the project area are added together to form the “Base Year” value. In 2005, when the RDA adopted the Redevelopment Plan for the Orange County Great Park Redevelopment Project Area, the base year value was assessed at approximately $4 million, which was the assessed value of the combined leasehold interests present at the base prior to Heritage Fields’ purchase of the property.
As property values rise, property owners in any area generally pay increased property taxes, with or without a redevelopment project area. The formation of a redevelopment project area allows any increase in assessed property value, above the base year value, to be specifically directed to the redevelopment project area to be used for public improvements. Tax increment comes from the increased assessed value of property, not from an increase in property tax rates.
However the RDA can only qualify to receive tax increment through indebtedness. Redevelopment agencies must establish a “need” to receive tax increment by entering into various debt instruments, including the sale of bonds, or loan agreements, such as the $134 million Purchase, Sale and Financing Agreement between the City of Irvine and the RDA.
The generation of tax increment over the 45 year life of the Redevelopment Agency will provide a substantial funding source to invest in public facilities, such as the Great Park.
RDA Purchase, Sale and Financing AgreementOn August 14, 2007, the City of Irvine entered into a Purchase and Sale Financing Agreement with the RDA to maximize and leverage tax increment resources and to create additional long-term funding for construction, operations, and maintenance of the Great Park.
The Agreement set forth concurrently occurring transactions between the City and the RDA:a. In the first transaction, the Agreement provides for a $134 million loan from the City’s
Great Park Special Fund (180) to the Redevelopment Agency Special Fund (108). This loan assures that the RDA could purchase needed land and that the RDA would have sufficient debt to collect all available tax increment.
b. In the second transaction, the RDA uses the funds borrowed from the Great Park Special Fund to purchase 35 acres of land owned by the City. The purchased land can be used to meet future objectives of the RDA.
- 30 -

Revenue SourcesOrange County Great Park Corporation
c. The Agreement further provided that the City use the land sale proceeds received from the RDA as part of the resources to construct the Park. Consequently the land sale proceeds of $134 million were contributed to the Great Park Special Fund 180.
The benefits of this Agreement are (1) repayment of the loan to the Great Park Special Fund provides a long-term unrestricted funding source to the City for construction, maintenance and rehabilitation of the Great Park, (2) the RDA creates debt and purchases property within the project area to achieve the objectives of the Redevelopment Plan, and (3) the City can use the land sale proceeds as part of the resources to develop the Great Park.
The Business Plan estimates that loan repayments to the Great Park Fund will begin in FY 2012-2013. It is possible that payments may begin sooner, however, due to the recessionary economy and the corresponding delay in residential and non-residential development, staff considered a more conservative approach to the receipt of these revenues to be the most prudent approach at this time.
- 31 -
Redevelopment Agency ConsiderationsOrange County Great Park Corporation
RDA Revenue Considerations Property Tax AppealsIn September 2006, Heritage Fields filed a property tax appeal on the parcels they own in the Irvine Redevelopment Agency Project Area. Their appeal challenged the inclusion of the value of the development agreement fees of $200 million in the assessed value of the property. The total 2006-07 assessed value (and the 2005-06 supplemental role value) as determined by the County Assessor was approximately $850 Million.
In September 2009, the County of Orange notified the City that it had lowered the value of the property in the Irvine Redevelopment Agency Project Area from its initial value of approximately $850 million to approximately $700 million for fiscal years 2005-2006 through 2008-2009, and down further to approximately $600 million for FY 2009-2010.
The downward revision to $600 million had an impact on the initial cash flow forecast as the business plan was originally developed assuming that the property tax appeal would result in a reduced property value of $649.5 million. This edition of the business plan has been updated to reflect new tax increment projections based on the new lower property valuations.
Potential State Take-AwaysThe latest financial estimate of the proposed State take away from the RDA is $5.3 million for 2009-2010 and $1.1 million in 2010-2011. The extraordinary impact of the State take away is due in part to the fact that the Irvine Redevelopment Agency received a large supplemental tax increment apportionment for fiscal year 2005-2006 in fiscal year 2006-2007. This significantly increases the Agency’s financial responsibility for the take away, from an estimated $2.7 to $3.0 million for 2009-2010 when based on 2007-2008 tax increment numbers, to over $5.3 million when based on 2006-2007 tax increment numbers.
In the event the Irvine Redevelopment Agency is required to make the take away payments, plans to begin repaying the $134 million loan to the City will have to be delayed. The repayment of the loan is designated for support of operating expenses for the Orange County Great Park and delaying the payment has an impact on the Park’s financial plan. In addition, the Agency was planning on issuing tax allocation bonds in the next few years, pledging $5 million in debt service annually. The State’s takeaway of $5.3 million this year and $1.1 million next year will delay the Agency’s bond issuance by a year or more further impacting the financing of capital improvements at the Orange County Great Park. Although the RDA’s bond capacity is not affected by this one or two year takeaway by the State, continued takes
- 32 -
Redevelopment Agency ConsiderationsOrange County Great Park Corporation
or the potential for future or more frequent takeaways would decrease the Agency’s ability to repay debt service and therefore lower the bonding capacity of the Agency.
Tax Increment Bonding Capacity and TimingAs discussed earlier, the RDA receives property tax revenues from the Great Park Project Area known as tax increment revenue. These revenues are based on the value of the property that exceeds the base year value of properties in the project area and rises proportionately as the assessed value of the property increases. As the Project Area develops and its taxable property value increases, the amount of tax increment revenue received by the RDA will increase.
The RDA has the ability to issue bonds supported by tax increment revenue. Bonds provide the opportunity to convert future tax increment revenues into immediate cash to build capital projects. Bonds represent a loan of money from investors which the RDA will pay back over time with tax increment revenues it receives from the Great Park Project Area, plus interest. For the RDA to raise capital funds by issuing bonds, sufficient revenues must be available, or projected to be available, to repay any bonds issued.
It should be noted that potential bond proceeds and tax increment revenues flow directly to and are controlled by the RDA Board. Because the bond proceeds are controlled by the RDA, the Business Plan does not include such amounts in future revenue streams. It is assumed, however, that the RDA Board will utilize future bond proceeds to develop the Great Park so estimated bond amounts are discussed and presented within this Business Plan.
Bonding Capacity Of The RDA Is Based On The Following Steps:1. Examine projected tax increment revenues available. This forecast of future tax
increment creates an estimated stream of revenues that may be used for various RDA purposes, including repayment of the Purchase, Sale and Financing Agreement $134 million loan and repayment of any bonds issued. The estimate of future tax increment is based on Heritage Fields initial development plan as adjusted by a Price Point and Market Absorption Study completed by Empire Economics in August of 2009 (See Appendix A).
State law requires all Redevelopment Plans to include a limit on how long tax increment may be collected. In the case of the Orange County Great Park Redevelopment Plan. This limit may not exceed 45 years. After that, tax increment reverts to regular property tax. RDA tax increment revenues have been projected throughout the life of the RDA and are based on the existing Heritage Fields
- 33 -

Redevelopment Agency ConsiderationsOrange County Great Park Corporation
development entitlements, of 4,894 homes, including the density bonus (See Appendix B for more details).
2. Forecasting the existing uses of the RDA’s tax increment revenues, including the low/mod housing set aside, administrative expenses, and loan obligations. The RDA currently has existing loan repayment obligations to the City’s Asset Management Fund and the Great Park Special Fund.
These anticipated uses of tax increment funds are subtracted from the RDA’s projected revenues, providing the net revenues available to repay bonds. The "net amount” of tax increment available forms the basis with which to estimate “bonding capacity,” or the amount of cash proceeds that the RDA can generate by issuing bonds. The net amount of tax increment available in each year also provides the basis for determining the timing for when bonds can be issued. (See Appendix B for more details).
- 34 -

Tax Increment BondingOrange County Great Park Corporation
Tax Increment BondingCurrently the RDA tax increment forecast does not anticipate sufficient net tax increment revenue available to support a traditional bond issue until FY 2016-2017. However, the RDA may wish issue bonds earlier based on an ongoing desire to expand the Great Park project as soon as practical. There are several financing techniques that allow for both conventional bond issues, where interest and principal payments would be required to be made as soon as six (6) months after bond issue, and other bond issuance structures where repayment can be delayed for a period of time.
The following bond capacity and timing analysis represents several options to issue bonds that advance Great Park capital development. Option 1 provides a lower amount of total net bond proceeds but delivers the first series of bond proceeds in 2015 and a second bond issue in 2021. Option 2 delays the receipt of bond proceeds for one year (until 2016 and 2022) but provides for more net bond proceeds overall. In total Option 2 provides approximately $3 million more in net bond proceeds than Option 1.
Both options assume (1) an average interest rate of 7%, which is expected to be conservative, (2) that Heritage Fields and the City of Irvine have already issued all or a significant part of the CFD bonds needed to construct joint backbone infrastructure, and (3) that there is substantial residential and non-residential development underway at the time of the RDA bond issue.
Table 3 OPTION 1
Bond Issue Estimate Bond Issuance: September 2015 September 2021 Total Interest Rate 7.00% 7.00% 7.00% Term in Years 30 29 29.5 Estimated Bond Issue Amount $36,624,000 $36,894,000 $73,518,000 Debt Service Reserve ($2,983,000) ($2,965,000) ($5,948,000) Capitalized Interest ($2,564,000) ($2,583,000) ($5,147,000) Costs of Issuance ($500,000) ($500,000) ($1,000,000) Underwriter's Discount (1.3% of Bond Issue Size) ($476,000) ($480,000) ($956,000) NET PROCEEDS $30,101,000 $30,366,000 $60,467,000
Option 1 provides for a total of $60.5 million of net bond proceeds for project development. The tax increment forecast indicates that two separate bond issues can be expected beginning in 2015 and then again in 2021. Both bond issues are anticipated to use a conventional fixed interest rate structure. This type of bond repayment would normally
- 35 -

Tax Increment BondingOrange County Great Park Corporation
commence within six (6) months of issue, however, for this projection, it is anticipated that the source of repayment for the first year will be from “capitalized interest,” which is a separate amount set aside specifically for the repayment of interest at the beginning of bond debt service. Given that there are not enough tax increment revenues expected from the redevelopment Project Area until FY 2016-2017, to support a $36.6 million bond issue in 2015, one year of interest payments must be borrowed.
Option 1 utilizes a total amount of capitalized interest of $5.2 million. This amount reduces the amount of proceeds available from both bond issues in total but advances the issuance of bond proceeds to construct the next phase of park development by one year.
Table 4 OPTION 2
Bond Issuance Estimate Bond Issuance: September 2016 September 2022 Total Interest Rate 7.00% 7.00% 7.00% Term in Years 30 29 29.5 Estimated Bond Issue Amount $35,420,000 $35,684,000 $71,104,000 Debt Service Reserve ($2,885,000) ($2,866,000) ($5,751,000) Capitalized Interest $0 $0 $0 Costs of Issuance ($500,000) ($500,000) ($1,000,000) Underwriter's Discount (1.3% of Bond Issue Size) ($460,000) ($464,000) ($924,000) NET PROCEEDS $31,575,000 $31,854,000 $63,429,000
Option 2 is similar to Option 1 in most respects but delays the timing of the bond issuance by one year. The tradeoff for the one-year delay is that total net bond proceeds are approximately $3.0 million higher than in Option 1. As noted in the table above, Option 2 provides for a total of $63.4 million of net bond proceeds. Option 2, like Option 1, is estimated to be issued in two traditional fixed-rate bond issues, however with no capitalized interest.
Option 2 contemplates the first bond issuance in September 2016 and that the net proceeds of this issue are $31.6 million. Option 2 has a second estimated bond issue in September 2022 which is expected to produce $31.9 million in net bond proceeds.
Bond Issue Considerations The net amount of bonds proceeds forecast under Options 1 and 2 appear to be somewhat lower than one might expect. This is because the bond issue estimate must take into account the following considerations:
- 36 -

Tax Increment BondingOrange County Great Park Corporation
• For every $1 million of tax increment revenue that is available to pay debt service on a bond issue approximately 40% must be diverted repay the RDA $134 million Loan amount. The Loan repayment amount is expected in turn to be used for maintenance and operations support for constructed park projects.
• That maintenance and operations costs of constructed projects will be, on average, approximately 10% of the hard, or construction cost of a given project.
• That for every $1 million of net proceeds generated by a bond issue approximately 67% will be used to support the construction cost, or hard costs, of a given project. The remaining 33% will be used for traditional soft costs such as design and construction administration, program and construction management, project permits, regulatory and other technical support.
- 37 -

Capital ExpendituresOrange County Great Park Corporation
Capital ExpendituresExpenditures relevant to approved capital development of the Great Park are outlined in this section. The expenditure forecast incorporates project expenditure estimates of $65.5 million for the Western Sector Park Development plan, as well as approximately $15.7 million for all the prior approved Capital Improvement Projects.
Table 5 and Table 6 below depicts a summary of the expected capital expenditures included in the business plan from FY 2009-10 through FY 2019-20. A discussion of each project expenditure follows these tables.
Table 5 FY 2009-2015 Capital Development
- 38 -
Adj. Budget 1 2 3 4 5
Capital Allocations and ReimbursementsCapital Allocations and Reimbursements 2009-10 2010-11 2011-12 2012-13 2013-14 2014-15
Park Development Allocations 30% 60% 10%
Western Sector - Park Development Plan$65,520,369.00 $19,656,111 $39,312,221 $6,552,037 0 0 0 Park Development Consulting na 3,700,000 0 0 0 0 0
Project Staff Salaries - PDP & CFD 3.4% 856,907 856,907 886,355 214,169 221,529 229,142
CIP Carryover Projects:
Site Prep & Demo Project na 3,500,000 0 0 0 0 0
GPDS Schematic Design na 6,000,000 0 0 0 0 0
Phase 1C Preview Park na 1,000,000 0 0 0 0 0
2009 Capital Improvement Project na 4,000,000 0 0 0 0 0
Backbone Infrastructure CIP na 1,200,000 0 0 0 0 0
Other Departmental Expenditures 3% 2,633 2,712 2,793 2,877 2,963 3,052
Allocations to Park Development Allocations to Park Development $39,915,651 $40,171,840 $7,441,185 $217,046 $224,492 $232,194
Capital Reimbursements:
CFD Infrastructure Expenditure Repayment na $0 $0 $0 $1,200,000 $0 $0
Total Capital Reimbursements Total Capital Reimbursements $0 $0 $0 $1,200,000 $0 $0

Capital ExpendituresOrange County Great Park Corporation
Table 6FY 2015-19 Capital Development
Western Sector Park Development PlanOn October 22, 2009, the Orange County Great Park Board approved the Western Sector Park Development Plan–Phase I, which outlines project components for development of approximately 200 acres of park property. The $65.5 million plan includes the following improvements:
• Runway Demolition - Runways will be demolished as necessary to complete the Western Sector Park Development Plan-Phase 1. Heritage Fields is obligated to remove runway materials as part of the Hardscape Recycling Agreement. That agreement was modified with the approval of the ARDA in August 2009 and the obligation for removal incorporated into a revised Master Implementation Agreement. Since that agreement is held in abeyance due to the legal challenge to the ARDA, the Great Park has budgeted an amount to address this work without the assistance of Heritage Fields. Reimbursement of the actual funds expended will be the subject of future negotiations with Heritage Fields.
• Recycled Water and Power - Interim infrastructure for recycled water and electrical power will be constructed to support the Western Sector Park Development Plan-Phase
- 39 -
1 2 3 4 5
Capital Allocations and ReimbursementsCapital Allocations and Reimbursements 2015-16 2016-17 2017-18 2018-19 2019-20
Park Development Allocations
Western Sector - Park Development Plan $65,520,369.00 $0 $0 0 0 0 Park Development Consulting na 0 0 0 0 0
Project Staff Salaries - PDP & CFD 3% 597,745 618,287 639,534 472,695 488,940
CIP Carryover Projects:
Site Prep & Demo Project na 0 0 0 0 0
GPDS Schematic Design na 0 0 0 0 0
Phase 1C Preview Park na 0 0 0 0 0
2009 Capital Improvement Project na 0 0 0 0 0
Backbone Infrastructure CIP na 0 0 0 0 0
Other Departmental Expenditures 3% 3,144 3,238 3,335 3,435 3,539
Allocations to Park Development $600,889 $621,525 $642,870 $476,131 $492,478
Capital Reimbursements:
CFD Infrastructure Expenditure Repayment na $0 $0 $0 $0 $0
Total Capital Reimbursements $0 $0 $0 $0 $0

Capital ExpendituresOrange County Great Park Corporation
1. Recycled water will be provided to agricultural areas and along the Timeline to the westerly edge of the existing Preview Park. Power will be provided from the Festival Event Site to the vicinity of the Timeline West.
• Marine Way and “C” Street Improvements - Marine Way and “C” Street improvement plans will be prepared. Pedestrian, bicycle and vehicular safety upgrades to existing Marine Way from Sand Canyon to “C” Street are included in this scope of work. The Great Park will confer with the City’s Public Works Department to determine if these upgrades to the public street can be included in the City’s ongoing street improvement program. “C” Street from Marine Way to the existing Preview Park entry drive will also include street lighting and landscape improvements. The budget also includes an allowance for safety upgrades including the addition of a Class II bike lane and road repairs to existing “C” Street north of the Preview Park entrance through Heritage Fields property to Trabuco Road.
• Agriculture Fields & Citrus Trees - The Agricultural Fields and Citrus Trees are preliminary components of the Fields and Meadows District. The site will be graded to construct water quality basins and provide soil amendments suitable for farming. Access to the Federal Aviation Administration VOR facility will be maintained and Navy monitoring well facilities will be protected in place. Facilities and site features will be provided in the agriculture area to enhance farm maintenance operations, provide interpretive elements, and plant the proposed water quality basin. Funding is included for the relocation and planting of up to 2,500 existing citrus trees adjacent to existing runway 34L.
• Palm Court and Art & Culture / Exhibition Space - The Palm Court and squadron complex will be a formal area within the Great Park used for special event programming, arts and cultural exhibitions, and every day use. The space is defined by the existing flanking squadron buildings to the north and south and Hangar 244 to
- 40 -
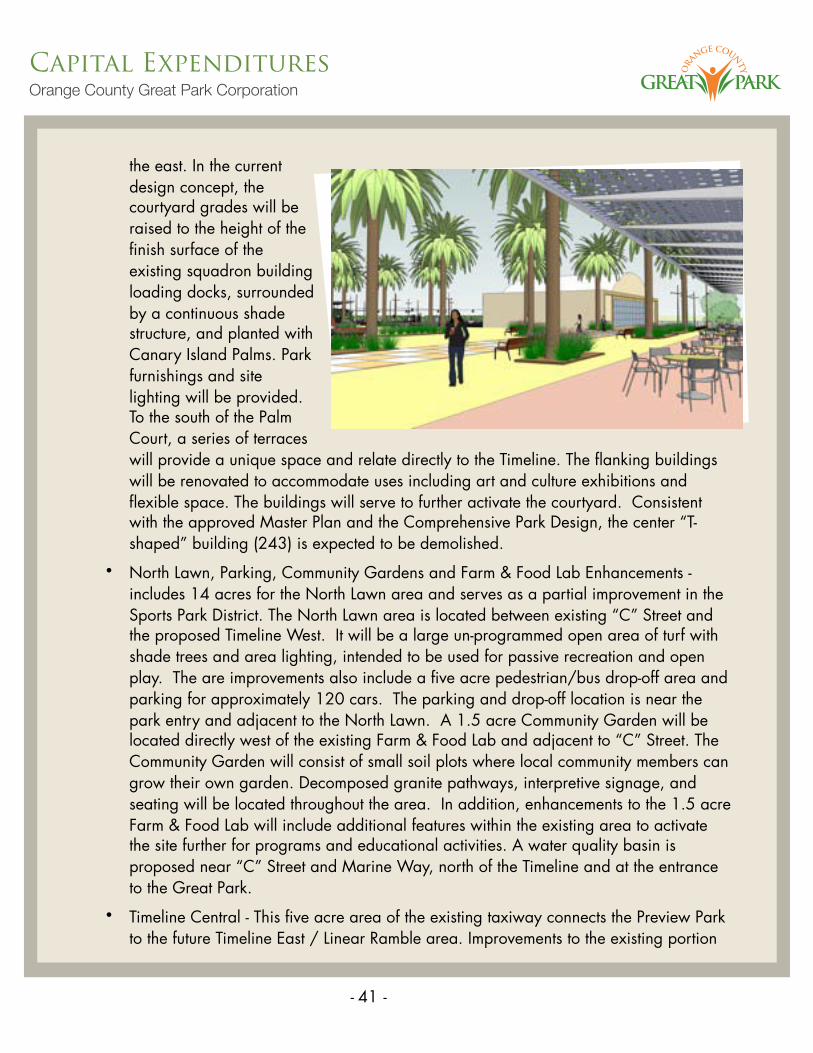
Capital ExpendituresOrange County Great Park Corporation
the east. In the current design concept, the courtyard grades will be raised to the height of the finish surface of the existing squadron building loading docks, surrounded by a continuous shade structure, and planted with Canary Island Palms. Park furnishings and site lighting will be provided. To the south of the Palm Court, a series of terraces will provide a unique space and relate directly to the Timeline. The flanking buildings will be renovated to accommodate uses including art and culture exhibitions and flexible space. The buildings will serve to further activate the courtyard. Consistent with the approved Master Plan and the Comprehensive Park Design, the center “T-shaped” building (243) is expected to be demolished.
• North Lawn, Parking, Community Gardens and Farm & Food Lab Enhancements - includes 14 acres for the North Lawn area and serves as a partial improvement in the Sports Park District. The North Lawn area is located between existing “C” Street and the proposed Timeline West. It will be a large un-programmed open area of turf with shade trees and area lighting, intended to be used for passive recreation and open play. The are improvements also include a five acre pedestrian/bus drop-off area and parking for approximately 120 cars. The parking and drop-off location is near the park entry and adjacent to the North Lawn. A 1.5 acre Community Garden will be located directly west of the existing Farm & Food Lab and adjacent to “C” Street. The Community Garden will consist of small soil plots where local community members can grow their own garden. Decomposed granite pathways, interpretive signage, and seating will be located throughout the area. In addition, enhancements to the 1.5 acre Farm & Food Lab will include additional features within the existing area to activate the site further for programs and educational activities. A water quality basin is proposed near “C” Street and Marine Way, north of the Timeline and at the entrance to the Great Park.
• Timeline Central - This five acre area of the existing taxiway connects the Preview Park to the future Timeline East / Linear Ramble area. Improvements to the existing portion
- 41 -

Capital ExpendituresOrange County Great Park Corporation
of the Timeline will include shade structures, park furnishings, a vegetated swale, a double row of trees, and a planting buffer.
• Timeline West and South Lawn Soccer Fields - This 24 acre site encompasses further development of the Sports Park area. A new portion of the Timeline will be built west of the Preview Park and will include Great Park identification signage. The nine acre Timeline West will connect the intersection of Marine Way and “C” Street to the Park. The Timeline will be constructed of asphalt and will contain a Class I bike trail. Features will include shade structures, park furnishings, a vegetated swale, a double row of trees, and a planting buffer. The 15 acre South Lawn area will contain three lighted soccer fields designed to City of Irvine standards. In addition, shade trees will be placed throughout the area. A water quality basin to treat storm water run-off from this site is proposed near “C” Street and Marine Way, south of the Timeline and at the entrance to the Great Park.
• Multi-Purpose Pavilion - The Multi-Purpose Pavilion will be an iconic park structure located in the Western Sector Park Development Plan-Phase 1. Program ideas include an open air park shelter, event space, restroom facilities, a visitor center, or a farm stand. The current program concept is to create an Agricultural Pavilion that will serve as an “upscale” roadside farm stand as well as a community networking center. The facility will be capable of accommodating many different agricultural and cultural purposes, including a produce stand to sell farm produce, a Wi-Fi connected meeting space, or a small café. In addition, the Agricultural Pavilion could be used to manage
- 42 -

Capital ExpendituresOrange County Great Park Corporation
a community-supported agricultural program which would provide citizens the opportunity to subscribe to a weekly supply of seasonally available fruits and vegetables grown at the Great Park farm.
• Also funded in the p lan are allowances to design, and construct the West Picnic Area and Hangar 244 rehabilitation, as well as Lake and water studies.
• Programmatic Support, Public Involvement and Strategic Development efforts are funded for the duration of the estimated 20 month project, including program and contingencies necessary to respond to constraints and opportunities as the project is constructed.
The $65.5 million project funding is estimated to be expended within three fiscal years. This accelerated spending assumption is considered the most fiscally conservative estimate in that it results in the least amount of interest income generated during those fiscal years. Actual spending, at a slower rate, will increase the interest income received by the Great Park.
Park Development ConsultingGreat Park consultants needed to develop and initiate the Western Sector Park Development Plan are funded separately in the current Fiscal Year. Subsequent consultant expenditures directly related to Park development are included in the Western Sector Park Development Plan-Phase I funding.
Project Staff Salaries PDP and CFDGreat Park staff salaries directly related to Park development are funded within the Capital Development budget. Salaries are assumed to escalate at 3.4%. Funding for project related staff salaries will be reduced in FY 2012-2013, by 76%, or $673,000, to coincide with the anticipated completion of the construction of the Western Sector Park Development Plan. Funding for Project related staff salaries is assumed to increase in FY 2015-2016 to correspond to additional project bond funds expected in 2015.
- 43 -

Operations and MaintenanceOrange County Great Park Corporation
G&A Expenses/Operations and MaintenanceConsistent with the City of Irvine’s strategic planning process, expenditures relevant to the short-term and long-term operations of the department are identified and forecast. The expenditure forecast is reflective of current and future service levels and commitments. Expenditures for the operations and maintenance of the park related to the Western Sector Park Development Plan are also incorporated.
Table 7, and Table 8, below depict a summary of the expenditures included in the business plan from FY 2009-10 through FY 2019-20. A detailed discussion of each expenditure item follow these tables..
Table 7Expenditures FY 2009-15
- 44 -
Adj. Budget 1 2 3 4 5
Expenditures by Budget Category Esc. 2009-10 2010-11 2011-12 2012-13 2013-14 2014-15
General & Administrative:
Salaries 3.4% $1,937,123 $1,937,123 $1,602,954 1,658,039 1,715,018 1,773,954Supplies 3.0% 180,000 185,400 152,770 157,353 162,073 166,935
Internal Services 3.0% 303,176 312,271 257,312 265,031 272,982 281,171
Contract Services 3.0% 2,634,000 2,794,270 1,946,943 1,994,851 2,044,197 2,095,023
Training & Business Expense 3.0% 94,050 96,872 84,978 87,527 90,153 92,858
Capital & Capital Equipment 3.0% 100,000 61,800 50,923 92,451 54,024 55,645
Insurance 3.0% 60,000 61,800 63,654 65,564 67,531 69,556
Transfers Out to General Fund 3.0% 100,000 103,000 106,090 109,273 112,551 115,927
Other Departmental Expenditures 3.0% 103,948 107,066 110,278 113,587 116,994 120,504
Subtotal G & A Expenditures $5,512,297 $5,659,602 $4,375,901 $4,543,675 $4,635,523 $4,771,574
Operations & Maintenance:Salaries 3.4% 983,852 983,852 1,017,662 1,052,634 1,088,808 1,126,224Supplies 3.0% 248,000 255,440 263,103 270,996 279,126 287,500
Rolling Stock Fuel, Maint. and Replacement 3.0% 24,676 25,416 26,179 26,964 27,773 28,606
Contract Services - M & O 3.0% 6,058,000 5,695,654 5,741,722 5,324,517 5,260,042 5,332,994
Contract Services - Programming 3.0% 2,000,000 2,060,000 1,000,000 1,030,000 1,060,900 1,092,727
Contract Services - Educational 3.0% 300,000 309,000 318,270 327,818 337,653 347,782
Utilities 3.0% 133,000 137,505 141,630 145,879 150,255 154,763
Capital Equipment - Replacement 3.0% 1,025,000 0 0 40,000 500,000 603,000
Insurance 3.0% 130,000 133,900 137,917 142,055 146,316 150,706
O&M Estimates For Park Development Plan 3.0% 500,000 1,054,899 3,643,713 4,199,870 4,364,147 4,673,631
Subtotal Operations Expenditures $11,402,528 $10,655,667 $12,290,196 $12,560,733 $13,215,020 $13,797,933
Total Expenditures $16,914,825 $16,315,269 $16,666,097 $17,104,409 $17,850,543 $18,569,507

Operations and MaintenanceOrange County Great Park Corporation
Table 8 Expenditures FY 2015-19
General & Administrative
Salaries Salary expenditures for the General & Administrative section are comprised of total salary costs, including benefits, for staff who are not assigned to Operations. These staff include the CEO and Deputy CEO’s, Great Park Managers, Analysts and Administrative support. Consistent with an anticipated conclusion of the Western Sector Park Development Plan construction effort, a programmed reduction to the G&A budget of staff salaries is projected
- 45 -
1 2 3 4 5
Expenditures by Budget Category Esc. 2015-16 2016-17 2017-18 2018-19 2019-20
General & Administrative:
Salaries 3.4% $1,834,916 $1,897,973 1,963,196 2,030,661 2,100,445Supplies 3.0% 171,944 177,102 182,415 187,887 193,524
Internal Services 3.0% 289,606 298,295 307,243 316,461 325,955
Contract Services 3.0% 2,147,373 2,201,295 2,256,833 2,314,038 2,372,959
Training & Business Expense 3.0% 95,644 98,513 101,468 104,512 107,648
Capital & Capital Equipment 3.0% 107,315 59,034 60,805 112,629 64,508
Insurance 3.0% 71,643 73,792 76,006 78,286 80,635
Transfers Out to General Fund 3.0% 119,405 122,987 126,677 130,477 134,392
Other Departmental Expenditures 3.0% 124,119 127,843 131,678 135,629 139,697
Subtotal G & A Expenditures $4,961,965 $5,056,833 $5,206,323 $5,410,582 $5,519,763
Operations & Maintenance:Salaries 3.4% 1,164,927 1,204,960 1,246,368 1,289,199 1,333,503Supplies 3.0% 296,125 305,009 314,159 323,584 333,291
Rolling Stock Fuel, Maint. and Replacement 3.0% 29,464 30,348 31,259 32,197 33,162
Contract Services - M & O 3.0% 5,278,953 5,418,781 5,581,345 5,767,785 6,056,249
Contract Services - Programming 3.0% 1,125,509 1,159,274 1,194,052 1,229,874 1,266,770
Contract Services - Educational 3.0% 358,216 368,962 380,031 391,432 403,175
Utilities 3.0% 159,406 164,188 169,114 174,187 179,413
Capital Equipment - Replacement 3.0% 40,000 0 0 40,000 700,000
Insurance 3.0% 155,227 159,884 164,680 169,621 174,709
O&M Estimates For Park Development Plan 3.0% 4,711,202 5,583,737 5,632,410 6,927,102 6,955,237
Subtotal Operations Expenditures $13,319,028 $14,395,143 $14,713,418 $16,344,980 $17,435,509
Total Expenditures $18,280,993 $19,451,976 $19,919,740 $21,755,562 $22,955,271

Operations and MaintenanceOrange County Great Park Corporation
in FY 2011-2012. Salary costs are then assumed to escalate at a steady 3.4% for the duration of the business plan.
SuppliesSupplies in the General & Administrative section are comprised of several items and include regular office supplies, postage, duplicating, advertising, and computer supplies. The Supplies budget is assumed to escalate 3% each year, until FY 2011-12 when it is reduced consistent with the planned reduction of staffing. Supplies budgets are generally treated as a function of staffing numbers.
Internal ServicesThe Internal Services budget in the General and Administrative section includes the department’s allocation of shared costs to run the City of Irvine’s mail center, duplicating center, telecommunications and IT network. As Internal Services costs are generally apportioned as a function of staffing numbers, in FY 2011-12 the Internal Services budged is also reduced.
Contract ServicesThe Contract services budget in the General and Administrative section is comprised of such items as the Lease for the Great Park offices, financial advisory and auditing consultants, legislative advocacy consultants, grant identification and research, Art & Cultural program consultant, fundraising and community outreach consultants, History Program funding needs, and legal expenses. Contract Services expenses are assumed to escalate by 3% each year until FY 2011-12. In FY 2011-12 contract services expenses for services that directly support staff are anticipated to be reduced commensurate with the reduction of staff. Following from FY 2011-12, reduction the internal services budget is assumed to escalate by 3% each year.
Training And Business ExpenseThe training and business expense category contains all Board of Directors and staff related costs for business travel, training, and tuition reimbursement. Commensurate with the reduction of staff in FY 2011-12, this category budget is reduced by an amount proportionate to staffing reductions. Otherwise this budget is assumed to escalate at 3% for the life of the business plan.
Capital EquipmentCapital Equipment expenses in the General and Administrative section are comprised of capital costs related to office and computer equipment needs. A reduction is programmed into the budget for FY 2011-12 as capital equipment costs are budgeted as a factor of staffing
- 46 -

Operations and MaintenanceOrange County Great Park Corporation
numbers. From that point forward, although the escalation factor is assumed to be 3%, the budget fluctuates based on replacement cycles for capital computer equipment for the duration of the business plan.
InsuranceInsurance premiums in the General and Administrative section cover general liability, special liability and directors and officers policies. These costs are assumed to escalate 3%.
Transfers Out To General FundTransfers out to the General Fund are designed to support the Great Park share of funding for the Council Executive Assistants. These costs are assumed to escalate 3%.
Other Department ExpendituresOther Department Expenditures consist of funding for administrative support provided by the City, such as accounting and finance. These costs are assumed to escalate 3%.
Operations and Maintenance
SalariesSalary expenditures for Operations are comprised of total salary costs, including benefits, for Operations and Programming staff. Salary costs are assumed to escalate at 3.4%.
SuppliesSupplies included in the Operations section comprise regular office supplies, duplicating, advertising, computer supplies and event and park programming supplies. The Supplies budget is assumed to escalate 3% each year.
Vehicle Fuel, Maintenance and ReplacementThis category includes all existing Operations vehicles, including the specialized golf-cart style vehicles. The budget includes costs to maintain the vehicles, fuel them, and eventually replace them. Costs are assumed to escalate 3% yearly.
Contract Services – Maintenance and OperationsMaintenance and Operations contract services budget is comprised of services necessary to keep the existing park safe, clean and well maintained. These services include: landscape maintenance, custodial, park restroom maintenance, facilities maintenance, site security, tree holding and maintenance, farm and food lab operations and maintenance, agricultural
- 47 -
Operations and MaintenanceOrange County Great Park Corporation
operations, balloon operations, visitor center operations, shade structure maintenance. Costs are assumed to escalate by 3% yearly.
Contract Services – ProgrammingThis budget includes funding necessary to support the outstanding special events and programs enjoyed by thousands of visitors in past years. Although the Programming budget is reduced by approximately $1 million in FY 2011-2012, it is expected that the Great Park will be able to attract additional sponsors to support these programs. After the reduction costs are assumed to escalate by 3% each year.
Contract Services – EducationalThe Educational budget in Operations is comprised of funding to support the newly introduced and popular Pilot programs such as Educational Awards, Visual and Environmental Arts, Cultural Heritage, Ecology, and Agriculture. Recent examples of these popular programs include the workshops hosted by the Master Gardeners at the Farm and Food Lab. Costs are assumed to escalate by 3% yearly.
UtilitiesThe Utilities budget in Operations is comprised of the electricity costs needed to operate the Park. These costs are assumed to escalate by 3% a year.
Capital Equipment ReplacementCapital Equipment costs in Operations fluctuate based primarily on the replacement schedules for the Balloon envelope and the Visitor Center tent. Costs are otherwise assumed to escalate 3% yearly.
InsuranceInsurance costs in Operations cover the insurance policy for the Balloon and are assumed to escalate 3% a year.
Future Operations and Maintenance Estimates for Park Development PlanThe Operations and Maintenance budget for costs related to the Western Sector Park Development Plan include landscape, facilities, custodial, capital equipment, utilities, program and staff support needs. The estimates were forecast using the following assumptions and are phased in as new areas of the Western Sector Park Development Plan become operational:
• Landscape and facilities maintenance costs reflect prevailing wage requirements and are based on industry-wide cost surveys, verified against current Irvine maintenance standards
- 48 -

Operations and MaintenanceOrange County Great Park Corporation
• Utility costs - based on today’s rates
• Staffing costs – based on increased park area and phased in as components of the Park Development Plan come on line
Detailed analysis was performed to create the estimates.
Landscape MaintenanceThe landscape maintenance cost estimates are based on industry wide cost surveys developed by PBS&J, which is an engineering and construction consulting firm and reflect prevailing wage rates. The survey included landscape companies such as Valley Crest, Andre Landscaping and Park West Landscape, the City of Los Angeles Sports complex and the City of Chino Hills Field of Dreams complex. Mosaic Consulting Inc. also developed a cost breakdown based upon a recommended scope of work to maintain multi-use and sports fields. Staff also utilized a landscape management consulting firm to review and verify the findings from PBS&J’s industry wide survey. Then, the landscape cost estimates generated from the efforts of both Mosaic and PBS&J were reviewed and verified by the City’s Public Works staff. The results of the survey created a benchmark rate for basic turf maintenance services.
Facility MaintenanceThe facility maintenance cost estimates were based upon the City’s Contractor Team for Facility Repairs. The operations and maintenance cost estimates for facility maintenance reflect prevailing wage rates. Custodial services were based upon the City’s current contract terms. Prevailing wage rates do not apply to custodial services.
Utilities and EquipmentUtility and equipment cost estimates come from a variety of sources. Electricity estimates are based on Southern California Edison’s current billing rates charged to the Preview Park. Water cost estimates utilize IRWD’s recycle water rates and Mosaic Consulting, Inc. supplied estimated watering needs for the different types of landscape (i.e. shrub versus turf) found in the Western Sector Park Development Plan. Cost estimates for capital equipment, which include vehicles and storage containers, were based upon recent quotes provided by contractors and include an estimate for City of Irvine maintenance, operations and replacement costs developed by the City’s Public Works Department.
StaffingStaffing cost estimates are phased into the business plan based on an estimated schedule of Park completion and programmatic elements described in the Park Development Plan. O&M
- 49 -
Operations and MaintenanceOrange County Great Park Corporation
staff levels include support for youth and adult soccer league programs, staff oversight for increased facility rentals, recreational activities, staff oversight of the community gardens and the Farm & Food Lab. Additional staff support for educational programming and support for the Orange County Great Park’s signature events (i.e. Summer Concert series, Anniversary event) is also included. Additionally, proposed staffing cost estimates include a Landscape Supervisor to assist with oversight to existing and future landscape contracts to ensure that the Park’s multi-use fields, soccer fields, over 3,000 trees, two water quality basin areas, and numerous other landscape areas are maintained at the City’s service standards.
Wildlife Corridor Maintenance and OperationsWildlife Corridor maintenance and operations funding has been included in the 2009 Business Plan as a precursor to the actual scheduling of development and construction. The assumption in the business plan is to start funding WLC maintenance in FY 2016-17 at $800,000 per year to sustain native plantings. Annual funding declines by $100,000 each year as less environmental support is needed for the survival of the native species until funding stabilizes at $500,000 in FY 2019-20. Funding for the Wildlife Corridor has also been included to demonstrate the Great Park’s commitment to the development and support of the natural corridor.
Rehabilitation and ReplacementApproximately $1 million of rehabilitation funding is anticipated to begin in FY 2018-19, which is about seven years after the completion of the Western Sector Park Development Plan. Rehabilitation funding is then continued in the amount of $1 million in the next fiscal year, which is year 10 of this business plan. As the Western Sector Park Development Plan is developed, and actual rehabilitation schedules are created to maintain the Park, a refined rehabilitation funding plan is expected to emerge in future editions of the Great Park Business Plan.
- 50 -

Business Plan SummaryOrange County Great Park Corporation
Business Plan SummaryThe graph below incorporates all expected revenues and expenditures for the Great Park for the ten year period of July 1, 2010 to June 30, 2020. The available fund balance depicted by the black line starts at $128 million at the beginning of the ten year period, moves to approximately $14 million in FY 2012-2013 and remains relatively constant until FY 2019. As additional revenues are received and new Great Park components are added, a revised business plan will be presented.
Cash Flow Analysis Stress TestA financial stress test was performed on the proposed Great Park 10-year cash flow forecast in an attempt to find out how forecast will withstand the impacts of higher inflation. As noted previously, both revenues and expenditures are forecast to escalate approximately 3% on average over the 10-year projection period. In order to stress the cash flow model, a rate of 6% was applied to both revenues and expenditures to simulate an inflationary economy. The results are presented graphically on the chart below. The chart illustrates the projected fiscal
- 51 -
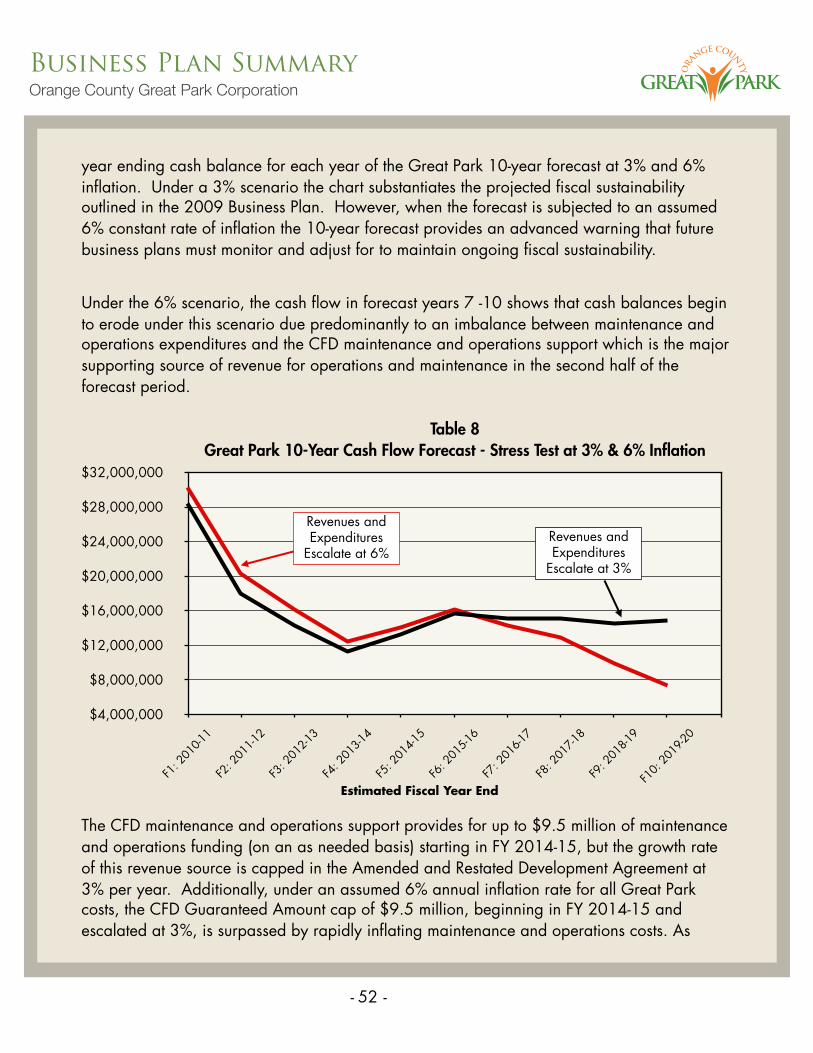
Business Plan SummaryOrange County Great Park Corporation
year ending cash balance for each year of the Great Park 10-year forecast at 3% and 6% inflation. Under a 3% scenario the chart substantiates the projected fiscal sustainability outlined in the 2009 Business Plan. However, when the forecast is subjected to an assumed 6% constant rate of inflation the 10-year forecast provides an advanced warning that future business plans must monitor and adjust for to maintain ongoing fiscal sustainability.
Under the 6% scenario, the cash flow in forecast years 7 -10 shows that cash balances begin to erode under this scenario due predominantly to an imbalance between maintenance and operations expenditures and the CFD maintenance and operations support which is the major supporting source of revenue for operations and maintenance in the second half of the forecast period.
$4,000,000
$8,000,000
$12,000,000
$16,000,000
$20,000,000
$24,000,000
$28,000,000
$32,000,000
F1: 2
010-1
1
F2: 2
011-1
2
F3: 2
012-1
3
F4: 2
013-1
4
F5: 2
014-1
5
F6: 2
015-1
6
F7: 2
016-1
7
F8: 2
017-1
8
F9: 2
018-1
9
F10:
2019
-20
Revenues and Expenditures
Escalate at 6%Revenues and Expenditures
Escalate at 3%
Table 8Great Park 10-Year Cash Flow Forecast - Stress Test at 3% & 6% Inflation
The CFD maintenance and operations support provides for up to $9.5 million of maintenance and operations funding (on an as needed basis) starting in FY 2014-15, but the growth rate of this revenue source is capped in the Amended and Restated Development Agreement at 3% per year. Additionally, under an assumed 6% annual inflation rate for all Great Park costs, the CFD Guaranteed Amount cap of $9.5 million, beginning in FY 2014-15 and escalated at 3%, is surpassed by rapidly inflating maintenance and operations costs. As
- 52 -
Estimated Fiscal Year End

Business Plan SummaryOrange County Great Park Corporation
noted on the graph above, over the projection period of this forecast the cumulative impact of sustained annual 6% cost increases begins to erode the projected cash balance.
ConclusionThe Business Plan attempts to demonstrate fiscal sustainability assuming all revenues and expenditures occur as estimated in this plan. It should be noted this plan attempts to chart a fiscal path for a full five years longer than the plan presented and adopted for the City of Irvine. Significant deviations from estimations can be expected the further into the future the plan reaches, therefore consistent with the City of Irvine’s Strategic Business Plan approach, this plan will be updated annually and estimates revised accordingly.
- 53 -

Appendix APrice Point and Market Absorption Study Updates
- 54 -
PRIC
EPO
INT
AN
DM
AR
KE
TA
BSO
RPT
ION
STU
DY
UPD
ATE
SPR
ICE
PO
INT
AN
D M
AR
KE
T A
BSO
RPT
ION
ST
UD
Y U
PDAT
ES
GR
EAT
PA
RK
-H
ER
ITA
GE
FIE
LD
S C
OM
MU
NIT
Y F
AC
ILIT
IES
DIS
TR
ICT
S
PRE
PAR
ED
BY
PRE
PAR
ED
BY:
EM
PIR
E E
CO
NO
MIC
S, IN
C.
AU
GU
ST 1
2, 2
009
1

Appendix APrice Point and Market Absorption Study Updates
- 55 -
CR
ED
EN
TIA
LS/
QU
AL
IFIC
ATIO
NS
OF
EM
PIR
E E
CO
NO
MIC
S
Empi
reEc
onom
ics
(Em
pire
)is
anec
onom
ican
dre
ales
tate
cons
ultin
gfir
mth
atsp
ecia
lizes
inpr
ovid
ing
mar
ket
abso
rptio
nan
dot
her
rela
ted
stud
ies
ON
LYfo
rpu
blic
entit
ies;
Empi
redo
esno
tpr
ovid
eco
nsul
ting
serv
ices
top
p;
pp
gde
velo
pers
/bui
lder
sin
orde
rto
avoi
dco
nflic
tsof
inte
rest
.
Dur
ing
the
past
25+
year
s,Em
pire
has
perf
orm
edsu
chco
nsul
ting
serv
ices
for5
00+
mun
icip
alta
x-ex
empt
bond
issu
esam
ount
ing
to$1
2+bi
llion
.
With
rega
rds
toO
rang
eC
ount
y,in
parti
cula
r,Em
pire
has
cond
ucte
d90
+st
udie
sfo
rla
ndse
cure
dm
unic
ipal
bond
finan
cing
sfo
rthe
Cou
nty,
citie
s,sc
hool
dist
ricts
and
spec
iald
istri
cts.
Empi
real
sope
rfor
med
Soci
oeco
nom
icFo
reca
stSt
udie
sfo
rth
e$2
.75
billi
onre
fund
ing
ofth
eSa
nJo
aqui
nH
ills
and
Foot
hill/
East
ern
Tran
spor
tatio
nC
orrid
ors’
Toll
Roa
ds.
Empi
reEc
onom
ics
has
parti
cipa
ted
innu
mer
ous
land
secu
red
finan
cing
sth
roug
hout
Sout
hern
Cal
iforn
iaco
untie
s;th
edi
strib
utio
nof
thes
eby
coun
tiesh
asbe
enas
follo
ws:
EMPI
RE
ECO
NO
MIC
S L
AN
D S
EC
UR
ED
FIN
AN
CIN
GS
BY
CO
UN
TY
Vent
ura C
ount
y$7
5M, 5
Issu
esSa
n B
erna
rdin
o C
ount
y$6
08M
41Is
sues
Los A
ngel
es C
ount
y$5
11M
, 33
Issu
es
Riv
ersid
e Cou
nty
$2,4
41M
, 186
Issu
es
$608
M, 4
1 Is
sues
Ora
nge C
ount
y$3
,281
M, 9
0 Is
sues
2Sa
n D
iego
Cou
nty
$817
M, 3
3 Is
sues

Appendix APrice Point and Market Absorption Study Updates
- 56 -
TAB
LE O
F C
ON
TEN
TS
Sect
ion
I:In
trod
uctio
n4
Sect
ion
I:
Intr
oduc
tion
……
……
……
……
……
……
……
……
……
……
……
……
……
……
……
…..4
Rat
iona
le U
nder
lyin
g P
rice
Poi
nt a
nd M
arke
t Abs
orpt
ion
Stu
dy U
pdat
es…
..……
……
……
……
…...
..5G
reat
Par
k –
Her
itage
Fie
lds:
Pre
mie
r Mix
ed-u
se P
roje
ct In
Sou
ther
n C
alifo
rnia
……
……
……
…...
..6
Sect
ion
II:R
esid
entia
lPro
duct
Upd
ates
forP
rice
Poin
tsan
dA
bsor
ptio
nSc
hedu
les…
……
.7Se
ctio
n II:
R
esid
entia
l Pro
duct
Upd
ates
for P
rice
Poin
ts a
nd A
bsor
ptio
n Sc
hedu
les…
……
.7
Upd
ated
Pric
e P
oint
s fo
r Res
iden
tial P
rodu
cts…
……
……
……
……
……
……
……
……
……
….…
..…..8
* R
ecom
men
ded
Cur
rent
Pric
e P
oint
s –
Page
s 10
-11
Maj
or S
hift
in R
ecen
t/Nea
r Ter
m R
esid
entia
l Mar
ket C
ondi
tions
……
……
……
……
……
……
……
….1
2
Upd
ated
Pric
e P
oint
Adj
ustm
ent F
acto
rs fo
r Res
iden
tial P
rodu
cts…
……
……
……
……
……
……
….1
5*
Rec
omm
ende
d P
rice
Poi
nt A
djus
tmen
t Fac
tors
–Pa
ge 1
7
Est
imat
ed A
bsor
ptio
n S
ched
ules
for t
he R
esid
entia
l Pro
duct
s……
……
……
……
……
……
……
……
18*
Est
imat
edAb
sorp
tion
Sche
dule
sby
Pla
nnin
gA
reas
Page
27
Est
imat
ed A
bsor
ptio
n Sc
hedu
les
by P
lann
ing
Are
as –
Page
27
Sect
ion
III: N
on-R
esid
entia
l Pro
duct
Upd
ates
for P
rice
Poin
ts a
nd A
bsor
ptio
n Sc
hedu
les…
.28
Upd
ated
Pric
e P
oint
s fo
r the
Non
-Res
iden
tial P
rodu
cts…
……
……
……
……
……
……
……
……
…...
..29
* R
ecom
men
ded
Cur
rent
Pric
e P
oint
s –
Page
30
g
Maj
or S
hift
in R
ecen
t/Nea
r Ter
m E
cono
mic
-Em
ploy
men
t Con
ditio
ns in
Ora
nge
Cou
nty…
……
….…
.31
Upd
ated
Pric
e P
oint
Adj
ustm
ent F
acto
rs fo
r Non
-Res
iden
tial P
rodu
cts…
……
……
……
……
……
......
.32
* R
ecom
men
ded
Pric
e P
oint
Tim
e A
djus
tmen
t Fac
tors
–Pa
ge 3
3
3
Est
imat
ed A
bsor
ptio
n S
ched
ules
for t
he N
on-R
esid
entia
l Pro
duct
s……
……
……
……
……
……
..…...
34*
Est
imat
ed A
bsor
ptio
n S
ched
ules
–Pa
ge 3
8

Appendix APrice Point and Market Absorption Study Updates
- 57 -
Sect
ion
I:In
trod
uctio
nSe
ctio
n I:
In
trod
uctio
n
Rat
iona
leU
nder
lyin
gP
rice
Poi
ntan
dM
arke
tAbs
orpt
ion
Stu
dyU
pdat
esR
atio
nale
Und
erly
ing
Pric
e Po
int a
nd M
arke
t Abs
orpt
ion
Stud
y U
pdat
es
Gre
at P
ark
–H
erita
ge F
ield
s: P
rem
ier M
ixed
-use
Pro
ject
In S
outh
ern
Cal
iforn
ia
4

Appendix APrice Point and Market Absorption Study Updates
- 58 -
RAT
ION
ALE
UN
DER
LYIN
G T
HE
PR
ICE
POIN
T A
ND
MA
RK
ET A
BSO
RPT
ION
STU
DY
UPD
ATES
The
Orig
inal
Pric
e Po
int a
nd M
arke
t Abs
orpt
ion
Stud
ies f
or th
e G
reat
Par
k –
Her
itage
Fie
lds (
GP-
HF)
C
omm
unity
Fac
ilitie
s Dis
trict
s tha
t wer
e pe
rfor
med
dur
ing
Sum
mer
200
8co
rrec
tly a
ntic
ipat
ed a
Maj
or H
ousi
ng M
arke
t Adj
ustm
ent,
di
td
thi
it
thR
dd
Pi
Pi
td
Eti
td
Ab
tiS
hd
lan
d in
corp
orat
ed th
is in
to th
e R
ecom
men
ded
Pric
e Po
ints
and
Est
imat
ed A
bsor
ptio
n Sc
hedu
les.
How
ever
, the
ant
icip
ated
hou
sing
mar
ket a
djus
tmen
ts w
ere
exac
erba
ted
by th
e un
expe
cted
liqu
idity
cris
is in
th
e fin
anci
al m
arke
ts d
urin
g Fa
ll 20
08 to
Win
ter 2
009,
whi
ch c
ause
d a
muc
h br
oade
r and
dee
per e
cono
mic
re
cess
ion ,
with
sign
ifica
nt e
mpl
oym
ent l
osse
s.,
gp
y
----
----
----
----
----
----
----
----
----
----
----
----
----
----
----
----
----
----
----
----
----
----
----
----
----
----
----
----
----
----
----
-
The
Pric
e Po
int a
nd M
arke
t Abs
orpt
ion
Stud
y U
pdat
es a
re b
ased
upo
n th
e fo
llow
ing:
Em
pire
Eco
nom
ics (
Em
pire
)Fo
unda
tion:
Com
preh
ensi
ve P
rior P
rice
Poin
t and
Mar
ket A
bsor
ptio
n St
udie
s dur
ing
Sum
mer
200
8M
odifi
catio
ns:
Upd
ates
of E
cono
mic
, Fin
anci
al, a
nd R
eal E
stat
e M
arke
t Con
ditio
ns si
nce
Sum
mer
200
8
Her
itage
Fie
lds -
Len
nar
Hom
esR
esid
entia
l Pro
duct
Mix
Cha
ract
eris
tics:
Pric
es/V
alue
s, Sq
uare
Foo
tage
s –D
ated
Feb
ruar
y 20
09R
evis
ed M
arke
t-Ent
ry T
ime
–N
OT
Prov
ided
.
The
Upd
ates
utili
zeth
eor
igin
alst
udie
sdur
ing
Sum
mer
2008
asa
foun
datio
nan
dth
enfo
cusu
pon
the
5
The
Upd
ates
util
ize
the
orig
inal
stud
ies d
urin
g Su
mm
er 2
008
as a
foun
datio
n, a
nd th
en fo
cus u
pon
the
rele
vant
cha
nges
in th
e ec
onom
ic, f
inan
cial
and
real
est
ate
cond
ition
s sin
ce S
umm
er 2
008,
so th
at th
e es
timat
ed P
rice
Poin
ts a
nd e
stim
ated
Abs
orpt
ion
Sche
dule
s are
tim
ely .

Appendix APrice Point and Market Absorption Study Updates
- 59 -
GR
EAT
PAR
K –
HER
ITA
GE
FIEL
DS
PREM
IER
MIX
ED-U
SE P
RO
JEC
T IN
SO
UTH
ERN
CA
LIFO
RN
IA
City
ofIr
vine
Exce
llent
repu
tatio
nam
ong
Ora
nge
Cou
nty
citie
sfo
rits
high
calib
erlif
esty
lean
dem
ploy
men
top
portu
nitie
s.Ve
ryH
igh
Educ
atio
nalQ
ualit
yV
LC
iR
tVe
ryLo
wC
rime
Rat
e.
Gre
atPa
rk–
Her
itage
Fiel
dsC
ompe
titiv
eM
arke
tAre
a(G
P-H
FC
MA
):(Ir
vine
,Eas
terly
ofR
t.5)
Exce
llent
acce
ssib
ility
via
mul
tiple
free
way
s.M
ajor
empl
oym
entc
ente
rwith
near
byre
tail
and
recr
eatio
nalo
ppor
tuni
ties
Maj
orem
ploy
men
tcen
terw
ithne
arby
reta
ilan
dre
crea
tiona
lopp
ortu
nitie
s.N
ewly
Dev
elop
ing
Res
iden
tialA
rea:
Hig
hQ
ualit
yPl
anne
dC
omm
uniti
esw
ithC
opio
usA
men
ityPa
ckag
esPr
ices
inth
eG
P-H
FC
MA
have
decl
ined
bym
uch
LESS
than
asfo
rOC
,asa
who
le.
Perc
enta
geof
hom
eow
ners
inth
eG
P-H
FC
MA
unde
rdur
essm
uch
low
erth
anfo
rO
C,a
saw
hole
.
Gre
at P
ark
–H
erita
ge F
ield
sFe
atur
es th
e “G
reat
Par
k” w
hich
will
offe
r num
erou
s rec
reat
iona
l, cu
ltura
l, an
d ot
her a
ctiv
ities
Entit
lem
ents
–Se
cure
d: A
ppro
vals
of t
he O
verla
y Pl
an b
y G
P-H
F ha
ve b
een
secu
red
from
the
City
of
Irvi
ne.
Bro
ad D
iver
sity
of R
esid
entia
l Pro
duct
s: A
ttach
ed a
nd D
etac
hed
Hou
sing
Pro
duct
s in
Vario
us P
rice
Ran
ges.
Non
-Res
iden
tial P
rodu
cts:
Edu
catio
nal F
acili
ties,
Offi
ce, R
esea
rch/
Dev
elop
men
t, an
d R
etai
l, am
ong
man
y ot
hers
.In
fras
truct
ure
–R
eady
to P
roce
ed w
ith C
onst
ruct
ion:
The
pla
ns fo
r the
dev
elop
men
t of t
he b
ackb
one
infr
astru
ctur
ere
quire
dto
supp
ortt
heco
nstru
ctio
n/oc
cupa
ncy
ofth
eho
mes
have
been
appr
oved
byth
eC
ity
6
infr
astru
ctur
e re
quire
d to
supp
ort t
he c
onst
ruct
ion/
occu
panc
y of
the
hom
es h
ave
been
app
rove
d b
y th
e C
ity
of Ir
vine
.

Appendix APrice Point and Market Absorption Study Updates
- 60 -
Sect
ion
II:
Res
iden
tial P
rodu
ct U
pdat
es fo
r Pric
e Po
ints
and
Abs
orpt
ion
Sche
dule
sp
Upd
ated
Pric
eP
oint
sfo
rRes
iden
tialP
rodu
cts
Upd
ated
Pric
e P
oint
s fo
r Res
iden
tial P
rodu
cts
Maj
or S
hift
in R
ecen
t/Nea
r Ter
m R
esid
entia
l Mar
ket C
ondi
tions
Upd
ated
Pric
e P
oint
Adj
ustm
ent F
acto
rs fo
r Res
iden
tial P
rodu
cts
Est
imat
ed A
bsor
ptio
n S
ched
ules
for t
he R
esid
entia
l Pro
duct
s
7

Appendix APrice Point and Market Absorption Study Updates
- 61 -
UPD
ATE
D P
RIC
E P
OIN
TS
FOR
RE
SID
EN
TIA
L PR
OD
UC
TS
ToUpdatethePricePointsfortheResidentialProductsinGP-HF,whichareutilizedtosetSpecialTaxes
fthft
htht
if
iththCit
fIi’
lii
Ei
tilidth
forthefuturehomeownersthatareinconformancewiththeCityofIrvine’spolicies,Empireutilizedthe
followingprocedure:
ConductedmarketsurveysofthecurrentlyactivecomparableprojectsintheCompetitiveMarket
A(CMA)thPl
dC
itifW
dbW
dbEt
dPtlSi
Area(CMA)–thePlannedCommunitiesofWoodbury,WoodburyEast,andPortolaSprings.
Thepricesofthehomesinthecomparableprojectsthathavebeenonthemarketfor
morethanayearhavedeclinedbyabout-9%,ontheaverage,sinceSummer2008.
However,anewprojectthatjustenteredthemarketjustrecentlyinWoodbury-East,Ivy,
hi
tht
hl
thth
kt
blhaspricesthataremuchlowerthanthemarketcomparables.
Performedacompetitivemarketanalysisoftheproposedpricesfortheforthcomingproductsin
GP-HF,consideringtheirlivingareasandlevelsofspecialtaxes.
ThddPi
PitbE
if
ttiS
ilT
tht
if
ithth
TherecommendedPricePointsbyEmpireforsettingSpecialTaxesthatareinconformancewiththe
City’spoliciesamounttoabout$704,317,ontheaverage.
ThePricePointsrecommendedbyEmpirearesomewhatlowerthanthoseproposedbyLennarforGP-
HF
hih
idd
fFb
2009
diff
fbt31%
thHF,whichwereprovidedasofFebruary2009,adifferenceofabout-3.1%,ontheaverage.
Additionally,baseduponextensiveresearchregardingthemarketsensitivityofvariousmarketsegments
toSpecialTaxes,Empirehasthefollowingtworecommendations:
Fi
thilt
bd
hld
td15%
8
Forseniors,thespecialtaxburdenshouldnotexceed1.5%.
Forhigher-pricedhomes,theamountofthespecialtaxesshouldnotexceed$15,000/yr.
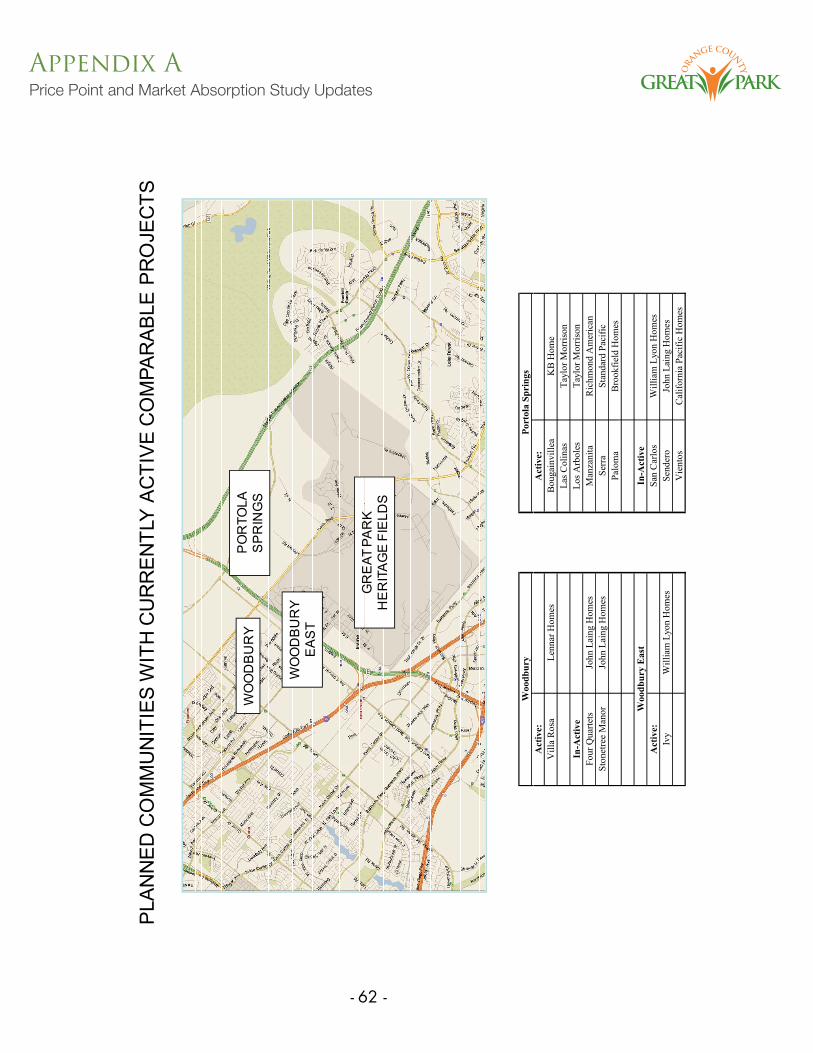
Appendix APrice Point and Market Absorption Study Updates
- 62 -
PLA
NN
ED
CO
MM
UN
ITIE
S W
ITH
CU
RR
EN
TLY
AC
TIV
E C
OM
PAR
AB
LE P
RO
JEC
TS
PO
RTO
LA
SP
RIN
GS
WO
OD
BU
RY
GR
EAT
PAR
K
WO
OD
BU
RY
EA
ST
GR
EAT
PA
RK
HE
RIT
AG
E F
IELD
S
Woo
dbur
yPo
rtol
a Sp
ring
sA
ctiv
e:A
ctiv
e:V
illa
Ros
aLe
nnar
Hom
esB
ouga
invi
llea
KB
Hom
eLa
s Col
inas
Tayl
or M
orris
onIn
-Act
ive
Los A
rbol
esTa
ylor
Mor
rison
Four
Qua
rtets
John
Lai
ng H
omes
Man
zani
taR
ichm
ond
Am
eric
anSt
onet
ree
Man
orJo
hn L
aing
Hom
esSe
rra
Stan
dard
Pac
ific
Palo
ma
Bro
okfie
ldH
omes
9
Palo
ma
Bro
okfie
ld H
omes
Woo
dbur
y E
ast
In-A
ctiv
eA
ctiv
e:Sa
n C
arlo
sW
illia
m L
yon
Hom
esIv
yW
illia
m L
yon
Hom
esSe
nder
oJo
hn L
aing
Hom
esV
ient
osC
alifo
rnia
Pac
ific
Hom
es

Appendix APrice Point and Market Absorption Study Updates
- 63 -
Rec
omm
ende
d P
rices
for t
he R
esid
entia
l Pro
duct
s: P
art 1
Plan
ning
Prod
uct
Prod
uct
Uni
tsL
ivin
g A
reas
GP-
HF
Spec
ial T
axC
ompa
riso
n: E
mpi
re v
s. D
evel
oper
Are
asD
escr
iptio
nT
ypes
(Est
imat
ed)
(Ave
rage
)Pr
ices
Max
. Tot
al =
2.0
0%Pe
rcen
tage
Rec
omm
ende
dFe
brua
ry20
091
22%
Diff
eren
ceB
ase
Pric
es
.Feb
ruar
y 20
09.
1.22
%D
iffer
ence
Bas
e Pr
ices
(Ave
rage
)
L29a
Bro
wns
tone
Atta
ched
301,
215
$449
,996
0.78
%-1
0.2%
$403
,999
L30b
Bro
wns
tone
Atta
ched
211,
215
$449
,996
0.78
%-1
0.2%
$403
,999
L36a
Bro
wns
tone
Atta
ched
301,
215
$449
,996
0.78
%-1
0.2%
$403
,999
L37b
Bro
wns
tone
Atta
ched
281,
215
$449
,996
0.78
%-1
0.2%
$403
,999
L42b
Bro
wns
tone
Atta
ched
81,
215
$449
,996
0.78
%-1
0.2%
$403
,999
L31
Bro
wns
tone
Atta
ched
116
1,21
5$4
49,9
960.
78%
-10.
2%$4
03,9
99
L32
Gre
en C
ourt
Atta
ched
921,
350
$486
,141
0.78
%-8
.9%
$443
,092
L33
SFD
Clu
ster
Det
ache
d86
1,85
0$6
20,0
100.
78%
-5.2
%$5
87,8
82
L34
Row
TH
Atta
ched
541,
600
$553
,075
0.78
%-6
.8%
$515
,487
L38
Gre
en C
ourt
Atta
ched
801,
350
$486
,141
0.78
%-8
.9%
$443
,092
L40
Row
TH
Atta
ched
331,
600
$553
,075
0.78
%-6
.8%
$515
,487
L23a
45x9
5 A
lley
w/s
tudi
oD
etac
hed
103
2,60
0$8
20,8
150.
78%
-1.9
%$8
05,0
66
L23b
40x9
0 U
rban
Alle
yD
etac
hed
632,
700
$847
,589
0.78
%-1
.6%
$834
,024
L25
Cou
rtyar
d L
uxur
y Fl
ats
Atta
ched
931,
850
$620
,010
0.78
%-5
.2%
$587
,882
L27a
Cou
rtyar
d L
uxur
y Fl
ats
Atta
ched
151,
850
$620
,010
0.78
%-5
.2%
$587
,882
L27b
40x9
0 U
rban
Alle
yD
etac
hed
462,
700
$847
,589
0.78
%-1
.6%
$834
,024
L27c
Row
TH
Atta
ched
901,
600
$553
,075
0.78
%-6
.8%
$515
,487
L2Se
nior
4 P
lex
Atta
ched
561,
155
$433
,931
0.28
%-6
.1%
$407
,448
L34
Plex
Atta
ched
132
1,85
0$6
20,0
100.
78%
-5.2
%$5
87,8
82
L6Se
nior
4 P
lex
Atta
ched
581,
155
$433
,931
0.28
%-6
.1%
$407
,448
,$
,%
%$
,
L14a
-b50
x105
Det
ache
d63
2,85
0$8
87,7
490.
78%
-1.2
%$8
77,4
60
L14c
55x1
05D
etac
hed
593,
200
$981
,458
0.78
%-0
.3%
$978
,813
L14d
-e42
x90
Alle
yD
etac
hed
612,
190
$710
,908
0.78
%-3
.5%
$686
,194
L14f
Man
sion
Trip
lex
Atta
ched
451,
550
$539
,688
0.78
%-7
.2%
$501
,008
L16
Man
sion
Trip
lex
Atta
ched
541,
550
$539
,688
0.78
%-7
.2%
$501
,008
L17
42x9
0A
lley
Det
ache
d91
219
0$7
1090
80
78%
-35%
$686
194
10
L17
42x9
0 A
lley
Det
ache
d91
2,19
0$7
10,9
080.
78%
-3.5
%$6
86,1
94
L18a
42x9
0 A
lley
Det
ache
d26
2,19
0$7
10,9
080.
78%
-3.5
%$6
86,1
94
L18b
SFD
Clu
ster
Det
ache
d98
1,85
0$6
20,0
100.
78%
-5.2
%$5
87,8
82
L18c
Man
sion
Trip
lex
Atta
ched
481,
550
$539
,688
0.78
%-7
.2%
$501
,008
L19
Man
sion
Trip
lex
Atta
ched
841,
550
$539
,688
0.78
%-7
.2%
$501
,008

Appendix APrice Point and Market Absorption Study Updates
- 64 -
Rec
omm
ende
d P
rices
for t
he R
esid
entia
l Pro
duct
s: P
art 2
Plan
ning
Prod
uct
Prod
uct
Uni
tsL
ivin
g A
reas
GP-
HF
Spec
ial T
axC
ompa
riso
n: E
mpi
re v
s. D
evel
oper
Are
aD
escr
iptio
nT
ypes
(Est
imat
ed)
(Ave
rage
)Pr
ices
Max
. Tot
al =
2.0
0%Pe
rcen
tage
Rec
omm
ende
d
.F
ebru
ary
2009
.1.
22%
Diff
eren
ceB
ase
Pric
es
(Ave
rage
)
L20
45x9
5 A
lley
w/s
tudi
oD
etac
hed
842,
600
$820
,815
0.78
%-1
.9%
$805
,066
L21
42x9
0 A
lley
Det
ache
d32
2,19
0$7
10,9
080.
78%
-3.5
%$6
86,1
94
P1a
Dup
lex
Atta
ched
413,
000
$927
,910
0.78
%-0
.8%
$920
,897
P1b
Dup
lex
Atta
ched
413,
000
$927
,910
0.78
%-0
.8%
$920
,897
P1c
Dup
lex
Atta
ched
573,
000
$927
,910
0.78
%-0
.8%
$920
,897
P2a
6 Pa
cD
etac
hed
412,
600
$820
,815
0.78
%-1
.9%
$805
,066
P2b
6 Pa
cD
etac
hed
742,
600
$820
,815
0.78
%-1
.9%
$805
,066
P380
x95
Det
ache
d60
3,00
0$9
27,9
100.
78%
-0.8
%$9
20,8
97
P490
x95
Det
ache
d59
3,20
0$9
81,4
580.
78%
-0.3
%$9
78,8
13
P5C
ourty
ard
Atta
ched
912,
450
$780
,654
0.78
%-2
.4%
$761
,629
P6a
80x9
5D
etac
hed
553,
000
$927
,910
0.78
%-0
.8%
$920
,897
P6b
80x9
5D
etac
hed
123,
000
$927
,910
0.78
%-0
.8%
$920
,897
P790
x95
Det
ache
d52
3,20
0$9
81,4
580.
78%
-0.3
%$9
78,8
13
P810
0x15
0D
etac
hed
165,
500
$1,5
97,2
580.
78%
3.0%
$1,6
44,8
44
P10
SFD
70x
100
Det
ache
d15
63,
350
$1,0
21,6
190.
78%
0.1%
$1,0
22,2
50
hd
$%
%$
P11
75x1
00D
etac
hed
393,
650
$1,1
01,9
410.
78%
0.7%
$1,1
09,1
23
P12
SFD
100
x120
Det
ache
d73
5,10
0$1
,490
,162
0.78
%2.
6%$1
,529
,012
P13
SFD
110
x150
Det
ache
d32
5,60
0$1
,624
,032
0.78
%3.
1%$1
,673
,802
P14
SFD
85x
120
Det
ache
d87
4,60
0$1
,356
,293
0.78
%2.
1%$1
,384
,223
P15
SFD
75x
110
Det
ache
d83
3,65
0$1
,101
,941
0.78
%0.
7%$1
,109
,123
P9ai
Larg
eD
etac
hed
198,
000
$2,2
66,6
060.
78%
4.5%
$2,3
68,7
91
P9bi
Larg
eD
etac
hed
128
000
$226
660
60
78%
45%
$236
879
1P9
biLa
rge
Det
ache
d12
8,00
0$2
,266
,606
0.78
%4.
5%$2
,368
,791
T8a-
bTi
mbe
rhill
Atta
ched
901,
668
$571
,282
0.78
%-6
.3%
$535
,178
T8c
Cou
rtyar
d (8
-pac
k)D
etac
hed
801,
302
$473
,289
0.78
%-9
.3%
$429
,192
T8d-
fTo
wnh
ome
(Cam
den)
Atta
ched
111
1,60
0$5
53,0
750.
78%
-6.8
%$5
15,4
87
T8g-
kZe
ro L
ot L
ine
Det
ache
d82
1,92
7$6
40,6
260.
78%
-4.8
%$6
10,1
79
T9a-
cD
uple
xA
ttach
ed11
22,
015
$664
,188
0.78
%-4
.3%
$635
,662
T9d-
kSF
DD
etac
hed
120
249
8$7
9350
60
78%
-23%
$775
529
11
T9d-
kSF
DD
etac
hed
120
2,49
8$7
93,5
060.
78%
-2.3
%$7
75,5
29
T11a
-cM
otor
cour
tA
ttach
ed18
01,
272
$465
,257
0.78
%-9
.6%
$420
,505
T15a
-gTo
wnh
ome
(Cam
den)
Atta
ched
437
1,60
0$5
53,0
750.
78%
-6.8
%$5
15,4
87
Tot
als/
Ave
rage
s:
604,
291
2,25
0$7
27,1
530.
77%
-3.1
%$7
04,3
17

Appendix APrice Point and Market Absorption Study Updates
- 65 -
MA
JOR
SH
IFT
IN R
EC
EN
T/N
EA
R-T
ER
M
RE
SID
EN
TIA
L M
AR
KE
T C
ON
DIT
ION
S
Rec
ently
,ane
wpr
ojec
t,Iv
y,by
Willi
amLy
onC
ompa
nyen
tere
dth
em
arke
tpla
cein
Woo
dbur
yE
ast,
offe
ring
hom
esat
sign
ifica
ntly
low
erpr
ices
than
the
mar
ketc
ompa
rabl
es.A
com
paris
onof
the
curre
ntpr
ices
for
the
hom
esin
Ivy
with
pric
esfo
rho
mes
ina
com
para
ble
proj
ecta
sof
July
2008
byth
esa
me
build
erre
veal
sth
atth
ecu
rrent
pric
esar
elo
wer
byso
me
-21%
July
2008
byth
esa
me
build
erre
veal
sth
atth
ecu
rrent
pric
esar
elo
wer
byso
me
21%
.
Sin
ceth
eC
MA
has
ala
rge
supp
lyof
entit
led
lots
with
mos
toft
heir
infra
stru
ctur
eim
prov
emen
tsin
plac
e,th
eex
pect
atio
nis
that
asad
ditio
nalp
roje
cts
ente
rthe
mar
ketp
lace
,the
irpr
oduc
tsm
ayal
sobe
pric
edbe
low
the
curre
ntm
arke
tcom
para
bles
asw
ell.
This
expe
ctat
ion
issu
ppor
ted
bya
rece
ntar
ticle
inth
eO
rang
eC
ount
yB
usin
ess
Jour
nalw
hich
disc
usse
san
“Exe
cutiv
eB
uild
erP
rogr
am”
byth
eIrv
ine
Com
pany
that
cont
empl
ates
payi
ngse
lect
build
ers
a“fi
xed
fee”
toco
nstru
ct/m
arke
thom
es.
-----------------------------------------------------------------------------------------------------------------------------
As
pros
pect
ive
purc
hase
rsre
spon
dto
the
low
erpr
ices
for
the
new
proj
ects
,the
rew
illbe
pric
epr
essu
res
plac
edon
othe
rseg
men
tsof
the
mar
ketp
lace
:
Cur
rent
lyAc
tive
Com
para
ble
Pro
ject
sw
illne
edto
furth
erdi
scou
ntpr
ices
/pro
vide
Cur
rent
lyAc
tive
Com
para
ble
Pro
ject
sw
illne
edto
furth
erdi
scou
ntpr
ices
/pro
vide
ince
ntiv
esto
attra
ctpu
rcha
sers
.H
owev
er,
thei
rab
ility
todo
som
aybe
cons
train
ed,
sinc
eth
eypr
evio
usly
purc
hase
dth
eirl
ots
athi
gher
pric
es.
Exi
stin
gH
omeo
wne
rsth
atar
ese
lling
will
also
need
todi
scou
ntth
eir
pric
esto
attra
cth
Hth
bt
id
bh
hth
li
d 12
purc
hase
rs.H
owev
er,t
hey
may
beco
nstra
ined
byho
wm
uch
they
can
low
erpr
ices
due
toth
eire
xist
ing
loan
bala
nces
.

Appendix APrice Point and Market Absorption Study Updates
- 66 -
IMPA
CT
OF
“IVY
” ON
TH
E M
AR
KE
T FO
R *
NE
W*
HO
ME
S
THE
PR
ICE
S F
OR
NEW
HO
ME
S IN
TH
E C
MA
AR
E E
XP
EC
TED
TO
CO
ME
UN
DER
PR
ESSU
RE,
AS
MO
RE
PRO
JEC
TS E
NTE
R T
HE
MAR
KETP
LAC
E W
ITH
MU
CH
LO
WE
R P
RIC
E P
OIN
TS.
CO
MPA
RIS
ON
OF
PRIC
E P
OIN
TS:
JU
LY 2
008
TO
JU
LY 2
009
PRO
JEC
TS
IN T
HE
GP-
HF-
CM
A B
Y W
ILL
IAM
LY
ON
HO
ME
S*C
OM
PAR
ING
HO
ME
SW
ITH
SIM
ILA
RSI
ZE
SO
FL
IVIN
GA
RE
AS*
$494
,222
$387
657
$500
,000
$600
,000
*CO
MPA
RIN
G H
OM
ES
WIT
H S
IMIL
AR
SIZ
ES
OF
LIV
ING
AR
EA
S*
$387
,657
$300
,000
$400
,000
$0
$100
,000
$200
,000
CHANGE
21%
($10
6,56
6)($
200
000)
($10
0,00
0)$0
13
($20
0,00
0)Ju
ly-2
008:
San
Car
los
W
illia
m L
yon
Hom
esJu
ly-2
009:
Ivy
W
illia
m L
yon
Hom
esPr
ice C
hang
e

Appendix APrice Point and Market Absorption Study Updates
- 67 -
IMPA
CT
OF
“IVY
ON
TH
E M
AR
KE
T FO
R *
EX
ISTI
NG
* H
OM
ES
THE
PR
ICE
S F
OR
EXI
STIN
G H
OM
ES
IN T
HE
CM
A A
RE
EX
PE
CTE
D T
O C
OM
E U
ND
ER
PR
ES
SU
RE
, A
SN
EW
PR
OJE
CTS
EN
TER
THE
MA
RK
ETP
LAC
EW
ITH
LOW
ER
PR
ICE
PO
INTS
AS
NE
W P
RO
JEC
TS E
NTE
R T
HE
MA
RK
ETP
LAC
E W
ITH
LO
WE
R P
RIC
E P
OIN
TSA
SIG
NIF
ICA
NT
PR
OP
OR
TIO
N O
F TH
ES
E H
OM
EO
WN
ER
S M
AY N
OW
HAV
E N
EG
ATIV
E E
QU
ITY.
MARKE
TPR
ICES/SALESFO
RWOODBU
RYCO
NDOMINIUMS
RECENTMARK
ETEN
TRYOF"IVY
"WITHLO
WER
PRICES
MAY
RESU
LTIN
NEG
ATIVEEQ
UITYFO
RMANYEX
ISTINGHOMEO
WNER
S
$644,950
$668,594
$634,449
$558,500
$538,800
$507,436
1,80
0
2,00
0
$600
,000
$700
,000
$800
,000
NAMOUNTS
MAY
RESU
LTIN
NEG
ATIVEEQ
UITYFO
RMANYEX
ISTINGHOMEO
WNER
S
SALESPR
ICEFO
RIVY;1,500SQ
.FT.;$423,000
$477,287
$507,436
$462,816
$357,044
$330,395
1,20
0
1,40
0
1,60
0
$200
,000
$300
,000
$400
,000
$500
,000
SPRICESANDLOAN
600
800
1,00
0
$200
000
$100
,000$0
$100
,000
NGSALES
SALE
IVY'SPR
ICES
ARE
*BELOW*SA
LESPR
ICES
ANDALSOBELO
WORIGINALLOANAMOUNTS
MOST
OFTH
ESEHOMEO
WNERSHAVENEG
ATIVEEQ
UITY
IVY'SPR
ICES
ARE
*BELOW*SA
LESPR
ICES
MOST
OFTH
ESEHOMEO
WNERSSTILLHAVE
POSITIVEEQ
UITYBU
TTH
EYMAYNOT
394
324
5951
30
200
400
$500
,000
$400
,000
$300
,000
$200
,000
NUMBEROFHOUSI
RECO
UPTH
EIRORIGINALP
URC
HASE
PRICES
14
0$6
00,000
2005
2006
2007
2008
.Jan
June
2009
SALESPR
ICES
LOANAMOUNTS
HOUSINGSA
LES

Appendix APrice Point and Market Absorption Study Updates
- 68 -
UPD
ATE
D P
RIC
E P
OIN
T A
DJU
STM
EN
T FA
CTO
RS
FOR
RE
SID
EN
TIA
L PR
OD
UC
TS
SincetheGP-HFFinancialPlancontemplatesaseriesofBondOfferingsduringtheforeseeablefuture,the
CurrentPricePointsareexpectedtobe“adjusted”tothemarketconditionsatthetimesthatthespecific
BondsareIssued.Toarriveattheestimated“adjustment”factors,Empireconsideredthefollowingfactors:
CityofIrvine:HighEducationalQualityandVeryLowCrimeRate.
NewlyDevelopingArea:HighCaliberPlannedCommunitieswithCopiousAmenityPackages.
HomeownerswithInitialSignificantAmountsofEquity:
TypicalInitialLoantoValueof69%;so,equityof31%.
ForeclosureActivity:SignificantlybelowlevelsforOrangeCounty,asawhole.
ForeclosureActivity:SignificantlybelowlevelsforOrangeCounty,asawhole.
RecentHousingPriceTrends–PastYear:
HousingpricesforOrangeCounty(OC),asawhole,havedeclinedbysome-21%.
HousingpricesfortheGP-HFCMAhavedeclinedbyonly-9%,ontheaverage.
HousingpricesfortheGPHFCMAhavedeclinedbyonly9%,ontheaverage.
How
ever
,ho
usin
gpr
ices
inth
eC
MA
are
expe
cted
toco
me
unde
rm
ore
pres
sure
asne
wpr
ojec
tsw
ithsi
gnifi
cant
lylo
wer
pric
esen
ter
the
mar
ketp
lace
.
15

Appendix APrice Point and Market Absorption Study Updates
- 69 -
POT
EN
TIA
L N
EA
R-T
ER
M P
RIC
E C
HA
NG
ES
FOR
HO
ME
S IN
TH
E G
P-H
F C
MA
ThepricesforhomesinresidentialprojectsintheGP-HFCMAthatenterthemarketplaceinthenear-termmay
dli
iifi
tld
tthfll
ift
declinesignificantly,duetothefollowingfactors.
RecentPriceChanges:
ThebuilderforIvy,WilliamLyonHomes,whichjustrecentlyenteredthemarketplace,isthesamebuilder
asfortheSanCarlosaprojectwhichwasactiveinJuly2008ThecurrentpricesforIvyforsimilarsized
asfortheSanCarlos,aprojectwhichwasactiveinJuly2008.ThecurrentpricesforIvy,forsimilarsized
homes,aresome-21%
belowtheJuly2008pricesforSanCarlos.
(Note:SanCarlosmodelshaveclosed;theremaininglotshavegonebacktoTheIrvineCompany.)
SupplyofNewHomesforPropertieswith“Completed”Infrastructure:
Therearefiveprojectsthathavebeenputonholdduetobuilderbankruptciesbuilders
Therearefiveprojectsthathavebeenputonholdduetobuilderbankruptcies,builders
decliningremaininglotsorbankownedlots;thesehaveanother4
28lo
tsforfuturehomes.
Woodbury,whichhascompletedmostofitsbackboneinfrastructureaswellasvarious
on-siteimprovements,hasthepotentialforanothere
stim
ated
1,00
0lo
tsforfuturehomes.
WoodburyEast,whichhasalsocompletedmostofitsbackboneinfrastructureaswellasvarious
WoodburyEast,whichhasalsocompletedmostofitsbackboneinfrastructureaswellasvarious
on-siteimprovements,hasthepotentialfor
anot
her
500
lotsforfuturehomes(includingIvy).
The
refo
re,t
here
are
abou
t1,9
28lo
ts/p
rope
rtie
stha
thav
em
osto
fthe
infr
astr
uctu
reso
that
they
are
read
yto
com
men
ceco
nstr
uctio
nof
the
hom
es,a
ndto
the
exte
ntth
atsu
chpr
ojec
tsar
epr
iced
sim
ilar
toIv
y,th
enth
eir
pric
esco
uld
beco
nsid
erab
lybe
low
the
curr
ently
activ
epr
ojec
ts.
TheGP-HFCMAhasrecentlyperformedfavorably,onacomparativebasis;however,consideringtherecentmarket
entryofIvyaswellasanother1,928“improved”lots,housingpricesareexpectedtocomeunderpressureinthenear
term.Accordingly,housingpricesareexpectedtodeclineby-12%
from
mid-2009tomid-2010,stabilizeduring
16
2011,andthenstarttoincreasein2012,returningtotheir2009levelsby2014.

Appendix APrice Point and Market Absorption Study Updates
- 70 -
RE
CO
MM
EN
DE
D P
RIC
E A
DJU
STM
EN
T F
AC
TO
RS
FOR
TH
E R
ESI
DE
NT
IAL
PRO
DU
CT
S IN
TH
E G
P-H
F C
FDS
140%
150%
009 = 100%
EMPIRE'SINITIALRECO
MMEN
DED
PRICES;JULY
2009
120%
130%
OINT FOR 20
EMPIRE'SINITIALRECO
MMEN
DED
PRICES;JULY
2009
100%
110%
ENT PRICE PO
ADJUSTED
PRICES
ABOVE
THE
INITIALRECO
MMEN
DED
PRICES
90%
100%
CURRE
ADJUSTED
PRICES
BELO
WTH
EINITIALRECO
MMEN
DED
PRICES
2009
20
10
2011
20
12
2013
20
14
2015
20
16
2017
20
18
2019
20
20
Pric
e A
djus
tmen
t Fa
ctor
s10
0.0%
88.0
%88
.0%
90.2
%94
.7%
100.
4%10
6.4%
112.
8%11
9.6%
126.
7%13
4.3%
142.
4%
80%
INITIALRECO
MMEN
DED
PRICES
17
Fact
ors

Appendix APrice Point and Market Absorption Study Updates
- 71 -
EST
IMAT
ED
AB
SOR
PTIO
N S
CH
ED
UL
ES
FOR
TH
E R
ESI
DE
NT
IAL
PRO
DU
CT
S
Theestimationoftheresidentialabsorptionschedulesinvolvesfirst,indentifyingtheprobablemarket-entry
timeandsecondlystartingatthattimeandthereaftertherelevanteconomicfinancialandrealestate
time,andsecondly,startingatthattimeandthereafter,therelevanteconomic,financialandrealestate
marketconditions;accordingly,eachoftheseisnowdiscussed.
Del
ayin
Mar
ket-
Ent
ryD
elay
in M
arke
t-E
ntry
ThepriorMarketAbsorptionStudyperformedduringSummer2008utilizedamarket-entrytimeschedule
forGP-HFthatwasprovidedbyLennarHomeswhichanticipatedhomeownerscommencingoccupancies
duringthefirsthalfof2010
duringthefirsthalfof2010.
However,sincetheinfrastructureimprovementsrequiredtosupportanearly2010market-entry
havenotyetcommenced,theexpectedmarket-entryhasapparentlybeendelayed.
Furthermore,LennarhasNOTprovidedanew,revisedmarket-entrytime.
Accordingly,theGreatParkCorporationhasdirectedEmpiretoperformananalysisoftherelevantfactors
toestimatetheprobablemarket-entrytime
18
toestimatetheprobablemarketentrytime.

Appendix APrice Point and Market Absorption Study Updates
- 72 -
CR
ITIC
AL
FAC
TOR
S U
ND
ER
LYIN
G T
HE
PR
OB
AB
LE
M
AR
KE
T-E
NT
RY
TIM
E A
ND
EST
IMAT
ED
AB
SOR
PTIO
N S
CH
ED
UL
ES
Empi
rees
timat
edth
epr
obab
lem
arke
tent
rytim
ean
dth
ees
timat
edab
sorp
tion
sche
dule
sfo
rth
ere
side
ntia
lEm
pire
estim
ated
the
prob
able
mar
ket-e
ntry
time
and
the
estim
ated
abso
rptio
nsc
hedu
les
for
the
resi
dent
ial
prod
ucts
,bas
edup
ona
cons
ider
atio
nof
the
follo
win
g:
Ent
itlem
ents
-Se
cure
dA
ppro
vals
ofth
eov
erla
ypl
anby
GP-
HF
have
been
secu
red
from
the
City
ofIr
vine
App
rova
ls o
f the
ove
rlay
plan
by
GP-
HF
have
bee
n se
cure
d fr
om th
e C
ity o
f Irv
ine.
Infr
astr
uctu
re –
Rea
dy to
Pro
ceed
with
Con
stru
ctio
nTh
e pl
ans f
or th
e de
velo
pmen
t of t
he b
ackb
one
infr
astru
ctur
e re
quire
d to
supp
ort t
heco
nstru
ctio
n/oc
cupa
ncy
ofth
eho
mes
have
been
appr
oved
byth
eC
ityof
Irvi
neco
nstru
ctio
n/oc
cupa
ncy
of th
e ho
mes
hav
e be
en a
ppro
ved
by
the
City
of I
rvin
e.
Mac
roec
onom
ic F
acto
rsTh
eex
pect
atio
nis
abr
oad
and
deep
econ
omic
rece
ssio
nw
ithhi
ghun
empl
oym
ent
thro
ugh
2010
.Th
esu
bseq
uent
econ
omic
reco
very
isex
pect
edto
bew
eak
due
to:
The
subs
eque
ntec
onom
icre
cove
ryis
expe
cted
tobe
wea
kdu
eto
:R
educ
ing
the
Fede
ralD
efic
itth
roug
hhi
gher
tax
rate
sand
/orl
ower
spen
ding
.Fe
dera
lRes
erve
Boa
rdre
-bal
anci
ngits
acco
unts
byre
-sel
ling
rece
ntly
purc
hase
dse
curit
ies.
Con
ditio
nsin
the
Ora
nge
Cou
nty
(OC
)Eco
nom
y&
Hou
sing
Mar
ket
Con
ditio
ns in
the
Ora
nge
Cou
nty
(OC
) Eco
nom
y &
Hou
sing
Mar
ket
The
OC
unem
ploy
men
trat
eha
srec
ently
clim
bed
to9.
2%,a
very
high
leve
l.H
ousi
ngpr
ices
inO
Cdu
ring
the
past
year
have
decl
ined
sign
ifica
ntly
,by
som
e-2
1%,
alth
ough
the
rate
ofde
clin
eha
srec
ently
dim
inis
hed.
Bui
ldin
gpe
rmits
forn
ewho
mes
inO
Cha
vede
clin
edby
som
e80
%fr
omth
eirp
eak
leve
ls
19
Bui
ldin
gpe
rmits
forn
ewho
mes
inO
Cha
vede
clin
edby
som
e80
%fr
omth
eirp
eak
leve
ls.
Som
e2.
1%of
the
hom
eow
ners
inO
Car
eun
derd
ures
s:de
faul
ts,f
orec
losu
reso
rban
kow
ned.
Appendix APrice Point and Market Absorption Study Updates
- 73 -
Con
ditio
ns in
the
Gre
at P
ark
Her
itage
Fie
lds (
GP-
HF)
Com
petit
ive
Mar
ket A
rea
(CM
A)
Pric
es in
the
GP-
HF
CM
A h
ave
decl
ined
by
muc
h LE
SS th
an a
s for
OC
, as a
who
le,
-9%
vs.
-21%
, res
pect
ivel
y.
How
ever
, con
side
ring
the
rece
nt m
arke
t ent
ry o
f Ivy
with
sign
ifica
ntly
low
er p
rice
s as
wel
l as a
noth
er 1
,928
lots
with
mos
t of t
heir
infr
astr
uctu
re im
prov
emen
t in
plac
e,
hous
ing
pric
es a
re e
xpec
ted
to c
ome
unde
r fu
rthe
r pr
essu
re.
Few
er h
omeo
wne
rs in
the
GP-
HF
CM
A a
re u
nder
dur
ess t
han
for O
C a
s a w
hole
,i
l1.
3% v
s. 2.
1%, r
espe
ctiv
ely.
Sale
s rat
es fo
r cur
rent
ly a
ctiv
e pr
ojec
ts h
ave
decl
ined
subs
tant
ially
, to
min
imal
leve
ls,
from
3-4
hom
es p
er p
roje
ct/m
onth
to le
ss th
an 1
hom
e pe
r pro
ject
/mon
th.
Cl
if
hi
hl
ij
di
h61
hC
losi
ngs f
or th
e ei
ght c
urre
ntly
act
ive
proj
ects
dur
ing
the
past
yea
r: 6
1 ho
mes
.
Eigh
t cur
rent
ly a
ctiv
e pr
ojec
ts h
ave
309
rem
aini
ng lo
ts/h
omes
for s
ale .
Cur
rent
ly u
nder
con
stru
ctio
n: 7
2 ho
mes
.C
li
ii
dd
iJ
lD
b20
0959
hC
losi
ng a
ntic
ipat
ed d
urin
g Ju
ly-D
ecem
ber 2
009:
59
hom
es.
Five
oth
er p
roje
cts h
ave
rece
ntly
left
the
mar
ket;
thes
e ha
d an
othe
r 428
lots
for f
utur
e ho
mes
.
Fh
hPl
dC
iifW
dbd
Wdb
Eh
b1
452
l
20
Furth
erm
ore,
the
Plan
ned
Com
mun
ities
of W
oodb
ury
and
Woo
dbur
y-Ea
st h
ave
abou
t 1,4
52 lo
tsfo
r fut
ure
hom
es(e
xclu
ding
Ivy)
that
hav
e m
ost o
f the
ir ba
ckbo
ne in
fras
truct
ure
as w
ell a
s var
ious
on-
site
impr
ovem
ents
in p
lace
.

Appendix APrice Point and Market Absorption Study Updates
- 74 -
SUPP
LYOFEN
TITLED
LOTS
WITHINFR
ASTRUCT
UREIN
THEGPHFCM
ARE
CENTABS
ORPTIONRA
TEIN
THECM
ADURINGTH
EPA
STYEAR:
61HOMES
EXPECTED
ABS
ORP
TIONDURINGJULY
DECEM
BER20
09:59
HOMES
1,000
1,00
0
1,20
0
ESTIMATED
800
TUREHOMES
428
442
600
ROFLOTSFORFUT
ESTIMATED
309
200
400
NUMBER
Currently
Activ
eProjects
ProjectsHalted
Woo
dburyEast
Woo
dbury
21
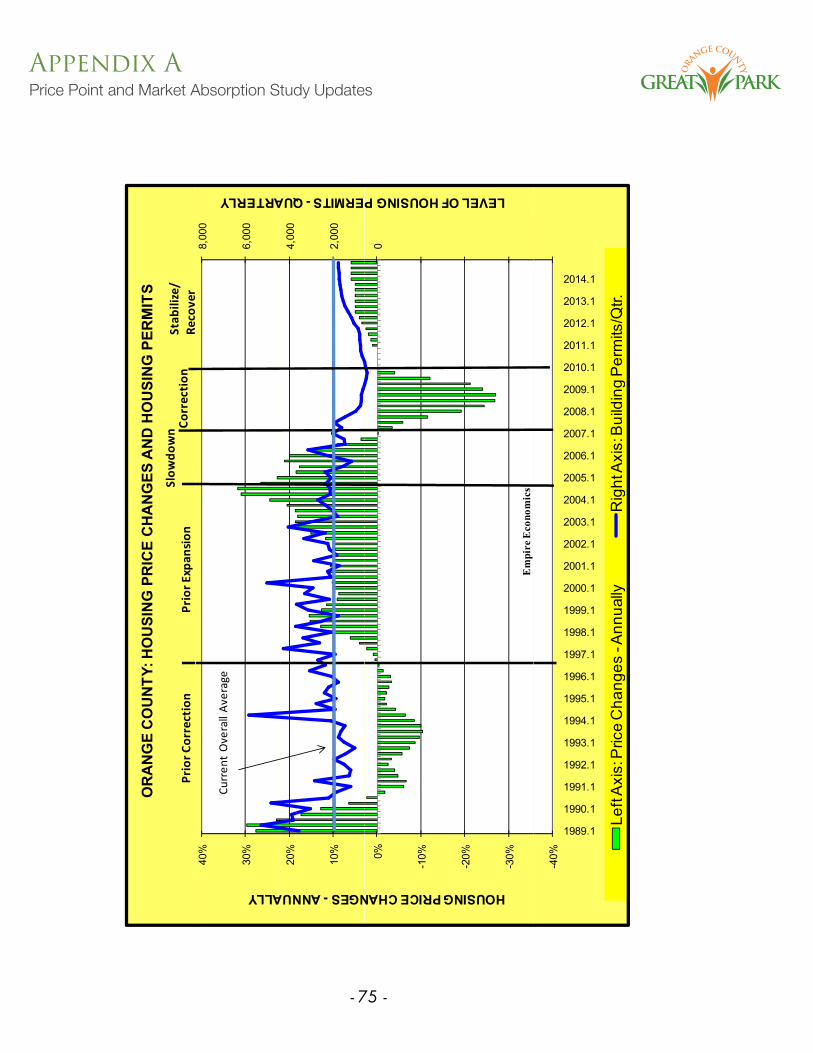
Appendix APrice Point and Market Absorption Study Updates
- 75 -
OR
AN
GE
CO
UN
TY: H
OU
SIN
G P
RIC
E C
HA
NG
ES A
ND
HO
USI
NG
PER
MIT
S
PriorC
orrection
PriorE
xpan
sion
Slow
down Co
rrection
Stab
ilize/
Recover
6,00
0
8,00
0
30%
40%
ARTERLY
ALLY
Curren
tOverallAverage
2,00
0
4,00
0
10%
20%
ERMITS -QUA
NGES -ANNUA
-2,0
00
0
-10%0%
F HOUSING P
G PRICE CHAN
-6,0
00
-4,0
00
-30%
-20%
LEVEL O
HOUSING
Em
pire
Eco
nom
ics
-8,0
00-4
0%
1989.1
1990.1
1991.1
1992.1
1993.1
1994.1
1995.1
1996.1
1997.1
1998.1
1999.1
2000.1
2001.1
2002.1
2003.1
2004.1
2005.1
2006.1
2007.1
2008.1
2009.1
2010.1
2011.1
2012.1
2013.1
2014.1
Left
Axi
s:P
rice
Cha
nges
-Ann
ually
Rig
htA
xis:
Bui
ldin
gP
erm
its/Q
tr
22
Left
Axi
s: P
rice
Cha
nges
-A
nnua
llyR
ight
Axi
s: B
uild
ing
Per
mits
/Qtr.

Appendix APrice Point and Market Absorption Study Updates
- 76 -
OR
AN
GE
CO
UN
TY: H
OU
SIN
G P
RIC
E C
HA
NG
ES A
ND
EM
PLO
YMEN
T C
HA
NG
ES
PriorC
orrection
PriorE
xpan
sion
Slow
down
Correction
Stab
ilize/
Recover
1500
0
18,0
00
21,0
00
24,0
00
30%
40%
TERLY
Y
Curren
tOverallAverage
6,00
0
9,00
0
12,0
00
15,0
00
10%
20%
MENT -QUART
S -ANNUALLY
-3,0
00
03,00
0
-10%0%
IN EMPLOYM
CE CHANGES
-12,
000
-9,0
00
-6,0
00
-30%
-20%
CHANGES I
HOUSING PRIC
-18,
000
-15,
000
-40%
1989.1
1990.1
1991.1
1992.1
1993.1
1994.1
1995.1
1996.1
1997.1
1998.1
1999.1
2000.1
2001.1
2002.1
2003.1
2004.1
2005.1
2006.1
2007.1
2008.1
2009.1
2010.1
2011.1
2012.1
H
Em
pire
Eco
nom
ics
23
Left
Axis
: Pric
e C
hang
es -
Annu
ally
Rig
ht A
xis:
Em
ploy
men
t Cha
nges
/Qtr.

Appendix APrice Point and Market Absorption Study Updates
- 77 -
THE
CO
RE
CO
MPO
NEN
TS O
F TH
E H
OU
SIN
G M
AR
KET
REC
OV
ERY
APP
EAR
IN T
HE
MID
DL
E O
F TH
E C
HA
RT
BR
OA
D M
AC
RO
ECO
NO
MIC
FA
CTO
RS,
EM
PLO
YM
ENT
AN
D M
ORT
GA
GE
RAT
ES, A
PPEA
R O
N T
HE
SID
ES
THES
EM
AYR
ESU
LTIN
EITH
ERA
QU
ICK
ERO
RA
NEL
ON
GAT
EDR
ECO
VER
YTH
ESE
MAY
RES
ULT
IN E
ITH
ER A
QU
ICK
ER O
R A
N E
LON
GAT
ED R
ECO
VER
YTO
TH
E EX
TEN
T TH
AT T
HEY
VA
RY F
RO
M T
HE
MO
ST P
RO
BA
BLE
SC
ENA
RIO
.
RECE
NT/EX
PECT
EDHOUSINGMARK
ETTR
ENDS/PATTER
NSINSO
UTH
ERNCA
LIFO
RNIA
TREN
DS/PATTER
NSINSO
UTH
ERNCA
LIFO
RNIA
STRO
NGER
THAN
ANTICIPATED
EMPLOYM
ENT
LOWER
THAN
ANTICIPATED
MORT
GAG
ERA
TES
PHASE
1:HOUSINGPR
ICES
ADJUST
TOEQ
UILIBRIUM,B
ASEDUPO
NHOUSEHOLD
INCO
MES
ANDCO
NVEN
TIONALFINANCINGTECH
NIQUES
DURING2007
2009
GRO
WTH
ACCE
LERA
TESTH
EHOUSINGRE
COVE
RY
ACCE
LERA
TETH
EHOUSINGRE
COVE
RYPR
ICES
DEC
LINESIGNIFICAN
TLY
DUEINITIALLYTO
MORT
GAG
ERE
SETS
ANDTH
ENEXAC
ERBA
TEDBY
NEG
ATIVEEQ
UITYFO
RHOMEO
WNER
S
PHASE
2:HOMES
THAT
HAV
ESIGNIFICANTLEVELSOFNEG
ATIVEEQ
UITY
EMPLOYM
ENT
CHANGES,W
HICH
DEP
ENDUPO
NTH
EOVER
ALL
ECONOMY,
MAY
SHIFTTH
ISPA
RADIGM
THELEVEL
OF
MORT
GAGERA
TES,
WHICHDEP
END
UPO
NTH
ERA
TEOF
INFLAT
ION,M
AYSH
IFTTH
IS
HOMES
THAT
HAV
ESIGNIFICANTLEVELSOFNEG
ATIVEEQ
UITY
ARE
CLEA
REDIN
THEMARK
ETPLACE
DURING2009
TOMID
2011
FORE
CLOSU
REAN
DSH
ORT
SALESDOMINATETH
EMAR
KETDURING2009
�–MID
2011
FORE
CLOSU
RESALESAR
EHIGH
SALESOFEXISTINGHOMES
(EXC
LUDINGFO
RECLOSU
RES)AR
EMODER
ATE
SALESOFNEW
HOMES
AREMINIM
AL�–DISPLAC
EDBY
FORE
CLOSU
RESALES
PHASE
3HOUSINGMARK
ETRE
COVER
SIN
MID
2011
ANDTH
ENRE
TURN
STO
NORM
ALIN
2012
FORNEW
RESIDEN
TIAL
DEV
ELOPM
ENT,
PARA
DIGM
LOWER
THAN
ANTICIPATED
EMPLOYM
ENT
SHIFTTH
ISPA
RADIGM
HIGHER
THAN
24
THEPR
OCE
SSSTAR
TSWITHFINISHED
LOTS
PURC
HASED
AT�“D
ISCO
UNTS�”;
THEN
,THESEAR
EFO
LLOWED
THER
EAFTER
BYNEW
LYFINISHED
�“FULL
COSTS�”
LOTS
GEO
GRA
PHICALLY,FIRST
AREHOMES
NEA
REM
PLOYM
ENTCE
NTERS
AND
COASTALAR
EAS
EMPLOYM
ENT
GRO
WTH
ELONGATES
THEHOUSING
RECO
VERY
HIGHER
THAN
ANTICIPATED
MORT
GAG
ERA
TES
ELONGATETH
EHOUSINGRE
COVE
RY

Appendix APrice Point and Market Absorption Study Updates
- 78 -
PRO
BA
BL
E M
AR
KE
T-E
NT
RY
TIM
E A
ND
EST
IMAT
ED
AB
SOR
PTIO
N S
CH
ED
UL
ES
Empirearrivedattheprobablemarket-entrytimefortheforthcomingresidentialproductsintheGP-HF,basedupona
considerationofwhentheconditionsintheeconomyandtheresidentialmarketareexpectedtobesufficientlystrongto
providea*STRONG*marketreception
provideaSTRONGmarketreception.
Hou
sing
Pric
eIn
crea
ses
TheOrangeCountyeconomyisexpectedtoenterarecoverymode,asreflectedbysignificantemployment
increasesstartingby2012.
hi
fh
iG
CA
di2012
dh
iThepricesfornewhomesinGP-HFCMAareexpectedtostarttorecoverin2012,andthenappreciateatarate
ofabout5%in2013and6%
in2014.
Proj
ectS
ales
Rat
esThesalesratesforprojectsintheGP-HFCMAarecurrentlyatminimallevels,lessthanonehomepermonthper
project;additionally,somefiveprojectshaverecentlyhaltedtheirsalesprogramsaswell.
pj;
y,pj
ypg
Thereisaconsiderablesupplyoflotsthathavetheirentitlementsandinfrastructureimprovementsinplace:
currentlyactiveprojectshave309futurehomes,temporarilyinactiveprojectshaveanother428futurehomes
andWoodbury/WoodburyEasthave“improved”lotsfor1,452futurehomes(excludingIvy).
Therefore,althoughtheGP-HFCMAisconsideredtohavestrongprospectsforrecovery,relativetoothercities/areasin
,g
gp
py,
OrangeCounty,themarketwillrequire
sometimetoabsorbthecurrentlevelsofinventory,andestablishsufficient
momentumfortheforthcomingproductsinGP-HF.
Em
pire
’s E
stim
ated
Mar
ket-
Ent
ry fo
r R
esid
entia
l Pro
duct
s: 2
013
The
mar
ket c
ondi
tions
in 2
013
are
expe
cted
to b
e su
ffic
ient
ly st
rong
to su
ppor
t the
mar
ketin
g of
abo
ut F
IVE
-SIX
re
side
ntia
l pro
ject
s, w
hich
are
ant
icip
ated
to o
ffer
a b
road
div
ersi
ty o
f pr
oduc
t typ
es in
var
ious
pri
ce r
ange
s.
THEACTUALMARKET-ENTRYTIMEWILLULTIMATELYBEBASEDUPONTHEDEVELOPMENTSTRATEGY
OFTHEPROPERTYOWNER
ANDTHISWILLINCLUDEACONSIDERATIONOFTHEEXPECTEDHOUSING
25
OFTHEPROPERTYOWNER,ANDTHISWILLINCLUDEACONSIDERATIONOFTHEEXPECTEDHOUSING
MARKETCONDITIONSASWELLASOTHER
CRITICALFACTORS,SUCHASSECURINGENTITLEMENTSAND
COMPLETINGTHEREQUIRED
BACKBONEINFRASTRUCTURE.

Appendix APrice Point and Market Absorption Study Updates
- 79 -
250
EMPIREEC
ONOMICS
EXPE
CTED
RESIDEN
TIALABSORPT
IONSCHED
ULES
ESCR
OW
CLOSINGS/OCC
UPA
NCIES
BYHOMEO
WNER
S;OVER
LAYUNITS
200
EOWNERS
THEGPHFCM
ARECO
VERS
AND
GAINSMOMEN
TUM
THEGPHFCM
ARETU
RNS
TOITS"N
ORM
AL"LEVEL
OFAC
TIVITY
150
CLOSINGSTOHOM
100
BEROFESCROWC
050
NUM
0
Q1 Q2/2012
Q3 Q4/2012
Q1 Q2/2013
Q3 Q4/2013
Q1 Q2/2014
Q3 Q4/2014
Q1 Q2/2015
Q3 Q4/2015
Q1 Q2/2016
Q3 Q4/2016
Q1 Q2/2017
Q3 Q4/2017
Q1 Q2/2018
Q3 Q4/2018
Q1 Q2/2019
Q3 Q4/2019
Q1 Q2/2020
Q3 Q4/2020
Q1 Q2/2021
Q3 Q4/2021
Q1 Q2/2022
Q3 Q4/2022
Q1 Q2/2023
Q3 Q4/2023
Q1 Q2/2024
Q3 Q4/2024
26
Tran
sitO
rien
ted
Lifelong
Learning
Park

Appendix APrice Point and Market Absorption Study Updates
- 80 -
Sect
ion
III:
Non
-Res
iden
tial P
rodu
ct U
pdat
esfo
r Pric
e Po
ints
and
Abs
orpt
ion
Sche
dule
s
Upd
ated
Pric
e P
oint
s fo
r the
Non
-Res
iden
tial P
rodu
cts
Maj
or S
hift
in R
ecen
t/Nea
r Ter
m E
cono
mic
-Em
ploy
men
t Con
ditio
ns in
Ora
nge
Cou
nty
Upd
ated
Pric
e P
oint
Adj
ustm
ent F
acto
rs fo
r Non
-Res
iden
tial P
rodu
cts
Est
imat
edA
bsor
ptio
nS
ched
ules
fort
heN
onR
esid
entia
lPro
duct
sE
stim
ated
Abs
orpt
ion
Sch
edul
es fo
r the
Non
-Res
iden
tial P
rodu
cts
28

Appendix APrice Point and Market Absorption Study Updates
- 81 -
UPD
ATE
D P
RIC
E P
OIN
TS
FOR
NO
N-R
ESI
DE
NT
IAL
PRO
DU
CT
S
ToUpdatethePricePointsfortheNon-ResidentialProductsinGP-HF,from
July2008toJuly2009,
Empireutilizedthefollowingprocedure:
ThePricePointsproposedforGP-HFbyLennarinJuly2008amountedtosome$287persq.ft.,
asaweightedaverage.Empire’sanalysisofthenon-residentialmarketconditionsinJuly2008
revealedthatthesePricePointswereconsistentwiththecomparableprojectsinthemarketplace.
ToUpdatethesePricePoints,Empireutilizedthechangesinleaseratesforthevariousnon-
residentialproducttypesduringthepastyear,andthesewereasfollows:
IndustrialProductsdeclinedby-14.5%
dusa
oducsdec
edby
.5%
OfficeProductsdeclinedby-13.1%
RetailProductsdeclinedby-5.5%
SpecializedProducts,suchasAssistedLivingandAutoCenter,
werealsou pdated,basedupontheirspecificmarketconditions.
p,
pp
Accordingly,byapplyingtherecentpricechangefactors,theUpdatedPricePointsamountedtosome
$262/sq.ft.,asaweightedaverage,andthisisabout-8.9%
belowtheirJuly2008levels.
29

Appendix APrice Point and Market Absorption Study Updates
- 82 -
NO
N-R
ESI
DE
NT
IAL
PRO
DU
CT
S IN
GP-
HF
CFD
'S
JULY
200
9 PR
ICE
PO
INT
S R
EC
OM
ME
ND
ED
BY
EM
PIR
E E
CO
NO
MIC
S
$458
$5
01
$500
$600
RE FOOTAGE
$262
$2
45
$305
$2
81
$289
$2
87
$288
$2
75
$262
$3
00
$400
PRICE / SQUAR
$$2
45
$173
$2
14
$195
$6
$100
$200
ALUE RATIO:
$0
$100
As
Ex
Ex
Au
Re
Me
Of
Of
Of
R&
Wa
Go
Ed
To
VA
sst. Living
xpo Center
xpo Retail
uto Center
etail
edical Office
ffice
ffice - Admin
ffice - Corp
&D
arehouse
olf Course
ducational
tal 30
e
n

Appendix APrice Point and Market Absorption Study Updates
- 83 -
MA
JOR
SH
IFT
IN R
EC
EN
T/N
EA
R T
ER
M E
CO
NO
MIC
-EM
PLO
YM
EN
T C
ON
DIT
ION
S IN
OR
AN
GE
CO
UN
TY
Ther
e ha
ve re
cent
ly b
een
maj
or e
mpl
oym
ent l
osse
s in
the
Indu
stria
l and
Ret
ail
sect
ors,
alo
ng w
ith m
oder
ate
loss
es in
the
Offi
ce S
ecto
r.
OR
AN
GE
CO
UN
TY
'SR
EC
EN
TE
MP
LO
YM
EN
TL
OSS
ES
5%10%
OF 4TH-2006
OR
AN
GE
CO
UN
TY
S R
EC
EN
T E
MP
LO
YM
EN
T L
OSS
ES
IND
UST
RIA
L-O
FF
ICE
-RE
TAIL
SE
CT
OR
S
-5%0%
S. BENCHMARK
-15%
-10%
EMPLOYMENT V
-20%
4th-2006
1st-2007
2nd-2007
3rd-2007
4th-2007
1st-2008
2nd-2008
3rd-2008
4th-2008
1st-2009
nd--2009
CHANGES IN E
31
2
2
2
Industrial
Office
Retail

Appendix APrice Point and Market Absorption Study Updates
- 84 -
UPD
ATE
D P
RIC
E P
OIN
T A
DJU
STM
EN
T FA
CTO
RS
FOR
NO
N-R
ESI
DE
NT
IAL
PRO
DU
CT
S
Sith
GPHFFi
ilPl
tlt
ifB
dOffi
di
thf
blft
thSincetheGP-HFFinancialPlancontemplatesaseriesofBondOfferingsduringtheforeseeablefuture,the
CurrentPricePointsareexpectedtobe“adjusted”tothemarketconditionsatthetimesthatthespecific
BondsareIssued.Thealgorithmutilizedtoestimatethepriceadjustmentfactorsstartswithrecentchangesin
employment,andthenrelatesthesetochangesinvacancyratesandalsoleaserates.
Indu
stri
al:
Employmentinthesesectorshasdeclinedby-45,867positionsor-15.8%
fromtheirrecentpeaklevel.
Thishascausedthevacancyrateforindustrialbuildingstorisefrom2.5%
to4.8%.
Lth
ddf
thi
tkl
lf$078t$065b
167%
Leaserateshavedecreasedfromtheirrecentpeaklevelof$0.78to$0.65,bysome-16.7%.
Off
ice: Employmentinthesesectorshasdeclinedby-40,950positionsor-3.8%fromtheirrecentpeaklevel.
Thih
dth
tf
ffibildi
tif
80%
t167%
Thishascausedthevacancyrateforofficebuildingstorisefrom8.0%
to16.7%.
Leaserateshavedecreasedfromtheirpeaklevelof$2.78to$2.33,bysome-16.2%.
Ret
ail: E
ltith
th
dlidb
22900
iti137%
fthi
tkl
lEmploymentinthesesectorshasdeclinedby-22,900positionsor-13.7%
fromtheirrecentpeaklevel.
Thishascausedthevacancyrateforretailspacetorisefrom3.0%
to7.7%.
Leaserateshavedecreasedfromtheirrecentpeaklevelof$2.71to$2.56,bysome-5.5%.
Adi
lith
tth
idj
ttf
tfthN
Rid
tilP
dtiGPHF
32
Accordingly,intheneartermthepriceadjustmentfactorsfortheNon-ResidentialProductsinGP-HFare
asfollows:Industrialby-8.3%,Officeby-7.4%andRetailby-3.0%.Butthenpricesareexpectedto
recovertotheircurrentlevelsasfollows:Industrialin2015,Officein2013,andRetailin2013.

Appendix APrice Point and Market Absorption Study Updates
- 85 -
CFD
PR
OG
RA
M F
OR
TH
E G
P-H
F*N
ON
-RE
SID
EN
TIA
L*
PR
ICE
TIM
E A
DJU
STM
EN
T F
AC
TO
RS
APP
LIE
D T
O E
MPI
RE
'S I
NIT
IAL
RE
CO
MM
EN
DE
D P
RIC
E P
OIN
TS
140%
150%
OINTS
OS
NC
ON
CO
NS
EMPIRE'S
INITIALRECO
MMEN
DED
PRICES:JULY
2009
120%
130%
NT FACTORS DED PRICE PO
EMPIRE
SINITIALRECO
MMEN
DED
PRICES:JULY
2009
100%
110%
E ADJUSTMENRECOMMEND
80%
90%
TIMEEMPIRE'S R
ADJUSTED
PRICES
BELO
WADJUSTED
PRICES
ABO
VETH
EINITIALRECO
MMEN
DED
PRICES
2009
2010
2011
2012
2013
2014
2015
2016
2017
2018
2019
2020
Industrial100.0%
94.0%
91.7%
93.5%
95.6%
97.7%
99.9%
102.2%
104.5%
106.8%
109.2%
111.7%
Office
100.0%
94.5%
92.6%
95.4%
99.7%
104.2%
108.9%
113.8%
118.9%
124.2%
129.8%
135.7%
70%
INITIALRECO
MMEN
DED
PRICES
33
Retail
100.0%
98.0%
97.0%
98.5%
100.9%
106.0%
111.3%
116.8%
122.7%
128.8%
135.3%
142.0%

Appendix APrice Point and Market Absorption Study Updates
- 86 -
CR
ITIC
AL
FAC
TOR
S U
ND
ER
LYIN
G T
HE
PR
OB
AB
LE
M
AR
KE
T-E
NT
RY
TIM
E A
ND
EST
IMAT
ED
AB
SOR
PTIO
N S
CH
ED
UL
ES
Toupdatethemarketabsorptionschedulesforthenon-residentialproductsinGP-HF,thefollowing
algorithmwasutilized:
Estimatedtimerequiredtorecoupmostoftherecentemploymentlosses,since4th -2006.
Al
ti
tdli
dl
tit
lll
Asemploymentrises,vacancyratesdeclineandleaseratesrisetonormallevels.
Thenoncethemarketreturnstonormal,newdevelopmentactivityoccurs.
Indu
stri
al:
El
tith
th
dlidb
45867
158%
fthi
tkl
lEmploymentinthesesectorshasdeclinedby-45,867or-15.8%
fromtheirrecentpeaklevel.
During2005-2006,whentheOCeconomywasstrong,thesesectorsexperiencedemploymentgrowth
ofsome6,800newpositions/yr.
Consequentlyitcouldtakesomesix-sevenyearsforemploymenttofullyrecover.
FthCit
fIi
thNOT
idtil
tti
tiitdiA
il2007t
FortheCityofIrvine,therewasNOTanynewindustrialconstructionactivityduringApril2007to
June2009,morethanatwo-yearperiod.
Off
ice: E
ltith
th
dlidb
40950
38%
fthi
tkl
lEmploymentinthesesectorshasdeclinedby-40,950or-3.8%fromtheirrecentpeaklevel.
During2005-2006,whentheOCeconomywasstrong,thesesectorsexperiencedemploymentgrowth
ofsome20,500newpositions/yr.
Consequentlyitcouldtakeabouttwoyearsforemploymenttofullyrecover.
FortheCitofIrinethereasNOne
officeconstrctionactiitdringAgst2008to
34
FortheCityofIrvine,therewasNOnewofficeconstructionactivityduringAugust2008to
June2009,almostayear.

Appendix APrice Point and Market Absorption Study Updates
- 87 -
Retail: Employmentinthesesectorshasdeclinedby-22,900or-13.7%
fromtheirrecentpeaklevel.
During2005-2006,whentheOCeconomywasstrong,thissectorexperiencedemploymentgrowth
ofsome3,775newpositions/yr.
Consequentlyitcouldtakesomesixyearsforemploymenttofullyrecover.
FortheCityofIrvine,therewasNOnewretailconstructionactivityduringNovember2008to
June2009,aneightmonthtimeperiod.
However,thefuturedemandforretaildevelopmentinGP-HFwillbedrivenbynewhousing
developmentinitsvicinity.
Accordingly,baseduponaconsiderationofthesefactors,Empirearrivedattheprobablemarket-entry
timesandestimatedabsorptionschedulesforthenon-residentialproductsinGP-HF.
Industrial:expectedtooccurin2015
Office:expectedtooccurin2013
Retail:expectedtofollownewresidentialdevelopment,expectedtooccurin2015
ExpoCenter/ExpoRetailexpectedtocommencein2013
Therefore,althoughtheGP-HFareaisconsideredtohavestrongprospectsforrecovery,relativetoother
cities/areasinOrangeCounty,themarketwillrequiresometimetoabsorbthecurrentlevelsofinventory,
andestablishsufficientmomentumfortheforthcomingnon-residentialproductsinGP-HF.
THEACTUALMARKET-ENTRYTIMEWILLULTIMATELYBEBASEDUPONTHEDEVELOPMENT
STRATEGYOFTHEPROPERTYOWNER,ANDTHISWILLINCLUDEACONSIDERATIONOFTHENON-
RESIDENTIALMARKET
CONDITIONSASWELLASOTHER
CRITICALFACTORS,SUCHASSECURING
35
ENTITLEMENTS
ANDCOMPLETIONOFTHEBACKBONEINFRASTRUCTUREREQUIRED
TOSUPPORT
SUCHDEVELOPMENT.

Appendix APrice Point and Market Absorption Study Updates
- 88 -
EMPIREEC
ONOMICS:EX
PECT
EDCO
MMER
CIALINDUSTRIALABSORPT
ION
EXPE
CTED
TAXA
BLEBU
ILDINGSPACE
:3,924,137SQ
.FT.
(EXC
LUDES
EDUCA
TIONALFA
CILITIES)
694,51
3
637,59
163
8,86
570
0,00
0
800,00
0
504,68
250
0,00
0
600,00
0
27658
7
417,31
6
335,13
0
30000
0
400,00
0
276,58
7
209,25
421
0,19
920
0,00
0
300,00
0 0
100,00
0
36
2011
2012
2013
2014
2015
2016
2017
2018
2019
2020
2021

Appendix APrice Point and Market Absorption Study Updates
- 89 -
300,00
0
EMPIREEC
ONOMICS:
EXPE
CTED
EDUCA
TIONALFA
CILITESABSORPT
ION
EXPE
CTED
BUILDINGSPACE
:1,452,600SQ
.FT.
235,81
223
5,81
223
5,81
223
5,81
225
0,00
0
D
15720
8
196,51
0
15563
6
200,00
0
OTAGEOCCUPIED
157,20
815
5,63
6
10000
0
150,00
0
NTOFSQUAREFOO
50,000
100,00
0
AMOUN
00
00
0
2011
2012
2013
2014
2015
2016
2017
2018
2019
2020
2021
37
Education

Appendix APrice Point and Market Absorption Study Updates
Heritage Fields Tax Increment Revenue ProjectionsDelayed Development Assumptions
Rosenow Spevacek Group, Inc. (RSG) has provided redevelopment consulting services to cities and redevelopment agencies throughout the State of California for 30 years. RSG specializes in fiscal consulting services including
! Financing Capacity Analysis
! Tax Increment Verification & Revenue Audits
! Revenue Projections & Verification
! Interpretation/Application of Pass Through & Developer Agreements
! Escrow Release Certification
! Fiscal Analysis & Reporting for Bond Insurers & Rating AgenciesTo date, RSG has served as fiscal consultant for over 200 financings, involving the issuance of approximately $2.6 billion in bonds. Our extensive experience covers a spectrum of financing sizes and structures. RSG provides a variety of services related to redevelopment including planning, economic development, affordable housing, land assemblage, developer negotiations and other activities related to redevelopment implementation. RSG assisted the Irvine Redevelopment Agency in the adoption of the Redevelopment Plan for the Orange County Great Park Redevelopment Project Area and has an in-depth knowledge of the plan and support documentation.
The tax increment revenue projections for Heritage Fields are based on the following assumptions:
• Development program is based on Heritage Fields product type, pricing and absorption with revisions to pricing and absorption based upon the Empire Economics Study dated August 2009.
• Initial secured assessed value is based on the 2009-10 assessed value for the Heritage Fields property as reported by the County Auditor Controller which is $598,069,960 (reflects the County Assessor’s recent reduction in value from the initial $831 million). Unsecured value is based on the actual 2009-10 assessed value which is $4,229,110.
• Assessed values remain the same until construction begins – no inflationary growth included.
• Throughout the development absorption period (beginning 2010-11 and ending in 2023-24), annual growth is assumed at 2% for secured value and 0% for unsecured value. When development is complete, the annual
- 90 -
Appendix APrice Point and Market Absorption Study Updates
growth rate on secured value is increased to 3% for the remaining duration of the projections (unsecured growth remains at 0%).
• The Empire Economics Study was used for pricing and absorption (both residential and non-residential). In both cases, price modifiers are applied to land and improvements – see Exhibit A .
• All Institutional uses are 100% tax exempt. No value has been added for affordable residential units. All other uses are assumed taxable at 100% of market value.
• The initial land value is deducted from the assessed value when the land is sold and then the land value is added back to the assessment roll when the property is improved and sold (timing and added land value based again on the Empire Economics Study).
• Assessed value additions are added to the projections roughly six months after completion. Development completed in the third and fourth quarters is included in the equalized roll for the following fiscal year based on the January 1 lien date. First and second quarter value additions are added to the following fiscal year revenues based on supplemental taxes (e.g. revenue from new development completed in April 2011 will be assumed beginning in fiscal year 2011-12 even though it won’t be included on the equalized roll until 2012-13).
• The pending 2008-09 Educational Revenue Augmentation Fund (ERAF), and 2009-10 and 2010-11 Supplemental Educational Revenue Augmentation Fund (SERAF) payments are paid from cash on hand; no deductions have been made for any future SERAF payments. These potential obligations are the result of State legislation that requires all redevelopment agencies statewide to deposit tax increment funds into special funds directed to school districts in order to relieve the State budget shortfall. The 2008-09 ERAF payment was successfully challenged in court, however, the State has filed an appeal of the Superior Court decision. The California Redevelopment Association has stated its intent to also file a legal challenge against the SERAF revenue shift on the basis that it is unconstitutional.
• Tax refunds resulting from the reduction in assessed value for years 2006-2009 are paid from cash on hand.
- 91 -

Appendix CFiscal Impact of Cirque du Soleil
ERA 388 Market St., Suite 1580, San Francisco, CA 94111 T 415.956.8152 F 415.956.5274 www.era.aecom.com
Memorandum
Date: July 22, 2009
To: City of Irvine and the Orange County Great Park Corporation From: ERA|AECOM
Subject: Economic and Fiscal Impact of Cirque du Soleil �– Project No. 18313
Introduction The City of Irvine retained ERA|AECOM, formerly Economics Research Associates (ERA), to prepare an assessment of the economic and fiscal impact of hosting the Cirque du Soleil within the Great Park. The Irvine City Council and the Orange County Great Park Corporation (OCGP) are currently in the process of ratifying a Letter of Intent to establish the Great Park as the Orange County location for the Cirque du Soleil touring show. Some of the key points of the lease terms include:
The Cirque will have the opportunity to use the site a maximum of eight times beginning in December 2009 and ending in January 2018.
The Cirque is entitled to 100 percent of the ticket, concessions, alcohol and retail revenues
generated within space occupied by the Cirque.
The Cirque will pay a lease rental cost of zero for the term of the agreement.
The Great Park will be responsible for parking and traffic management, and the OCGP is entitled to receive parking revenue of $10 per vehicle.
Key Input Assumptions The Cirque will sell tickets for an initial performance period of three weeks. If the initial sales are successful, ticket sales would be extended for an additional up to three weeks. Considering the affluence of the Southern Orange County regional market and the strong location of the site near the confluence of I-5, I-405 and SR-133, ERA has assumed that the performance will last for the full six weeks for each season. The ticket and concession revenues earned by the Cirque are taken out of Orange County because the organization and its long term employees are based in Montreal, Canada. However, the Cirque is such a unique entertainment venue that ERA has assumed that these dollars to the Cirque either would have flowed out of the county in any case (e.g. to attend the Cirque in Santa Monica or Las Vegas) or would not have been spent. ERA has not assumed the dollar flow to the Cirque is diversion from local cinema, cultural events or sports venues.
- 92 -

Appendix CFiscal Impact of Cirque du Soleil
- 93 - 2

Appendix CFiscal Impact of Cirque du Soleil
- 94 -
The Economic Impact Assessment One important factor in accurately assessing impacts is determined by the geographic source of the attendees to the Cirque du Soleil. In estimating where the attendee will come from, ERA considered:
The location of the Cirque site within the Great Park and its proximity to the rest of Orange County and to the surrounding counties of San Diego, Riverside, San Bernardino and Los Angeles.
The population and income distribution of these five counties.
The fact the Cirque will be in Santa Monica before coming to the Great Park.
The analysis in Table 1 shows that approximately 42 percent of the attendees will come from Orange County, with 8.4 percent of the total from Irvine. The balance will be from Los Angeles County (34 percent), San Diego County (12.3 percent), Riverside County (7.5 percent) and San Bernardino County (4.2 percent). A large majority of the economic impact will be from to the expenditures of the Cirque du Soleil organization in Southern California. These include the following for each season:
The Cirque will hire approximately 165 Southern Californians to help with site preparation, set up, tear down, ticket sales, and usher work etc. Including a training period, these workers work for seven weeks at average of 20 hours per week for about $10 per hour. ERA estimates that 85 percent of these locally hired employees will be from Orange County.
The Cirque will bring 50 performers/artists and 100 support/administrative staff. They will
arrive one week before the show starts and stay through the last day of the performance. They will stay in hotels in Irvine as stipulated by the lease agreement.
The Cirque will purchase groceries from local establishments to serve three meals per day to
these 150 visiting staff.
The Cirque will spend about $50,000 in Southern California to transport its staff between the hotels and the performance venue at the Great Park. This expenditure is for buses, taxi rides and car rental.
The Cirque will spend an estimated $125,000 during these seven weeks for rental of
temporary office space and equipment and will purchase $40,000 in fuel (gasoline and propane) to operate its equipment and kitchen.
Other local spending includes promotional cost of $300,000 for advertising and marketing
and $40,000 for a premiere event (caterers, tent rental, entertainers and security personnel).
Other Cirque expenditures in Southern California will include approximately $20,000 for professional fees for lawyers, consultants, architects and engineers.
For each season at the Great Park, the Cirque du Soleil will spend about $1.9 million in Southern California. Of this total, 91 percent or just over $1.7 million will be spent in Orange County. The detailed estimates are presented in Table 2.
3

Appendix CFiscal Impact of Cirque du Soleil
- 95 -
In addition to the expenditures by the Cirque as an organization, the employees and attendees living outside of Orange County will spend some monies in Orange County due to their visitation to the Cirque. These will include:
The meal and snack expenditures by Southern California employees living outside Orange County and hired by the Cirque for each season.
The spending for incidentals and a few meals by Cirque performers and support personnel
brought out from Montreal, its international headquarters.
The meal, snack and parking spending by the 58 percent of Cirque attendees visiting Irvine from outside of Orange County.
Using fairly conservative spending factors, ERA estimates that these temporary employees and visitors from outside of Orange County will spend an additional $670,000 in Orange County per season (see Table 3). The direct Cirque du Soleil spending impact on Orange County is therefore approximately $2.4 million per season or $19.2 million for eight seasons without considering any inflation factor. ERA then used two simulation models to estimate the net overall employment impact on Orange County and Southern California due to the direct expenditures caused by the Cirque. ERA leased these two simulation models from the Regional Economic Models, Inc (REMI). This organization develops and updates the REMI Policy Insight, which is used for forecasting and policy analysis by many different types of public, private, and non-governmental organizations throughout the country. Articles about the model equations and research findings have been published in professional journals such as the American Economic Review, The Review of Economic Statistics, the Journal of Regional Science, and the International Regional Science Review. The first model was calibrated to estimate the impacts on Orange County while the second model was calibrated to estimate the impacts on Los Angeles County, San Diego County, San Bernardino County, and Riverside County. The impact on Southern California was determined by combining the results of the two models. The REMI Policy Insight models indicate that the presences of the Cirque du Soleil in the Orange County Great Park for a full six-week season generates approximately 300 additional jobs for Southern California with 90 percent of these jobs generated within Orange County. REMI is using the Department of Commerce Bureau of Economic Analysis (BEA) definition of jobs and not full time equivalents (FTEs). A large majority of these jobs are in the arts, entertainment and recreation sector and a notable minority are in the accommodations and food services sector (see Table 4 for details).
Impact on Irvine�’s General Fund Revenue While the Cirque is not paying land rent, it does generate General Fund tax revenue for the City of Irvine. This revenue is primarily from transient occupancy tax on hotel room rentals and from sales tax revenue on meal and other incidental spending by staff and attendees from outside of Irvine. As detailed in Table 5, the estimated transient occupancy tax per season is $82,000 and the sales tax impact per season is $6,000. Over eight seasons, the City�’s General Fund benefits by about $700,000.
4

Appendix CFiscal Impact of Cirque du Soleil
- 96 -
Summary of Impacts The future presence of the Cirque du Soleil performing in the Great Park will have following estimated economic and fiscal impacts on Orange County and the City of Irvine:
Direct spending impact by the Cirque and its induced visitors to Orange County - $2.4 million per season or $19.2 million over eight seasons.
Overall additional jobs for Southern California per season of 300 with 270 being Orange
County jobs.
The City of Irvine�’s General Fund benefits by approximately $88,000 per season and $700,000 for the total of eight seasons.
Table 1MARKET AREA POPULATION ESTIMATES AND CIRQUE ATTENDANCE PENETRATION
PenetrationNumber Percentage Number Percentage Rate
Orange County 3,139,017 15.0% 56,028 42.0% 1.78%
Los Angeles County 10,393,185 49.8% 45,356 34.0% 0.44%
Riverside County 2,107,653 10.1% 10,005 7.5% 0.47%
San Bernardino County 2,060,950 9.9% 5,603 4.2% 0.27%
San Diego County 3,173,407 15.2% 16,408 12.3% 0.52%
Total Market Area 20,874,212 100.0% 133,400 100.0% 0.64%
City of Irvine 212,793 1.0% 11,206 8.4% 5.27%
Source: CA Department of Finance
Population January 2009 Estimated Cirque Attendance
5

Appendix CFiscal Impact of Cirque du Soleil
- 97 -
Table 2EXPENDITURES BY CIRQUE DU SOLEIL IN SOUTHERN CALIFORNIA AND ORANGE COUNTY FOR ECONOMIC IMPACT ASSESSMENT
Locally Average Weeks Average Total Total Wage Orange Cty Total OC WagePercentageHired Staff Hours/Week of Work Hourly Rate Hourrs Expenditures Expenditures
Wages for Locally Hired Staff 165 20 7 $10.00 23,100 $231,000 85% $196,350(Ticket Sales/Urshers/Set-up/Take-down)
Persons Average Total Total Room Orange Cty OC RoomVisiting Staff Per Room Hotel Rooms Room Rate Room Nites Expenditures Percentage Expenditures
Accommodations for Visiting Staff 150 1.14 132 $149.00 6,468 $963,732 100% $963,732(Hotel Room Expenditures for Performers & Traveling Staff)
Total Grocery Daily Number Total Meal Est. Cost Orange Cty OC GroceryVisiting Staff Meal of Days for Staff Per Meal Expenditures Percentage Expenditures
Meals to Visiting Staff 150 3 49 22,050 $6.00 $132,300 100% $132,300(Prepared in Cirque Kitchen)
Total Local Orange Cty OC TransTrans Exp Percentage Expenditures
Local Transportation Cost $50,000 90% $45,000(Buses, Taxi & Car Rental)
Total Local Orange Cty Total OCPercentage Off & EquipOff & Equip
Rental of Temporary Office & Equipment $125,000 100% $125,000
Total Local Orange Cty Total OCPercentage Fuel CostFuel Cost
Fuel Purchases $40,000 100% $40,000(Gasoline & Propane)
Total Local Orange Cty Total OCPromo Cost Percentage Promo Cost
Local Promotional Cost $300,000 60.0% $180,000(Advertising & Marketing)
Total Local Orange Cty Total OCPromiere Cost Percentage Promiere Cost
Premiere Event $40,000 80% $32,000(Caterers, tent, entertainment & security)
Total Local Orange Cty Total OCProf Serv Cost Percentage Prof Serv Cost
Professional Services Costs $20,000 75% $15,000(Lawyers, Consultants, Architects & Engineers)
Total So Cal Orange Cty Total OCExpenditure Percentage Expenditure
Total Estimated Cirque Expenditures in Southern California and Orange County per Season $1,902,032 91% $1,729,382
Source: Cirque du Soleil & ERA
6

Appendix CFiscal Impact of Cirque du Soleil
- 98 -
Table 3EXPENDITURES BY VISITORS TO ORANGE COUNTY FOR ECONOMIC IMPACT ASSESSMENT
Locally From Outside Days of Average Local Staff OCHired Staff Orange Cty Work Exp per Day Expenditures
Locally (So Cal) Hired Staff Expenditures 165 15% 49 $5.00 $6,064
(Meal & Snacks)From Outside Days of Average Visitor Staff OC
Visiting Staff Orange Cty Work Exp per Day Expenditures
Visiting Cirque Performers & Staff 150 100% 49 $5.00 $36,750
(Sundries & Meals)Attendance at From Outside Number of Expenditure per Attendee OC
Each Show Orange Cty Perfomrances Attendee Meal Spending
Attendees Meal Expenditures 2,470 58% 54 $5.50 $425,546
(Meals & Snacks)Attendance at From Outside Number of Expenditure per Attendee OC
Each Show Orange Cty Perfomrances Attendee Parking Spending
Attendees Parking Expenditures 2,470 58% 54 $2.55 $197,299
Total Estimated Cirque Induced Visitor Expenditures in Orange County per Season $665,658
Source: Cirque du Soleil, City of Irvine & ERA
7

Appendix CFiscal Impact of Cirque du Soleil
- 99 -
Table 4EMPLOYMENT IMPACT OF CIRQUE DU SOLEIL (ASSUMING EIGHT SEASONS)
Year 2010 2011 2012 2013 2014 2015 2016 2017
Orange County
Forestry, Fishing, Other 0 0 0 0 0 0 0 0Mining 0 0 0 0 0 0 0 0Utilities 0 0 0 0 0 0 0 0Construction 6 9 10 11 11 11 11 11Manufacturing 2 2 2 2 2 2 2 2Wholesale Trade 2 2 2 2 2 2 2 3Retail Trade 6 7 8 8 9 9 10Transp, Warehousing 1 1 1 1 1 1 1 1Information 1 1 1 1 1 1 2 2Finance, Insurance 4 4 4 3 3 3 3 3Real Estate, Rental, Leasing 4 4 4 4 4 4 3 3Profess, Tech Services 10 11 11 11 11 11 11 12Mngmt of Co, Enter 1 1 1 1 1 1 1 1Admin, Waste Services 11 11 11 11 11 11 11 11Educational Services 1 1 1 1 1 1 1 1Health Care, Social Asst 3 3 4 5 5 6 6 7Arts, Enter, Rec 175 175 174 174 174 174 174 174Accom, Food Services 25 24 24 23 22 21 21 21Other Services (excl Gov) 8 8 8 8 8 8 8 8State Gov 0 0 0 0 0 0 0 0Local Gov 0 0 0 0 0 0 0 0Total 261 266 268 268 268 268 270 271
Table 4 continuedEMPLOYMENT IMPACT OF CIRQUE DU SOLEIL (ASSUMING EIGHT SEASONS)
Surrounding Counties
Forestry, Fishing, Other 0 0 0 0 0 0 0 0Mining 0 0 0 0 0 0 0 0Utilities 0 0 0 0 0 0 0 0Construction 1 2 2 2 2 2 2 2Manufacturing 1 2 2 2 2 2 2 2Wholesale Trade 1 1 1 1 1 1 1 1Retail Trade 3 3 3 3 3 3 4 4Transp, Warehousing 1 1 1 1 2 2 2 2Information 1 1 1 1 2 2 2 2Finance, Insurance 1 1 2 2 2 2 2 2Real Estate, Rental, Leasing 1 1 1 1 2 2 2 2Profess, Tech Services 2 3 3 3 3 3 4 4Mngmt of Co, Enter 0 0 0 0 0 0 0 0Admin, Waste Services 2 2 2 2 3 3 3 3Educational Services 1 1 1 1 2 2 2 2Health Care, Social Asst 1 2 2 2 2 3 3 3Arts, Enter, Rec 1 1 1 1 1 1 1 1Accom, Food Services 2 2 2 2 2 2 3 3Other Services (excl Gov) 2 2 2 2 3 3 3 3State Gov 0 0 0 0 0 0 0 0Local Gov 0 0 0 1 1 1 1 1Total 23 25 27 27 32 34 36 37
Grand Total 284 291 294 295 300 302 306 308Percent in Orange County 92% 91% 91% 91% 89% 89% 88% 88%
Source: REMI
10
8

Appendix CFiscal Impact of Cirque du Soleil
- 100 -
Table 5CIRQUE INDUCED GENERAL FUND REVENUE FOR CITY OF IRVINE
Locally From Outside Days of Average Local StaffHIred Staff City of Irvine Work Exp per Day Expenditures
Locally Hired Staff Expenditures 165 75% 49 $5.00 $30,319
(Meal & Snacks)From Outside Days of Average Visitor Staff
Visiting Staff City of Irvine Work Exp per Day Expenditures
Visiting Cirque Performers & Staff 150 100% 49 $5.00 $36,750
(Sundries, Snacks & Meals)Attendance at From Outside Number of Expenditure per Attendee
Each Show City of Irvine Perfomrances Attendee Meal Spending
Attendees Meal Expenditures 2,470 92% 54 $5.50 $672,069
(Meals & Snacks)
Total Cirque Induced Visitor Retail Expenditures $739,138
Estimated Percentage Spent in Irvine 85%
Total Induced Visitor Retail Expenditures in Irvine $628,267
Irvine Sales Tax @ 1% $6,283
Total Visitor Lodging Expenditures in Irvine (from Table 2) $963,732
Irvine Transient Occupancy Tax for City at 8.5% $81,917
Total Cirque Induced City of Irvine Revenue per Season $88,200
Source: Cirque du Soleil, City of Irvine & ERA
9

Appendix DContract Services & CIP Expenditures Summary
- 101 -
Category Description Vendor Total
Project Balloon Project Cal-Pac $3,037,028Other Vendors $1,761,024
$4,798,052
Project Preview Park Belaire West $4,281,878Other Vendors $1,046,945
$5,328,823
Project Demolition Kishimoto Architects $879,732Masek Consulting $193,479Interior Demolition $1,238,224Heritage Fields $13,430
$2,324,865
Project Great Park Design Great Park Design StudioMaster Plan $10,546,759Balloon Park (1A) $355,260Schematic Design* $25,629,719
Includes Preview Park, Change orders and Park Development Plan work
Strategy & Communications $3,075,337FY 2008-09 Accruals, All Projects $3,091,524
$42,698,598
Project Engineering Fuscoe $38,239IBI Group $56,057DMc Engineering $723,767WRNS Studio $114,192Dudek $202,583
$1,134,838
Project Planning Fees City of Irvine $929,341County of Orange $59,370
$988,712
Project Program Management Bovis Lend Lease $9,324,618
Total All Projects $66,598,506
Great Park Contract Services & CIP Expenditures SummaryInception Through June 30, 2009
All Great Park Funds
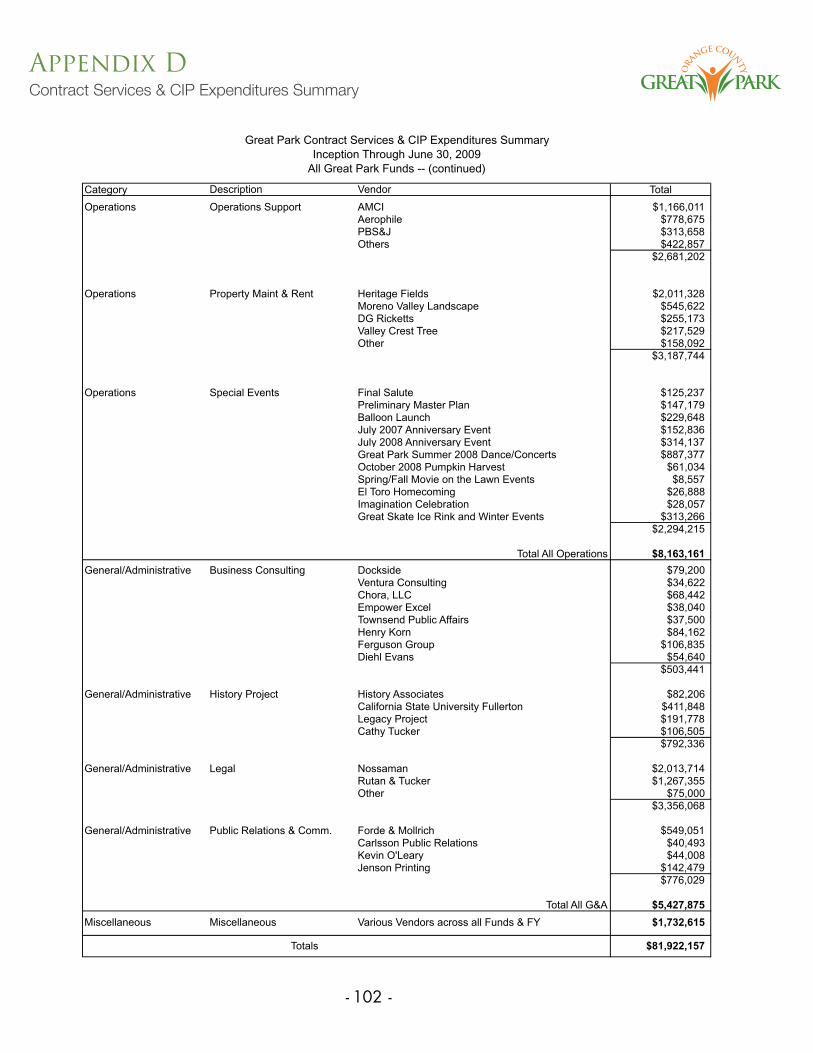
Appendix DContract Services & CIP Expenditures Summary
- 102 -
Category Description Vendor Total
Operations Operations Support AMCI $1,166,011Aerophile $778,675PBS&J $313,658Others $422,857
$2,681,202
Operations Property Maint & Rent Heritage Fields $2,011,328Moreno Valley Landscape $545,622DG Ricketts $255,173Valley Crest Tree $217,529Other $158,092
$3,187,744
Operations Special Events Final Salute $125,237Preliminary Master Plan $147,179Balloon Launch $229,648July 2007 Anniversary Event $152,836July 2008 Anniversary Event $314,137Great Park Summer 2008 Dance/Concerts $887,377October 2008 Pumpkin Harvest $61,034Spring/Fall Movie on the Lawn Events $8,557El Toro Homecoming $26,888Imagination Celebration $28,057Great Skate Ice Rink and Winter Events $313,266
$2,294,215
Total All Operations $8,163,161General/Administrative Business Consulting Dockside $79,200
Ventura Consulting $34,622Chora, LLC $68,442Empower Excel $38,040Townsend Public Affairs $37,500Henry Korn $84,162Ferguson Group $106,835Diehl Evans $54,640
$503,441
General/Administrative History Project History Associates $82,206California State University Fullerton $411,848Legacy Project $191,778Cathy Tucker $106,505
$792,336
General/Administrative Legal Nossaman $2,013,714Rutan & Tucker $1,267,355Other $75,000
$3,356,068
General/Administrative Public Relations & Comm. Forde & Mollrich $549,051Carlsson Public Relations $40,493Kevin O'Leary $44,008Jenson Printing $142,479
$776,029
Total All G&A $5,427,875Miscellaneous Miscellaneous Various Vendors across all Funds & FY $1,732,615
Totals $81,922,157
Inception Through June 30, 2009All Great Park Funds -- (continued)
Great Park Contract Services & CIP Expenditures Summary
Related Documents