IRRIGATION AND DRAINAGE Irrig. and Drain. 54: 455–465 (2005) Published online in Wiley InterScience (www.interscience.wiley.com). DOI: 10.1002/ird.197 FUZZY MULTICRITERION DECISION MAKING IN IRRIGATION PLANNING y K. SRINIVASA RAJU 1 AND D. NAGESH KUMAR 2 * 1 Department of Civil Engineering, Birla Institute of Technology and Science, Pilani 333 031, Rajasthan, India 2 Department of Civil Engineering, Indian Institute of Science, Bangalore 560 012, Karnataka, India ABSTRACT Multicriterion decision making (MCDM) has emerged as an effective methodology due to its ability to combine quantitative and qualitative criteria for selection of the best alternative. Concurrently, fuzzy logic is gaining importance due to its flexibility in handling imprecise subjective data. In the present study two fuzzy logic-based MCDM methods, namely similarity analysis (SA) and decision analysis (DA), are adopted and developed as a FUzzy Decision System (FUDS) and applied to a case study of the Sri Ram Sagar Project (SRSP), Andhra Pradesh, India, for selecting the best-performing irrigation subsystem. It is found that both SA and DA suggested the same irrigation subsystem as the best. It is concluded that application of fuzzy logic methodology for real-world decision-making problems is found to be effective. Copyright # 2005 John Wiley & Sons, Ltd. key words: fuzzy logic; multicriterion decision making; performance evaluation; India RE ´ SUME ´ La prise de de ´cision multicrite `re (MCDM) a e ´merge ´ comme me ´thodologie efficace due a ` sa capacite ´ de combiner des crite `res quantitatifs et qualitatifs pour le choix de la meilleure alternative. Concurremment, la logique floue gagne l’importance due a ` sa flexibilite ´ en manipulant des donne ´es subjectives impre ´cises. Dans la pre ´sente e ´tude deux me ´thodes de MCDM base ´es `, dans la logique floue, a ` savoir, l’analyse de similitude (SA) et l’analyse de de ´cision (DA), sont adopte ´es et de ´veloppe ´es comme syste `me brouille ´ de de ´cision (FUDS) et applique ´es a ` une e ´tude de cas du projet de Sagar de Ram de Sri (SRSP), Andhra Pradesh, Inde, pour choisir le meilleur sous-syste `me d’exe ´cution d’irrigation. On constate que SA et DA ont sugge ´re ´ le me ˆme sous-syste `me d’irrigation comme le meilleur. On conclut que l’application de la me ´thodologie de logique floue pour le proble `me re ´el de prise de de ´cision du monde s’ave `re efficace. Copyright # 2005 John Wiley & Sons, Ltd. mots cle ´s: logique floue; prise de de ´cision multicrite `re; e ´valuation des performances; Inde INTRODUCTION Multicriterion decision making (MCDM) has emerged as an effective methodology due to its ability to combine quantitative and qualitative criteria for selection of the best alternative (Pomerol and Romero, 2000). Received 18 March 2004 Revised 4 July 2005 Copyright # 2005 John Wiley & Sons, Ltd. Accepted 13 July 2005 * Correspondence to: Prof. D. Nagesh Kumar, Department of Civil Engineering, Indian Institute of Science, Bangalore 560 012, Karnataka, India. E-mail: [email protected] y Prise de de ´cision multicrite `re brouille ´e dans la planification d’irrigation.

Welcome message from author
This document is posted to help you gain knowledge. Please leave a comment to let me know what you think about it! Share it to your friends and learn new things together.
Transcript
IRRIGATION AND DRAINAGE
Irrig. and Drain. 54: 455–465 (2005)
Published online in Wiley InterScience (www.interscience.wiley.com). DOI: 10.1002/ird.197
FUZZY MULTICRITERION DECISION MAKING IN IRRIGATION PLANNINGy
K. SRINIVASA RAJU1 AND D. NAGESH KUMAR2*1 Department of Civil Engineering, Birla Institute of Technology and Science, Pilani 333 031, Rajasthan, India
2Department of Civil Engineering, Indian Institute of Science, Bangalore 560 012, Karnataka, India
ABSTRACT
Multicriterion decision making (MCDM) has emerged as an effective methodology due to its ability to combine
quantitative and qualitative criteria for selection of the best alternative. Concurrently, fuzzy logic is gaining
importance due to its flexibility in handling imprecise subjective data. In the present study two fuzzy logic-based
MCDM methods, namely similarity analysis (SA) and decision analysis (DA), are adopted and developed as a
FUzzy Decision System (FUDS) and applied to a case study of the Sri Ram Sagar Project (SRSP), Andhra Pradesh,
India, for selecting the best-performing irrigation subsystem. It is found that both SA and DA suggested the same
irrigation subsystem as the best. It is concluded that application of fuzzy logic methodology for real-world
decision-making problems is found to be effective. Copyright # 2005 John Wiley & Sons, Ltd.
key words: fuzzy logic; multicriterion decision making; performance evaluation; India
RESUME
La prise de decision multicritere (MCDM) a emerge commemethodologie efficace due a sa capacite de combiner des
criteres quantitatifs et qualitatifs pour le choix de la meilleure alternative. Concurremment, la logique floue gagne
l’importance due a sa flexibilite en manipulant des donnees subjectives imprecises. Dans la presente etude deux
methodes de MCDM basees, dans la logique floue, a savoir, l’analyse de similitude (SA) et l’analyse de decision
(DA), sont adoptees et developpees comme systeme brouille de decision (FUDS) et appliquees a une etude de cas du
projet de Sagar de Ram de Sri (SRSP), Andhra Pradesh, Inde, pour choisir le meilleur sous-systeme d’execution
d’irrigation. On constate que SA et DA ont suggere le meme sous-systeme d’irrigation comme le meilleur. On
conclut que l’application de la methodologie de logique floue pour le probleme reel de prise de decision du monde
s’avere efficace. Copyright # 2005 John Wiley & Sons, Ltd.
mots cles: logique floue; prise de decision multicritere; evaluation des performances; Inde
INTRODUCTION
Multicriterion decision making (MCDM) has emerged as an effective methodology due to its ability to
combine quantitative and qualitative criteria for selection of the best alternative (Pomerol and Romero, 2000).
Received 18 March 2004
Revised 4 July 2005
Copyright # 2005 John Wiley & Sons, Ltd. Accepted 13 July 2005
*Correspondence to: Prof. D. Nagesh Kumar, Department of Civil Engineering, Indian Institute of Science, Bangalore 560 012, Karnataka,India. E-mail: [email protected] de decision multicritere brouillee dans la planification d’irrigation.
Concurrently, fuzzy logic is gaining importance due to its flexibility in handling imprecise subjective data. In
the present study concepts of fuzzy logic and MCDM are integrated and applied to a case study for selecting the
best performing irrigation subsystem. Numerous studies on fuzzy logic are reported by various researchers for
decision-making analysis in water resources planning. Raj and Kumar (1998, 1999) used maximizing and
minimizing set concepts of fuzzy logic to select the best reservoir configuration for the Krishna River basin in
India. Yin et al. (1999) employed fuzzy relation analysis for multicriteria water resource management for a
case study of Great Lakes St Lawrence River basin, USA. Raju and Kumar (1999) applied the MCDM approach
for selection of suitable irrigation planning strategy for a case study in Andhra Pradesh and employed
PROMETHEE and EXPROM for ranking. Bender and Simonovic (2000) applied fuzzy compromise
programming to water resource systems planning under uncertainty and compared it with ELECTRE. Very
little work is reported on performance evaluation studies in a multicriterion environment. Heyder et al. (1991)
explored 11 distinct long-term, system-wide alternative strategies and their impacts upon irrigation delivery
performance. The alternatives that were considered involve structural, managerial and/or policy changes.
These are compared with respect to relative cost, social acceptability, institutional acceptability and
environmental impact, as well as water delivery performance, and applied to the case study of Alamosa River
and La Jara Creek irrigation systems in the San Luis Valley of south-central Colorado. Two multicriterion
decision-making techniques, namely PROMETHEE and weighted average, were applied to rank the alternative
strategies. Similar studies are reported by Karamouz et al. (2002) where they developed an algorithm to
monitor and evaluate drip and pressure irrigation projects in Iran. Different indicators are identified and an
analytical hierarchy process is used for evaluation. The objective of the present study is to explore the use of
fuzzy decision-making algorithms in performance evaluation studies and to develop a simple, interactive
decision support system.
STUDYAREA
The Sri Ram Sagar Project (SRSP) is a state sector major irrigation project in Andhra Pradesh, India, located on
the river Godavari. The project is mainly meant for irrigation. Global coordinates of the site are 18�580 latitudenorth and 70�200 longitude east. The SRSP project has three canal systems, namely the Kakatiya, Saraswati and
Lakshmi, serving a number of irrigation subsystems (distributaries). Crops grown in the command area are
paddy (rice), jowar, maize, groundnut, sugarcane and pulses in both summer (kharif ) and winter (rabi) seasons.
Soils of the command area are categorised under red soils and black soils. Climate of the area is subtropical and
semi-arid. There is extreme variation in temperature with average maximum and minimum values of 42.2 and
28.6�C. The relative humidity varies from 65 to 80%. In the present study, four irrigation subsystems (choice
set) under the Kakatiya canal are considered and these are denoted as D1, D2, D3 and D4. These irrigation
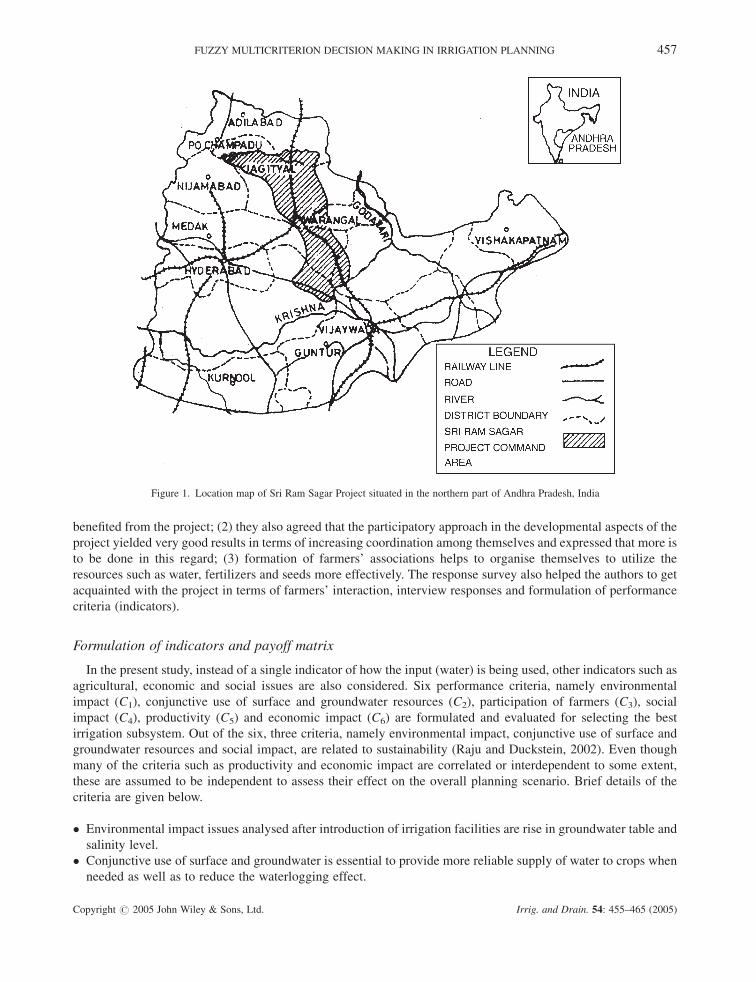
subsystems differ from each other in terms of acreages, farmers and other conditions. Figure 1 presents the
location map of the Sri Ram Sagar Project, Andhra Pradesh, India.
Farmers’ response survey
A farmers’ response survey is conducted to understand the irrigation management characteristics, constraints in
the irrigation subsystem and to identify performance indicators. Responses from 35 farmers from the four
irrigation subsystems are documented. Questions were asked regarding canal gate opening details, timing,
adequacy and distribution pattern (such as equitable, etc.) of water supply, status of supplementing canal supplies
with groundwater, usage of high-yield variety seeds, knowledge of critical periods of crops, cost of canal water,
participation in operation and management works, relationship with co-farmers and authorities and role of farmers’
associations for effective participatory irrigation management. Questions were also asked about constraints which
may reduce yield such as poor drainage, land development work, availability of marketing facilities, fertilizers and
water, and the corresponding effect on economic and social scenarios. Suggestions from farmers are also solicited
which can be useful for further improvement of the project. The main conclusions emanating from the response
survey are: (1) all farmers have expressed their satisfaction with the performance of the project and agreed that they
456 K. S. RAJU AND D. NAGESH KUMAR
Copyright # 2005 John Wiley & Sons, Ltd. Irrig. and Drain. 54: 455–465 (2005)
benefited from the project; (2) they also agreed that the participatory approach in the developmental aspects of the
project yielded very good results in terms of increasing coordination among themselves and expressed that more is
to be done in this regard; (3) formation of farmers’ associations helps to organise themselves to utilize the
resources such as water, fertilizers and seeds more effectively. The response survey also helped the authors to get
acquainted with the project in terms of farmers’ interaction, interview responses and formulation of performance
criteria (indicators).
Formulation of indicators and payoff matrix
In the present study, instead of a single indicator of how the input (water) is being used, other indicators such as
agricultural, economic and social issues are also considered. Six performance criteria, namely environmental
impact (C1), conjunctive use of surface and groundwater resources (C2), participation of farmers (C3), social
impact (C4), productivity (C5) and economic impact (C6) are formulated and evaluated for selecting the best
irrigation subsystem. Out of the six, three criteria, namely environmental impact, conjunctive use of surface and
groundwater resources and social impact, are related to sustainability (Raju and Duckstein, 2002). Even though
many of the criteria such as productivity and economic impact are correlated or interdependent to some extent,
these are assumed to be independent to assess their effect on the overall planning scenario. Brief details of the
criteria are given below.
� Environmental impact issues analysed after introduction of irrigation facilities are rise in groundwater table and
salinity level.
� Conjunctive use of surface and groundwater is essential to provide more reliable supply of water to crops when
needed as well as to reduce the waterlogging effect.
Figure 1. Location map of Sri Ram Sagar Project situated in the northern part of Andhra Pradesh, India
FUZZY MULTICRITERION DECISION MAKING IN IRRIGATION PLANNING 457
Copyright # 2005 John Wiley & Sons, Ltd. Irrig. and Drain. 54: 455–465 (2005)
� Participation of farmers: farmers’ knowledge of technology and new developments and participation are
essential for optimum utilization of resources. It is the way in which farmers use the irrigation water that
determines the success of an irrigation project.
� Social impact includes labour employment, which is measured in terms of man days employed per hectare for
each crop grown.
� Productivity of various crops for various seasons for various landholdings are to be determined.
� Economic impact includes farmers’ income and revenue collected for supply of irrigation water.
Information on the above criteria has been obtained from primary sources such as marketing societies and
irrigation, groundwater and agricultural departments. Additional information is also obtained from secondary
sources such as interviews with farmers, discussions with officials of the project, economic and statistics reports
etc. Criteria C1, C2, C3 are qualitative in type. Though the remaining criteria C4, C5, C6 are quantitative in type,
these criteria are also assumed to be qualitative, as converting productivity (yield) values of six crops to a base
equivalent for two seasons under surface and well irrigation for different landholdings becomes complex and
similar difficulties are faced for C5 and C6 also (Raju, 1995). All the above criteria are evaluated against each
irrigation subsystem (termed as a payoff matrix or system versus criteria array) on a fuzzy rating basis. Three
experts from the irrigation department who worked extensively on the above irrigation systems and have a good
knowledge of working of the subsystem are requested to fill in the payoff matrix with evaluations ranging from 1
for excellent to 0 for unsatisfactory. Farmers’ involvement is not considered for formulating this payoff matrix as
they may possess less or no information about other irrigation subsystems. However, responses from their
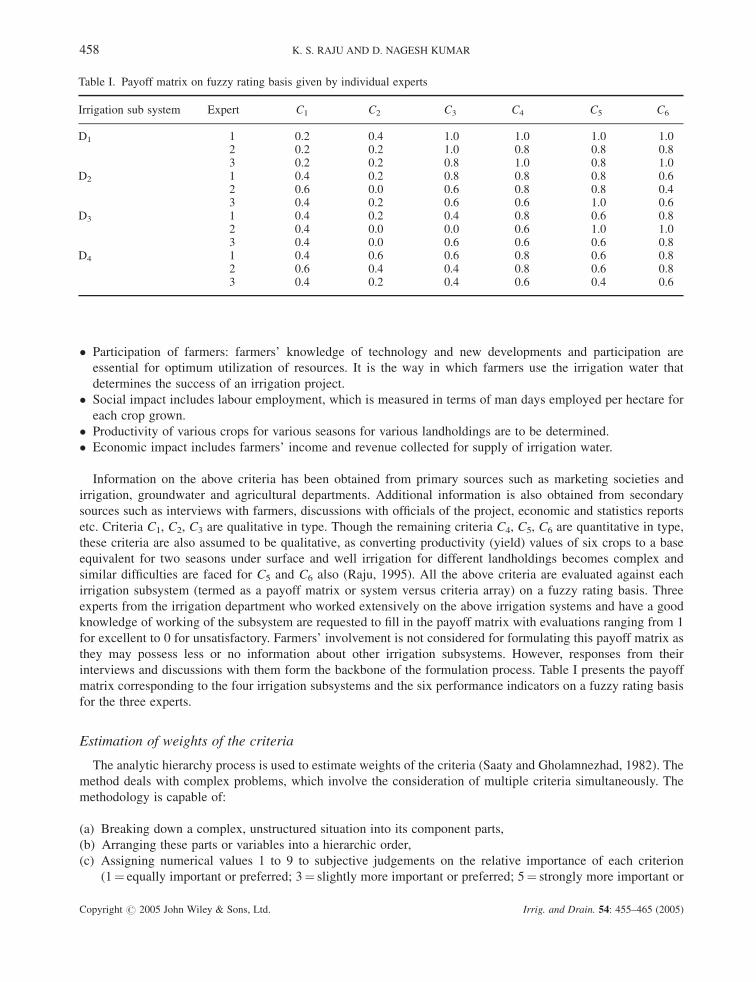
interviews and discussions with them form the backbone of the formulation process. Table I presents the payoff
matrix corresponding to the four irrigation subsystems and the six performance indicators on a fuzzy rating basis
for the three experts.
Estimation of weights of the criteria
The analytic hierarchy process is used to estimate weights of the criteria (Saaty and Gholamnezhad, 1982). The
method deals with complex problems, which involve the consideration of multiple criteria simultaneously. The
methodology is capable of:
(a) Breaking down a complex, unstructured situation into its component parts,
(b) Arranging these parts or variables into a hierarchic order,
(c) Assigning numerical values 1 to 9 to subjective judgements on the relative importance of each criterion
(1¼ equally important or preferred; 3¼ slightly more important or preferred; 5¼ strongly more important or
Table I. Payoff matrix on fuzzy rating basis given by individual experts
Irrigation sub system Expert C1 C2 C3 C4 C5 C6
D1 1 0.2 0.4 1.0 1.0 1.0 1.02 0.2 0.2 1.0 0.8 0.8 0.83 0.2 0.2 0.8 1.0 0.8 1.0
D2 1 0.4 0.2 0.8 0.8 0.8 0.62 0.6 0.0 0.6 0.8 0.8 0.43 0.4 0.2 0.6 0.6 1.0 0.6
D3 1 0.4 0.2 0.4 0.8 0.6 0.82 0.4 0.0 0.0 0.6 1.0 1.03 0.4 0.0 0.6 0.6 0.6 0.8
D4 1 0.4 0.6 0.6 0.8 0.6 0.82 0.6 0.4 0.4 0.8 0.6 0.83 0.4 0.2 0.4 0.6 0.4 0.6
458 K. S. RAJU AND D. NAGESH KUMAR
Copyright # 2005 John Wiley & Sons, Ltd. Irrig. and Drain. 54: 455–465 (2005)
preferred; 7¼ very strongly more important or preferred; 9¼ extremely more important or preferred; 2, 4, 6,
8¼ intermediate values to reflect compromise) and
(d) Synthesising the judgments to determine the overall priorities of the criteria.
An eigenvector approach that can be solved by the power method is used to compute the priorities of the criteria in
a pairwise comparison matrix. The eigenvector corresponding to maximum eigenvalue ð�maxÞ is computed. Since
small changes in elements of a pairwise comparison matrix imply a small change in �max, the deviation of the latter
from matrix size N is a deviation of consistency. This is represented by [ð�max � NÞ=ðN � 1Þ] and termed as the
consistency index (CI). Random index (RI) is the consistency index of the random matrix obtained by calculating
the consistency index for a randomly filled matrix of size N. The ratio of CI to average RI for the same order matrix
is called the consistency ratio (CR). A CR of 0.1 or less is considered acceptable.
Interaction with farmers and discussion with officials helped the decision maker to assess the importance of
criteria. For example, it was mentioned during discussion and interactions that the economic impact was slightly
more important than the environmental impact. Accordingly, values were chosen from Saaty’s scale and noted in
the pairwise comparison matrix. Similarly, other elements in the pairwise comparison matrix were noted. Table II
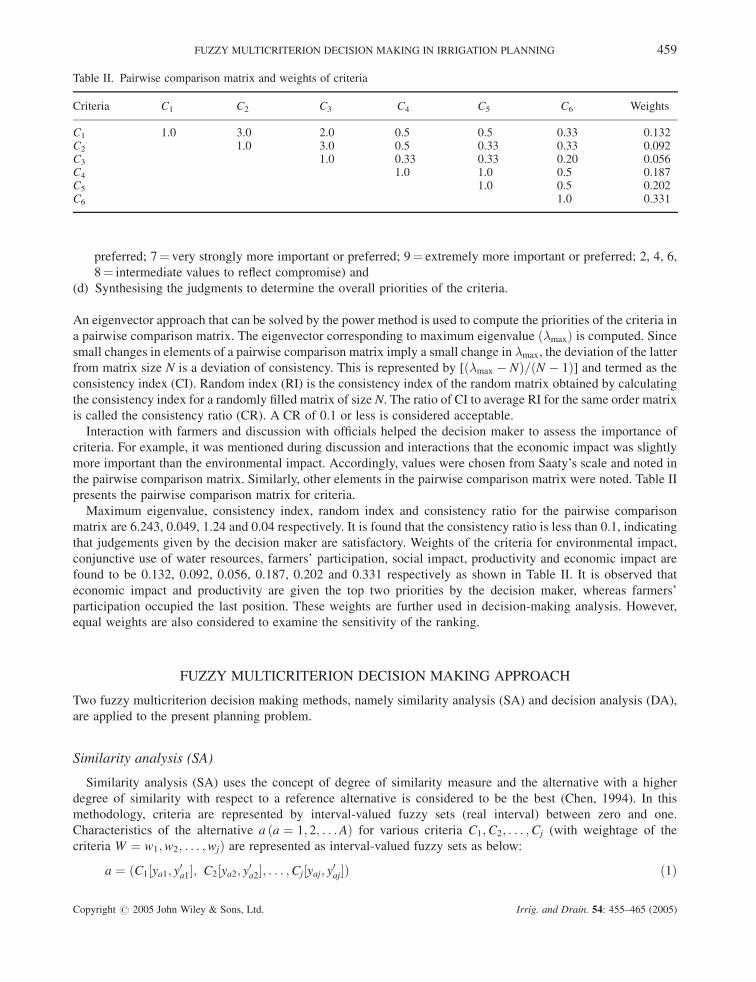
presents the pairwise comparison matrix for criteria.
Maximum eigenvalue, consistency index, random index and consistency ratio for the pairwise comparison
matrix are 6.243, 0.049, 1.24 and 0.04 respectively. It is found that the consistency ratio is less than 0.1, indicating
that judgements given by the decision maker are satisfactory. Weights of the criteria for environmental impact,
conjunctive use of water resources, farmers’ participation, social impact, productivity and economic impact are
found to be 0.132, 0.092, 0.056, 0.187, 0.202 and 0.331 respectively as shown in Table II. It is observed that
economic impact and productivity are given the top two priorities by the decision maker, whereas farmers’
participation occupied the last position. These weights are further used in decision-making analysis. However,
equal weights are also considered to examine the sensitivity of the ranking.
FUZZY MULTICRITERION DECISION MAKING APPROACH
Two fuzzy multicriterion decision making methods, namely similarity analysis (SA) and decision analysis (DA),
are applied to the present planning problem.
Similarity analysis (SA)
Similarity analysis (SA) uses the concept of degree of similarity measure and the alternative with a higher
degree of similarity with respect to a reference alternative is considered to be the best (Chen, 1994). In this
methodology, criteria are represented by interval-valued fuzzy sets (real interval) between zero and one.
Characteristics of the alternative a ða ¼ 1; 2; . . .AÞ for various criteria C1;C2; . . . ;Cj (with weightage of the
criteria W ¼ w1;w2; . . . ;wjÞ are represented as interval-valued fuzzy sets as below:
a ¼ ðC1½ya1; y0a1�; C2½ya2; y0a2�; . . . ;Cj½yaj; y0aj�Þ ð1Þ
Table II. Pairwise comparison matrix and weights of criteria
Criteria C1 C2 C3 C4 C5 C6 Weights
C1 1.0 3.0 2.0 0.5 0.5 0.33 0.132C2 1.0 3.0 0.5 0.33 0.33 0.092C3 1.0 0.33 0.33 0.20 0.056C4 1.0 1.0 0.5 0.187C5 1.0 0.5 0.202C6 1.0 0.331
FUZZY MULTICRITERION DECISION MAKING IN IRRIGATION PLANNING 459
Copyright # 2005 John Wiley & Sons, Ltd. Irrig. and Drain. 54: 455–465 (2005)
where ½yaj; y0aj� represents the fuzzy interval for the ath alternative for then jth criteria within the ranges
of [0 � yaj � y0aj � 1] with 1 � a � A. Here A and j represent the number of alternatives and criteria.
Equation (1) can also be represented in matrix notation as below:
A ¼ ½ya1; y0a1�; ½ya2; y0a2�; . . . ; ½yaj; y0aj� ð2ÞThe objective is to choose such an alternative as the best, whose characteristics are most similar to the interval-
valued fuzzy reference alternative set, R, which is expressed in the matrix notation as below:
R ¼ ½x1; x01�; ½x2; x02�; . . . ; ½xj; x0j� ð3Þwhere ½xj; x0j� represents the fuzzy interval for the reference alternative for jth criteria. Similarity between the
interval-valued fuzzy reference alternative set R and given alternative A for a specified weight setW is computed in
the form of similarity measure, S (A, R, W), as follows (Chen, 1994):
SðA;R;WÞ ¼PJ
j¼1 ½1� ðjyaj � xjj þ jy0aj � x0jjÞ=2 � wj�PJj¼1 wj
ð4Þ
Similarity measure values vary from zero to one. The higher the value of SðA;R;WÞ, the higher the similarity
between the interval-valued fuzzy sets A and R. In the present study the similarity measure is aimed at for selection
of the best alternative. More information about similarity measures is given in the Appendix.
Decision analysis (DA)
Decision analysis (DA) uses the concept of decision (membership) function and the alternative with a higher
value of decision function is considered to be the best (Ross, 1995). In this methodology the decision function D is
defined as
D ¼ MðC1;w1Þ \MðC2;w2Þ \ . . . . . . \MðCj;wjÞ ð5ÞwhereM ( ) is a decision measure involving criteria and weights. The decision measure for a particular alternative a
is defined as
MðCjðaÞ;wjÞ ¼ wj ! CjðaÞ ¼ �wwj [ CjðaÞ ð6ÞThe decision function for the above scenario is given as
D ¼ \Jj¼1
ð�wwj [ CjÞ ð7Þ
and the optimum solution a* is the alternative that maximizes D. Defining dummy variable Ej as
Ej ¼ ð�wwj [ CjÞ ð8Þthe membership function form �Ej
ðaÞ for variable Ej is
�EjðaÞ ¼ max½��wwj
ðaÞ; �cjðaÞ� ð9ÞThe optimum decision function, expressed in membership form, is given as
�Dða�Þ ¼ minf�E1ðaÞ; �E2
ðaÞ; . . . ; �EJðaÞg ð10Þ
RESULTS AND DISCUSSION
Two fuzzy MCDM methods, viz. similarity analysis (SA) and decision analysis (DA), are programmed in a Visual
Basic environment (Cornell, 2001) in the form of a decision support system and named as FUDS (FUzzy Decision
460 K. S. RAJU AND D. NAGESH KUMAR
Copyright # 2005 John Wiley & Sons, Ltd. Irrig. and Drain. 54: 455–465 (2005)
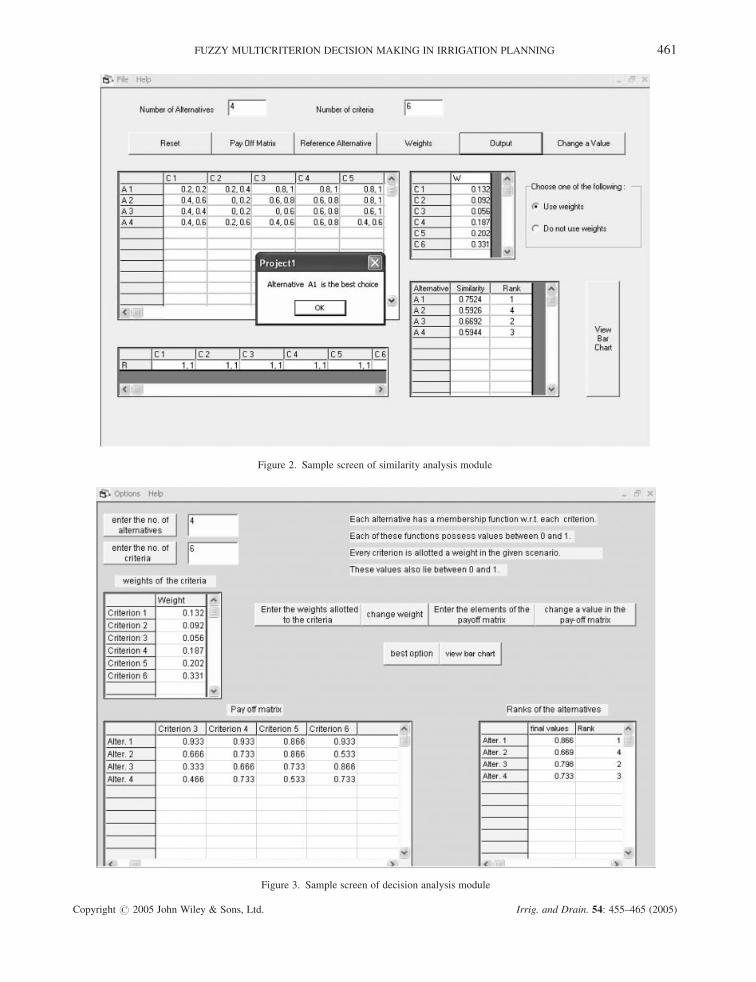
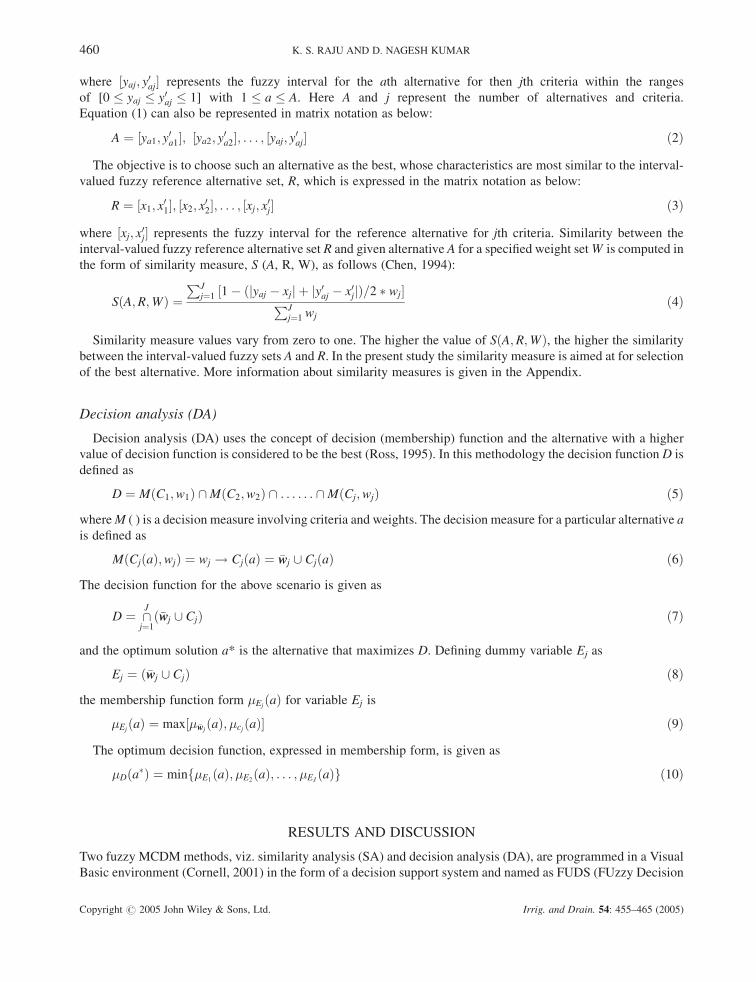
Figure 2. Sample screen of similarity analysis module
Figure 3. Sample screen of decision analysis module
FUZZY MULTICRITERION DECISION MAKING IN IRRIGATION PLANNING 461
Copyright # 2005 John Wiley & Sons, Ltd. Irrig. and Drain. 54: 455–465 (2005)
System). Figures 2 and 3 present the sample screen of SA and DA approach modules of FUDS respectively. In both
the modules common inputs are number of alternatives, criteria, payoff matrix and weights of criteria. Provision
for changing the payoff matrix values and weights are also incorporated in both the modules. Provision for
graphical representation of ranking pattern in the form of a bar chart is also made.
Similarity analysis (SA) module
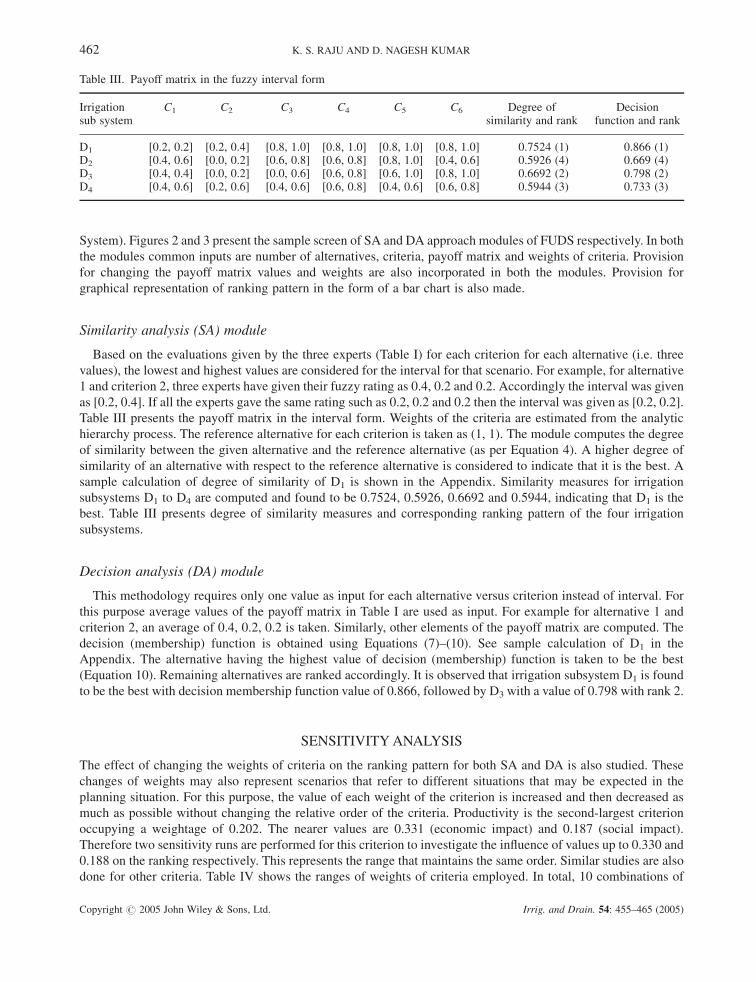
Based on the evaluations given by the three experts (Table I) for each criterion for each alternative (i.e. three
values), the lowest and highest values are considered for the interval for that scenario. For example, for alternative
1 and criterion 2, three experts have given their fuzzy rating as 0.4, 0.2 and 0.2. Accordingly the interval was given
as [0.2, 0.4]. If all the experts gave the same rating such as 0.2, 0.2 and 0.2 then the interval was given as [0.2, 0.2].
Table III presents the payoff matrix in the interval form. Weights of the criteria are estimated from the analytic
hierarchy process. The reference alternative for each criterion is taken as (1, 1). The module computes the degree
of similarity between the given alternative and the reference alternative (as per Equation 4). A higher degree of
similarity of an alternative with respect to the reference alternative is considered to indicate that it is the best. A
sample calculation of degree of similarity of D1 is shown in the Appendix. Similarity measures for irrigation
subsystems D1 to D4 are computed and found to be 0.7524, 0.5926, 0.6692 and 0.5944, indicating that D1 is the
best. Table III presents degree of similarity measures and corresponding ranking pattern of the four irrigation
subsystems.
Decision analysis (DA) module
This methodology requires only one value as input for each alternative versus criterion instead of interval. For
this purpose average values of the payoff matrix in Table I are used as input. For example for alternative 1 and
criterion 2, an average of 0.4, 0.2, 0.2 is taken. Similarly, other elements of the payoff matrix are computed. The
decision (membership) function is obtained using Equations (7)–(10). See sample calculation of D1 in the
Appendix. The alternative having the highest value of decision (membership) function is taken to be the best
(Equation 10). Remaining alternatives are ranked accordingly. It is observed that irrigation subsystem D1 is found
to be the best with decision membership function value of 0.866, followed by D3 with a value of 0.798 with rank 2.
SENSITIVITYANALYSIS
The effect of changing the weights of criteria on the ranking pattern for both SA and DA is also studied. These
changes of weights may also represent scenarios that refer to different situations that may be expected in the
planning situation. For this purpose, the value of each weight of the criterion is increased and then decreased as
much as possible without changing the relative order of the criteria. Productivity is the second-largest criterion
occupying a weightage of 0.202. The nearer values are 0.331 (economic impact) and 0.187 (social impact).
Therefore two sensitivity runs are performed for this criterion to investigate the influence of values up to 0.330 and
0.188 on the ranking respectively. This represents the range that maintains the same order. Similar studies are also
done for other criteria. Table IV shows the ranges of weights of criteria employed. In total, 10 combinations of
Table III. Payoff matrix in the fuzzy interval form
Irrigation C1 C2 C3 C4 C5 C6 Degree of Decisionsub system similarity and rank function and rank
D1 [0.2, 0.2] [0.2, 0.4] [0.8, 1.0] [0.8, 1.0] [0.8, 1.0] [0.8, 1.0] 0.7524 (1) 0.866 (1)D2 [0.4, 0.6] [0.0, 0.2] [0.6, 0.8] [0.6, 0.8] [0.8, 1.0] [0.4, 0.6] 0.5926 (4) 0.669 (4)D3 [0.4, 0.4] [0.0, 0.2] [0.0, 0.6] [0.6, 0.8] [0.6, 1.0] [0.8, 1.0] 0.6692 (2) 0.798 (2)D4 [0.4, 0.6] [0.2, 0.6] [0.4, 0.6] [0.6, 0.8] [0.4, 0.6] [0.6, 0.8] 0.5944 (3) 0.733 (3)
462 K. S. RAJU AND D. NAGESH KUMAR
Copyright # 2005 John Wiley & Sons, Ltd. Irrig. and Drain. 54: 455–465 (2005)
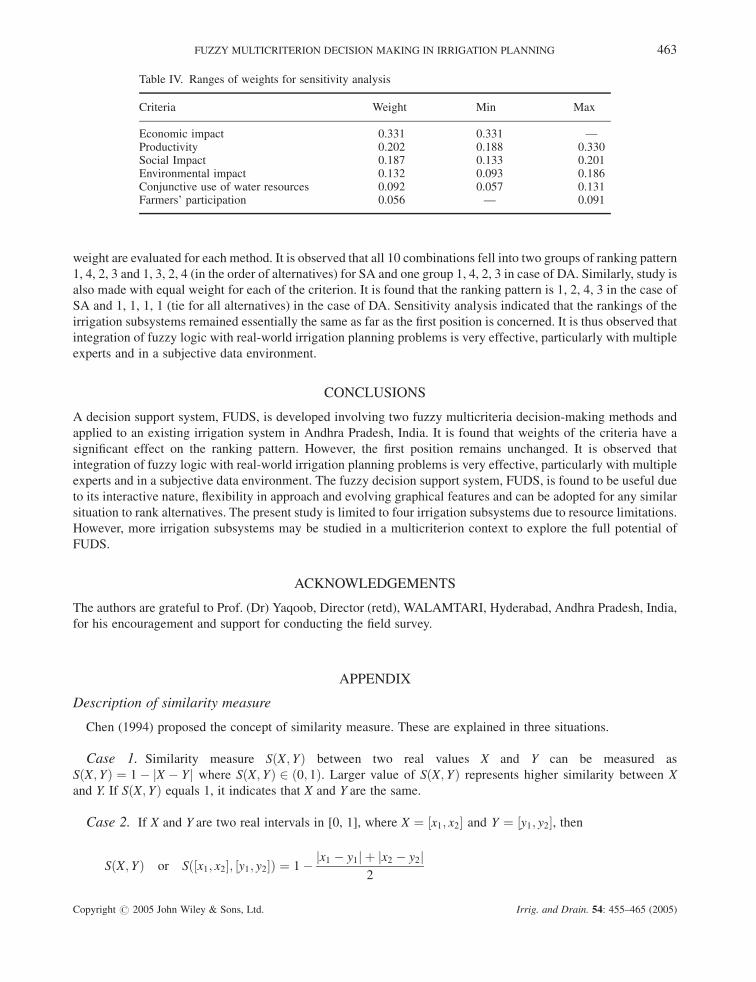
weight are evaluated for each method. It is observed that all 10 combinations fell into two groups of ranking pattern
1, 4, 2, 3 and 1, 3, 2, 4 (in the order of alternatives) for SA and one group 1, 4, 2, 3 in case of DA. Similarly, study is
also made with equal weight for each of the criterion. It is found that the ranking pattern is 1, 2, 4, 3 in the case of
SA and 1, 1, 1, 1 (tie for all alternatives) in the case of DA. Sensitivity analysis indicated that the rankings of the
irrigation subsystems remained essentially the same as far as the first position is concerned. It is thus observed that
integration of fuzzy logic with real-world irrigation planning problems is very effective, particularly with multiple
experts and in a subjective data environment.
CONCLUSIONS
A decision support system, FUDS, is developed involving two fuzzy multicriteria decision-making methods and
applied to an existing irrigation system in Andhra Pradesh, India. It is found that weights of the criteria have a
significant effect on the ranking pattern. However, the first position remains unchanged. It is observed that
integration of fuzzy logic with real-world irrigation planning problems is very effective, particularly with multiple
experts and in a subjective data environment. The fuzzy decision support system, FUDS, is found to be useful due
to its interactive nature, flexibility in approach and evolving graphical features and can be adopted for any similar
situation to rank alternatives. The present study is limited to four irrigation subsystems due to resource limitations.
However, more irrigation subsystems may be studied in a multicriterion context to explore the full potential of
FUDS.
ACKNOWLEDGEMENTS
The authors are grateful to Prof. (Dr) Yaqoob, Director (retd), WALAMTARI, Hyderabad, Andhra Pradesh, India,
for his encouragement and support for conducting the field survey.
APPENDIX
Description of similarity measure
Chen (1994) proposed the concept of similarity measure. These are explained in three situations.
Case 1. Similarity measure SðX; YÞ between two real values X and Y can be measured as
SðX; YÞ ¼ 1� jX � Y j where SðX; YÞ 2 ð0; 1Þ. Larger value of SðX; YÞ represents higher similarity between X
and Y. If SðX; YÞ equals 1, it indicates that X and Y are the same.
Case 2. If X and Y are two real intervals in [0, 1], where X ¼ ½x1; x2� and Y ¼ ½y1; y2�, then
SðX; YÞ or Sð½x1; x2�; ½y1; y2�Þ ¼ 1� jx1 � y1j þ jx2 � y2j2
Table IV. Ranges of weights for sensitivity analysis
Criteria Weight Min Max
Economic impact 0.331 0.331 —Productivity 0.202 0.188 0.330Social Impact 0.187 0.133 0.201Environmental impact 0.132 0.093 0.186Conjunctive use of water resources 0.092 0.057 0.131Farmers’ participation 0.056 — 0.091
FUZZY MULTICRITERION DECISION MAKING IN IRRIGATION PLANNING 463
Copyright # 2005 John Wiley & Sons, Ltd. Irrig. and Drain. 54: 455–465 (2005)
Case 3. Similarity measure S (A, R, W) of alternative A with reference to R for a given weight set W
(W ¼ w1;w2; . . . ;wj) is given as (Chen, 1994)
SðA;R;WÞ ¼PJ
j¼1 ½1� ðjyaj � xjj þ jy0aj � x0jjÞ=2 � wj�PJj¼1 wj
where A and R are two real intervals in [0, 1] and represented as
A ¼ ½ya1; y0a1�; ½ya2; y0a2�; . . . ; ½yaj; y0aj�
R ¼ ½x1; x01�; ½x2; x02�; . . . ; ½xj; x0j�
Sample calculations for similarity analysis (SA)
Calculations of degree of similarity are with reference to Table III using Equation (4). Normalized weights of the
six criteria are 0.132, 0.092, 0.056, 0.187, 0.202, 0.331. Substituting values in Table III for irrigation subsystem D1
and substitutingPJ
j¼1 wj ¼ 1, in Equation (4), the degree of similarity for irrigation subsystem D1 is computed as
follows:
1� j0:2� 1:0j þ j0:2� 1:0j2
� �� 0:132þ 1� j0:2� 1:0j þ j0:4� 1:0j
2
� �� 0:092
þ 1� j0:8� 1:0j þ j1:0� 1:0j2
� �� 0:056þ 1� j0:8� 1:0j þ j1:0� 1:0j
2
� �� 0:187
þ 1� j0:8� 1:0j þ j1:0� 1:0j2
� �� 0:202þ 1� j0:8� 1:0j þ j1:0� 1:0j
2
� �� 0:331 ¼ 0:7524
Sample calculations for decision analysis (DA)
Calculations of decision measure are based on average values in Table I. �wwj ¼ 1� wj where wj are weights of six
criteria (0.132, 0.092, 0.056, 0.187, 0.202, 0.331); �wwj values for six criteria are 0.868, 0.908, 0.944, 0.813, 0.798,
0.669.
As per Equation (7):
D ¼ ð�ww1 [ C1Þ \ ð�ww2 [ C2Þ \ ð�ww3 [ C3Þ \ ð�ww4 [ C4Þ \ ð�ww5 [ C5Þ \ ð�ww6 [ C6ÞDefining dummy variable Ej as
Ej ¼ ð�wwj [ CjÞ ð8ÞEquation (8) can be expressed in the membership function form resulting in Equation (9):
�EjðaÞ ¼ max½��wwj
ðaÞ; �cjðaÞ��Ej
ðaÞ ¼ fmax½��ww1ðaÞ; �c1ðaÞ�;max½��ww2
ðaÞ; �c2ðaÞ�;max½��ww3ðaÞ; �c3ðaÞ�;
max½��ww4ðaÞ; �c4ðaÞ�;max½��ww5
ðaÞ; �c5ðaÞ�;max½��ww6ðaÞ; �c6ðaÞ�g
¼ ð0:868 [ 0:2Þ; ð0:908 [ 0:266Þ; ð0:944 [ 0:933Þ; ð0:813 [ 0:933Þ; ð0:798 [ 0:866Þ; ð0:669 [ 0:933Þ½ �¼ ð0:868; 0:908; 0:944; 0:933; 0:866; 0:933Þ½ �
464 K. S. RAJU AND D. NAGESH KUMAR
Copyright # 2005 John Wiley & Sons, Ltd. Irrig. and Drain. 54: 455–465 (2005)
As per Equation (10),
�Dða�Þ ¼ minf�EjðaÞg
¼ minf�E1ðaÞ; �E2
ðaÞ; . . . ; �EjðaÞg
¼ min ð0:868; 0:908; 0:944; 0:933; 0:866; 0:933Þ½ � ¼ 0:866
REFERENCES
Bender MJ, Simonovic SP. 2000. A fuzzy compromise approach to water resource systems planning under uncertainty. Fuzzy Sets and Systems
115: 35–44.
Chen SM. 1994. A new method for handling multicriteria fuzzy decision making problems. Cybernetics and Systems 25: 409–420.
Cornell G. 2001. Visual Basic 6 from the Ground up. Tata McGraw-Hill: New Delhi, India.
Heyder WE, Gates TK, Fontane DG, Salas JD. 1991. Multicriterion strategic planning for improved irrigation delivery. II: application. Journal
of Irrigation and Drainage Engineering 117: 914–934.
Karamouz M, Kerachian R, Zahraie B, Nejhad SA. 2002. Monitoring and evaluation scheme using the multiple-criteria-decision-making
technique: application to irrigation projects. Journal of Irrigation and Drainage Engineering 128: 341–350.
Pomerol J Ch, Romero SB. 2000. Multicriterion Decision in Management: Principles and Practice. Kluwer Academic: Dordrecht, The
Netherlands.
Raj PA, Nagesh Kumar D. 1998. Ranking multi-criterion river basin planning alternatives using fuzzy numbers. Fuzzy Sets and Systems 100:
89–99.
Raj PA, Nagesh Kumar D. 1999. Ranking alternatives with fuzzy weights using maximizing set and minimizing set. Fuzzy Sets and Systems 105:
365–375.
Raju KS. 1995. Studies on multicriterion decision making methods and management of irrigation systems. Unpublished doctoral dissertation,
Indian Institute of Technology, Kharagpur, India.
Raju KS, Duckstein L. 2002. Multicriterion analysis for ranking an irrigation system: an Indian case study. Journal of Decision Systems 11: 499–
511.
Raju KS, Nagesh Kumar D. 1999. Multicriterion decision making in irrigation development strategies. Journal of Agricultural Systems 62: 117–
129.
Ross TJ. 1995. Fuzzy logic with Engineering Applications. McGraw-Hill, Inc: New York, USA.
Saaty TL, Gholamnezhad H. 1982. High level nuclear waste management: analysis of options. Environment and Planning 9: 181–196.
Yin YY, Huang GH, Hipel KW. 1999. Fuzzy relation analysis for multicriteria water resources management. Journal of Water Resource
Planning and Management, ASCE 125: 41–47.
FUZZY MULTICRITERION DECISION MAKING IN IRRIGATION PLANNING 465
Copyright # 2005 John Wiley & Sons, Ltd. Irrig. and Drain. 54: 455–465 (2005)
Related Documents


![Chapter 3: Fuzzy Rules & Fuzzy Reasoning513].pdf · CH. 3: Fuzzy rules & fuzzy reasoning 1 Chapter 3: Fuzzy Rules & Fuzzy Reasoning ... Application of the extension principle to fuzzy](https://static.cupdf.com/doc/110x72/5b3ed7b37f8b9a3a138b5aa0/chapter-3-fuzzy-rules-fuzzy-513pdf-ch-3-fuzzy-rules-fuzzy-reasoning.jpg)