International Journal of Information Sciences and Techniques (IJIST) Vol.4, No.3, May 2014 DOI : 10.5121/ijist.2014.4322 179 FUZZY BASED HYPERSPECTRAL IMAGE SEGMENTATION USING SUBPIXEL DETECTION VeeraSenthilKumar.G 1 , Dhivya.M 2 , Sivasangari.R 3 , Suganya.V 4 1 Assistant Professor, 2 UG Student, 3 UG Student, 4 UG Student Department of ECE,Velammal College of Engineering and Technology, Tamil Nadu, India ABSTRACT Spatial analysis of images sensed and captured from a satellite provides less adequate information about a remote location. Hence spectral analysis becomes essential. Hyperspectral image is one of the remotely sensed images, superior to multispectral images in providing spectral information. Target detection is one of the significant requirements in many areas such as military, agriculture etc. Sub pixel target detection, which further divides each pixel of the image into partitions, is possible only with spectral analysis of hyperspectral image. This paper focuses on developing an algorithm for segmenting hyperspectral image using sub pixel target detection followed by Fuzzy C-Means(FCM) clustering technique. Principal Component Analysis (PCA) is the basic step adopted to reduce the high dimensional data of image to low dimensional data. Mixture tuned matched filtering technique is used for sub pixel target detection because it is a combination of linear spectral unmixing and matched filtering and has advantages of both the techniques. Keywords Spectral analysis, Hyperspectral image segmentation, Sub-pixel detection and FCM. 1. INTRODUCTION HYPERSPECTRAL image is a high-dimensional image set that typically consists of 100-200 image channels. Hyper spectral imaging is the simultaneous acquisition of hundreds of narrow contiguous spectral bands. Multispectral images consists only RGB colors and captures image data at specific frequencies across the electromagnetic spectrum. Each channel in the hyperspectral image is a gray scale image that indicates the spectral response to a particular frequency in the electromagnetic spectrum. These frequencies usually include the visible spectrum of light, but almost all of the channels are focused in the infrared range (IR). This allows a hyperspectral image to have features that are invisible in a standard color image. Each pixel in the hyperspectral image will possess a spectral response vector that is the high- dimensional equivalent of the ‘color’ of the pixel. Certain materials have a specific spectral signature which can be used to identify pixels containing that material. For this reason, there is great demand in developing fast detection techniques in hyperspectral imaging for applications such as Aerial surveillance, agricultural and chemical analysis, mineral analysis and medical imaging. These hyperspectral images are acquired using hyperspectral sensors. There are varieties of sensors available for capturing these images. Important of these are AVIRIS and HYDICE. The AVIRIS sensor provides data sets of the hyperspectral images consisting of multiple bands. Datasets of AVIRIS sensor have been used in this project for experimentation. Hyperspectral

Welcome message from author
This document is posted to help you gain knowledge. Please leave a comment to let me know what you think about it! Share it to your friends and learn new things together.
Transcript
International Journal of Information Sciences and Techniques (IJIST) Vol.4, No.3, May 2014
DOI : 10.5121/ijist.2014.4322 179
FUZZY BASEDHYPERSPECTRAL IMAGESEGMENTATION USING SUBPIXEL DETECTION
VeeraSenthilKumar.G1, Dhivya.M2, Sivasangari.R3, Suganya.V4
1Assistant Professor, 2UG Student, 3UG Student, 4UG StudentDepartment of ECE,Velammal College of Engineering and Technology, Tamil Nadu,
India
ABSTRACT
Spatial analysis of images sensed and captured from a satellite provides less adequate information about aremote location. Hence spectral analysis becomes essential. Hyperspectral image is one of the remotelysensed images, superior to multispectral images in providing spectral information. Target detection is oneof the significant requirements in many areas such as military, agriculture etc. Sub pixel target detection,which further divides each pixel of the image into partitions, is possible only with spectral analysis ofhyperspectral image. This paper focuses on developing an algorithm for segmenting hyperspectral imageusing sub pixel target detection followed by Fuzzy C-Means(FCM) clustering technique. PrincipalComponent Analysis (PCA) is the basic step adopted to reduce the high dimensional data of image to lowdimensional data. Mixture tuned matched filtering technique is used for sub pixel target detection becauseit is a combination of linear spectral unmixing and matched filtering and has advantages of both thetechniques.
Keywords
Spectral analysis, Hyperspectral image segmentation, Sub-pixel detection and FCM.
1. INTRODUCTION
HYPERSPECTRAL image is a high-dimensional image set that typically consists of 100-200image channels. Hyper spectral imaging is the simultaneous acquisition of hundreds of narrowcontiguous spectral bands. Multispectral images consists only RGB colors and captures imagedata at specific frequencies across the electromagnetic spectrum. Each channel in thehyperspectral image is a gray scale image that indicates the spectral response to a particularfrequency in the electromagnetic spectrum. These frequencies usually include the visiblespectrum of light, but almost all of the channels are focused in the infrared range (IR). Thisallows a hyperspectral image to have features that are invisible in a standard color image. Eachpixel in the hyperspectral image will possess a spectral response vector that is the high-dimensional equivalent of the ‘color’ of the pixel. Certain materials have a specific spectralsignature which can be used to identify pixels containing that material. For this reason, there isgreat demand in developing fast detection techniques in hyperspectral imaging for applicationssuch as Aerial surveillance, agricultural and chemical analysis, mineral analysis and medicalimaging. These hyperspectral images are acquired using hyperspectral sensors. There are varietiesof sensors available for capturing these images. Important of these are AVIRIS and HYDICE.The AVIRIS sensor provides data sets of the hyperspectral images consisting of multiple bands.Datasets of AVIRIS sensor have been used in this project for experimentation. Hyperspectral

International Journal of Information Sciences and Techniques (IJIST) Vol.4, No.3, May 2014
180
images are mainly used in three areas of interest namely Anomaly detection, Target detection andMaterial identification. This paper focuses on target detection i.e., finding within the imagery,materials that are present and match them with the existing spectral libraries. All pixels whosespectra match the target spectrum are marked as potential targets. The underlying assumption isthat the pixels containing the target are all “pure”.
Jun Li et al. proposed an algorithm for supervised Hyperspectral image segmentation usingBayesian framework with active learning in the year 2011. The algorithm implements two mainsteps semi supervised learning of the posterior class distributions followed by segmentation,which infers an image of class labels from a posterior distribution built on the learned classdistributions and on a Markov random field [2]. This method is about integration of subspaceprojection methods with the MLR algorithm, combined with the use of spatial–contextualinformation [1]. Janete S. Borges et al. proposed a supervised technique to segment hyperspectralimages: the Bayesian segmentation based on discriminative classification and on multilevellogistic (MLL) spatial prior [3]. Hernâni Gonçalves et al. proposed AIR method which is basedon the combination of image segmentation and SIFT, complemented by a robust procedure ofoutlier removal. This combination allows for an accurate obtention of tie points for a pair ofremote sensing images, being a powerful scheme for AIR [4]. Gokan Bilgin et al. presented anunsupervised Hyperspectral image segmentation with a new subtractive-clustering-basedsimilarity segmentation and a novel cluster validation method using one-class support vector (SV)machine (OC-SVM)[5].
The proposed method consists of four major parts. They are:
• Preprocessing• Principal component analysis• Sub-pixel detection• Fuzzy c – means
Section II of this paper describes the preprocessing technique which always must be done for anyimage processing. Preprocessing varies according to our requirement. This section gives varioustechniques and their advantages. Section III describes the principal component analysis technique.Principal components are the main components or features in an image. They are to be found outfrom the image in order to enable further processing efficiently. Here, preprocessing is done toreduce dimension of the high dimensional Hyperspectral data set. Section IV describes the sub-pixel target detection technique which is used to detect the target in the sub-pixel level. Varioustechniques used are also discussed. Section V discusses the Fuzzy c-mean algorithm which isused for segmentation of Hyperspectral image. Section VII consists of the results we obtained ineach stage.
2. PREPROCESSING:
The aim of the spectral preprocessing is to avoid the effect of undesirable phenomena that affectthe spectral measurement like light scattering, morphological differences or particle size effectssuch as surface roughness, detected artifacts etc. In the field of Hyperspectral the most generalpractice is to adapt well known preprocessing techniques of classical spectrography.
International Journal of Information Sciences and Techniques (IJIST) Vol.4, No.3, May 2014
181
Main spectral preprocessing techniques:
i) Denoisingii) Scatter correction
iii) Derivatives
i) Denoising:
Denoising means the instrumental noise can be partially removed by using smoothing techniques.Many different algorithms are used in smoothing. But Savitzky-Golay is one of the well knowntechniques.
ii) Scatter correction:
Light scattering is one of the main pitfalls when for example, NIR spectra are measured. In thesense, the most widely used methods for scatter minimization are standard normal variate andmultiplicative scattering correction.
iii) Derivatives:
The Savitzky-Golay filter is also used in finding spectral derivative in order to minimize additiveeffects as spectral base line slopes and offsets. First derivative eliminates an additive base line;second derivatives eliminate the linear base line. Generally, derivative transform emphasizes thespectral features of the data. But it can also promote on emphasis at the level of noise. So, specialattention must be paid in the selection of the parameters for tuning the filter.
Standard A4 (210mm x 297mm) portrait page set-up should be used. The left, right, top andbottom margins should be 30mm. Do not use any headers, footers or footnotes. No pagenumbers. Single column. All main text paragraphs, including the abstract, must be fully (left andright) justified. All text, including title, authors, headings, captions and body, will be Times NewRoman font.
3. PRINCIPAL COMPONENT ANALYSIS:
PCA is a widely used dimension reduction technique in image data analysis. It is theoptimal linear scheme for minimizing a set of high dimensional vectors into a set of lowerdimensional vectors[14]. There are two kinds of methods to perform PrincipalComponent Analysis, the matrix method, and the data method. In this work, focus will beon matrix methods. To compute PCA, we follow the general 4 steps given below:
i) Find the mean vector in x-space.ii) Assemble the covariance matrix in x-space.iii) Compute Eigen values and corresponding eigenvectors.iv) Form the components in y-space.
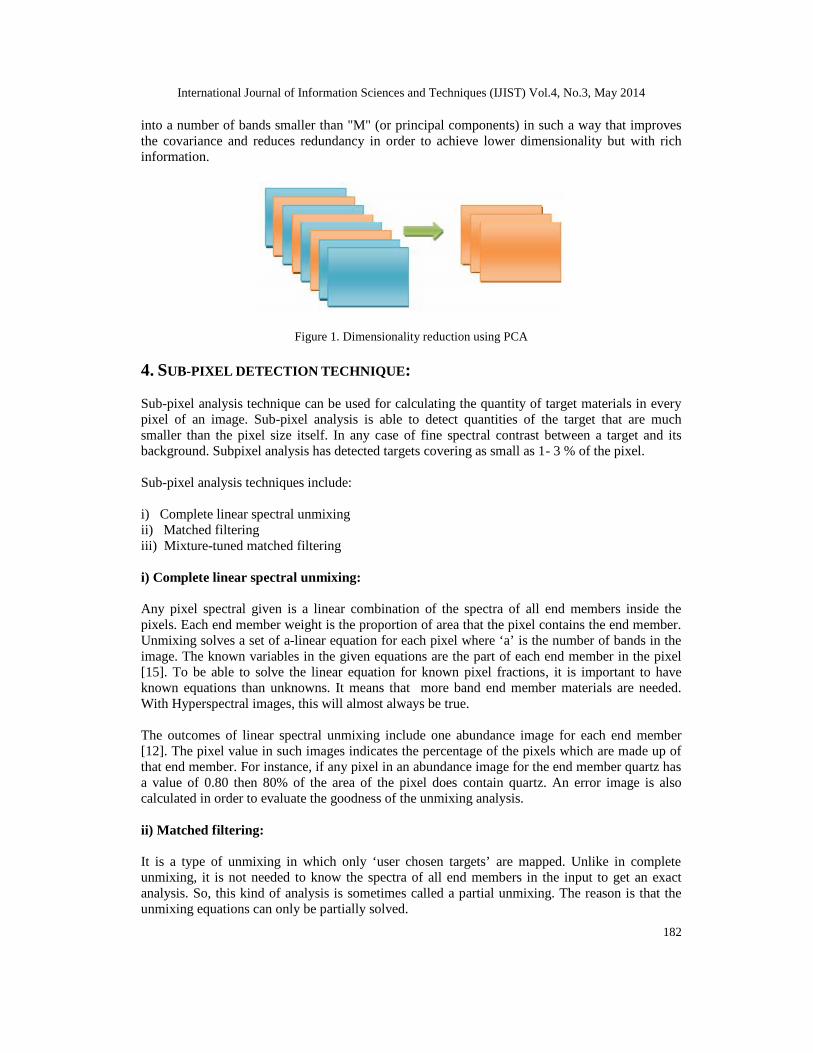
It is shown in the figure 1 that only the first few components are likely to contain the neededinformation. The number of components that hold the majority of or the very importantinformation is called the intrinsic dimensionality and each data image may contain a differentintrinsic dimensionality [7]. PCA condenses all the information of an "M" band original data set
International Journal of Information Sciences and Techniques (IJIST) Vol.4, No.3, May 2014
182
into a number of bands smaller than "M" (or principal components) in such a way that improvesthe covariance and reduces redundancy in order to achieve lower dimensionality but with richinformation.
Figure 1. Dimensionality reduction using PCA
4. SUB-PIXEL DETECTION TECHNIQUE:
Sub-pixel analysis technique can be used for calculating the quantity of target materials in everypixel of an image. Sub-pixel analysis is able to detect quantities of the target that are muchsmaller than the pixel size itself. In any case of fine spectral contrast between a target and itsbackground. Subpixel analysis has detected targets covering as small as 1- 3 % of the pixel.
Sub-pixel analysis techniques include:
i) Complete linear spectral unmixingii) Matched filteringiii) Mixture-tuned matched filtering
i) Complete linear spectral unmixing:
Any pixel spectral given is a linear combination of the spectra of all end members inside thepixels. Each end member weight is the proportion of area that the pixel contains the end member.Unmixing solves a set of a-linear equation for each pixel where ‘a’ is the number of bands in theimage. The known variables in the given equations are the part of each end member in the pixel[15]. To be able to solve the linear equation for known pixel fractions, it is important to haveknown equations than unknowns. It means that more band end member materials are needed.With Hyperspectral images, this will almost always be true.
The outcomes of linear spectral unmixing include one abundance image for each end member[12]. The pixel value in such images indicates the percentage of the pixels which are made up ofthat end member. For instance, if any pixel in an abundance image for the end member quartz hasa value of 0.80 then 80% of the area of the pixel does contain quartz. An error image is alsocalculated in order to evaluate the goodness of the unmixing analysis.
ii) Matched filtering:
It is a type of unmixing in which only ‘user chosen targets’ are mapped. Unlike in completeunmixing, it is not needed to know the spectra of all end members in the input to get an exactanalysis. So, this kind of analysis is sometimes called a partial unmixing. The reason is that theunmixing equations can only be partially solved.
International Journal of Information Sciences and Techniques (IJIST) Vol.4, No.3, May 2014
183
Matched filtering filters the given input image for better matches to the chosen target spectrum byenhancing the response of the target spectrum within the data and neglecting the response of otherspectrum expect the target one, which is treated as a composite unknown background to thetarget. Similar to complete unmixing, a pixel value in the response image is proportional to thefraction of the pixel which contains the target object. If a pixel contain a value of 0 or even lesserthan with a value of 0 or less than it, then that will be interpreted as background.
One critical problem with this matched filtering technique is that, it may end up with falsepositive results. One possible solution to this problem that can be obtained in ENVI is to find outan additional measure called infeasibility that is the method called Mixture Tuned MatchedFiltering.
iii) Mixture tuned matched filtering:
It is a hybrid method which is the combination of the matched filter method. It is not required toknow all end members and linear mixture theory. The results of mixture tuned matched filteringwill be two images. They are
a) MF score image (0-1)b) Infeasibility image, the smaller its value better will be the matching.
Infeasibility is based on both noise and image statistics. This image indicates the degree to whichthe matched filtering outcome is a feasible mixture of the target and background. All pixels withhigh infeasibilities are likely to be false positives regardless of their matched filter value. 2Dscatter plot is used to locate pixel in an image
5. FUZZY CLUSTERING TECHNIQUE:
Clustering of numerical data forms the basis of many classification and other system modelingalgorithms. The main purpose of clustering is to identify natural groupings of data from a largedata set to produce a concise representation of behavior of a system. FCM is a data clusteringtechnique in which a dataset is grouped into n clusters with every data point in the datasetbelonging to every cluster to a certain degree. For example, a certain data point that lies close tothe center of a cluster will have a high degree of belonging or membership to that cluster andanother data point that lies far away from the center of a cluster will have a low degree ofbelonging or membership to that cluster. It starts with an initial guess for the cluster centers,which are intended to mark the mean location of each and every cluster. The initial guess for suchcluster centers is most likely to be incorrect. Next, FCM assigns every data point a membershipgrade for every cluster. By iteratively updating the cluster centers and the membership grades foreach data point, FCM iteratively moves the cluster centers to the right location within a particulardata set. This iteration is based on reducing an objective function that represents the distance fromany given data point to a cluster center weighted by that data point's membership grade.
The aim of image segmentation is to partition an image into a set of disjoint regions with uniformand homogeneous attributes such as intensity, color, tone or texture, etc. Many segmentationtechniques have been developed and detailed surveys can be found in references. The imagesegmentation approaches can be divided into four categories. They are Thresholding, clustering,edge detection and region extraction. Clustering is a process for classifying objects or patterns insuch a way that samples of the same group are more similar to one another than samplesbelonging to various groups. Many clustering strategies have been used, such as the hard

International Journal of Information Sciences and Techniques (IJIST) Vol.4, No.3, May 2014
184
clustering scheme and the fuzzy clustering technique, each of which has its own specialcharacteristics. . Among the fuzzy clustering methods, FCM algorithm is the most popularmethod used in image segmentation because it has robust characteristics for ambiguity and canretain more information than hard segmentation methods.The FCM clustering algorithm was first introduced by Dunn and later was extended by Bezdek.The algorithm is an iterative clustering method that produces an optimal c partition byminimizing the weighted within group sum of squared error objective function JFCM :
= ( ) ( , ) (1)where X = {x1, x2, · · · , xn} ⊆ Rp is the data set in the p-dimensional vector space, n is thenumber of data items, c is the number of clusters with 2 ≤ c < n, uik is the degree of membershipof xk in the ith cluster, q is a weighting exponent on each fuzzy membership, vi is the prototype ofthe centre of cluster i, d2 (xk, vi) is a distance measure between object xk and cluster centre vi. Asolution of the object function JFCM can be obtained via an iterative process, which is carried outas follows:
1. Set values for c, q and ǫ.2. Initialize the fuzzy partition matrix U = [uik].3. Set the loop counter b = 0.4. Calculate the c cluster centers
( ) = ∑ ( )∑ ( ( )) (2)5. Calculate the membership U(b+1). For k = 1 to n, calculate the following:= { |1 ≤ ≤ , = ‖ − ‖ = 0},/I for the kth column of the matrix, compute
new membership values:(a) if Ik = φ, then = 1∑ (3)(b)Else ( ) = 0 ∄ and ∑ ℇ ( ) = 1;
6. If ( ) − ( ) <e, stop; otherwise, set c = c + 1 and go to step 4.
6. PROPOSED WORK:
The main objective is to select a particular band of the entire hyperspectral dataset. As a first steppreprocessing is done in order to remove the noise present in the input band. Salt and peppernoise present in the image is removed by using median filter. Then principal component analysishas been performed in order to reduce the dimension of the Hyperspectral image. As a result ofPCA only few principal components of the image is obtained. The result of principal component

International Journal of Information Sciences and Techniques (IJIST) Vol.4, No.3, May 2014
185
analysis is then further used in sub-pixel target detection. Then fuzzy c-means algorithm is usedto obtain the segmented output.
Fig. 7.1 Flow diagram of the proposed work
7. EXPERIMENTAL OUTPUT:
The image we have taken is from the datasets of Indian pines captured by AVIRIS sensor. ThisIndian pines dataset contain 220 contiguous bands. At a time, all the bands cannot be loaded. Tofurther process the Hyperspectral image a particular band should be selected and the highdimensional data should be reduced to smaller one. Figure 3 represents the 100th band of theHyperspectral image “Indian_pines”.
Figure 3. 100th band of Indian_pines, AVIRIS.
Figure 4 represents preprocessed output of 100th band of the input Hyperspectral image. Forpreprocessing median filter is used. This output will be out of noises in the image mainly salt andpepper noise.
International Journal of Information Sciences and Techniques (IJIST) Vol.4, No.3, May 2014
186
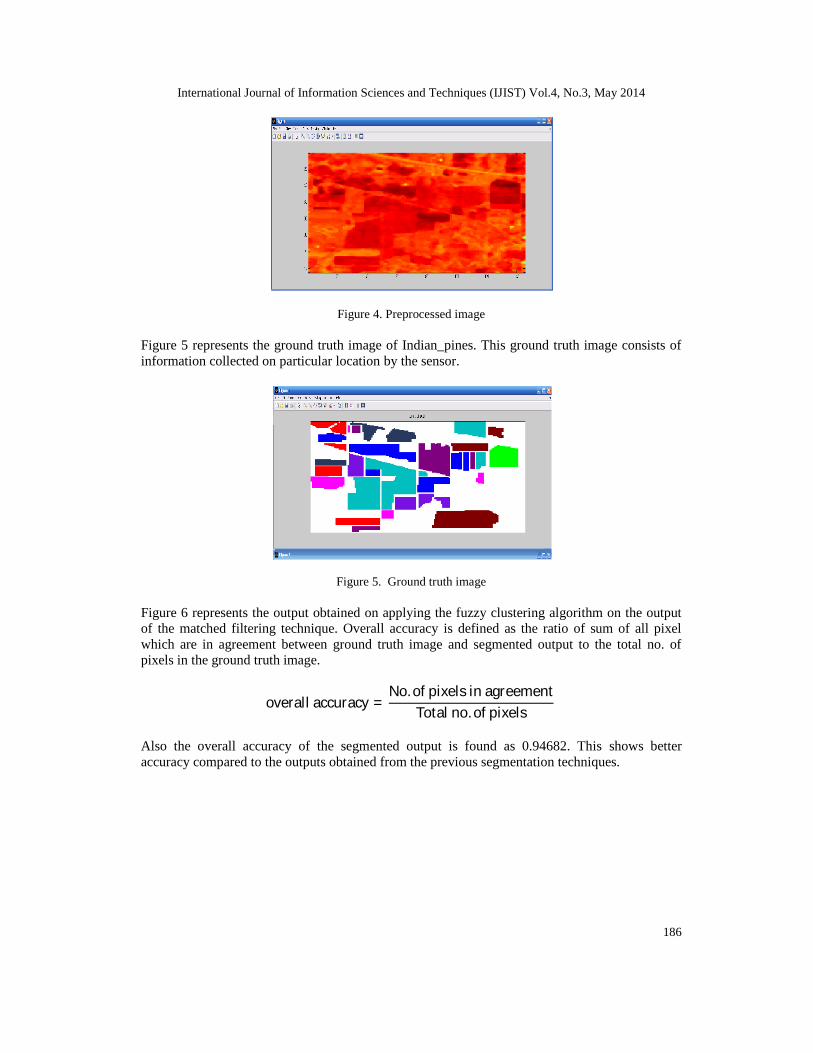
Figure 4. Preprocessed image
Figure 5 represents the ground truth image of Indian_pines. This ground truth image consists ofinformation collected on particular location by the sensor.
Figure 5. Ground truth image
Figure 6 represents the output obtained on applying the fuzzy clustering algorithm on the outputof the matched filtering technique. Overall accuracy is defined as the ratio of sum of all pixelwhich are in agreement between ground truth image and segmented output to the total no. ofpixels in the ground truth image.
overall accuracy = No. of pixels in agreementTotal no. of pixelsAlso the overall accuracy of the segmented output is found as 0.94682. This shows betteraccuracy compared to the outputs obtained from the previous segmentation techniques.

International Journal of Information Sciences and Techniques (IJIST) Vol.4, No.3, May 2014
187
Figure 6 Segmented output
7. CONCLUSION:
Thus a new Hyperspectral image segmentation technique is proposed which combines sub-pixeldetection and fuzzy clustering technique. The number of bands is reduced by using principalcomponent analysis technique. Only useful bands were selected and segmentation was done basedon the values obtained using principal component analysis. Since fuzzy c-means is used, theclustering becomes simple. The overall accuracy is found to be 0.94682.
REFERENCES
[1] Jun Li,José M.Bioucas-Dias and Antonio Plaza, “Spectral–spatial Hyperspectral Image SegmentationUsing Subspace Multinomial Logistic Regression and Markov Random Fields”, 2012, ieeetransactions on geoscience and remote sensing, vol. 50, no. 3, march 2012.
[2] Jun Li, José M.Bioucas-Dias and Antonio Plaza “Hyperspectral Image Segmentation Using a NewBayesian Approach With Active Learning”,2011, ieee transactions on geoscience and remote sensing,vol. 49, no. 10, october 2011.
[3] Janete S. Borges, José M. Bioucas-Dias and Andre R. S. Marcal. “ Bayesian Hyperspectral ImageSegmentation With Discriminative ClassLearning”,2011, ieee transactions on geoscience and remotesensing, vol. 49, no. 6, june 2011.
[4] Hernâni Gonçalves, Luís Corte-Real, and José A. Gonçalves ‘Automatic Image Registration ThroughImage Segmentation and SIFT’’’,2011, ieee transactions on geoscience and remote sensing, vol. 49,no. 7, july 2011.
[5] Gökhan Bilgin, Sarp Ertürk, Member, IEEE, and Tülay Yıldırım, “Segmentation of HyperspectralImages via Subtractive Clustering and Cluster Validation Using One-Class Support VectorMachines”,2011. ieee transactions on geoscience and remote sensing, vol. 49, no. 8, august 2011.
[6] J. Silverman, S. R. Rotman, and C. E. Caefer, “Segmentation of hyperspectral images based onhistograms of principal components,” in Proc. SPIE, 2002, vol. 4816, pp. 270–277.
[7] N. Acito, G. Corsini, and M. Diani, “An unsupervised algorithm for hyperspectral imagesegmentation based on the Gaussian mixture model,” in Proc. IEEE IGARSS, Toulouse, France, Jul.2003, vol. 6, pp. 3745–3747.
[8] M. D. Farrell, Jr. and R. Mersereau, “Robust automatic clustering of hyperspectral imagery using non-Gaussian mixtures,” in Proc. SPIE, 2004, vol. 5573, pp. 161–172.
[9] G. Mercier, S. Derrode, and M. Lennon, “Hyperspectral image segmentation with Markov chainmodel,” in Proc. IEEE Geosci. Remote Sens. Symp., Toulouse, France, Jul. 2003, vol. 6, pp. 3766–3768.
[10] H. H. Muhammed, “Unsupervised hyperspectral image segmentation using a new class of neuro–fuzzy systems based on weighted incremental neural networks,” in Proc. IEEE 31st Appl. ImagePattern Recognit. Workshop, Washington, DC, Oct. 2002, pp. 171–177.

International Journal of Information Sciences and Techniques (IJIST) Vol.4, No.3, May 2014
188
[11] J. S. Beis and D. G. Lowe, “Shape indexing using approximate nearestneighbor search in high-dimensional spaces,” in Proc. Conf. Comput. Vis. Pattern Recog., Washington, DC, 1997, pp. 1000–1006.
[12] L. G. Brown, “A survey of image registration techniques,” Comput. Surv., vol. 24, no. 4, pp. 325–376, Dec. 1992.
[13] H. D. Cheng, X. H. Jiang, Y. Sun, and J. Wang, “Color image segmentation: Advances andprospects,” Pattern Recog., vol. 34, no. 12, pp. 2259– 2281, Dec. 2001.
[14] L. Cheng, J. Gong, X. Yang, C. Fan, and P. Han, “Robust affine invariant feature extraction for imagematching,” IEEE Geosci. Remote Sens. Lett., vol. 5, no. 2, pp. 246–250, Apr. 2008.
[15] P. Dare and I. Dowman, “An improved model for automatic feature-based registration of SAR andSPOT images,” Proc. ISPRS J. Photogramm. Remote Sens., vol. 56, no. 1, pp. 13–28, Jun. 2001.
Related Documents


