Vol 61, No 1 February 2008 International Journal of Dairy Technology REVIEW *Author for correspondence. E-mail: [email protected] © 2008 Society of Dairy Technology 16 Blackwell Publishing Ltd Oxford, UK IDT International Journal of Dairy Technology 1364-727X Society of Dairy Technology 2007 XXX REVIEW ORIGINAL RESEARCH Future outlook for the Irish dairy industry: a study of international competitiveness, influence of international trade reform and requirement for change PAT DILLON, 1 * THIA HENNESSY, 2 LAURENCE SHALLOO, 1 FIONA THORNE 2 and BRENDAN HORAN 1 1 Teagasc, Moorepark Dairy Production Research Centre, Fermoy, County Cork, Ireland, 2 Teagasc Rural Economy Research Centre, Athenry, County Galway, Ireland *Author for correspondence. E-mail: [email protected] European Union (EU) trade liberalisation policies will continue to push EU milk price downwards and necessitate increased efficiency and scale at farm and processing level to maintain profitability. In Ireland pasture-based dairying, based on the efficient conversion of grazed grass into milk can be competitive within the EU. Continued technical innovation increasing animal performance from grazed grass, increasing herd genetic potential and developing labour efficient lower fixed cost systems will be essential. At processing level, increased efficiency in commodity processing, higher margin product development and the evolution of milk payment systems to reflect the true product value of supplies received will be required. Keywords Efficiency, EU policy, Pasture-based systems, Scale, Technical innovation. INTRODUCTION The dairy industry is one of the most important sectors of Irish agriculture and accounts for 27% of agricultural output (Department of Agriculture and Food 2006) with the production of 5.35 million tonnes of milk per annum. The dairy industry also makes a significant contribution to sustaining rural communities, with the dairy processing industry employing over 7000 people. In 2005, the average family farm income (excluding arrears brought forward from 2004) on specialist dairy farms in Ireland was approximately a36 690 compared to just under a8030 on cattle rearing farms, the poor- est sector (Connolly et al. 2005). Direct payments/ subsidies contributed as a percentage of family farm income a total of 48, 130, 125 and 99% of income for dairying, cattle rearing, sheep and tillage farming, respectively, in 2005 (Connolly et al. 2005). National Farm Survey (NFS) figures also show that on average, dairy farm incomes exceed average industrial wages. However, despite the apparent relative profitability of dairy farming, dairy farm numbers are declining faster than any other system of farming. According to Department of Agriculture and Food (2006) there were approxi- mately 22 386 active dairy producers in Ireland in 2005 compared to 28 000 in 2001 and 42 000 in 1993. In this paper the Irish dairy industry is examined in terms of its competitive strength and as a producer of dairy products in a scenario of increasing world demand. It is reviewed in the context of changing European Union (EU) and international trade policies, a prosperous growing Irish economy and an uncertain market outlook for present product ranges. IRISH MILK PRODUCTION EFFICIENCY Table 1 shows the evolution of input costs, gross outputs and margins from 1990 to 2004 in nominal terms for specialist manufacturing milk herds in Ireland (from various NFS reports). The results show that total input costs have increased by on average 1.6 cents/L or less than 1% per annum from 1990 –92 to 2002–04 in nominal terms, which is relatively low considering that inflation ran at an average rate of 2.5% per annum over the period. Direct costs increased by 1.0 cent/L and overhead costs by 0.5 cent/L over the period. The CSO Agricultural price index for total agricultural inputs rose by 13.6% between 1990 and 2004 (www.cso.i.e./statistics/), whereas total costs for specialist milk production (Table 1) showed an increase of 9.7%. This indicates a real decrease in unit costs of production or an efficiency gain of 2.6% over a 12-year period. The results also indicate that direct costs (+1.07 cents/L) increased at twice the rate of overhead costs (+0.50 cent/L). Table 2 shows the gross output, total input costs, direct costs, overhead costs and net margin (cent/L) for the five cost groups from the Connolly et al.

Welcome message from author
This document is posted to help you gain knowledge. Please leave a comment to let me know what you think about it! Share it to your friends and learn new things together.
Transcript
Vol 61, No 1 February 2008 International Journal of Dairy Technology
REVIEW
*Author for correspondence. E-mail: [email protected]
© 2008 Society of Dairy Technology
16
Blackwell Publishing LtdOxford, UKIDTInternational Journal of Dairy Technology1364-727XSociety of Dairy Technology 2007XXXREVIEWORIGINAL RESEARCH
Future outlook for the Irish dairy industry: a study of international competitiveness, influence of international trade reform and requirement for change
PAT DILLON,1* THIA HENNESSY,2 LAURENCE SHALLOO,1 FIONA THORNE 2 and BRENDAN HORAN 1
1Teagasc, Moorepark Dairy Production Research Centre, Fermoy, County Cork, Ireland, 2Teagasc Rural Economy Research Centre, Athenry, County Galway, Ireland
*Author for correspondence. E-mail: [email protected] Union (EU) trade liberalisation policies will continue to push EU milk price downwards andnecessitate increased efficiency and scale at farm and processing level to maintain profitability. In Irelandpasture-based dairying, based on the efficient conversion of grazed grass into milk can be competitivewithin the EU. Continued technical innovation increasing animal performance from grazed grass,increasing herd genetic potential and developing labour efficient lower fixed cost systems will beessential. At processing level, increased efficiency in commodity processing, higher margin productdevelopment and the evolution of milk payment systems to reflect the true product value of suppliesreceived will be required.
Keywords Efficiency, EU policy, Pasture-based systems, Scale, Technical innovation.
I N T RO D U C T I O N
The dairy industry is one of the most importantsectors of Irish agriculture and accounts for 27% ofagricultural output (Department of Agriculture andFood 2006) with the production of 5.35 milliontonnes of milk per annum. The dairy industry alsomakes a significant contribution to sustaining ruralcommunities, with the dairy processing industryemploying over 7000 people. In 2005, the averagefamily farm income (excluding arrears broughtforward from 2004) on specialist dairy farms inIreland was approximately a36 690 compared tojust under a8030 on cattle rearing farms, the poor-est sector (Connolly et al. 2005). Direct payments/subsidies contributed as a percentage of familyfarm income a total of 48, 130, 125 and 99% ofincome for dairying, cattle rearing, sheep andtillage farming, respectively, in 2005 (Connollyet al. 2005). National Farm Survey (NFS) figuresalso show that on average, dairy farm incomesexceed average industrial wages. However, despitethe apparent relative profitability of dairy farming,dairy farm numbers are declining faster than anyother system of farming. According to Departmentof Agriculture and Food (2006) there were approxi-mately 22 386 active dairy producers in Ireland in2005 compared to 28 000 in 2001 and 42 000 in 1993.
In this paper the Irish dairy industry is examinedin terms of its competitive strength and as a producerof dairy products in a scenario of increasing world
demand. It is reviewed in the context of changingEuropean Union (EU) and international trade policies,a prosperous growing Irish economy and an uncertainmarket outlook for present product ranges.
I R I S H M I L K P RO D U C T I O N E F F I C I E N C Y
Table 1 shows the evolution of input costs, grossoutputs and margins from 1990 to 2004 in nominalterms for specialist manufacturing milk herds inIreland (from various NFS reports). The resultsshow that total input costs have increased by onaverage 1.6 cents/L or less than 1% per annum from1990–92 to 2002–04 in nominal terms, which isrelatively low considering that inflation ran at anaverage rate of 2.5% per annum over the period.Direct costs increased by 1.0 cent/L and overheadcosts by 0.5 cent/L over the period. The CSOAgricultural price index for total agriculturalinputs rose by 13.6% between 1990 and 2004(www.cso.i.e./statistics/), whereas total costs forspecialist milk production (Table 1) showed anincrease of 9.7%. This indicates a real decrease inunit costs of production or an efficiency gain of2.6% over a 12-year period. The results alsoindicate that direct costs (+1.07 cents/L) increasedat twice the rate of overhead costs (+0.50 cent/L).
Table 2 shows the gross output, total input costs,direct costs, overhead costs and net margin (cent/L)for the five cost groups from the Connolly et al.
© 2008 Society of Dairy Technology 17
Vol 61, No 1 February 2008
(2005). The total cost of production for the lowestquintile (20%) was 13.0 cents/L, compared to 22.8cents/L for the highest quintile, or a difference of9.8 cents/L; while the average cost of production(quintile 3) was 17.1 cents/L. The high cost groupwere effectively producing a litre of milk at 75%higher input costs than their more efficientcounterparts and almost 33% above the overallaverage. This difference in production efficiencyrepresents 9.0 cent/L (16.1 cents/L vs 6.1 cents/L)in net margin; while the net margin of the averageproducer was 12.4 cents/L. Differences in feedcosts (mainly concentrate costs) were responsiblefor 42% of the total cost difference. Of the overheadcost items—hired labour (8.4%), machineryoperating and depreciation charges (11.8%), landrental charges (6.4%) and interest payments onloans (7.3%) were the major contributors to overallvariation in unit input costs.
These results demonstrate that a lot of variationexists in the efficiency of milk production. The pro-jected milk price under the Medium Term Review
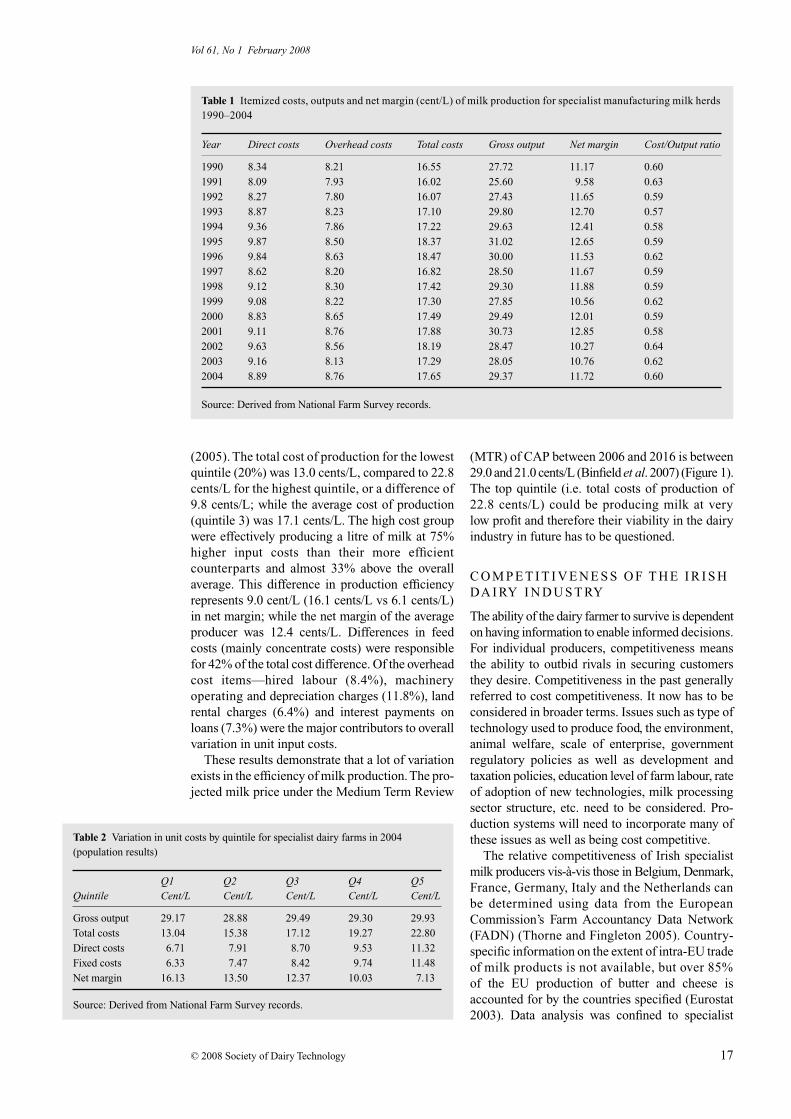
(MTR) of CAP between 2006 and 2016 is between29.0 and 21.0 cents/L (Binfield et al. 2007) (Figure 1).The top quintile (i.e. total costs of production of22.8 cents/L) could be producing milk at verylow profit and therefore their viability in the dairyindustry in future has to be questioned.
C O M P E T I T I V E N E S S O F T H E I R I S H DA I RY I N D U S T RY
The ability of the dairy farmer to survive is dependenton having information to enable informed decisions.For individual producers, competitiveness meansthe ability to outbid rivals in securing customersthey desire. Competitiveness in the past generallyreferred to cost competitiveness. It now has to beconsidered in broader terms. Issues such as type oftechnology used to produce food, the environment,animal welfare, scale of enterprise, governmentregulatory policies as well as development andtaxation policies, education level of farm labour, rateof adoption of new technologies, milk processingsector structure, etc. need to be considered. Pro-duction systems will need to incorporate many ofthese issues as well as being cost competitive.
The relative competitiveness of Irish specialistmilk producers vis-à-vis those in Belgium, Denmark,France, Germany, Italy and the Netherlands canbe determined using data from the EuropeanCommission’s Farm Accountancy Data Network(FADN) (Thorne and Fingleton 2005). Country-specific information on the extent of intra-EU tradeof milk products is not available, but over 85%of the EU production of butter and cheese isaccounted for by the countries specified (Eurostat2003). Data analysis was confined to specialist
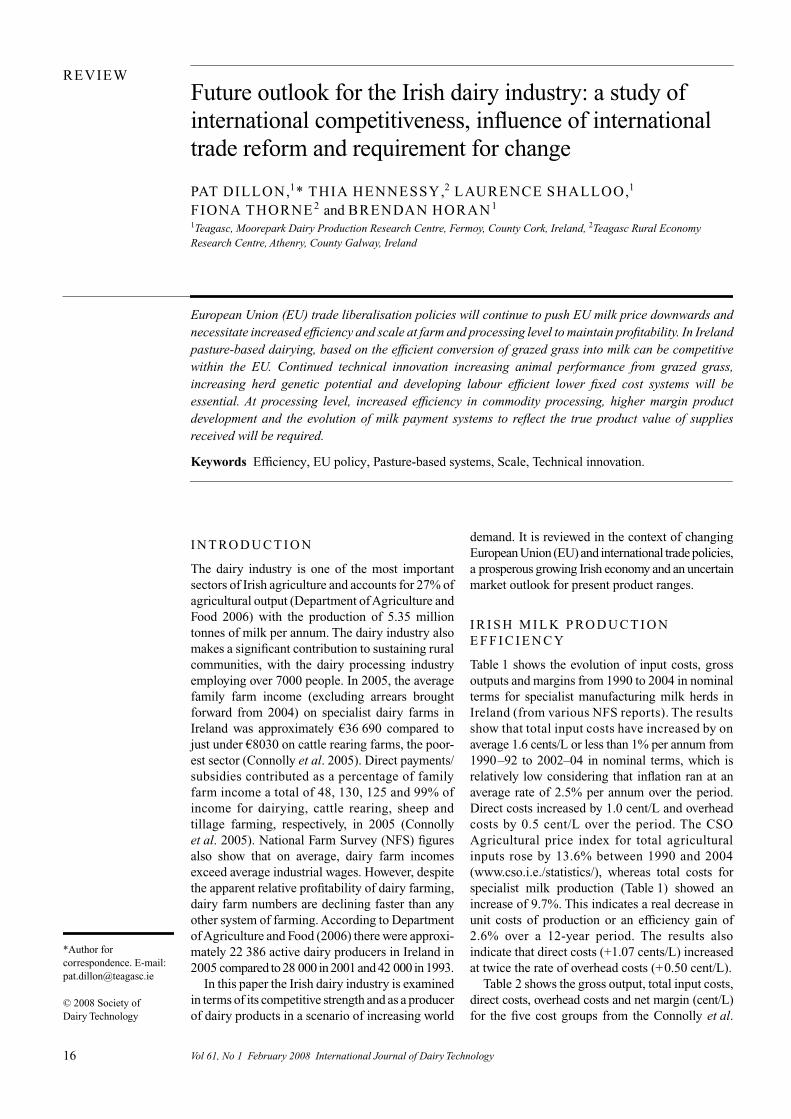
Table 1 Itemized costs, outputs and net margin (cent/L) of milk production for specialist manufacturing milk herds 1990–2004
Year Direct costs Overhead costs Total costs Gross output Net margin Cost/Output ratio
1990 8.34 8.21 16.55 27.72 11.17 0.601991 8.09 7.93 16.02 25.60 9.58 0.631992 8.27 7.80 16.07 27.43 11.65 0.591993 8.87 8.23 17.10 29.80 12.70 0.571994 9.36 7.86 17.22 29.63 12.41 0.581995 9.87 8.50 18.37 31.02 12.65 0.591996 9.84 8.63 18.47 30.00 11.53 0.621997 8.62 8.20 16.82 28.50 11.67 0.591998 9.12 8.30 17.42 29.30 11.88 0.591999 9.08 8.22 17.30 27.85 10.56 0.622000 8.83 8.65 17.49 29.49 12.01 0.592001 9.11 8.76 17.88 30.73 12.85 0.582002 9.63 8.56 18.19 28.47 10.27 0.642003 9.16 8.13 17.29 28.05 10.76 0.622004 8.89 8.76 17.65 29.37 11.72 0.60
Source: Derived from National Farm Survey records.
Table 2 Variation in unit costs by quintile for specialist dairy farms in 2004 (population results)
QuintileQ1 Cent/L
Q2 Cent/L
Q3 Cent/L
Q4 Cent/L
Q5 Cent/L
Gross output 29.17 28.88 29.49 29.30 29.93Total costs 13.04 15.38 17.12 19.27 22.80Direct costs 6.71 7.91 8.70 9.53 11.32Fixed costs 6.33 7.47 8.42 9.74 11.48Net margin 16.13 13.50 12.37 10.03 7.13
Source: Derived from National Farm Survey records.
Vol 61, No 1 February 2008
© 2008 Society of Dairy Technology18
dairy farms as defined by FADN, on which thestandard gross margin from dairying accounts forat least two-thirds of the farm total gross marginand were weighted to estimates of populationmeans. The results presented for each of thecountries is the average for the years 1996–2003and indexed relative to Ireland.
Comparison of partial productivity in selected EU dairy farmsThe partial productivity indicators used in thisanalysis for the dairy sector were defined byFingleton (1995). The measures relate to animal,land and labour productivities. They are milk solids(kilogram of fat plus protein) per cow (kg), stockingrate (livestock units/ha), milk solids per hectareand milk production per labour unit (tonne).Figure 2 shows that the average milk solids percow were lowest in Ireland. In particular, milksolids per cow in the Netherlands and Denmarkwere 66% and 52% higher, respectively, than inIreland. Similarly stocking rates in Ireland werelow; with only France and Germany having stockingdensities equivalent or lower than Ireland. Stockingrates in the Netherlands and Denmark were 34%and 30% higher than in Ireland.
The combination of the generally lower stockingdensities and lower milk solids per cow for Irelandresult in Ireland having the lowest milk solids perhectare compared with all other countries with theexception of France, the Netherlands and Denmarkagain produced well in excess of the othercountries examined, with milk solids productionper hectare 200% higher than Ireland. The finalpartial productivity measure—milk production perlabour unit—was again highest in the Netherlandsand Denmark, with levels in the UK also relativelyhigh. Italy was the only country that exhibitedlower labour productivity than Ireland, but averagelevels in France and Germany were very similar toIreland.
All of the results presented in Figure 2 arecalculated with respect to population estimates ofall specialist dairy farms in the countries included.Productivity indicators for farms with 50–99 cowswere also examined in each of the countries.However, despite the variations in sampling pro-cedures adopted in the FADN survey, there was noevidence of pronounced differences in averageproductivity levels between the subsample andthe whole sample. In general, the productivityrankings between the countries were similar in thetwo samples but the relative differences betweenthe countries tended to be reduced in the morehomogeneous sample of the 50–99 cow farms.This was particularly evident in the use of land andlabour productivity measures, where the largedisparities between the countries in the averagesample of farms were reduced in the 50–99 cowsize subsample.
The results for the individual years between1996 and 2003 were also examined using a linearregression model fitted to measure the trend overtime for Irish dairy farms in relation to the averagefor all countries examined. The average sample ofall specialist dairy farms exhibited a significanttrend over time for three of the six partial pro-ductivity indicators, namely: milk solids per cow,stocking rate per hectare and milk solids perhectare. Of these indicators, milk solids per cowfor Irish dairy farms increased significantly by onaverage 0.012 kg per cow per year relative to theaverage of all countries. In contrast, stocking rate(cows per hectare) and milk solids per hectaredecreased relative to the average of all countriesexamined, by on average 0.01 cows per hectare and0.09 kg of milk solids per hectare, respectively,over the time period examined.
However, the subsample of specialist dairyfarms, with 50–99 dairy cows, did not show asignificant relationship between any of the relativeproductivity measures in Ireland vis-à-vis ourEuropean competitors. While there was a positivetrend for these larger dairy units within Ireland,with respect to milk solids per cow (+10.5 kg per
Figure 1 Milk price projections baseline 2006–15.
Source: FAPRI-Ireland Model (Binfield et al. 2007).
Figure 2 Partial productivity measures for selected EU countries (1996–2003).
© 2008 Society of Dairy Technology 19
Vol 61, No 1 February 2008
cow per year) and milk production per labour unit(+7 kg per cow per year), compared to the averageof all countries examined, none of these relationshipswere significant.
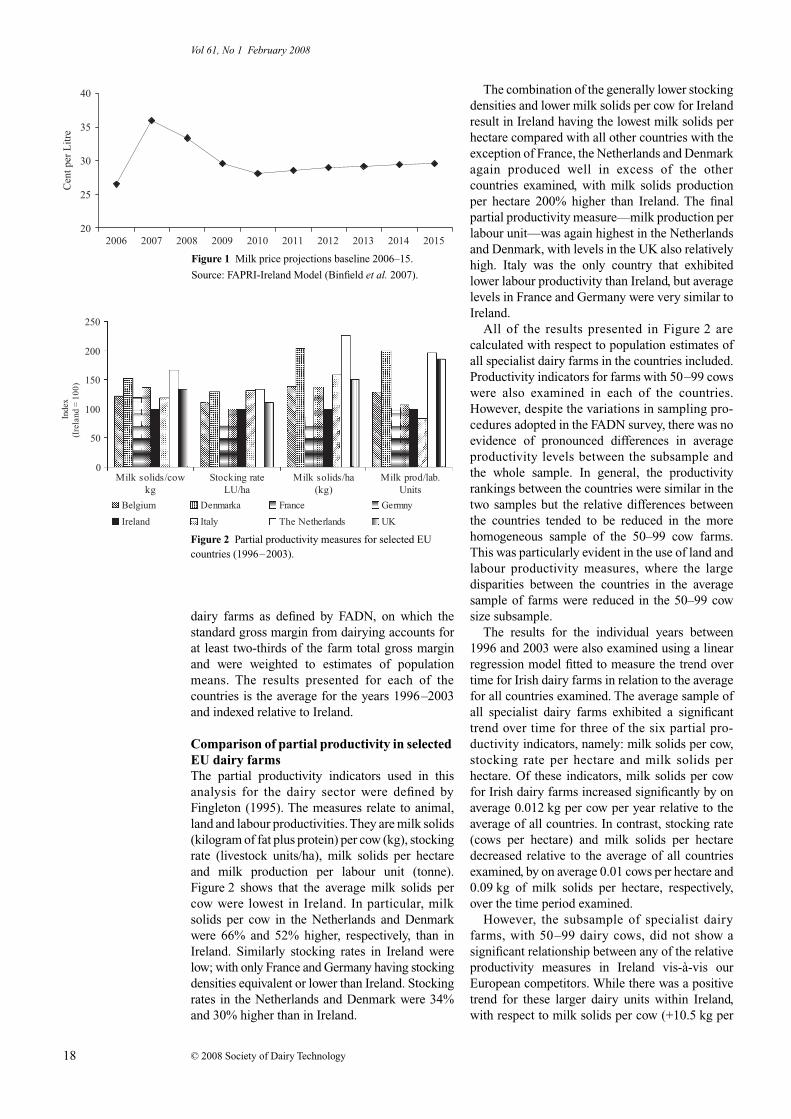
Comparison of costs and returns in selected EU dairy farmsFor the purpose of examining costs of production,costs were defined as: total cash costs (whichinclude all specific costs, directly incurred in theproduction of a given commodity, for examplefertilizer, feedstuffs, seeds, etc. plus external costssuch as wages, rent and interest paid, plus depreciationcharges) and total economic costs (which includesall of the cash costs identified above, except interestcharges, plus imputed resource costs for familylabour, equity capital and owned land) (Boyle et al.1992). Figure 3 shows total costs as a percentage ofdairy output for the 8-year average, for each of theselected countries, for all specialist dairy farms inthe FADN sample. The value of dairy output wascalculated as milk receipts plus surplus dairy stocksales. Cash costs and the imputed charges forowned resources were identified. Cash costs as apercentage of output were relatively low in Irelandover the period 1996–2003. Italy had the lowestcash costs as a percentage of output at 61%, but thecost structures in Ireland and Belgium were onlyslightly higher at 65 and 66%, respectively. Thehighest cash costs as a per cent of output wereexperienced in Denmark where cash costs were88% of total output of the enterprise.
The competitive advantage experienced by‘average’ Irish producers worsens when allimputed charges for owned resources are taken intoconsideration. Total economic costs as a percentageof output were highest in Germany, where costswere 120% of the output from the dairy enterprise.Ireland followed with the second highest total
economic costs at 118% of output. The lowest totaleconomic costs were found in Belgium, wherenearly 1% of dairy output remained as profit fordairy producers, on average, over the 8-year period(i.e. total economic costs were 99% of total dairyoutput). The main imputed cost that contributedto the relatively high total economic costs experi-enced in Ireland was for owned land. This was dueto the relatively high imputed rental charge coupledwith high levels of land ownership in Irish dairyproduction. The relatively low stocking rates andmilk yields per hectare on Irish dairy farms overthe period must also be considered as a contributingfactor. Given the milk quota transfer scheme inoperation in Ireland over the last number of years,structural change has not occurred as quickly in theIrish dairy farming sector as in other memberstates and as a result the output per hectare and perlabour unit remains low because of the distributionof milk quota. However, it is worthwhile to notethat when the imputed land charge for ownedresources is not taken into consideration, the relativecompetitive position of Irish dairy farms remainsstrong, with Irish farms showing one of the lowestcosts to output ratios for the period 1996–2003.
When total economic costs as a percentageof output for the 50–99 cow size category wereconsidered they were generally substantially lowerthan the average for all specialist farms. Inaddition, the competitive position of these largerIrish dairy producers (with 50–99 dairy cows) wassubstantially improved relative to competingcountries: total economic costs as a percentage ofoutput were reduced by 15% on these farms relativeto the average producer in Ireland, suggestingthat larger farmers are allocating resources moreefficiently. This ranked these larger Irish producersas the third lowest total economic cost producerrelative to producers in all countries examined. It isworth noting here again, that when the imputedcharge for owned land is excluded from the analysis,the competitive position of Irish producers improvessignificantly.
The effect of imputed land and labour costs onthe long-term competitiveness of Irish milk producersis highlighted in this analysis. When these costswere excluded from economic costs, Irelandappeared to be quite competitive, with only Italyexhibiting lower costs than the average producer inIreland, while for the larger subsample no othercountry had lower costs than Ireland during theperiod 1996–2003. However, it is important toconsider these costs as they are a leading indicatorof a farmer’s ability to expand milk productionefficiently and therefore are the key to the successof a more liberal milk production market.
A linear regression model was fitted to the datato observe trends over the period 1996–2003. Forthe average sample there was no apparent trend
Figure 3 Cash and economic costs for all specialist dairy farms in selected EU countries (1996–2003).
Vol 61, No 1 February 2008
© 2008 Society of Dairy Technology20
over the period, whereas with the subsample oflarger producers there was a significant improve-ment in cash and economic costs per productvolume for Irish producers relative to the average.Cash costs improved at a rate of 2 cents per kilogramof milk solids per year and economic costs at a rateof 3 cents per year relative to the average of allcountries. It is evident that on a cash cost basis,Ireland is in a relatively advantageous positionwithin Europe and may be well placed to competein a more liberalized milk quota environment.However, total economic costs, which could beconsidered the leading indicator of the sector’sability to adapt and expand, are relatively high. It istherefore important for Irish policy makers toestablish policies that will promote the moreefficient allocation of land and labour resources toensure the sustainability of the Irish dairy sector ina post quota situation.
E VO L U T I O N O F E U AG R I C U LT U R A L P O L I C Y
Evolution of EU agricultural policy (1957–91)The EU Common Agricultural Policy (CAP) set upin 1957 aimed to guarantee food security in postwarEurope at stable and reasonable prices to producersby maximizing production and protecting domesticagriculture from foreign competitors (Whetstone1999). The dairy policy regime has been one of themain structures of the Common Agricultural Policysince the creation of the European Community.From 1973, when Ireland joined the community, to1984, milk production increased from 91.3 to 110million tonnes, creating market surplus costs by1983 equivalent to 30% of the total CAP budget.This cost required the introduction of milk quotasin 1984 which were implemented by the impositionof fines (super levies) on the delivery of milk aboveeach national quota. While the adoption of milkquotas ensured price protection for EU producers,the scheme required the use of export refunds formilk products onto world markets and subsidiesfor various forms of disposal (ice cream making,confectionery and animal feeds) within the internalEU market.
Policy reform towards a free market (1992–2006)The MacSharry reforms agreed in 1992 instigateda reduction in market support prices and insteadprovided direct compensation for farmers bymeans of direct aids. Several rural developmentmeasures were introduced, notably to encouragemore environmentally friendly and less intensivesystems of farming. This shift in emphasis in theCAP entered a new phase in 1999 with the ‘Agenda2000’ reforms. These reforms further reducedprice supports and compensated farmers withdirect payments aimed at enticing more environ-mentally sensitive farm practice.
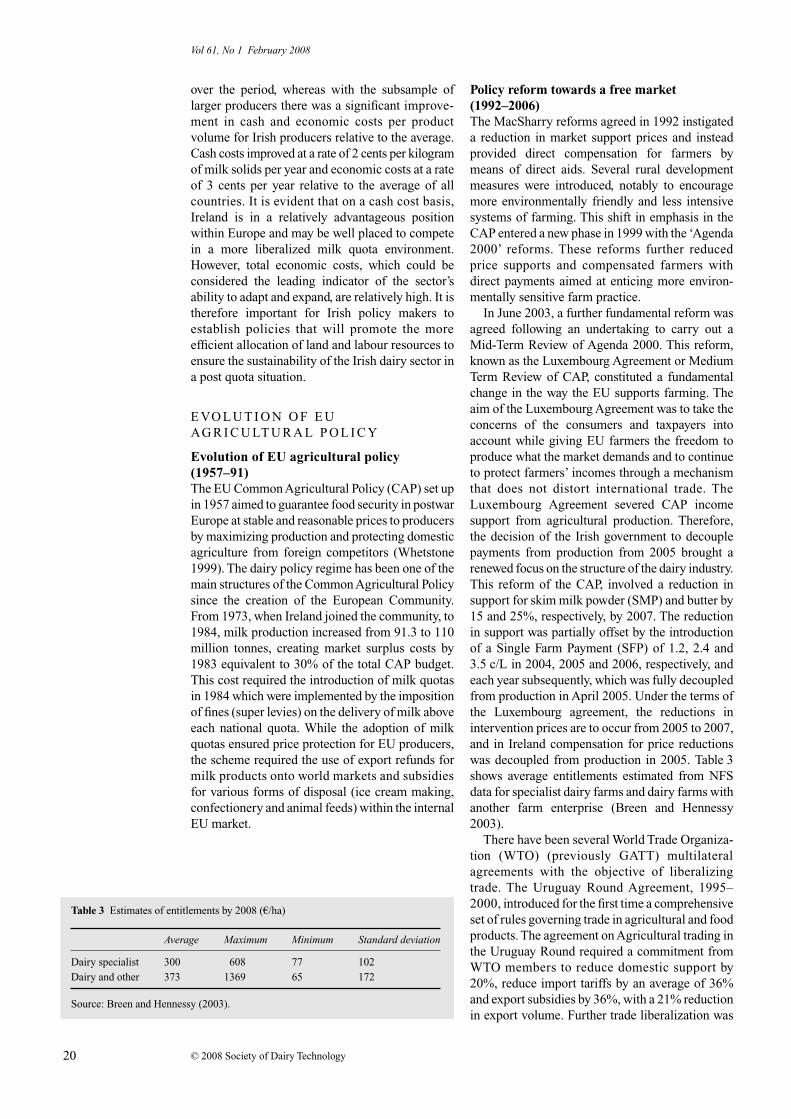
In June 2003, a further fundamental reform wasagreed following an undertaking to carry out aMid-Term Review of Agenda 2000. This reform,known as the Luxembourg Agreement or MediumTerm Review of CAP, constituted a fundamentalchange in the way the EU supports farming. Theaim of the Luxembourg Agreement was to take theconcerns of the consumers and taxpayers intoaccount while giving EU farmers the freedom toproduce what the market demands and to continueto protect farmers’ incomes through a mechanismthat does not distort international trade. TheLuxembourg Agreement severed CAP incomesupport from agricultural production. Therefore,the decision of the Irish government to decouplepayments from production from 2005 brought arenewed focus on the structure of the dairy industry.This reform of the CAP, involved a reduction insupport for skim milk powder (SMP) and butter by15 and 25%, respectively, by 2007. The reductionin support was partially offset by the introductionof a Single Farm Payment (SFP) of 1.2, 2.4 and3.5 c/L in 2004, 2005 and 2006, respectively, andeach year subsequently, which was fully decoupledfrom production in April 2005. Under the terms ofthe Luxembourg agreement, the reductions inintervention prices are to occur from 2005 to 2007,and in Ireland compensation for price reductionswas decoupled from production in 2005. Table 3shows average entitlements estimated from NFSdata for specialist dairy farms and dairy farms withanother farm enterprise (Breen and Hennessy2003).
There have been several World Trade Organiza-tion (WTO) (previously GATT) multilateralagreements with the objective of liberalizingtrade. The Uruguay Round Agreement, 1995–2000, introduced for the first time a comprehensiveset of rules governing trade in agricultural and foodproducts. The agreement on Agricultural trading inthe Uruguay Round required a commitment fromWTO members to reduce domestic support by20%, reduce import tariffs by an average of 36%and export subsidies by 36%, with a 21% reductionin export volume. Further trade liberalization was
Table 3 Estimates of entitlements by 2008 (a/ha)
Average Maximum Minimum Standard deviation
Dairy specialist 300 608 77 102Dairy and other 373 1369 65 172
Source: Breen and Hennessy (2003).
© 2008 Society of Dairy Technology 21
Vol 61, No 1 February 2008
planned, and following the breakdown of negotiationson the WTO policy reform round in Cancun,negotiations resumed in Geneva, with agreementreached in Doha in August 2004. While the specificreductions in the levels of protection and supportwere not discussed, the main elements of theagreement included further reductions in domesticsupport, increased market access and reduced exportsubsidies. At the sixth WTO Ministerial meeting inHong Kong in December 2005 agreement wasreached to eliminate all forms of agriculturecommodity export subsidies by 2013; however, theexact schedule has not yet been agreed. Agreementon market access and domestic support of agri-culture was not completed in Hong Kong but wasto be completed in 2006. In July 2006, the talkswere suspended indefinitely and will now probablybe replaced by new bilateral trade agreementsbetween different trading nations.
The Luxembourg Agreement allowed for areview of the CAP in 2008, which will include areview of the EU dairy policy assessing the effectof reforms on the sector. It is also possible thatfurther reductions of export support and marketprotection may be agreed, which would furtherreduce EU milk price to a level where the quotasystem may not be effective anymore.
Future developments in EU agricultural policy (2007–15)The projection is that both EU and Irish milk priceswill continue to decrease in 2007 as the final inter-vention price reduction agreed under the Luxem-bourg Agreement is implemented. The projectedeffects of the agreement on farm-level milk priceare shown in Fig. 1 where direct payments aredecoupled from production. Much will depend onthe international market situations and the attitudeof the European Commission towards the provi-sion of export refunds. The EU cheese, SMP andbutter prices are projected to decline by 5, 8 and23% as a direct result of cuts in intervention prices.This will result in a 10% decline in farm-level milkprice in 2007 compared with 2004, recovering towithin 8% by 2015 (Binfield et al. 2007). By 2015the value of Irish milk output is projected to bealmost 15% lower than in 2004. Cheese productionis projected to increase to 131 000 tonnes per yearby 2015.
As outlined, WTO policy reform negotiationswere ongoing in Hong Kong early in 2006 andwhile a specific agreement was not reached, therewas agreement in principle to abolish export sub-sidies and to improve EU market access. The elim-ination of export subsidies will have a significantimpact on agricultural markets. Export subsidiesexpenditure has two effects: first, it supportsdomestic prices by facilitating the sale of surplusproducts on non-EU markets; and second, it
reduces the exposure of European prices to thevolatility of world markets and exchange rates. Inrecent years, the move from support prices to directpayments has seen export subsidies used in a pricestabilization role, i.e. providing a safety net whenthere is downward pressure on EU prices.
Although the WTO policy reform negotiationshave been suspended indefinitely at present, theEU commission has indicated that further reformof the EU internal market is likely under the CAPreview in 2008, which may result in further tradeliberalization. The extent of milk price reductionwill depend on EU and external market develop-ments and the implementation of trade liberalizationagreements. This may include abolishing exportrefunds as offered in the WTO policy reformnegotiations, even if no WTO agreement is reached.If WTO policy reform agreement were to bereached, concessions on import duties as well asabolition of export refunds would be required. Thiswould have a knock-on-effect for internal EUprices and would create further impetus for CAPreform, particularly for butter, if large quantities ofcheaper third country imports are to be avoided onthe internal market.
Binfield et al. (2006) analysed the implicationsof various possible WTO policy reforms. Thedetails of the WTO scenario were: a 70% reductionin the aggregate measure of domestic support(AMS) based on Uruguay Round Agreement; thephased removal of EU export subsidies over thecourse of 10 years with the elimination frontloaded, a 50% cut in export subsidies in 2007 andwith the remaining export subsidies eliminated inequal installments over the remaining 9 years; a60% cut in tariffs to facilitate greater marketaccess, with a 25% cut in tariffs applied to sensitiveproducts, and no expansion of tariff rate quotaassociated with the designation of beef and butteras sensitive products.
Under the WTO policy reform, export refundexpenditure limits would be close to zero by 2015,leading to sharp reductions in cheese, butter andwhole milk powder exports from the EU andIreland to non-EU markets. SMP prices, however,will be less affected by the elimination of exportrefunds as the EU SMP price is already closer tothe world price. It is projected that the eliminationof export subsidies in conjunction with the reductionin import tariffs is likely to lead to greater declinesin commodity prices than projected under MTR.Binfield et al. (2006) projected that the price ofbutter would decline by 18%, the price of cheese by10% and the price of SMP by 6% relative to the2015 MTR levels. The overall effect is that the Irishfarm level milk price is projected to decline furtherunder the WTO scenario than under the MTR.Relative to 2004, the Irish farm level milk priceis projected to be almost 20% lower by 2015
Vol 61, No 1 February 2008
© 2008 Society of Dairy Technology22
under a WTO scenario compared to 8–10% in asituation where there is no WTO reform. Thiswould reduce Irish average milk price to about 20.9cents/L by 2015 compared to an EU average of24.2. Also in this scenario there would be greaterfluctuations in EU milk price from year to yeardue to variation in international markets for dairyproducts.
Future EU milk quota policy (2007–15)The present EU dairy market regime combinesprice support, through measures like interventionbuying, import tariffs and export subsidies, withmilk quotas to limit production levels. The 2003reform of CAP agreed to retain the present milkquota system until 1 April 2015; however, it isexpected that the quota issue will form an impor-tant part of the 2008 review of CAP. It is possiblethat further reductions of export support andmarket protection in the framework of WTOmaybe agreed as part of the review which wouldreduce EU milk price further to a level where aquota system may not be effective anymore. TheEU Commission’s wish to phase out milk quotascoincides with a desire to have a lower milk pricein order to cope with lower import tariffs and endexport refunds, to avoid possible pressure forcompensation for loss of quota assets, avoidpressure from new member states for additionalquota and pressure from free-market memberstates (the London group) to end milk quotas.
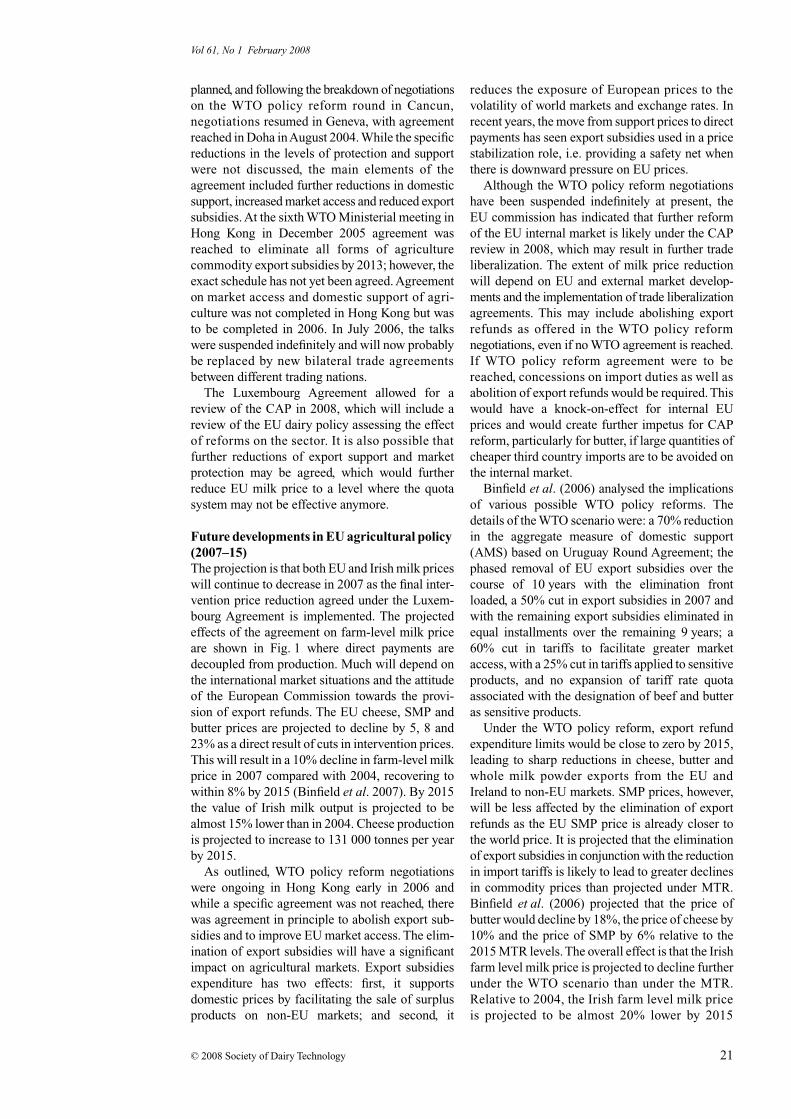
A Dutch study on the impact of quota abolitionon the Dutch dairy sector (van Berkum and Helm-ing 2006) has just been completed. The reporthighlights that under MTR, incomes will declineby between 8 and 10% and if inflation, quota costsand other input costs are included, income levelswill be further reduced resulting in a large reduc-tion in dairy farm numbers. This is not taking intoaccount further milk price reductions as a result offurther trade liberalization. The model simulationused in the analysis assumed that milk prices
would be further reduced by 5% as a result offurther trade liberalization where milk quotas weremaintained until 2015 and 15% where milk quotaswere abolished in 2009. Table 4 shows the economicoutcome of the different scenarios in 2015.
The simulation showed that the WTO scenariowith quota continuation until 2015 resulted in asimilar reduction in farm profit as MTR with quotaabolition in 2009. Quota abolition in 2009 resultedin an average increase in total milk supply of 21%;+28% for large low cost farms, +27% for largehigh cost farms, +8% for small low cost farms and–13% for small high cost farms. The results alsoindicated that under the WTO scenario with earlyabolition of milk quotas, milk production wouldbe concentrated on fewer larger farms. The studyindicated that milk production within the EUwould shift to areas of lower cost, e.g. Ireland,Denmark and Holland and away from high costproduction areas like southern Germany, southernFrance, southern Italy, Sweden and Greece.
During the Agenda 2000 negotiations, fourmember states, Denmark, Italy, Sweden and theUK, unsuccessfully campaigned for a dismantlingof the quota system (Benjamin et al. 1999). As EUmilk price moves closer to world market prices asa result of greater trade liberalization, it is possiblethat more countries will favour the abolition ofmilk quotas. From an Irish viewpoint, the effect ofquota removal on milk price and productionlevels nationally is critical. From the studies thatare currently available, the indications are that ifmilk quotas were abolished, milk price wouldreduce by 15–20% more than that in MTR, but thatmilk production would increase significantly (Lipsand Rieder 2005; van Berkum and Helming 2006).It would also result in a significant reduction indairy farm numbers and a shift to lower cost largerfarm units.
Hennessy and Thorne (2006) concluded that,following the abolition of export subsidies, Irishmilk quota would still be filled but that milk quotas
Table 4 Total income per farm in 2015 under different scenarios
CategoryReference scenarioIncome (amillion)
WTO scenario
Quota until 2015 Quota abolished 2009
% change relative to reference scenario
Large with low costs 1086 –7 –8Large with high costs 688 –8 –5Small with low costs 336 –8 –10Small with high costs 182 –8 –28Total 2292 –8 –9
Note: Average quota price is ›1 per kg over the period 2002–15.
Source: van Berkum and Helming 2006.
© 2008 Society of Dairy Technology 23
Vol 61, No 1 February 2008
value would be negligible. However, whether Irelandwould benefit or not from milk quota liberalization ishighly dependent on the ability of the Irish dairysector to retain and expand international marketsand compete internationally. It is evident then thatthe international competitiveness of Irish dairy farm-ers and the Irish dairy processing sector should beconsidered before any debate on the long-termoutlook for milk quota policy can take place.
Implication for Irish dairy farm numbersPrevious policy analysis studies by the FAPRI–Ireland Partnership forecasted that the decouplingof direct payments and the reduction in dairy inter-vention prices agreed in the MTR were likely to causea considerable exodus from dairy farming. Breenand Hennessy (2003) projected that the number ofdairy producers in Ireland would fall from approx-imately 26 000 in 2002 to 18 000 in 2012 and 14 000in 2015 as a result of the MTR of the CAP. Accordingto Connolly et al. (2006) data, the average producersize is 225 000 L and this is projected to increaseto almost 300 000 L by 2012 and 350 000 L by2015 as a result of the MTR of the CAP.
Given that the milk price is projected to fall to agreater extent in the WTO scenario, the implicationfor dairy producer numbers is likely to be morenegative. Hennessy and Thorne (2006) suggestedthat the WTO scenario would have very severeconsequences for dairy producer numbers, withmore than half exiting milk production over the next10 years; and that active dairy producers would fallto approximately 9000 by 2015 under WTO ascompared to 14 000 under MTR, increasing theaverage producer supply to almost 500 000 L.
C O N T R I B U T I O N O F T E C H N I C A L I N N OVAT I O N AT FA R M L E V E L
Regardless of future dairy sector policy, it isclear that the Irish dairy farming sector is facing
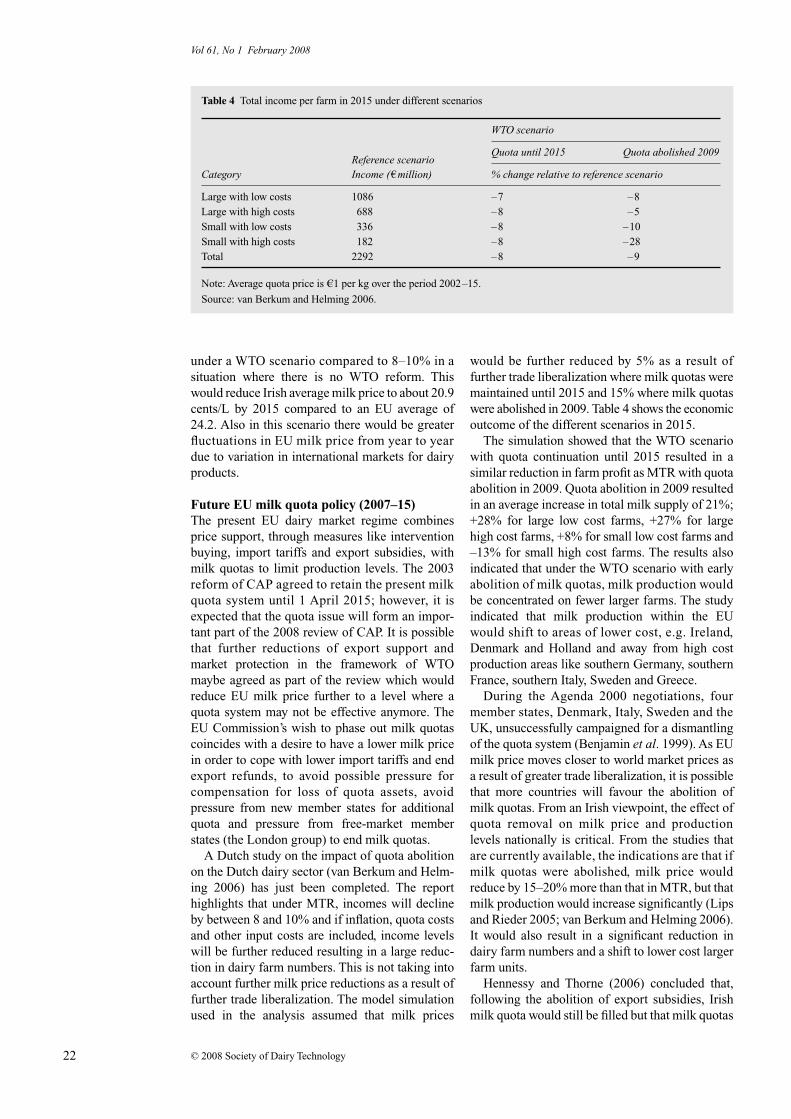
challenges and continued technical innovation thatare very important for the sustainability of thesector in the long term. Given that milk prices areprojected to fall to approximately 21–22 cents/L asa result of CAP and WTO reforms, dairy farmershave no option but to increase production efficiencyand scale if they are to maintain current incomes.Acquiring and applying newer skills and knowledgeto develop more efficient milk production systemsis a critical requirement for the industry in future.Through research new technology can be developedwhich will allow dairy farmers to increase scalewhile at the same time reduce the unit cost ofproduction. Table 5 shows a comparison of thephysical and financial performance from the averagespecialist dairy farmer in the NFS and potentialbased on best performance within Mooreparkresearch herds (Horan et al. 2004, 2005). Threemain areas of technical innovation will be importantfor the sustainability of dairy farming in Ireland:the use of profitable high quality genetics to increasethe productivity of the herd; maximizing theutilization and performance from grazed grass;and the development of labour-efficient, while atthe same time lower fixed cost, systems of animalmanagement.
Using high economic breeding index geneticsOne of the main factors influencing farm profitnow and in the future is the genetic make-up of thedairy herd, which will be critical to the profitabilityof any dairy enterprise. Until recently, milk yieldhas been the main objective criterion for selectionin most temperate countries, and the use of Holstein-Friesian genetics of high milk production potentialhas been widespread. Overwhelming evidenceshows that selection solely on production traitsresults in reduced herd health, fertility and welfare(Pryce and Veerkamp 2001; Horan et al. 2004;Evans et al. 2006) with an almost 1% reduction peryear in calving rate to first service in Irish springcalving herds between 1990 and 2001 (Evans et al.2006). Reproductive performance affects theamount of milk produced per cow per day of herdlife, breeding costs, rate of voluntary and involuntaryculling, and the rate of genetic progress fortraits of importance (Plaizier et al. 1997), andconsequently results in a reduction in the overallprofitability of a dairy herd (Dijkhuizen et al. 1985;Lopez-Villalobos et al. 2000). In Ireland, therelative importance of fertility is higher becausemilk production is based to a large extent onseasonal pasture production systems, and thusprofitability is influenced by the ability to calvecows rapidly at the optimum time.
Since 2001, the Economic Breeding Index (EBI)has been in effect in Ireland to identify geneticallysuperior animals in order to increase profitabilitywithin Irish dairy herds (Veerkamp et al. 2002).
Table 5 Comparison of physical and financial performance from the average specialist dairy farmer from the National Farm Survey 2004 and potential target based on using recent technical innovation
National Farm Survey 2004 Moorepark target*
Milk yield (L/cow) 4700 6280Protein percentage 3.30 3.60Fat percentage 3.75 4.20Milk solids yield (kg/cow) 324 505Concentrate (kg/cow) 713 300Stocking rate (LU/ha) 1.9 2.5Calving interval (days) 394 366Six-week calving rate (%) 54 75Net margin (c/L) 10 19
Source: Horan et al. 2004 and 2005.
Vol 61, No 1 February 2008
© 2008 Society of Dairy Technology24
The EBI is currently composed of five sub-indexes(relative emphasis in parenthesis): milk production(49%), fertility/survival (32%), calving performance(8%), beef performance (6%) and health (5%). TheEBI favours animals whose progeny have a long herdlife, annually producing a large quantity of high com-position milk within a 365-day calving interval, areeasy calving and have progeny that themselves calveeasily in the future and exhibit large carcase weightsof good conformation. In 2006, approximately 30%of replacements entering Irish dairy herds will haveoriginated from artificial insemination (AI) sires,with the remainder resulting from the use of stockbulls (Department of Agriculture and Food 2006).The average EBI of dairy cows and stock bullsrecorded in Ireland is a24 and a8, respectively,with the average EBI of the dairy cow populationonly increasing by a1 per annum (ICBF 2005).
Based on the gains observed in research and theprevailing EBI in the national dairy cow population(EBI = a24), an increase in profit of a3500 per454 000 L of milk quota per year through thedevelopment of a high EBI herd can be expected inthe coming years.
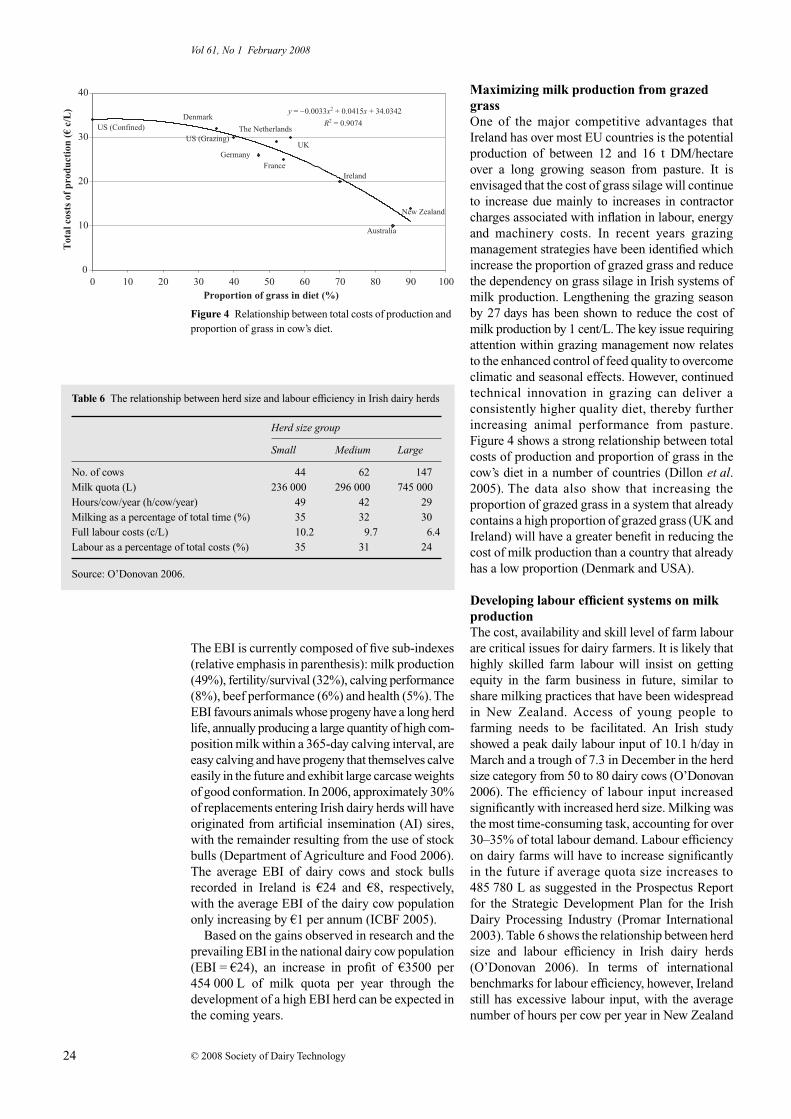
Maximizing milk production from grazed grassOne of the major competitive advantages thatIreland has over most EU countries is the potentialproduction of between 12 and 16 t DM/hectareover a long growing season from pasture. It isenvisaged that the cost of grass silage will continueto increase due mainly to increases in contractorcharges associated with inflation in labour, energyand machinery costs. In recent years grazingmanagement strategies have been identified whichincrease the proportion of grazed grass and reducethe dependency on grass silage in Irish systems ofmilk production. Lengthening the grazing seasonby 27 days has been shown to reduce the cost ofmilk production by 1 cent/L. The key issue requiringattention within grazing management now relatesto the enhanced control of feed quality to overcomeclimatic and seasonal effects. However, continuedtechnical innovation in grazing can deliver aconsistently higher quality diet, thereby furtherincreasing animal performance from pasture.Figure 4 shows a strong relationship between totalcosts of production and proportion of grass in thecow’s diet in a number of countries (Dillon et al.2005). The data also show that increasing theproportion of grazed grass in a system that alreadycontains a high proportion of grazed grass (UK andIreland) will have a greater benefit in reducing thecost of milk production than a country that alreadyhas a low proportion (Denmark and USA).
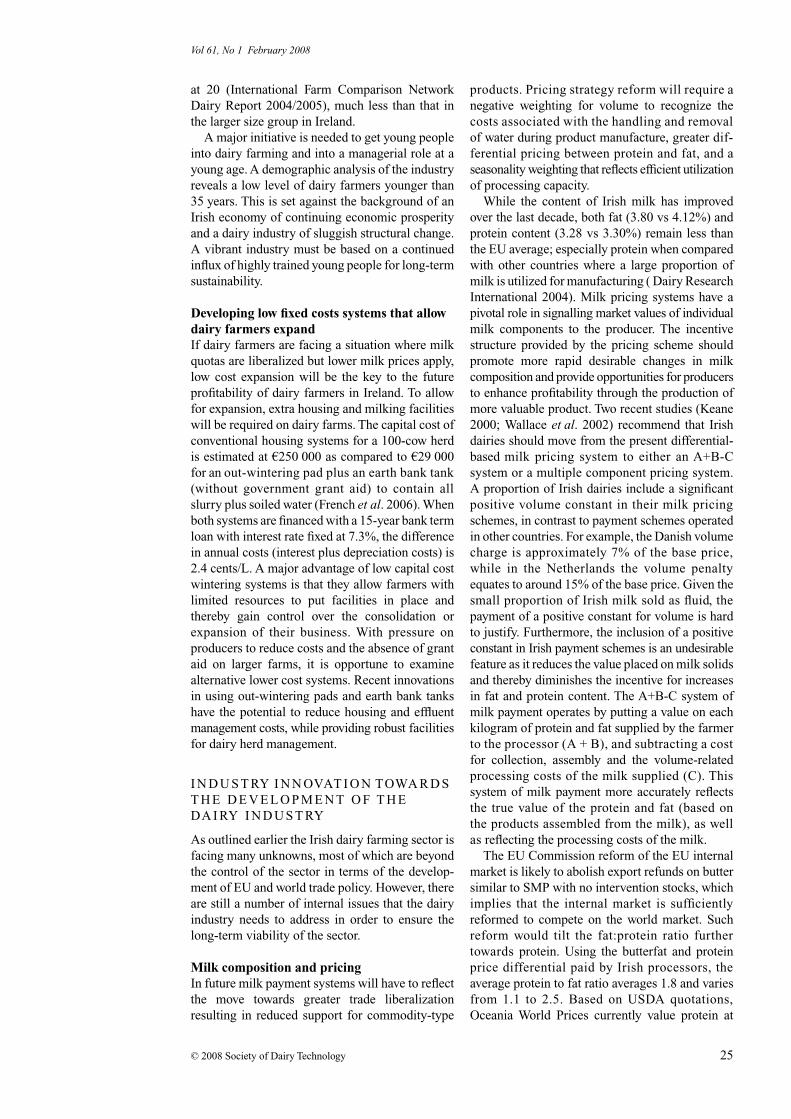
Developing labour efficient systems on milk productionThe cost, availability and skill level of farm labourare critical issues for dairy farmers. It is likely thathighly skilled farm labour will insist on gettingequity in the farm business in future, similar toshare milking practices that have been widespreadin New Zealand. Access of young people tofarming needs to be facilitated. An Irish studyshowed a peak daily labour input of 10.1 h/day inMarch and a trough of 7.3 in December in the herdsize category from 50 to 80 dairy cows (O’Donovan2006). The efficiency of labour input increasedsignificantly with increased herd size. Milking wasthe most time-consuming task, accounting for over30–35% of total labour demand. Labour efficiencyon dairy farms will have to increase significantlyin the future if average quota size increases to485 780 L as suggested in the Prospectus Reportfor the Strategic Development Plan for the IrishDairy Processing Industry (Promar International2003). Table 6 shows the relationship between herdsize and labour efficiency in Irish dairy herds(O’Donovan 2006). In terms of internationalbenchmarks for labour efficiency, however, Irelandstill has excessive labour input, with the averagenumber of hours per cow per year in New Zealand
Figure 4 Relationship between total costs of production and proportion of grass in cow’s diet.
Table 6 The relationship between herd size and labour efficiency in Irish dairy herds
Herd size group
Small Medium Large
No. of cows 44 62 147Milk quota (L) 236 000 296 000 745 000Hours/cow/year (h/cow/year) 49 42 29Milking as a percentage of total time (%) 35 32 30Full labour costs (c/L) 10.2 9.7 6.4Labour as a percentage of total costs (%) 35 31 24
Source: O’Donovan 2006.
© 2008 Society of Dairy Technology 25
Vol 61, No 1 February 2008
at 20 (International Farm Comparison NetworkDairy Report 2004/2005), much less than that inthe larger size group in Ireland.
A major initiative is needed to get young peopleinto dairy farming and into a managerial role at ayoung age. A demographic analysis of the industryreveals a low level of dairy farmers younger than35 years. This is set against the background of anIrish economy of continuing economic prosperityand a dairy industry of sluggish structural change.A vibrant industry must be based on a continuedinflux of highly trained young people for long-termsustainability.
Developing low fixed costs systems that allow dairy farmers expandIf dairy farmers are facing a situation where milkquotas are liberalized but lower milk prices apply,low cost expansion will be the key to the futureprofitability of dairy farmers in Ireland. To allowfor expansion, extra housing and milking facilitieswill be required on dairy farms. The capital cost ofconventional housing systems for a 100-cow herdis estimated at a250 000 as compared to a29 000for an out-wintering pad plus an earth bank tank(without government grant aid) to contain allslurry plus soiled water (French et al. 2006). Whenboth systems are financed with a 15-year bank termloan with interest rate fixed at 7.3%, the differencein annual costs (interest plus depreciation costs) is2.4 cents/L. A major advantage of low capital costwintering systems is that they allow farmers withlimited resources to put facilities in place andthereby gain control over the consolidation orexpansion of their business. With pressure onproducers to reduce costs and the absence of grantaid on larger farms, it is opportune to examinealternative lower cost systems. Recent innovationsin using out-wintering pads and earth bank tankshave the potential to reduce housing and effluentmanagement costs, while providing robust facilitiesfor dairy herd management.
I N D U S T RY I N N OVAT I O N TOWA R D S T H E D E V E L O P M E N T O F T H E DA I RY I N D U S T RY
As outlined earlier the Irish dairy farming sector isfacing many unknowns, most of which are beyondthe control of the sector in terms of the develop-ment of EU and world trade policy. However, thereare still a number of internal issues that the dairyindustry needs to address in order to ensure thelong-term viability of the sector.
Milk composition and pricingIn future milk payment systems will have to reflectthe move towards greater trade liberalizationresulting in reduced support for commodity-type
products. Pricing strategy reform will require anegative weighting for volume to recognize thecosts associated with the handling and removalof water during product manufacture, greater dif-ferential pricing between protein and fat, and aseasonality weighting that reflects efficient utilizationof processing capacity.
While the content of Irish milk has improvedover the last decade, both fat (3.80 vs 4.12%) andprotein content (3.28 vs 3.30%) remain less thanthe EU average; especially protein when comparedwith other countries where a large proportion ofmilk is utilized for manufacturing ( Dairy ResearchInternational 2004). Milk pricing systems have apivotal role in signalling market values of individualmilk components to the producer. The incentivestructure provided by the pricing scheme shouldpromote more rapid desirable changes in milkcomposition and provide opportunities for producersto enhance profitability through the production ofmore valuable product. Two recent studies (Keane2000; Wallace et al. 2002) recommend that Irishdairies should move from the present differential-based milk pricing system to either an A+B-Csystem or a multiple component pricing system.A proportion of Irish dairies include a significantpositive volume constant in their milk pricingschemes, in contrast to payment schemes operatedin other countries. For example, the Danish volumecharge is approximately 7% of the base price,while in the Netherlands the volume penaltyequates to around 15% of the base price. Given thesmall proportion of Irish milk sold as fluid, thepayment of a positive constant for volume is hardto justify. Furthermore, the inclusion of a positiveconstant in Irish payment schemes is an undesirablefeature as it reduces the value placed on milk solidsand thereby diminishes the incentive for increasesin fat and protein content. The A+B-C system ofmilk payment operates by putting a value on eachkilogram of protein and fat supplied by the farmerto the processor (A + B), and subtracting a costfor collection, assembly and the volume-relatedprocessing costs of the milk supplied (C). Thissystem of milk payment more accurately reflectsthe true value of the protein and fat (based onthe products assembled from the milk), as wellas reflecting the processing costs of the milk.
The EU Commission reform of the EU internalmarket is likely to abolish export refunds on buttersimilar to SMP with no intervention stocks, whichimplies that the internal market is sufficientlyreformed to compete on the world market. Suchreform would tilt the fat:protein ratio furthertowards protein. Using the butterfat and proteinprice differential paid by Irish processors, theaverage protein to fat ratio averages 1.8 and variesfrom 1.1 to 2.5. Based on USDA quotations,Oceania World Prices currently value protein at
Vol 61, No 1 February 2008
© 2008 Society of Dairy Technology26
2.9, while World Prices value protein at 3.3 timesmore than butterfat (Personal Communication).FAPRI projections for world prices in 2015 suggesta price differential of 2.6. Therefore, to reflect thesechanges Irish milk payment systems in the futurewill require a greater differential between proteinand fat.
Product mix, plant utilization efficiency and seasonality of milk supplyThe Irish dairy industry produces a high proportionof its output as base or commodity-type products(butter, powder and bulk cheeses), which up to nowhave relied heavily on EU market interventionand other market support. Changes to the policyenvironment at EU and WTO level will resultin reduced support for these commodity-typeproducts in future. These changes will require thedairy industry to make changes to the existingproduct mix. The potential for increases in efficiencyin the processing of commodity products andincreasing the proportion of output away frombase/commodity type-products were highlightedas two key strategies for the future as suggested inthe Prospectus Report for the Strategic Develop-ment Plan for the Irish Dairy Processing Industry(Promar International 2003). Rationalizing thenumber of processing plants for butter, powder andcasein production from the present level of 11 to 4would deliver efficiencies and savings at manufac-turing and enterprise level through scale and more
efficient use of resources. Increasing revenuesfrom milk production through research and devel-opment in products that are growing in demandwould also result in a higher marginal productvalue.
Milk production in Ireland is predominatelybased on spring calving systems. This is becausegrazed grass is the lowest cost feed and can makeup a large proportion of the diet over a long grazingseason. For climatic reasons most regions in theEU have a period of 6 months or longer whencheap production based on grazed grass cannotoccur, while in Ireland in dry southern parts this isreduced to less than 3 months (Dillon et al. 2005).On this basis, a much larger incentive will berequired to ensure all-year-round milk supply inIreland compared to other EU countries. At present,seasonality of supply is reducing processingefficiency with peak deliveries during the peaksupply month (May), a multiple of six times thevolume of the lowest month’s production (January).This has two disadvantages. First, this seasonalityleads to poor capacity utilization in the Irishprocessing industry, adding to the operating costsof the processor. Second, it restricts the types ofproducts that can be produced especially thoserequiring year-round supply.
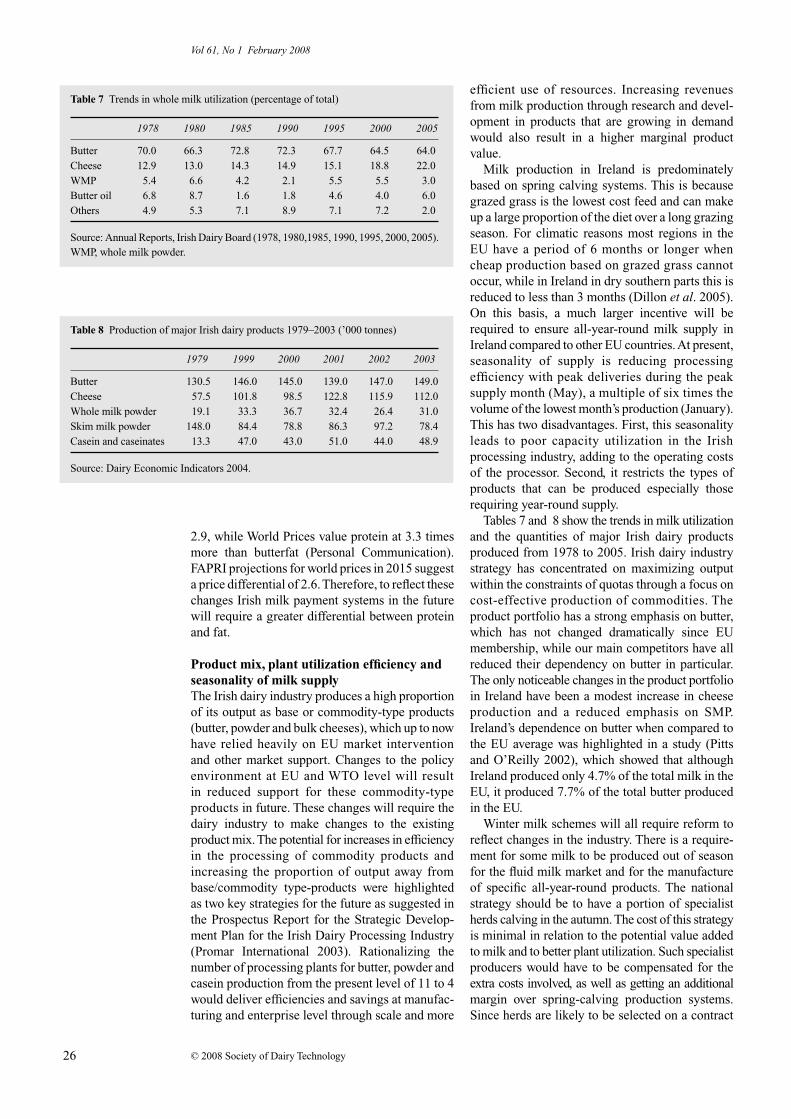
Tables 7 and 8 show the trends in milk utilizationand the quantities of major Irish dairy productsproduced from 1978 to 2005. Irish dairy industrystrategy has concentrated on maximizing outputwithin the constraints of quotas through a focus oncost-effective production of commodities. Theproduct portfolio has a strong emphasis on butter,which has not changed dramatically since EUmembership, while our main competitors have allreduced their dependency on butter in particular.The only noticeable changes in the product portfolioin Ireland have been a modest increase in cheeseproduction and a reduced emphasis on SMP.Ireland’s dependence on butter when compared tothe EU average was highlighted in a study (Pittsand O’Reilly 2002), which showed that althoughIreland produced only 4.7% of the total milk in theEU, it produced 7.7% of the total butter producedin the EU.
Winter milk schemes will all require reform toreflect changes in the industry. There is a require-ment for some milk to be produced out of seasonfor the fluid milk market and for the manufactureof specific all-year-round products. The nationalstrategy should be to have a portion of specialistherds calving in the autumn. The cost of this strategyis minimal in relation to the potential value addedto milk and to better plant utilization. Such specialistproducers would have to be compensated for theextra costs involved, as well as getting an additionalmargin over spring-calving production systems.Since herds are likely to be selected on a contract
Table 7 Trends in whole milk utilization (percentage of total)
1978 1980 1985 1990 1995 2000 2005
Butter 70.0 66.3 72.8 72.3 67.7 64.5 64.0Cheese 12.9 13.0 14.3 14.9 15.1 18.8 22.0WMP 5.4 6.6 4.2 2.1 5.5 5.5 3.0Butter oil 6.8 8.7 1.6 1.8 4.6 4.0 6.0Others 4.9 5.3 7.1 8.9 7.1 7.2 2.0
Source: Annual Reports, Irish Dairy Board (1978, 1980,1985, 1990, 1995, 2000, 2005).WMP, whole milk powder.
Table 8 Production of major Irish dairy products 1979–2003 (’000 tonnes)
1979 1999 2000 2001 2002 2003
Butter 130.5 146.0 145.0 139.0 147.0 149.0Cheese 57.5 101.8 98.5 122.8 115.9 112.0Whole milk powder 19.1 33.3 36.7 32.4 26.4 31.0Skim milk powder 148.0 84.4 78.8 86.3 97.2 78.4Casein and caseinates 13.3 47.0 43.0 51.0 44.0 48.9
Source: Dairy Economic Indicators 2004.
© 2008 Society of Dairy Technology 27
Vol 61, No 1 February 2008
basis, the herds can be clustered together. All themilk collected over the winter months would beearly lactation milk, giving greater flexibility interms of product mix. It would also facilitate theblending of early lactation milk from autumn-calving herds with late lactation milk fromspring-calving herds as required. The cost of thetotal milk pool assembled can be lower than thatobtained from the current system even though themilk bonus payment is higher for milk from 100%autumn-calving herds.
Land useWhen EU milk quotas are abolished it is generallyaccepted that the next most limiting factor toincreased milk production on many dairy farms isfarm structure (Connolly et al. 2005). It is likelythat land purchase price in Ireland will continue tobe high for the foreseeable future. Therefore, it isimportant that land use policies facilitate theavailability of land for dairying through long-termleasing arrangements. The most efficient andcompetitive model for milk production in Irelandis the production of milk from grazed grass. Itis envisaged that herd sizes will increase substan-tially over the coming years, thereby requiringlarge blocks of land to facilitate expansion. Manydairy farms are constrained by farm size and farmfragmentation. Failure to acquire additional landadjacent to the milking area will result in expansionthrough the proliferation of intensive indoor highinput systems which is undesirable from an envi-ronmental viewpoint. It is therefore important thatmeasures that facilitate long-term leasing of landare put in place and ensure land transfers are notconstrained by the regulations.
Animal health and welfareFarming systems need to be sustainable in terms ofanimal welfare. Ireland has a good track record inthis regard and will need to build on this strengthto differentiate its almost unique system within aworld market. Irish cows graze outdoors for mostof the year and consumers perceive this productionas more ‘natural’ and ‘welfare-friendly’. There needbe no conflict between profitable dairy farming andecological sustainability.
The high animal health status of the Irishnational herd is vital to all forms of agricultural andfood production and to the export trade in particular.Infectious diseases of livestock impose constraintson production efficiency as well as affectinganimal welfare, and the quality and safety offood supply (Agri Vision 2015 Committee 2004).Bovine tuberculosis, brucellosis, bovine spongiformencephalopathy, and Johne’s disease are diseasesof major concern in Ireland, not only in regard tothe health of the animal but also because of thepossibility of direct contamination of food (e.g.
Salmonella, tuberculosis and Johne’s) (Agri Vision2015 Committee 2004).
EnvironmentA series of EU directives has been introduced withthe objective of protecting the natural environment.These include directives dealing with issues suchas water quality, the protection of the naturalenvironment birds and habitats. The positivecontribution of farming and agricultural policy tothe reduction of greenhouse gases and increasedlevels of carbon sequestration should be noted inthe context of Ireland’s efforts to achieve targets setout in the Kyoto protocol. The introduction of theNitrate Directive is a matter of the most interest toIrish dairy farmers. The directive aims to protectwater quality against pollution from agriculturalsources, with a primary emphasis on bettermanagement of livestock manure and otherorganic fertilizer. The Nitrate Directive set a legallimit of 170 kg of organic nitrogen that can beapplied per hectare (a stocking rate of 2 LU/ha).Economic modelling showed that of the 8000 dairyfarmers (approximately) that exceed the limit of170 kg/ha of organic N, approximately 12% couldcomply with the 170 kg/ha organic N limit at littleor no cost, 10% would be < 10% worse offfinancially; a further 8% would be < 20% worseoff and 5% > 20% worse off financially as a resultof the 170 kg/ha organic limit (Hennessy et al.2005). The analysis also shows that the impositionof the organic N limit of 170 kg will results inrelatively greater financial loss at farm level in thefuture due to the reduction in dairy farm numbers.It is therefore important that Ireland obtains aderogation of up to 250 kg of organic N/ha forthese farms at higher stocking rates. Much evidenceexists showing Ireland’s weather pattern, soil typeand grass-based system should warrant a higherlimit, and therefore it is important that we do noterode the competitiveness of the grass-basedsystem relative to other higher input systems in theEU with over regulatory environmental legislation.
C O N C L U S I O N S
This paper reviews recent trends in Irish dairyfarming and contemplates the short- to medium-term outlook for farming. Statistics from the IrishDepartment of Agriculture show that dairy farmnumbers are falling faster than any other system offarming despite the comparatively greater farmincomes associated with dairy enterprises. Thispaper outlines the challenges facing dairy farmersin Ireland in terms of the outlook for milk price andthe continued uncertainty regarding the future ofinternational trade agreements and the EU milk quotasystem. Analysis of international data suggests thatIreland has one of the lowest cash costs of production
Vol 61, No 1 February 2008
© 2008 Society of Dairy Technology28
but that its use of land and labour are still relativelyinefficient. If the industry is to prepare for an era ofmore liberal milk production, then the managementand policies supporting the reallocation of land andlabour resources are critical to future success. Thepaper also highlights the capacity and importanceof continued technical innovation and adaptationof new technologies to ensure sustainability ofIrish dairy farming in the long term.
R E F E R E N C E S
Agri Vision 2015 Committee (2004) Report of the Agri Vision2015 Committee. www.agri-vision2015.ie.
Benjamin C, Gohin A and Guyomard H (1999) The future ofEuropean Union Dairy Policy. Canadian Journal ofAgricultural Economics 47 91–101.
van Berkum S and Helming J (2006) European dairy policy inthe years to come: impact of quota abolition on the dairysector. The Hague, The Netherlands: LEI-Wageningen UR.
Binfield J, Donnellan T, Hanrahan K and Westhoff P (2003)The Luxembourg CAP reform agreement: Implicationsfor EU and Irish Agriculture. Medium Term Analysis forthe Agri-Food Sector. Teagasc, Rural Economy ResearchCentre Dublin.
Binfield J, Donnellan T, Hanrahan K and Westhoff P (2007)World Agriculture Trade Reform and the WTO DohaRound: Analysis of the Impact on EU and Irish Agri-culture. Teagasc, Rural Economy Research Centre Galway.
Boyle G E, Kearney B, McCarthy T and Keane M (1992) TheCompetitiveness of Irish Agriculture. Allied Irish Banksand Irish Farmers Journal. Dublin, Ireland: Irish Farmer’sJournal.
Breen J and Hennessy T (2003) The impact of the MTR andWTO reform on Irish farms. FABRI Ireland Outlook 2003Medium Term Analysis for the Agri-Food Sector. Teagasc,Rural Economy Research Centre Dublin.
Connolly L, Kinsella A, Quinlan G and Moran B (2005)National Farm Survey 2004. Galway, Ireland: Teagasc,Farm Surveys Department, Rural Economy ResearchCentre.
Connolly L, Kinsella A, Quinlan G and Moran B (2006)National Farm Survey 2005. Galway, Ireland: Teagasc,Farm Surveys Department, Rural Economy Research Centre.
Dairy Research International (2004) Dairy EconomicIndicators. Surrey, UK: Dairy Research International.
Department of Agriculture and Food (2006) Annual Reviewand Outlook for Agriculture and Food 2005/2006. Dublin,Ireland: Department of Agriculture and Food, CorporateAffairs Division.
Dijkhuizen A A, Renkema J A and Stelwagen J (1985)Economic aspects of reproductive failure in dairy cattle.I. Financial loss at farm level. American Journal of Pre-ventative Veterinary Medicine 3 265–276.
Dillon P, Roche J R, Shalloo L and Horan B (2005) Optimis-ing financial return from grazing in temperate pastures. InUtilisation of Grazed Grass in Temperate Animal Systems.Murphy J J ed. Proceedings of a Satellite Workshop of theXxth International Grassland Congress, Cork, Ireland.
Eurostat (2003) Milk Statistics Database <http://europa.eu.int/newcronos/>. Accessed 15 July 2003.
Evans R D, Dillon P, Buckley F, Berry D P, Wallace M, DucrocqV and Garrick D J (2006) Trends in milk production,
fertility and survival of cows in 14 Irish dairy herds as aresult of the introgression of Holstein-Friesian genes.Animal Science 82 423–433.
Fingleton W A (1995) Comparative costs and returns for milkproduction in EU countries. Paper presented at the AnnualConference of the Agricultural Economics Society ofIreland, Dublin, October 1995.
French P, Ryan T and O’Loughlin J (2006) Cost effective win-tering options. In New Vision for the Irish Dairy Industry.Proceedings of the Teagasc National Dairy Conference2006, Teagasc, Carlow, pp. 60–66.
Hennessy T, Shalloo L and Dillon P (2005) The economicimplications of complying with a limit on organic nitrogenin a decoupled policy environment—an Irish case study.Journal of Farm Management 12 297–311.
Hennessy T and Thorne F (2006) The Impact of WTO DohaDevelopment Round on Farming in Ireland. Galway,Ireland: Teagasc, Rural Economy Research Centre.
Horan B, Mee J F, Rath M, O’Connor P and Dillon P (2004)The effect of strain of Holstein-Friesian cow and feedsystem on reproductive performance in seasonal-calving milk production systems. Animal Science 79453–469.
Horan B, Dillon P, Faverdin P, Delaby L, Buckley F and RathM (2005) The interaction of strain of Holstein Friesiancows and pasture based feed systems on milk yield, bodyweight and body condition score. Journal of Dairy Science88 1231–1243.
International Farm Comparison Network Dairy Report (2004/2005) Hemme T, Christoffers K and Deekon E, eds.International Farm Comparison Network. Braunschweig,Germany: Global Farm GbR, ISSN 1610-434x.
Irish Cattle Breeding Federation (2005) Irish CattleBreeding Statistics. Co. Cork, Ireland: Irish CattleBreeding Federation.
Irish Dairy Board (1978) Annual Report. Dublin, Ireland:Irish Dairy Board Head Office.
Irish Dairy Board (1980) Annual Report. Dublin, Ireland:Irish Dairy Board Head Office.
Irish Dairy Board (1985) Annual Report. Dublin, Ireland:Irish Dairy Board Head Office.
Irish Dairy Board (1990) Annual Report. Dublin, Ireland:Irish Dairy Board Head Office.
Irish Dairy Board (1995) Annual Report. Dublin, Ireland:Irish Dairy Board Head Office.
Irish Dairy Board (2000) Annual Report. Dublin, Ireland:Irish Dairy Board Head Office.
Irish Dairy Board (2005) Annual Report. Dublin, Ireland:Irish Dairy Board Head Office.
Keane M (2000) Milk payment issues—payment schemesand transparency in statements. Discussion Paper. Cork,Ireland: Department of Food Economics, UniversityCollege Cork.
Lips M and Rieder P (2005) Abolition of raw milk quotasin the European Union: a CGE analysis at the membercountry level. Journal of Agriculture Economics 56 1–17.
Lopez-Villalobos N, Garrick D J, Holmes C W, Blair H T andSpelman R J (2000) Profitabilities of some mating systemsfor dairy herds in New Zealand. Journal of Dairy Science83 144–153.
National Farm Survey (1990–2003) National Farm SurveyReport. Galway, Ireland: Teagasc, Rural Economy ResearchCentre.
© 2008 Society of Dairy Technology 29
Vol 61, No 1 February 2008
O’Donovan K (2006) Labour efficiency on Irish Dairy Farms.PhD Thesis. The National University of Ireland. Dublin.
Pitts E and O’Reilly P (2002) Strategic direction for the Irishdairy industry in a freer market. A discussion document.Teagasc, Rural Economy Research Centre, Dublin 4.
Plaizier J C B, King G J, Dekkers J C M and Lissemore K(1997) Estimation of economic values of indices forreproductive performance in dairy herds using computersimulation. Journal of Dairy Science 80 2775–2783.
Promar International (2003) Prospectus strategic develop-ment plan for the Irish dairy processing sector.
Pryce J E and Veerkamp R F (2001) The incorporation offertility indices in genetic improvement programmes. InFertility in the High Producing Dairy Cow. Diskin M Ged. Midlothian, Scotland: British Society of AnimalScience, Occasional Publication 26 237–249.
Thorne F and Fingleton B (2005) Irish dairying—can wecompete? Teagasc National Dairy Conference 2005. InWinning in Changing Times. Teagasc Oak Park Carlow.10–24.
Veerkamp R F, Dillon P, Kelly E, Cromie A R and Groen AF (2002) Dairy cattle breeding objectives combiningyield, survival and calving interval for pasture-basedsystems in Ireland under different milk quota scenarios.Livestock Production Science 76 137–151.
Wallace M, Breen J and Crosse S (2002) Milk pricingrevisited: equity, transparency and producer incentives.Irish Grassland Association Journal 36 106–119.
Whetstone L (1999) The perversity of agricultural subsidies.In Fearing Food, Risk, Health and Environment, pp. 123.Morris J and Roger Bate R. eds. London, UK: Butterworth-Heinemann.
Related Documents