Future Internet 2012, 4, 488-513; doi:10.3390/fi4020488 OPEN ACCESS future internet ISSN 1999-5903 www.mdpi.com/journal/futureinternet Article Distributed Performance Measurement and Usability Assessment of the Tor Anonymization Network Sebastian M ¨ uller 1, ? , Franziska Brecht 2 , Benjamin Fabian 2, ? , Steffen Kunz 2 and Dominik Kunze 2 1 Institute of Computer Science, Freie Universit¨ at Berlin, TakustraBe 9, 14195 Berlin, Germany 2 Institute of Information Systems, Humboldt-Universit¨ at zu Berlin, Spandauer StraBe 1, 10178 Berlin, Germany; E-Mails: [email protected] (F.B.); [email protected] (S.K.); [email protected] (D.K.) ? Authors to whom correspondence should be addressed; E-Mails: [email protected] (S.M.); [email protected] (B.F.); Tel.: +49-30-838-75136; Fax: +49-30-838-75109. Received: 1 November 2011; in revised form: 2 March 2012 / Accepted: 8 May 2012 / Published: 15 May 2012 Abstract: While the Internet increasingly permeates everyday life of individuals around the world, it becomes crucial to prevent unauthorized collection and abuse of personalized information. Internet anonymization software such as Tor is an important instrument to protect online privacy. However, due to the performance overhead caused by Tor, many Internet users refrain from using it. This causes a negative impact on the overall privacy provided by Tor, since it depends on the size of the user community and availability of shared resources. Detailed measurements about the performance of Tor are crucial for solving this issue. This paper presents comparative experiments on Tor latency and throughput for surfing to 500 popular websites from several locations around the world during the period of 28 days. Furthermore, we compare these measurements to critical latency thresholds gathered from web usability research, including our own user studies. Our results indicate that without massive future optimizations of Tor performance, it is unlikely that a larger part of Internet users would adopt it for everyday usage. This leads to fewer resources available to the Tor community than theoretically possible, and increases the exposure of privacy-concerned individuals. Furthermore, this could lead to an adoption barrier of similar privacy-enhancing technologies for a Future Internet.

Welcome message from author
This document is posted to help you gain knowledge. Please leave a comment to let me know what you think about it! Share it to your friends and learn new things together.
Transcript
Future Internet 2012, 4, 488-513; doi:10.3390/fi4020488OPEN ACCESS
future internetISSN 1999-5903
www.mdpi.com/journal/futureinternet
Article
Distributed Performance Measurement and UsabilityAssessment of the Tor Anonymization NetworkSebastian Muller 1,?, Franziska Brecht 2, Benjamin Fabian 2,?, Steffen Kunz 2
and Dominik Kunze 2
1 Institute of Computer Science, Freie Universitat Berlin, TakustraBe 9, 14195 Berlin, Germany2 Institute of Information Systems, Humboldt-Universitat zu Berlin, Spandauer StraBe 1, 10178 Berlin,
Germany; E-Mails: [email protected] (F.B.);[email protected] (S.K.); [email protected] (D.K.)
? Authors to whom correspondence should be addressed;E-Mails: [email protected] (S.M.); [email protected] (B.F.);Tel.: +49-30-838-75136; Fax: +49-30-838-75109.
Received: 1 November 2011; in revised form: 2 March 2012 / Accepted: 8 May 2012 /Published: 15 May 2012
Abstract: While the Internet increasingly permeates everyday life of individuals aroundthe world, it becomes crucial to prevent unauthorized collection and abuse of personalizedinformation. Internet anonymization software such as Tor is an important instrument toprotect online privacy. However, due to the performance overhead caused by Tor, manyInternet users refrain from using it. This causes a negative impact on the overall privacyprovided by Tor, since it depends on the size of the user community and availability of sharedresources. Detailed measurements about the performance of Tor are crucial for solving thisissue. This paper presents comparative experiments on Tor latency and throughput for surfingto 500 popular websites from several locations around the world during the period of 28 days.Furthermore, we compare these measurements to critical latency thresholds gathered fromweb usability research, including our own user studies. Our results indicate that withoutmassive future optimizations of Tor performance, it is unlikely that a larger part of Internetusers would adopt it for everyday usage. This leads to fewer resources available to theTor community than theoretically possible, and increases the exposure of privacy-concernedindividuals. Furthermore, this could lead to an adoption barrier of similar privacy-enhancingtechnologies for a Future Internet.
Future Internet 2012, 4 489
Keywords: internet anonymity; onion routing; Tor; web latency; usability
1. Introduction
The Internet increasingly permeates everyday life of individuals around the world. On the otherhand, information technology allows data analysis to a degree which was inconceivable a few yearsago. Simultaneously to the increasing amount and availability of information about Internet users, newinformation retrieval, data mining and further technologies allow to automatically collect, filter andanalyze personal information and to draw conclusions based on this process. Democratic societies shouldfurther advocate environments that respect user privacy for citizens and should support individuals whoface repressive censorship to access public information without being identified or traced. In politicalregimes, where personal rights, the freedom of speech, and in particular free access to information isrestricted, these possibilities of modern data collection can lead to persecution of individuals if theiridentity is unveiled. Another restraint is censorship, which may be used to restrict free access toinformation [1].
By using anonymization tools such as the Tor onion routing network [2,3], Internet users canconceal their virtual tracks to a certain degree by obfuscating their IP addresses, allowing for a moreanonymous Internet access. With Tor, application messages are not directly routed to the receiver, but areencrypted and forwarded through ephemeral paths of Tor relays through an overlay network, using morecomplicated routes that are difficult to analyze for third parties. The more users participate, the harderit is to correlate senders and receivers, and the less likely it is for any user to raise suspicions simply byusing Tor: “Anonymity loves company” [4]. The anonymity provided within the Tor network attractsmany different groups of users, such as journalists and activists or business, governmental, military, andprivate users [5,6]. A recent study showed significant growth of Tor users in China as the governmentalcensorship increased and also in Iran when the riots after the presidential election took place [7].
However, due to usability problems caused by Tor, many “average” Internet users refrain from usingit. This causes a negative impact on the potential overall privacy provided by Tor, since it dependson the size of the user community and availability of shared resources such as Tor relays. Besidesone-time installation and configuration efforts, the main usability loss when using an anonymization toolsuch as Tor is an increase in latency. Several authors already discussed technically why Tor is slowingdown a client’s Internet speed and proposed how to improve the performance [7–9]. However, detailedcomparative measurements about the performance of Tor are crucial for assessing and solving this issue.
This paper presents distributed measurements on Tor latency and throughput for surfing to 500popular websites from several PlanetLab nodes around the world during the period of 28 days(PlanetLab [10] provides a globally distributed testbed for network research). Furthermore, we comparethese measurements to critical latency thresholds gathered from web usability research, including ourown user studies. The resulting expected user cancelation rate—i.e., the percentage of users who abandonthe wait during a certain time interval—is an indicator how easy it would be to keep existing users and toattract new, “average” Web users to Tor for increasing their own anonymity as well as the anonymity of
Future Internet 2012, 4 490
the whole user community. Our results could also be relevant for integrating similar privacy-enhancingtechnologies into a “Future Internet”.
The structure of the paper is the following. We present related work in Section 2, followed by adescription of our measurement setup in Section 3. The experimental results are presented in Section 4.An interpretation of those results from the perspective of web usability is given in Section 5. Section 6discusses limitations and future work. Section 7 concludes the paper.
2. Related Work
Even though Internet privacy is increasingly being covered in the media, many Internet users are stillnot aware of the attacks that threaten the privacy of their daily communication links. One importantcountermeasure against attacks on communication privacy is anonymization [11], the obfuscation of theidentity of communication partners, especially of clients contacting a public server. As an importantexample, the Tor onion routing network provides privacy for Internet users by fundamentally enhancingtheir anonymity when using the Internet [2].
However, a fundamental problem associated with many of today’s security and privacy solutions isnot primarily that the level of security they provide is insufficient, but rather their lack of usability. If theusability for certain security features is too low, end users are not willing to apply them, increasing theusers’ personal risk of exposure to adversary attacks. Recent studies indicate that too complex securityfeatures are not applied unless they are mandatory, see for example the usage of security in bankingscenarios [12]. The amount of time or money users are willing to spend for more security is restrictedand differs individually.
There exist two ways to foster a broader application of security mechanisms: either (i) to increasethe awareness of security risks in order to raise the willingness to pay money or time; or (ii) to increasethe usability of the security features. In the case of Tor, we argue that due to its poor usability interms of network latency, Tor is not as frequently and intensively used as would be desirable. A largeruser base—with proportionate number of additional Tor relays—could enhance the privacy of its usersindirectly by making Tor traffic (i.e., connections to well-known relays) less rare and suspicious. Thisargument is supported by research on economic network effects and the role of usability in anonymitysystems [4,13].
Moreover, generalizing from current Tor adoption to future privacy infrastructures, if anonymitymechanisms are to be deployed to protect user privacy in a Future Internet [14], the performanceexpectations of average users need to be respected.
An important aspect of usability is the latency overhead caused by anonymization systems. Classicalanonymity systems are mix networks, which were invented by David Chaum for anonymous email [15]and were later generalized to arbitrary anonymous communication [16]. In comparison to mix networks,Tor already provides much lower latency because traffic of different senders is not stored for a time andsent out in batches in order to counter timing attacks [2]. Recent studies provide a simulation analysisof the interrelation of network topology, additional synchronization and dummy traffic against timingattacks, anonymity, and overhead [17]. Even though Tor does not (yet) apply these additional protectionmeasures, end user latency is still high.
Future Internet 2012, 4 491
Several authors have already qualitatively discussed why Tor is by design slow, or have proposedideas how to improve the performance, e.g., [9] or [8]. An analysis of the number and the reportedbandwidth of Tor relay servers from 2006 until 2008 gives an aggregated view on global Tor capacityand actual load [9]. Another study investigates the impact of different Tor path selection algorithms onanonymity and performance [18]. Further studies investigate the performance of Tor hidden services [19]and [20], which is different from our focus on accessing standard websites through Tor. Related researchalso includes demographic studies on Tor, e.g., number and countries of exit nodes or estimation of usernumbers and origin [7].
In the Tor Metrics project [21], statistics such as number of users, relays, and bridges are collected.Furthermore, the duration and percentage of timeouts and failures of downloading files over Tor froma few data repositories are measured. These statistics also indicate that the performance of Tor is ingeneral volatile over time, but the measurement of latency overhead compared to a direct connectionis not provided. Furthermore, the number of servers used for these measurements is very small. Inan earlier pre-study, we conducted three-day experiments from Germany to 50 websites [22]. Thereis also a report on Tor usage, including performance measurements [23] and the software TorFlow, atoolset for onion router performance analysis and measurements [24]. Another study [25] experimentallyreveals a principal reason of Tor’s weak performance, namely frequent delays (as high as a few seconds)contributed by single, overloaded onion routers with low bandwidths. An interesting twist of ourproblem at hand is discussed in [26], where the impact of different latency values on de-anonymizingcommunication partners is investigated.
In contrast to these studies, our current paper focuses on an extensive quantitative assessment of thelatency overhead of Tor, comparing the latency of Internet access from several countries with and withoutthe application of Tor, using a list of 500 popular websites. Furthermore, we provide an analysis andmapping of these measurements to latency acceptance studies. For this, we define measures in orderto estimate when users cancel their Web page request, or in other words, how much waiting time userstolerate for a request. These measures are based on related work and previous user studies conducted bythe authors [27].
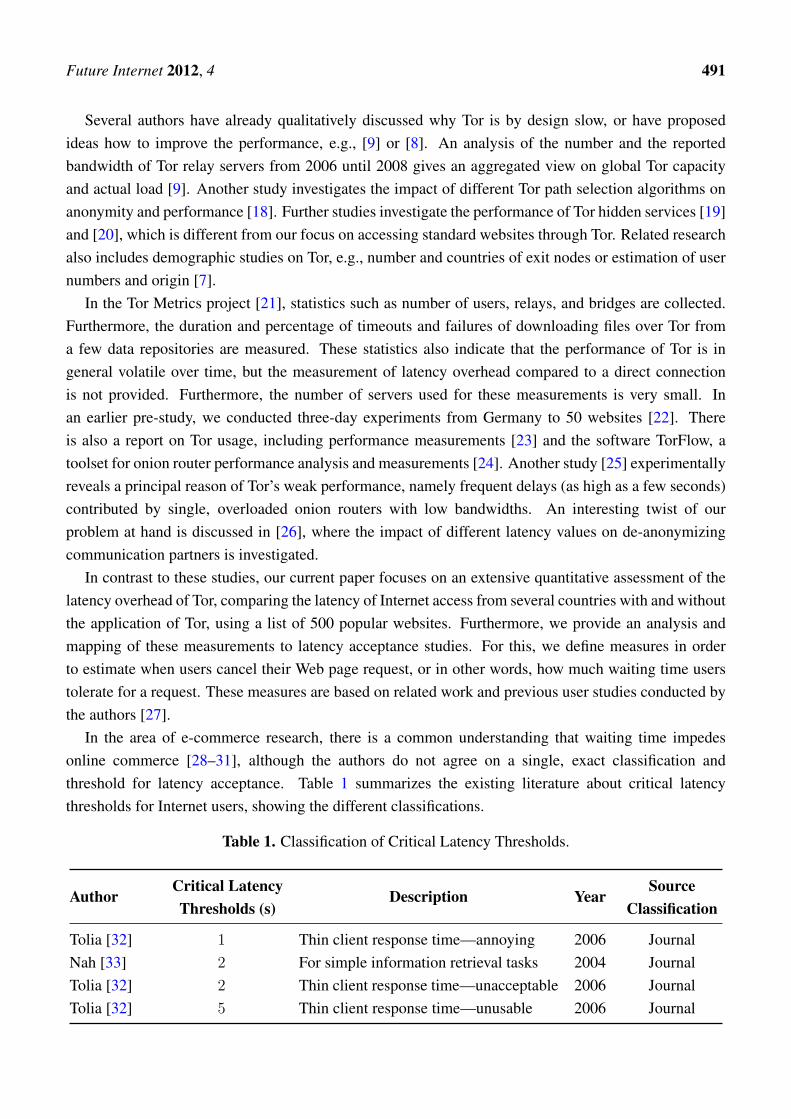
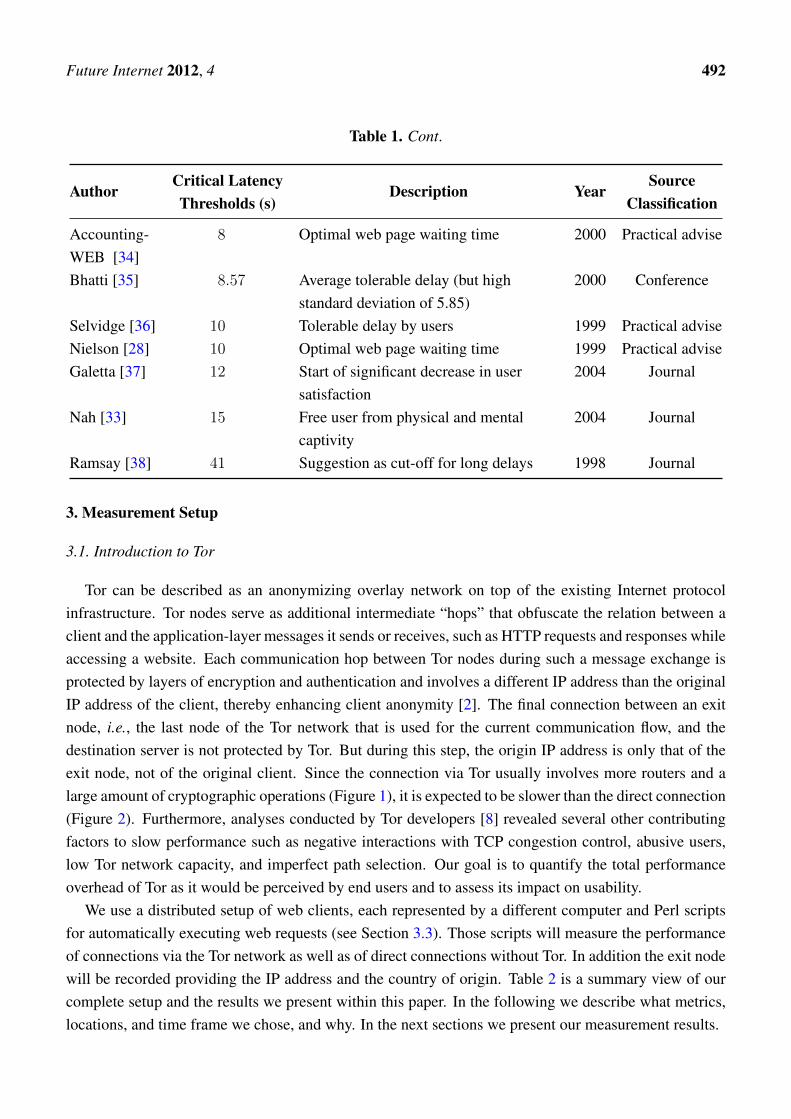
In the area of e-commerce research, there is a common understanding that waiting time impedesonline commerce [28–31], although the authors do not agree on a single, exact classification andthreshold for latency acceptance. Table 1 summarizes the existing literature about critical latencythresholds for Internet users, showing the different classifications.
Table 1. Classification of Critical Latency Thresholds.
AuthorCritical LatencyThresholds (s)
Description YearSource
Classification
Tolia [32] 1 Thin client response time—annoying 2006 JournalNah [33] 2 For simple information retrieval tasks 2004 JournalTolia [32] 2 Thin client response time—unacceptable 2006 JournalTolia [32] 5 Thin client response time—unusable 2006 Journal
Future Internet 2012, 4 492
Table 1. Cont.
AuthorCritical LatencyThresholds (s)
Description YearSource
Classification
Accounting-WEB [34]
8 Optimal web page waiting time 2000 Practical advise
Bhatti [35] 8.57 Average tolerable delay (but highstandard deviation of 5.85)
2000 Conference
Selvidge [36] 10 Tolerable delay by users 1999 Practical adviseNielson [28] 10 Optimal web page waiting time 1999 Practical adviseGaletta [37] 12 Start of significant decrease in user
satisfaction2004 Journal
Nah [33] 15 Free user from physical and mentalcaptivity
2004 Journal
Ramsay [38] 41 Suggestion as cut-off for long delays 1998 Journal
3. Measurement Setup
3.1. Introduction to Tor
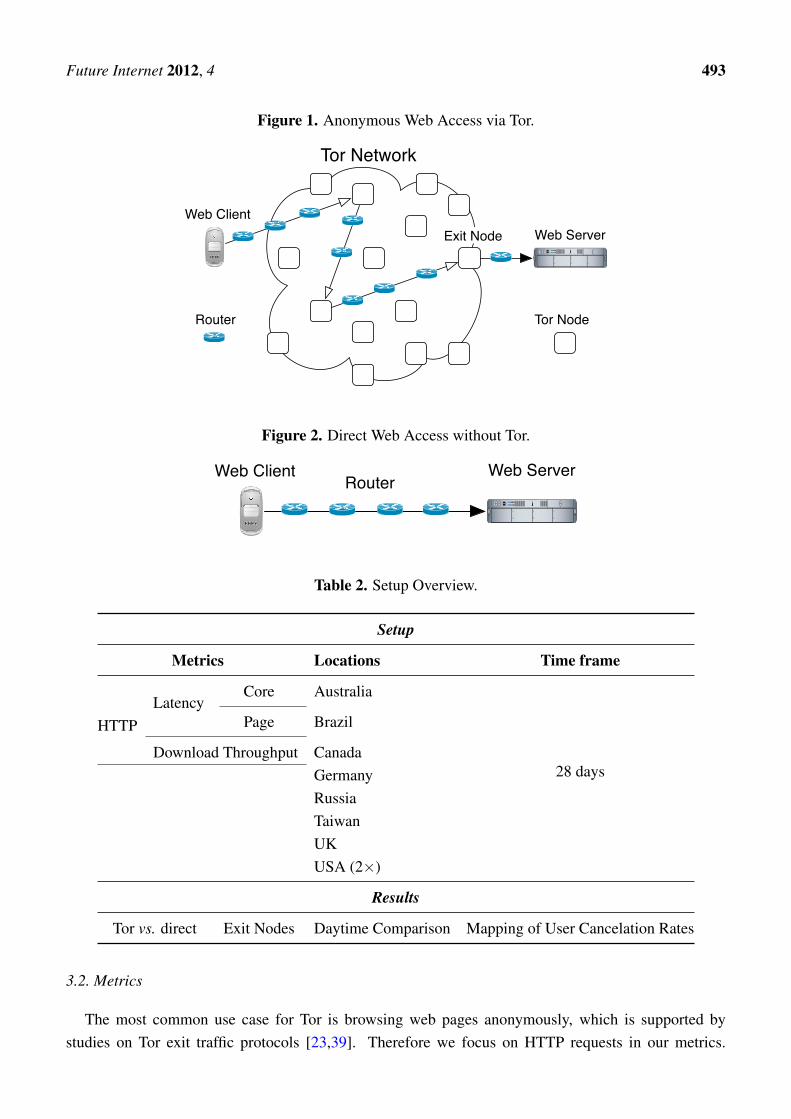
Tor can be described as an anonymizing overlay network on top of the existing Internet protocolinfrastructure. Tor nodes serve as additional intermediate “hops” that obfuscate the relation between aclient and the application-layer messages it sends or receives, such as HTTP requests and responses whileaccessing a website. Each communication hop between Tor nodes during such a message exchange isprotected by layers of encryption and authentication and involves a different IP address than the originalIP address of the client, thereby enhancing client anonymity [2]. The final connection between an exitnode, i.e., the last node of the Tor network that is used for the current communication flow, and thedestination server is not protected by Tor. But during this step, the origin IP address is only that of theexit node, not of the original client. Since the connection via Tor usually involves more routers and alarge amount of cryptographic operations (Figure 1), it is expected to be slower than the direct connection(Figure 2). Furthermore, analyses conducted by Tor developers [8] revealed several other contributingfactors to slow performance such as negative interactions with TCP congestion control, abusive users,low Tor network capacity, and imperfect path selection. Our goal is to quantify the total performanceoverhead of Tor as it would be perceived by end users and to assess its impact on usability.
We use a distributed setup of web clients, each represented by a different computer and Perl scriptsfor automatically executing web requests (see Section 3.3). Those scripts will measure the performanceof connections via the Tor network as well as of direct connections without Tor. In addition the exit nodewill be recorded providing the IP address and the country of origin. Table 2 is a summary view of ourcomplete setup and the results we present within this paper. In the following we describe what metrics,locations, and time frame we chose, and why. In the next sections we present our measurement results.
Future Internet 2012, 4 493
Figure 1. Anonymous Web Access via Tor.
Web ClientWeb Server
Tor Network
Exit Node
Router Tor Node
Figure 2. Direct Web Access without Tor.
Web Client Web Server
Router
Table 2. Setup Overview.
Setup
Metrics Locations Time frame
HTTPLatency
Core Australia
28 days
Page Brazil
Download Throughput CanadaGermanyRussiaTaiwanUKUSA (2×)
Results
Tor vs. direct Exit Nodes Daytime Comparison Mapping of User Cancelation Rates
3.2. Metrics
The most common use case for Tor is browsing web pages anonymously, which is supported bystudies on Tor exit traffic protocols [23,39]. Therefore we focus on HTTP requests in our metrics.
Future Internet 2012, 4 494
Moreover, in order to include bandwidth performance, we also measure throughput of upload anddownload requests. The throughput metric captures another important use case: transferring largeramounts of data from and to the web via the HTTP protocol.
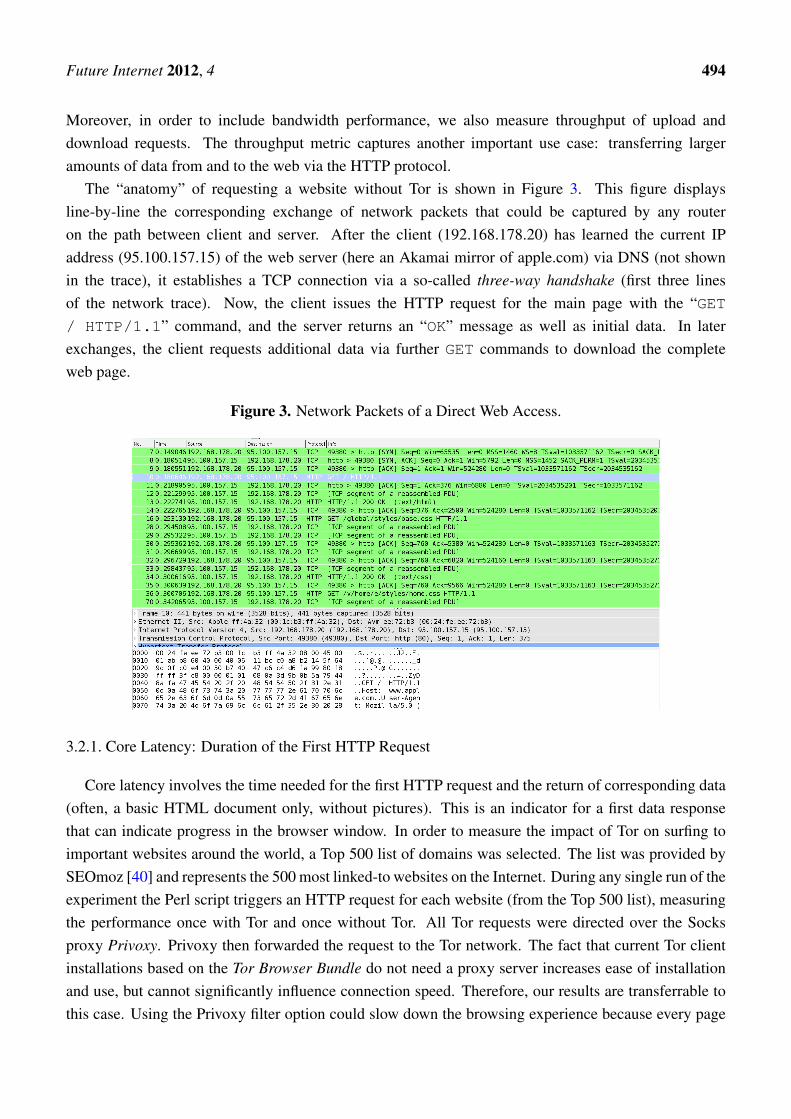
The “anatomy” of requesting a website without Tor is shown in Figure 3. This figure displaysline-by-line the corresponding exchange of network packets that could be captured by any routeron the path between client and server. After the client (192.168.178.20) has learned the current IPaddress (95.100.157.15) of the web server (here an Akamai mirror of apple.com) via DNS (not shownin the trace), it establishes a TCP connection via a so-called three-way handshake (first three linesof the network trace). Now, the client issues the HTTP request for the main page with the “GET/ HTTP/1.1” command, and the server returns an “OK” message as well as initial data. In laterexchanges, the client requests additional data via further GET commands to download the completeweb page.
Figure 3. Network Packets of a Direct Web Access.
3.2.1. Core Latency: Duration of the First HTTP Request
Core latency involves the time needed for the first HTTP request and the return of corresponding data(often, a basic HTML document only, without pictures). This is an indicator for a first data responsethat can indicate progress in the browser window. In order to measure the impact of Tor on surfing toimportant websites around the world, a Top 500 list of domains was selected. The list was provided bySEOmoz [40] and represents the 500 most linked-to websites on the Internet. During any single run of theexperiment the Perl script triggers an HTTP request for each website (from the Top 500 list), measuringthe performance once with Tor and once without Tor. All Tor requests were directed over the Socksproxy Privoxy. Privoxy then forwarded the request to the Tor network. The fact that current Tor clientinstallations based on the Tor Browser Bundle do not need a proxy server increases ease of installationand use, but cannot significantly influence connection speed. Therefore, our results are transferrable tothis case. Using the Privoxy filter option could slow down the browsing experience because every page
Future Internet 2012, 4 495
is first completely downloaded by Privoxy and than forwarded. However, we did not activate Privoxyfilters during our experiments, therefore pages were directly and continuously transferred.
Tor clients were running as daemons on our nodes over the whole time of the experiment. Theremight be some influence on certain measurements (temporarily increased latency) in the moment whenTor builds new circuits. Nevertheless, this reflects best the browsing experience since also in normalweb browsing the user will be confronted with Tor building new circuits. Static data like images, videosor Javascript files were excluded from the experiment. For each request, date, time, request durationand received bytes were logged. This script was built in order to run until it has made a request to all500 web sites.
3.2.2. Page Latency: Duration of a Complete Web Page Download
Page latency is an estimated measure for the download time of the complete web page (includingpictures, scripts, external content etc.), an indicator for whole web page presentation in the browserwindow. There are many uncontrollable factors that have an influence on page latency, including currentdynamic content, script execution, externally hosted content (mash-up), server reaction time, and thekind and version of web browser used.
In order to provide a reproducible and browser independent estimate for extrapolating page latencyfrom core latency, we utilized the GNU Wget tool for downloading multiple complete web pages ofthe Top 500 lists via the command line. Our comparison is based on the wget and wget -p commands,where wget -p serves as an estimator for retrieving entire web pages including inline images, sounds,and referenced stylesheets.
We calculated an extrapolation factor F = (n∑
i=1lpi)/(
n∑i=1
li), where n is the number of web pages (here
500), lp the latency with wget -p, and l the latency with wget. Both latencies were measured 5 times inorder to flatten one-time effects. Our results indicate an extrapolation factor F of 2.4, which means thaton the average the following approximation holds: Page Latency ≈ 2.4∗ Core Latency. Parallel controlexperiments using the Yslow plugin for Firefox indicated that this approach provides a good estimationin the average case for our set of websites. However, current web browser download web pages viaparallel connections which should speed up the download of a complete web page.
To take this into account, we repeated our calculation of the extrapolation factor with the Parallel URLfetcher (puf ) which is comparable in usage and functionality to wget and is able to retrieve web pageswith parallel connections. The results show that with puf -p the extrapolation factor is in average 20%lower due to the use of parallel connections. Although parallel connections simulate a more realisticbrowsing experience because all common web browsers support them, we also have to take into accountthis could underestimate the loading of a complete web page. The reason for this is the inability of bothwget -p and puf -p to retrieve all page-requisites a browser would need, since for example they will notgather any content requested via Javascript. Therefore, we have a reason why wget -p would overestimatethe extrapolation factor (no use of parallel connections), but also why it would underestimate this factor(content not retrieved). For the purpose of this paper and backed by initial tests, we suppose that theseinaccurate estimations on the average balance each other, and therefore adhere to the extrapolation factorcalculated by using wget -p.
Future Internet 2012, 4 496
3.2.3. Download Throughput via HTTP
For download throughput, we compare the transfer time with and without Tor while downloading50 KB and 1 MB of data via HTTP. Pre-tests showed that 50 KB and 1 MB are sufficientin order to have a good throughput indicator. Furthermore, these are also steps chosen by theTor metrics project [21]. By choice, the target URL for this part of the experiment was fixedthroughout the experiment, since download of arbitrary files from multiple sites could lead to practicalproblems and could cause random errors. The downloaded file was located on Google’s servers(http://dl.google.com/picasa/picasa3-setup.exe). Since this file is larger then required, the download wascanceled after 1 MB. In this paper, throughput is used in the sense of effective “goodput”, referringto application-layer throughput and not the actually larger amount of bytes sent via the network.Transmission overhead such as a TCP header is not being considered according to the definition ofgoodput [41]. The Perl script was executed twice an hour in order to measure the traffic beingdownloaded. This was once done directly and once using Tor via the Socks proxy Privoxy.
3.3. Experimental Setup on PlanetLab
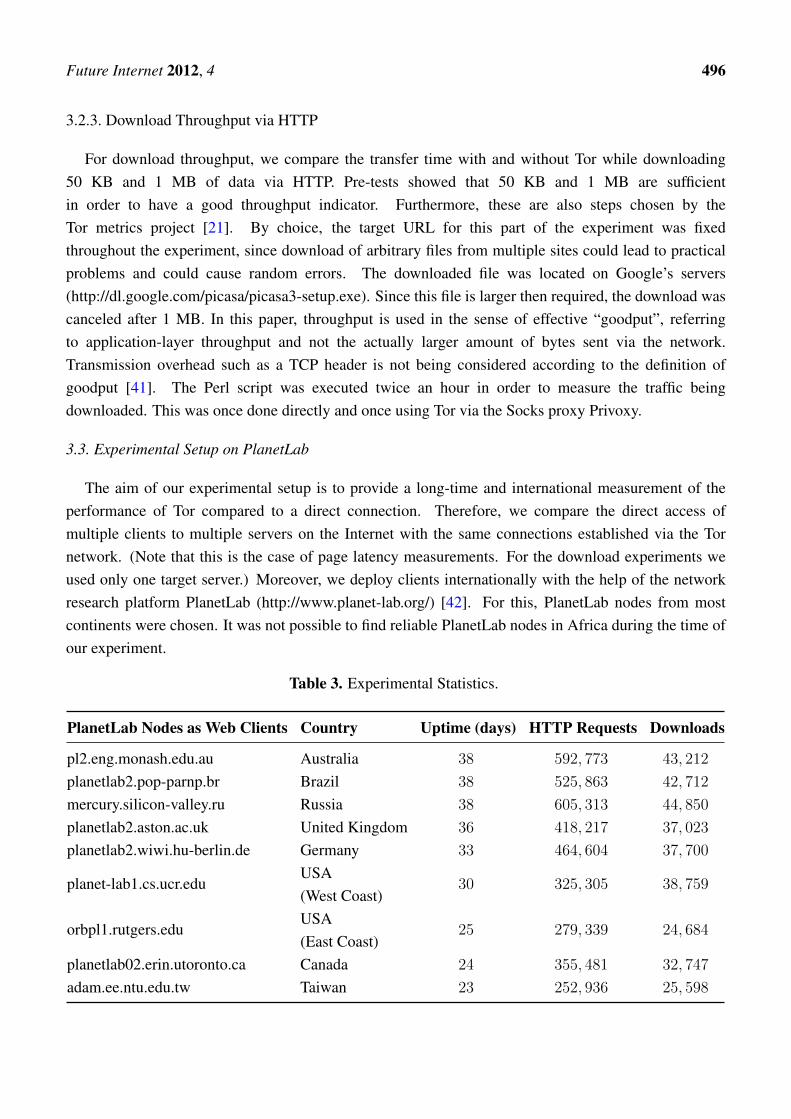
The aim of our experimental setup is to provide a long-time and international measurement of theperformance of Tor compared to a direct connection. Therefore, we compare the direct access ofmultiple clients to multiple servers on the Internet with the same connections established via the Tornetwork. (Note that this is the case of page latency measurements. For the download experiments weused only one target server.) Moreover, we deploy clients internationally with the help of the networkresearch platform PlanetLab (http://www.planet-lab.org/) [42]. For this, PlanetLab nodes from mostcontinents were chosen. It was not possible to find reliable PlanetLab nodes in Africa during the time ofour experiment.
Table 3. Experimental Statistics.
PlanetLab Nodes as Web Clients Country Uptime (days) HTTP Requests Downloads
pl2.eng.monash.edu.au Australia 38 592, 773 43, 212
planetlab2.pop-parnp.br Brazil 38 525, 863 42, 712
mercury.silicon-valley.ru Russia 38 605, 313 44, 850
planetlab2.aston.ac.uk United Kingdom 36 418, 217 37, 023
planetlab2.wiwi.hu-berlin.de Germany 33 464, 604 37, 700
planet-lab1.cs.ucr.eduUSA(West Coast)
30 325, 305 38, 759
orbpl1.rutgers.eduUSA(East Coast)
25 279, 339 24, 684
planetlab02.erin.utoronto.ca Canada 24 355, 481 32, 747
adam.ee.ntu.edu.tw Taiwan 23 252, 936 25, 598
Future Internet 2012, 4 497
Each PlanetLab node provides its users with a minimal Fedora Core 8 Linux installation [10]. Forour experiments, additional software needed to be installed. On all PlanetLab nodes we used Tor inversion 0.2.0.32, Privoxy in version 3.0.6, Perl in version 5.8.8, Perl-CPAN in version 1.76 02, andLWP::UserAgent in version v5.835.
Table 3 shows the PlanetLab nodes that were selected for the experiment and experimental statistics.All nodes were capable of executing the Perl scripts for our experiments. Some other nodes we initiallyselected had to be excluded from the experiment. For example, our supposition why a PlanetLab node inChina was not able to connect to the Tor network via public relays is that since September 2009 Chineseauthorities started to block the Tor network in China [43,44].
3.4. Time Frame
In order to gain representative data from the tests, a time span of 28 days was chosen, starting on the20th of December 2010. For the purpose of a direct comparison we had to leave out days when not allof the nodes were running. Observing such a long period, however, will prevent a biasing of the resultscaused by random load effects of PlanetLab nodes and their network connections. Initially, nodes startedthe HTTP script twice and the throughput scripts four times within an hour. Because some of the nodesprovided only a very slow connection and the scripts would not finish before the next was started, thisfrequency was reduced. The HTTP script was then started once and the throughput scripts twice duringan hour. But even with this change in the setup, scripts were sometimes started a second time before thelast script was finished, but this did not impair the quality of the measurements.
4. Measurement Results
Each of the following subsections will describe the results of one of our metrics (http, download).Furthermore, we will present results concerning specific nodes and a comparison between different timesof the day.
4.1. HTTP Requests
In this section the speed of usual web browsing between Tor and a direct connection is compared.The speed and duration were measured by executing an HTTP request. Table 3 provides an overview ofall PlanetLab nodes, their uptime, and number of successful requests.
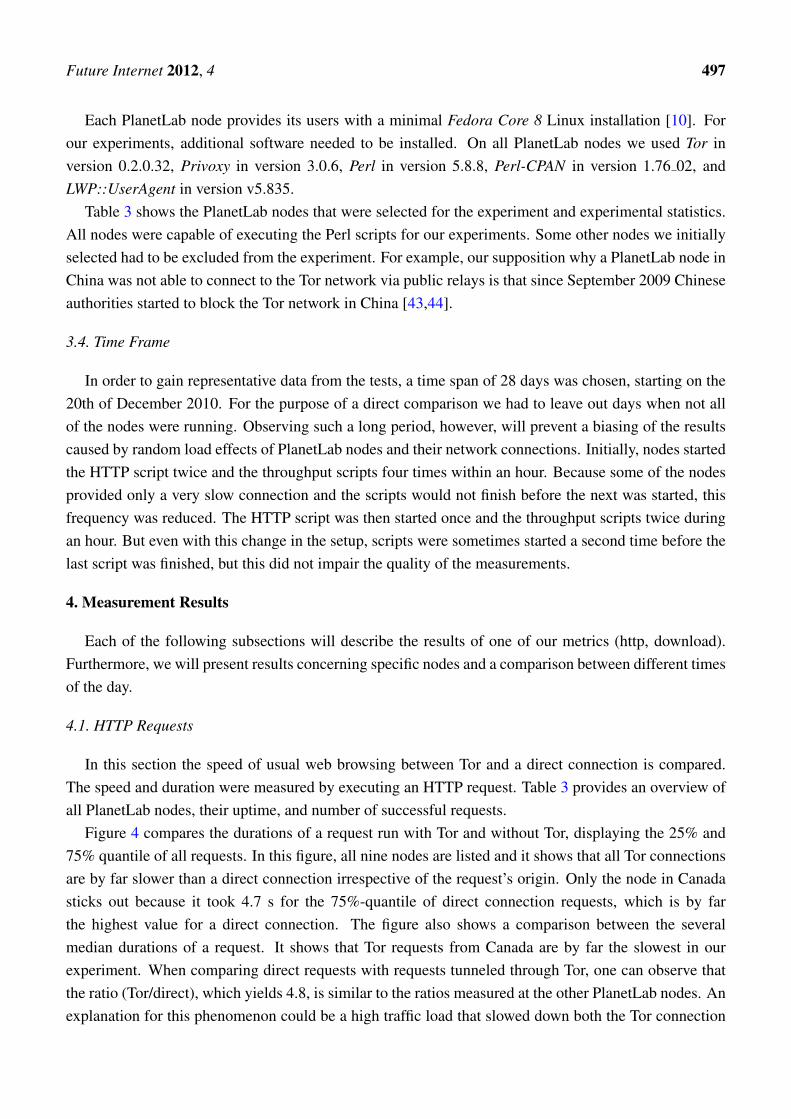
Figure 4 compares the durations of a request run with Tor and without Tor, displaying the 25% and75% quantile of all requests. In this figure, all nine nodes are listed and it shows that all Tor connectionsare by far slower than a direct connection irrespective of the request’s origin. Only the node in Canadasticks out because it took 4.7 s for the 75%-quantile of direct connection requests, which is by farthe highest value for a direct connection. The figure also shows a comparison between the severalmedian durations of a request. It shows that Tor requests from Canada are by far the slowest in ourexperiment. When comparing direct requests with requests tunneled through Tor, one can observe thatthe ratio (Tor/direct), which yields 4.8, is similar to the ratios measured at the other PlanetLab nodes. Anexplanation for this phenomenon could be a high traffic load that slowed down both the Tor connection
Future Internet 2012, 4 498
and the direct connection. The average ratio of HTTP request durations (Tor/direct) of all nine PlanetLabnodes is 4.1.
Figure 4. Averages of Core Latency for HTTP Requests.
0
5
10
15
20
25
30
35
40
taiw
an -
dir
ect
taiw
an -
tor
russ
ia -
dir
ect
russ
ia -
tor
usa
rutg
ers
- dir
ect
usa
rutg
ers
- to
rau
stra
lia
- dir
ect
aust
rali
a -
tor
usa
ucr
- d
irec
tusa
ucr
- t
or
canad
a -
dir
ect
canad
a -
tor
uk -
dir
ect
uk -
tor
bra
zil
- dir
ect
bra
zil
- to
rger
man
y -
dir
ect
ger
man
y -
tor
Tim
e in
Sec
onds
Another observation is that the four nodes located in Germany, UK, and USA always have thefastest Tor connection compared to the other nodes—only these four nodes have the 75%-quantile below8.7 s, and all other nodes are at least above 11 s up to 25.9 s. When regarding the median time of arequest through the Tor network, the nodes located in Taiwan and Australia are almost as fast as theaforementioned four. Only the PlanetLab nodes in Brazil, Russia and Canada were significantly slowerin terms of average, median and quantiles. The fact that connections from Germany, UK and USA arethe fastest could probably be related to the fact that more than 50% of all Tor nodes are located in thesecountries [45]. One reason supporting this supposition might be a smaller geographical distance for thefirst entry point. Other studies showed that distance influences latency [24,46].
4.2. Download Requests
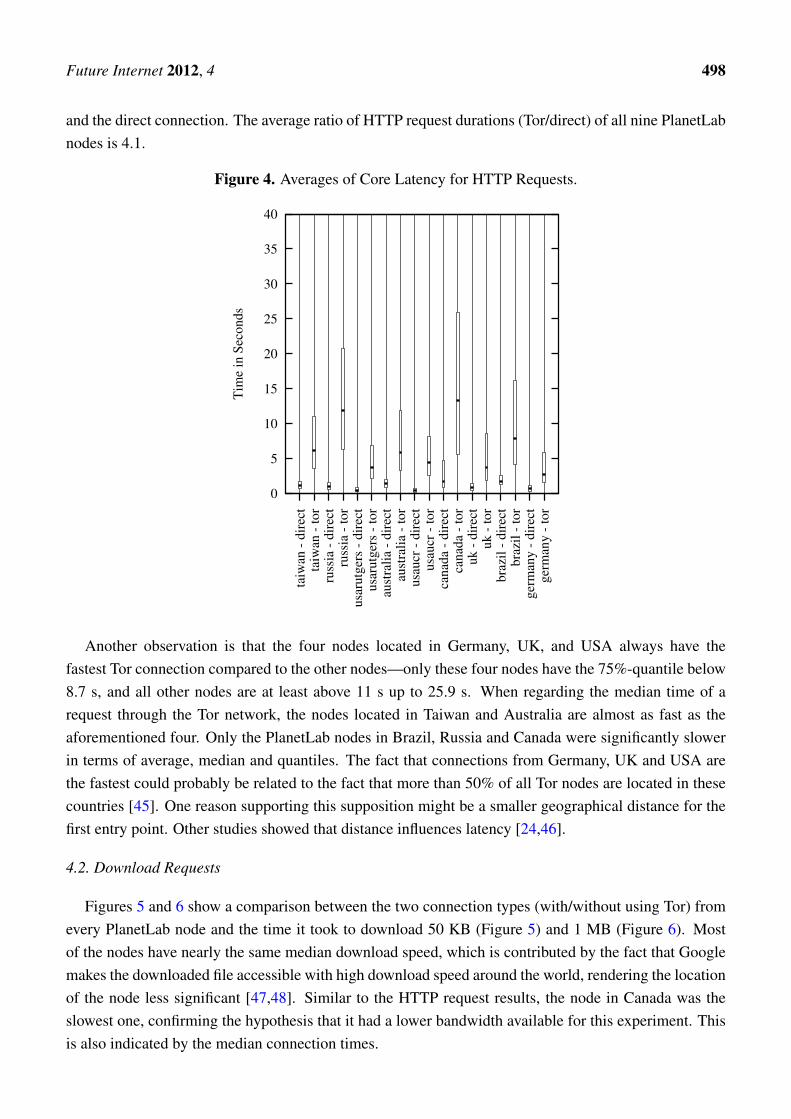
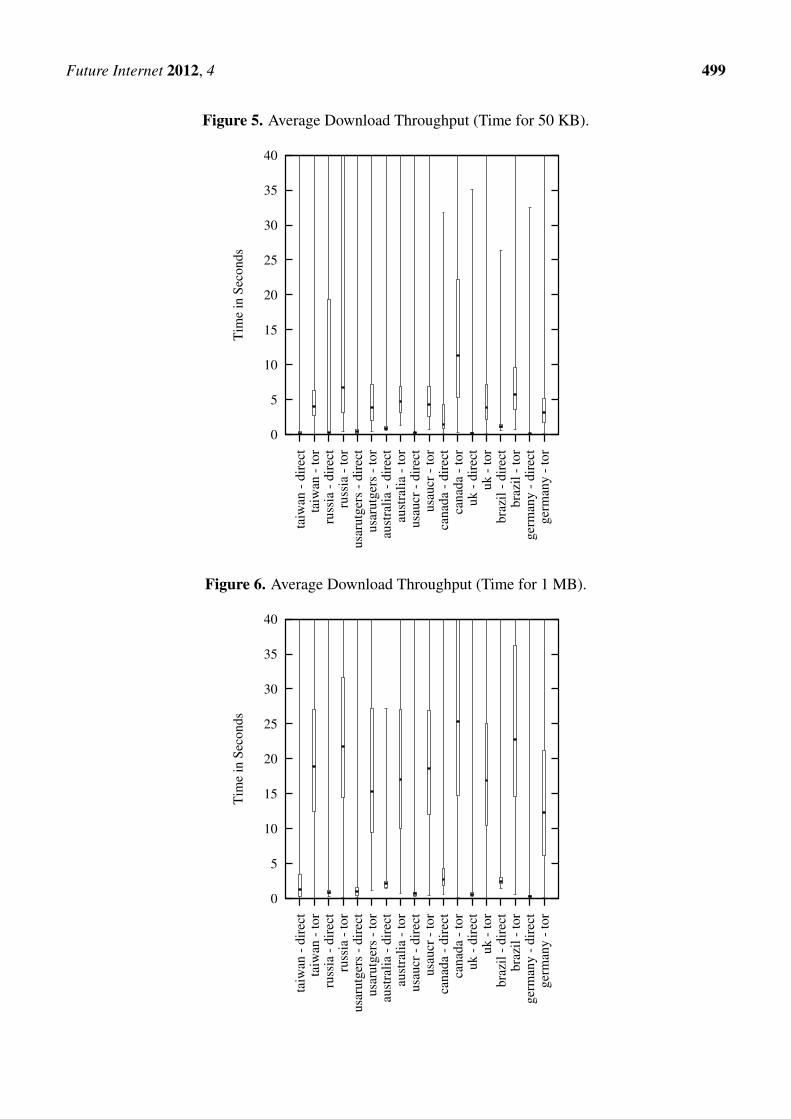
Figures 5 and 6 show a comparison between the two connection types (with/without using Tor) fromevery PlanetLab node and the time it took to download 50 KB (Figure 5) and 1 MB (Figure 6). Mostof the nodes have nearly the same median download speed, which is contributed by the fact that Googlemakes the downloaded file accessible with high download speed around the world, rendering the locationof the node less significant [47,48]. Similar to the HTTP request results, the node in Canada was theslowest one, confirming the hypothesis that it had a lower bandwidth available for this experiment. Thisis also indicated by the median connection times.
Future Internet 2012, 4 499
Figure 5. Average Download Throughput (Time for 50 KB).
0
5
10
15
20
25
30
35
40
taiw
an -
dir
ect
taiw
an -
tor
russ
ia -
dir
ect
russ
ia -
tor
usa
rutg
ers
- dir
ect
usa
rutg
ers
- to
rau
stra
lia
- dir
ect
aust
rali
a -
tor
usa
ucr
- d
irec
tusa
ucr
- t
or
canad
a -
dir
ect
canad
a -
tor
uk -
dir
ect
uk -
tor
bra
zil
- dir
ect
bra
zil
- to
rger
man
y -
dir
ect
ger
man
y -
tor
Tim
e in
Sec
onds
Figure 6. Average Download Throughput (Time for 1 MB).
0
5
10
15
20
25
30
35
40
taiw
an -
dir
ect
taiw
an -
tor
russ
ia -
dir
ect
russ
ia -
tor
usa
rutg
ers
- dir
ect
usa
rutg
ers
- to
rau
stra
lia
- dir
ect
aust
rali
a -
tor
usa
ucr
- d
irec
tusa
ucr
- t
or
canad
a -
dir
ect
canad
a -
tor
uk -
dir
ect
uk -
tor
bra
zil
- dir
ect
bra
zil
- to
rger
man
y -
dir
ect
ger
man
y -
tor
Tim
e in
Sec
onds
Future Internet 2012, 4 500
Download measurements (from different web servers) are also conducted by the Tor metricsproject [21]. During the timeframe of our experiments, the median value for downloading of 50 KBwas reported as between 3 and 4 s, and for downloading of 1 MB between 9 and 15 s. Our results ofdownloading 50 KB were between 3 and 11 s (median), and for the download of 1 MB between 12 and26 s (median). We see them as comparable. The difference is that the Tor metrics results were measuredon the same nodes and differ in time, whereas our results differ in nodes and are averaged over time,probably causing a higher variation.
4.3. Exit Nodes
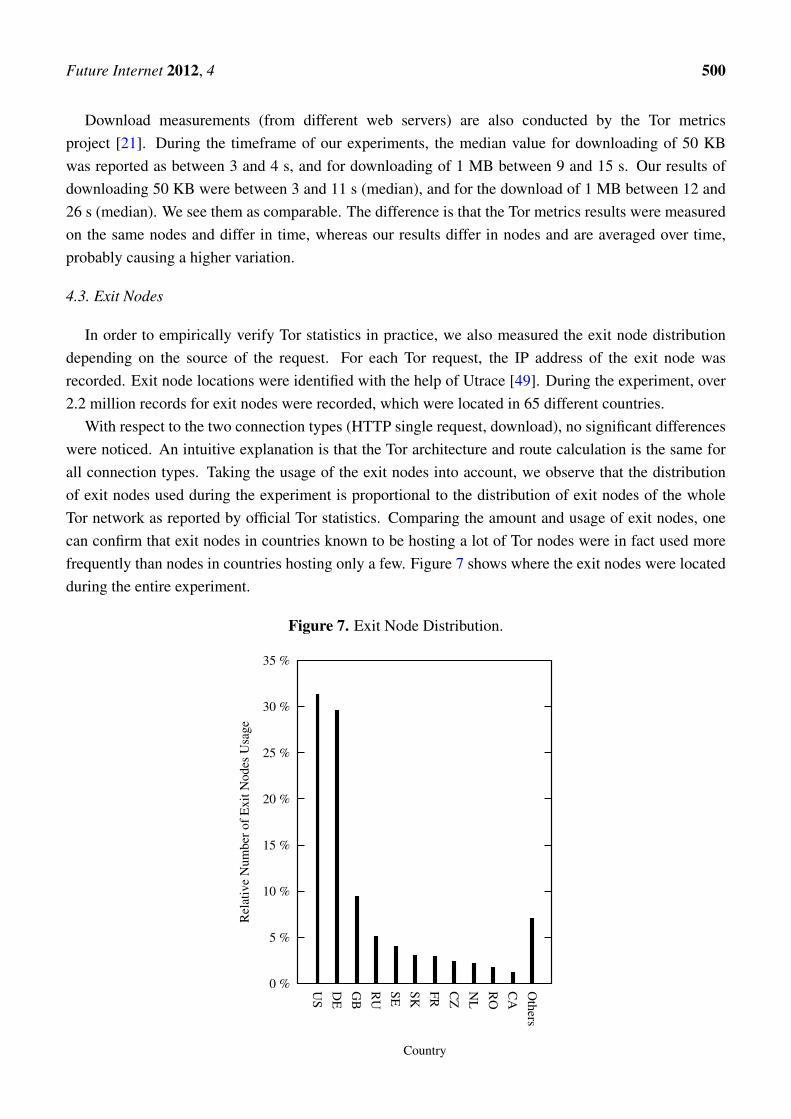
In order to empirically verify Tor statistics in practice, we also measured the exit node distributiondepending on the source of the request. For each Tor request, the IP address of the exit node wasrecorded. Exit node locations were identified with the help of Utrace [49]. During the experiment, over2.2 million records for exit nodes were recorded, which were located in 65 different countries.
With respect to the two connection types (HTTP single request, download), no significant differenceswere noticed. An intuitive explanation is that the Tor architecture and route calculation is the same forall connection types. Taking the usage of the exit nodes into account, we observe that the distributionof exit nodes used during the experiment is proportional to the distribution of exit nodes of the wholeTor network as reported by official Tor statistics. Comparing the amount and usage of exit nodes, onecan confirm that exit nodes in countries known to be hosting a lot of Tor nodes were in fact used morefrequently than nodes in countries hosting only a few. Figure 7 shows where the exit nodes were locatedduring the entire experiment.
Figure 7. Exit Node Distribution.
0 %
5 %
10 %
15 %
20 %
25 %
30 %
35 %
US
DE
GB
RU
SE
SK
FR
CZ
NL
RO
CA
Oth
ers
Rel
ativ
e N
um
ber
of
Exit
Nodes
Usa
ge
Country
Future Internet 2012, 4 501
4.4. Daytime View
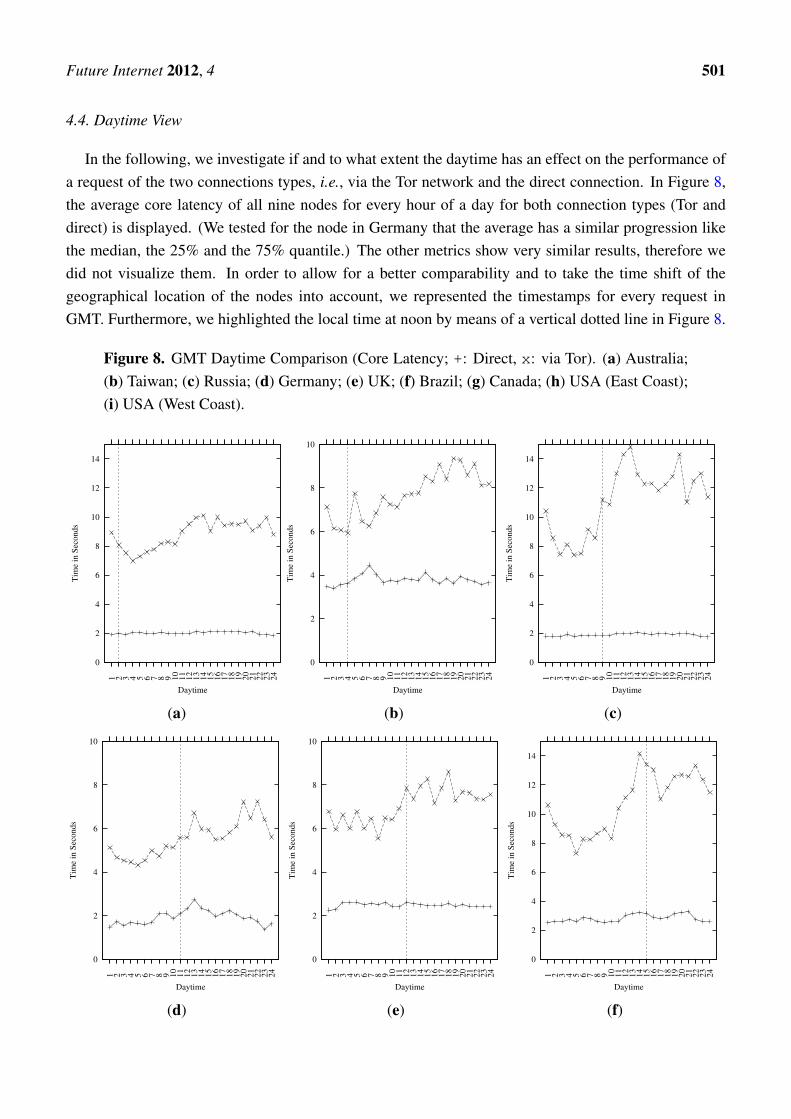
In the following, we investigate if and to what extent the daytime has an effect on the performance ofa request of the two connections types, i.e., via the Tor network and the direct connection. In Figure 8,the average core latency of all nine nodes for every hour of a day for both connection types (Tor anddirect) is displayed. (We tested for the node in Germany that the average has a similar progression likethe median, the 25% and the 75% quantile.) The other metrics show very similar results, therefore wedid not visualize them. In order to allow for a better comparability and to take the time shift of thegeographical location of the nodes into account, we represented the timestamps for every request inGMT. Furthermore, we highlighted the local time at noon by means of a vertical dotted line in Figure 8.
Figure 8. GMT Daytime Comparison (Core Latency; +: Direct, x: via Tor). (a) Australia;(b) Taiwan; (c) Russia; (d) Germany; (e) UK; (f) Brazil; (g) Canada; (h) USA (East Coast);(i) USA (West Coast).
0
2
4
6
8
10
12
14
1 2 3 4 5 6 7 8 9 10
11
12
13
14
15
16
17
18
19
20
21
22
23
24
Tim
e in
Sec
onds
Daytime
(a)
0
2
4
6
8
10
1 2 3 4 5 6 7 8 9 10
11
12
13
14
15
16
17
18
19
20
21
22
23
24
Tim
e in
Sec
onds
Daytime
(b)
0
2
4
6
8
10
12
14
1 2 3 4 5 6 7 8 9 10
11
12
13
14
15
16
17
18
19
20
21
22
23
24
Tim
e in
Sec
onds
Daytime
(c)
0
2
4
6
8
10
1 2 3 4 5 6 7 8 9 10
11
12
13
14
15
16
17
18
19
20
21
22
23
24
Tim
e in
Sec
onds
Daytime
(d)
0
2
4
6
8
10
1 2 3 4 5 6 7 8 9 10
11
12
13
14
15
16
17
18
19
20
21
22
23
24
Tim
e in
Sec
onds
Daytime
(e)
0
2
4
6
8
10
12
14
1 2 3 4 5 6 7 8 9 10
11
12
13
14
15
16
17
18
19
20
21
22
23
24
Tim
e in
Sec
onds
Daytime
(f)
Future Internet 2012, 4 502
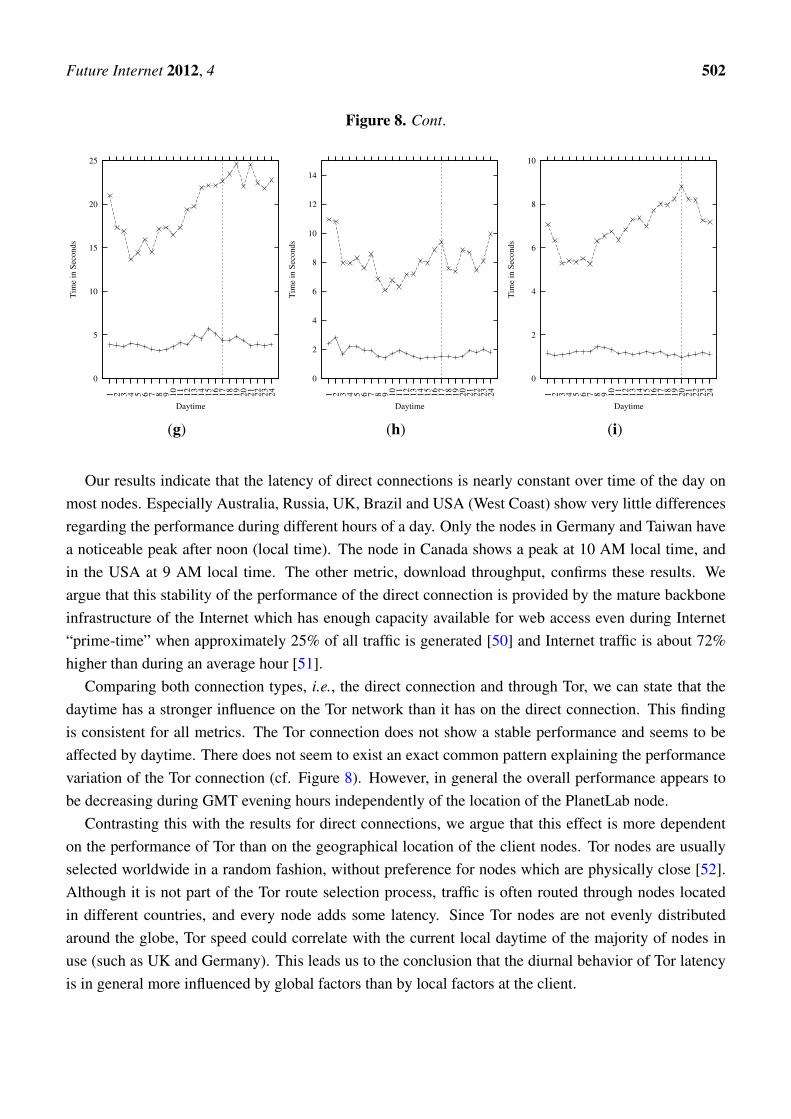
Figure 8. Cont.
0
5
10
15
20
25
1 2 3 4 5 6 7 8 9 10
11
12
13
14
15
16
17
18
19
20
21
22
23
24
Tim
e in
Sec
onds
Daytime
(g)
0
2
4
6
8
10
12
14
1 2 3 4 5 6 7 8 9 10
11
12
13
14
15
16
17
18
19
20
21
22
23
24
Tim
e in
Sec
onds
Daytime
(h)
0
2
4
6
8
10
1 2 3 4 5 6 7 8 9 10
11
12
13
14
15
16
17
18
19
20
21
22
23
24
Tim
e in
Sec
onds
Daytime
(i)
Our results indicate that the latency of direct connections is nearly constant over time of the day onmost nodes. Especially Australia, Russia, UK, Brazil and USA (West Coast) show very little differencesregarding the performance during different hours of a day. Only the nodes in Germany and Taiwan havea noticeable peak after noon (local time). The node in Canada shows a peak at 10 AM local time, andin the USA at 9 AM local time. The other metric, download throughput, confirms these results. Weargue that this stability of the performance of the direct connection is provided by the mature backboneinfrastructure of the Internet which has enough capacity available for web access even during Internet“prime-time” when approximately 25% of all traffic is generated [50] and Internet traffic is about 72%higher than during an average hour [51].
Comparing both connection types, i.e., the direct connection and through Tor, we can state that thedaytime has a stronger influence on the Tor network than it has on the direct connection. This findingis consistent for all metrics. The Tor connection does not show a stable performance and seems to beaffected by daytime. There does not seem to exist an exact common pattern explaining the performancevariation of the Tor connection (cf. Figure 8). However, in general the overall performance appears tobe decreasing during GMT evening hours independently of the location of the PlanetLab node.
Contrasting this with the results for direct connections, we argue that this effect is more dependenton the performance of Tor than on the geographical location of the client nodes. Tor nodes are usuallyselected worldwide in a random fashion, without preference for nodes which are physically close [52].Although it is not part of the Tor route selection process, traffic is often routed through nodes locatedin different countries, and every node adds some latency. Since Tor nodes are not evenly distributedaround the globe, Tor speed could correlate with the current local daytime of the majority of nodes inuse (such as UK and Germany). This leads us to the conclusion that the diurnal behavior of Tor latencyis in general more influenced by global factors than by local factors at the client.
Future Internet 2012, 4 503
5. Interpretation of Results with Respect to Usability
In this section, we focus on the combination of our technical measurements with studies of userbehaviour while browsing the web. The aim is to reason about the influence of the latency that wemeasured on user acceptance. We already introduced critical latency values gained from experimentalresearch (cf. Section 2). According to this related work, in particular in Table 1, we assume that usertolerance of waiting for web-page requests decreases after 2 s; it falls sharply within the interval between7 s and 15 s, and ends with 50 s when the user stops waiting. In our opinion, the related researchconducted by Nah et al. [33] is best suited for our experiment due to its empirical grounding and mostrecent data in comparison to the other studies. However, we extend these experimentally measured labresults [33] with results stated by users from our own survey [27].
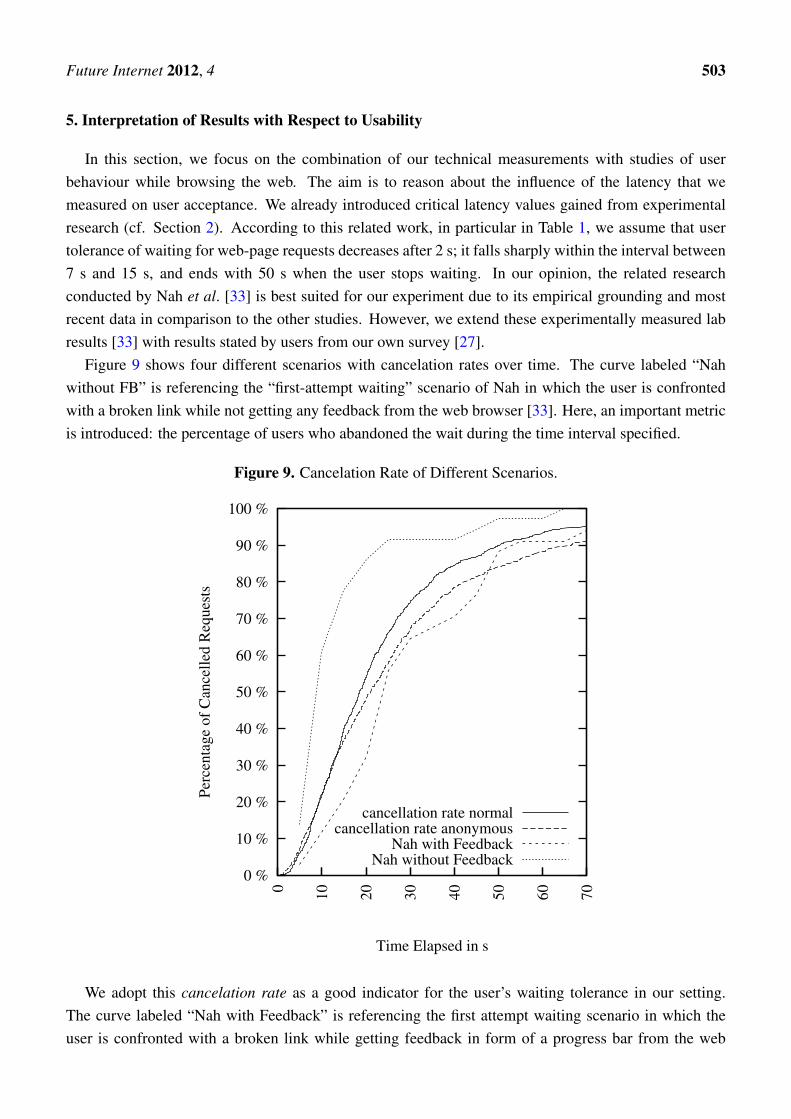
Figure 9 shows four different scenarios with cancelation rates over time. The curve labeled “Nahwithout FB” is referencing the “first-attempt waiting” scenario of Nah in which the user is confrontedwith a broken link while not getting any feedback from the web browser [33]. Here, an important metricis introduced: the percentage of users who abandoned the wait during the time interval specified.
Figure 9. Cancelation Rate of Different Scenarios.
0 %
10 %
20 %
30 %
40 %
50 %
60 %
70 %
80 %
90 %
100 %
0
10
20
30
40
50
60
70
Per
centa
ge
of
Can
cell
ed R
eques
ts
Time Elapsed in s
cancellation rate normalcancellation rate anonymous
Nah with FeedbackNah without Feedback
We adopt this cancelation rate as a good indicator for the user’s waiting tolerance in our setting.The curve labeled “Nah with Feedback” is referencing the first attempt waiting scenario in which theuser is confronted with a broken link while getting feedback in form of a progress bar from the web
Future Internet 2012, 4 504
browser [33]. The other two scenarios are derived from our own survey and show stated tolerated waitingtimes for normal and anonymous web browsing. Those two cancelation rate curves indicate that peoplesurfing anonymously have a higher tolerance in terms of latency. Nevertheless, the gap between thecurves is small: The correlation is 0.989, the medians are 18.556 and 21.096 s, respectively. Thereare 948 data points. The maximum difference D between the cumulative distributions according tothe Kolmogorov–Smirnov comparison is: 0.0854, with a corresponding p-value of: 0.002 (statisticallysignificant at 0.5% level). Furthermore, we note that our survey results also confirmed the results ofNah’s lab experiments.
In order to reason about expected cancelation rates for browsing the web via Tor, we map our technicallatency results to corresponding user cancelation rates. On the technical side, we apply our core and pagelatency measurements for both direct connections and connections over Tor. Page latency, estimated bythe applying the measured factor 2.4 to core latency, increases the median of core latency for HTTPrequests via Tor from 13.36 s to 32.06 s. The median of HTTP requests without Tor increases from1.72 s to 4.13 s.
¿From a usability perspective, we are provided with stated as well as experimentally measured usercancelation rates. As stated cancelation rates, we have statements for direct connection and anonymizedconnection. Experimental cancelation rates can be divided in those with and without feedback. Outof the 4 × 4 possible combinations, Table 4 shows the meaningful mappings. The results from the labexperiment with feedback can be mapped to page latency because the user is given feedback duringloading of the page (the page builds up stepwise). The lab experiment without feedback should bemapped to core latency because the user gets no detailed visual progress feedback until first datais retrieved.
Table 4. Comparing Cancelation Rates from User Studies to our Latency Measurements.
Type of Cancelation RateDirect, Core
LatencyTor, CoreLatency
Direct, PageLatency
Tor, PageLatency
Lab with Feedback – – X XLab without Feedback X X – –Stated Direct X – X –Stated Anonymous – X – X
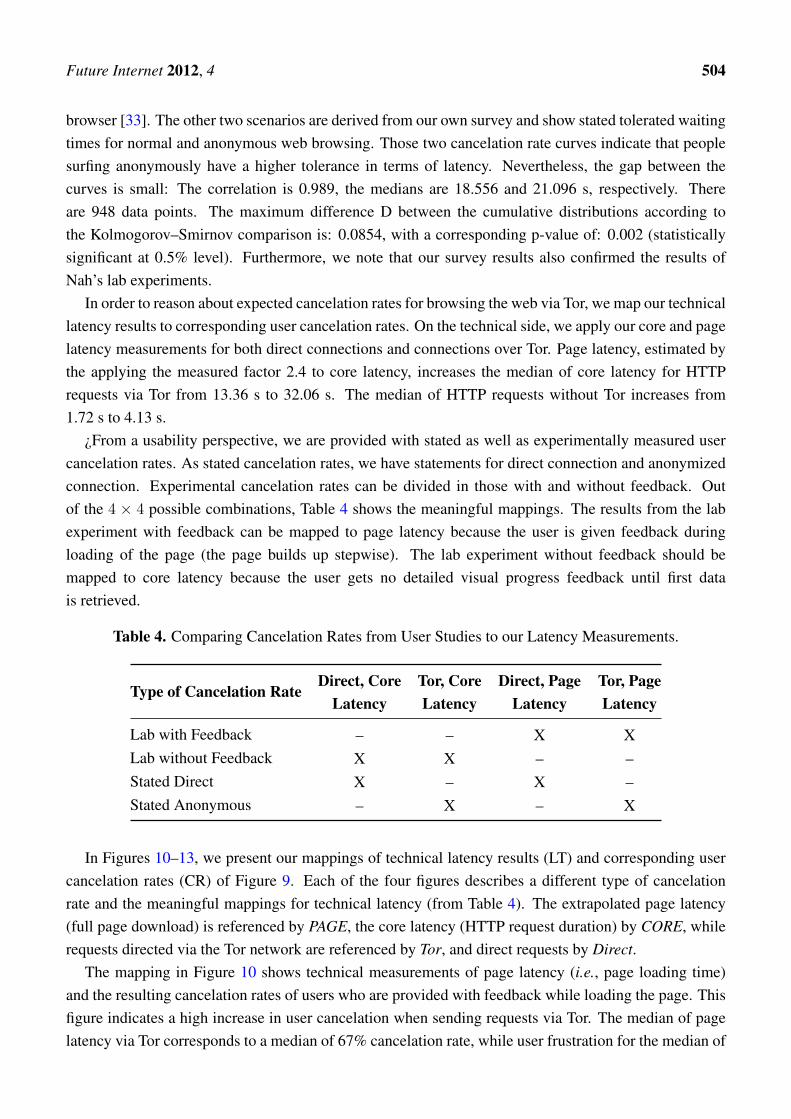
In Figures 10–13, we present our mappings of technical latency results (LT) and corresponding usercancelation rates (CR) of Figure 9. Each of the four figures describes a different type of cancelationrate and the meaningful mappings for technical latency (from Table 4). The extrapolated page latency(full page download) is referenced by PAGE, the core latency (HTTP request duration) by CORE, whilerequests directed via the Tor network are referenced by Tor, and direct requests by Direct.
The mapping in Figure 10 shows technical measurements of page latency (i.e., page loading time)and the resulting cancelation rates of users who are provided with feedback while loading the page. Thisfigure indicates a high increase in user cancelation when sending requests via Tor. The median of pagelatency via Tor corresponds to a median of 67% cancelation rate, while user frustration for the median of
Future Internet 2012, 4 505
direct page latency maps to only 2% cancelation. This gap between cancelation rates indicates a criticaljump in expected user cancelation when using the Tor network, which we aim to investigate further byour own set of user studies in future work.
Moreover, the user cancelation rate follows a saturation curve. Therefore, early user loss (in termsof cancelation rates) caused by latency is massive. Lowering the page latency via Tor by 7 s woulddecrease the user cancelation rate by 12%. A reduction of Tor-based page latency by 12 s would reducethe cancelation rate by 33%. Hence, an only minimal optimization of the Tor network latency will notgain a substantial effect. Only if the optimization is massive, a real improvement would be made.
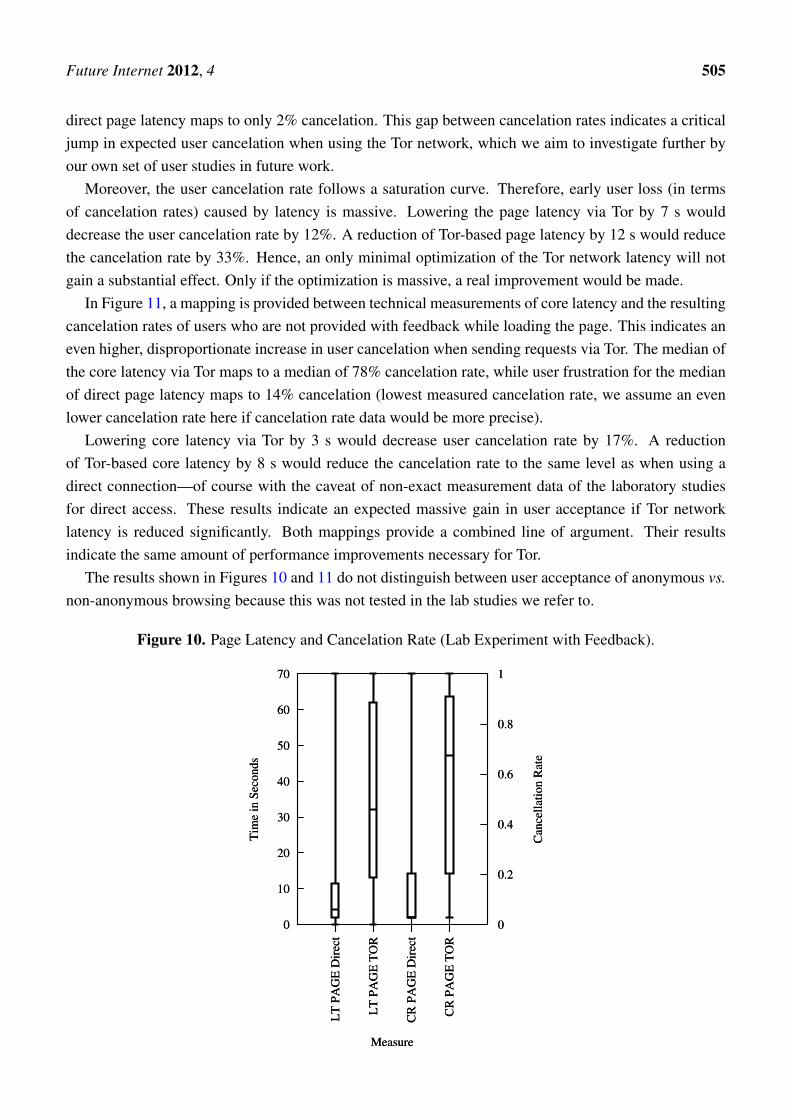
In Figure 11, a mapping is provided between technical measurements of core latency and the resultingcancelation rates of users who are not provided with feedback while loading the page. This indicates aneven higher, disproportionate increase in user cancelation when sending requests via Tor. The median ofthe core latency via Tor maps to a median of 78% cancelation rate, while user frustration for the medianof direct page latency maps to 14% cancelation (lowest measured cancelation rate, we assume an evenlower cancelation rate here if cancelation rate data would be more precise).
Lowering core latency via Tor by 3 s would decrease user cancelation rate by 17%. A reductionof Tor-based core latency by 8 s would reduce the cancelation rate to the same level as when using adirect connection—of course with the caveat of non-exact measurement data of the laboratory studiesfor direct access. These results indicate an expected massive gain in user acceptance if Tor networklatency is reduced significantly. Both mappings provide a combined line of argument. Their resultsindicate the same amount of performance improvements necessary for Tor.
The results shown in Figures 10 and 11 do not distinguish between user acceptance of anonymous vs.non-anonymous browsing because this was not tested in the lab studies we refer to.
Figure 10. Page Latency and Cancelation Rate (Lab Experiment with Feedback).
0
10
20
30
40
50
60
70
LT
PA
GE
Dir
ect
LT
PA
GE
TO
R
CR
PA
GE
Dir
ect
CR
PA
GE
TO
R
0
0.2
0.4
0.6
0.8
1
Tim
e i
n S
eco
nd
s
Can
cell
ati
on
Rate
Measure
0
10
20
30
40
50
60
70
LT
PA
GE
Dir
ect
LT
PA
GE
TO
R
CR
PA
GE
Dir
ect
CR
PA
GE
TO
R
0
0.2
0.4
0.6
0.8
1
Tim
e i
n S
eco
nd
s
Can
cell
ati
on
Rate
Measure
Future Internet 2012, 4 506
Figure 11. Core Latency and Cancelation Rate (Lab Experiment without Feedback).
0
10
20
30
40
50
60
70
LT
CO
RE
Dir
ect
LT
CO
RE
TO
R
CR
CO
RE
Dir
ect
CR
CO
RE
TO
R
0
0.2
0.4
0.6
0.8
1
Tim
e i
n S
eco
nd
s
Can
cell
ati
on
Rate
Measure
0
10
20
30
40
50
60
70
LT
CO
RE
Dir
ect
LT
CO
RE
TO
R
CR
CO
RE
Dir
ect
CR
CO
RE
TO
R
0
0.2
0.4
0.6
0.8
1
Tim
e i
n S
eco
nd
s
Can
cell
ati
on
Rate
Measure
Figure 12. Latency and Cancelation Rate for Normal Web Browsing (Survey Statements).
0
10
20
30
40
50
60
70
LT
CO
RE
Dir
ect
LT
PA
GE
Dir
ect
CR
CO
RE
No
rm
CR
PA
GE
No
rm
0
0.2
0.4
0.6
0.8
1
Tim
e i
n S
eco
nd
s
Can
cell
ati
on
Rate
Measure
0
10
20
30
40
50
60
70
LT
CO
RE
Dir
ect
LT
PA
GE
Dir
ect
CR
CO
RE
No
rm
CR
PA
GE
No
rm
0
0.2
0.4
0.6
0.8
1
Tim
e i
n S
eco
nd
s
Can
cell
ati
on
Rate
Measure
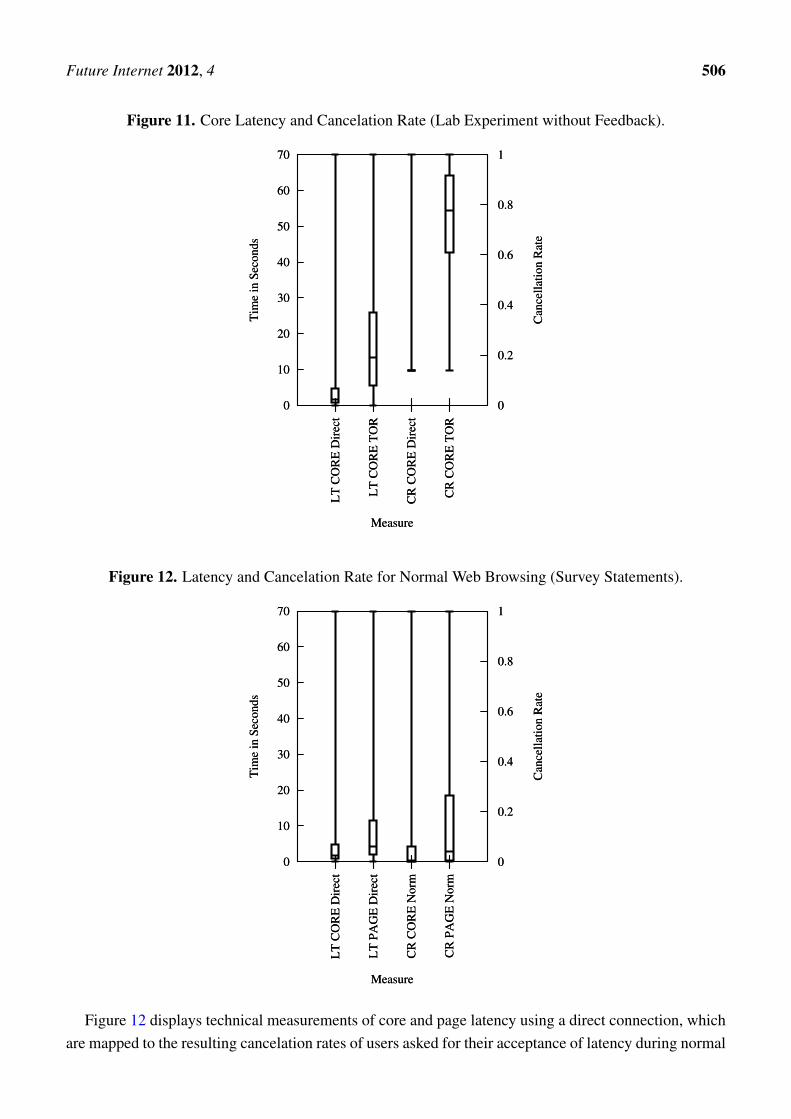
Figure 12 displays technical measurements of core and page latency using a direct connection, whichare mapped to the resulting cancelation rates of users asked for their acceptance of latency during normal
Future Internet 2012, 4 507
browsing (referenced by Norm). This mapping indicates that core and page latency of an average directconnection are accepted by more than 96% of the users.
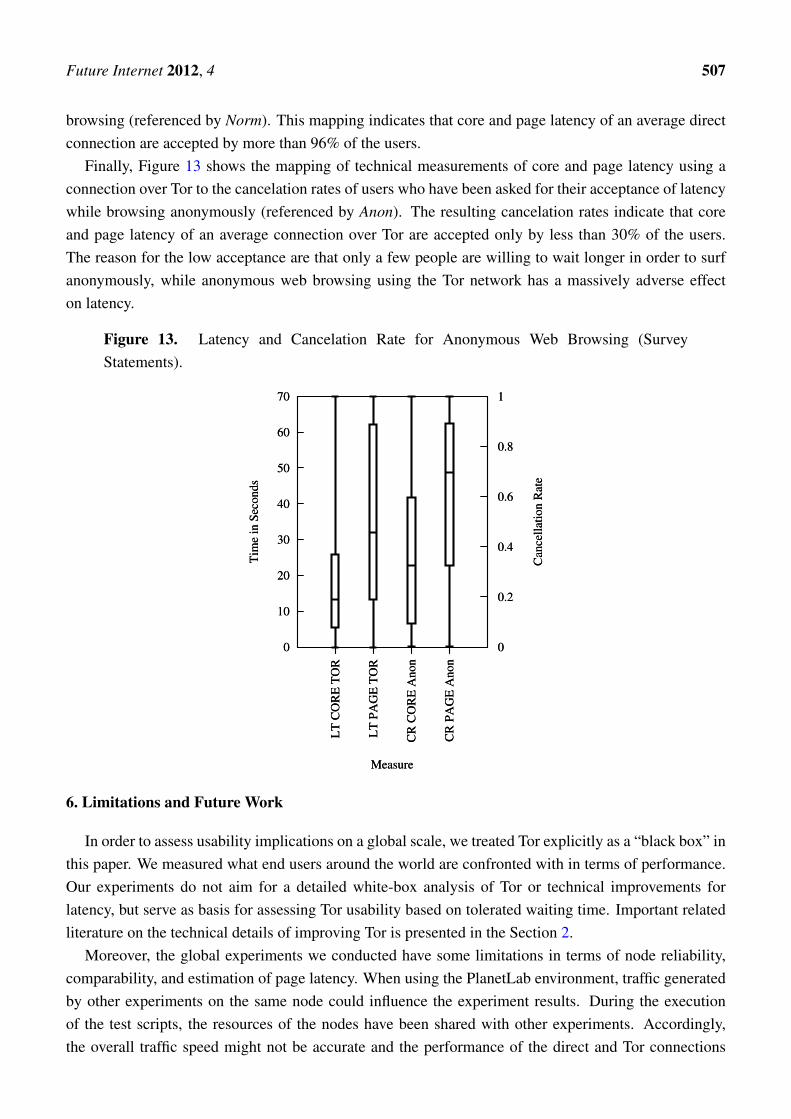
Finally, Figure 13 shows the mapping of technical measurements of core and page latency using aconnection over Tor to the cancelation rates of users who have been asked for their acceptance of latencywhile browsing anonymously (referenced by Anon). The resulting cancelation rates indicate that coreand page latency of an average connection over Tor are accepted only by less than 30% of the users.The reason for the low acceptance are that only a few people are willing to wait longer in order to surfanonymously, while anonymous web browsing using the Tor network has a massively adverse effecton latency.
Figure 13. Latency and Cancelation Rate for Anonymous Web Browsing (SurveyStatements).
0
10
20
30
40
50
60
70
LT
CO
RE
TO
R
LT
PA
GE
TO
R
CR
CO
RE
An
on
CR
PA
GE
An
on
0
0.2
0.4
0.6
0.8
1
Tim
e i
n S
eco
nd
s
Can
cell
ati
on
Rate
Measure
0
10
20
30
40
50
60
70
LT
CO
RE
TO
R
LT
PA
GE
TO
R
CR
CO
RE
An
on
CR
PA
GE
An
on
0
0.2
0.4
0.6
0.8
1
Tim
e i
n S
eco
nd
s
Can
cell
ati
on
Rate
Measure
6. Limitations and Future Work
In order to assess usability implications on a global scale, we treated Tor explicitly as a “black box” inthis paper. We measured what end users around the world are confronted with in terms of performance.Our experiments do not aim for a detailed white-box analysis of Tor or technical improvements forlatency, but serve as basis for assessing Tor usability based on tolerated waiting time. Important relatedliterature on the technical details of improving Tor is presented in the Section 2.
Moreover, the global experiments we conducted have some limitations in terms of node reliability,comparability, and estimation of page latency. When using the PlanetLab environment, traffic generatedby other experiments on the same node could influence the experiment results. During the executionof the test scripts, the resources of the nodes have been shared with other experiments. Accordingly,the overall traffic speed might not be accurate and the performance of the direct and Tor connections
Future Internet 2012, 4 508
should only be compared against each other and are (quantitatively) not exactly comparable acrossmachines. However, the results from experiments conducted on the same node (i.e., direct vs. Tor)are still comparable since both traffic types used the same connection and the ratio between them wasconsidered for analysis. On the one hand, our experiments might be overestimating the speed of normalweb browsing, e.g., at home, because the PlanetLab environment provides in most cases server-gradecomputers with a good Internet connection. On the other hand, they may be underestimating the speed ofnormal web browsing because of the heavy load these PlanetLab nodes suffer. Though we suppose thatthese differences between PlanetLab nodes and common personal computers are insignificant, furtherresearch should include tests to strengthen this hypothesis. All in all, the relative ratio of both traffictypes will be comparable.
Our approach for calculating the extrapolation factor for downloading complete web pages, thoughmost suited for our experimental setting, has some limitations: (i) The results vary between differentwebsites, while extrapolating does not cover this issue. We do not consider this as crucial due to the factthat we focus on page latency; (ii) When downloading the complete web page, additional variations interms of time and coverage for different browsers and individual browser settings may be experienced.An alternative method, which could better reflect a real user’s browsing behavior, would be to providea Tor exit node and use the requested websites for live measurement experiments. However, eventhough such alternative experiments could in theory be conducted without affecting the privacy of Torusers, this could nonetheless raise strong privacy concerns and potentially also cause legal issues in ouruniversity environment.
We focused on clear-cut technical metrics that can be measured via automated requests. In the realworld, the perceived latency of the user depends on various other aspects. Additional studies aboutinfluence factors for perceived latency such as cultural issues, the task at hand, or individual user settingsof the browser or operating system could provide valuable information about how latency is experiencedby users and what countermeasures could be applied, such as introducing a loading progress bar forTor users. In future work, we plan a set of user studies on capturing those further, more individual orsubjective aspects of latency acceptance and usability. In addition, we will investigate user acceptancescorrelation to educational and ethnical background and if IT knowledge has an influence on usersacceptance. Furthermore, we will ask if risk awareness and risk aversion have an influence on thewillingness to use Tor. First results in this direction were recently published by us [27].
Future research will also focus on performance improvements, which according to our studies willhelp to gain a wider user acceptance. We would like to investigate if changing parameters such asthe number of hops in an anonymization network could have a positive influence on anonymity andusability, e.g., decreasing the number of hops could result in lower latency. This could result in broaderuser acceptance, leading to more users and increasing anonymity in general, but possibly leaving routesmuch more open to compromise. Another approach could be a performance-oriented one in which thebehavior of the anonymization network is not focused on guaranteeing a certain degree of anonymity, buton a guarantee of performance. For example, one could include statistics such as number of participantsand latency of nodes when calculating the route within the anonymization network. Such an approach isadopted by the I2P anonymity system, which takes the performance of the peers into account when
Future Internet 2012, 4 509
calculating routes through the network. This is of course a compromise between performance andprivacy [53].
7. Conclusions
In this paper, we extended previous research on measuring Tor latency and usability: for the technicalmeasurement in terms of diversification and duration and for the user acceptance in terms of usercancelation rates. We included further statistics from web usability studies and we included our ownresults based on an interactive survey. Both extensions helped us to improve the significance and clarityof the usability analysis of the Tor anonymization tool. In particular, we analyzed the performance of theTor network by comparing direct Internet access against a Tor-anonymized Internet access. Those testswere performed on different nodes around the world to gather data based on various locations. Enormousamounts of data were accumulated during a period of 38 days totaling nearly 4.5 million requests foreach connection type.
The experiment results quantitatively confirmed the common intuition that one has to acceptperformance losses while using the Tor network. User waiting times exhibit a large spread, ranging fromtaking twice as long as to nearly a hundred times longer while using the Tor network. The median ratiowhile using the Tor network is around 7.8 times slower. Concerning the loss of usability in exchange forimproved anonymity while browsing the web via Tor, we can say that for core latency, the median of allTor requests was 7.8 times higher than the median of the direct connection. Furthermore, the experimentsrevealed that Tor latency seems to fluctuate more, i.e., the actual duration of an HTTP request via Tor isharder to anticipate for the user. The overall latency that a user finally experiences is approximated bypage latency, estimating the download of a complete web page. Our results indicate that at least 75% ofall direct requests are faster than 75% of all Tor requests.
Based on the results of our experiments, we provided a mapping that measures the expected increasein web user cancelation rate while using Tor. Comparing page latency between Tor-based and directrequests, there is a difference of 64% or 65% according to the lab experiment, respectively the usersurvey, in expected cancelation rate. This is a strong indicator for potentially high user frustration whenusing the Tor anonymization network.
We suggest that a usability improvement in terms of a massive latency reduction would significantlyincrease the adoption of Tor by new users, and thereby increase the anonymity of current users aswell. On the other hand, if anonymization technology should become part of a Future Internet [14],our research offers first steps towards an empirically grounded analysis of corresponding performancerequirements.
References
1. Amnesty International. Undermining Freedom of Expression in China. 2006. Availableonline: http://www.amnestyusa.org/business/Undermining Freedom of Expression in China.pdf(accessed on 8 May 2012).
2. Dingledine, R.; Mathewson, N.; Syverson, P. Tor: The Second-Generation Onion Router. InProceedings of the 13th USENIX Security Symposium, San Diego, CA, USA, 9–13 August 2004.
Future Internet 2012, 4 510
3. Tor Project Web Site. 2010. Available online: https://www.torproject.org/ (accessed on 8May 2012).
4. Dingledine, R.; Mathewson, N. Anonymity Loves Company: Usability and the Network Effect.In Proceedings of the 5th Workshop on the Economics of Information Security (WEIS 2006),Cambridge, UK, 26–28 June 2006.
5. Palme, J.; Berglund, M. Anonymity on the Internet. 2002. Available online: http://people.dsv.su.se/∼jpalme/society/anonymity.html (accessed on 8 May 2012).
6. Vitone, D. Anonymous Networks. 2008. Available online: http://blag.cerebralmind.net/wp-content/uploads/2008/05/tor.pdf (accessed on 8 May 2012).
7. Loesing, K.; Murdoch, S.J.; Dingledine, R. A Case Study on Measuring Statistical Data in the TorAnonymity Network. In Proceedings of the Workshop on Ethics in Computer Security Research(WECSR 2010), Canary Islands, Spain, 28–29 January 2010.
8. Dingledine, R.; Murdoch, S.J. Performance Improvements on Tor. 2009. Available online: https://www.torproject.org/press/presskit/2009-03-11-performance.pdf (accessed on 8 May 2012).
9. Loesing, K. Measuring the Tor Network from Public Directory Information. In Proceedings ofthe 2nd Hot Topics in Privacy Enhancing Technologies (HotPETs), Seattle, WA, USA, 5–7 August2009.
10. PlanetLab User’s Guide. 2011. Available online: http://www.planet-lab.org/doc/guides/user(accessed on 8 May 2012).
11. Wright, T. Security, privacy, and anonymity. ACM 2004, 11, doi:10.1145/1144403.1144408.12. Mannan, M.; van Oorschot, P.C. Security and Usability: The Gap in Real-World Online Banking.
In Proceedings of the 2007 Workshop on New Security Paradigms, North Conway, NH, USA, 18–21September 2007; pp. 1–14.
13. Acquisti, A.; Dingledine, R.; Syverson, P. On the Economics of Anonymity. In Proceedingsof the Financial Cryptography (FC ’03); Wright, R.N., Ed.; Springer: Berlin, Germany, 2003;pp. 84–102.
14. Bellovin, S.M.; Clark, D.D.; Perrig, A. A Clean-Slate Design for the Next-Generation SecureInternet. Available online: http://mars.cs.kent.edu/∼peyravi/Net208S/Lec/NextGenInternet.pdf(accessed on 10 May 2012).
15. Chaum, D. Untraceable electronic mail, return addresses, and digital pseudonyms. Commun. ACM1981, 24, 84–88.
16. Danezis, G. Mix-Networks with Restricted Routes. In Proceedings of the 3rd Privacy EnhancingTechnologies Workshop (PET 2003); Dingledine, R., Ed.; Springer: Berlin, Germany, 2003;Volume 2760, pp. 1–17.
17. Diaz, C.; Murdoch, S.J.; Troncoso, C. Impact of Network Topology on Anonymity and Overheadin Low-Latency Anonymity Networks. In Proceedings of the 10th International Symposium onPrivacy Enhancing Technologies (PETS 2010), Berlin, Germany, 21–23 July 2010.
18. Murdoch, S.J.; Watson, R.N.M. Metrics for Security and Performance in Low-Latency AnonymityNetworks. In Proceedings of the 8th International Symposium on Privacy Enhancing Technologies(PETS 2008); Springer: Berlin, Germany, 2008; pp. 115–132.
Future Internet 2012, 4 511
19. Loesing, K.; Sandmann, W.; Wilms, C.; Wirtz, G. Performance Measurements and Statistics of TorHidden Services. In Proceedings of the 2008 International Symposium on Applications and theInternet (SAINT); IEEE CS Press: Turku, Finland, 2008.
20. Lenhard, J.; Loesing, K.; Wirtz, G. Performance Measurements of Tor Hidden Services inLow-Bandwidth Access Networks. In Proceedings of the 7th International Conference on AppliedCryptography and Network Security (ACNS 09), Paris-Rocquencourt, France, 2–5 June 2009;Volume 5536.
21. Tor Metrics Portal. 2010. Available online: http://metrics.torproject.org/ (accessed on 8 May 2012).22. Fabian, B.; Goertz, F.; Kunz, S.; Muller, S.; Nitzsche, M. Privately Waiting—A Usability Analysis
of the Tor Anonymity Network. In Proceedings of the 16th Americas Conference on InformationSystems (AMCIS 2010); Springer: Berlin, Germany, 2010; Volume 58.
23. McCoy, D.; Bauer, K.; Grunwald, D.; Kohno, T.; Sicker, D. Shining Light in Dark Places:Understanding the Tor Network. In Proceedings of the 8th International Symposium on PrivacyEnhancing Technologies (PETS 2008); Springer: Berlin, Germany, 2008; pp. 63–76.
24. Perry, M. TorFlow: Tor Network Analysis. Available online: http://fscked.org/talks/TorFlow-HotPETS-final.pdf (accessed on 10 May 2012).
25. Dhungel, P.; Steiner, M.; Rimac, I.; Hilt, V.; Ross, K.W. Waiting for Anonymity: UnderstandingDelays in the Tor Overlay. In Proceedings of the IEEE 10th International Conference on Peer-to-Peer Computing (P2P 2010), Delft, The Netherlands, 25–27 August 2010.
26. Hopper, N.; Vasserman, E.Y.; Chan-Tin, E. How much anonymity does network latency leak? ACMTrans. Inf. Syst. Secur. 2010, 13, doi:10.1145/1698750.1698753.
27. Brecht, F.; Fabian, B.; Kunz, S.; Muller, S. Are You Willing to Wait Longer for Internet Privacy? InProceedings of the European Conference on Information Systems (ECIS 2011), Helsinki, Finland,9–11 June 2011.
28. Nielson, J. “Top Ten Mistakes” in Web design—Revisited Three Years Later. Available online:http://www.useit.com/alertbox/990502.html (accessed on 8 May 2012).
29. Rose, G.; Khoo, H.; Straub, D.W. Current technological impediments to business-to-consumerelectronic commerce. Commun. AIS 1999, 1, 1.
30. Ryan, G.; Valverde, M. Waiting online: A review and research agenda. Int. Res. Electron. Netw.Appl. Policy 2003, 13, 195–205.
31. Stockport, G.J.; Kunnath, G.; Sedick, R. Boo.com—The path to failure. J. Interact. Mark. 2001,15, 56–70.
32. Tolia, N.; Andersen, D.; Satyanarayanan, M. Quantifying interactive user experience on thin clients.IEEE Comput. 2006, 39, 46–52.
33. Nah, F.F. A study on tolerable waiting time: How long are web users willing to wait? Behav. Inf.Technol. 2004, 23, 153–163.
34. AccountingWEB. Is Your Web Site Too Big? 2000. Available online: http://www.accountingweb.com/item/29331 (accessed on 8 May 2012).
35. Bhatti, N.; Bouch, A.; Kuchinsky, A. Integrating user-perceived quality into Web server design.Comput. Netw. (Amst. Neth. 1999) 2000, 33, 1–16.
Future Internet 2012, 4 512
36. Selvidge, P. How Long is Too Long to Wait for a Website to Load? 1999. Available online:http://www.surl.org/usabilitynews/12/time delay.asp (accessed on 8 May 2012).
37. Galletta, D.F.; Henry, R.M.; McCoy, S.; Polak, P. Web site delays: How tolerant are users? J. AIS2004, 5, 1–28.
38. Ramsay, J.; Barbesi, A.; Preece, J. A psychological investigation of long retrieval times on theWorld Wide Web. Interact. Comput. 1998, 10, 77–86.
39. Huber, M.; Mulazzani, M.; Weippl, E. Tor HTTP Usage and Information Leakage. In Proceedingsof the Communications and Multimedia Security; Springer: Berlin, Germany, 2010; Volume 6109,pp. 245–255.
40. SEOmoz: The 500 Most Important Websites on the Internet. 2011. Available online: http://www.seomoz.org/top500 (accessed on 8 May 2012).
41. Wikipedia. Goodput. 2011. Available online: https://secure.wikimedia.org/wikipedia/en/wiki/Goodput (accessed on 8 May 2012).
42. Peterson, L.; Pai, V.S. Experience-driven experimental systems research. Commun. ACM 2007,50, 38–44.
43. Tor partially blocked in China. 2009. Available online: https://blog.torproject.org/blog/tor-partially-blocked-china/ (accessed on 8 May 2012).
44. Talbot, D. China Cracks Down on Tor Anonymity Network. Technology Review. 2009. Availableonline: http://www.technologyreview.com/web/23736/ (accessed on 8 May 2012).
45. Berger, M. Tor Nodes Statistics. 2011. Available online: http://www.dianacht.de/torstat/ (accessedon 8 May 2012).
46. Panchenko, A.; Renner, J. Path Selection Metrics for Performance-Improved Onion Routing. InProceedings of the 2009 9th Annual International Symposium on Applications and the Internet;IEEE Computer Society: Washington, DC, USA, 2009; pp. 114–120.
47. Map of all Google data center locations. Pingdom Blog. 2008. Available online: http://royal.pingdom.com/2008/04/11/map-of-all-google-data-center-locations/ (accessed on 8 May 2012).
48. CDN performance. 2010. Available online: http://royal.pingdom.com/2010/05/11/cdn-performance-downloading-jquery-from-google-microsoft-and-edgecast-cdns/ (accessed on 8May 2012).
49. Utrace—Locate IP Addresses and Domain Names. 2011. Available online: http://www.utrace.de/(accessed on 8 May 2012).
50. New Cisco Study Reveals Peak Internet Traffic Increases Due to Social Networking and BroadbandVideo Usage. 2009. Available online: http://newsroom.cisco.com/dlls/2009/prod 102109.html(accessed on 8 May 2012).
51. Cisco Visual Networking Index: Usage Study. 2010. Available online: http://www.cisco.com/en/US/solutions/collateral/ns341/ns525/ns537/ns705/Cisco VNI Usage WP.html (accessed on 8May 2012).
52. Roger Dingledine and Nick Mathewson. 2011. Available online: https://git.torproject.org/checkout/tor/master/doc/spec/path-spec.txt (accessed on 8 May 2012).

Future Internet 2012, 4 513
53. Herrmann, M.; Grothoff, C. Privacy-Implications of Performance-Based Peer Selection by Onion-Routers: A Real-World Case Study Using I2P. In Proceedings of the 11th International Symposiumon Privacy Enhancing Technologies (PETS 2011); Springer: Berlin, Germany, 2011; pp. 155–174.
c© 2012 by the authors; licensee MDPI, Basel, Switzerland. This article is an open access articledistributed under the terms and conditions of the Creative Commons Attribution license(http://creativecommons.org/licenses/by/3.0/.)
Related Documents