Future flood risk management in the UK E. Evans MA, FICE, J. Hall PhD , CEng, FICE, E. Penning-Rowsell PhD , MA, P. Sayers CEng, MICE, C. Thorne PhD , Affil. MASCE and A. Watkinson PhD The Foresight Future Flooding project has analysed future flood risk in a scenario framework for the whole of the UK. The analysis predicts increasing flood risk unless current flood management policies and investment levels are changed, with up to a twentyfold increase in economic risk by the 2080s. The increase is attributable to a combination of climate change and increasing value of household, industrial and infrastructure assets. Potential responses are assessed in terms of the three pillars of sustainability: social, environmental and economic. The work described has formed much of the evidence base for the new government strategy for flood risk management in England, ‘Making space for water’. 1. INTRODUCTION This paper summarises some of the results from the Foresight Future Flooding project 1,2 in which scenario analysis was used to inform the strategic choices that should be made now if the increased flood risk that may occur in the future is to be addressed. The potential future drivers and impacts of flood risk are assessed for a simple baseline assumption under which the presentday approach to flood management and expenditure is held constant under the four Foresight Futures. 3 This might at first appear to be at odds with scenario analysis in that the approach to flood management might be expected to differ in each scenario, but provides a baseline against which the effectiveness of different flood management programmes can be judged. It also answers the simple question: what might happen to flood risk under different future scenarios if current flood risk management strategies continue unchanged? The assessment of responses used a similar scenario framework, but in this case the approach to flood management and expenditure was allowed to vary in a way that was consistent with the storylines in each of the four scenarios. 2. THE ANALYSIS OF CHANGING FLOOD RISK Change in the flooding system can be conceptualised using the pressure–state–impact–response (PSIR) model. 4,5 Typical variables describing the flooding system state might be extreme water levels, flood defence levels and numbers of properties in the floodplain, while any phenomenon that could change the time-averaged state of the flooding system is referred to as a ‘driver’. The flooding system can be further analysed using the source– pathway–receptor (SPR) model. 6 The SPR model is a well- established framework in environmental risk assessment which is based upon the causal linkage between the source of environmental hazard, the mechanism by which it is transmitted and the receptor, which suffers some impact. Thus in the case of flooding (a) sources are the weather events or conditions that may result in flooding (e.g. heavy rainfall, rising sea level) (b) pathways are the mechanisms that convey flood waters that originate as extreme weather events to places where they may impact upon receptors: these include fluvial flows, overland urban flows, coastal processes and failure of fluvial and sea defence structures or urban drainage systems (c) receptors are the people, industries and built and natural environments that may be impacted upon by flooding. The division between sources, pathways and receptors is not crisp and depends upon the context of the analysis. For example, an urban area can be both a pathway and a receptor. 2.1. Scenario analysis The use of scenarios for policy analysis far into the future has been stimulated by the long-term uncertainties surrounding climate and socio-economic change. Flood risk analysis involves the use of two different types of scenario. (a) Climate change projections are based on emissions scenarios. Climate change is the key driver relating to the flooding ‘source’ variables in the SPR model. The UKCIP02 climate scenarios for the UK 7 have been used. (b) Socio-economic scenarios provide the context in which flood management policy and practice will be enacted and relate to the extent to which society may be impacted upon by flooding. The Foresight Futures socio-economic scenarios 8 are intended to suggest possible long-term futures, exploring alternative directions in which social, economic and technological changes may evolve over coming decades (Fig. 1). Under the Foresight Futures, one futures axis is concerned primarily with the scale of governance from global to local, while the other reflects values from those that are community orientated to individual consumerism. Edward Evans Visiting Professor, Glasgow University, UK Jim Hall Professor of Earth Systems Engineering, University of Newcastle-upon-Tyne, UK Edmund Penning-Rowsell Professor of Geography and Head of Flood Hazard Research Centre, Middlesex University, UK Paul Sayers Group Manager, River and Coastal Systems, HR Wallingford Limited, Wallingford, UK Colin Thorne Professor of Physical Geography, University of Nottingham, UK Andrew Watkinson Professor of Ecology, University of East Anglia and Tyndall Centre for Climate Change Research, Norwich, UK Proceedings of the Institution of Civil Engineers Water Management 159 March 2006 Issue WM1 Pages 53–61 Paper 14216 Received 06/04/2005 Accepted 04/01/2006 Keywords: floods & floodworks/risk & probability analysis Water Management 159 Issue WM1 Future flood risk management in the UK Evans et al. 53

Welcome message from author
This document is posted to help you gain knowledge. Please leave a comment to let me know what you think about it! Share it to your friends and learn new things together.
Transcript
Edward EvansVisiting Professor,Glasgow University,UK
Jim HallProfessor of Earth SystemsEngineering, University ofNewcastle-upon-Tyne,UK
Edmund Penning-RowsellProfessor of Geographyand Head of Flood HazardResearch Centre,Middlesex University, UK
Paul SayersGroup Manager, Riverand Coastal Systems, HRWallingford Limited,Wallingford, UK
Colin ThorneProfessor ofPhysical Geography,University ofNottingham, UK
Andrew WatkinsonProfessor of Ecology, Universityof East Anglia and TyndallCentre for Climate ChangeResearch, Norwich, UK
Proceedings of the Institution ofCivil EngineersWater Management 159March 2006 Issue WM1Pages 53–61
Paper 14216Received 06/04/2005Accepted 04/01/2006
Keywords:floods & floodworks/risk &probability analysis
Future flood risk management in the UK
E. Evans MA, FICE, J. Hall PhD, CEng, FICE, E. Penning-Rowsell PhD, MA, P. Sayers CEng, MICE,C. Thorne PhD, Affil. MASCE and A. Watkinson PhD
The Foresight Future Flooding project has analysed future
flood risk in a scenario framework for the whole of the UK.
The analysis predicts increasing flood risk unless current
flood management policies and investment levels are
changed, with up to a twentyfold increase in economic risk
by the 2080s. The increase is attributable to a combination
of climate change and increasing value of household,
industrial and infrastructure assets. Potential responses
are assessed in terms of the three pillars of sustainability:
social, environmental and economic. The work described
has formed much of the evidence base for the new
government strategy for flood risk management in
England, ‘Making space for water’.
1. INTRODUCTION
This paper summarises some of the results from the Foresight
Future Flooding project1,2 in which scenario analysis was used to
inform the strategic choices that should be made now if the
increased flood risk that may occur in the future is to be
addressed. The potential future drivers and impacts of flood risk
are assessed for a simple baseline assumption under which the
presentday approach to flood management and expenditure is
held constant under the four Foresight Futures.3 This might at
first appear to be at odds with scenario analysis in that the
approach to flood management might be expected to differ in
each scenario, but provides a baseline against which the
effectiveness of different flood management programmes can be
judged. It also answers the simple question: what might happen
to flood risk under different future scenarios if current flood risk
management strategies continue unchanged?
The assessment of responses used a similar scenario framework,
but in this case the approach to flood management and
expenditure was allowed to vary in a way that was consistent
with the storylines in each of the four scenarios.
2. THE ANALYSIS OF CHANGING FLOOD RISK
Change in the flooding system can be conceptualised using the
pressure–state–impact–response (PSIR) model.4,5 Typical
variables describing the flooding system state might be extreme
water levels, flood defence levels and numbers of properties in
the floodplain, while any phenomenon that could change the
time-averaged state of the flooding system is referred to as a
‘driver’.
Water Management 159 Issue WM1 Future fl
The flooding system can be further analysed using the source–
pathway–receptor (SPR) model.6 The SPR model is a well-
established framework in environmental risk assessment which
is based upon the causal linkage between the source of
environmental hazard, the mechanism by which it is transmitted
and the receptor, which suffers some impact. Thus in the case of
flooding
(a) sources are the weather events or conditions that may result
in flooding (e.g. heavy rainfall, rising sea level)
(b) pathways are the mechanisms that convey flood waters that
originate as extreme weather events to places where they
may impact upon receptors: these include fluvial flows,
overland urban flows, coastal processes and failure of
fluvial and sea defence structures or urban drainage
systems
(c) receptors are the people, industries and built and natural
environments that may be impacted upon by flooding.
The division between sources, pathways and receptors is not crisp
and depends upon the context of the analysis. For example, an
urban area can be both a pathway and a receptor.
2.1. Scenario analysis
The use of scenarios for policy analysis far into the future has
been stimulated by the long-term uncertainties surrounding
climate and socio-economic change. Flood risk analysis involves
the use of two different types of scenario.
(a) Climate change projections are based on emissions
scenarios. Climate change is the key driver relating to the
flooding ‘source’ variables in the SPR model. The UKCIP02
climate scenarios for the UK7 have been used.
(b) Socio-economic scenarios provide the context in which
flood management policy and practice will be enacted and
relate to the extent to which society may be impacted upon
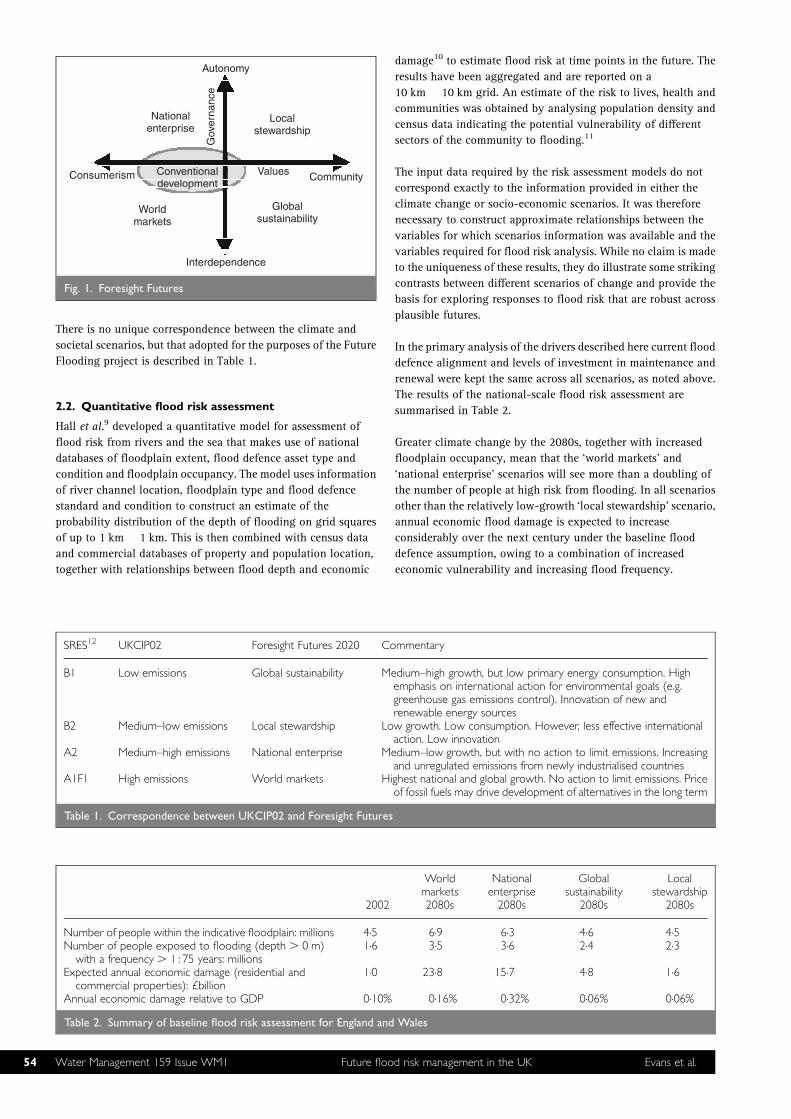
by flooding. The Foresight Futures socio-economic
scenarios8 are intended to suggest possible long-term
futures, exploring alternative directions in which social,
economic and technological changes may evolve over
coming decades (Fig. 1). Under the Foresight Futures, one
futures axis is concerned primarily with the scale of
governance from global to local, while the other reflects
values from those that are community orientated to
individual consumerism.
ood risk management in the UK Evans et al. 53
Autonomy
Nationalenterprise
Localstewardship
Gov
erna
nce
Values CommunityConsumerism
Worldmarkets
Globalsustainability
Interdependence
Conventionaldevelopment
Fig. 1. Foresight Futures
54
There is no unique correspondence between the climate and
societal scenarios, but that adopted for the purposes of the Future
Flooding project is described in Table 1.
2.2. Quantitative flood risk assessment
Hall et al.9 developed a quantitative model for assessment of
flood risk from rivers and the sea that makes use of national
databases of floodplain extent, flood defence asset type and
condition and floodplain occupancy. The model uses information
of river channel location, floodplain type and flood defence
standard and condition to construct an estimate of the
probability distribution of the depth of flooding on grid squares
of up to 1 km � 1 km. This is then combined with census data
and commercial databases of property and population location,
together with relationships between flood depth and economic
SRES12 UKCIP02 Foresight Futures 2020 Co
B1 Low emissions Global sustainability Me
B2 Medium–low emissions Local stewardship Lo
A2 Medium–high emissions National enterprise Me
A1F1 High emissions World markets Hi
Table 1. Correspondence between UKCIP02 and Foresight Futures
2002
Number of people within the indicative floodplain: millions 4.5Number of people exposed to flooding (depth . 0 m)
with a frequency . 1 : 75 years: millions1.6
Expected annual economic damage (residential andcommercial properties): £billion
1.0
Annual economic damage relative to GDP 0.10%
Table 2. Summary of baseline flood risk assessment for England and
Water Management 159 Issue WM1 Future floo
damage10 to estimate flood risk at time points in the future. The
results have been aggregated and are reported on a
10 km � 10 km grid. An estimate of the risk to lives, health and
communities was obtained by analysing population density and
census data indicating the potential vulnerability of different
sectors of the community to flooding.11
The input data required by the risk assessment models do not
correspond exactly to the information provided in either the
climate change or socio-economic scenarios. It was therefore
necessary to construct approximate relationships between the
variables for which scenarios information was available and the
variables required for flood risk analysis. While no claim is made
to the uniqueness of these results, they do illustrate some striking
contrasts between different scenarios of change and provide the
basis for exploring responses to flood risk that are robust across
plausible futures.
In the primary analysis of the drivers described here current flood
defence alignment and levels of investment in maintenance and
renewal were kept the same across all scenarios, as noted above.
The results of the national-scale flood risk assessment are
summarised in Table 2.
Greater climate change by the 2080s, together with increased
floodplain occupancy, mean that the ‘world markets’ and
‘national enterprise’ scenarios will see more than a doubling of
the number of people at high risk from flooding. In all scenarios
other than the relatively low-growth ‘local stewardship’ scenario,
annual economic flood damage is expected to increase
considerably over the next century under the baseline flood
defence assumption, owing to a combination of increased
economic vulnerability and increasing flood frequency.
mmentary
dium–high growth, but low primary energy consumption. Highemphasis on international action for environmental goals (e.g.greenhouse gas emissions control). Innovation of new andrenewable energy sourcesw growth. Low consumption. However, less effective internationalaction. Low innovationdium–low growth, but with no action to limit emissions. Increasingand unregulated emissions from newly industrialised countriesghest national and global growth. No action to limit emissions. Priceof fossil fuels may drive development of alternatives in the long term
Worldmarkets2080s
Nationalenterprise
2080s
Globalsustainability
2080s
Localstewardship
2080s
6.9 6.3 4.6 4.53.5 3.6 2.4 2.3
23.8 15.7 4.8 1.6
0.16% 0.32% 0.06% 0.06%
Wales
d risk management in the UK Evans et al.
Change in the ratio of flood risk to per capita gross domestic
product (GDP) provides an indication of how harmful (in
economic terms) flooding will be to the UK. In the ‘world markets’
and ‘national enterprise’ scenarios flooding is expected to remove
a greater proportion of national wealth than it currently does
(and thus merit a greater investment to reduce risk). In the
‘local stewardship’ and ‘global sustainability’ scenarios flooding
is predicted to remove a lesser proportion of national wealth
since these scenarios will tend to be less vulnerable to flood
damage and are expected to be subject to somewhat less
climate change.
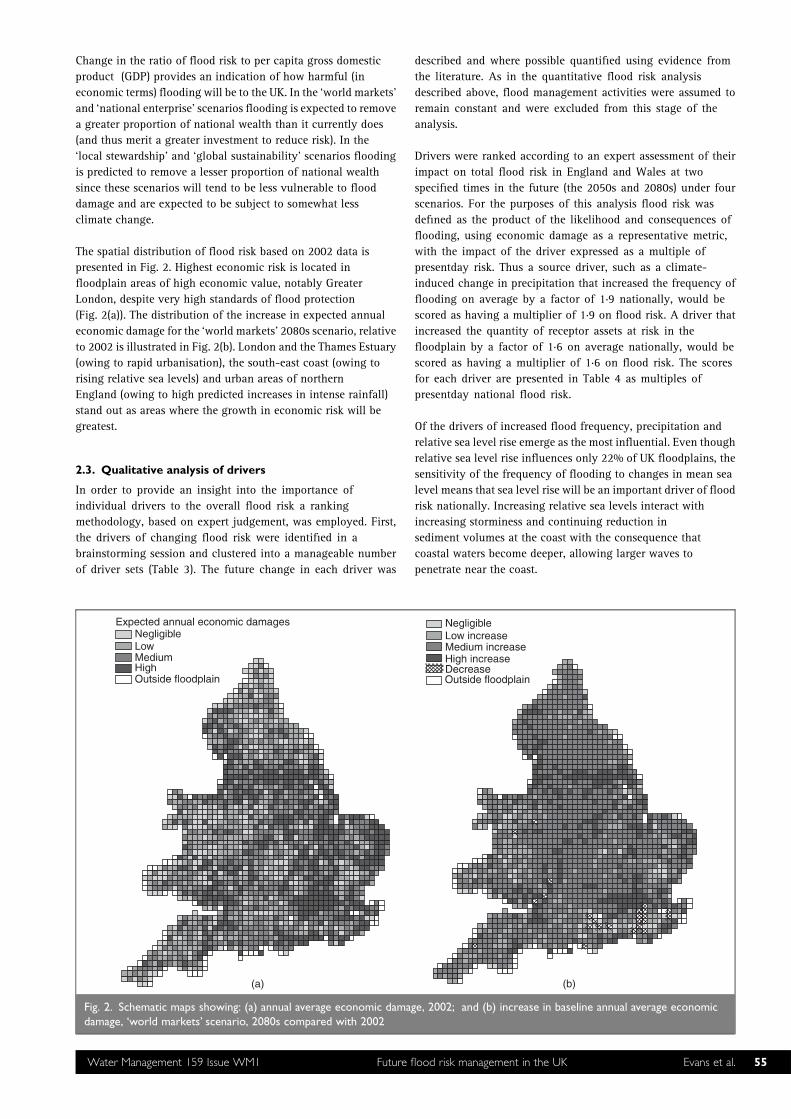
The spatial distribution of flood risk based on 2002 data is
presented in Fig. 2. Highest economic risk is located in
floodplain areas of high economic value, notably Greater
London, despite very high standards of flood protection
(Fig. 2(a)). The distribution of the increase in expected annual
economic damage for the ‘world markets’ 2080s scenario, relative
to 2002 is illustrated in Fig. 2(b). London and the Thames Estuary
(owing to rapid urbanisation), the south-east coast (owing to
rising relative sea levels) and urban areas of northern
England (owing to high predicted increases in intense rainfall)
stand out as areas where the growth in economic risk will be
greatest.
2.3. Qualitative analysis of drivers
In order to provide an insight into the importance of
individual drivers to the overall flood risk a ranking
methodology, based on expert judgement, was employed. First,
the drivers of changing flood risk were identified in a
brainstorming session and clustered into a manageable number
of driver sets (Table 3). The future change in each driver was
(a)
Fig. 2. Schematic maps showing: (a) annual average economic damagdamage, ‘world markets’ scenario, 2080s compared with 2002
Water Management 159 Issue WM1 Future fl
described and where possible quantified using evidence from
the literature. As in the quantitative flood risk analysis
described above, flood management activities were assumed to
remain constant and were excluded from this stage of the
analysis.
Drivers were ranked according to an expert assessment of their
impact on total flood risk in England and Wales at two
specified times in the future (the 2050s and 2080s) under four
scenarios. For the purposes of this analysis flood risk was
defined as the product of the likelihood and consequences of
flooding, using economic damage as a representative metric,
with the impact of the driver expressed as a multiple of
presentday risk. Thus a source driver, such as a climate-
induced change in precipitation that increased the frequency of
flooding on average by a factor of 1.9 nationally, would be
scored as having a multiplier of 1.9 on flood risk. A driver that
increased the quantity of receptor assets at risk in the
floodplain by a factor of 1.6 on average nationally, would be
scored as having a multiplier of 1.6 on flood risk. The scores
for each driver are presented in Table 4 as multiples of
presentday national flood risk.
Of the drivers of increased flood frequency, precipitation and
relative sea level rise emerge as the most influential. Even though
relative sea level rise influences only 22% of UK floodplains, the
sensitivity of the frequency of flooding to changes in mean sea
level means that sea level rise will be an important driver of flood
risk nationally. Increasing relative sea levels interact with
increasing storminess and continuing reduction in
sediment volumes at the coast with the consequence that
coastal waters become deeper, allowing larger waves to
penetrate near the coast.
(b)
e, 2002; and (b) increase in baseline annual average economic
ood risk management in the UK Evans et al. 55
Driver set DriversSPR
classification Explanation
Climate change Precipitation Source Quantity, spatial distribution of rainfall and intensityTemperature Source Influence of temperature on runoff
Catchment runoff Urbanisation Pathway Changes in the area of impermeable surfaces that increase runoffRural land management Pathway Effects of rural land management practices that affect runoff generation
Fluvial processes Environmental regulation Pathway Future legislation that may influence policy on flood managementRiver morphology and
sediment supplyPathway Changes in river morphology that influence flood storage and
conveyanceRiver vegetation
and conveyancePathway Vegetation and micro-morphology may affect flood conveyance
Coastal processes Relative sea level Source Increases in mean sea level owing to climate change.Uplift/subsidence of land
Waves Source Wave height and directionSurges Source Temporary increases in sea level above astronomic tide level,
resulting from reduced atmospheric pressure and strong windsCoastal morphology and
sediment supplyPathway Changes in the nearshore seabed, shoreline and estuaries. May be the
consequence of anthropogenic activities such as dredgingHuman behaviour Stakeholder behaviour Pathway Behaviour of floodplain occupants before, during and after floods can
significantly modify lossesSocial impacts Receptor Changes in social vulnerability to flooding, for example due to
changes in health and fitness, equity and systems of social provisionSocio-economics Buildings and contents Receptor Changes in the cost of flood damage to buildings and contents
(e.g. owing to increasing wealth)Urban impacts Receptor Changes in the number and distribution of domestic, commercial and
other buildings in floodplainsInfrastructure impacts Receptor Changes in systems of communication, energy distribution and so on,
and the extent to which society is dependent on these systemsAgriculture impacts Receptor Changes in agriculture, including removal of agricultural land from
production
Table 3. Summary of drivers of changing flood risk
56
Precipitation is the leading driver of increasing fluvial flood
frequency, though the increase in rainfall frequency and
intensity is not projected to be uniform across the UK. The
influence of river morphology, vegetation and conveyance on
World markets
Name 2050s 2080s
Climate changePrecipitation 3 3.6Temperature 1.0 1.0
Catchment runoffUrbanisation 2.2 2.7Rural land management 1.3 1.6
Fluvial processesEnvironmental regulation 1.0 1.0River morphology and sediment supply 1.0 1.6River vegetation and conveyance 1.0 1.2
Coastal processesWaves 1.7 5.1Relative sea-level rise 2.4 9.6Surges 2.4 9.6Coastal morphology and sediment supply 2.4 5.1
Human behaviourStakeholder behaviour 2.0 2.8Social impacts 6.0 19.8
Socio-economicsBuildings and contents 4.0 6.4Urban impacts 1.6 2.0Infrastructure impacts 4.7 9.0Agricultural impacts 1.0 1.0
Table 4. Expert assessments of driver impacts on national flood risk
Water Management 159 Issue WM1 Future floo
flood risk is scenario-dependent. In ‘global sustainability’ and
‘local stewardship’ scenarios regulatory restrictions on channel
maintenance and the wish to renaturalise rivers might reduce
channel conveyance and hence increase flood frequency unless
National enterprise Local stewardship Global sustainability
2050s 2080s 2050s 2080s 2050s 2080s
2.2 2.7 2.2 2.7 1.7 2.01.0 1.0 1.0 1.0 1.0 1.0
2.2 2.7 0.8 0.7 0.8 0.71.3 1.6 0.8 0.7 0.8 0.8
1.0 1.0 1.4 2.8 2.0 4.01.0 1.0 1.7 2.7 1.3 2.01.0 1.2 1.0 1.6 1.7 3.6
1.3 2.8 1.0 1.9 1.0 1.52.6 4.0 1.7 5.1 1.7 3.71.7 4.6 1.3 2.8 1.0 1.52.0 3.7 1.7 2.4 1.3 1.5
0.5 0.3 0.3 0.2 0.3 0.22.2 3.6 3.0 6.1 2.2 3.2
3.2 4.5 0.9 0.7 1.5 1.91.4 1.6 1.0 1.0 1.1 1.13.2 5.2 0.9 0.7 1.5 1.51.0 1.0 1.0 1.0 1.0 1.0
d risk management in the UK Evans et al.
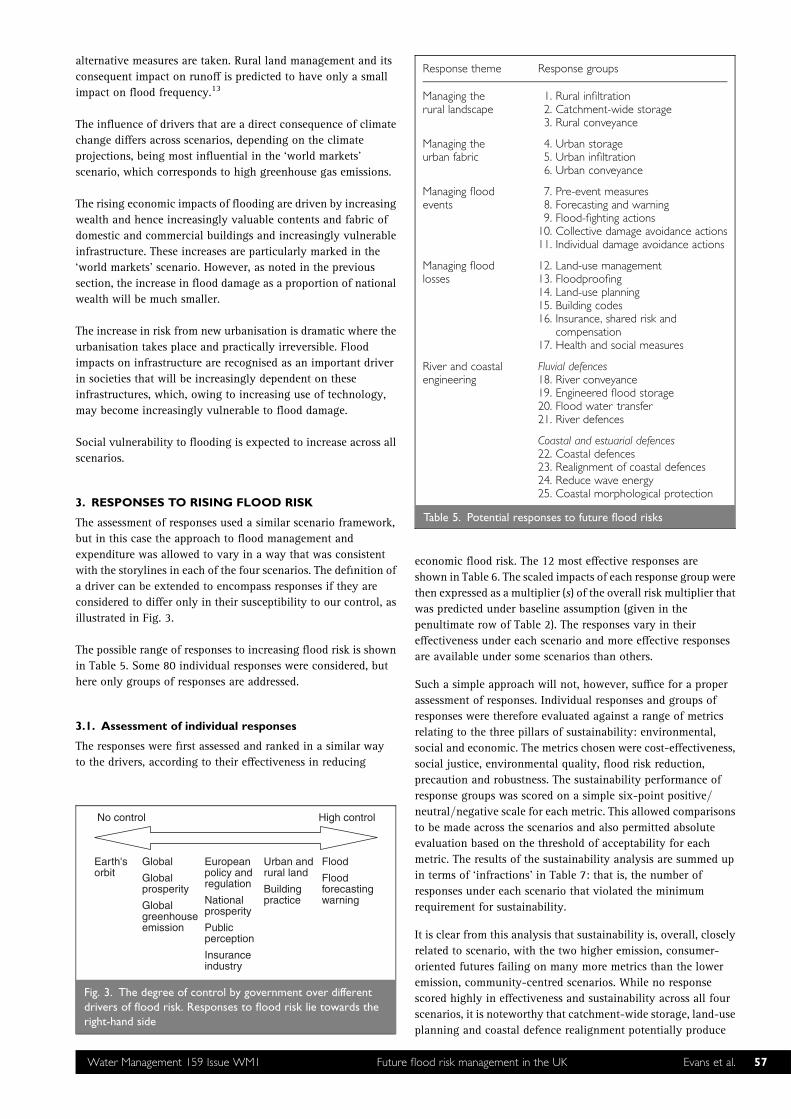
Response theme Response groups
Managing therural landscape
1. Rural infiltration2. Catchment-wide storage3. Rural conveyance
Managing theurban fabric
4. Urban storage5. Urban infiltration6. Urban conveyance
Managing floodevents
7. Pre-event measures8. Forecasting and warning9. Flood-fighting actions
10. Collective damage avoidance actions11. Individual damage avoidance actions
Managing floodlosses
12. Land-use management13. Floodproofing14. Land-use planning15. Building codes16. Insurance, shared risk and
compensation17. Health and social measures
River and coastalengineering
Fluvial defences18. River conveyance19. Engineered flood storage20. Flood water transfer21. River defences
Coastal and estuarial defences22. Coastal defences
alternative measures are taken. Rural land management and its
consequent impact on runoff is predicted to have only a small
impact on flood frequency.13
The influence of drivers that are a direct consequence of climate
change differs across scenarios, depending on the climate
projections, being most influential in the ‘world markets’
scenario, which corresponds to high greenhouse gas emissions.
The rising economic impacts of flooding are driven by increasing
wealth and hence increasingly valuable contents and fabric of
domestic and commercial buildings and increasingly vulnerable
infrastructure. These increases are particularly marked in the
‘world markets’ scenario. However, as noted in the previous
section, the increase in flood damage as a proportion of national
wealth will be much smaller.
The increase in risk from new urbanisation is dramatic where the
urbanisation takes place and practically irreversible. Flood
impacts on infrastructure are recognised as an important driver
in societies that will be increasingly dependent on these
infrastructures, which, owing to increasing use of technology,
may become increasingly vulnerable to flood damage.
Social vulnerability to flooding is expected to increase across all
scenarios.
23. Realignment of coastal defences24. Reduce wave energy25. Coastal morphological protectionTable 5. Potential responses to future flood risks
3. RESPONSES TO RISING FLOOD RISK
The assessment of responses used a similar scenario framework,
but in this case the approach to flood management and
expenditure was allowed to vary in a way that was consistent
with the storylines in each of the four scenarios. The definition of
a driver can be extended to encompass responses if they are
considered to differ only in their susceptibility to our control, as
illustrated in Fig. 3.
The possible range of responses to increasing flood risk is shown
in Table 5. Some 80 individual responses were considered, but
here only groups of responses are addressed.
3.1. Assessment of individual responses
The responses were first assessed and ranked in a similar way
to the drivers, according to their effectiveness in reducing
No control High control
Earth'sorbit
Global
Globalprosperity
Globalgreenhouseemission
Europeanpolicy andregulation
Nationalprosperity
Publicperception
Insuranceindustry
Urban andrural land
Buildingpractice
Flood
Floodforecastingwarning
Fig. 3. The degree of control by government over differentdrivers of flood risk. Responses to flood risk lie towards theright-hand side
Water Management 159 Issue WM1 Future fl
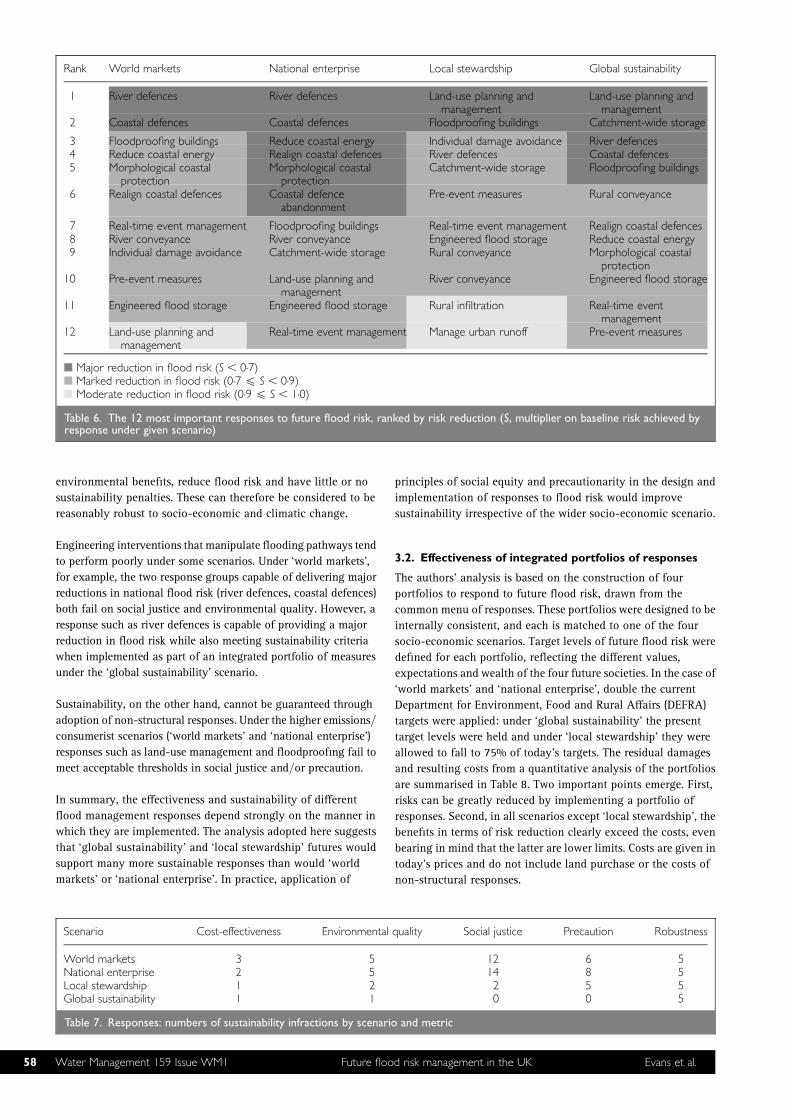
economic flood risk. The 12 most effective responses are
shown in Table 6. The scaled impacts of each response group were
then expressed as a multiplier (s) of the overall risk multiplier that
was predicted under baseline assumption (given in the
penultimate row of Table 2). The responses vary in their
effectiveness under each scenario and more effective responses
are available under some scenarios than others.
Such a simple approach will not, however, suffice for a proper
assessment of responses. Individual responses and groups of
responses were therefore evaluated against a range of metrics
relating to the three pillars of sustainability: environmental,
social and economic. The metrics chosen were cost-effectiveness,
social justice, environmental quality, flood risk reduction,
precaution and robustness. The sustainability performance of
response groups was scored on a simple six-point positive/
neutral/negative scale for each metric. This allowed comparisons
to be made across the scenarios and also permitted absolute
evaluation based on the threshold of acceptability for each
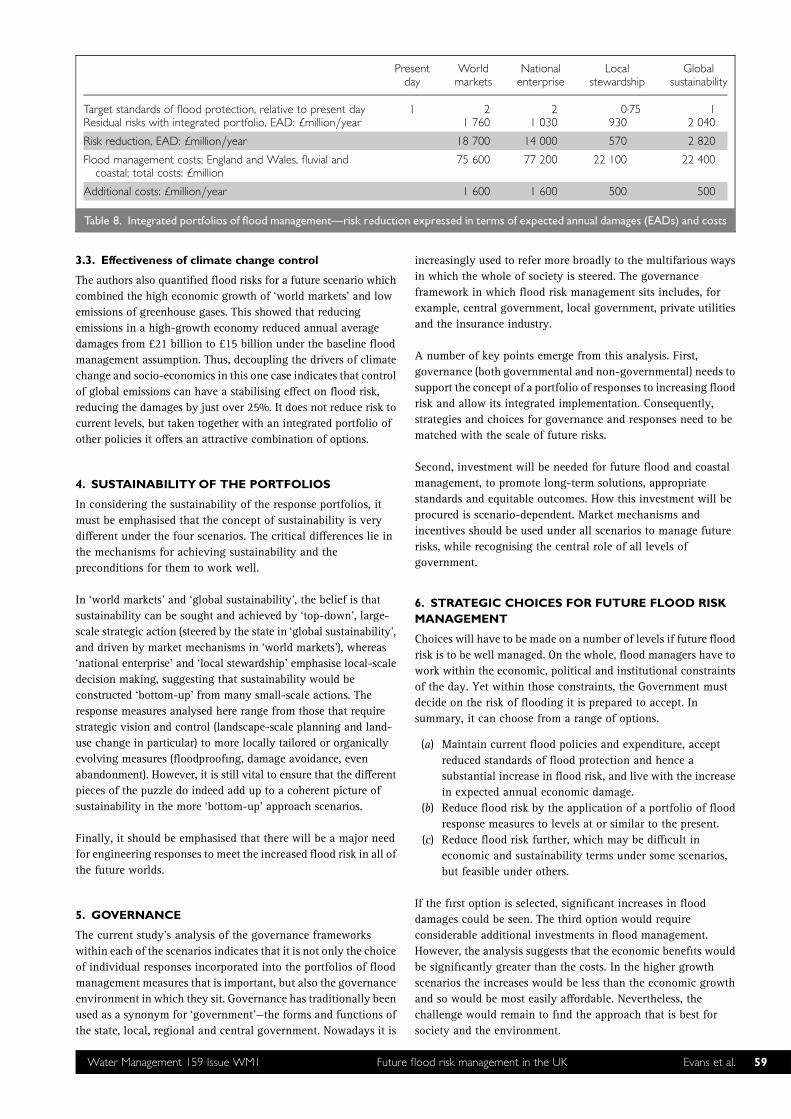
metric. The results of the sustainability analysis are summed up
in terms of ‘infractions’ in Table 7: that is, the number of
responses under each scenario that violated the minimum
requirement for sustainability.
It is clear from this analysis that sustainability is, overall, closely
related to scenario, with the two higher emission, consumer-
oriented futures failing on many more metrics than the lower
emission, community-centred scenarios. While no response
scored highly in effectiveness and sustainability across all four
scenarios, it is noteworthy that catchment-wide storage, land-use
planning and coastal defence realignment potentially produce
ood risk management in the UK Evans et al. 57
Rank World markets National enterprise Local stewardship Global sustainability
1 River defences River defences Land-use planning andmanagement
Land-use planning andmanagement
2 Coastal defences Coastal defences Floodproofing buildings Catchment-wide storage
3 Floodproofing buildings Reduce coastal energy Individual damage avoidance River defences4 Reduce coastal energy Realign coastal defences River defences Coastal defences5 Morphological coastal
protectionMorphological coastal
protectionCatchment-wide storage Floodproofing buildings
6 Realign coastal defences Coastal defenceabandonment
Pre-event measures Rural conveyance
7 Real-time event management Floodproofing buildings Real-time event management Realign coastal defences8 River conveyance River conveyance Engineered flood storage Reduce coastal energy9 Individual damage avoidance Catchment-wide storage Rural conveyance Morphological coastal
protection10 Pre-event measures Land-use planning and
managementRiver conveyance Engineered flood storage
11 Engineered flood storage Engineered flood storage Rural infiltration Real-time eventmanagement
12 Land-use planning andmanagement
Real-time event management Manage urban runoff Pre-event measures
B Major reduction in flood risk (S , 0.7)B Marked reduction in flood risk (0.7 4 S , 0.9)B Moderate reduction in flood risk (0.9 4 S , 1.0)
Table 6. The 12 most important responses to future flood risk, ranked by risk reduction (S, multiplier on baseline risk achieved byresponse under given scenario)
58
environmental benefits, reduce flood risk and have little or no
sustainability penalties. These can therefore be considered to be
reasonably robust to socio-economic and climatic change.
Engineering interventions that manipulate flooding pathways tend
to perform poorly under some scenarios. Under ‘world markets’,
for example, the two response groups capable of delivering major
reductions in national flood risk (river defences, coastal defences)
both fail on social justice and environmental quality. However, a
response such as river defences is capable of providing a major
reduction in flood risk while also meeting sustainability criteria
when implemented as part of an integrated portfolio of measures
under the ‘global sustainability’ scenario.
Sustainability, on the other hand, cannot be guaranteed through
adoption of non-structural responses. Under the higher emissions/
consumerist scenarios (‘world markets’ and ‘national enterprise’)
responses such as land-use management and floodproofing fail to
meet acceptable thresholds in social justice and/or precaution.
In summary, the effectiveness and sustainability of different
flood management responses depend strongly on the manner in
which they are implemented. The analysis adopted here suggests
that ‘global sustainability’ and ‘local stewardship’ futures would
support many more sustainable responses than would ‘world
markets’ or ‘national enterprise’. In practice, application of
Scenario Cost-effectiveness Environmental
World markets 3 5National enterprise 2 5Local stewardship 1 2Global sustainability 1 1
Table 7. Responses: numbers of sustainability infractions by scenario
Water Management 159 Issue WM1 Future floo
principles of social equity and precautionarity in the design and
implementation of responses to flood risk would improve
sustainability irrespective of the wider socio-economic scenario.
3.2. Effectiveness of integrated portfolios of responses
The authors’ analysis is based on the construction of four
portfolios to respond to future flood risk, drawn from the
common menu of responses. These portfolios were designed to be
internally consistent, and each is matched to one of the four
socio-economic scenarios. Target levels of future flood risk were
defined for each portfolio, reflecting the different values,
expectations and wealth of the four future societies. In the case of
‘world markets’ and ‘national enterprise’, double the current
Department for Environment, Food and Rural Affairs (DEFRA)
targets were applied: under ‘global sustainability’ the present
target levels were held and under ‘local stewardship’ they were
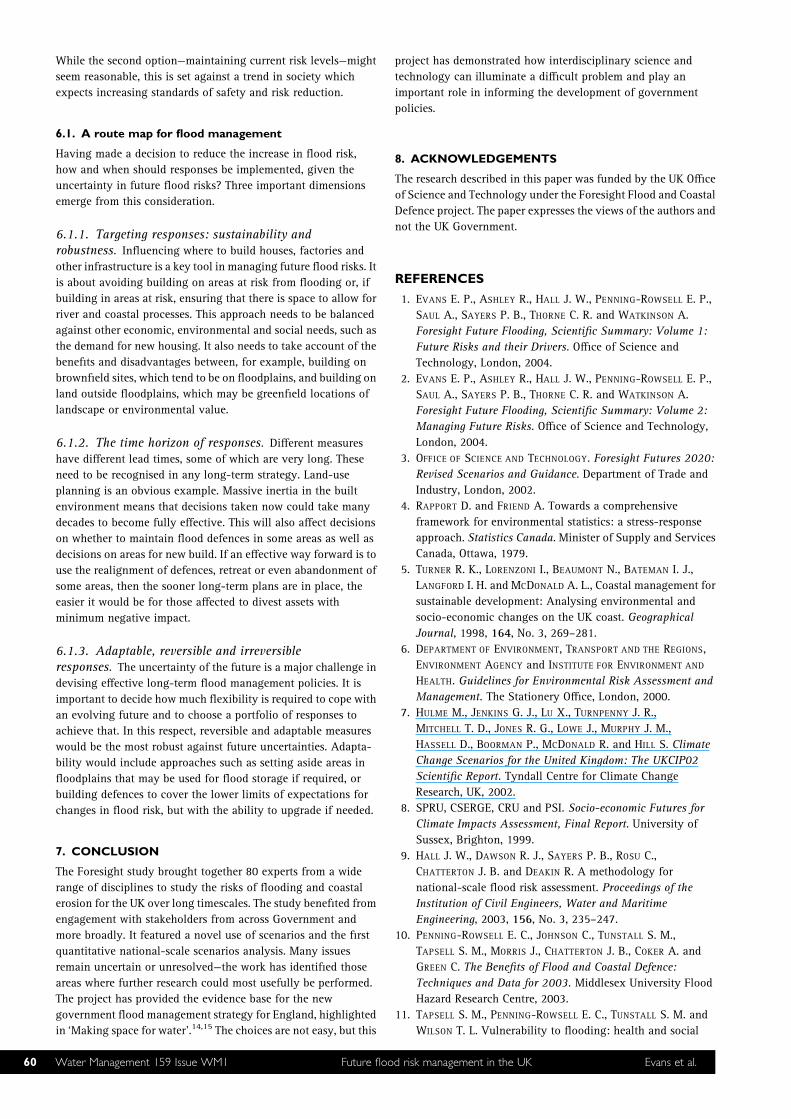
allowed to fall to 75% of today’s targets. The residual damages
and resulting costs from a quantitative analysis of the portfolios
are summarised in Table 8. Two important points emerge. First,
risks can be greatly reduced by implementing a portfolio of
responses. Second, in all scenarios except ‘local stewardship’, the
benefits in terms of risk reduction clearly exceed the costs, even
bearing in mind that the latter are lower limits. Costs are given in
today’s prices and do not include land purchase or the costs of
non-structural responses.
quality Social justice Precaution Robustness
12 6 514 8 52 5 50 0 5
and metric
d risk management in the UK Evans et al.
Presentday
Worldmarkets
Nationalenterprise
Localstewardship
Globalsustainability
Target standards of flood protection, relative to present day 1 2 2 0.75 1Residual risks with integrated portfolio, EAD: £million/year 1 760 1 030 930 2 040
Risk reduction, EAD: £million/year 18 700 14 000 570 2 820
Flood management costs; England and Wales, fluvial andcoastal; total costs: £million
75 600 77 200 22 100 22 400
Additional costs: £million/year 1 600 1 600 500 500
Table 8. Integrated portfolios of flood management—risk reduction expressed in terms of expected annual damages (EADs) and costs
3.3. Effectiveness of climate change control
The authors also quantified flood risks for a future scenario which
combined the high economic growth of ‘world markets’ and low
emissions of greenhouse gases. This showed that reducing
emissions in a high-growth economy reduced annual average
damages from £21 billion to £15 billion under the baseline flood
management assumption. Thus, decoupling the drivers of climate
change and socio-economics in this one case indicates that control
of global emissions can have a stabilising effect on flood risk,
reducing the damages by just over 25%. It does not reduce risk to
current levels, but taken together with an integrated portfolio of
other policies it offers an attractive combination of options.
4. SUSTAINABILITYOF THE PORTFOLIOS
In considering the sustainability of the response portfolios, it
must be emphasised that the concept of sustainability is very
different under the four scenarios. The critical differences lie in
the mechanisms for achieving sustainability and the
preconditions for them to work well.
In ‘world markets’ and ‘global sustainability’, the belief is that
sustainability can be sought and achieved by ‘top-down’, large-
scale strategic action (steered by the state in ‘global sustainability’,
and driven by market mechanisms in ‘world markets’), whereas
‘national enterprise’ and ‘local stewardship’ emphasise local-scale
decision making, suggesting that sustainability would be
constructed ‘bottom-up’ from many small-scale actions. The
response measures analysed here range from those that require
strategic vision and control (landscape-scale planning and land-
use change in particular) to more locally tailored or organically
evolving measures (floodproofing, damage avoidance, even
abandonment). However, it is still vital to ensure that the different
pieces of the puzzle do indeed add up to a coherent picture of
sustainability in the more ‘bottom-up’ approach scenarios.
Finally, it should be emphasised that there will be a major need
for engineering responses to meet the increased flood risk in all of
the future worlds.
5. GOVERNANCE
The current study’s analysis of the governance frameworks
within each of the scenarios indicates that it is not only the choice
of individual responses incorporated into the portfolios of flood
management measures that is important, but also the governance
environment in which they sit. Governance has traditionally been
used as a synonym for ‘government’—the forms and functions of
the state, local, regional and central government. Nowadays it is
Water Management 159 Issue WM1 Future fl
increasingly used to refer more broadly to the multifarious ways
in which the whole of society is steered. The governance
framework in which flood risk management sits includes, for
example, central government, local government, private utilities
and the insurance industry.
A number of key points emerge from this analysis. First,
governance (both governmental and non-governmental) needs to
support the concept of a portfolio of responses to increasing flood
risk and allow its integrated implementation. Consequently,
strategies and choices for governance and responses need to be
matched with the scale of future risks.
Second, investment will be needed for future flood and coastal
management, to promote long-term solutions, appropriate
standards and equitable outcomes. How this investment will be
procured is scenario-dependent. Market mechanisms and
incentives should be used under all scenarios to manage future
risks, while recognising the central role of all levels of
government.
6. STRATEGIC CHOICES FOR FUTURE FLOOD RISK
MANAGEMENT
Choices will have to be made on a number of levels if future flood
risk is to be well managed. On the whole, flood managers have to
work within the economic, political and institutional constraints
of the day. Yet within those constraints, the Government must
decide on the risk of flooding it is prepared to accept. In
summary, it can choose from a range of options.
(a) Maintain current flood policies and expenditure, accept
reduced standards of flood protection and hence a
substantial increase in flood risk, and live with the increase
in expected annual economic damage.
(b) Reduce flood risk by the application of a portfolio of flood
response measures to levels at or similar to the present.
(c) Reduce flood risk further, which may be difficult in
economic and sustainability terms under some scenarios,
but feasible under others.
If the first option is selected, significant increases in flood
damages could be seen. The third option would require
considerable additional investments in flood management.
However, the analysis suggests that the economic benefits would
be significantly greater than the costs. In the higher growth
scenarios the increases would be less than the economic growth
and so would be most easily affordable. Nevertheless, the
challenge would remain to find the approach that is best for
society and the environment.
ood risk management in the UK Evans et al. 59
60
While the second option—maintaining current risk levels—might
seem reasonable, this is set against a trend in society which
expects increasing standards of safety and risk reduction.
6.1. A route map for flood management
Having made a decision to reduce the increase in flood risk,
how and when should responses be implemented, given the
uncertainty in future flood risks? Three important dimensions
emerge from this consideration.
6.1.1. Targeting responses: sustainability androbustness. Influencing where to build houses, factories and
other infrastructure is a key tool in managing future flood risks. It
is about avoiding building on areas at risk from flooding or, if
building in areas at risk, ensuring that there is space to allow for
river and coastal processes. This approach needs to be balanced
against other economic, environmental and social needs, such as
the demand for new housing. It also needs to take account of the
benefits and disadvantages between, for example, building on
brownfield sites, which tend to be on floodplains, and building on
land outside floodplains, which may be greenfield locations of
landscape or environmental value.
6.1.2. The time horizon of responses. Different measures
have different lead times, some of which are very long. These
need to be recognised in any long-term strategy. Land-use
planning is an obvious example. Massive inertia in the built
environment means that decisions taken now could take many
decades to become fully effective. This will also affect decisions
on whether to maintain flood defences in some areas as well as
decisions on areas for new build. If an effective way forward is to
use the realignment of defences, retreat or even abandonment of
some areas, then the sooner long-term plans are in place, the
easier it would be for those affected to divest assets with
minimum negative impact.
6.1.3. Adaptable, reversible and irreversibleresponses. The uncertainty of the future is a major challenge in
devising effective long-term flood management policies. It is
important to decide how much flexibility is required to cope with
an evolving future and to choose a portfolio of responses to
achieve that. In this respect, reversible and adaptable measures
would be the most robust against future uncertainties. Adapta-
bility would include approaches such as setting aside areas in
floodplains that may be used for flood storage if required, or
building defences to cover the lower limits of expectations for
changes in flood risk, but with the ability to upgrade if needed.
7. CONCLUSION
The Foresight study brought together 80 experts from a wide
range of disciplines to study the risks of flooding and coastal
erosion for the UK over long timescales. The study benefited from
engagement with stakeholders from across Government and
more broadly. It featured a novel use of scenarios and the first
quantitative national-scale scenarios analysis. Many issues
remain uncertain or unresolved—the work has identified those
areas where further research could most usefully be performed.
The project has provided the evidence base for the new
government flood management strategy for England, highlighted
in ‘Making space for water’.14,15 The choices are not easy, but this
Water Management 159 Issue WM1 Future floo
project has demonstrated how interdisciplinary science and
technology can illuminate a difficult problem and play an
important role in informing the development of government
policies.
8. ACKNOWLEDGEMENTS
The research described in this paper was funded by the UK Office
of Science and Technology under the Foresight Flood and Coastal
Defence project. The paper expresses the views of the authors and
not the UK Government.
REFERENCES
1. EVANS E. P., ASHLEY R., HALL J. W., PENNING-ROWSELL E. P.,
SAUL A., SAYERS P. B., THORNE C. R. and WATKINSON A.
Foresight Future Flooding, Scientific Summary: Volume 1:
Future Risks and their Drivers. Office of Science and
Technology, London, 2004.
2. EVANS E. P., ASHLEY R., HALL J. W., PENNING-ROWSELL E. P.,
SAUL A., SAYERS P. B., THORNE C. R. and WATKINSON A.
Foresight Future Flooding, Scientific Summary: Volume 2:
Managing Future Risks. Office of Science and Technology,
London, 2004.
3. OFFICE OF SCIENCE AND TECHNOLOGY. Foresight Futures 2020:
Revised Scenarios and Guidance. Department of Trade and
Industry, London, 2002.
4. RAPPORT D. and FRIEND A. Towards a comprehensive
framework for environmental statistics: a stress-response
approach. Statistics Canada. Minister of Supply and Services
Canada, Ottawa, 1979.
5. TURNER R. K., LORENZONI I., BEAUMONT N., BATEMAN I. J.,
LANGFORD I. H. and MCDONALD A. L., Coastal management for
sustainable development: Analysing environmental and
socio-economic changes on the UK coast. Geographical
Journal, 1998, 164, No. 3, 269–281.
6. DEPARTMENT OF ENVIRONMENT, TRANSPORT AND THE REGIONS,
ENVIRONMENT AGENCY and INSTITUTE FOR ENVIRONMENT AND
HEALTH. Guidelines for Environmental Risk Assessment and
Management. The Stationery Office, London, 2000.
7. HULME M., JENKINS G. J., LU X., TURNPENNY J. R.,
MITCHELL T. D., JONES R. G., LOWE J., MURPHY J. M.,
HASSELL D., BOORMAN P., MCDONALD R. and HILL S. Climate
Change Scenarios for the United Kingdom: The UKCIP02
Scientific Report. Tyndall Centre for Climate Change
Research, UK, 2002.
8. SPRU, CSERGE, CRU and PSI. Socio-economic Futures for
Climate Impacts Assessment, Final Report. University of
Sussex, Brighton, 1999.
9. HALL J. W., DAWSON R. J., SAYERS P. B., ROSU C.,
CHATTERTON J. B. and DEAKIN R. A methodology for
national-scale flood risk assessment. Proceedings of the
Institution of Civil Engineers, Water and Maritime
Engineering, 2003, 156, No. 3, 235–247.
10. PENNING-ROWSELL E. C., JOHNSON C., TUNSTALL S. M.,
TAPSELL S. M., MORRIS J., CHATTERTON J. B., COKER A. and
GREEN C. The Benefits of Flood and Coastal Defence:
Techniques and Data for 2003. Middlesex University Flood
Hazard Research Centre, 2003.
11. TAPSELL S. M., PENNING-ROWSELL E. C., TUNSTALL S. M. and
WILSON T. L. Vulnerability to flooding: health and social
d risk management in the UK Evans et al.

dimensions. Philosophical Transactions of the Royal Society,
London, Series A, 2002, 360, No. 1796, 1511–1525.
12. INTERGOVERNMENTAL PANEL ON CLIMATE CHANGE. Special
Report on Emissions Scenarios. Cambridge University Press,
Cambridge, 2000.
13. O’CONNELL P. E., BEVEN K. J., CARNEY J. N., CLEMENTS R. O.,
EWEN J., FOWLER H., HARRIS G. L., HOLLIS J., MORRIS J.,
O’DONNELL G. M., PACKMAN J. C., PARKIN A., QUINN P. F.,
ROSE S. C., SHEPHERD M. and TELLIER S. Review of Impacts
of Rural Land Use and Management on Flood Generation.
DEFRA, London, 2004, R&D Technical Report FD2114.
Water Management 159 Issue WM1 Future fl
14. DEPARTMENT FOR ENVIRONMENT, FOOD AND RURAL AFFAIRS.
Making Space for Water. Developing a New Government
Strategy for Flood and Coastal Erosion Risk Management in
England. A Consultation Exercise. DEFRA Publications,
London, 2004.
15. DEPARTMENT FOR ENVIRONMENT, FOOD AND RURAL AFFAIRS.
Making Space for Water. Taking Forward a New Government
Strategy for Flood and Coastal Erosion Risk Management in
England, First Government Response to the Autumn 2004
Making Space for Water Consultation Exercise. DEFRA
Publications, London, 2005.
What do you think?To comment on this paper, please email up to 500 words to the editor at [email protected]
Proceedings journals rely entirely on contributions sent in by civil engineers and related professionals, academics and students. Papersshould be 2000–5000 words long, with adequate illustrations and references. Please visit www.thomastelford.com/journals for authorguidelines and further details.
ood risk management in the UK Evans et al. 61
Related Documents