“FUTURE CONSIDERATIONS FOR PK/PD RESEARCH” Terrence F. Blaschke, M.D. Professor of Medicine and Molecular Pharmacology Stanford University

“FUTURE CONSIDERATIONS FOR PK/PD RESEARCH” Terrence F. Blaschke, M.D. Professor of Medicine and Molecular Pharmacology Stanford University.
Dec 23, 2015
Welcome message from author
This document is posted to help you gain knowledge. Please leave a comment to let me know what you think about it! Share it to your friends and learn new things together.
Transcript

“FUTURE CONSIDERATIONS FOR PK/PD RESEARCH”
Terrence F. Blaschke, M.D.Professor of Medicine and Molecular Pharmacology
Stanford University

Issue for discussion:
Can PK/PD modeling help to devise dosage regimens that will have better efficacy and/or safety without adding
time/cost to drug development?

Premise:• There is a need for alternative dose-finding
methods since all reasonable regimens cannot be studied using the current standard of a 48 week controlled study of efficacy and safety– Patient resources are limited– Time requirements would be excessive, and delay
patient access to alternative regimens– HIV therapeutics is a fast-moving field, and approved
regimens may not be acceptable as controls to patients or investigators

M =n!
p!(n-p)!
IF:
FOR: n=31 M=4495
n=23 M=1771
n=14 M=364
n=6 M=20
(p=3)
Combinatorials: the numbers problem
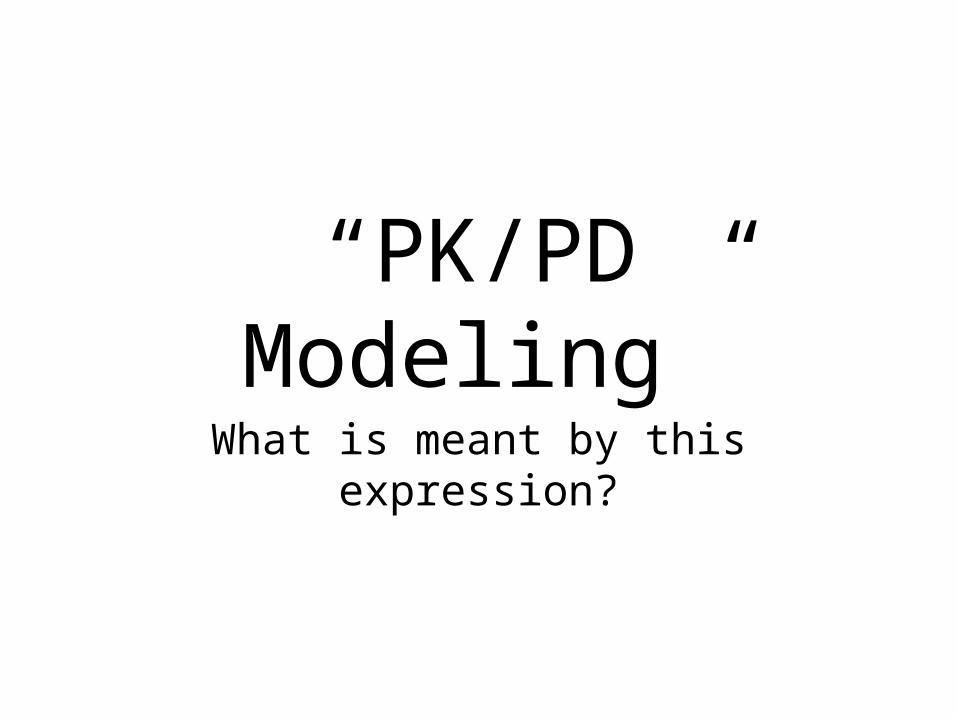
“PK/PD Modeling”What is meant by this expression?
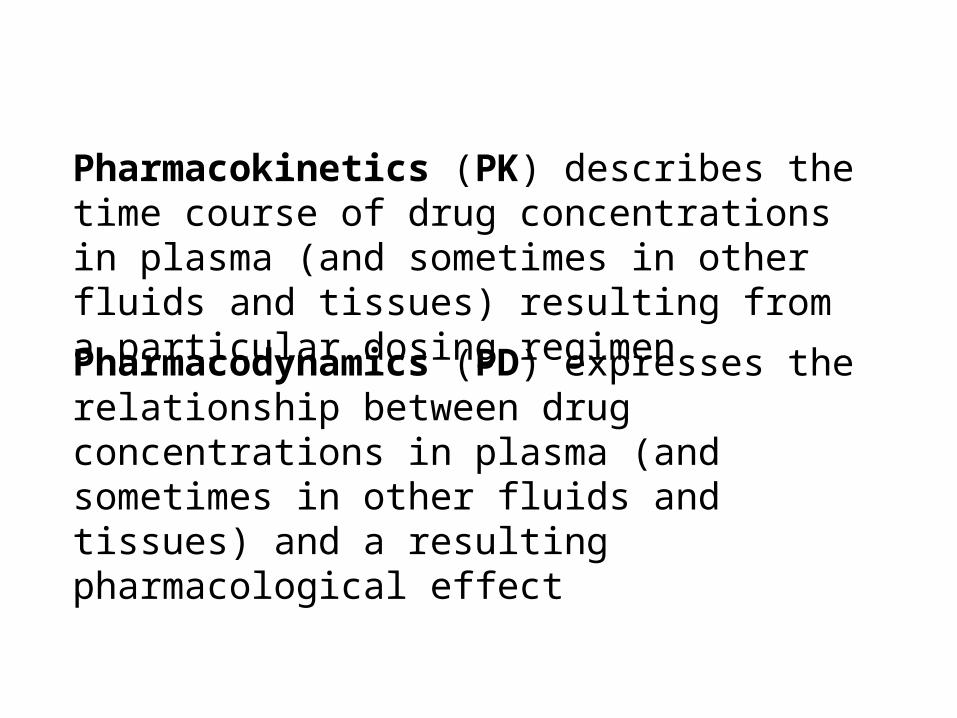
Pharmacokinetics (PK) describes the time course of drug concentrations in plasma (and sometimes in other fluids and tissues) resulting from a particular dosing regimen
Pharmacodynamics (PD) expresses the relationship between drug concentrations in plasma (and sometimes in other fluids and tissues) and a resulting pharmacological effect

A PK/PD Model combines • A model describing drug concentrations vs. time (PK) with• A model describing the relationship of effect vs. concentration (PD), and• A statistical model describing variation in intra- and inter-individual PK/PD models
to predict the time-course and variability of effect vs. of time.
Note: Only mechanistic PK/PD models can be relied upon for extrapolation (I.e., for prediction vs. description)

Process:
• Build PK Model• Build PD Model• Link PK and PD models• Simulate treatment regimens or trials for
useful predictions
An Example:(Next few slides courtesy of Abbott Laboratories and Pharsight Corporation)

This simple model links adherence, pharmacokinetics, and viral pharmacodynamics to
treatment outcome in a patient population.
Adherence Pharmaco-kinetics
Pharmaco-dynamics
PrescribedPI Doses Actual
DosePlasmaConc
Antiretroviral Experience,Disease Severity
Model
DataSource
Random,(beta distribution)
fractional adherence rate
Two one-comp.PK models with
enzyme inhibition and induction
Standard two-strainviral model
MEMS data,Public literature
Two multiple-dosePhase I studies,
One Phase II study
In-vitro data,
ViralLoad

Pharmacokinetic Modeling: The PK model accounts for dose-dependent bioavailability, competitive inhibition, and
exposure-dependent enzyme induction.
PI
RTVEnzyme Induction
Enzyme induction
whenapplicable
CompetitiveEnzymeInhibition
AbsorptionSite
Plasma
AbsorptionSite Plasma E
l i m
i n
a t
i o nTime
Time
Fraction Absorbed
WhenApplicable
Fraction Absorbed
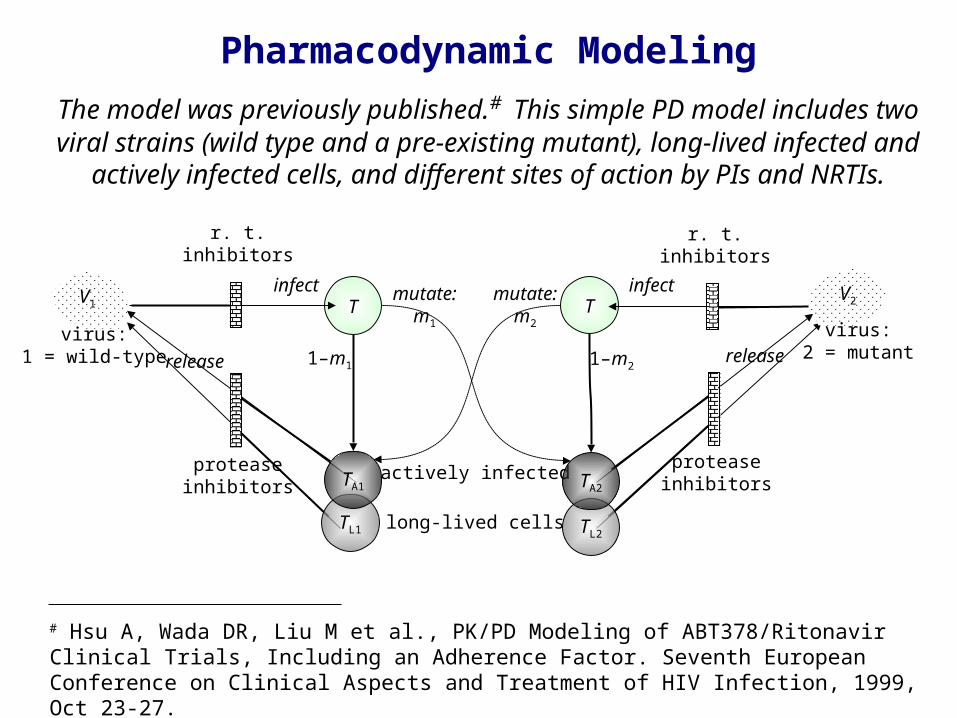
Pharmacodynamic Modeling
The model was previously published.# This simple PD model includes two viral strains (wild type and a pre-existing mutant), long-lived infected and
actively infected cells, and different sites of action by PIs and NRTIs.
V2
virus:1 = wild-type
virus:2 = mutant
V1 Tmutate:
m1
1–m1release
infect
proteaseinhibitors
r. t.inhibitors
long-lived cells
actively infected
mutate:m2
1–m2
Tinfect
proteaseinhibitors
r. t.inhibitors
TL2
TA2
TL1
TA1
release
# Hsu A, Wada DR, Liu M et al., PK/PD Modeling of ABT378/Ritonavir Clinical Trials, Including an Adherence Factor. Seventh European Conference on Clinical Aspects and Treatment of HIV Infection, 1999, Oct 23-27.

– For assessing the effect of PK and adherence variability, 400 subjects were simulated for 48 weeks for each of the six regimens, for a dose-time perturbation of 1.6 hr. Adherences with a beta distribution and with a mean of 81% and SD of 0.20 were used for BID regimens, and a mean of 84% and SD of 0.19 were used for QD regimens.
Simulation

Abbott used this approach to compare various combinations PI dosing regimens which included low and moderate dose ritonavir and were able to predict:
• The range of peak and trough concentrations for each of the PI’s in the regimen, and the ratio of trough concentrations to IC50 values
• The effect of varying degrees of nonadherence on the fraction of patients who were likely to experience virological failure
The PK/PD model and the simulations done with it were observed to be consistent with data from several actual trials carried out by Abbott

Building and Evaluating PK/PD Models
• PK models– As part of conventional PK studies,
information on inter- and intra-subject variability is needed
– For drug combinations, interactions should be evaluated at steady-state with dose regimens that include/bracket those likely to be used
– Consider measuring binding proteins such as 1 acid glycoprotein and unbound drug concentrations

This simple model links adherence, pharmacokinetics, and viral pharmacodynamics to
treatment outcome in a patient population.
Adherence Pharmaco-kinetics
Pharmaco-dynamics
PrescribedPI Doses Actual
DosePlasmaConc
Antiretroviral Experience,Disease Severity
Model
DataSource
Single-coin model,beta distribution
of fractional adherence
Two one-comp.PK models with
enzyme inhibition and induction
Standard two-strainviral model
MEMS data,Public literature
Two multiple-dosePhase I studies,
One Phase II studyIn-vitro data,
ViralLoad
DATA NEEDED TO CREATE PK/PD MODELS(Much of it is pre-existing scientific knowledge!)
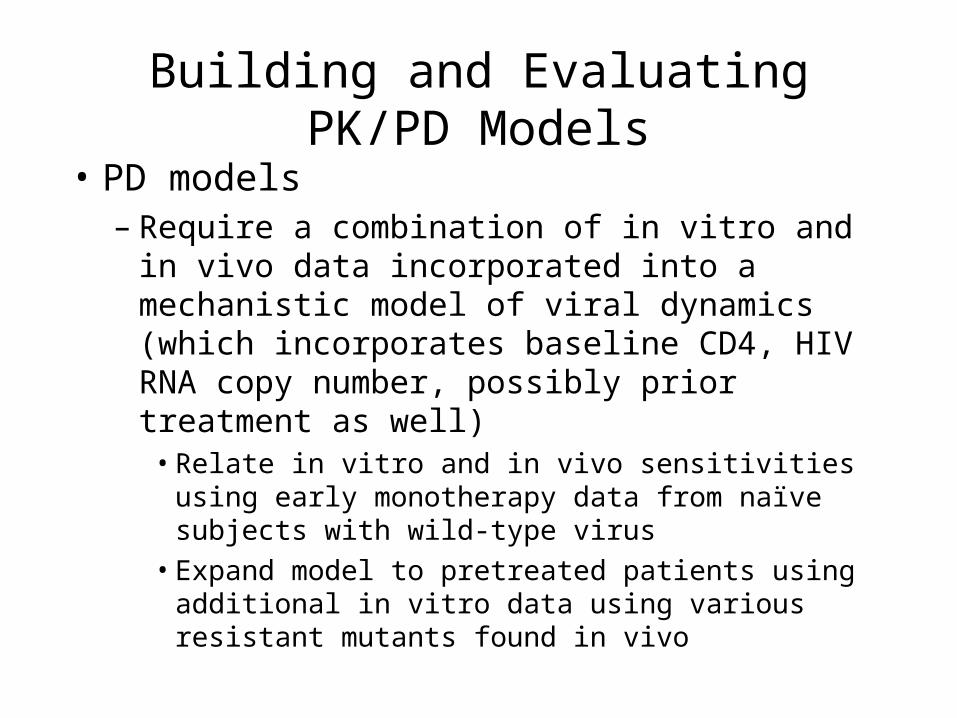
• PD models– Require a combination of in vitro and in vivo
data incorporated into a mechanistic model of viral dynamics (which incorporates baseline CD4, HIV RNA copy number, possibly prior treatment as well)
• Relate in vitro and in vivo sensitivities using early monotherapy data from naïve subjects with wild-type virus
• Expand model to pretreated patients using additional in vitro data using various resistant mutants found in vivo
Building and Evaluating PK/PD Models

This simple model links adherence, pharmacokinetics, and viral pharmacodynamics to
treatment outcome in a patient population.
Adherence Pharmaco-kinetics
Pharmaco-dynamics
PrescribedPI Doses Actual
DosePlasmaConc
Antiretroviral Experience,Disease Severity
Model
DataSource
Single-coin model,beta distribution
of fractional adherence
Two one-comp.PK models with
enzyme inhibition and induction
Standard two-strainviral model
MEMS data,Public literature
Two multiple-dosePhase I studies,
One Phase II studyIn-vitro data,
ViralLoad
DATA NEEDED TO CREATE PK/PD MODELS(Much of it is pre-existing scientific knowledge!)

In Vitro Pharmacokinetic-Pharmacodynamic System
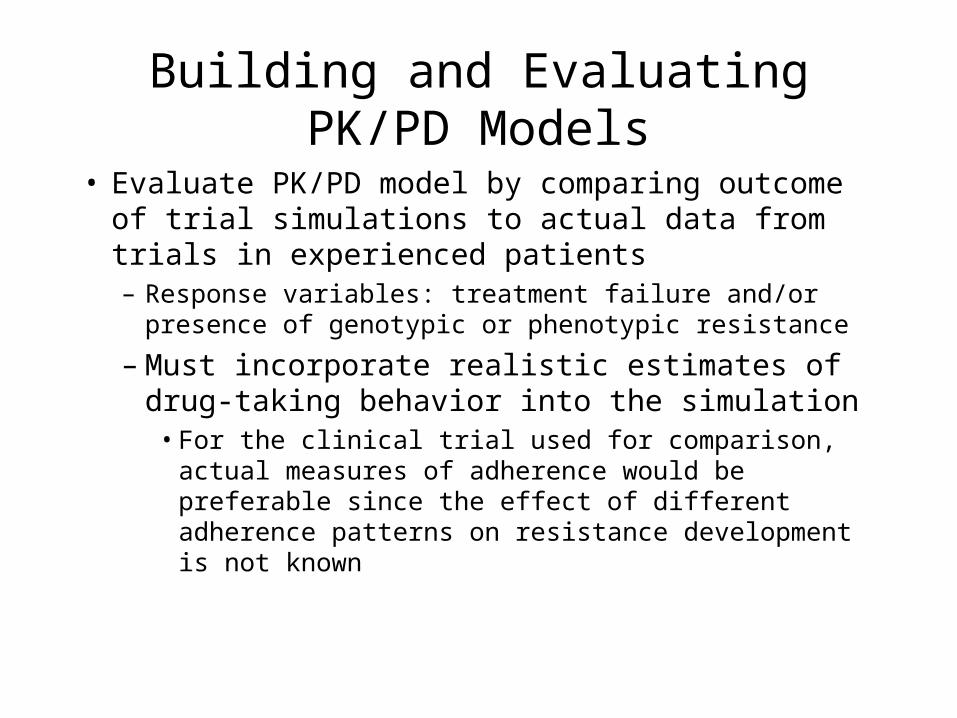
• Evaluate PK/PD model by comparing outcome of trial simulations to actual data from trials in experienced patients– Response variables: treatment failure and/or presence
of genotypic or phenotypic resistance
– Must incorporate realistic estimates of drug-taking behavior into the simulation
• For the clinical trial used for comparison, actual measures of adherence would be preferable since the effect of different adherence patterns on resistance development is not known
Building and Evaluating PK/PD Models

This simple model links adherence, pharmacokinetics, and viral pharmacodynamics to
treatment outcome in a patient population.
Adherence Pharmaco-kinetics
Pharmaco-dynamics
PrescribedPI Doses Actual
DosePlasmaConc
Antiretroviral Experience,Disease Severity
Model
DataSource
Single-coin model,beta distribution
of fractional adherence
Two one-comp.PK models with
enzyme inhibition and induction
Standard two-strainviral model
MEMS data,Public literature
Two multiple-dosePhase I studies,
One Phase II studyIn-vitro data,
ViralLoad
DATA NEEDED TO CREATE PK/PD MODELS(Much of it is pre-existing scientific knowledge!)
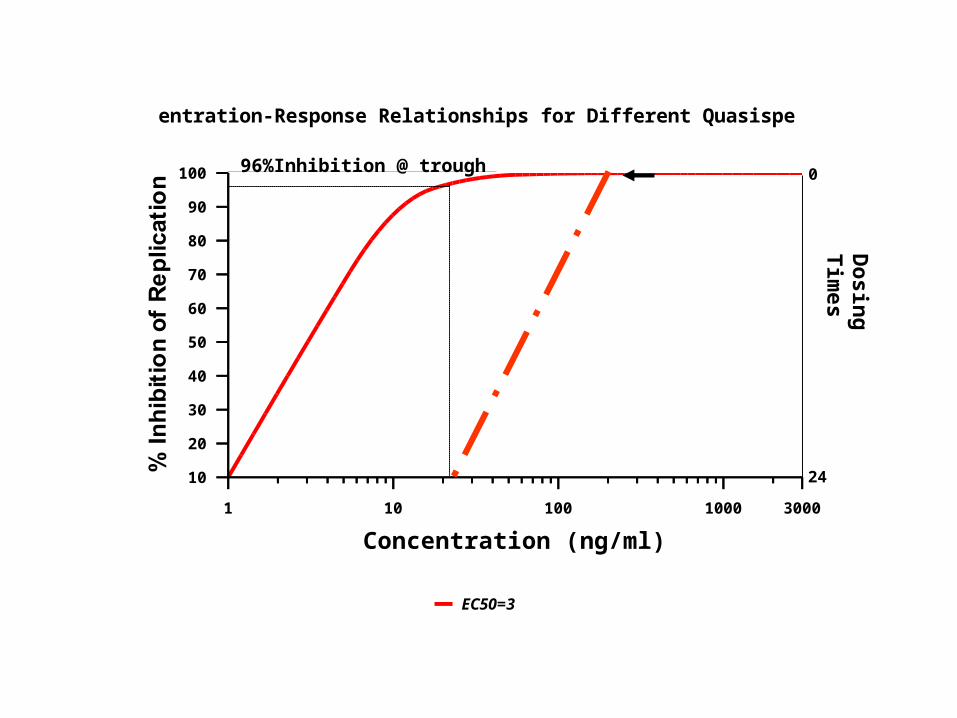
A simple PK/PD relationship to help understand the
potential consequences of changes in dose regimens or
formulations

10
20
30
40
50
60
70
80
90
100
1 10 100 1000 3000
Concentration (ng/ml)
EC50=3
Concentration-Response Relationships for Different Quasispecies

10
20
30
40
50
60
70
80
90
100
1 10 100 1000 3000
Concentration (ng/ml)
EC50=3
Concentration-Response Relationships for Different Quasispecies
0
8
16
24
Do
sing
T
imes

10
20
30
40
50
60
70
80
90
100
1 10 100 1000 3000
Concentration (ng/ml)
EC50=3
Concentration-Response Relationships for Different Quasispecies
0
8
16
24
Do
sing
T
imes
99%Inhibition @ trough
(Note that the overall antiviral response is the integrated response over time)

10
20
30
40
50
60
70
80
90
100
1 10 100 1000 3000
Concentration (ng/ml)
EC50=3
Concentration-Response Relationships for Different Quasispecies
0
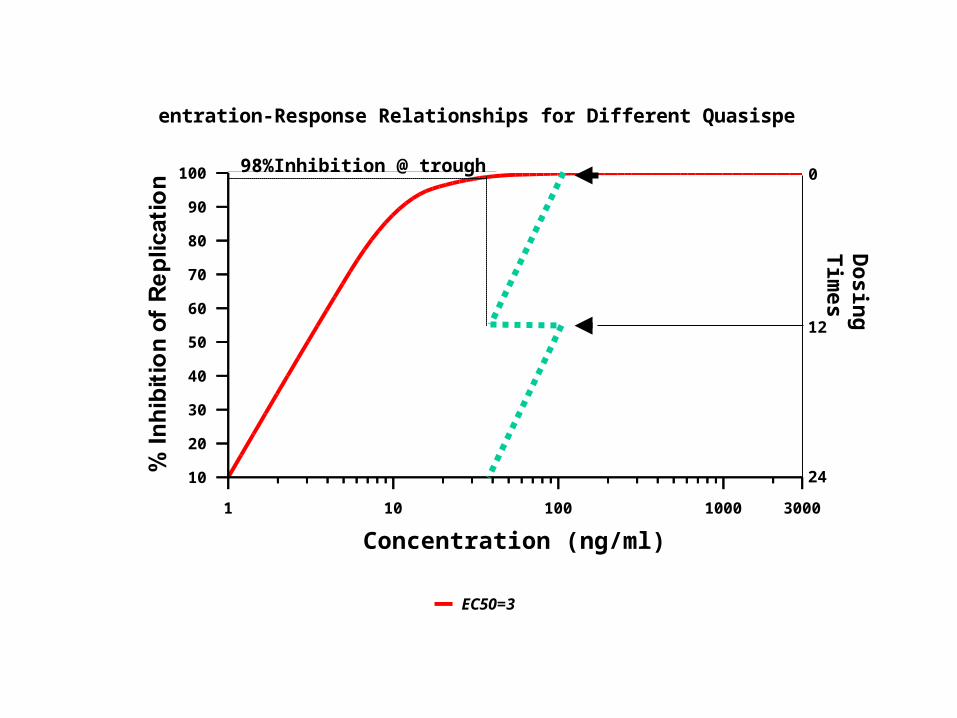
12
24
Do
sing
T
imes
10
20
30
40
50
60
70
80
90
100
1 10 100 1000 3000
Concentration (ng/ml)
EC50=3
Concentration-Response Relationships for Different Quasispecies
0
12
24
Do
sing
T
imes
98%Inhibition @ trough

10
20
30
40
50
60
70
80
90
100
1 10 100 1000 3000
Concentration (ng/ml)
EC50=3
Concentration-Response Relationships for Different Quasispecies
0
24
Do
sing
T
imes
10
20
30
40
50
60
70
80
90
100
1 10 100 1000 3000
Concentration (ng/ml)
EC50=3
Concentration-Response Relationships for Different Quasispecies
0
24
Do
sing
T
imes
96%Inhibition @ trough
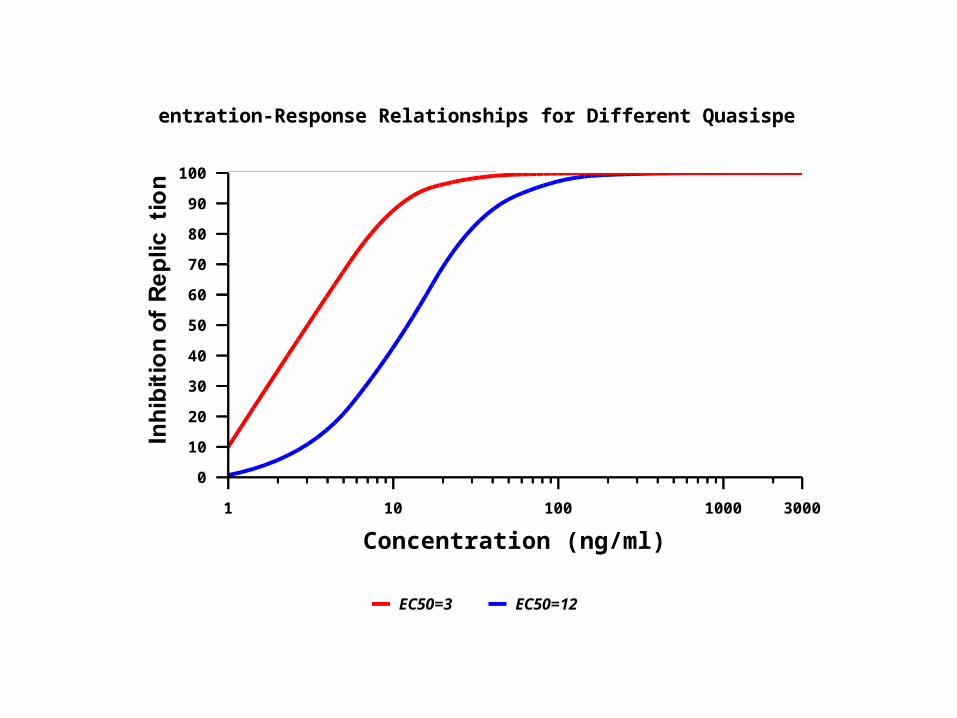
0
10
20
30
40
50
60
70
80
90
100
1 10 100 1000 3000
Concentration (ng/ml)
EC50=3 EC50=12
Concentration-Response Relationships for Different Quasispecies
0
10
20
30
40
50
60
70
80
90
100
1 10 100 1000 3000
Concentration (ng/ml)
EC50=3 EC50=12
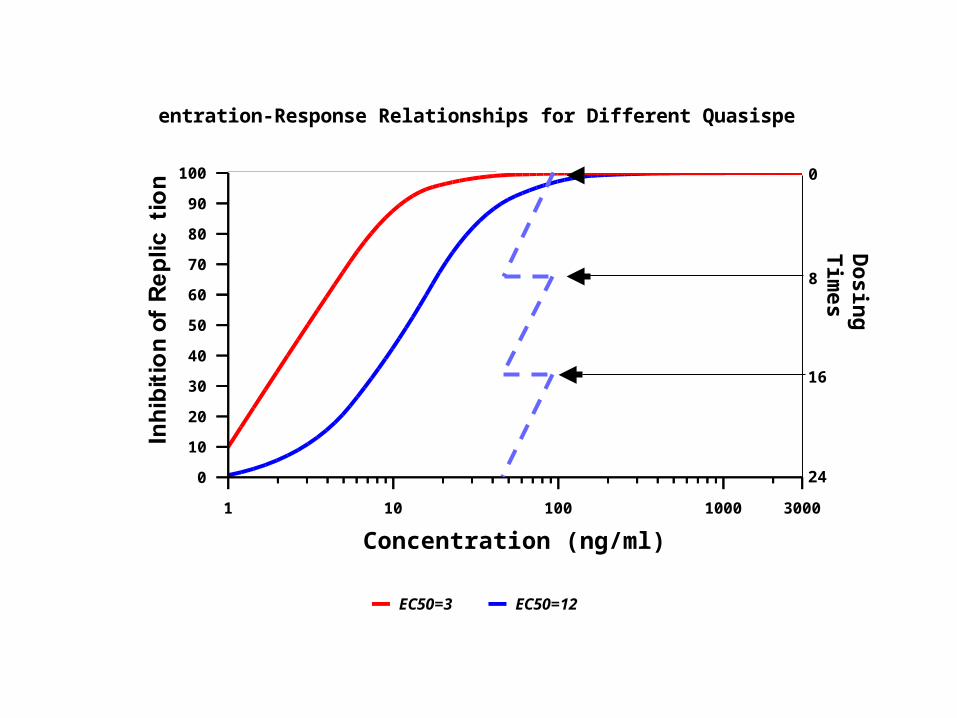
Concentration-Response Relationships for Different Quasispecies
0
8
16
24
Do
sing
T
imes
0
10
20
30
40
50
60
70
80
90
100
1 10 100 1000 3000
Concentration (ng/ml)
EC50=3 EC50=12
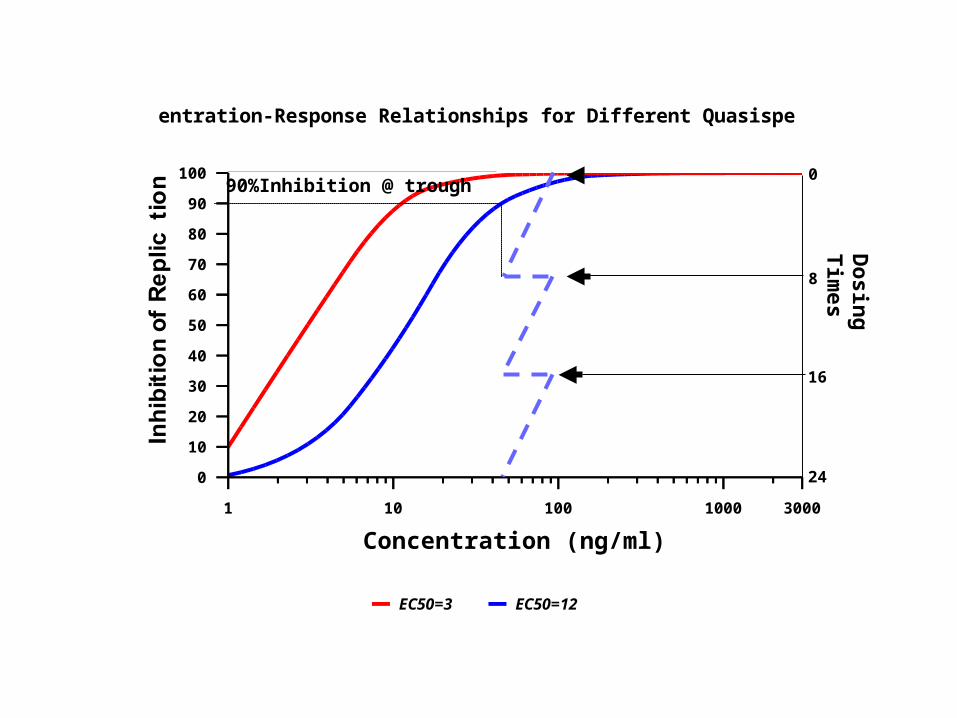
Concentration-Response Relationships for Different Quasispecies
0
8
16
24
Do
sing
T
imes
90%Inhibition @ trough

0
10
20
30
40
50
60
70
80
90
100
1 10 100 1000 3000
Concentration (ng/ml)
EC50=3 EC50=12
Concentration-Response Relationships for Different Quasispecies
0
12
24
Do
sing
T
imes

0
10
20
30
40
50
60
70
80
90
100
1 10 100 1000 3000
Concentration (ng/ml)
EC50=3 EC50=12
Concentration-Response Relationships for Different Quasispecies
0
12
24
Do
sing
T
imes
85%Inhibition @ trough

0
10
20
30
40
50
60
70
80
90
100
1 10 100 1000 3000
Concentration (ng/ml)
EC50=3 EC50=12
Concentration-Response Relationships for Different Quasispecies
0
24
Do
sing
T
imes

0
10
20
30
40
50
60
70
80
90
100
1 10 100 1000 3000
Concentration (ng/ml)
EC50=3 EC50=12
Concentration-Response Relationships for Different Quasispecies
0
24
Do
sing
T
imes
72%Inhibition @ trough

PK/PD modeling for AIDS: Where do we stand today?
• PK models for antivirals are generally well-defined
• Several good models of viral dynamics have been developed
• For PIs and NNRTIs, plausible mechanistic relationships between drug concentrations in plasma and inhibition of viral replication have been proposed
• Although simulations using full, mechanistic PK/PD models are consistent with observed data, the robustness of such models in a variety of settings and dosing regimens has not yet been demonstrated
• It is too soon to conclude that PK/PD modeling can substitute for confirmatory trials
General PK/PD modeling: Where do we stand today?

• Continue to improve and refine mechanistic PK/PD models, using in vitro and in vivo data– for individual drugs, in vitro data needs to be
related to in vivo data, including the effect of protein binding, early in development when monotherapy data are being generated
• Generate concentration-response data in early development
PK/PD modeling: Where do we go from here?
• Use PK/PD models to plan trials, limiting dosing regimens and drug combinations to those likely to demonstrate acceptable efficacy/toxicity, and be robust to non-adherence
• Measure adherence as part of the trial
PK/PD modeling: Where do we go from here?
• Consider whether PK/PD modeling based on short term (e.g., 24 weeks) studies can be used as surrogate evidence of long term efficacy– Differences in outcome between 24 and 48
weeks are more likely due to non-adherence rather than regimen failure (use-effectiveness vs. method effectiveness)
PK/PD modeling: Where do we go from here?
Related Documents