FUSION OF STEREOGRAMMETRIC AND INSAR DATA FOR ADVANCED TOPOGRAPHIC MODELLING IN ARCTIC DESERTS Gerhard Brandstätter, Graz University of Technology, Austria Aleksey I.Sharov, Moscow State University of Geodesy and Cartography, Russia E-mail: [email protected] and [email protected] KEYWORDS: Stereophotogrammetry, Stereophotometry, Radar Interferometry, Data Fusion ABSTRACT This paper describes the first stage of a study aiming to evaluate the potential and limitations of stereophotogrammetric and INSAR data for detailed topographic research in arctic deserts. Several different image processing techniques, including digital stereoplotting with Russian spaceborne KATE-200 photographs, photometric segmentation of stereophotographs and ERS-1/2-SAR interferogram differencing, have been tested and practically applied for topographic modelling of several large ice caps in the Franz Josef Land archipelago, Russian High Arctic. The stereophotographic, stereophotometric and interferometric data obtained were merged for the purpose of intercomparative analysis, quality control and methodological developments. Several new methodological variants of image processing have been proposed for the enhanced reconstruction of the ground surface in a relatively flat glacier terrain. The results of relative accuracy analysis are discussed. 1. INTRODUCTION One-sixth of the land area of the globe, i.e. over 23 million square kilometres belong to the regions of “cold deserts” characterised by perpetual ice and snow cover, intense cold and negligible pioneer vegetation in stony and sandy “oases” during the short summer season. In secluded archipelagos of the European Arctic sector poleward of latitude 75°N, the physiographic zone of arctic deserts occupies nearly 59,000 km², which accounts for about 0.6% of the European “terra firma”. This immense inaccessible and inhospitable tract of insular land remains, nowadays, the largest “white spot” in our basic topographic knowledge on the “Old World”. The monotonous landscape of arctic deserts with mostly homogeneous glacial topography, generally uniform land cover and invariably high reflectance properties is subject to rapid changes due to the impact of wind, ice and water, and is regarded as a very problematic object for detailed topographic studies by conventional means (Figure 1). The accuracies of stereophotogrammetric modelling via aerial photographs and/or satellite optical imagery, especially the vertical accuracy of measurements and contouring in extensive glacial areas usually do not meet standard demands (Konecny 1966, 1996). Precise photogrammetric processing of optical imagery is mostly hampered by the high albedo of glacial landscapes, shadows obscuring details, and the lack of reliable ground control. Featureless zones and an almost complete lack of visible contrast render image processing extremely difficult. Often not even visual tiepointing over large polar ice caps and domes can be performed in optical imagery or radar scenes. The automatic procedures of radiometric correlation used for image matching and DEM generation in glacial areas generally yield even more unsatisfactory results since “there is nothing to correlate”. Methods of satellite radar SAR-interferometry (INSAR) provide a new tool to study the detailed topography and environmental changes over prominent ice sheets in the High Arctic. This tool is especially applicable to the detailed topographic study of barren landscapes with a relatively flat topography, and it is generally accepted that the INSAR method is capable of playing a key role in polar remote sensing. It was reported, for example, that a relative elevation accuracy on the order of 2.5 m and an absolute accuracy of about 4 m could be achieved over extensive glacier sheets with ERS-1- SAR repeat-pass interferometry (Joughin et al. 1996). Relevant data on accuracies of polar topographic interferometry, however, are still very sparse and represent rather modest results, which were sometimes achieved without any reliable ground control. The real applicability of this technique for reliable operational topographic modelling in the European High Arctic has yet to be tested in practice in order to be able to define the most efficient way of using INSAR data.

Welcome message from author
This document is posted to help you gain knowledge. Please leave a comment to let me know what you think about it! Share it to your friends and learn new things together.
Transcript
FUSION OF STEREOGRAMMETRIC AND INSAR DATA FOR ADVANCEDTOPOGRAPHIC MODELLING IN ARCTIC DESERTS
Gerhard Brandstätter, Graz University of Technology, AustriaAleksey I.Sharov, Moscow State University of Geodesy and Cartography, Russia
E-mail: [email protected] and [email protected]
KEYWORDS: Stereophotogrammetry, Stereophotometry, Radar Interferometry, Data Fusion
ABSTRACTThis paper describes the first stage of a study aiming to evaluate the potential and limitations ofstereophotogrammetric and INSAR data for detailed topographic research in arctic deserts. Several differentimage processing techniques, including digital stereoplotting with Russian spaceborne KATE-200photographs, photometric segmentation of stereophotographs and ERS-1/2-SAR interferogram differencing,have been tested and practically applied for topographic modelling of several large ice caps in the FranzJosef Land archipelago, Russian High Arctic. The stereophotographic, stereophotometric and interferometricdata obtained were merged for the purpose of intercomparative analysis, quality control and methodologicaldevelopments. Several new methodological variants of image processing have been proposed for theenhanced reconstruction of the ground surface in a relatively flat glacier terrain. The results of relativeaccuracy analysis are discussed.
1. INTRODUCTION
One-sixth of the land area of the globe, i.e. over 23million square kilometres belong to the regions of“cold deserts” characterised by perpetual ice andsnow cover, intense cold and negligible pioneervegetation in stony and sandy “oases” during theshort summer season. In secluded archipelagos ofthe European Arctic sector poleward of latitude75°N, the physiographic zone of arctic desertsoccupies nearly 59,000 km², which accounts forabout 0.6% of the European “terra firma”. Thisimmense inaccessible and inhospitable tract ofinsular land remains, nowadays, the largest “whitespot” in our basic topographic knowledge on the“Old World”.
The monotonous landscape of arctic deserts withmostly homogeneous glacial topography, generallyuniform land cover and invariably high reflectanceproperties is subject to rapid changes due to theimpact of wind, ice and water, and is regarded as avery problematic object for detailed topographicstudies by conventional means (Figure 1). Theaccuracies of stereophotogrammetric modelling viaaerial photographs and/or satellite optical imagery,especially the vertical accuracy of measurementsand contouring in extensive glacial areas usually donot meet standard demands (Konecny 1966, 1996).Precise photogrammetric processing of opticalimagery is mostly hampered by the high albedo ofglacial landscapes, shadows obscuring details, andthe lack of reliable ground control. Featureless
zones and an almost complete lack of visiblecontrast render image processing extremelydifficult. Often not even visual tiepointing overlarge polar ice caps and domes can be performed inoptical imagery or radar scenes. The automaticprocedures of radiometric correlation used for imagematching and DEM generation in glacial areasgenerally yield even more unsatisfactory resultssince “there is nothing to correlate”.
Methods of satellite radar SAR-interferometry(INSAR) provide a new tool to study the detailedtopography and environmental changes overprominent ice sheets in the High Arctic. This tool isespecially applicable to the detailed topographicstudy of barren landscapes with a relatively flattopography, and it is generally accepted that theINSAR method is capable of playing a key role inpolar remote sensing. It was reported, for example,that a relative elevation accuracy on the order of 2.5m and an absolute accuracy of about 4 m could beachieved over extensive glacier sheets with ERS-1-SAR repeat-pass interferometry (Joughin et al.1996). Relevant data on accuracies of polartopographic interferometry, however, are still verysparse and represent rather modest results, whichwere sometimes achieved without any reliableground control. The real applicability of thistechnique for reliable operational topographicmodelling in the European High Arctic has yet to betested in practice in order to be able to define themost efficient way of using INSAR data.

Several recent publications devoted to INSARtopographic applications attest to the expedience offusion with other image data, preferably from theoptical range. To our knowledge the subject ofcombining INSAR image data with opticalstereoimages was first mentioned in a report by theFrench scientists L.Renouard, F.Perlant and P.Noninin 1993, who focussed on the generation of digitalelevation models (DEMs) in the French Alps. Theimpact of stereo SPOT and INSAR data fusion onthe reliability, completeness and integrity oftopographic modelling in the framework of theORFEAS (Optical-Radar sensor Fusion forEnvironmental ApplicationS) action has beendiscussed in (Crosetto & Crippa 1998). By mergingSAR and multispectral image data the accuracy ofland use classification can be significantly improved(Hellwich 1999). Experiments in the past haveshown the combined use of stereographic andmicrowave data to be very expedient for advancedtopographic modelling in mountainous and hillyareas with significant slopes, where the radarimagery is subject to layover, shadowing and othertopographic effects (Small et al. 1996).
While other studies used stereogrammetric andinterferometric data fusion in order to improve theresults of topographic interpretation and to completeobscured areas, we applied this approach mostly tomethodological tests, accuracy control and thedetermination of general relations betweenstereogrammetric and interferometric methods ofimage analysis. In contrast to previousinvestigations we concentrated on mergingstereographic and interferometric data for theenhanced reconstruction of the ground surface in
relatively flat terrain. Several different techniques,including• digital stereoplotting with Russian aerial and
spaceborne KATE-200 photographs;• stereophotoclinometry, a new technique based
on photometric segmentation for imageprocessing under low optical contrast;
• ERS-1/2-SAR interferogram differencingwere practically applied to the detailed topographicmodelling of several large ice caps in the FranzJosef Land archipelago (FJL), Russian High Arctic.Several original methodological variants of datafusion were specially designed to ensure thecombination and comparison of the resultant datasets with one another and with available groundcontrol data.
2. DATA PREPARATION
Four spaceborne stereophotographs obtained at anoriginal scale of 1:1,250,000 by a KATE-200 filmcamera (1st spectral channel, 635-690 nm,photogrammetric focal length of 201.342 mm), 9complex ERS-1/2-SAR images constituting 5INSAR image pairs, and 8 old aerial photographstaken over the same territory were collected forbasic experimental investigations (Table 1).Besides, several high-resolution spacebornestereoscopic photographs acquired over FJL byRESOURCE-F1, KFA-1000 and CORONA, KH-4(A) systems as well as 2 precision ERS-1 radarscenes were used for the identification of groundcontrol and check points. All necessary cartographicmaterials and ground-truth data were also available.
Figure 1. Typical glacial landscape in the High Arctic, Russkiy Ice Cap, Franz Josef Land

To provide high-resolution, high-quality digitalimage input for computer-based processing theanalog image set was digitised at the VEXCEL3000Image Scanning System with a maximum attainablespatial resolution of 1,250 and 2,500 dots per inch(DPI) so that pixel sizes were 20 and 10 microns,respectively. The spatial resolution of digitisedimages was principally chosen to avoid anygeometric loss and to ensure that the digitalimagery used for joint analysis is of similar scale,resolution and size. For instance, KATE-200photographs from the first spectral band digitisedwith a spatial resolution of 1,250 DPI offer aground resolution of about 25 meters, which issimilar to that of ERS-1/2-SAR imagery. Thus,comparable detailedness of image input can beachieved. Several old aerial photographs werescanned with a spatial resolution of 300 and 600DPI in order to perform comparative accuracy tests.Practical image processing was performed using theADOBE Ph.5.0, ENVI 3.0, PHOTOMOD 1.6 andRSG 3.21 software packages.
In order to reduce the processing time, we did notdigitise the entire imagery, but only the fragmentscorresponding to the test sites. In our case the mostinteresting test sites with different types of glacialcover and some ice-free areas comprise three largeislands, namely Ziegler Island with a total land areaof 404.0 km² and a maximum elevation of 554 ma.s.l., Becker Island (37.5 km² and 165 m) andKane Island (23.5 km² and 282 m). In total, 6digital fragments from KATE-200 imagery and 8fragments from aerial photographs were prepared.The largest fragment depicting Ziegler Island withsurrounding areas in the central part of FJL coversan area of 37 x 44 square kilometres.
2. DIGITAL STEREOPLOTTING WITHKATE-200 PHOTOGRAPHS
KATE-200 stereoscopic image fragments served asa basis for photogrammetric precision modellingand complete three-dimensional vectorisation of thetopography in test areas, including consistent
contouring at 1:100,000 scale. For the major part ofthe study region a contour interval of 50 meters waschosen for solid contours, which should not besmaller than about three to five times the rms (rootmean square error) height accuracy (Leberl 1989).The highest elevation in the region is 554 meters,which means that a total of 12 contour layers,including the shoreline, had to be vectorised.
Contouring in homogeneous glacial areas combinedwith local topographic interpretation did not bringabout the difficulties we had expected and actuallywas even more convenient than contouring in rockyareas affected by shadows. However, it was verycomplicated and often impossible to performcontouring in relatively flat and homogeneousterrain at the top of the largest ice domes, which arecharacterised by very high visible albedo and littleimage contrast. Nevertheless, the localinterpretation of KATE-200, KFA-1000 andCORONA images allowed the precise location ofthe 27 highest positions within the accumulationarea of the glacier to be determined. Theirphotogrammetric elevations were defined withrespect to the current sea level. Due to the manualdrawing mode contouring was a relatively time-consuming process and took several weeks,including preparations and corrections.
A satellite basic contour map of Ziegler Island withsurrounding areas was printed in six colours at1:100,000 scale in conformal Gauss projection,which is the usual scale for Russian topographicmaps. Contour lines representing elevations of 200and 400 meters were rendered in darker colours anddepression contours were marked by dashes. Theelevations given were compiledphotogrammetrically with respect to the currentlevel of the Barents Sea. It should be noted that themean effect of tidal forces in FJL does not exceed20 to 30 cm and can thus be neglected. Differentkinds of shorelines are presented: ice-free and icyshores, precipitous and sloping, steady andchanging banks. A small-size black and white copyof this map is given in Figure 2.
Table 1. Description of available remote sensing data
System Image type, frame No. Date/time of survey GMT Base, m/resolution, m QuantityKATE-200 Multispectral stereoph. (B),
0218, 0219, 0277, 027828.08.93, 07.09.93/ 10:25 90,000 / 18.8 – 24 4
ERS-1/2-SAR
SLC, PRI*1935, 1953
28.08.93 / 09:203/4.09.95, 8/9.10.95 / 09:11
49 - 245 / 40- /25 – 30*
92*
AFA-TE100 Stereoph. 5950-53, 4754-57 08.05.53, 21.08.53 2,000 / 0.7 (5 digit.) 8

Figure 2. Result of stereoplotting with KATE-200 images at 1:100,000 original scale
050
100150200250300350400
0 5 7 8 10 11 13 15 19 25 28 34 38 40 44 49 55 59 62 64 66 68 70 72 74 76
Distance in mm at 1:100,000 scale
Elevation, m
Elevation, m 1:100000Elevation, m 1:200000
Figure 3. Transverse profiles across the ice cap derived from traditional and satellite map
Table 1. Results of vertical accuracy test
Control method Mean difference, m RMS, mCheck points (27) - 1.30 ± 15.5Check profiles (3) - 4.23 ± 17.1

The vertical accuracy of the contour base map ofZiegler Island was checked by comparing 27elevations determined photogrammetrically withrespect to the current sea level with those given inavailable topographic maps at 1:100,000 and1:200,000 scales in relation to the multiyear meansea level. Several control elevations related to themultiyear mean sea level were derived from thecatalogue of geodetic and navigation spots. Theroot mean square difference betweenphotogrammetrically derived spot elevations andthose given in available cartographic documents didnot exceed 15.5 meters. The results of the verticalaccuracy test are given in Table 1. The horizontalaccuracy of the map was estimated at −
+ 25 m rms.
Moreover, contours and spot elevations werechecked by means of the profile method, which isbased on comparing profiles established inavailable and newly produced maps directly acrossthe largest ice cap on Ziegler Island. Two of theprofiles compared are given in the next graph. Thecomparison between the profile derived from theavailable 1:200,000 map with a contour interval of40 meters and the one established in the satellitemap with a 50 m contour interval shows significantelevation differences of several tens of meters, inparticular on the right side of the graphcorresponding to the northern slope of the ice cap.Apart from the inaccuracies of stereoplotting,which increase in areas affected by shadows (as canbe seen on the right side of the graph), someelevation differences might be caused by glacialchanges. The mean difference between thecompared contour values is given as - 4.23 m andthe rms difference is −
+ 17.1 m.
Generally speaking, the values obtained are wellwithin the accuracy standard and even surpasstheoretically expected accuracies. However, at avery gentle slope of about 1°, which is typical ofthe majority of glacier tops in the FJL archipelago,the vertical inaccuracy of 17 meters will result in acontour line horizontally displaced from the trueposition by about 980 meters. No intermediatecontours, e.g. at a contour interval of 25 m, couldbe traced additionally for better height reproductionin these low-contrast areas. Therefore, relativelylarge tracts of ice at glacier tops up to 10 km² insize were not traced at all. Thus, neither accuracynor completeness of topographic modelling athomogeneous glacier tops could meet the standardrequirements for precise DEM generation. One
possible solution to this problem is given in thenext section.
3. PHOTOMETRIC SEGMENTATION –A SUBSIDIARY TOOL FOR GLACIER
SURFACE MODELLING
Due to the limited capabilities of human vision,subtle differences in image brightness cannot bedirectly perceived in homogeneous areas at glaciertops. These variations, depending on the surfacetopography, land cover, illumination and viewinggeometry, usually exist and can be detected if theimage is not affected by sensor oversaturation.Under some assumptions we may suggest that, inhomogeneous areas with uniform albedo, a lineconnecting the image points of equal brightness“belongs” to the glacier surface. Thus, a set of suchisolines could additionally facilitate the reliablerepresentation of the surface.
The desired set of isolines can be effectivelyproduced by means of photometric segmentation ofoptical images. The simplest equidistantsegmentation consists in converting an originalgrey scale image to an indexed-colour image with alimited number of grey levels (fewer than 256). Theresultant “stepped” image is composed of areas ofconstant brightness and characterised by the steadybrightness difference between adjacent areas. Theprocedure of high-pass filtering transforms such anindexed-colour image into a system of isolines.
By manipulating the pixel depth of an originalimage between 3 to 8 bits/pixel the rate of isolinescan be varied while maintaining the visual qualityrequired. Greater pixel depth means a higher rate ofisolines and a smaller brightness differencebetween neighbouring lines. Figure 4, a) illustratesthe result of photometric segmentation of a KATE-200 image fragment (4 bits/pixel) and, in contrast toFigure 2, shows a number of new elements at thetop of an ice cap. Isolines can be hardly detected inice-free and shadowed areas.
The preeminent orientation of isolines in Figure 4,a) is perpendicular to the along-sun directionmarked by the V symbol, and it can be seen that thedensity of isolines per unit area increases at largerslopes. The rate of isolines on the direct(illuminated) slope of an ice cap is lower than onthe opposite side. In our case the camera movementnearly coincided with the along-sun direction andthe isolines drawn on the KATE-200 image paircan be observed stereoscopically. The stereoscopic

viewing of isolines is distorted in the areas withinhomogeneous albedo, such as areas of wet snow,blue and superimposed ice, crevasses etc.
K.M.Lee and C.J.Kuo, who investigated thestereophotometric approach to the reconstruction ofthe simplest shapes and the shape-from-shadingmethod, showed that the image brightness in aphotometric ratio between two images of the sameobject is only a function of the surface normal (Lee& Kuo 1996). We suppose that the same holds forthe stereophotographic surveying of ice caps in FJLand that the photometric ratio between twostereoscopic KATE-200 images may be
successfully used for the correct and consistentrepresentation of the glacier surface in areas withgentle slopes. That is why the isolines determinedin the photometric ratio image were calledisoclinals. Of course, isoclinals are not contourlines and cannot be directly incorporated into aDEM. In order to verify the correspondencebetween the isolines obtained by traditionalstereoplotting and those resulting from our newapproach, the set of isolines derived bysegmentation of the photometric ratio was directlymerged with the contour plot shown in Figure 2.The result of fusion is shown in Figure 4, b.
a) b)
Figure 4. The result of photometric segmentation of KATE-200 image (a);fusion of a) with the contour plot (b).
The combination shows very good correspondencebetween data sets, which can be seen very wellalong the ice divide of the glacier. The conformityin position of the contour plot with photometricfeatures was verified by means of 10 checkpoints.The rms error in the plotted position of checkpoints(marked by • ) with respect to the “central”(highest) isocline was evaluated as being less than± 34 m, which corresponds to a relative height errorof less than 1 meter. We assume that our newapproach based on automatic procedures ofphotometric image analysis is capable of providinghigher accuracy than traditional stereoplotting inglacial areas. However, further investigations arerequired to verify the absolute accuracy ofstereophotometric modelling and define the basicprinciples and limitations of the new method calledstereophotoclinometry. The concept of optical flow,i.e. changes of object brightness in successiveimages due to camera movement (Horn 1989), andrelated topics could provide valuable informationessential to understanding the problem.
There is a very interesting methodological variantof photometric segmentation, which should also bestudied in detail. It is based on the use of ditheringfunctions for the representation of the indexed-colour image with a reduced number of colours.Dithering mixes the pixels of the available greylevels to simulate the missing shades of grey. If thediffusion dithering function is applied, the high-
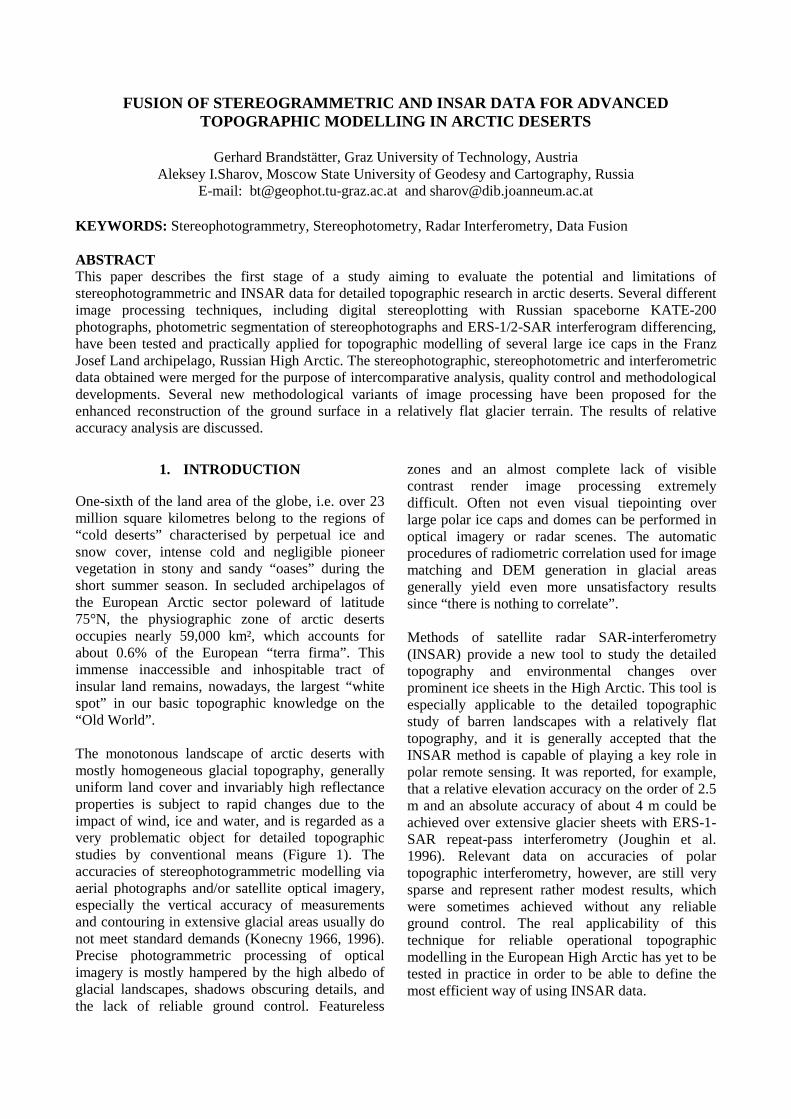
pass filtering of the indexed-colour image results ina fringe pattern, which can be considered as aquasi-interferogram showing some valuableproperties essential to real interferograms. Thefringe rate in the optical fringe pattern can be easilychanged as explained above. However, increasingthe fringe rate decreases the visibility of fringes.Optical fringe patterns for Suvorov Ice Cap onBecker Island and the northeastern part of ZieglerIsland (ice caps Nos. 26, 27, 28) are shown inFigures 5, c) and 7, b), respectively.
Such a product allows for a more reliableinterpretation of different glacial zones, includingthe belt of superimposed ice and slush areas, icedivides and ice shores. Certain elements of glacialtopography also look more prominent in the fringepattern. For example, a small river in the left part ofthe ice cap, as shown in the topographic map(Figure 5, d), is well detectable in the fringepattern, but could not be reliably detected in optical(Figure 5, a) or radar imagery (Figure 5, b).Besides, the practical implementation of such anapproach provides certain evidence on thesimilarity between the stereophotogrammetric,stereophotometric and interferometric method ofimage analysis, which means that some stratagemsused in radar interferometry, e.g. interferogramdifferencing, could be applied to streophotographicimage processing.
a) b)
c) d)
Figure 5. Suvorov Ice Cap, Becker Island on KATE-200 image (a), precision ERS-1-SAR image (b), opticalfringe pattern (c), Russian topographic map at 1:200,000 scale (d).

4. INSAR DATA PROCESSING
Previous studies using interferometric ERS-1/2-SAR image data were recently carried out with theaim to further increase the correctness, detailednessand consistency of topographic modelling in theFJL archipelago (Brandstaetter & Sharov 1998).Main emphasis has been put on the differentialapproach to repeat-pass INSAR data processingbased on linear combination of the two originalinterferograms generated from different SAR imagepairs of the same area.
The basic principle of differential interferometrystates that the proper linear combination of originalinterferograms results in a new secondaryinterferogram. In the resultant interferogram, thewidth and rate of fringes depends on the value ofthe virtual (equivalent) baseline Bv, which in turndepends on the kind of mathematical operationapplied to the combination of originalinterferograms. The combination can be done so
that the height interval corresponding to oneinterferometric fringe will exceed the maximumelevation in a region. Then the number of fringesenclosed between the lowest and the highest pointsin the area will be smaller than one and larger thanzero. In a “single fringe interferogram”, theinterferometric phase can be unambiguously relatedto topographic height on a pixel-by-pixel basis.Since the single-fringe interferogram provides amore or less realistic view of the terrain, it issometimes reffered to as topogram.
The practical generation of a single-fringeinterferogram can be accomplished either bycombining two original interferograms withdifferent baselines or by differentiating between theprimary interferogram and a phase filter, i.e.simulated interferogram with straight fringes beingperpendicular to the range direction. Severalvariants of linear combinations between ERS-1/2-SAR interferograms are illustrated in Figure 6.
a)
b)
c)
����
Figure 6. Linear combinations: between two original interferograms of Kane Island (a), between twointerferograms of Kane Island after FTP correction (b), between one original interferogram of Becker Islandand a phase filter (c).
m130B 2 ≅ m53B 1 −≅m53B 1 −≅ m25B v ≅
The linear combination of interferograms may beperformed either before (Figure 6, a) or after(Figure 6, b) the “flat terrain phase” correction isperformed. The combinatorial approach is based onthe co-registration of interferograms, which must bedone with sub-pixel accuracy. However, the directcorrelation of wrapped fringe patterns is usuallyimpossible, which is why the correspondingcoherency images with the same geometry wereused to derive the parameters of co-registration.Besides, due to the contradiction between thedesirable spatial and temporal baselines, the fineadjustment of the virtual baseline is not alwayspossible.
The approach based on the use of a phase filterusually does not result in such complications andprovides a more flexible solution to the phaseunwrapping problem. The approximate width offringes in the phase filter can be derived from theequations given in (Brandstaetter & Sharov 1999).The fine adjustment of the filter can be performediteratively by changing the filter scale. Theadditional difficulties brought about by narrow“traces” from the edges of fringes, which can beseen in our topograms (Figure 6, b, c), are,however, more prominent, if a phase filter with ahigher rate of fringes is applied.
Besides, it is to be noted that in some cases wewere not able to perform full phase unwrapping forhigh islands. While phase unwrapping of the fringeimage was possible in the relatively low areas, thiswas not always the case in the glacier terrain withrather steep slopes. In available interferograms, thecritical elevation corresponds to a height of about300 meters a.s.l. Nevertheless, the highest positionsof several of the largest ice caps, including sevenglacier tops at Ziegler Island, were defined andcompared with those given in the KATE-200stereophotographic plot. The highest positions onice caps were recognized by detecting extremepixel values in the fringe image in the vicinity ofthe presumed summit.
5. MERGING STEREOGRAMMETRIC ANDINTERFEROMETRIC DATA
Interesting results were obtained by merginginterferometric imagery with the graphic layerobtained by stereoplotting from KATE-200photographs. The rectified KATE-200 digital imagehas a ground pixel size of 25 meters, and ERS-1/2-INSAR image data acquired over the same area
could be registered to the optical image, since theyhave similar ground resolutions. However, directfusion of these heterogeneous image data did notproduce the desired results. Significant difficultieswere brought about by the different appearance ofslant-range INSAR scenes and optical images withdifferent geometry.
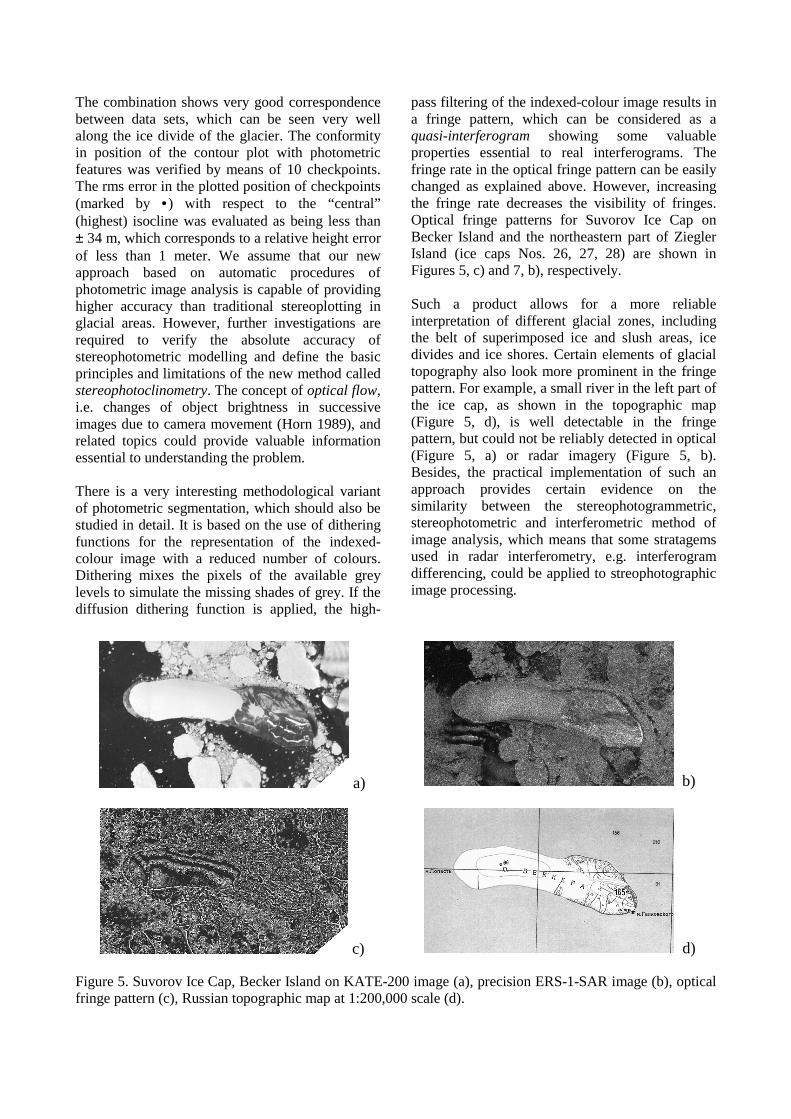
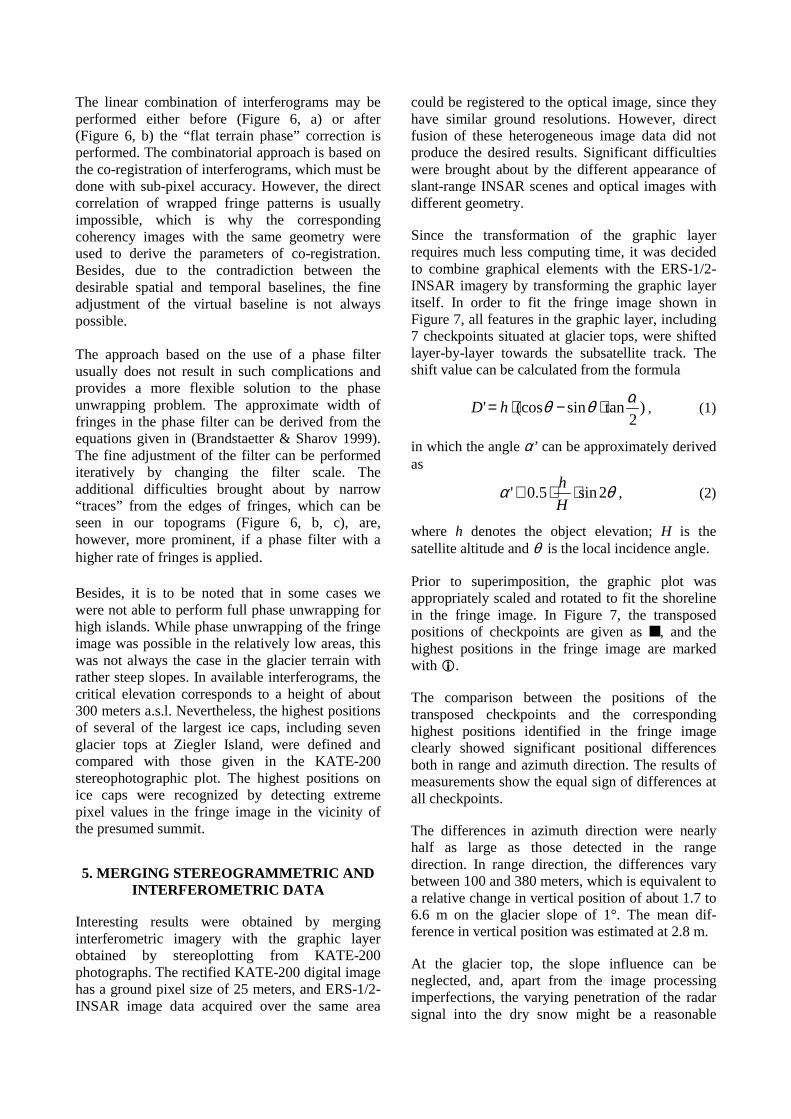
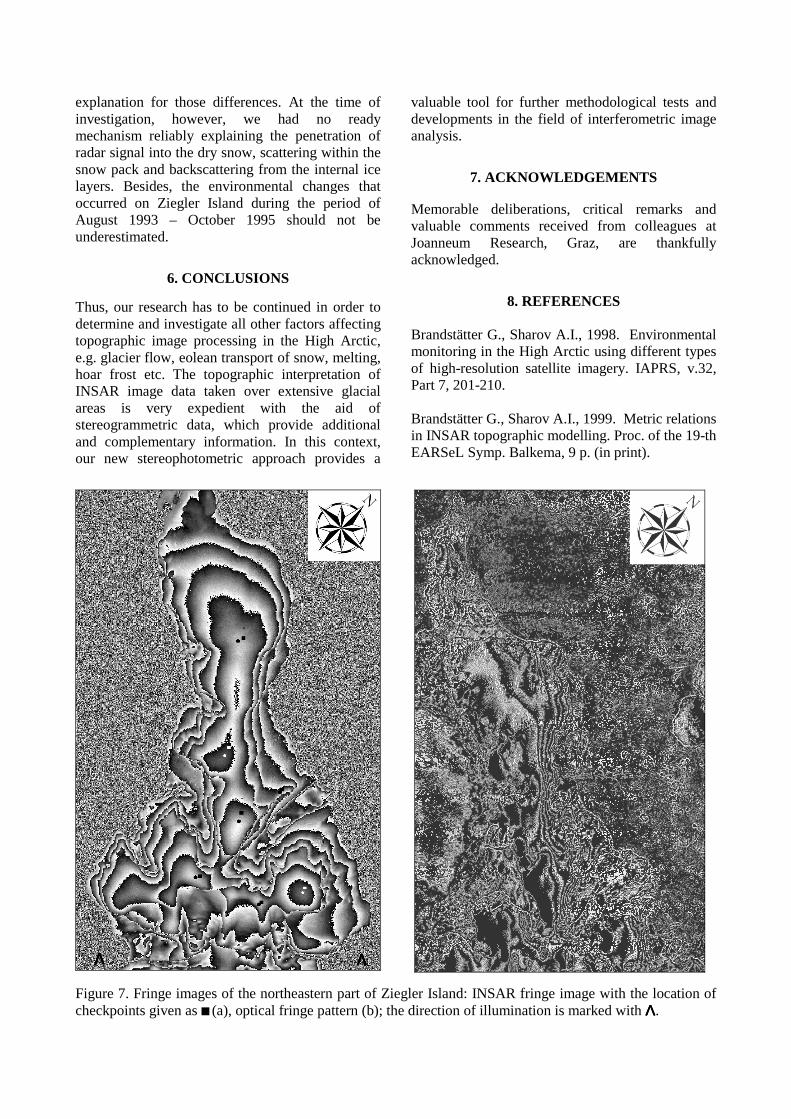
Since the transformation of the graphic layerrequires much less computing time, it was decidedto combine graphical elements with the ERS-1/2-INSAR imagery by transforming the graphic layeritself. In order to fit the fringe image shown inFigure 7, all features in the graphic layer, including7 checkpoints situated at glacier tops, were shiftedlayer-by-layer towards the subsatellite track. Theshift value can be calculated from the formula
)2
tansin(cos' αθθ ⋅−⋅= hD , (1)
in which the angle α’ can be approximately derivedas
θα 2sin5.0' ⋅⋅≅Hh
, (2)
where h denotes the object elevation; H is thesatellite altitude and θ is the local incidence angle.
Prior to superimposition, the graphic plot wasappropriately scaled and rotated to fit the shorelinein the fringe image. In Figure 7, the transposedpositions of checkpoints are given as ■ , and thehighest positions in the fringe image are markedwith �.
The comparison between the positions of thetransposed checkpoints and the correspondinghighest positions identified in the fringe imageclearly showed significant positional differencesboth in range and azimuth direction. The results ofmeasurements show the equal sign of differences atall checkpoints.
The differences in azimuth direction were nearlyhalf as large as those detected in the rangedirection. In range direction, the differences varybetween 100 and 380 meters, which is equivalent toa relative change in vertical position of about 1.7 to6.6 m on the glacier slope of 1°. The mean dif-ference in vertical position was estimated at 2.8 m.
At the glacier top, the slope influence can beneglected, and, apart from the image processingimperfections, the varying penetration of the radarsignal into the dry snow might be a reasonable
explanation for those differences. At the time ofinvestigation, however, we had no readymechanism reliably explaining the penetration ofradar signal into the dry snow, scattering within thesnow pack and backscattering from the internal icelayers. Besides, the environmental changes thatoccurred on Ziegler Island during the period ofAugust 1993 – October 1995 should not beunderestimated.
6. CONCLUSIONS
Thus, our research has to be continued in order todetermine and investigate all other factors affectingtopographic image processing in the High Arctic,e.g. glacier flow, eolean transport of snow, melting,hoar frost etc. The topographic interpretation ofINSAR image data taken over extensive glacialareas is very expedient with the aid ofstereogrammetric data, which provide additionaland complementary information. In this context,our new stereophotometric approach provides a
valuable tool for further methodological tests anddevelopments in the field of interferometric imageanalysis.
7. ACKNOWLEDGEMENTS
Memorable deliberations, critical remarks andvaluable comments received from colleagues atJoanneum Research, Graz, are thankfullyacknowledged.
8. REFERENCES
Brandstätter G., Sharov A.I., 1998. Environmentalmonitoring in the High Arctic using different typesof high-resolution satellite imagery. IAPRS, v.32,Part 7, 201-210.
Brandstätter G., Sharov A.I., 1999. Metric relationsin INSAR topographic modelling. Proc. of the 19-thEARSeL Symp. Balkema, 9 p. (in print).
Figure 7. Fringe images of the northeastern part of Ziegler Island: INSAR fringe image with the location ofcheckpoints given as ■ (a), optical fringe pattern (b); the direction of illumination is marked with ΛΛΛΛ.

Crosetto M., Crippa B., 1998. Optical and radardata fusion for DEM generation. IAPRS, v.32, Part4, pp.128-134.
Hellwich O., 1999. An alternative paradigm fordata evaluation in remote sensing using multisensordata fusion. Proc. of the IGARSS’99 Symposium, 3p. (in print).
Horn B., 1989. Robot vision. Moscow, Mir,488p.(in Russ).
Joughin I., Winebrenner D., Fahnestock M.,1996. Measurement of ice-sheet topography usingsatellite-radar interferometry. J. of Glac., v.42,No.140, 11-21.
Konecny G., 1966. Applications ofPhotogrammetry to Surveys of Glaciers in Canadaand Alaska. Canadian J. of Earth Sciences, v.3,No.6, p.783-798.
Konecny G.,1996.HochauflösendeFernerkundungssensoren für kartographischeAnwendungen in Entwicklungsländern.Photogrammetrie und Fernerkundung, Heft 2, p.39-51.
Leberl F., 1989 Radargrammetric imageprocessing. Artech House, L.-A., 595 p.
Lee K.M., Kuo C.J., 1996. Shape from photometricratio and stereo. J. of Visual Communication andImage Representation, 7(2), p.155-162.
Small D. et al., 1996. ERS-1/2 tandem mission.FRINGE Report to ESA, ESRIN, 11 p.
Related Documents