Int. J. Cancer: 33,389-398 (1984) FURTHER CHARACTERIZATION OF MAREK'S DISEASE VIRUS-INFECTED LYMPHOCYTES. I. IN VNO INFECTION B.W.CamK1,K.A. SCHAT',L.J.N.Ross2,W.R. S rn~~andC-L.H. cHEN4 'Department of Avian and Aquatic Animal Medicine, New York State College of Veterinary Medicine, Cornell University, Ithaca, NY 14853, USA. Houghton Poultry Research Station, Houghton, Huntingdon, Cambs., PEl7 2DA England; Charles River Breeding Laboratories, Inc., 251 Ballardvale St., Wilmington, M A 01887; and Departments of Pediatrics and Microbiology, University of Alabama in Birmingham, School of Medicine, Comprehensive Cancer Center Cellular Immunobiology Unit, University Station, A L 35294, USA. Previous reports from this laboratory identified bursa- derived lymphocytes (B cells) and non-B cells as the predo- minant cell types respectively involved in the early cyto- lytic and subsequent latent infection of chickens with Marek's disease virus (MDV). It was not known whether these differences were qualitative or quantitative or if the method for detection of latent infection (viral antigen pro- duction after 48 h of in viho cultivation) was sensitive enough. To further define the cells involved in the various phases of MDV infection, we used monoclonal antibodies which specifically react with B cells, o r T cells, or la-anti- gen-bearing cells. Dual fluorescencetests to detect surface markers and viral internal antigen (VIA) were conducted with infected spleen cells freshly collected from MDV-in- fected chickens or after in vihocultivation of those cells. The same antibodies were also used for a rosetting proce- dure to yield fractions enriched or depleted of T cells, B cells or la-bearing cells. These were examined directly for viral DNA by in situ hybridization or dot blot DNA hybridi- zation and for VIA cultivation. We learned that infected T cells alsocomprise part of the early cytolytic phaseof MDV infection but constitute a minority population (approxi- mately 2-3 %) compared to B cells (83-92 %) at 3 or 4 days post infection. Latently infected cells were definitively identified as mostly la-bearing T cells, although a few (2- 4%) were B cells. Prior to in vitro cultivation, latently infected cells apparently had insufflcient viral DNA for detection by in situ hybridization, but the more sensitive dot blot procedure revealed viral DNA in fractions later found positive by VIA expressionafter in vitrocultivation. Viral DNA replication in latently infected cells apparently had occured after 48 h cultivation because in situ hybridi- zation detected infected cells at that time. Treatment of cell cultures with iodo-deoxyuridine, 12- Qtetradecanoyl phorbol-13-acetate or n-butyrate failed to increase the number of spleen cells which expressed VIA. The pathogenicity of Marek's disease (MD), a natur- ally occurring herpesvirus-induced lymphomatous dis- ease of fowl, has been well defined in terms of sequen- tial events (Calnek, 1980). During the first 3-6 days after infection, an acute cytolytic infection of the pri- mary lymphoid organs (bursa of Fabricius, spleen, thy- mus) occurs. This is followed by a predominantly latent infection of lymphocytes which is persistent. Lympho- mas may subsequently develop in a proportion of in- fected chickens which varies according to factors such as genetic constitution, age at infection of the host, and isolate of MD virus (MDV). Lymphomas comprise a variety of lymphocytes and other cells. However, the constituent tumor cells have been identified as neoplastically transformed thymus- derived lymphocytes (T cells), based on characteriza- tion of continuous cell lines established from lym- phomas (Powell et al., 1974, Nazerian and Sharma, 1975; Matsuda et al., 1976; Calnek et al., 1978a). These cells are lymphoblastic in character and bear several recognizable surface antigens other than T-cell mark- ers, including Ia antigen, a Marek's disease tumor- associated antigen (MATSA) and embryonic antigen (Powell et al., 1974; Witter et al., 1975; Murthy et al., 1979; Schat et al., 1982). Shek et al. (1983) showed that bursa-derived lym- phocytes (B cells) were the predominant cell type in- volved in the early cytolytic infection with MDV in vivo and that subsequent latent infections were found most- ly in Ia-bearing non-B lymphocytes, presumably T cells. This fitted the pattern suggested by an earlier study by Schat et al. (1981a) in which embryonally bursectomized chickens, free of B cells, failed to ex- hibit early cytolytic MDV infection but did develop latent infection and tumors. Calnek et al. (1982) studied in vitro infection of spleen cells and learned that B cells were the major target of cytolytic infection in that system as well. At the time of those studies, avail- able methodology was not sufficiently precise to defini- tively rule out the possibility that T cells as well as B cells could be cytolytically infected with MDV. Fur- thermore, it could only be speculated that the latently infected non-B lymphocytes were in fact T cells. The availability of mouse monoclonal antibodies di- rected against T-cell and B-cell surface markers, or Ia antigen, prompted further characterization of both the cytolytic and latent phases of MDV infection in vivo. Data are presented to show that, whereas B cells and T cells are the predominant components of cytolytic and latent infections respectively, these are quantitative rather than qualitative differences. MATERIAL AND METHODS Experimental chickens Three- to 4-week-old chickens were obtained from specific-pathogen-free departmental flocks of genetic strains: N-2, P-2, UCD-003 and S-strain (Schat and Calnek, 1980; Schat etal., 1981b;Hutt and Cole, 1947). 5Abbreviations: B-cells = bursa-derived lymphocytes;DPI = days post infection; EBx = embryonallybursectomized; FA test = fluorescent antibody test; FITC = fluorescein isothio- cyanate; GARG-TRITC = goat IgG anti-rabbit Ig conjugated with rhodamine; HBSS = Hanks' balanced salt solution; IUdR = iododeoxyuridine; MAC la = mouse monoclonal anti-chicken Ia; MAC IgM = mouse monoclonal anti-chicken IgM (p chain); MAC T = mouse monoclonal anti-chicken T-cell; MD = Marek's disease; MDV = Marek's disease virus; MPBS = modified phosphate-buffered saline (PH 7.3) contai- ning 170 bovine serum albumin and 0.1 % sodium azide; PBS = phosphate-buffered saline (PH 7.3); PFU = plaque-forming units; RAM = rabbit IgG anti-mouse Ig (heavy and light chain); Staph A = staphylococcus protein A; T cells = thy- mus-derived lymphocytes; TPA = 12-0-tetradecanoyl phor- bol-13-acetate; VIA = viral internal antigen(s). Received: November 16, 1983.

Welcome message from author
This document is posted to help you gain knowledge. Please leave a comment to let me know what you think about it! Share it to your friends and learn new things together.
Transcript
Int. J . Cancer: 33,389-398 (1984)
FURTHER CHARACTERIZATION OF MAREK'S DISEASE VIRUS-INFECTED LYMPHOCYTES. I. IN V N O INFECTION B.W.CamK1,K.A. SCHAT',L.J.N. Ross2,W.R. S r n ~ ~ a n d C - L . H . c H E N 4
'Department of Avian and Aquatic Animal Medicine, New York State College of Veterinary Medicine, Cornell University, Ithaca, NY 14853, USA. Houghton Poultry Research Station, Houghton, Huntingdon, Cambs., PEl7 2DA England; Charles River Breeding Laboratories, Inc., 251 Ballardvale St., Wilmington, M A 01887; and Departments of Pediatrics and Microbiology, University of Alabama in Birmingham, School of Medicine, Comprehensive Cancer Center Cellular Immunobiology Unit, University Station, A L 35294, USA.
Previous reports from th is laboratory identified bursa- derived lymphocytes (B cells) and non-B cells as the predo- minant cell types respectively involved in the early cyto- lytic and subsequent latent infection of chickens with Marek's disease virus (MDV). It was not known whether these differences were qualitative or quantitative or if the method for detection of latent infection (viral antigen pro- duction after 48 h of in v i h o cultivation) was sensitive enough. To further define the cells involved in the various phases of MDV infection, we used monoclonal antibodies which specifically react with B cells, or T cells, or la-anti- gen-bearing cells. Dual fluorescence tests to detect surface markers and viral internal antigen (VIA) were conducted with infected spleen cells freshly collected from MDV-in- fected chickens or after in vihocultivation of those cells. The same antibodies were also used for a rosetting proce- dure to yield fractions enriched or depleted of T cells, B cells or la-bearing cells. These were examined directly for viral DNA by in situ hybridization or dot blot DNA hybridi- zation and for VIA cultivation. We learned that infected T cells also comprise part of the early cytolytic phase of MDV infection but constitute a minority population (approxi- mately 2-3 %) compared to B cells (83-92 %) at 3 or 4 days post infection. Latently infected cells were definitively identified as mostly la-bearing T cells, although a few (2- 4%) were B cells. Prior to in vitro cultivation, latently infected cells apparently had insufflcient viral DNA for detection by in situ hybridization, but the more sensitive dot blot procedure revealed viral DNA in fractions later found positive by VIA expression after in vitrocultivation. Viral DNA replication in latently infected cells apparently had occured after 48 h cultivation because in s i tu hybridi- zation detected infected cells at that time. Treatment of cell cultures with iodo-deoxyuridine, 12- Qtetradecanoyl phorbol-13-acetate or n-butyrate failed to increase the number of spleen cells which expressed VIA.
The pathogenicity of Marek's disease (MD), a natur- ally occurring herpesvirus-induced lymphomatous dis- ease of fowl, has been well defined in terms of sequen- tial events (Calnek, 1980). During the first 3-6 days after infection, an acute cytolytic infection of the pri- mary lymphoid organs (bursa of Fabricius, spleen, thy- mus) occurs. This is followed by a predominantly latent infection of lymphocytes which is persistent. Lympho- mas may subsequently develop in a proportion of in- fected chickens which varies according to factors such as genetic constitution, age at infection of the host, and isolate of MD virus (MDV).
Lymphomas comprise a variety of lymphocytes and other cells. However, the constituent tumor cells have been identified as neoplastically transformed thymus- derived lymphocytes (T cells), based on characteriza- tion of continuous cell lines established from lym- phomas (Powell et al., 1974, Nazerian and Sharma, 1975; Matsuda et al., 1976; Calnek et al., 1978a). These cells are lymphoblastic in character and bear several recognizable surface antigens other than T-cell mark- ers, including Ia antigen, a Marek's disease tumor-
associated antigen (MATSA) and embryonic antigen (Powell et al., 1974; Witter et al., 1975; Murthy et al., 1979; Schat et al., 1982).
Shek et al. (1983) showed that bursa-derived lym- phocytes (B cells) were the predominant cell type in- volved in the early cytolytic infection with MDV in vivo and that subsequent latent infections were found most- ly in Ia-bearing non-B lymphocytes, presumably T cells. This fitted the pattern suggested by an earlier study by Schat et al. (1981a) in which embryonally bursectomized chickens, free of B cells, failed to ex- hibit early cytolytic MDV infection but did develop latent infection and tumors. Calnek et al. (1982) studied in vitro infection of spleen cells and learned that B cells were the major target of cytolytic infection in that system as well. At the time of those studies, avail- able methodology was not sufficiently precise to defini- tively rule out the possibility that T cells as well as B cells could be cytolytically infected with MDV. Fur- thermore, it could only be speculated that the latently infected non-B lymphocytes were in fact T cells.
The availability of mouse monoclonal antibodies di- rected against T-cell and B-cell surface markers, or Ia antigen, prompted further characterization of both the cytolytic and latent phases of MDV infection in vivo. Data are presented to show that, whereas B cells and T cells are the predominant components of cytolytic and latent infections respectively, these are quantitative rather than qualitative differences.
MATERIAL AND METHODS
Experimental chickens Three- to 4-week-old chickens were obtained from
specific-pathogen-free departmental flocks of genetic strains: N-2, P-2, UCD-003 and S-strain (Schat and Calnek, 1980; Schat etal., 1981b; Hutt and Cole, 1947).
5Abbreviations: B-cells = bursa-derived lymphocytes; DPI = days post infection; EBx = embryonally bursectomized; FA test = fluorescent antibody test; FITC = fluorescein isothio- cyanate; GARG-TRITC = goat IgG anti-rabbit Ig conjugated with rhodamine; HBSS = Hanks' balanced salt solution; IUdR = iododeoxyuridine; MAC la = mouse monoclonal anti-chicken Ia; MAC IgM = mouse monoclonal anti-chicken IgM ( p chain); MAC T = mouse monoclonal anti-chicken T-cell; MD = Marek's disease; MDV = Marek's disease virus; MPBS = modified phosphate-buffered saline (PH 7.3) contai- ning 170 bovine serum albumin and 0.1 % sodium azide; PBS = phosphate-buffered saline (PH 7.3); PFU = plaque-forming units; RAM = rabbit IgG anti-mouse Ig (heavy and light chain); Staph A = staphylococcus protein A; T cells = thy- mus-derived lymphocytes; TPA = 12-0-tetradecanoyl phor- bol-13-acetate; VIA = viral internal antigen(s).
Received: November 16, 1983.
390 CALNEK ET AL.
Some of the S-strain chickens were embryonally bur- sectomized (EBx) following methods described else- where (Calnek et al., 1978b). The efficacy of that treat- ment was confirmed by the absence of bursa1 remnants at the time of post-mortem examination. After infec- tion with MDV, all chickens were held in isolation units. Viral inocula
Cloned MDV isolates JM-10, GA-5 and CU-2 have been described (Calnek, 1973; Smith and Calnek, 1974). Additionally, a new clone of the JM isolate of MDV (JM-16) was obtained by plaque selection after virus titration of a cell-free extract of skin from chick- ens infected with a JM-virus-bearing tumor cell trans- plant (Calnek et al., 1969). All inocula for these experi- ments were from stocks of infected chicken kidney cell cultures stored at -196” C. The dose, based on previous virus titrations, was 500-1,000 plaque-forming units (PFU)/bird; inoculation was by intraabdominal injec- tion. Monoclonal antibodies, anti-species immunoglobulins, and fluorescent antibody conjugates
Mouse monoclonal IgG anti-chicken IgM (p chain) (MAC IgM) (Chen et al., 1982) and mouse monoclonal IgM anti-chicken Ia antigens (MAC Ia) were as used before (Schat et al., 1982; Shek et al., 1983). The prepa- ration and initial screening of the mouse monoclonal anti-chicken T-cell (MAC T) were similar to the proce- dures described previously (Hammerling et al., 1981). A detailed description of this antibody will be pub- lished elsewhere (Chen et al., manuscript in prepara- tion). Briefly, lymph node cells from BALB/c mice immunized with peripheral blood leukocytes (PBL) obtained from agammaglobulinemic chickens were fused with X63-Ag8.653 myeloma cells. The specifici- ties of monoclonal antibodies from the hybrid culture supernatants were screened on the mononuclear cells from chicken thymus, bursa or blood by indirect im- munofluorescence. The anti-T-cell antibody reacted with thymocytes and T cells in PBL, but not with any immunoglobulin-bearing lymphocyte. MAC T reacts also with macrophages. The isotype of the antibody, as determined by enzyme-linked immunosorbent assays, is IgGIK. These three reagents were used in rosetting procedures for the enrichment or depletion of spleen- cell preparations for B cells (MAC IgM), T cells (MAC T) or Ia-antigen-bearing cells (MAC Ia), as well as for immunofluorescence tests to identify cells according to surface markers (Shek et al., 1983).
Rabbit IgG anti-mouse Ig (heavy and light chain, Miles-Yeda Ltd., Rehovot, Israel) (RAM) and goat IgG anti-rabbit Ig’s, conjugated with rhodamine (GARG-TRITC) (Cappel Laboratories, Westchester, PA) were used for indirect fluorescent antibody tests, in conjunction with monoclonal antibodies. Fluores- cein isothiocyanate (FITC)-conjugated chicken IgG anti-MDV (Calnek and Hitchner, 1969) was used in direct fluorescent antibody (FA) tests to detect MD viral internal antigen (VIA). All antibody preparations were titrated before use, to determine optimal dilu- tions. Preparation of lymphocyte suspensions
Spleens were collected aseptically and gently forced through an autoclavable 60-pm mesh (Tetco Inc.,
Elmsford, NY). Cells, washed and suspended in pH7.3 phosphate-buffered saline (PBS), were centrifuged over Ficoll-Paque (Pharmacia, Inc., Piscataway, NJ). Leukocytes, collected from the interface, were washed in PBS and suspended in LM-Hahn medium (Calnek et al., 1981a) for direct culture, in Hanks’ balanced salt solution (HBSS) for rosetting procedures, or in PBS modified by addition of 1 % bovine serum albumin and 0,1% sodium azide (MPBS) for staining of surface markers.
Fractions of spleen lymphocytes enriched in, or de- pleted of, cells with T-cell, B-cell or Ia-antigen surface markers were prepared by a rosetting technique essen- tially as described by Shek et al. (1983). Briefly, spleen cells suspended and washed in MPBS, were sequen- tially treated with mouse monoclonal antibodies and RAM before being rosetted with sheep erythrocytes to which Staphylococcus protein A (Staph A) (Phar- macia, Uppsala, Sweden) had been bound by chromi- um chloride (Parish et al., 1974). Tissue culture medium was substituted for monoclonal antibodies for a control. The rosettes, which formed because Staph A bound the Fc portion of mammalian immunoglobulin (Kronvall and Williams, 1969) were collected from the pellet after centrifugation of reacted mixtures over Ficoll-Paque, and lysed with NH,Cl, PH 7.3, to yield fractions enriched for cells with the respective surface markers. Non-rosetted cells, constituting the respec- tive depleted fractions, were collected from the inter- face. All fractions were washed twice in HBSS to re- move sodium azide.
In vitro cultivation Spleen cells were suspended in LM-Hahn medium
(Calnek etal., 1981b) at a concentration of 3-5x1O6/mi and incubated in a humidified, 5% CO, atmosphere at 41°C. Immunofluorescence tests
Direct FA tests for MDV-VIA were done by washing cells once in PBS and resuspending to one-tenth the original volume. Ten-pl drops were placed on glass slides, air-dried, fixed in acetone for 10 min at room temperature and stained with FITC-conjugated MDV antibodies. Each smear contained the yield from 0.1 ml of the original cell suspension. The number of VIA- positive cells per smear was determined by examina- tion of all or a known portion of the smear with epi- illumination using a Leitz fluorescence microscope.
For detection of T-cell, B-cell or Ia-antigen surface markers, 1-5X10⁶ cells were washed with MPBS and then sequentially treated (15 min at 4°C followed by washing with MPBS) with the desired mouse mono- clonal antibody, RAM, and GARC-TRITC. Air-dried smears were examined directly after fixation for 4 min in ethyl alcohol, or fixed in acetone and then stained with FITC-conjugated MDV antibodies for dual fluo- rescence tests. The rhodamine-stained surface markers were observed as strong patchy or solid-ring reddish fluorescence and the FITC-stained VIA was seen as granular intracytoplasmic and intranuclear greenish fluorescence. The Leitz microscope was equiped with filters suitable for exciting either conjugate, and by switching from one to the other it was possible to deter- mine whether or not a given VIA-positive cell had a given surface marker. Percentages reported in “Re-
MDV AND IN V N O INFECTION 391
sults” were generally derived from examination of not less than 25, and more often 50-100 of the VIA-positive cells in dual fluorescence tests. Detection of MDV D N A by hybridization
Both in situ hybridization and dot blot hybridization procedures were used to detect viral DNA in the lym- phoid cell preparations. In situ hybridization was car- ried out as described previously (Ross et al., 1981) by the method of Brahic and Haase (1978) and Haase et al., (1981). For dot blot hybridization, DNA was ex- tracted from the lymphoid cells by standard procedures which involved treatment with SDS, RNase, pronase and extraction with phenol and chloroform (Shank et al., 1978). DNA samples were dotted on nitrocellulose as described by Thomas (1980).
MDV DNA used for probe synthesis was derived from a collection of EcoRl fragments of DNA of the HPRS 16/att strain of MDV that had been cloned in PBR322 and propagated in E. coli HBlOl (Ross et al., 1981). Ten cloned MDV DNA fragments ranging in size from 1.3 kbp to 12 kbp and representing approxi- mately 50 % of the MDV genome were separated from PBR322 by electrophoresis and labelled individually by nick translation using either 35S dCTP (600 Ci/mmole, New England Nuclear, nEN Chemical GmbH D-6072 Dreieich West-Germany, Postfach 401240) for in situ hybridization or 32P dCTP (410 CUmmole, Amersham International, White Lion Rd, Amersham, Bucking- hamshire, England, HP70YB) for dot blot hybridiza- tion. The probes were mixtures of molar amounts of each labelled fragment. The specific activities of the probes were 5X10⁷dpm/pg (35S) and lo8 dpndpg (32P).
In situ hybridization was done on smears in parallel with those used to detect MDV VIA. The number of positive cells per smear was determined by microscopic examination of the entire smear or a known proportion of the smear. Using the MDCC-HP2 lymphoblastoid cell line (Powell et al., 1974) as a reference, the sensitiv- ity of detection of viral DNA was calculated to be 10 grains/copy/7 days exposure. This cell line has been estimated to contain 20 copies of viral DNA per cell (Ross, unpublished).
Because the number of fractionated cells available for DNA extraction for dot blot assays was small and the yield of DNA poor, it was not possible to estimate DNA concentration spectrophotometrically for all samples. In order to obtain a rough estimate of the relative amounts of total DNA spotted on nitrocellu- lose, the filters were rehybridized to a second probe (mainly chick ribosomal DNA) after elution of viral DNA probe by heating at 60°C for 30 min in 50% formamide. The relative amounts of total and viral DNAs were scored subjectively from X-ray film auto- radiograms and ranged from * (trace), 1+ (low) to 3+ (very high).
Negative controls for dot blot hybridization tests consisted of DNA from uninfected chicken spleen cells, phage T4 and salmon sperm. Varying amounts of DNA extracted from the MDCC-HP2 lymphoblastoid cell line served as a positive control. Experimental design
1. Early pathogenesis (Experiment 1). Four trials were conducted in which 3-week-old chickens were inoculated with JM-10 MDV. In the first trial, spleen
cells were collected from four N-2 and four P-2 chick- ens and were sampled at 4 and 5 days post infection (DPI) and two of each strain were sampled at 6 and 7 DPI. Frozen-tissue sections of all spleens were ex- amined for the presence of VIA-positive cells by FA tests with anti-MDV conjugate. Dual fluorescence test to identlfy surface markers on VIA-positive cells were done on spleen cells freshly prepared (4 and 5 DPI) or after 48 h in vitro cultivation (6 and 7 DPI).
Trials 2 and 3 were done with UCD-003 and Trial 4 with P-2 chickens. In each trial, four chickens were tested at 1 ,2 ,3 , or 4 DPI. Spleen-cell suspensions were smeared and examined by FA test for VIA-positive cells at 0 h and after 48 h of in vitro cultivation. Positive samples were examined by dual fluorescence as in Trial 1; only those samples with at least 50 VIA-positive cells were included in the calculation of percentage means.
2. Fractionation of latently infected spleen cells by rosetting procedures (Experiment 2). Spleens from six individual P-2 chickens infected with JM-10 MDV at 4 weeks of age were collected 22 DPI. Four were normal in appearance, but two were enlarged to two or three times the normal size and had small tumor nodules. After initial separation of leukocytes by centrifugation over Ficoll-Paque, a portion of each spleen-cell suspen- sion was stored for later studies by freezing at -196” C according to described methods (Spencer and Calnek, 1967). The remainder of each was divided into four aliquots and subjected to rosetting procedures to ob- tain fractions enriched in, or depleted, of Tcells, B cells or Ia-bearing cells. Examination of samples stained with acridine orange and viewed with light and fluorescence microscopy confirmed the efficacy of the rosetting procedure with all three monoclonal anti- bodies. Only non-rosetted cells were saved from the control aliquot since the rosetted fractions contained very few cells; thus seven samples were obtained from each spleen. The number of cells in each sample was counted and the sample then divided for the following tests: (i) VIA expression at 0 hand after 48 h of in vitro cultivation, (ii) DNA hybridization by dot blot and in situ methods, and (iii) FA test for surface markers appropriate to the given fraction. The number of cells per sample depended on the fraction collected and was variable. Therefore, the number of cells per ml cul- tured, or per smear for 0 h VIA or in situ hybridization, and the number of cells available for dot blot hybridiza- tion varied.
3. Dual fluorescence tests to detect VIA and surface markers afrer in vitro cultivation of latently infected spleen lymphocytes. Two experiments were conducted. Experiment 3 consisted of six separate trials from which data were pooled. In each, spleen cells from individual chickens or pools of spleen cells from three or six chickens were cultivated in vitro for 30 to 48 hand then examined by dual fluorescence to determine the percentage of VIA-positive cells which were T cells, B cells or Ia-bearing cells. All spleen-cell suspensions were from P-2 or S-strain donors infected 22 to 35 days earlier at 3-4 weeks of age with JM-10, JM-16 or CU-2 MDV. Details are in Table IV. Five JM-10-infected P-2 chicken spleen cell suspensions were from the group of six also studied in Experiment 2.
Experiment 4 was designed to learn whether infec- tion could spread in vitro from T cells to B cells within
392 CALNEK ET AL.
30-48 h and thus confuse an interpretation of possible latent infection in B cells. Latently infected spleen cells harvested from an EBx S-strain chicken were mixed with uninfected spleen cells from an intact P-2 donor (ratio of infected to uninfected = 1:3). The infected spleen cell suspension was free of lymphocytes with detectable B-cell markers, whereas the suspensions from the intact donor contained both B and T cells (approximately 30 and 70 %, respectively) as deter- mined by FA tests. Replicate 1 ml cultures were pre- pared to permit testing after 0,6,10,12,18,24,30,36 and 42 h of incubation. A parallel set of cultures was prepared from the spleen of an intact S-strain which was a hatch-mate of the EBx chicken. The two birds were infected at the same time (4 weeks of age) with the same virus (JM-lo), and the spleens were collected from both at the same time (35 DPI). At each of the testing times, one culture of each type was tested to determine the number of VIA-positive celldo. 1 ml and, by dual fluorescence, to identify T-cell or B-cell surface markers on VIA-positive cells.
4. Comparative tests for viral antigen and viral DNA in latently infected spleen cells before of after in vitro cultivation. Data were collected from two trials. Three spleen samples from Experiment 2, subsequently shown to have relatively high levels of latent infection, were examined at 0 h for VIA and for viral DNA by both in situ and dot blot hybridization. All samples had been depleted of B cells by rosetting. Tests comparing VIA and viral DNA after in vitro cultivation for 48 h
1979; Nonoyama et al., 1978; Kawanishi et al., 1981), and IUdR was previously shown to enhance the expres- sion of VIA in MDV-transformed lymphoblastoid cell lines (Nazerian, 1975; Dunn and Nazerian, 1977; Ross et al., 1977; Calnek et al., 1981a). Two MD cell lines, MDCC-CU31 and MDCC-CU32, which have a low level of spontaneous VIA expression, but have shown enhanced expression after IUdR treatment (Calnek et al., 1981a), were tested in parallel as controls. Cells were examined for viability (trypan blue dye exclusion) and the number of VIA-positive cells per 100,000 was determined by FA tests at the end of the 48 h culture period.
RESULTS Early pathogenesis
Although the majority of cytolytically infected cells displaying MDV-VIA in the spleen during the 3-5 DPI period could be shown to be B cells, some T cells also were infected at that time (Table I). The first infected cells were found in 1 of 12 chickens at 1 DPI. That sample was not positive until it had been cultured but did serve to illustrate that infection could reach the spleen that early. Ten of 12 samples from 2 DPI were similarly positive for VIA only after cultivation. Three of those samples had enough VIA-positive cells after incubation to allow dual fluorescence tests; approxi- mately 10% were identified as T cells. At 3-5 DPI, freshly harvested cells were found to be VIA-positive and from 2 to 9 % of those were T cells. As at 2 DPI,
TABLE I - EARLY PATHOGENESIS: APPEARANCE OF MDV-INFECTED CELLS IN SPLEEN LYMPHOCYTES. EXPERIMENT 1
No. samples with VIA-pos. Days post No. cells at:)
inoc. samples' Oh 48 h
2-4 1 12 0 1 2 12 0 10 3 12 9 11 4 12 10 -
6+7 8 3 8 5 - 1 4+5 16 13
Percentage of VIA-positive cells with surface marker (total or mean SEM)'
O h 48 h
T-cell B-cell Ia T-cell B-cell Ia
- - - - - - - - - 1 0 f 2 ( 3)6 83f10 ( 3) -
2 f 2 (3) 9254 (3) - 1 8 f 3 (10) 7 4 f 4 (11) - 3+1 (9) 83k4 (9) - - - -
- - - 9 58 89 - - - 38 34 45
'AU trials with 3-weekdd chickens inoculated intraahdominally with 500 PFU of JM-10 MDV. Trial 1 with N-2 and P-2, Trials 2 and 3 with UCD-003 and Trial 4 with P-2 strain chickens. -*Trial 1 = four chickens of each strain sampled on DPI 4 + 5, two of each on DPI 6 + 7; data pooled from Trials 2 4 ; four birds/triaYsampling time. -'ForOhexaminations, basedonFAtestsoffrozen tissuesectionsofspleen (Trial1)oronFAtestsofsmearsfromspleen-cell suspensions (other trials). For 48 h samples, based on FA tests on smears of cultured spleen cells. -'For trial 1 , the total number of VIA and surface marker positive cells / the total VIA-positive cells examined from all birds in the group was used to determine the percentage. Individual percentages for Trials 2 4 were used to calculate a mean ? standard error of the mean (SEM). -I- = not done. - 6Numhers in parentheses = number of samples included in the calculation (only samples with 50 or more VIA-positive cells included).
were conducted on three other spleen-cell samples from S-strain chickens of the same group as used in Experiment 4. Two donors had been EBx; the other was intact.
5. Attempts to enhance MDV genome expression in latently infected spleen cells. Four pools of spleen cells, each from three to six P-2 chickens infected 4 to 5 weeks earlier with GA-5 (pools 1 and 2) or JM-16 (pools 3 and 4) were cultivated for 48 h untreated or in the presence of 25 pg/ml iododeoxyuridine (IUdR), 5 mM n-buty- rate, or 1 pg/mll2-O-tetradecanoyl phorbol-13-acetate (TPA). Each of these substances had been reported to induce viral genome expression with Epstein-Barr vi- rus-transformed human lymphocytes (Luka et al.,
many of the spleen cells harvested at 3 DPI were in- fected but not yet expressing viral antigen since cultiva- tion increased the number of positive samples from 9 to 11 and the percentage of VIA-positive cells with T-cell markers from 2 to 18 %. By 6-7 DPI, the infection had apparently entered the latent phase since no VIA-posi- tive cells were found in five of eight spleens and the three positive spleens had only rare positive cells in FA tests on frozen tissue sections. After culture, approxi- mately equel numbers of VIA-positive T cells and B cells were observed. It was not possible to determine if the infected T cells bore Ia antigen since the percentage of B cells (which usually are Ia-bearing) was too high for valid conclusions about the T cells.
MDV AND IN V N O INFECTION
TABLE II - EFFICACY OF FRACTIONATION BY ROSE'lTING TO OBTAIN SPLEEN-CELL SUSPENSIONS ENRICHED FOR OR DEPLETED OF T CELLS, B CELLS OR la-BEARING CELLS. EXPERIMENT 2'
393
~~
Rosetted fractions
Percentage of cells with surface marker
Enriched fraction Deoleted fraction
Surface Original suspension: percentage cell marker of cells which surface marker Percentage of total recovered
cells in enriched fraction2
T cell 73.0k 1.4 B cell 16.7k1.0 Ia-antigen 52.7k1.8
~
72.3f3.9 90.5k2.6 0.7k0.7
54.0k2.6 81.2k 1.9 0 0
7.8k1.2 (+I3
'Data from six individual P-2 chickens with latent MDV infections; results reported as the mean 5 SEM. -'Total cells based on number recovered in enriched and depleted fractions combined. -)There were too few cells in most samples to permit an accurate determination. However, positive cells were seen in all six samples.
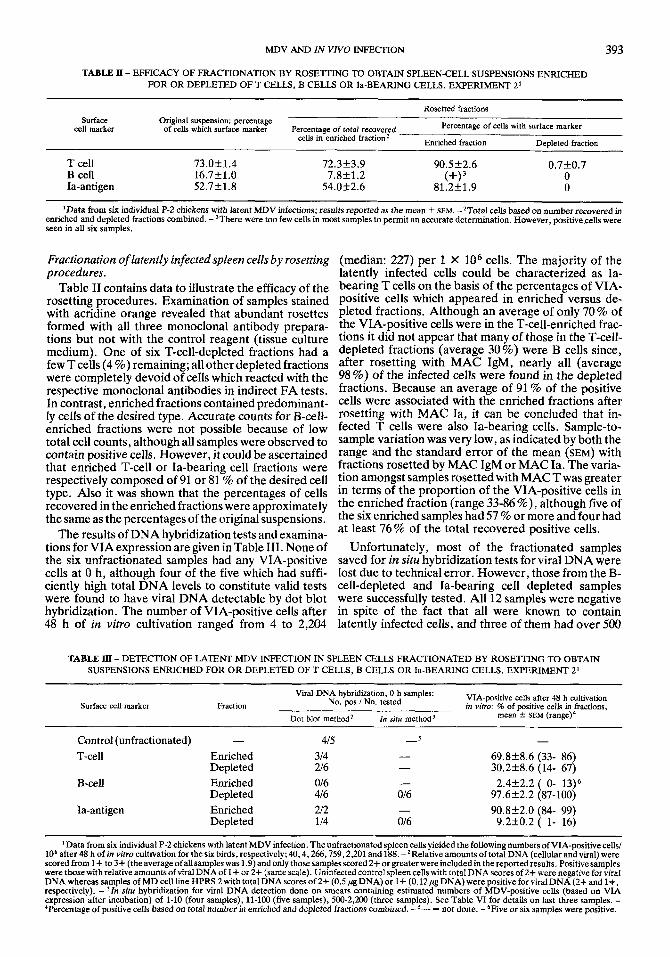
Fractionation of latently infected spleen cells by rosetring (median: 227) per 1 X lo6 cells. The majority of the procedures. latently infected cells could be characterized as Ia-
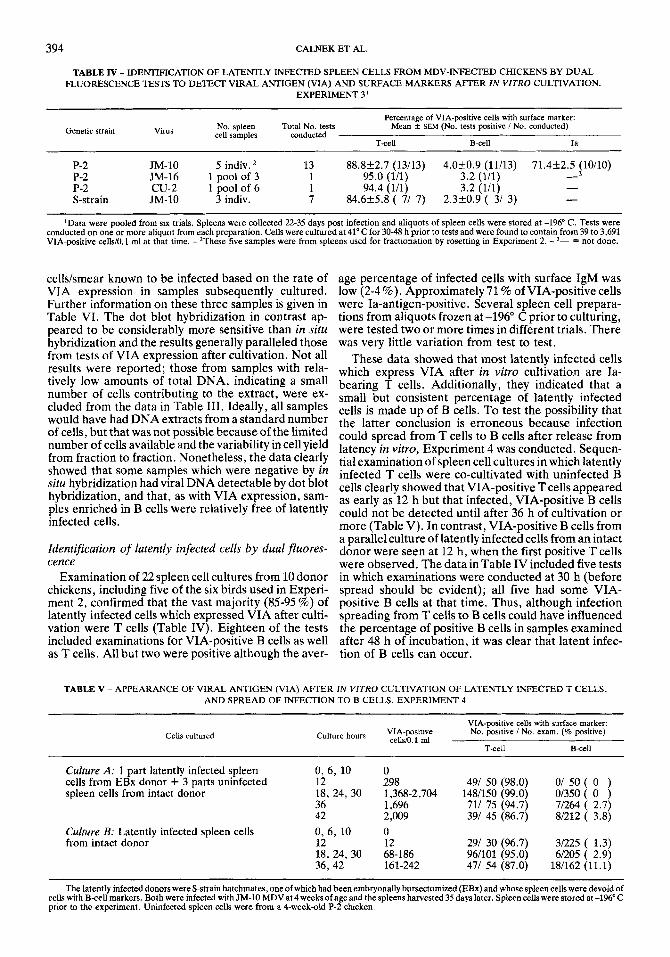
Table 11 contains data to illustrate the efficacy of the bearing T cells on the basis of the Percentages of VIA- rosetting procedures. Examination of samples stained Posltlve cells which appeared in enriched versus de- with acridine orange revealed that abundant rosettes pleted fractions. Although an average of only 70 of formed with all three monoclonal antibody prepara- the VIA-positive cells were in the T-cell-enriched frac- tions but not with the control reagent (tissue culture tions it did not appear that many of those in the T-cell- medium). One of six T-cell-depleted fractions had a depleted fractions (average 30%) were €3 cells since, few T cells (4 %) remaining; allother depleted fractions after resetting with MAC IgM, nearly all (average were completely devoid of cells which reacted with the 98 %> of the infected Cells were found in the depleted respective monoclonal antibodies in indirect FA tests. fractions. Because an average of 91 '% of the Positive In contrast, enriched fractions contained predominant- cells were associated with the enriched fractions after ly celfs of the desired type. Accurate counts for &cell- resetting with MAC 1% it can be concluded that in- enriched fractions were not possible because of low fected T cells were also Ia-bearing cells. Sample-to- total cell counts, although all samples were observed to sample variation was very low, as indicated by both the contain positive cells. However, it could be ascertained range and the standard error of the mean (SEMI with that enriched T-cell or Ia-bearing cell fractions were fractions rosetted by MAC IgM or MAC Ia. The varia- respectively composed of 91 or 81 % of the desired cell tionamongstsamPlesrosettedwith MAC Twas greater type. Also it was shown that the percentages of cells in terms ofthe Propoflion of the VIA-Positive cells in recovered in the enriched fractions were approximately the enriched fraction (range 33-86%) 7 although five of the same as the percentages of the original suspensions. the Six enrichedsamPleshad57% Or more and four had
at least 76% of the total recovered positive cells. The results of DNA hybridization tests and examina- tions for VIA expression are given in Table 111. None of Unfortunately, most of the fractionated samples the six unfractionated samples had any VIA-positive saved for in situ hybridization tests for viral DNA were cells at 0 h, although four of the five which had suffi- lost due to technical error. However, those from the B- ciently high total DNA levels to constitute valid tests cell-depleted and Ia-bearing cell depleted samples were found to have viral DNA detectable by dot blot were successfully tested. All 12 samples were negative hybridization. The number of VIA-positive cells after in spite of the fact that all were known to contain 48 h of in vitro cultivation ranged from 4 to 2,204 latently infected cells, and three of them had over 500
TABLE IlI - DETECTION OF LATENT MDV INFECTION IN SPLEEN CELLS FRACTIONATED BY ROSETIXNG TO OBTAIN SUSPENSIONS ENRICHED FOR OR DEPLETED O F T CELLS, B CELLS OR Ia-BEARING CELLS. EXPERIMENT Z1
Surface cell marker
~~
Fraction Viral DNA hybridization, 0 h samples: VIA-positive after 48 cultivation
in vim: % of positive cells in fractions, mean f SEM (range)4
No. pos / No. tested
Dot blot methodZ In situ method)
Control (unfractionated) - 41.5 -5 - 69.8k8.6 (33- 86)
Depleted 216 - 30.2k8.6 (14- 67) T-cell Enriched 314 -
B-cell Enriched 016 - 2.4k2.2 ( 0- 13)6 Depleted 416 016 97.6k2.2 (87-100)
90.8k2.0 (84- 99) Ia-antigen Enriched 212 - Depleted 114 016 9.2k0.2 ( 1- 16)
'Data from six individual P-2 chickens with latent MDV infection. The unfractionated spleen cells yielded the following numbers of VIA-positive cells/ lo6 after 48 h of in vitro cultivation for the six birds, respectively; 40,4,266,759,2,201 and 188. - Relative amounts of total DNA (cellular and viral) were scored kom I+ to3+ (theaverageofallsamples wasl.9)and onlythosesamplesscored2+orgreaterwereincludedin thereportedresults. Positivesamples were thosewithrelativeamountsofviralDNAof 1+ or2+ (samescale). Uninfectedconrrolspleencellswith totalDNAscoresofZf werenegative forviral DNA whereas samples of MD cell line HPRS 2 with total DNA scores of 2+ (0.5 pg DNA) or 1 + (0.12 pg DNA) were positive for viral DNA (2+ and 1 +, respectively). - 3Zn situ hybridization for viral DNA detection done on smears containing estimated numbers of MDV-positive cells (based on VIA expression after incubation) of 1-10 (four samples), 11-100 (five samples), 500-2,Uw) (three samples). See Table VI for details on last three samples. - 4Percentage of positive cells based on total number in enriched and depleted fractions combined. - '- = not done. - 6Five or six samples were positive.
394 CALNEK ET AL.
TABLE N - IDENTIFICATION OF LATENTLY INFECTED SPLEEN CELLS FROM MDV-INFECTED CHICKENS BY DUAL FLUORESCENCE TESTS TO DETECT VIRAL ANTIGEN (VIA) AND SURFACE MARKERS AFTER IN VITRO CULTIVATION.
EXPERIMENT 3'
Percentage of VIA-positive cells with surface marker: Mean f SEM (No. tests positive / No. conducted)
T-cell B-cell la
No. spleen Total No. tests cell samples conducted Genetic strain virus
P-2 JM-10 5 indiv. 13 88.8k2.7 (13/13) 4.0k0.9 (11113) 71.4k2.5 (10/10) 3 P-2 JM-16 1 pool of 3 1 95.0 (l/l) 3.2 ( I n ) -
P-2 CU-2 I pool of 6 1 94.4 ( l i l ) 3.2 ( l / l ) - S-strain JM-10 3 indiv. 7 84.6f5.8 ( 7/ 7) 2.320.9 ( 31 3) -
IData were pooled from six trials. Spleens were collected 22-35 days post infection and aliquots of spleen cells were stored at -196" C. Tests were conducted on one or more aliquot from each preparation. CeUs were cultured at 41" C for 30-48 h prior to tests and were found to contain from 39 to 3,691 VIA-positive ceUs/O.l ml at that time. -*These five samples were from spleens used for fractionation by rosetting in Experiment 2. - 3- = not done.
cellskmear known to be infected based on the rate of VIA expression in samples subsequently cultured. Further information on these three samples is given in Table VI. The dot blot hybridization in contrast ap- peared to be considerably more sensitive than in situ hybridization and the results generally paralleled those from tests of VIA expression after cultivation. Not all results were reported; those from samples with rela- tively low amounts of total DNA, indicating a small number of cells contributing to the extract, were ex- cluded from the data in Table 111. Ideally, all samples would have had DNA extracts from a standard number of cells, but that was not possible because of the limited number of cells available and the variability in cell yield from fraction to fraction. Nonetheless, the data clearly showed that some samples which were negative by in situ hybridization had viral DNA detectable by dot blot hybridization, and that, as with VIA expression, sam- ples enriched in B cells were relatively free of latently infected cells.
Identification of latently infected cells by dual jluores- cence
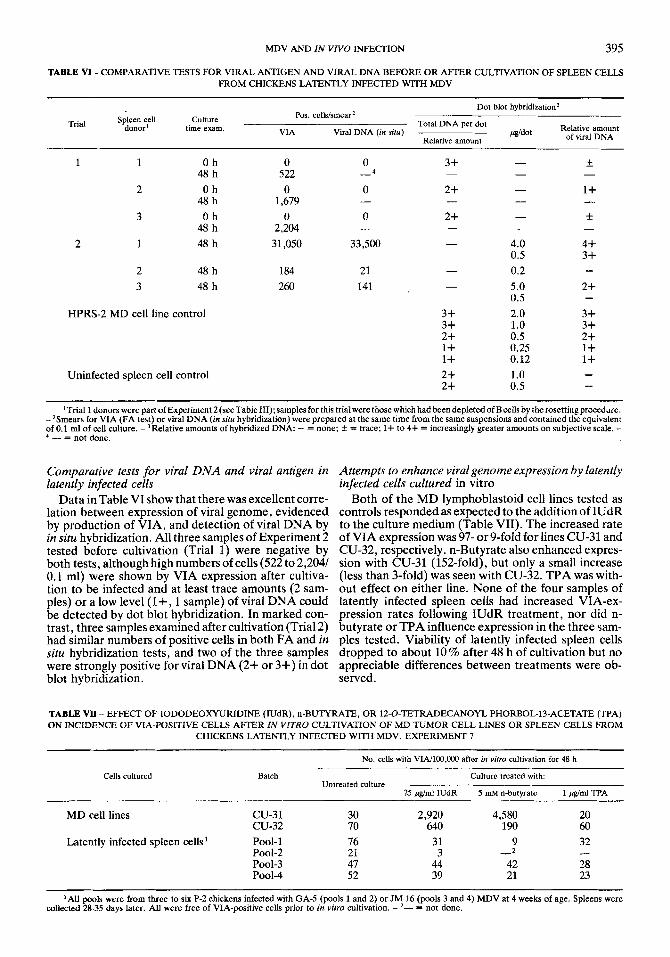
Examination of 22 spleen cell cultures from 10 donor chickens, including five of the six birds used in Experi- ment 2, confirmed that the vast majority (85-95 %) of latently infected cells which expressed VIA after culti- vation were T cells (Table IV). Eighteen of the tests included examinations for VIA-positive B cells as well as T cells. All but two were positive although the aver-
age percentage of infected cells with surface IgM was low (2-4 %). Approximately 71 % of VIA-positive cells were Ia-antigen-positive. Several spleen cell prepara- tions from aliquots frozen at -196" C prior to culturing, were tested two or more times in different trials. There was very little variation from test to test.
These data showed that most latently infected cells which express VIA after in vitro cultivation are Ia- bearing T cells. Additionally, they indicated that a small but consistent percentage of latently infected cells is made up of B cells. To test the possibility that the latter conclusion is erroneous because infection could spread from T cells to B cells after release from latency in vitro, Experiment 4 was conducted. Sequen- tial examination of spleen cell cultures in which latently infected T cells were co-cultivated with uninfected B cells clearly showed that VIA-positive T cells appeared as early as 12 h but that infected, VIA-positive B cells could not be detected until after 36 h of cultivation or more (Table V). In contrast, VIA-positive B cells from a parallel culture of latently infected cells from an intact donor were seen at 12 h, when the first positive T cells were observed. The data in Table IV included five tests in which examinations were conducted at 30 h (before spread should be evident); all five had some VIA- positive B cells at that time. Thus, although infection spreading from T cells to B cells could have influenced the percentage of positive B cells in samples examined after 48 h of incubation, it was clear that latent infec- tion of B cells can occur.
TABLE V - APPEARANCE OF VIRAL ANTIGEN (VIA) AFTER IN VITRO CULTIVATION OF LATENTLY INFECTED T CELLS, AND SPREAD OF INFECTION TO B CELLS. EXPERIMENT 4
Cells cultured VIA-positive cells with surface marker: No. positive / No. exam. (70 positive) Culture hours ~~~~~~
T-cell B-cell
Culture A: 1 part latently infected spleen 0, 6, 10 0 cells from EBx donor + 3 parts uninfected 12 298 49/ 50 (98.0) O/ 50 ( 0 )
36 1,696 71/ 75 (94.7) 7/264 ( 2.7) 42 2,009 39/ 45 (86.7) 8/212 ( 3.8)
from intact donor 12 12 29/ 30 (96.7) 3/225 ( 1.3) 18, 24, 30 68-186 96/101 (95.0) 6/205 ( 2.9) 36, 42 161-242 47/ 54 (87.0) 18/162 (11.1)
spleen cells from intact donor 18, 24, 30 1,368-2,704 148/150 (99.0) 0/350 ( 0 )
Culture B: Latently infected spleen cells 0, 6, 10 0
The latently infected donors were S-strain hatchmates, one of which had been embryonally bursectomized (EBx) and whose spleen c e h were devoid of cells with B-cell markers. Both were infected with JM-10 MDV at 4 weeks of age and the spleens harvested 35 days later. Spleen cells were stored at -196" C prior to the experiment. Uninfected spleen cells were from a 4-week-old P-2 chicken.
MDV AND IN V N O INFECTION
TABLE VI - COMPARATIVE TESTS FOR VIRAL ANTIGEN AND VIRAL DNA BEFORE OR AFTER CULTIVATION OF SPLEEN CELLS FROM CHICKENS LATENTLY INFECTED WITH MDV
395
Dot blot hybridization3 POS. cells/smear2
/Iddot Relative amount ~ Total DNA per dot Spleen cell Culture
of viral DNA VIA Viral DNA (in sim) donor' time exam. Relative amount
1 1 O h 48 h
2 Oh 48 h
3 O h 48 h
1 48 h 2
2 48 h 3 48 h
HPRS-2 MD cell line control
Uninfected spleen cell control
0 522 0
1,679 0
2,204 31,050
184 260
0
0
0
33,500
4 -
-
-
21 141
3+ 3+ 2+ 1+ 1+ 2+ 2+
4.0 0.5 0.2 5.0 0.5 2.0 1.0 0.5 0.25 0.12 1.0 0.5
4+ 3+
2+
3+ 3+ 2+ I+ 1+
-
'Trial 1 donors were part of Experiment 2 (see Table 111); samples for this trialwere those which had been depleted of B cells by the rosetting procedure. - 2Smears for VIA (FA test) or viral DNA (in situ hybridization) were prepared at the same time from the same suspensions and contained the equivalent of 0.1 mI of cell culture. - 3Relative amounts of hybridized DNA: - = none; f = trace; 1+ to 4+ = increasingly greater amounts on subjective scale. - ' - = not done.
Comparative tests for viral DNA and viral antigen in latently infected cells
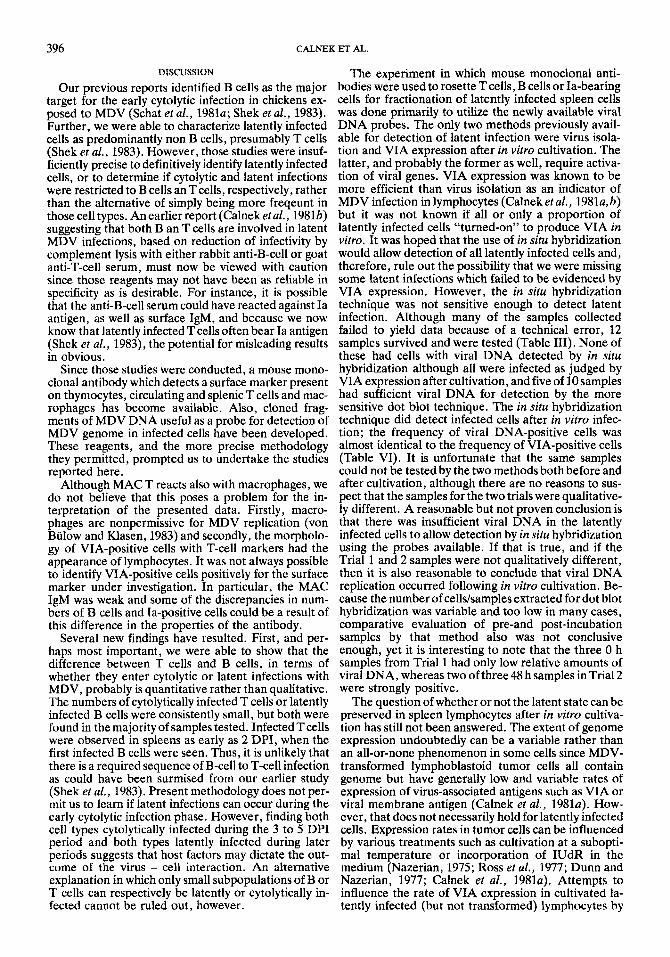
Data in Table VI show that there was excellent corre- lation between expression of viral genome, evidenced by production of VIA, and detection of viral DNA by in situ hybridization. All three samples of Experiment 2 tested before cultivation (Trial 1) were negative by both tests, although high numbers of cells (522 to 2,204/ 0.1 ml) were shown by VIA expression after cultiva- tion to be infected and at least trace amounts (2 sam- ples) or a low level (1 + , 1 sample) of viral DNA could be detected by dot blot hybridization. In marked con- trast, three samples examined after cultivation (Trial 2) had similar numbers of positive cells in both FA and in situ hybridization tests, and two of the three samples were strongly positive for viral DNA (2+ or 3+) in dot blot hybridization.
Attempts to enhance viral genome expression by latently infected cells cultured in vitro
Both of the MD lymphoblastoid cell lines tested as controls responded as expected to the addition of IUdR to the culture medium (Table VII). The increased rate of VIA expression was 97- or 9-fold for lines CU-31 and CU-32, respectively. n-Butyrate also enhanced expres- sion with CU-31 (152-fold), but only a small increase (less than 3-fold) was seen with CU-32. TPA was with- out effect on either line. None of the four samples of latently infected spleen cells had increased VIA-ex- pression rates following IUdR treatment, nor did n- butyrate or TPA influence expression in the three sam- ples tested. Viability of latently infected spleen cells dropped to about 10 % after 48 h of cultivation but no appreciable differences between treatments were ob- served.
TABLE VII - EFFECT OF IODODEOXYURIDINE (IUdR), n-BUTYRATE, OR 12-0-TETRADECANOYL PHORBOL-13-ACETATE (TPA) ON INCIDENCE OF VLA-POSITIVE CELLS AFTER IN VITRO CULTIVATION OF MD TUMOR CELL LINES OR SPLEEN CELLS FROM
CHICKENS LATENTLY INFECTED WITH MDV. EXPERIMENT 7
No. cells with VIA/1oO,ooO after in v i m cultivation for 48 h
Cells cultured Batch Culture treated with: Untreated culture
75 &ml IUdR 5 mM n-butyrate 1 p d d TPA
MD cell lines CU-31 30 2,920 4,580 20 CU-32 70 640 190 60
Latently infected spleen cells' Pool-1 76 31 9 32 Pool-2 21 3 Pool-3 47 44 42 28 POOI-4 52 39 21 23
2 - -
'AU pools were from three to six P-2 chickens infected with GA-5 (pools 1 and 2) or JM-16 (pools 3 and 4) MDV at 4 weeks of age. Spleens were collected 28-35 days later. Au were free of VIA-positive cells prior to in v i m cultivation. - 2- = not done.
396 CALNEK ET AL.
DISCUSSION
Our previous reports identified B cells as the major target for the early cytolytic infection in chickens ex- posed to MDV (Schat et al., 1981~; Shek et al., 1983). Further, we were able to characterize latently infected cells as predominantly non B cells, presumably T cells (Shek et al., 1983). However, those studies were insuf- ficiently precise to definitively identify latently infected cells, or to determine if cytolytic and latent infections were restricted to B cells an T cells, respectively, rather than the alternative of simply being more freqeunt in those cell types. Anearlier report (Calneketal., 1981b) suggesting that both B an T cells are involved in latent MDV infections, based on reduction of infectivity by complement lysis with either rabbit anti-B-cell or goat anti-T-cell serum, must now be viewed with caution since those reagents may not have been as reliable in specificity as is desirable. For instance, it is possible that the anti-B-cell serum could have reacted against Ia antigen, as well as surface IgM, and because we now know that latently infected T cells often bear Ia antigen (Shek et al., 1983), the potential for misleading results in obvious.
Since those studies were conducted, a mouse mono- clonal antibody which detects a surface marker present on thymocytes, circulating and splenic T cells and mac- rophages has become available. Also, cloned frag- ments of MDV DNA useful as a probe for detection of MDV genome in infected cells have been developed. These reagents, and the more precise methodology they permitted, prompted us to undertake the studies reported here.
Although MAC T reacts also with macrophages, we do not believe that this poses a problem for the in- terpretation of the presented data. Firstly, macro- phages are nonpermissive for MDV replication (von Bulow and Klasen, 1983) and secondly, the morpholo- gy of VIA-positive cells with T-cell markers had the appearance of lymphocytes. It was not always possible to identify VIA-positive cells positively for the surface marker under investigation. In particular, the MAC IgM was weak and some of the discrepancies in num- bers of B cells and Ia-positive cells could be a result of this difference in the properties of the antibody.
Several new findings have resulted. First, and per- haps most important, we were able to show that the difference between T cells and B cells, in terms of whether they enter cytolytic or latent infections with MDV, probably is quantitative rather than qualitative. The numbers of cytolytically infected T cells or latently infected B cells were consistently small, but both were found in the majority of samples tested. InfectedTcells were observed in spleens as early as 2 DPI, when the first infected B cells were seen. Thus, it is unlikely that there is a required sequence of B-cell to T-cell infection as could have been surmised from our earlier study (Shek et al., 1983). Present methodology does not per- mit us to learn if latent infections can occur during the early cytolytic infection phase. However, finding both cell types cytolytically infected during the 3 to 5 DPI period and both types latently infected during later periods suggests that host factors may dictate the out- come of the virus - cell interaction. An alternative explanation in which only small subpopulations of B or T cells can respectively be latently or cytolytically in-
The experiment in which mouse monoclonal anti- bodies were used to rosette Tcells, B cellsor Ia-bearing cells for fractionation of latently infected spleen cells was done primarily to utilize the newly available viral DNA probes. The only two methods previously avail- able for detection of latent infection were virus isola- tion and VIA expression after in vitro cultivation. The latter, and probably the former as well, require activa- tion of viral genes. VIA expression was known to be more efficient than virus isolation as an indicator of MDV infection in lymphocytes (Calnek etal., 1981a,b) but it was not known if all or only a proportion of latently infected cells “turned-on’’ to produce VIA in vitro. It was hoped that the use of in situ hybridization would allow detection of all latently infected cells and, therefore, rule out the possibility that we were missing some latent infections which failed to be evidenced by VIA expression. However, the in situ hybridization technique was not sensitive enough to detect latent infection. Although many of the samples collected failed to yield data because of a technical error, 12 samples survived and were tested (Table 111). None of these had cells with viral DNA detected by in situ hybridization although all were infected as judged by VIA expression after cultivation, and five of 10 samples had sufficient viral DNA for detection by the more sensitive dot blot technique. The in situ hybridization technique did detect infected cells after in vitro infec- tion; the frequency of viral DNA-positive cells was almost identical to the frequency of VIA-positive cells (Table VI). It is unfortunate that the same samples could not be tested by the two methods both before and after cultivation, although there are no reasons to sus- pect that the samples for the two trials were qualitative- ly different. A reasonable but not proven conclusion is that there was insufficient viral DNA in the latently infected cells to allow detection by in situ hybridization using the probes available. If that is true, and if the Trial 1 and 2 samples were not qualitatively different, then it is also reasonable to conclude that viral DNA replication occurred following in vitro cultivation, Be- cause the number of cells/samples extracted for dot blot hybridization was variable and too low in many cases, comparative evaluation of pre-and post-incubation samples by that method also was not conclusive enough, yet it is interesting to note that the three 0 h samples from Trial 1 had only low relative amounts of viral DNA, whereas two of three 48 h samples in Trial 2 were strongly positive.
The question of whether or not the latent state can be preserved in spleen lymphocytes after in vitro cultiva- tion has still not been answered. The extent of genome expression undoubtedly can be a variable rather than an all-or-none phenomenon in some cells since MDV- transformed lymphoblastoid tumor cells all contain genome but have generally low and variable rates of expression of virus-associated antigens such as VIA or viral membrane antigen (Calnek et al., 1981a). How- ever, that does not necessarily hold for latently infected cells. Expression rates in tumor cells can be influenced by various treatments such as cultivation at a subopti- mal temperature or incorporation of IUdR in the medium (Nazerian, 1975; Ross et al., 1977; Dunn and Nazerian, 1977; Calnek et al., 1981~). Attempts to influence the rate of VIA exmession in cultivated la-
fected cannot be ruled out, however. tently infected (but not trans’forrned) lymphocytes by
MDV AND IN V N O INFECTION 397
incubation at temperatures lower (37°C) or higher expression of the T-cell surface marker on infected (42.5”C) than the usual 41°C were without effect (Cal- cells. This might have led to less efficient rosettingwith nek, unpublished data). Also, incorporation in the cul- infected than with non-infected T cells but still allowed ture medium of three substances (IUdR, n-butyrate, detection by immunofluorescence. Weak expression of TPA) which were shown to enhance genome expres- T-cell markers on MDV-transformed lymphoblastoid sion with Epstein-Barr virus-transformed lymphocytes cell lines has been reported (Ross et al., 1977; Matsuda (Luka et al., 1979; Nonoyamaetal., 1978; Kawanishi et et al., 1976; Calnek et al., 1978a). al., 19Sl), failed to influence VIA expression in latent- m e dual fluorescence tests on cells after in vitro IY infected spleen lymphocytes, although two (IUdR cultivation provided the best identification of latently and n-butyrate) did increase VIA expression with two infected cells. The vast majority were T cells, and al- MD cell lines. It Will be necessary to develop a more though tests for Ia antigen were conducted on only 13 efficient DNA probe for hybridbation before the ques- of 22 samples, the results were consistent with earlier tion can be answered. This might be difficult in prac- observations (Shek et al., 1983) and the present frac- tic% since increasing the complexity of the Probe to tionation studies (Table 111). The detection of surface comprise the entire genome increases background hY- IgM on a small proportion of infected cells was espe- bridization Probably due to the Presence of cell se- cially significant since the percentage was too low to quences in Viral DNA (Ross, unpublished Ob~rva- have been detected by the less precise fractionation tions). method. Concern that infected B cells constituted an
The fractionation work served to confirm earlier artifact resulting from infection being passed from data showing latent infection to be associated predo- genome-expressing T cells in vitro was obviated when it minantly with Ia-bearing n0n-B cells. However, it was learned that infected B cells could be observed as further confirmed the supposition that the non-B cells early as infected T cells. Furthermore, several of the are T cells. The majority of VIA-positive cells were tests were done 30 h before in vitro transfer of infection associated with T-cell-enriched fractions in most of the could have resulted in VIA-positive B cells (not before samples, although a substantial number (average 30 %) 36 h). were found in T-cell-depleted fractions. The one sam- ple which had 67% of the VIA-positive cells in the depleted fraction (Table 111) had only a very low total This research was supported in Part by Public Health number of positive cells, so that percentage may have Service Grants CA 06709-21 9 CA 16673 and CA 13148 been somewhat in error. The reason for the relatively from the National Cancer Institute and Grant 1-608 high number of VIA-positive cells in the ~ - ~ l l de- from the National Foundation March Of Dimes. N. pleted fractions is enigmatic, especially since five of the Ross is grateful to the J ~ u k m ~ i a Research Fund ofthe six spleen suspensions used for rosetting were also UK for its support. examined later by dual fluorescence (Table IV) when We thank Mr. Raymond Harris, Mrs Beverly Bau- nearly 90 % of VIA-positive cells were found to be T man and Mr. Gary Allen for excellent technical assis- cells. It could have been due to weaker than normal tance, and Mrs Gwen Troise for typing the manuscript.
ACKNOWLEDGEMENTS
REFERENCES
BRAHIC, M., and HAASE, A.T., Detection of viral sequences of low reiteration frequency by in situ hybridization. Proc. nat. Acad. Sci. (Wash.), 15, 6125-6129 (1978). CALNEK, B.W., Influence of age at exposure on the pathogenesis of Marek’s disease. J. nut. Cancer Inst., 51, 929-939 (1973). CALNEK, B.W., Marek’s disease virus and lymphoma. In: F. Rapp (ed.), Oncogenic herpesviruses, Vol. I, pp. 103-144, CRC Press, Florida (1980). CALNEK, B.W., FABRICANT, J., SCHAT, K. A., and MURTHY, K.K., Rejection of a transplantable Marek’s disease lymphoma in nor- mal versus immunologically deficient chickens. J . nat. Cancer Inst., 60, 623-631 (1978b). CALNEK, B.W., andHrrCmR, S.B.,Localizationofviralantigen in chickens infected with Marek’s disease herpesvirus. J . nat. Cancer Inst., 43,935-949 (1969). CALNEK, B.W., &IN, S.H., and KNIAZEFF, A.J., Susceptibility of cultured mammalian cells to infection with a herpesvirus from Marek’s disease and T-virus from reticuloendotheliosis of chick- ens. Amer. J . vet. Res., 30, 1403-1412 (1969). CALNEK, B.W., MURTHY, K.K., and SCHAT, K.K., Establishment of Marek’s disease lymphoblastoid cell lines from transplantable versus primary lymphomas. Int. J . Cancer, 21, 100-107 (1978~). CALNEK, B.W., SCHAT, K. A., SHEK, W.R., and CHEN, C-L.H., In vitro infection of lymphocytes with Marek’s disease virus. J . nat. Cancer Inst., 69, 709-713 (1982). CALNEK, B.W., SHEK, W.R., and SCHAT, K.A., Spontaneous and induced herpesvirus genome expression in Marek’s disease tumor cell lines. Infect. Immun., 34, 483-491 (1981a).
CALNEK, B.W., SHEK, W.R., and SCHAT, K.A., Latent infections with Marek’s disease virus and turkey herpesvirus. J. nat. Cancer Inst., 66, 585-590 (1981b). CHEN, C-L.H., LEHMEYER, J.E., and COOPER, M.D., Evidence for an IgD homologue on chicken lymphocytes. J. Immunol., 129,
DUNN. K.. and NAZERIAN. K.. Induction of Marek’s disease virus 2580-2585 (1982).
antigens by IUdR in a chkke’n lymphoblastoid cell line. J . genl Virol., 34,413-419 (1977). HAASE, A.T., VENTURA, P., GIBBS, C.J., and TOURTELOTTE, W.W., JR., Measles virus nucleotide sequences: detection by hy- bridization in situ. Science, 212, 672-674 (1981). HAMMERLING, G.J., HAMMERLING, U., and KEARNEY, J.F., Monoclonal antibodies and T-cell hybridomas. Perspective and technical advances, p. 563, ElsevierNorth-Holland, New York (1981). Hum, F.B., and COLE, R.K., Genetic control of lymphomatosis in the fowl. Science, 106, 379-384 (1947). KAWANISHI, M., SUGAWARA, K., and ITO, Y., Epstein-Barr virus- induced early polypeptides in Raji and NC37 cells activated by diterpene ester TPA in combination with n-butyrate. Virology,
KRONVALL, G., and WILLIAMS, R.C., Differences in anti-protein. An activity among IgG subgroups. J . Immunol., 103, 828-833 (1969). LUKA, J., KALLIN, B., and KLEIN, G., Induction of the Epstein- Barr virus (EBV) cycle in latently infected cells by n-butyrate. Virology, 94, 228-231 (1979).
115,406-409 (1981).
398 CALNJ5K ET AL.
MATSUDA, H., IKUTA, K., and KATO, S., Detection of T-cell surface determinants in three Marek’s disease lymphoblastoid cell lines. Biken J., 19, 29-32 (1976). MURTHY, K.K., DIETERT, R.R., and CALNEK, B.W., Demonstra- tion of chicken fetal antigen (CFA) on normal splenic lympho- cytes, Marek’s disease lymphoblastoid cell lines and other neo- plasms. Int. 1. Cancer, 24, 349-354 (1979). NAZERLAN, K., Induction of an early antigen of Marek’s disease virus in a lymphoblastoid cell line. In: G. de-The, M.A. Epstein and H. zur Hausen (ed.), Oncogenesis and herpesviruses, II, pp. 345-305, IARC, Lyon (1975). NAZERIAN, K., and SHARMA, J.M., Brief communication: detec- tion of T-cell surface antigens in a Marek’s disease lymphoblastoid cell line. J. nat. Cancer Inst., 54, 277-279 (1975). NONOYAMA, M., TANAKA, A., and GLASER, R. , Expression of latent Epstein-Barr virus genomes in human epitheliaYBurkitt’s lymphoblastoid hybrid cells. IARCSci. Publ., 20,397-402 (1978). PARISH, C.R., KIROV, S.M., BOWERN, N., and BLANDEN, R.V., A one step procedure for separating mouse T and B lymphocytes. Europ. J. Immunol., 4, 808-815 (1974). POWELL, P.C., PAYNE, L.N., FRAZIER, J.A., and RENNIE, M., T lymphoblastoid cell lines from Marek’s disease lymphomas. Nature (Lond.), 251, 79-80 (1974). Ross, N.L.J., LELORBE, W., VARMUS, H.E., BISHOP, J.M., BRAHIC, M., and HAASE, A., Persistence and expression of Marek’s disease virus DNA in tumor cells and peripheral nerves studied by insitu hybridization. J . gen. Virol., 57,285-296 (1981). Ross, L.J.N., POWELL, P.C., WALKER, D.J., RENNIE, M., and PAYNE, L.N., Expression of virus-specific, thymus-specific, and tumor-specific antigens in lymphoblastoid cell lines derived from Marek’s disease lymphomas. J. gen. Virol., 35,219-235 (1977).
Biggs (ed.), Resistance and immunity to Marek’s disease, pp. 301- 319, EEC Publication, Luxembourg (1980). SCHAT, K. A, , CALNEK, B.W., and FABRICANT, J., Influence of the bursa of Fabricius on the pathogenesis of Marek’s disease. Infect. Immun., 31, 199-207 (1981a). SCHAT, K.A., CALNEK, B.W., and FABRICANT, J., Influence of oncogenicity of Marek‘s disease virus on evaluation of genetic resistance. Poultry Sci., 60, 2559-2566 (1981b). SCHAT, K.A., CALNEK, B. W., and FABRICANT, J., Characteriza- tion of two highly oncogenic strains of Marek’s disease virus. Avian Path., 11, 593-605 (1982). SHANK, P.R., HUGHES, S.H., KUNG, H.J., MAJORS, J.E., QUIN- TRELL, N., GUNTAKA, R.V., BISHOP, J.M., and VARMUS, H., Mapping unintegrated sarcoma virus DNA: termini of linear DNA bear 300 nucleotides present once or twice in the species of circular DNA. Cell, 15, 1383-1395 (1978). SHEK, W.R., CALNEK, B.W., SCHAT, K.A., and CHEN, C-L.H., Characterization of Marek’s disease virus infected lymphocytes: discrimination between cytolytically and latently infected cells. J. nat. Cancer Inst., 70, 485-491 (1983). SMITH, M.W., and CALNEK, B.W., Comparative features of low- virulence and high-virulence Marek’s disease virus infections. Avian Path., 3, 229-246 (1974). SPENCER, J.L., and CALNEK, B.W., Storage of cells infected with Rous sarcoma virus or JM strain of avian lyrnphornatosis agent. Avian Dis., 11, 274-287 (1967). THOMAS, P.S., Hybridization of denatured RNA and small DNA fragments transferred to nitrocellulose. Proc. nat. Acad. Sci.
VON BULOW, V., and KLASEN, A , , Effects of avian viruses on cultured chicken bone-marrow-derived macrophages. Avian Path., 12, 179-198 (1983). WITTER. R.L.. STEPHENS. E.A.. SHARMA. J.M.. and NAZERIAN.
(Wash.), 77, 5201-5205 (1980).
SCHAT, K.A., and CALNEK, B.W., In vitro cytotoxicity of spleen lymphocytes against Marek‘s disease tumor cells: induction by SB- 1 , an apparently nononcogenic Marek’s disease virus. In: P.M.
K., Demonstration of a tumor-associated surface antigen in Marek’s disease. J. Immunol., 115, 177-183 (1975).
Related Documents


