FUNDING WATER in Times of Financial Uncertainty: The Case for a Public Goods Charge in California

Welcome message from author
This document is posted to help you gain knowledge. Please leave a comment to let me know what you think about it! Share it to your friends and learn new things together.
Transcript

FUNDING WATER in Times of Financial Uncertainty: The Case for a Public Goods Charge in California

January 2015
Authors
Kim Quesnel and Newsha Ajami, Ph.D.*
Acknowledgments
We would like to thank the California Water Foundation for generously funding this project. This work was also made possible by support from the National Science Foundation Grant 28139880-50542-C, the National Science Foundation Engineering Research Center for Reinventing the Nation’s Urban Water Infrastructure (ReNUWIt) (Award No. EEC-1028968), and Stanford University.
We greatly appreciate information and data from the following people: Scott Anders (USD EPIC), Josh Brock (SDG&E), Bryan Cash (CNRA), Natalie Hernandez (CNRA), Bob Hondeville (MID), Valerie Kao (CPUC), Steve Kromer (CPUC Consultant), Amanda Moore (PG&E), Scott Tomashefky (NPCA), Timothy Tutt (SMUD), Tami Wallenburg (TID), and Camille Watts-Zagha (CPUC). We would also like to thank Noemi Wyss for research assistance. Finally, we would like to acknowledge Scott Anders, Juliet Christian-Smith, Valerie Kao, Steve Kromer, Robert Wilkinson, and an anonymous reviewer for their invaluable feedback.
Contact
Water in the West Stanford University Jerry Yang and Akiko Yamazaki (Y2E2) Building 473 Via Ortega, MC 4205 Stanford, CA 94305 [email protected]
About Water in the West
Water in the West is a partnership of the faculty, staff and students of the Stanford Woods Institute for the Environment and the Bill Lane Center for the American West. The mission of Water in the West is to design, articulate, and advance sustainable water management for the people and environment of the American West. Linking ideas to action, we accomplish our mission by engaging in cutting-edge research, creative problem solving, active collaboration with decision-makers and opinion leaders, effective public communications and hands-on education of students. To learn more visit: waterinthewest.stanford.edu.
*Corresponding author
ABOUT THE AUTHORS
Kim Quesnel is a graduate student at Stanford University studying civil and environmental engineering with a focus
on environmental fluid mechanics and hydrology. Her research concentrates on western water policy and financing
through Stanford University’s Water in the West Program and the National Science Foundation’s Engineering Research
Center for Reinventing the Nation’s Urban Water Infrastructure (ReNUWIt). Prior to coming to Stanford, Quesnel worked
as a civil engineer in Denver, Colorado in the field of environmental remediation, responsible for both technical design
work and project management. She has also contributed to a wide range of water-related research projects including
the laboratory investigation of tsunami wave breaking behavior at Oregon State University, the assessment and design
of water filtration systems in rural Thailand, and the study of glacier hydrology through field research in Alaska. Quesnel
received her bachelor’s degree in civil engineering from California Polytechnic State University, San Luis Obispo in 2010.
Newsha K. Ajami is the director of Urban Water Policy with Water in the West and the NSF-ReNUWIt initiative.
She is a hydrologist specializing in sustainable water resource management, water policy, the water-energy-food nexus,
and advancing uncertainty assessment techniques impacting hydrological predictions. Her research throughout the
years has been interdisciplinary and impact driven, focusing on the improvement of the science-policy stakeholder
interface by incorporating social and economic measures and relevant and effective communication. Dr. Ajami is also a
gubernatorial appointee to the Bay Area Regional Water Quality Control Board. Before joining Stanford, she worked as a
senior research associate at the Pacific Institute from 2011 to 2013, and served as a Science and Technology fellow at
the California State Senate’s Natural Resources and Water Committee where she worked on various water and energy
related legislation. She was also a postdoctoral researcher with the Berkeley Water Center, University of California,
Berkeley. She has published many highly cited peer-reviewed papers in prominent journals, coauthored two books, and
contributed opinion pieces to the New York Times and the Sacramento Bee. She was the recipient of the 2005 National
Science Foundation award for the American Meteorological Society’s Science and Policy Colloquium and ICSC-World
Laboratory Hydrologic Science and Water Resources Fellowship from 2000 to 2003. Ajami received her Ph.D. in civil
and environmental engineering from the University of California, Irvine; an M.S. in hydrology and water resources from
the University of Arizona; and a B.S. in civil and environmental engineering from Tehran Polytechnic.

TABLE OF CONTENTSEXECUTIVE SUMMARY ...................................................................................................................................................... 1
1 INTRODUCTION ........................................................................................................................................................ 2
1.1 Motivation for Analysis ..................................................................................................................................... 2
1.2 Financing Public Purpose Projects .................................................................................................................... 2
2 WATER: GENERAL OBLIGATION BONDS .................................................................................................................. 4
2.1 California’s Water Utility Structure ..................................................................................................................... 4
2.2 Water Public Purpose Funding .......................................................................................................................... 4
3 ELECTRICITY: PUBLIC GOODS CHARGE ................................................................................................................... 10
3.1 California’s Electric Utility Structure ................................................................................................................... 10
3.2 Electricity Public Purpose Funding..................................................................................................................... 11
3.3 Investor Owned Utilities .................................................................................................................................... 13
3.3.1 Total PGC Contributions ................................................................................................................................... 14
3.3.2 Energy Efficiency ............................................................................................................................................. 15
3.3.3 Renewable Energy Program .............................................................................................................................. 20
3.3.4 Research, Development, and Demonstration (PIER Program) .............................................................................. 22
3.4 Publicly Owned Utilities .................................................................................................................................... 24
4 A PUBLIC GOODS CHARGE FOR WATER ................................................................................................................... 25
4.1 The Need for Additional Funding ....................................................................................................................... 25
4.2 Comparison of Funding Mechanisms ................................................................................................................. 25
4.3 Governance ..................................................................................................................................................... 26
4.4 Lessons Learned from the Electricity PGC ......................................................................................................... 27
5 CONCLUSION ........................................................................................................................................................... 28
6 REFERENCES ........................................................................................................................................................... 29
WATER IN THE WEST A Public Goods Charge for Water ii

LIST OF TABLESTable 1-1: Comparison of Water and Electricity Sectors in California ................................................................................... 3
Table 2-1: Water Related General Obligation Bonds Passed during the Public Goods Charge Era (1998-2011) ...................... 8
Table 3-1: Comparison of California’s Two Main Electric Utility Types .................................................................................. 11
Table 3-2: Total Public Goods Charge IOU Funding Contributions (millions) .......................................................................... 14
Table 3-3: IOU PGC Funding Requirements for Energy Efficiency Programs (millions) ........................................................... 16
Table 3-4: IOU Funding Requirements for the Renewable Energy Program (millions) ............................................................. 21
Table 3-5: IOU Funding Requirements for Research, Development and Demonstration (millions) ........................................... 22
Table 4-1: Comparison of the Fundamental Structures of GO Bonds and a Public Goods Charge ......................................... 25
LIST OF FIGURESFigure 2-1: Authorized Amount of Water-Related Bonds in California 1970-2014 .................................................................. 5
Figure 2-2: California’s Average Annual Per-Capita GO Bond Spending on Water Projects by County ...................................... 7
Figure 2-3: Funds Authorized for Water-Related Purposes through General Obligation Bonds: Propositions 40, 50, 1E and 80 8
Figure 2-4: Proposed Uses of Proposition 1 Bond Funds ...................................................................................................... 9
Figure 3-1: California’s Electric Utility Structure ................................................................................................................... 10
Figure 3-2: Funding Structure of Electricity Public Purpose Programs 1998-2011 ................................................................. 12
Figure 3-3: Average Electric Revenue Requirement for California’s Three Major IOUs, 2011 ................................................... 13
Figure 3-4: 2011 San Diego Gas and Electric (SDG&E) Public Purpose Program Rate Components ....................................... 13
Figure 3-5: IOU Contributions to Public Goods Charge Programs 1998-2011 (millions) .......................................................... 15
Figure 3-6: Utility Contributions to Public Goods Charge Programs 1998-2011 ..................................................................... 15
Figure 3-7: IOU Energy Efficiency Funding 1998-2011 ........................................................................................................ 17
Figure 3-8: PG&E, SCE, and SDG&E Energy Efficiency Funding Allocations 2010-2012 ........................................................ 18
Figure 3-9: Distribution of Energy Efficiency Spending by California’s Three Major IOUs by County – Average Annual Spending Per Capita 2010-2012 ............................................................................................. 19
Figure 3-10: California Statewide Electricity Efficiency and Conservation Impacts ................................................................... 20
Figure 3-11: Total PGC Contributions to the Renewable Energy Subprograms 1998-2011 ....................................................... 21
Figure 3-12: Evolution of Renewables Funding from PGC Contributions, 1998-2011 ............................................................... 22
Figure 3-13: PIER Electric and Natural Gas Research Budget Allocations 1997-2011 .............................................................. 23
Figure 3-14: Examples of POU Public Goods Charge Spending 2000-2011 ............................................................................ 24
WATER IN THE WEST A Public Goods Charge for Water iii

LIST OF ACRONYMSAB Assembly Bill
CARE California Alternative Rates for Energy
CEC California Energy Commission
CMUA California Municipal Utilities Association
CPUC California Public Utilities Commission
DWR California Department of Water Resources
EE Energy Efficiency
EM&V Evaluation, Measurement, and Verification
EPIC Electric Program Investment Charge
FERC Federal Energy Regulatory Commission
GIS Geographic Information System
GO General Obligation (Bond)
GWh Gigawatt Hours
IOU Investor Owned Utility
kWh Kilowatt Hours
LAO California Legislative Analyst’s Office
LIEE Low Income Energy Efficiency
MWD Metropolitan Water District of Southern California
O&M Operations and Maintenance
PEEBA Procurement Energy Efficiency Balancing Act
PG&E Pacific Gas and Electric
PGC Public Goods Charge
PIER Public Interest Energy Research
POU Publicly Owned Utility
PPP Public Purpose Program
RD&D Research Development and Demonstration
RRTF Renewable Resource Trust Fund
SB Senate Bill
SCE Southern California Edison
SDG&E San Diego Gas and Electric
SMUD Sacramento Municipal Utility District
USD EPIC University of San Diego Energy Policy Initiatives Center
WATER IN THE WEST A Public Goods Charge for Water iv

EXECUTIVE SUMMARYFunding for water-related public purpose projects has become increasingly scarce in California. Utilities are facing new challenges that require additional capital while the state’s legal system has restricted the ability of local governments to raise funds. This fiscal landscape requires the water sector to find new ways to finance water-related public interest projects, including conservation and efficiency programs, monitoring and evaluation, and infrastructure maintenance and modernization. California must also generate supplementary funds for new water technology research, development, and dissemination if the state is to continue to grow despite dwindling water supplies. In recent decades, California has relied heavily on general obligation (GO) bonds to finance a variety of water-related projects. GO bonds, however, are unreliable funding mechanisms as they require voter approval if they survive the legislative process, and they can be costly in the long run as they are repaid with interest. Additionally, GO bonds violate the beneficiary-pays principle as the entire state repays a debt that benefits taxpayers in certain regions more than others.
This research paper looks at a supplemental funding mechanism, a Public Goods Charge (PGC), as an additional way for California to provide for water investment in the future. In a PGC scheme, ratepayers are charged a small, usage-related fee, and the funds are subsequently allocated to public interest projects at the local, utility, state, and broader scales. This method was used to fund electricity public purpose programs in California from 1998-2011, resulting in over $5.8 billion collected by the state’s three main Investor Owned Utilities (IOUs), with additional funds collected by local Publicly Owned Utilities (POUs), for energy innovation over 14 years. Utilities and the state as a whole benefitted economically and environmentally from the increased funding for energy efficiency, renewables, and research and development. The electricity PGC helped to transform California’s energy landscape into one that includes more modern and sustainable infrastructure systems. Significant energy savings were also achieved during the PGC era.
We find that a PGC for water, implemented at a state, regional, local, or multi-level scale could be an appropriate mechanism for additional sustainable water financing in the future. Money collected from the fee could be used to support public purpose projects, including water innovation, throughout the state. The surcharge generally achieves the same goal as GO bonds, but is a more consistent and focused tool. A PGC for water could also be less expensive and a more “fair” fundraising mechanism than statewide bonds. Some water utilities in California have already taken the initiative to collect a volumetric fee for public purpose programs- one example is the Metropolitan Water District’s Water Stewardship rate, which “recovers the cost of Metropolitan’s financial commitment to conservation, water recycling, groundwater clean-up and other local resource management programs.” However, few utilities finance public purpose projects through a usage-based surcharge and there are currently no broader water funding mechanisms that parallel the electricity PGC. While state GO bonds have helped fill funding gaps in the recent past, California’s utilities need to find additional sustainable sources of funding, and a PGC for water could be one such mechanism for the future.
WATER IN THE WEST A Public Goods Charge for Water 1
1 INTRODUCTION1.1 Motivation for AnalysisFunding for water-related public purpose projects has become increasingly scarce in California. Local utilities are facing new challenges that require additional capital, yet the state’s legal system, including voter-approved initiatives such as Proposition 218 and Proposition 13, has restricted the ability of local governments to raise funds. This fiscal landscape requires the water sector to find additional ways to finance water-related public interest projects, including conservation and efficiency programs, monitoring and evaluation, and infrastructure maintenance and modernization. California must also generate supplementary funds for research and development, testing, deployment and dissemination of innovative water solutions if the state is to continue to grow despite dwindling water supplies. In recent decades, California has relied heavily on general obligation (GO) bonds to finance public interest projects. GO bonds, however, violate the beneficiary-pays principle as the entire state repays a debt that benefits taxpayers in certain regions more than others. Additionally, GO bonds are unreliable funding mechanisms, as they must pass through several steps in the legislative process before they are approved. Bond passage can be delayed for several years after the proposition is initiated. Before the bond makes it to the voting process, legal language and content can be continually revised and funding amounts reduced. GO bonds can also be costly in the long run to both the state and taxpayers as they are repaid with interest.
This research paper looks at an alternative funding mechanism, a public goods charge (PGC), as a way for California to provide for water investment and reinvention in the future. In a PGC scheme, ratepayers are charged a small, usage-related fee, and the funds are subsequently allocated to public interest projects at the utility, state or broader scales. This method was used to fund electricity public purpose programs in California from 1998 to 2011, resulting in the collection of more than $5.8 billion1 by the state’s three main investor owned utilities (IOUs), with additional funds collected by the state’s publicly owned utilities (POUs), for energy innovation over 14 years. The funds were spent on projects that benefitted the state economically and environmentally. The PGC program was successful in increasing energy efficiency throughout the state, supplementing California’s electricity landscape with renewable sources, and contributing to the discovery and implementation of new energy technologies. This paper examines the accomplishments of the electricity PGC, as well as the lessons learned, to determine if a PGC for water could be an appropriate mechanism to supplement water financing in California for the future.
1.2 Financing Public Purpose ProjectsPublic purpose projects can be defined as activities that serve the public good or need, including the implementation and improvement of public infrastructure. For water and electricity, these projects usually have environmental and/or economic benefits and are often centered on conservation, efficiency and research and development. Examples include customer rebates for energy- or water-saving appliances and increased investment in new technologies. In California, bonds have been used in recent decades to fund water public purpose projects, while a PGC was used as recently as 2011 to fund energy efficiency and electricity innovation. Both mechanisms account for less than 6% of utility spending in each industry (Hanak et al. 2014a; California Public Utilities Commission 2011). The statewide electric PGC was active from 1998 to 2011, during which time six water-related GO bonds were passed.
There are many reasons to compare water and electricity. Both are commodities that are sold and delivered to customers and both are necessary to sustain modern society. Water and electricity systems in California are highly complex and dependent on heavy infrastructure systems. Additionally, both industries have significant environmental externalities, such as source pollution. There
1 California Public Utilities Commission Resolution E-3792, and PG&E, SCE, and SDG&E Advice Letters. The PGC was levied on both electricity and natural gas ratepayers, however we only assessed electricity in our analysis. Unless noted, all financial terms are nominal.
WATER IN THE WEST A Public Goods Charge for Water 2
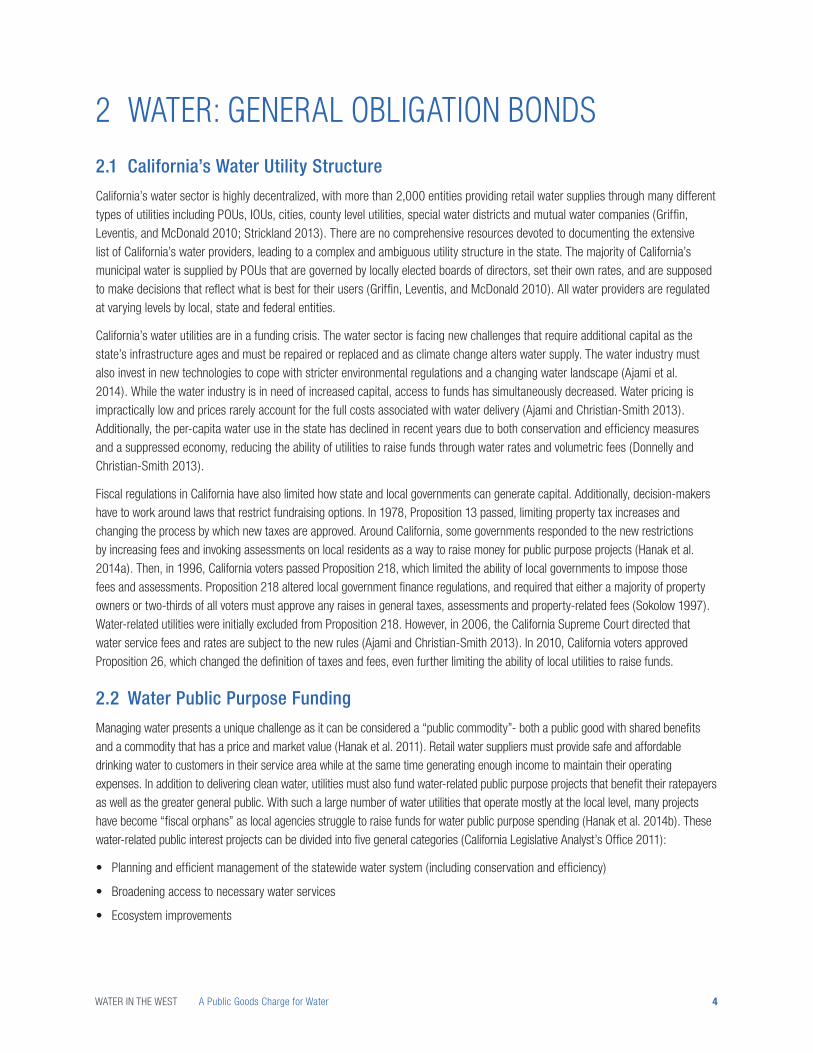
are also many differences between the water and electricity sectors, including the organizational structure of the utilities within the state and the inherent properties of the goods (Table 1-1). Yet, overall, the two goods are fundamentally similar and there are many lessons from the energy sector that can be applied to the water sector.
Table 1-1: Comparison of Water and Electricity Sectors in California
Water Electricity
Number of Utilities in California 2,000+ 50+
Utility Landscape Highly decentralized, mostly Publicly Owned Utilities
Dominated by three major Investor Owned Utilities
Characteristic of the Good Economic Commodity
Public Good
Human Right
Economic Commodity
Recent Public Benefits Funding Mechanism General Obligation Bonds Public Goods Charge
Approach to Efficiency Mostly Voluntary Mostly Mandatory
Source: Adapted from Donnelly, Kristina, Juliet Christian-Smith and Heather Cooley. 2013.
WATER IN THE WEST A Public Goods Charge for Water 3
2 WATER: GENERAL OBLIGATION BONDS2.1 California’s Water Utility StructureCalifornia’s water sector is highly decentralized, with more than 2,000 entities providing retail water supplies through many different types of utilities including POUs, IOUs, cities, county level utilities, special water districts and mutual water companies (Griffin, Leventis, and McDonald 2010; Strickland 2013). There are no comprehensive resources devoted to documenting the extensive list of California’s water providers, leading to a complex and ambiguous utility structure in the state. The majority of California’s municipal water is supplied by POUs that are governed by locally elected boards of directors, set their own rates, and are supposed to make decisions that reflect what is best for their users (Griffin, Leventis, and McDonald 2010). All water providers are regulated at varying levels by local, state and federal entities.
California’s water utilities are in a funding crisis. The water sector is facing new challenges that require additional capital as the state’s infrastructure ages and must be repaired or replaced and as climate change alters water supply. The water industry must also invest in new technologies to cope with stricter environmental regulations and a changing water landscape (Ajami et al. 2014). While the water industry is in need of increased capital, access to funds has simultaneously decreased. Water pricing is impractically low and prices rarely account for the full costs associated with water delivery (Ajami and Christian-Smith 2013). Additionally, the per-capita water use in the state has declined in recent years due to both conservation and efficiency measures and a suppressed economy, reducing the ability of utilities to raise funds through water rates and volumetric fees (Donnelly and Christian-Smith 2013).
Fiscal regulations in California have also limited how state and local governments can generate capital. Additionally, decision-makers have to work around laws that restrict fundraising options. In 1978, Proposition 13 passed, limiting property tax increases and changing the process by which new taxes are approved. Around California, some governments responded to the new restrictions by increasing fees and invoking assessments on local residents as a way to raise money for public purpose projects (Hanak et al. 2014a). Then, in 1996, California voters passed Proposition 218, which limited the ability of local governments to impose those fees and assessments. Proposition 218 altered local government finance regulations, and required that either a majority of property owners or two-thirds of all voters must approve any raises in general taxes, assessments and property-related fees (Sokolow 1997). Water-related utilities were initially excluded from Proposition 218. However, in 2006, the California Supreme Court directed that water service fees and rates are subject to the new rules (Ajami and Christian-Smith 2013). In 2010, California voters approved Proposition 26, which changed the definition of taxes and fees, even further limiting the ability of local utilities to raise funds.
2.2 Water Public Purpose FundingManaging water presents a unique challenge as it can be considered a “public commodity”- both a public good with shared benefits and a commodity that has a price and market value (Hanak et al. 2011). Retail water suppliers must provide safe and affordable drinking water to customers in their service area while at the same time generating enough income to maintain their operating expenses. In addition to delivering clean water, utilities must also fund water-related public purpose projects that benefit their ratepayers as well as the greater general public. With such a large number of water utilities that operate mostly at the local level, many projects have become “fiscal orphans” as local agencies struggle to raise funds for water public purpose spending (Hanak et al. 2014b). These water-related public interest projects can be divided into five general categories (California Legislative Analyst’s Office 2011):
• Planning and efficient management of the statewide water system (including conservation and efficiency)
• Broadening access to necessary water services
• Ecosystem improvements
WATER IN THE WEST A Public Goods Charge for Water 4

• Managements of water-related risks and major public emergencies
• Water system changes that improve recreational opportunities
GO bonds have been the primary mechanism used to fund these public programs in past decades as bond financing has become increasingly popular in California (Figure 2-1). In addition to GO bonds, revenue bonds (the other broad type of municipal bonds) have been used to fund projects throughout the state. Revenue bonds are targeted at specific projects and populations, and are repaid by those who directly benefit from the projects (Ajami and Christian-Smith 2013). These bonds are useful for projects like bridge construction that collect user fees, but less so for many public purpose projects, such as ecosystem restoration, that might not generate income.
GO bonds finance long-term investments by borrowing money from investors, which is then slowly repaid with interest by the general fund. GO bonds have successfully funded many water projects throughout California, including projects focused on drinking water, flood protection, restoration and water reliability (Ajami and Christian-Smith 2013). A GO bond is initiated through legislation, and then sent to the ballot where it must be passed by a majority of voters to be implemented. This multi-step approval process makes GO bonds an unreliable and expensive source of funding. However, GO bonds can be useful for providing significant capital for large water projects such as infrastructure.
Figure 2-1: Authorized Amount of Water-Related Bonds in California 1970-2014
1.0
2.0
3.0
4.0
5.0
1970 1974 1978 1982 1986 1990 1994 1998 2002 2006 2010 2014
6.0
7.0
8.0
9.0
10.0
$ Bi
llions
Aut
horiz
ed fo
r Wat
er-R
elat
ed B
onds
Source: California Legislative Analyst’s Office 2009.
Note: Nominal
In addition to being undependable, bonds are expensive to the state. Bond debt repayment has been steadily increasing and even recently surpassed total bond spending in California (Hanak et al. 2014a). Debt service for outstanding water-related GO bonds has increased in recent years from about $20 annually per household in 2000 to about $80 annually per household (California Department of Water Resources 2013). This means that every household in California is paying about $6 per month to pay back the debt (principal plus interest) accrued through water bonds.
Another disadvantage of GO Bonds is that while the entire state population is responsible for paying back the debt service, the bond money is not redistributed equally throughout the state (Figure 2-3). This is a violation of the beneficiary-pays principle, which requires that those who benefit from investments repay the associated costs of programs and projects. There are some co-benefits to projects implemented in upstream regions or at the statewide level, however the overall benefits are not distributed uniformly.
WATER IN THE WEST A Public Goods Charge for Water 5
Indeed, the largest water bond ever passed by voters in California, which financed the State Water Project, required that State Water Project users, rather than taxpayers at large, repay the general fund. In recommendations to the legislature, the California Legislative Analyst’s Office advised that the beneficiary-pays principle be utilized when financing future water infrastructure (California Legislative Analyst’s Office 2009).
Bonds’ lopsided benefits are due, in part, to earmarks, funds specifically allocated to certain projects and often added after the original bond language is drafted. These earmarks are regularly attached to bills as a way to garner support. Political leaders will add onto a bill a project or issue that is important to their constituents, and, in return, support the legislation. While earmarks are often in line with the original purpose of the bond, they can lead to disproportionate benefits as the entire state population repays the bond, but only certain communities benefit. GO bond funding is further limited by legal requirements that they be used for capital purposes rather than for operations and maintenance (O&M), which might be what some regions need (California Legislative Analyst’s Office 2009).
Bonds are used to fund specific projects throughout California, with a higher concentration of monies being sent to certain hydrologic regions. In the four GO bonds passed during the period 2002-2006, almost one-third of the funds went to the Sacramento River region, another third went to the South Coast in Southern California, and the rest was distributed throughout the state (Hanak et al. 2014a). Historically, bonds have not been allocated to the state’s most highly urbanized regions, meaning that the higher income residents who live in these areas have been disproportionately paying California’s GO bond debt (Hanak et al. 2014a). However, money spent in upstream regions can also benefit downstream users. For example, funds used to augment supply in the headwaters of the State Water Project will ultimately benefit users throughout the state, including those in Southern California. With such a complex water supply system in the state, it is difficult to calculate the water yield per dollar spent. It is also a challenge to determine the optimal funding distribution through the state that will result in the greatest benefits per cost. However, it is clear that the current distribution of bond funding is skewed, as some hydrologic regions receive up to 100 times more funding than others (Figure 2-3).
WATER IN THE WEST A Public Goods Charge for Water 6

Figure 2-2: California’s Average Annual Per-Capita GO Bond Spending on Water Projects by County
Sources: Propositions 13, 12, 40, 50, and 84: California Natural Resources Agency 2014; Proposition 1: Public Policy Institute of California 2013.
Notes: Map shows 88% of funds spent ($13.1 billion out of $15.0 billion allocated) on water-related projects from 2001-2013. The remaining 12% of funds were allocated to statewide projects or used for projects that could not be geographically located. Of the $19.6 billion authorized for the six bonds, 76% ($15.0 billion allocated out of $19.6 billion) had been allocated as of January 2014. Population data is from the 2012 census.
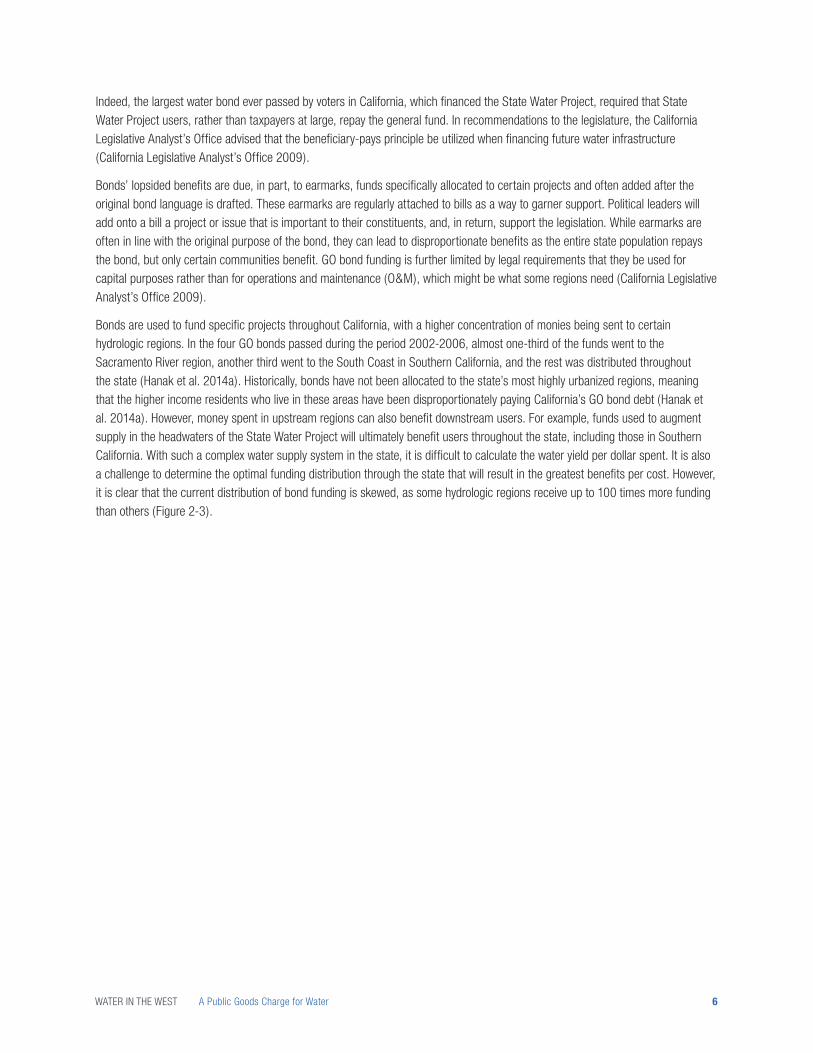
Six water-related GO bonds, financing more than $19.6 billion for the State of California, were passed while the electricity PGC was in effect (Figure 2-2, Table 2-1). The amounts shown reflect what was authorized when the bonds passed through the legislature, and were approved by voters. This is not necessarily the same amount as what has been spent to date, as bonds go through a specific process before money is actually disbursed. As of January 2014, about three quarters of the money authorized had been allocated. These six measures funded water-related projects throughout California in many different areas that would not otherwise have been funded by local governments. These include flood protection, ecosystem management, storm water infrastructure and other water public purpose projects (Figure 2-4).
WATER IN THE WEST A Public Goods Charge for Water 7
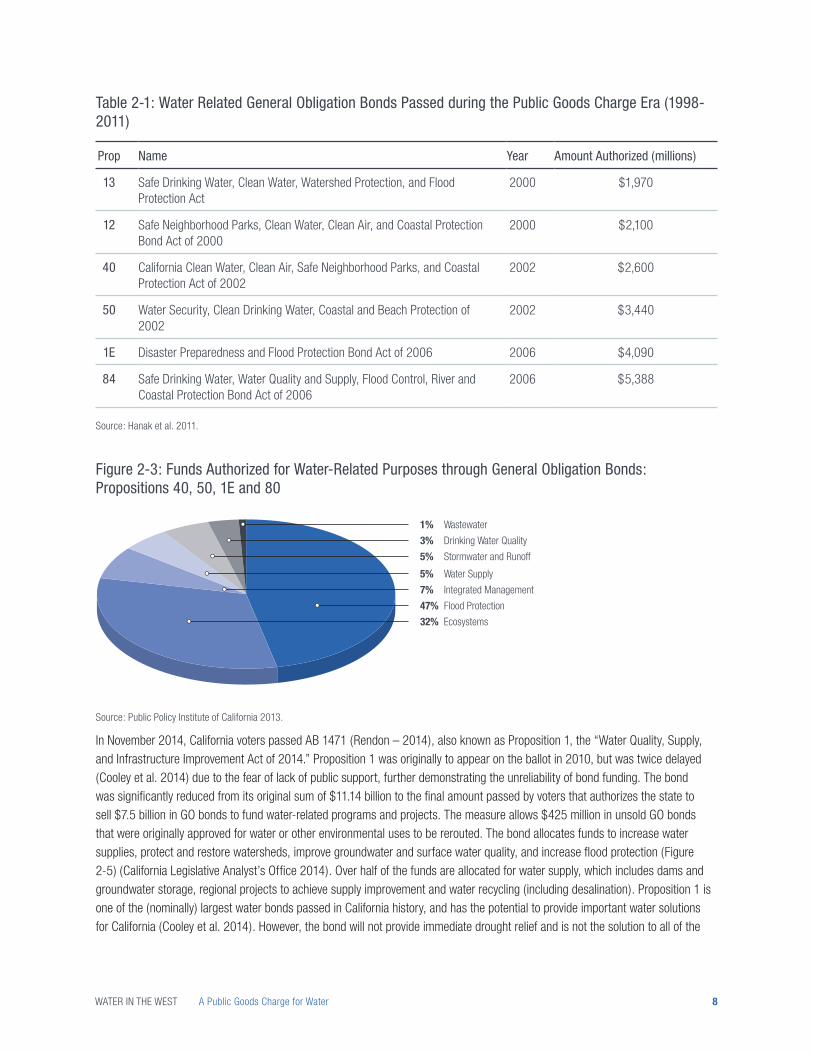
Table 2-1: Water Related General Obligation Bonds Passed during the Public Goods Charge Era (1998-2011)
Prop Name Year Amount Authorized (millions)
13 Safe Drinking Water, Clean Water, Watershed Protection, and Flood Protection Act
2000 $1,970
12 Safe Neighborhood Parks, Clean Water, Clean Air, and Coastal Protection Bond Act of 2000
2000 $2,100
40 California Clean Water, Clean Air, Safe Neighborhood Parks, and Coastal Protection Act of 2002
2002 $2,600
50 Water Security, Clean Drinking Water, Coastal and Beach Protection of 2002
2002 $3,440
1E Disaster Preparedness and Flood Protection Bond Act of 2006 2006 $4,090
84 Safe Drinking Water, Water Quality and Supply, Flood Control, River and Coastal Protection Bond Act of 2006
2006 $5,388
Source: Hanak et al. 2011.
Figure 2-3: Funds Authorized for Water-Related Purposes through General Obligation Bonds: Propositions 40, 50, 1E and 80
47% Flood Protection
32% Ecosystems
7% Integrated Management
5% Water Supply
5% Stormwater and Runoff
3% Drinking Water Quality
1% Wastewater
Source: Public Policy Institute of California 2013.
In November 2014, California voters passed AB 1471 (Rendon – 2014), also known as Proposition 1, the “Water Quality, Supply, and Infrastructure Improvement Act of 2014.” Proposition 1 was originally to appear on the ballot in 2010, but was twice delayed (Cooley et al. 2014) due to the fear of lack of public support, further demonstrating the unreliability of bond funding. The bond was significantly reduced from its original sum of $11.14 billion to the final amount passed by voters that authorizes the state to sell $7.5 billion in GO bonds to fund water-related programs and projects. The measure allows $425 million in unsold GO bonds that were originally approved for water or other environmental uses to be rerouted. The bond allocates funds to increase water supplies, protect and restore watersheds, improve groundwater and surface water quality, and increase flood protection (Figure 2-5) (California Legislative Analyst’s Office 2014). Over half of the funds are allocated for water supply, which includes dams and groundwater storage, regional projects to achieve supply improvement and water recycling (including desalination). Proposition 1 is one of the (nominally) largest water bonds passed in California history, and has the potential to provide important water solutions for California (Cooley et al. 2014). However, the bond will not provide immediate drought relief and is not the solution to all of the
WATER IN THE WEST A Public Goods Charge for Water 8

state’s water problems. California will need additional funding to support innovative solutions that better manage limited resources and high demand.
Figure 2-4: Proposed Uses of Proposition 1 Bond Funds
56% Water Supply
20% Watershed Protection and Restoration
19% Groundwater and Surface Water Quality
5% Flood Protection
The water sector can look to the electricity sector for financing ideas. Although water and electric utilities operate differently, there are many parallels. California’s electric utilities have faced some of the same challenges as the water sector, including decreased demand and fiscal instability, and these utilities have implemented a variety of innovative funding schemes to finance public interest projects (Donnelly, Christian-Smith, and Cooley 2013). One example is the public goods charge (PGC), a usage-related fee imposed on ratepayers that funded public purpose programs and helped reinvent California’s energy industry. In the next section, we will investigate the PGC for electricity to determine if a similar program could be appropriate for the water sector in the future. We will begin by looking at the utility and regulatory structures of the electricity sector in California to see how it compares to the state’s water industry. Then, we will examine the governance and implementation of the electricity PGC to assess successes and failures. Finally, we will determine how the PGC for electricity could be used as a model for a PGC for water, and how the fee-based program could to be modified to fit a similar commodity.
WATER IN THE WEST A Public Goods Charge for Water 9

3 ELECTRICITY: PUBLIC GOODS CHARGE3.1 California’s Electric Utility StructureWhile California’s water sector is highly fragmented, the structure of electric utilities in the state is less complex with only a few utilities responsible for the majority of power delivery. Three types of utilities provide almost all of California’s electricity — investor owned utilities (IOUs), publicly owned utilities (POUs), and rural cooperatives (Figure 3-1)2. The supply 78% of energy statewide, while the POUs deliver 22%, and the rest account for less than a fraction of 1% (California Energy Commission 2014). California has three major electric IOUs: Pacific Gas and Electric (PG&E), Southern California Edison (SCE) and San Diego Gas and Electric (SDG&E)3, and at least 46 energy-providing POUs (California Energy Commission 2011). The IOUs and POUs operate, set rates, and are regulated differently (Table 3-1).
Electric utilities in California are regulated at the national, state and local levels. The Federal Energy Regulatory Commission (FERC) and congress oversee electricity markets and systems nationally. In California, the state legislature implements policy through statutory law. The governor appoints the California Public Utilities Commission (CPUC) commissioners, who then regulate and set rates for IOUs in exchange for monopoly rights (California Municipal Utilities Association 2004). The POUs are not regulated by the CPUC as they are expected to act in the best interest of the local community. They are overseen by locally elected boards and/or city councils. The POUs and IOUs are subject to regulations implemented by the governor-appointed California Energy Commission (CEC)4, which is responsible for directing the use of energy through energy policy and planning.
Figure 3-1: California’s Electric Utility Structure
Source: California Energy Commission, Facilities Siting Division, Cartography Unit GIS files, May 2014.
Note: Combination Utilities are Lassen Municipal Utility District with Plumas-Sierra Rural Electric Cooperative and PG&E with Modesto Irrigation District.
2 Additionally, there are two Native American Utilities and four Rural Cooperatives that service a small number of customers.3 Since the focus of this report is electricity, California’s fourth major IOU, Southern California Gas (SoCalGas) is not evaluated in this study.4 Formally the Energy Resources Conservation and Development Commission.
WATER IN THE WEST A Public Goods Charge for Water 10

Table 3-1: Comparison of California’s Two Main Electric Utility Types
IOUs POUs
Number in California 3 (+ 3 minor) 46
% of State Electricity Supplied 78% 22%
Structure For-profit corporation with subsidiaries Not-for-profit public agencies
Regulation California Public Utilities Commission Locally Elected Boards
Rate Setting Rates approved by CPUC Rates are set in a public forum
Mechanism for Non-Low Income Public Purpose Funding
Public Goods Charge (1998-2011) and Electric Procurement (2004 onwards)
Public Goods Charge
Source: Modified from California Municipal Utilities Association 2004
3.2 Electricity Public Purpose FundingLike water providers, electric utilities are required to fund public purpose programs that benefit their ratepayers and the general public. These projects include incentivizing energy efficiency measures that result in financial savings for customers and transitioning to renewable energy sources that lead to environmental benefits. Public purpose funding also includes investment in research and development of inventive technologies that have the potential to enhance the state economically and environmentally. California has become a leader in energy innovation. The state’s high electricity needs and generally liberal political landscape have created many strategies aimed at reducing demand and modernizing infrastructure. The state has historically been a frontrunner in energy policy, setting strict environmental pollution limits, and mandating funding for clean and efficient energy use. These energy policies have created a stable funding environment in which utilities’ environmental goals and revenue requirements are approved through several regulatory processes (California Public Utilities Commission 2012). California has the second highest energy need of any state in the country, yet per capita usage is among the lowest (Energy Information Administration 2014).
Many legislative and regulatory efforts have played a critical role in defining California’s energy landscape. One important example is Assembly Bill (AB) 1890 (Brulte – 1996), the Electric Utility Industry Restructuring Act, which reformed the state’s electricity sector by effectively deregulating the electricity market. Policymakers were concerned that the bill would encourage California’s three major IOUs to cut costs wherever possible and reduce funds for public programs and research and development. In order to ensure that the IOUs didn’t eliminate this spending, part of the bill included levying a charge on ratepayers to fund energy research activities that were previously funded by the IOUs themselves (Taylor 2011). The funds collected from the PGC were intended to support investments in energy efficiency, renewable energy and public interest research and development. AB 1890 (Brulte- 1996) mandated that the utilities collect the PGC from 1998 to 2001. AB 995 (Wright – 2000) extended the program until Jan. 1, 2012. The PGC program was not renewed, however, and the Electric Program Investment Charge (EPIC) was established as its replacement for 2012 to 2014.
The Procurement surcharge, administered through the Procurement Energy Efficiency Balancing Account (PEEBA), was established in 2004 and collected by the IOUs to augment PGC energy efficiency funding. The Procurement is a “one-way” balancing account created to track the difference between actual procurement-related energy efficiency costs and authorized procurement-related energy efficiency revenues (Southern California Edison 2004). The Procurement surcharge is still collected today and some of the funds are used in place of the expired PGC funding. The PGC and Procurement surcharges were part of the larger electricity Public Purpose Program (PPP) surcharge that was levied from IOU and POU ratepayers from 1998-2011 (Figure 3-2).
WATER IN THE WEST A Public Goods Charge for Water 11
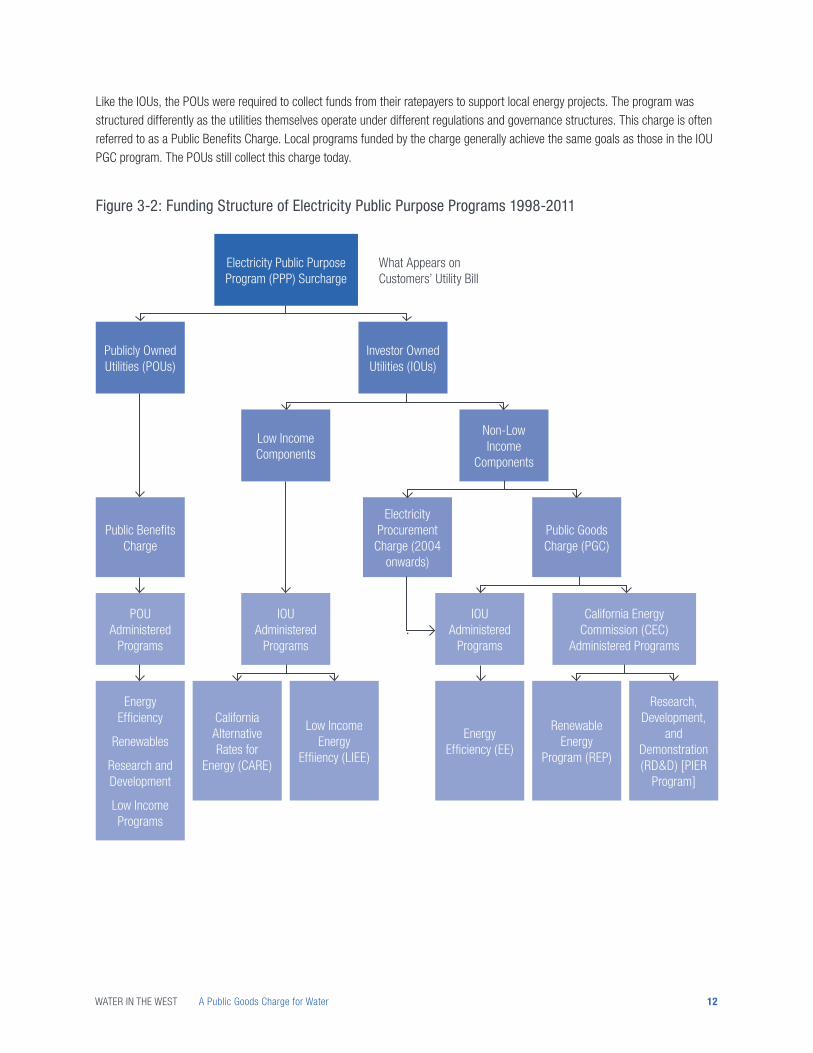
Like the IOUs, the POUs were required to collect funds from their ratepayers to support local energy projects. The program was structured differently as the utilities themselves operate under different regulations and governance structures. This charge is often referred to as a Public Benefits Charge. Local programs funded by the charge generally achieve the same goals as those in the IOU PGC program. The POUs still collect this charge today.
Figure 3-2: Funding Structure of Electricity Public Purpose Programs 1998-2011
Electricity Public Purpose Program (PPP) Surcharge
What Appears on Customers’ Utility Bill
Publicly Owned Utilities (POUs)
Investor Owned Utilities (IOUs)
Non-Low Income
Components
Low Income Components
IOU Administered
Programs
IOU Administered
Programs
California Energy Commission (CEC)
Administered Programs
California Alternative Rates for
Energy (CARE)
Low Income Energy
Effiiency (LIEE)
Energy Efficiency (EE)
Renewable Energy
Program (REP)
Research, Development,
and Demonstration (RD&D) [PIER
Program]
Public Benefits Charge
Electricity Procurement
Charge (2004 onwards)
Public Goods Charge (PGC)
POU Administered
Programs
Energy Efficiency
Renewables
Research and Development
Low Income Programs
WATER IN THE WEST A Public Goods Charge for Water 12

3.3 Investor Owned UtilitiesElectricity rates levied by California’s IOUs are set by the CPUC and based on each IOU’s revenue requirement- the money needed for the utility to operate and maintain facilities, cover capital expenses, and provide an opportunity to earn a profit (Donnelly, Christian-Smith, and Cooley 2013). A component of the rate is the Public Purpose Program (PPP) surcharge that accounts for approximately 6% of an IOU’s revenue requirement (Figure 3-3). The fee is nonbypassable as it cannot be avoided by any customer, and everyone is obligated to pay the charges (Ajami and Christian-Smith 2013). The PPP surcharge is levied on a per kilowatt-hour (kWh) basis and varies between each IOU and within each IOU’s rate schedule (Figure 3-4).
Figure 3-3: Average Electric Revenue Requirement for California’s Three Major IOUs, 2011
38.8% Generation
35.3% Distribution
8.3% Transmission
5.6% Public Purpose Programs
4.8% Ongoing Competition Transition Charge
7.3% DWR Bond Charge and Power Charge Revenues, Energy Recover Bonds, Nuclear Decommissioning and Francise Fee Surcharges
Source: California Public Utilities Commission 2011.
Figure 3-4: 2011 San Diego Gas and Electric (SDG&E) Public Purpose Program Rate Components
0.00341 0.00341
0.001890.00132
0.00244
0.00149
0
0.001
0.002
0.003
0.004
0.005
0.006
0.007
0.008
0.009
Commercial A Residential DR
cent
s/kW
h Procurement EE Surcharge
Non-Low Income (PGC)
Low Income
Sources: Scott Anders, Energy Policy Initiatives Center (USD EPIC); San Diego Gas and Electric 2011.
WATER IN THE WEST A Public Goods Charge for Water 13
The PPP levied by the IOUs from 1998 to 2011 had two components: low income and non-low income. The low-income components of the PPP surcharge, which are still active today, include two programs — the California Alternative Rates for Energy (CARE) Program, which provides low-income households with reduced energy bills; and the Low Income Energy Efficiency (LIEE) Program, which gives eligible households free energy education, energy efficient appliances and weatherization measures (California Public Utilities Commission 2010). Approximately one third of California’s households qualified for the CARE and LIEE Programs in 2006 (California Public Utilities Commission 2007). Only customers in IOU territories are eligible for CARE and LIEE support as low-income residents in POU territories were assumed to receive assistance from their local utility.
From 1998 to 2003, the non-low income component of the PPP was comprised solely of the PGC. In 2004, the Procurement surcharge was instituted as a way to accumulate more energy efficiency funds. This mechanism is still in use today. As discussed in the following sections, PGC collections were allocated to three different programs — energy efficiency, the renewable energy program, and research, development, and demonstration (RD&D), while the Procurement surcharge was exclusively for the energy efficiency programs. The IOUs managed their own energy efficiency programs, while the California Energy Commission (CEC) administered the renewable energy program and research and development programs.
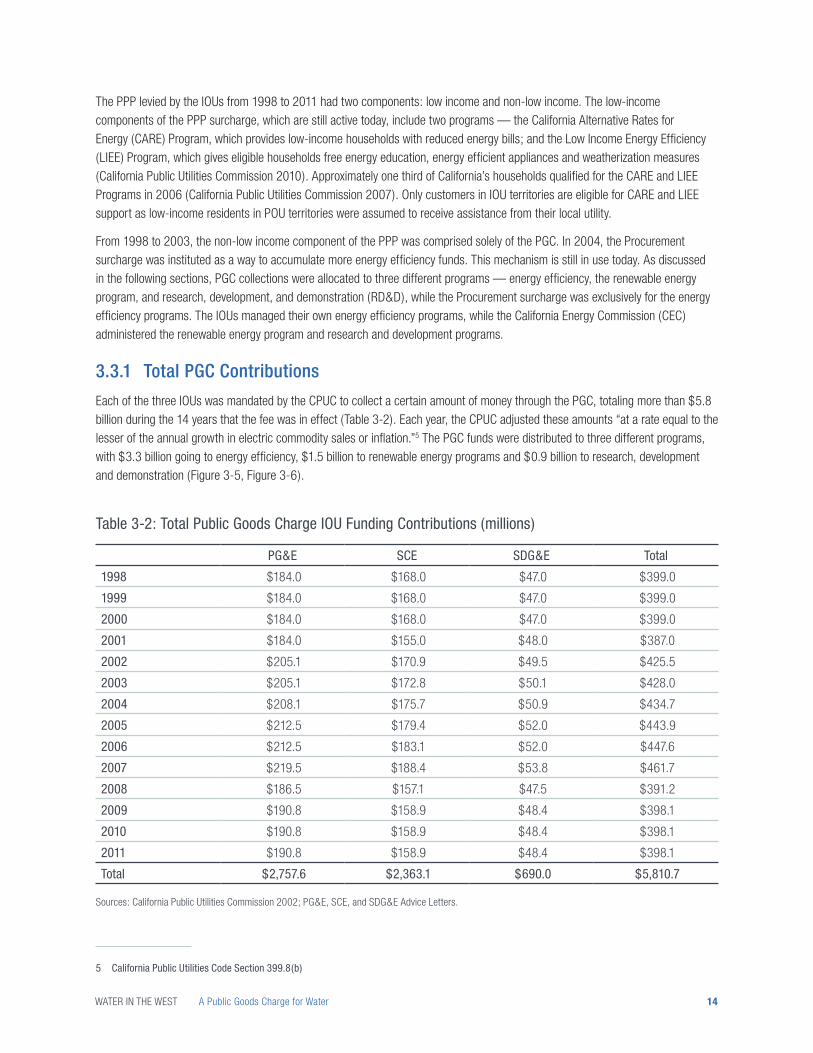
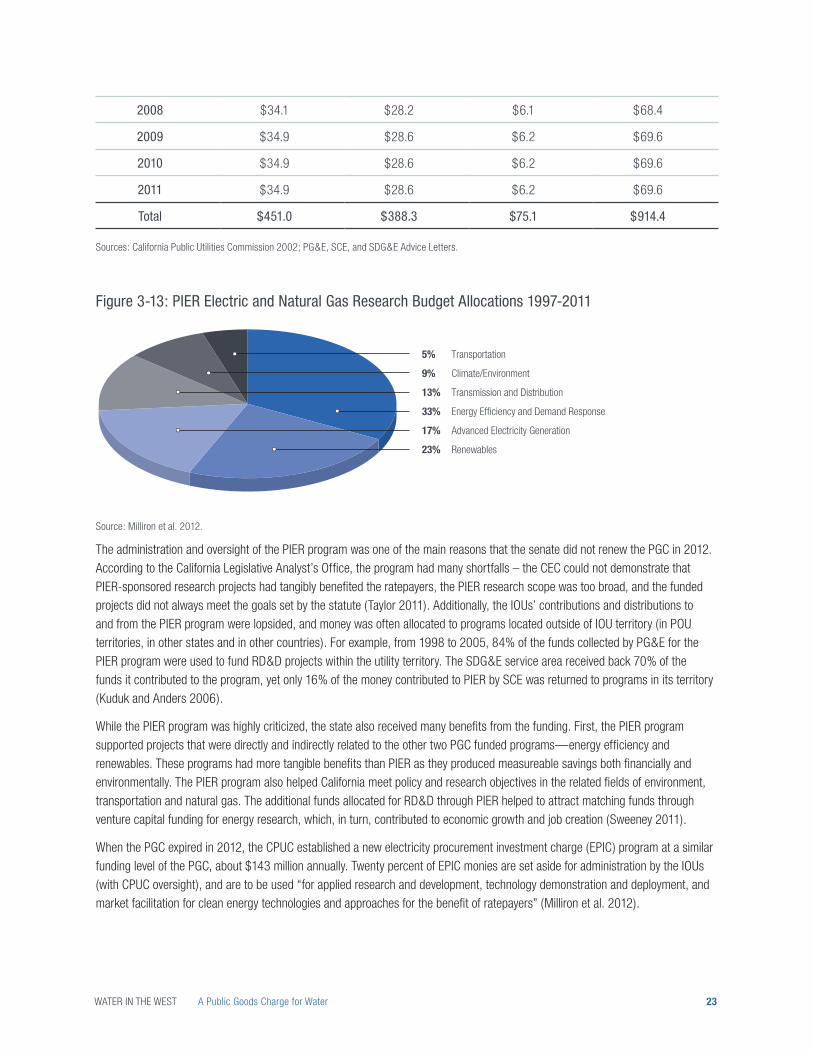
3.3.1 Total PGC ContributionsEach of the three IOUs was mandated by the CPUC to collect a certain amount of money through the PGC, totaling more than $5.8 billion during the 14 years that the fee was in effect (Table 3-2). Each year, the CPUC adjusted these amounts “at a rate equal to the lesser of the annual growth in electric commodity sales or inflation.”5 The PGC funds were distributed to three different programs, with $3.3 billion going to energy efficiency, $1.5 billion to renewable energy programs and $0.9 billion to research, development and demonstration (Figure 3-5, Figure 3-6).
Table 3-2: Total Public Goods Charge IOU Funding Contributions (millions)
PG&E SCE SDG&E Total
1998 $184.0 $168.0 $47.0 $399.0
1999 $184.0 $168.0 $47.0 $399.0
2000 $184.0 $168.0 $47.0 $399.0
2001 $184.0 $155.0 $48.0 $387.0
2002 $205.1 $170.9 $49.5 $425.5
2003 $205.1 $172.8 $50.1 $428.0
2004 $208.1 $175.7 $50.9 $434.7
2005 $212.5 $179.4 $52.0 $443.9
2006 $212.5 $183.1 $52.0 $447.6
2007 $219.5 $188.4 $53.8 $461.7
2008 $186.5 $157.1 $47.5 $391.2
2009 $190.8 $158.9 $48.4 $398.1
2010 $190.8 $158.9 $48.4 $398.1
2011 $190.8 $158.9 $48.4 $398.1
Total $2,757.6 $2,363.1 $690.0 $5,810.7
Sources: California Public Utilities Commission 2002; PG&E, SCE, and SDG&E Advice Letters.
5 California Public Utilities Code Section 399.8(b)
WATER IN THE WEST A Public Goods Charge for Water 14
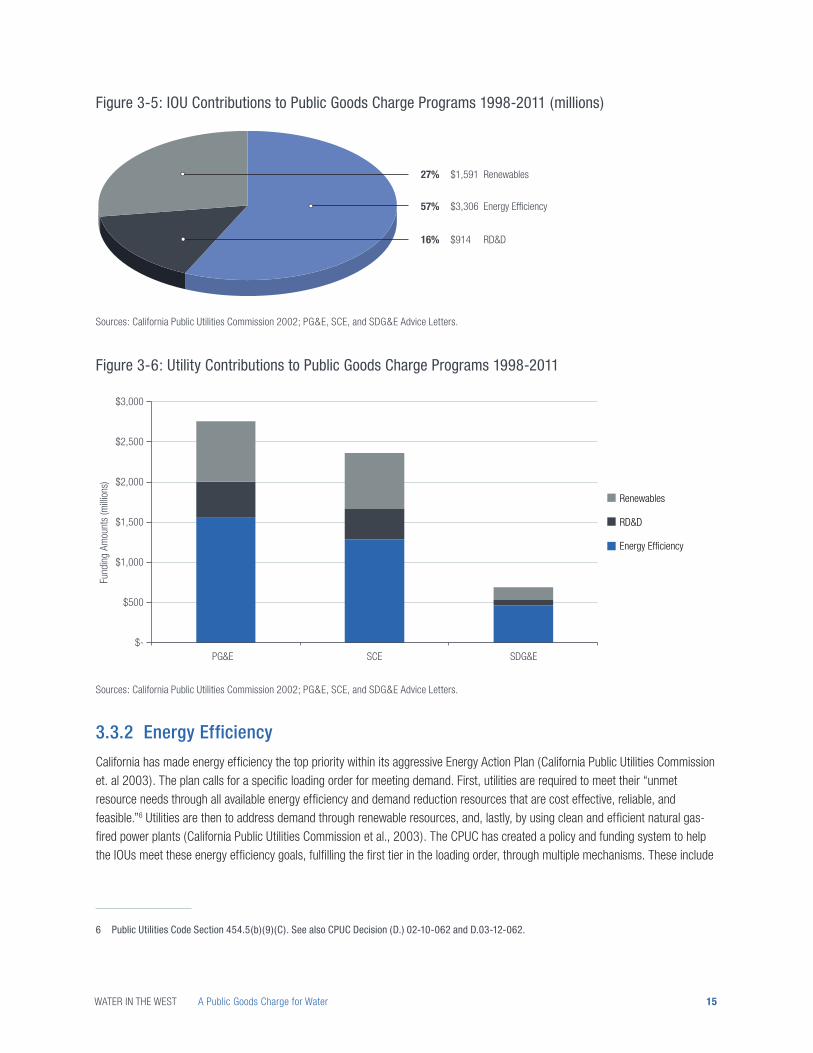
Figure 3-5: IOU Contributions to Public Goods Charge Programs 1998-2011 (millions)
16% $914 RD&D
57% $3,306 Energy Efficiency
27% $1,591 Renewables
Sources: California Public Utilities Commission 2002; PG&E, SCE, and SDG&E Advice Letters.
Figure 3-6: Utility Contributions to Public Goods Charge Programs 1998-2011
Renewables
RD&D
Energy Efficiency
$-
$500
$1,000
$1,500
$2,000
$2,500
$3,000
PG&E SCE SDG&E
Fund
ing
Amou
nts
(milli
ons)
Sources: California Public Utilities Commission 2002; PG&E, SCE, and SDG&E Advice Letters.
3.3.2 Energy EfficiencyCalifornia has made energy efficiency the top priority within its aggressive Energy Action Plan (California Public Utilities Commission et. al 2003). The plan calls for a specific loading order for meeting demand. First, utilities are required to meet their “unmet resource needs through all available energy efficiency and demand reduction resources that are cost effective, reliable, and feasible.”6 Utilities are then to address demand through renewable resources, and, lastly, by using clean and efficient natural gas-fired power plants (California Public Utilities Commission et al., 2003). The CPUC has created a policy and funding system to help the IOUs meet these energy efficiency goals, fulfilling the first tier in the loading order, through multiple mechanisms. These include
6 Public Utilities Code Section 454.5(b)(9)(C). See also CPUC Decision (D.) 02-10-062 and D.03-12-062.
WATER IN THE WEST A Public Goods Charge for Water 15

setting high efficiency goals, creating revenue requirements that decouple sales from revenues, and creating performance-based incentive programs (California Public Utilities Commission 2008). From 1998 to 2011, these energy efficiency measures were funded by two sources — PGC and Procurement collections.
While the PGC was in effect, the three IOUs were mandated to collect a certain amount from ratepayers for energy efficiency each year (Table 3 3) and the IOUs themselves administered the programs. More than half of the money collected by the IOUs through the PGC, more than $2.4 billion, went to energy efficiency efforts throughout the state. An additional $2.3 billion was added from 2004 to 2011 from money collected from ratepayers through the Procurement mechanism (Figure 3-7). The IOUs were responsible for allocating collected funds and for the planning, oversight and management of the energy efficiency subprograms (California Public Utilities Commission 2005). The energy efficiency programs were intended to create a sustainable and economical energy efficiency landscape by providing financial rebates, incentives and education to ratepayers to reduce barriers to investments in energy-efficient products and services (Kuduk and Anders 2006).
Table 3-3: IOU PGC Funding Requirements for Energy Efficiency Programs (millions)
PG&E SCE SDG&E Total
1998 $106.0 $90.0 $31.0 $227.0
1999 $106.0 $90.0 $31.0 $227.0
2000 $106.0 $90.0 $31.0 $227.0
2001 $106.0 $50.0 $32.0 $188.0
2002 $106.0 $90.0 $32.0 $228.0
2003 $106.0 $91.0 $32.4 $229.4
2004 $108.3 $92.5 $32.9 $233.8
2005 $110.6 $94.5 $33.6 $238.7
2006 $110.6 $96.4 $33.6 $240.7
2007 $114.2 $99.2 $34.8 $248.3
2008 $116.8 $99.3 $35.0 $251.1
2009 $119.4 $100.4 $35.7 $255.6
2010 $119.4 $100.4 $35.7 $255.6
2011 $119.4 $100.4 $35.7 $255.6
Total $1,555.0 $1,284.2 $466.4 $3,305.5
Sources: California Public Utilities Commission 2002; PG&E, SCE, and SDG&E Advice Letters.
WATER IN THE WEST A Public Goods Charge for Water 16

Figure 3-7: IOU Energy Efficiency Funding 1998-2011
0
100
200
300
400
500
600
700
800
900
1,000
IOU
Ener
gy E
fficie
ncy
Fund
ing
(milli
ons)
1998 1999 2000 2001 2002 2003 2004 2005 2006 2007 2008 2009 2010 2011
Procurement EE
PGC EE
Sources: PG&E, SCE, and SDG&E Advice Letters. California Public Utilities Commission Electric and Gas and Utility Cost Reports: Section 747 Reports to the Governor and Legislature (AB 67 Reports).
Money collected for energy efficiency was spent on agriculture, commercial, industrial and residential programs. It was distributed to the IOUs themselves, statewide programs, local government partnerships and third/local party implementers. Energy efficiency spending can be broken down into two components — measure costs and program costs. Measure costs are the funds used for directly implementing projects such as rebates, materials, labor and other financial incentives. Program costs include the expenditures needed to run the programs, including direct implementation costs, marketing and outreach, overhead, general administration and other miscellaneous expenditures. In the 2010-2012 funding cycle, energy efficiency programs administered by the IOUs spent half of their funds on measure costs and half on program costs (Figure 3-8).
The IOU’s administered their own energy efficiency programs and generally spent funds within or near the service area. Not all funds stayed within the region, but overall the monies were distributed mostly within the IOU areas from which they were collected (Figure 3-9). In the map below, counties with darker shading had a higher per-capita sum of money (collected by their serving IOU) spent on energy efficiency than the counties with lighter shading. Counties that are not shaded did not receive energy efficiency money from the IOU. Money spent outside of the service area tended to be significantly less than money spent inside the service area. Funds spent in areas outside of the service regions from which they were collected could still benefit IOU ratepayers. For example, funds spent on a generation facility outside of the service area would still yield savings for customers inside the service area. The utilities and the regulatory agencies did not track the PGC monies closely enough to adequately evaluate the costs and benefits of money spent outside of the utility area. This regional distribution of funds is one indication that a PGC could be an appropriate funding mechanism for the water sector moving forward.
WATER IN THE WEST A Public Goods Charge for Water 17

Figure 3-8: PG&E, SCE, and SDG&E Energy Efficiency Funding Allocations 2010-2012
Direct Implement
70%
Marketing and Outreach
11%
Overhead and Admin
11%
Other8%
EMV>1%
Rebates55%
Other Incentives
20%
Direct Install Labor
17%
Direct Install
Materials8%
Program Costs50%
Measure Costs50%
Source: California Public Utilities Commission 2014.
WATER IN THE WEST A Public Goods Charge for Water 18

Figure 3-9: Distribution of Energy Efficiency Spending by California’s Three Major IOUs by County – Average Annual Spending Per Capita 2010-2012
Source: California Public Utilities Commission 2014.
Note: Per capita based on 2012 population data from the U.S. Census Bureau.
Overall, California’s energy efficiency programs have been considered extremely successful, as they have decreased the state’s per capita energy demand and, consequently, created enormous economic and environmental benefits (Martinez, Wang, and Chou 2010). During the PGC era, 1998-2012, the rate at which statewide efficiency and conservation impacts increased was 1.8 times faster than the rate at which impacts increased from 1975 to 1998 (Figure 3-10). In 2012, when the PGC sunset, California’s
WATER IN THE WEST A Public Goods Charge for Water 19

per capita energy consumption was the third lowest in the country, despite having the highest population (Energy Information Administration 2014). Part of this success can be attributed to energy efficiency programs. The PGC and Procurement provided a dedicated funding stream for energy efficiency, which accelerated the uptake of efficiency measures throughout the state and transformed the electricity sector into a more sustainable one.
Figure 3-10: California Statewide Electricity Efficiency and Conservation Impacts
-
10,000
20,000
30,000
40,000
50,000
60,000
70,000
Cum
ulat
ive E
fficie
ncy
and
Cons
erva
tion
Impa
cts
(GW
h)
Public Goods Charge Era
1975 1977 1979 1981 1983 1985 1987 1989 1991 1993 1995 1997 1999 2001 2003 2005 2007 2009 2011
Source: California Energy Commission 2013.
Note: Impacts represent the cumulative GWh reductions to electricity consumption compared to the emissions without the efficiency and conservation measures.
3.3.3 Renewable Energy ProgramCalifornia’s renewable energy program provided fiscal incentives to renewable energy generators and end-use customers as a way to augment the state’s energy supply with renewable energy sources such as wind, solar, geothermal, biomass, landfill gas and small hydroelectricity (Kuduk and Anders 2006). The program was administered by the CEC, and was implemented through the Renewable Resources Trust Fund (RRTF). More than $1.5 billion dollars were allocated to the program over the 14 years that the PGC was active (Table 3-4) to support the dissemination of renewable technologies throughout the state. Expenditures included utility-level spending on new and existing renewable energy facilities as well as allocations on the customer scale for rebates on home systems, credits for choosing renewable energy and education (Chong et al., 2011).
WATER IN THE WEST A Public Goods Charge for Water 20

Table 3-4: IOU Funding Requirements for the Renewable Energy Program (millions)
PG&E SCE SDG&E Total
1998 $48.0 $49.5 $12.0 $109.5
1999 $48.0 $49.5 $12.0 $109.5
2000 $48.0 $49.5 $12.0 $109.5
2001 $48.0 $76.5 $12.0 $136.5
2002 $67.7 $55.3 $12.0 $135.0
2003 $67.7 $55.9 $12.1 $135.7
2004 $68.2 $56.8 $12.3 $137.3
2005 $69.6 $58.0 $12.6 $140.2
2006 $69.6 $59.3 $12.6 $141.5
2007 $71.9 $61.0 $13.0 $145.8
2008 $35.6 $29.6 $6.4 $71.6
2009 $36.5 $29.9 $6.5 $72.9
2010 $36.5 $29.9 $6.5 $72.9
2011 $36.5 $29.9 $6.5 $72.9
Total $751.7 $690.7 $148.5 $1,590.8
Sources: California Public Utilities Commission 2002; PG&E, SCE, and SDG&E Advice Letters.
The IOUs transferred PGC funds allocated for renewables to the CEC-managed trust fund quarterly. The CEC then allocated the funds to five main program areas: new renewable facilities, emerging renewables, existing renewables, consumer education and customer credit (Figure 3-11). The CEC also used some of the funds pay for staff costs, program implementation, eligibility certification and site registration (Chong et al., 2011).
Figure 3-11: Total PGC Contributions to the Renewable Energy Subprograms 1998-2011
40% New Renewable Facilities
25% Existing Renewables
27% Emerging Renewables
6% Customer Credit
2% Consumer Education
Source: Chong et al. 2011.
There were many changes within the renewable program during the time that the PGC was in effect (Figure 3-12). First, in 2003, the customer credit program was discontinued, and the monies were reallocated to the other four areas within the program. Then, in 2008, Senate Bill (SB) 1036 eliminated the New Renewable Resources Account, which effectively reduced renewables funding by 51.5%. The PGC funds were an essential source of funding for the IOUs working to meet the aggressive renewable energy goals set by the legislation and CPUC through the Energy Action Plan.
WATER IN THE WEST A Public Goods Charge for Water 21

Figure 3-12: Evolution of Renewables Funding from PGC Contributions, 1998-2011
0%
10%
20%
30%
40%
50%
60%
70%
80%
90%
100%
1998-2001 2002-2003 2004-2006 2007 2008-2011
Perc
enta
ge o
f Ren
ewab
les
Fund
ing
Customer Credit
Consumer Education
Existing Renewables
Emerging Renewables
New Renewable Facilities
Source: Chong et al. 2011.
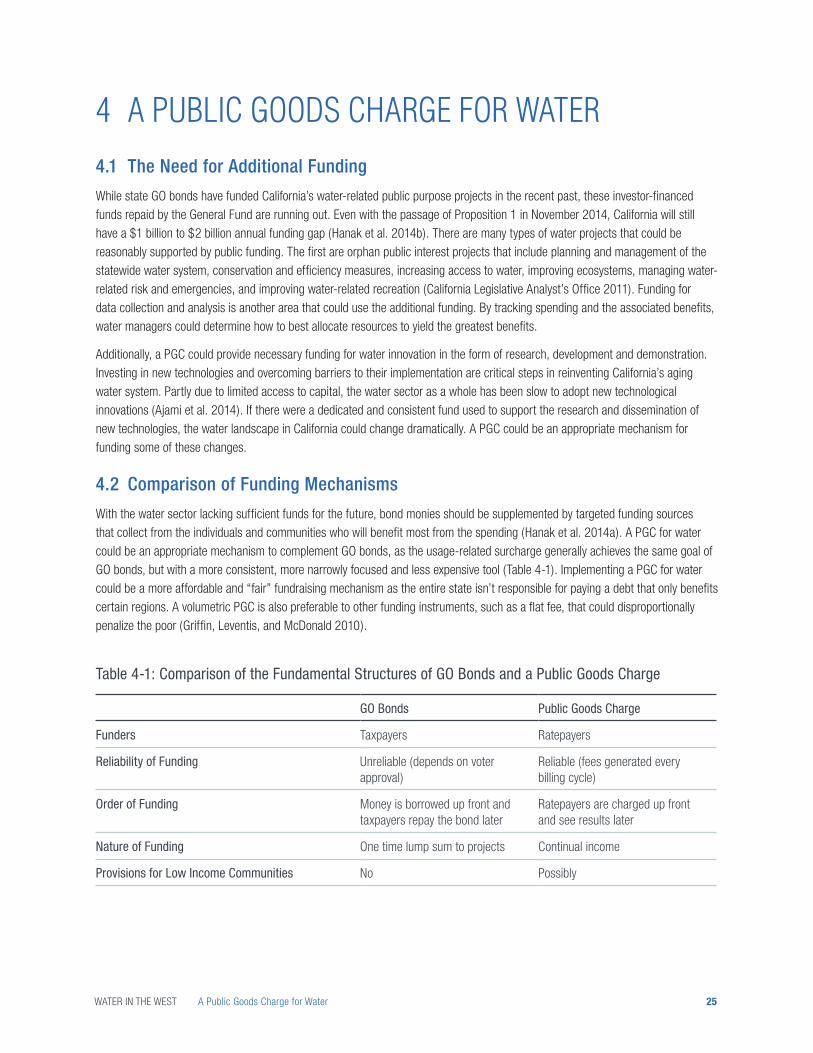
3.3.4 Research, Development, and Demonstration (PIER Program)The IOUs collected more than $0.9 billion over the life of the PGC for research, development, and demonstration (RD&D) (Table 3-5), the mechanism used to fund the Public Interest Energy Research (PIER) Program. The goal of the CEC-administered PIER program was to “fund research in energy efficiency and demand response, renewable energy resources, advanced energy generation, transmission and distribution and energy-related environmental research that is not adequately provided by competitive and regulated markets” (Figure 3-13) (Mohney and Patterson 2011). The CEC allocated funds to various utilities and research institutions around the state, country and world, with the overall goal of funding projects with the potential to advance California’s energy landscape.
Table 3-5: IOU Funding Requirements for Research, Development and Demonstration (millions)
PG&E SCE SDG&E Total
1998 $30.0 $28.5 $4.0 $62.5
1999 $30.0 $28.5 $4.0 $62.5
2000 $30.0 $28.5 $4.0 $62.5
2001 $30.0 $28.5 $4.0 $62.5
2002 $31.4 $25.6 $5.5 $62.5
2003 $31.4 $25.9 $5.6 $62.9
2004 $31.6 $26.3 $5.7 $63.6
2005 $32.3 $26.9 $5.8 $65.0
2006 $32.3 $27.4 $5.8 $65.5
2007 $33.3 $28.2 $6.0 $67.6
WATER IN THE WEST A Public Goods Charge for Water 22
2008 $34.1 $28.2 $6.1 $68.4
2009 $34.9 $28.6 $6.2 $69.6
2010 $34.9 $28.6 $6.2 $69.6
2011 $34.9 $28.6 $6.2 $69.6
Total $451.0 $388.3 $75.1 $914.4
Sources: California Public Utilities Commission 2002; PG&E, SCE, and SDG&E Advice Letters.
Figure 3-13: PIER Electric and Natural Gas Research Budget Allocations 1997-2011
5% Transportation
9% Climate/Environment
13% Transmission and Distribution
33% Energy Efficiency and Demand Response
17% Advanced Electricity Generation
23% Renewables
Source: Milliron et al. 2012.
The administration and oversight of the PIER program was one of the main reasons that the senate did not renew the PGC in 2012. According to the California Legislative Analyst’s Office, the program had many shortfalls – the CEC could not demonstrate that PIER-sponsored research projects had tangibly benefited the ratepayers, the PIER research scope was too broad, and the funded projects did not always meet the goals set by the statute (Taylor 2011). Additionally, the IOUs’ contributions and distributions to and from the PIER program were lopsided, and money was often allocated to programs located outside of IOU territory (in POU territories, in other states and in other countries). For example, from 1998 to 2005, 84% of the funds collected by PG&E for the PIER program were used to fund RD&D projects within the utility territory. The SDG&E service area received back 70% of the funds it contributed to the program, yet only 16% of the money contributed to PIER by SCE was returned to programs in its territory (Kuduk and Anders 2006).
While the PIER program was highly criticized, the state also received many benefits from the funding. First, the PIER program supported projects that were directly and indirectly related to the other two PGC funded programs—energy efficiency and renewables. These programs had more tangible benefits than PIER as they produced measureable savings both financially and environmentally. The PIER program also helped California meet policy and research objectives in the related fields of environment, transportation and natural gas. The additional funds allocated for RD&D through PIER helped to attract matching funds through venture capital funding for energy research, which, in turn, contributed to economic growth and job creation (Sweeney 2011).
When the PGC expired in 2012, the CPUC established a new electricity procurement investment charge (EPIC) program at a similar funding level of the PGC, about $143 million annually. Twenty percent of EPIC monies are set aside for administration by the IOUs (with CPUC oversight), and are to be used “for applied research and development, technology demonstration and deployment, and market facilitation for clean energy technologies and approaches for the benefit of ratepayers” (Milliron et al. 2012).
WATER IN THE WEST A Public Goods Charge for Water 23

3.4 Publicly Owned UtilitiesThere are 46 Publicly Owned Utilities (POUs) in California that provide approximately 22% of California’s electricity (California Energy Commission 2014). Each POU is a non-profit public agency that is governed by an elected board of officials. While AB 1890 also mandated that the POUs collect the public goods charge, sometimes referred to as the public benefits charge, from their customers, the bill was less specific about the amount of funds required to be collected. The legislation instead included a formula for calculating the charge that was based on the PGC funding requirements set by AB 1890 for the IOUs. Each IOU’s total required expenditure for public purpose programs was divided by the utility’s total 1994 revenue requirement, yielding a percentage. The POUs were required to collect the lowest of these three percentages (Raynor 1999). The amount that most of the POUs decided to collect was 2.85% of their total revenues collected. The specific percentage was not written into the legislation, and, therefore, the actual amount of funds allocated to public benefit programs could vary for each POU (Raynor 1999).
The PGC monies collected by the POUs went to the same program areas as the PGC funds collected by the IOUs:
• Low-income assistance programs
• Energy efficiency and demand-side management programs
• Renewable energy programs
• Research, development and demonstration programs
Each POU spent the money however they thought would best benefit their community. This meant that the POUs allocated their money differently depending on the demographics and industry in their service areas (Figure 3-14). POUs around the state have benefitted from the increased funding and the ability to spend the money so that it will most benefit their local community. From 2006 to 2012, California’s POUs spent more than $750 million on energy efficiency programs. They were able to reduce peak demand by more than 563 megawatts, and achieve more than 2.89 billion kWh in savings (California Municipal Utilities Association et al. 2013). The charge is still collected today.
Figure 3-14: Examples of POU Public Goods Charge Spending 2000-2011
Low Income
Energy Efficiency
Renewables
RD&D
0%
10%
20%
30%
40%
50%
60%
70%
80%
90%
100%
Modesto Irrigation District
Sacramento Municipal Utility District
Turlock Irrigation District
Dist
ribut
ion
of P
ublic
Ben
efits
Spe
ndin
g
Sources: Correspondence with Modesto Irrigation District, Sacramento Municipal Utility District (SMUD), and Turlock Irrigation District.
Note: Modesto did not begin collecting PGC money until 2001.
WATER IN THE WEST A Public Goods Charge for Water 24
4 A PUBLIC GOODS CHARGE FOR WATER4.1 The Need for Additional FundingWhile state GO bonds have funded California’s water-related public purpose projects in the recent past, these investor-financed funds repaid by the General Fund are running out. Even with the passage of Proposition 1 in November 2014, California will still have a $1 billion to $2 billion annual funding gap (Hanak et al. 2014b). There are many types of water projects that could be reasonably supported by public funding. The first are orphan public interest projects that include planning and management of the statewide water system, conservation and efficiency measures, increasing access to water, improving ecosystems, managing water-related risk and emergencies, and improving water-related recreation (California Legislative Analyst’s Office 2011). Funding for data collection and analysis is another area that could use the additional funding. By tracking spending and the associated benefits, water managers could determine how to best allocate resources to yield the greatest benefits.
Additionally, a PGC could provide necessary funding for water innovation in the form of research, development and demonstration. Investing in new technologies and overcoming barriers to their implementation are critical steps in reinventing California’s aging water system. Partly due to limited access to capital, the water sector as a whole has been slow to adopt new technological innovations (Ajami et al. 2014). If there were a dedicated and consistent fund used to support the research and dissemination of new technologies, the water landscape in California could change dramatically. A PGC could be an appropriate mechanism for funding some of these changes.
4.2 Comparison of Funding MechanismsWith the water sector lacking sufficient funds for the future, bond monies should be supplemented by targeted funding sources that collect from the individuals and communities who will benefit most from the spending (Hanak et al. 2014a). A PGC for water could be an appropriate mechanism to complement GO bonds, as the usage-related surcharge generally achieves the same goal of GO bonds, but with a more consistent, more narrowly focused and less expensive tool (Table 4-1). Implementing a PGC for water could be a more affordable and “fair” fundraising mechanism as the entire state isn’t responsible for paying a debt that only benefits certain regions. A volumetric PGC is also preferable to other funding instruments, such as a flat fee, that could disproportionally penalize the poor (Griffin, Leventis, and McDonald 2010).
Table 4-1: Comparison of the Fundamental Structures of GO Bonds and a Public Goods Charge
GO Bonds Public Goods Charge
Funders Taxpayers Ratepayers
Reliability of Funding Unreliable (depends on voter approval)
Reliable (fees generated every billing cycle)
Order of Funding Money is borrowed up front and taxpayers repay the bond later
Ratepayers are charged up front and see results later
Nature of Funding One time lump sum to projects Continual income
Provisions for Low Income Communities No Possibly
WATER IN THE WEST A Public Goods Charge for Water 25

4.3 GovernanceA PGC for water could be implemented at the state, regional or local level. Regardless of how the fee is realized, the funds raised by the volumetric fee should be used to fund public interest projects at the same scale from which the fee is collected. This would follow the beneficiary-pays principle. Different fee schedules may be needed for different industries and geographical regions. In addition to raising much needed funds, a volumetric fee through the PGC could help incentivize water users to conserve water.
Statewide, a PGC for water could look similar to the PGC for electricity. An existing state regulatory agency, such as the State Water Resource Control Board (SWRCB), could set funding requirements, and utilities or government agencies could oversee the collection and distribution of money. Alternatively, the state could create a new regulatory body such as a state-level water innovation office that would be responsible for identifying targeted opportunities, promoting policies, implementing programs, and encouraging collaboration between existing agencies (Ajami et al. 2014). However, there could be some barriers to a statewide implementation due to the decentralized nature of California’s water system.
Retail water utilities throughout the state can be grouped into various regional entities based on their watershed, wholesale water supplier and/or water district. The current integrated regional water resource management regions can be used to group utilities. A PGC could be imposed on water users at this scale. This is a practical way to implement the fee, as utilities within the same district often have similar geographical, environmental and financial landscapes, and share similar water challenges. One example of a regional entity already using this type of scheme is the Metropolitan Water District of Southern California (MWD). This consortium of 26 cities and water districts has taken the initiative to collect a volumetric fee for public purpose programs- a water stewardship rate, which “recovers the cost of Metropolitan’s financial commitment to conservation, water recycling, groundwater cleanup and other local resource management programs” (Metropolitan Water District of Southern California 2014). MWD has been collecting this fee since 2002. The monies are used to finance conservation programs within the district’s member agencies (Metropolitan Water District of Southern California 2001). The surcharge supports rebate programs for both residential and commercial consumers within the utilities service areas, research and development and education and outreach. Additionally, MWD has been working with the CPUC to quantify the energy savings that result from water conservation and efficiency efforts (Ajami and Christian-Smith 2013).
With many smaller, local, publicly owned utilities responsible for water throughout the state, a locally implemented PGC could be an appropriate way for the fee to be implemented. Publicly owned water utilities could levy a PGC on their water users to generate income for local public interest projects, including modernization through new technologies. Ratepayers would benefit directly. Local governing boards would be responsible for overseeing the collection and distribution of the fee, ensuring that utilities act in the best interest of their customers and address local needs. One obstacle to implementing a PGC at the local level, which is often cited by water managers, is Proposition 218, which imposes considerable barriers to any rate changes in the public sector. POUs implementing the PGC for electricity did not face this challenge as electricity and gas related fees are exempt from the proposition’s restrictions.7 With the majority of California’s water being provided by public utilities, Proposition 218 will present difficulties not only to a PGC, but also for other rate-raising campaigns that could be used for public projects. However, a PGC for water at the local level could benefit ratepayers in the region substantially. With water issues gaining political traction in the state, evidenced by the recent passage of Proposition 1, now could be the best time to gain support for such a surcharge.
Additionally, a PGC for water could be also set as a hybrid mechanism, operating at multiple scales and with utilities or regional entities collected fees and then sending dedicated funding pools to different governance levels to meet needs in each scale. For example, a regional entity could collect PGC monies, with some funds dedicated to local projects and other monies sent to upstream territories. The surcharge could also be structured in the same way as the energy efficiency portion of the PPP for electricity,
7 California Proposition 218 “Right to Vote on Taxes Act” XIII D Section 3 (b) (1996).
WATER IN THE WEST A Public Goods Charge for Water 26

including both the PGC and a separate procurement charge, with part of the money staying within the region for general public purpose programming and the rest spent on procurement or other dedicated uses.
4.4 Lessons Learned from the Electricity PGCIf a PGC for water is implemented, there could be many program benefits similar to those realized through the PGC for electricity. The PGC program was effective in transforming California’s energy landscape into a more efficient and sustainable one by creating a funding pool used solely for public purpose programming and research and development. Overall cost savings to customers from energy efficiency campaigns increased nearly five-fold during the first ten years of the PGC (Martinez, Wang, and Chou 2010), with additional savings during the last four years of the program and continuing into today with the Procurement surcharge. A water-related surcharge could yield the same types of benefits by creating a constant and focused stream of money dedicated to water public purpose programming.
A PGC for water could provide funding to bring innovation and modernization to California’s water sector. In order for California’s water sector to continue operations amid a changing water climate, scientific research and development must become a priority. Important new technologies could include water recycling, drinking water purification, groundwater measurement and conservation and efficiency devices and tools (Ajami at al. 2014). The water sector as a whole has been slow to embrace innovation, in part because of the industry’s lack of access to capital (Ajami et al. 2014). Diffusion of these advanced methods into the state’s aging water infrastructure system is critical for the future. The PGC could provide some of the funds for this transformation.
There are many lessons that the water sector can take away from the overall administration and management of the PGC for electricity. First, financial transparency and record keeping is critical. Money collected and spent through PGC programming should be carefully tracked to ensure that funds are spent appropriately, goals are met, and public benefits are achieved. The majority of PGC data assessed for this study was energy efficiency data, mainly because of availability and completeness. Energy efficiency data was available primarily due to the needs of the evaluation, measurement and verification (EM&V) projects and the emphasis that the CPUC Energy Division placed on standardizing the data systems. Detailed financial records for the renewable energy and PIER program were not accessible. Money collected and distributed through the PGC programs was not closely tracked, which meant that when the fee was expiring in 2012, there were limited records to demonstrate how the state benefitted from the program. This scarce documentation contributed to the PGC not being renewed.
Second, program priorities should be continually reevaluated to make sure that they are in line with the state of water within the region. As regulations change, technology advances, and climate change transforms water resources, water managers must regularly assess what projects are needed and appropriate to fund. When the PGC was implemented in 1996, the energy landscape was considerably different than when the program ended in 2012. This was mostly due to enactment of several changes in energy policy objectives (Taylor 2011). This created the need for new research in order to achieve state goals. As 2015 begins with almost 80% of California in an extreme or exceptional drought (U.S. Drought Monitor January 2015), priorities are concentrated in water supply and reliability. During different climatic eras, water managers tend to focus on different problems, such as water quality. Climate change and population growth are altering the state of water and it is important that PGC-funded projects reflect the most pressing issues.
Third, investment in research and development should be specific and clearly defined. The PIER program, the mechanism used to fund RD&D within the PGC program, was one of the most successful yet most controversial parts of the PGC. It is often cited as one of the main reasons that the PGC was not renewed. In reviewing the PIER program, the LAO found that key problems with the program included the program’s “lack of focus and weak strategic tie to the state’s current energy goals” (Taylor 2011). The CEC funded projects that were aligned with the overall strategy of the program, yet the funding requirements were not defined clearly enough. Funds generated from a PGC should be prudently distributed to programs and projects that have a direct benefit to the public.
WATER IN THE WEST A Public Goods Charge for Water 27

5 CONCLUSIONCalifornia’s fragmented water sector is in a funding dilemma as it faces new challenges that require supplementary funding. The ability of local and state governments to raise funds is restricted. Water utilities must find a way to finance public purpose projects, including conservation and efficiency measures, which benefit the public as a whole. In recent years, California has relied on GO bonds to fund these programs as other financing tools, such as local bonds and taxes, have become more difficult to pass. However, GO bonds can be unreliable, as they must survive the legislative process and require voter approval; unfair, as they can benefit certain taxpayers more than others throughout the state; and expensive, as bond debt repayment grows. California must therefore adopt additional funding mechanisms to advance innovation in the water sector, and to support water public purpose projects that have become “fiscal orphans” throughout the state (Hanak et al. 2014b). A PGC is not meant to replace financial tools currently in place to support California’s water system, but should instead be considered a supplemental way to address some financial shortfalls of the state and its water utilities.
Although the water and electricity sectors operate differently, the water sector can benefit from examining practices employed by the state’s electric utilities. One way that California’s electricity sector has worked to overcome funding deficits for public interest programs and research and development projects is by implementing a usage-related fee called the Public Goods Charge (PGC). From 1998 to 2011, California’s three major IOUs, and, to a lesser extent, the state’s POUs, collected a public purpose program surcharge that included both low income and non-low income components. The non-low income component included both the Procurement surcharge and the PGC. The funds collected from the PGC were used to support energy efficiency, renewable energy and research and development throughout the utility areas and the state. Unlike GO bonds, the money was distributed more locally and was more concentrated within the utilities’ service area. The PGC expired in 2012, and was not renewed. However, the utilities continue to impose the Procurement energy efficiency surcharge and the POU’s actively collect monies for public purposes.
We find that a PGC, implemented at the state, regional, local or multi-level scale, could be a suitable mechanism for additional water financing. The surcharge generally achieves the same goals as GO bonds, but is a more steady and dedicated tool. A PGC for water could be less expensive than bonds, which accrue interest and are costly to both the state and taxpayers. The fee could be a more “fair” fundraising mechanism than statewide bonds as money is distributed more locally with direct benefits to ratepayers. The PGC program could be adapted to the water sector by incorporating both the best practices and lessons learned from the PGC for electricity. The fee has the potential to modernize California’s water sector by creating a pool of money for research, development and dissemination that could help transform water resources throughout the state. Additionally, the fee could be used to fund many orphan public purpose projects that would not otherwise be funded such as ecosystem restoration that could benefit both ratepayers and the state as a whole. If a PGC program is implemented, its administrators should keep consistent financial records, continually evaluate programs and projects to make sure they are in line with the current state of water and needs, and clearly define what types of RD&D projects should be funded.
While some utilities and regional entities have already taken the initiative to collect a volumetric fee, few utilities finance public purpose projects through a usage-based surcharge. There are currently no broader water funding mechanisms that parallel the electricity PGC (California Legislative Analyst’s Office 2011). State GO bonds have helped fill key funding gaps in the recent past, but California needs to find additional, reliable and sustainable sources of funding to supplement bond funding and keep the state’s water system from failing (Hanak et al. 2014b). A PGC for water could be one such mechanism for the future.
WATER IN THE WEST A Public Goods Charge for Water 28

6 REFERENCESAjami, Newsha and Juliet Christian-Smith. 2013. “Beyond Water Pricing: An Overview of Water Financing Options in California.”
Pacific Institute, Oakland, CA.
Ajami, Newsha, Barton H. Thompson Jr., and David G. Victor. 2014. “The Path to Water Innovation.” The Hamilton Project, Brookings Institution, Washington, DC.
California Department of Water Resources. 2013. “Draft California Water Plan Update: Investment in Innovation and Infrastructure.” California Department of Water Resources, Sacramento.
California Energy Commission. 2011. “Publicly- Owned Utility Company Programs.” http://www.energy.ca.gov/sb1/pou_reports/Publicly_Owned_Utility_Company_Programs.pdf. California Energy Commission, Sacramento.
California Energy Commission. 2013. “Tracking Progress: Energy Efficiency.” http://www.energy.ca.gov/renewables/tracking_progress/documents/energy_efficiency.pdf. California Energy Commission, Sacramento.
California Energy Commission. 2014. California Electric Utility Service Areas Map. http://www.energy.ca.gov/maps/serviceareas/Electric_Service_Areas_Detail.pdf. California Energy Commission, Sacramento.
California Legislative Analyst’s Office. 2009. “Financing Water Infrastructure.” California Legislative Analyst’s Office, Sacramento.
California Legislative Analyst’s Office. 2011. “Funding Public-Purpose Water-Related Activities.” California Legislative Analyst’s Office, Sacramento.
California Legislative Analyst’s Office. 2014. “Proposition 1: Water Quality, Supply, and Infrastructure Improvement Act of 2014. AB 1471 (Chapter 188, Statutes of 2014), Rendon. Bond Measure.” California Legislative Analyst’s Office, Sacramento.
California Municipal Utilities Association. 2004. “Publicly Owned Utilities: What Makes Us Different.” http://www.cmua.org/documents/About_POUs.pdf. California Municipal Utilities Association, Sacramento.
California Municipal Utilities Association, Northern California Power Agency, and Southern California Public Power Authority. 2013. “Energy Efficiency in California’s Public Power Sector: A 2013 Status Report.” California Municipal Utilities Association, Sacramento.
California Public Utilities Commission. 2002. Resolution E-3792. California Public Utilities Commission, Sacramento.
California Public Utilities Commission, California Energy Commission, and Conservation Financing Authority. 2003. “Energy Action Plan I.” http://docs.cpuc.ca.gov/word_pdf/REPORT/28715.pdf. California Public Utilities Commission, Sacramento and California Energy Commission, Sacramento.
California Public Utilities Commission. 2004-2012. “Gas and Electric Utility Cost Report: Section 747 Report to the Governor and Legislature.” California Public Utilities Commission, Sacramento.
California Public Utilities Commission. 2005. “Interim Opinion On The Administrative Structure For Energy Efficiency: Threshold Issues.” California Public Utilities Commission, Sacramento.
California Public Utilities Commission. 2007 “Final Report on Phase 2 Low Income Needs Assessment.” http://www.calmac.org/publications/Needs_Assessment-Final_Report-Sept-2007ES.pdf. California Public Utilities Commission, Sacramento.
WATER IN THE WEST A Public Goods Charge for Water 29
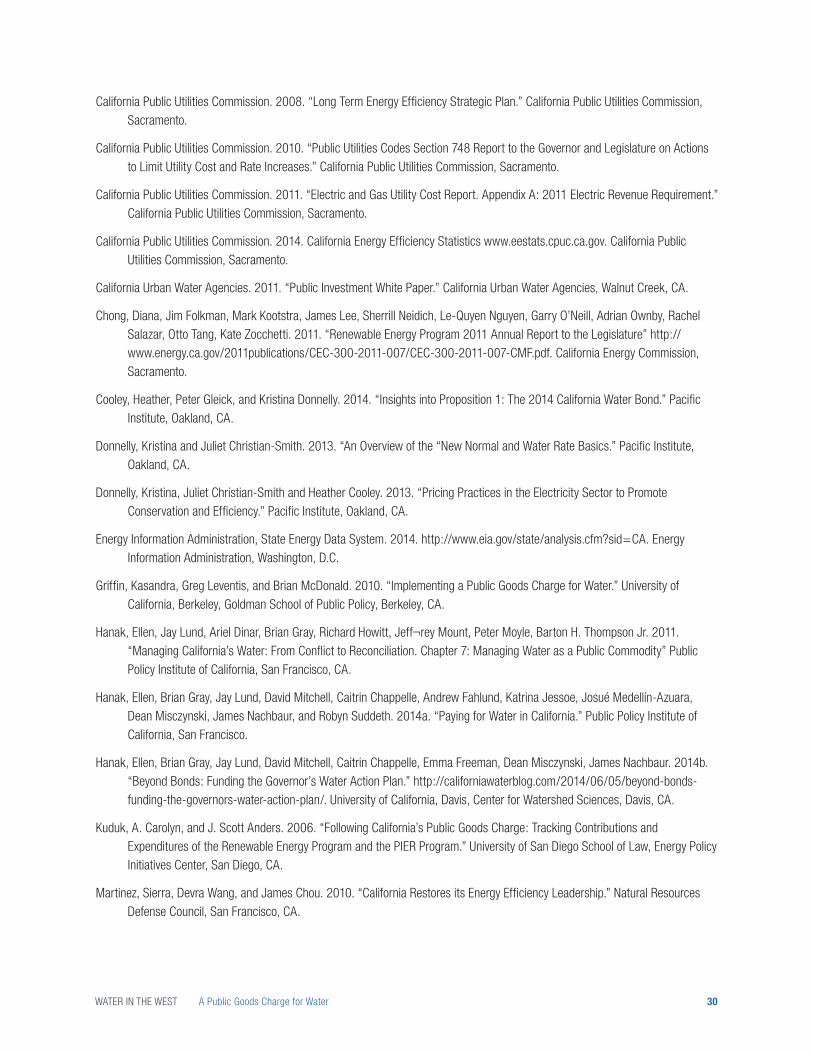
California Public Utilities Commission. 2008. “Long Term Energy Efficiency Strategic Plan.” California Public Utilities Commission, Sacramento.
California Public Utilities Commission. 2010. “Public Utilities Codes Section 748 Report to the Governor and Legislature on Actions to Limit Utility Cost and Rate Increases.” California Public Utilities Commission, Sacramento.
California Public Utilities Commission. 2011. “Electric and Gas Utility Cost Report. Appendix A: 2011 Electric Revenue Requirement.” California Public Utilities Commission, Sacramento.
California Public Utilities Commission. 2014. California Energy Efficiency Statistics www.eestats.cpuc.ca.gov. California Public Utilities Commission, Sacramento.
California Urban Water Agencies. 2011. “Public Investment White Paper.” California Urban Water Agencies, Walnut Creek, CA.
Chong, Diana, Jim Folkman, Mark Kootstra, James Lee, Sherrill Neidich, Le-Quyen Nguyen, Garry O’Neill, Adrian Ownby, Rachel Salazar, Otto Tang, Kate Zocchetti. 2011. “Renewable Energy Program 2011 Annual Report to the Legislature” http://www.energy.ca.gov/2011publications/CEC-300-2011-007/CEC-300-2011-007-CMF.pdf. California Energy Commission, Sacramento.
Cooley, Heather, Peter Gleick, and Kristina Donnelly. 2014. “Insights into Proposition 1: The 2014 California Water Bond.” Pacific Institute, Oakland, CA.
Donnelly, Kristina and Juliet Christian-Smith. 2013. “An Overview of the “New Normal and Water Rate Basics.” Pacific Institute, Oakland, CA.
Donnelly, Kristina, Juliet Christian-Smith and Heather Cooley. 2013. “Pricing Practices in the Electricity Sector to Promote Conservation and Efficiency.” Pacific Institute, Oakland, CA.
Energy Information Administration, State Energy Data System. 2014. http://www.eia.gov/state/analysis.cfm?sid=CA. Energy Information Administration, Washington, D.C.
Griffin, Kasandra, Greg Leventis, and Brian McDonald. 2010. “Implementing a Public Goods Charge for Water.” University of California, Berkeley, Goldman School of Public Policy, Berkeley, CA.
Hanak, Ellen, Jay Lund, Ariel Dinar, Brian Gray, Richard Howitt, Jeff¬rey Mount, Peter Moyle, Barton H. Thompson Jr. 2011. “Managing California’s Water: From Conflict to Reconciliation. Chapter 7: Managing Water as a Public Commodity” Public Policy Institute of California, San Francisco, CA.
Hanak, Ellen, Brian Gray, Jay Lund, David Mitchell, Caitrin Chappelle, Andrew Fahlund, Katrina Jessoe, Josué Medellín-Azuara, Dean Misczynski, James Nachbaur, and Robyn Suddeth. 2014a. “Paying for Water in California.” Public Policy Institute of California, San Francisco.
Hanak, Ellen, Brian Gray, Jay Lund, David Mitchell, Caitrin Chappelle, Emma Freeman, Dean Misczynski, James Nachbaur. 2014b. “Beyond Bonds: Funding the Governor’s Water Action Plan.” http://californiawaterblog.com/2014/06/05/beyond-bonds-funding-the-governors-water-action-plan/. University of California, Davis, Center for Watershed Sciences, Davis, CA.
Kuduk, A. Carolyn, and J. Scott Anders. 2006. “Following California’s Public Goods Charge: Tracking Contributions and Expenditures of the Renewable Energy Program and the PIER Program.” University of San Diego School of Law, Energy Policy Initiatives Center, San Diego, CA.
Martinez, Sierra, Devra Wang, and James Chou. 2010. “California Restores its Energy Efficiency Leadership.” Natural Resources Defense Council, San Francisco, CA.
WATER IN THE WEST A Public Goods Charge for Water 30
Metropolitan Water District of Southern California. 2001. “Annual Progress Report to the California State Legislature, Achievements in Conservation, Recycling and Groundwater Recharge.” Metropolitan Water District of Southern California, Los Angeles.
Metropolitan Water District of Southern California. 2014. “Adopted Water Rates & Charges.” http://www.mwdh2o.com/mwdh2o/pages/finance/finance_03.html. Metropolitan Water District of Southern California, Los Angeles.
Milliron, Misa, Linda Spiegel, and Janna Franks. 2012. “Public Interest Energy Research 2011 Annual Report (CEC�500�2012�003�CMF).” California Energy Commission, Energy Research and Development Division, Sacramento.
Mohney, Leah, and Jamie Patterson. 2011 “Public Interest Energy Research 2010 Annual Report (CEC�500�2011�031 CMF).” California Energy Commission, Sacramento.
Public Policy Institute of California. 2013. Data Set: Sate General Obligation Bond Spending on Water. http://www.ppic.org/main/dataSet.asp?i=1458. Public Policy Institute of California, San Francisco.
Raynor, Michelle. 1999. “California Energy Commission Survey of Public Benefit Programs of Publicly Owned Utilities in California.” California Energy Commission, Sacramento.
San Diego Gas and Electric. 2011. Advice Letter 2222-E. http://www.sdge.com/tm2/pdf/2222-E.pdf. San Diego Gas and Electric, San Diego, CA.
Sokolow, A.D. 1997. “Proposition 218: How it Works and What it Means.” http://ucanr.edu/sites/UC_CCP/files/125945.pdf. University of California, Davis.
Southern California Edison. 2004. Advice Letter 1768-E, Section S. Southern California Edison, Rosemead.
Strickland, Wes. 2013. “The Organization of Water Utilities in California.” http://privatewaterlaw.com/2013/09/25/the-organization-of-water-utilities-in-california/
Sweeney, James L. February 27, 2011. Letter to Senator Alex Padilla and the Members of the Senate Energy Committee. Precourt Energy Efficiency Center, Stanford University, CA.
Taylor, Mac. March 29, 2011. Letter to Senator Alex Padilla on the Public Interest Energy Research (PIER) program. California Legislative Analyst’s Office (LAO), Sacramento.
U.S. Drought Monitor. The National Drought Mitigation Center, Lincoln, NE. Accessed January 15, 2015.
WATER IN THE WEST A Public Goods Charge for Water 31

WATER IN THE WEST A Public Goods Charge for Water 32


For more information visit:waterinthewest.stanford.edu
Water in the WestStanford UniversityJerry Yang & Akiko Yamazaki Environment& Energy Building473 Via Ortega, MC 4205Stanford, CA [email protected]
Related Documents