1 Funding Liquidity and Equity Liquidity in the Subprime Crisis Period: Evidence from the Financial ETFs Market Junmao Chiu, Huimin Chung, Keng-Yu Ho ∗ _____________________________________________________________________ ABSTRACT Using financial ETFs from various financial industries, we set out in this study to explore the relationship between funding liquidity and equity liquidity. We measure funding liquidity from the interbank as well as the collateral markets and examine how funding liquidity affects bid-ask spread, market depth, and net buying volume during the subprime crisis period. Our results show that a higher degree of funding illiquidity leads to an increase in bid-ask spread and a decrease in market depth and net buying volume, indicating that equity liquidity tends to decrease. However, we find evidence of an adverse relationship between net buying volume and funding liquidity for the global ETFs. Based on the event study, we find that there is a significant net buying volume during the Bear Stearns event, but funding illiquidity decreases equity liquidity more significantly following the bankruptcy of Lehman Brothers. Overall, our study provides a better understanding of the role of the liquidity-supplier funding constraint during the subprime crisis period. Keywords: Equity Liquidity; Funding Liquidity; Collateral Market; Interbank Market; Subprime Crisis JEL Classification: G00; G01; G12 ∗ Junmao Chiu and Huimin Chung (the corresponding author) are both with the Graduate Institute of Finance, National Chiao Tung University, Taiwan, and Keng-Yu Ho is with the Department of Finance, National Taiwan University, Taiwan. Address for correspondence: Graduate Institute of Finance, National Chiao Tung University, 1001 Ta-Hsueh Road, Hsinchu 30050, Taiwan; Tel: +886-3-5712121, ext. 57075; Fax: +886-3-5733260; e-mail: [email protected].

Welcome message from author
This document is posted to help you gain knowledge. Please leave a comment to let me know what you think about it! Share it to your friends and learn new things together.
Transcript

1
Funding Liquidity and Equity Liquidity in the Subprime Crisis
Period: Evidence from the Financial ETFs Market
Junmao Chiu, Huimin Chung, Keng-Yu Ho∗
_____________________________________________________________________ ABSTRACT Using financial ETFs from various financial industries, we set out in this study to explore the relationship between funding liquidity and equity liquidity. We measure funding liquidity from the interbank as well as the collateral markets and examine how funding liquidity affects bid-ask spread, market depth, and net buying volume during the subprime crisis period. Our results show that a higher degree of funding illiquidity leads to an increase in bid-ask spread and a decrease in market depth and net buying volume, indicating that equity liquidity tends to decrease. However, we find evidence of an adverse relationship between net buying volume and funding liquidity for the global ETFs. Based on the event study, we find that there is a significant net buying volume during the Bear Stearns event, but funding illiquidity decreases equity liquidity more significantly following the bankruptcy of Lehman Brothers. Overall, our study provides a better understanding of the role of the liquidity-supplier funding constraint during the subprime crisis period. Keywords: Equity Liquidity; Funding Liquidity; Collateral Market; Interbank
Market; Subprime Crisis JEL Classification: G00; G01; G12
∗ Junmao Chiu and Huimin Chung (the corresponding author) are both with the Graduate Institute of Finance, National Chiao Tung University, Taiwan, and Keng-Yu Ho is with the Department of Finance, National Taiwan University, Taiwan. Address for correspondence: Graduate Institute of Finance, National Chiao Tung University, 1001 Ta-Hsueh Road, Hsinchu 30050, Taiwan; Tel: +886-3-5712121, ext. 57075; Fax: +886-3-5733260; e-mail: [email protected].
2
1. INTRODUCTION
In recent research, the funding constraint of liquidity suppliers has received much
attention. When securities prices decline below their fundamental values, the financial
intermediaries, market makers, and arbitrageurs could face funding constraint due to
the risk of higher margins and the losses in the existing positions. They thus are
withdrawn from providing liquidity and could become short-term liquidity demanders
instead. They could also rush to liquidate their position following negative shocks,
causing equity illiquidity and price to decline further. In this paper, we explore
empirically the relationship between funding and equity liquidity in the subprime crisis
period.
The liquidity crisis began in early 2007, when there was an increase in subprime
mortgage defaults. The subprime crisis caused the value of subprime mortgage related
assets and securities held by financial intermediaries to decline. In addition, the
funding problem for financial intermediaries led them to seek financing sources from
short-term collateral market (asset-backed commercial paper and Repo). As investors
decided not to reinvest their proceeds as the collateral matured, the liquidity of the
collateral market dried up, which made the financial intermediaries difficult to roll
over their short-term liabilities.
Although many financial intermediaries (conduits and SIVs) have been set up
with back-up liquidity lines from banks, during the subprime crisis, banks were
unwilling to lend to each other except for very short-term maturities, such as overnight
to one-week, without knowing more about the risk involved and their own imminent
liquidity needs. Questions about counterparty insolvency have also kept interbank
markets illiquid. When hedge funds and financial intermediations found it difficult to
3
roll over their short-term liabilities from collateral as well as interbank markets, they
began to sell their existing portfolios to meet funding constraint.1 As a result, equity
liquidity decreased further.
We now discuss previous studies regarding the relationship between the funding
constraint and market liquidity. First, many studies examine how the funding
constraint affects the liquidity providing by arbitrageurs and market makers. For the
theoretical foundation, Kyle and Xiong (2001) argue that arbitrage provides liquidity
into the market when the price deviates from fundament value. If the arbitrageurs
exhibit decreasing risk aversion or face funding constraints, they may instead become
liquidity demanders as they liquidate their position in the risky assets. In addition,
liquidity provision from arbitrage could benefits all investors (Gromb and Vayanos,
2002). Empirically, Mitchell, Pedersen, and Pulvino (2007) examine whether
convertible and merger arbitrageurs provide immediate liquidity. They find that when
the external capital shocks force liquidity providers to become liquidity demanders, it
can remain for several months before recovering back to equilibrium. Using
market-maker balance sheet and income statement information, Comerton-Forde,
Hendershott, Jones, Moulton, and Seasholes (2010) find that when specialists have
larger position or loss money on their inventories, aggregate market-level and
specialist firm-level spread are significantly wider in the days that follow. Their results
suggest liquidity suppliers’ financing constraints matter.
Second, other studies argue that the funding constraint plays an important role in
how bank runs and risk management affect market liquidity. Bernardo and Welch
(2004) extend the Diamond and Dybvig (1983) model of bank runs into the financial
system. They find that liquidity runs and crisis are caused by the fear of future
1 See Caruana and Kodres (2008).

4
liquidity shock and margin constraints. Since investors fear possible liquidation in the
future, they prefer to sell their shares today. Furthermore, Garleanu and Pedersen
(2007) link the risk management to liquidity. They propose that if market volatility
increases, or if the agent faces funding constraint and risk-bearing capacity reduction,
risk management would be tighter and would induce to market illiquidity.
Third, recent studies use the funding liquidity to measure liquidity suppliers’
funding situation. Brunnermeier and Pedersen (2009) provide a model linking market
and funding liquidity and argue that liquidity spirals triggered by a large liquidity
shock result in larger margin requirements and losses on existing positions. This
restricts dealers further from providing equity liquidity. Hameed, Kang, and
Viswanathan (2010) explore the relationship between market decline and liquidity
dry-up as the indication of capital constraints in the marketplace. The results show that
market liquidity reduction following market decline is related to the tightness in
funding liquidity. Using multivariate GARCH model, Frank, Gonzalez-Hermosillo,
and Hesse (2008) examine the liquidity spillovers from 2006 to 2007. They find that
the relationship between market and funding liquidity is increasingly strong in the U.S.
market. In particular, the funding illiquidity shocks in the U.S. asset-backed
commercial paper (ABCP) market were contagion to other advanced countries.
Our study makes a number of contributions to the extant literature. We use the
funding costs in the interbank and collateral markets to proxy liquidity suppliers’
funding situation. The interbank market could measure the lending channel hoarding
and the collateral market could measure the borrowers’ balance sheet deterioration. We
then examine how funding liquidity affect bid-ask spread, market depth, and net

5
buying volume during subprime crisis period in the financial ETF market.2 We focus
on the financial ETF markets, because the financial industry is the most directly
affected industry during the subprime crisis. Furthermore, we examine whether there
are any systematic differences relationship between equity and funding liquidity based
on two important events, Bear Stearns and Lehman Brothers, in the subprime crisis
period.
We use ETF data for the following reasons. First, ETFs) are usually more liquid
and are more suitable for our research question, since funding problem could lead
investors to liquidate more liquid assets from their portfolio first. Second, using
financial ETFs on various financial subgroups, we could examine whether different
types of financial ETFs would have different relationship between equity and funding
liquidity.
Finally, previous studies have generally used daily or lower frequency data. The
use of lower frequency data may not be able to detect the interaction relation between
equity and funding liquidity if it occurs for relatively short time periods and is masked
by the aggregate nature of the data. The higher frequency data used in our study allows
us to draw more precise inferences.
Our empirical findings are summarized as follows. First, our findings show that a
higher funding illiquidity leads to an increase in bid-ask spread and decrease in market
depth, indicating that equity liquidity tend to decrease. The results provide support to the
story of liquidity supplier’s funding constraint during the subprime crisis period as well
as to the theory of Brunnermeier and Pedersen (2009).
Second, we find that when the funding liquidity decreases, investors would place
more sell orders, leading to a decrease in net buying volume. However, we find an 2 We divide the financial ETFs into 5 groups (broad financial sector, bank, broker and asset management, insurance, and global).

6
adverse result for the global ETFs. We suggest that since higher funding illiquidity
could increase volatility, investors would thus choose to invest in different countries in
order to diversify their risk, leading to an increase in net buying volume for the global
ETFs.
Third, for the Bear Stearns and Lehman Brothers events, we find that there is a
significant net buying volume in the Bear Stearns event since investors tend to believe
that the Bear Stearns was treated as “too big to fail” by the Federal Reserve. However, we
find that funding illiquidity decreases equity liquidity more significantly than other event
days after the Lehman Brothers bankruptcy.
The remainder of this paper is organized as follows. Section 2 describes the data
and research methodology used in this study and develops our testing hypotheses.
Section 3 analyzes the empirical results. Finally, the conclusions are drawn in Section 4.
2. DATA SOURCE AND RESEARCH METHODOLOGY
2.1 Data Source and Sample Selection
In this study, we include 14 financial ETFs whose average daily trading volumes
are must higher than 11,000 units and divide them into 5 groups.3 In the broad U.S.
financial sector group, the underlying index includes broad financial business in U.S.,
such as commercial and investment banking, capital markets, diversified financial
services, insurance, and real estate. In the banking group, the underlying index
includes national money center banks and regional banking institutions listed on the
U.S. stock markets. In the broker and asset management group, the underlying index
includes securities brokers and dealers, online brokers, asset managers, and securities
or commodities exchanges. The insurance industry includes personal and commercial
3 Our research samples are detailed in the Appendix 1.

7
lines, property/casualty, life insurance, reinsurance, brokerage, and financial guarantee.
Finally, for the global group, the underlying index includes major financial companies
in the markets outside of the U.S. and Canada. In addition, we exclude days with no
trading volume data from our research samples.
We then employ intraday data on ETFs taken from the NYSE Trade and Quote
(TAQ) database, using the daily abstract trading and quoting data from 9:30 am to 4:00
pm. We follow the previous literature on controlling different trading mechanism and
include all the data in AMEX, NYSE, NYSE Arca, NASDAQ, NASDAQ (ADF), and
National Stock exchanges. The period under examination is the post-decimalization
period which runs from 1 January, 2007 to 31 December, 2008; this period contains
the sub-prime mortgage crisis period.
Following Chung (2006), we eliminate all quotes falling into the following three
conditions: (i) either the bid or the ask price is equal to or less than zero, (ii) either the
bid or the ask depth is equal to or less than zero, and (iii) either the price or volume is
equal to or less than zero. Furthermore, we follow Huang and Stoll (1996) who delete
the quoting and trading data with the following characteristics: (i) all quotes with a
negative bid-ask spread or a bid-ask spread of greater than U.S. $4, (ii) all trades and
quotes which are either before-the-open or after-the close, (iii) all Pt trade prices,
where |Pt-Pt-1 / Pt-1|>0.1, (iv) all at ask quotes, where |at-at-1 / at-1|>0.1, and (v) all
bt bid quotes, where |bt-bt-1 / bt-1|>0.1.
2.2 Measure of Funding Liquidity
In this study, we explore funding liquidity from borrowers’ balance sheets
deterioration and lending channel hoarding. According to Brunnermier (2009), we use
the collateral market to measure borrowers’ balance sheets deterioration and the

8
interbank market to measure lending channel hoarding. We then employ daily funding
variable taken from the Bloomberg database. In the interbank market, we use Libor to
measure the financial intermediaries’ capital constraints. Libor is modeled by the
spread between 3-month U.S. interbank Libor rate and the overnight index swap (OIS).
In the collateral markets, we use ABCP and Repo to capture hedge fund and market
makers’ capital constraint. ABCP is measured by the spread between 3-month ABCP
rates and the overnight index swap, and Repo is calculated as the Mortgage Repo rate
minus Government Repo rate (Adrian and Shin, 2008; Brunnermier, 2009).
2.3 Measure of Equity Liquidity
2.3.1 Bid-Ask Spread
In this study, we use percentage spread as the illiquidity variable. The formula for
percentage spread is [(Askt – Bidt) / [(Askt +
Bidt) / 2], where Askt and Bidt are the
respective intraday ask and bid prices at time t. We then calculate the average of all the
percentage spreads in one day. In order to control for the factors that might be important
in determining the spread, following Copeland and Galai (1983) and Stoll (2000), we
investigate the following regression model:
, (1a)
, (1b)
, (1c)
where SPit is the daily average of the percentage spread for ETF i at day t, RETit is the
daily return for ETF i at day t, VOLit is the daily Parkinson volatility for ETF i at day t,
Vit is the daily trading volume for ETF i at day t, and the dummy variable, Dshort, is
ittshortitititit ABCPDLogVVOLRETSP εβββββα ++×++++= 54321
ittshortitititit RepoDLogVVOLRETSP εβββββα ++×++++= 54321
ittshortitititit LiborDLogVVOLRETSP εβββββα ++×++++= 54321
9
equal to 1 from 17 September, 2008 to 17 October, 2008 since the U.S. Securities and
Exchange Commission (SEC) prohibited short sales of financial companies’ stocks.
Libor is the spread between 3-month U.S. interbank Libor rate and the overnight index
swap on day t; ABCP is the spread between 3-month ABCP rates and the overnight
index swap on day t; Repo is the spread between Mortgage Repo rate minus
Government Repo rate on day t.
We argue that when the financing cost of investor increases (Libor, ABCP and
Repo), the arbitrageurs would provide less liquidity and thus the market volatility
increases. It would result in equity liquidity decrease and bid-ask spread increase. We
therefore hypothesize that lower funding liquidity leads to larger bid-ask spread and
lower equity liquidity.
2.3.2 Market Depth
Equity liquidity has both a price dimension (the spread) and a quantity dimension
(the depth). Lee and Ready (1993) argue that liquidity provider are sensitive to change in
information asymmetry risk and use both spread and depth to actively manage this risk.
Therefore, following Brockman and Chung (1999), which argue that dollar depth
provides a more relevant measure of liquidity, we define depth as the number of shares
at the best bid and ask price multiplied by their respective prices and cumulate each
depth on date t to be our depth variable. This (dollar) depth measure is a more relevant
measure of liquidity from the investor’s perspective than the alternative measure based
solely on the available number of shares. By following Ahn, Bae, and Chan (2001), in
order to control for the factors that may be of importance in determining market depth,
we then examine the relationship between the market depth and funding liquidity in the
following regression model:

10
, (2a)
, (2b)
, (2c)
where Depthit is the daily average of the market depth for ETF i at day t, and Ntradeit
is the daily number of trade for ETF i at day t.4
Huge loss raises the investors’ funding problem from the subprime sector, and
housing prices fell in the early 2007. In order to profit their portfolio, investor chooses
to increase market orders and reduce limit orders, indicating market depth reduction.
In addition, many studies have shown that the two dimensions of the liquidity pattern
exhibit a negative association, i.e., a wider (narrower) the spread, the smaller (larger)
the depth.5 Based on the previous argument, we suggest that lower funding liquidity
causes decreasing market depth.
2.3.3 Net Buying Volume
We then go on to investigate whether the funding illiquidity has impact on the net
buying volume. Net buying volume could measure the net buying pressure from the
market and provides us an opportunity to examine how funding liquidity affects investor
trading behavior. As for the calculation of net buying volume, we use the algorithm
proposed by Lee and Ready (1991) to distinguish whether the transactions are buyer or
seller initiated. The algorithm classifies a trade as a buyer (seller) initiated trade if the
traded price is higher (lower) than the mid-point of the bid and ask price.
We assign a value of +1 (–1), which represents whether each transaction is a
buyer (seller) initiated trade, multiply the assigned value by trading volume, and sum
4 The remaining control variables are the same as those in Equation (1). 5 See Lee, Mucklow, and Ready (1993), Ahn and Cheung (1999), and Brockman and Chung (1999)
ittshortititit ABCPDNtradeVOLDepth εββββα ++×+++= 4321
ittshortititit RepoDNtradeVOLDepth εββββα ++×+++= 4321
ittshortititit LiborDNtradeVOLDepth εββββα ++×+++= 4321

11
up all the multiplying results that occur each day. By doing so, we could obtain net
buying volume each day. In addition, we also add the volume and volatility variables,
following Bailey, Chan, and Chung (2000) and Chung (2006), as the control variable in
our regression model. We explore the relationship between net buying volume and
funding liquidity in the following model:
, (3a)
, (3b)
, (3c)
where OIBNUMit is the net buying volume variable, which is the number of
buyer-initiated trades less the number of seller-initiated trades in ETF i at day t.6
When the financing cost of investor increases, the arbitrageurs provide less
liquidity and thus make market more volatile, the funding problems for investors would
cause them to sell off their securities holdings or buy fewer stocks. We therefore argue
that lower funding liquidity causes net buying volume reduction.
2.4. Event Study
In order to examine how the funding liquidity affects equity liquidity in the important
events of subprime crisis period, we apply a traditional event study to explore whether
there are any systematic differences for those major events. We identify the
relationship between equity and funding liquidity based on the important event days by
investigating the following regression models:
, (4a)
6 The remaining control variables are the same as those in Equation (1).
ittshortitititit ABCPDLogVVOLRetOIBNUM εβββββα ++×++++= 54321
ittshortitititit RepoDLogVVOLRetOIBNUM εβββββα ++×++++= 54321
itj
jtj
tshortitititit
DLibor
LiborDLogVVOLLogPSP
εβ
βββββα
+×
++×++++=
∑=
5
16
54321
ittshortitititit LiborDLogVVOLRetOIBNUM εβββββα ++×++++= 54321

12
, (4b)
, (4c)
where Dj is 1 for event j, and 0 otherwise (Table 1 lists the dates of each event).7 Event
dates are defined as the announcement of an event in the Wall Street Journal. We focus on
the two major events, Bear Stearns and Lehman Brothers. We then could explore and
compare how the Bear Stearns event and Lehman Brothers event affect equity liquidity.
Since the Bear Stearns and Lehman Brothers are both financial intermediations, their event
could affect lending channel hoarding more directly. We thus only show how interbank
market affects equity liquidity in this study.
In early March, 2008, rumors of Bear Stearns’ eminent demise began circulating. On
March 16, J.P. Morgan announces that it has acquired Bear Stearns about $236 million. In
order to compare whether there are any systematic differences in the influence of the
before and after Bear Stearns event, we set D1 from 6 March, 2008 to 14 March, 2008
and D2 from 17 March, 2008 to 25 March, 2008. In addition, on September 15, 2008,
Lehman Brothers filed for Chapter 11 bankruptcy protection. We therefore set D3 from 04
September 2008 to 12 September, 2008 and D4 from 15 September, 2008 to 23
September, 2008 for Lehman Brothers event. According to Veronesi and Zingales
(2010), we consider a post Lehman bailout event. We therefore set D5 from 14 October,
2008 to 22 October, 2008. Therefore, Libor×D1 measures funding liquidity before Bear
Stearns event; Libor×D2 measures funding liquidity after Bear Stearns event.
Libor×D3 measures funding liquidity before Lehman Brothers bankruptcy, Libor×D4
measures funding liquidity after Lehman Brothers bankruptcy, and Libor×D5 measures
funding liquidity after Lehman Brothers bankruptcy bailout
7 The remaining control variables are the same as those in Equation (1).
itj
jtj
tshortititit
DLibor
LiborDNtradeVOLDepth
εβ
ββββα
+×
++×+++=
∑=
5
15
4321
itj
jtjt
shortitititit
DLiborLibor
DLogVVOLRetOIBNUM
εββ
ββββα
+×+
+×++++=
∑=
5
165
4321

13
<Table 1 is inserted about here>
Finally, for our empirical models, we use panel data regression framework to
investigate the effect of funding liquidity on equity liquidity. We perform the Hausman
test and for all of our empirical models, and find no misspecification when the
random-effect model is used. The random-effect model is thus chosen in the estimation
for all our empirical models. In addition, we also follow Wansbeek and Kapteyn
(1989), which is used to handle both balanced and unbalanced data.8
3. EMPIRICAL RESULTS
3.1 Descriptive Statistics
Table 2 describes the characteristics of our research samples. The standard deviation
SP, Depth, and funding liquidity (Libor, ABCP, and Repo) in our samples are higher,
which suggests a highly volatile movement in equity and funding liquidity during
subprime crisis period. In addition, the average and median return are both negative,
intuitively indicating that our sample period covers a down market and have more
bearish expectation.
As shown in Table 3, the correlation between SP and Depth is significantly
negative, which is consistent with Lee and Ready (1993). We also find that there is a
significantly negative correlation between SP and OIBNUM and a significantly
positive correlation between Depth and OIBNUM. The results indicate that when buy
initiated trades are more than sell initiated trades, the equity liquidity could increase.
The correlation between SP and funding liquidity variables (Libor, ABCP, and Repo)
are all significantly positive. Furthermore, Depth and funding liquidity variables are all
negatively correlated for our research samples. These results are consistent with our
8 See SAS PANEL procedure.

14
hypotheses that funding illiquidity is associated with higher bid-ask spread and lower
market depth.
Figure 1 shows the average level of daily funding liquidity variables (Libor,
ABCP, and Repo) from 1 January, 2007 to 31 December, 2008. The figure shows that
our funding liquidity variables often co-move together, especially for Libor and ABCP.
Figure 1 also suggests that funding liquidity variables start to increase in August 2007.
It is consistent with the fact that investors experienced remarkable volatility and huge
losses in July, 2007, and they could begin to have funding problem from August, 2007.
In November, 2007, many banks experienced additional and larger losses, leading to a
subsequent increase in the funding liquidity variables. Furthermore, the important
events during the subprime crisis period, the Bear Stearns and Lehman Brothers events
occurring in March and September, 2008, both have significantly impacts on funding
liquidity variables. Overall, our results are similar to Brunnermier (2009) and Melvin
and Taylor (2009) and suggest that our funding liquidity variables (Libor, ABCP and
Repo) could clearly reflect funding liquidity situation.
<Table 2 is inserted about here>
<Table 3 is inserted about here>
<Figure 1 is inserted about here>
3.2. Equity and Funding Liquidity
3.2.1. Bid-Ask Spread and Funding Liquidity
We begin the empirical analysis by providing a deeper understanding of whether
funding liquidity affect the equity liquidity during the subprime crisis period. Using
Equation (1), we first examine how funding liquidity could affect bid-ask spread. As
we observe from Table 4, an increase in VOL leads to an increase in SP, demonstrating

15
that higher market risk could increase bid-ask spread, thereby reducing market
liquidity.9 We also find that there is a significant positive relationship between Ret and
SP. Furthermore, LogV has a significantly negative impact on SP except for the
insurance group, indicating a positive relationship between equity liquidity and trading
volume.
Most of our findings suggest that the short-sale constraint dummy variable, Ds,
has a significantly positive impact on equity liquidity. It suggests that since investor
cannot short sell financial companies’ stocks during this period, they would be
unwilling to bear such short-term excess risk and could choose to buy fewer stocks.
These results could increase bid-ask spread and decrease equity liquidity. In contrast,
we find the negative relationship between short-sale constraint dummy variable and
equity liquidity in the global group. This result indicates that investor could choose to
trade global ETFs during the short-sale constraint period; thus equity liquidity of
global ETFs increases in that period.
<Table 4 is inserted about here>
Most importantly, we now move to the discussion of the three funding liquidity
variables: Libor, ABCP, and Repo. We find that an increase in funding liquidity
variables (Libor, ABCP and Repo) leads to an increase in SP. These results provide
solid evidence that lower funding liquidity increases bid-ask spread and decreases
equity liquidity. When investor faces the huge losses, funding problem occurs. The
increase in financing cost of the investors leads to a decrease in funding liquidity. Thus,
the arbitrageurs provide less liquidity, and the market becomes more volatile. It would
be resulting in equity liquidity decrease and bid-ask spread increase.
In addition, our results show evidence that Libor has a slightly more significantly 9 Our results provide support for Copeland and Galai (1983), Amihud and Mendelson (1987), and McInish and Wood (1992).
16
impact on equity liquidity of banking group than other funding liquidity variables. The
global group is more sensitivity than other groups, since their operation and service
might be different from those in the U.S.
3.2.2. Market Depth and Funding Liquidity
In this section, we examine the relationship between market depth and funding
liquidity. Since Lee and Ready (1993) argue that any discussion of liquidity must
include both spread and depth, we therefore examine how the funding liquidity affects
market depth.10 The results in Table 5 show that we find that an increase in VOL could
have a negative impact on Depth. The market risk is high during the periods of high
volatility. The limit order traders further could choose to reduce liquidity, either by
shifting depth away from the quotes or reducing the depth provided at a given price.11
We therefore find the negative relationship between market depth and volatility.
In addition, we also find that there is the significantly negative relationship between
Ntrade and Depth. The theoretical models suggest different stories on the relationship
between trading volume and depth. On one hand, since transaction consumes market
liquidity, there is the negative relationship between depth and volume (Lee, Mucklow,
and ready, 1993). On the other hand, investor could place more limit orders when orders
have a higher probability of execution; an increase in trading volume thus could increase
limit order and market depth (Chung, Van Ness, and Van Ness, 1999).12 Most of our
results support Lee, Mucklow, and ready (1993).
<Table 5 is inserted about here>
Finally, as we observe from Table 5, an increase in funding liquidity variables
(Libor, ABCP and Repo) leads to the reduction of Depth. Since the subprime crisis 10 They find that volume shocks cause spread to widen and depth to decrease. 11 Our results suggest to the opinion of Goldstein and Kavajecz (2004). 12 Our results are similar to those of Ahn, Bae, and Chan (2001).

17
makes the housing price to fall in early 2007, investors have huge losses in their
portfolios, and they tend to liquidate their portfolios in the market. This would cause the
financing cost of the investors to rise and funding liquidity to decrease. In order to
liquidate their portfolios, investors may choose to increase market orders and reduce
limit orders. The limit order traders further could choose to reduce liquidity providing
and market depth.
Overall, as we can observe from Tables 4 and 5, funding illiquidity could increase
bid-ask spread and decrease market depth, indicating the lower funding liquidity causes
the equity liquidity reduction. Our results provide support to our hypotheses and the
theoretical model of Brunnermeier and Pedersen (2009).
3.3. Net Buying Volume and Funding Liquidity
We now examine whether funding liquidity could affect investor trading behavior. By
following Equation (3), we examine the relationship between net buying volume and
funding liquidity variables (Libor, ABCP and Repo). As shown in Table 6, an increase
in Ret and LogV lead to an increase in net buying volume. The results indicate that
investors tend to place buy orders in the market when the daily return and trading
volume on ETFs are higher.
Most of our results show that there is a negative relationship between OIBNUM
and funding liquidity variables (Libor, ABCP and Repo), especially for banking and
insurance groups. These results indicate that when the funding is illiquid, investor
could choose to participate by placing more sell orders or buy fewer stocks, leading to
a decrease in net buying volume. These results therefore support our hypothesis,
indicating the lower funding liquidity causing the net buying volume reduction.
<Table 6 is inserted about here>

18
Furthermore, we have also found an interesting result that the funding liquidity
variables (Libor, ABCP and Repo) have a positively significantly impact on net buying
volume in the global group. Since investor is loss averse, they have very limited
capacity for arbitrage. Investors would choose to diverse their risk by investing in the
different countries when investors face the huge losses and highly extreme movement
during the subprime crisis period. Investors then could place more buy orders for the
global ETFs, leading to the increase in net buying volume and order imbalance. We
therefore find the significantly positive relationship between net buying volume and
funding liquidity.
3.4. Event Study
In this section, we examine how funding liquidity affect equity liquidity based on the
two important events, Bear Stearns and Lehman Brothers, during the subprime crisis
period. According to the Equation (4), we use the event study approach to explore whether
there are any systematic different relationship between equity and funding liquidity
(Libor) in these events. We also use the other two funding liquidity variables (ABCP and
Repo) to examine the relationship with equity liquidity based on the event days, and the
results are similar with those based on Libor.13 As shown in Table 7, the Libor are
positively significant for SP, and negatively significant for Depth, indicating the lower
funding liquidity leading to the equity liquidity reduction. These results also provide
support for our hypotheses.
In the Bear Stearns event, since the Federal Reserve had taken many actions to
prevent it from bankruptcy, investors tend to believe that the Bear Stearns was treated as
“too big to fail” by the Federal Reserve. Therefore, there is a positively significant
13 The results are not reported here due to brevity; however, they are available upon request.

19
relationship between OIBNUM and Libor×D1. In addition, we find that Libor×D1 are
positively significant for SP and negatively insignificant for Depth. In order to decrease
trading cost, investors could choose to place more limit orders, and this could be the
reason why market depth does not significantly decrease (Foucault, 1999).
<Table 7 is inserted about here>
In the Lehman Brothers event, since investors also believe that the Lehman Brothers
will be treated as “too big to fail”, just like the Bear Stearns event. The empirical results
find that Libor×D3 are not significant for equity liquidity (SP and Depth) and OIBNUM
before the Lehman Brothers event. However, the Lehman Brothers was not so fortunate; it
finally announced bankruptcy in the morning of 15 September, 2008. After the Lehman
Brothers bankruptcy, we find that Libor×D4 decreases significantly in equity liquidity (SP
increase and Depth reduction). We also find that the relationship between net buying
volume and Libor×D4 turns to be negative, although it is insignificant.
The funding illiquidity decreases equity liquidity more significantly after the Lehman
Brothers event, since investors falsely expected that the Federal Reserve would step in to
avoid any defaults. Our earlier results indicate that when investors have more significant
huge losses after the Lehman Brothers bankruptcy, the positive relationship between
equity and funding liquidity is more significant. Finally, in the post Lehman Brothers
bailout event, we find that there is a significantly negative relationship between Libor×D5
and Depth. These results indicate that after the U.S. governance bailout plan, investors
may become more confident and choose to place more limit order and buy more stocks in
the market. However, investors could still feel uncertain towards the future, and it would
allow more time on governance funding infusion in the market. Therefore, the bid-ask
spread does not yet decrease.
3.5. Robustness Check

20
In this study, we also use other variables, such as the Ted ratio (the spread between
3-month U.S. Treasury bills and Eurodollar Libor rate) as well as the spread between
3-month U.S. Treasury bills and overnight index swap, to measure funding liquidity.
We then examine how the funding liquidity affects equity liquidity, and the results are
similar to our findings reported earlier.
In terms of research methodology, we also apply the Park (1967) method to
estimate a pooled cross-sectional time series regression that corrects for
heteroscedasticity and first order autocorrelation. Since Kim and Ogden (1996) find
higher order serial correlation for the spread, Parks (1967) provide consistent and
efficient estimates of the parameters when disturbances follow a first order auto
regressive process, AR(1), with contemporaneous correlation.14 Furthermore, given
perfect clustering of observations in our sample, the OLS estimates are not consistent
or efficient because the error terms are not homoscedastic, independent and identically
distributed in the cross section. Since the Park method requires balance panel data, we
therefore delete date on the trading days of 4 April, 2007, 17 April, 2007, and 7 May,
2007. The results of Park method are similar to the reported random-effect model
results and they are not reported here due to brevity. However, those results are
available upon request.
4. CONCLUSIONS
This study explores the relationship between funding liquidity and equity liquidity. We
use three different funding liquidity variables (Libor, ABCP, and Repo) to proxy
interbank and collateral market liquidity. We use intraday data to measure equity
liquidity from the 14 financial ETFs and divide our research samples into five groups
14 See Greene (2008) and Chordia and Subrahmanyam (2004).

21
(Financial Sector, Banking, Broker and Asset Management, Insurance, and Global).
We then investigate how funding liquidity affect equity liquidity during the subprime
crisis period.
We observe that when funding illiquidity increases during the subprime crisis
period, the market depth decreases and the bid-ask spread increases, indicating that
equity liquidity tends to decrease. Our results could provide support for the story of
liquidity supplier’s funding constraint during subprime crisis period, that a large
liquidity shock triggers the huge loss for investor, resulting in larger margin
requirements and losses on existing positions. Their model suggests that the above
situation leads to the funding problem and higher equity volatility and restricts dealer
further from providing equity liquidity. The relationship between funding liquidity and
bid-ask spread is more sensitive in the global group, since their operation and service
could be different from the U.S. financial industry.
Using the net buying volume to measure investor trading behavior, we find that
when the funding liquidity decreases, investors choose to participate by placing more
sell orders or fewer buy orders, leading to a decrease in net buying volume. However,
we find that funding illiquidity increases net buying volume for the global ETFs. The
reason might be that investors choose to invest in the different countries via global
ETFs in order to diverse their risk.
In the event study, we explore whether there are any systematic different
relationship between equity and funding liquidity in the Bear Stearns and Lehman
Brothers events. We find that there is a significantly net buying volume in the Bear
Stearns event since investor tend to believe that the Bear Stearns was treated as “too big to
fail” by the Federal Reserve. However, the Lehman Brothers was not so fortunate; our
results show that funding illiquidity decreases equity liquidity more significantly than

22
other event days after the Lehman Brothers bankruptcy. Overall, our results could provide
a better understanding on how funding liquidity dry-up after large price drop would
affect the equity liquidity in the financial ETFs market.

23
REFERENCES
Ahn, H.J., and Y.L. Cheung (1999), ‘The Intraday Patterns of the Spread and Depth in
a Market without a Market-Maker: The Stock Exchange of Hong Kong’,
Pacific-Basin Finance Journal, 7: 539-556.
Ahn, H.J., K.H. Bae, and K. Chan (2001), ‘Limit Orders, Depth, and Volatility’,
Journal of Finance, 56: 767-788.
Amihud, Y. and H. Mendelson (1987), ‘Trading Mechanism and Stock Returns: An
Empirical Investigation’, Journal of Finance, 42: 533-553.
Adrian T. and H.S. Shin (2008), ‘Liquidity and Financial Contagion’, Financial
Stability Review-Special issue on Liquidity, Banque de France, 11: 1-7.
Anshuman, R. and S. Viswanathan (2005), ‘Market Liquidity’, Working Paper, Duke
University.
Bailey W., K. Chan and Y.P. Chung (2000), ‘Depositary Receipts, Country Funds and
the Peso Crash: The Intraday Evidence’, Journal of Finance, 55(6): 2693-2717.
Bernado, A., and I. Welch (2004), ‘Liquidity and Financial Market Runs’, Quarterly
Journal of Economics, 119, 135-158.
Brockman, P., and D.Y. Chung (1999), ‘An Analysis of Depth Behavior in an
Electronic, Order-Driven Environment’, Journal of Banking and Finance, 23:
1861-1886.
Brunnermeier, M.K. (2009), ‘Deciphering the Liquidity and Credit Crunch 2007-2008’,
Journal of Economic Perspectives, 23(1): 77-100.
Brunnermeier, M.K. and L.H. Pedersen (2009), ‘Market Liquidity and Funding
Liquidity’, Review of Financial Studies, 22(6): 2201-2238.
Caruana J. and L. Kodres (2008), ‘Liquidity in Global Market’, Financial Stability
Review-Special issue on Liquidity, Banque de France, 11: 65-74.

24
Chordia, T., and A. Subrahmanyam (2004), ‘Order Imbalance and Individual Stock
Returns: Theory and Evidence, Journal of Financial Economics, 72: 485-518.
Chung, K.H., B.F. Van Ness and R.A. Van Ness (1999), ‘Limit Orders and the Bid-Ask
Spread’, Journal of Financial Economics, 53: 255-287.
Chung, H. (2006), ‘Investor Protection and the Liquidity of Cross-listed Securities:
Evidence from the ADR market’, Journal of Banking and Finance, 30:
1485-1505.
Comerton-Forde, C., T. Hendershott, C. Jones, P. Moulton and M. Seasholes (2010),
‘Time Variation in Liquidity: The Role of Market maker Inventories and
Revenues’, Journal of Finance, 65: 295-331.
Copeland, T.E. and D. Galai (1983), ‘Information Effects on the Bid-Ask Spread’,
Journal of Banking and Finance, 38: 1457–1470.
Diamond, D., and P. Dybvig (1983), ‘Bank runs, Deposit Insurance, and Liquidity’,
Journal of Political Economy, 91: 401-419.
Foucault, T. (1999), ‘Order Flow Composition and Trading Cost in a Dynamic Limit
Order Book’, Journal of Financial Market, 2: 99-134.
Frank N., B. Gonzalez-Hermosillo and H. Hesse (2008), ‘Global Transmission of
Liquidity Shocks: Evidence from the 2007 Subprime Crisis’, IMF Working Paper,
International Monetary Fund.
Garleanu, N., and L.H. Pedersen (2007), ‘Liquidity and Risk Management’, American
Economic Review, 97, 193-197.
Goldstein M.A. and K.A. Kavajecz (2004), ‘Trading Strategies during Circuit Breakers
and Extreme Market Movements’, Journal of Financial Market, 7(3): 301-333.
Greene, W.H. (2008), ‘Econometric Analysis’, Prentice-Hall International, Inc.

25
Gromb D. and D. Vayanos (2002), ‘Equilibrium and Welfare in Markets with
Financially Constrained Arbitrageurs,’ Journal of Financial Economics, 66:
361-407.
Hammed, A., W. Kang and S. Viswanathan (2010) ‘Stock Market Declines and
Liquidity’, Journal of Finance, 65(1): 257-293.
Hegde S.P. and R. Paliwal (2005), ‘Financial Contagion and Market Liquidity:
Evidence from the Asian Crisis’, Working Paper, University of Connecticut.
Huang, R.D. and H.R. Stoll (1996), ‘Dealer versus Auction Markets: A Paired
Comparison of Execution Costs on the NASDAQ and the NYSE’, Journal of
Financial Economics, 41: 313-357.
Kim S.H. and J. Ogden (1996), ‘Determinants of the Components of Bid-Ask Spreads
on Stock’, European Financial Management, 1(1): 127-145.
Kyle, P. and W. Xiong (2001), ‘Contagion as a Wealth Effect’, Journal of Finance, 4:
1401-1440.
Lee, C.M.C. and M.J. Ready (1991), ‘Inferring Trade Direction from Intraday Data’,
Journal of Finance, 46: 733-747.
Lee, C. M. C., B. Mucklow and M.J. Ready (1993), ‘Spreads, Depths, and the Impact
of Earnings Information: an Intraday Analysis’, Review of Financial Studies, 6:
345-374.
McInish, T. and R.A. Wood (1992), ‘An Analysis of Intraday Patterns in Bid-Ask
Spread for NYSE Stocks, Journal of Finance, 47: 753-764.
Melvin M. and M.P. Taylor (2009), ‘The Crisis in the Foreign Exchange Market’,
Journal of International Money and Finance, 28(8): 1317-1330.
Mitchell, M., L.H. Pedersen and T. Pulvino (2007), ‘Slow Moving Capital’, American
Economic Review, 97: 215-220.

26
Parks, R.W. (1967), ‘Efficient Estimation of a System of Regression Equations When
Disturbances are Both Serially and Contemporaneously Correlated’, Journal of
American Statistical Association, 62: 500-509.
Stoll, H.R. (2000), ‘Friction’, Journal of Finance, 55: 1479-1514.
Veronesi, P., and L. Zingales (2010), ‘Paulson’s Gift’, Journal of Financial Economics,
forthcoming.
Wansbeek, T., and A. Kapteyn (1989), ‘Estimation of the Error-Components Model
with Incomplete Panels’, Journal of Econometrics, 41: 341-361.

27
Table 1 Events Date and Description Event Dummy Event date Event description D1 2008/3/06-2008/3/14
EVENT 1 2008/3/16 J.P. Morgan announces it has acquired Bear Stearns for $2 per share, or about $236 million.
D2 2008/3/17-2008/3/25
D3 2008/9/4-2008/9/12
EVENT 2 2008/9/15 Lehman had to declare bankruptcy.
D4 2008/9/15-2008/9/23
EVENT 3 2008/10/13
US government announces a plan which included a $125 billion preferred equity infusion in the nine largest U.S.commercial banks joint by a three-year government guarantee on new unsecured bank debt issues.
D5 2008/10/14-2008/10/22 Table 2 Descriptive Statistics
Variables Mean Median S.D.
Panel A: Dependent and Control Variables
SP 0.0028 0.0013 0.0044
Depth 69,343.1900 3,480.4000 10,353.7700
OIBNUM 38,124.5900 28,000.0000 593,459.0800
Ret -0.0018 -0.0011 0.0307
LogV 12.4577 12.4180 2.6846
VOL 0.0188 0.0140 0.0178
Panel B: Funding Liquidity Variables
Libor 0.7133 0.6551 0.6826
ABCP 0.8682 0.8325 0.7777
Repo 0.3985 0.3000 0.3560Note: The descriptive statistics are provided for the dependent and control variables in Panel A, the funding liquidity variables in Panel B, comprising of Libor, ABCP, and Repo. The data covers the period from 1 January, 2007 to 31 December, 2008.

28
Table 3 Correlation Statistic
Variables SP Depth OIBNUM Libor ABCP Repo
SP 1.000
Depth -0.2225*** 1.000
OIBNUM -0.0296*** 0.0974*** 1.000
Libor 0.2363*** -0.1705*** -0.0038 1.000
ABCP 0.2261*** -0.1683*** 0.0047 0.9778*** 1.000
Repo 0.1787*** -0.1382*** 0.0126 0.7191*** 0.7606*** 1.000 Note: The correlation statistics are provided for the empirical variables, comprising of SP, Depth, OIBNUM, Libor, ABCP, and Repo. The data covers the period from 1 January, 2007 to 31 December, 2008. We also use T-test to examine whether the correlation coefficient is significantly different from zero. ***, **, and * indicate significance at the 1%, 5%, and 10% levels, respectively.

29
Table 4 Bid-Ask Spread and Funding Liquidity Variables Funding Ret VOL LogV Dshort C R2 Panel A: Libor Full Sample 0.101 (12.25) *** 0.226 (1.98) ** 2.351 (7.99) *** -0.017 (-9.05) *** 0.133 (6.31) *** 0.364 (4.17) *** 0.122
Financial Sector 0.023 (3.63) *** 0.020 (1.24) 0.420 (6.75) *** -0.007 (-6.51) *** 0.002 (0.18) 0.154 (9.75) *** 0.057
Banking 0.039 (2.38) ** -0.024 (-0.50) 0.588 (3.61) *** -0.017 (-5.61) *** -0.022 (-0.65) 0.297 (7.59) *** 0.050
Broker 0.081 (13.35) *** 0.151 (2.96) *** 0.703 (4.26) *** -0.006 (-2.98) *** 0.005 (0.31) 0.136 (5.35) *** 0.327
Insurance 0.233 (10.29) *** 0.953 (2.73) *** 1.198 (1.33) 0.029 (3.32) *** 0.672 (11.49) *** -0.169 (-1.09) 0.478
Global 0.342 (9.01) *** 1.204 (1.91) * 12.394 (7.56) *** -0.098 (-4.40) *** -0.371 (-3.53) *** 1.479 (5.98) *** 0.235 Panel B: ABCP Full Sample 0.076 (11.97) *** 0.235 (2.04) ** 2.536 (8.78) *** -0.019 (-5.94) *** 0.162 (7.93) *** 0.393 (4.55) *** 0.120
Financial Sector 0.016 (3.02) *** 0.019 (1.20) 0.430 (7.03) *** -0.006 (-6.24) *** 0.007 (0.62) 0.156 (9.96) *** 0.052
Banking 0.028 (2.06) ** -0.023 (-0.47) 0.629 (3.94) *** -0.016 (-5.48) *** -0.011 (-0.31) 0.304 (7.81) *** 0.047
Broker 0.059 (11.70) *** 0.163 (3.11) *** 0.915 (5.52) *** -0.008 (-3.98) *** 0.035 (2.10) ** 0.163 (6.37) *** 0.302
Insurance 0.177 (9.59) *** 0.986 (2.81) *** 2.141 (2.47) ** 0.025 (2.86) *** 0.737 (12.89) *** -0.135 (-0.88) 0.472
Global 0.248 (7.92) *** 1.165 (1.83) * 13.977 (8.69) *** -0.107 (-4.79) *** -0.246 (-2.41) ** 1.569 (6.38) *** 0.239

30
Panel C: Repo Full Sample 0.106 (9.19) *** 0.175 (1.58) 3.190 (11.71) *** -0.017 (-4.98) *** 0.225 (12.10) *** 0.366 (4.04) *** 0.123
Financial Sector 0.004 (0.78) 0.015 (0.82) 0.514 (7.78) *** -0.007 (-6.35) *** 0.021 (1.72) * 0.168 (10.63) *** 0.053
Banking 0.016 (1.11) -0.030 (-0.61) 0.673 (4.16) *** -0.017 (-5.65) *** 0.009 (0.31) 0.319 (8.23) *** 0.047
Broker 0.057 (5.75) *** 0.167 (3.02) *** 1.294 (7.60) *** -0.009 (-4.37) *** 0.105 (5.97) *** 0.201 (7.41) *** 0.210
Insurance 0.206 (5.82) *** 0.857 (2.38) ** 4.360 (5.14) *** 0.025 (2.76) *** 0.872 (15.32) *** -0.102 (-0.66) 0.442
Global 0.377 (6.17) *** 0.842 (1.31) 15.560 (9.71) *** -0.107 (-4.71) *** -0.019 (-0.20) 1.601 (5.62) *** 0.221 Note: The dependent variable is the daily percentage spread for ETF i at day t, which is regressed on RET, LogV, VOL, short-sales constraint dummy, and funding liquidity variable on day t. The funding variable is the Libor on trading day t in Panel A, the ABCP on trading day t in Panel B and the REPO on trading day t in Panel C. The bracket value is T-value, which examine whether the regression coefficient is significantly different from zero. ***, **, and * indicate significance at the 1%, 5%, and 10% levels, respectively.

31
Table 5 Market Depth and Funding Liquidity Variables Funding VOL Ntrade Dshort C R2 Panel A: Libor Full Sample -886.76 (-10.94) *** -23030.60 (-8.25) *** -0.102 (-5.72) *** 750.30 (1.46) 4658.02 (3.77) *** 0.090
Financial Sector -1603.75 (-8.27) *** -4544.02 (-1.79) * -0.037 (-0.99) 481.86 (1.13) 4128.05 (23.81) *** 0.051
Banking -802.49 (-4.94) *** 1686.88 (0.86) -0.137 (-3.54) *** 392.45 (1.09) 3041.63 (21.30) *** 0.035
Broker -780.22 (-2.82) *** -19165.40 (-1.98) ** -0.237 (-4.12) *** 271.82 (0.71) 3893.93 (11.76) *** 0.039
Insurance -1112.49 (-5.92) *** -24158.00 (-3.29) *** 0.136 (0.27) 668.62 (1.38) 4204.32 (32.99) *** 0.139
Global -826.44 (-14.33) *** -1882.82 (-0.79) 0.259 (0.92) 1042.74 (6.54) *** 1656.64 (30.98) *** 0.245 Panel B: ABCP Full Sample -552.89 (-8.09) *** -601.84 (-11.36) *** -0.104 (6.13) *** 77.27 (0.38) 1453.99 (1.14) 0.104
Financial Sector -1304.82 (-8.36) *** -5574.59 (-2.19) ** -0.050 (-1.36) 244.59 (0.59) 4128.05 (23.81) *** 0.052
Banking -600.82 (-7.10) *** 1134.31 (1.00) -0.097 (-5.35) *** 279.66 (1.26) 3041.63 (21.30) *** 0.050
Broker -535.41 (-2.72) *** -455.01 (-0.24) -0.243 (-4.14) *** 64.45 (0.17) 3893.93 (11.76) *** 0.027
Insurance -664.17 (-4.36) *** -32792.40 (-4.59) *** 0.112 (0.22) 209.31 (0.44) 4204.32 (32.99) *** 0.126
Global -740.65 (-16.09) *** -1686.31 (-0.74) 0.292 (1.06) 894.02 (5.95) *** 1256.64 (30.98) *** 0.277
32
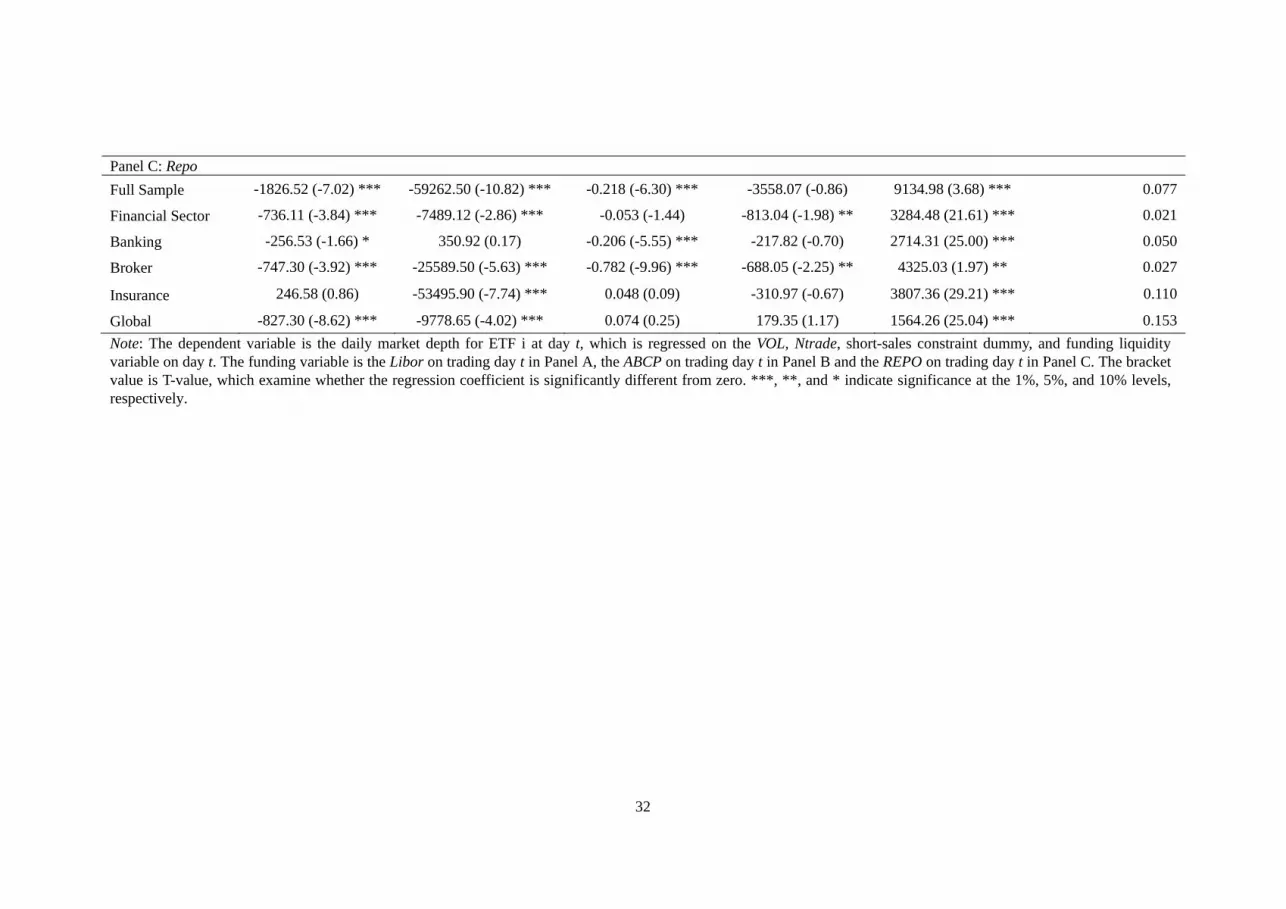
Panel C: Repo Full Sample -1826.52 (-7.02) *** -59262.50 (-10.82) *** -0.218 (-6.30) *** -3558.07 (-0.86) 9134.98 (3.68) *** 0.077
Financial Sector -736.11 (-3.84) *** -7489.12 (-2.86) *** -0.053 (-1.44) -813.04 (-1.98) ** 3284.48 (21.61) *** 0.021
Banking -256.53 (-1.66) * 350.92 (0.17) -0.206 (-5.55) *** -217.82 (-0.70) 2714.31 (25.00) *** 0.050
Broker -747.30 (-3.92) *** -25589.50 (-5.63) *** -0.782 (-9.96) *** -688.05 (-2.25) ** 4325.03 (1.97) ** 0.027
Insurance 246.58 (0.86) -53495.90 (-7.74) *** 0.048 (0.09) -310.97 (-0.67) 3807.36 (29.21) *** 0.110
Global -827.30 (-8.62) *** -9778.65 (-4.02) *** 0.074 (0.25) 179.35 (1.17) 1564.26 (25.04) *** 0.153 Note: The dependent variable is the daily market depth for ETF i at day t, which is regressed on the VOL, Ntrade, short-sales constraint dummy, and funding liquidity variable on day t. The funding variable is the Libor on trading day t in Panel A, the ABCP on trading day t in Panel B and the REPO on trading day t in Panel C. The bracket value is T-value, which examine whether the regression coefficient is significantly different from zero. ***, **, and * indicate significance at the 1%, 5%, and 10% levels, respectively.

33
Table 6 Net Buying Volume and Funding Liquidity Variables Funding Ret VOL LogV Dshort C R2 Panel A: Libor Full Sample -84.95 (-1.10) 5453.69 (4.77) *** 2657.73 (0.91) 104.59 (3.86) *** -188.40 (-0.90) -1011.01 (-3.24) *** 0.007
Financial Sector -473.23 (-1.76) * 1286.36 (3.43) *** 6793.43 (0.70) 260.17 (3.32) *** -256.62 (-0.36) -2612.21 (-2.80) *** 0.014
Banking -170.22 (-2.16) ** 2541.06 (2.91) *** 1165.11 (2.48) ** 28.55 (1.27) 91.93 (0.55) 522.77 (1.09) 0.014
Broker 44.53 (0.68) 1261.38 (1.47) 49.54 (1.76) * 134.51 (0.55) -146.37 (-0.87) -610.76 (-1.73) * 0.007
Insurance -68.73 (-1.83) * 783.74 (1.36) 6648.67 (4.49) *** 40.86 (3.08) *** -190.90 (-1.97) ** -404.39 (-3.03) *** 0.047
Global 12.69 (2.01) ** 711.79 (6.76) *** -540.26 (-2.01) ** -1.67 (-0.64) 2.05 (0.12) 156.66 (0.65) 0.049 Panel B: ABCP Full Sample -43.27 (-0.60) 5512.45 (14.20) *** 3260.59 (0.99) 92.71 (2.83) *** -253.50 (-1.10) -890.34 (-2.4) ** 0.005
Financial Sector -27.14 (-0.61) 1296.37 (0.22) 1493.90 (1.09) 29.72 (2.41) ** -91.79 (-0.63) -218.34 (-1.61) 0.012
Banking -42.67 (-1.67) * 1042.33 (2.08) ** 2134.55 (1.81) * 33.69 (2.21) ** 146.75 (1.60) -325.11 (-1.62) 0.026
Broker 70.29 (1.36) 1287.40 (1.50) 527.58 (0.23) 51.45 (1.88) * -166.94 (-1.04) -646.21 (-1.89) * 0.009
Insurance -45.98 (-1.52) 779.31 (1.35) 6372.40 (4.52) *** 36.34 (3.68) *** -216.90 (-2.31) ** -362.79 (-3.73) *** 0.051
Global 11.08 (2.15) ** 712.86 (6.78) *** -530.95 (-2.03) ** -1.87 (-0.72) 4.59 (0.27) 16.79 (10.03) *** 0.050

34
Panel C: Repo Full Sample 13.21 (0.11) 5534.22 (4.85) *** 1106.44 (0.40) 96.98 (3.38) *** -288.59 (-1.50) -953.33 (-2.87) *** 0.006
Financial Sector -44.94 (-0.58) 1304.33 (2.24) ** 1369.21 (1.04) 30.86 (2.54) *** -118.30 (-0.93) -2233.06 (-1.65) * 0.013
Banking 62.17 (1.06) 798.48 (2.22) ** -325.86 (-0.39) 21.92 (2.84) *** 77.37 (1.19) -213.54 (-2.75) *** 0.025
Broker 68.23 (0.71) 1257.14 (11.46) *** 1502.39 (0.68) 44.64 (1.66) * -107.74 (-0.70) -551.41 (-1.65) * 0.007
Insurance -50.82 (-0.90) 813.12 (1.41) 5754.49 (4.30) *** 36.53 (3.69) *** -251.97 (-2.76) *** -373.44 (-3.85) *** 0.049
Global 28.08 (2.83) *** 698.34 (6.66) *** -592.14 (-2.30) ** -2.06 (-0.99) 13.15 (0.83) 17.39 (0.72) 0.053 Note: The dependent variable is the daily net buying volumes for ETF i at day t, which is regressed on the return on day t, VOL, LogV, short-sales constraint dummy, and funding liquidity variable. The funding variable is the Libor on trading day t in Panel A, the ABCP on trading day t in Panel B and the REPO on trading day t in Panel C. All of these table coffees are divided 100. The bracket value is T-value, which examine whether the regression coefficient is significantly different from zero. ***, **, and * indicate significance at the 1%, 5%, and 10% levels, respectively.

35
Table 7 Event Study
Variables SP
Depth
OIBNUM
Coeff. t-Value Coeff. t-Value Coeff. t-Value
Libor×D1 0.115 3.07*** -237.86 -0.75 965.65 2.48**
Libor×D2 0.137 3.12*** -1172.19 -3.12*** 190.39 4.14***
Libor×D3 -0.018 -0.53 -72.66 -0.26 255.96 0.75
Libor×D4 0.127 6.41*** -501.35 -2.97*** -72.89 -0.59
Libor×D5 -0.007 -0.60 198.37 1.97** 7.76 0.04
Libor 0.112 14.11*** -932.33 -13.70*** -53.86 -0.65
Ret 0.252 2.30** 5452.04 4.77***
LogV -0.019 -5.66*** 89.07 3.16***
Ntrade -0.135 -7.72***
VOL 2.046 7.05*** -21264.50 -8.70*** 1519.48 0.51
Dshort 0.042 1.65* 1029.64 4.60*** -117.73 -0.43
C 0.378 4.25*** 4718.94 3.56*** -861.76 -2.65***
Observations 8,091 8,091 8,091
R2 0.140 0.149 0.010 Note: The dependent variable is the daily percentage spread for ETF i at day t in first column, which is regressed on LogP, LogV, VOL, short-sales constraint dummy, and Libor on day t. The dependent variable is the daily market depth for ETF i at day t in second column which is regressed on the VOL, Ntrade, short-sales constraint dummy, and Libor on day t. The dependent variable is the daily net buying volumes for ETF i at day t in last column, which is regressed on the return on day t, VOL, LogV, short-sales constraint dummy, and Libor on day t. The dummy variable D1 is equal to 1 on days from 03 March, 2008 to 14 March, 2008, D2 is equal to 1 on days from 17 March, 2008 to 31 March, 2008, D3 is equal to 1 on days from 01 September, 2008 to 12 September, 2008 and D4 is equal to 1 on days from 15 September, 2008 to 30 September, 2008. Therefore, Libor×D1 could measure Libor liquidity before Bear Stearns event; Libor×D2 could measure Libor liquidity after Bear Stearns event. Libor×D3 could measure Libor liquidity before Lehman Brothers bankruptcy, and Libor×D4 could measure Libor liquidity after Lehman Brothers bankruptcy. All of the last column coffees are divided 100. The T-value means that examine whether the regression coefficient is significantly different from zero. ***, **, and * indicate significance at the 1%, 5%, and 10% levels, respectively.

36
Figure 1 Funding Liquidity
Note: The times-series daily values of Libor, ABCP, and Repo during the period from 1 January, 2007 to 31 December, 2008.

37
Appendix 1 Ticker ETFs Full name Exchange Observations Definition Broad U.S. Financial Sector
XLF Financial Select Sector SPDR Amex 506 The underlying index includes commercial and investment banking and capital markets, diversified financial services, insurance and real estate.
IYF iShares Dow Jones U.S. Financial Sector NYSEArca 506 The underlying index includes companies in the following industry groups: Banks, Non-life
insurance, Life insurance, Real estate, and General finance. VFH Vanguard Financials ETF Amex 506 It designed to track the performance of the MSCI U.S. Investable Market Financials index.
IYG iShares Dow Jones U.S. Financial Services NYSEArca 506 It is a subset of the Dow Jones U.S. Financial index.
Banking
KBE KBW Bank ETF Amex 506 The underlying index includes national money center banks and regional banking institutions listed on U.S. stock markets
KRE KBW Regional Banking ETF Amex 506 An equal weighted index of geographically diverse companies representing regional banking institutions listed on U.S. stock markets
RKH Regional Bank HOLDRs Amex
506 The investment is designed to diversify your investment in the regional banking industry through a single, exchange-listed instrument representing your undivided beneficial ownership of the underlying securities.
IAT iShares Dow Jones U.S. Regional Banks NYSEArca 506
The underlying index is a subset of the Dow Jones U.S. bank index small and mid-size banks.
Broker and Asset Management
IAI iShares Dow Jones U.S. Broker-Dealers NYSEArca 506 Companies providing a range of specialized financial services, including securities brokers
and dealers, online brokers and securities or commodities exchanges.
KCE KBW Capital Markets ETF Amex 506 In the U.S. capital market industry and includes broker dealers, asset managers, trust and custody banks and a stock exchange.

38
Insurance
KIE KBW Insurance ETF Amex 506 In the insurance industry which are publicly traded in the U.S. including personal and commercial lines, property/casualty, life insurance, reinsurance, brokerage and financial guarantee.
IAK iShares Dow Jones U.S. Insurance NYSEArca 504 The underlying index includes companies in the following industry groups: Full line insurance, insurance brokers, property and casualty insurance reinsurance and life insurance.
Global
IXG iShares S&P Global Financials NYSEArca 506 It is a subset of the S&P Global 1200 Index.
DRF WisdomTree International Financial NYSEArca 505 It measures the performance of dividend-paying companies in developed markets outside of the U.S. and Canada within the "International Financial" sector.
Related Documents


