Fundamentals of Thermal Resistance Measurement Dr. John W. Sofia 1995 Analysis Tech (781)245-7825 FAX (781)246-4548 email: [email protected]

Welcome message from author
This document is posted to help you gain knowledge. Please leave a comment to let me know what you think about it! Share it to your friends and learn new things together.
Transcript
Fundamentals of Thermal Resistance Measurement
Dr. John W. Sofia
1995
Analysis Tech(781)245-7825
FAX (781)246-4548email: [email protected]

2
PART 1: Technical Background
1.1 Introduction
The Analysis Tech Thermal Analyzers are complete test systems for semiconductorcomponent thermal characterization. These systems offer extensive selections of testcapabilities accessed via user-friendly menus and forms. The range of applicationextends from laboratory research to production screening.
Part 1 deals with the scientific background of experimental methods and analysesrelated to the thermal characterization of packaged semiconductor devices, commonlyreferred to as "components".
Thermal characterization of a semiconductor device (component) is thedetermination of the temperature response of the semiconductor circuit junctionsdue to internal self-heating. This internal self-heating is a byproduct of electricalcurrent flow in the electronic device during operation; the heat generatedelevates the temperature in the semiconductor junctions. It conducts from thejunction area through the die, through the package, and eventually into the localambient. This flow of heat is governed by the laws of thermodynamics and theprinciples of heat transfer. Accordingly the temperature within the package isthe highest in the heat generating junctions on the semiconductor die. It is thistemperature elevation of the semiconductor junctions that drives the need forthermal characterization of packaged semiconductors since highersemiconductor junction temperatures are associated with reduced operating life.[Kraus, et. al., 1983]
Device heat generation is concentrated in a small region in the semiconductor die fromwhich it diffuses outward into the package where it becomes progressively lessconcentrated. Stated another way, the heat flux density is greatest in the heatgenerating region of the semiconductor. As the energy moves further and further fromthe semiconductor, heat flux densities are lower and the temperature elevations aresmaller. This general pattern is a central theme in all component heat dissipation.
From the perspective of the entire electronics cooling network, the component is thecritical, initial link for all heat leaving the die. As such, the component exhibits heat fluxdensities that are many orders of magnitude higher than in any other area of thecooling network. At the component level, minute differences in package design,material selection, and quality of manufacture can have enormous impacts on junctionoperating temperatures and time-to-failure. The technological trend towardprogressively increasing heat flux densities and the necessity to control junctiontemperatures creates the need for component characterization.
3
The focal point of component thermal characterization is the control of junctiontemperatures. Since semiconductor reliability is adversely affected by higher junctionoperating temperatures, the determination of junction temperature is essential todeveloping electronic systems free from thermally induced failures.
1.2 Thermal Resistance
The primary goal of thermal engineering in electronics-cooling is the reduction orcontrol of operating junction temperatures. The measurement of component thermalresistance is a common approach to junction temperature determination given a set ofenvironmental conditions and the component power dissipation. Thermal resistanceprovides a simple and convenient means for estimating junction temperatures.
Thermal resistance is analogous to electrical resistance. Electrical resistance iscomputed as the difference in voltage between two points divided by the electricalcurrent flowing between them. This analogy is based on the fundamental similaritybetween voltage and temperature, current conduction and heat conduction: Electricalconduction occurs in response to a voltage difference; heat conduction occurs inresponse to a temperature difference. This is a popular analogy due the generalfamiliarity of electric conduction in wires.
One shortcoming of the electrical analogy is that it suggests familiar networks such asone-dimensional current flow in wires between discrete components. The conductionof heat in electronic components is rarely so simple since it is significantly three-dimensional with spatially distributed thermal resistances and heat capacitances. Thisdifference tends to make the electrical analogy lead to a one-dimensional interpretationof an inherently three dimensional phenomena. The precise definition of thermalresistance is key to its correct measurement and application.
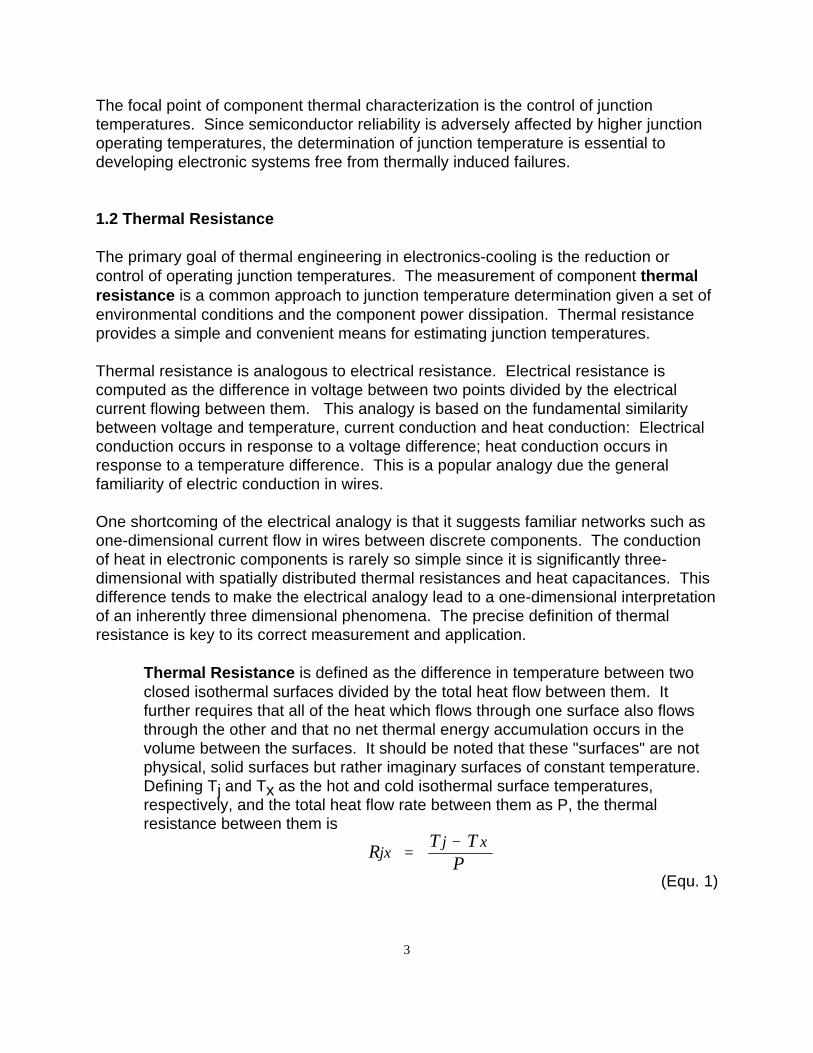
Thermal Resistance is defined as the difference in temperature between twoclosed isothermal surfaces divided by the total heat flow between them. Itfurther requires that all of the heat which flows through one surface also flowsthrough the other and that no net thermal energy accumulation occurs in thevolume between the surfaces. It should be noted that these "surfaces" are notphysical, solid surfaces but rather imaginary surfaces of constant temperature.Defining Tj and Tx as the hot and cold isothermal surface temperatures,respectively, and the total heat flow rate between them as P, the thermalresistance between them is
RT T
Pjx
j x=
−
(Equ. 1)
4
The units of thermal resistance in electronic applications are °C / Watt. If massflow occurs across these isothermal surfaces, there must be no net massaccumulation within the volume enclosed between the two surfaces since thatwould comprise an accumulation of thermal energy in the form of mass heatcapacity. Likewise, there can also be no net thermal accumulation due to latentheat that may result from phase change effects.
In addition to being surfaces of constant temperature, isothermal surfaces experienceheat flow in a perpendicular direction. Lines drawn parallel to the heat flow are called"heat-flux-lines". Each line is a heat flow (flux) path, each leading from the componentjunction to the environment. Taken together, these lines form a map-like network ofpaths for heat flowing from the component. The heat flux network provides a means forillustrating and visualizing heat flow. Isothermal surfaces do not intersect but ratherform "nests" of concentric, closed volumes around a heat source. Isotherm nests andheat-flux-networks are directly related: a complete description of either one contains allthe information necessary to construct the other since heat conducts perpendicular toisotherms and parallel to heat-flux-lines. A complete heat flux network describes indetail the three dimensional conduction of heat from a component's hot core to itsperipheral surfaces.
Isothermal surfaces are uniquely defined by size and shape. Thermal resistance isisotherm specific: changing the size or shape of the isothermal surfaces used inEquation (1) will change the computed thermal resistance. Alternatively, thermalresistance is specific to the heat flux network; any alteration will change the thermalresistance.
To avoid confusion, it is important to distinguish the difference between thermalresistance and thermal resistivity.
Thermal Resistivity is defined as the ratio of thermal gradient to the heat fluxdensity for a one-dimensional heat conduction. Thermal resistivity is thereciprocal of thermal conductivity and is a material property indicating theresistance of the material to thermal conduction. Alternatively, resistivity is anindication of thermal insulative quality. To understand resistivity and itsmeasurement, envision two parallel isothermal surfaces, T1 and T2 separatedby a uniform layer of material of thickness with thickness x. If the heat flux perunit area is defined as q, the resistivity of the material separating the isothermalsurfaces is
r
T T
xq
=
−
(Equ. 2)

5
For electronic cooling applications thermal resistivity is expressed in units of °Cmeter / Watt. The reciprocal of resistivity, conductivity, is more commonly usedand indicated by the symbol "k".
Thermal resistivity is a material property and is not affected by the geometry of thethermal flux network in which the material is used. By contrast, thermal resistance is afunction of material resistivities and geometry. Thermal resistivity is used for evaluatingthe thermal quality of a materials for use in component packaging applications.Thermal resistance is a figure of merit for evaluation of the thermal transport capabilityof component packaging.
1.3 Electrical Junction Temperature Measurement
The measurement of junction temperatures is essential for evaluating thermalperformance for design, application and manufacture of semiconductor components.The electrical method for junction temperature measurement is a widely used methodtoday. It is a direct, non-contact technique since it utilizes the junction itself as thetemperature sensor. Although methods such as infrared and liquid crystal sensing[Azar, 1991] can be used to measure junction temperatures, their application is limitedto junctions that are directly visible. In contrast, the electrical method is a directtechnique that can be performed at-a-distance without an introduced sensor using onlythe electrical-temperature properties of semiconductor junctions. It is used extensivelyfor direct component characterization measurements.
The electrical method is a popular technique for measuring junction temperatures inelectronic components spanning the entire power and function spectrum of theelectronics industry. The most common implementation of the method uses the forwardvoltage drop of a junction as the temperature sensitive parameter and is variouslyknown as the "diode-forward-drop" method or the "Vbe" technique from originalapplications with power diodes and bipolar power transistors. The method wasimplemented soon after the invention of semiconductor electronics and continues to beused extensively used throughout the industry. In the integrated circuit industry, it isused to thermally characterize functional components as well as "dummy" thermal testcomponents made by substituting standard thermal test dice for functional dice.Although the diode forward voltage is the most commonly used temperature sensitiveparameter (TSP), other parameters can also be used depending on the specific deviceunder test. An excellent reference on the electrical method is contained in reference[Oettinger, F.F., Blackburn, D.L., 1990].
The electrical method of junction temperature measurement is based on a temperatureand voltage dependency exhibited by all semiconductor diode junctions. Thisrelationship can be measured and used to compute the semiconductor junctiontemperatures in response to power dissipation in the junction region.
6
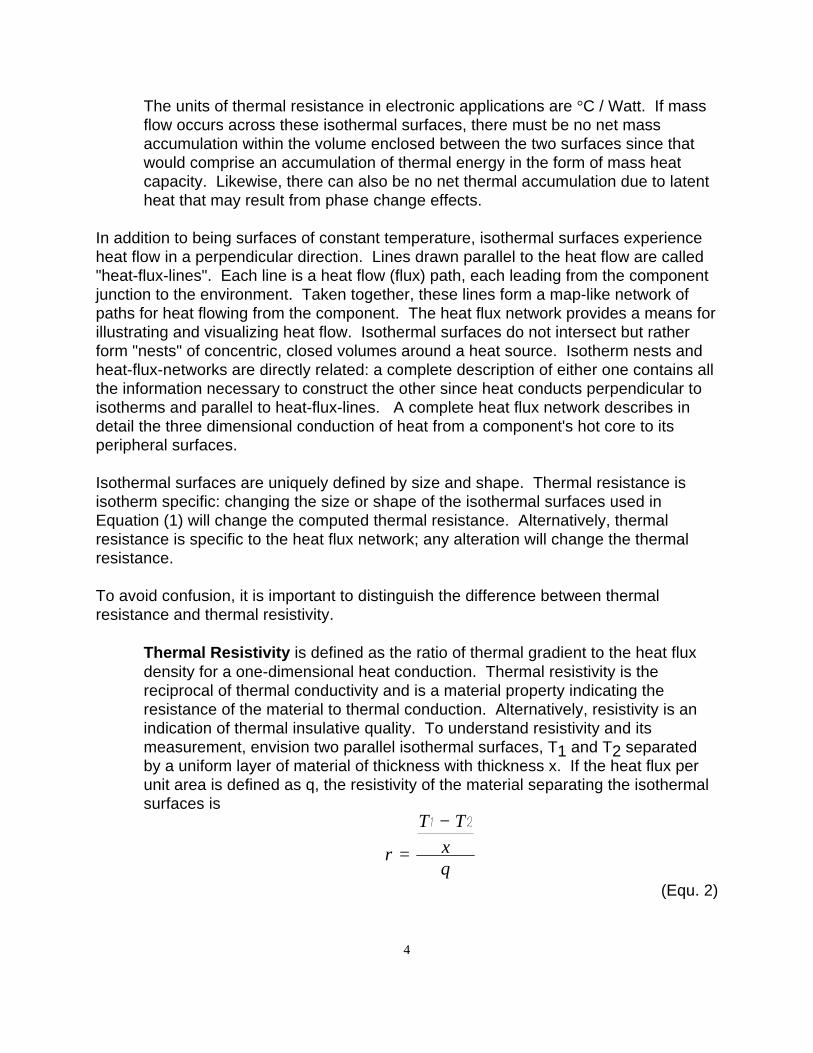
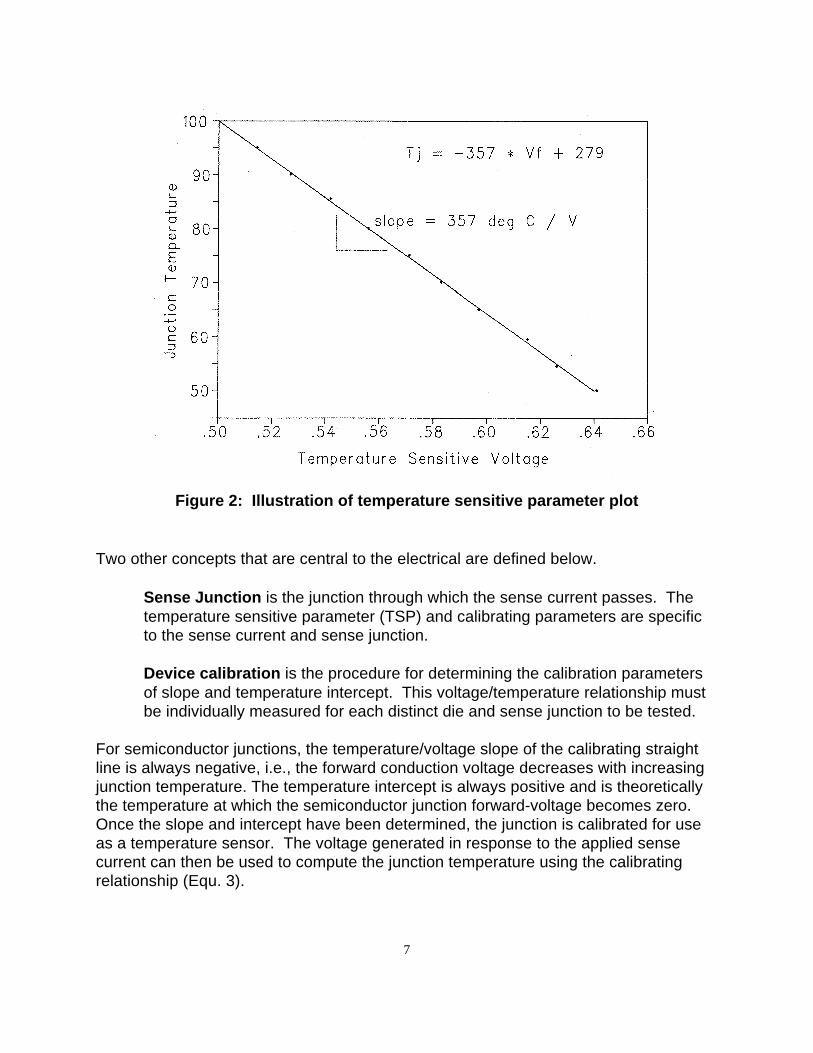
Voltage-temperature relationships are an intrinsic electro-thermal property ofsemiconductor junctions. These relationships are characterized by a nearlylinear relationship between forward-biased voltage drop and junctiontemperature when a constant forward-biased current is applied. This constantcurrent is called the "sense current" (also "measurement current"). Figure 1illustrates the concept of measuring this voltage versus junction temperaturerelationship in for a diode junction; Figure 2 shows a graph of the resulting data.The relationship can be expressed mathematically as in the calibratingrelationship,
T m V Tj f= +(Equ. 3)
The slope, "m" (deg C/volt) and the temperature ordinate-intercept, "T0" areused to quantify this straight line relationship. The reciprocal of the slope isoften referred as the "K factor" expressed in units of mV/°C. In this case, Vf isthe "temperature sensitive parameter" (TSP). The slope and intercept aredevice specific and are collectively referred to as the "calibration parameters".
Figure 1: Illustration of bath method for measurement of temperature sensitiveparameter
7
Figure 2: Illustration of temperature sensitive parameter plot
Two other concepts that are central to the electrical are defined below.
Sense Junction is the junction through which the sense current passes. Thetemperature sensitive parameter (TSP) and calibrating parameters are specificto the sense current and sense junction.
Device calibration is the procedure for determining the calibration parametersof slope and temperature intercept. This voltage/temperature relationship mustbe individually measured for each distinct die and sense junction to be tested.
For semiconductor junctions, the temperature/voltage slope of the calibrating straightline is always negative, i.e., the forward conduction voltage decreases with increasingjunction temperature. The temperature intercept is always positive and is theoreticallythe temperature at which the semiconductor junction forward-voltage becomes zero.Once the slope and intercept have been determined, the junction is calibrated for useas a temperature sensor. The voltage generated in response to the applied sensecurrent can then be used to compute the junction temperature using the calibratingrelationship (Equ. 3).
8
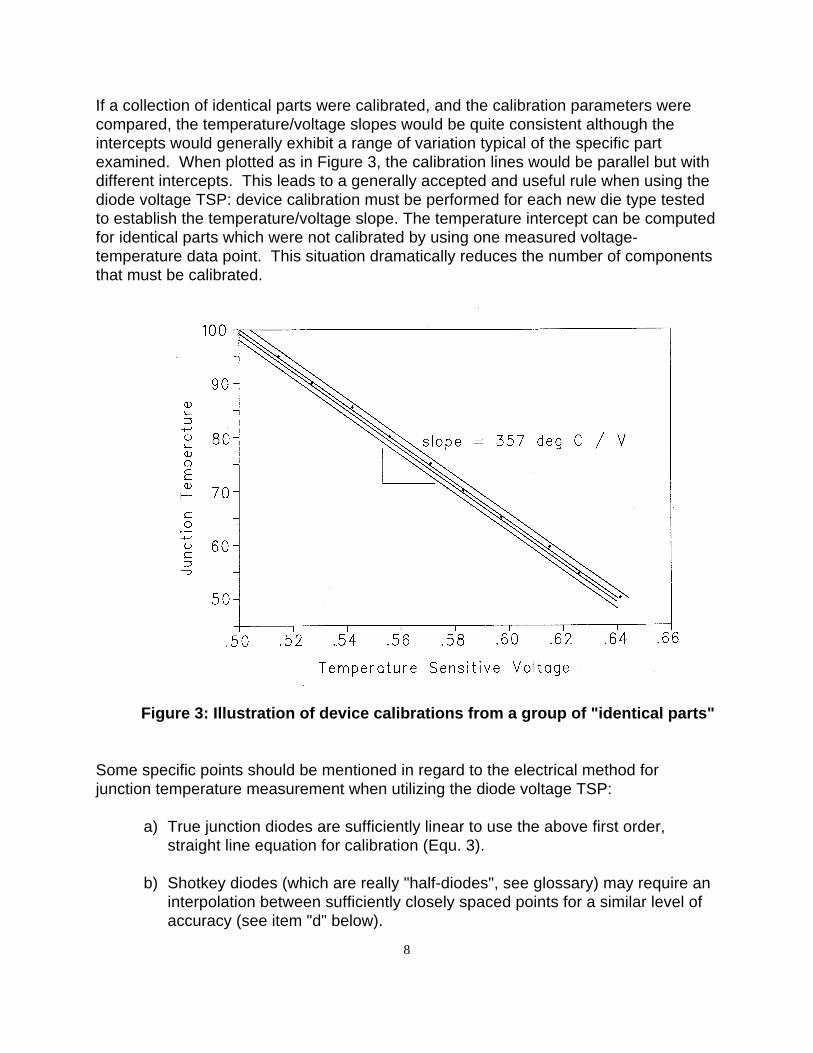
If a collection of identical parts were calibrated, and the calibration parameters werecompared, the temperature/voltage slopes would be quite consistent although theintercepts would generally exhibit a range of variation typical of the specific partexamined. When plotted as in Figure 3, the calibration lines would be parallel but withdifferent intercepts. This leads to a generally accepted and useful rule when using thediode voltage TSP: device calibration must be performed for each new die type testedto establish the temperature/voltage slope. The temperature intercept can be computedfor identical parts which were not calibrated by using one measured voltage-temperature data point. This situation dramatically reduces the number of componentsthat must be calibrated.
Figure 3: Illustration of device calibrations from a group of "identical parts"
Some specific points should be mentioned in regard to the electrical method forjunction temperature measurement when utilizing the diode voltage TSP:
a) True junction diodes are sufficiently linear to use the above first order,
straight line equation for calibration (Equ. 3). b) Shotkey diodes (which are really "half-diodes", see glossary) may require an
interpolation between sufficiently closely spaced points for a similar level ofaccuracy (see item "d" below).
9
c) Device calibration is current-specific; specific calibration parameters cannot
be used for other sense current values. d) Device calibration data can be used in tabular form with linear interpolation
applied rather tan converted to calibration equations such as Equ. 3 and Equ.4.
The "transistor saturation voltage" is another temperature sensitive parameter (TSP)that can be used for electrical junction temperature sensing. Its characteristics aresimilar to the diode forward voltage. For testing certain types of devices, the diodevoltage TSP cannot be used due to the absence of an electrically accessible diode.Such parts include IGBTs and some darlington transistors. The transistor saturationvoltage is defined as the voltage across the main current terminals of a 3-terminaldevice in response to a fixed, small sense current while the control terminal is held fully"on". The voltage versus temperature data fits the linear equation format (Equ. 3) usedfor the diode-junction temperature sensing. The gate-turn-on voltage [Oettinger, F.F.,Blackburn, D.L., 1990] is another possible TSP for testing of IGBTs and MOSFETs.Unlike other TSPs, this TSP requires junction calibration of each and every device tobe tested.
1.4 Device Calibration Technique
1.4.1 Performing Device Calibrations
Device calibration is the procedure of measuring data pairs of junction temperatureversus junction voltage due to the imposed sense current. These measurements areperformed under unpowered, thermal equilibrium conditions so that the junction andcase temperature are nearly equal. Once the electrical connections for the selectedtemperature sensitive junction have been completed, device calibration entails:
a) selection of the sense current levelb) establishment of thermal equilibrium between the component and a stable-
temperature environmentc) measurement of the component case (junction) temperature and temperature
sensitive voltaged) alteration of the environment temperature and repeating steps b through d
During calibration, the device is unheated except for the heat generated by the sensecurrent which is generally insignificantly small. When the component is immersed inthe constant temperature environment, any point on the component case will eventuallyreach the same temperature as the component junction. Under these conditions, thecomponent is said to be in thermal equilibrium with its surrounding environment.
10
Measurement of the forward voltage and the associated case temperature comprisesone data point for construction of the calibration relationship.
This procedure must be performed for at least two sufficiently spaced temperaturessince at least two points are required for a straight line calibrating relationship (Equ. 3).Although two points are the minimum required, a far superior technique is performedusing 5-20 data pairs spaced in equal temperature increments. The calibrationparameters are then determined by a best-fit straight line using least-squares linearregression. Often, the only indication that a particular sense junction on an active dieis unsuitable for junction temperature sensing lies in the non-linearity of the calibration.Since any two points define a straight line, such non-linearity is totally masked whenusing the two-point calibration. The use of multiple temperature points for calibrationalso provides a dramatic increase in the accuracy of the calibration in the same mannerthat sample averaging decreases the level of random error associated with a singlesample.
1.4.2 Sense Current Level Selection
The selection of the sense current is the first step for device calibration. The selectionof this current is limited by a number of factors although within a fairly wide range, theprecise selection is not critical. Generally, the best sense current is the smallest onewhich does not encroach on any of the limiting factors discussed below. Once thesense current has been chosen and the device calibration performed, the calibrationparameters are specific to the junction and the sense current level. Sense currentselections typically range from 0.1 to 50 milliamps.
Lower limit - conduction: The sense current must be sufficiently large toestablish conduction in the body of the junction rather than just superficialsurface leakage conduction. Generally, 0.1 milliamp is the lower limit of theselection range for the smallest junctions tested. Typically, the larger thejunction, the higher this lower limit becomes.
Upper limit - thermal: Ideally, a sense current generates no internal heating inthe diode junction. In reality, diode current flows of any magnitude generatesome heating; therefore the ideal sense current is the one that generates thesmallest amount of self-heating. For example, if the sense current is 10milliamps and the forward voltage is 0.6 volts, the power dissipation is 0.006Watts or 6 milliwatts. This apparently insignificantly small amount of heating isfocused exclusively on the sensed junction and causes some temperature rise.Ultimately this heating contributes to an error in the final computation of junctiontemperature. Based on this, two conclusions can be drawn:
11
a) Given a particular junction, smaller sense currents generate less self-heating error.
b) Given a particular sense current, larger sense junctions experiencesmaller the temperatures rises and thus less self-heating error.
Although self-heating errors are generally quite small, properly conducted testprocedures can further reduce this potential problem. (See "recalibration" in thefollowing section "Calibration Environments")
Lower Limit - electrical: All semiconductor junctions have parasitic electricalcapacitances in parallel connection with them. These capacitances cause thediode voltage readings to "lag" the temperature readings whenever voltage ortemperature changes occur during thermal testing. Although such changes arequite slow during calibration, during thermal testing, the sense current mustcharge or discharge these capacitances as the junction temperature/voltagechanges. This charging/discharging utilizing a fixed current requires time inproportion to the size of the parasitic capacitance. Larger sense currentsrequire less time since they offer faster charge/discharge rates. Generally,larger, more capacitive junctions will test better with larger sense currents. (SeeActive Dice under Device Types and Test Methods)
The most commonly used sense current throughout the industry is 1 milliamp. Mosttesting on integrated circuits, functional and thermal dice, is performed with a 1milliamp sense current. Other common selections are 10 and 20 milliamps for largerpower devices.
1.4.3 Thermal Equilibrium in Calibration
As stated previously, unpowered, steady-state, thermal equilibrium of the component inthe calibration environment is required for convergence of the junction and casetemperatures. This necessitates a waiting period, the duration of which depends on:
a) the heat capacity of the componentb) the thermal resistance between the component junction and the environment
medium
The product of a resistance and a capacitance yields a time parameter, i.e., the "RC"time constant of the pair. The linear combination of a resistance "R" and a capacitance"C" will reach 99.3% of final equilibrium in a duration equal to 5 times the "RC" timeconstant.
In practice, the heat capacity and thermal resistance are never known prior tocalibration. Therefore other less precise methods are used to estimate the onset of

12
thermal equilibrium. Although the rate of change in the case temperature can be usedto estimate equilibrium, the waiting interval is usually extended to the point where thereis no doubt that equilibrium has been reached. Clearly, there is a significant benefit inchoosing a medium that offers a small thermal resistance to the component-under-calibration to minimize the waiting interval.
1.4.4 Calibration Environments
Two types of stable temperature environments are commonly used for devicecalibration: liquid baths and ovens. The function of the device calibration environmentis to provide stable temperature surroundings which will quickly reach equilibrium withthe component, and to provide a convenient means of controlling that stabletemperature.
The bath liquid must be a dielectric (electrical insulator) and capable of withstandingtemperatures up to about 150 °C without boiling. Flouro-chloro carbon liquids andcommon mineral oil are typical choices. The liquid must be circulated or stirred toenhance temperature uniformity and increase the liquid-to-component heat transfercoefficient. This allows the device to reach equilibrium with the liquid quickly. The bathmust have some means of temperature control and regulation. This control should belinear and free from cyclic variations. The component should be suspended in the bathand should not contact the bath walls or the liquid surface. The thermocouple used forsensing the case temperature should be soldered to the component leads. This willensure maximum mechanical stability and accurate sensing of the junction temperature.
The oven technique may require the use of a significant heat sink to stabilize the rapidfluctuations of air in the oven as the heating elements cycle on and off. Forcedconvection should be utilized on the heat sink and the component must be attached tothe heat sink with an excellent thermal bond. Again, the thermocouple used for sensingthe case temperature should be soldered to the component leads or otherwise wellgrounded to the internal bulk temperature of the component. Some ovens offer moreoptimal controllers utilizing short-duration time-proportioning algorithms to minimize thecyclic variations inherent in the common banded-hysteresis "bang-bang" controller.These oven controllers offer significantly better conditions for calibration, so a smallerdevice heat sink may be used.
The bath technique offers some advantages based on the following considerations.Since the chosen sense current will not cause significant self-heating, the ambient andjunction temperatures will become nearly equal after a sufficiently long thermal"soaking" interval in the constant temperature environment. The length of this intervalis determined by the heat capacity of the component and the thermal resistancebetween the component and the environment, liquid or air. Since a circulated liquidhas an order of magnitude lower fluid-to-solid thermal resistance than oven-circulated

13
air, the time required for the thermal "soaking-equilibrium" in the bath is less than one-tenth that of an oven for equivalent accuracy. The use of a heat sink in the oven cansomewhat reduce this difference. Alternatively, the bath method is somewhat moremessy and generally less suitable for non-hermetic packages. In summary, bothmethods will ultimately produce the same results if each offers a suitably constantenvironment temperature and sufficient soaking time is allowed.
Once a device has been calibrated using the diode voltage TSP, calibration parametersfor identical parts are adjusted for part-to-part variations by using a single temperature-voltage data point. This procedure is often referred as "recalibration". It makes use ofthe fact that identical parts calibrate with a uniform slope and only vary in thetemperature intercept (Equ. 3). Referring to Figure 4, the intercept can be computed bysimply allowing the component to reach unpowered steady state equilibrium at roomtemperature and then measuring the sense voltage and case temperature. This onedata point combined with the calibrated slope for an identical component permits thecorrected computation of the temperature intercept. Once a part has been calibrated,recalibration on identical parts is usually a sufficient substitute for a full devicecalibration on every identical part tested. One point recalibration is effective for thediode voltage TSP and transistor saturation voltage but not for the gate-turn-on TSP.
Figure 4: Illustration of one-point recalibration method

14
When a device calibration is performed using the diode voltage TSP, the calibratingparameters apply to a specific junction on a specific die. The slope applies to allidentical junctions of the type calibrated; the temperature intercept only applies to theactual die calibrated but can be established with a one-point recalibration procedure.When a previously calibrated die is mounted in different packages, the calibration neednot be repeated. Care should be taken to ensure that the correct electrical connectionsare bonded out for the chosen sense parameter each time the die is used in a differentpackage. If device calibrations are correctly performed, it does not matter in whatpackage a calibrated die is mounted; a given diode on a given die will have the samecalibration regardless of the package.
1.5 Application of Thermal Resistance Concepts
According to the definition, Equ. 2, thermal resistance is specific to the chosenisothermal surfaces, specified by size and shape. Practically, it would be quite difficultto specify an isothermal surface that does not correspond to a physical surface bydescribing its particular size and shape. Even if such a description could be provided,it would be nearly impossible to utilize such information in a real-world test situation.
The application of thermal resistance measurement to electronic componentapplications requires a practical perspective in addition to an understanding of thebasic definition. Thermal resistance is generally based on junction temperature (hotterisotherm), with a variety of different forms spawned from the selection of the referencetemperature (colder isotherm). Thermal resistances are frequently cited as thermalresistance, junction-to-<reference x>,Rjx, or θjx, where <reference x> would besubstituted with such typical temperature sites as:
a) local ambient air temperatureb) specific site on the component casec) specific site on a component leadd) other well defined reference site
It is instructive to compare the theoretical definition with the practical application ofthermal resistance. Each of the above varieties of thermal resistance implies a pair ofisothermal surfaces. The "junction" is considered to be tightly enclosed by aninfinitesimal, "hot", isothermal surface through which all of the internally generated heatis dissipated. Provided the same junction is used for all measurements of thermalresistance on a particular component, this "hot" isothermal surface is well defined andconstant.
The "cold" isothermal surface, the reference isothermal surface, is much moreproblematic. Each of the above reference temperature sites is a physically defined
15
location without regard to the shape and size of the isothermal surfaces in theimmediate vicinity. Under any precisely defined set of cooling conditions, eachreference site corresponds to one point on a particular, vaguely specified, isothermalsurface. Under different component cooling conditions, heat flows from the componentin a different pattern of paths and forms different the isothermal surfaces. (Note:isothermal surfaces are defined by size and shape) Since no practical method existsfor specifying the shape and size of these isothermal surface, the above thermalresistances, based on fixed reference sites, require complete specification of thecomponent cooling conditions. Expressed simply, any thermal resistance based onphysically fixed temperature sites is specific to the cooling conditions under which themeasurements are taken. Thermal resistances measured under significantly differentcooling conditions are simply different measured parameters.
Junction-to-local-ambient thermal resistance typically exhibits appreciable variationwith the velocity of the air flow on the component. Natural convection is influenced bythe orientation of the component and its power dissipation; forced convection isaffected by the local air pressure gradient. The isothermal surfaces in the vicinity ofthe component are specifically linked to the type of thermal resistance measured. Forexample, the isothermal surfaces in natural convection cooling are dramaticallydifferent than those in forced convection. Therefore, junction-to-ambient thermalresistance measurements must include specifications of the air flow conditions.
Junction-to-case thermal resistances are likewise specific to the cooling conditionsimplemented during measurement. The case temperature is usually measured at aspecific accessible site on the outside of the component case, most often, the hottestpoint on the case. The temperature difference between the junction and the case isdramatically affected by variations in heat flux network for the junction. Factors such asheat dissipation from adjacent components, nearby materials and thermal pathways,power level, air flow, and component mounting can radically affect the junction-to-casethermal resistance. Components with a wide variety of cooling-condition alternativeswill likewise offer a wide variety of thermal resistances. Conversely, componentsdesigned for strictly defined cooling configurations with little variation in the overall heatflow patterns will have few meaningful thermal resistance varieties.
Junction-to-case thermal resistances are often mistaken for fixed parameters that areindependent of the specific heat flow configuration. This stems from the misconceptionthat junction-to-case thermal resistance is solely a function of the component packageand does not depend on the cooling environment imposed when the thermal resistanceis measured. Despite plentiful evidence to the contrary, this erroneous attitude persiststoday.
Integrated circuits are a good example of components which typically experience awide variety of heat flow patterns. Some of the primary paths typically include:
16
a) case directly into the board holding the componentb) case directly into the airc) case-to-leads and into board holding the component
Additional cooling parameters include adjacent component heating of the board and thelocal air flow. Each set of cooling conditions prescribes a different, defined thermalresistance.
By contrast, some components with integral metal plates which are always cooled byattachment to a significant heat sink have few primary heat flow paths and few coolingvariations. Component packages of the type TO220, TO202, and TO247 are goodexamples of this. These packages are specifically intended to be used with asignificant heat sink. Nearly all of the heat that leaves the junction exits the componentthrough the integral cooling plate regardless of the specific application. For thisreason, there are very few varieties of thermal resistances for these components.
In summary, thermal resistances must be reported with precise descriptions of thecooling conditions and the power dissipations that were used during the measurement.This description should ideally be as simple as possible yet sufficiently accurate toenable detailed reconstruction of the test configuration.
1.5.1 Thermocouple Measurements
Thermocouples are generally used to measure thermal resistance referencetemperatures. Ideally, the reference temperature measurement should be non-invasive, i.e., report the same site-temperature as that which existed prior to theinstallation of the thermocouple. This goal is never perfectly achieved sincethermocouples inherently involve contact measurement. Some heat conductioninvariably occurs in the thermocouple, thus wicking the heat away and cooling thereference site. This error elevates the temperature difference between the referenceand the junction and yields a thermal resistance value which is chronically too high.This error is most acute when measuring case temperatures of components fabricatedof low thermal conductivity (high resistivity) packaging materials compared to theconductivity of the thermocouple wire. For example, if high conductivity 30 gaugethermocouple wire (type T) is used to measure a typical plastic integrated circuit casetemperature, the error can be as high as 40% of the difference between the ambientand the actual case temperature depending on the means of thermocouple attachment.Although precise error predictions are not practical, the following recommendationsgenerally apply:
a) Wire thermocouples should be no larger than 30 gauge, preferably, 36gauge.

17
b) Type K offers the lowest wire-conductivity and thus the lowest conductionerror but requires additional adhesive attachment; type T offers solderable-attachment although with a higher level of conduction error.
c) The use of wire thermocouples should be limited to measurement of metaland highly conductive surfaces; use laminated thin-foil type thermocouplesfor surfaces of low conductivity materials.
d) Larger thermocouples are desirable for measurement of bulk airtemperatures where the averaging affect of the heat capacitance in the beadcan stabilize unwanted fluctuations.
e) Test systems utilizing temperature sensitive phosphor technology providethermocouple-like measurement with very low conductivity contact-fibers.
f) Infrared temperature sensors can be used effectively for the measurement ofnon-conductive surface temperatures. These devices avoid the errorsassociated with thermocouple heat wicking effects.
1.5.2 Specific Thermal Resistance Measurement Methods
Standard environmental specifications for measurement of junction-to-case andjunction-to-ambient thermal resistances are available as Military Standards, SEMIPackaging Standards and JEDEC Industrial Standards. Such standards offer avaluable means of technical communication and documentation. When applying suchindustry standard methods, critical examination must be exercised to independentlyevaluate the validity of the recommended methods. Some "standards" have been laterfound to be deeply flawed based on the underlying physical principles or tainted by theeffects of commercial bias in the standards creation process. There is no substitute fora critical investigation of any unfamiliar method regardless of how widely recognized orstandardized. Care should always be taken to ensure that the method employedgenerates data which is useful for the intended purpose.
The following example underscores the caution must be exercised before embracingany "standard" method. SEMI Standards, G30-88 and G43-87, discuss the use ofliquid bath environments for junction-to-case measurements. These specious methodsmeasure junction-to-case thermal resistance by suspending the component in anagitated fluid. According to the method, the high thermal conductivity of the fluidcombined with the agitation effectively creates infinite heat sinking conditions andthereby assures that the entire surface of the case will be isothermal. Any cautiousimplementation of this method quickly reveals that the component is far from isothermaland that the fluid selection (within the range of specification) and degree of agitationdramatically affect the resulting measurement. These methods do not sufficientlyspecify the essential liquid cooling parameters but rather rely on fictitious infinite heatsinking. Such bogus "standards" illustrate the hazards of assuming that a standardmethod is technically sound.
18
Another popular junction-to-case thermal resistance measurement standard is found inMil Std 883, method 1012 as well as SEMI Std G30-88. Here the integrated circuitcomponent is thermally grounded to a very significant heat sink so that almost all of theheat flows directly into the heat sink. The case temperature is usually the surfacetemperature of the component that is in contact with the heat sink. The resultingjunction-to-case thermal resistance value is quite valid and repeatable since the heatflow patterns and cooling conditions are well specified. This variety of junction-to-casethermal resistance is directly applicable to components which are cooled in thismanner, i.e., by heat sink attachment in the same manner as the test configuration. Butfor components which are not intended to be cooled in this way, this technique provideswildly elevated thermal resistances that are nearly useless for predicting the operatingjunction temperatures in their intended applications.
Much of the latest standards work has been by JEDEC. JEDEC committees haverecently generated a number of new standardized methods for component thermalcharacterization including JESD51-1 and JESD52-2. As these "standards" are new,their technical merit, and overall quality has yet to be demonstrated. As with allunfamiliar methods, a cautious, skeptical application approach is warranted. Thesestandards are available from Global Engineering Documents, 800-854-7179.
1.6 Delivery of DC heating power
Test procedures for component characterization generally utilize steady state, DCcurrent to heat the semiconductor component. The reason for this is that thermalresistance measurement requires steady-state thermal equilibrium which in turnrequires constant heat dissipation for a sufficient period of time. The heating powerdissipated in a component is computed as the product of the current flow through thecomponent times the voltage difference between the in-flowing and out-flowing currentleads. With the voltage expressed in volts and the current expressed in amps, theproduct is expressed in Watts.
P I V Vin out= −(Equ 5)
For a thermal test die (see glossary), the heat dissipating element may be a pureresistance. When dealing with a linear resistor, the voltage, current, and resistanceare governed by Ohm's law:
V I R=(Equ 6)
Current flow through any resistor generates heat. This is also true of the wires whichcarry power to the device. Lead wires have a finite resistance and generate a voltage
19
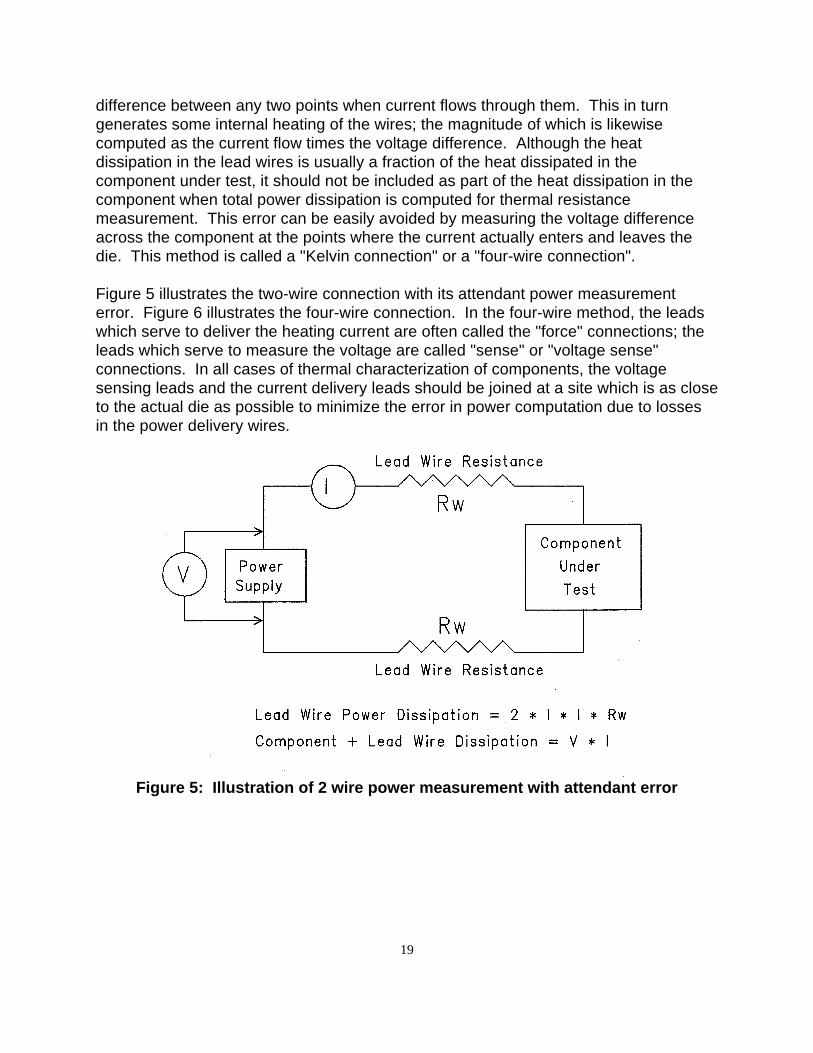
difference between any two points when current flows through them. This in turngenerates some internal heating of the wires; the magnitude of which is likewisecomputed as the current flow times the voltage difference. Although the heatdissipation in the lead wires is usually a fraction of the heat dissipated in thecomponent under test, it should not be included as part of the heat dissipation in thecomponent when total power dissipation is computed for thermal resistancemeasurement. This error can be easily avoided by measuring the voltage differenceacross the component at the points where the current actually enters and leaves thedie. This method is called a "Kelvin connection" or a "four-wire connection".
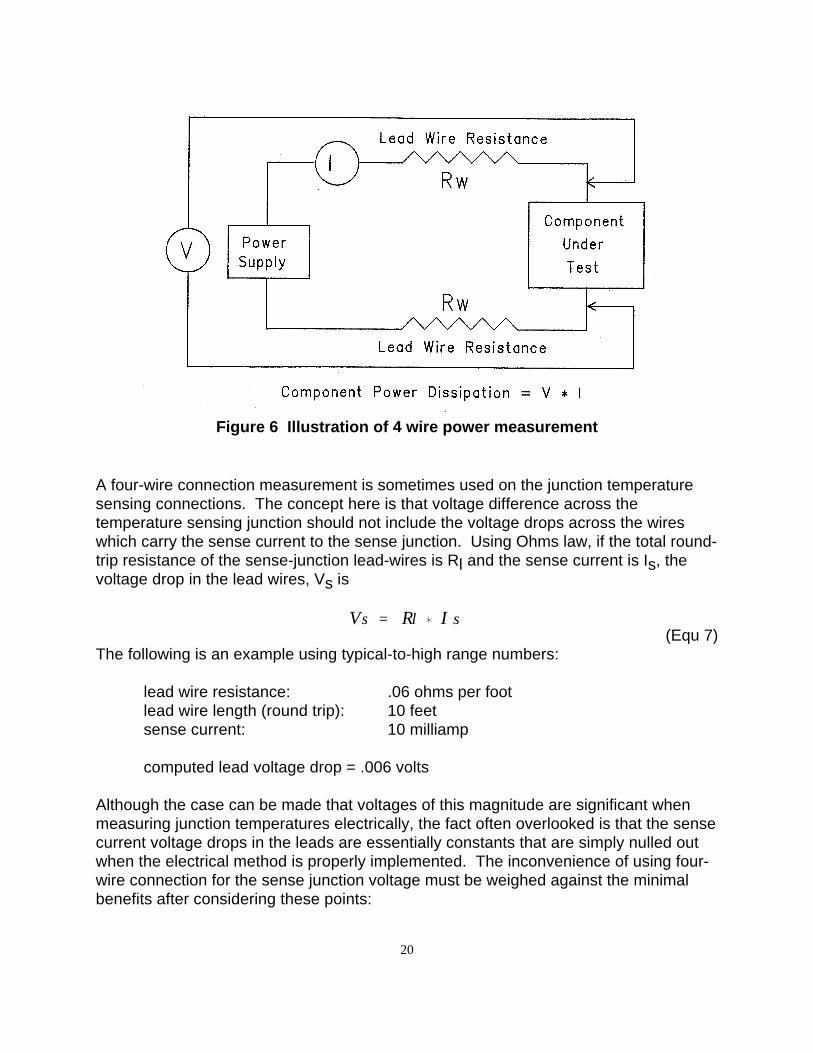
Figure 5 illustrates the two-wire connection with its attendant power measurementerror. Figure 6 illustrates the four-wire connection. In the four-wire method, the leadswhich serve to deliver the heating current are often called the "force" connections; theleads which serve to measure the voltage are called "sense" or "voltage sense"connections. In all cases of thermal characterization of components, the voltagesensing leads and the current delivery leads should be joined at a site which is as closeto the actual die as possible to minimize the error in power computation due to lossesin the power delivery wires.
Figure 5: Illustration of 2 wire power measurement with attendant error
20
Figure 6 Illustration of 4 wire power measurement
A four-wire connection measurement is sometimes used on the junction temperaturesensing connections. The concept here is that voltage difference across thetemperature sensing junction should not include the voltage drops across the wireswhich carry the sense current to the sense junction. Using Ohms law, if the total round-trip resistance of the sense-junction lead-wires is Rl and the sense current is Is, thevoltage drop in the lead wires, Vs is
V R Is l s=(Equ 7)
The following is an example using typical-to-high range numbers:
lead wire resistance: .06 ohms per footlead wire length (round trip): 10 feetsense current: 10 milliamp
computed lead voltage drop = .006 volts
Although the case can be made that voltages of this magnitude are significant whenmeasuring junction temperatures electrically, the fact often overlooked is that the sensecurrent voltage drops in the leads are essentially constants that are simply nulled outwhen the electrical method is properly implemented. The inconvenience of using four-wire connection for the sense junction voltage must be weighed against the minimalbenefits after considering these points:

21
a) If a device is calibrated using sense current lead-lengths approximately thesame as those intended for thermal resistance testing, the sense voltagedrop in the leads is inherently included in the device calibration parameters.
b) If all thermally characterized devices utilize one-point recalibration to adjustfor variations in the temperature intercept within a collection of identicalcomponents, variations in lead length between that used for devicecalibration versus device characterization will be nulled out.
c) The variation in lead electrical resistance with temperature is insignificant.
Based on the above, the four-wire technique is generally confined to connections forheating power delivery.
1.7 Control of Heating Power
The method used to control the heating power delivered to the component under test isspecific to the type of die being tested. For this consideration, components are dividedinto two categories: two-terminal and three-terminal devices.
The category of two-terminal devices includes diodes, thyristors (SCRs, TRIACs, etc.),and thermal test dice. These devices exhibit essentially one power dissipation for anyspecified supply voltage or current. The voltage and the current cannot beindependently selected. At any given power dissipation, these devices possess anearly fixed ratio between the applied voltage and the current flow, much like Ohmslaw. The ratio is "nearly" fixed since the voltage/current ratio varies somewhat as afunction of the die temperature. If a fixed heating current is established in a previouslyunpowered two-terminal component, the power dissipation will progressively changeuntil a steady die temperature is reached. These variations can be generalized forspecific types of power control for specific device types:
Fixed Heating Current in Two Terminal Devices:
Thermal Test Die - Increasing temperature leads to increasing voltagedrop and thus increasing power dissipation with temperature.Diodes and thyristors - Increasing temperature leads to decreasingvoltage drop and thus decreasing power dissipation with temperature
Fixed Heating Voltage in Two Terminal Devices:
Thermal Test Die - Increasing temperature leads to decreasing currentflow and thus decreasing power dissipation with temperature.Diodes and thyristors - Increasing temperature leads to increasingcurrent flow and thus increasing power dissipation with temperature.

22
In summary, as die temperatures increase, thermal dice experience highervoltage/current ratios while diodes and thyristors experience lower ratios. Thesevoltage/current ratio variations typically range from 10% to 50% for a 100 °C change indie temperature. The power dissipation will thus vary by a comparable amount over thecourse of a test when using either fixed-voltage or fixed-current power control. Whenthermally characterizing two-terminal devices, the power dissipation cannot becontrolled to a specified level using a fixed heating voltage or heating current. Althoughapplication of a fixed voltage or current will eventually result in constant powerdissipation and establishment of thermal equilibrium, the final value of the heatingpower will not be controlled to a pre-selected level. The Thermal Analyzer powercontrol options can be used to establish a controlled constant wattage without junctiontemperature dependency.
The category of three-terminal devices includes bipolar transistors, MOSFETs, junctionFETs, and IGBTs. The functional design of these devices permits the heating voltageand current to be simultaneously specified independently. Each of these devices hasone pair of terminals which essentially carry all of the power and a third terminal whichacts to control the operating voltage/current ratio device. By design, these devicespermit a small voltage or current to control much larger voltages and currents, andessentially control the voltage/current operating point of the device. This amplifiedcontrol behavior of three-terminal devices also exhibits significant temperaturedependency in much the same manner as two-terminal devices. Despite this, thecapability to select the heating voltage and current independently is a powerful assetwhen thermally characterizing three-terminal devices. Again, the Thermal Analyzerpower control capabilities eliminate these temperature dependencies of power control.
1.8 Device Types and Test Methods
This section covers the application of the electrical test method to a variety offunctional device categories. These categories are determined by the electrical designof the die utilized in the specific component under test.
1.8.1 Thermal Test Die
Thermal test dice are specifically designed for thermal characterization of integratedcircuit packages. These dice are available in a variety of sizes and can be mountedinto any desired package to create a thermal test vehicle. They have become popularfor package characterizations including related thermal enhancements. Thermal dicehave been designed to offer electrically independent power dissipation and electricalmeasurement of junction temperature. The thermal die test method is illustratedschematically in Figure 7. Thermal dice offer accurate thermal characterization with a

23
minimum of measurement hardware. The basic concepts of device calibration, junctiontemperature measurement, power delivery, and wattage control are direct application ofthe concepts presented previously. The sense diode voltage can be directly measuredwith a voltmeter and the associated junction temperature computed (Equ. 3) usingpredetermined calibrating parameters. The Thermal Analyzer provides comprehensivetest capabilities for thermal dies.
Figure 7: Illustration of thermal test die test method concept
Care must be taken to ensure that the thermal test die size corresponds the intendedfunctional die application. The die attachment may also be different for the thermal dieversus the active die since one is a prototype process and the other a productionprocess. Any component characterizations utilizing thermal test dice should include aspecification of the thermal test die size and the type of die attachment.
1.8.2 Active Dice
Active or functional dice are often used as the ultimate test for component thermalcharacterization. The primary feature that distinguishes active die from thermal die isthat heat dissipation is not electrically independent from temperature sensing and thatthe die is designed to perform an electrical function other than providing convenientjunction temperature reporting. This requires that the otherwise continuous heatingpower be interrupted for the measurement of the junction temperature. The process ofperiodically interrupting the heating power to measure the sense junction voltage isbest presented with some standard definitions. This process is automaticallyperformed by the Thermal Analyzer.
Temperature sampling interval is the period of time when the heating powerhas been interrupted and the sense current has been applied to the sensed
24
junction. The temperature sensitive voltage is measured during this interval.During the temperature sampling interval, the junction cools passively until theheating power is restored. When properly executed, the cooling is minimal andcan be further reduced to negligible levels with rapid data acquisition. Onetemperature sampling interval is required for each junction temperature reading.The temperature sampling interval is very small compared to the heating interval(less than 0.01%).
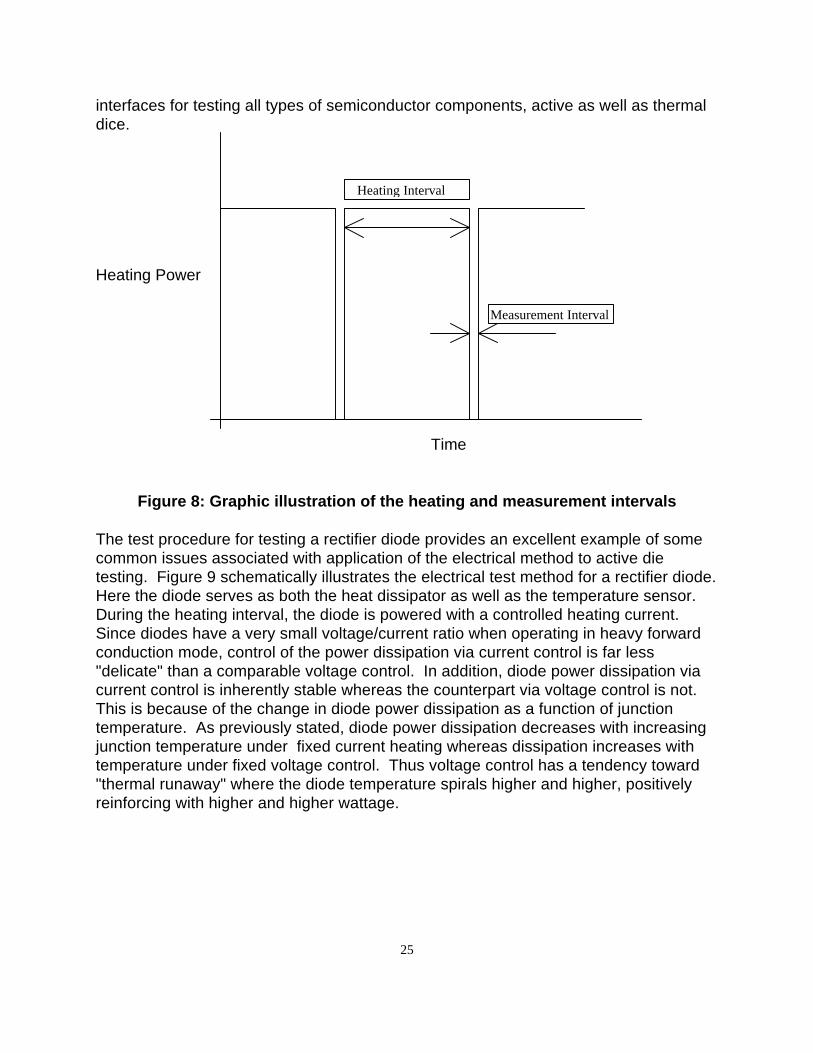
Heating Interval is the period of time when the heating power is being deliveredto the component under test. Active dice are tested with a succession of heatingintervals and temperature sampling intervals. During thermal resistance testing,the heating intervals are much longer than the temperature sampling intervals;the heating duty-cycle approaches 100% and thereby essentially satisfiesrequirement of steady, fixed heat dissipation for thermal resistancemeasurement.
The end of the heating interval corresponds with the beginning of the temperaturesampling interval and visa versa. Although the objective of the temperature samplinginterval is to measure the junction temperature at the instant the heating interval ends,some junction cooling does occur during the temperature sampling interval. Threeapproaches are used to minimize the impact of junction cooling from the instant ofpower interruption until the temperature sensitive voltage has been acquired:
a) minimize the duration of the temperature sampling interval to minimizejunction cooling
b) perform rapid sampling of the temperature sensitive voltagec) extrapolate back to the instant of power interruption to overcome the effects
of junction cooling and electrical switching transients
These techniques will be discussed below with additional details on the temperaturesampling process. Junction temperature measurement on active dice is a uniqueprocedure with special requirements which include:
a) rapidly switching the heating power offb) switching the sense current onc) measuring the temperature sensitive parameterd) switching the heating power back on again
Unlike thermal die testing, special purpose electrical switching hardware is required toperform this operation such as that contained within the Analysis Tech ThermalAnalyzer. In addition, there is a wide variety of specific requirements for temperaturesensing and power control to match the diversity of active dice. Commercially availabletest systems offer such specialized test functionality with convenient software
25
interfaces for testing all types of semiconductor components, active as well as thermaldice.
Heating Power
Time
Figure 8: Graphic illustration of the heating and measurement intervals
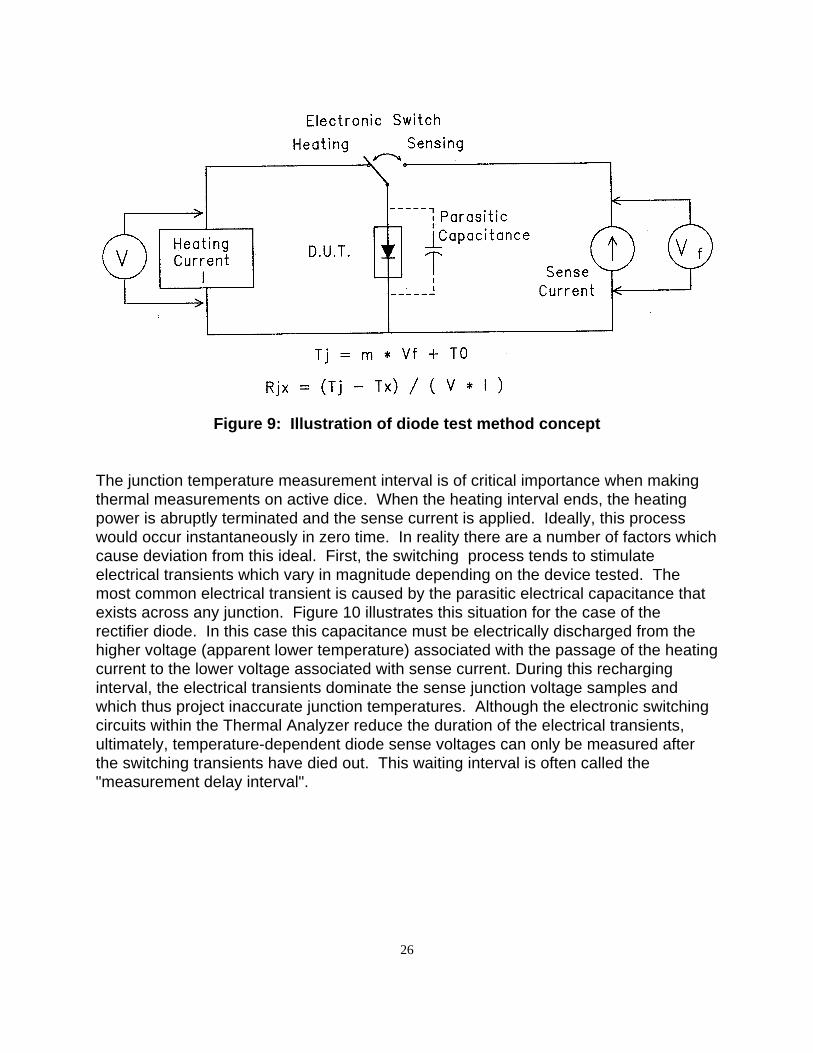
The test procedure for testing a rectifier diode provides an excellent example of somecommon issues associated with application of the electrical method to active dietesting. Figure 9 schematically illustrates the electrical test method for a rectifier diode.Here the diode serves as both the heat dissipator as well as the temperature sensor.During the heating interval, the diode is powered with a controlled heating current.Since diodes have a very small voltage/current ratio when operating in heavy forwardconduction mode, control of the power dissipation via current control is far less"delicate" than a comparable voltage control. In addition, diode power dissipation viacurrent control is inherently stable whereas the counterpart via voltage control is not.This is because of the change in diode power dissipation as a function of junctiontemperature. As previously stated, diode power dissipation decreases with increasingjunction temperature under fixed current heating whereas dissipation increases withtemperature under fixed voltage control. Thus voltage control has a tendency toward"thermal runaway" where the diode temperature spirals higher and higher, positivelyreinforcing with higher and higher wattage.
Heating Interval
Measurement Interval
26
Figure 9: Illustration of diode test method concept
The junction temperature measurement interval is of critical importance when makingthermal measurements on active dice. When the heating interval ends, the heatingpower is abruptly terminated and the sense current is applied. Ideally, this processwould occur instantaneously in zero time. In reality there are a number of factors whichcause deviation from this ideal. First, the switching process tends to stimulateelectrical transients which vary in magnitude depending on the device tested. Themost common electrical transient is caused by the parasitic electrical capacitance thatexists across any junction. Figure 10 illustrates this situation for the case of therectifier diode. In this case this capacitance must be electrically discharged from thehigher voltage (apparent lower temperature) associated with the passage of the heatingcurrent to the lower voltage associated with sense current. During this recharginginterval, the electrical transients dominate the sense junction voltage samples andwhich thus project inaccurate junction temperatures. Although the electronic switchingcircuits within the Thermal Analyzer reduce the duration of the electrical transients,ultimately, temperature-dependent diode sense voltages can only be measured afterthe switching transients have died out. This waiting interval is often called the"measurement delay interval".
27
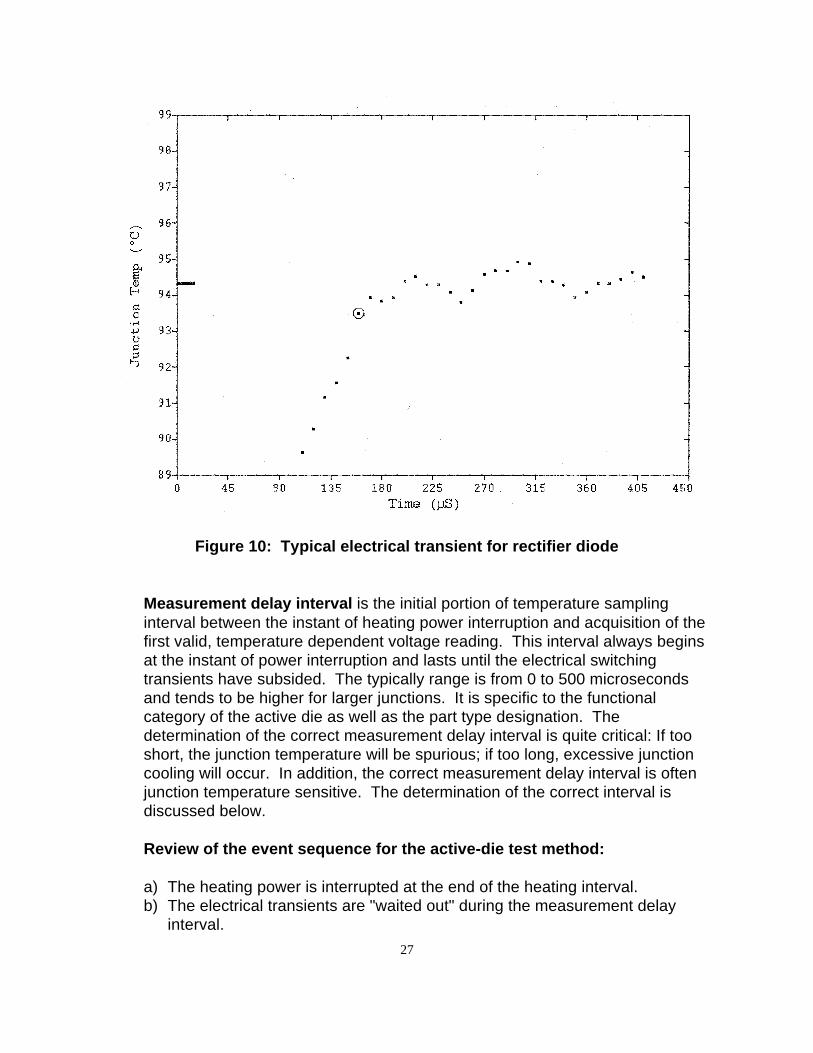
Figure 10: Typical electrical transient for rectifier diode
Measurement delay interval is the initial portion of temperature samplinginterval between the instant of heating power interruption and acquisition of thefirst valid, temperature dependent voltage reading. This interval always beginsat the instant of power interruption and lasts until the electrical switchingtransients have subsided. The typically range is from 0 to 500 microsecondsand tends to be higher for larger junctions. It is specific to the functionalcategory of the active die as well as the part type designation. Thedetermination of the correct measurement delay interval is quite critical: If tooshort, the junction temperature will be spurious; if too long, excessive junctioncooling will occur. In addition, the correct measurement delay interval is oftenjunction temperature sensitive. The determination of the correct interval isdiscussed below.
Review of the event sequence for the active-die test method:
a) The heating power is interrupted at the end of the heating interval.b) The electrical transients are "waited out" during the measurement delay
interval.
28
c) Sampling of the temperature sensitive voltage is performed for the remainderof the temperature sampling interval.
d) Heating power is resumed at the end of the temperature sampling interval.
The recommended approach for acquiring the desired junction temperature at theinstant of heating power interruption utilizes repetitive sampling for the remainingduration of the temperature sampling interval. [Oettinger, F.F., Blackburn, D.L., 1990]Typical sampling rates range from 50 to 200 kilohertz (5 to 20 microsecond samplingperiod) for 10 to 30 samples. The Analysis Tech Thermal Analyzers utilize up to 10kilohertz reading rates at 25 or more samples. The temperature sensitive voltages arethen converted into junction temperature readings (Equ 3). Since the junction coolsduring the temperature sampling interval, extrapolation should be utilized to determinethe junction temperature at the instant of power interruption. This extrapolationbecomes critical for longer measurement delay intervals. The process of extrapolationalso improves sample accuracy since the random noise present in the sense voltagereadings will be averaged-out.
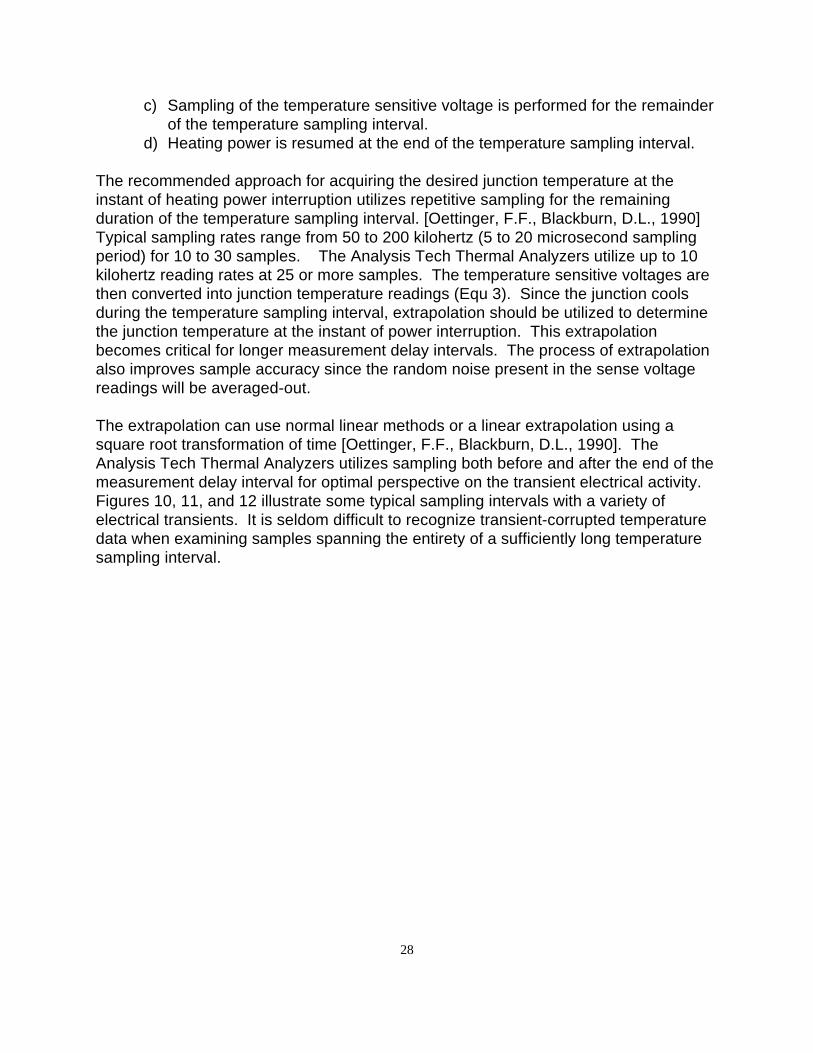
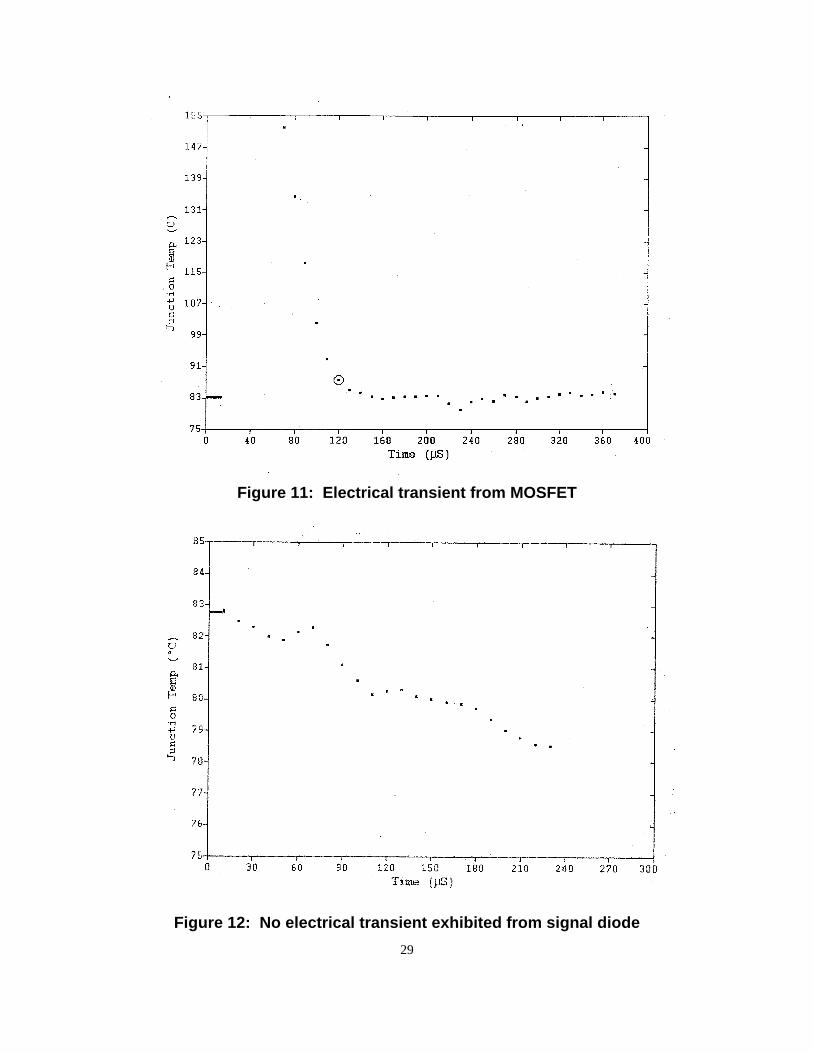
The extrapolation can use normal linear methods or a linear extrapolation using asquare root transformation of time [Oettinger, F.F., Blackburn, D.L., 1990]. TheAnalysis Tech Thermal Analyzers utilizes sampling both before and after the end of themeasurement delay interval for optimal perspective on the transient electrical activity.Figures 10, 11, and 12 illustrate some typical sampling intervals with a variety ofelectrical transients. It is seldom difficult to recognize transient-corrupted temperaturedata when examining samples spanning the entirety of a sufficiently long temperaturesampling interval.
29
Figure 11: Electrical transient from MOSFET
Figure 12: No electrical transient exhibited from signal diode

30
1.9 Standard Test Methods
Standard methods have been developed for applying the electrical method of junctiontemperature measurement to a variety of different functional device categories, i.e.,bipolar transistor, rectifier, and MOSFET. A resource for these methods is MIL STD750C, 3100 series methods.
Devices can be divided into two categories for thermal testing: two-terminal and three-terminal. The issues and differences in powering these two device types have alreadybeen covered in the section on Delivery of Heating Power. The junction-temperaturesensing is somewhat specific to the functional device type. Table #1 provides anoverview of the temperature sensitive parameters used for various device types. Adetailed description of these methods are available in the MIL Std 750C, 3100 seriesmethods.
Device Family Temperature Sensitive Parameterdiode, rectifier, SCR, TRIAC diode V
integrated circuit, thermal test die die sensing diode Vintegrated circuit, functional die substrate isolation diode sensed and
powered orsense diode voltage and functional
poweringbipolar transistor, NPN base-to-emitter or
base-to-collector diode Vbipolar transistor, PNP emitter-to-base or
collector-to-base diode VMOSFET (N channel) source-to-drain diode V or
gate turn-on VMOSFET (P channel) drain-to-source diode V or
gate turn-on Vdarlington transistor base-to-emitter diode or
saturation VIGBT saturation V or
gate turn-on V
Table #1: Temperature Sensitive Parameter Listing for Various Device Types
31
1.9.1 Integrated Circuits
Integrated circuit components can be thermally characterized using a functional die orby substituting a thermal test die. Active die testing can be quite simple despite thepotentially complex functionality and high lead counts that integrated circuits maypresent. The simplest technique utilizes the substrate isolation diode that is present onmost (although not all) integrated circuit dice. The substrate isolation diode iselectrically accessed by reverse biasing the power and ground pins and can be usedas both the heat dissipator and sense junction. This technique is the same as theprocedure for testing rectifier diodes. The die heating is not concentrated but rather isquite uniform much like that of the thermal test die. The advantage of using substrateisolation diode testing on active dice is that the die size and die attachment is identicalto the final production components. This is often not true when a thermal test die issubstituted for the active die. A difference in either die size or attachment can cause adiscrepancy between component characterization data with the thermal test die versusthat with an active die. The disadvantage of using the substrate isolation diode methodor the thermal test die method is that the heat dissipation pattern on the die can bequite different from that which exists during functional operation of the integratedcircuit. This difference can yield higher junction temperature in actual operation offunctional dies than that predicted by thermal testing.
1.10 Component Thermal Impedance
This section deals with the topic of transient, non-equilibrium, componentcharacterization. Consideration of transient effects is required in applications wherethe component never reaches steady state during the course of operation. Forexample, the components in some small on-board missile applications experience nomore than 100 seconds of intended operation. Characterization of components atsteady state is not useful for such situations.
Characterization of component transient behavior can also reveal aspects of internaldevice construction. It can be used to perform non-destructive testing for dieattachment quality and to delineate the effective thermal performance of componentconstruction details.
Further, transient component characterization can be used to predict the performanceof components in response to non-steady, irregular, or cyclic heating waveforms.

32
1.10.1 Transient and Steady State
When a component is unpowered and at thermal equilibrium with the ambientenvironment, its temperature is uniform throughout. When a constant level of power isabruptly applied to the component and held constant for long period of time, thecomponent temperature undergoes a transition from an initially unpowered equilibriumcondition to a new, final powered steady state equilibrium condition.
Steady state thermal equilibrium is the condition where the previoustemperature of the component no longer influences the present temperaturedisposition of the component. At thermal equilibrium, the only variables thatcontrol the temperature of the component are the fixed power dissipation and thethermal environment; when both of these are constant for a sufficient period oftime, the part approaches thermal equilibrium. Prior to equilibrium, thecomponent is considered to be in thermal transition or a transient thermal state.At thermal equilibrium, time becomes an irrelevant parameter. Once equilibriumhas been reached, the duration of previous heating is not needed to predict thetemperature of the component.
During a transient thermal condition, the temperatures within the component packageare changing toward a new thermal equilibrium. Thermal resistance can only bemeasured at equilibrium conditions. The physical reason for this is the existence ofthermal mass or heat capacitance that is present in all matter. These capacitances aredistributed throughout the body of a component and must be thermally "charged" todifferent temperatures when a component makes a thermal transition from oneequilibrium condition to another. This thermal "charging" via heat flow requires time.The definition of thermal resistance requires the same total heat flow across both of thetwo isothermal surfaces. This can only occur when all of the heat capacitancesbetween the two isothermal surfaces have stopped changing temperature and havereached equilibrium. The greater the heat capacity of the package contained betweenthe isothermal surfaces, the longer the transient period until the onset of thermalequilibrium.
Prior to thermal equilibrium, the attempted computation of thermal resistance yieldsthermal impedance.
Thermal impedance is defined as the difference in temperature between twoisothermal surfaces divided by the heat flow entering the hotter of the twosurfaces. Thermal impedance at thermal equilibrium is synonymous with thermalresistance. Thermal impedance must specify the powering condition andduration whereas thermal resistance is only defined at thermal equilibrium.These "surfaces" are not physical, solid surfaces but rather imaginary surfacesof constant temperature. Defining Tj and Tx as the hot and cold isothermalsurface temperatures respectively and the total heat flow rate entering the
33
isothermal surface at temperature Tj as P, the thermal impedance between thesesurfaces is
ZT T
Pjx
j x=
−
(Equ 8)The units of thermal impedance are °C / Watt.
Thermal impedance is simply thermal resistance without the condition of equal heat fluxacross both isotherms. This inequality occurs when heat capacitances between theisothermal surfaces are storing heat energy prior to thermal equilibrium.
The thermal impedance concept is analogous to electrical impedance. Electricalimpedances include resistances and reactances, i.e., capacitors and inductances.Reactances only manifest themselves during periods of transition. Once electricalsteady state has been reached, only the presence of resistance is apparent. Thissituation is precisely analogous to thermal impedances although electrical inductorshave no thermal analog.
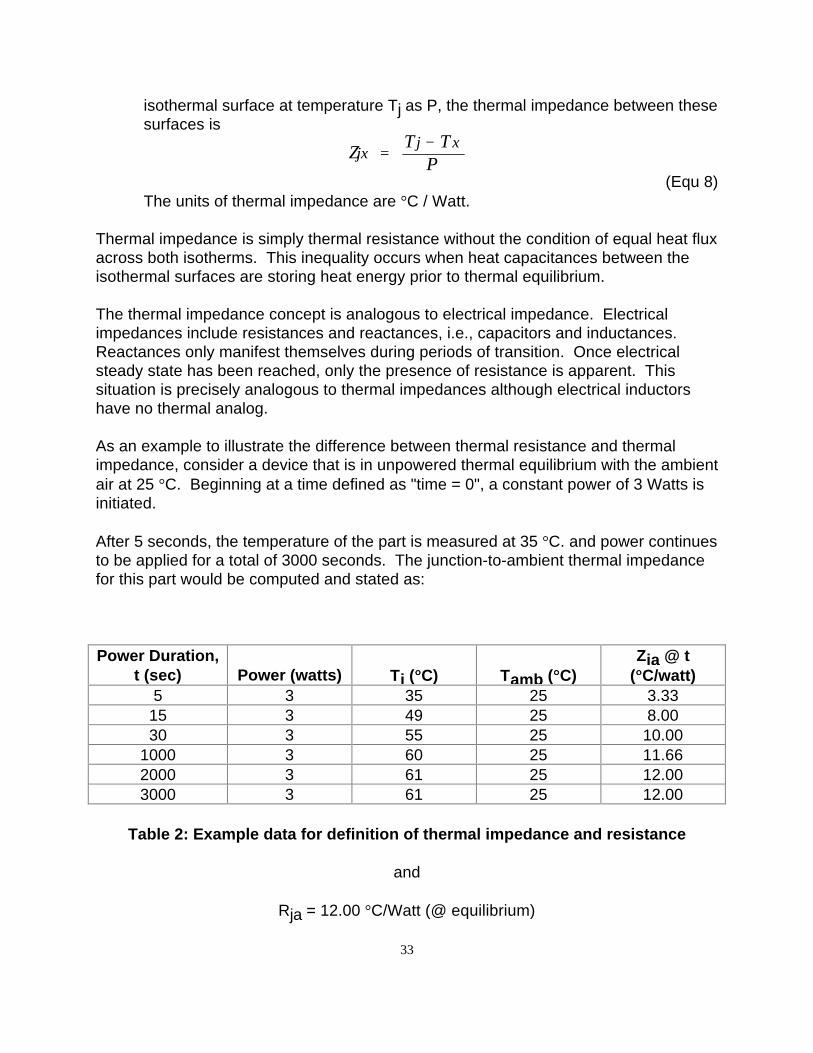
As an example to illustrate the difference between thermal resistance and thermalimpedance, consider a device that is in unpowered thermal equilibrium with the ambientair at 25 °C. Beginning at a time defined as "time = 0", a constant power of 3 Watts isinitiated.
After 5 seconds, the temperature of the part is measured at 35 °C. and power continuesto be applied for a total of 3000 seconds. The junction-to-ambient thermal impedancefor this part would be computed and stated as:
Power Duration,t (sec) Power (watts) Tj (°°C) Tamb (°°C)
Zja @ t(°°C/watt)
5 3 35 25 3.3315 3 49 25 8.0030 3 55 25 10.00
1000 3 60 25 11.662000 3 61 25 12.003000 3 61 25 12.00
Table 2: Example data for definition of thermal impedance and resistance
and
Rja = 12.00 °C/Watt (@ equilibrium)

34
Clearly, by the time the component has been powered for 2000 seconds, it has reachedsteady state and therefore the impedance at 2000 seconds is actually the thermalresistance of the component. In summary for any given power level, selectedtemperature references, and cooling environment, a component can have an unlimitednumber of thermal impedances but can have only one thermal resistance for any set ofselected isothermal surfaces.
Figure 13 illustrates component junction-to-ambient thermal impedance versus heatingduration after a step change in power dissipation. Theoretically, equilibrium requiresan infinite heating duration, although for all practical purposes, equilibrium begins after5 or 6 times the longest thermal time constant of the system enclosed between the twoisothermal surfaces. Collectively, the thermal impedance data taken during transientresponse to a step-change in power is often called "heat characterization" or "heatingcurve," since a plot of the data plot details the heating of the device.
Figure 13: Example of linear-time heating characterization plot

35
Heating Characterization is the complete response of a component to a step-heating condition. It defines the relationship of thermal impedance to heatingduration and contains a complete signature of the thermal behavior of the deviceranging from transient to steady state. When properly analyzed, the data can beused to predict the operation of the device under any set of operating powerconditions.
Heating characterization also provides valuable insights into the cross sectionaldisposition of thermal resistances and capacitances within the component. Insummary, the transient thermal data contained in a heating characterization can offer awealth of insight into the thermal performance of a component. (See following paper onSynthetic Models in Heating Characterization.) Figure13 presents a heatingcharacterization plot of impedance versus heating duration in response to a heatingpower step. The X-axis is a linear time axis where zero is the instant of step-initiationand the Y-axis is the component impedance. The longest duration of this heatingcharacterization is 1000 seconds. A very large portion of this plot presents equilibriumdata. Figure 14 presents the same heating characterization data plotted using a log-time. When plotted in this manner, the curve
Figure 14: Example of log-time heating characterization

36
exhibits plateaus or ripples which are associated with the internal thermal capacitancesand resistances of the package. The bulk of the log-time plot presents non-equilibriumdata. This example illustrates a useful fact regarding the selection of time axes forplotting heating characterization data. The linear time axis provides a much betterpresentation of equilibrium data; the log time axis presents a more detailedpresentation of the short duration, transient, non-equilibrium thermal data. Sinceheating characterization focuses on the transient data, the log-time plot is universallyaccepted for heating curves.
Figures15 and 16 each present a comparison of two heating curves. Figure 15contains the heating characterization for two plastic packages, one with an internalheat spreader pad and one without the spreader. Comparing the data starting from theshortest duration, the curves progressively diverge as the duration increases. Afterabout 4 seconds, the curves track parallel to each other at a fixed impedancedifference. This is indicative of a thermal difference quite close to the die.
Figure 15: Heating curve comparison for two plastic packages
37
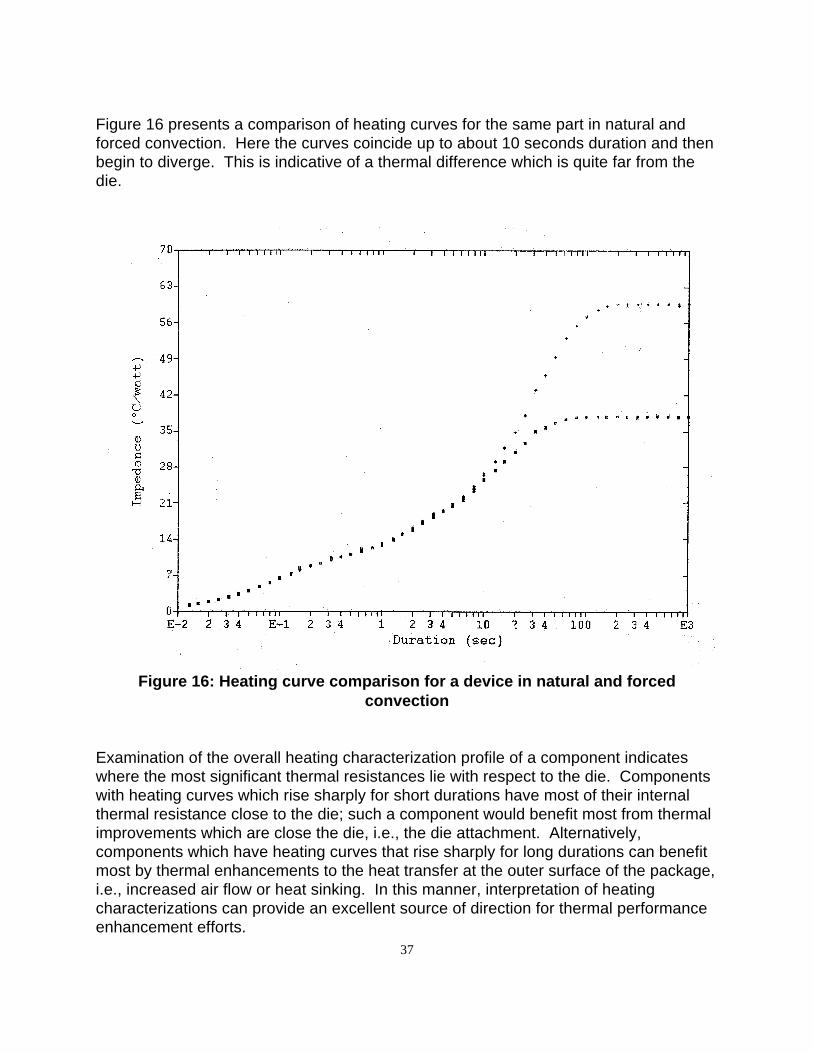
Figure 16 presents a comparison of heating curves for the same part in natural andforced convection. Here the curves coincide up to about 10 seconds duration and thenbegin to diverge. This is indicative of a thermal difference which is quite far from thedie.
Figure 16: Heating curve comparison for a device in natural and forcedconvection
Examination of the overall heating characterization profile of a component indicateswhere the most significant thermal resistances lie with respect to the die. Componentswith heating curves which rise sharply for short durations have most of their internalthermal resistance close to the die; such a component would benefit most from thermalimprovements which are close the die, i.e., the die attachment. Alternatively,components which have heating curves that rise sharply for long durations can benefitmost by thermal enhancements to the heat transfer at the outer surface of the package,i.e., increased air flow or heat sinking. In this manner, interpretation of heatingcharacterizations can provide an excellent source of direction for thermal performanceenhancement efforts.
38
1.11 Heating Characterization Measurements
Conceptually, heating characterization begins with a component in an unpoweredequilibrium condition. Ideally, the power-step begins when the component heating-power is instantaneously elevated to the specified level and then held constant for theduration required to ensure complete thermal equilibrium. The junction - referencetemperature difference climbs steadily from its initial value to the final equilibrium valueas the heating-step progresses. During this heating power step, the temperature of thejunction-to-reference temperature difference is measured continuously. Thecomponent impedance is computed as the instantaneous difference between thejunction and the reference temperature divided by the power level. For a number ofpractical reasons, the implementation of the heating characterization divergessignificantly from this basic concept.
In the single-step heating characterization, the junction temperature rises are quitesmall shortly after the commencement of the heating step. As the heating progresses,the temperatures differences increase and eventually reach a maximum at equilibrium.Since the fundamental errors associated with the measurement of junction temperaturerises are not tolerance ratios but rather a fixed error level expressed in °C,measurement errors will tend to overwhelm the small temperature rise data early in theheating pulse. As the heating progresses and temperatures rise, the relativesignificance of these fixed errors will subside to manageable levels. Thus, the singlestep response heating characterization will suffer from massive errors for the shortduration impedances and minimal errors for long duration impedances and thermalresistance. One solution is to use a higher heating power level throughout the step.This marginally improves the measurement errors and would be restricted by themaximum power and junction temperature limits of the component. The fundamentalproblem with the idealized, fixed power, single step heating response is that theheating power is limited to the steady state DC power limit.
Another problem with the ideal heating characterization concept is that only thermaldice can be continuously powered while simultaneously being measured for junctiontemperature. All active non-thermal dice require fixed duration interruption in theheating power for the measurement of the junction temperature. For short durationimpedances, these power interruptions comprise a significant "duty cycle" factor and anunacceptable deviation from the requirement of continuous heating at a fixed level. Asthe heating duration progresses, the off-power intervals become insignificant as aproportion of the heating duration.
For these reasons, heating characterization for components with active, non-thermaldice is performed using a sequence of single pulses which are successively deliveredat reduced power levels as the pulse duration increases. After each pulse, the
39
component impedance can be computed for that particular heating duration as thetemperature difference rise at the end of the pulse divided by the pulse power level.The heating curve is then composed by collecting the impedances, one from eachpulse. After each pulse, the component must be allowed to passively cool to nearly itsoriginal unpowered equilibrium state. When the pulse wattages are chosen to generatea uniform temperature rise for all heating durations, the impedance measurementsexhibit a uniform accuracy throughout the heating characterization. In the interest ofreducing the total time required for a heating characterization, longer heating durationscan be performed in the idealized, fixed-power level approach. When performingheating characterization with a respect a reference temperature which is assumed to befixed, i.e., ambient air temperature, care should be taken to ensure that the referencetemperature does not inadvertently "drift" during the heating characterization. Such a"drift" would generate systemic errors in the resultant data. Alternatively the referencetemperature can be monitored with a thermocouple to eliminate such errors.
1.11.1 Interpreting Heating Characterizations
The heating step-response curve of Figure 14 illustrates typical characteristics worthnoting. The variations in slope with shallow "plateaus" are a common, although notuniversal, manifestation. Each ripple in the heating step-response indicates anequilibrium condition in the distributed network of thermal resistances and capacitancesat a particular depth of the component with respect the outer portions of the package.The final plateau is reached when all of the intermediate levels of the componentpackage are near thermal equilibrium on the extreme right of the plot. Recalling that anexponential function exceeds 95% of its final value after 3 exponential time constantshave elapsed, each of the points of inflection correspond to approximately three-timesone of the inherent internal thermal time constants of the component packagingconfiguration.
The heating characterization represents a type of cross sectional view of the internalthermal resistances and capacitances of a component as depicted. To appreciate thisfact, it is helpful to envision the flow of heat in the component beginning at the instantthat the power-step commences: As heat spreads through the die, it begins to enterthe die attachment region. The small heat capacitance of the die region and the highheat flux density present causes a significant increase in the die temperature with onlya small accumulation of heat energy. Thus initial temperature rises are almost entirelygoverned by thermal spreading in the die region; the short duration impedances areoverwhelmingly representative of the heat flux network in the die region. The mass ofthe component package, with its larger heat capacitance, responds after further heatingand sufficient energy accumulates to alter its temperature. The larger the heatcapacitance associated with a thermal resistance, the longer the heating durationbefore its influence will be manifested. Thus heating curve data plots depict thedisposition of internal thermal resistances as a function of distance from the die -
40
effectively a thermal resistance cross section of the component [Sofia, J.W.,1995, D.L.Blackburn, 1975, D.L. Blackburn, F.F. Oettinger, 1974, C. Neugebauer, [et al.], 1986].
1.11.2 Impedance Testing
As the duration of heating characterization continues, the component approachesequilibrium as the measured impedances approach the steady state thermal resistance.At equilibrium, the thermal resistance embodies all of the distributed, constituentthermal resistances elements between the two designated reference temperature sites.For heating durations less than that required for thermal equilibrium, those thermalresistances are partially reflected in the associated impedances as a function of theheating duration: The longer the heating duration, the greater the proportion of thethermal resistances between the reference sites that will be included in the associatedthermal impedance. Based on this, pre-equilibrium heating durations can be chosen toselectively exclude the outer portions of a component. Essentially, an impedancemeasurement can be "tuned" to probe a particular internal component interface byselecting the correct heating duration. Such tests are specific and highly sensitive tothe thermal performance of the component package-depth of interest.
One of the most popular applications of "tuned" impedance measurement is the dieattachment test. [F.F. Oettinger, R.L. Gladhill, 1973] This test is also referred to as the"power pulse" test. The objective is to evaluate the thermal resistance of themechanical/thermal bond between the die-attachment and the package. Since most ofthe heat dissipated from a die is first conducted through the die-attachment, evaluationof the thermal integrity of the die-attachment is crucial to ensuring good thermalperformance. If the die-attachment is incomplete or defective and thus offers a poorheat-conduction path from the chip to the chip-package, the packaged semiconductordevice will operate with higher junction temperatures and thus have a shortened lifeexpectancy.
The die attachment test does not approach thermal equilibrium but is a totally transient,non-equilibrium test. Typical heating durations range from 10 to 200 milliseconds. Thetest begins by heating the component with a short, precisely controlled pulse causingrapid heating of the die without substantially heating the package into which it ismounted. At the end of the heating pulse the chip temperature rise is determined andthe impedance computed. When the pulse duration has been correctly chosen, theimpedance measured reflects the thermal resistance of the package from the dieoutward to slightly beyond the die attachment. The local ambient is used as the implicitreference temperature although, since this temperature does not change during the testand the device is assumed to be at unpowered thermal equilibrium prior to the test, theimpedance is simply the difference in junction temperature before and after the powerpulse. The peak junction temperature rise above the starting temperature is stronglycontrolled by the thermal resistance of the die attachment. Voids or defects in the

41
attachment will result in reduced thermal conduction and higher chip temperatures.The short duration of the power pulse required for die attachment testing is ideallysuited to screening production lots of devices for acceptable thermal die-attachment.
It should be noted that the pulse power in die-attachment tests is often significantlyhigher than the steady state, DC power level limit. Such augmented power levels offersignificantly higher temperature rises than the DC limit and thereby improves themeasurement accuracy of the test.
In a similar manner, longer heating duration pulses can be used to test internalcomponent-interface layers. The testing of header attachments is a good example ofthis. Here the pulse duration can range from 50 to 500 milliseconds. This testeffectively determines the quality of the header attachment but is also affected by thequality of the die attachment since the longer pulse measures the thermal resistancefrom the die through the die attachment, the header, and the header attachment,respectively. A test of this type does not comprise a good indicator of headerattachment unless a previous test for die attachment has been performed.
In production environments, large quantities of devices can be "screened" for dieattachment. The results of this screening can be represented as a histogram. Figure17 presents an example of this type of evaluation. The shape of these curves is often abell curve with an extended "hot-foot" as shown in the figure. This type of analysishelps to determine production consistency and provides the basis for enhancement ofthermal quality of manufacture.
Figure 17: Sample histogram of die-attachment test results

42
The topic of heating characterization is also discussed in SEMI Std G46-88.
1.11.3 Further Applications of Heating Characterization
A heating characterization contains all of the information needed to accurately predictthe behavior of the component to any non-steady heating condition. A technique forsynthesizing dynamic models comprised of discrete thermal resistances andcapacitances has been developed for improved physical insight. [Sofia, 1995] Thesemodels provide three significant benefits:
a) delineation of effective internal package thermal resistances and timeconstants
b) delineation of the best "target" for package thermal enhancement efforts andestimate of probable results
c) simulation of the behavior of the device to non-steady or cyclic poweringconditions.
These component dynamic models can be used to simulate the thermal performance inresponse to power conditions other than the simple step. Arbitrary power waveformscan be specified as the input to the synthetic model. The resulting simulation cancompletely detail the thermal performance of the device. Figure 18 presents a typicalsimulation using square-wave heating power over a range duty cycles.

43
Figure 18: Sample of square-wave impedance simulation
Arbitrary heating waveforms can be utilized when expressed in step-wiseapproximation. This simulation technique essentially involves a superposition in time ofa sequence of power steps that, when added together, produce the desired heatingwaveform. Since the response of the component to a single heating step is known,superimposing the responses of the individual steps comprising the desired heatingwaveform produces the desired response. This technique is called "temporalsuperposition". It can be applied to simulate the thermal response of any componentfor any arbitrary heating waveform, transient or steady-state, based on the informationcontained in the standard heating characterization.
1.12 Thermal Resistance Methods for Hybrids/Multi-Chip Components
1.12.1 Introduction
Thermal resistance characterizations of electronic packages having multiple heatsources are unique and can often pose problems, particularly for the thermal test
44
engineer. Such packages are typified by multi-chip packages or hybrid electronicassemblies. Such components possess multiple dice in close proximity withindependent heat dissipations. The fundamental effect that differentiates thesecomponents from the single die packages is that each die heats the adjacent dice andthe relative heat dissipation of the dice may independently be a function of thecomponent operation.
The following discussion covers the method of thermal resistance characterization inmulti-chip components. The underlying theory of linear superposition is brieflydiscussed followed by the matrix method of thermal resistance formulation.
1.12.2 Method of Linear Superposition
The physics of heat transfer is expressed by the general heat-conduction equation andgoverns the temperature distribution and the conduction heat flow in a solid havinguniform physical properties. The Laplace transformation theory that can be used tosolve this differential equation includes the superposition theorem, the Duhamelintegral theorem, as part of its formulation. The idea of superposition is that knownheat conduction solutions for specific heat transfer problems can be superimposed toyield valid solutions for more complex problems of interest. This principle of linearsuperposition of heat conduction solutions is an extremely powerful tool which can beapplied to thermal testing.
As a simple example of linear superposition, consider the hypothetical case of one-dimensional heat conduction in a bar. Here, the bar contains two internal heat sourcesand is insulated everywhere except at the ends where a fixed temperature is imposed.The temperature distribution within this bar is shown in Figure 19A, where only a singleheat source is operating. With a different heat source operating, a second solution canbe easily generated as shown in Figure 19B. Using the method of linear superposition,the solution for the bar with the two heat sources operating simultaneously can becreated by simply adding the temperature fields and the heat fluxes. Thissuperimposed solution is shown in Figure 19C which was created by summing thetemperature rises from each single source solution.
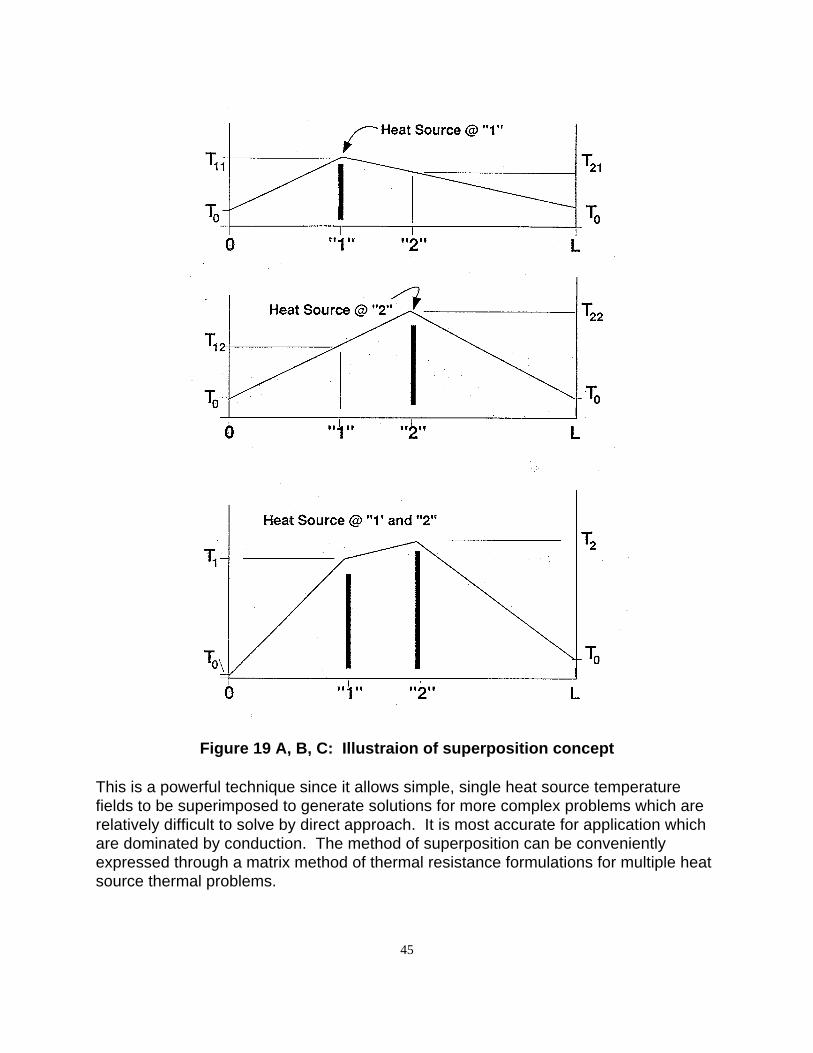
45
Figure 19 A, B, C: Illustraion of superposition concept
This is a powerful technique since it allows simple, single heat source temperaturefields to be superimposed to generate solutions for more complex problems which arerelatively difficult to solve by direct approach. It is most accurate for application whichare dominated by conduction. The method of superposition can be convenientlyexpressed through a matrix method of thermal resistance formulations for multiple heatsource thermal problems.
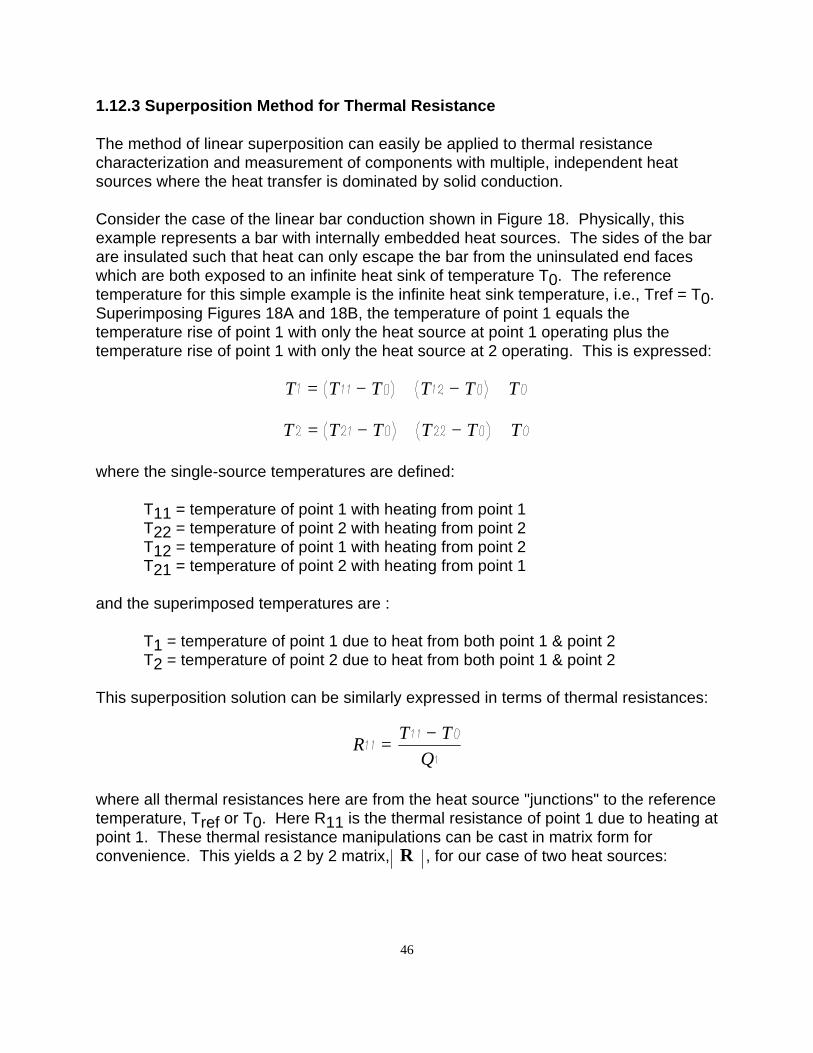
46
1.12.3 Superposition Method for Thermal Resistance
The method of linear superposition can easily be applied to thermal resistancecharacterization and measurement of components with multiple, independent heatsources where the heat transfer is dominated by solid conduction.
Consider the case of the linear bar conduction shown in Figure 18. Physically, thisexample represents a bar with internally embedded heat sources. The sides of the barare insulated such that heat can only escape the bar from the uninsulated end faceswhich are both exposed to an infinite heat sink of temperature T0. The referencetemperature for this simple example is the infinite heat sink temperature, i.e., Tref = T0.Superimposing Figures 18A and 18B, the temperature of point 1 equals thetemperature rise of point 1 with only the heat source at point 1 operating plus thetemperature rise of point 1 with only the heat source at 2 operating. This is expressed:
T T T T T T= − + − +
T T T T T T= − + − +
where the single-source temperatures are defined:
T11 = temperature of point 1 with heating from point 1T22 = temperature of point 2 with heating from point 2T12 = temperature of point 1 with heating from point 2T21 = temperature of point 2 with heating from point 1
and the superimposed temperatures are :
T1 = temperature of point 1 due to heat from both point 1 & point 2T2 = temperature of point 2 due to heat from both point 1 & point 2
This superposition solution can be similarly expressed in terms of thermal resistances:
RT T
Q=
−
where all thermal resistances here are from the heat source "junctions" to the referencetemperature, Tref or T0. Here R11 is the thermal resistance of point 1 due to heating atpoint 1. These thermal resistance manipulations can be cast in matrix form forconvenience. This yields a 2 by 2 matrix, R , for our case of two heat sources:
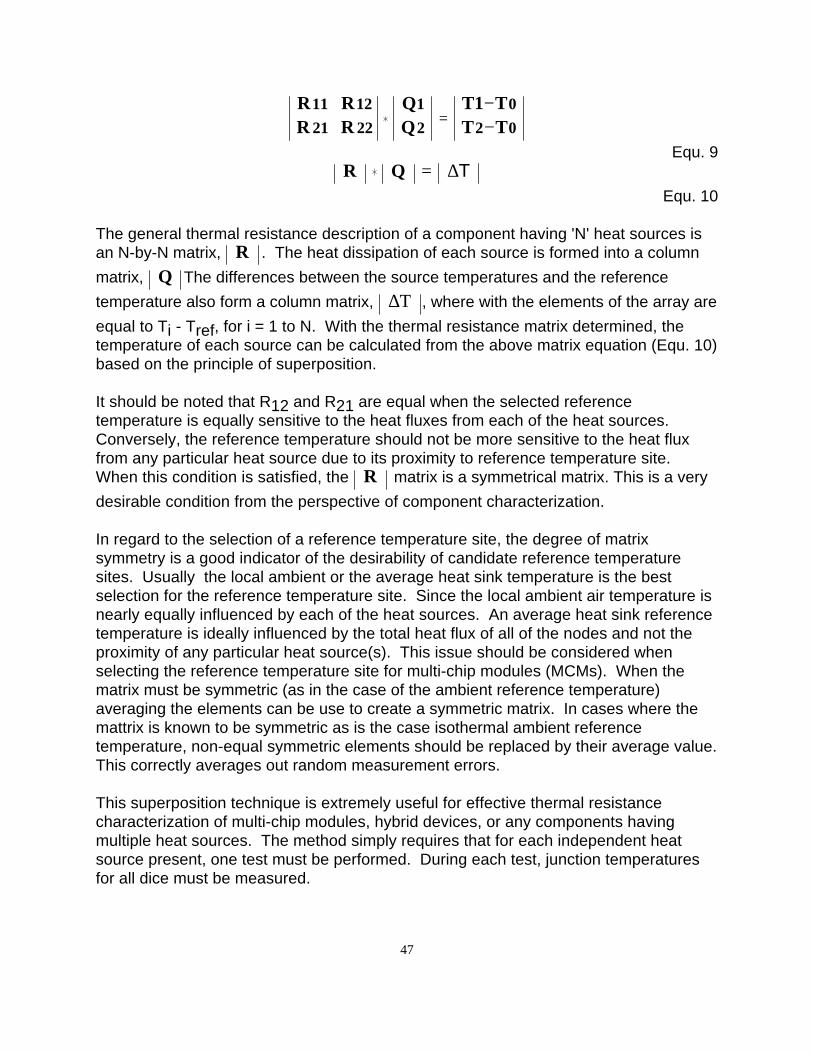
47
R RR R
T1 TT T
11 12
21 22
1
2
0
2 0=
−−
Equ. 9R Q = ∆T
Equ. 10
The general thermal resistance description of a component having 'N' heat sources isan N-by-N matrix, R . The heat dissipation of each source is formed into a column
matrix, Q The differences between the source temperatures and the reference
temperature also form a column matrix, ∆Τ , where with the elements of the array are
equal to Ti - Tref, for i = 1 to N. With the thermal resistance matrix determined, thetemperature of each source can be calculated from the above matrix equation (Equ. 10)based on the principle of superposition.
It should be noted that R12 and R21 are equal when the selected referencetemperature is equally sensitive to the heat fluxes from each of the heat sources.Conversely, the reference temperature should not be more sensitive to the heat fluxfrom any particular heat source due to its proximity to reference temperature site.When this condition is satisfied, the R matrix is a symmetrical matrix. This is a very
desirable condition from the perspective of component characterization.
In regard to the selection of a reference temperature site, the degree of matrixsymmetry is a good indicator of the desirability of candidate reference temperaturesites. Usually the local ambient or the average heat sink temperature is the bestselection for the reference temperature site. Since the local ambient air temperature isnearly equally influenced by each of the heat sources. An average heat sink referencetemperature is ideally influenced by the total heat flux of all of the nodes and not theproximity of any particular heat source(s). This issue should be considered whenselecting the reference temperature site for multi-chip modules (MCMs). When thematrix must be symmetric (as in the case of the ambient reference temperature)averaging the elements can be use to create a symmetric matrix. In cases where themattrix is known to be symmetric as is the case isothermal ambient referencetemperature, non-equal symmetric elements should be replaced by their average value.This correctly averages out random measurement errors.
This superposition technique is extremely useful for effective thermal resistancecharacterization of multi-chip modules, hybrid devices, or any components havingmultiple heat sources. The method simply requires that for each independent heatsource present, one test must be performed. During each test, junction temperaturesfor all dice must be measured.

48
1.12.4 Limitations and Sources of ErrorThe method of superposition may be used effectively over a wide range of problems.Random errors are always present but these can be quantified by test repetition andanalysis of the sensitivity of the final results to such errors. There are however somesituations which may cause significant systematic errors:
a) radiation effects: When radiation becomes a significant means of heattransfer (greater than 5 to 10 % of the total heat transfer) superposition willbegin to generate systematic errors. The reason is that radiation heattransfer has fourth power dependency on temperature, hence, is notsuperimposable.
b) temperature variations in material properties: These are nonlinearitieswhich are not superimposable. To minimize these non-linear effects, allsingle source tests should be performed at peak temperatures close to thoseexpected in the superimposed solution.
c) transport by convection: Natural convection generates a non-superimposable non-linearity since the convective action depends on thetotal amount of heat dissipated leading to buoyancy. Convection affectscomponents that are down-stream of the heated component(s). Fluiddynamic effects are often non-linear and thus can create systematic errorsfor superposition method.
1.13 Component Characterization Method Summary
The following list comprises the primary steps for component characterization.
Device Calibrationa) Determine the electrical connections for the temperature sensitive
parameter (TSP).b) Select the sense current and calibration environment.c) Perform calibration to determine the calibration relationship for the
TSP.
Thermal Resistance Testinga) Determine the means to heat the component with DC power.b) Determine the reference temperature site and the means to measure
it.c) Fixture the component in the desired test thermal environment.d) Allow the component to reach unpowered equilibrium with the
environment.e) Measure the sense voltage and compute the unpowered junction
temperature.

49
f) Compare the junction temperature with the environment temperatureand correct temperature intercept if necessary (one-pointrecalibration).
g) Begin heating the component.h) Check the junction temperature readings to ensure the correct value
for the measurement delay interval to avoid spurious electrical noise.i) When powered thermal equilibrium has been reached, report the
thermal resistance based on the final power level, measured referencetemperature, and junction temperature (computed using therecalibrated calibration parameters).
Thermal Impedance Testinga) Perform thermal resistance first to establish steady state power limits
and stable DC power conditions.b) Let component reach unpowered equilibrium in test environment.c) Determine the desired duration of heating .d) Determine the desired power level for sufficient temperature rise.e) Deliver the desired power pulse and determine the junction
temperature rise. Be sure that the correct value for the measurementdelay interval is used to avoid spurious electrical noise.
f) Compute thermal impedance based on the temperature rise and thepower level delivered.
g) If performing a heating characterization, repeat steps b) - f) for anothercombination of duration and power level.
1.14 References
Azar, K., Benson, J. R., Manno, V., "Liquid Crystal Imaging for TemperatureMeasurement of Electronic Devices" Seventh IEEE SEMI-THERM Symposium pp 23-29, 1991
Blackburn, D.L., "An Electrical Technique for the Measurement of the Peak JunctionTemperature of Power Transistors", 13th Annual Proceedings Reliability Physics, '75,IEEE 75CH0931-6PHY, pp. 142-145, 1975
Blackburn, D.L., Oettinger, F.F., "Transient Thermal Response Measurements of PowerTransistors," IEEE Power Electronics Specialists Conference (PESC), 1974 Record,June 1974, pp 140-148
"Circuit-Performance and Thermal Resistance Measurements" (3100 Series) MIL-STD-750C, February, 1993

50
Kraus, A.D., Bar-Cohen, A., Thermal Analysis and Control of Electronic Equipment,McGraw Hill, 1983, ch. 1
C. Neugebauer, [et al.], Thermal Response Measurements for Semiconductor Devices,New York: Gordon & Breach Science Publications, 1986, ch. 4, 5, 6
Oettinger, F.F., Blackburn, D.L. Thermal Resistance Measurements, NIST SpecialPublication 400-86 from Series on Semiconductor Measurement Technology, July,1990
Oettinger, F.F., Gladhill, R.L., "Thermal Response Measurements for SemiconductorDevice Die Attachment Evaluation," International Electronic Device Meeting TechnicalDigest (IEDM), 1973, pp. 47-50
Sofia, J.W., "Analysis of Thermal Transient Data with Synthesized Dynamic Models forSemiconductor Devices", IEEE Transactions on Components, Packaging, andManufacturing Technology Part A (CPMT), Volume 18, March 1995, pp 39-47
Related Documents