Fundamentals of Operations Management BUS 3 – 140 Capacity & Operations Planning Week of Feb 25, 2008

Fundamentals of Operations Management BUS 3 – 140 Capacity & Operations Planning Week of Feb 25, 2008.
Dec 19, 2015
Welcome message from author
This document is posted to help you gain knowledge. Please leave a comment to let me know what you think about it! Share it to your friends and learn new things together.
Transcript
Fundamentals ofOperations Management
BUS 3 – 140
Capacity & Operations Planning
Week of Feb 25, 2008
Page 2 2
Definitions
* From Stevenson, Operations Management, Ninth Edition, McGraw Hill Irwin
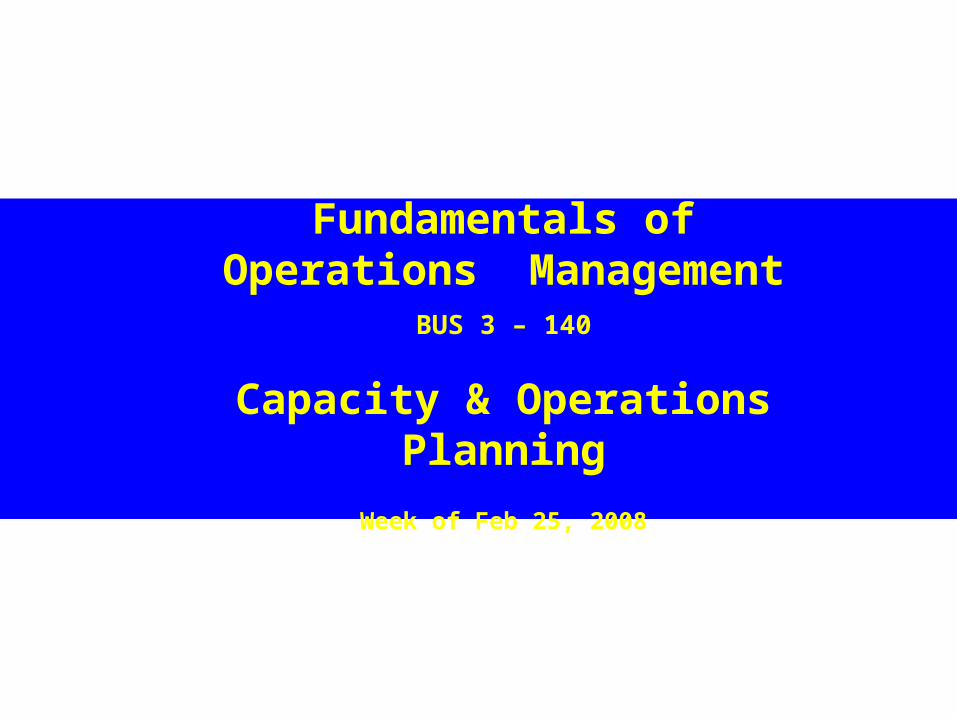
Design capacity
Maximum output rate or service capacity for which an operation, process, or facility is designed
Effective capacity
Design capacity minus allowances such as personal time, maintenance, and scrap
Actual output
Rate of output actually achieved--cannot exceed effective capacity.
Page 3 3
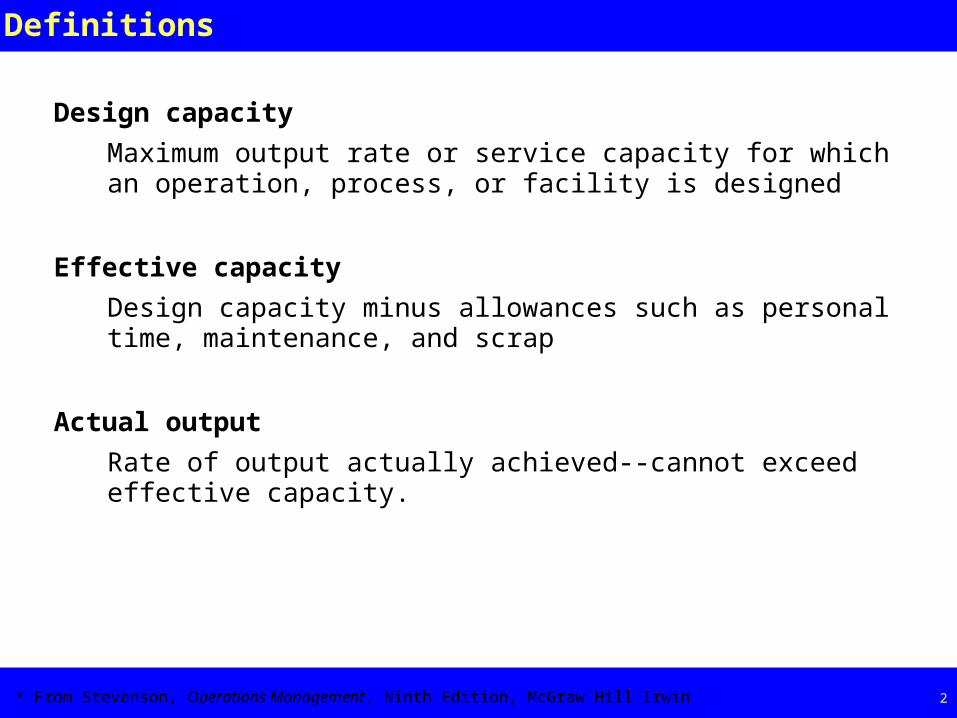
Measures of Capacity (Table 5.1)
* From Stevenson, Operations Management, Ninth Edition, McGraw Hill Irwin
Business Inputs Outputs
Auto Manufacturing Labor hours, machine hours Number of cars per shift
Steel Mill Furnace size Tons of steel per day
Oil Refinery Refinery size Gallons of fuel per day
Farming Number of acres, number of cowsBushels of grain per acre per year, gallons of milk per day
RestaurantNumber of tables, seating capacity
Number of meals served per day
Theater Number of SeatsNumber of tickets sold per performance
Retail Sales Square feet of floor space Revenue generated per day

Page 4 4
Factors that Influence Effective Capacity (Table 5.2)
FACILITIES POLICY
Design
Location OPERATIONAL
Layout Scheduling
Environment Materials Management
Quality assurancePRODUCT / SERVICES Maintenance policies
Design Equipment breakdownsProduct or service MIX
SUPPLY CHAINS
PROCESS
Quantity capabilities EXTERNAL FACTORS
Quality capabilities Product standards
Safety regulationsHUMAN FACTORS Unions
Job Content Pollution control standards
Job Design
Training and Experience
Motivation
CompensationLearning Curve
Absenteeism & labor turnover
Page 5 5
Strategic Considerations in Capacity Planning
Revenue
Cost
Technologies
Volumes
Markets
Acquisitions
Sourcing decisions
Expansion decisions
Capital equipment
Long time to Implement and then in place for a Long time
Page 6 6
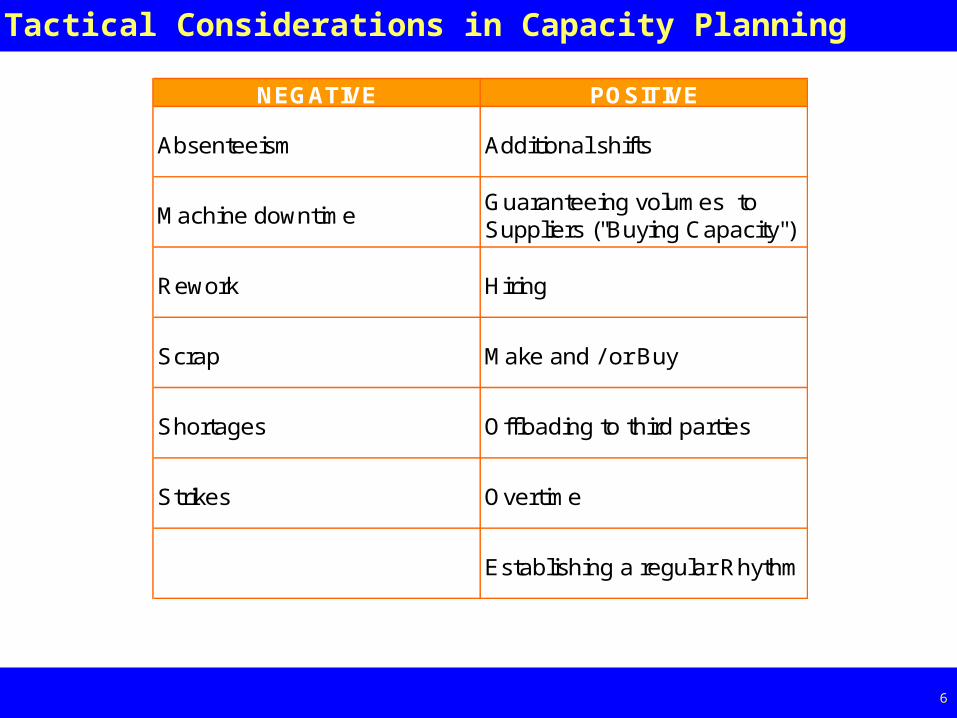
Tactical Considerations in Capacity Planning
NEGATIVE POSITIVE
Absenteeism Additional shifts
Machine downtime Guaranteeing volumes to Suppliers ("Buying Capacity")
Rework Hiring
Scrap Make and / or Buy
Shortages Offloading to third parties
Strikes Overtime
Establishing a regular Rhythm
Page 7 7
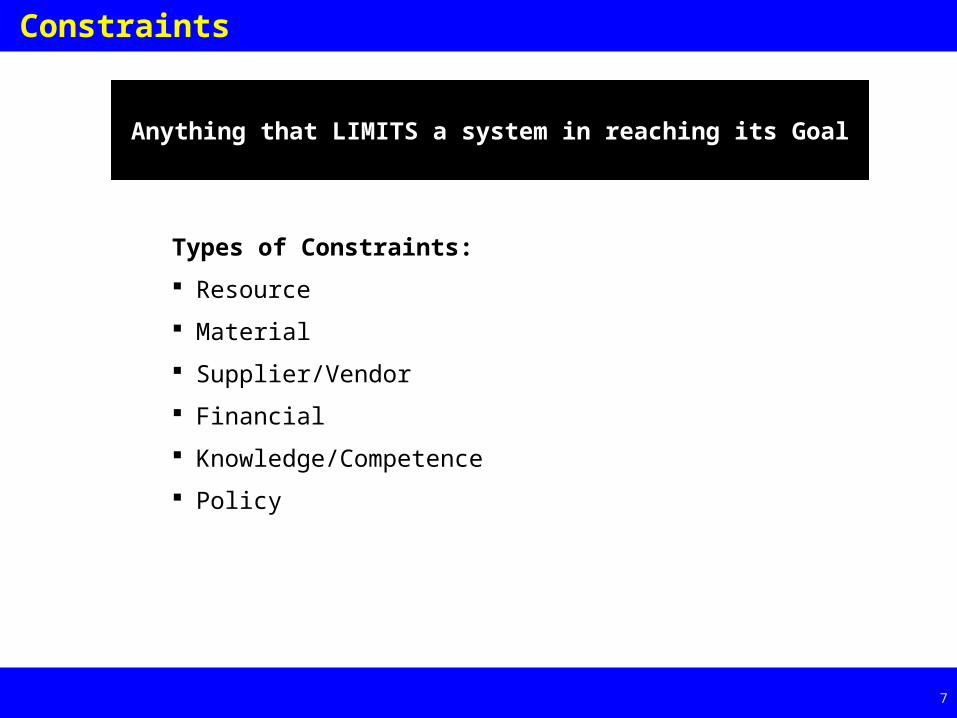
Constraints
Types of Constraints:
Resource
Material
Supplier/Vendor
Financial
Knowledge/Competence
Policy
Anything that LIMITS a system in reaching its Goal
Page 8 8
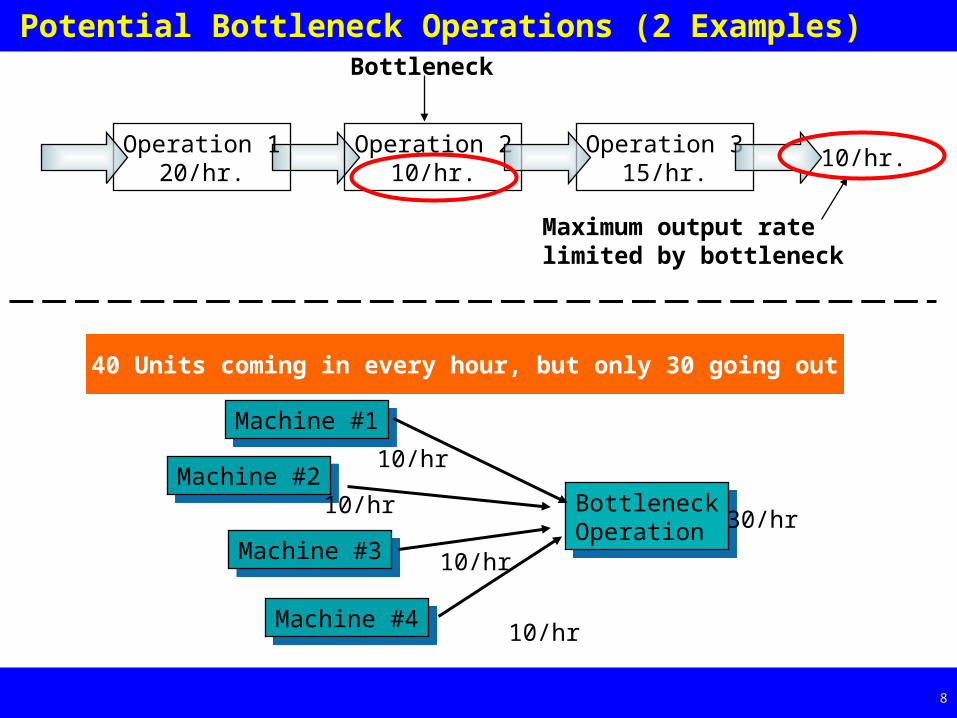
Potential Bottleneck Operations (2 Examples)
Operation 120/hr.
Operation 210/hr.
Operation 315/hr.
10/hr.
Bottleneck
Maximum output ratelimited by bottleneck
Machine #2Machine #2
BottleneckOperation
BottleneckOperation
Machine #1Machine #1
Machine #3Machine #3
Machine #4Machine #4
10/hr
10/hr
10/hr
10/hr
30/hr
40 Units coming in every hour, but only 30 going out
Page 9 9
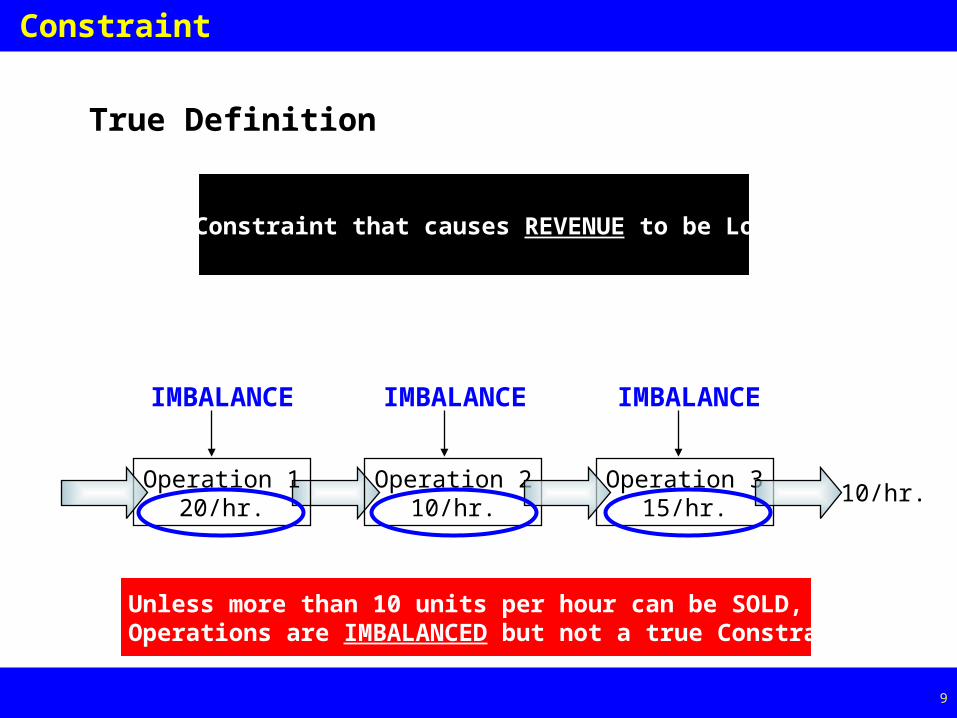
Constraint
A Constraint that causes REVENUE to be Lost
True Definition
Unless more than 10 units per hour can be SOLD,the Operations are IMBALANCED but not a true Constraint
Operation 120/hr.
Operation 210/hr.
Operation 315/hr.
10/hr.
IMBALANCEIMBALANCE IMBALANCE
Page 10 10
Unique Elements of Service Capacity
The need to be near Customers
Cannot store “inventory” of services in advance of the requirement
Variability of Inputs and Outputs
Page 11 11
Developing Capacity Alternatives
Design flexibility into systems
Add power and water lines for easier expansion
Simplify facilities
Three bedroom house when you have no kids
Take stage of life cycle into account
Take a “big picture” approach to capacity changes
Correlation of different events (e.g. Increasing number of Hotel Rooms offered will increase need for Parking, Food, Housekeeping, etc..)
Attempt to smooth out capacity requirements
Influence demand so that load during peak times may be transferred of too-peak times
Use same equipment for complementary products (e.g. Bicycles and “Body by Jake”)
Capacity Planning & Cost
Page 13 13
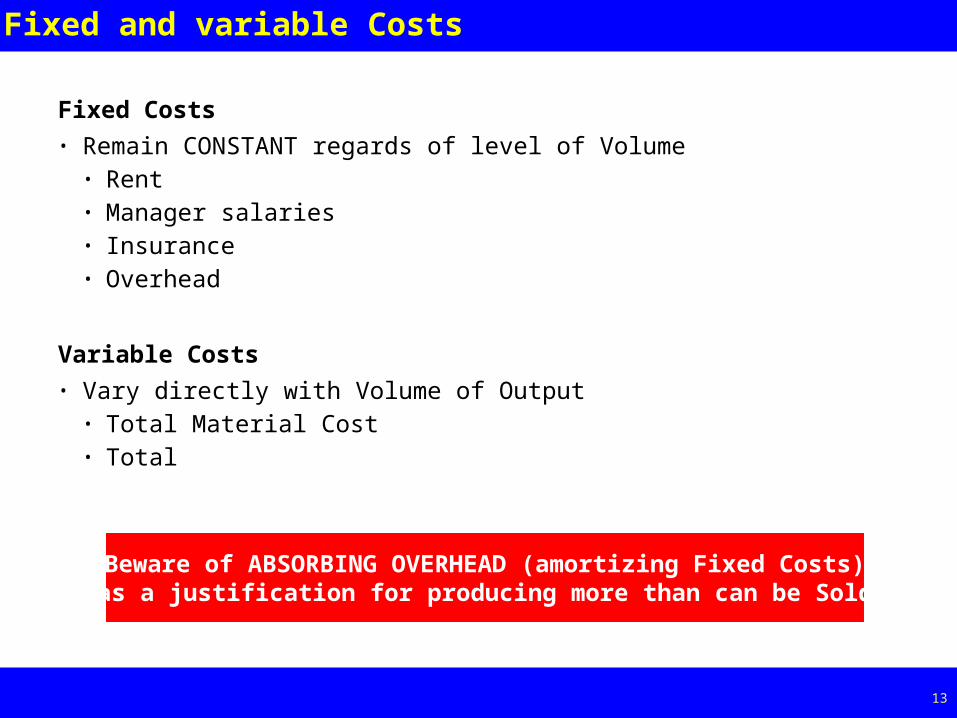
Fixed and variable Costs
Fixed Costs
• Remain CONSTANT regards of level of Volume• Rent• Manager salaries• Insurance• Overhead
Variable Costs
• Vary directly with Volume of Output• Total Material Cost• Total
Beware of ABSORBING OVERHEAD (amortizing Fixed Costs)as a justification for producing more than can be Sold
Page 14 14
Breakeven PointA
mo
un
t ($
)
0Q (volume in units)
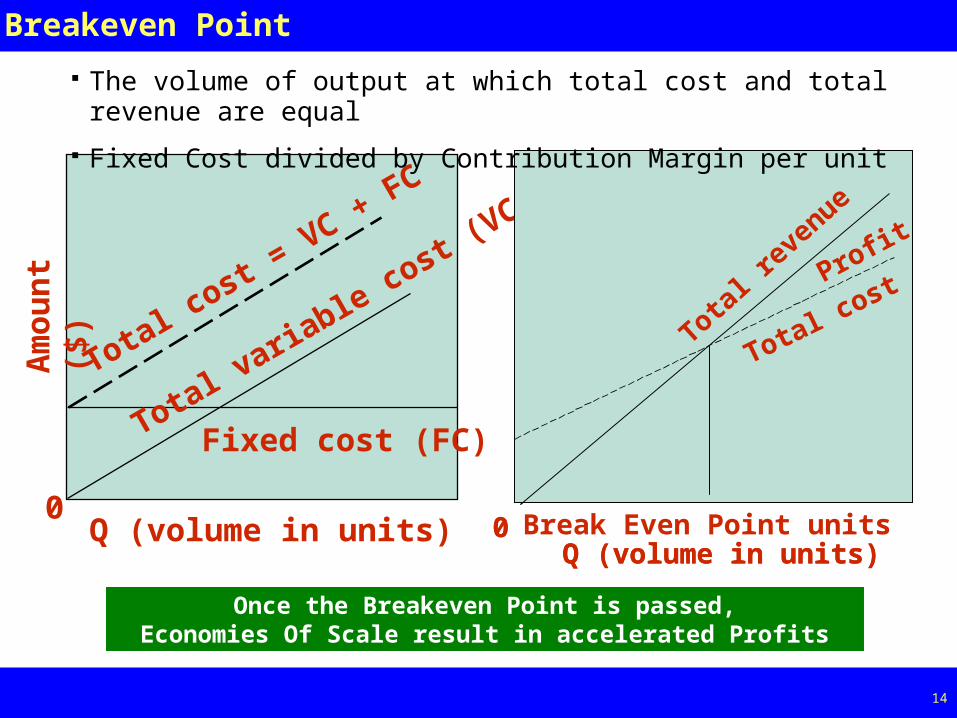
Total cost = VC + FC
Total variable cost (V
C)
Fixed cost (FC)
Q (volume in units)0
Profit
Total r
even
ue
Total cost
Q (volume in units)0 Break Even Point units
Profit
Total r
even
ue
Total cost
The volume of output at which total cost and total revenue are equal
Fixed Cost divided by Contribution Margin per unit
Once the Breakeven Point is passed,Economies Of Scale result in accelerated Profits
Page 15 15
Breakeven Exercise
Page 194 of Book
Aggregate Planning
Page 17 17
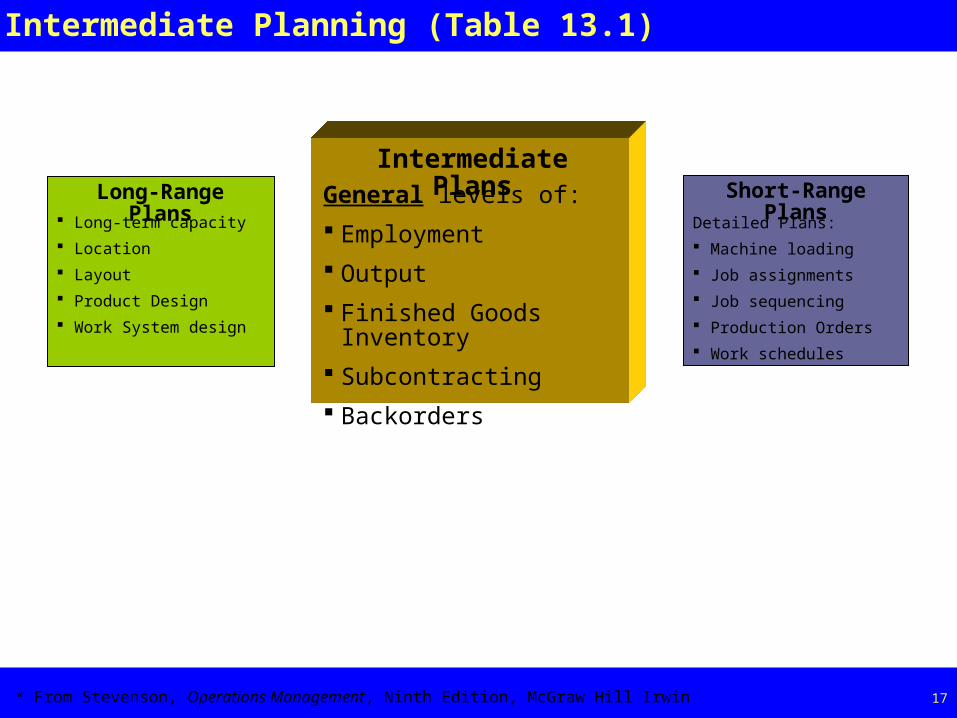
Intermediate Planning (Table 13.1)
* From Stevenson, Operations Management, Ninth Edition, McGraw Hill Irwin
Long-term capacity
Location
Layout
Product Design
Work System design
Long-Range Plans
Intermediate PlansShort-Range PlansGeneral levels of:
Employment
Output
Finished Goods Inventory
Subcontracting
Backorders
Detailed Plans:
Machine loading
Job assignments
Job sequencing
Production Orders
Work schedules
Page 18 18
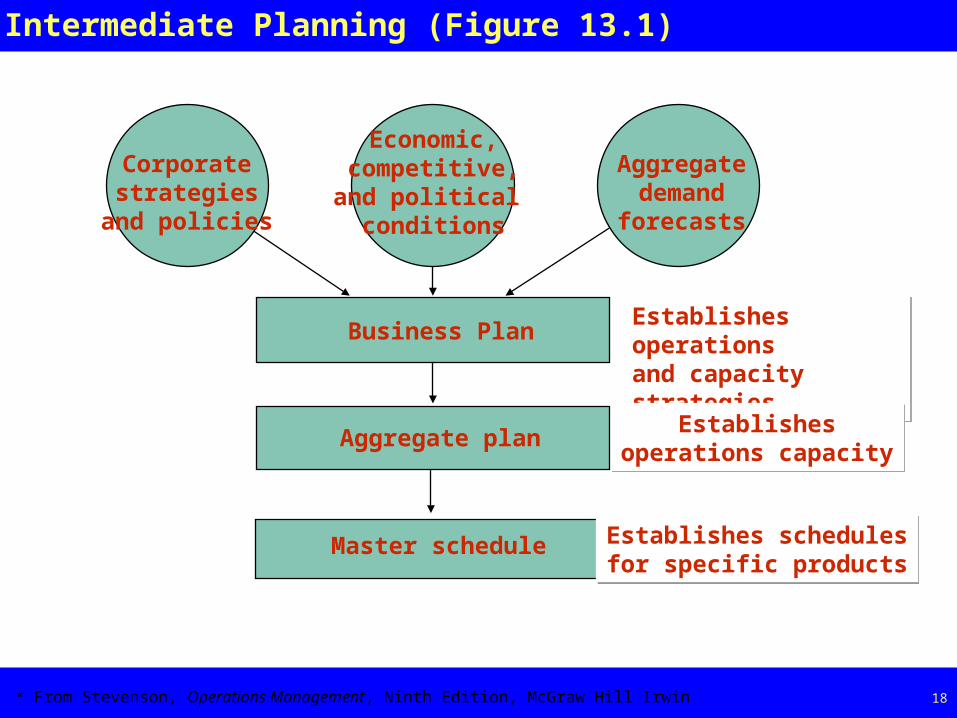
Intermediate Planning (Figure 13.1)
* From Stevenson, Operations Management, Ninth Edition, McGraw Hill Irwin
Business PlanEstablishes operationsand capacity strategiesEstablishes operationsand capacity strategies
Aggregate plan Establishesoperations capacity
Establishesoperations capacity
Master schedule Establishes schedulesfor specific products
Establishes schedulesfor specific products
Corporatestrategies
and policies
Economic,competitive,and political conditions
Aggregatedemand
forecasts
Page 19 19
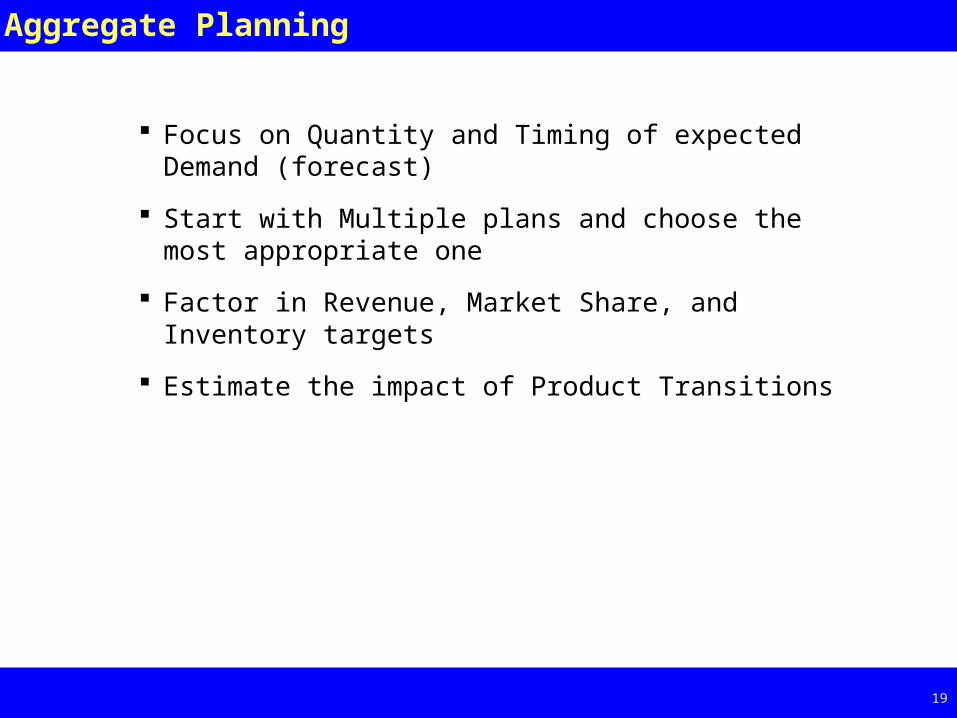
Aggregate Planning
Focus on Quantity and Timing of expected Demand (forecast)
Start with Multiple plans and choose the most appropriate one
Factor in Revenue, Market Share, and Inventory targets
Estimate the impact of Product Transitions
Page 20 20
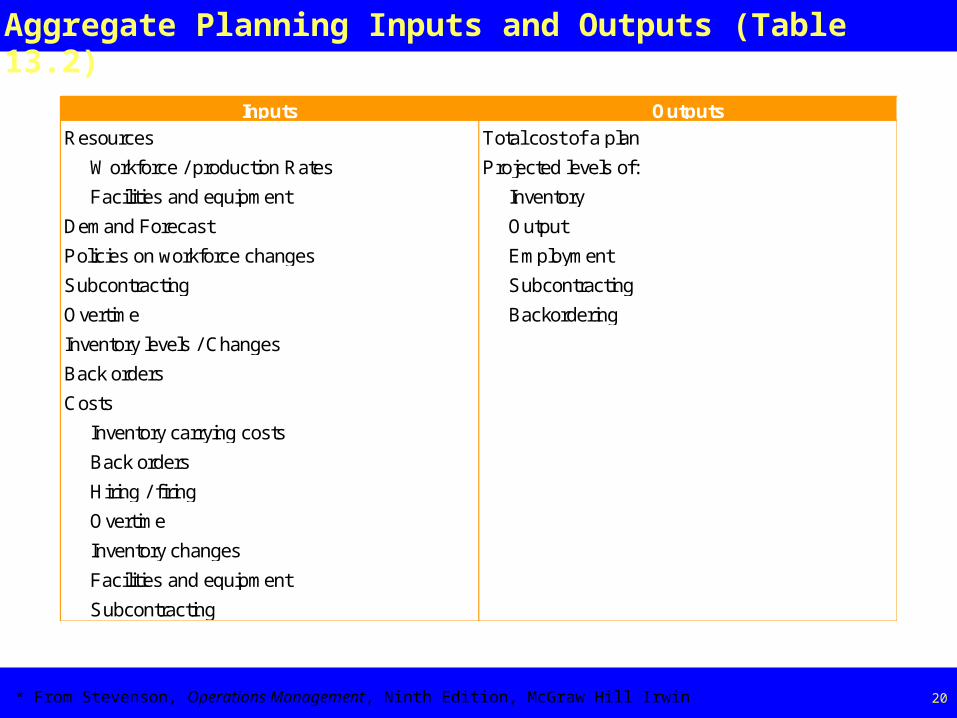
Aggregate Planning Inputs and Outputs (Table 13.2)
* From Stevenson, Operations Management, Ninth Edition, McGraw Hill Irwin
Inputs OutputsResources Total cost of a plan
Workforce / production Rates Projected levels of:
Facilities and equipment Inventory
Demand Forecast Output
Policies on workforce changes Employment
Subcontracting Subcontracting
Overtime Backordering
Inventory levels / Changes
Back orders
Costs
Inventory carrying costs
Back orders
Hiring / firing
Overtime
Inventory changes
Facilities and equipment
Subcontracting
Page 21 21
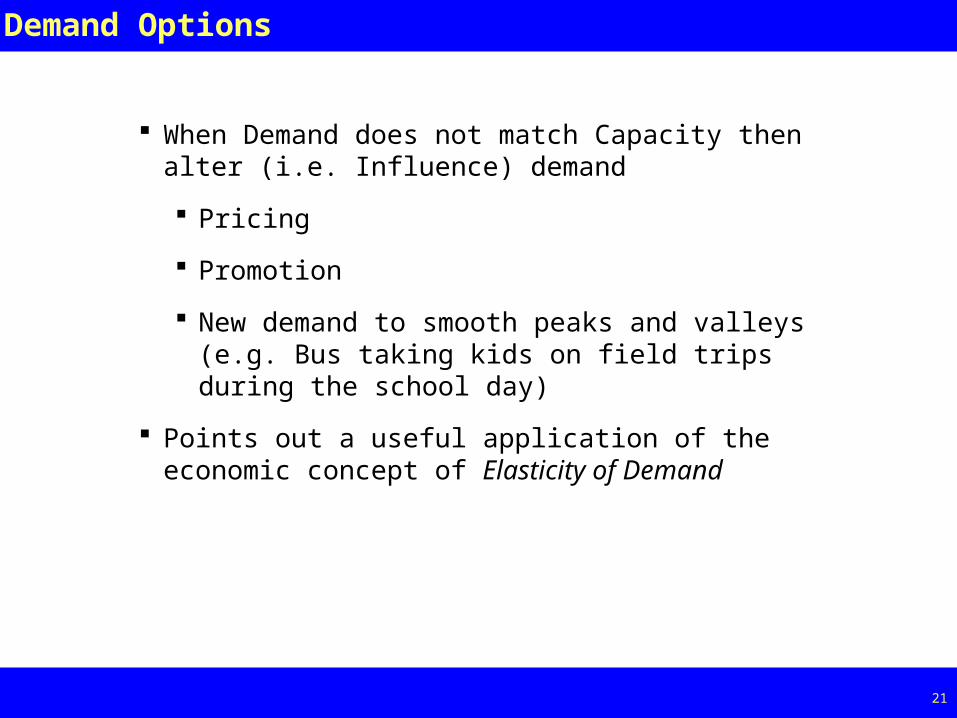
Demand Options
When Demand does not match Capacity then alter (i.e. Influence) demand
Pricing
Promotion
New demand to smooth peaks and valleys (e.g. Bus taking kids on field trips during the school day)
Points out a useful application of the economic concept of Elasticity of Demand
Page 22 22
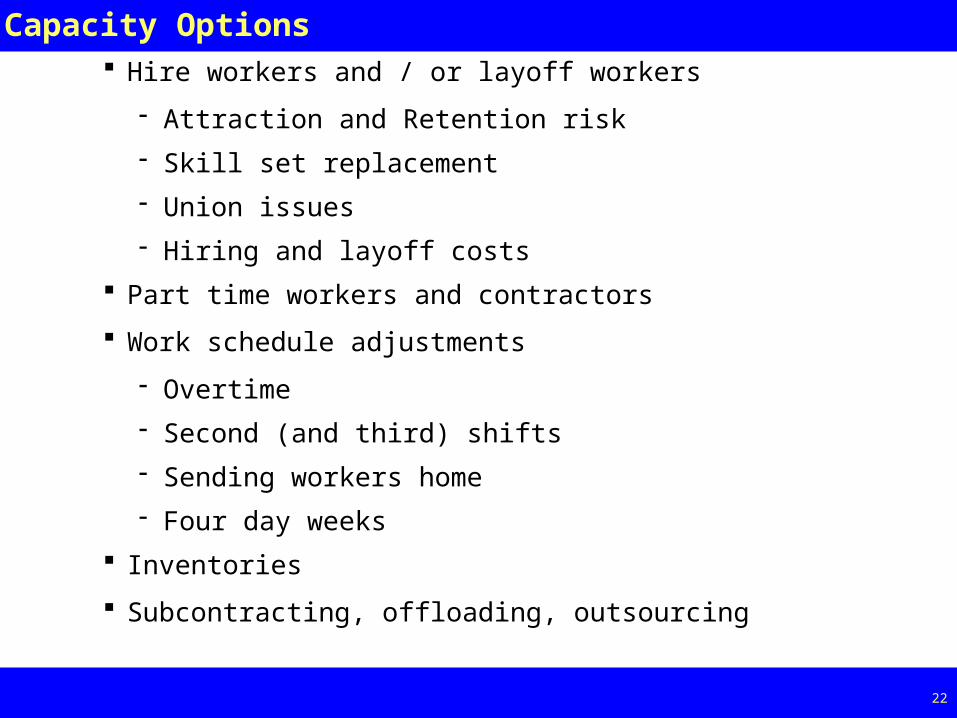
Capacity Options Hire workers and / or layoff workers
Attraction and Retention risk
Skill set replacement
Union issues
Hiring and layoff costs
Part time workers and contractors
Work schedule adjustments
Overtime
Second (and third) shifts
Sending workers home
Four day weeks
Inventories
Subcontracting, offloading, outsourcing
Page 23 23
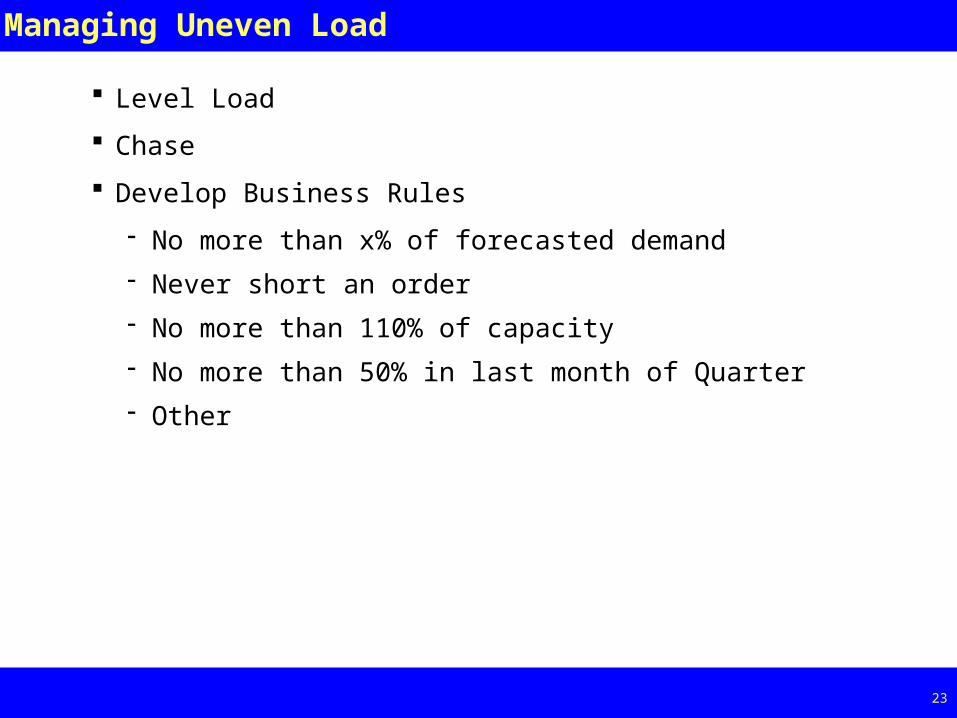
Managing Uneven Load
Level Load
Chase
Develop Business Rules
No more than x% of forecasted demand
Never short an order
No more than 110% of capacity
No more than 50% in last month of Quarter
Other
Page 24 24
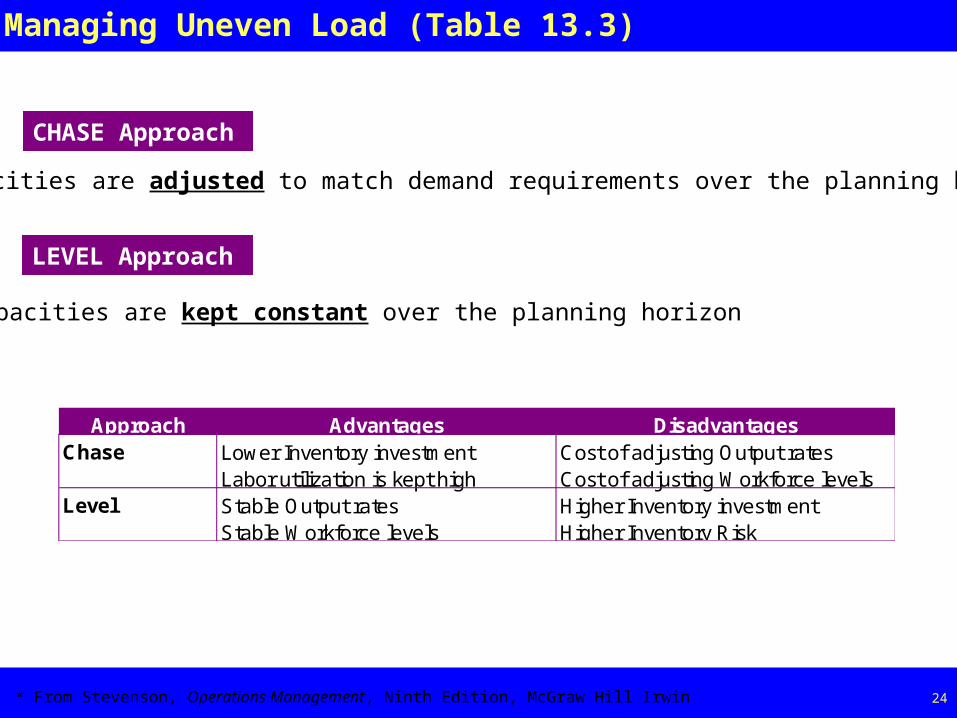
Managing Uneven Load (Table 13.3)
* From Stevenson, Operations Management, Ninth Edition, McGraw Hill Irwin
CHASE Approach
LEVEL Approach
Capacities are adjusted to match demand requirements over the planning horizon
Capacities are kept constant over the planning horizon
Approach Advantages DisadvantagesChase Lower Inventory investment Cost of adjusting Output rates
Labor utilization is kept high Cost of adjusting Workforce levelsLevel Stable Output rates Higher Inventory investment
Stable Workforce levels Higher Inventory Risk
Page 25 25
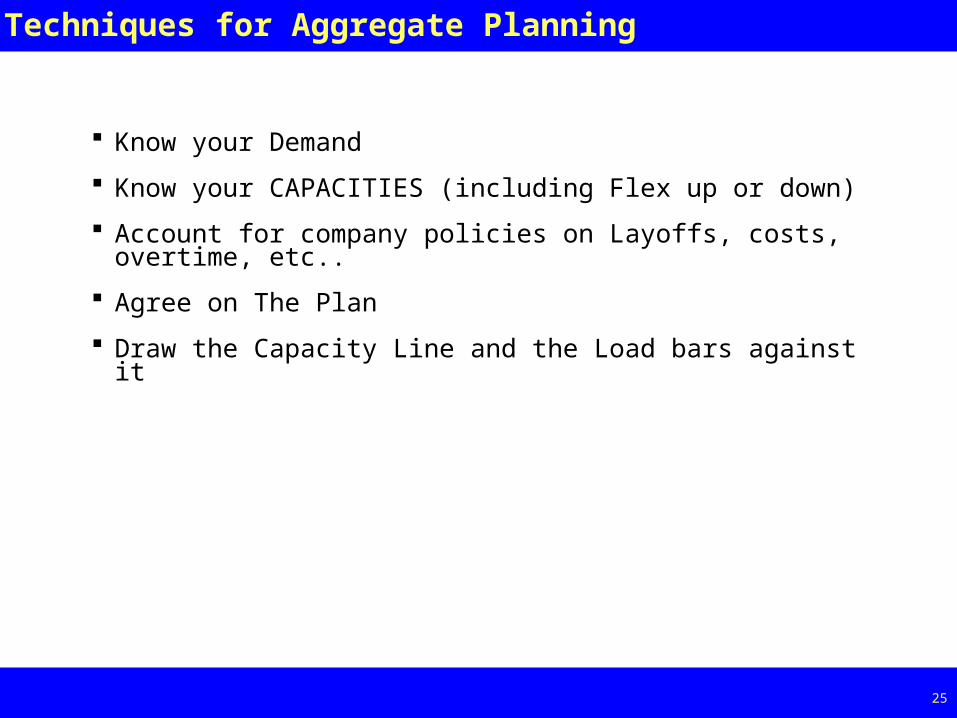
Techniques for Aggregate Planning
Know your Demand
Know your CAPACITIES (including Flex up or down)
Account for company policies on Layoffs, costs, overtime, etc..
Agree on The Plan
Draw the Capacity Line and the Load bars against it
Page 26 26
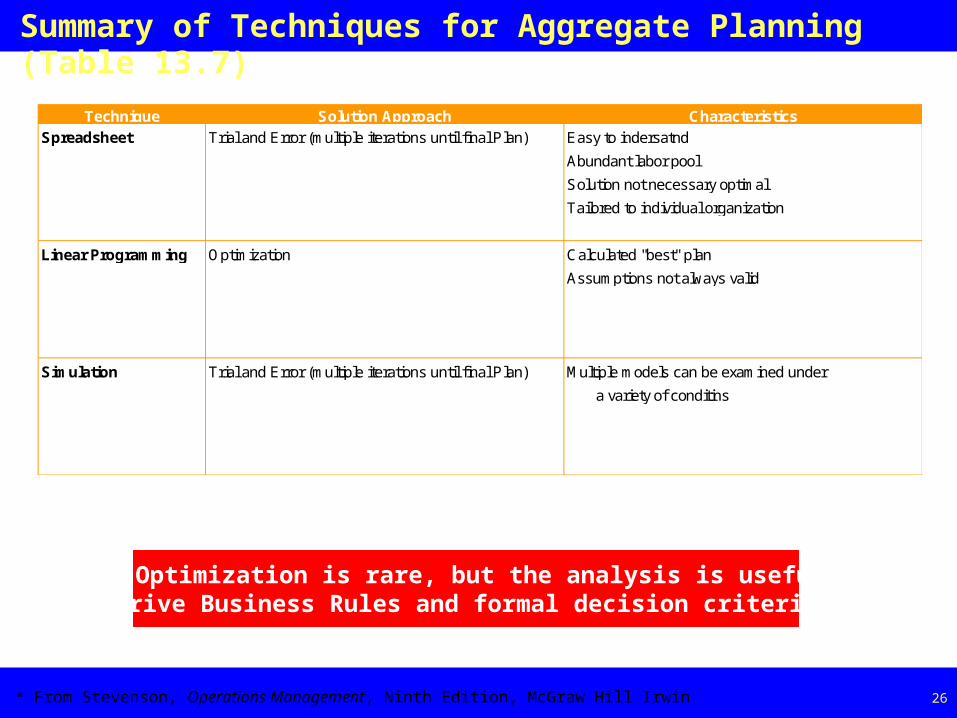
Summary of Techniques for Aggregate Planning (Table 13.7)
* From Stevenson, Operations Management, Ninth Edition, McGraw Hill Irwin
Technique Solution Approach CharacteristicsSpreadsheet Trial and Error (multiple iterations until final Plan) Easy to indersatnd
Abundant labor pool
Solution not necessary optimal
Tailored to individual organization
Linear Programming Optimization Calculated "best" plan
Assumptions not always valid
Simulation Trial and Error (multiple iterations until final Plan) Multiple models can be examined under
a variety of conditins
True Optimization is rare, but the analysis is useful todrive Business Rules and formal decision criteria
Page 27 27
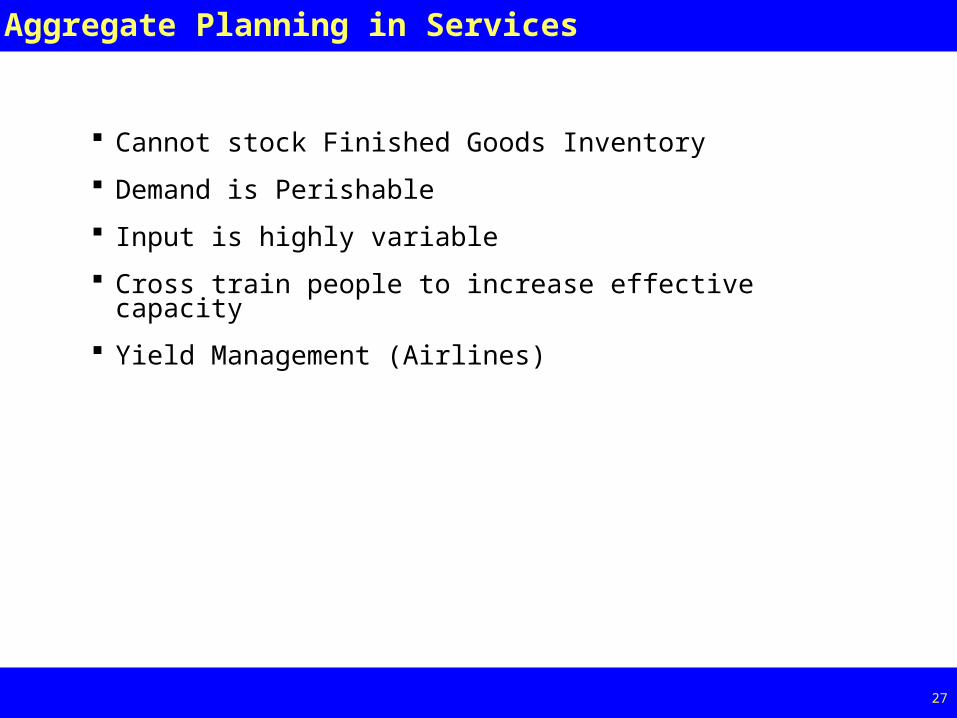
Aggregate Planning in Services
Cannot stock Finished Goods Inventory
Demand is Perishable
Input is highly variable
Cross train people to increase effective capacity
Yield Management (Airlines)
Master Scheduling
Page 29 29
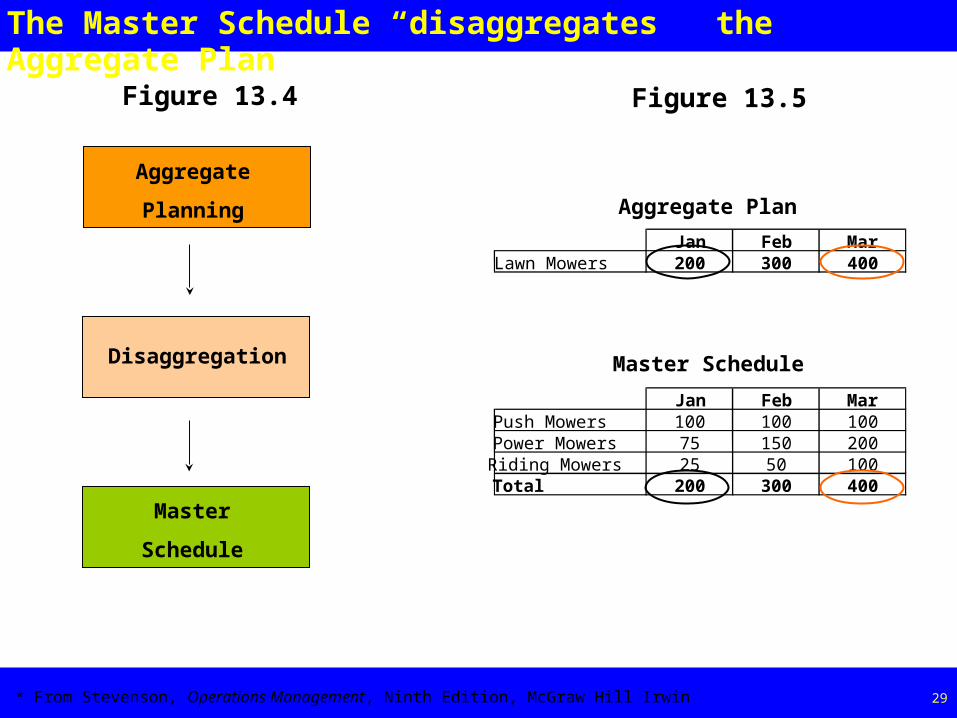
The Master Schedule “disaggregates ” the Aggregate Plan
* From Stevenson, Operations Management, Ninth Edition, McGraw Hill Irwin
Figure 13.4 Figure 13.5
Aggregate
Planning
Disaggregation
Master
Schedule
Aggregate Plan
Jan Feb MarLawn Mowers 200 300 400
Jan Feb MarPush Mowers 100 100 100Power Mowers 75 150 200Riding Mowers 25 50 100Total 200 300 400
Master Schedule
Page 30 30
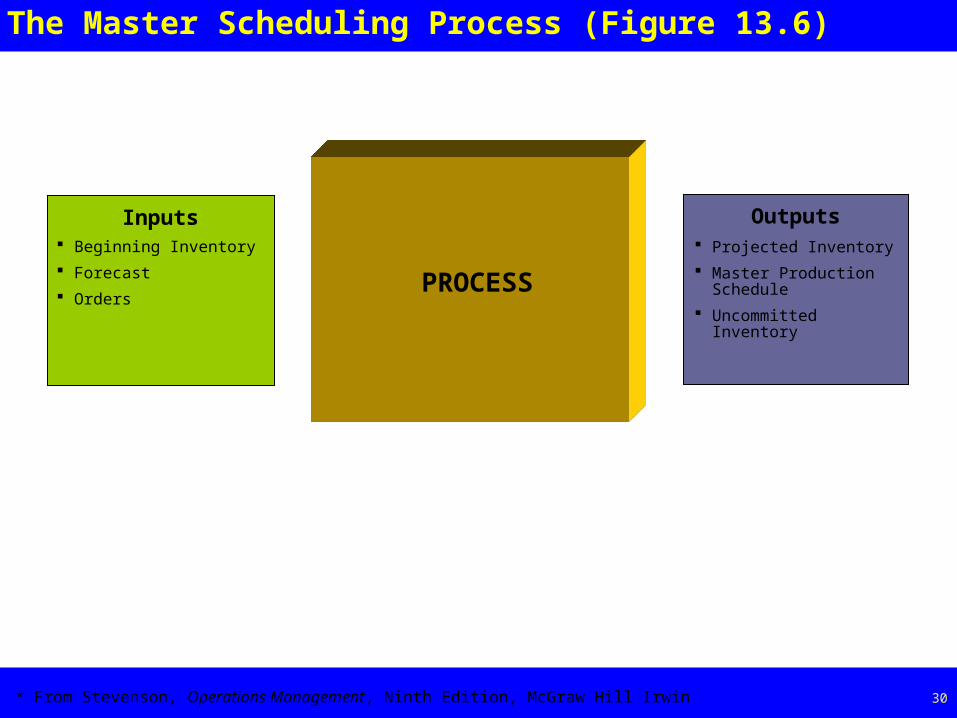
The Master Scheduling Process (Figure 13.6)
* From Stevenson, Operations Management, Ninth Edition, McGraw Hill Irwin
Beginning Inventory
Forecast
Orders
Inputs
PROCESS
Outputs Projected Inventory
Master Production Schedule
Uncommitted Inventory
Page 31 31
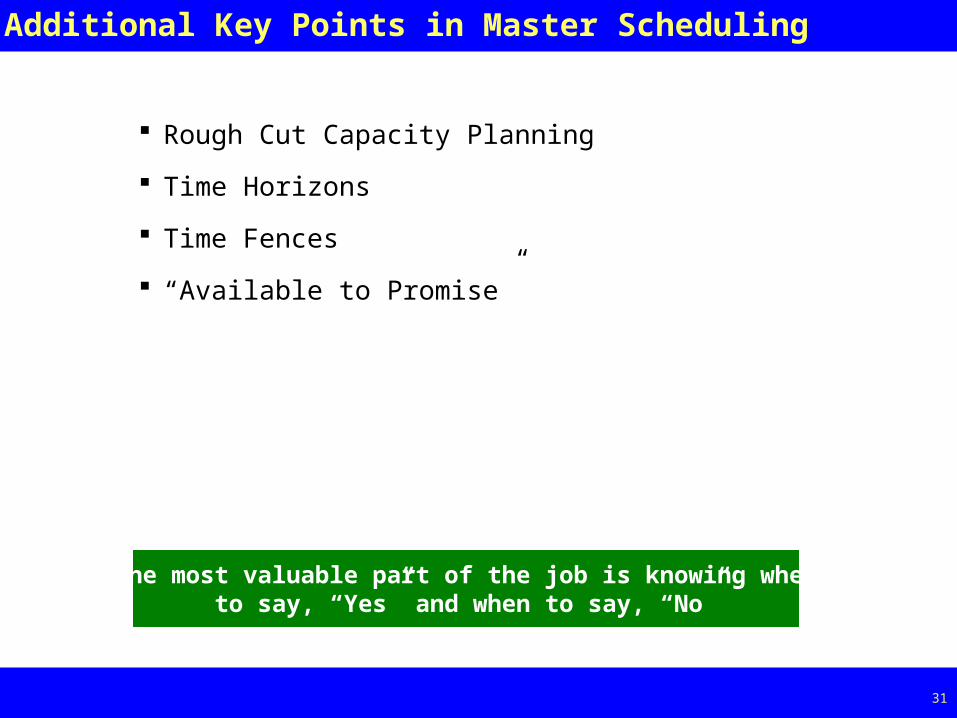
Additional Key Points in Master Scheduling
Rough Cut Capacity Planning
Time Horizons
Time Fences
“Available to Promise”
The most valuable part of the job is knowing whento say, “Yes” and when to say, “No”
Page 32 32
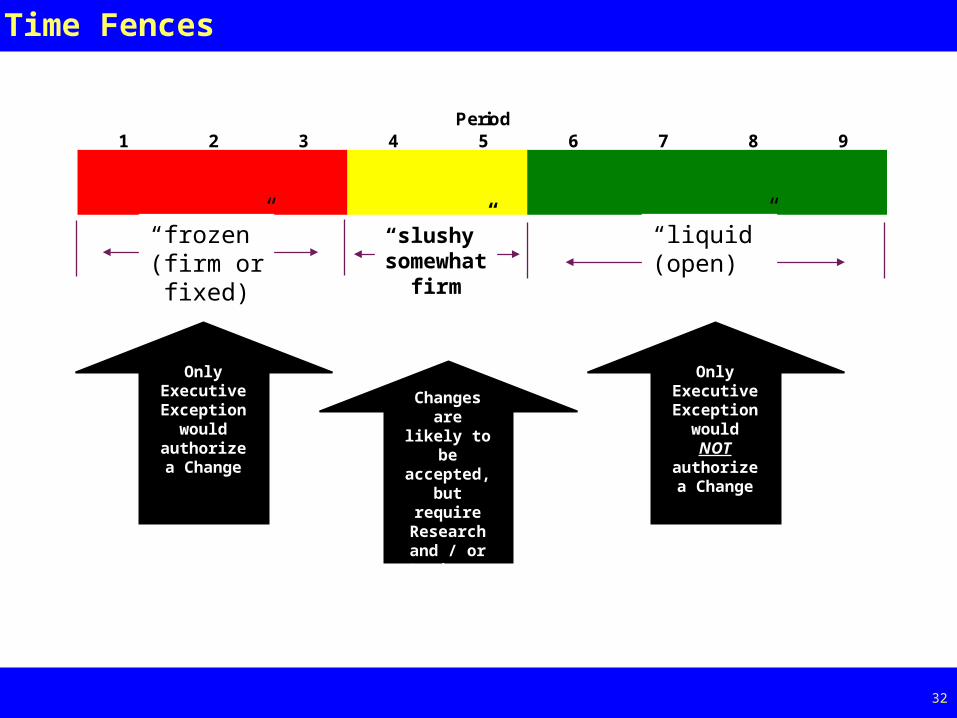
Time Fences
1 2 3 4 5 6 7 8 9Period
“frozen”(firm orfixed)
“slushy”somewhat
firm
“liquid”(open)
Only Executive Exception
would authorize a
Change
Changes are likely
to be accepted,
but require Research and / or
Business Case
Only Executive Exception would NOT authorize a
Change
Page 33 33
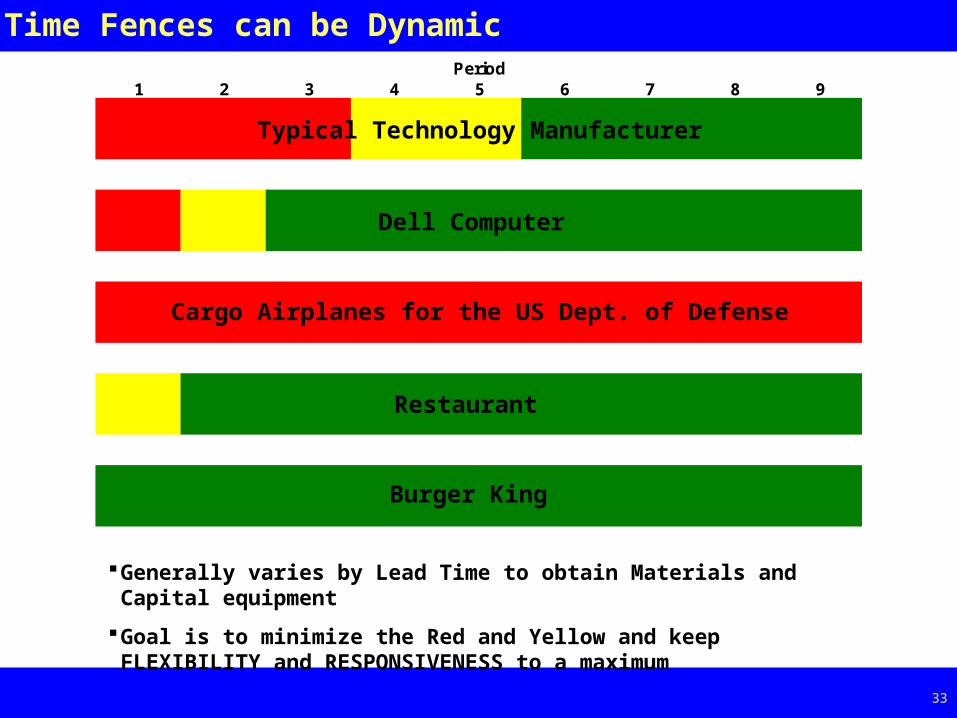
Time Fences can be Dynamic
1 2 3 4 5 6 7 8 9Period
Generally varies by Lead Time to obtain Materials and Capital equipment
Goal is to minimize the Red and Yellow and keep FLEXIBILITY and RESPONSIVENESS to a maximum
Burger King
Typical Technology Manufacturer
Dell Computer
Cargo Airplanes for the US Dept. of Defense
Restaurant
Sales & Operations Planning
A bridge between Aggregate Planning & Master Scheduling
Page 35 35
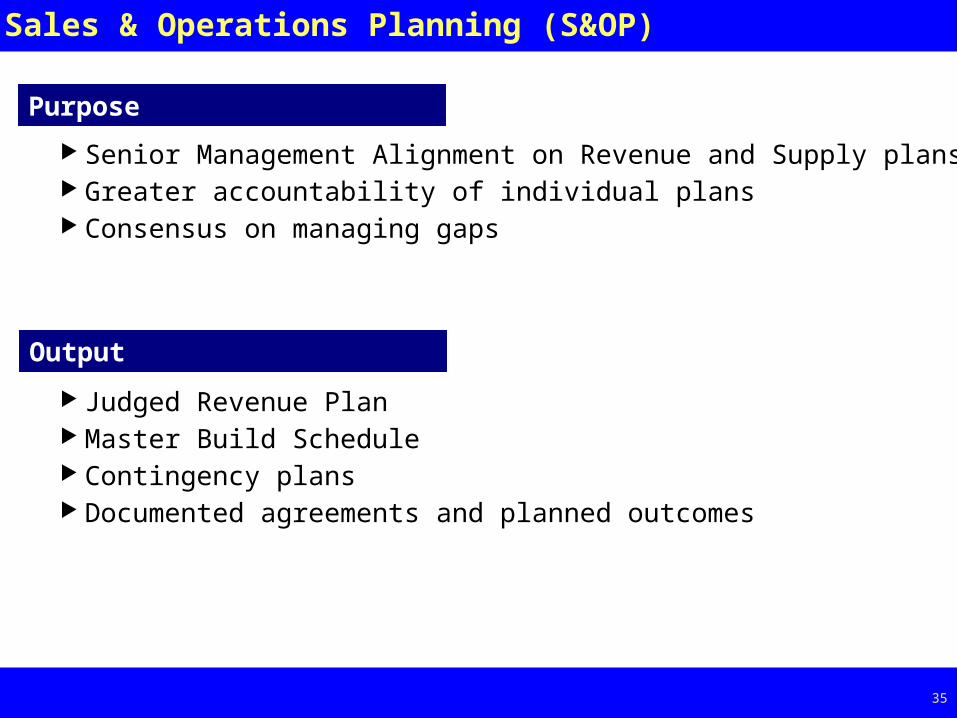
Sales & Operations Planning (S&OP)
Senior Management Alignment on Revenue and Supply plans Greater accountability of individual plans Consensus on managing gaps
Purpose
Output
Judged Revenue Plan Master Build Schedule Contingency plans Documented agreements and planned outcomes
Page 36 36
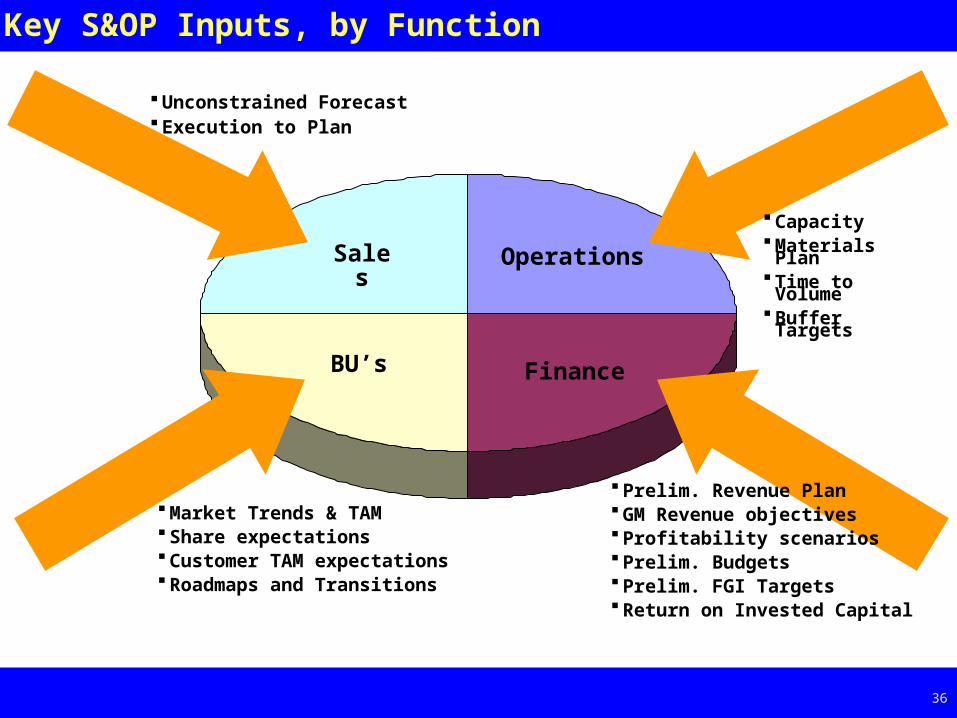
Key S&OP Inputs, by Function
Sales Operations
FinanceBU’s
Prelim. Revenue Plan GM Revenue objectives Profitability scenarios Prelim. Budgets Prelim. FGI Targets Return on Invested Capital
Capacity Materials Plan Time to Volume Buffer Targets
Unconstrained Forecast Execution to Plan
Market Trends & TAM Share expectations Customer TAM expectations Roadmaps and Transitions
Page 37 37
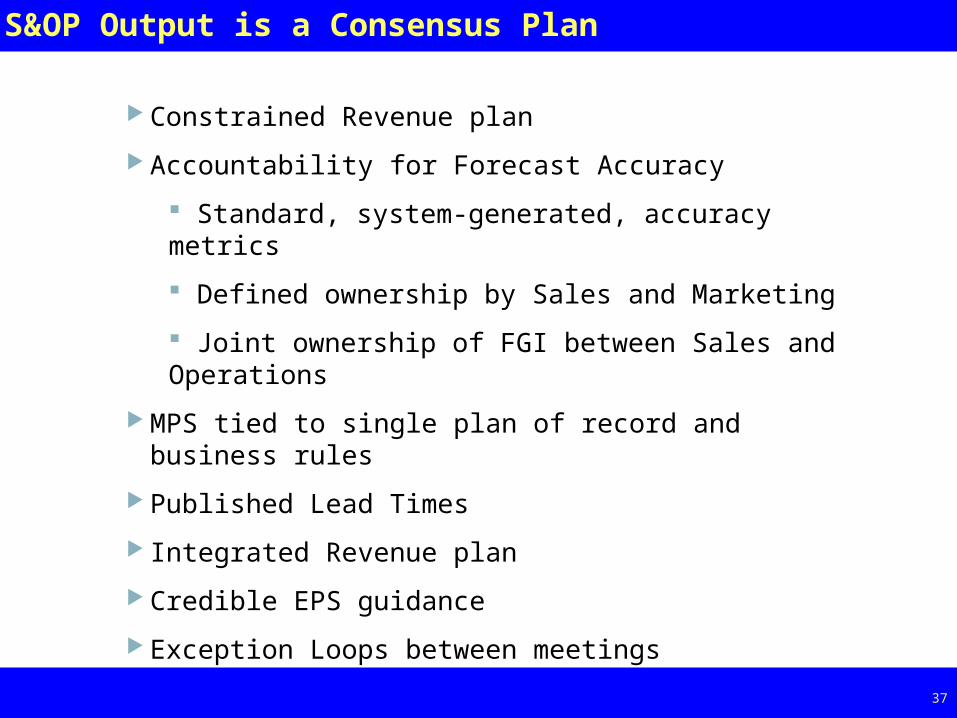
S&OP Output is a Consensus Plan
Constrained Revenue plan
Accountability for Forecast Accuracy
Standard, system-generated, accuracy metrics
Defined ownership by Sales and Marketing
Joint ownership of FGI between Sales and Operations
MPS tied to single plan of record and business rules
Published Lead Times
Integrated Revenue plan
Credible EPS guidance
Exception Loops between meetings
Introduction to Inventory Management
Page 39 39
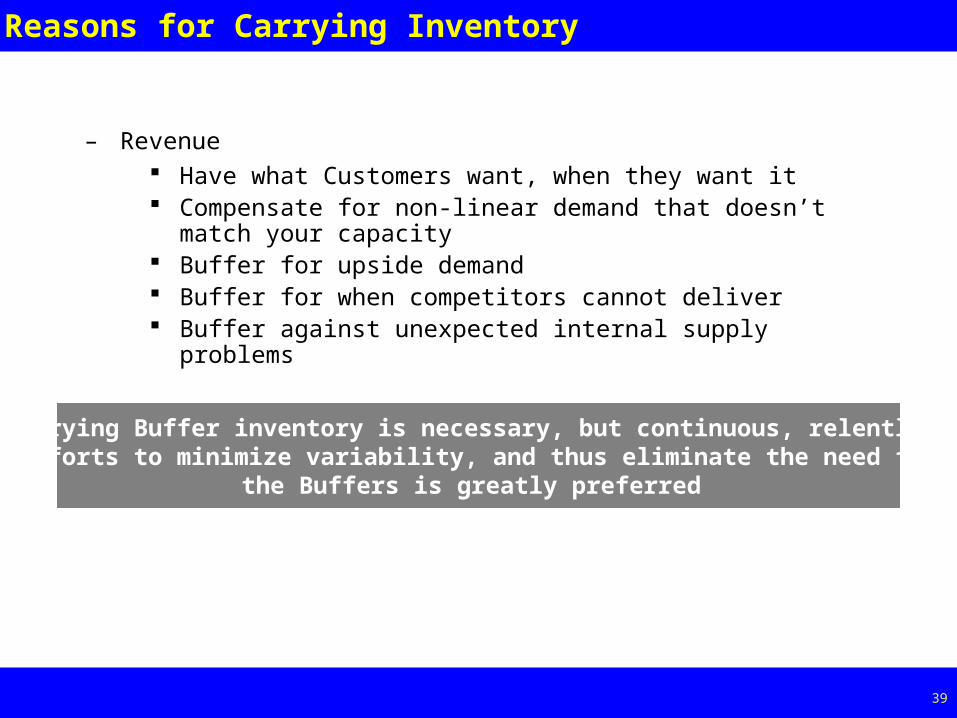
Reasons for Carrying Inventory
– Revenue Have what Customers want, when they want it Compensate for non-linear demand that doesn’t match your
capacity Buffer for upside demand Buffer for when competitors cannot deliver Buffer against unexpected internal supply problems
Carrying Buffer inventory is necessary, but continuous, relentlessefforts to minimize variability, and thus eliminate the need for
the Buffers is greatly preferred
Page 40 40
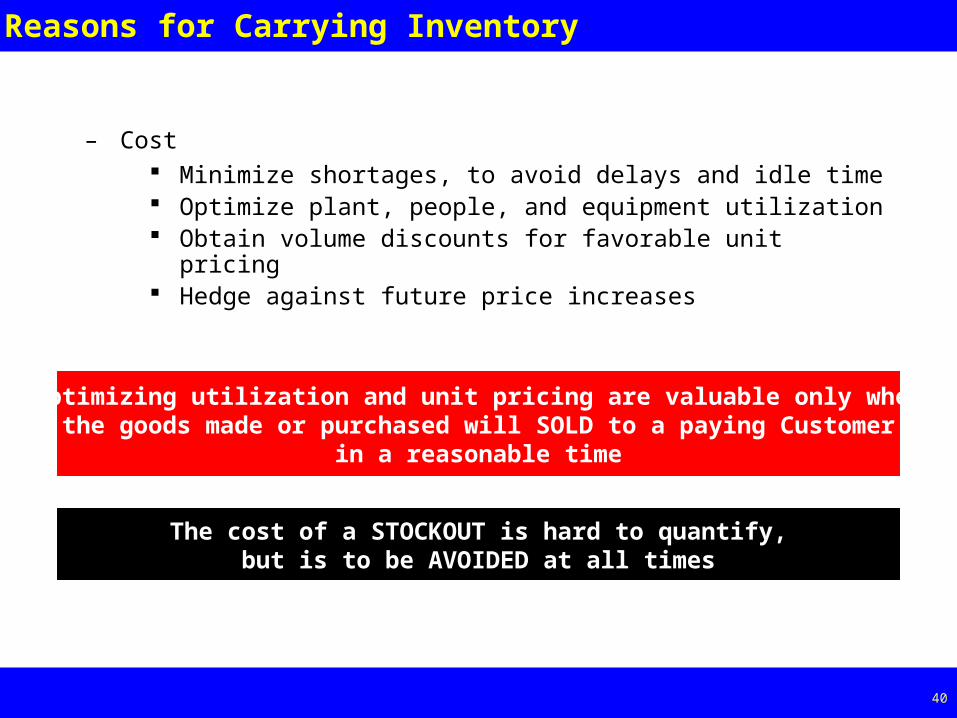
Reasons for Carrying Inventory
– Cost Minimize shortages, to avoid delays and idle time Optimize plant, people, and equipment utilization Obtain volume discounts for favorable unit pricing Hedge against future price increases
Optimizing utilization and unit pricing are valuable only whenthe goods made or purchased will SOLD to a paying Customer
in a reasonable time
The cost of a STOCKOUT is hard to quantify,but is to be AVOIDED at all times
Page 41 41
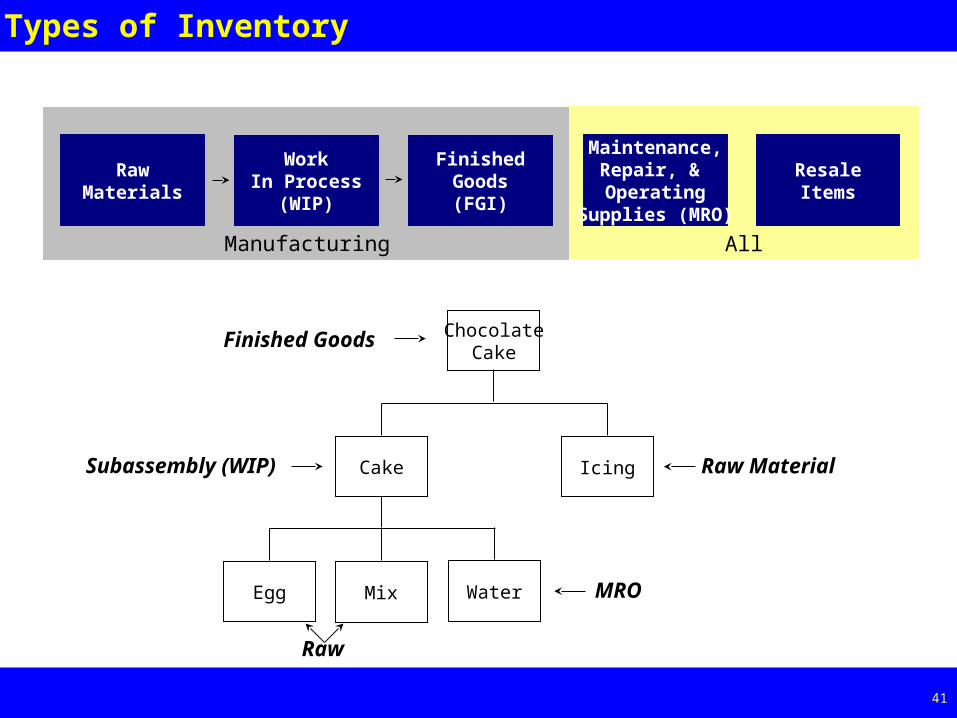
Types of Inventory
RawMaterials
WorkIn Process
(WIP)
FinishedGoods(FGI)
Maintenance,Repair, & Operating
Supplies (MRO)
ResaleItems
Manufacturing All
Egg Mix Water
Cake Icing
ChocolateCake
Finished Goods
Subassembly (WIP) Raw Material
Raw
MRO
Related Documents