TopDown Analysis Associate Prof. Gregory Ang Thursday 16 th January 2014 6.30pm Fundamental Analysis Workshop

Welcome message from author
This document is posted to help you gain knowledge. Please leave a comment to let me know what you think about it! Share it to your friends and learn new things together.
Transcript

Top-‐Down Analysis Associate Prof. Gregory Ang Thursday 16th January 2014
6.30pm
Fundamental Analysis Workshop

What is Top-‐Down Analysis?
• Analysis of global economic trends, indicators and performances
• Narrowing down stronger performing economies, sectors, industries and companies
• Factors in the effect of external variables in the performance of a company

Why Top-‐Down?
• Increasing alignment of global central banks and industries
• A ‘global equilibrium’: AffecRng price trends of resources’ supply and demand
• Fast informaRon: Retail investors can understand economic opportuniRes or threats

Scope of Analysis
Global/Local Economy
Sectors/Industries
Companies

Economic Analysis

FuncRon of Economic Analysis
• Pinpoint economic trends and their implicaRons on financial markets
• To understand the sensiRvity of industries to big-‐picture events for their profitability

Develop an Economic Outlook
• Understand the economy through indicators • Derive certain economic trends • Comparing Cyclical vs Defensive Industries • Assess the sustainability of economic trends • Impact of the U.S. Federal Reserve

QuesRons about Economic Analysis
• What is the government’s economic goals? • How are they achieving them? • Are the measures taken effecRve? • Are the measures taken sustainable? • What implicaRons does this have for industries in the economy?

Economic Indicators • Gross DomesRc Product • Money Supply • Interest Rates/Debt • Employment StaRsRcs • Consumer Price Index • Retail Sales • Manufacturing Inventories • Purchasing Manufacturer’s Index • Foreign Direct Investment

Gross DomesRc Product
• Market value of all goods and services produced • Simplest measure of the economy’s health • OpRmal GDP growth: 2.5%-‐3.5% • Recession: 2 consecuRve quarters of negaRve GDP growth

GDP Analysis
• Through GDP we can understand a country’s: -‐ Material Prosperity -‐ Business CondiRons -‐ Weightage of GDP components

Singapore’s GDP by Industry
Goods Producing Sectors
Manufacturing -‐ Electronics -‐ Chemicals -‐ Biomedical Manufacturing -‐ Precision Engineering -‐ Transport Engineering -‐ General Manufacturing
ConstrucRon -‐ Public -‐ Private
URliRes
Services Producing Sectors
-‐ Wholesale Trade -‐ Retail Trade -‐ TransportaRon & Storage -‐ AccommodaRon & Food Services -‐ InformaRon & CommunicaRons -‐ Finance & Insurance -‐ Business Services
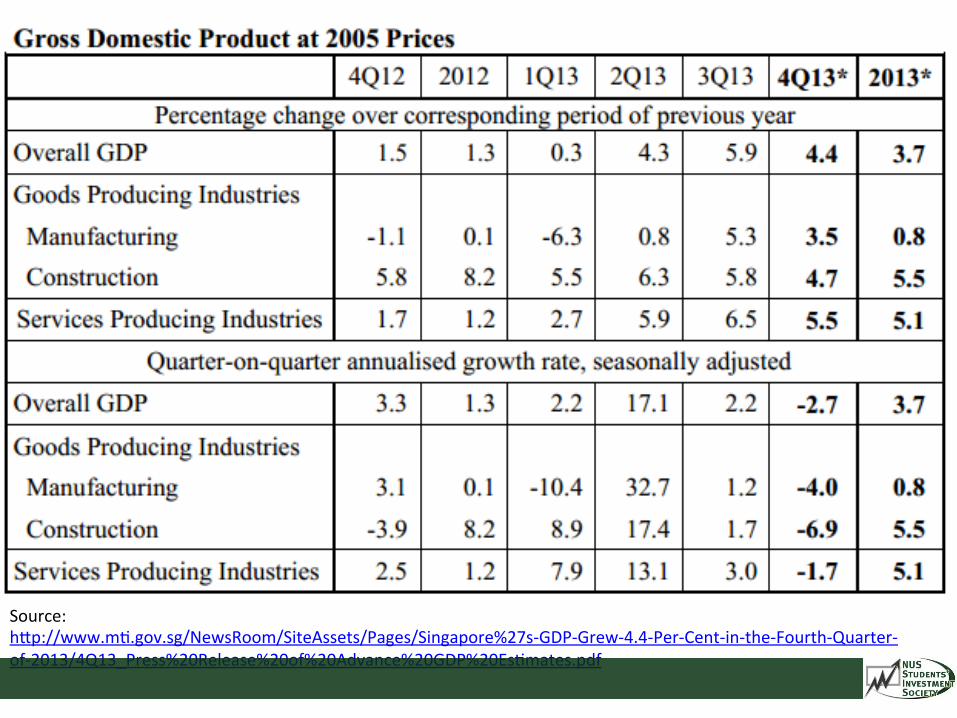
Source: hcp://www.mR.gov.sg/NewsRoom/SiteAssets/Pages/Singapore%27s-‐GDP-‐Grew-‐4.4-‐Per-‐Cent-‐in-‐the-‐Fourth-‐Quarter-‐of-‐2013/4Q13_Press%20Release%20of%20Advance%20GDP%20EsRmates.pdf

Interest Rates
• Singapore Inter-‐bank Offered Rate -‐ Rate at which banks lend to each other -‐ Reference rate used to provide home loans • In general, lower rates = more inter-‐bank and household loans, money supply, consumpRon and economic growth


Private Sector Loans
• Total value of loans provided by private banks to households and businesses • Important in assessing the stability of economic growth, especially when factoring in current interest rates


Singapore Interest Rates/Loans
• Low interest rates have led to increased loans being taken out, increasing spending and economic growth on a whole
• However, high debt levels mean that we are more sensiRve to future changes in interest rate, which may affect the pace of growth

Source: Nomura Holdings

Singapore Debt vs Income
• Since 2010: – Household Debt increased 41% – Household Income increased 25% – Wages increased 15% – Debt accounts for 75% of GDP, up from 55% – Home loans account at 46% of GDP, up from 35%
• From here, we can understand that economic growth comes at a cost
Employment
• Employment leads to higher incomes, influencing overall economic performance • “People with jobs create jobs” – Increased income and consumpRon influences industry demand

Singapore Employment (3Q 2013)
• 1.8 % unemployment, down from 2.1% in 2Q 2013 • 33,100 new jobs, up 4.2% from 3Q 2012 • 2,710 workers made redundant, down from 3,080 in 2Q 2013
• Job vacancies up 5.9% aper falling 5.1% in 2Q 2013 • Overall, a Rghter labour market is expected as larger demand for workers pushes up wages

Consumer Price Index (InflaRon)
• Higher inflaRon = higher interest rates • Increasing uncertainty about cost from consumers, affects industries • Industries with high operaRng leverage benefit as the value of their debt is lessened
Types of InflaRon
• Cost-‐push InflaRon: Higher producRon costs result in higher prices set by producers
• Demand-‐pull InflaRon: Growing demand for products against limited supply results in prices going up

Cost-‐push InflaRon
Source: hcp://www.dineshbakshi.com/ib-‐economics/macroeconomics/165-‐revision-‐notes/1881-‐types-‐and-‐causes-‐of-‐inflaRon

Demand Pull InflaRon
Source: hcp://www.dineshbakshi.com/ib-‐economics/macroeconomics/165-‐revision-‐notes/1881-‐types-‐and-‐causes-‐of-‐inflaRon

Source: hcp://www.singstat.gov.sg/news/press_releases/cpinov2013.pdf
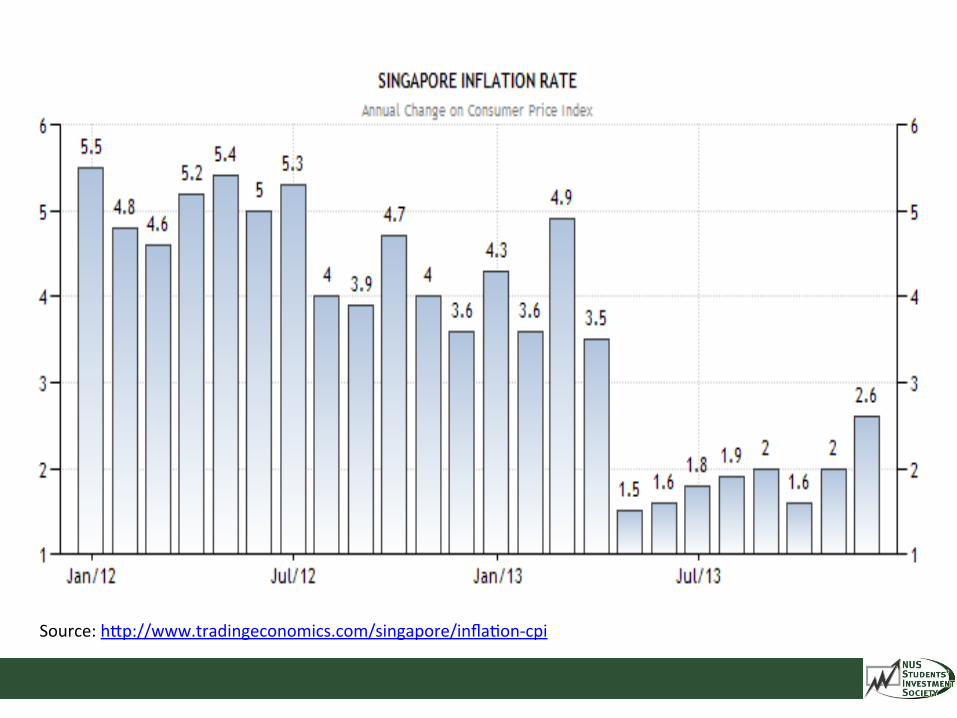
Source: hcp://www.tradingeconomics.com/singapore/inflaRon-‐cpi


Singapore’s InflaRon • April 2013: Dropped to 1.5% due to
– Lower COE premiums aper MAS financing restricRons, and dealers’ corresponding changes in car prices (Demand)
– DistribuRon of service rebates for HDB households, temporarily reducing the cost of maintenance and thus rental rates (Cost)
• Nov 2013: Increased 2.6% due to: – Rising COE premiums and private transport costs (Demand) – Rising accommodaRon, service, and non-‐cooked food items costs (Cost)
• Overall, it is important to understand the reason behind changes in inflaRon, what the government is doing about it, and idenRfy whether these two factors will affect any industries in parRcular

Retail Sales
• Monthly aggregate sales of retail goods • Reflects direct consumer spending, affects the performance of retail industries and overall economic outlook
• Analysis can be supplemented by looking at Consumer Spending

Source: hcp://www.tradingeconomics.com/singapore/retail-‐sales-‐annual

Source: hcp://www.singstat.gov.sg/news/press_releases/mrsoct2013.pdf

Source: hcp://www.tradingeconomics.com/singapore/consumer-‐spending

Singapore Retail Sales
• November 2013: 9.4% yoy decrease, largely due to lower motor vehicle sales (34.4%) and TelecommunicaRons/Computers (15.4%)
• Stable performances from others, rising tourist arrivals and uptrend in consumer spending indicate posiRve outlook for retail
• Cost of producRon may be influenced by rising wage rates

Purchasing Manager’s Index (PMI)
• Monthly indicator of manufacturing performance • Five major components: – New orders – Inventory levels – ProducRon – Supplier deliveries – Employment environment
• PMI > 50 indicates that the economy is expanding

Inventories
• Rising inventories may predict slowing sales growth, which translates into lower producRon and PMI in future
• High inventories may not indicate bad performance if companies are stockpiling in anRcipaRon of greater demand
• Need to determine if inventories will be consumed as fast as they are accumulated

Source: hcp://www.tradingeconomics.com/singapore/changes-‐in-‐inventories

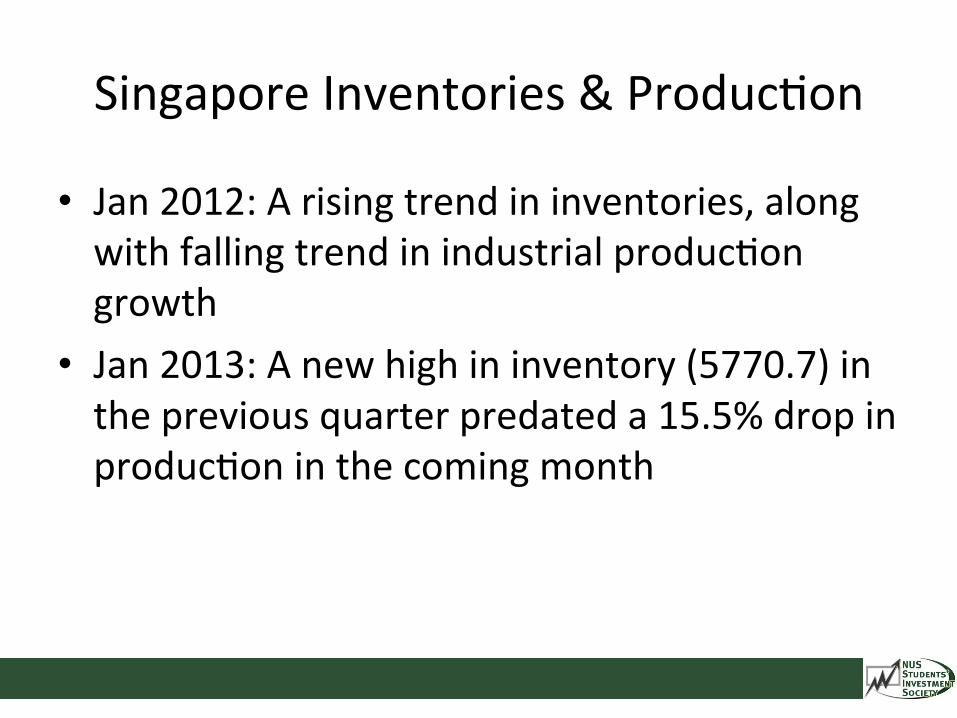
Singapore Inventories & ProducRon
• Jan 2012: A rising trend in inventories, along with falling trend in industrial producRon growth
• Jan 2013: A new high in inventory (5770.7) in the previous quarter predated a 15.5% drop in producRon in the coming month


Source: hcp://www.tradingeconomics.com/singapore/changes-‐in-‐inventories
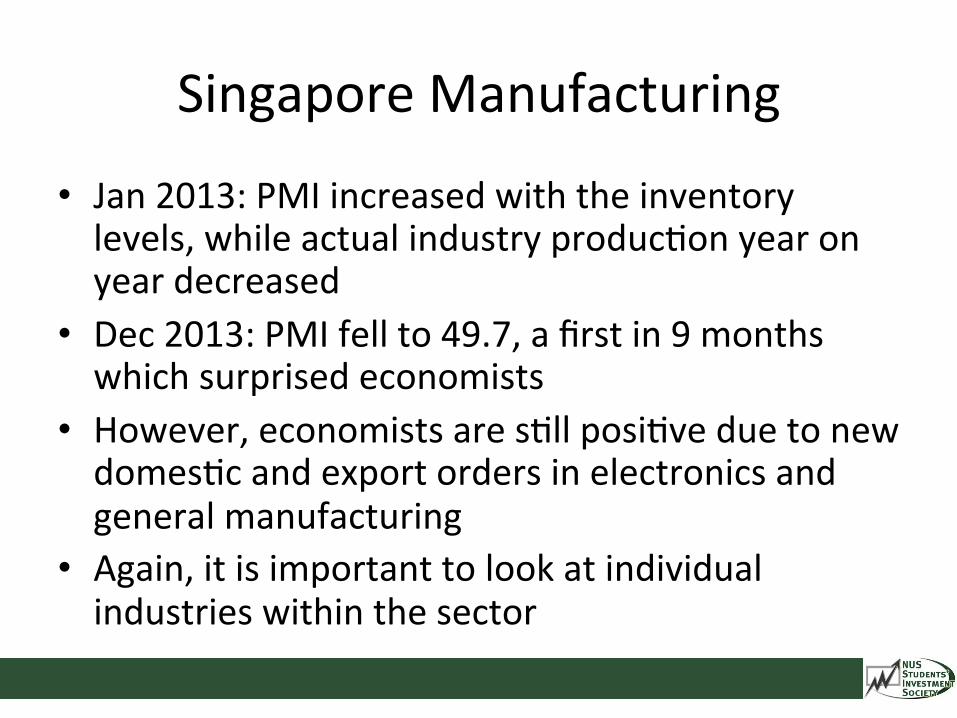
Singapore Manufacturing
• Jan 2013: PMI increased with the inventory levels, while actual industry producRon year on year decreased
• Dec 2013: PMI fell to 49.7, a first in 9 months which surprised economists
• However, economists are sRll posiRve due to new domesRc and export orders in electronics and general manufacturing
• Again, it is important to look at individual industries within the sector

Foreign Direct Investment/Balance of Trade
• Measure investment between Singapore and other countries
• As we are a foreign trade-‐reliant country, our economy is sensiRve to that of others
• A country’s boom or recession may increase or decrease their level of trade and investment, affecRng our economic growth

Singapore’s Top Partner Countries
FDI Inflow ($732b)
• U.S. ($107b) • Netherlands ($63b)
• Japan($57b)
FDI Outlow ($460b)
• China ($91b) • Hong Kong ($38b) • Australia ($37b)

Cyclical Vs Defensive Stocks
Cyclical Stocks • Affected by movements in the economic cycle, perform becer in economic boom
Defensive Stocks • NecessiRes, perform becer in economic recession as they do not move in cycles

• Basic Materials • Capital Goods • CommunicaRons • Consumer Cyclicals • Energy • Finance • Technology • Personal TransportaRon
Cyclical Stocks Defensive Stocks
• URliRes • Food Staples • Healthcare • Non-‐durable Goods

United States Federal Reserve
• U.S. govt bank, chaired by Ben Bernanke • Provides financial services to, and regulates commercial banks
• Engages in U.S. monetary policy • Policies are set by the Federal Open Market Commicee (FOMC), 8 Rmes annually

Mission of The Fed
The Fed pursues: • Full Employment • Stable Prices • Economic Growth It does so through: • Sewng the Discount Rate • Sewng Reserve Requirements • Open-‐Market OperaRons

Sewng the Discount Rate
• The interest rate that a regional Fed bank charges to financial insRtuRons when they borrow short-‐term funds
• Higher discount rate indicates more restricRve monetary policy
• Lower discount rate indicates more relaxed monetary policy

Sewng Reserve Requirements
• Reserve funds that banks must hold as a percentage of customers’ account deposits
• Affects the money supply that banks can provide through loans/investments
• The Fed usually prefers open-‐market operaRons as the bulk of its policy

Open-‐Market OperaRons
• Trading of U.S. government securiRes • Affects Federal Funds Rate (interest rate at which banks borrow reserves from each other)
• Buying securiRes increases the money supply in the financial markets, resulRng in lower FFR
• Selling securiRes decreases the money supply, increasing the FFR
Effects of U.S. Interest Rate Changes
• Singapore’s currency value is managed against currencies that belong to its major trading partners, very prominently being the U.S.
• The SIBOR is pegged closely with the U.S. rate • Low U.S. rates lead to capital outlow (foreign investment), which has resulted in capital inflow to Singapore

Source: hcp://www.triforce-‐adviser.com/resources/115-‐investment-‐arRcle-‐archives

Sample Economic Themes

Tight Labour Market
• The government’s decision to maximise Singaporean labour capital in the 2013 Budget
• Lower foreign worker inflows, assistance for SMEs to create long-‐term employment and technological efficiency
• Higher wage rates, causing increased producRon cost for labour-‐intensive industries
• Higher household incomes may lead to increased consumer spending

SensiRvity to QE tapering
• As the U.S. sets to increase interest rates, Singapore interest rates will be affected
• Loan applicaRons may decrease, affecRng household spending and business acRvity
• Singapore may see less capital inflow from U.S. Foreign Direct Investment
• Banks will benefit from higher lending rates, while industries with large borrowings will see an increase in the cost of debt

Housing Market Crunch
• High loans, home prices and speculaRon led MAS to introduce property market cooling through loan financing
• HDB resale prices fell 1.3%, indicaRng towards lower demand for ExecuRve Condominiums
• Poor performance of home sales (down 33% annually)
• However, large supply of BTO flats and lower prices may enRce a buyer’s market in 2014

Industry Analysis

FuncRon of Industry Analysis
• To understand the general outlook for each industry, and decide whether they are profitable in the long run
• To idenRfy the major compeRtors within each industry

QuesRons for Industry Analysis
• What is the nature of the industry? (MonopolisRc /CompeRRve?) • What is the industry’s life cycle stage? • Is the industry cyclical or defensive? • What are the key factors that affect the labour, supply and demand?

Components of Analysis
• Business Cycle • Structural Economic Changes • AlternaRve Industries • Industry Life Cycle • Industry CompeRRve Environment • Case Study
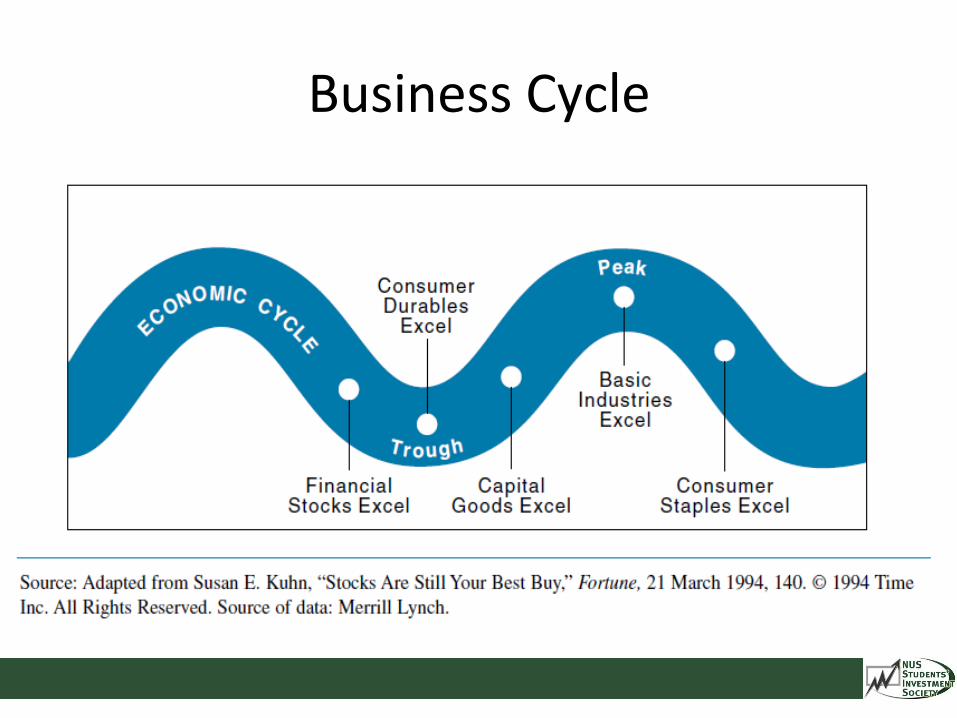
Business Cycle

Structural Economic Changes
• PopulaRon growth/income & geographic distribuRon • Consumer preferences (e.g. educaRon, entertainment, housing, automobiles)
Demographics/Lifestyles
• Affects the producRon/delivery efficiency, reducing costs
• CreaRon of alternaRve industries may affect industry demand
Technology
• RegulaRons and laws may affect the producRon and overhead cost of doing business
PoliRcs & RegulaRons

Industry Life Cycle
Source: hcp://www.josephaegan.com/elearning/file.php/79/DD202_3_008i.jpg

Industry Life Cycle
• Introduc;on -‐ Small/NegaRve profit margins -‐ High development costs • Growth -‐ SubstanRal Demand -‐ Limited firms, licle compeRRon -‐ High sales growth & profit margins

Industry Life Cycle (2)
• Maturity -‐ Slowed industry growth/profit margins -‐ Firm compeRRon to lower costs, increases supply and lowers profits
• Decline -‐ Industry growth declines -‐ Profitable firms will show low returns, may seek alternaRve sources of income

Industry CompeRRon – Porter’s 5 Forces
Source: hcp://geekyfry.com/wp-‐content/uploads/2012/01/porters-‐5-‐forces.png

Industry Rivalry • Determine the number of firms and their market power
(Monopoly -‐> Perfect CompeRRon) • CompeRRon aspects include: -‐ Price -‐ ProducRon Cost -‐ Product DifferenRaRon
• Unhealthy factors include: -‐ Low industry growth -‐ Many equally balanced compeRtors -‐ High fixed costs -‐ UndifferenRated products
• E.g. Home entertainment industry

Bargaining Power of Consumers
• Consumers’ ability to influence lower prices or higher quality/more services
• Bargaining Power factors include: -‐ Concentrated buyers -‐ UndifferenRated, simple product -‐ Low switching cost -‐ High cost to buyers • E.g. Paper industry

Bargaining Power of Suppliers
• Affects cost of producRon for the industry • Supplier power factors include: -‐ Unique product -‐ Large distribuRon pool -‐ High switching costs/few alternaRves • E.g. Intellectual Property/BroadcasRng Rights

Threat of SubsRtutes
• Influenced by technological advances • SubsRtuRon factors include: -‐ Lower price -‐ More convenience/effecRveness -‐ Low switching costs for buyers • E.g. Ebooks, AlternaRve energy

Threat of New Entrants
• Affects outperforming industries, leads to falling prices and higher costs of producRon
• Barriers to entry include: -‐ Large resource pool from incumbent firms -‐ Monopoly power of incumbent firms -‐ Extensive distribuRon channels -‐ Licensing requirements • E.g. TelecommunicaRons/Specialty industry
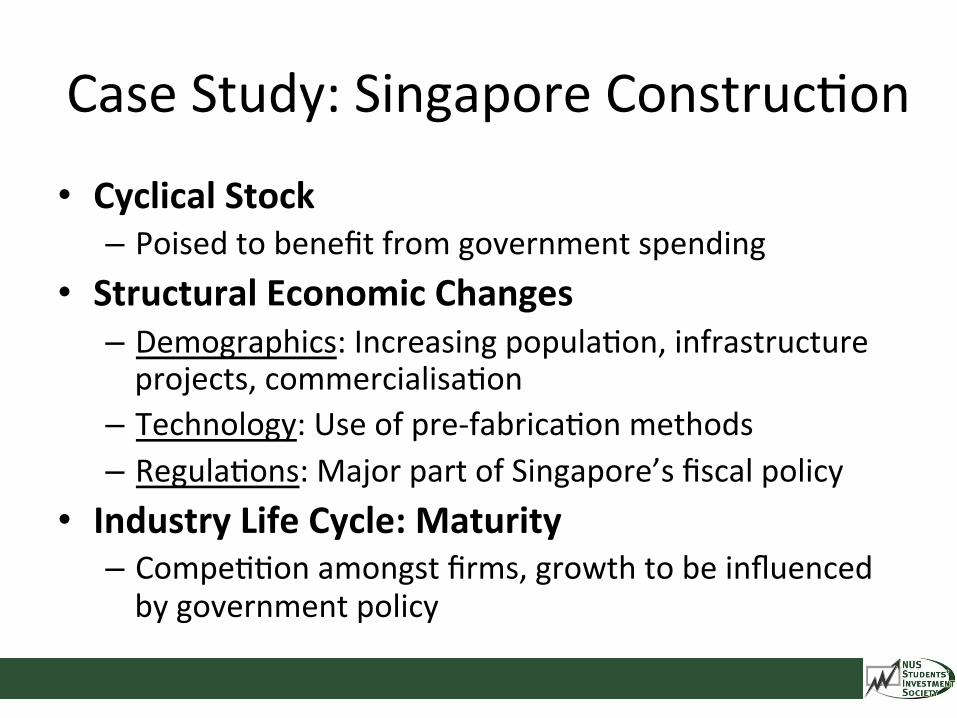
Case Study: Singapore ConstrucRon
• Cyclical Stock – Poised to benefit from government spending
• Structural Economic Changes – Demographics: Increasing populaRon, infrastructure projects, commercialisaRon
– Technology: Use of pre-‐fabricaRon methods – RegulaRons: Major part of Singapore’s fiscal policy
• Industry Life Cycle: Maturity – CompeRRon amongst firms, growth to be influenced by government policy

Porter’s 5 Forces
Threat of New Entrants Low, due to high startup cost and establishment of key players
Consumer Power High within industry, as contracts are not
bound by customer loyalty
Supplier Power -‐ Low, due to undifferenRated products
(steel & concrete) which are falling in prices -‐ Possible effects of foreign labour crunch
Threat of Subs;tutes -‐ Low in public sector, relies on local firms -‐ High in private sector, due to compeRRon
from overseas developers
Industry Rivalry High due to similar products and compeRRve tenders

ConstrucRon Outlook
• Strong performance in 2013 ($35.8b) • PosiRve outlook from increased govt spending (Projected $33b in 2014, as high as $38b)
• Shrinking demand for private construcRon due to cooling property market
• 30% increase of FDI into local property ($4.1b)
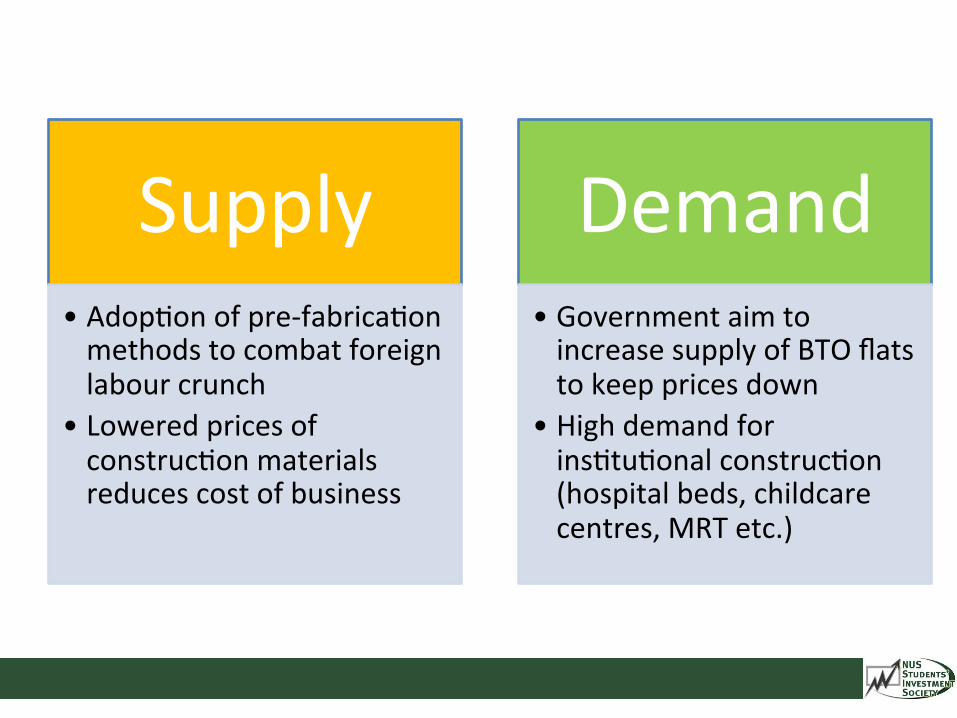
Supply • AdopRon of pre-‐fabricaRon methods to combat foreign labour crunch
• Lowered prices of construcRon materials reduces cost of business
Demand • Government aim to increase supply of BTO flats to keep prices down
• High demand for insRtuRonal construcRon (hospital beds, childcare centres, MRT etc.)

Company Analysis: To be covered in Week 3

THANK YOU
Related Documents